Exhibit D
THE REPUBLIC OF TURKEY

This description of the Republic of Turkey is dated as of October 3, 2016 and appears as Exhibit D to the Republic of Turkey’s Annual Report on Form 18-K to the U.S. Securities and Exchange Commission for the fiscal year ended December 31, 2015.
TABLE OF CONTENTS
2
FORWARD-LOOKING STATEMENTS
Turkey has made forward-looking statements in this Annual Report on Form 18-K. Statements that are not historical facts are forward-looking statements. These statements are based on Turkey’s current plans, estimates, assumptions and projections. Therefore, you should not place undue reliance on them. Forward-looking statements speak only as of the date they are made. Turkey undertakes no obligation to update any of them in light of new information or future events.
Forward-looking statements involve inherent risks. Turkey cautions you that a number of factors could cause actual results to differ materially from those contained in any forward-looking statements. These factors include, but are not limited to:
| | • | | External factors, such as: |
| | • | | interest rates in financial markets outside Turkey; |
| | • | | the impact of changes in the credit rating of Turkey; |
| | • | | the impact of changes in the international prices of commodities; |
| | • | | economic conditions in Turkey’s major export markets; |
| | • | | the decisions of international financial institutions regarding the terms of their financial arrangements with Turkey; |
| | • | | the impact of any delays or other adverse developments in Turkey’s accession to the European Union; and |
| | • | | the impact of adverse developments in the region where Turkey is located. |
| | • | | Internal factors, such as: |
| | • | | general economic and business conditions in Turkey; |
| | • | | present and future exchange rates of the Turkish currency; |
| | • | | foreign currency reserves; |
| | • | | the level of domestic debt; |
| | • | | the ability of Turkey to effect key economic reforms; |
| | • | | the level of foreign direct and portfolio investment; and |
| | • | | the level of Turkish domestic interest rates. |
3
RECENT DEVELOPMENTS AND SUMMARY
GENERAL
The Republic’s GDP increased by 3.1% in the second quarter of 2016. See “—Economic Developments.”
In 2015, there were a series of raids against opposition media outlets and businesses associated with the U.S.-based Islamic cleric Fethullah Gulen throughout Turkey. For example, in January 2015, several policemen were arrested for illegal wiretapping and political spying charges. On September 1, 2015, Turkish police raided the Ankara-based offices of a media group affiliated with Fethullah Gulen. Six people were arrested and a warrant was issued for the conglomerate’s chief executive, Akin Ipek. On September 16, 2015, Turkish police issued warrants against eleven executives on charges of organized theft. The arrests took place in the central city of Kayseri, where police raided a university with alleged links to Fethullah Gulen. On October 26, 2015, an Ankara court appointed administrators to take control of Koza İpek Holding, which the Ankara Chief Public Prosecutor’s Office identified as a Gulen-associated business. On March 23, 2016, a court in Istanbul appointed trustees to run the Feza media group, which owns the Zaman Daily and Cihan News Agency. The court accused the Feza media group of supporting the movement of Fethullah Gulen.
On July 15, 2016, a coup d’état was attempted in Turkey against the Government by a faction within the army that is linked to the Gulen movement (which was officially designated by the Government as a terrorist group called FETÖ). The coup plotters attempted to overthrow the Government by seizing control of several key institutions and buildings in Ankara, Istanbul, and elsewhere, but failed to do so as there was strong public opposition against the coup plotters. During the coup attempt, around 250 people were killed and more than 2,200 were injured while many government buildings, including the Turkish Parliament and the Presidential Palace, were damaged. On July 21, 2016, the Parliament approved the declaration of a three-month state of emergency in order to enable the authorities to take swift and effective action against those responsible for the failed coup, which also resulted in the temporary suspension of the European Convention on Human Rights. On August 7, 2016, several million people gathered in Istanbul for an anti-coup rally organized by the Turkish authorities, showing solidarity and political cohesion against the attempt. The President, Prime Minister and the two leaders of the opposition parties participated in the anti-coup rally.
As of August 17, 2016, approximately 40,000 people have been detained in connection with the failed coup. Of those detained, a substantial number have been military personnel (approximately 10,000 people, including 178 generals). Around 20,000 people have been arrested as of August 17, 2016, including police officers, soldiers, judiciary members, local administrators and civilians. As of August 17, 2016 nearly 80,000 government officials have been fired or suspended from various public institutions, including approximately 3,000 judges and prosecutors, deans of all universities have been asked to resign and the licenses of approximately 21,000 teachers working at private institutions have been terminated due to their alleged links to the Gulen movement. In addition, more than 100 media outlets have been closed, such as newspapers, TV channels, radio stations and magazines. Following the coup, there have also been raids on businesses with suspected links to the Gulen movement, greater civilian control of the military, a planned overhaul of military hierarchy and command structure and the release of prisoners to increase capacity of prisons to house those arrested for their involvement in the failed coup. On September 28, 2016, prosecutors in Istanbul decided to include Ergenekon, Balyoz, and Military Espionage investigations and prosecutions in the main July 15, 2016 coup attempt investigation.
On April 27, 2016, a suicide bomber detonated an explosive in the northwestern Turkish city of Bursa. On May 2, 2016, the Minister of Interior Efkan Ala announced the identity of the suicide bomber to be a member of the PKK (the Kurdistan Workers’ Party).
Since May 2016, dozens of police officers, soldiers and civilians have been killed and hundreds of people wounded in several terrorist bomb attacks carried out by the PKK in the eastern part of Turkey.
On May 20, 2016, Turkey’s legislature voted to lift the immunity of 138 deputies from all parties, including 46 of the 59 deputies of the Kurdish People’s Democratic Party, who face potential prosecution on allegations such as supporting terrorism. On June 8, 2016, President Erdoğan approved lifting of the deputies’ immunity.
On June 28, 2016, three suicide attackers armed with guns and bombs attacked Atatürk Airport in Istanbul. More than 40 people were killed, in addition to the three attackers, and more than 250 people were injured. President Erdoğan blamed DAESH (a synonym for the Islamic State terrorist group ISIS/ISIL) for the attack and called on the international community to make the attack a turning point in the global fight against terrorism. The airport became operational within a few hours after the attack.
4
On August 20, 2016, a suicide bomber targeted a wedding ceremony in Gaziantep. A total of 54 people were killed while 66 people were injured in the attack. While there has been no claim of responsibility, President Erdoğan has said that DAESH is the primary suspect for the attack.
On August 25, 2016, the main opposition Republican People’s Party (“CHP”) leader, Kemal Kılıçdaroğlu, and his convoy were attacked by a group of PKK militants in the northeastern province of Artvin. One soldier who was guarding him was killed by the militants while two others were injured.
The Republic is continuing its humanitarian efforts to provide shelter to refugees fleeing the conflict in Syria. As of August 29, 2016, 254,034 Syrian refugees occupied accommodation centers throughout Turkey. As of August 2016, the Republic has spent approximately U.S.$12 billion for Syrian refugees in Turkey.
On March 18, 2016, the EU agreed on a wide range of proposals with Turkey to manage the migration crisis, including the return of all irregular migrants, accelerating the visa-liberalization process for Turkish citizens and sharing the work of hosting Syrian refugees. According to the agreement, the EU will allocate €6 billion (U.S.$6.6 billion) for reducing illegal migration and making passage to Europe safe. On April 4, 2016 the agreement went into effect and the first group of Syrian refugees arrived in Germany from Istanbul while the first group of migrants, including Syrian refugees, returned to Turkey from Greece. Since the implementation of the agreement, the Turkish Parliament has approved the entry into force of the provisions of the agreement and the relevant law was signed by the President’s office on May 18, 2016. Since May 2, 2016, a Turkish liaison officer has also been stationed with Europol. Turkish authorities have set up units on migrant smuggling and human trafficking and are taking legislative steps to put in place higher penalties for smugglers. The Republic and the EU have been in discussions regarding visa-free travel for Turkish citizens, if the Republic fulfils a set of conditions, including revising its legislation and practices on terrorism in line with European standards.
On December 10, 2015, the Republic announced a structural reform agenda to be completed by January 2017 (the “Economic Reform Agenda”). The main objectives of the structural reform agenda are reaching a high-income level with strong and sustainable growth and ‘Inclusive Growth’ which will enable all parts of the society to benefit from strong and sustainable growth. In June 2016, the Government introduced a comprehensive package of economic reform to improve the investment climate in Turkey, proposing a range of new legal amendments to eliminate obstacles faced by foreign direct investors and to ease employment restrictions on foreigners. On August 10, 2016, the parliament, in an effort to boost domestic savings, approved a new law that will require workers under the age of 45 to be automatically enrolled in a private pension plan. On August 26, 2016, the Parliament approved a bill to set up a sovereign wealth fund to finance large projects in Turkey and ease the burden of Turkish banks. The new wealth fund, with initial capital of TL 50 million, which will be paid out of Turkey’s privatization fund, may get additional financing from the Government’s asset sales program, cash surpluses from the privatization fund and other government institutions.
POLITICAL CONDITIONS
On May 5, 2016, the Republic’s former Prime Minister Mr. Ahmet Davutoğlu announced his resignation. On May 22, 2016, the ruling Justice and Development Party held an extraordinary congress and elected Mr. Binali Yıldırım as its new chairman and therefore, as Prime Minister of the Republic. On the same day, President Mr. Recep Tayyip Erdoğan accepted the resignation of Prime Minister Ahmet Davutoglu and his cabinet. On May 24, 2016, Mr. Yıldırım formed the 65th Turkish government.
Following the election of Prime Minister Binali Yildirim in May 2016, the Government has indicated that it will focus on revising the constitution and newly elected Prime Minister Binali Yildirim has indicated that he is supportive of a presidential model.
On May 24, 2016, Prime Minister Binali Yildirim announced members of the new cabinet, including 9 new ministers and 4 re-seated ministers. Deputy Prime Minister in charge of Economic and Financial Affairs Mr. Mehmet Şimşek and Minister of Finance Mr. Naci Ağbal retained their posts.
On August 31, 2016, Minister of Interior Efkan Ala resigned and Minister of Labor and Social Security Süleyman Soylu replaced him. The former Minister of Health Mehmet Müezzinoğlu was appointed as Minister of Labor and Social Security.
5
The following table sets forth the composition of the Assembly by total number of seats as of September 2, 2016:
| | | | |
| | | Number of
Seats | |
Justice and Development Party (AKP) | | | 317 | |
Republican People’s Party (CHP) | | | 133 | |
People’s Democratic Party (HDP) | | | 59 | |
Nationalist Action Party (MHP) | | | 40 | |
Independent | | | 1 | |
| | | | |
Total | | | 550 | |
| | | | |
Source: The Grand National Assembly of Turkey
INTERNATIONAL RELATIONS
On March 15, 2016, the fifth Turkey and Azerbaijan High Strategic Cooperation Council meeting was held in Ankara. During the meeting, six cooperation agreements were signed alongside a declaration to increase efforts to complete the Trans Anatolian Pipeline Project before the scheduled date.
On March 16, 2016, Turkey ratified the new Trade Facilitation Agreement, becoming the 71st World Trade Organization member to do so.
On April 14, 2016, the European Parliament released a report criticizing Turkey over democracy, human rights and the rule of law while calling for an end to military operations in the Kurdish populated southeast. On April 15, 2016, Turkey’s European Union Affairs Minister announced that the report is considered null and void and stated that it would be sent back to the European Parliament.
United States
On July 19, 2016, Turkey filed an official request with the United States for the extradition of Fethullah Gulen, a Pennsylvania-based preacher accused of masterminding the failed military coup on July 15, 2016. On August 2, 2016, Turkey filed a second request for the extradition of Fethullah Gulen. On August 23, 2016, a delegation from the United States visited Turkey to discuss the extradition of Fethullah Gulen with officials from relevant government institutions. On August 24, 2016, U.S. Vice President Biden met with President Erdoğan in Ankara to ease the tensions between Turkey and the United States over the extradition of Fethullah Gulen. After the meeting, Vice President Biden stated that the United States had no interest whatsoever in shielding anyone who has done harm to an ally but the United States government needs to meet the legal standard requirement under the law. On another visit to the US by the Turkish delegation in September 2016, relevant Turkey and US counterparts re-exchanged views.
Russia
On June 27, 2016, President Erdoğan sent a letter to Russian President Vladimir Putin to commence the process of overcoming the crisis in bilateral relations. On June 29, 2016, both leaders held a phone conversation, during which both parties emphasized the importance of normalizing relations between the two countries. On June 30, 2016, Russia started the implementation of a government order to lift the ban on charter flights to Turkey.
On August 9, 2016, President Erdoğan met with Russian President Vladimir Putin in St. Petersburg to discuss reinforcing bilateral relations, where Turkey and Russia agreed to establish a joint investment fund and increase cooperation in the defense sector.
On August 28, 2016, the Russian government stated that its ban on charter flights from Russia to Turkey, which it had announced on November 28, 2015, would no longer be in effect. These charter flights bring the majority of tourists from Russia to Turkey.
On September 15, 2016, the Turkish and Russian military chiefs came together in Ankara on seeking joint perspective on contentious issues in the Middle East. The meeting came after Russia’s top general arrived in Ankara for the first time in 11 years.
6
Cyprus
On April 5, 2016, the prime minister of the Turkish Cypriot administration submitted the resignation of his government following the withdrawal of the government’s coalition partner. Turkish Cypriot President Mustafa Akıncı has assigned National Unity Party Chairman Hüseyin Özgürgün to form a new government. On April 18, 2016, the new cabinet which was formed by the National Unity Party leader Hüseyin Özgürgün and the Democrat Party leader Serdar Denktaş with the support of the independent deputies was approved by President Mustafa Akıncı.
Syria
On February 14, 2016, Saudi military jets landed at Turkey’s Incirlik air base in the southern Adana province to carry out missions against DAESH.
On August 24, 2016, Turkey launched a major military operation called “Operation Euphrates Shield” with U.S. and Russian support in Syria in an effort to improve security, support coalition forces and eliminate the terror threat along Turkey’s border. “Operation Euphrates Shield” is consistent with Turkey’s right to self-defense arising from international treaties and a mandate given to Turkey’s armed forces by Parliament in 2014, which was extended for another year in September 2015. As of September 23, 2016, “Operation Euphrates Shield” is still ongoing.
Israel
On June 27, 2016, Turkey and Israel signed a reconciliation agreement to re-start the normalization of bilateral relations after a six-year hiatus. According to the reconciliation agreement, Israel will transfer $20 million to a humanitarian fund that will compensate the families of the Turkish nationals killed and wounded during a 2010 Gaza flotilla raid on the Mavi Marmara. In addition to compensation, Israel has agreed to allow Turkey to build infrastructure projects in Gaza and to transfer unlimited humanitarian aid to Gaza through the Ashdod Port. On August 31, 2016, President Erdoğan approved the procedural agreement regarding compensation between Turkey and Israel.
ECONOMIC DEVELOPMENTS
The following table sets forth the percentage of GDP represented by economic sector (at constant prices and expressed in percentages) for the periods indicated:
| | | | | | | | | | |
GDP by Economic Sector (in %) | | 2016
Q1 | | | 2016
Q2 | |
1. | | Agriculture, forestry and fishing | | | 4.5 | | | | 7.1 | |
2. | | Mining and quarrying | | | 0.5 | | | | 0.6 | |
3. | | Manufacturing | | | 25.8 | | | | 25.8 | |
4. | | Electricity, gas, steam and air conditioning supply | | | 1.5 | | | | 1.8 | |
5. | | Water supply, sewerage, waste management and remediation | | | 0.4 | | | | 0.5 | |
6. | | Construction | | | 5.8 | | | | 6.2 | |
7. | | Wholesale and retail trade | | | 13.1 | | | | 13.1 | |
8. | | Transportation and storage | | | 12.2 | | | | 12.4 | |
9. | | Accommodation and food service activities | | | 1.4 | | | | 1.3 | |
10. | | Information and communication | | | 2.7 | | | | 2.7 | |
11. | | Financial and insurance activities | | | 14.4 | | | | 13.0 | |
12. | | Real estate activities | | | 4.9 | | | | 4.6 | |
13. | | Professional, scientific and technical activities | | | 3.7 | | | | 2.6 | |
14. | | Administrative and support service activities | | | 2.3 | | | | 1.9 | |
15. | | Public administration and defense; compulsory social security | | | 3.0 | | | | 2.8 | |
16. | | Education | | | 2.4 | | | | 2.1 | |
17. | | Human health and social work activities | | | 1.5 | | | | 1.2 | |
18. | | Arts, entertainment and recreation | | | 0.2 | | | | 0.2 | |
19. | | Other service activities | | | 0.9 | | | | 0.8 | |
7
| | | | | | | | | | |
GDP by Economic Sector (in %) | | 2016
Q1 | | | 2016
Q2 | |
20. | | Activities of household as employers | | | 0.2 | | | | 0.1 | |
21. | | Sectoral total | | | 101.4 | | | | 100.7 | |
22. | | Financial intermediation services indirectly measured | | | 10.6 | | | | 9.7 | |
23. | | Taxes-Subsidies | | | 9.2 | | | | 9.0 | |
24. | | Gross Domestic Product (Purchaser’s Price) | | | 100.0 | | | | 100.0 | |
Source: TURKSTAT
The following table sets forth increases or decreases in GDP (at constant prices and expressed in percentages) for the periods indicated:
| | | | | | | | |
GDP growth rates (in %) | | Q1 | | | Q2 | |
2016 | | | 4.7 | | | | 3.1 | |
Source: TURKSTAT
For the month of September 2016, CPI decreased by 0.18% and domestic PPI increased by 0.29% as compared to the previous month.
In September 2016, the Republic’s annual CPI and domestic PPI increased by 7.28% and 1.78%, respectively, as compared to the same month of the previous year.
On September 28, 2016, the Government offered an interest rate of 9.94% for its 10-year Government Bond, compared to 10.54% on October 7, 2015.
The calendar adjusted industrial production index decreased by 4.9% in July 2016 compared to July 2015 (year on year).
The following table indicates unemployment figures for 2016:
| | | | | | | | |
| 2016 | | Unemployment
rate (in %) | | | Number of
unemployed | |
January | | | 11.1 | | | | 3,290,000 | |
February | | | 10.9 | | | | 3,224,000 | |
March | | | 10.1 | | | | 3,023,000 | |
April | | | 9.3 | | | | 2,824,000 | |
May | | | 9.4 | | | | 2,895,000 | |
June | | | 10.2 | | | | 3,127,000 | |
Source: TURKSTAT
On January 11, 2016, the Medium Term Program covering the 2016-2018 period (the “2016-2018 Medium Term Program”) was announced. The main objectives of the 2016-2018 Medium Term Program are increasing stable and inclusive growth, reducing inflation, preserving the decreasing trend in the current account deficit, increasing competitiveness, employment and productivity, and improving fiscal discipline and strengthening public finance. The 2016-2018 Medium Term Program set a central government budget deficit target of 1.3% of GDP by the end of 2016, 1.0% of GDP by the end of 2017, and 0.8% of GDP by the end of 2018. In the 2016-2018 Medium Term Program, the government announced that real GDP target growth is 4.5% in 2016, and 5.0% in 2017 and 2018. The primary surplus to GDP ratio target is 0.6% for 2016, 1.1% for 2017, and 1.3% for 2018. The general government deficit to GDP target is 0.7% for 2016, 0.7% for 2017 and 0.4% for 2018. The EU defined general government debt to GDP ratio target is 31.7% for 2016, 30.5% for 2017 and 29.5% for 2018. The current account deficit to GDP ratio target is 3.9% for 2016, 3.7% for 2017, and 3.5% for 2018. The domestic savings to GDP ratio target is 16.5% for 2016, 17.2% for 2017 and 17.8% for 2018. The CPI inflation target is 7.5% for 2016, 6.0% for 2017 and 5.0% for 2018. The unemployment target is 10.2% for 2016, 9.9% for 2017 and 9.6% for 2018.
8
TOURISM
In August 2016, the number of foreign visitors visiting the Republic decreased by approximately 37.96% to 3,183,003 as compared to the same month of 2015. Between January and August 2016, the number of foreign visitors visiting the Republic decreased by approximately 31.81% to 17,391,431 as compared to the same period in 2015. According to the Turkish Statistical Institute, in the second quarter of 2016, tourism revenues decreased by 35.6% compared to the same period of 2015.
EMPLOYMENT AND WAGES
As of June 2016, total civilian employment was approximately 27.65 million of whom approximately 20.2% were employed in agriculture, 19.3% in industry, 7.5% in construction and 53.1% in services sectors. In June 2016, the labor force participation rate was at 52.4%, compared to 52.1% in June 2015. There were approximately 3,622,000 public sector workers at the end of the second quarter of 2016.
As of July 2016, the total asset value of the Unemployment Insurance Fund amounted to TL 98.3 billion. The monthly return of the fund for July 2016 was 0.68% As of July 2016, approximately 91.6% of the Unemployment Insurance Fund was invested in bonds and 7.1% of the assets were held in deposits.
As of September 6, 2016, the number of pension funds offered to the public equaled 250. The total net asset value of these funds increased to approximately TL 57.1 billion as of September 6, 2016 from TL 47.8 billion on December 31, 2015.
FOREIGN TRADE AND BALANCE OF PAYMENTS
In August 2016, the trade balance (according to provisional data) posted a deficit of U.S.$4.687 billion as compared to a deficit of U.S.$4.947 billion in the same period in 2015. In August 2016, total goods imported (c.i.f.), including gold imports, increased by 3.7% to approximately U.S.$16.554 billion, as compared to approximately U.S.$15.969 billion during the same period in 2015. In August 2016, the import of capital goods, which are used in the production of physical capital, increased by approximately 13% over the same period in 2015; the import of intermediate goods such as partly finished goods and raw materials, which are used in the production of other goods, decreased by approximately 2% over the same period in 2015; and the import of consumption goods decreased by approximately 0.3% over the same period in 2015. In August 2016, total goods exported (f.o.b.), increased by 7.7% to approximately U.S.$11.867 billion, as compared to approximately U.S.$11.022 billion during the same period of 2015. Between January and July 2016, the current account produced a deficit of approximately U.S.$21.701 billion, as compared to a deficit of approximately U.S.$25.011 billion in the same period of 2015.
According to provisional data, net foreign direct investment inflows into Turkey amounted to U.S.$400 million in July 2016.
The following table summarizes the balance of payments of Turkey for the periods indicated:
| | | | |
in millions of U.S. dollars* | | January-July
2016 | |
CURRENT ACCOUNT | | | -21,701 | |
Trade Balance | | | -24,057 | |
Goods Exports | | | 85,809 | |
Goods Imports | | | 109,866 | |
Services | | | 6,522 | |
Primary Income | | | 5,108 | |
Secondary Income | �� | | 942 | |
CAPITAL ACCOUNT | | | 26 | |
FINANCIAL ACCOUNT | | | -24,989 | |
Direct Investment (net) | | | -2,989 | |
9
| | | | |
in millions of U.S. dollars* | | January-July
2016 | |
Portfolio Investment (net) | | | -9,653 | |
Assets | | | -382 | |
Liabilities | | | 9,271 | |
Other Investment (net) | | | -12,347 | |
Assets | | | 1,310 | |
Liabilities | | | 13,657 | |
RESERVE ASSETS | | | 6,773 | |
NET ERRORS AND OMISSIONS | | | 3,459 | |
Source: CBRT
In June 2016, the volume of crude oil imports decreased by 12.69% compared to June 2015. In June 2016, natural gas imports decreased by 0.88% to 3,173.14 million cubic meters compared to 3,201.40 million cubic meters in June 2015. In June 2016, liquefied petroleum gas imports decreased by 4.5% to 294,038 tons compared to 307,898 tons in June 2015.
As of July 2016, total gross international reserves were approximately U.S.$141,810 million (compared to U.S.$140,996 million as of July 2015). As of July 2016, gold reserves were approximately U.S.$19,791 million (compared to U.S.$18,107 million as of July 2015) and the Central Bank gross foreign exchange reserves were approximately U.S.$99,927 million (compared to approximately U.S.$102,533 million as of July 2015).
As of September 29, 2016, the Central Bank held approximately TL 129.6 billion in public sector deposits.
MONETARY POLICY
The Central Bank set the annual inflation target rate for 2016 at 5.0%. The following table sets forth the quarterly inflation path and uncertainty band for 2016:
Inflation Path Consistent with the Year-End Inflation Target and the Uncertainty Band for 2016
| | | | | | | | | | | | | | | | |
| | | March | | | June | | | September | | | December | |
Uncertainty Band (Upper Limit) | | | 7.0 | | | | 7.0 | | | | 7.0 | | | | 7.0 | |
Path Consistent with the Target | | | 5.0 | | | | 5.0 | | | | 5.0 | | | | 5.0 | |
Uncertainty Band (Lower Limit) | | | 3.0 | | | | 3.0 | | | | 3.0 | | | | 3.0 | |
Source: Central Bank
On October 3, 2016, the Central Bank foreign exchange buying rate for U.S. dollars was TL 3.0036 per U.S. dollar.
The following table displays the period-end exchange rate of Turkish Lira per U.S. Dollar, Euro, and Japanese Yen and against the U.S. Dollar-Euro currency basket:
Period-End Exchange Rates
| | | | |
| | | 2016** | |
Turkish Lira per U.S. Dollar | | | 3.00 | |
Turkish Lira per Euro | | | 3.37 | |
Turkish Lira per 100 Japanese Yen | | | 2.96 | |
Turkish Lira per Currency Basket (*) | | | 3.19 | |
| | (*) | The basket consists of U.S.$0.5 and EUR 0.5. |
| | (**) | As of October 3, 2016. |
Source: CBRT
10
A team from the International Monetary Fund (the “IMF”) visited the Republic between January 20, 2016 and February 1, 2016 for the annual evaluation of the economy as part of the regular consultations under Article IV of the IMF’s Articles of Agreement. The IMF periodically consults with each member state in order to ensure that each member state has in place a sound macroeconomic framework and corresponding policies to promote financial stability, economic growth and free exchange rates. On February 2, 2016, the IMF published a concluding statement with its preliminary findings. In its statement, the mission highlighted that a tighter monetary policy stance is needed to bring inflation back to the 5% target in the medium-term. The IMF also emphasized that a tighter fiscal stance would contribute to reducing external imbalances and lowering inflation. On March 25, 2016, the Executive Board of the IMF concluded the Article IV consultation with Turkey. Executive Directors of the IMF remarked on the Turkish economy’s resilient growth notwithstanding shocks in 2015. At the same time, they noted that high inflation, external imbalances, and dependence on external financing pose vulnerabilities. They, therefore, underscored the need to rebalance the economy through macroeconomic policies and structural reforms aimed at increasing domestic savings and raising potential growth.
In 2015, Turkey requested for a Financial Sector Assessment Program (“FSAP”) update to be performed in 2016. The FSAP Mission, composed of IMF and World Bank staff, visited Turkey in April and June 2016 to consult with the relevant authorities, public and private institutions and non-governmental organizations on a broad range of issues, including banking, insurance and financial market infrastructures, systemic risks, Islamic finance, capital markets and financial inclusion. As of September 2016, the process is still underway.
On January 19, 2016, the Monetary Policy Committee held another meeting at which it kept short-term interest rates constant compared to the prior meeting on December 22, 2015. At the meeting, the Committee noted that future monetary policy decisions will be conditional on the inflation outlook. The Committee further noted that, taking into account inflation expectations, pricing behavior and the course of other factors affecting inflation, the tight monetary policy stance will be maintained. The Committee also assessed the heightened global volatility since the beginning of the year and the January Inflation Report forecasts.
On February 23, 2016, the Monetary Policy Committee held another meeting at which it kept short-term interest rates constant compared to the prior meeting on January 19, 2016. The Committee stated that annual loan growth continues at reasonable rates in response to the tight monetary policy stance and macro-prudential measures. The Committee noted the favorable developments in the terms of trade and the moderate course of consumer loans contributing to the improvement in the current account balance. The Committee also noted that demand from the European Union economies continues to support exports at an increasing pace, despite elevated geopolitical risks in other export markets. The Committee determined that the implementation of announced structural reforms would contribute to potential growth significantly. The Committee stated that energy price developments affect inflation favorably, while other cost factors limit the improvement in the core indicators. Considering the wage developments and the impact of the uncertainty in global markets on inflation expectations and pricing behavior and taking into account the volatility in energy and unprocessed food prices, the Committee stated that the tight liquidity stance will be maintained as long as deemed necessary. The Committee again noted that future monetary policy decisions will be conditional on the inflation outlook. The Committee further noted that, taking into account inflation expectations, pricing behavior and the course of other factors affecting inflation, the tight monetary policy stance will be maintained.
On March 24, 2016, the Monetary Policy Committee held another meeting at which it decided to reduce the marginal funding rate from 10.75% to 10.5%. The Committee kept the borrowing rate and one-week repo rate constant at 7.25% and 7.5%, respectively, compared to the prior meeting held on February 23, 2016. The Committee stated that annual loan growth continues at reasonable rates in response to the tight monetary policy stance and macroprudential measures. The Committee also noted that favorable developments in the terms of trade and the moderate course of consumer loans contribute to the improvement in the current account balance. The Committee recognized that demand from the European Union economies continues to support exports at an increasing pace, despite elevated geopolitical risks in other export markets. The Committee assessed that the implementation of announced structural reforms would contribute to potential growth significantly. The Committee noted that recently, global volatility has eased to some extent. The Committee further noted that with the effective use of the policy instruments laid out in the road map published in August 2015, the need for a wide interest rate corridor has been reduced. In this respect, the Committee decided to take a measured step towards simplification. However, the Committee stated that improvement in the underlying core inflation trend remains limited, necessitating the
11
maintenance of a tight liquidity stance. The Committee acknowledged that future monetary policy decisions will be conditional on the inflation outlook. The Committee further acknowledged that taking into account inflation expectations, pricing behavior and the course of other factors affecting inflation, the tight monetary policy stance will be maintained.
On April 20, 2016, the Monetary Policy Committee held another meeting at which it decided to reduce the marginal funding rate from 10.5% to 10.0%. The Committee kept the borrowing rate and one-week repo rate constant at 7.25% and 7.5%, respectively, compared to the prior meeting held on March 24, 2016. The Committee stated that annual loan growth continues at reasonable rates in response to the tight monetary policy stance and macroprudential measures. The Committee also noted that favorable developments in the terms of trade and the moderate course of consumer loans contribute to the improvement in the current account balance. The Committee recognized that demand from the European Union economies continues to support exports at an increasing pace, despite elevated geopolitical risks in other export markets. The Committee also noted that recent data and the leading indicators show that economic activity displays a moderate and stable course of growth. The Committee assessed that the implementation of structural reforms would contribute to potential growth significantly and the recent decline in global volatility has continued and global financial conditions have improved. The Committee further assessed that along with these developments, the effective use of the policy instruments laid out in the road map published in August 2015 has reduced the need for a wide interest rate corridor. In this respect, the Committee decided to take a measured step towards simplification. The Committee stated that recently, inflation displayed a marked decline, which was mainly due to unprocessed food prices, and this decline is expected to continue in the short run. However, improvement in the underlying core inflation trend remains limited, necessitating the maintenance of a tight liquidity stance. The Committee acknowledged that future monetary policy decisions will be conditional on the inflation outlook and taking into account inflation expectations, pricing behavior and the course of other factors affecting inflation, the tight monetary policy stance will be maintained.
On May 24, 2016, the Monetary Policy Committee held another meeting at which it decided to reduce the marginal funding rate from 10.0% to 9.5% The Committee kept the borrowing rate and one-week repo rate constant at 7.25% and 7.5%, respectively, compared to the prior meeting held on April 20, 2016. The Committee also decided to reduce the late liquidity window lending rate from 11.5% to 11% The Committee stated that annual loan growth continues at reasonable rates in response to the tight monetary policy stance and macroprudential measures. The Committee also noted that favorable developments in the terms of trade and the moderate course of consumer loans contribute to the improvement in the current account balance. The Committee recognized that demand from the European Union economies continues to support exports, while domestic demand continues to have a positive impact on growth. The Committee also noted that economic activity displays a moderate and stable course of growth. The Committee assessed that the implementation of structural reforms would contribute to potential growth significantly. The Committee further assessed that the tight monetary policy stance, the cautious macroprudential policies and the effective use of the policy instruments laid out in the road map published in August 2015 increase the resilience of the economy against shocks. In this respect, the Committee decided to take a measured step towards simplification. The Committee stated that recently inflation has displayed a marked decline, which was mainly due to unprocessed food prices. However, it is noted that the improvement in the underlying core inflation trend remains limited, necessitating the maintenance of a tight liquidity stance. The Committee acknowledged that future monetary policy decisions will be conditional on the inflation outlook and taking into account inflation expectations, pricing behavior and the course of other factors affecting inflation, the tight monetary policy stance will be maintained.
On June 21, 2016, the Monetary Policy Committee held another meeting at which it decided to reduce the marginal funding rate from 9.5% to 9.0%. The Committee kept the borrowing rate and one-week repo rate constant at 7.25% and 7.5%, respectively, compared to the prior meeting held on May 24, 2016. The Committee also decided to reduce the late liquidity window lending rate from 11.0% to 10.5% The Committee stated that annual loan growth continues at reasonable levels in response to the tight monetary policy stance and macroprudential measures. The Committee assessed that economic activity in Turkey remains on a moderate and steady growth track and consumer spending spurred domestic demand while investments remained weak. The Committee further assessed that global financial markets remain volatile amid ongoing concerns over global growth, developments regarding the UK’s exit from the EU and continued uncertainty about global monetary policies. The Committee stated that the sharp decline in food inflation since the beginning of the year helped to bring consumer inflation down markedly, although the underlying services inflation trend remains elevated. The Committee acknowledged that in the upcoming period, the monetary policy stance will be conditional on the inflation outlook and taking into account inflation expectations, the pricing behavior and the course of other factors affecting inflation, the tight monetary policy stance will be maintained.
12
On July 19, 2016, the Monetary Policy Committee held another meeting at which it decided to reduce the marginal funding rate from 9.0% to 8.75% The Committee kept the borrowing rate and one-week repo rate constant at 7.25% and 7.5%, respectively, compared to the prior meeting held on June 21, 2016. The Committee also decided to reduce the late liquidity window lending rate from 10.5% to 10.25% The Committee stated that the recent hikes in unprocessed food prices and the tobacco price adjustments would cause an upsurge in inflation in the short term. The Committee also noted that food prices may see a downward correction in the upcoming periods, and that owing to the measures taken by the Food and Agricultural Product Markets Monitoring Committee accompanied by the seasonal decline in food demand caused by the tourism sector, the year-end food price inflation is expected to prove lower compared to the previous reporting period. The Committee recognized that financial conditions continue to be tight despite the recent rise in the global risk appetite, which slightly eased conditions. The Committee also recognized that global financial markets and capital flows remain highly volatile. The Committee also noted recent terrorist attacks and domestic developments pose a downside risk to economic activity especially through the tourism sector. The Committee assessed that the current account deficit may widen slightly in the short term even though external balances continue to recover. The Committee further assessed that recent exchange rate developments pose an upside risk to inflation through the cost channel. The Committee stated that it would closely monitor the developments in both global and domestic markets and take necessary stabilizing measures by utilizing its large variety of tools. The Committee acknowledged that simplification of the monetary policy is planned to be finalized within a reasonable schedule and the pace and timing of simplification would depend on the developments regarding inflation and financial stability.
On August 23, 2016, the Monetary Policy Committee held another meeting at which it decided to reduce the marginal funding rate from 8.75% to 8.50% The Committee kept the borrowing rate and one-week repo rate constant at 7.25% and 7.5%, respectively, compared to the prior meeting held on July 19, 2016. The Committee also decided to reduce the late liquidity window lending rate from 10.25% to 10.0%. The Committee stated that annual inflation in food items excluding fresh fruits and vegetables registered a decline. The Committee also noted that unprocessed food prices, which saw notable increases in the last couple of months, may display a downward correction in the short term. The Committee recognized that financial conditions remain tight while the moderate course of annual loan growth rates continues. The Committee also noted economic activity maintains a moderate and stable course of growth, and consumption spending has slowed down slightly, while investment remains relatively sluggish. The Committee also noted that domestic developments in July 2016, geopolitical factors, waning global growth and a sluggish tourism sector pose a downside risk to economic activity. The Committee assessed that the volatility in global financial markets has recently eased, and portfolio inflows to emerging markets gained momentum amid the increased risk appetite. The Committee stated that the ultimate aim of monetary policy simplification is to achieve a narrow and symmetrical corridor and provide funding via a single rate. The Committee acknowledged that in the upcoming period, the monetary policy stance will be conditional on the inflation outlook and taking into account inflation expectations, the pricing behavior and the course of other factors affecting inflation, the tight monetary policy stance will be maintained.
On September 22, 2016, the Monetary Policy Committee held another meeting at which it decided to reduce the marginal funding rate from 8.50% to 8.25% The Committee kept the borrowing rate and one-week repo rate constant at 7.25% and 7.5%, respectively, compared to the prior meeting held on August 23, 2016. The Committee also decided to reduce the late liquidity window lending rate from 10.0% to 9.75%. The Committee stated that recently released data and indicators regarding the third quarter display a deceleration in economic activity. The Committee assessed that current financial conditions are tight and while developments in tourism revenues will have a short-term negative impact, the lagged effects of the developments in the terms of trade and the moderate course of consumer loans will continue to contribute to the improvement in the current account balance. The Committee also noted that the demand from the European Union economies continues to support exports. With the supportive measures and incentives provided recently, domestic demand is expected to recover starting in the final quarter of 2016. The Committee assessed that the implementation of the structural reforms would contribute to the potential growth significantly. The Committee also stated that the slowdown in aggregate demand contributes to the gradual fall in core inflation and, with the help from falling food prices, headline inflation is expected to display a decline in the short term. Yet, the recent tax adjustment in fuel prices and other cost factors limit the improvement in inflation and thus necessitate the maintenance of a cautious monetary policy stance. In light of these assessments, and considering its contribution to the effectiveness of monetary policy, the Committee decided to take a measured and cautious step towards simplification. The Committee also noted that future monetary policy decisions will be conditional on the inflation outlook and taking into account inflation expectations, pricing behavior and the course of other factors affecting inflation, the cautious monetary policy stance will be maintained.
13
On July 17, 2016, following the failed coup attempt, the Central Bank of the Republic of Turkey announced that it had taken several measures for the efficient functioning of markets:
i. The Central Bank will provide banks with needed liquidity without limits.
ii. The commission rate for the Intraday Liquidity Facility will be zero.
iii. Banks will be allowed to place foreign exchange deposits as collateral without limits for needed Turkish lira liquidity.
iv. Banks’ current foreign exchange deposit limits of approximately U.S.$50 billion may be increased and utilization conditions (collateral and cost) may be improved if deemed necessary.
v. All markets and systems (the Electronic Fund Transfer and the Electronic Security Transfer and Settlement systems) will be left open until final settlement of transactions.
vi. Market depth and prices will be closely monitored.
vii. All measures will be taken to ensure financial stability, if deemed necessary.
As of September 22, 2016, the one-week repo auction rate of the Central Bank was 7.5%, the Central Bank overnight borrowing interest rate was 7.25% and the Central Bank marginal funding rate was 8.25%.
BANKING SYSTEM
The Republic has a relatively strong, well-capitalized and profitable banking system. The banking system in the Republic had a capital adequacy ratio of 15.80% and a relatively low non-performing loan ratio of 3.17% as of July 2016. This ratio takes into account a moderate increase in non-performing retail loans.
As of July 2016, the loan to deposit ratio and net income margin of the banking sector were 123.77% and 0.94%, respectively.
On February 26, 2016, Turkey’s second state-owned participation bank, Vakıf Participation Bank, officially began operating with an initial capital of TL 805 million.
As of October 3, 2016, the RRRs for Turkish Lira deposits/participation accounts were between 4.0% and 7.5% depending on maturity. Furthermore, as of that date RRRs were 10.5% for Turkish Lira demand deposits, notice deposits and private current accounts, and deposits/participation accounts with maturities up to one month and three months (including 1 and 3 months).
In February 2015, the Turkish Banking Regulation and Supervision Agency (the “BRSA”) ordered the seizure of Asya Katilim Bankasi, a publicly traded bank in Turkey that trades as Bank Asya, as a result of which the Turkish Savings and Deposits Insurance Fund assumed management control of the bank. The BRSA announced it was taking such action due to Bank Asya’s violation of a provision of the Banking Law that requires banks to have a transparent and open shareholding and organizational structure that does not obstruct the efficient auditing of the bank by the BRSA. On May 29, 2015, the management of Bank Asya was transferred to the Savings Deposit Insurance Fund. On May 23, 2016, the Savings Deposit Insurance Fund decided to sell Bank Asya via an auction. The auction took place on July 15, 2016 but the only qualified bidder did not present an offer and the sale was unsuccessful. Subsequent to the inconclusive resolution process, on July 21, 2016, the Board of Savings Deposit Insurance Fund requested the BRSA to cancel the banking license of Bank Asya. On July 22, 2016, the banking license of Bank Asya was cancelled by the BRSA. After this decision, the liquidation process of Bank Asya started.
PUBLIC FINANCE AND BUDGET
During the period from January – August in 2016, the central government consolidated budget expenditures were approximately TL 363.5 billion and the central government consolidated budget revenues were approximately TL 368.4 billion, compared to central government consolidated budget expenditures of approximately TL 319.7 billion and consolidated budget revenues of approximately TL 320.4 billion during the same period in 2015. During the period from January – August in 2016, the central government consolidated budget surplus was approximately TL 4.9 billion, compared to a central government consolidated budget surplus of approximately TL 639 million during the same period in 2015.
14
During the period from January – August in 2016, the central government consolidated budget primary surplus reached approximately TL 40.3 billion, compared to the central government consolidated budget primary surplus of approximately TL 39.0 billion during the same period in 2015.
In August 2016, the central government consolidated budget expenditures were approximately TL 47.3 billion and the central government consolidated budget revenues were approximately TL 50.9 billion, compared to central government consolidated budget expenditures of approximately TL 37.5 billion and central government consolidated budget revenues of approximately TL 42.8 billion during the same period in 2015.
In August 2016, the central government consolidated budget surplus was approximately TL 3.6 billion, compared to a central government consolidated budget surplus of approximately TL 5.2 billion during the same period in 2015.
In August 2016, the central government consolidated budget primary surplus reached approximately TL 8.4 billion, compared to a central government consolidated budget primary surplus of approximately TL 8.9 billion during the same period in 2015.
The following table sets forth the details of the central government budget for the period from January-August 2016 and for August 2016.
| | | | | | | | |
Central Government Budget (Thousand TL) | | January – August 2016
(cumulative) | | | August
2016 | |
Budget Expenditures | | | 363,538,820 | | | | 47,273,113 | |
1-Excluding Interest | | | 328,101,659 | | | | 42,424,195 | |
Compensation of Employees | | | 100,959,780 | | | | 11,671,457 | |
Social Security Contributions | | | 16,552,053 | | | | 1,993,155 | |
Purchase of Goods and Services | | | 30,087,071 | | | | 4,060,450 | |
Current Transfers | | | 145,473,689 | | | | 18,090,358 | |
Capital Expenditures | | | 23,688,918 | | | | 5,053,298 | |
Capital Transfers | | | 3,826,540 | | | | 592,280 | |
Lending | | | 7,513,608 | | | | 963,197 | |
2-Interest | | | 35,437,161 | | | | 4,848,918 | |
Budget Revenues | | | 368,409,092 | | | | 50,865,003 | |
1-General Budget Revenues | | | 354,370,510 | | | | 49,482,879 | |
Taxes | | | 298,090,158 | | | | 45,425,215 | |
Property Income | | | 18,828,405 | | | | 899,180 | |
Grants and Aids and Special Revenues | | | 1,822,881 | | | | 69,931 | |
Interest, Shares and Fines | | | 23,853,683 | | | | 2,918,151 | |
Capital Revenues | | | 10,950,320 | | | | 131,268 | |
Collections from Loans | | | 825,063 | | | | 39,134 | |
2-Special Budget Institutions | | | 10,830,592 | | | | 1,233,622 | |
3-Regularity & Supervisory Institutions | | | 3,207,990 | | | | 148,502 | |
Budget Balance | | | 4,870,272 | | | | 3,591,890 | |
Balance Excluding Interest | | | 40,307,433 | | | | 8,440,808 | |
Source: Ministry of Finance
According to the Constitution, the budget law should be submitted to the Parliament at least 75 days prior to the year-end. Moreover, the budget law (either provisional or not) should be enacted before the beginning of the fiscal year. However, due to the busy election calendar, the Parliament was not able to negotiate the budget in 2015. Under these circumstances, according to article 19 of the Law 5018 named Public Management and Control, a provisional budget should be enacted. The provisional budget, which covered the period between January 1, 2016 and March 31, 2016, was approved by the Parliament and published in the Official Gazette on December 23, 2015.
Following Parliamentary negotiations that took place in January and February of 2016, the final 2016 Budget Law was approved on March 9, 2016 and published in the Official Gazette on March 16, 2016.
15
PRIVATIZATION
The Republic’s plans for privatization include, among others, the remaining shares of Turk Telekom A.S., Turk Hava Yollari A.O., electricity generators/distributors, bridges and ports, toll roads, Halkbank, and the national lottery.
In 2015, the privatization implementations of Turkey amounted to an aggregate U.S.$2 billion in value. In 2016, the privatization implementations of Turkey amounted to U.S.$681.5 million in value as of October 3, 2016.
The following table sets out a summary of the most significant privatization implementations completed in 2016:
| | | | | | | | |
Name of The Company or Asset | | Date of
Privatization | | | Amount (U.S.
Dollars) | |
EÜAŞ — Manavgat Hydroelectric Power Plant and its immovable fixed assets | | | 4/4/2016 | | | | 131,219,633 | |
EÜAŞ — Doğankent, Kürtün ve Torul Hydroelectric Power Plant and its immovable fixed assets | | | 4/29/2016 | | | | 435,204,263 | |
| Note: | Only privatizations worth U.S.$100 million or more are listed above. |
Total privatization proceeds realized by the Turkish Privatization Administration (PA) since 1985 amounted to U.S.$67.5 billion as of October 3, 2016.
DEBT
On January 29, 2016, the Treasury revised the 2016 financing program based on the new medium-term program projections. According to the revised program, the total amount of debt service is projected to be TL 120.4 billion, comprising payments of TL 70.9 billion in principal and TL 49.5 billion in interest. Total domestic debt service is expected to be TL 94.0 billion while total external debt service is expected to be TL 26.5 billion. On the external financing front, the Treasury announced that up to U.S.$4.5 billion equivalent external financing is planned in 2016 through bond and lease certificate issuances in international markets and the total amount of external financing is planned to reach at most U.S.$5.5 billion, with the inclusion of project and program loans from the World Bank, European Investment Bank and other international financial institutions.
The Central Government’s total domestic debt stock was approximately TL 458.4 billion as of the end of August 2016, compared to approximately TL 435.0 billion as of the end of August 2015. In August 2016, the average maturity of the Republic’s domestic cash borrowing was 80.9 months, as compared to 41.6 months in August 2015. The average annual interest rate on domestic cash borrowing in local currency (including discounted treasury bills/government bonds) on a compounded basis was 9.92% in August 2016, compared to 8.84% in August 2015.
The total gross outstanding external debt of the Republic was approximately U.S.$421,434 million (at then-current exchange rates) at the end of the second quarter of 2016. The table below summarizes the gross external debt profile of the Republic (at period end).
| | | | | | | | |
| | | 2016 | |
Gross Extern Debt Profiles | | Q1 | | | Q2 | |
| | | (Million USD) | |
GROSS EXTERNAL DEBT | | | 411,502 | | | | 421,434 | |
SHORT TERM | | | 106,640 | | | | 107,469 | |
Public Sector | | | 17,559 | | | | 16,486 | |
Central Bank | | | 173 | | | | 157 | |
Private Sector | | | 88,908 | | | | 90,826 | |
LONG TERM | | | 304,862 | | | | 313,965 | |
Public Sector | | | 100,614 | | | | 105,014 | |
Central Bank | | | 1,131 | | | | 1,010 | |
Private Sector | | | 203,117 | | | | 207,941 | |
Source: Undersecretariat of Treasury
16
SUMMARY OF KEY ECONOMIC INDICATORS
The following table summarizes the key economic indicators of Turkey for the periods indicated:
| | | | | | | | | | | | | | | | | | | | | | | | |
| | | 2011 | | | 2012 | | | 2013 | | | 2014 | | | 2015 | | | 2016 | |
Nominal GDP (billion TL) | | | 1,298 | | | | 1,417 | | | | 1,567 | | | | 1,748 | | | | 1,953 | | | | 1,024 | ** |
Real GDP Growth (%) | | | 8.8 | | | | 2.1 | | | | 4.2 | | | | 3.0 | | | | 4.0 | | | | 3.9 | ** |
Unemployment (%) | | | 9.2 | | | | 8.4 | | | | 9.1 | | | | 9.9 | | | | 10.3 | | | | 10.2 | *** |
Consumer Price Index (%) | | | 10.45 | | | | 6.16 | | | | 7.40 | | | | 8.17 | | | | 8.81 | | | | 7.28 | ****** |
Domestic Manufacturing Producer Price Index (%) | | | 13.3 | | | | 5.5 | | | | 4.5 | | | | 11.4 | | | | 5.9 | | | | 1.78 | ****** |
Current Account Deficit (million USD) | | | 74,402 | | | | 47,961 | | | | 63,608 | | | | 43,552 | | | | 32,241 | | | | 21,701 | **** |
Public Sector Budget Primary Balance /GDP (%) | | | 1.8 | | | | 0.8 | | | | 1 | | | | 0.6 | | | | 0.8 | * | | | 0.6 | * |
Central Government External Debt Stock (million USD) | | | 79,184 | | | | 81,710 | | | | 85,663 | | | | 85,162 | | | | 81,705 | | | | 85,474 | ***** |
Public Sector Borrowing Requirement/GDP (%) | | | 0.1 | | | | 1 | | | | 0.5 | | | | 0.6 | | | | 0 | * | | | 0.3 | * |
| Sources: | TURKSTAT, CBRT, Treasury |
| * | 2016-2018 Medium Term Program target |
From May 23, 2016 to October 3, 2016, the Istanbul Stock Exchange National 100 Index (since April 5, 2013 the Istanbul Stock Exchange has carried out its operations under the title of “Borsa Istanbul”) increased by 0.46%.
17
DESCRIPTION OF THE REPUBLIC
Turkey has a democratically elected parliamentary form of government. Since its founding in 1923, Turkey has aligned itself with the west and is a member of numerous international organizations, including the North Atlantic Treaty Organization (“NATO”), the Council of Europe, the World Bank, the International Monetary Fund (“IMF”) and the Organization for Economic Cooperation and Development (the “OECD”). Turkey is also an associate member of the EU and a founding member of the European Bank for Reconstruction and Development (the “EBRD”).
Since 1980, the Turkish Government has embarked upon a series of market-oriented reforms which, among other things, were designed to remove price controls and reduce subsidies, reduce the role of the public sector in the economy, emphasize growth in the industrial and service sectors, encourage private investment and savings, liberalize foreign trade, reduce tariffs and promote export growth, ease capital transfer and exchange controls and encourage foreign investment, increase the independence of the Central Bank of the Republic of Turkey (the “Central Bank” and “CBRT”) and reform the tax system. Turkey moved towards full convertibility of the Turkish Lira by accepting the obligations of Article VIII of the IMF Articles of Agreement in March 1990. Turkey has developed a market-oriented, highly diversified economy with growing industrial and service sectors, while retaining a prominent agricultural sector that makes the country largely self-sufficient in foodstuffs. According to the Ministry of Development, in 2015, agriculture, industrial sector and services sector accounted for 8.6%, 21.5% and 69.9% of GDP respectively. The average GDP growth rate during the 2011-2015 period was 4.4%. See “Economy—Services,” “Economy—Industry” and “Economy—Agriculture.”
LOCATION, AREA AND TOPOGRAPHY
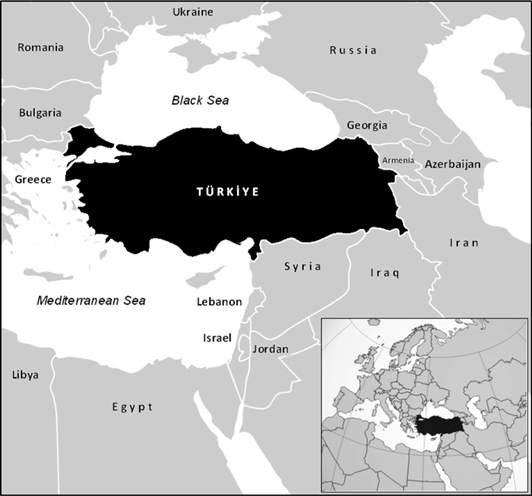
Turkey, situated at the junction of Europe and Asia, is an important crossroads between Western Europe, the Middle East and Asia. Turkey’s location has been a central feature of its history, culture and politics. Turkey’s land borders extend for more than 2,600 kilometers and are shared with eight countries: Greece and Bulgaria in the west and northwest, Iran in the east, Armenia, Georgia and Azerbaijan in the northeast, and Iraq and Syria in the south.
Turkey’s coastline extends for approximately 7,200 kilometers along the Black Sea in the north, the Aegean Sea in the southwest and the Mediterranean Sea in the south, all of which are connected by the Bosporus, the Sea of Marmara and the Dardanelles.
18
Turkey has an area of approximately 814,578 square kilometers (inclusive of its lakes), and its topography is varied. Most of the country consists of highland plateau surrounded by mountainous areas which rise toward the east. Climatic conditions differ widely among the regions.
POPULATION
According to estimates of the Turkish Statistical Institute (“TURKSTAT”) and the Ministry of Development, the population of Turkey was 78,741,053 on December 31, 2015. The annual population growth rate for Turkey in 2015 was 1.34%, compared to an annual growth rate of 1.33% in 2014. Turkey’s population is relatively young compared to other European countries, and the transformation of Turkey’s economy from a largely agricultural economy to an industrial and service-oriented economy has led to an increasingly urban population. According to TURKSTAT, in 2015, 92.1% of the population lived in urban areas and 7.9% lived in rural areas. In 2015, the median age of the population in Turkey was 31, with a median age of 30.4 for males and 31.6 for females. Persons of working age, the age group of 15-64, constituted 67.8% of the total population in 2015.
The largest city in Turkey, with a population of about 14.7 million, is Istanbul, the country’s commercial center. Ankara, the capital city of Turkey, with a population of about 5.27 million is the second largest city. Izmir, with a population of about 4.2 million, is third largest. Other cities with populations in excess of one million are (in alphabetical order) Adana, Antalya, Aydin, Balikesir, Bursa, Diyarbakir, Gaziantep, Hatay, Kahramanmaraş, Kayseri, Kocaeli, Konya, Manisa, Mersin, Samsun, Sanliurfa and Van.
In 2015, total employment was 26,621million, with approximately 20.6% employed in agriculture, 20% in industry and 59.4% in services (including construction). See “Economy-Employment and Wages.” The unemployment rate was 10.3% in 2015.
Turkey has made significant progress in improving social welfare over the last decade. Life expectancy increased from an average of 67.4 years in 1990 to an average of 78 years for the period of 2013-2014. The infant mortality rate decreased from 51.5 per thousand live births for the year 1990 to 10.7per thousand live births for the year 2015. According to the Address Based Population Registration System, the adult literacy rate among individuals aged 6 years and over increased sharply from 80.5% in 1990 to 96.2 in 2015.
Turkey is constitutionally a secular state. The vast majority of the Turkish population is Muslim. There are very small numbers of non-Muslims in Turkey, including Greek Orthodox, Armenian Christians and Jews. The official language of Turkey is Turkish.
GOVERNMENT ORGANIZATION AND POLITICAL BACKGROUND
Overview
A popular nationalist movement began in Turkey before the turn of the 20th century and gathered momentum in the aftermath of World War I. Turkey was declared a republic on October 29, 1923, upon the abolition of the Sultanate. Mustafa Kemal Ataturk was elected as Turkey’s first President. Ataturk instituted a series of sweeping social reforms that have played a central role in the development of modern Turkey. The Constitution of Turkey (the “Constitution”) was adopted in 1924 and provided for an elected Grand National Assembly (the “Assembly”) to be the repository of sovereign power. Executive authority was vested in the Prime Minister and the Council of Ministers (the “Cabinet”). Changes were made in the legal, political, social and economic structure of Turkey, and Islamic legal codes were replaced by Western ones. Ataturk’s reforms and Western orientation continue to be the dominant ideological element in Turkey today.
Turkey’s current Constitution, which was revised and ratified by popular referendum in 1982, contains a system of checks and balances aimed at ensuring a strong central government and reducing factionalism in the Assembly. The Constitution provides for the Assembly, a President and a Prime Minister. Pursuant to a 2007 amendment to the Constitution, the President is elected by the absolute majority vote of the public. Prior to this amendment, the President was elected by the Assembly. The President is elected for a five-year term, and can serve a maximum of two terms. The Prime Minister is appointed by the President from the Assembly. The Prime Minister, in turn, nominates other members of the Cabinet, who are then approved by the President. The Cabinet, chaired by the Prime Minister, exercises the executive powers of the Government.
The members of the Assembly are elected for four-year terms. The Constitution provides for a system of proportional representation and forbids the formation of political parties based on class, religion or ethnic identity. The Law No. 2839 provides that parties whose nationwide vote in general elections is less than 10% are not eligible for seats in the Assembly.
Judicial power in Turkey is exercised by courts whose independence is guaranteed by the Constitution. The Constitutional Court (the “Constitutional Court”) decides issues relating to the form and substance of laws, decrees and rules of the Assembly and matters relating to public officials and political parties. The Court of Appeal is the court of last resort for most civil and criminal matters, while military matters are referred to a separate system of courts.
19
The Turkish military establishment has historically been an important factor in Turkish government and politics, successfully interfering with civilian authority three times since 1959 (in 1960, 1971 and 1980). Each time, the military withdrew after the election of a new civilian government and the introduction of changes to the legal and political systems. On July 15, 2016, a coup d’état was attempted against the Government by a faction within the army that is linked to the Gulen movement (which was officially designated by the Government as a terrorist group called FETÖ in May 2016). The coup plotters attempted to overthrow the Government by seizing control of several key institutions and buildings in Ankara, Istanbul, and elsewhere, but failed to do so as there was strong public opposition against the coup plotters. During the coup attempt, approximately 250 people were killed and more than 2,200 were injured while many government buildings, including the Turkish Parliament and the Presidential Palace, were damaged. On July 21, 2016, the Parliament approved the declaration of a three-month state of emergency in order to enable the authorities to take swift and effective action against those responsible for the failed coup, which also resulted in the temporary suspension of the European Convention on Human Rights. On August 7, 2016, several million people gathered in Istanbul for an anti-coup rally organized by the Turkish authorities, showing solidarity and political cohesion against the attempt. The President, Prime Minister and the two leaders of the opposition parties participated in the anti-coup rally.
Significant Events
On July 25, 2008, the 13th Penal Court of Istanbul agreed to hear a case against 86 people (including two senior retired army officials, one political party leader and a number of journalists and non-governmental organization members) accused of, among other things, inciting an armed insurrection, aiding a terrorist group and plotting to overthrow the government. Over time, the investigation continued and additional defendants were charged. On August 5, 2013, 254 of the 275 defendants were convicted. In March 2014, the former chief of staff, sentenced to life imprisonment, was released by a decision of the Constitutional Court, on the grounds that he had been ‘unlawfully deprived of his freedom’. As a result of the court’s decision, more than 50 people convicted in the case were also released. In May 2015, the Supreme Court of Appeals Prosecutor’s Office requested the reversal of the decision. On July 21, 2016, the Supreme Court of Appeals overturned convictions of all 275 defendants. The Court stated in its ruling that convictions by a local court were invalid, as the cases lacked concrete evidence pointing to the existence of the alleged terrorist organization. The Court cited a number of violations in the case such as illegal wiretapping, dubious statements of secret witnesses and unlawful searches.
On September 21, 2012, in a separate case involving a plot to overthrow the government in 2003, over 300 military officials were sentenced to prison terms ranging from six years to twenty years. On October 9, 2013, the Supreme Court of Appeals ordered the retrial of 88 convicted suspects, while approving the convictions of 237 suspects in the case. After merging 230 separate individual appeals that were filed by the convicts, on June 18, 2014, the Constitutional Court ruled that the convicted suspects’ rights were violated concerning “digital data and defendants’ testimony,” requiring the cases of the suspects to be retried in local courts in order to eliminate the violations. On March 31, 2015, all suspects in the case were acquitted.
On May 13, 2014, an explosion at a coalmine in Soma, Manisa, caused an underground mine fire. 301 people died in that disaster. Following the incident, an investigation was initiated and 24 people were taken into custody. On November 10, 2014, the indictment of the case was presented to the court by the chief public prosecutor. The indictment has been rejected by the court on four grounds, including lack of testimony, lack of evidence, violation of the principle of individual criminal responsibility and submission of charges without including the necessary technical details. On March 7, 2015, the court approved a revised bill of indictment implicating 45 people in connection with the mining incident. The lawsuit is ongoing.
On December 14, 2014, Turkish authorities made over two dozen arrests of media representatives during raids of a newspaper and TV station with close ties to the U.S.-based Islamic cleric Fethullah Gulen, the spiritual leader of the Gulen movement, an opposition movement in Turkey. The arrests were made on charges of forgery, fabricating evidence and forming an illegal organization to oppose the state. On December 14, 2014, European Union officials Federica Mogherini and Johannes Hahn issued a joint statement stating that such actions were incompatible with the freedom of media, which is a core principle of democracy. On December 15, 2014, Turkish President Recep Tayyip Erdoğan issued a statement that such steps were necessary and within the rule of law against elements that threaten national security. Following the arrests, several detainees have been released with the remaining subject to further interrogation. On December 19, 2014, the 1st Istanbul Penal Court of Peace issued an arrest warrant for Fethullah Gulen. On February 24, 2015, an Istanbul Court issued a second arrest warrant for Mr. Gulen. On September 17, 2015, a Turkish prosecutor sought a jail sentence for Fethullah Gulen of up to 34 years. On October 19, 2015, Istanbul’s High Penal Court issued an arrest warrant for Gulen and Sinan Dursun for “attempting to stage a coup, establishing and masterminding an armed organization and political espionage”. On November 9, 2015, the Istanbul 14th Criminal Court ordered the arrests of Fethullah Gulen and former police officer Emre Uslu over illegal wiretapping, along with 112 suspects. On December 28, 2015, another arrest warrant was issued for Gulen, along with 60 suspects.
In 2015, a series of raids were carried out against opposition media outlets and Gulen-associated businesses throughout Turkey. For example, in January 2015, several policemen were arrested for illegal wiretapping and political spying charges. On September 1, 2015, Turkish police raided the Ankara-based offices of a media group affiliated with Fethullah Gulen. Six people were arrested and a warrant was issued for the conglomerate’s chief executive, Akin Ipek. On September 16, 2015, Turkish police issued warrants against eleven executives on charges of organized theft. The arrests took place in the central city of Kayseri, where police raided a university with alleged links to Fethullah Gulen. On October 26, 2015, an Ankara court appointed administrators to take control of Koza İpek Holding, which the Ankara Chief Public Prosecutor’s Office identified as a Gulen-associated business. On March 23, 2016, a court in Istanbul appointed trustees to run the Feza media group, which owns the Zaman Daily and Cihan News Agency. The court accused the Feza media group of supporting the movement of Fethullah Gulen.
As of August 17, 2016, approximately 40,000 people have been detained in connection with the failed coup of July 2016. Of those detained, a substantial number have been military personnel (approximately 10,000 people, including 178 generals). Around 20,000 people have been arrested as of August 17, 2016, including police officers, soldiers, judiciary members, local administrators and civilians. As of August 17, 2016, nearly 80,000 government officials have been fired or suspended from various public institutions, including approximately 3,000 judges and prosecutors, deans of all universities have been asked to resign and the licenses of approximately 21,000 teachers working at private institutions have been terminated due to their alleged links to the Gulen movement. In addition, more than 100 media outlets have been closed, such as newspapers, TV channels, radio stations and magazines. Following the coup, there have also been raids on businesses with suspected links to the Gulen movement, greater civilian control of the military, a planned overhaul of military hierarchy and command structure and the release of prisoners to increase capacity of prisons to house those arrested for their involvement in the failed coup.
Elections & Executive Powers
The most recent local elections for municipalities were held on March 30, 2014. The AKP received 42.87% of the votes cast for the seats in councils of the municipalities. The CHP, the MHP and the Peace and Democracy Party (BDP) received 26.34%, 17.82% and 4.16% of the votes, respectively.
On August 10, 2014, the presidential elections were held. Recep Tayyip Erdogan was elected by absolute majority vote to a five-year term as president. Recep Tayyip Erdoğan received 51.79% of the total votes, whereas Ekmeleddin Ihsanoglu, the joint candidate of the Republic’s two largest opposition parties, claimed 38.44% and Selahattin Demirtas, candidate of the pro-Kurdish Democratic Regions Party (formerly the Peoples’ Democracy Party), won 9.76%.
The latest general elections were held on November 1, 2015. The AKP, the CHP, the MHP and the HDP received 49.50%, 25.32%, 11.90% and 10.76% of the votes, respectively. After the elections, on November 24, 2015, the AKP formed a single party government.
Following the November 2015 elections, the Government started negotiations to form a new constitution with an aim to replace the existing constitution, which was enacted after the military coup in 1980, with a more democratic one. On July 25, 2016, the Government held a meeting with CHP and MHP representatives, where it was agreed they would negotiate a small-scale change to the constitution in order to amend the existing bylaws regarding High Council of Judges and Prosecutors.
On May 5, 2016, the Republic’s former Prime Minister Mr. Ahmet Davutoğlu announced his resignation. On May 22, 2016, the ruling Justice and Development Party held an extraordinary congress and elected Mr. Binali Yıldırım as its new chairman and therefore, as Prime Minister of the Republic. On the same day, President Mr. Recep Tayyip Erdoğan accepted the resignation of Prime Minister Ahmet Davutoglu and his cabinet. On May 24, 2016, Mr. Yıldırım formed the 65th Turkish government.
The following table sets forth the composition of the Assembly by total number of seats as of September 22, 2016:
| | | | |
| | | Number of
Seats | |
Justice and Development Party (AKP) | | | 317 | |
Republican People’s Party (CHP) | | | 133 | |
People’s Democratic Party (HDP) | | | 59 | |
Nationalist Action Party (MHP) | | | 40 | |
Independent | | | 1 | |
| | | | |
Total | | | 550 | |
| | | | |
Source: The Grand National Assembly of Turkey
Legislation
On March 27, 2015, the Assembly approved the new domestic security law (Law No. 6638). Law No. 6638 was published in the Official Gazette on April 4, 2015 (No. 29316). The new law expands the powers of the Turkish police and increases penalties for people participating in unauthorized demonstrations.
FOREIGN POLICY
Since the foundation of the Republic, Turkey’s foreign policy has been guided by the principle of “peace at home, peace in the world.” Over the years, the country’s foreign policy has developed based on this principle and in line with changes in the domestic and international environment.
As a democratic, secular and economically thriving country located at the center of a strategic and dynamic region, Turkey actively pursues a responsible, constructive and multidimensional foreign policy. Facing a multitude of opportunities and challenges in surrounding regions, Turkey seeks to be a positive influence and to help generate stability, security and prosperity in its region and beyond.
20
In pursuit of creating peace and prosperity in the surrounding region, Turkey aims to further develop its relations with neighboring countries through initiatives towards strengthening political dialogue, economic interdependence and social-cultural interaction among regional countries. The key element of this policy is fostering an environment where all regional actors can become part of the solution and agree on a common vision based on their shared interests.
Deepening existing strategic relations with European and Transatlantic political, economic and security structures and continuing the accession negotiations with the European Union (the “EU”) remain the main pillars of Turkish foreign policy. At the same time, drawing strength from its increased economic and political capabilities, Turkey has been more actively involved in a wider geography and in a wider set of global issues. In this context, Turkey has been developing and strengthening its relations bilaterally as well as with regional organizations in Africa, Asia-Pacific, and Latin America and the Caribbean. Turkey has also been taking on greater responsibility in global humanitarian and development initiatives. To this end, on May 23-24, 2016, Turkey hosted the first-ever UN World Humanitarian Summit in Istanbul.
Furthermore, Turkey has been playing a more prominent role in peace building and conflict prevention efforts, serving as a mediator or facilitator in various conflicts across the world, and initiating multilateral initiatives such as the United Nations Alliance of Civilizations in 2005 and Mediation for Peace in 2010, which promotes tolerance and strengthens the role of mediation in the United Nations (the “UN”) and other international forums.
Strong commitment to human rights, the rule of law and democracy are among the guiding principles for Turkey in pursuing foreign policy objectives. With this understanding, Turkey gives its full support to protection, promotion and effective implementation of fundamental human rights in its surrounding region and beyond, as well as making significant contributions to the international standard-setting activities with respect to human rights. Beginning in January 2016, Turkey became a major contributor to the budget of the Council of Europe and increased its annual contribution to 33 million Euros. Additionally, the seats allocated to the delegation of Turkey at the Parliamentary Assembly of the Council of Europe and the Congress of Local and Regional Authorities increased to 18 from 12.
Turkey is party to the core human rights conventions of the UN and cooperates with the international and regional human rights mechanisms. Turkey is also party to the European Convention on Human Rights and to a large number of protocols and other Council of Europe Conventions, including Protocol 6 and 13, abolishing the death penalty in all circumstances.
Over the last decade, a series of comprehensive reforms have been successfully implemented in line with Turkey’s international commitments and aspirations to further improve the standards of human rights, the rule of law and democracy. In December 2012, the Ombudsman’s Institution began operation. The Human Rights and Equality Institution of Turkey was established in June 2012 and was designated the “National Preventive Mechanism” in January 2014, in order to perform tasks under the Optional Protocol to the Convention against Torture and Other Cruel, Inhuman or Degrading Treatment or Punishment.
Turkey is committed to pursuing an active foreign policy which aims to strike a balance between national interests and universal values.
International Organizations
Turkey is the founding member of the UN, the Council of Europe, the European Bank for Reconstruction and Development and the Organization for Security and Cooperation in Europe (“OSCE”). Turkey is also a member of NATO, the OECD, the World Trade Organization, the Organization of the Islamic Cooperation (“OIC”), Islamic Development Bank, the Black Sea Economic Cooperation Organization, the Economic Cooperation Organization, the Developing 8 and the Conference on Interaction and Confidence Building Measures in Asia. Turkey also has either an “observer” or a “partner” status at various regional organizations. Turkey also participates in the Euromed/Barcelona Process. Turkey is a member of the World Bank, the IMF, the European Resettlement Fund, the Asian Development Bank, the Multilateral Investment Guarantee Agency, and the Bank for International Settlements and is a participant in the International Convention on the Harmonized Commodity Description and Coding System. Turkey ranks among the biggest contributors to the UN budget. Turkey has been a member of the Geneva Group since 2014. In line with our increasing contributions to UN activities, important steps have already been taken to realize our vision of making Istanbul a regional UN center. In this regard, UNICEF will follow the examples of the United Nations Development Program, United Nations Population Fund and UN Women by opening its regional office in Istanbul, helping to make Istanbul a regional UN center.
Turkey is a founding and active member of the Organization of the Islamic Cooperation”). Turkey hosted the 13th Islamic Summit of the OIC on April 14-15, 2016, in İstanbul. Turkey has assumed the Summit Chairmanship of the OIC for two years.
Turkey is a member of The Group of Twenty (“G-20”). At the G-20 Leaders’ Summit in Cannes in 2011, it was announced that Turkey would assume the presidency of the G-20 in 2015. Turkey became a member of the G-20 troika (past, current and future hosts) on December 1, 2013, and its presidency of the G-20 commenced on December 1, 2014. Upon taking over the G-20 Presidency, Turkey announced its priorities as ‘Inclusiveness’, ‘Implementation’, and ‘Investment’, namely the three ‘I’s. During its G-20 Presidency, Turkey organized events in line with the Africa’s “Agenda 2063”. A High Level Conference on Access to Energy in Sub-Saharan Africa was organized on October 1, 2015. The 10th G-20 Leaders Summit was hosted by the President of the Turkey in Antalya on November 15-16, 2015. Turkey handed over the G-20 Presidency to China on December 1, 2015 and continues to be part of the troika membership.
21
Turkey was one of the founding members of the International Maritime Organization (“IMO”) and has been a member of its Executive Council since 1999. Turkey has intensified its efforts to improve the standards of its merchant fleet and to harmonize its legislation with the EU acquis in areas like maritime safety, fisheries and shipping. Turkey is also party to major IMO Conventions and Protocols. Turkey became an Associate Member of the European Organization for Nuclear Research (“CERN”), on May 6, 2015, following Turkey’s ratification of the Associate Member Agreement signed in 2014, granting Associate Member status to the country. Turkey’s Associate Membership will strengthen the long-term partnership between CERN and the Turkish scientific community.
Non-Proliferation and Disarmament
Turkey’s security policies prohibit the production and use of all kinds of weapons of mass destruction (“WMD”). Party to all international non-proliferation instruments and export control regimes, Turkey supports the universal use of such measures, as well as effective implementation in good faith. With a view to fulfilling the provisions of these instruments and arrangements, Turkey has an enhanced system of export controls in line with the standards of the European Union.
Turkey pursues a comprehensive and integrated policy in its region. Due to its proximity to areas of internal and regional strife, Turkey also closely monitors developments in its region and takes part in collective efforts aimed at containing and reversing alarming trends. In this respect, Turkey supports all efforts towards the establishment of an effectively verifiable zone free of WMD and their means of delivery in the Middle East, as an important confidence building measure that would contribute to the peace, security and stability in the region.
Terrorism
In recent years, the Republic has experienced a number of terror-related incidents. On January 6, 2015, a police station in Istanbul was bombed. In June 2015, four people died and over 400 were injured after two explosions hit the city of Diyarbakir during a pro-Kurdish Peoples’ Democratic Party election rally. On April 27, 2016, a suicide bomber detonated an explosive in the northwestern Turkish city of Bursa. Police operations in respect of this bombing are ongoing.
The bombings and attacks by Islamic State of Iraq and the Levant (“DAESH”), a terrorist organization, in major cities in Turkey has taken the lives of 206 Turkish citizens and left hundreds of citizens wounded. As a member of the Global Coalition Against DAESH, Turkey contributes to the Coalition’s efforts in Syria and Iraq through the use of its own national assets and capabilities. Turkey and the United States have been conducting joint military operations with the Coalition against DAESH elements in northern Syria since July 28, 2015. As of July 2016, Turkey has eliminated more than 1,200 DAESH operatives in Syria.
On October 10, 2015, two bombs exploded in Ankara during a peace rally killing nearly 100 individuals and wounding over 200 others. On October 28, 2015, the Ankara Chief Public Prosecutor’s office said a DAESH cell from Gaziantep, a province in southern Turkey that borders Syria, carried out the bombing. On January 12, 2016, a bombing in Istanbul killed at least 11 individuals including the bomber, a suspected DAESH activist based in Syria. More than a dozen other individuals were wounded in the attack. Following the suicide bombing, Turkish artillery attacked DAESH positions in Syria and Iraq, killing around 200 fighters within 48 hours. On March 19, 2016, a suicide bomb attack in İstiklal Street, İstanbul’s main shopping street, killed 4 people and injured 39 others. Two Israelis with dual U.S. nationality and an Iranian were killed in the blast.
In late July 2015, the Kurdistan Workers’ Party (the “PKK”), a terrorist organization, abandoned the cease-fire process initiated by the Government, and resumed violent activities. Since July 2015, hundreds of civilians as well as Turkish soldiers and policemen have been killed by PKK, and Turkish security forces have carried out operations against the terrorist group in Turkey and northern Iraq. Since July 2015, counter-terrorist operations have escalated to include airstrikes against PKK targets. On February 17, 2016, PKK-affiliated terrorists exploded a car bomb in the Turkish capital near military vehicles carrying personnel, killing 29 people and injuring at least 60 other individuals. On March 13, 2016, another car bomb attack in Ankara’s central Kızılay neighborhood hit a major public transportation hub, killing 37 people and injuring dozens of others. The Interior Ministry has identified the 24-year-old female bomber who had joined the PKK terrorist group in 2013 and received training with the People’s Protection Units in Syria. On April 4, 2016, Turkish Armed Forces carried out airstrikes on PKK terrorist bases in northern Iraq.
On December 14, 2015, Special Forces from the Turkish National Police and the Turkish Armed Forces commenced a joint counter-terror operation against PKK members located and active in a number of southeastern Turkish towns. On February 11, 2016, the counter-terror operation in Cizre town ended. According to figures released by the Turkish Armed Forces, 619 PKK members were killed in Cizre during the nearly two month long operation. On March 9, 2016, anti-terror operations launched against the PKK in the southeastern Sur district of Diyarbakır province ended. According to a statement released by the Turkish General Staff, 264 terrorists were killed and 345 explosive devices were defused in Sur since the operation began. On March 14, 2016, counter-terrorism operations were launched in the Nusaybin district of Turkey’s southeastern province of Mardin. According to a statement from Mardin Governorate, 137 PKK terrorists were neutralized, 100 barricades were removed, 11 ditches filled up and 263 handmade explosives destroyed since the launch of operations. On September 4, 2016, the Turkish Government announced that it will invest U.S.$3.4 billion in rebuilding the settlements destroyed by the PKK in terror in the southeast of the country.
22
Turkey contributed to the Council of Europe Additional Protocol to the Convention on the Prevention of Terrorism which addresses the phenomenon of foreign terrorist fighters. Turkey signed the Additional Protocol on October 22, 2015 and the ratification process is expected to be completed soon.
Turkey’s response to these terror threats has been based on the notion of self-defense as outlined in Article 51 of the UN Charter. Turkey will continue to exercise its right to protect the country’s national security. Certain Security Council resolutions (no. 1373, no.2170, no.2178) attribute responsibility to countries in the fight against terrorism, specifically in countering DAESH.
It is against this backdrop that Turkey initiated Operation Euphrates Shield (“OES”) on August 24, 2016. OES is a counter-DAESH effort and is supported by the Global Coalition. Turkey is determined to clear its borders of terrorist groups. Turkey has given its full support to all international efforts to fight DAESH since day one. DAESH rocket and suicide attacks claimed the lives of hundreds of Turkey’s citizens. Clearing Turkey’s borders of DAESH will ensure Turkey’s border security completely. As of September 4, 2016, the 98 km stretch of Turkey’s borders from Azaz to Jarablus has been sealed off. DAESH still needs to be totally eliminated in inland Syria. Turkey is maintaining pressure in cooperation with the Global Coalition.
INTERNATIONAL RELATIONS
The European Union
In 1963, Turkey signed an association agreement (the “Ankara Agreement”) with the European Economic Community (“EEC”), which is now the EU. In 1970, an additional protocol to the Ankara Agreement was signed which established the framework and conditions of the transitional stage of the association. In April 1987, Turkey submitted its formal application for full membership in the EU. In December 1989, in its “Opinion on Turkey’s Request for Accession to the Community” the European Commission determined that the EEC could not accept a new member or engage in new accession negotiations before 1993, at the earliest. Moreover, the opinion stated that Turkey would have to fulfill certain requirements in terms of the country’s economic, social and political developments prior to any accession negotiations.
With the completion of the Customs Union, in accordance with the Ankara Agreement, the association between Turkey and the EU entered its final stage and at the European Council (the “Turkey-EU Summit”) held in Helsinki in December 1999, Turkey was granted candidate status. The recognition of Turkey as a candidate country for accession to the EU ushered in a new era in Turkey-EU relations. The Accession Partnership Document for Turkey was approved by the Council of the European Union (the “EU Council”) on March 8, 2001. In response, the Turkish Government adopted its National Program for the Adoption of the Acquis (“NPAA”) on March 19, 2001. Both the Accession Partnership Document and the NPAA are revised on a regular basis to take note of the progress made and to include new goals and priorities.
Accession Negotiations
Turkey’s EU accession process is being conducted in 35 chapters. During the negotiation process, chapters are opened depending upon the candidate country’s fulfilment of opening benchmarks, if any, which are determined by the EU Council. Chapters are provisionally closed depending upon the candidate country’s fulfilment of closing benchmarks, which are also determined by the EU Council. A negative opinion expressed by one or more member states can block the opening or closing of a chapter.
In October 2015, following a meeting between President Erdoğan, Donald Tusk, President of the European Council, Martin Schulz, President of the European Parliament, and Jean-Claude Juncker, President of the European Commission, Turkey and the EU agreed to re-energize Turkey’s accession process at the Turkey-EU Summit of November 29, 2015. Chapter 17 (Economic and Monetary Policy) was opened to negotiations on December 14, 2015. Turkey and the EU also agreed to complete the preparatory work for the opening of Chapter 15 (Energy), Chapter 23 (Judiciary and Fundamental Rights), Chapter 24 (Justice, Freedom and Security), Chapter 26 (Education and Culture) and Chapter 31 (Foreign, Security and Defense Policy), in the first quarter of 2016 and to start the preparations regarding the remaining Chapters. As of September 2016, the preparatory work has been completed and Turkey has sent its contribution to the Commission. Turkey expects the Commission and the EU Council to take the necessary steps to open these chapters.
In the Turkey-EU Summit of March 18, 2016, the parties also decided to open Chapter 33 (Financial and Budgetary Provisions) and on June 30, 2016, Chapter 33 was opened to negotiations at the 12th meeting of the Intergovernmental Accession Conference in Brussels.
In Turkey’s EU accession negotiations, sixteen chapters have been opened to negotiations including most recently Chapter 17 (Economic and Monetary Policy—on December 14, 2015) and Chapter 33 (Financial and Budgetary Provisions-on June 30, 2016). One chapter has been provisionally closed — Chapter 25 (Science and Research).
Although the screening process of 33 chapters was completed back in 2006, the screening reports of 8 of those chapters are still pending for approval at the EU Council. Since the screening reports have not yet been approved, the official opening benchmarks of these chapters has yet to be communicated to Turkey.
23
Fourteen chapters have been blocked by the EU Council and Southern Cyprus. The EU Council (General Affairs and External Relations) Decision of December 11, 2006, suspended negotiations on eight chapters relevant to Turkey’s restrictions with respect to the Republic of Cyprus and restricted the closing of the other six chapters until Turkey fulfils its commitments under the Additional Protocol to the EU-Turkey Association Agreement, which extended the EU-Turkey Customs Union to the ten member states, including Cyprus, that joined the EU in May 2004. Therefore, the fulfillment of Turkey’s commitments under the Additional Protocol to the Ankara Agreement is the opening benchmark for eight chapters and the closing benchmark for all chapters. Although no chapter can be closed due to the aforementioned EU Council decision, two (Chapter 20—Enterprise and Industry and Chapter 21—Trans-European Networks) are ready to be closed other than meeting the commitments under the Additional Protocol. Moreover, the European Commission has confirmed the fulfillment of certain closing benchmarks of five chapters since 2011. The sole closing benchmark of Chapter 20 (Enterprise and Industry Policy) was confirmed fulfilled in April 2011. The sole closing benchmark of Chapter 21 (Trans-European Networks was confirmed fulfilled by the Commission) in March 2011. One closing benchmark out of 5 in Chapter 6 (Company Law) was confirmed fulfilled in June 2012. Three closing benchmarks out of 6 in Chapter 32 (Financial Control) were confirmed fulfilled by the Commission in June 2012. And one closing benchmark out of 5 in Chapter 28 (Consumer and Health Protection) was confirmed fulfilled in October 2012. Turkey is ready to revive the process and proceed in the negotiations, which, however, may be difficult as long as the political blockages are in place. Currently, Turkey’s priority is to open chapters within the framework of Turkey-EU statement of November 29, 2015, particularly, Chapter 23 (Judiciary and Fundamental Rights) and Chapter 24 (Justice-Freedom and Security).
Efforts to Accelerate Accession Negotiations
(1) Turkey’s New EU Strategy
Turkey’s New EU Strategy (“EU Strategy)”, was publicly announced on September 18, 2014. The EU Strategy rests on three pillars: (1) determination in the political reform process, (2) continuity in socio-economic transformation, and (3) effectiveness in communication.
The first pillar of the strategy involves the political reform process. The Reform Action Group (“RAG”) monitors political reforms, and takes an active role contributing to the preparation, adoption and implementation phases of reform. Three meetings of the RAG have been held so far—on November 8, 2014, February 20, 2015, and December 11, 2015.
The second pillar of the EU Strategy is socio-economic transformation in Turkey, which is a continual process, essential to fostering and consolidating democracy. Accordingly, a two-phase National Action Plan for EU Accession has been established, which focuses, among other things, on proper enforcement of relevant legislation to further raise the living standards of Turkish citizens. Initially, the National Action Plan was being implemented in two phases, the first phase covers the period between November 2014 and June 2015 and the second phase covers the period between June 2015 and June 2019. In the first phase of the National Action Plan, seven laws were ratified, 72 secondary legislations became effective, and 20 administrative measures were established. However, some legislation and administrative were left untouched due to time constraints. Therefore, Ministry for EU Affairs opted to update the National Action Plan, incorporating and rescheduling the elements of the first phase that had been pending with the elements of the second phase which are yet to be addressed. As a result, the updated National Action Plan for EU Accession was publicly announced on February 26, 2016, covering the 2016-2019 period.
The National Action Plan for EU Accession, covering the 2016-2019 period, establishes the steps that Turkey will take to align with the EU acquis in 33 chapters in terms of legislative and administrative measures.
To ensure that new legislation is drafted in line with the EU Acquis, the Prime Ministry issued a Circular on September 25, 2014, which delineates the role of the Ministry for EU Affairs in the accession process and requires that any draft legislation prepared by a public institution with the purpose of EU Acquis alignment be sent to the Ministry of EU Affairs for its opinion.
The third pillar of the EU Strategy, Turkey’s EU Communication Strategy, was announced on October 16, 2014. The EU Communication Strategy has two dimensions. The first dimension covers communication within the country, which aims to contribute to the domestic perception of the EU accession process as a modernization project, improving living standards of Turkish people. The second dimension of the strategy addresses the European public opinion of Turkey and its accession negotiations with the EU.
In this context, the Ministry for EU Affairs hosted Civil Society Dialogue meetings in seven different cities, including İstanbul (on November 26, 2014), İzmir (on February 19, 2015), Konya (on March 18, 2015) Adana (on March 24, 2015), Bursa (on April 22, 2015),Antalya (on April 28, 2015) and Samsun (on December 24, 2015). Hundreds of Civil Society Organizations (“CSOs”) representing businesses, universities, different interest groups and local administrations were invited. Over 2,000 participants in each of those cities attended the meetings. During the meetings, CSOs expressed their views about Turkey’s EU accession process and shared their opinions and recommendations on how to establish a better dialogue between the populace and the public sector and encourage participation in every aspect of the process. The meetings created a forum and an opportunity not only for the CSOs’ voices to be heard, but also for the Ministry to explain to the CSOs the goals of the EU Strategy, provide information regarding the EU funds available for CSOs’ development, and promote administrative-civil society dialogue and civil society dialogue between Turkey and EU.
24
To incorporate all segments of Turkish society into the EU accession process, the Ministry for EU Affairs opened its second Office in Antalya on December 21, 2014 and its third Office in İzmir on February 19, 2015, in addition to its office in İstanbul. The main purpose of these new offices is to achieve harmonization and effective implementation of the EU Acquis at a local level. The offices work in close cooperation with NGOs, municipalities, and public institutions in all EU related activities at the local level and to ensure efficient use of EU financial assistance to Turkey.
(2) Sub-Committees
Eight sub-committees to the Association Committee were established by Decision No: 3/2000 of the European Community-Turkey Association Council on April 11, 2000. The subcommittees were established before the accession negotiations and remained a mechanism to harmonize the EU Acquis. They, however, lacked the capabilities needed to effectively respond to the challenges of the negotiation process after 2005.
Therefore, Turkey and the European Commission agreed on a new chapter-based methodology for sub-committee meetings. Sub-committee meetings employing this new methodology were held in 2015 after a nearly three-year break. The chapter-based structure of sub-committees facilitated the technical negotiation process by managing the opening and closing benchmarks regardless of political blockages, increasing the motivation of public institutions. With this new methodology, Turkey expects to be informed via official letters from the Commission on the progress made with respect to the relevant benchmarks following the sub-committee meetings.
(3) Dialogue Platforms
Recently, new dialogue platforms were established between Turkey and the EU. Turkey welcomes intensifying the dialogue for deepening Turkey-EU relations; however, the dialogue mechanisms between Turkey and the EU are not a substitute for the accession process. These mechanisms complement and support the accession process.
Both sides agreed to have regular Summits twice a year, and to have comprehensive regular political dialogue meetings at Ministerial/High Representative/Commissioner level in addition to the regular Association Council meetings. Turkey and the EU agreed to launch a High Level Economic Dialogue (“HLED”) Mechanism in the first quarter of 2016, and the first meeting was held on April 25-26, 2016. The HLED aims to further enhance the economic relations, which have been significantly improved as a result of the Customs Union between the EU and Turkey, through developing a mutual understanding of economic policies and structural reform agendas. The first day included an EU-Turkey Business Dialogue in Istanbul where officials from the Commission and Turkish Government and representatives of major Turkish and European businesses came together and focused on how to create a better business environment and deepen bilateral trade and investment links. The second day of the HLED was held in Ankara where ministerial-level discussions were held regarding the outlook for the EU and Turkish economies and the need for an ambitious reform agenda.
To enhance Turkey-EU cooperation for securing and diversifying energy supplies and to ensure competitive energy markets, the High Level Energy Dialogue was launched on March 16, 2015. Turkey is a natural energy hub between the energy resources of the Middle Eastern and Caspian Regions and the EU energy markets. Turkey’s development as an energy hub would be beneficial to both Turkey and the EU.
Political Reforms
Since 1999, a comprehensive transformation and reform process in line with the goal of EU accession has been underway. Turkey’s objective is full compliance with the EU Copenhagen political criteria and political reforms in the areas of human rights, democracy and the rule of law, which are prerequisites to EU accession.
Reforms with respect to freedom of thought and expression, freedom of association and peaceful assembly and freedom of religion have been implemented. There have also been reforms related to the judicial system, civil-military relations and anti-corruption measures. Relevant legislation has been changed to enable the learning of and broadcasting in languages and dialects which are used traditionally by Turkish citizens in their daily lives. In addition, the death penalty has been abolished and the prison system has been reformed. The right to property of community foundations belonging to certain minorities in Turkey has been ensured and the legal basis needed for the activities of foreign foundations in Turkey has been established. New definitions and measures to deal with illegal immigration have been introduced.
New democratic institutions were established, which created notable improvements in the process of institutionalization of human rights. The Law on the Human Rights Institution, which became effective on June 30, 2012, for example, is a public legal entity which has administrative and financial autonomy and has its own budget. In order to make the Human Rights Institution of Turkey more effective, the Law on Human Rights and Equality Institution of Turkey was adopted, and it entered into force on April 20, 2016. The purpose of this Law is to protect and promote human rights, secure the right to receive equal treatment, prevent discrimination, and
25
fight against torture and ill-treatment effectively. The Institution operates as national preventive mechanism within the framework of the provisions of Optional Protocol to the UN Convention against Torture and Other Cruel, Inhuman or Degrading Treatment or Punishment. The Ombudsman Institution aims to improve the quality and effectiveness of public services, by addressing the complaints of citizens regarding public services in a fair and timely manner, free of charge. The establishment of an Ombudsman system, on June 29, 2012, is a first in Turkey and one of the most important steps taken to improve accountability, fairness and transparency of the public administration. With the adoption of the Law on Settlement of Some Applications Made to the European Court of Human Rights through Compensation, which was published in the Official Gazette on January 19, 2013, a domestic legal remedy has been introduced which provides for compensation for persons who have applied to the European Court of Human Rights on the grounds of (a) excessively long civil, criminal or administrative trials or (b) delayed or deficient implementation or non-implementation of courts’ decisions. The implementation of the individual application system to the Constitutional Court, which is an exceptional domestic legal remedy for the violation of individual rights and freedoms guaranteed by the Constitution and the ECHR through acts, operations or negligence of public authorities, started on September 23, 2012.
The Action Plan for Prevention of Human Rights Violations became effective on March 1, 2014. The Action Plan contains concrete objectives towards finding solutions through a timetable in areas in which European Convention on Human Rights are violated.
The Democratization Package announced on September 30, 2013, proposed comprehensive reforms for further improvement and enjoyment of a wide spectrum of civil and political rights. The package includes, allowing political discourse in languages and dialects other than Turkish, facilitating local organization of political parties, enabling education in languages and dialects other than Turkish in private schools, lifting restrictions on renaming villages and the use of letters Q, X, W, ending the ban on women wearing headscarves in public service, enacting a comprehensive anti-discrimination legislation, establishing the Anti-Discrimination Commission, and ensuring that possible motives based in bigotry are considered an aggravating circumstance in criminal proceedings. The Law Amending Certain Laws for the Enhancement of Fundamental Rights and Freedoms was adopted on March 2, 2014, fulfilling legal and administrative arrangements required by the Democratization Package.
In the first half 2016, Turkey took several crucial steps to become a party to regional and international conventions in the field of fundamental rights and freedoms by ratifying over a dozen conventions and protocols, which range from the processing of personal data to the prevention of financing of terrorism. Some of these steps also constitute some of the requirements of the Visa Liberalization Roadmap towards a visa-free regime for Turkey. The approval of these conventions and protocols strengthens the fundamental rights and freedoms in Turkey. The approval of these conventions and protocols also has had a positive impact on the post-monitoring dialogue between Turkey and the Council of Europe, which began after the Council of Europe lifted the political monitoring process in 2004.
The Law on International Judicial Cooperation in Criminal Matters was adopted by the Turkish National Grand Assembly on April 22, 2016 and entered into force on May 5, 2016. This Law facilitates the implementation of the provisions of international agreements in the field of international judicial cooperation in criminal matters in the domestic law.
After five years of implementation, the Judicial Reform Strategy, which aims to further strengthen the independence, impartiality, efficiency and effectiveness of the judiciary, was renewed on April 17, 2015.
Within the framework of the previous Strategy, Turkey has adopted six Judicial Reform Packages binning in 2011. The amendments to the legislation were introduced to strengthen independence and impartiality and increase the effectiveness of the judiciary as well as to reduce the backlog of cases.
The First and Second Judicial Reform Packages became effective in March 31 and August 16, 2016, respectively and aim to accelerate and carry out judicial services swiftly, efficiently and economically and tackle the backlog of cases.
On July 2, 2012, the Turkish Parliament adopted new measures, known as the Third Judicial Reform Package (The Law Amending Some Laws for Effectiveness of Judicial Services and Suspension of Cases and Sentences Regarding the Offences Committed via Press), intended to improve the effectiveness of the judiciary. The Third Package provides further protection for freedom of expression and freedom of press, as well as fights against corruption. The Package has made major contributions to increasing the effectiveness and speed of judicial services.
The Third and the Fourth Packages (the Fourth Package became effective of April 3, 2013) were designed to improve human rights and governance and to overcome the problem of long trials, as guided by the European Convention on Human Rights and case law of the European Court of Human Rights. The Packages also amended certain provisions in penal legislation including detention orders, administrative judiciary, and legislation regarding freedom of expression and freedom of the press. The amendments to the Turkish Criminal Code and the Anti-Terror Law give more room for interpretation in favor of freedom of the press and freedom of expression. In addition, the Packages removed the statute of limitations applicable to offences of torture.
The Fifth Reform Package, effective March 6, 2014, ensures the right to a fair trial, personal freedom and protection of privacy and personal data, as well as presumption of innocence. The Sixth Reform Package, adopted June 18, 2014, restricted the Regional Administrative Courts within the administrative judiciary. The Regional Administrative Courts acts as a better filter between first instance courts and the Council of State. The package also introduces some amendments for the Regional Courts of Appeal within the Regional Administrative Courts. With these amendments, Regional Administrative Courts and Regional Courts of Appeal may either
26
uphold or quash the decision of the First Instance Courts. The Council of State is the last instance for reviewing judgments rendered by administrative courts. This in turn reduces the length of trials in judiciary and reduces backlog. The package also strengthens the Council of State’s main role: safeguarding legal uniformity through case law. The amendments also include increased penalties regarding offences against sexual integrity.
The Law amending the Law on Judges and Prosecutors and Certain Laws and Decree Laws became effective on December 12, 2014. The Law primarily aims to strengthen independence, impartiality and the effectiveness of the judiciary in line with the provisions of the European Convention on Human Rights and case law of the European Court of Human Rights.
The Law on Eradicating Terrorism and Strengthening Societal Integration was adopted by the Parliament on July 10, 2014. The objective of the law is to end terrorism and strengthen societal integration in Turkey. Necessary measures were taken regarding the societal integration process of the members of the terrorist organization, who have been disarmed.
The Law on Protection of Family and Prevention of Violence against Women was adopted on March 20, 2012. The By-Laws on the implementation of the Law on the Protection of Family and Prevention of Violence against Women and on the Establishment of Women Shelters were adopted as of January 2013. Turkey became the first country to sign and ratify the Council of Europe Convention on preventing and combating violence against women and domestic violence (Istanbul Convention) without any reservations in 2011 and The Law Approving the Council of Europe Convention on Preventing and Combating Violence against Women and Domestic Violence entered into force on March 14, 2012.
With the Law on Mediation in Legal Disputes, published in the Official Gazette on June 22, 2012, a mediation system was established through which the parties may freely address disputes arising from private law procedures. With this system, disputes can be resolved through a mediator chosen by the parties.
The Prime Minister announced, on January 14, 2015, the creation of a new action plan covering the 2015-2018 period within the scope of Transparency Package in public administration. The Transparency Package includes many significant reforms including amendments in political parties finance and political ethics.
The Law amending the Law on Duties and Competencies of the Police and Certain Laws and Decree Laws (known as Reform Package on Internal Security and Protection of Freedoms) was adopted by the Parliament on March 27, 2015. The Law aims to strike a balance between freedom and security and establish control mechanisms on many issues including the use of force by law enforcement authorities.
Significant steps have been taken to enhance the dialogue with different faith groups. Ministers and Government officials have been continuously holding meetings with the representatives of religious communities to address their problems. The Prime Minister met with the religious leaders and representatives of different faith groups twice in the first half of 2015.
Following the request of the Greek community for a Greek Primary School in Gökçeada, permission was granted on March 28, 2013, to open a Greek minority school in Gökçeada. In September 2014, the Ministry of National Education approved the opening of the Private Mor Ephrem Syriac Kindergarten by Beyoğlu Virgin Mary Chaldean Church Foundation in Yeşilköy, İstanbul. The Gedikpaşa Armenian Protestant Church and School Foundation applied to register certain land as its private property, which was transferred on October 27, 2015.
With respect to property rights, an important step was taken to resolve a long-standing issue regarding the immovable properties of minority foundations by the amendment of Law on Foundations in August 2011 and its Implementing By-Law, dated October 1, 2011. This legislation has paved the way for the return of the immovable properties owned by minority foundations. 116 community foundations have applied to the Directorate General of Foundations and the Foundations Assembly has decided for the return of 333 immovable properties, and has decided to pay compensation for 21 immovable properties. . Within the scope of the Law, all the applications for the return of properties were assessed and the process was completed in 2014. Additionally, as a part of the Democratization Package, the disputed property of Mor Gabriel Monastery was returned to the Monastery Foundation in 2013. Twelve parcels, which were the subject of dispute, were registered on behalf of the Monastery Foundation on February 25, 2014. Some churches and monasteries, including Sumela Monastery, Armenian Church of Akdamar on Lake Van and Surp Giragos (an Armenian Orthodox Church at Diyarbakir) that had been closed for years to religious ceremonies were re-opened. The Great Synagogue in Edirne was restored by the General Directorate of Foundations, and re-opened for worship on March 26, 2015.
In the wake of the coup attempt by Fetullah Terrorist Organization, which claimed the lives of 241 people, Turkey has achieved some reforms regarding civil-military relations, which was an area previously criticized by the European Union. The Gendarmerie General and Coast Guard Commands now report to the Ministry of Interior. The Service Commands report to the Ministry of National Defense. The composition of the Supreme Military Council has changed and now has more civilian members. During the 3-month State of Emergency instituted immediately following the coup attempt, administrative actions in respect of human rights and rule of law remained open to judicial review.
27
Visa Liberalization Dialogue
The launch of the Visa Liberalization Dialogue on December 16, 2013, was an important point in Turkey-EU relations. The Readmission Agreement was signed on the same day. Steps towards ensuring timely completion of the Visa Liberalization Dialogue and effective implementation of the Turkey-EU Readmission Agreement are being taken together with all the relevant Turkish institutions and with the collaboration of the European Commission.
The Visa Liberalization Dialogue is based on a Roadmap towards a visa-free regime with Turkey setting out the requirements that Turkey needs to meet in order to enable the European Parliament and the Council to amend Regulation (EC) No 539/2001 which would allow Turkish citizens holding a biometric passport in line with EU standards to travel for short stays in the Schengen area without a visa. The 72 requirements listed in the Roadmap are organized in five thematic groups: (1) document security, (2) migration management, (3) public order and security, (4) fundamental rights, and (5) readmission of irregular migrants. The European Commission reports regularly to the Council and the Parliament on Turkey’s progress in fulfilling the Roadmap requirements.
On October 20, 2014, the Commission adopted its First Report on progress. The First Report assessed the fulfillment of each requirement and issued recommendations for making further progress. After the publication of the First Report, high-level meetings of the Visa Liberalization Dialogue were held between Turkey and the Commission on February 26, 2015, and December 14, 2015. The Commission organized seven technical missions to Turkey between April and July 2015, involving experts from Member States, the Commission, Frontex, European Asylum Support Office, Europol and the EU Delegation to Turkey, to study Turkey’s legislation and administrative practices and evaluate possible progress made in implementing the requirements of the Roadmap. In addition, two meetings of the Joint Readmission Committee took place on July 15, 2015, to assess the implementation of the EU-Turkey Readmission Agreement.
At the Turkey-EU Summit of November 29, 2015, Turkey and the EU agreed to accelerate fulfillment of the Roadmap and the Second Report was adopted by the Commission on March 4, 2016. According to Second Report, Turkey fulfilled 19 out of 72 requirements/benchmarks in the Roadmap. The Third Report on progress was published on May 4, 2016. In the Third Report, the Commission stated that Turkey fulfilled 65 out of 72 benchmarks in the Roadmap. Work is underway to meet the remaining requirements through expert working groups. In the Third Report, the European Commission also presented the proposal to amend Regulation (EC) No 539/2001 to lift the visa requirement for Turkish citizens on the understanding that Turkey will fulfill outstanding benchmarks of the Roadmap.
Harmonization with the EU Acquis
Turkey continues its reform process in every field of the Acquis. In 2015 alone, six primary and 121 secondary legislative enactments were made targeting the harmonization process with the EU Acquis.
The Law No. 6475 on Postal Services was published in the Official Gazette No. 28655 of May 23, 2013, which provides for guaranteed uninterrupted postal service, regardless of geographical areas, for all users throughout Turkey at an affordable price. With this Law, the Information and Communication Technologies Authority was designated as an independent regulator of postal sector. This Law also narrowed the scope of postal monopoly by opening the market to more than one operator, helping to liberalize the sector.
Law No. 6112 on Establishment and Broadcasting Services of Radio and TV, which increases the limit on foreign ownership in radio and TV companies from 25% to 50%, was published in the Official Gazette No. 27863 of March 3, 2011. On March 30, 2013, Law No. 6446 on Electricity Market became effective, abolishing all sectorial restrictions on foreign ownership in the privatization of electricity distribution and general assets.
Turkey has also taken significant steps to liberalize its legislation on real estate acquisition by foreigners by abolishing “the reservation of reciprocity” on May 18, 2012.
On July 4, 2012, it was announced that a Memorandum of Understanding was signed between the Central Bank of the Republic of Turkey and the European Central Bank, laying the groundwork for continued cooperation in the field of central banking, through regular dialogue at technical and policy levels and possible staff exchanges.
The Capital Markets Law (No. 6362) entered into force on December 30, 2012. It provides for the functioning and development of the capital markets in a reliable, transparent, effective, stable, fair and competitive environment. The Law also aims to regulate and supervise the capital markets in order to safeguard the rights of investors.
The Law on Prevention of Financing of Terrorism was adopted on February 16, 2013. With this Law, the crime of financing terrorism has been redefined to be in line with international conventions and arrangements. Freezing of assets has been introduced to Turkey’s legal system as an administrative protective measure, and procedures and principles related to the implementation of this measure have been established.
Payment and Securities Settlement Systems, Payment Services and E-Money Institutions Law No. 6493 entered into force on June 27, 2013. The Law was prepared in line with Turkish commitments to the EU alignment process. It regulates the payment and securities settlement systems, payment services, payment service providers and e-money institutions.
28
In the banking sector, between September 2015 and March 2016, Turkey completed the Regulatory Consistency Assessment Program of Basel Committee. The Turkish banking sector regulations and legislation were reviewed in terms of compliance with the Basel standards and were determined to be in full compliance with current Basel standards.
On September 26, 2011, the Council of Ministers approved the Decree-Law on Organization and Duties of Public Oversight, Accounting and Auditing Standards Authority. With the establishment of this Authority, the Turkish Accounting Standards Authority was abolished and as stated by the European Commission, the relevant closing benchmark of the Company Law Chapter 6 was met. The Accounting and Auditing Standards Authority has become the sole authority with the power to regulate accounting and auditing standards in Turkey. It has the authority (1) to prepare and publish Turkish Accounting Standards in line with international standards, (2) to ensure uniformity in implementation, reliability and quality of independent auditing, (3) to identify auditing standards, (4) to authorize independent auditors and independent audit companies and supervise their audit activities and (5) to ensure public oversight in the field of independent auditing.
Turkey signed the Convention on Cybercrime of the Council of Europe on November 10, 2010, which was ratified on April 22, 2014. The convention entered into force on January 1, 2015. This Convention will better implement limitations on illegal internet content, since it streamlined current regulations and provides a sound framework for the use of internet.
Law No. 6461 on Liberalization of Turkish Rail Transport Sector entered into force on May 1, 2013. It liberalizes the rail transport market by opening it to competition and separating the functions of infrastructure managers and railway undertakings.
With respect to trade union rights, the Parliament adopted two important pieces of legislation to ensure full trade union rights in line with the EU standards. With the amendment to the Law on Public Servants’ Trade Unions and Collective Agreement on April 11, 2012, the right of collective agreement was established for public servants. The Law on Trade Union and Collective Labor Agreement was adopted on November 7, 2012. As a result of the decision of the Constitutional Court, on June 11, 2015, related to the Law on Trade Union and Collective Labor Agreement, the activity threshold entitling trade unions to engage in collective labor agreements was set at 1%. The Constitutional Court (1) on October 22, 2014, removed the precondition of being employed in an establishment with thirty or more workers and having a minimum seniority of six months for workers to apply to the court for termination of the contract because of trade union affiliation, (2) on October 22, 2014, removed the ban on strike and lockout for banking services and urban public transportation services, and (3) on October 20, 2015, nullified the provision preventing public employees working in the administrative organization of the Turkish Grand National Assembly from being members of a trade union.
The Law on Occupational Health and Safety No. 6331 was adopted on June 30, 2012. This Law constitutes the legal basis of all the transposed EU occupation health and safety directives and includes both workers and public employees in the scope of the health and safety legislation.
On April 20, 2016, the Law on Human Rights and Equality Institution was adopted. This Law sets the general basis for combating discrimination in Turkey, which also aims to transpose the EU Acquis concerning anti-discrimination on grounds of race and ethnic origin in every area of life and anti-discrimination in employment on grounds of religion, belief, disability and age. The Human Rights and Equality Institution will act as an equality body, as required by the EU Acquis.
On June 25, 2015, a new Turkish Industrial Strategy Paper (2015-2018) was published which aims to meet the closing benchmark for Chapter 20 (Enterprise and Industrial Policy).
The Council of Europe Convention on the Prevention of Terrorism which, was ratified on February 23, 2011, entered into force on January 13, 2012.
The Optional Protocol to the Convention against Torture and Other Cruel, Inhuman or Degrading Treatment or Punishment (“OPCAT”) has been ratified and entered into force on March 12, 2011. On January 28, 2014, the Human Rights Institution was declared the “national preventive mechanism” under the OPCAT.
The Council of Europe Convention on the Protection of Children against Sexual Exploitation and Sexual Abuse was signed by Turkey and entered into force on April 1, 2012.
The individual application procedure to the Constitutional Court following the exhaustion of domestic remedies became operational as of September 23, 2012.
Another important development is the amendment of the Turkish Criminal Procedure Law and Law on Execution of Penal and Security Measures as of January 2013. No a defendant can opt to make his or her oral defense in his or her preferred language after the indictment is read and the merits on charges are presented.
On April 11, 2013, The Law No. 6458 on Foreigners and International Protection entered into force which is the framework legislation on regular and irregular migrants, foreigners, refugees and asylum seekers in Turkey and establishes General Directorate of Migration Management under the Ministry of Interior.
On November 19, 2015, the By-law on the Procedures and Principles of the Implementation of Turkish Qualifications Framework was adopted. Subsequently the Communiqué related to Turkish Qualifications Framework, which is the annex of the By-law, was published on the Official Gazette No. 29581 of January 2, 2016. Hence, alignment with the EU Recommendation on the establishment of the European Qualifications Framework for lifelong learning (2008/C 111/01) was fulfilled.
29
On January 11, 2011, the Assembly approved the new Turkish Code of Obligations Law No. 6098. Law No. 6098 was published in the Official Gazette No. 27836 of February 4, 2011. The new Law includes, inter alia, several amendments that provide protection to individuals against unilaterally pre-prepared contracts. Additionally, in the case of any unforeseen, extraordinary events, which with respect to the debtor, which lead to changes to the conditions that existed at the time of the execution of a contract, such debtor is entitled to apply to a court for modification of such contract.
In January 2011, the Assembly approved the New Turkish Code of Commerce (Law No. 6102) and it was published in the Official Gazette No. 27846 on February 14, 2011, and became effective, on July 1, 2012. Under the new Turkish Code of Commerce (“TCC”), among other things, companies will be required to prepare financial statements in accordance with International Financial Reporting Standards and the obligations of companies regarding public disclosures and corporate governance principles have been broadened to be in line with global standards. The TCC also allows the establishment of joint stock companies or limited liability companies with a single shareholder or partner. Legal entities can now become board members, board meetings can be held in electronic media (with the use of online votes in General Assemblies now being allowed), and board resolutions can also be signed with electronic signatures. Types of mergers, conditions of withdrawal from partnerships, financial assistance to employees, spin-offs and conversions have also been acknowledged in the TCC.
Implementation of the Southeastern Anatolia Project (“GAP”) for development continues. GAP includes a wide array of investment products from agriculture to health, education and transportation. The GAP Action Plan Phase I was implemented in 2008-2012. During the first implementation period of the Plan, the share of GAP initiatives in public investments increased from 7% to nearly 14%. More than TL 30 billion (approximately U.S.$16.8 billion) was allocated for investment in GAP Region in the 2008-2012 periods. Within the framework of the GAP Action Plan Phase II (2014-2018), almost TL 26.7 billion (approximately U.S.$12.5 billion) is allocated to the region. Moreover, Konya Plain, Eastern Black Sea and Eastern Anatolia development action plans were adopted and have been implemented by their respective development administrations.
The 2010-2014 Anti-Corruption Strategy (The Strategy on Enhancing Transparency and Strengthening the Fight against Corruption) and its Action Plan was completed successfully. Turkey is committed to fight against corruption based on the principles of the 2010-2014 Anti-Corruption Strategy.
On June 24, 2011, the Financial Action Task Force (the “FATF”), an inter-governmental global standard setting body responsible for developing and promoting policies to combat money laundering and terrorist financing (“AML/CFT”), identified Turkey among the jurisdictions that have strategic AML/CFT deficiencies. Because Turkey has demonstrated significant progress combating AML/CFT issues through both legislation and implementation and, accordingly, has addressed deficiencies identified by the FATF, the FATF released the Public Statement for Turkey on October 2014. In the Public Statement, the FATF noted Turkey’s significant progress in improving its AML/CFT regime and that Turkey has established the legal and regulatory framework to meet its commitments in its action plan regarding the deficiencies that the FATF had identified in February 2010. Turkey is, therefore, no longer subject to the FATF’s monitoring process under its on-going global AML/CFT compliance process.
In addition to Turkey’s efforts in respect of AML/CFT, the regulation on Principles and Procedures Regarding Electronic Notification System of the Financial Crimes Investigation Board became effective on March 30, 2015, through publication in the Official Gazette No.29311. Thus, it is now possible for Financial Crimes Investigation Board (“MASAK”) to communicate with most of the financial institutions in electronic environment in a rapid and reliable manner.
The EU Twinning Project on effectiveness of AML/CFT, in which MASAK is the main beneficiary, officially started on March 1, 2015. The Project aims to strengthen the efficiency and effectiveness of the legal, institutional and technical framework of AML/CFT, and has a completion deadline of 2017.
Progress Reports
Since 1998, the European Commission annually publishes its regular Progress Reports on Turkey, as well as the Enlargement Strategy Paper, which evaluate developments in all candidate and potential candidate countries.
The Progress Report on Turkey and the 2011-2012 Enlargement Strategy were published on October 12, 2011. In the Report, the European Commission concluded that Turkey has made progress in meeting EU membership criteria. The Report indicated that Turkey continued to sufficiently fulfill the political criteria. According to the Report, work on implementing the 2010 Constitutional reform package was launched by the Government, free and fair parliamentary elections took place on June 12, 2011, and opened the way for further Constitutional reform. The establishment of a specific Ministry for EU Affairs was regarded as an encouraging signal for Turkey’s reform efforts to meet the EU accession criteria. The Report also indicated that the rapid economic expansion continued and the private sector remained the main driving force behind the rapid economic expansion. The Report underlined the fact that robust economic development allowed strong employment growth and a sizeable drop in unemployment. It also stated that Turkey continued to improve its ability to take on the obligations of membership, in particular Chapter 6- (Company Law), Chapter 18 (Statistics) and Chapter 21 (Trans-European Networks).
30
The 2012 Progress Report on Turkey and the 2012-2013 Enlargement Strategy were published on October 10, 2012. The Report welcomed the successful launch of the Positive Agenda in May to support and to complement the accession negotiations through enhanced cooperation in a number of areas of joint interest: political reforms, alignment with the EU law, dialogue on foreign policy, visa liberalization, mobility and migration, trade, energy, counter terrorism and participation in Community programs. In the Report, the Council invites the European Commission to take steps towards visa liberalization as a gradual and long-term perspective, in parallel with the signing of the Readmission Agreement between Turkey and the EU, which was signed in June 2012. It also stressed that Turkey should sign the Readmission Agreement to allow for a proper roadmap to be finalized. The Report welcomes the work on a new Constitution and acknowledges that a democratic and participatory process has been put in place. The Report also notes that representatives of non-Muslim minorities were officially received by Parliament. In the Report, terrorist attacks by the PKK (a terrorist organization in Northern Iraq) were strongly condemned by the EU, yet it is stated that the Kurdish issue remains a key challenge for Turkey’s democracy. Moreover, the Report stressed that several important pieces of legislation were adopted, in particular, laws on the protection of family and prevention of violence against women, probation, collective bargaining for civil servants, the Ombudsman Institution and the national human rights institution.
The 2013 Progress Report on Turkey and the 2013-2014 Enlargement Strategy Document were published by the European Commission on October 16, 2013. The Report comprehensively described the political reforms undertaken in Turkey during the previous year. The Report also emphasized the Turkish Government’s determination regarding the continuation of democratization and political reforms and, in this context, referred to the Democratization Package published on September 30, 2013, as well as to the steps taken concerning the judiciary reform and ongoing work on the new Constitution. The Report stated that the process in Turkey that aims to end armed terrorist attacks and the activities of the PKK constitutes a milestone and continues to generate the support of the EU. The Report also referred to Turkey’s active role in foreign policy.
The 2014 Progress Report on Turkey and the 2014-2015 Enlargement Strategy were published on October 8, 2014. The Report specifically references Turkey’s positive actions implementing legislation within the Democratization Package framework and praises Turkey’s constructive approach outlined in the Solution Process. The Report indicated that the adoption by Turkey of “The Action Plan on Prevention of ECHR Violations” was a critical step in the democratization process. The humanitarian assistance provided by Turkey to 1.5 million Syrians fleeing violence across the border was also praised in the Report. The Report also indicated that the growth of the economy since 2011 affirms the strength and resilience of the economy against the global economic shocks. With regard to alignment with the EU Acquis, the Progress Report confirmed that progress has been made at various levels in 30 of the 33 negotiation chapters. The Progress Report also indicated that Turkey has reached advanced level of alignment in 26 of these chapters.
The 2015 Progress Report on Turkey and EU Enlargement Strategy were published on November 10. 2015. The Report refers to the positive developments in cooperating on foreign and security policy, including counter-terrorism, the Joint EU-Turkey Action Plan for refugees and migration management, the High Level Energy Dialogue, modernization and extension of the Customs Union, and visa liberalization. The humanitarian aid and support provided to millions of refugees from Syria and Iraq was also praised in the Report. The Report confirmed that the high turnouts at the general elections in June and November are a clear sign of the strength of Turkish democracy. The Report criticized the judicial system, rule of law, and freedom of expression, assembly and the media. With regard to the economic criteria, the Report indicates that there is an increasingly high level of commercial and economic integration between Turkey and the EU. It also underlined that Turkey has a functioning market economy, noting Turkey’s high capacity to deal with competitive pressure and market forces despite some macroeconomic imbalances. The Report recommended accelerating structural reforms for long-term growth. With respect to the alignment with the Acquis in the past year, the European Commission has confirmed that Turkey has achieved various levels of progress beyond what was achieved in 2014, in 27 Chapters out of 33.
Economic Criteria
The European Commission has considered Turkey a functioning market economy in all its annual Progress Reports since 1998. The recent Progress Reports have highlighted Turkey’s robust financial sector and resilience of the Turkish economy, with a special emphasis on its sustained growth rate despite a difficult international economic environment.
In March 2015, Turkey submitted its Economic Reform Program (“ERP”) for the 2015-2017 period, which replaced the Pre-Accession Economic Program. The ERP was prepared based on the 2015-2017 Medium Term Program.
The Turkish economy grew by 8.5% in 2011, 2.1% in 2012, and 4.2% in 2013, 2.9% in 2014 and 4.0% in 2015.According to the ERP, for the 2015-2017 period, Turkey’s economy is expected to grow 5% both in 2016 and 2017. The year-end consumer price inflation rate was 10.4% in 2011, 6.2% in 2012, 7.4% in 2013, 8.2% in 2014 and 8.8 in 2015. The inflation target was set as 5.5% for 2016 and 5.0% for 2017. Turkey’s International Labor Organization defined unemployment rates were recorded as 8.4% in 2012, 9.0% in 2013, 9.6% in 2014 and 9.5% in 2015. Unemployment rate is expected to decrease to 9.2% in 2016 and 9.1% in 2017. Current account deficit/GDP ratio figures were 10% in 2011, 6.2% in 2012, 7.9% in 2013, 5.7% in 2014 and 5.4% in 2015. ERP forecasts the current account deficit/GDP ratio as 5.4% and 5.2% in, 2016 and 2017, respectively.
31
Customs Union
For Turkey, Customs Union was considered a stepping stone. The reason Turkey entered into such an asymmetric structure was that there was an expectation of EU membership within a foreseeable period of time. Because Turkey has yet to achieve EU membership, and the systemic problems within the Customs Union continue to exist, Turkey and the EU have agreed to update the Customs Union.
With the update package, Turkey expects sound and sustainable solutions to the structural problems due to the asymmetries of the Customs Union and an extension of trade relations to new areas which will boost bilateral trade relations. Turkey’s main expectations are removal of existing barriers hindering free movements of goods such as road quotas and visas and inclusion of Turkey in EU’s policymaking mechanisms in areas directly related with the Customs Union, enabling Turkey to benefit simultaneously from the Free Trade Agreement concluded by the EU.
One of the most important aspects of the FTA issue is the Transatlantic Trade and Investment Partnership (“TTIP”) negotiations between the EU and the USA. Turkey expects the update to facilitate the inclusion of Turkey in the TTIP.
The negotiations will start by the beginning of 2017. Currently, both sides are carrying out their internal procedures to get negotiating mandates.
Financial Assistance
Following the expiration of 2007-2013 IPA term’s legal framework (“IPA I”), the European Commission and Turkey established priorities for financial assistance under the new Instrument for Pre-accession Assistance (“IPA II”), set out in the Indicative Strategy Paper for Turkey for the period 2014-2020. This key document was presented to the Commission’s IPA committee in July 2014 and adopted on August 26, 2014. The IPA II Framework Agreement, transferring the implementation principles into internal legislation was signed by both parties on February 11, 2015. The Law No. 6647 regarding approval of the Framework Agreement by the Turkish Grand National Assembly was published in the Official Gazette on April 28, 2015. Council of Ministers’ decision approving the Agreement was published in the Official Gazette No. 29393 on June 21, 2015. In IPA II, reforms relating to the rule of law and fundamental rights, home affairs, and civil society are to receive increased funding compared to IPA I. Other priorities include education, employment and social policies. In the sectors of environment, transport, and energy, the IPA II will focus on promoting development towards a resource efficient, low carbon economy and on increasing inter-connectivity between Turkey and the EU. In the areas of agriculture and rural development, work will focus on food safety, veterinary and phytosanitary policy, agriculture, fisheries and rural development. These priorities will be used as the basis for sector programs promoting structural reforms, allowing more targeted assistance and improving the impact of financial assistance.
In implementing IPA II, the European Commission and Government of Turkey agreed that Civil Society would make up a specific sub-sector, under the overall sector of “Governance and Democracy.” About 190 million Euro will be allocated to this sub-sector. The programming of the IPA II civil society sub-sector has been underway with the participation of all relevant parties.
The objectives under the Civil Society sub-sector are to support the development of civil society through more active democratic participation in policy and decision-making processes; promote a culture of fundamental rights and dialogue; enhance civil society dialogue and inter-cultural exchange between civil societies in Turkey and Europe.
The Financing Agreement of 2014 Annual Action Program for Turkey and its Annexes was signed by National Instrument for Pre-Accession Assistance (IPA) Coordinator on December 3, 2015 and effective on December 21, 2015 after an internal ratification procedure. The Agreement allocates IPA funds to the projects as annual and multiannual programs. The annual programs are Democracy and Governance, Rule of Law and Fundamental Rights, Energy and, Agriculture. The multiannual programs are Competitiveness and Innovation, Education, Employment and Social Policies, Transport and, Environment.
The Sectoral Agreement of the Agriculture and Rural Development allocates IPA funds to the projects addressed under Agriculture and Rural Development area. This Agreement was effective as of November 25, 2015, after an internal ratification process.
EU Process at the Local Level
According to the Ministry of Interior Circular No. 2010/6 of January 26, 2010 EU Harmonization, Consultancy and Steering Committees were established within 81 province governorship offices and within each of the 81 province governorships, one Deputy Governor has been appointed as the Provincial EU Permanent Contact Point. The Provincial EU Permanent Contact Points disseminate EU related information throughout the provinces.
Additionally, Provincial EU Advisory and Steering Committees have been established in all the provinces. Deputy governors appointed as the Provincial EU Permanent Contact Points have been chairing these Provincial EU Advisory and Steering Committee meetings since 2010. By the end of 2015, approximately 900 meetings have been held across Turkey.
Finally, EU Offices have been established in each of the 81 provinces. The local offices of Ministry for EU Affairs in Istanbul, Antalya and İzmir coordinate with these offices and act as a guide through harmonization and implementation of the EU Acquis at the local level.
32
The United States
Turkey and the United States, as close allies and partners, enjoy a relationship of fundamental importance based on shared values and common goals like democracy, the rule of law, respect for human rights, development and growth of a market economy, as well as the desire to promote peace, stability and prosperity around the globe.
Turkey and the United States together face a host of international challenges of major significance. Turkey-U.S. cooperation makes substantial contributions to efforts aimed at achieving global and regional peace, stability and prosperity. The United States is Turkey’s main military export-import partner. While defense ties form the bedrock of the relationship between two countries, there have also been improvements in bilateral trade and economic relations.
Turkey and the United States cooperate on a wide range of issues and complex international challenges such as the fight against terrorism, the chaos in Syria and Iraq and the migration crisis, energy supply security, nuclear non-proliferation, and global economic developments.
Bilateral high-level visits gained momentum during recent years. Former President Gül visited the United States to attend the NATO Chicago Summit in May 2012. Former Secretary of State Clinton paid a visit to Turkey in June 2012 within the framework of the 2nd Coordination Committee meeting of the Global Counter Terrorism Forum. She also paid a working visit to Turkey on August 11, 2012. The visit of former Prime Minister, now President Erdoğan to Washington, D.C. in May 2013, brought about a fresh impetus to Turkey-U.S. relations. This visit reaffirmed that Turkey and the United States share a common set of foreign policy priorities and that they have the common will to strengthen their cooperation with a view to addressing the challenges of the 21st century.
Other high-level visits and regular contacts between Turkey and the United States during the course of 2013 included the visits of Secretary of State Kerry, Former Prime Minister, Davutoğlu and other Ministers as well as visits of Congressional delegations.
Frequent high-level visits and contacts between Turkey and the United States also took place in 2014. During the NATO Wales Summit and the UN General Assembly in 2014, President Erdoğan met with United States President Obama and United States Vice President Biden, respectively. Former Prime Minister Davutoğlu also met with Secretary of State Kerry during of the NATO Wales Summit, in September 2014. In the last quarter of 2014, Turkey hosted a number of Senior Administrative Officials from the United States. In this period, Vice President Biden, Secretary of State Kerry, Secretary of Commerce Pritzker and Former Secretary of Defense Hagel visited Turkey. Secretary Pritzker’s visit was of particular importance, where business and investment opportunities between the two countries were discussed.
In 2015, high-level visits and contacts between Turkey and the United States intensified. Foreign Minister Çavuşoğlu met with Foreign Minister Kerry in several occasions, including the Meeting of the Global Coalition to Counter ISIL in London in January 2015, Association of Southeast Asian Nations (“ASEAN”) Foreign Ministers’ Meeting in Malaysia in August 2015, UN General Assembly in 2015, G-20 Summit in Antalya in October 2015 and NATO Foreign Ministers’ Meeting in Brussels in December 2015. Minister Çavuşoğlu met with Minister Kerry during his visit to Washington in May 2015. Former Prime Minister Davutoğlu also met with Foreign Minister Kerry at the NATO Foreign Ministers’ Meeting in Antalya in May 2015. President Erdoğan met with President Obama during the G-20 Antalya Summit and World Climate Summit in Paris.
From 2012-204, the United States has issued a waiver to Turkey from certain U.S. extraterritorial sanctions against Iran that otherwise might have applied by reference to Turkish imports of Iranian crude oil, which was later superseded by additional sanctions relief under the Joint Plan of Action with Iran, enabling Turkey, among other countries, to continue purchasing its then-current average amounts of such crude oil from January 20, 2014 forward, subject to the non-involvement of the U.S. financial system and other U.S. elements in those transactions. As of January 16, 2016, which was “Implementation Day” under the Joint Comprehensive Plan of Action which was agreed with Iran in July 2015, the relevant U.S. extraterritorial sanctions against Iran were lifted, leaving in place only the primary sanctions which prohibit the involvement of U.S. elements in Iran-related oil transactions.
The United States is one of the major trade partners of Turkey. The bilateral trade volume between Turkey and the United States was U.S.$17.5 billion in 2015. Turkish exports to the United States reached U.S.$6.3 billion, mainly composed of iron and steel, road transportation vehicles and textile fiber and its products. Total import volume was U.S.$11.1 billion. Iron ore and metal scraps, textile fiber and other transportation vehicles are the major import items of Turkey from the United States.
Approximately 1,600 U.S. companies have invested in or do business in Turkey. In the last decade (2005-2015), U.S. companies have invested U.S.$10.6 billion in Turkey. Currently, the United States ranks second in FDI inflows behind the Netherlands. U.S.-investments surpassed U.S.$1.566 billion in 2015. The U.S. Chamber of Commerce has chosen its second overseas representative mission to be located in Istanbul.
33
Turkey is also designated by the United States as one of the 6 preferential markets (Colombia, Indonesia, Vietnam, Saudi Arabia, South Africa and Turkey) in the world.
Since 2009, several mechanisms have been established for bringing economic, trade and investment relations to a level proportionate to political and security relations between the two countries, such as the Framework for Strategic Economic and Commercial Cooperation (launched in 2009) (the “FSECC”), the Business Council (launched in 2011), established under the auspices of the FSECC, the Economic Partnership Commission (launched in 2011), and the Trade and Investment Framework Agreement Council.
Russia
While Turkey and Russia differ on a number of international issues, in particular, with respect to Crimea, the Ukraine crisis, and Syria, the two countries keep their channels of dialogue open.
Turkey-Russia relations, which followed a course of cooperation, faced a serious test as a result of military activities related to the Syrian crisis, culminating in the downing of a Russian military aircraft, which violated Turkish airspace despite repeated warnings. Following the incident, Russia took a number of unilateral restrictive measures against Turkey. However, in line with the mutual desire of Turkish and Russian peoples, the two countries decided to make a new start in bilateral relations and a normalization process was launched by the Presidents in June 2016. With this understanding, an intense bilateral political dialogue has been re-established as of second half of 2016. Economy, trade and energy relations are the driving force of Turkish-Russian relations. Due to mainly decrease in Russian economic performance bilateral trade, which was U.S.$30.0 billion at the end of 2014, dropped to U.S.$23.9 billion as of the end of 2015.
Reciprocal investments have exceeded U.S.$10 billion each, as of 2015, excluding the Akkuyu nuclear power plant project being built in Turkey currently valued at approximately U.S.$20 billion.
On December 1, 2014, the President of the Russian Federation announced the cancellation of the South Stream project and instead proposed the construction of a new pipeline system from Russia to Turkey through the Black Sea. During President Putin’s visit to Turkey on December 1, 2014, a non-binding document was signed to this effect between BOTAŞ and Gazprom. Limited progress was achieved between December 2014 and July 2016. Following the high-level talks held between President Erdoğan and President Putin in St. Petersburg on August 9, 2016, both countries displayed a common will to reassess the “Turkish Stream” project.
Work related to Akkuyu Nuclear Power Plant project is ongoing in accordance with the contractual commitments inscribed in the Intergovernmental Agreement signed on May 12, 2010.
Tourism constitutes an important aspect of Turkish-Russian bilateral relations. In 2013 and 2014, 4,270,000 and 4,480,000, respectively, Russian tourists visited Turkey. The number dropped in 2015 to 3,649,000.
Yet another field of economic cooperation is the construction sector. Turkish construction companies have completed various projects in Russia since the fall of the USSR, the total value of which has surpassed U.S.$64.8 billion as of the end of 2015.
The Balkans
Turkey’s policy towards the Balkans is guided by the principles of “regional ownership” and “all-inclusiveness” and is based on four main pillars: security for all, high-level political dialogue, economic interdependence and preservation of the multi-ethnic, multi-cultural and multi-religious social fabric of the region. In addition to having a common history and shared values, the Republic has a joint vision with the Balkan countries based on common goals and integration with European and Euro-Atlantic institutions.
Apart from political support, Turkey also provides assistance to the countries of the region in various areas including economy, culture, education, military and security through its relevant public institutions, municipalities, NGO’s and universities.
34
Turkey has played a leading role in launching major initiatives such as the South-Eastern European Cooperation Process (“SEECP”), the only major initiative which started within the region, and the Multinational Peace Force Southeast Europe/South-eastern Europe Brigade. Turkey also plays an active role in the Southeastern Europe Defense Ministerial process. Turkey continues to be active within the Southeast European Law Enforcement Center as well.
The Trilateral Summits bring the parties together to engage in joint projects intended to strengthen the dialogue and contribute to the regional peace, stability and cooperation. The second meeting of the “Trilateral Balkan Summit” was held in Karadjordjevo, Serbia on April 26, 2011. The third was held in Ankara on May 14-15, 2013. At the summit, the “Ankara Summit Declaration” was adopted and the Ministers of Economy of Turkey, Bosnia-Herzegovina and Serbia met and established “Trilateral Trade Committee”. The first meeting of the “Trilateral Trade Committee” was held in Ankara with the participation of Ministers of Economy, on August 17-18, 2015. The second meeting of the Trilateral Trade Committee was held in Belgrade on October 19, 2015, followed by a Business Forum, organized in Sarajevo the next day.
During 2015, several high level visits took place, including the visits of Dragan Çoviç, the-then Chairman of the Bosnia Herzegovina Presidential Council, Bakir İzetbegoviç, a Bosnian member of the Council to Turkey, and President Erdoğan to Slovenia, Romania, Bosnia Herzegovina and Albania, respectively. Former Prime Minister Davutoğlu also visited Bulgaria and Serbia in 2015.
Turkey’s economic and trade relations with the countries of this region are strong and the overall trade volume exceeded U.S.$16.5 billion in 2015.
Greece
Following the dialogue and cooperation process initiated between Turkey and Greece in 1999, a more constructive understanding has begun to define the terms of bilateral relations which were problematic in past decades. The conclusion of 35 bilateral agreements/protocols/MoUs in various fields such as trade, tourism, environment, culture, energy, transportation and security-related matters has contributed towards cooperation on issues of common interest. During this process, 29 Confidence Building Measures (“CBM”) were adopted. Since 2009, Turkey and Greece have furthered their efforts in order to improve bilateral relations.
The second High Level Cooperation Council (“HLCC”) meeting was held in İstanbul on March 3-4, 2013. The third meeting of HLCC was held in Athens on December 6, 2014, in conjunction with Prime Minister Ahmet Davutoğlu’s visit to Greece. In total, 48 agreements/MoUs/protocols were signed at the HLCC meetings between Turkey and Greece in various fields with a view to enhancing cooperation in a wide-range of fields such as transport, energy, irregular migration, culture, agriculture and health.
The HLCC model in essence aims to bring together all relevant Ministers from both countries in the form of a joint cabinet meeting in order to raise their issues and develop a joint vision under the guidance of the two Prime Ministers.
The Greek Foreign Minister Kotzias and Prime Minister Tsipras visited Turkey, on May 12, 2015, and November 17 and 18, 2015, respectively. During the visit of the Prime Minister Tsipras, the countries agreed to hold the 4th meeting of HLCC in Turkey in early 2016 and establish a joint working group against irregular migration. The first meeting of the joint working group was held in Ankara on November 27, 2015. As agreed during the visit of Prime Minister Tsipras, the Fourth HLCC Meeting took place on March 8, 2016 in İzmir and 6 documents were signed in the fields of tourism, irregular migration, media and maritime cooperation. At the meeting, both sides agreed to take steps to implement the Izmir-Thessaloniki Ro-Pax ferry line and the Istanbul-Thessaloniki high-speed train projects. In the meantime, established dialogue mechanisms continue to work smoothly. By the end of 2015, 59 rounds of exploratory talks were held.
The countries’ mutual desire to bridge differences through dialogue and promote cooperation has had a positive impact on other dimensions of bilateral relations, such as trade, economy and tourism. The trade volume between the two countries exceeded U.S.$4.0 billion in 2011. The bilateral trade volume reached U.S.$4.9 billion in 2012. In 2013, Turkey became the number one trade partner of Greece and trade volume reached U.S.$5.7 billion, with a surplus of U.S.$2.7 billion in Greece’s favor. Bilateral trade volume was about U.S.$5.6 billion in 2014. In 2015, trade volume was U.S.$3.3 billion in 2015, with Turkey’s exports and imports to Greece amounting to U.S.$1.4 billion and U.S.$1.9 billion, respectively.
The amount of Greek foreign direct investment in Turkey, with the banking sector taking the lead, was U.S.$6.7 billion by the end of 2014 and reached U.S.$6.8 billion by the end of 2015 while the total of Turkish companies’ investments in Greece was about U.S.$500 million.
In 2013, Turkey was the destination of choice for more than 800,000 Greek tourists. In 2014, the number of Turkish tourists who visited Greece exceeded 1 million while the number of Greek tourists visiting Turkey reached 830,000. In 2015, 1,153,046 tourists from Turkey visited Greece and 755,414 tourists from Greece visited Turkey. The simplified visa procedure for Turkish tourists to visit the seven Greek islands close to Turkish shores (in effect since 2012), has been instrumental in the increase of the number of Turkish tourists to Greece.
35
Turkey and Greece are also intensifying their cooperation in the transportation sector. Currently, Turkish airline operators are conducting 52 flights a week between Turkey and Greece.
As agreed by the Turkish and Greek Foreign Ministers during their meeting in New York in September 2013, the reciprocal visits of the Turkish Cypriot Negotiator Mr. Kudret Özersay and Greek Cypriot Negotiator Mr. Andreas Mavroyiannis to Athens and Ankara, respectively, took place on February 27, 2014, following the resumption of negotiations for a comprehensive settlement in Cyprus. These visits demonstrated the support and commitment of Turkey and Greece to finding a satisfactory solution in respect of the settlement of Cyprus issue.
Cyprus
Turkey supports the UN Secretary General’s Good Offices Mission, with a view to finding a just and lasting comprehensive settlement to the Cyprus problem, based on the long established UN parameters such as bizonality, political equality, equal status of the two constituent states and a settlement which will bring about a new partnership state. Turkey has openly declared its full support for a political settlement in the Island.
The island of Cyprus is the home of two politically equal parties: Turkish Cypriots and Greek Cypriots who are two distinct peoples with different religions, cultures and ethnicities. The bitter past of ethnic conflict in Cyprus dictates that lasting peace can only be achieved through a viable equal partnership.
In 1963, Greek Cypriots expelled Turkish Cypriots by force from the partnership state institutions as well as from the Turkish-Cypriots’ homes, in violation of the Treaties of 1960. A UN peacekeeping operation deployed on the Island in 1964 and has been operational since then.
From 1963 to 1974 Turkish Cypriots lived in isolated enclaves, representing 3% of the Island, under frequent, organized and systemic attacks by Greek Cypriots. When this culminated with a coup d’état in 1974, which was aimed at annexing the Island to Greece, Turkey as a guarantor power was left with no other option but to exercise its rights pursuant to the 1960 Treaties.
In the past forty-eight years of the UN negotiation process, Turkish Cypriots have always supported a just, lasting and comprehensive settlement of the issue based on negotiations between the two peoples of the Island, under the auspices of the UN Secretary-General’s Good Offices Mission. However, Greek Cypriots rejected the 1985-86 Draft Framework Agreement, the UN sponsored Set of Ideas of 1992, the package of Confidence Building Measures of 1994.The political resolve demonstrated by the Turkish Cypriot side for a settlement paved the way for a renewed initiative by the former UN Secretary General Mr. Kofi Annan in January 2004 for the resumption of negotiations with a view to reaching a comprehensive settlement of this issue.
The Annan Plan was submitted to simultaneous separate referenda in the North and the South of Cyprus on April 24, 2004. With the resolute support of Turkey, the Turkish Cypriots voted in favor of the Annan Plan with 64.9%, whereas the Greek Cypriots rejected the Plan with a ‘No’ vote of 75.8%.
Turkey, as a guarantor power, has always supported constructive efforts in the UN negotiating process for the establishment of a new partnership state in Cyprus which will bring peace and stability to the Eastern Mediterranean region and beyond.
The negotiations resumed on May 26, 2010. During the process, the two leaders and the Secretary General of the United Nations (“UNSG”) held in tripartite meetings on November 18, 2010 in New York, on January 26, 2011 and July 7, 2011 in Geneva, and on October 30-31, 2011 and January 23-24, 2012 in Greentree, New York. The Turkish Cypriot side maintained its constructive and result-oriented approach during these meetings as well.
The international community had high expectations from the tripartite meeting held on January 23-24, 2012 in Greentree. The Turkish side had hoped that the second Greentree meeting would usher in the high-level meeting with the participation of the two sides and the three guarantors, which would address all remaining issues that could not have been agreed upon in order to seal the settlement through a grand bargain. Regrettably, this was not achieved at the meeting, despite the sincere efforts of the Turkish Cypriot side and a very important opportunity was missed.
Throughout the period following the second Greentree meeting, the Turkish Cypriot side continued its determined and constructive efforts for the success of the UN process with Turkey’s full support.
After the Greek Cypriot elections in February 2013, it took almost a year for the new Greek Cypriot leader to return to the negotiations.
Almost a year after the election of Mr. Anastasiades and months-long effort to finalize a joint statement, the two leaders in Cyprus finally met on February 11, 2014 to resume the comprehensive settlement negotiations. Following the resumption of the negotiations, the cross-visits of the Turkish Cypriot Negotiator Mr. Kudret Özersay and the Greek Cypriot Negotiator Mr. Andreas Mavroyiannis to Athens and Ankara respectively, took place on February 27, 2014.
Since the resumption of the negotiations, the Turkish Cypriot side exerted repeat efforts to secure the existing convergences and to build upon them. Despite the Leaders’ Joint Statement of February 11, 2014 that referred to the “structured” negotiations to be carried out in a “results-oriented” manner, focusing on unresolved core issues. The Greek Cypriot side came with new proposals that disregarded the existing convergences. This pushed the negotiations into a futile, time-consuming exercise, which meant losing the whole acquis of the process and returning back to 2008.
In their meeting on July 24, 2014, the leaders agreed that both sides had completed the submission of proposals on all issues. The leaders met again on September 17, 2014 for a basic agreement to be reached for moving to the next phase of structured negotiations. The expectation was that a lasting settlement would be achieved following the referenda at the earliest opportunity.
36
Instead of concentrating on the negotiation process at that critical juncture, the Greek Cypriot side started new drilling activity on September 25, 2014 in its so-called license areas, which overlaps with those of the TRNC and Turkey.
Despite Turkey’s and the TRNC’s warnings, the Greek Cypriot side began its initial offshore drilling activities on September 19, 2011. In this context, a continental shelf delimitation agreement was then signed on September 21, 2011 by Prime Minister Erdoğan and TRNC President Eroğlu in the margins of the 66th UN General Assembly in New York. On the other hand, the Greek Cypriots did not accept President Eroğlu’s constructive proposals put forth on September 24, 2011 and on September 29, 2012 for a fair sharing of these natural resources. In the absence of Greek Cypriot cooperation, the Government of the TRNC designated its own license areas around the Island and issued licenses for exploration and exploitation of oil and gas reserves to the Turkish Petroleum Corporation.
Following the continuing unilateral activities of the Greek Cypriot side, the TRNC also started conducting seismic research activity in its own license area, which does not overlap with the Greek Cypriots’ drilling activity area. In response, the Greek Cypriot side walked away from the UN negotiations table on October 7, 2014.
Following the Greek Cypriot side’s drilling activities coming to an end at the end of March 2015, the Turkish Cypriot side decided to withdraw the BHP ship conducting seismic research from the region. Following the election of Mustafa Akıncı as the President of the TRNC in April 2015, the comprehensive settlement negotiations resumed on May 15, 2015.
After negotiations had intensified at the level of Leaders in November 2015, the Leaders continued their meetings with the aim of reaching a settlement in 2016. As of August 2016, there has been progress achieved on the negotiations, but not enough to conclude a comprehensive settlement of the issue. Turkey and the Turkish Cypriot side are genuinely committed to the settlement aim and believe that if there is political will, a settlement in Cyprus could be possible in 2016.
Water resources are also another area for potential cooperation. Turkey and the TRNC completed the Northern Cyprus Water Supply Project on October 17, 2015, which is to provide 75 million cubic meters of water from Turkey to the TRNC. This amount can be increased ten-fold in the future that would be equal to the double of the water requirement of the entire Island.
Turkey additionally believes that the UN Security Council should heed the call made by the UNSG in his Report of May 28, 2004, towards putting an end to the isolation of the Turkish Cypriots. The UNSG noted in his report that there is no Security Council resolution which imposes restrictions on the Turkish Cypriots and also called on members of the Security Council to encourage all Member States to eliminate unnecessary restrictions and barriers that isolate the Turkish Cypriots and impede their development. The European Council also decided on April 26, 2004, to end the isolation of the Turkish Cypriots with no conditions; this decision, however, has yet to be implemented. This situation is discouraging, particularly with respect to the ongoing UN negotiations. In line with the UNSG’s call, Turkey hopes that the international community will call for the isolation to end, thus also contributing to the settlement aim.
Iraq
Turkey strongly supports Iraq’s stability, political unity and territorial integrity and has made great efforts to help Iraq become a democratic, stable, peaceful and prosperous country. Turkey promoted national reconciliation and contributed to the successful conclusion of the government formation processes after the general elections in March 2010 and April 2014 by reaching out to all segments of Iraqi society and preserving its impartial stance towards all Iraqi political groups.
The Turkey-Iraq High Level Strategic Cooperation Council (the “HLSCC”), established in 2008, provides the legal framework to increase bilateral cooperation between the two countries in a more structured fashion. The purpose of the HLSCC is to achieve full economic integration between the two countries through joint projects in areas such as trade, energy, agriculture, security, health and water.
The first meeting of then HLSCC was held in October 2009 in Baghdad. The second meeting was held in December 2014 in Ankara.
Turkey has expanded its consular presence in Iraq. The Mosul Consulate General was opened in 2007 but it had to be closed after DAESH occupied the city in June 2014. Turkey also opened the Consulate General in Basra in 2009. Activities of Basra Consulate General were suspended temporarily due to security reasons following DAESH’s partial occupation of Iraqi territory in June 2014. The Erbil Consulate General was opened in 2010. The Sulaymaniyah Consular Agency commenced its activities as of April 2016.
Despite the ongoing security problems in Iraq since the second half of 2014, Iraq was the third largest export destination for Turkish products in 2015. Iraq currently ranks fourth among Turkey’s trade partners.
Turkish companies also play a crucial role in Iraq’s reconstruction and development. As of the end of 2015, a total of 1,600 Turkish companies operate in Iraq and their aggregate investments reached U.S.$23.6 billion.
Turkey’s main export items to Iraq are food products and beverages, basic metals, furniture, metal products, agriculture, electrical machinery, wearing apparel, rubber and plastic, and machinery and equipment products. There was a substantial increase in nearly all export items to Iraq between 2010-2014 period.
Turkey managed to diversify both its export markets and export products by implementing effective strategies in foreign trade. Export diversification to the MENA region allowed Turkish exports to grow despite weak demand in the EU, Turkey’s major trade partner, after the global financial crisis. Moreover, since 2010, exports to Iraq increased mainly due to the recovery in the economic activity and political stability in the region. Turkish organizations and businesspersons increased operations in this region to take advantage of its geographic proximity to Turkey.
37
The major industries of Turkish companies operating in Iraq are finance, construction, logistics, and wholesale & retail trade.
In recent years, Turkey has also significantly improved its relations with the Kurdish Regional Government (“KRG”) in Iraq. Turkish businessmen, contractors and workers have made crucial contributions to the prosperity and welfare in northern Iraq. In addition to the opening of Consulate General in Erbil, frequent high-level visits have been carried out between Turkey and the KRG. Another important factor in Turkish-Iraqi relations is the presence of the PKK, a terrorist organization in northern Iraq. Turkey believes that the PKK constitutes a threat to Turkey and its people, the security and stability of Iraq, and the region at large. Turkey seeks more resolute support and enhanced cooperation from the Iraqi authorities in ending the presence of this terrorist organization in Iraq.
Throughout 2013 and most of 2014, due to a dysfunctional government and lack of inclusive policies, public support of the Iraqi government has plunged and sectarian and ethnic based tensions have soared. DAESH quickly occupied large parts of Iraq by taking advantage of the social and political crisis inflamed by sectarian conflicts. Turkey believes that, in addition to the military efforts supported by the Global Coalition to Counter DAESH, established by the members of the international community in 2014 to strengthen cooperation in this struggle, regaining the alienated segments of Iraqi society through inclusive policies and establishment of a functioning federalism based on fair power and revenue sharing, as stated in the Iraqi constitution, is the sole remedy to defeat DAESH and achieve durable stability in Iraq. Furthermore, the underlying economic and structural drivers of instability should be addressed by a comprehensive overhaul of the administration.
DAESH is a national security threat for Turkey. Turkey is committed to fighting DAESH in cooperation with Iraq and the Global Coalition to Counter DAESH. To this end, since June 2014, Turkey has been providing military and humanitarian assistance to Iraq. At the request of the Iraqi Government, we have trained more than 3,000 local Iraqis and 2,500 Peshmerga to fight against DAESH to protect and liberate their own cities. Turkey set up three Internally Displaced Persons (“IDPs” camps in KRG that host almost 40,000 IDPs and opened its doors to more than 200,000 Iraqis, 10,000 of which are living in IDP camps, including 20,000 Yezidis and Christians. Turkey has also donated 770 truckloads of humanitarian assistance to Iraq.
On December 6, 2015, Turkey deployed forces to a camp in a region of northern Iraq as a routine rotation to train Iraqis to retake Mosul from DAESH. The Iraqi leadership resisted this deployment and threatened to turn to the U.N. Security Council if Turkish troops sent to northern Iraq were not withdrawn within 48 hours. Turkey decided to halt the transfer of troops. On December 18, 2015, Turkey decided to move troops out of Iraq to de-escalate tensions. Bilateral talks between the neighboring states are proceeding favorably.
Iran
Turkish-Iranian bilateral relations are evolving based on the principles of non-interference in domestic affairs, mutual respect and good neighborliness. Efforts are made to further enhance the political dialogue both on bilateral and regional issues, through reciprocal visits and mechanisms such as a High Level Cooperation Council (the “HLCC”), and joint commissions in different sectors. Since the formation of the HLCC in 2014, Turkish-Iranian relations have been carried out in a structural framework. So far, two HLCC meetings were co-chaired by Turkish and Iranian Presidents. Developments in Iran are of direct consequence to Turkey. Turkey has continually sought to engage Iran in helping stabilize the region. Therefore, Turkey’s relationship with Iran is an asset not only for Turkey but also for the international community.
Given the already volatile and unstable situation in this region, Turkey believes that only negotiated and cooperative solutions can provide lasting arrangements for issues that are of regional and global concern. Therefore, Turkey considers diplomacy and negotiation the only option in the resolution of the Iranian nuclear program and supported the negotiation process between P5+1 (China, France, the Russian Federation, the United Kingdom, the United States and Germany) and Iran which culminated in the adoption of the Joint Comprehensive Plan of Action on October 18, 2015.
Iran is an important trading partner of Turkey. In 2012, the volume of trade between Turkey and Iran reached a record level of U.S.$21.8 billion, which had decreased to U.S.$9.8 billion in 2015. Since then, the trade volume decreased significantly. In January-November 2015 period, total imports from Iran decreased by 38% compared to the previous year, mainly due to lower energy costs, while exports to Iran declined only by 3.5%. In the last 6 years, the major products exported to Iran are natural or cultured pearls, precious metals and jewelry products, machinery and mechanical appliances, plastics and articles, wood and articles of wood, electrical machinery and equipment and parts, and tobacco products. Major products imported from Iran are mineral fuels and mineral oils, plastics and articles thereof, copper and articles thereof, organic chemicals, and fertilizers. In 2012, when the total trade reached its record level, the main product exported was gold and the main product imported was energy. Natural or cultured pearls, precious or semi-precious stones, precious metals, metals clad with precious metal and articles thereof, imitation jewelry, coin accounted for 65.9% of total exports in 2012. Mineral fuels, mineral oils and products of their distillation, bituminous substances, and mineral waxes accounted for 89.4% of total imports in 2012.
38
The tourism sector constitutes the main part of Turkey’s service trade, as well as trade in goods. The number of Iranian tourists visiting Turkey has increased rapidly in the last decade and reached its peak level of 1.9 million in 2010. From January-November 2015, the number of tourists from Iran was approximately 1.6 million, which accounted for a 4.6% share of the total number of tourists visiting Turkey during that same time period.
Given that Turkish and Iranian economies complement each other, bilateral relations between Turkey and Iran, particularly in trade and energy, is expected to accelerate rapidly since the sanctions related to Iran’s nuclear program were lifted in early 2016. The Preferential Trade Agreement between Turkey and Iran, which came into effect in 2015, is an instrumental in increasing bilateral trade.
Syria
Turkey has invested substantial resources, politically, economically and otherwise, in its relations with Syria in the last ten years. Prior to the conflict that began in March 2011, the thriving relations between Turkey and Syria had contributed positively to bilateral trade, investment and tourism until the conflict erupted.
In March 2011, the Syrian people staged peaceful demonstrations, demanding democracy, freedom, human rights and the rule of law. However, the regime responded to these demonstrations with lethal force. In the weeks and months that followed the initial protests, the regime continued its policy to suppress peaceful protests by using heavy weapons, tanks, fighter aircraft and ballistic missiles. On November 30, 2011, the Minister of Foreign Affairs Ahmet announced measures, in close consultation with the Arab League, to curtail the capacity of the Syrian administration to commit acts of violence against its citizens. The measures adopted include (i) suspending the High Level Strategic Cooperation Council mechanism until a democratic administration comes to power, (ii) imposing travel ban and asset-freeze measures against some members of the Syrian leadership who have been reportedly involved in incidents where excessive violence and illegal methods were used against civilians, (iii) freezing the financial assets of the Syrian Government in Turkey, (iv) ceasing transactions with the Syrian Central Bank. On May 30, 2012, after the violence committed by the Syrian security forces in the town of Houla, and pursuant to Article 9 of the Vienna Convention on Diplomatic Relations, Turkey, as the host country, requested that the Syrian Chargé d’Affaires in Ankara and all other diplomatic personnel of the Embassy to leave the country, (v) terminating oil exports from Syria, and (vi) freezing credit relations with the Syrian government.
On December 4, 2012, NATO approved the augmentation of Turkey’s air defense capabilities. United States, German and Dutch batteries were deployed in Turkey beginning in early 2013. In August 2015, the United States and Germany decided to remove Patriot missile batteries from southern Turkey on technical and stational grounds. As of January 2015, one Spanish Patriot battery and, since July 2016, an Italian SAMP/T battery have been deployed in Turkey.
On March 23, 2014, a Turkish fighter jet shot down a Syrian jet and on May 16, 2015 a Turkish fighter jet shot down a Syrian aerial vehicle for violating Turkish air space in accordance with its rules of engagement and determination to protect its borders.
The regime’s aggression, as well as the growing presence of extremist and terror elements supported by the regime (particularly in the northern parts of Syria) constitute a deep and increasing concern for Turkey’s national security. This threat became more acute and manifold with the emergence of DAESH in Syria in the beginning of 2014. DAESH terrorism quickly became a threat to regional security as well has had a direct impact on Turkey’s national security.
The situation in Syria progressively deteriorated in from 2013-2015. By the end of 2015, the number of Syrians who sought refuge in neighboring countries surpassed 4.8 million. The death toll reached 245,000. The number of those in need of assistance inside Syria rose to 13.5 million. Over the course of 2015, the regime continued its indiscriminate attacks against innocent civilians and further escalated its campaign of violence through the continued use of heavy bombardment (ballistic missiles, barrel bombs) as well as chemical weapons.
The Republic is continuing its humanitarian efforts to provide shelter to refugees fleeing the conflict in Syria employing an open-door policy without discrimination. As of December 2015, the Republic had spent more than U.S.$8 billion for Syrian refugees in Turkey. As of April 11, 2016, 269,736 Syrian refugees occupied accommodation centers throughout Turkey. The Turkish Government has spent more than U.S.$6 billion for Syrians in Turkey, whereas the total contributions we received bilaterally and multilaterally from the international community so far have been limited to U.S.$417 million.
39
On October 6, 2015, a draft action plan was published reflecting an agreement between the EU and the Republic to cooperate on support of refugees and migration management to address the unprecedented refugee crisis created by the situation in Syria and Iraq (the “Action Plan”). The Action Plan identifies collaborative actions to be implemented as a matter of urgency by the EU and the Republic with the objective to assist the Republic in managing the massive influx of refugees and preventing uncontrolled migratory flows from Turkey to the EU. The Action Plan contemplates immediate implementation to be jointly steered and monitored by the European Commission and the High Representative / Vice President and the Republic through the establishment of the EU-Turkey high-level dialogue on migration. On November 29, 2015, the leaders of the European Union met in Brussels with their Turkish counterparts. In this meeting, the European Union declared that it is committed to provide an initial €3 billion of resources to Turkey for Syrian refugees. On March 18, 2016, the EU agreed on a wide range of proposals with Turkey to manage the migration crisis, including the return of all irregular migrants, accelerating the visa-liberalization process for Turkish citizens and sharing the work of hosting Syrian refugees. According to the agreement, the EU will allocate €6 billion (U.S.$6.6 billion) for reducing illegal migration and making passage to Europe safe. On April 4, 2016 the agreement went into effect and the first group of Syrian refugees arrived in Germany from Istanbul while the first group of migrants, including Syrian refugees, returned to Turkey from Greece.
As a response to the shattering infrastructure and lack of services within Syria, Turkey mobilized its own resources to address and alleviate the suffering of the Syrian people through on-the-ground humanitarian assistance in conformity with international legitimacy and humanitarian principles. The total value of the aid channeled to Syria through zero point operations was in the range of U.S.$535 million as of March 2016. Since July 2014, Turkey has also been cooperating closely with the UN to enable UN cross-border humanitarian operations into northern Syria within the framework of UN Security Council Resolution 2165.
Turkey, aware of this threat, has designated DAESH/ISIL as a terrorist organization since 2005, under its previous names and revised it by its new name the Islamic State of Iraq and the Levant (“ISIL”) on October 10, 2013, has begun to counter the threat posed by foreign terrorist fighters since 2011 and called for source countries to take necessary legal and administrative measures to prevent departure and travel of foreign terrorist fighters from their countries.
Turkey continues to be at the forefront of DAESH/ISIL threat and has seen the most ruthless face of terrorism of DAESH. The bomb attacks of this terrorist organization in major cities of Turkey took 206 lives of Turkey’s citizens and left hundreds of people wounded.
Following the terrorist attack that took place in Suruç, Turkey, on July 20, 2015 and DAESH’s targeting Turkey’s military border post on July 23, 2015, Turkey took necessary military actions against the terrorist organization in Syria. On July 24, 2015, Turkish Air Force hit certain DAESH targets in Syria, based on Turkey’s right of self-defense in accordance with Article 51 of the UN Charter. On December 3, 2015, the Prime Minister of Turkey announced that Turkey is setting up “physical barriers” in the 98 km (61 mile) stretch of land controlled on the Syrian side by DAESH.
On February 13, 2016, Syria’s Democratic United Party (“PYD/YPG”), a terrorist group affiliated with the PKK, located around Azaz in northern Syria, shelled the Akçabağlar base of the Turkish military, located near the Kilis province. Turkish Armed Forces shelled PYD/YPG targets in retaliation under Turkey’s military rules of engagement. On February 16, 2016, at the request of Russia, the UN Security Council discussed Turkey’s shelling of PYD/YPG targets in Syria and expressed their concerns.
On December 18, 2015, the United Nations Security Council unanimously agreed Resolution 2254 endorsing an international roadmap for a Syrian peace process. Turkey has announced that it supports a solution in which Bashar Assad would be transitioned out in the envisaged political transition process through absolute transfer of power to a transitional government body.
Turkey continues to cooperate with its regional and international partners in order to bring an immediate end to the violence in Syria and to initiate a political transition process in line with the legitimate demands of the Syrian people. Turkey remains fully committed to a political solution in Syria and will continue to support all efforts for a genuine political transition based on the principles of the Geneva Communique.
Israel & Palestine
In light of fundamental changes taking place in the Middle East and North Africa in the recent period, finding a just, lasting and comprehensive settlement to the Israeli-Palestinian conflict has become all the more important and urgent. Turkey supports all efforts for the resumption of the direct negotiations for the resolution of the Israeli-Palestinian conflict, through a two-state solution based on pre-1967 borders that would lead to the establishment of an independent, sovereign and viable Palestinian State with East Jerusalem as its capital, to live in peace and security with the State of Israel.
On June 3, 2016, Turkey’s Deputy Prime Minister participated in the Paris Ministerial Meeting where participants met to revive the Middle East peace process.
Turkey has maintained its bilateral program of assistance and its contribution to the international efforts aimed at improving the economic and humanitarian situation in Palestine. It carries out projects relating to health, education, technical assistance, protection of cultural heritage, and water supply in the Palestinian territory through the Turkish Cooperation and Coordination Agency (“TIKA”), Prime Ministry Disaster and Emergency Management Authority, and Turkish Red Crescent. Moreover, Turkey pledged U.S.$200 million for the period of 2014-2017 at the Donors Conference in Cairo, which took place on October 12, 2014 for the reconstruction of, and the humanitarian aid to Gaza. Turkey’s development assistance to Palestine during 2006-2015 period reached U.S.$375 million. In 2014 and 2015, TIKA, Prime Ministry Disaster and Emergency Management Authority and the Turkish Red Crescent provided assistance to Palestine worth approximately U.S.$100 million. In 2016 and 2017, Turkey will contribute U.S.$100 million for the reconstruction of Gaza and the sustainable development of the Palestinian economy.
40
Turkish-Israeli economic relations continued to develop in recent years. The trade volume reached U.S.$4.4 billion in 2011 and U.S.$4.0 billion in 2012. While bilateral trade volume was U.S.$4.6 billion in 2013, it increased to U.S.$5.5 billion in 2014. Bilateral trade volume fell to U.S.$4.2 billion in 2015 due to the decreasing oil prices.
Turkish Airlines is the second airliner in Tel Aviv Ben Gurion Airport, just after El Al. Turkish airliners make a total of 100 reciprocal scheduled flights every week between İstanbul and Tel Aviv.
Israeli tourists visiting Turkey reached 79,140 in 2011, 83,740 in 2012, 164,917 in 2013, 188,608 in 2014, and 224,000 in 2015.
Tunisia
A country which ignited the first spark of democratic transformation in the region, Tunisia has successfully completed its political transition process.
Increasing terrorist activity has posed a threat to Tunisia (with three significant attacks occurring in 2015), which has broader implications for its democratic consolidation efforts and economic well-being. To that end, Turkey provides technical and financial support to Tunisia to ensure lasting stability, democracy and welfare in the country. High Level Strategic Cooperation Council mechanism, established in 2013 between Turkey and Tunisia, has given a fresh impetus to the bilateral relations of the two nations. The first meeting of the Council was held on June 6, 2013 in Tunis. The two countries are working on joint projects that will enable Turkey to share its experience and expertise in the fields of economic development, defense, security, poverty reduction and technical training.
In order to facilitate the transition process, Turkey has extended financial assistance to Tunisia. Turkey provided a financial package worth U.S.$500 million in 2014 (U.S.$100 million grant, U.S.$200 million loan and a U.S.$200 million Eximbank line of credit from Turkish Eximbank) to Tunisia.
Libya
Turkey supported the subsequent Libyan political dialogue process facilitated by the United Nations throughout 2015, aimed at bringing an end to the political division and authority vacuum in Libya. Turkey has engaged with all sides in Libya in order to encourage them to join the dialogue process and come out with a mutually acceptable agreement. Turkey hosted various meetings of Libyan stakeholders throughout 2015. Turkey welcomed the signing of the Libyan Political Agreement on December 17, 2015, which offers a framework for long-lasting peace and stability in Libya. As a show of support, the Minister of Foreign Affairs of Turkey, took part at the signing ceremony held in Skhirat, Morocco. Turkey supports the Government of National Accord in its endeavors to effectively implement the Libyan Political Agreement.
Egypt
Starting from the earliest stages of the Tahrir Revolution back in January 2011, Turkey supported the legitimate demands of the Egyptian people in Egypt. Nevertheless, the coup that took place on July 3, 2013, which led to the ousting of the first democratically elected President, Mohammed Morsi, has adversely affected the bilateral relationship between Turkey and Egypt. In this regard, due to Egypt’s unilateral actions, the level of diplomatic relations were lowered to Chargé d’Affaires and the bilateral agreement on Cooperation on Ro-Ro and Road Transit Transportation. For its part, Turkey continues to pursue a policy of non-hostility towards Egypt.
41
Yemen
Yemen faces severe political, economic, humanitarian and security problems. These challenges require a resolute and unified stance of the international community, particularly the UN. In the face of forceful seizure of power in Yemen by the Houthis in February 2015, Turkey supports the constitutional legitimacy in Yemen represented by President Abd Rabbu Mansour Hadi. Turkey believes that a lasting settlement in Yemen is possible only through peaceful political dialogue and reconciliation, based on the parameters set by the Gulf Cooperation Council Initiative, the National Dialogue Conference outcomes and the UN Security Council Resolution 2216 in 2015.
To assist economic development in Yemen, Turkey pledged U.S.$100 million in 2012. This amount has been allocated for specific capacity-building projects. As the conditions on the ground allow, these projects will be implemented. Turkey also extends humanitarian assistance to Yemen. Turkey has delivered humanitarian aid both in Yemen and in Djibouti where thousands of Yemeni refugees stayed in 2015.
Gulf Cooperation Council
Turkey has strong political, economic, commercial and cultural ties with the Gulf countries, based on deep-rooted common history, common values and interests. Turkey views its relations with the Gulf countries from a strategic perspective and wishes to further develop its relations with the Gulf Cooperation Council (“GCC”). To this end, there is common will and mutual understanding between Turkey and the GCC. In 2008, the Turkey-GCC High Level Strategic Dialogue Mechanism was established. Within this Mechanism, four meetings have been held thus far at Foreign Ministers level.
Moreover, the bilateral relations between Turkey and the Gulf countries have been steadily developing. High-level bilateral visits are frequently held between Turkey and the Gulf countries and several agreements have been signed, which continue to contribute to the expansion of relations in all fields between Turkey and the GCC countries. The first meeting of the Turkey-Kuwait Joint Committee for Cooperation was held on October 24, 2013, among Foreign Ministers. Turkey and Qatar established the Supreme Strategic Committee in December 2014 and held its first meeting on December 2, 2015 in Doha. Moreover, Turkey and Saudi Arabia agreed to form a similar high-level cooperation mechanism during the visit of Turkish President Erdoğan in December 2015.
As a manifestation of its support to the security and stability of the Gulf region, Turkey signed an agreement with Qatar for deployment of Turkish Armed Forces in Qatar in December 2014.
South Caucasus
The South Caucasus occupies one of the unique places in Turkey’s quest for peace, security and prosperity in its neighborhood and beyond. Turkey’s approach to the South Caucasus is shaped by its desire to establish a climate conducive to comprehensive peace and cooperation among all states of the region. The region is home to three of the four protracted conflicts of the OSCE area, namely that of Abkhazia, South Ossetia and Nagorno-Karabakh (“NK”). The conflicts are a destabilizing factor and threat to the security of this crucial region. These conflicts have also prevented the region from realizing its full cooperation potential, which in turn, adversely affects regional wealth and prosperity. In this regard, Turkey is engaged in significant diplomatic efforts for strengthening peace and stability in the South Caucasus region. The Nagorno-Karabakh (“NK”) conflict constitutes a major impediment to the establishment of peace, stability and prosperity and it also prevents the emergence of a cooperative atmosphere in the South Caucasus. The recent ceasefire violations by Armenia against Azerbaijan along the line of contact in the Nagorno-Karabakh region which caused military and civilian casualties confirm once again that the status-quo in the conflict is neither acceptable nor sustainable. Since 1994, there have been numerous unsuccessful attempts to broker peace by the Minsk Group. However, due to the failure of mediation efforts, the region faces increasing risk of renewed hostilities and escalating militarization. Turkey is a member of the OSCE Minsk Group and continues to support the efforts towards the peaceful settlement of the NK conflict within Azerbaijan’s territorial integrity and sovereignty. Turkey is also working on confidence building measures including ones in the transport sector with a view to creating peace, stability and prosperity atmosphere in the region.
The process that Turkey has initiated with Armenia for the normalization of its relations should also be regarded as the reflection of this interest. The signing of the protocols on October 10, 2009 in Zurich was a major achievement in the direction of building a comprehensive and sustainable peace in the South Caucasus. Turkey keeps its adherence to the protocols and remains committed to the normalization process. However, Armenia does not display a similar approach as shown by its latest move of recalling the Protocols from the Armenian Parliament in 2015.
Turkey’s relations with Azerbaijan and Georgia are multifaceted and strategic. The three countries are engaged in substantial regional cooperation projects such as the Baku–Tbilisi–Ceyhan oil pipeline (operational since 2006), Baku–Tbilisi–Erzurum gas pipeline (operational since 2007), Baku–Tbilisi–Kars railway project and the Trans Anatolian Pipeline project. Additionally, Turkey has begun to organize trilateral meetings of the Ministers of Foreign Affairs of Turkey-Azerbaijan-Iran, Turkey-Azerbaijan-Georgia and Turkey-Azerbaijan-Turkmenistan. The latter two meetings are also held at the presidential level.
Turkey’s economic relations with the South Caucasus have been steadily improving. Turkey’s total trade with the countries of the region has amounted to U.S.$4.8 billion in 2015.
42
Central Asia
Central Asia constitutes a strategic aspect of Turkey’s multi-dimensional foreign policy. Turkey shares common historical, linguistic and cultural ties with the Central Asian Republics (“CARs”). Turkey believes that a secure and democratic Central Asia will be in the interest of the region as well as the whole world.
Turkey has High Level Strategic Cooperation Council mechanisms with Kyrgyzstan and Kazakhstan, as well as strategic cooperation with Turkmenistan in areas ranging from energy to trade. Turkey’s trade volume with the countries of the region reached U.S.$6.5 billion at the end of 2015. In addition, Turkish construction companies have completed approximately U.S.$73 billion worth of projects in the region. Turkish direct investments in the region amounted to U.S.$4.5 billion as of the end of 2015. More than 2,000 Turkish companies are operating in the region. Turkey has also provided the region with a substantial amount of development assistance, worth approximately U.S.$1.9 billion in the last 10 years.
Turkey spearheaded the process of The Summits of Turkic Speaking Countries, which has been held since 1992, with a view to increasing solidarity and cooperation among the CARs. This process gained an institutional structure through the Establishment of the Cooperation Council of Turkic Speaking States in 2010. The Council has been conducting various projects, ranging from education to transportation including establishing the International Turkic Academy and Turkish Culture and Heritage Fund in Astana and Baku, respectively.
Given the critical geopolitical location and proximity to Afghanistan, countries in the region may face security challenges. Turkey is closely working with these countries to assist them in their effort to strengthen their security environment.
Afghanistan
Turkey cultivates bilateral ties with Afghanistan in every field and actively contributes to international efforts to establish lasting stability and security and ensure sustainable development in the country.
The Resolute Support Mission (“RSM”) was launched by NATO on January 1, 2015. Turkey is a “framework nation”—a term used by NATO to define a nation accepting the primary responsibility for completing the tasks assigned to a multi-national headquarters groups and/or units. Other framework nations in Afghanistan are the United States, Germany and Italy. Turkey assumed responsibility for managing Hamid Karzai International Airport in Kabul on January 1, 2015. Turkey will continue its lead role until the end of 2017. Former Turkish Ambassador to Afghanistan currently serves as the Senior Civilian Representative of NATO in Afghanistan. Furthermore the Turkish Embassy in Kabul is the NATO Contact Point Embassy for the 2015-2016 period.
The aggregate amount of Official Development Aid (“ODA”) of Turkey to Afghanistan between 2011 and 2015 is U.S.$962 million. ODA towards Afghanistan mainly focuses on education, health, water and water sanitation and transportation.
The largest part of Turkey’s development assistance is dedicated to education in Afghanistan. Turkey has built more than 100 schools in Afghanistan and is working to establish “Mevlana Celaleddin-i Rumi Turkish-Afghan Women University”. A sum of U.S.$60 million is being allocated to this university from our international pledge to Afghanistan for the 2015-2017 period. Health is the second largest field of Turkey’s development assistance to Afghanistan. As of the end of 2015, more than 250 projects were completed in this field with 17 hospitals or clinics built or repaired. Thus far, approximately 4 million Afghans have been served by hospitals, clinics and mobile health clinics built/repaired or operated by Turkey.
At the Tokyo Conference in 2012, Turkey pledged U.S.$150 million to development efforts in Afghanistan for the 2015-2017 period. This pledge was reiterated during the London Conference in 2014.
Turkey also confirmed its pledge of U.S.$60 million for the sustainment of the Afghan National Defense and Security Forces (“ANDSF”) for the 2015-2017 period in NATO’s Chicago Summit in 2012.
As a part of its capacity building assistance in the field of security in Afghanistan, Turkey organizes comprehensive training programs for the Afghan National Army (“ANA”) and Afghan National Police. Since 2011, 1,956 Afghan police cadets were trained in 4 terms of a six-month program. Likewise, a total of 494 Afghan female police cadets were trained since 2011.
The Trilateral Summit Process, launched at Turkey’s initiative in 2007, has evolved into a concrete platform for multidimensional cooperation among Turkey, Pakistan and Afghanistan. The process has three dimensions: political dialogue, security cooperation and development partnership. It allows for the development of multidimensional cooperation in areas such as economy, development, security, education and training, while enabling enhanced contacts across a wide spectrum, including among parliamentarians, businessmen and members of the media. The Eighth Summit meeting was held in Ankara in February 2014.
43
Turkey also continues to encourage regional cooperation through the Heart of Asia-Istanbul Process. This Process, which was initiated by Turkey and Afghanistan at the Istanbul Conference for Afghanistan on November 2, 2011, serves as a regional cooperation platform with Afghanistan at its center, engaging regional countries in political dialogue and practical cooperation through the implementation of confidence building measures (“CBMs”). Turkey takes part in the implementation of all CBMs and leads the Counter Terrorism CBM together with Afghanistan and the United Arab Emirates. Turkey organized a “Defense Against Suicide Bombing” course under the Counter-Terrorism CBM and the Regional Technical Group meeting in 2015 with a view to plan future activities. The fifth Ministerial Conference of the Process was held in Islamabad, on December 9, 2015.
Asia-Pacific
In line with its multi-dimensional foreign policy and in view of the growing economic and political significance of the Asia-Pacific, Turkey has adopted policies geared towards a more constructive relationship with the region. The main elements of the policy include, fostering economic and trade relations, enhancing political dialogue, establishing necessary legal frameworks and strengthening cultural ties.
Bilateral relations with the G-20 members of the region, namely Australia, China, Indonesia, Japan and the Republic of Korea remain strong both economically and politically. Since 2014, Turkey has successfully established strategic relations with six countries in China, Japan, Indonesia, Korea, Malaysia and Singapore.
Turkey’s economic relations with the Asia-Pacific region followed global trends towards increased trade and investment with the countries in the region. The total trade between Turkey and East Asian countries (China, Japan, Korea) reached U.S.$38.4 billion in 2015. Trade with ten ASEAN members was U.S.$7.8 billion Dollars in 2015.
Major items exported to Asia-Pacific are salt and sulphur, ores, slag and ash, nuclear reactors, boilers, machinery and mechanical appliances, inorganic chemicals, vehicles other than railway or tramway rolling-stock, mineral fuels and oils, and iron and steel. Major items imported from Asia-Pacific are electrical machinery and equipment, nuclear reactors and boilers, plastics and articles, mineral fuels and oils, vehicles other than railway or tramway rolling-stock, iron and steel, organic chemicals, and optical machines.
Turkey aims to liberalize its trade with the region. Turkey-South Korea FTA has been in force since May 2013. Turkey-Malaysia Free Trade Agreement (a “FTA”) came into force in August 2015 and is the first FTA with an ASEAN member. Turkey-Singapore FTA was signed in November 2015.
Turkey’s Dialogue Partnership with the Shanghai Cooperation Organization in June 2012 is another example of its opening to the Asia-Pacific region, as are the signing of the ASEAN Treaty of Amity and Cooperation in 2010, a turning point, and its active participation in the Pacific Islands Forum as Post-Forum Dialogue Partner.
Turkey regards ASEAN as the key organization in Southeast Asia and continues to develop new partnerships will all its members. Today, the Turkish Embassy in Jakarta is accredited to ASEAN. Turkey will continue its engagement with the new ASEAN Economic Community in sectors. Its application to ASEAN Secretariat in Jakarta in December 2015 to form a Sectoral Dialogue Partnership, once approved, will lead to stronger dialogue and sectoral cooperation.
Turkey’s involvement in development in the Asia-Pacific region is relatively new. Turkish Cooperation and Coordination Agency has increased the number of its development projects and strengthened its presence by opening offices in Yangon, on February 1, 2013, and Manila, on April 8, 2015.
Turkish Airlines flies to all major capitals in the Asia-Pacific region. As of the end of 2015, from its hub in Istanbul, the national flag carrier operates 196 flights to the region. The number of tourist arrivals to Turkey from the Asia-Pacific countries reached 1.2 million people in 2015.
Middle Corridor/Silk Road/Belt and Road
Turkey signed the Memorandum of Understanding on Aligning the Silk Road and the 21st Century Maritime Silk Road and the Middle Corridor Initiative between the Government of the Republic of Turkey and the Government of the People’s Republic of China (the “Middle Corridor Initiative”) on November 14, 2015, in Antalya, during the G-20 Summit.
The Middle Corridor links Turkey, the Caucasus and the Central Asian Republics via crossing the Caspian Sea. The Marmaray tube crossing under the Bosporus Bridge has already been built and links Europe and Asia. The opening ceremony of the third bridge (Yavuz Sultan Selim) was held on August 26, 2016. Another big tube link under the Bosporus is being constructed. The third bridge, 3 Level Bosporus Tunnel and the new international airport of Istanbul are also under construction and will be part of an intermodal transport linkage between Europe and Asia. Once the Baku-Tbilisi-Kars railway project becomes operational, at the end of 2016, an uninterrupted railway line will connect Beijing to London through the Caspian Sea and the Bosporus.
44
Turkey believes that the Middle Corridor Initiative and the “Belt and Road” will contribute to regional development, welfare, cultural exchange and enhance people-to-people contacts between Turkey and China. It will also provide new employment opportunities and energy security. Thus, Turkey supports integration projects in the fields of transportation, logistics, investment, energy and trade that would contribute to the realization of the “Modern Silk Road”.
Africa
In recent years, Turkey’s relations with the region have been transformed into a mutually reinforced political-economic partnership.
The partnership was further strengthened by the Second Turkey-Africa Partnership Summit held in Malabo, Equatorial Guinea, in November 2014. During the Summit, a framework for Turkey-Africa Partnership for 2014-2019 was outlined.
Turkey pursues a multilayered policy in Africa, aiming to establish close political relations by intensifying bilateral high level visits and defending the rights of various African nations at the bilateral and multilateral level, assisting certain African countries to overcome economic difficulties through trade, investment and humanitarian assistance; when duly requested, playing a role through diplomacy in the settlement of conflicts and disputes, supporting progress in the areas of democracy and good governance, supporting international and regional organizations in their efforts towards peace and stability, and participating in seven out of nine peacekeeping missions in the continent.
The number of Turkish embassies in Africa was only 12 in 2002, but as of the end of 2015, there are 39. Similarly, African countries have opened several embassies in Turkey in the past decade. Currently, 32 African countries have embassies in Ankara.
Turkey’s trade volume with Sub-Saharan Africa reached U.S.$6.0 billion in 2015. Overall trade volume with the entire African continent reached U.S.$17.5 billion in 2015. Major items exported to Africa are iron and steel, nuclear reactors, boilers, machinery and mechanical appliances, mineral fuels and oils, and electrical machinery and equipment. Major items imported from Africa are mineral fuels and oils, jewelry and precious metals, cocoa, plastics and articles, copper and articles, and iron and steel.
In line with the developing relations, the value of Turkish direct investments to Sub-Saharan African countries is also steadily increasing. Many being exemplary of their kind in a number of African countries, Turkish investors employ local labor force, use home-produced resources and export final products to third countries. Total Turkish investment in Africa is estimated to be around U.S.$6.2 billion. Turkey, under various cooperation schemes, has been trying to share its experience in the fields of agriculture, health, education, energy, tourism and environment, as well as supporting small and medium size enterprises.
TIKA, with its 15 coordination offices across the continent, is the key governmental agency carrying out humanitarian and development assistance in most of the African countries. Turkey has substantially increased its official development assistance to the African countries. While having provided U.S.$269.8 million in 2011, Turkish official development assistance to Africa reached U.S.$383.3 in 2014. Turkey has also become a prominent country in humanitarian activities across the continent ranging from Somalia to Niger and Sudan.
Turkish Airlines has become a major international airline connecting the continent to the world with a total of 48 flights from Istanbul to various cities across the continent.
Turkey has been providing several scholarships to African students. For the 2015-2016 academic year alone, 1239 scholarships have been allocated to students from the continent. As of the end of 2015, there are 5437 students in higher education and 116 visiting professors/research assistants from African countries.
Latin America
Turkey firmly believes in the importance of frequent high-level visits and entering into agreements in order to complement the legal framework of its relations with Latin America. Two official Presidential visits from Ecuador and Chile took place in in Turkey 2012 and, in 2013, the President of Mexico visited Turkey. During the visit, relations between Turkey and Mexico were elevated to the level of strategic partnership and Mexico became Turkey’s second strategic partner in the region following Brazil. President Recep Tayyip Erdoğan visited Colombia, Cuba and Mexico from February 9-13, 2015. The visit was the first presidential tour to Latin America from Turkey in the last 20 years.
45
Turkey’s economic and commercial relations with the region increased in recent years. The average trade volume for the 2011-2015 period was U.S.$7.8 billion. Major items exported to Latin America are iron and steel, vehicles other than railway or tramway rolling-stock, nuclear reactors and boilers, ships, boats and floating structures, and mineral fuels and oils. Major items imported from Africa are mineral fuels and oils, oil seeds and oleaginous fruits, miscellaneous grains, seeds and fruit, industrial or medicinal plants, straw and fodder, ores, slag and ash, vehicles other than railway or tramway rolling-stock, copper and articles, nuclear reactors and boilers, and iron and steel.
Turkey opened embassies in Quito, Ecuador in 2012, Santo Domingo, Dominican Republic in 2013, and in San Jose, Costa Rica and Panama in 2014 and Guatemala City in 2015, in addition to the existing eight Embassies in 2011, and a Consulate General in Sao Paulo. Latin American countries (“LAC”) increased their representation in Turkey. The number of LAC resident Embassies in Ankara reached 11 at the end of 2015, up from 9 at the end of 2011. Moreover, TIKA opened its Coordination Office in Mexico City. Through such enhanced representation, Turkey is better equipped to further its relations and cooperation in the region.
Chile became the first country in the region with which Turkey has concluded a Free Trade Agreement. Turkey is currently negotiating similar agreements with Mexico, Colombia, Peru and Ecuador. While building closer ties with the countries of the region and diversifying relations on a bilateral basis, Turkey has also sought to strengthen its cooperation with regional organizations. Turkey enjoys permanent observer status in the Organization of American States, the Association of Caribbean States, the Pacific Alliance and Central American Integration System. Furthermore, Turkey established a Cooperation and Consultation Mechanism with the Caribbean Community, a Political Dialogue and Cooperation Mechanism with Mercosur countries and a Consultation Mechanism with the Community of Latin American and Caribbean States Quartet. The Turkish National Assembly has applied for observer status to the Latin American Parliament, which is an umbrella regional parliamentary organization.
46
ECONOMY
After the 1980s, significant progress was made in Turkey towards establishing a full-fledged market economy. In this respect, a radical policy shift from government intervention and import substitution to a greater reliance on market forces and trade liberalization was necessary. In order to complete this process, international capital markets were entirely liberalized in 1989. In addition, a Customs Union covering Turkey’s industrial product and the last stage of the association agreement between Turkey and the European community both began in 1996. These reforms contributed significantly to the dynamic growth of the private sector and underpinned the flexibility of the Turkish economy to adapt to both internal and external factors. The success of those reforms implemented in Turkey is also reflected by the strong performance of the Turkish economy in the last decade.
Turkey’s real GDP annual growth rate averaged 4.4% during the period from 2011 to 2015. Over this period, the Turkish economy became more diversified. In particular, the industrial base was broadened, and exports of goods and services grew rapidly. In addition, financial markets expanded and became more sophisticated. Turkey’s long-term gross external debt levels rose in absolute terms from U.S.$214.6 billion in 2010 to approximately U.S.$304.9 billion in 2015. See “Debt-External Debt and Debt Management” for details.
In addition to the registered economy, Turkey has an unregistered economy, which is substantial, though by definition unquantifiable, and has historically not been reflected in the statistics of the Republic. The unregistered economy, which is referred to as “shuttle trade”, includes significant amounts of activity in the agricultural sector and trade by the Republic with states consisting of the Commonwealth of Independent States (CIS) (Armenia, Azerbaijan, Belarus, Kazakhstan, Kyrgyzstan, Moldova, Russia, Tajikistan, Turkmenistan, Ukraine and Uzbekistan). Consequently, trade and other figures may under-report the actual level of economic activity intended to be measured. The Government has been working with the World Bank to bring more untaxed economic activities within the scope of the registered economy, and therefore within the tax base of Turkey. Since 1996, the Government has developed a methodology to account for the portion of the unregistered economy relating to “shuttle trade” with the CIS republics. See “Foreign Trade and Balance of Payments-Current Account”.
In 2015, growth was mainly driven by the increase in domestic demand. External demand’s contribution to growth in 2015 was negative. The unemployment rate in 2015 increased due to the rise in labor force participation. Inflation in 2015 increased due mainly to increases in food prices and unfavorable exchange rates. The current account deficit in 2015 improved due mainly to the decline in oil and commodity prices. The current account is mainly financed through long-term sources and direct capital investments. Domestic debt security yields increased primarily because of the overall increase in global rates and tight liquidity conditions in 2015.
ECONOMIC STIMULUS EFFORTS
On June 4, 2009, the Government announced a new stimulus package that included investment incentives, certain measures to enhance employment and a new credit guarantee fund for small and medium-sized enterprises. On June 18, 2009, Law No. 5909, which enables the Turkish Treasury to transfer up to TL 1 billion of resources to the “Credit Guarantee Fund,” was approved by Assembly and was published in the Official Gazette on June 24, 2009 (No. 27268). The purpose of this law is to ensure that the Credit Guarantee Fund is adequately capitalized. The investment incentives program was renewed in 2012 with Decree No 2012/3305 and is still being implemented.
The Action Plan of the Business and Investment Climate Improvement Program became effective on February 16, 2015. The Program intends to increase investments by improving existing mechanisms and is built on four pillars: (1) Improving Bureaucratic Procedures; Improving Judiciary Processes, (2) Facilitating the Provision of Investment Location, (3) Improving the Governance of Business and (4) Investment Climate at Regional Level. The Program targets (i) increasing the share of private sector investment in GDP to 19.3% by the end of 2018 which was 15.9% in 2015, (ii) reaching U.S.$92.8 billion cumulative international direct investment for the 2014-2018 plan period (excluding real estate), and (iii) ranking among the top 40 countries in the Ease of Doing Business Index created by the World Bank Group.
GROSS DOMESTIC PRODUCT
Table 1
| | | | | | | | | | | | | | | | | | | | |
| | | Gross Domestic Product | |
| | | 2011 | | | 2012 | | | 2013 | | | 2014 | | | 2015 | |
At constant 1998 prices | | | | | | | | | | | | | | | | | | | | |
GDP (millions of TL) | | | 115,175 | | | | 117,625 | | | | 122,556 | | | | 126,258 | | | | 131,289 | |
GDP (at current prices) | | | 1,297,713 | | | | 1,416,798 | | | | 1,567,289 | | | | 1,748,168 | | | | 1,953,561 | |
Turkish Lira/US dollar (annual average) | | | 1.670 | | | | 1.793 | | | | 1.902 | | | | 2.187 | | | | 2,719 | |
GDP (at current prices, millions of dollars) | | | 774,188 | | | | 786,283 | | | | 823,044 | | | | 799,370 | | | | 719,967 | |
Population (mid-year, in thousands) | | | 74,224 | | | | 75,176 | | | | 76,055 | | | | 76,903 | | | | 77,738 | |
Per capita GDP (at current prices, in dollars) | | | 10,428 | | | | 10,459 | | | | 10,822 | | | | 10,395 | | | | 9,261 | |
Source: TURKSTAT
In 2011, in spite of the worsening economic conditions for many countries in Europe, notably in the first half of the year, the economy grew at a strong pace, mainly driven by credit expansion and favorable external funding conditions. In the first half of 2011, value added of the agricultural sector, industrial sector and services sector increased by 7.5%, 11.9% and 10.5% respectively, and GDP growth rate was 10.8%. However, such an increase in the domestic economy raised concerns for a potentially large current account
47
deficit. Therefore, the Central Bank of the Republic of Turkey and Banking Regulation and Supervision Agency took cautionary measures against robust credit growth in order to cool down the economic activity and to shrink the current account deficit. In the second half of 2011, effects of those measures slowed down the pace of growth and the GDP growth rate was 7.0%. At the end of 2011 the sectors’ growth rates were recorded as 6.1%, 9.7% and 9.0% respectively and the annual GDP growth rate was 8.8% which indicate strong economic activity in spite of measures taken. In 2011, agriculture, industrial sector and services sector accounted for 9.0%, 22.5% and 68.5% of GDP respectively.
In 2012, the slowdown in the pace of growth of economic activity continued each quarter. Namely, measures taken in 2011 yielded a gradual decline in domestic demand. Therefore, exports were enhanced through the near and Middle East to circumvent the distress in European markets and the effects of weak domestic demand and to prevent a sharp decline in GDP growth rate. On the other hand, a new investment incentive program was introduced to stimulate production. However, those efforts did not suffice to support aggregate domestic demand, and it shrank by 1.8%, while net exports grew by 4.0% in 2012. On the production side of the economy, agriculture, industrial sector and services sectors grew by 3.1%, 1.8% and 2.4%, respectively. Thus, the annual GDP growth rate was 2.1%. In 2012, agriculture, industrial sector and services sectors accounted for 8.8%, 21.7% and 69.4% of the GDP, respectively.
In 2013, domestic demand recovered somewhat thanks to increases in both private consumption and public investment expenditures which were recorded as 5.3% and 24.1% respectively. Therefore, growth in net exports declined 2.6% due to the recovery in domestic demand. On the other hand, private investment expenditures did not rise sharply and occurred as 0.5%. On the production side, agriculture, industrial sector and services sectors grew by 3.5%, 3.4% and 5.7%, respectively. High value added rises in services sector mainly stemmed from construction and financial intermediation services sectors. In sum, the GDP growth rate was 4.2% in 2013. Agriculture, industrial sector and services sectors accounted for 8.3%, 21.6% and 70.1% respectively.
In 2014, growth rate of domestic demand declined to 1.0%, mainly caused by sluggish increase in private consumption expenditures which was recorded as 1.4% and the 8.2% decrease in public investment expenditures. On the other hand, private investment expenditures could not rise remarkably and recorded only 0.3% growth. Sluggish domestic demand and depreciation in domestic currency bolstered the growth of net exports somewhat and was recorded as 2.0%. On the production side, agricultural sector shrank by 2.1% due to unfavorable weather conditions. Therefore, crop production shrank by 4.8%. The industrial sector carried on its moderate pace and grew by 3.8%. Capital goods production and energy production were the main leading manufacturing sectors which recorded 5.4% and 4.3% growth rates respectively. On the other hand, mining sector’s production growth rate occurred as 7.4% and 5.6% for value added growth rate, which had bolstered the total industrial value added in 2014. The services sector grew by 4.1%, which was mainly fueled by financial intermediation services, professional, scientific and technical activities, education and entertainment activities, which recorded 7.0% and 10.8% growth rates, respectively. Consequently, GDP grew by 3.0% in 2014. Agriculture, industrial sector and services sectors accounted for 8.0%, 22.0% and 70.0% of GDP, respectively.
In 2015, domestic demand recovered rapidly and became the main driver of a 4.0% GDP growth rate, while net exports shrank somewhat. Private consumption and investment expenditures grew by 4.5% and 2.7%, respectively. Similarly, public expenditures contributed buoyant domestic demand. Public consumption and investment expenditures recorded 6.7% and 7.6% growth rates. Thus, total domestic demand grew by 4.2% and net exports decreased by 0.3%. On the production side, favorable weather conditions and base effect elevated agricultural production sharply and agricultural value added recorded 7.6% growth. Industrial value added growth carried on its moderate pace and recorded 3.7% growth rate. The services sectors value added grew by 4.5% in 2015, mainly driven by financial services and professional, scientific and technical activities. Agriculture, industrial sector and services sectors accounted for 8.6%, 21.5% and 69.9% of GDP, respectively.
Table 2
Gross Domestic Product
| | | | | | | | | | | | | | | | | | | | | | | | |
| | | | | | | | | | | | | | | | | | | |
Years | | GDP at
Current
prices
(in millions
of TL) | | | Percentage
change
from prior
year (%) | | | GDP at
Current
prices
(in millions
of US$) | | | Percentage
change
from prior
year (%) | | | GDP at
Constant
prices
(in millions
of TL) | | | Percentage
change
from prior
year (%) | |
2011 | | | 1,297,713 | | | | 18.1 | | | | 774,188 | | | | 5.8 | | | | 115,175 | | | | 8.8 | |
2012 | | | 1,416,798 | | | | 9.2 | | | | 786,283 | | | | 1.6 | | | | 117,625 | | | | 2.1 | |
2013 | | | 1,567,289 | | | | 10.6 | | | | 823,044 | | | | 4.7 | | | | 122,556 | | | | 4.2 | |
2014 | | | 1,748,168 | | | | 11.5 | | | | 799,370 | | | | -2.9 | | | | 126,258 | | | | 3.0 | |
2015 | | | 1,953,561 | | | | 11.7 | | | | 719,967 | | | | -9.9 | | | | 131,289 | | | | 4.0 | |
Source: TURKSTAT
The following table presents the composition of GDP at current prices for the periods indicated:
48
Table 3
| | | | | | | | | | | | | | | | | | | | |
Composition of GDP by Sectors (1) | | 2011 | | | 2012 | | | 2013 | | | 2014 | | | 2015 | |
| | | | | | | | | | | | | | | | | | | | |
Agriculture | | | 9.0 | | | | 8.8 | | | | 8.3 | | | | 8.0 | | | | 8.6 | |
Industry | | | 22.5 | | | | 21.7 | | | | 21.6 | | | | 22.0 | | | | 21.5 | |
Mining | | | 1.7 | | | | 1.7 | | | | 1.6 | | | | 1.6 | | | | 1.4 | |
Manufacturing | | | 18.2 | | | | 17.4 | | | | 17.3 | | | | 17.8 | | | | 17.6 | |
Electricity, Gas, Steam | | | 1.9 | | | | 2.0 | | | | 2.0 | | | | 1.8 | | | | 1.6 | |
Water Supply | | | 0.7 | | | | 0.7 | | | | 0.7 | | | | 0.8 | | | | 0.8 | |
Services | | | 68.5 | | | | 69.4 | | | | 70.1 | | | | 70.0 | | | | 69.9 | |
Construction | | | 5.0 | | | | 4.9 | | | | 5.0 | | | | 5.1 | | | | 5.0 | |
Wholesale and Retail Trade | | | 13.4 | | | | 13.3 | | | | 13.6 | | | | 13.4 | | | | 13.2 | |
Transportation | | | 13.1 | | | | 13.5 | | | | 13.5 | | | | 13.4 | | | | 13.2 | |
GDP Total | | | 100.0 | | | | 100.0 | | | | 100.0 | | | | 100.0 | | | | 100.0 | |
| (1) | Financial intermediation services were indirectly measured and tax-subsidies were distributed to sectors with respect to their sectoral weights. Therefore, the sum of agriculture, industry and services sectors’ shares equals 100%. |
Source: TURKSTAT
The following table presents real growth in output for GDP for the periods indicated:
Table 4
| | | | | | | | | | | | | | | | | | | | |
| | | 2011 | | | 2012 | | | 2013 | | | 2014 | | | 2015 | |
| | | | | | | | | | | | | | | | | | | | |
Agriculture | | | 6.1 | | | | 3.1 | | | | 3.5 | | | | -2.1 | | | | 7.6 | |
Industry | | | 9.7 | | | | 1.8 | | | | 3.4 | | | | 3.8 | | | | 3.7 | |
Mining | | | 3.9 | | | | 0.8 | | | | -3.4 | | | | 5.6 | | | | -2.3 | |
Manufacturing | | | 10.0 | | | | 1.7 | | | | 3.7 | | | | 3.7 | | | | 3.8 | |
Electricity, Gas, Steam | | | 9.0 | | | | 3.4 | | | | 1.3 | | | | 4.1 | | | | 2.4 | |
Water Supply | | | 6.5 | | | | 2.7 | | | | 4.7 | | | | 10.8 | | | | 10.4 | |
Services | | | 9.0 | | | | 2.4 | | | | 5.7 | | | | 4.1 | | | | 4.5 | |
Construction | | | 11.5 | | | | 0.6 | | | | 7.4 | | | | 2.2 | | | | 1.7 | |
Wholesale and Retail Trade | | | 11.2 | | | | 0.0 | | | | 5.1 | | | | 1.9 | | | | 2.1 | |
Transportation | | | 10.4 | | | | 2.0 | | | | 3.9 | | | | 3.1 | | | | 2.9 | |
GDP | | | 8.8 | | | | 2.1 | | | | 4.2 | | | | 3.0 | | | | 4.0 | |
Source: TURKSTAT
PRINCIPAL INDUSTRIES
Turkey has a well-developed and increasingly diversified industrial sector. Since 1995, industrial production has increased primarily as a result of the expansion of domestic demand since the second quarter of 1995. In addition, decreased import costs as a result of the Customs Union with the EU and an increase in investment contributed to the rapid growth of industrial production.
2010 and 2011 witnessed recovery from the global financial crisis, with the industrial sector’s value added increase amounting 13.9% and 10.0% respectively. Production of total industry and manufacturing industry increased by 12.8% and 14.5%, respectively, in 2010 and by 10.1% and 10.5%, respectively, in 2011. The manufacturing sector capacity utilization rate was 75.4%.
In 2012, the slowdown in the economic activity was reflected in industrial sector. Total industrial production and manufacturing production increased by 2.5% and 2.3%, respectively, while value added of industrial sector was 1.8%. The manufacturing sector capacity utilization rate was 74.2%.
In 2013, thanks to recovery in the domestic economy, industrial production and manufacturing industry production rose by 3.0% and 4.0%, respectively, and the capacity utilization rate was 74.6%. Value added in industry increased by 4.1% in 2013.
In 2014 and 2015, industrial sector carried on its moderate pace. Industrial production rose by 3.6% and 3.2%. Manufacturing industry production rose by 3.2% and 3.6%. Capacity utilization rates were 74.4% and 74.7% in 2014 and 2015. Value added in industry increased by 3.5% in 2014 and 3.3% in 2015.
The following table presents industrial output for products for the periods indicated:
49
Table 5
| | | | | | | | | | | | | | | | | | | | | | | | | | | | | | | | |
| | | (In TL Millions) | | | (% change) | |
| | | 2011 | | | 2012 | | | 2013 | | | 2014 | | | 11/10 | | | 12/11 | | | 13/12 | | | 14/13 | |
| | | | | | | | | | | | | | | | | | | | | | | | | | | | | | | | |
Hard Coal | | | 840 | | | | 876 | | | | 818 | | | | 769 | | | | 5 | | | | 4 | | | | -7 | | | | -6 | |
Lignite | | | 6,330 | | | | 6,816 | | | | 6,246 | | | | 5,927 | | | | 27 | | | | 8 | | | | -8 | | | | -5 | |
Natural Gas | | | 327 | | | | 373 | | | | 348 | | | | 351 | | | | 9 | | | | 14 | | | | 7 | | | | 0,9 | |
Iron Ores | | | 882 | | | | 1,201 | | | | 1,267 | | | | 1,530 | | | | 41 | | | | 36 | | | | 6 | | | | 21 | |
Lead, Zink, Tin Ores | | | 284 | | | | 407 | | | | 566 | | | | 608 | | | | 242 | | | | 43 | | | | 39 | | | | 7 | |
Other Non-Iron Metal Ores | | | 1,112 | | | | 1,501 | | | | 1,152 | | | | 2,159 | | | | 11 | | | | 35 | | | | -23 | | | | 87 | |
Marble and Building Stones | | | 1,402 | | | | 2,100 | | | | 2,681 | | | | 2,430 | | | | 30 | | | | 50 | | | | 28 | | | | -9 | |
Limestone and Gypsum | | | 497 | | | | 538 | | | | 606 | | | | 702 | | | | 24 | | | | 8 | | | | 13 | | | | 16 | |
Granules and Pebble Stones | | | 1,558 | | | | 2,061 | | | | 3,391 | | | | 2,683 | | | | 53 | | | | 32 | | | | 65 | | | | -21 | |
Other Minerals | | | 922 | | | | 822 | | | | 1,236 | | | | 1,308 | | | | 44 | | | | -11 | | | | 50 | | | | 6 | |
Beef (Fresh or Cooled) | | | 1,720 | | | | 2,755 | | | | 2,652 | | | | 3,425 | | | | 2 | | | | 60 | | | | -4 | | | | 29 | |
Poultry (Fresh or Cooled) | | | 5,675 | | | | 6,719 | | | | 6,840 | | | | 8,397 | | | | 16 | | | | 18 | | | | 2 | | | | 23 | |
Cigarette | | | 2,944 | | | | 3,179 | | | | 3,567 | | | | 4,405 | | | | 8 | | | | 8 | | | | 12 | | | | 24 | |
Cotton Yarn | | | 7,852 | | | | 7,706 | | | | 8,292 | | | | 9,052 | | | | 35 | | | | -2 | | | | 8 | | | | 9 | |
Cotton Weaving Fabric | | | 5,287 | | | | 5,896 | | | | 6,723 | | | | 7,411 | | | | 33 | | | | 12 | | | | 14 | | | | 10 | |
Rough Aluminum | | | 836 | | | | 797 | | | | 766 | | | | 1,081 | | | | 47 | | | | -5 | | | | -4 | | | | 41 | |
Tractor (37 kw < engine power < 59 kw) | | | 817 | | | | 610 | | | | 897 | | | | 1,114 | | | | 72 | | | | -25 | | | | 47 | | | | 24 | |
Automobile (1500 cm3 cylinder volume 3000 cm3 | | | 12,435 | | | | 11,299 | | | | 12,084 | | | | 15,661 | | | | 26 | | | | -9 | | | | 7 | | | | 30 | |
Tankers | | | 61 | | | | 98 | | | | n/a | | | | 430 | | | | -70 | | | | 61 | | | | n/a | | | | n/a | |
Source: TURKSTAT
Note: 2015 data is not available.
ENERGY
Geographically, Turkey is in close proximity to 72% of the world’s energy resources. Thus, it forms a natural energy bridge between the source exporting countries and energy consumer markets and it stands as a key country in ensuring energy security through diversification of supply sources and routes. Therefore, considerations that have gained increased significance in the world today.
Turkey imported 72% of its total energy consumption in 2011 which increased 73% in 2012 and 2013 and 75% in 2014.
50
The total amount of imported oil increased abruptly in 2015, crude oil imports were up 32% over the last three years to 25.1 million metric tons of oil. In 2015, Turkey imported 48.4 bcm of natural gas. Turkey imported 22.5 million metric tons of oil equivalent of coal in 2014.
Turkey’s sources of imported oil have diversified recently. While the share of oil from Iran has been decreasing from 51% in 2011 to 22% in 2015, the proportion of Iraqi oil in total oil imports has risen from 16% to 45%. Dependence on oil from Russia has not changed in the years between 2011 and 2015 and it has corresponded to approximately 12% of total oil import.
The following table presents Turkey’s oil imports by source countries for the years indicated:
Table 6
| | | | | | | | | | | | | | | | | | | | |
| Oil Imports (million tons) | | 2011 | | | 2012 | | | 2013 | | | 2014 | | | 2015 | |
Iraq | | | 3 | | | | 3.7 | | | | 6.3 | | | | 5.7 | | | | 11.4 | |
Iran | | | 9.2 | | | | 7.6 | | | | 5.5 | | | | 5.5 | | | | 5.6 | |
Libya | | | | | | | 1 | | | | 0.6 | | | | 0.1 | | | | — | |
Saudi Arabia | | | 1.9 | | | | 2.8 | | | | 2.8 | | | | 2.1 | | | | 2.4 | |
Russia | | | 2.1 | | | | 2.1 | | | | 1.5 | | | | 0.6 | | | | 3.1 | |
Syria | | | 0.2 | | | | | | | | | | | | | | | | — | |
Azerbaijan | | | | | | | 0.2 | | | | 0.1 | | | | | | | | — | |
Georgia | | | | | | | | | | | 0.4 | | | | 1.8 | | | | — | |
Kazakhstan | | | 1.1 | | | | 1.4 | | | | 1.6 | | | | 1.6 | | | | 0.7 | |
Italy | | | 0.1 | | | | 0.3 | | | | 0.2 | | | | | | | | 0.3 | |
Italy | | | 0.1 | | | | 0.3 | | | | 0.2 | | | | | | | | | |
Nigeria | | | | | | | | | | | | | | | | | | | 0.5 | |
Colombia | | | | | | | | | | | | | | | | | | | 0.9 | |
Others | | | | | | | 0.4 | | | | | | | | 0.7 | | | | 0.2 | |
Total Crude Oil Imports | | | 18 | | | | 19.5 | | | | 19 | | | | 18.1 | | | | 25.1 | |
Petroleum Products Imports | | | 9.1 | | | | 10 | | | | 13 | | | | 14.8 | | | | 14.6 | |
Source: Energy Market Regulatory Authority
Energy development and power generation were priority areas for public investment. In particular, in the second half of 1970s Turkey embarked on a power and irrigation project (known as “GAP”) in Southeastern Anatolia, and Turkey is continuing to develop hydroelectric sources. The GAP project region covers an area of 27,340 square miles, which corresponds to 9.5% of the total area of Turkey. GAP is a combination of 13 major installations primarily for irrigation and hydroelectric power generation. The project includes the construction of 22 dams and 19 hydroelectric power plants on the Euphrates and the Tigris rivers and their tributaries. It is planned that upon completion of GAP, approximately 1.8 million hectares (4.5 million acres) of land will be irrigated, and its power generating capacity will be approximately 7,500 MW (megawatt). As of December 31, 2015, the installed capacity of GAP hydropower plants in operation was 5,534 MW. In addition, as of December 31, 2015, approximately 26.4 % of the total irrigation was completed, 8.9 % was under construction and 64.7 % was at the planning and final design level. The total cost of GAP is expected to be U.S.$25.0 billion (excluding expropriation and overhead costs)
Natural Gas
Natural gas has been used extensively for power generation in Turkey since the late 1980s. Turkey is increasingly utilizing natural gas, both from its own reserves and from abroad, having established long-term purchase contracts with the Russian Federation, Algeria, Nigeria, Iran and Azerbaijan and also buys spot liquefied natural gas (“LNG”) from the market during the winter season in order to maintain a supply-demand balance. Turkey has very limited domestic gas reserves and national gas production represents approximately 1% of the total domestic demand. Consequently, nearly 99% of natural gas demand is satisfied by import ..The Petroleum Pipeline Corporation of Turkey (“BOTAŞ”) is Turkey’s main natural gas importer. At present, BOTAŞ has 9 long-term sale and purchase contracts with 6 different supply sources. In 2015, primary natural gas supply amounted 48 billion cubic meters (bcm) and 41.3 bcm of it was imported by BOTAŞ. By the end of 2015, the breakdown of consumption was 39.6% electricity production, 29.1% industry and 22.9% households, government and trade offices 6.0%. Distribution is carried out by local distribution companies. As of the end of 2015, 66 distribution zones were supplied with natural gas. Recent analysis suggests that natural gas demand will increase parallel to the growth expected in primary energy demand. Forecasts currently indicate that the demand for natural gas will reach 61 bcm in 2020.
In 2015, Turkey imported 26.8 bcm of natural gas from the Russian Federation, 7.8 bcm of natural gas from Iran and 6.2 bcm of natural gas from Azerbaijan. Turkey also imported 3.9 bcm and 1.2 bcm of natural gas from Algeria and Nigeria, respectively in LNG form. On the other hand, in 2015 Turkey also imported spot LNG from Qatar, Nigeria, Norway, Spain, Trinidad Tobago, France, Nigeria and Belgium.
51
The agreement for gas purchase and transmission from Azerbaijan, within the scope of Trans Anatolian Gas Pipeline (“TANAP”) Project, was signed on October 25, 2011. According to the agreement, Turkey will purchase annually 6 bcm Shah Deniz Phase 2 beginning 2018.
Turkey’s domestic natural gas transmission system is approximately 12,963 km in length. As of the end of 2015, the number of firms with a distribution license was 69. The Natural Gas Market Law was enacted on May 2, 2001 to foster competition in the natural gas sector. Pursuant to this law, the BOTAŞ monopoly structure will be gradually decreased; supply, transmission and distribution activities in the natural gas market will be organized; and current legislation and applications will be harmonized with EU regulations.
Since the enactment of Natural Gas Market Law in 2001 , which aimed to liberalize Turkish natural gas market, crucial steps have been taken to transition to a competitive natural gas market in Turkey. In 2012, Energy Market Regulatory Authority (“EMRA”) Board rendered a decision that paved the way for private sector companies to import natural gas from Iraq. The Board Decision allowed the private sector applications for natural gas import license. As a result, one company obtained an import license in September 2013. BOTAŞ did not extend the Natural Gas Sale and Purchase Contract dated February 14, 1986 with Russian Federation. Then, in July of 2012, EMRA Board rendered a decision relating to natural gas import from Russia via Malkoçlar Entry Point for 6 bcm/year. According to this decision, the private sector companies were allowed to submit applications to obtain import licenses, until August 2012. Four applicants ultimately obtained natural gas import licenses. These private companies, began importing natural gas on January 1, 2013. By 2015, the market share of BOTAŞ has decreased to 80% of the total consumption.
In December 2012, EMRA Board decided that all customers should be eligible to choose their supplier. This decision was reinforced with a new EMRA Board decision taken in December 2014 decreasing the eligibility threshold for the household customers to 75,000 m3. In October 2013, EMRA prepared and published the model agreements for natural gas transportation and delivery services in distribution regions. This development will provide transparency to supplier switching process and functioning of the market.
Amendment of Natural Gas Market Law was sent to the Grand National Assembly in August 2014. It is aimed to enhance liberalization and competition of natural gas market and expected to contribute to the process of liberalization of Natural Gas Market within the Draft Natural Gas Market Law.
Restructuring the Electricity Sector
Significant steps have been made towards a fundamental restructuring of the electricity sector. The Electricity Market Law (No. 4628) came into effect in March 2001, with the objective of developing a transparent and competitive electricity market. In March of 2013, the new market law governing the electricity market entered into force. The Electricity Market Law (No. 6446) includes new rules and regulations regarding the electricity market to increase transparency and efficiency in the investment environment. These laws provide a framework for establishing institutions and provide the following structural regulations:
| | • | | Creates and maintains the EMRA, as an independent agency, governed by the Energy Market Regulatory Board, which is responsible for regulatory functions such as licensing, supervising, tariff setting and market monitoring. |
| | • | | Requires participants in defined market segments (generation, transmission, distribution and wholesale (trading and retail)) to be licensed by the EMRA. It also requires that separate accounts be maintained for each licensed activity and location, each with specific rights and obligations. |
| | • | | Requires bilateral contracting between market participants, thus implying a residual balancing mechanism to operate the transmission system; with compulsory pool type wholesale markets excluded. |
| | • | | Provides competition, since March of 2003, for consumers directly connected to the transmission system or with annual consumption of more than 9 Gigawatt Hour (GWh). This eligibility threshold was re-determined in January 2011 as 30,000 kWh, in January 2012 as 25,000 kWh, in January 2013 as 5,000 kWh, in January 2014 as 4,500 kWh in January 2015 as 4,000 kWh and in January 2016 as 3,600 kWh (85.04% theoretical market openness). |
| | • | | Provides for non-discriminatory and regulated third party access to the electricity grid and distribution system. |
Several models such as the Build-Operate-Transfer (the “BOT Model”), the Build-Own-Operate (the “BOO Model”) and the Transfer of Operating Rights (the “TOOR Model”) were developed previously to provide effective means to attract foreign and domestic investment.
As of the end of 2015, There are 17 plants in operation based on the BOT Model with total capacity of 2,309 MW, whereas approximately 6,101.8 MW of capacity was built through the BOO Model. As of the end of the 2015, 60 plants comprising a total of 946.2 MW of capacity are producing electricity based on the TOOR Model. However, the desired outcome was not obtained through application of these models and they were abolished pursuant to the provisions of the new Electricity Market Law, which envisages a competitive electricity market.
52
Auto-production is regulated by Law No. 3096 by Decree No. 85/9799 which allows the Ministry of Energy and Natural Resources (“MENR”) to grant permission to industrial plants, residential complexes with more than 5,000 dwellings, five star hotels, industrial zones, universities and municipal institutions to generate their own electricity. With the amendments in Law Nr. 6446, auto-production license was abolished and accordingly all of these licenses will be changed into generation licenses. As of the end of 2015, 954 Independent Power Producers generated 146.7 TWh, which constituted approximately 56% of Turkey’s total electricity generation.
Turkey consumed 265.7 TWh of electricity in 2015. Installed capacity has surpassed 73.1 GW in 2015 and the increase of electrical energy demand has been realized as 3.3% in 2015. Electricity demand is projected to increase annually between 5% and 6% until 2020. With the Bylaw on Competition for the Applications of the Wind and Solar Power Plant Projects (Official Gazette: December 6, 2013, No. 28843), principles and procedures related to applications for projects to be connected to the grid are determined. Within the context of this Bylaw, eligibility criteria are determined by the declared RES (Wind Power Electricity Generation Plant) contribution margin to be paid per MW of electricity.
According to the Amendment to Law on Utilization of Renewable Energy Resources for the Purpose of Generating Electrical Energy (No. 6094) (Official Gazette: January 8, 2011, No. 27809), a new support structure was introduced with varying prices for different renewable based electricity generation, namely: 7.3 US cents per kWh for hydro and wind, 10.5 US cents per kWh for geothermal and 13.3 US cents per kWh for solar and biomass (including waste gases). In addition, MENR issued the By-law on the Domestic Production of the Equipment Used in Facilities Producing Electrical Power with Renewable Energy Resources published in the Official Gazette dated June 19, 2011 (No. 27969) to provide certain support of between 0.4 to 3.5 US cents per kWh to power plants for the utilization of domestically manufactured technical equipment. Additionally, MENR also issued the By-law on Electricity Generating Facilities Based on Solar Power which identifies the standards, testing and audit methods for equipment used in solar power plants in the Official Gazette dated June 19, 2011 (No. 27969). Moreover, the EMRA issued the By-law on Production of Electricity in Electricity Market without License in the Official Gazette dated July 21, 2011 (No. 28001) which identifies methods and principles to be applied for cogeneration facilities that produce electricity for its own needs and renewable energy based facilities with installed capacity below 500 kW and micro cogeneration facilities which are all exempted from licensing requirements .The new Electricity Market Law (No. 6446) aims to increase the amount of generation plants based on renewable resources, increasing the limit of the unlicensed installed capacity to 1 MW. This law also defines methods and principles for unloading excess electricity into the system. Similarly, EMRA issued the By-law on Certification and Promotion of Renewable Energy Sources which identifies methods and principles for the certification of renewable energy facilities and the establishment and operation of such facilities (Official Gazette dated October 1, 2013 (No. 28782).
Also by the amendment in Regulation on Documentation and Support of Renewable Energy published in Official Gazette on April 29, 2016, renewable participants in support mechanism have responsibility for electricity sales and imbalances. They can sell to the day-ahead market, intraday market and sell by bilateral contracts. The support amount is determined by total of feed-in-tariff plus the difference of sales and the produced amount multiplied by 98% of Day Ahead Market price.
By the end of 2015, the share of renewable energy sources in total electricity generation was 31.5% and total wind capacity reached 4,503.2 MW
Privatization of the bulk of the publicly held installed capacity in the power generation sector was initiated in 2011. Transmission ownership and market operation functions will remain under government control through the Turkish Electricity Transmission Co. (“TEİAŞ”), as a result of the nature of the transmission activity.
The electricity sector in Turkey was dominated by three state-owned companies, covering generation, trading and transmission activities: Turkish Electricity Transmission Corp. (TEİAŞ), Electricity Generation Corp. (EÜAŞ) and Turkish Electricity Trading and Contracting Corp. (TETAŞ). As of end of 2015, the share of publicly held installed capacity stayed below privately held installed capacity due to continuous and increasing private investments in the sector. Moreover, about 72% of electricity generation capacity was held by the private sector in 2015. 28 hydro power plants were privatized with a total capacity of 99,693 MW in 2011, 17 hydro power plants with a total installed capacity of 63,27 MW and 3 thermal power plants (Kangal, Seyitömer, Hamitabat) with a total installed capacity of 2213 MW were privatized in 2013. 5 hydro power plants with a total installed capacity of 5,54 MW and 4 thermal power plants (Kemerköy, Yeniköy, Yatağan, Çatalağzı) with a total installed capacity of 1980 MW were privatized in 2014, 3 thermal power plants (Orhaneli, Tunçbilek, Soma B) with a total installed capacity of 1565 MW were privatized in 2015. The remaining plants are expected to be privatized in the next few years.
While EÜAŞ, a state-owned company, held approximately half of all installed capacity in 2011, its share in total installed capacity reduced 27.8 % by the end of 2015. The total installed capacity of EÜAŞ by the end of 2015 is 20,322 MW. Independent power producers owned more than 59% of total capacity in 2015. BOO, BOT and TOOR power plants (with long term purchase agreements with TETAŞ) had 13% of capacity.
In order to introduce nuclear power into the generation portfolio, projects are being carried out at bilateral level. An intergovernmental agreement (IGA) between the Russian Federation and Turkey concerning cooperation in the area of construction and operation of the nuclear power plant on the Akkuyu Site in Turkey was ratified and came into force on December 27, 2010 (OJ Number 27721). The Akkuyu site has been allocated to the project company established under the terms of the agreement. The IGA establishes build own operate (BOO) model where the project company is responsible for construction and operation of the Akkuyu NPP. On June 25, 2015, EMRA granted Akkuyu NPP a preliminary generation license which is effective for 36 months. It is expected that a construction license application will be submitted in December 2016 following the approval of the Site Parameters Report by Turkish Atomic Energy Authority.
53
An IGA between Turkey and Japan for construction and operation of the second nuclear power plant and development of the nuclear industry in Turkey was ratified and came into force on May 23, 2015 (OJ Number 29364) This IGA establishes a public private partnership between Japanese Consortium (MHI, Itochu and GDF Suez) and EÜAŞ. Sinop site has been designated as the potential candidate for the second nuclear power plant. Site evaluation studies in Sinop continue.
Turkey acknowledges the need to reduce energy dependency and to improve energy efficiency. The Energy Efficiency Strategy Paper (published in the Official Gazette on February 25, 2012, No. 28215) was published in order to increase the effectiveness of energy efficiency studies which had occurred to date and to set concrete objectives for such studies, with an aim to reduce primary energy intensity at least 20% by 2023.
Similarly, according to the 2010-2014 Strategic Plan of the MENR, efficiency is considered a supply source and it is evaluated as a crucial component of security of supply. . Energy efficiency was also one of the main topics covered in the 2014-2019 Strategic Plan of MENR, where related targets and actions were identified to increase energy efficiency.
Electricity Interconnections
Turkey has the following existing interconnections with neighboring countries, and import/export figures are as follows:
| | • | | Bulgaria: There are two 400 kV separate interconnection lines between Hamitabat (Turkey) and Maritsa East (Bulgaria), and each of them currently operate in synchronous parallel mode with the ENTSO-E Continental Europe Synchronous Area (“CESA”). 2,525,418,000 kWh of energy was imported from Bulgaria to Turkey and nearly 163,052,000 kWh of energy was exported from Turkey to Bulgaria through the Hamitabat-Marista East interconnection line in connection with synchronous parallel operation between the Turkish power system and ENTSO-E CESA since 2015. |
| | • | | Azerbaijan (Nahcievan): There is a 154 kV interconnection line between Babek (Nahcivan/Azerbaijan) and Iğdir (Turkey) which is currently operating for import to Turkey in unit direction mode. 3,280 kWh of energy was imported from Nahcevan to Turkey and 2,110 kWh of energy was exported from Turkey to Nahcievan at 15-25 MW peak power through the Igdir-Babek interconnection line in 2015. |
| | • | | Iran: There are two interconnection lines; one of which is a 400 kV Khoy (Iran) and Başkale (Turkey) interconnection line and the other is a 154 kV Doğubeyazit (Turkey) and Bazargan (Iran) interconnection line, Doğubeyazıt-Bazargan interconnection line is not operated due to the expiry of term of the importer company’s license. In 2015, 1,867,695,307 kWh of energy was imported from Iran to Turkey through the Khoy-Baskale interconnection line. |
| | • | | Georgia: Two interconnection lines exist between Turkey and Georgia. The first is a 220 kV Hopa-Batum interconnection line which is operated only in emergency situations. In 2015, 1,389,609 kWh of energy was imported from Georgia and 1,386,662 kWh of energy was exported to Georgia in 2015. The second interconnection line is a 400 kV interconnection line between Borçka (Turkey) and Akhaltsikhe (Georgia) with a DC back-to-back station in Akhaltsikhe was completed in 2013 and operated since 2014. In 2015, via Borçka-Akhaltsikhe interconnection line, 416,064,813 kWh of energy was imported to Turkey and 746,427 kWh of energy was exported from Turkey. |
A Construction Agreement for a new 154 kV transmission line, between Batumi (Georgia) and Muratli (Turkey), with a DC back-to-back station on the Georgian side was signed in 2011 and construction of the Turkish part commenced in 2015. Georgian part of the154 kV Batumi-Muratli Interconnection Line is expected to be complete in 2020.
| | • | | Syria: The 400 kV interconnection line between Birecik (Turkey) and Aleppo (Syria), has been out of service since October 1, 2012 due to technical problems on the Syria side. However, steps have been taken to increase the amount of energy exchanged between Syria and Turkey by installing a 600 MW High-Voltage Direct Current back-to-back station in Şanliurfa (Birecik substation). A successful interconnection depends on end of the war in Syria and the establishment of new relationship with the appropriate institutions. |
| | • | | Iraq: There is a 400 kV interconnection line between PS3 (Turkey) and Zakho (Iraq) which was being used for export to Iraq in isolated mode, but the use of this line was terminated as of January 25, 2011. However, an Interconnection Operation Agreement was signed between TEİAŞ and the Regional Directorate of Iraq and the Ministry of Electricity on June 10, 2013. As of June 12, 2013, the interconnection line has resumed operation. Installation of a second 400 kV interconnection line between Cizre (Turkey)–Mosul (Iraq), is well underway and the portion of the line within Turkish borders is 130 kilometers in length. Cizre -Border section has been completed but the Mosul—Border section is not and Iraqi authorities have stated that they cannot predict when this section will completed. 317,757,760 kWh of energy was exported from Turkey to Iraq through PS3—Karkey (Turkey)—Zakho (Iraq) Interconnection Line in 2015. |
54
| | • | | Greece: There is a 400 kV interconnection line between Babaeski (Turkey) and Philippi Nea Santa (Greece) which is currently operating in synchronous parallel mode with ENTSO-E CESA). 8,366,740 kWh /year of energy was imported from Greece to Turkey and nearly 2,818,614,910 kWh of energy was exported from Turkey to Greece through the Babaeski- Nea Santa interconnection line in connection with trial synchronous operation between the Turkish power system and ENTSO-E CESA in 2015. A Bilateral Agreement was signed in November 2012 between TEİAŞ and IPTO, the independent power system operator of Greece, with respect to the commissioning of a communication channel for providing the real time data exchange realized between the National Load Dispatch Centers located in Ankara and Athens. |
EMRA issued the By-law on Electricity Market Import and Export, published in the Official Gazette dated May 17, 2014 (No. 29003), in order to identify rules and exceptions governing the export and import of electricity through interconnections between the national grid and transmission grids of neighboring countries and to determine methods and principles of capacity allocation in international interconnections.
Trial synchronous parallel operation of the Turkish Power System with the ENTSO-E Continental Europe Synchronous Area (“CESA”) began on September 18, 2010. The trial parallel operation would be finalized in 3 sections. The “limited commercial exchange” period, which is the third and last phase, was delayed until the autumn of 2013. On September 4, 2013, ENTSO-E Regional Group Continental Europe (“ENTSO-E RG CE”) Plenary approved the report emphasizing the success of the technical studies carried out by TEİAŞ for ENTSO-E connection. After the positive results of trial parallel operation, ENTSO-E decided in favor of the permanent synchronous operation of Turkish power system with the Continental Europe system ın April 2014. Following the fulfilment of the standards/obligations set down in the ENTSO-E Operation Handbook by TEIAS, the Long Term Agreement was signed in April 2015, which is a requirement of the ENTSO-E Articles of Association for permanent operation and will make the standards and obligations binding for TEIAS. TEIAS, therefore, became an integral part of European network. On its General Assembly on December 10, 2015, ENTSO-E approved TEIAS’s application to be an observer and an Observer-ship Agreement was signed between TEIAS and ENTSO-E on January 14, 2016.
Crude oil and natural gas pipelines and pipeline projects
As a consequence of the three-year negotiations carried out between Turkey and Azerbaijan, an agreement for gas sale and purchase, transit passage of gas across Turkey, and development of a standalone pipeline was signed on October 25, 2011. According to the agreement, Turkey will purchase annually 6 bcm Shah Deniz Phase 2 gas. The Shah Deniz natural gas production of Azerbaijan will be transported to Europe by this pipeline.
Subsequently on December 24, 2011, Turkey and Azerbaijan signed a Memorandum of Understanding concerning the development of a standalone pipeline. The Trans Anatolian Natural Gas Pipeline (“TANAP”) Project will have initially 16 bcm/a capacity and will be scalable up to 32 bcm/a to accommodate future natural gas volumes originating and transiting from Azerbaijan. The Intergovernmental Agreement and the Host Government Agreement of The TANAP Project were signed on June 26, 2012 and became effective on April 8, 2013. The groundbreaking ceremony of TANAP was held in March 2015 and construction started in April 2015.
First gas flow is planned in 2018 to Turkey and in 2020 to Europe. The TANAP Project is critical to meeting the natural gas demand of both Turkey and Europe. Upon operation, this project would be the first to take gas from the Caspian Sea and transmit it to Europe from Caucasus 6 bcm of the 16 bcm of gas to be taken from the Stage 2 of the Shah Deniz Offshore Gas Field is planned to be used in Turkey and the remaining 10 bcm is planned to be transmitted to Europe through the TANAP Project. On May 30, 2014, a signing ceremony of a package of agreements concerning Shah Deniz gas field and TANAP Project was held in Istanbul. The package contains several agreements related to the increase of Türkiye Petrolleri A.O’s share in Shah Deniz Consortium from 9% to 19% by acquiring all shares of TOTAL, increase of BOTAŞ’s share in TANAP Project Company from 20% to 30% by acquiring 10% of SOCAR’s share, transportation of 6 bcm of gas to be purchased by BOTAŞ from Shah Deniz Phase II via TANAP System. With these agreements, Turkey reaffirmed its commitment to Shah Deniz field and pipeline projects in order to further enhance its supply security and open up the Southern Gas Corridor.
The TANAP Project is designed as the backbone of the Southern Gas Corridor and will contribute to the diversification of natural gas sources for Turkey. TANAP Project will facilitate the realization of the other projects such as South Caucasus Pipeline Expansion and Trans Adriatic Pipeline (“TAP”) within the Southern Gas Corridor.
Once the Southern Gas Corridor is opened by Azerbaijani gas, other gases such as the Turkmen gas originated from Caspian Basin or Iraqi and Iranian gas can also flow through this corridor as well. Regarding the delivery of Turkmen gas to Europe through Turkey, on May 1, 2015, the Ashgabat Declaration, was signed between Turkmenistan, Azerbaijan, Turkey and European Union, and a High-Level Working Group was established to negotiate the roadmap of the Trans Caspian Pipeline.
In June of 2013, the consortium developing Azerbaijan’s Shah Deniz gas field chose TAP over Nabucco West project. The TAP project, first envisioned more than a decade ago, reflects a European Union push for alternatives to Russian gas imports and is expected to start flowing in 2020. The annual gas transportation capacity of the project is planned to be 10 bcm. However, the design of the pipeline will allow for transportation of more than 20 bcm/year of additional gas sources. The TAP project will collect Azeri gas via Turkey and will start on the border of Turkey and Greece, where it will connect with the TANAP project. TAP will continue
55
onshore, crossing the entire territory of Northern Greece, then pass through Albania to the Adriatic coast. The offshore section of the pipeline will traverse the Adriatic Sea and will connect Italy’s gas transportation network in Southern Italy. TAP will be approximately 878 kilometers in length (Greece 550 km; Albania 215 km; Adriatic Sea 105 km; Italy 8 km). TAP is fronted by Swiss company AXPO BP of England, SOCAR of Azerbaijan, Fluxys of Belgium, Enagas of Spain and Snam of Italy. On March 28, 2014, a Memorandum of Understanding relating to the Turkey-Bulgaria Interconnector Project was signed. This memorandum establishes a Joint Working Group in order to prepare a prefeasibility report and action plan for the Project.
The following table presents Turkey’s energy supply (by resource) for the years indicated:
Table 7
| | | | | | | | | | | | | | | | | | | | | | | | | | | | | | | | | | | | | | | | | | | | | | | | | | | | | | | | | | | | |
| | | | Coal (2) | | | Oil | | | Hydro | | | Gas | | | Electricity | | | Other | | | Total | |
| | (mtoe)(1) | | | (%) | | | (mtoe) | | | (%) | | | (mtoe) | | | (%) | | | (mtoe) | | | (%) | | | (mtoe) | | | (%) | | | (mtoe) | | | (%) | | | (mtoe) | | | (%) | |
Production | | | 2011 | | | | 17.86 | | | | 15.6 | | | | 2.55 | | | | 2.2 | | | | 4.50 | | | | 4.0 | | | | 0.65 | | | | 0.6 | | | | | | | | | | | | 6.66 | | | | 5.8 | | | | 32.22 | | | | 28.15 | |
| | | 2012 | | | | 17.01 | | | | 14.2 | | | | 2.40 | | | | 2.0 | | | | 4.98 | | | | 4.1 | | | | 0.53 | | | | 0.4 | | | | | | | | | | | | 7.04 | | | | 5.9 | | | | 31.96 | | | | 26.61 | |
| | | 2013 | | | | 15.45 | | | | 12.8 | | | | 2.48 | | | | 2.1 | | | | 5.11 | | | | 4.3 | | | | 0.44 | | | | 0.4 | | | | | | | | | | | | 8.46 | | | | 7.0 | | | | 31.94 | | | | 26.55 | |
| | | 2014 | | | | 16.36 | | | | 13.2 | | | | 2.47 | | | | 0.08 | | | | 3.5 | | | | 2.8 | | | | 0.41 | | | | 0.3 | | | | | | | | | | | | 8.31 | | | | 6.7 | | | | 31.05 | | | | 25.05 | |
Import | | | 2011 | | | | 17.58 | | | | 15.4 | | | | 36.09 | | | | 31.5 | | | | | | | | — | | | | 36.21 | | | | 31.6 | | | | 0.39 | | | | 0.4 | | | | | | | | | | | | 90.29 | | | | 78.87 | |
| | | 2012 | | | | 22.43 | | | | 18.7 | | | | 37.86 | | | | 31.5 | | | | | | | | | | | | 37.91 | | | | 31.6 | | | | 0.50 | | | | 0.4 | | | | | | | | | | | | 98.70 | | | | 82.18 | |
| | | 2013 | | | | 20.13 | | | | 16.7 | | | | 37.88 | | | | 31.5 | | | | | | | | | | | | 37.35 | | | | 31.1 | | | | 0.64 | | | | 0.5 | | | | | | | | | | | | 96.00 | | | | 79.81 | |
| | | 2014 | | | | 22.54 | | | | 18.2 | | | | 38.52 | | | | 31.1 | | | | | | | | | | | | 40.64 | | | | 32.8 | | | | 0.67 | | | | 0.5 | | | | | | | | | | | | 102.38 | | | | 82.6 | |
Export(3) | | | 2011 | | | | | | | | — | | | | 8.24 | | | | 4.6 | | | | | | | | — | | | | 0.6 | | | | 0.5 | | | | 0.31 | | | | 0.3 | | | | | | | | | | | | -9.15 | | | | -7.99 | |
| | | 2012 | | | | | | | | | | | | 9.56 | | | | 7.9 | | | | | | | | | | | | 0.5 | | | | 0.4 | | | | 0.25 | | | | 0.2 | | | | | | | | | | | | -10.32 | | | | -8.59 | |
| | | 2013 | | | | 0.01 | | | | | | | | 8.35 | | | | 6.9 | | | | | | | | | | | | 0.56 | | | | 0.5 | | | | 0.11 | | | | 0.1 | | | | | | | | | | | | -9.03 | | | | -7.50 | |
| | | 2014 | | | | 0.04 | | | | | | | | 8.80 | | | | 7.1 | | | | | | | | | | | | 0.52 | | | | 0.4 | | | | 0.23 | | | | 0.2 | | | | | | | | | | | | -9.60 | | | | -7.7 | |
Net stock | | | 2011 | | | | — | | | | — | | | | — | | | | — | | | | — | | | | — | | | | — | | | | — | | | | — | | | | — | | | | — | | | | — | | | | 1.10 | | | | 0.97 | |
| | | 2012 | | | | | | | | | | | | | | | | | | | | | | | | | | | | | | | | | | | | | | | | | | | | | | | | | | | | -0.81 | | | | -0.67 | |
| | | 2013 | | | | | | | | | | | | | | | | | | | | | | | | | | | | | | | | | | | | | | | | | | | | | | | | | | | | -0.64 | | | | -0.53 | |
| | | 2014 | | | | | | | | | | | | | | | | | | | | | | | | | | | | | | | | | | | | | | | | | | | | | | | | | | | | 0.11 | | | | 0.09 | |
Statistical Error | | | 2011 | | | | — | | | | — | | | | — | | | | | | | | | | | | | | | | | | | | | | | | — | | | | — | | | | | | | | — | | | | | | | | | |
| | | 2012 | | | | | | | | | | | | | | | | | | | | | | | | | | | | | | | | | | | | | | | | | | | | | | | | | | | | 0.56 | | | | 0.46 | |
| | | 2013 | | | | | | | | | | | | | | | | | | | | | | | | | | | | | | | | | | | | | | | | | | | | | | | | | | | | 2.01 | | | | 1.67 | |
| | | 2014 | | | | | | | | | | | | | | | | | | | | | | | | | | | | | | | | | | | | | | | | | | | | | | | | | | | | -0.04 | | | | -0.03 | |
Total supply | | | 2011 | | | | 35.84 | | | | 31.3 | | | | 30.49 | | | | 26.6 | | | | 4.5 | | | | 4.0 | | | | 36.90 | | | | 32.2 | | | | | | | | | | | | 6.75 | | | | 5.9 | | | | 114.48 | | | | 100.0 | |
| | | 2012 | | | | 39.29 | | | | 32.7 | | | | 31.20 | | | | 26.0 | | | | 4.97 | | | | 4.1 | | | | 37.37 | | | | 31.1 | | | | — | | | | — | | | | 7.26 | | | | 6.1 | | | | 120.09 | | | | 100.0 | |
| | | 2013 | | | | 34.66 | | | | 28.8 | | | | 33.90 | | | | 28.2 | | | | 5.11 | | | | 4.3 | | | | 37.63 | | | | 31.3 | | | | | | | | | | | | 8.99 | | | | 7.5 | | | | 120.29 | | | | 100.0 | |
| | | 2014 | | | | 39.05 | | | | 31.51 | | | | 32.43 | | | | 26.16 | | | | 3.5 | | | | 2.82 | | | | 40.22 | | | | 32.45 | | | | | | | | | | | | 8.31 | | | | 7.1 | | | | 123.94 | | | | 100.0 | |
| (1) | Million Metric tons of oil equivalent. Calorific unit of energy is taken as 860 kcal/10 kWh |
| (2) | Includes coke and petrocoke |
| (3) | Includes marine bunkers. |
Source: MENR
AGRICULTURE
While agriculture has historically been a very important sector in Turkey, the contribution of this sector to the country’s GDP and total employment has diminished in the past few years. Nevertheless, this sector is crucial to the Republic since the agricultural sector employs a significant portion of Turkey’s work force, generates most of the income and employment in rural areas, supplies products to many other sectors, and contributes significantly to total exports of the country.
Turkey became a member of the G20 troika (past, current and future hosts) on December 1, 2013, and its presidency of the G20 commenced on December 1, 2014. Turkey, as President of the G20, hosted the meeting of the G20 Ministers of Agriculture on May 6-8, 2015, in İstanbul. This was the first time G20 Agriculture Ministers had convened since 2011. The G20 Agriculture Ministers expressed their strong support of global efforts to ensure food security and agreed on the importance of establishing economically, socially and environmentally sustainable food systems. The G20 Labor and Employment Ministers Meeting was held on September 3-4, 2015, in Ankara. By adopting the G20 Labor and Employment Ministerial Declaration, the G20 Labor Ministers agreed upon a target to reduce the share of young people who are at most risk of being permanently left behind in the labor market by 15% by 2025. The first G20 Energy Ministers Meeting in the history of the G20 was held in İstanbul on October 2, 2015, focusing on issues relating to development and access in particular. The G20 Leaders’ Summit was held on November 15-16, 2015, in Antalya. After the conclusion of its term as the G20 President, Turkey passed the presidency over to China on December 1, 2015.
In recent years, support schemes that contribute to productivity have been given special importance. Premium payments especially for oil seeds, area-based supports, animal husbandry supports and rural development supports are among the major schemes in the support program. In 2015, those major support schemes have accounted for 27.1%, 28.0%, 28.2% and 10.3% of total support budget, respectively. The distribution of premium payments, area-based supports, animal husbandry supports and rural development supports for the year 2016 are estimated to have constituted 29.6%, 28.3%, 27.0% and 9.0% of the total support budget, respectively.
56
As irrigation investments accelerated with the introduction of the GAP Action Plan (2008-2012), the concentration on regional development action plans increased. A new version of the GAP Action Plan has been finalized for the period of 2014-2018. In addition, to the revised GAP Action Plan (2014-2018), the KOP Action Plan (2014-2018), the DAP Action Plan (2014-2018), and the DOKAP Action Plan (2014-2018) applicable to other priority regions have also been prepared and implementation thereof has begun. The purpose of these plans is to strengthen the social and economic development of Turkey. The agriculture sector plays a crucial role in these Action Plans to create jobs and incomes, improve the standard of living in rural areas and diminish the regional disparities. The principal objectives of the agriculture sector in these Action Plans are to increase productivity, generate more income and employment in rural areas, and provide sufficient and balanced nutrition to the population.
In 2015, agricultural value added increased by 7.6%, compared to a 2.1% decrease in 2014 (in 1998 prices).
Although agricultural production in Turkey is generally less efficient than elsewhere in Europe, Turkey is largely self-sufficient with respect to crops. Turkey is a net exporter country in terms of agricultural raw and processed products trade in the world market. Moreover, there have been significant improvements in the quality and productivity of its crops in recent years. These crops, such as barley, wheat, maize and rice, have become more readily marketable.
The following table presents Turkey’s agricultural output (by crop) for the years indicated:
57
Table 8
Agricultural Output
| | | | | | | | | | | | | | | | | | | | | | | | | | | | | | | | | | | | |
| | | Annual | | | Percentage Change | |
| | | 2011 | | | 2012 | | | 2013 | | | 2014 | | | 2015 | | | 2011/2012 | | | 2012/13 | | | 2013/14 | | | 2014/15 | |
| | | (in thousands of tons) | | | (percentage) | |
Cereal | | | | | | | | | | | | | | | | | | | | | | | | | | | | |
Wheat | | | 21,800 | | | | 20,100 | | | | 22,050 | | | | 19,000 | | | | 22,500 | | | | -7.8 | | | | 9.7 | | | | -13.8 | | | | 18.4 | |
Barley | | | 7,600 | | | | 7,100 | | | | 7,900 | | | | 6,300 | | | | 8,000 | | | | -6.6 | | | | 11.3 | | | | -20.3 | | | | 27.0 | |
Maize | | | 4,200 | | | | 4,600 | | | | 5,900 | | | | 5,950 | | | | 6,300 | | | | -9.5 | | | | -28.3 | | | | -0.8 | | | | 5.9 | |
Pulses | | | | | | | | | | | | | | | | | | | | | | | | | | | | |
Lentils (red) | | | 385 | | | | 410 | | | | 395 | | | | 325 | | | | 328 | | | | 6.5 | | | | 3.7 | | | | 17.7 | | | | 0.9 | |
Chick Peas | | | 487 | | | | 518 | | | | 506 | | | | 450 | | | | 460 | | | | 6.3 | | | | 2.3 | | | | 11.1 | | | | 2.2 | |
Dry Beans | | | 201 | | | | 200 | | | | 195 | | | | 215 | | | | 232 | | | | -0.3 | | | | 2.5 | | | | -10.3 | | | | 7.9 | |
Industrial Crops | | | | | | | | | | | | | | | | | | | | | | | | | | | | |
Sugar Beet | | | 16,126 | | | | 15,000 | | | | 16,483 | | | | 16,743 | | | | 17,893 | | | | -7.5 | | | | -9.9 | | | | -1.6 | | | | 6.9 | |
Cotton (raw) | | | 2,580 | | | | 2,320 | | | | 2,250 | | | | 2,350 | | | | 2,350 | | | | -10.1 | | | | 3.0 | | | | -4.4 | | | | 0.0 | |
Tobacco | | | 45 | | | | 80 | | | | 90 | | | | 70 | | | | 75 | | | | 61.3 | | | | -12.5 | | | | 22.2 | | | | 7.1 | |
Oil Seeds | | | | | | | | | | | | | | | | | | | | | | | | | | | | |
Sunflower | | | 1,335 | | | | 1,370 | | | | 1,523 | | | | 1,638 | | | | 1,688 | | | | 2.6 | | | | -11.2 | | | | -7.5 | | | | 3.1 | |
Soybeans | | | 102 | | | | 122 | | | | 180 | | | | 150 | | | | 160 | | | | 19.4 | | | | -47.4 | | | | 16.7 | | | | 6.7 | |
Rapeseed | | | 91 | | | | 110 | | | | 102 | | | | 110 | | | | 120 | | | | 20.6 | | | | 7.3 | | | | -7.8 | | | | 9.1 | |
Groundnut | | | 90 | | | | 123 | | | | 141 | | | | 124 | | | | 144 | | | | 35.8 | | | | -15.1 | | | | 12.5 | | | | 16.5 | |
Tuber Crops | | | | | | | | | | | | | | | | | | | | | | | | | | | | |
Potatoes | | | 4,613 | | | | 4,795 | | | | 3,948 | | | | 4,166 | | | | 4,831 | | | | 3.9 | | | | 17.7 | | | | -5.5 | | | | 16.0 | |
Dry Onions | | | 2,141 | | | | 1,668 | | | | 1,905 | | | | 1,790 | | | | 1,936 | | | | -18.9 | | | | -14.2 | | | | 6.0 | | | | 8.2 | |
Fruit Bearing Vegetables | | | | | | | | | | | | | | | | | | | | | | | | | | | | |
Watermelons and Melons | | | 5,512 | | | | 5,711 | | | | 5,587 | | | | 5,593 | | | | 5,676 | | | | 3.6 | | | | 2.2 | | | | -0.1 | | | | 1.5 | |
Tomatoes | | | 11,003 | | | | 11,350 | | | | 11,820 | | | | 11,850 | | | | 12,500 | | | | 3.1 | | | | -4.1 | | | | -0.3 | | | | 5.5 | |
Fruits and Nuts | | | | | | | | | | | | | | | | | | | | | | | | | | | | |
Grapes | | | 4,296 | | | | 4,185 | | | | 4,011 | | | | 4,175 | | | | 4,146 | | | | -2.6 | | | | 4.2 | | | | -4.1 | | | | -0.7 | |
Figs | | | 261 | | | | 275 | | | | 299 | | | | 300 | | | | 329 | | | | 5.6 | | | | -8.7 | | | | -0.5 | | | | 9.6 | |
Citrus Fruits | | | 3,614 | | | | 3,475 | | | | 3,681 | | | | 3,784 | | | | 3,806 | | | | -3.8 | | | | -5.9 | | | | -2.8 | | | | 0.6 | |
Hazelnuts | | | 430 | | | | 660 | | | | 549 | | | | 412 | | | | 585 | | | | 53.5 | | | | 16.8 | | | | 25.0 | | | | 42.0 | |
Apples | | | 2,680 | | | | 2,889 | | | | 3,128 | | | | 2,480 | | | | 2,535 | | | | 7.8 | | | | -8.3 | | | | 20.7 | | | | 2.2 | |
Olives | | | 1,750 | | | | 1,820 | | | | 1,676 | | | | 1,768 | | | | 1,980 | | | | 4.0 | | | | 7.9 | | | | -5.5 | | | | 12.0 | |
Tea | | | 1,231 | | | | 1,250 | | | | 1,180 | | | | 1,260 | | | | 1,260 | | | | 1.5 | | | | 5.6 | | | | -6.8 | | | | 0.0 | |
Value Added in Agriculture (at 1998 prices, billion TL) | | | 10,604 | | | | 10,935 | | | | 11,315 | | | | 11,083 | | | | 11,926 | | | | 3.1 | | | | 3.5 | | | | -2.1 | | | | 7.6 | |
| | | | | | | |
Source: TURKSTAT | | | | | | | | | | | | | | | | | | | | | | | | | | | | |
58
SERVICES
The services sector, which accounted for 69.4% of GDP (excluding tax-subsidies and Financial Intermediation Services Indirectly Measured) in 2012 (compared to 68.5% of GDP in 2011) and 58.4% of total civilian employment in 2014, is composed of a wide range of activities including construction, wholesale and retail trade, tourism, transport and communications, as well as finance and commerce, health, education and social services. In 2012, value added in the services sector increased by 2.4%, compared to a 9.0% increase in 2011. The increase in the services sector was attributable to the overall recovery of the Turkish economy and its impact on trade and construction sectors. In 2013 and 2014 value added increases continued in the services sector and the growth rate reached 5.7% and 3.9%, respectively. As of end of 2014, services sector accounts for 70.0% of GDP.
Trade
Wholesale and retail trade is a dynamic sector in Turkish economy. A modernization trend toward more organized market structure has been observed during recent years. By 2015, the share of sector in total employment was 14.0%. By the end of the year 2014, the share of wholesale and retail trade in total number of enterprises and turnover in industry and services (excluding financial services) were 34.0% and 38.0%, respectively. In 2015, wholesale and retail share in GDP accounted for 11.6%.
Tourism
Tourism has become a major growth sector in Turkey’s economy, has contributed significantly to foreign exchange earnings, and has generated demand for other activities including transportation and construction. Government policy has been to support and promote growth in the tourism sector in Turkey by expediting improvements in infrastructure and by facilitating private investment in this sector, including both foreign and domestic investment.
In 2011, the number of foreign visitors increased by 9.9% to 31.5 million and tourism revenues increased by 12.8% to U.S.$28.1 billion. In 2013, the total number of foreign visitors visiting Turkey increased by 9.8% to 34.9 million and tourism revenues increased by 10.1% to U.S.$32.3 billion. In 2014, the total number of foreign visitors travelling to Turkey increased by 5.5% to 36.8 million and tourism revenues increased by 6.2% to U.S.$34.3 billion. In 2015, the total number of foreign visitor visiting Turkey decreased by 1.6% to 36.3 million and tourism revenues decreased by 8.3% to U.S.$31.5 billion. In 2015, according to the World Tourism Organization (“UNWTO”), Turkey ranked 6th in tourist arrivals in the world, and 12th in tourism revenues. Additionally, in 2015, Turkey’s international tourism expenditures were U.S.$5.4 billion while its tourism revenues were U.S.$31.5 billion, ranking Turkey 5th among countries by surplus on the travel balance.
In 2013, Turkey’s methodology for measuring tourism statistics, revenues and expenditures was revised to be more in line with the methodologies recommended by Eurostat and UNWTO.
The following table presents overall foreign visitor arrivals, receipts and the percentage change in receipts for the years indicated:
Table 9
| | | | | | | | | | | | |
| | | Total Foreign
Visitor Arrivals | | | Total Receipts | | | % Increase in Total Receipts | |
Year | | (in thousands) | | | (in millions of US dollars) | | | (percentage) | |
2011 | | | 31,456 | | | | 28,116 | | | | 12.8 | |
2012 | | | 31,783 | | | | 29,351 | | | | 4.4 | |
2013 | | | 34,910 | | | | 32,309 | | | | 10.1 | |
2014 | | | 36,838 | | | | 34,306 | | | | 6.2 | |
2015 | | | 36,245 | | | | 31,465 | | | | -8.3 | |
Sources: CBT, Ministry of Culture and Tourism
Transport and Communications
Since its liberalization in 2004, the telecommunications sector has experienced rapid growth. As of 2013, 2014 and 2015, the value of the telecommunications market reached approximately U.S.$17.3 billion, U.S.$16.2 billion and U.S.$14.6 billion, respectively. Even though growth rates of the market, in Turkish Liras terms, are 5.0%, 8.2% and 11.5% in 2013, 2014 and 2015, respectively, the contraction in U.S. dollar terms is the result of depreciation of the currency. A total of 930 authorizations were granted to 582 telecommunications operators as of May 27, 2016.
59
The usage of fixed and mobile broadband services is steadily increasing in Turkey while fixed telephone usage has been declining since 2006. Mobile telephone (GSM + 3G) penetration is 93.6% and fixed line telephone use declined to 14.4% as of December 2015. The use of broadband services in Turkey increased drastically in the last few years. As of December 2015, total broadband penetration is 61.7% and mobile broadband use reached 49.6%.
4G mobile broadband services were introduced in April 2016 and 3 telecommunication operators provide these services. As of May 30, 2016 the number of active 4G users reached 12.1 million.
In 2010 and 2011, the total output in transportation increased by 11.0% and 10.4% in real terms and accounted for 12.4% and 13.1% of GDP at current prices, respectively, while information/communication sector grew by 4.7% and 9.2% in real terms and accounted for 2.5% and 2.2% of GDP at current prices. In 2012, value added in transportation grew by 2.0% and accounted for 13.5% of GDP at current prices, while information/communication sector grew by 8.5% in real terms and accounted for 2.3% of GDP. In 2013, the growth rate in transportation sector was 3.9% and share in GDP was 13.5%, while information/communication sector’s growth rate and share was 2.8% and 2.2%, respectively. In 2014, the growth rate in transportation sector was 3.1% and share in GDP was 13.4%, while information/communication sector’s growth rate and share was 3.3% and 2.1%, respectively. In 2015, the growth rate and share in GDP were 2.9% and 13.2%, respectively, for the transportation sector and 3.3% and 2.0%, respectively, for the information/communication sector.
Construction
The importance of the construction sector is underscored by the role of housing, particularly by the activities of the Mass Housing Administration, the development of industrial facilities and commercial buildings, and the implementation of public infrastructure improvements. Also, domestic and international contracting and engineering services are important to the value added and employment potential of Turkey. With its strong knowledge, experience and human resource capacity, the Turkish construction and contracting services sector is competitive in foreign markets.
The construction sector grew by 11.5% in 2011, 0.6% in 2012, 7.4% in 2013, 2.2% in 2014 and 1.7% in 2015. The construction and contracting sector maintains a competitive position in certain foreign markets, especially in North Africa, Middle East and CIS. Its market share has increased from around U.S.$1 billion in 2000 U.S.$22.4billion in 2015. The total contracting amounts in 2011, 2012, 2013, 2014 and 2015 were U.S.$23.0 billion, U.S.$29.8 billion, U.S.$30 billion, U.S.$ 26.5billion and U.S.$22.4 billion, respectively.
EMPLOYMENT AND WAGES
The total civilian labor force in Turkey was 29,678 thousand people in 2015. Turkey has a large pool of unskilled and semi-skilled workers. Turnover in the labor force has been high in certain industries, particularly in those that are labor-intensive. During the period from 2008 to the end of 2015, the total labor force increased at an average annual rate of approximately 3.77%.
Total civilian employment was 26,621 thousand in 2015, of whom approximately 20.6% were employed in agriculture, 20% in industry and 59.4% in services. Moreover, in 2015, the labor force participation rate was at 51.3%, compared to 50.5% in 2014.
There were approximately 3,440,000 public sector workers at the end of 2014. The rate of unemployment was 10.3% in 2015, compared to 9.9% in 2014.
The following table sets forth information with respect to the labor force and employment in Turkey for the dates indicated:
Table 10
| | | | | | | | | | | | | | | | | | | | |
| | | Employment (in thousands) | |
| | | 2011 | | | 2012 | | | 2013 | | | 2014 | | | 2015 | |
Civilian labor force | | | 25,594 | | | | 26,141 | | | | 27,046 | | | | 28,786 | | | | 29,678 | |
Civilian Employment | | | 23,266 | | | | 23,937 | | | | 24,601 | | | | 25,933 | | | | 26,621 | |
Agriculture | | | 5,412 | | | | 5,301 | | | | 5,204 | | | | 5,470 | | | | 5,483 | |
Industry | | | 4,842 | | | | 4,903 | | | | 5,101 | | | | 5,316 | | | | 5,331 | |
Services | | | 13,012 | | | | 13,733 | | | | 14,296 | | | | 15,147 | | | | 15,806 | |
Unemployed | | | 2,328 | | | | 2,204 | | | | 2,445 | | | | 2,853 | | | | 3,057 | |
Unemployment rate (%) | | | 9.1 | | | | 8.4 | | | | 9.0 | | | | 9.9 | | | | 10,3 | |
Source: TURKSTAT
The following table sets forth information on the employment rate with respect to age and gender in Turkey for the dates indicated:
60
Table 11
| | | | | | | | | | | | | | | | | | | | | | | | | | |
| | | Employment Rate% | | | | | Youth* Employment Rate% | |
Year | | Male | | | Female | | | Total | | | Year | | Male | | | Female | | | Total | |
2010 | | | 62.7 | | | | 24.0 | | | | 43.0 | | | 2010 | | | 40.2 | | | | 20.3 | | | | 30.0 | |
2011 | | | 65.1 | | | | 25.6 | | | | 45.0 | | | 2011 | | | 43.4 | | | | 21.2 | | | | 32.1 | |
2012 | | | 65 | | | | 26.3 | | | | 45.4 | | | 2012 | | | 42.5 | | | | 20.7 | | | | 31.5 | |
2013 | | | 65.2 | | | | 27.1 | | | | 45.9 | | | 2013 | | | 43.1 | | | | 21.5 | | | | 32.2 | |
2014 | | | 69.5 | | | | 29.5 | | | | 49.5 | | | 2014 | | | 45 | | | | 22.0 | | | | 33.5 | |
September 2015 | | | 71.1 | | | | 31.0 | | | | 51.1 | | | September 2015 | | | 48.8 | | | | 24.3 | | | | 36.6 | |
| | | | | | | | |
Source: TURKSTAT | | (*) Young people in the 15-24 age group |
The collective bargaining system in Turkey covers workers in the public and private sectors. The public sector includes employees who are defined under Union and Collective Bargaining Law No. 6356 and work for state – owned enterprises.
In 2011, labor costs in the public sector increased by 6.4% (-4.2% in real terms), compared to 2010. Labor costs in the private sector increased by 4.4% (-6% in real terms) in 2011, compared to 2010. Labor costs (including salaries and benefits) for civil servants increased by 12% (0.8% in real terms) in 2011 compared to 2010.
In 2012, labor costs in the public sector increased by 7.2% (1% in real terms), compared to 2011. Labor costs in the private sector increased by 12.1% (5.7% in real terms) in 2012, compared to 2011. Labor costs (including salaries and benefits) for civil servants increased by 13.1% (6.6% in real terms) in 2012, compared to 2011.
In 2013, labor costs in the public sector increased by 9.2% (4.5% in real terms), compared to 2012. Labor costs in the private sector increased by 7.3% (2.7% in real terms) in 2013, compared to 2012. Labor costs (including salaries and benefits) for civil servants increased by 7.3% (2.7% in real terms) in 2013.
In 2014, labor costs in the public sector increased by 8.8% (-1.3% in real terms), compared to 2013. In 2015, labor costs in the public sector increased by 12.3% (6.6% in real terms), compared to 2014. Labor costs in the private sector increased by 10.3% (0.1% in real terms) in 2014, compared to 2013. Labor costs (including salaries and benefits) for civil servants increased by 11.2% (0.9% in real terms) in 2014 and 7.6% (2.2% in real terms) in 2015.
The following table sets forth the real and nominal changes in costs of labor to public and private employers from the prior year for the public and private sectors and civil servants for the years indicated:
Table 12
| | | | | | | | | | | | | | | | | | | | | | | | |
| | | Changes in Labor Costs | |
| | | Public Sector | | | Private Sector(2) | | | Civil Servants | |
Year | | Nominal | | | Real (1) | | | Nominal | | | Real (1) | | | Nominal | | | Real (1) | |
| | | (percentage change) | |
2011 | | | 6.4 | | | | -4.2 | | | | 4.4 | | | | -6.0 | | | | 12.0 | | | | 0.8 | |
2012 | | | 7.2 | | | | 1.0 | | | | 12.1 | | | | 5.7 | | | | 13.1 | | | | 6.6 | |
2013 | | | 9.2 | | | | 4.5 | | | | 7.3 | | | | 2.7 | | | | 7.3 | | | | 2.7 | |
2014 | | | 8.8 | | | | -1.3 | | | | 10.3 | | | | 0.1 | | | | 11.2 | | | | 0,9 | |
2015 | | | 12.3 | | | | 6.6 | | | | — | | | | — | | | | 7.6 | | | | 2.2 | |
| (1) | Deflated by the wholesale price index. Labor costs presented in this table include costs of employment in addition to wages. |
| (2) | Figures represent a selective sample of wages covered by the collective bargaining agreements between TİSK, the confederation of employer unions, and trade unions. |
Sources: Ministry of Development, Turkish Confederation of Employer Associations, TURKSTAT, Ministry of Finance
The salaries of civil servants increased by 4.0% in 2011. The salaries of civil servants increased by 4.0% in first six-month period in 2012 and increased by 3.0% in second half of year. The salaries of civil servants increased by 13.7% in 2012, 7.3% in 2013, and 10.0% in 2014. In 2014, all civil servant salaries increased by a fixed amount (TL 175) and additional increases were made to certain professional groups. In 2015, the salaries of civil servants increased by 3.8%.
The minimum wage for both private and public sector workers increased by 4.7% in the first six months of 2011. The minimum wage for both private and public sector workers increased by 5.91% in the first six months of 2012 and by another 6.09% in the second half of 2012. The minimum wage for both private and public sector workers increased by 4.1% in the first half of 2013 and by an additional 4.4% in the second half of 2013. In 2014, the minimum wage for both private and public sector workers increased by 5.0% in the first half of 2014 and by an additional 6.0% in the second half of 2014. In 2015, the minimum wage for both private and public sector workers increased by 6.0% in the first half of 2015 and by an additional 6.0% in the second half of the year. For 2016, the minimum wage for both private and public sector workers increased by 33.5% and was raised to 1,300 TL for the year.
As of December 30, 2015, there were around 5.3 million workers on minimum wage payroll in Turkey.
61
Law No. 6356, which regulates collective labor agreements, was enacted in 2012. This legislation came into force instead of the Law No. 2821 and 2822. With this new law many arrangements have been implemented to enhance the opportunities of trade union organization to move industrial relations and labor life to modern standards and ILO criteria.
As of July 31, 2016, 1,756,934 employees were members of a trade union (in public), compared to 1,195,102 employees at the beginning of 2011. Moreover, the ratio of civil servants who are union members was 71.64% as of July 31, 2016, compared to 71.32% as of July 31, 2015.
New flexible working arrangements were legalized by Law Code 6715, amending Labor Code 4857, in May 2016. Now, private employment agencies (“PEAs”), permitted by the Turkish Employment Agency, can enter into temporary worker contracts with an employer and assign the PEA’s employee to the new employer. Remote teleworking was added on Labor Code 4857. Now, workers will be able to telecommute.
Also in 2016, new regulations were passed allowing civil servants who recently gave birth to work half of their regular work hours for the first two months for the first birth, first four months for the second birth, and first 6 months for the third birth. Additionally, civil servants who recently gave birth or their spouses can work half of their regular work hours until the child reaches almost six years old. However, the financial and social benefits will be commensurate with the number of hours they would be working.
INFLATION
Falling to a historically low year-end value in 2010, the annual headline inflation further declined in the first quarter of 2011 and decreased to 3.99% by March 2011, the lowest it has been since June 1970. Throughout the year, import prices denominated in Turkish lira increased, mainly as a result of the depreciation of the Turkish lira, which caused core goods inflation to soar in the second half of 2011. Though it did not have an unfavorable outlook, annual inflation of services followed a mild upward trend. Annual food inflation was volatile throughout the year due to the unprocessed food group market and was 12.21% by the end of the year. Energy prices followed an upward trend, which got steeper after the energy price adjustments in the last quarter of 2011. Also, adding to upward price pressures, the tax rate on certain items such as alcoholic beverages and tobacco products increased in the fourth quarter of the year. Additionally, during 2011, the contribution of aggregate demand conditions to disinflation decreased and producer price pressures remained high. The sizable depreciation of the Turkish lira was the main factor causing the year-end target of 5.5% to be exceeded by a wide margin, as annual CPI inflation was 10.45%. Meanwhile, PPI inflation rose to 13.33% and core inflation indicators scaled up.
In 2012, CPI inflation ended the year with a historically low year-end value of 6.2%. The depreciation of the Turkish lira in 2011 for the most part ceased to affect inflation, particularly with respect to durable goods, thus annual inflation in core goods displayed a downward trend across the year. The relatively favorable course of unprocessed food prices was a major factor in reducing inflation. The stable course of the foreign exchange rates, the slowdown in economic activity and the steady course of international commodity prices, excluding agricultural products, throughout the year contributed positively to the inflation outlook. Although services inflation grew slightly during this period, alleviated cost and demand pressures caused the core inflation indicators to trend downwards throughout the year. However, public price increases and tax adjustments, especially in the energy sector, were the leading factors contributing to a worsening inflation. Consumer inflation exceeded the 5% inflation target by 1.16% in 2012, but remained within the uncertainty band. PPI inflation also hit a historically low year-end level of 2.45%, curtailing cost-side pressures on consumer prices throughout the year.
In 2013, consumer inflation increased by 1.2 points year-on-year to 7.4%, overshooting the uncertainty band of the inflation target. Consumer inflation, which soared due to the tax adjustments on tobacco at the beginning of 2013, followed a volatile path in the remaining part of the year amid developments in unprocessed food and energy prices, and ended the mid-year significantly above the value implied by the target. In the second half of the year, the weak course of portfolio flows driven by global uncertainty over the monetary policies in advanced economies led to depreciation of the Turkish lira and caused core inflation indicators to rise with the pass-through effect. Consequently, inflation expectations deteriorated slightly during the last six months of 2013. PPI inflation rose to 6.97% and the course of producer prices suggested that cost pressures on consumer prices increased.
In 2014, annual consumer inflation increased by 0.8 points year-on-year to 8.2%, rising above the uncertainty band around the inflation target. This increase was mostly driven by the depreciation of the Turkish lira as well as the sharp increase in food prices. Throughout the year, inflation followed a volatile course shaped by food price and exchange rate developments. In the first half of 2014, inflation soared due to considerable depreciation of the Turkish lira and surge in food prices and ended the mid-year significantly above the value implied by the target. Despite the slowdown in the second half of the year, thanks to plunging international oil prices and the partial correction in unprocessed food prices, annual inflation ended the year with a high year-end value. Consequently, medium-term inflation expectations followed a downward track in the fourth quarter after trending upward earlier in the year. In line with the outlook for import prices, annual PPI inflation declined to 6.4% in 2014.
62
In 2015, inflation followed a volatile course and ended the year at 8.81%, well above the upper bound of the uncertainty band. In the first half of the year, annual CPI inflation improved compared to the previous year. As of March, annual CPI inflation decreased to 7.61% mainly due to the core goods group while food and services inflation remained at high levels. Thanks to the correction in the unprocessed food group, annual inflation continued to fall in the second quarter and reached 7.2 \%. Meanwhile, depreciation in the Turkish lira limited this fall and annual inflation of core goods and energy groups increased as a result. In the second half of the year, CPI inflation increased significantly mainly due to the accumulated depreciation in the Turkish lira and the adverse outlook in food inflation. Consequently, medium-term inflation expectations also increased in the second half of the year. On the other hand, decline in commodity prices mainly led by oil price developments helped limit exchange rate pressures on inflation. Accordingly, producer price inflation followed relatively a stable course throughout 2015 and was 5.71% by the end of the year.
Uncertainty Band around Target and Inflation Realizations
Table 13
| | | | | | | | | | | | | | | | | | | | |
| | | Dec. 2011 | | | Dec. 2012 | | | Dec. 2013 | | | Dec. 2014 | | | Dec. 2015 | |
Uncertainty Band (upper limit) | | | 7.5 | | | | 7.0 | | | | 7.0 | | | | 7.0 | | | | 7.0 | |
Uncertainty Band (lower limit) | | | 3.5 | | | | 3.0 | | | | 3.0 | | | | 3.0 | | | | 3.0 | |
Realization | | | 10.4 | | | | 6.2 | | | | 7.4 | | | | 8.2 | | | | 8.8 | |
Source: TURKSTAT, CBRT
The following table presents the percentage changes in producer and consumer prices for the years indicated:
Inflation
Table 14
| | | | | | | | |
| | | Producer Price Index | | | Consumer Price Index | |
| Year | | (percentage change) | | | | |
2011 | | | 13.3 | | | | 10.4 | |
2012 | | | 2.5 | | | | 6.2 | |
2013 | | | 7.0 | | | | 7.4 | |
2014 | | | 6.4 | | | | 8.2 | |
2015 | | | 5.7 | | | | 8.8 | |
Source: TURKSTAT
EDUCATION
According to the Address Based Population Registration System, the adult literacy rate among individuals aged 6 years and over increased sharply from 80.5% in 1990 to 96.2% in 2015. The rate for men and women was 98.7% and 93.7%, respectively. Over the years, increasing primary school attendance rates have been influential in reducing the illiteracy rate.
According to the Ministry of Development, total student enrollment in the educational year 2015-2016 is 24.2 million, of whom 4.9% were in pre-primary school, 43.5% were in primary school, 23.9% were in secondary school and 27.5% were in university. The number of university students continues to increase year after year.
ENVIRONMENT
The current National Development Plan of Turkey has placed sustainable development at its center with a focus on green growth. To protect and improve the quality of the environment, implement sustainable development principles, and internalize green growth approach, strategies and policies have been adopted and projects and programs on strengthening legislation and institutional structure have been implemented.
In July 2016, Turkey presented its report on steps towards the implementation of the 2030 Agenda for Sustainable Development at the United Nations Economic and Social Council, High Level Political Forum on Sustainable Development in July 2016. The report indicated that the land area covered by forests in Turkey is increasing. While total forestland in 1973 was 26.1%, it increased to 26.6% in 1999 and to 27.7% in 2012. At the same time, Turkey’s Greenhouse Gas emissions have also increased, primarily due to economic and population growth, paired with a corresponding increase in energy demand and industrialization. While the ratio of municipal population who benefit from drinking and using water supplies was 95% in 2001, this increased up to 97% in 2014 due to the extension of investments in that area. 75% of municipal population benefited from sanitation systems in 2001, and this rate has increased to 91% in 2014.
63
Turkey is a party to most of the multilateral environmental agreements. Turkey is active in regional environmental initiatives such as the Mediterranean Technical Assistance Program, the Mediterranean Action Plan, the Black Sea Environment Program and Regional Agenda 21, which is a program for continuing development in Central Asian Republics and Balkan countries, pursuant to which these countries will operate under the same agenda regarding environmental issues.
COMPETITION LAW
The Law on the Protection of Competition (Law No. 4054, the “Competition Act”) is the basic legislation which provides the framework for antitrust and merger control rules. The purpose of the Competition Act, which was adopted by the Grand National Assembly of Turkey on December 7, 1994, is (1) to prevent agreements, decisions and practices preventing, distorting or restricting competition in goods and services markets, and (2) to ensure the protection of competition by providing the necessary regulations and performing oversight.
The Competition Act prohibits the following:
| | • | | Agreements and concerted practices between undertakings, and decisions and practices of associations of undertakings which have as their objective or effect, or likely effect, the prevention, distortion or restriction of competition directly or indirectly in a particular market for goods or services (i.e., agreements involving price fixing, market sharing, etc.); |
| | • | | Abuse by an undertaking or association of undertakings of their dominant position in a particular field; and |
| | • | | Mergers or acquisitions that create or strengthen an undertaking’s dominant position and significantly decrease competition. |
The Competition Act has been enforced by the Turkish Competition Authority (the “TCA”) since 1997, when the TCA was formed, and the Competition Board is the decision-making body of the TCA. In addition, the Competition Board has the authority to adopt secondary legislation designed to assist in the implementation of the Competition Act, which is in line with the legislation of the European Union.
The TCA is a stand-alone entity and is granted administrative and financial autonomy. The TCA is a related body of the Ministry of Customs and Trade, but is independent in fulfilling its duties.
The Competition Board has the power to impose an administrative fine of up to 10% of the annual gross revenue of an applicable entity that violates the Competition Act. Moreover, an additional administrative fine of up to 5% of the fine referenced in the previous sentence is imposed on an firm’s/association of firm’s managers or employees who are determined to have had a decisive influence with respect to the violation. Firms or associations of firms or their managers and employees who actively cooperate with the TCA for purposes of disclosing violations of the Competition Act may not be fined or fines may be reduced due to such cooperation. The Competition Act also provides for turnover-based fines for certain procedural violations, such as failure to provide requested information; providing incomplete, false or misleading information; hindering or complicating on-the-spot inspections; executing unauthorized mergers or acquisitions, which are subject to review by the Competition Board, or failure to comply with the decisions of the Competition Board.
Furthermore, the Competition Act empowers the Competition Board to impose structural remedies (i.e., divestiture of certain assets) and behavioral remedies (i.e. elimination of certain conduct such as refusal to deal or amendments to certain provisions in agreements involving resale of goods by dealers) in the event the Competition Act is violated. As a final matter, the TCA is empowered to submit its opinions regarding draft legislation to the relevant administrative and legislative bodies.
The following table presents a summary of the files concluded by the TCA between 2011 and 2015:
Table 15
| | | | | | | | | | | | | | | | | | | | | | | | | | | | | | | | | | | | | | | | | | | | | | | | |
Year | | | | | | | | | | | | | | | | | | | | | | | | | | Competition
Infringement | | | Exemptions
and Negative
Clearance | | | Mergers and
Acquisitions
(including
privatizations) | | | TOTAL | |
2011 | | | | | | | | | | | | | | | | | | | | | | | | | | | | | | | | | | | 283 | | | | 54 | | | | 253 | | | | 590 | |
2012 | | | | | | | | | | | | | | | | | | | | | | | | | | | | | | | | | | | 303 | | | | 50 | | | | 303 | | | | 656 | |
2013 | | | | | | | | | | | | | | | | | | | | | | | | | | | | | | | | | | | 191 | | | | 58 | | | | 213 | | | | 462 | |
2014 | | | | | | | | | | | | | | | | | | | | | | | | | | | | | | | | | | | 163 | | | | 59 | | | | 215 | | | | 437 | |
2015 | | | | | | | | | | | | | | | | | | | | | | | | | | | | | | | | | | | 89 | | | | 35 | | | | 158 | | | | 282 | |
TOTAL | | | | | | | | | | | | | | | | | | | | | | | | | | | | | | | | | | | 1,029 | | | | 256 | | | | 1,142 | | | | 2,427 | |
Source: Competition Authority
64
In 2011, the following legislation was adopted:
| | • | | Articles 3, 20, 22, 27, 30 and 37 of the Competition Act were amended, in part to update provisions regarding the composition of the Board and powers of the President of the TCA in delegating work to TCA staff. |
| | • | | Two guidelines on Communiqué No. 2010/4 were issued. One of the guidelines was with respect to remedies that are acceptable to the TCA and the other was with respect to ancillary restraints in mergers and acquisitions. The purpose of this Communiqué is to determine and announce the mergers and acquisitions which require notification to and authorization by the Competition Board. |
In 2012, the following legislation was adopted:
| | • | | Communiqué on the Procedure for the Applications about Competition Infringements (Communiqué No. 2012/2). The Communiqué determines procedures for the intended applications to the TCA regarding the possible infringements of competition law and procedures for evaluating such applications within the Authority. |
| | • | | Communiqué on the Amendments Made to the Communiqué Concerning the Mergers and Acquisitions Calling for the Authorization of the Competition Board (Communiqué No. 2010/4), (Communiqué No. 2012/3). With this communiqué, the merger notification thresholds have been amended. According to the amended (new) communiqué, authorization of the Board shall be required for the transactions which satisfy either one of the following thresholds: |
(a) Total turnovers of the transaction parties in Turkey exceed TL 100 million, and turnovers of at least two of the transaction parties in Turkey each exceed TL 30 million, or
(b) The turnover in Turkey for the acquired assets or operations in acquisition transactions, or for at least one of the transaction parties in merger transactions exceeds TL 30 million, and at least one of the other transaction parties has a global turnover exceeding TL 500 million.
Communiqué No. 2012/3 also revoked the previous exceptions in the Communiqué no 2010/4 in relation to the affected market.
In 2013, the following legislation was adopted:
| | • | | Block Exemption Communiqué on Specialization Agreements (Communiqué No: 2013/3): The purpose of this Communiqué is to establish the conditions for granting block exemption to specialization agreements between firms from the application of the provisions of Article 4 of the Competition Act. |
| | • | | Communiqué on the Procedures and Principles to be Pursued in Pre-Notifications and Authorization Applications to be Filed with the Competition Authority in Order for Acquisitions via Privatization to Become Legally Valid (Communiqué No: 2013/2): The purpose of this Communiqué is to establish and announce the procedures and principles to be pursued in pre-notifications and authorization applications to be filed with the Competition Authority in order for acquisitions realized by the Privatization Administration or by other public institutions and firms to become legally valid, in accordance with Article 7 as well as Article 27, Paragraph 1, Subparagraph f of the Competition Act. |
| | • | | Guidelines on the General Principles of Exemption: The Competition Act dated July 2, 2005 and numbered 5388 abolished the obligation to notify the Board of the agreements, concerted practices and decisions of associations of firms that are under the scope of Article 4 of the Act. Since the obligation to notify was abolished, in principle, firms and associations of firms should make the assessment for exemption on their own without notifying the Board. The purpose of these guidelines is to draw a general framework about the scope of Article 4 and the principles for the application of the conditions listed in Article 5 as well as to set out the criteria used in the assessment of exemption. |
| | • | | Guidelines on the Assessment of Non-Horizontal Mergers and Acquisitions: The purpose of these Guidelines is to lay down the general principles to be taken into consideration in the initial assessments to be conducted by the Competition Board in relation to non-horizontal mergers and acquisitions. |
| | • | | Guidelines on Horizontal Cooperation Agreements: The purpose of these Guidelines is to establish the principles that shall be taken into consideration in the assessment, within the framework of Article 4 and 5 of the Competition Act, of agreements between firms, decisions of associations of firms and concerted practices with the nature of a horizontal cooperation. |
| | • | | Guidelines on Cases Considered a Merger or an Acquisition and the Concept of Control: A merger by two or more firms or the acquisition of direct or indirect control over all or part of one or more firm by one or more firms or by one or more persons who currently control at least one firm, through the purchase of shares or assets, through a contract or through any other means shall be considered a merger or an acquisition within the scope of Article 7 of the Act, provided there is a lasting change in control. |
In 2014, the following legislation was adopted:
| | • | | Guidelines On the Assessment Of Exclusionary Abusive Conduct by Dominant Firms: These Guidelines were published in order to describe the elements the Competition Board (“Board”) must take into consideration when assessing exclusionary abusive conduct by dominant firms under article 6 of the Competition Act, to increase transparency, and thus to minimize the uncertainties that may arise in the interpretation of the article by the firms. |
65
| | • | | Competition Assessment Guide: the Guide aims to provide a methodology for government agencies in evaluating competitive impacts of draft or existing legislation. It includes a checklist setting forth questions for detecting unnecessary restraints on competition. |
In 2015, no new regulation, communiqué or guideline was published in 2015 by the TCA.
Turkish competition law is parallel to EU competition law and the implementation of competition policy in Turkey is one element of a much larger national initiative to advance beyond the Customs Union Agreement and achieve formal membership in the European Union. The Competition Act covers only antitrust and merger control rules. Regarding legislative alignment with the acquis communautaire in the field of competition rules and administrative capacity of the TCA, the 2015 Progress Report prepared by the European Commission reiterates that Turkey has made progress in adapting the acquis, administrative capacity is high and operational independence of the TCA is satisfactory. The Report, which is very similar to the previous years’ reports, indicated the need to make certain alignments with the acquis in some fields.
The TCA actively attends the meetings of Organization for Economic Cooperation and Development, United Nations Conference on Trade and Development, and International Competition Network on a regular basis, presents written papers and oral presentations, and attends other meetings in the international space. The TCA has signed Memorandums of Understanding with the competition agencies of Republic of Korea (2005), Romania (2005), Bulgaria (2007), Portugal (2008), Bosnia and Herzegovina (2010), Mongolia (2010), Russia (2011), Croatia (2011), Austria (2011), Northern Cyprus (2012), Egypt (2012), Kazakhstan (2013), Ukraine (2013) and Kyrgyzstan (2015), each in an aim to promote cooperation in the field of competition law and policy.
INTELLECTUAL PROPERTY
Turkish Copyright Law No. 5846 (enacted in 1951, as amended in 1995 by Law No. 4110) provides protection for scientific and literary works (including computer programs), musical works, artistic works (including textile and fashion designs), cinematographic works, and derivations. Under this law, an author has the exclusive right to perform, authorize or present his works which fall into one of the above-mentioned categories, including the rights of adaptation, reproduction, distribution, performance presentation and broadcast. This law has a 70-year term of protection for these economic rights and also recognizes moral rights, which include an author’s right to claim authorship of the work and to object to any distortion, mutilation or other modification of their work that would be prejudicial to their honor or reputation.
The main task of the Turkish Patent Institute (“TPI”) is to perform registration pursuant to provisions of relevant acts of industrial property rights, which currently concerns patents and utility models, trademarks, industrial designs, topographies of layout-designs of integrated circuits and geographical indications. In addition, TPI acts as a mediator in the performance of license transactions, acts as an expert before the courts, guides technological transfers and submits such information for the benefit of the public, cooperates with national/international institutions, and ensures the implementation of agreements in the field of industrial property rights.
TPI has prepared strategy documents in coordination with all the relevant governmental and non-governmental institutions on Industrial Property Rights (“IPRs”). Furthermore, specific strategies on Geographical Indications and Design Protection were also prepared after undertaking consultations with all the relevant stakeholders. The Design Strategy Paper and Action Plan was prepared in 2014 and entered into force upon publication in the Official Gazette dated November 2, 2014. The preparations for the National IP Strategy and Action plan were launched in 2013, followed by the preparations of the National Strategy and Action Plan on Geographical Indications. The two latter papers were completed in 2015 and entered into force upon their publication in the Official Gazette dated July 4, 2015.
A founding member of the World Trade Organization (“WTO”), Turkey adopted its national industrial property legislation in 1995. Turkey’s intellectual property legislation was reviewed successfully by the WTO Member States during the Trade Policy Review Mechanism of the WTO, amongst other obligations arising from the WTO Agreements, on March 15-17, 2016.
In April 2016, Turkey’s application to become an International Search and Examination Authority for the patent applications through Patent Cooperation Treaty was approved by the Committee of World Intellectual Property Organization (“WIPO”), a specialized agency of United Nations. The decision will be adopted by the General Assemblies of WIPO in October 2016.
Turkey’s enforcement capacity has been further strengthened because the number of Specialized IPR Courts has increased to 23 as of the end of 2015
The TPI currently administers bilateral cooperation protocols with the Industrial Property Rights Offices of the following countries: Albania, Azerbaijan, Austria, Brazil, Bulgaria, Czech Republic, People’s Republic of China, Denmark, Morocco, France, South Korea, Georgia, Islamic Republic of Iran, Spain, Sweden, Italy, Kirgizstan, Macedonia, Mongolia, Pakistan, Romania, Russian Federation, Serbia, Syria, Tajikistan and Tunisia.
66
Statistics Regarding Industrial Property Rights Applications/Registrations/Grants
Table 16
| | | | | | | | | | | | | | | | | | | | |
| | | 2011 | | | 2012 | | | 2013 | | | 2014 | | | 2015 | |
Number of Patent Applications | | | 10,241 | | | | 11,599 | | | | 12,053 | | | | 12,375 | | | | 13,958 | |
Number of Utility Model Applications | | | 3,244 | | | | 3,788 | | | | 3,541 | | | | 3,568 | | | | 3,583 | |
Number of Trademark Applications | | | 117,723 | | | | 111,143 | | | | 100,608 | | | | 111,544 | | | | 110,679 | |
Number of Industrial Design Applications | | | 7,989 | | | | 8,423 | | | | 8,782 | | | | 9,028 | | | | 8,896 | |
Source: Turkish Patent Institute
Table 17
| | | | | | | | | | | | | | | | | | | | |
| | | 2011 | | | 2012 | | | 2013 | | | 2014 | | | 2015 | |
Number of Patent Granted | | | 6,539 | | | | 7,816 | | | | 8,925 | | | | 8,530 | | | | 10,100 | |
Number of Utility Model Issued | | | 1,976 | | | | 2,299 | | | | 2,037 | | | | 2,561 | | | | 2,767 | |
Number of Trademarks Registered | | | 42,059 | | | | 64,721 | | | | 83,189 | | | | 87,545 | | | | 83,027 | |
Number of Industrial Designs Registered | | | 7,388 | | | | 7,767 | | | | 8,393 | | | | 8,265 | | | | 9,225 | |
Source: Turkish Patent Institute
SOCIAL SECURITY SYSTEM
The pay as you go social security system in Turkey has been run by the Social Security Institution (“SSI”) since 2006. The SSI is responsible for conducting all operations of the active/passive insured and their dependents regarding retirement and health services. In 2008, the social security system was amended by the Social Security and Universal Health Insurance Law (Law No.5510). The most important parameters of the social security system are provided in the table below.
Table 18
| | | | |
| | | Before the Reform | | After the Reform (Law 5510) |
| Retirement Age (women/men) | | 58 / 60 (for new entries) | | Gradual increase to 65 for both genders starting from 2036 |
| | |
Contribution Period • Workers • Others | | 7000 days 9000 days | | 7200 days 9000 days |
| | |
| Valorization of Contribution for SSK and BK | | 100% real GDP growth + 100% CPI | | 30% real GDP growth + 100% CPI |
| | |
| Replacement Rate | | | | |
• Civil servant • Others | | 50% + 1% for each year 3.5% for the first 10 years; 2% for the next 15 years; 1.5% for the remaining years | | 2% for each year |
Source: UT
In addition to eliminating the differences between the services that the insured receive, one of the most important features of the reform was to repress the rapidly growing deficits of the social security system. Total budgetary transfers to the SSI were 4.0% of GDP in 2015.
Table 19
| | | | | | | | | | | | | | | | | | | | |
| Revenues and Expenditures of Social Security Institution | | | | | | | | | | | | | | | |
Billion TL | | 2011 | | | 2012 | | | 2013 | | | 2014 | | | 2015 | |
Revenues | | | 124 | | | | 143 | | | | 163 | | | | 184 | | | | 220 | |
Expenditures | | | 141 | | | | 160 | | | | 183 | | | | 204 | | | | 232 | |
Rev. - Exp. | | | -16 | | | | -17 | | | | -20 | | | | -20 | | | | -11 | |
Budgetary Transfers (BT) | | | 53 | | | | 59 | | | | 71 | | | | 77 | | | | 79 | |
BT as % of GDP | | | 4.1 | % | | | 4.1 | % | | | 4.5 | % | | | 4.4 | % | | | 4.0 | % |
67
Source: Social Security Institution
The goals of the reform in health services are implementation of Universal Health Insurance which covers the entire population, countrywide implementation of family medicine and easier access to all health care services by the insured.
The compulsory unemployment insurance system was introduced in 1999. The Turkish Employment Agency is responsible for all transactions and services related to unemployment insurance. Contribution rates for unemployment insurance are 2% for the employer, 1% for the employee and 1% for the State based on the employee’s gross salary. As of December 31, 2015, the total asset value of the Unemployment Insurance Fund was TL 93.1 billion.
Personal Pension System
Law No. 4632 (Individual Pension Savings and Investment System) (a) establishes the regulation and supervision of the individual pension system which is complementary to the state social security system on the basis of voluntary participation and a fully funded defined contribution, directing individual pension savings to long term investments, (b) improves welfare level during retirement by providing a supplementary pension income, and (c) contributes to economic development by creating long-term resources for the economy and thereby increasing opportunities for employment. The Individual Pension Savings and Investment System commenced on October 27, 2003. As of the end of 2015, there were 18 pension companies, 6,038,432participants and 7,040,375active pension contracts in the system, while the total amount of funds reached TL 42.9 billion (TL 47.9 billion including state match contributions).
According to the Law No. 6327, which came into force in June 2012, the tax deduction incentive was replaced by a state match of 25% for the contributions made by system participants. This match is capped at the annual gross minimum wage for each participant. This new incentive, aiming to increase the effectiveness of the system in attracting pension savings, came into effect on January 1, 2013. Whereas the total number of participants at the end of 2012 was 3,128,130, as a result of the new incentive, the number of new participants who have entered into the system has increased by approximately 3 million between 2013 and 2015.
EXCHANGE RATES AND EXCHANGE POLICIES
The Central Bank of the Republic of Turkey (the “Central Bank” or “CBRT”) continued to implement the floating exchange rate regime in 2011. Amid strong capital inflows to Turkey in the first quarter of 2011, further FX purchase auctions were held with the objective to strengthen the Central Bank’s reserves as much as possible. In the second quarter of 2011, rising concerns over global growth and sovereign debt sustainability in some European countries deteriorated risk appetite and had an adverse impact on capital flows to emerging economies, including Turkey. In view of these developments, the amount to be purchased via daily FX auctions was reduced in May and June, and FX purchase auctions were suspended as of July 25, 2011. Given the heightened uncertainty due to aggravated concerns over global growth and sovereign debt sustainability in some European countries as of late July, with a view to providing the market with FX liquidity, on August 5, 2011, the Central Bank started to hold FX sale auctions, when deemed necessary. In September 2011, the Central Bank announced that the selling amount was set as the maximum daily amount to be sold on the days of FX sales. The amount to be sold could also be lower than the maximum selling amount when deemed necessary. In November, the Central Bank decided to announce the maximum amount of FX that can be sold via auctions on every working day for the subsequent two working days. In December, the Central Bank increased the maximum amount of FX that can be sold within two working days following the daily FX auctions to U.S.$1.70 billion and the amount that can be sold other than exceptions to U.S.$1.35 billion. Starting from January 6, 2012, the Central Bank started to hold intra-day foreign exchange sale auctions when necessary. Given the improving current account balance dynamics following the decisions taken at the Monetary Policy Committee (the “MPC”) meeting on January 24, 2012 as well as the abrupt changes in global conditions, the regular FX sale auctions were suspended as intra-day FX sale auctions proved relatively more efficient and better-suited to meet the objectives of the monetary policy than the regular auctions. Moreover, on October, 18, 2011, December 30, 2011 and January 2 to 4, 2012, direct FX sale interventions were performed in response to unhealthy price formations in exchange rates due to loss of market depth. The last four direct FX sale interventions were conducted in the context of additional monetary tightening which was started on December 29, 2011 as a response to deteriorated inflation outlook and delivered on so-called “exceptional” days in the first half of 2012. Although additional monetary tightening has been implemented mainly via open market operations, it also featured unsterilized (effective) foreign exchange sales and interventions in order to prevent inflation expectations from being adversely affected by exchange rate movements detached from fundamentals.
With a view of providing the market with FX liquidity, FX required reserve ratios were reduced in July, August and October 2011. In addition, interest rates on weekly FX deposits at the FX and Deposit Markets were slightly reduced in August 2011. The maturity of FX deposits that banks can buy from the Central Bank was extended from one week to one month in December 2011. Furthermore, in order to ease FX liquidity in the interbank FX markets, the Central Bank resumed its intervention in the FX Deposit Markets in November 2011.
Moreover, in September 2011, the Central Bank introduced a new facility, Reserve Option Mechanism (“ROM”), which allows banks (and later on other financial institutions) to maintain reserve requirements for Turkish lira liabilities in US Dollar and/or Euro up to a certain threshold. According to this mechanism for each Turkish lira reserve requirement, the banks can bring equivalent FX amount weighted by a factor called Reserve Option Coefficient. In September 2011, this facility allowed banks to maintain FX reserves for Turkish lira reserve requirements up to 10%. This option was first raised to 20% and then 40% in October 2011. In 2012, this option was gradually further raised to 45%, in to 50% in May 2015 and 55% in June 2015. Since this facility is used by the banks almost fully, it increased the FX reserves of the Central Bank.
68
On October 27, 2011, the Central Bank updated the reserve requirement ratios for Turkish Lira deposits for related maturities and set the range between 5% and 11%. In addition, the reserve requirement ratios for foreign exchange deposits and liabilities were adjusted on October 5, 2011, with a range set between 6% and 11% depending on maturity.
On December 28, 2011, the Central Bank announced that, in addition to the daily one-week repo auctions, the Central Bank will start holding one-month (4 weeks) repo auctions every Friday. The one-month repo auctions are to be held in the traditional auction method and each institution’s total bid amount is to be limited to an announced auction amount. Auctions commenced on December 30, 2011. For the period of December 30, 2011 to January 26, 2012, upper limits were set as TL 2.0 billion for the total funding through one-month auctions and TL 3.0 billion for each week’s auction. On May 29, 2012, the MPC decided to set the amount of daily funding via quantity auctions between TL 1.0 and TL 5.0 billion. On June 21, 2012, the MPC decided to keep the amount of daily funding via quantity auctions between TL 1.0 and 5.0 billion until July 19, 2012. The upper limit for each one-month repo auction to be held between June 22 and July 21, 2012 was set at TL 5.0 billion.
On March 29, 2012, the limit for standard gold reserves that may be held to meet reserve requirements for foreign currency liabilities, excluding precious metal deposit accounts, was decreased from 10% to 0%. On June 21, 2012, it was announced that the upper limit for gold reserves that might be held to maintain Turkish lira reserve requirements was raised from 20% to 25%, and banks were allowed to hold Turkish lira reserve requirements in gold over the total amount calculated by multiplying the first tranche corresponding to 20% of Turkish lira reserve requirements by a reserve option coefficient (“ROC”) of “1” and the second tranche corresponding to 5% of Turkish lira reserve requirements by a ROC of “1.5.”
On August 3, 2012, the Central Bank announced certain technical amendments to the Communiqué on Reserve Requirements no. 2005/1 relating to operational processes with respect to reserve requirements. These amendments stipulate that, as is the case with FX reserve requirements, the Turkish lira equivalent of FX reserves maintained for Turkish lira reserve requirements will be calculated by using the exchange rates announced in the Official Gazette on the calculation date; the US dollar reserves held by the Central Bank to maintain Turkish lira reserve requirements will not be less than 50% of total FX reserves; and the carryover limit will be 5%. On September 11, 2012, the Central Bank announced that in order to maintain required reserves consistent with the composition of foreign currency liabilities, banks must maintain their required reserves against their U.S. dollar-denominated liabilities in U.S. dollars only.
In 2011, the amount of FX purchased via FX purchase auctions totaled U.S.$6.45 billion, while the total amount of FX sold through FX sale auctions and direct interventions amounted to U.S.$13.60 billion. Furthermore, in 2012, an FX amount of U.S.$2.46 billion sold through FX sale auctions and direct interventions. Gross FX reserves of the Central Bank excluding gold stood at U.S.$78.46 billion at the end of 2011 and U.S.$84.00 billion on July 13, 2012.
Table 20
| | | | | | | | | | | | | | | | | | | | |
| Central Bank Direct Interventions and Auctions (in million USD) | | Interventions | | | | | | Auctions | |
| | | Purchase | | | Sale | | | | | | Purchase | | | Sale | |
2011 | | | — | | | | 2,390 | | | | | | | | 6,450 | | | | 11,210 | |
2012 | | | — | | | | 1,450 | | | | | | | | — | | | | 1,006 | |
2013 | | | — | | | | — | | | | | | | | — | | | | 17,610 | |
2014 | | | — | | | | 3,151 | | | | | | | | — | | | | 11,200 | |
2015* | | | — | | | | — | | | | | | | | — | | | | 12,366 | |
| * | As of December 31, 2015 (includes direct sales to State Energy Enterprises) |
Source: CBT
In the second half of 2012, the Central Bank continued to implement the floating exchange rate regime along with the inflation targeting framework (having no nominal or real exchange rate target, and with intervention unlikely unless the level of exchange rate seemed decoupled substantially from macroeconomic fundamentals, hurting inflation and financial stability goals). The Central Bank continued to construct the Reserve Option Mechanism (“ROM”), which allows Turkish banks to hold a certain portion of their TL required reserves in foreign exchange (FX) and gold, during the second half of 2012 and increased the ROCs by 0.2% for all of the tranches except the first tranche (compared to July 2012). The utilization rate of this mechanism reached around 90% as of the end of 2012. The mechanism so far appears to support the resilience of the economy to cross-border capital flows and facilitate the liquidity management of the banking system.
69
As of December 21, 2012, ROM-based foreign exchange reserves were valued at U.S.$27.2 billion (an increase of U.S.$16.9 billion from the previous year), and the ROM-based gold reserves were valued at U.S.$12.5 billion (an increase of U.S.$10.2 billion from the previous year). To further strengthen the Central Bank’s FX reserves, the Central Bank increased the export rediscount credits limits several times during 2012. In sum, export rediscount credits added U.S.$8.3 billion to the Central Bank’s net international reserves. Overall, total gross international reserves of the Central Bank reached U.S.$119.1 billion as of the end of 2012. Additionally, the Central Bank provided nearly U.S.$2.5 billion to the market through interventions and auctions in 2012.
Due to increasing cross-border capital flows during 2012, the Central Bank gradually increased the foreign exchange required reserve ratios to a range of 6% to11.5% (with 6% for the longest maturity, and 11.5% for the shortest maturity) from 5% to 11%. Moreover, the Central Bank’s foreign exchange lending rate was 4.5% for US Dollars and 5.5% for Euro. In the last meeting of the Monetary Policy Committee (MPC), on December 25, 2012, the MPC increased foreign exchange lending rates for US Dollars and Euro to 10% due to favorable global financial market conditions.
During 2013, the CBRT implemented new revisions to Reserve Option Mechanism for gold and FX facilities. These revisions included an increase in ROCs for gold option on January 22, 2013, an increase in ROCs for gold and FX option on March 26, 2013, addition of new tranches for FX and gold on March 26, 2013, an increase in ROCs for FX option on April 16, 2013, an increase in ROCs for FX option and addition of new tranches for FX on May 16, 2013, an increase in ROCs for FX option on December 26, 2013. The latest tranches and corresponding ROCs as of December 31, 2014 are described below.
Table 21
| | | | |
FX Facility Tranches (%) | | ROC | |
0-30 | | | 1.0 | |
30-35 | | | 1.5 | |
35-40 | | | 1.8 | |
40-45 | | | 2.6 | |
45-50 | | | 2.9 | |
50-55 | | | 3.1 | |
55-56 | | | 3.9 | |
56-57 | | | 4.1 | |
57-58 | | | 4.3 | |
58-59 | | | 4.5 | |
59-60 | | | 4.7 | |
Source: Central Bank
Following the tapering signal by the U.S. Federal Reserve Board in May 2013, most emerging countries’ risk premiums exhibited an upward trend until late 2013. Accompanied with domestic risk factors, the Turkish lira lost value against major currencies (e.g. US Dollar, Euro) beyond what peer emerging countries have experienced. To contain potential risks due to currency depreciation (e.g. a rise in inflation due to pass through), the CBRT has implemented additional monetary tightening and conducted unsterilized foreign exchange selling auctions (amounting to approximately U.S.$17 billion for the whole year). There were also increases in the upper limit of the interest rate corridor in mid-2013. Further, the CBRT conducted forward guidance on the likely path of the CBRT average funding rate in fourth quarter of 2013. The CBRT announced that the rate would be close to the upper limit of the corridor until the end of the year.
In the beginning of 2014, Turkey experienced external and internal developments with strong effects on its exchange rate and risk premium. In order to contain the negative impact of these developments on inflation and macroeconomic stability, the CBRT decided at its interim MPC meeting on January 28, 2014 to deliver a strong and front-loaded monetary tightening and to simplify its operational framework. Accordingly, the marginal funding rate was raised from 7.75% to 12%, the interest rate on borrowing facilities provided for primary dealers on repo transactions within open market operations was raised from 6.75% to 11.5%, and the CBRT borrowing rate was raised from 3.5% to 8%. With regard to the simplification of the operational framework, the CBRT decided to provide liquidity from the one-week repo rate instead of the marginal funding rate, and the one-week repo rate was increased from 4.5% to 10%. This simplified framework has been kept in operation throughout 2014, with several downward revisions to the one-week repo rate and to the interest rate corridor.
During the same time period, the CBRT provided FX liquidity to the market by direct currency intervention and daily FX sale auctions. Considering the developments in FX volatility, the limits on daily FX sales were revised several times which set the minimum amount between U.S.$10 million to U.S.$40 million. Moreover, the CBRT announced that the required portion of the FX requirements of energy-importing state economic enterprises (“SEEs”) would be met directly by the Undersecreteriat of the Treasury and the CBRT as of December 17, 2014. In 2014, an FX amount of U.S.$14.35 billion was sold through FX sale auctions and direct intervention.
70
As of December 19, 2014, ROM-based foreign exchange reserves were valued at U.S.$33 billion (from U.S.$34.1 billion in 2013), and the ROM-based gold reserves were valued at U.S.$15.1 billion (an increase of U.S.$14.8 billion from the previous year). As of August 1, 2014, the CBRT limit the foreign currencies that can be maintained for Turkish lira required that the reserves be within the scope of the Communiqué on Reserve Requirements No. 2013/15 to the U.S. dollar only. To further strengthen the Central Bank’s FX reserves, the Central Bank increased the export rediscount credits limits several times during 2013 and 2014. In sum, export rediscount credits added U.S.$12.7 billion in 2013 and U.S.$13 billion in 2014 to the Central Bank’s net international reserves. Overall, international reserves of the Central Bank reached U.S.$127.3 billion as of the end of 2014.
In order to maintain balanced growth and capital inflows for the upcoming global monetary policy normalization, the CBRT has changed the foreign exchange deposit rates that apply to banks to borrow from the CBRT within their limits through the Foreign Exchange Deposit Market. As of October 9, 2014, the rates for one-week maturity borrowings from the CBRT as a last resort facility were reduced from 10% to 7.5% for the US Dollar and from 10% to 6.5% for the Euro. Moreover, considering the increase in banks’ balance sheets and in CBRT’s international reserves, it raised the banks’ transaction limits at the Foreign Exchange and Banknotes Markets from U.S.$10.8 billion to U.S.$22.6 billion as of December 10, 2014.
On August 18, 2015, the CBRT released a road map regarding policies to be implemented before and during the normalization of global monetary policies. Thus, adjustments were made in the policies regarding interest rate and Turkish lira liquidity, foreign exchange liquidity and financial stability to be implemented before and during the normalization. Accordingly, measures were taken to enhance the flexibility of the foreign exchange liquidity policy and bolster core liabilities and long-term borrowing to support financial stability before and during the global monetary policy normalization.
In 2015, given the expected normalization in global monetary policies, the CBRT continued to lower the interest rates on FX deposits that banks can borrow from the CBRT within their borrowing limits in the FX Deposit Market. Throughout 2015, the CBRT lowered the 1-week FX deposit interest rate. By August 2015, rates had declined to 2.75% (down from 7.5% earlier in the year) for U.S. dollars and 1.25% (down from 6.5% earlier in the year) for euros. On July 24, 2015, the CBRT announced that going forward, whenever necessary, these rates would be adjusted in either direction at 9:30 a.m. on business days, and will be valid for the same business day. Further, on September 1, 2015, in order to enhance the flexibility of the foreign exchange liquidity management, transaction limits for banks at the CBRT Foreign Exchange and Banknotes Markets were raised by approximately 130% to U.S.$50 billion. The arrangements are anticipated to function as a buffer for the banking sector to boost confidence in financial markets.
Moreover, as of May 5, 2015, U.S. dollar required reserves, reserve options and free reserves held at the CBRT have been remunerated. The applicable interest rate has been set on a daily basis depending on varying conditions in the global and local financial markets, and announced daily at 9.30 a.m. As of December 17, 2015 the remuneration rate was set at 49 basis points. Due to the developments in the euro area, the per annum commission of 0.2% received from euro accounts of banks and financing companies at the CBRT as of 1 February 2015, was reduced to 0% on July 27, 2015.
Effective February 13, 2015, the CBRT introduced changes to reserve option tranches and coefficients to strengthen the automatic stabilizing feature of the Reserve Option Mechanism. Accordingly, to meet the required FX liquidity due to the adjustments in the reserve requirement ratios, the ROC in the first 30% tranche was lowered by 0.2 points. Furthermore, with the upper limit of the facility unchanged, the corresponding ROC to each additional tranche was raised by 0.2 points for tranches above 55%. On March 10, 2015, the CBRT introduced further changes to reserve option coefficients in order to meet the temporary FX liquidity needs of the financial system. Accordingly, the ROC in the first 30% tranche was lowered by 0.2 points. The ROC for tranches above 55%, on the other hand, was raised by 0.6 points. Lastly, on December 26, the calculation of the foreign exchange amount to be held against Turkish lira liabilities under the ROM was rearranged to strengthen its stabilizing feature. Accordingly, the calculation of the foreign exchange amount was based on the average of the exchange rates prevailing before the start of the maintenance period rather than the exchange rates prevailing on the liability date.
As of February 27, 2015, the CBRT has begun to set the FX sale auction amount on a daily basis in order to gain flexibility in FX liquidity policy against market volatility. To this end, as of August 19, 2015, on days when deemed necessary, the CBRT might increase the FX selling auction amount by up to U.S$70 million above the pre-announced minimum amount. Moreover, throughout 2015, the CBRT continued to provide the required portion of the FX requirements of energy-importing SEEs. The CBRT raised the limits of export rediscount credits on January 23, 2015, and widened the scope of firms that can utilize these loans. These changes will enable exporters and the services sector firms, which have FX-denominated earnings, to make higher utilization of the CBRT rediscount credits. The CBRT sold U.S.$22.9 billion through FX selling auctions and direct FX sales to energy-importing SEEs in 2015. During 2015, the FX amount obtained by rediscount credits was U.S.$15.2 billion.
The following table displays the average and the period-end rates of exchange of Turkish Lira per US Dollar, Japanese Yen and against the US Dollar-Euro currency basket:
71
Table 22
Exchange Rates
| | | | | | | | | | | | | | | | |
Period Average Year | | Turkish Lira per
U.S. Dollar | | | Turkish Lira per
Euro | | | Turkish Lira
per 100
Japanese
Yen | | | Turkish Lira per
Currency Basket(1) | |
2011 | | | 1.68 | | | | 2.33 | | | | 2.11 | | | | 2.01 | |
2012 | | | 1.80 | | | | 2.32 | | | | 2.27 | | | | 2.06 | |
2013 | | | 1.91 | | | | 2.53 | | | | 2.04 | | | | 2.22 | |
2014 | | | 2.19 | | | | 2.91 | | | | 2.08 | | | | 2.50 | |
2015 | | | 2.73 | | | | 3.03 | | | | 2.26 | | | | 2.88 | |
| | | | |
| Period End At | | | | | | | | | | | | | | | | |
| December 31st | | | | | | | | | | | | | | | | |
2011 | | | 1.91 | | | | 2.47 | | | | 2.46 | | | | 2.19 | |
2012 | | | 1.79 | | | | 2.36 | | | | 2.08 | | | | 2.08 | |
2013 | | | 2.14 | | | | 2.94 | | | | 2.03 | | | | 2.54 | |
2014 | | | 2.32 | | | | 2.83 | | | | 1.95 | | | | 2.58 | |
2015 | | | 2.92 | | | | 3.19 | | | | 2.43 | | | | 3.05 | |
| (1) | The basket consisting of U.S.$0.5 and EUR0.5. |
Source: CBRT
Note: CBRT’s foreign exchange effective selling rates.
INTERNATIONAL LENDING
The World Bank-Turkey Country Partnership Strategy (the “CPS”) for fiscal years 2012 to 2016 (fiscal year end June 30, 2016) is a financial package reaching up to U.S.$6.45 billion in total. This package consists of development policy loans and investment loans. In addition, the CPS provides financing for private sector investments and guarantees against non-commercial risks by the International Finance Corporation (“IFC”) and Multilateral Investment Guarantee Agency (“MIGA”), respectively. IFC and MIGA are members of the World Bank Group.
Between July 1, 2011 and June 30, 2015, under the current CPS, the International Bank of Reconstruction and Development (“IBRD”) provided U.S.$3.9 billion, IFC provided U.S.$4.5 billion, and MIGA provided U.S.$1.1 billion of financing to Turkey.
From July 1, 2011 to December 2015, under the current CPS, Turkey received U.S.$4.3 billion in financing from the IBRD. A summary of the program and investment loans approved during this period are as follows:
Table 23
| | | | | | | | | | | | | | | | |
| Program Loans | | Original Amount | | | USD Equivalent | | | Board Approval | | | Loan Agreement | |
Environmental Sustainability and Energy Sector (ESES) DPL3 | | € | 455,400,000 | | | $ | 600,000,000 | | | | Mar 27, 2012 | | | | Apr 6, 2012 | |
Competitiveness and Savings Development Policy Loan (CSDPL) | | € | 624,100,000 | | | $ | 800,000,000. | | | | Jun 6, 2013 | | | | Jun 7, 2013 | |
Turkey Sustaining Shared Growth DPL | | € | 367,400,000 | | | $ | 500,000,000 | | | | Jul 24, 2014 | | | | Aug 22, 2014 | |
Investment Loans | | | | | | | | | | | | | | | | |
Private Sector Renewable Energy and Energy Efficiency Project—Add. Finance | | $
€ | 235,000,000
183,600,000 |
| | $ | 500,000,000 | | | | Nov 22, 2011 | | | | Dec 5, 2011 | |
SME Energy Efficiency | | $ | 201,000,000 | | | $ | 201,000,000 | | | | Mar 27, 2013 | | | | May 6, 2013 | |
Third Access to Finance for SMEs (SME III) | | $ | 300,000,000 | | | $ | 300,000,000 | | | | Jun 26, 2013 | | | | Aug 22, 2013 | |
Renewable Energy Integration | | € | 217,600,000 | | | $ | 300,000,000 | | | | May 9, 2014 | | | | Jul 10, 2014 | |
Gas Sector Development—Add. Finance | | $ | 400,000,000 | | | $ | 400,000,000 | | | | Jul 2, 2014 | | | | Oct 2, 2014 | |
Innovative Access to Finance | | $
€ | 190,000,000
44,100,000 |
| | $ | 250,000,000 | | | | Jul 22, 2014 | | | | Aug 22, 2014 | |
Health System Strengthening and Support Project | | € | 120,000,000 | | | $ | 134,300,000 | | | | Sep 21, 2015 | | | | Sep 30, 2015 | |
Land Registration and Cadastre Modernization | | € | 81,000,000 | | | $ | 90,590,000 | | | | Oct 15, 2015 | | | | Nov 30, 2015 | |
Micro Small & Medium Enterprise and Large Enterprise Supply Chain Finance | | $ | 200,000,000 | | | $ | 200,000,000 | | | | Dec 22, 2015 | | | | Dec 28, 2015 | |
72
On February 11, 2011, the Executive Board of the IMF concluded the Second Post-Program Monitoring Discussions with Turkey. The Executive Board welcomed the strong recovery of the Turkish economy during 2010, with output exceeding its pre-crisis level and unemployment moderating significantly, but noted the sharply widening Current Account deficit. The Executive Board stated that Turkey’s main challenge is determining the right policy mix in the face of vulnerabilities arising from excessive domestic demand and volatile short-term capital flows. The Executive Board recognized that Turkey’s favorable near-term growth prospects and healthy balance sheets would likely continue to attract capital inflows, but also noted that predominantly short-term capital inflows have increased the Republic’s exposure to capital flow reversal and associated re-pricing risks. The Executive Board welcomed Turkey’s increased focus on systemic financial-sector risk and a moderate tightening of macro-prudential measures. A number of Executive Board directors, however, called for further action in these areas. The Executive Board also encouraged progress on structural reforms to enhance competitiveness and resilience to capital inflows.
Between March 16, 2011 and April 5, 2011, an IMF staff mission visited Turkey for the Financial Sector Assessment Program (“FSAP”) update. FSAP assessments include a financial stability assessment, which is the responsibility of the IMF, and a financial development assessment, which is the responsibility of the World Bank. The Financial System Stability Assessment for Turkey, including the main findings of the 2011 FSAP update for Turkey, was endorsed by the IMF during the IMF Executive Board meeting on November 30, 2011 and was published on September 7, 2012. IMF Executive Board’s Decision makes it mandatory for jurisdictions with systemically important financial sectors to undergo financial stability assessments under the FSAP every five years. In 2015, Turkey requested FSAP update to be performed in 2016 and as of August 2016 it is underway.
On September 6, 2011, an IMF staff mission visited Turkey for the purpose of conducting an Article IV consultation for fiscal 2011. The IMF staff mission concluded its review on November 30, 2011, and published its staff report on January 27, 2012. The staff noted that Turkey entered the global economic crisis with stronger private and public sector balance sheets than many other countries in the region, due to institutional reforms and improved policy frameworks adopted earlier in the decade. The staff also noted that a deft macroeconomic and financial policy response during the global economic crisis enhanced policy credibility. However, an inadequate policy response to renewed capital flows caused growth to revert to its previous unbalanced path, and an overvalued real exchange rate and abundant external financing caused demand to become skewed toward imports resulting in the current account deficit widening sharply. The staff report commented on various other economic developments and policies in Turkey, including recommending structural reforms to prevent the emergence of a negative output gap as the current account is corrected.
An IMF staff mission visited Turkey between May 31 and June 6, 2012 to discuss recent economic developments and preparations for the 2012 Article IV consultation discussions. In their conclusion statement, the IMF staff stated that the economy is decelerating toward a soft landing, thus the imbalances built over the last two years are diminishing.
During the G-20 meeting held in Los Cabos on June 18-19, 2012, Turkey declared its commitment to contributing to global financial stability by increasing the resources of the IMF. On June 19, 2012, it was announced that the Central Bank of the Republic of Turkey will contribute up to U.S.$5 billion to the IMF, to be counted as part of its international reserves. The note purchase agreement between the IMF and the Central Bank of the Republic of Turkey became effective on October 17, 2013.
On September 13, 2012, the IMF staff mission visited Turkey in the context of 2012 Article IV consultations. The IMF staff mission concluded its review on September 26, 2012, and published its staff report on December 21, 2012. In its report the staff noted that Turkish authorities set the stage for more sustainable and balanced growth in 2012, accompanied by declines in the Current Account deficit and inflation. The staff also emphasized the importance of the tighter fiscal policy proposed in the Republic of Turkey’s 2013 budget. They also noted that in the current environment of volatile capital flows, the Central Bank’s more flexible policy framework served the Turkish economy well. Additionally, the staff explained that the Turkish banks appear well-positioned for the introduction of Basel III.
After the last payment on May 14, 2013, Turkey’s outstanding debt to the IMF due to the Stand-by Arrangements was settled.
Between September 19, 2013 and October 1, 2013, the IMF mission visited Turkey as part of the annual Article IV consultations. On November 20, 2013, the Executive Board of the IMF concluded the Article IV consultation with Turkey and the staff report was published on December 20, 2013. In its report the staff noted that the economic activity accelerated and domestic demand got stronger. However, these improvements came with a deteriorating external account and inflation remaining above target. The staff underlined that monetary stance should be tightened and the monetary policy framework should be normalized with a clearer focus on inflation. On fiscal policy, while mentioning that the fiscal targets for 2013 are on track to be met, the staff noted that the fiscal stance was expansionary and should be reined in. They also stated that increasing national savings and improving competitiveness were central to addressing vulnerabilities, which would require ambitious medium-term fiscal targets and comprehensive structural reforms. In addition, the report praised the sound performance of the Turkish financial system, while advising against downside risks.
73
The IMF mission visited Turkey again from April 24 to April 30, 2014 in preparation for the 2014 Article IV regular consultations. No press release was issued following the mission’s visit.
Between September 11 and 24, 2014, the IMF mission visited Turkey to hold discussions for the 2014 Article IV regular consultation. On November 21, 2014, the Executive Board of the IMF concluded the Article IV consultation with Turkey and the staff report was published on December 5, 2014. In its report, the staff noted that Turkey’s economy has grown by 6% on average since 2010, which was a significant achievement. However, low national saving and competitiveness challenges are constraining investment and exports. The staff also noted that monetary policy needs to focus on the inflation target, and macro prudential policies should also be reinforced. The staff commended the fact that the financial system remains well capitalized and capital adequacy ratios are high on average, and mostly based on high quality capital, while noting that a tighter fiscal stance would contribute to reducing the external imbalance and relieving pressure on monetary policy.
An IMF staff mission made two separate visits to Turkey during 2015, the first occurred between April 22-29, 2015, and the second between October 15-22, 2015. The IMF staff visited to discuss, with heads and technical teams of several fiscal, financial and monetary agencies, recent economic developments and preparations for the regular 2015 Article IV consultation discussions.
In 2010, the Islamic Development Bank Group (“IDBG”) approved the Member Country Partnership Strategy (“MCPS”) for the Republic of Turkey, which is the first strategy document ever approved by the IDBG. Within the scope of the Strategy, the IDBG provided U.S.$2.2 billion of financing for projects in Turkey during the period covered by the Strategy, namely 2010-2013. The first MCPS for Turkey was completed and rated “highly successful” by IDBG in July 2016. The second MCPS for Turkey is in progress. As of the end of2015, IDBG has provided U.S.$4.6 billion of financing for projects in Turkey for the 2010-2015 period. The annual approvals of the IDBG for Turkey reached U.S.$2 billion in 2015.
As one of the founding members, Turkey became a recipient country of the European Bank for Reconstruction and Development (“EBRD”) in 2008. As of the end of 2015, EBRD has provided €6.8 billion of financing for projects in Turkey, mostly in the private sector. The annual bank investment (signed operations) of EBRD in Turkey was €1.9 billion in 2015. As EBRD suspended its operations in Russia in 2014, Turkey became the largest individual recipient of the EBRD financing both in 2014 and 2015. The EBRD has demonstrated its confidence in the future of the Turkish economy by making its EBRD office in Istanbul a regional hub, covering the Central Asian operations of the EBRD as well. In addition, the EBRD has offices in Ankara and Gaziantep.
Turkey is one of the founding members of the Black Sea Trade and Development Bank (“BSTDB”). The BSTDB has provided €254.6 million of financing for projects in Turkey between 2011 and 2015, mostly in private sector. According to the 2015-2018 Country Strategy, the BSTDB plans to invest approximately €37 to €55 million per year in Turkey.
The Republic signed a total of €920 million, €1.1 billion, €1.5 billion, €1.1 billion and €1.2 million worth of various financing agreements with the European Investment Bank in 2011, 2012, 2013, 2014 and 2015, respectively.
Turkey is one of the founding members of the Council of Europe Development Bank (“CEB”). The CEB provided €780 million of financing for projects in Turkey from 2011 to 2015.
74
FOREIGN TRADE AND BALANCE OF PAYMENTS
FOREIGN TRADE
In 2011, exports increased by 18.5% to U.S.$134.9 billion. In 2012, exports increased by 13% to U.S.$152.5 billion and in 2013, exports decreased by 0.4% to U.S.$151.8 billion. In 2014, exports increased by 3.8% to U.S.$157.6 billion. In the meantime, because domestic demand also increased, import demand increased considerably by 31.7% and 29.8% in 2010 and 2011 respectively. In 2015, exports decreased by 8.7% to U.S.$143.8 billion. The same year imports decreased 14.4% and were U.S.$207.2 billion. Since imports decreased more than exports, the trade deficit and hence the current account deficit also decreased.
The trade deficit (including shuttle trade) and the current account deficit were U.S.$89.2 billion and U.S.$74.4 billion respectively in 2011 and the trade deficit and the current account deficit U.S.$65.4 billion and U.S.$48 billion respectively in 2012. The trade deficit and the current account deficit were U.S.$79.9 billion and U.S.$63.6 billion respectively in 2013, U.S.$63.6 billion and U.S.$43.6 billion respectively in 2014 and U.S.$48.2 billion and U.S.$32.2 billion respectively in 2015.
The composition of exports has shifted substantially from agricultural products to industrial products. In 2013, this outlook did not change significantly. In addition to traditional export goods such as textiles and clothing products, food products and beverages, rubber and plastic products, metal products, machinery and equipment, electrical machinery and apparatus, motor vehicles and trailers, other transportation and furniture have been gaining greater importance. In 2013, while textiles and clothing products increased 8.8% to U.S.$27.4 billion, exports of food products and beverages, rubber and plastic products, basic metals, machinery and equipment, electrical machinery and apparatus, motor vehicles and trailers, other transportation and furniture decreased by 6.4% to U.S.$75.0 billion. In 2014, textiles and clothing products increased 6.4% to U.S.$29.2 billion. Additionally, exports of food products and beverages, rubber and plastic products, basic metals, machinery and equipment, electrical machinery and apparatus, motor vehicles and trailers, other transportation and furniture decreased by 4.4% to U.S.$78.1 billion. In 2015, textiles and clothing products decreased by 10.5% to U.S.$26.1 billion and exports of food products and beverages, rubber and plastic products, basic metals, machinery and equipment, electrical machinery and apparatus, motor vehicles and trailers, other transportation and furniture decreased by 6.2% to U.S.$77 billion.
Turkey’s principal trading partners have traditionally been EU member countries. In 2013, EU member countries accounted for 41.5% of total exports and 37.7% of total imports. The largest total export market for Turkish products was Germany, which accounted for 9% of total exports in 2013 compared to 8.6% in 2012. In 2014, EU member countries accounted for 43.5% of total exports and 36.7% of total imports. In addition, the largest total export market for Turkish products was Germany, which accounted for 9.6% of total exports in 2014 compared to 9.0% in 2013. In 2015, EU member countries accounted for 44.5% of total exports and 38.0% of total imports. In addition, the largest total export market for Turkish products was Germany, which accounted for 9.3% of total exports in 2015 compared to 9.6% in 2014.
The following table presents Turkey’s total imports, exports and terms of trade for the years indicated:
Table 24
Terms of Trade-Foreign Trade, Value, Volume
| | | | | | | | | | | | | | | | | | | | |
| | | 2011 | | | 2012 | | | 2013 | | | 2014 | | | 2015 | |
Exports f.o.b (1) | | | 134.9 | | | | 152.5 | | | | 151.8 | | | | 157.6 | | | | 143.8 | |
Imports c.i.f (2) | | | 240.8 | | | | 236.5 | | | | 251.7 | | | | 242.2 | | | | 207.2 | |
Consumption goods | | | 29.7 | | | | 26.7 | | | | 30.4 | | | | 29.0 | | | | 28.6 | |
Capital goods | | | 37.3 | | | | 33.9 | | | | 36.8 | | | | 36.0 | | | | 34.9 | |
Intermediate goods | | | 173.1 | | | | 174.9 | | | | 183.8 | | | | 176.7 | | | | 143.3 | |
Total Exports | | | | | | | | | | | | | | | | | | | | |
Value | | | 18.5 | | | | 13.0 | | | | -0.4 | | | | 3.8 | | | | -8,7 | |
Price | | | 11.5 | | | | -2.7 | | | | 0.1 | | | | -1.4 | | | | -9.6 | |
Volume(3) | | | 6.4 | | | | 16.2 | | | | -0.5 | | | | 5.3 | | | | 1.0 | |
Total Imports(2) | | | | | | | | | | | | | | | | | | | | |
Value | | | 29.8 | | | | -1.8 | | | | 6.4 | | | | -3.8 | | | | -14.4 | |
Price | | | 14.9 | | | | -2.6 | | | | -1.6 | | | | -2.9 | | | | -15.6 | |
Volume(3) | | | 13.1 | | | | 0.9 | | | | 8.2 | | | | -0.9 | | | | -1.3 | |
Terms of Trade | | | -3.0 | | | | -0.2 | | | | 1.7 | | | | 1.5 | | | | 7.0 | |
Source: TURKSTAT
| (1) | Excluding transit trade and shuttle trade. |
| (2) | Excluding transit trade and non-monetary gold. |
| (3) | Volume changes are obtained by dividing value changes by price changes. |
75
The following table presents the composition of Turkey’s exports by sector of trade for the periods indicated:
Table 25
Exports (FOB)* by Sectors and Commodity
| | | | | | | | | | | | | | | | | | | | | | | | | | | | | | | | | | | | | | | | |
| | | (in millions of U.S. dollars unless otherwise indicated) | | | Percentage Change (%) | |
| | | 2011 | | | 2012 | | | 2013 | | | 2014 | | | 2015 | | | 11/10 | | | 12/11 | | | 13/12 | | | 14/13 | | | 15/14 | |
AGRICULTURE AND FORESTRY | | | 5,166,596 | | | | 5,188,858 | | | | 5,653,323 | | | | 6,029,749 | | | | 5,756,596 | | | | 4.7 | | | | 0.4 | | | | 9.0 | | | | 6.7 | | | | -4.5 | |
Agriculture and farming of animals | | | 5,148,007 | | | | 5,167,145 | | | | 5,626,402 | | | | 6,007,500 | | | | 5,735,622 | | | | 4.7 | | | | 0.4 | | | | 8.9 | | | | 6.8 | | | | -4.5 | |
Forestry and logging | | | 18,590 | | | | 21,713 | | | | 26,921 | | | | 22,249 | | | | 20,974 | | | | 20.2 | | | | 16.8 | | | | 24.0 | | | | -17.4 | | | | -5.7 | |
FISHING | | | 186,017 | | | | 190,340 | | | | 258,177 | | | | 346,537 | | | | 368,235 | | | | 19.2 | | | | 2.3 | | | | 35.6 | | | | 34.2 | | | | 6.3 | |
Fishing | | | 186,017 | | | | 190,340 | | | | 258,177 | | | | 346,537 | | | | 368,235 | | | | 19.2 | | | | 2.3 | | | | 35.6 | | | | 34.2 | | | | 6.3 | |
MINING AND QUARRYING | | | 2,805,449 | | | | 3,160,765 | | | | 3,879,449 | | | | 3,406,108 | | | | 2,798,896 | | | | 4.4 | | | | 12.7 | | | | 22.7 | | | | -12.2 | | | | -17.8 | |
Mining of coal, lignite and peat | | | 5,864 | | | | 6,660 | | | | 3,416 | | | | 8,524 | | | | 13,618 | | | | -10.3 | | | | 13.6 | | | | -48.7 | | | | 149.5 | | | | 59.7 | |
Crude petroleum and natural gas | | | 126,405 | | | | 229,919 | | | | 248,808 | | | | 226,136 | | | | 168,260 | | | | 25.8 | | | | 81.9 | | | | 8.2 | | | | -9.1 | | | | -25.6 | |
Metal ores | | | 1,213,947 | | | | 1,338,680 | | | | 1,729,264 | | | | 1,367,763 | | | | 991,699 | | | | -5.2 | | | | 10.3 | | | | 29.2 | | | | -20.9 | | | | -27.5 | |
Other mining and quarrying | | | 1,459,233 | | | | 1,585,505 | | | | 1,897,960 | | | | 1,803,684 | | | | 1,625,319 | | | | 12.3 | | | | 8.7 | | | | 19.7 | | | | -5.0 | | | | -9.9 | |
MANUFACTURING | | | 125,962,537 | | | | 143,193,911 | | | | 141,358,199 | | | | 147,059,418 | | | | 134,389,890 | | | | 19.4 | | | | 13.7 | | | | -1.3 | | | | 4.0 | | | | -8.6 | |
Food products and beverages | | | 8,880,453 | | | | 9,514,194 | | | | 10,664,446 | | | | 11,157,501 | | | | 10,222,407 | | | | 32.5 | | | | 7.1 | | | | 12.1 | | | | 4.6 | | | | -8.4 | |
Tobacco products | | | 301,161 | | | | 415,340 | | | | 465,440 | | | | 554,938 | | | | 532,311 | | | | 1.8 | | | | 37.9 | | | | 12.1 | | | | 19.2 | | | | -4.1 | |
Textiles | | | 12,920,412 | | | | 13,259,405 | | | | 14,740,647 | | | | 15,413,632 | | | | 13,591,481 | | | | 18.2 | | | | 2.6 | | | | 11.2 | | | | 4.6 | | | | -11.8 | |
Wearing apparel | | | 11,633,424 | | | | 11,955,404 | | | | 12,703,715 | | | | 13,773,510 | | | | 12,525,940 | | | | 9.6 | | | | 2.8 | | | | 6.3 | | | | 8.4 | | | | -9.1 | |
Luggage, saddlery and footwear | | | 773,480 | | | | 913,714 | | | | 1,119,089 | | | | 1,153,124 | | | | 1,018,116 | | | | 17.8 | | | | 18.1 | | | | 22.5 | | | | 3.0 | | | | -11.7 | |
Products of wood and cork | | | 653,294 | | | | 658,431 | | | | 724,289 | | | | 853,567 | | | | 695,233 | | | | 14.0 | | | | 0.8 | | | | 10.0 | | | | 17.8 | | | | -18.5 | |
Paper and paper products | | | 1,407,263 | | | | 1,646,891 | | | | 1,933,665 | | | | 1,984,813 | | | | 1,778,511 | | | | 17.8 | | | | 17.0 | | | | 17.4 | | | | 2.6 | | | | -10.4 | |
Printing and publishing | | | 163,950 | | | | 157,514 | | | | 154,496 | | | | 167,511 | | | | 142,358 | | | | 15.9 | | | | -3.9 | | | | -1.9 | | | | 8.4 | | | | -15.0 | |
Coke, petroleum products and nuclear fuel | | | 6,122,477 | | | | 7,179,744 | | | | 6,299,799 | | | | 5,728,616 | | | | 4,175,800 | | | | 47.4 | | | | 17.3 | | | | -12.3 | | | | -9.1 | | | | -27.1 | |
Chemicals and chemical products | | | 6,742,722 | | | | 7,308,244 | | | | 7,614,807 | | | | 7,960,572 | | | | 7,466,601 | | | | 18.2 | | | | 8.4 | | | | 4.2 | | | | 4.5 | | | | -6.2 | |
Rubber and plastic products | | | 6,240,692 | | | | 6,430,097 | | | | 7,029,917 | | | | 7,539,802 | | | | 6,473,843 | | | | 27.7 | | | | 3.0 | | | | 9.3 | | | | 7.3 | | | | -14.1 | |
Other non-metallic minerals | | | 4,042,172 | | | | 4,083,453 | | | | 4,289,985 | | | | 4,328,839 | | | | 3,848,995 | | | | 1.3 | | | | 1.0 | | | | 5.1 | | | | 0.9 | | | | -11.1 | |
Manufacture of basic metals | | | 17,062,183 | | | | 29,109,842 | | | | 17,516,405 | | | | 16,636,352 | | | | 17,709,995 | | | | 18.3 | | | | 70.6 | | | | -39.8 | | | | -5.0 | | | | 6.5 | |
Manufacture of fabricated metal prod (exc machinery) | | | 6,230,149 | | | | 6,589,003 | | | | 7,067,823 | | | | 7,430,285 | | | | 6,490,562 | | | | 25.3 | | | | 5.8 | | | | 7.3 | | | | 5.1 | | | | -12.6 | |
Manufacture of machinery and equipment | | | 11,126,283 | | | | 11,856,605 | | | | 12,779,481 | | | | 13,590,841 | | | | 12,068,019 | | | | 22.8 | | | | 6.6 | | | | 7.8 | | | | 6.3 | | | | -11.2 | |
Office, accounting and computing machinery | | | 140,303 | | | | 147,973 | | | | 177,687 | | | | 189,301 | | | | 185,113 | | | | 4.9 | | | | 5.5 | | | | 20.1 | | | | 6.5 | | | | -2.2 | |
Electrical machinery and apparatus | | | 5,863,094 | | | | 5,859,416 | | | | 6,459,928 | | | | 6,364,357 | | | | 5,432,544 | | | | 20.6 | | | | -0.1 | | | | 10.2 | | | | -1.5 | | | | -14.6 | |
Communication and apparatus | | | 2,110,837 | | | | 2,511,008 | | | | 2,047,306 | | | | 2,234,053 | | | | 1,936,228 | | | | 8.2 | | | | 19.0 | | | | -18.5 | | | | 9.1 | | | | -13.3 | |
Medical, precision and optical instruments, watches | | | 498,727 | | | | 628,171 | | | | 789,300 | | | | 833,516 | | | | 820,023 | | | | 21.0 | | | | 26.0 | | | | 25.7 | | | | 5.6 | | | | -1.6 | |
Motor vehicles and trailers | | | 17,043,514 | | | | 16,244,049 | | | | 18,245,643 | | | | 19,217,751 | | | | 18,533,196 | | | | 14.7 | | | | -4.7 | | | | 12.3 | | | | 5.3 | | | | -3.6 | |
Other transport | | | 1,992,358 | | | | 1,780,943 | | | | 2,340,254 | | | | 2,398,340 | | | | 2,178,545 | | | | 20.1 | | | | -10.6 | | | | 31.4 | | | | 2.5 | | | | -9.2 | |
Furniture | | | 4,013,587 | | | | 4,944,472 | | | | 6,194,074 | | | | 7,548,199 | | | | 6,564,070 | | | | 22.3 | | | | 23.2 | | | | 25.3 | | | | 21.9 | | | | -13.0 | |
ELECTRICITY, GAS AND WATER SUPPLY | | | 148,789 | | | | 190,211 | | | | 28,970 | | | | 88,884 | | | | 73,861 | | | | -18.0 | | | | 27.8 | | | | -84.8 | | | | 206.8 | | | | -16.9 | |
Electricity, gas and steam | | | 148,789 | | | | 190,211 | | | | 28,970 | | | | 88,884 | | | | 73,861 | | | | -18.0 | | | | 27.8 | | | | -84.8 | | | | 206.8 | | | | -16.9 | |
WHOLESALE AND RETAIL TRADE | | | 631,901 | | | | 534,800 | | | | 605,984 | | | | 672,861 | | | | 445,282 | | | | 39.9 | | | | -15.4 | | | | 13.3 | | | | 11.0 | | | | -33.8 | |
Except of motor vehicles and motorcycles | | | 631,901 | | | | 534,800 | | | | 605,984 | | | | 672,861 | | | | 445,282 | | | | 39.9 | | | | -15.4 | | | | 13.3 | | | | 11.0 | | | | -33.8 | |
OTHER BUSINESS ACTIVITIES | | | 583 | | | | 544 | | | | 3,422 | | | | 2,556 | | | | 1,967 | | | | -71.4 | | | | -6.7 | | | | 529.3 | | | | -25.3 | | | | -23.0 | |
Other business activities | | | 583 | | | | 544 | | | | 3,422 | | | | 2,556 | | | | 1,967 | | | | -71.4 | | | | -6.7 | | | | 529.3 | | | | -25.3 | | | | -23.0 | |
SOCIAL AND PERSONAL ACTIVITIES | | | 4,997 | | | | 2,307 | | | | 15,113 | | | | 4,043 | | | | 4,145 | | | | 38.1 | | | | -53.8 | | | | 555.2 | | | | -73.3 | | | | 2.5 | |
Recreational, cultural and sporting activities | | | 4,996 | | | | 2,286 | | | | 15,107 | | | | 4,024 | | | | 4,144 | | | | 38.1 | | | | -54.2 | | | | 560.8 | | | | -73.4 | | | | 3.0 | |
Other service activities | | | 1 | | | | 21 | | | | 6 | | | | 18 | | | | 1 | | | | 427.3 | | | | 1880.5 | | | | -68.6 | | | | 183.3 | | | | -93.6 | |
Total | | | 134,906,869 | | | | 152,461,737 | | | | 151,802,637 | | | | 157,610,158 | | | | 143,838,871 | | | | 18.5 | | | | 13.0 | | | | -0.4 | | | | 3.8 | | | | -8.7 | |
| * | Excluding shuttle and transit trade |
Source: TURKSTAT
76
The following table presents Turkey’s exports by country for the periods indicated:
Table 26
| | | | | | | | | | | | | | | | | | | | | | | | | | | | | | | | | | | | | | | | |
| | | 2011 | | | 2012 | | | 2013 | | | 2014 | | | 2015 | | | 2011 | | | 2012 | | | 2013 | | | 2014 | | | 2015 | |
Total | | 134,906,869 | | | 152,461,737 | | | 151,802,637 | | | 157,610,158 | | | 143,838,871 | | | 100.0 | | | 100.0 | | | 100.0 | | | 100.0 | | | 100.0 | |
A. European Union Countries (EU-28) | | | 62,589,257 | | | | 59,398,377 | | | | 63,039,810 | | | | 68,514,370 | | | | 63,998,494 | | | | 46.4 | | | | 39.0 | | | | 41.5 | | | | 43.5 | | | | 44.5 | |
B. Turkish Free Zones | | | 2,544,721 | | | | 2,294,934 | | | | 2,412,824 | | | | 2,269,841 | | | | 1,906,792 | | | | 1.9 | | | | 1.5 | | | | 1.6 | | | | 1.4 | | | | 1.3 | |
C. Other Countries | | | 69,772,890 | | | | 90,768,426 | | | | 86,350,002 | | | | 86,825,947 | | | | 77,933,585 | | | | 51.7 | | | | 59.5 | | | | 56.9 | | | | 55.1 | | | | 54.2 | |
1. European Countries | | | 12,734,548 | | | | 14,166,917 | | | | 14,213,880 | | | | 15,183,962 | | | | 14,141,058 | | | | 9.4 | | | | 9.3 | | | | 9.4 | | | | 9.6 | | | | 9.8 | |
2. African Countries | | | 10,333,821 | | | | 13,356,851 | | | | 14,145,543 | | | | 13,754,398 | | | | 12,448,924 | | | | 7.7 | | | | 8.8 | | | | 9.3 | | | | 8.7 | | | | 8.7 | |
3. American Countries | | | 7,925,943 | | | | 9,623,267 | | | | 9,711,457 | | | | 10,082,687 | | | | 9,225,109 | | | | 5.9 | | | | 6.3 | | | | 6.4 | | | | 6.4 | | | | 6.4 | |
4. Asian Countries | | | 38,134,133 | | | | 53,025,802 | | | | 47,591,498 | | | | 46,974,351 | | | | 41,393,124 | | | | 28.3 | | | | 34.8 | | | | 31.4 | | | | 29.8 | | | | 28.8 | |
Middle East Countries | | | 27,934,772 | | | | 42,451,153 | | | | 35,574,660 | | | | 35,383,669 | | | | 31,085,756 | | | | 20.7 | | | | 27.8 | | | | 23.4 | | | | 22.5 | | | | 21.6 | |
5. Other Countries | | | 644,445,405 | | | | 595,589,099 | | | | 687,623,705 | | | | 830,548,890 | | | | 725,370,353 | | | | 0.5 | | | | 0.4 | | | | 0.5 | | | | 0.5 | | | | 0.5 | |
Selected Country Groups | | | | | | | | | | | | | | | | | | | | | | | | | | | | | | | | | | | | | | | | |
-OECD Countries | | | 67,113,921 | | | | 66,289,740 | | | | 68,683,836 | | | | 76,674,897 | | | | 75,368,261 | | | | 49.7 | | | | 43.5 | | | | 45.2 | | | | 48.6 | | | | 52.4 | |
-EFTA Countries | | | 1,887,252 | | | | 2,601,134 | | | | 1,661,908 | | | | 3,795,180 | | | | 6,202,203 | | | | 1.4 | | | | 1.7 | | | | 1.1 | | | | 2.4 | | | | 4.3 | |
-Black Sea Economic Cooperation | | | 17,767,964 | | | | 18,791,305 | | | | 20,367,992 | | | | 19,687,232 | | | | 14,590,290 | | | | 13.2 | | | | 12.3 | | | | 13.4 | | | | 12.5 | | | | 10.1 | |
-Economic Cooperation Organization | | | 9,291,735 | | | | 16,563,295 | | | | 11,898,400 | | | | 11,716,861 | | | | 9,566,766 | | | | 6.9 | �� | | | 10.9 | | | | 7.8 | | | | 7.4 | | | | 6.7 | |
-Commonwealth of Independent States | | | 13,376,636 | | | | 15,074,703 | | | | 16,924,418 | | | | 15,616,469 | | | | 10,568,768 | | | | 9.9 | | | | 9.9 | | | | 11.1 | | | | 9.9 | | | | 7.3 | |
-Turkish Republics | | | 5,039,884 | | | | 5,840,703 | | | | 6,908,137 | | | | 7,107,785 | | | | 5,289,671 | | | | 3.7 | | | | 3.8 | | | | 4.6 | | | | 4.5 | | | | 3.7 | |
-Islamic Conference Organization | | | 37,325,434 | | | | 55,218,487 | | | | 49,370,615 | | | | 48,625,211 | | | | 42,737,552 | | | | 27.7 | | | | 36.2 | | | | 32.5 | | | | 30.9 | | | | 29.7 | |
-D-8 Organization for Economic Cooperation | | | — | | | | — | | | | 8,790,044 | | | | 8,573,992 | | | | 8,155,651 | | | | — | | | | — | | | | 5.8 | | | | 5.4 | | | | 5.7 | |
Selected Countries(1) | | | | | | | | | | | | | | | | | | | | | | | | | | | | | | | | | | | | | | | | |
Germany | | | 13,950,825 | | | | 13,124,375 | | | | 13,702,577 | | | | 15,147,423 | | | | 13,417,033 | | | | 10.3 | | | | 8.6 | | | | 9.0 | | | | 9.6 | | | | 9.3 | |
United Kingdom | | | 8,151,430 | | | | 8,693,599 | | | | 8,785,124 | | | | 9,903,172 | | | | 10,556,393 | | | | 6.0 | | | | 5.7 | | | | 5.8 | | | | 6.3 | | | | 7.3 | |
Iraq | | | 8,310,130 | | | | 10,822,144 | | | | 11,948,905 | | | | 10,887,826 | | | | 8,549,967 | | | | 6.2 | | | | 7.1 | | | | 7.9 | | | | 6.9 | | | | 5.9 | |
Italy | | | 7,851,480 | | | | 6,373,080 | | | | 6,718,355 | | | | 7,141,071 | | | | 6,887,399 | | | | 5.8 | | | | 4.2 | | | | 4.4 | | | | 4.5 | | | | 4.8 | |
USA | | | 4,584,029 | | | | 5,604,230 | | | | 5,640,247 | | | | 6,341,841 | | | | 6,395,842 | | | | 3.4 | | | | 3.7 | | | | 3.7 | | | | 4.0 | | | | 4.4 | |
France | | | 6,805,821 | | | | 6,198,536 | | | | 6,376,704 | | | | 6,464,243 | | | | 5,845,032 | | | | 5.0 | | | | 4.1 | | | | 4.2 | | | | 4.1 | | | | 4.1 | |
Switzerland | | | 1,484,320 | | | | 2,124,525 | | | | 1,014,523 | | | | 3,207,526 | | | | 5,675,424 | | | | 1.1 | | | | 1.4 | | | | 0.7 | | | | 2.0 | | | | 3.9 | |
Spain | | | 3,917,559 | | | | 3,717,345 | | | | 4,334,196 | | | | 4,749,584 | | | | 4,742,270 | | | | 2.9 | | | | 2.4 | | | | 2.9 | | | | 3.0 | | | | 3.3 | |
UAE | | | 3,706,654 | | | | 8,174,607 | | | | 4,965,630 | | | | 4,655,710 | | | | 4,681,255 | | | | 2.7 | | | | 5.4 | | | | 3.3 | | | | 3.0 | | | | 3.3 | |
Iran | | | 3,589,635 | | | | 9,921,602 | | | | 4,192,511 | | | | 3,886,190 | | | | 3,663,760 | | | | 2.7 | | | | 6.5 | | | | 2.8 | | | | 2.5 | | | | 2.5 | |
Russia | | | 5,992,633 | | | | 6,680,777 | | | | 6,964,209 | | | | 5,943,014 | | | | 3,588,331 | | | | 4.4 | | | | 4.4 | | | | 4.6 | | | | 3.8 | | | | 2.5 | |
Saudi Arabia | | | 2,763,476 | | | | 3,676,612 | | | | 3,191,482 | | | | 3,047,134 | | | | 3,472,514 | | | | 2.0 | | | | 2.4 | | | | 2.1 | | | | 1.9 | | | | 2.4 | |
Netherlands | | | 3,243,080 | | | | 3,244,429 | | | | 3,538,043 | | | | 3,458,689 | | | | 3,154,867 | | | | 2.4 | | | | 2.1 | | | | 2.3 | | | | 2.2 | | | | 2.2 | |
Egypt | | | 2,759,311 | | | | 3,679,195 | | | | 3,200,362 | | | | 3,297,538 | | | | 3,124,876 | | | | 2.0 | | | | 2.4 | | | | 2.1 | | | | 2.1 | | | | 2.2 | |
Romania | | | 2,878,760 | | | | 2,495,427 | | | | 2,616,313 | | | | 3,008,011 | | | | 2,815,506 | | | | 2.1 | | | | 1.6 | | | | 1.7 | | | | 1.9 | | | | 2.0 | |
Israel | | | 2,391,148 | | | | 2,329,531 | | | | 2,649,663 | | | | 2,950,902 | | | | 2,698,139 | | | | 1.8 | | | | 1.5 | | | | 1.7 | | | | 1.9 | | | | 1.9 | |
Belgium | | | 2,451,030 | | | | 2,359,575 | | | | 2,573,804 | | | | 2,939,108 | | | | 2,557,805 | | | | 1.8 | | | | 1.5 | | | | 1.7 | | | | 1.9 | | | | 1.8 | |
China | | | 2,466,316 | | | | 2,833,255 | | | | 3,600,865 | | | | 2,861,052 | | | | 2,414,790 | | | | 1.8 | | | | 1.9 | | | | 2.4 | | | | 1.8 | | | | 1.7 | |
Poland | | | 1,758,252 | | | | 1,853,700 | | | | 2,058,857 | | | | 2,401,689 | | | | 2,329,176 | | | | 1.3 | | | | 1.2 | | | | 1.4 | | | | 1.5 | | | | 1.6 | |
Azerbaijan | | | 2,063,996 | | | | 2,584,671 | | | | 2,960,371 | | | | 2,874,608 | | | | 1,898,520 | | | | 1.5 | | | | 1.7 | | | | 2.0 | | | | 1.8 | | | | 1.3 | |
Others | | | 43,786,984 | | | | 45,970,523 | | | | 50,769,896 | | | | 52,443,825 | | | | 45,369,972 | | | | 32.5 | | | | 30.2 | | | | 33.4 | | | | 33.3 | | | | 31.5 | |
| (1) | Countries are ranked by 2015 figures. |
77
Source: TURKSTAT
In 2011, the value of imports increased to U.S.$240.8 billion and EU share in Turkey’s import was 37.8%.
In 2012, the value of imports increased to U.S.$236.5 billion and EU share in Turkey’s import was 37%.
In 2013, the value of imports increased to U.S.$251.7 billion and EU share in Turkey’s import was 36.7%.
In 2014, the value of imports increased to U.S.$242.2 billion and EU share in Turkey’s import was 36.7%.
Due to the decline in domestic consumption in Turkey and the decrease in global imports prices, in 2015, the value, the value of imports decreased to U.S.$207.2 billion and EU share in Turkey’s import was 38.0%.
In 2013 and 2014, of the main commodity groups, the share of intermediate goods in total imports was 73.0%, while the shares of capital goods and consumption goods in total imports were 13.5% and 12.1%, respectively. In 2015, of the main commodity groups, the share of intermediate goods in total imports was 69.2%, while the shares of capital goods and consumption goods in total imports were 16.8% and 13.8%, respectively.
78
The following table presents the composition (by Broad Economic Classification) of Turkey’s imports (other than non-monetary gold) by sector of trade for the periods indicated:
Table 27
(In Million Dollars, and % changes)
| | | | | | | | | | | | | | | | | | | | | | | | | | | | | | | | | | | | | | | | | | |
| | | | | 2011 | | | 2012 | | | 2013 | | | 2014 | | | 2015 | | | 11/10 | | | 12/11 | | | 13/12 | | | 14/13 | | | 15/14 | |
Total | | | | | 240,841,676 | | | | 236,545,141 | | | | 251,661,250 | | | | 242,177,117 | | | | 207,234,359 | | | | 29.8 | | | | -1.8 | | | | 6.4 | | | | -3.8 | | | | -14.4 | |
1. Capital goods | | | 37,270,611 | | | | 33,925,389 | | | | 36,771,127 | | | | 35,995,907 | | | | 34,904,940 | | | | 29.3 | | | | -9.0 | | | | 8.4 | | | | -2.1 | | | | -3.0 | |
41 | | Capital goods (Except transportation vehicles) | | | 29,605,450 | | | | 28,125,442 | | | | 32,034,334 | | | | 30,437,762 | | | | 28,517,406 | | | | 27.3 | | | | -5.0 | | | | 13.9 | | | | -5.0 | | | | -6.3 | |
521 | | Transportation vehicles incidental to industry | | | 7,665,161 | | | | 5,799,947 | | | | 4,736,793 | | | | 5,558,145 | | | | 6,387,533 | | | | 37.7 | | | | -24.3 | | | | -18.3 | | | | 17.3 | | | | 14.9 | |
2. Intermediate goods | | | 173,140,243 | | | | 174,930,331 | | | | 183,811,325 | | | | 176,721,669 | | | | 143,316,885 | | | | 31.7 | | | | 1.0 | | | | 5.1 | | | | -3.9 | | | | -18.9 | |
21 | | Unprocessed materials incidental to industry | | | 16,159,591 | | | | 15,344,073 | | | | 13,926,322 | | | | 13,298,987 | | | | 9,328,123 | | | | 31.8 | | | | -5.0 | | | | -9.2 | | | | -4.5 | | | | -29.9 | |
22 | | Processed materials incidental to industry | | | 75,482,185 | | | | 73,612,072 | | | | 85,896,095 | | | | 78,849,939 | | | | 67,929,522 | | | | 28.5 | | | | -2.5 | | | | 16.7 | | | | -8.2 | | | | -13.8 | |
31 | | Unprocessed fuels and oils | | | 1,303,880 | | | | 1,161,641 | | | | 923,019 | | | | 847,099 | | | | 2,974,619 | | | | 10.9 | | | | -10.9 | | | | -20.5 | | | | -8.2 | | | | 251.2 | |
42 | | Parts of investment goods | | | 10,861,237 | | | | 10,949,032 | | | | 12,411,705 | | | | 12,152,091 | | | | 11,420,508 | | | | 19.8 | | | | 0.8 | | | | 13.4 | | | | -2.1 | | | | -6.0 | |
53 | | Parts of transportation vehicles | | | 12,334,237 | | | | 11,128,565 | | | | 11,890,116 | | | | 12,187,234 | | | | 12,114,994 | | | | 16.6 | | | | -9.8 | | | | 6.8 | | | | 2.5 | | | | -0.6 | |
111 | | Unprocessed materials of food and beverages | | | 4,379,477 | | | | 3,703,383 | | | | 3,414,093 | | | | 4,289,973 | | | | 3,456,384 | | | | 56.7 | | | | -15.4 | | | | -7.8 | | | | 25.7 | | | | -19.4 | |
121 | | Processed materials of food and beverages | | | 1,793,844 | | | | 2,137,069 | | | | 2,244,379 | | | | 2,628,359 | | | | 2,388,591 | | | | 61.2 | | | | 19.1 | | | | 5.0 | | | | 17.1 | | | | -9.1 | |
322 | | Processed fuels and oils | | | 16,433,500 | | | | 17,423,952 | | | | 17,425,970 | | | | 17,702,419 | | | | 10,279,445 | | | | 34.4 | | | | 6.0 | | | | 0.0 | | | | 1.6 | | | | -41.9 | |
79
| | | | | | | | | | | | | | | | | | | | | | | | | | | | | | | | | | | | | | | | | | |
3. Consumption goods | | | 29,692,268 | | | | 26,699,252 | | | | 30,415,894 | | | | 29,006,394 | | | | 28,586,784 | | | | 20.0 | | | | -10.1 | | | | 13.9 | | | | -4.6 | | | | -1.4 | |
51 | | Automobiles | | | 8,474,787 | | | | 7,248,447 | | | | 9,126,820 | | | | 7,717,928 | | | | 9,223,243 | | | | 24.3 | | | | -14.5 | | | | 25.9 | | | | -15.4 | | | | 19.5 | |
61 | | Resistant consumption goods | | | 4,337,380 | | | | 4,352,554 | | | | 4,962,452 | | | | 4,663,920 | | | | 3,765,901 | | | | 24.0 | | | | 0.3 | | | | 14.0 | | | | -6.0 | | | | -19.3 | |
62 | | Semi-resistant consumption goods | | | 6,452,876 | | | | 5,893,362 | | | | 6,794,659 | | | | 6,912,899 | | | | 6,279,324 | | | | 21.7 | | | | -8.7 | | | | 15.3 | | | | 1.7 | | | | -9.2 | |
63 | | Non-resistant consumption goods | | | 5,894,846 | | | | 5,177,291 | | | | 5,392,162 | | | | 5,642,136 | | | | 5,266,595 | | | | 6.6 | | | | -12.2 | | | | 4.2 | | | | 4.6 | | | | -6.7 | |
112 | | Unprocessed of food and beverages | | | 813,826 | | | | 808,512 | | | | 844,854 | | | | 978,762 | | | | 1,025,280 | | | | 20.4 | | | | -0.7 | | | | 4.5 | | | | 15.8 | | | | 4.8 | |
122 | | Processed of food and beverages | | | 1,816,157 | | | | 1,387,324 | | | | 1,619,087 | | | | 1,778,299 | | | | 1,903,196 | | | | 33.0 | | | | -23.6 | | | | 16.7 | | | | 9.8 | | | | 7.0 | |
321 | | Gasoline | | | 1,662,262 | | | | 1,674,633 | | | | 1,415,040 | | | | 1,048,594 | | | | 814,311 | | | | 23.8 | | | | 0.7 | | | | -15.5 | | | | -25.9 | | | | -22.3 | |
522 | | Transportation vehicles not incidental to industry | | | 240,134 | | | | 157,128 | | | | 260,819 | | | | 263,857 | | | | 308,933 | | | | 21.9 | | | | -34.6 | | | | 66.0 | | | | 1.2 | | | | 17.1 | |
4. Others | | | 738,555 | | | | 990,170 | | | | 662,904 | | | | 453,147 | | | | 425,750 | | | | 35.3 | | | | 34.1 | | | | -33.1 | | | | -31.6 | | | | -6.0 | |
7 | | Other goods not elsewhere specified | | | 738,555 | | | | 990,170 | | | | 662,904 | | | | 453,147 | | | | 425,750 | | | | 35.3 | | | | 34.1 | | | | -33.1 | | | | -31.6 | | | | -6.0 | |
Source: Ministry of Development
The following table presents imports (other than non-monetary gold) by country or region of origin for the periods indicated:
Table 28
| | | | | | | | | | | | | | | | | | | | | | | | | | | | | | | | | | | | | | | | |
| | | 2011 | | | 2012 | | | 2013 | | | 2014 | | | 2015 | | | 2011 | | | 2012 | | | 2013 | | | 2014 | | | 2015 | |
Total | | | 240,841,676 | | | | 236,545,141 | | | | 251,661,250 | | | | 242,177,117 | | | | 207,234,359 | | | | 100.0 | | | | 100.0 | | | | 100.0 | | | | 100.0 | | | | 100.0 | |
A. European Union Countries (EU-28) | | | 91,439,406 | | | | 87,657,462 | | | | 92,457,992 | | | | 88,783,651 | | | | 78,681,346 | | | | 38.0 | | | | 37.1 | | | | 36.7 | | | | 38.2 | | | | 38.0 | |
B. Turkish Free Zones | | | 1,038,057 | | | | 1,045,827 | | | | 1,267,869 | | | | 1,260,771 | | | | 1,227,213 | | | | 0.4 | | | | 0.4 | | | | 0.5 | | | | 0.5 | | | | 0.6 | |
C. Other Countries | | | 148,364,213 | | | | 147,841,852 | | | | 157,935,389 | | | | 152,132,695 | | | | 127,325,800 | | | | 61.6 | | | | 62.5 | | | | 62.8 | | | | 65.2 | | | | 61.4 | |
1. European Countries | | | 35,668,228 | | | | 37,206,446 | | | | 41,319,229 | | | | 36,367,325 | | | | 28,111,593 | | | | 14.8 | | | | 15.7 | | | | 16.4 | | | | 17.1 | | | | 13.6 | |
2. African Countries | | | 6,766,713 | | | | 5,921,790 | | | | 6,031,110 | | | | 5,937,961 | | | | 5,099,352 | | | | 2.8 | | | | 2.5 | | | | 2.4 | | | | 2.5 | | | | 2.5 | |
80
| | | | | | | | | | | | | | | | | | | | | | | | | | | | | | | | | | | | | | | | |
3. American Countries | | | 22,749,493 | | | | 20,232,975 | | | | 18,980,708 | | | | 18,893,560 | | | | 16,771,144 | | | | 9.4 | | | | 8.6 | | | | 7.5 | | | | 7.8 | | | | 8.1 | |
4. Asian Countries | | | 73,583,358 | | | | 71,012,030 | | | | 76,862,371 | | | | 76,642,759 | | | | 66,914,077 | | | | 30.6 | | | | 30.0 | | | | 30.5 | | | | 31.7 | | | | 32.3 | |
Middle East Countries | | | 20,439,413 | | | | 21,410,008 | | | | 22,214,051 | | | | 20,480,465 | | | | 13,574,630 | | | | 8.5 | | | | 9.1 | | | | 8.8 | | | | 9.2 | | | | 6.6 | |
5. Other Countries (2) | | | 9,596,421,543 | | | | 13,468,611,276 | | | | 14,741,972,160 | | | | 14,291,090,320 | | | | 10,429,634,249 | | | | 4.0 | | | | 5.7 | | | | 5.9 | | | | 6.1 | | | | 5.0 | |
Selected Country Groups | | | | | | | | | | | | | | | | | | | | | | | | | | | | | | | | | | | | | |
-OECD Countries | | | 121,327,626 | | | | 113,723,573 | | | | 124,206,736 | | | | 116,518,208 | | | | 101,502,395 | | | | 50.4 | | | | 48.1 | | | | 49.4 | | | | 51.3 | | | | 49.0 | |
-EFTA Countries | | | 5,845,716 | | | | 5,238,265 | | | | 10,652,294 | | | | 5,716,743 | | | | 3,137,859 | | | | 2.4 | | | | 2.2 | | | | 4.2 | | | | 4.4 | | | | 1.5 | |
-Black Sea Economic Cooperation | | | 38,770,165 | | | | 41,509,519 | | | | 41,270,643 | | | | 40,926,921 | | | | 31,525,224 | | | | 16.1 | | | | 17.5 | | | | 16.4 | | | | 17.0 | | | | 15.2 | |
-Economic Cooperation Organization | | | 17,305,837 | | | | 16,429,472 | | | | 14,802,005 | | | | 13,443,503 | | | | 9,310,425 | | | | 7.2 | | | | 6.9 | | | | 5.9 | | | | 6.1 | | | | 4.5 | |
-Commonwealth of Independent States | | | 33,159,169 | | | | 35,248,191 | | | | 34,000,176 | | | | 33,085,484 | | | | 27,152,409 | | | | 13.8 | | | | 14.9 | | | | 13.5 | | | | 14.0 | | | | 13.1 | |
-Turkish Republics | | | 3,642,096 | | | | 3,558,042 | | | | 3,600,058 | | | | 2,997,231 | | | | 2,687,976 | | | | 1.5 | | | | 1.5 | | | | 1.4 | | | | 1.5 | | | | 1.3 | |
-Islamic Conference Organization | | | 31,417,773 | | | | 31,690,284 | | | | 32,074,294 | | | | 29,107,197 | | | | 22,406,807 | | | | 13.0 | | | | 13.4 | | | | 12.7 | | | | 13.2 | | | | 10.8 | |
-D-8 Organization for Economic Cooperation | | | — | | | | — | | | | 16,823,004 | | | | 16,070,934 | | | | 11,786,072 | | | | — | | | | — | | | | 6.7 | | | | 6.9 | | | | 5.7 | |
Selected Countries(1) | | | | | | | | | | | | | | | | | | | | | | | | | | | | | | | | | | | | | | | | |
China | | | 21,693,336 | | | | 21,295,242 | | | | 24,685,885 | | | | 24,918,224 | | | | 24,873,457 | | | | 9.0 | | | | 9.0 | | | | 9.8 | | | | 10.2 | | | | 12.0 | |
Germany | | | 22,985,567 | | | | 21,400,614 | | | | 24,182,422 | | | | 22,369,476 | | | | 21,351,884 | | | | 9.5 | | | | 9.0 | | | | 9.6 | | | | 10.0 | | | | 10.3 | |
Russia | | | 23,952,914 | | | | 26,625,286 | | | | 25,064,214 | | | | 25,288,597 | | | | 20,401,757 | | | | 9.9 | | | | 11.3 | | | | 10.0 | | | | 10.3 | | | | 9.8 | |
USA | | | 16,034,121 | | | | 14,130,546 | | | | 12,596,170 | | | | 12,727,562 | | | | 11,141,462 | | | | 6.7 | | | | 6.0 | | | | 5.0 | | | | 5.2 | | | | 5.4 | |
Italy | | | 13,449,861 | | | | 13,344,468 | | | | 12,884,864 | | | | 12,055,972 | | | | 10,639,042 | | | | 5.6 | | | | 5.6 | | | | 5.1 | | | | 5.3 | | | | 5.1 | |
France | | | 9,229,558 | | | | 8,589,896 | | | | 8,079,840 | | | | 8,122,571 | | | | 7,597,687 | | | | 3.8 | | | | 3.6 | | | | 3.2 | | | | 3.3 | | | | 3.7 | |
South Korea | | | 6,298,483 | | | | 5,660,093 | | | | 6,088,318 | | | | 7,548,319 | | | | 7,057,439 | | | | 2.6 | | | | 2.4 | | | | 2.4 | | | | 2.5 | | | | 3.4 | |
Iran | | | 12,461,532 | | | | 11,964,779 | | | | 10,383,217 | | | | 9,833,290 | | | | 6,096,254 | | | | 5.2 | | | | 5.1 | | | | 4.1 | | | | 4.3 | | | | 2.9 | |
India | | | 6,498,651 | | | | 5,843,638 | | | | 6,367,791 | | | | 6,898,577 | | | | 5,613,515 | | | | 2.7 | | | | 2.5 | | | | 2.5 | | | | 2.6 | | | | 2.7 | |
Spain | | | 6,196,452 | | | | 6,023,625 | | | | 6,417,719 | | | | 6,075,843 | | | | 5,588,524 | | | | 2.6 | | | | 2.5 | | | | 2.6 | | | | 2.7 | | | | 2.7 | |
United Kingdom | | | 5,840,380 | | | | 5,629,455 | | | | 6,281,414 | | | | 5,932,227 | | | | 5,541,277 | | | | 2.4 | | | | 2.4 | | | | 2.5 | | | | 2.6 | | | | 2.7 | |
Ukraine | | | 4,812,060 | | | | 4,394,200 | | | | 4,516,333 | | | | 4,242,612 | | | | 3,448,171 | | | | 2.0 | | | | 1.9 | | | | 1.8 | | | | 1.9 | | | | 1.7 | |
Belgium | | | 3,959,279 | | | | 3,690,309 | | | | 3,843,376 | | | | 3,863,892 | | | | 3,146,936 | | | | 1.6 | | | | 1.6 | | | | 1.5 | | | | 1.6 | | | | 1.5 | |
81
| | | | | | | | | | | | | | | | | | | | | | | | | | | | | | | | | | | | | | | | |
Japan | | | 4,263,730 | | | | 3,601,427 | | | | 3,453,190 | | | | 3,199,915 | | | | 3,140,055 | | | | 1.8 | | | | 1.5 | | | | 1.4 | | | | 1.4 | | | | 1.5 | |
Poland | | | 3,496,189 | | | | 3,058,078 | | | | 3,184,533 | | | | 3,082,128 | | | | 2,977,662 | | | | 1.5 | | | | 1.3 | | | | 1.3 | | | | 1.3 | | | | 1.4 | |
Netherlands | | | 4,004,955 | | | | 3,660,634 | | | | 3,363,585 | | | | 3,517,164 | | | | 2,914,359 | | | | 1.7 | | | | 1.5 | | | | 1.3 | | | | 1.4 | | | | 1.4 | |
Romania | | | 3,801,297 | | | | 3,236,425 | | | | 3,592,568 | | | | 3,363,233 | | | | 2,598,908 | | | | 1.6 | | | | 1.4 | | | | 1.4 | | | | 1.5 | | | | 1.3 | |
Switzerland | | | 5,018,977 | | | | 4,304,864 | | | | 9,645,289 | | | | 4,821,031 | | | | 2,445,864 | | | | 2.1 | | | | 1.8 | | | | 3.8 | | | | 4.0 | | | | 1.2 | |
Bulgaria | | | 2,474,621 | | | | 2,753,650 | | | | 2,760,303 | | | | 2,846,185 | | | | 2,254,180 | | | | 1.0 | | | | 1.2 | | | | 1.1 | | | | 1.1 | | | | 1.1 | |
Czech Republic | | | 1,755,452 | | | | 2,005,342 | | | | 2,627,288 | | | | 2,420,199 | | | | 2,218,334 | | | | 0.7 | | | | 0.8 | | | | 1.0 | | | | 1.1 | | | | 1.1 | |
Others | | | 62,614,263 | | | | 65,332,570 | | | | 71,642,932 | | | | 69,050,099 | | | | 56,187,593 | | | | 26.0 | | | | 27.6 | | | | 28.5 | | | | 29.6 | | | | 27.1 | |
| (1) | Countries are ranked by 2015 figures. |
Sources: TURKSTAT, Ministry of Development
82
In 2011, Turkey’s net international reserves were approximately U.S.$110.5 billion. In 2011, gross foreign exchange reserves of the Central Bank were approximately U.S.$78.5 billion and commercial banks and special finance house gross foreign exchange reserves (excluding gold and securities portfolio) were approximately U.S.$22.2 billion. In 2011, net portfolio outflow from Turkey was U.S.$0.9 billion, compared to a U.S.$0.5 billion outflow in 2010.
In 2012, Turkey’s net international reserves were approximately U.S.$137.5 billion. In 2012, gross foreign exchange reserves of the Central Bank were approximately U.S.$100 billion and commercial banks and special finance house gross foreign exchange reserves (excluding gold and securities portfolio) were approximately U.S.$18.3 billion. In 2012, net portfolio outflow from Turkey was U.S.$0.6 billion, compared to a U.S.$0.9 billion outflow in 2011.
In 2013, Turkey’s net international reserves were approximately U.S.$147.9 billion. In 2013, gross foreign exchange reserves of the Central Bank were approximately U.S.$110.9 billion and commercial banks and special finance house gross foreign exchange reserves (excluding gold and securities portfolio) were approximately U.S.$16.9 billion. In 2013, net portfolio outflow from Turkey was U.S.$1.3 billion, compared to a U.S.$0.6 billion outflow in 2012.
In 2014, Turkey’s net international reserves were approximately U.S.$141.8 billion. In 2014, gross foreign exchange reserves of the Central Bank were approximately U.S.$106.9 billion and commercial banks and special finance house gross foreign exchange reserves (excluding gold and securities portfolio) were approximately U.S.$14.5 billion. In 2014, net portfolio outflow from Turkey was U.S.$2 billion, compared to a U.S.$1.3 billion outflow in 2013.
In 2015, Turkey’s net international reserves were approximately U.S.$128.0 billion. In 2015, gross foreign exchange reserves of the Central Bank were approximately U.S.$92.9 billion and commercial banks and special finance house gross foreign exchange reserves (excluding gold and securities portfolio) were approximately U.S.$17.5 billion. In 2015, net portfolio outflow from Turkey was U.S.$2.5 billion, compared to a U.S.$2.0 billion outflow in 2014.
OTHER GOODS, SERVICES AND INCOME
In addition to merchandise exports and imports, Turkey’s current account is composed of earnings from other goods, services and income. This item includes tourism revenues, interest earnings and other invisible revenues, such as earnings from shipment and transportation, investment income, contractors’ earnings and other official and private services (a residual category).
In 2011, Turkey’s travel revenues increased by 10.9% to U.S.$25.1 billion. See “Economy—Services—Tourism.” In addition, earnings from primary income were U.S.$4.6 billion in 2011, compared to U.S.$5.2 billion in 2010.
Turkey’s receipts from all services amounted to approximately U.S.$40.9 billion in 2011, which represented an increase of 12.9% from 2010. Secondary income amounted to U.S.$1.7 billion in 2011. On the other hand, the debit for all services and primary income account amounted to approximately U.S.$32.4 billion ($11.9 billion from income) in 2011, representing an increase of 4.1% (an increase of 1.4% for primary income) from 2010.
In 2012, Turkey’s travel revenues increased by 1.2% to U.S.$25.3 billion. See “Economy—Services—Tourism.” In addition, earnings from primary income were U.S.$5.8 billion in 2012, compared to U.S.$4.6 billion in 2011.
Turkey’s receipts from all services amounted to approximately U.S.$43.2 billion in 2012, which represented an increase of 5.8% from 2011. Secondary income amounted to U.S.$1.4 billion in 2012. On the other hand, the debit for all services and primary income account amounted to approximately U.S.$33 billion ($12.4 billion from primary income) in 2012, representing an increase of 1. 7% (an increase of 4% for primary income) from 2011.
In 2013, Turkey’s travel revenues increased by 10.5% to U.S.$28 billion. See “Economy—Services—Tourism.” In addition, earnings from primary income were U.S.$5.3 billion in 2013, compared to U.S.$5.8 billion in 2012.
Turkey’s receipts from all services amounted to approximately U.S.$47.7 billion in 2013, which represented an increase of 10.3% from 2012. Secondary income amounted to U.S.$1.2 billion in 2013. On the other hand, the debit for all services and income account amounted to approximately U.S.$37.9 billion ($14 billion from primary income) in 2013, representing an increase of 14.8% (an increase of 12.3% for primary income) from 2012.
In 2014, Turkey’s travel revenues increased by 5.6% to U.S.$29.6 billion. See “Economy—Services—Tourism.” In addition, earnings from primary income were U.S.$4.9 billion in 2014, compared to U.S.$5.3 billion in 2013.
Turkey’s receipts from all services amounted to approximately U.S.$51.7 billion in 2014, which represented an increase of 8.4% from 2013. Secondary income amounted to U.S.$1.4 billion in 2014. On the other hand, the debit for all services and income account amounted to approximately U.S.$38 billion ($13 billion from primary income) in 2014, representing an increase of 0.1% (a decrease of 6.2% for primary income) from 2013.
In 2015, Turkey’s travel revenues increased by 9.9% to U.S.$26.6 billion. See “Economy—Services—Tourism.” In addition, earnings from primary income were U.S.$4.5 billion in 2015, compared to U.S.$4.9 billion in 2014.
83
Turkey’s receipts from all services amounted to approximately U.S.$46.3 billion in 2014, which represented a decrease of 10.4% from 2013. Secondary income amounted to U.S.$1.3 billion in 2015. On the other hand, the debit for all services and income account amounted to approximately U.S.$36.2 billion ($14 billion from primary income) in 2015, representing a decrease of 4.6% (an increase of 7.6% for primary income) from 2014.
BALANCE OF PAYMENTS
The following table summarizes the balance of payments of Turkey for the periods indicated:
Table 29
| | | | | | | | | | | | | | | | | | | | |
| in millions of US dollars | | 2011 | | | 2012 | | | 2013 | | | 2014 | | | 2015 | |
CURRENT ACCOUNT | | | -74,402 | | | | -47,961 | | | | -63,608 | | | | -43,552 | | | | -32,241 | |
Trade Balance | | | -89,160 | | | | -65,367 | | | | -79,917 | | | | -63,597 | | | | -48,157 | |
Goods Exports | | | 142,392 | | | | 161,948 | | | | 161,789 | | | | 168,926 | | | | 151,970 | |
Goods Imports | | | 231,552 | | | | 227,315 | | | | 241,706 | | | | 232,523 | | | | 200,127 | |
Services | | | 20,288 | | | | 22,588 | | | | 23,680 | | | | 26,768 | | | | 24,118 | |
Credit | | | 40,851 | | | | 43,225 | | | | 47,674 | | | | 51,657 | | | | 46,273 | |
Travel receipts | | | 25,054 | | | | 25,345 | | | | 27,997 | | | | 29,552 | | | | 26,616 | |
Debit | | | 20,563 | | | | 20,637 | | | | 23,994 | | | | 24,889 | | | | 22,155 | |
Primary Income | | | -7,249 | | | | -6,588 | | | | -8,577 | | | | -8,130 | | | | -9,524 | |
Credit | | | 4,625 | | | | 5,762 | | | | 5,289 | | | | 4,874 | | | | 4,471 | |
Interest Income | | | 1,207 | | | | 2,054 | | | | 1,778 | | | | 1,666 | | | | 1,722 | |
Debit | | | 11,874 | | | | 12,350 | | | | 13,866 | | | | 13,004 | | | | 13,995 | |
Interest Expenditure | | | 5,287 | | | | 5,828 | | | | 5,774 | | | | 5,642 | | | | 5,189 | |
Secondary Income | | | 1,719 | | | | 1,406 | | | | 1,206 | | | | 1,407 | | | | 1,322 | |
General Government | | | 626 | | | | 396 | | | | 457 | | | | 475 | | | | 516 | |
Other Sectors | | | 1,093 | | | | 1,010 | | | | 749 | | | | 932 | | | | 806 | |
Workers’ Remittances | | | 1,045 | | | | 975 | | | | 878 | | | | 838 | | | | 714 | |
CAPITAL ACCOUNT | | | -25 | | | | -58 | | | | -96 | | | | -70 | | | | -21 | |
FINANCIAL ACCOUNT | | | -66,132 | | | | -48,935 | | | | -62,296 | | | | -42,062 | | | | -22,879 | |
Direct Investment (net) | | | -13,812 | | | | -9,179 | | | | -8,757 | | | | -5,476 | | | | -11,807 | |
Portfolio Investment (net) | | | -22,204 | | | | -41,012 | | | | -23,988 | | | | -20,104 | | | | 15,498 | |
Assets | | | -2,688 | | | | -2,657 | | | | -2,601 | | | | 746 | | | | 6,129 | |
Liabilities | | | 19,516 | | | | 38,355 | | | | 21,387 | | | | 20,850 | | | | -9,369 | |
Equity Securities | | | -985 | | | | 6,276 | | | | 842 | | | | 2,559 | | | | -2,395 | |
Debt Securities | | | 20,501 | | | | 32,079 | | | | 20,545 | | | | 18,291 | | | | -6,974 | |
General Government | | | 17,326 | | | | 21,658 | | | | 8,754 | | | | 4,572 | | | | -7,420 | |
In Turkey | | | 14,805 | | | | 16,835 | | | | 4,133 | | | | 370 | | | | -7,670 | |
Abroad | | | 2,521 | | | | 4,823 | | | | 4,621 | | | | 4,202 | | | | 250 | |
Other Investment (net) | | | -28,303 | | | | -19,558 | | | | -39,462 | | | | -16,014 | | | | -14,739 | |
Assets | | | -11,197 | | | | 703 | | | | -2,340 | | | | 1,659 | | | | 14,786 | |
Liabilities | | | 17,106 | | | | 20,261 | | | | 37,122 | | | | 17,673 | | | | 29,525 | |
Loans | | | 18,931 | | | | 11,003 | | | | 22,404 | | | | 17,036 | | | | 14,405 | |
Monetary Authority | | | 0 | | | | 0 | | | | 0 | | | | 0 | | | | 0 | |
General Government | | | -754 | | | | -2,096 | | | | -874 | | | | -887 | | | | -1,216 | |
Banks | | | 12,511 | | | | 5,961 | | | | 21,733 | | | | 11,837 | | | | 4,948 | |
Other Sectors | | | 7,174 | | | | 7,138 | | | | 1,545 | | | | 6,086 | | | | 10,673 | |
Currency and Deposits | | | -4,308 | | | | 7,799 | | | | 8,533 | | | | -154 | | | | 12,887 | |
in Monetary Authority | | | -1,915 | | | | -2,243 | | | | -2,000 | | | | -2,333 | | | | -916 | |
in Banks | | | -2,393 | | | | 10,042 | | | | 10,533 | | | | 2,179 | | | | 13,803 | |
Reserve Assets | | | -1,813 | | | | 20,814 | | | | 9,911 | | | | -468 | | | | -11,831 | |
NET ERRORS AND OMISSIONS | | | 8,295 | | | | -916 | | | | 1,408 | | | | 1,560 | | | | 9,383 | |
Source: CBRT
84
CURRENT ACCOUNT
In the post-crisis recovery period, the Turkish economy followed a robust course, with domestic and external demand displaying divergences in terms of their speed of recovery. Accordingly, imports surged amid robust domestic demand in 2011; whereas, exports exhibited only a mild recovery due to relatively weak external demand. Despite the evident slowdown in imports owing to the policy measures adopted in the second half of the year to balance domestic and external demand, the foreign trade deficit continued to grow in 2011. Consequently, balance-of-payments-defined total exports and imports of goods registered annual increases by 17.7% and 30.6%, respectively, and reached U.S.$142.4 billion, and U.S.$231.6 billion, respectively. As a result, the foreign trade deficit hit U.S.$89.2 billion in 2011, with a year-on-year increase of U.S.$32.8 billion.
Despite weaker external demand conditions amid intensifying downside risks to the global economy due to heightened concerns over sovereign debt sustainability in the Eurozone as well as the perception that the recovery in the U.S. economy would be slower than expected, exports remained relatively stable throughout the year. Exports were mainly driven by base metals, motor vehicles, food products and textiles throughout 2011. All subcategories of imports, particularly base metals, chemicals and chemical products, machinery-equipment and road vehicles, increased amid brisk domestic demand. Having improved in favor of the Turkish economy amid the decline in international energy prices during the global crisis, terms of trade started to deteriorate particularly by the second half of 2009; worsening further in 2011 on the heels of the mild recovery in the post-crisis period, causing energy prices, and in particular, crude oil prices to soar. However, even when excluding energy prices, terms of trade have followed a downward course since the second half of 2009.
The monetary policy implemented by the Central Bank at the end of 2010 to balance domestic and external demand, weakened domestic demand factors, and the increase in net external demand were the main factors underlying the decline in the current account deficit throughout 2012. Measures were taken to decrease credit growth to a sustainable level, which led to a slowdown in imports. Meanwhile, the contraction in private consumption caused exporting sectors to concentrate on foreign markets, which catalyzed the reduction in the current account deficit. The Turkish lira, which maintained its competitiveness, also played a significant role in reducing the current account deficit by contributing to the increase in exports of goods and services. As a consequence, the Current Account deficit was reduced by U.S.$26.4 billion to U.S.$48 billion in 2012.
The moderate and steady upward trend in exports that started in the wake of the financial crisis continued throughout 2012. The financial crisis in the EU countries that deepened at the end-2011 impeded Turkey’s exports to the EU. However, the adverse effects of the conditions in the EU were mitigated by diversifying to newer export regions and sectors during this period. Another significant development with respect to exports was the increase in gold exports that started primarily in the second quarter of 2012.
The downward trend in imports that began in the final quarter of 2011 was reversed and there was a limited increase in imports during the last quarter of 2012. Overall, the decline in domestic demand had a restrictive effect on the total demand for imports, and both total imports and imports, excluding the energy sector, decreased in year-on-year terms by 1.8% and 5.8% (balance-of-payments-defined), respectively.
Travel and transport items continued to be the main drivers of goods and services in 2012. Travel revenues increased in the final quarter of 2012 compared to the same period of the previous year. This was mainly driven by the increase in the number of visitors from outside of the EU, primarily from Asian countries.
Despite the weak global growth, exports managed to maintain a steady pattern in 2013 and stayed at U.S.$161.8 billion level. On the other hand, a significant growth of 6.3% was realized in imports mainly because of historically high gold imports as well as robust domestic demand. Consequently, the balance-of-payments-defined trade deficit rose to U.S.$79.9 billion in 2013 (U.S.$11.8 billion of which was due to gold imports).
Travel and transport items continued to be the main drivers of services in 2013 as in 2012. Travel revenues increased throughout the year and reached a historical high of U.S.$28 billion in 2013. This was mainly driven by the increase in the number of visitors from outside of the EU, primarily from Russia, Georgia and Asian countries.
As a result of the above factors, the current account deficit rose to U.S.$63.6 billion (7.7% of GDP) at the end of 2013.
In 2014, the current account deficit of Turkey narrowed by U.S.$20.1 billion to U.S.$43.6 billion (5.4% of GDP). The main factor behind this fall was the collapse of gold imports. After a spike in 2013, the plunge in net gold imports contributed U.S.$7.9 billion to the shrinkage of the Current Account deficit.
Although geopolitical issues affecting Turkey’s important trade partners, such as Iraq, Russia and Ukraine, limited Turkey’s export performance, with the exception of gold exports, (balance-of-payments-defined) exports increased by 4.6% (U.S.$7.3 billion). In addition to the below-the-potential growth, the sharp fall in oil prices over the second half of the year helped in containing energy imports and total imports dropped by 3.8 % (U.S.$9.2 billion). Travel revenues and shuttle trade, important revenue items in Turkey’s current account balance, performed relatively well during 2014 and expanded by 5.6% and 15.8 %, respectively.
The improvement in the current account balance observed since 2014 continued but slowed in 2015. The weak outlook of the global economy and adverse geopolitical developments restricted exports, while moderate domestic demand boosted imports, resulting in a slow-down in the improvement of the current account balance in the first half of the year. However, in the second half, while the
85
strengthening recovery trend in exports to EU countries supported export growth offsetting the negative effects of adverse geopolitical developments to some extent, the imports started to display a downward trend, both contributing to the revival of the rebalancing process. During the year, the decline in energy prices, the favorable terms of trade developments, and the moderate course of consumer loans were important factors providing support to the recovery. Both exports and imports (balance-of-payments-defined) decreased by 12.7% (U.S.$21 billion, U.S.$28.7 billion, respectively).
On the other hand, travel revenues, after having recorded an upward trend in the period 2011-2014, decreased by 9.9% in 2015. The main determinants of this fall were the parity effect, the decrease in the number of visitors from Russia, and the decline in package tour expenditures. In line with these developments, shuttle trade decreased by 36.1% to U.S.$5.5 billion in 2015. As a result of these developments, the current account deficit was reduced by U.S.$11.3 billion to U.S.$32.2 billion (4.5% of GDP) in 2015.
FOREIGN DIRECT INVESTMENTS
Pro-business foreign direct investment (“FDI”) policies were introduced as part of the modernization of the Turkish economy. FDI legislation, which has been in force since June 17, 2003, provides a secure environment for foreign investors by providing support through several bilateral and multilateral agreements and organizations, all of which help to ensure equal treatment of domestic and foreign investors, such as granting foreign entrepreneurs the same rights as local entrepreneurs and guaranteeing the transfer of profits, fees and royalties and the repatriation of capital.
The main principles of the FDI Regime are:
| | • | | No Pre-entry Screening Requirement |
| | • | | No Minimum Capital Requirement |
| | • | | Equal Treatment of Domestic and Foreign Investors |
| | • | | Guarantee to Transfer of Proceeds |
| | • | | Key Expatriate Personnel Employment |
| | • | | Protection Against Expropriation |
| | • | | International Dispute Settlement |
Turkey has been a member of several international organizations and party to bilateral and multilateral agreements, which provide a more secure investment environment for foreign investors, such as:
| | • | | The Organization for Economic Co-operation and Development (the “OECD”), the World Trade Organization (“WTO”), the International Monetary Fund (IMF), the World Bank and various organizations of the World Bank, including the Multinational International Guaranty Agency (“MIGA”). |
| | • | | Agreements to protect and promote investment which have been signed with 98 countries, 76 of which are currently in force. |
| | • | | Agreements to avoid double taxation are currently in effect with 82 countries. |
| | • | | Active participation in meetings and activities of the OECD Investment Committee and its working parties, and party to the convention on the International Center for Settlement of Disputes. |
| | • | | Investment-related agreements on WTO platforms such as Trade Related Investment Measures and Trade Related Intellectual Property Rights. |
| | • | | Active participant in the WTO working group conducting analytical studies on the relationship between trade and investment. |
Net FDI inflows into Turkey amounted to U.S.$16.9 billion in 2015. The following table sets forth foreign direct investment inflows for the years indicated:
86
Table 30
Foreign Direct Investment
| | | | | | | | | | | | | | | | | | | | | | | | |
| | | Equity Capital | | | Other Capital
(Intra-
Company
Loans) | | | Real
Estate | | | Total (Net
Incurrence
of
Liabilities) | |
| | | Inflows | | | Liquidation
Outflows | | | Net | | | Net | | | Net | | | (Net) | |
Year | | (in millions of U.S. dollars) | |
2011 | | | 16,136 | | | | -1,991 | | | | 14,145 | | | | 24 | | | | 2,013 | | | | 16,182 | |
2012 | | | 10,759 | | | | -633 | | | | 10,126 | | | | 522 | | | | 2,636 | | | | 13,284 | |
2013 | | | 9,878 | | | | -568 | | | | 9,310 | | | | 25 | | | | 3,049 | | | | 12,384 | |
2014 | | | 8,576 | | | | -261 | | | | 8,315 | | | | -113 | | | | 4,321 | | | | 12,523 | |
2015 | | | 11,939 | | | | -364 | | | | 11,575 | | | | 1,170 | | | | 4,156 | | | | 16,901 | |
Source: CBRT
Investments in the services sector accounted for 52.7% of total FDI for 2015, while manufacturing accounted for 34.7% of such total. The following table sets forth FDI inflows (Equity Capital) by sector:
Table 31
Foreign Direct Investment (Equity Capital) by Sector
| | | | | | | | | | | | | | | | | | | | |
| Sector (in millions of U.S. Dollars) | | 2011 | | | 2012 | | | 2013 | | | 2014 | | | 2015 | |
Agriculture, Forestry and Fishing | | | 32 | | | | 43 | | | | 47 | | | | 61 | | | | 31 | |
Mining and Quarrying | | | 146 | | | | 188 | | | | 717 | | | | 365 | | | | 202 | |
Manufacturing | | | 3,599 | | | | 4,519 | | | | 2,209 | | | | 2,731 | | | | 4,148 | |
Electricity, Gas, Steam and Air-conditioning Supply | | | 4,293 | | | | 773 | | | | 1,795 | | | | 1,131 | | | | 1,261 | |
Water Supply; Sewerage, Waste Management and Remediation | | | 2 | | | | 0 | | | | 36 | | | | 3 | | | | 2 | |
Construction | | | 301 | | | | 1,427 | | | | 178 | | | | 232 | | | | 83 | |
Wholesale and Retail Trade | | | 707 | | | | 221 | | | | 377 | | | | 1,136 | | | | 569 | |
Transportation and Storage | | | 221 | | | | 130 | | | | 364 | | | | 594 | | | | 1,524 | |
Accommodation and Food Service Activities | | | 122 | | | | 16 | | | | 59 | | | | 24 | | | | 23 | |
Information and Communication Services | | | 36 | | | | 133 | | | | 110 | | | | 214 | | | | 150 | |
Financial and Insurance Activities | | | 5,883 | | | | 2,084 | | | | 3,415 | | | | 1,470 | | | | 3,588 | |
Real Estate Activities | | | 300 | | | | 173 | | | | 128 | | | | 227 | | | | 169 | |
Professional, Scientific and Technical Activities | | | 103 | | | | 78 | | | | 87 | | | | 94 | | | | 53 | |
Administrative and Support Service Activities | | | 55 | | | | 234 | | | | 185 | | | | 21 | | | | 42 | |
Public Administration and Defense Compulsory Social Security | | | 0 | | | | 0 | | | | 0 | | | | 0 | | | | 0 | |
Education | | | 68 | | | | 60 | | | | 2 | | | | 0 | | | | 0 | |
Human Health and Social Work Activities | | | 232 | | | | 546 | | | | 106 | | | | 202 | | | | 59 | |
Arts, Entertainment and Recreation | | | 13 | | | | 81 | | | | 5 | | | | 15 | | | | 23 | |
Other Service Activities | | | 23 | | | | 53 | | | | 58 | | | | 56 | | | | 12 | |
Activities of Extra-Territorial Organizations and Bodies | | | 300 | | | | 173 | | | | 128 | | | | 227 | | | | 169 | |
TOTAL | | | 16,136 | | | | 10,759 | | | | 9,878 | | | | 8,576 | | | | 11,939 | |
Source: CBRT
Historically, firms from the EU member states have had the largest share of FDI in the country. FDI inflows reached U.S.$16.2 billion in 2011. In 2012, 2013 and 2014, FDI inflows maintained a stable level of U.S.$12-13 billion. In 2015, FDI inflows to Turkey reached U.S.$16.9 billion, increasing by 35.0% compared to 2014. Although, the share of FDI inflows from European Union countries declined slightly, from 61.5% to 57.8% in 2015 compared to the previous year, and there has been a rise in FDI flows from other regions, especially Asian countries accounting for 21.0% of total FDI inflows to Turkey in 2015, FDI inflows to Turkey from EU member states continue to maintain a dominant share of inflows to the country. The following table sets forth foreign direct investment inflows (Equity Capital) by country:
87
Table 32
Foreign Direct Investment (Equity Capital) by Country
| | | | | | | | | | | | | | | | | | | | |
| (in millions of U.S. Dollars) | | 2011 | | | 2012 | | | 2013 | | | 2014 | | | 2015 | |
EUROPE | | | 12,587 | | | | 7,925 | | | | 6,412 | | | | 6,316 | | | | 7,858 | |
Austria | | | 2,419 | | | | 1,519 | | | | 657 | | | | 31 | | | | 45 | |
France | | | 1,000 | | | | 86 | | | | 217 | | | | 281 | | | | 167 | |
Germany | | | 664 | | | | 491 | | | | 1,968 | | | | 601 | | | | 387 | |
Greece | | | 111 | | | | 58 | | | | 68 | | | | 52 | | | | 49 | |
Italy | | | 111 | | | | 154 | | | | 148 | | | | 488 | | | | 180 | |
Luxembourg | | | 562 | | | | 1,186 | | | | 278 | | | | 528 | | | | 1,270 | |
Netherlands | | | 1,424 | | | | 1,381 | | | | 918 | | | | 2,016 | | | | 1,188 | |
Spain | | | 2,251 | | | | 193 | | | | 506 | | | | 74 | | | | 2,195 | |
United Kingdom | | | 906 | | | | 2,044 | | | | 300 | | | | 1,051 | | | | 596 | |
Other EU Countries | | | 3,139 | | | | 813 | | | | 1,352 | | | | 1,194 | | | | 1,781 | |
EFTA Countries | | | 323 | | | | 592 | | | | 234 | | | | 318 | | | | 197 | |
OTHER EUROPEAN COUNTRIES | | | 770 | | | | 30 | | | | 894 | | | | 723 | | | | 759 | |
AFRICA | | | 0 | | | | 0 | | | | 221 | | | | 42 | | | | 0 | |
AMERICA | | | 1,484 | | | | 491 | | | | 343 | | | | 334 | | | | 1,573 | |
NORTH AMERICA | | | 1,422 | | | | 471 | | | | 342 | | | | 334 | | | | 1,568 | |
USA | | | 1,401 | | | | 439 | | | | 326 | | | | 334 | | | | 1,568 | |
Canada | | | 21 | | | | 32 | | | | 16 | | | | 0 | | | | 0 | |
CENTRAL AMERICA | | | 57 | | | | 16 | | | | 1 | | | | 0 | | | | 0 | |
SOUTH AMERICA | | | 5 | | | | 4 | | | | 0 | | | | 0 | | | | 5 | |
ASIA | | | 2,056 | | | | 2,337 | | | | 2,899 | | | | 1,884 | | | | 2,508 | |
NEAR AND MIDDLE EAST COUNTRIES | | | 1,559 | | | | 1,593 | | | | 2,286 | | | | 1336 | | | | 1,316 | |
OTHER ASIAN COUNTRIES | | | 497 | | | | 744 | | | | 613 | | | | 548 | | | | 1,192 | |
AUSTRALIA | | | 9 | | | | 6 | | | | 3 | | | | 0 | | | | 0 | |
UNCLASSIFIED | | | 0 | | | | 0 | | | | 0 | | | | 0 | | | | 0 | |
TOTAL WORLD | | | 16,136 | | | | 10,759 | | | | 9,878 | | | | 8,576 | | | | 11,939 | |
Source: CBRT
FUTURE DIRECTIONS
Strengthening the private sector’s role in the Turkish economy is an integral part of Turkey’s overall macroeconomic program. To that end, Turkey initiated a comprehensive reform program in 2001 in order to streamline all investment-related procedures (the “Reform Program”).
The purpose of the Reform Program is to increase domestic and foreign investments by improving the investment environment. Thus, it is intended to prevent administrative obstacles to investing, reduce or eliminate unnecessary and repetitive bureaucratic transactions and complete investment rapidly. The Reform Program is an on-going improvement initiative.
With a view to provide an efficient institutional structure to coordinate the Reform Program, the Coordination Council for the Improvement of the Investment Environment (“YOIKK”) was established in 2001. The mandate of YOIKK is to make specific recommendations to the Council of Ministers to remove obstacles to the improvement of the investment climate.
The structure and working mechanisms of YOIKK was revised on January 4, 2016, in order to further increase efficiency in the decision making process. The chair of YOIKK was upgraded to the level of the Deputy Prime Minister and nine Ministries in charge of investment policies are now represented at ministerial level. This recent revision of YOIKK’s structure strengthened political ownership of the reform process, enabling quicker and more decisive steps to deal with needs and priorities of the private sector while enhancing their presence in Turkish market.
88
In recent years, YOIKK has been instrumental in a number of developments designed to make private investment in Turkey more attractive. These developments include, but are not limited to, establishing and amending pre-existing laws which attract qualified foreign professionals and investors and improve employment conditions of foreigners, establish the Tax Audit Board and address certain tax issues including predictability, regulate the license fee system and royalties, increase license security in the mining sector, regulate health and safety conditions at work, encourage the private sector’s participation in railway transportation, help enforce insurance claims as an assurance for the credibility of enterprises and SME’s, establish the Istanbul Arbitration Center and increase the effectiveness of arbitration mechanisms, harmonize Turkey’s postal services with international standards, review natural protected zones for prospective investment locations, encourage rapid transformation of the telecommunication infrastructure to fiber technology, and restructure recycling requirements.
The investment climate indices published by international organizations or institutions are of vital importance and provide comparative information on countries to assist in the improvement of the investment environment. The indices, published periodically, focus on issues such as legal framework, infrastructure, and institutional capacity which factor into investors’ decisions on mobilizing their investments, and thus contribute to the prioritization of the country’s reform agenda. According to the World Bank 2016 Doing Business Report, which compares 189 countries under 11 different topics, such as, starting a business, resolving insolvency and trading across borders, Turkey ranked 55 among 189 countries.
While achieving positive results in improving the investment environment for businesses by means of national platforms like YOIKK, another structure with an international perspective, Investment Advisory Council (“IAC”) for Turkey, was established in 2004 with a view to raise the competitive position of Turkey in the world economy as an investment location. At the end of the inaugural meeting the Council members decided to convene once a year and highlighted a number of priority issues which they believed to be hindering Turkey’s full potential and which they view would be beneficial to concentrate on. These IAC meetings brought together top executives of leading multinational companies, international organizations, such as IMF, World Bank and European Investment Bank and heads of Turkish private sector associations in Istanbul and were chaired by the Prime Minister. The IAC structure, and the cooperative dialogue it encourages with the private sector, has proven to be not only fundamental for creating a better investment climate, but also fully supportive of the government’s philosophy that continuous efforts to improve the investment environment will remain at the forefront of the country’s development priorities. The YOIKK technical committees serve as working groups to which the IAC recommendations shall be remitted for follow up and action.
The IAC has had eight meetings to date, most recently held on October 31, 2013 in Istanbul. The members of the IAC unanimously reaffirmed for the eighth year their commitment to the Turkish economy and reiterate their substantial investment and growth plans for the future.
Tax incentives for activities in the free trade zones (“FTZ”) have been restructured to encourage international trade. Movement of goods between FTZs and third countries is exempt from customs duties. Corporate and personal income tax exemptions have been abolished since 2004 for new companies which are not engaged in production. Income from the sales of products manufactured in FTZs is exempt from personal and corporate income taxes until the year of full membership in the EU. Salaries paid by those FTZ manufacturers which export at least 85% (FOB price) of their products are exempt from personal income tax.
Investment incentives which are designed and implemented by the Ministry of Economy are based on the provisions of Board of Ministers decrees and implementing communiqués. Turkey’s current Investment Incentive Program became effective by the “Council of Minister’s Decree No. 2012/3305 dated June 15, 2012. The Decree aims to steer savings into high value added investments, to boost production and employment, to encourage large scale and strategic investments with high R&D content for increased international competitiveness, to increase foreign direct investments, to reduce regional development disparities and to promote investments clustering and environment protection for the production and export-oriented growth strategy in line with the projected targets in Development Plans and Annual Programs as well as international agreements. Investments are supported through four different incentive schemes designed within the scope of the Incentive Program. Contributions provided to investors through incentive measures depend on the characteristics of the investment and one or more of the following applicable schemes: regional investment incentive scheme, large scale investment incentive scheme, strategic investment incentive scheme, and general investment incentive scheme.
CAPITAL ACCOUNT
In 2011, net capital inflow was U.S.$54.3 billion, with the exclusion of reserve changes (Central Bank, banks and other sectors) and IMF loans. Unlike 2010, the non-bank private sector was a net borrower in 2011. Long and short-term borrowings of banks and other sectors, the FDI as well as portfolio investment, particularly Government Domestic Borrowing Securities purchases, were the main drivers of net capital inflows. Due to the policy measures adopted in this period, the share of portfolio investment and short-term capital inflows dropped, while FDI and long-term capital inflows gained a higher share in external financing. Accordingly, official reserves declined by U.S.$1.8 billion in 2011, while FX assets of banks and the private sector went down by U.S.$15.1 billion, with net errors and omissions posting a surplus of U.S.$8.3 billion.
89
The share of direct investment and other investment declined in 2012, while the share of portfolio inflows increased. Capital inflows increased due to the decrease in the current account deficit resulting in a significant increase in official reserves and banks reserves in 2012. The lingering financial problems in the EU resulted in a decrease in direct investments from that region compared to the previous year. Meanwhile, Turkish direct investments abroad reached high levels, which reflect the relatively positive outlook of the country. Due to an increase in risk appetite globally, increasing amounts of liquidity have been directed towards emerging markets. The impact of this trend on Turkey’s balance of payments was marked by an increase in portfolio inflows that started predominantly in the second half of 2012, and Turkey’s share of the global portfolio flows towards emerging economies reached historic highs in the final quarter of 2012.
Turkey’s share of short-term flows in capital inflows declined throughout 2013 compared to the previous year. On the other hand, long-term funding of current account deficit surged by almost 25% and exceeded the short-term inflows at this period. Neither the banking sector nor other sectors experienced any supply side constraints in borrowing from abroad in 2013 and short-term credit borrowing created an important source of financing for banks and the other sectors. For long-term financing, banks resorted to both bond offerings and foreign credits. They used U.S.$17.9 billion worth of long-term credit together with U.S.$8.3 billion of bond issuance. For other sectors, a significant bond issuance occurred in 2012 and almost tripled in 2013, reaching U.S.$3.5 billion. In fact, the banking sector’s debt roll-over ratio, including the bond offerings of the banks, well exceeded the 100 level in 2013.
In 2014, the net capital inflow fell to U.S.$41.9 billion. In 2014, the net foreign direct investment was U.S.$5.5 billion. The direct investment in Turkey by foreigners was U.S.$8.6 billion, while the investment abroad by the residents almost doubled from U.S.$3.6 billion in 2013 to U.S.$7.1 billion in 2014. The net portfolio investment amounted to U.S.$20.1 billion. The government, banks, and other sectors issued bonds worth of U.S.$4.2 billion, U.S.$10.3 billion, and U.S.$3.3 billion, respectively, net of repayments. Net long-run foreign credit was approximately U.S.$13 billion. The official foreign exchange reserves fell by U.S.$0.5 billion, while the reserves of the banking sector and the others increased by U.S.$0.3 billion.
In 2015, net capital inflows declined to U.S.$26 billion. Net foreign direct investments showed an upward trend at U.S.$11.8 billion, due to several high-volume inflows. However, portfolio investments registered U.S.$15.5 billion outflows due to worsening global risk appetite. The banking sector’s net long-term borrowing almost tripled in 2015, reaching U.S.$26.3 billon. Other sectors, which includes non-bank financial corporations, non-financial corporations, households and non-profit institutions serving households, borrowed U.S.$10.7 billion in long-term, net of repayments. The net errors and omissions item posted a net inflow of U.S.$9.4 billion in 2015. Accordingly, official reserves decreased by U.S.$11.8 billion, while the reserves of the banking and other sectors increased by U.S.$15 billion.
INTERNATIONAL RESERVES
Over the 2011-2013 period, the Central Bank substantially increased its international reserves from previous years. Gold accumulation together with a U.S.$21.5 billion increase in gross reserves of the Central Bank drove total net reserves to U.S.$147.8 billion in 2013. Net international reserves decreased to U.S.$142 billion in 2014, which originated from gross reserves of the Central Bank and commercial banks. In 2014 and 2015, net international reserves dropped by approximately U.S.$6 billion and U.S.$13.8 billion, respectively, due to the fall in the gross reserves of the Central Bank. The following table presents the level of international reserves at the end of the years indicated:
Table 33
International Reserves (in millions of U.S. Dollars)
| | | | | | | | | | | | | | | | | | | | | | | | |
Years | | CBT Gross Reserves
(A) | | | Overdraft
(B) | | | Gold
(C) | | | CBT Net Reserves
(D=A-B+C) | | | Commercial Banks (E) | | | Total Net Reserves
(F=D+E) | |
2011 | | | 78,458 | | | | 0,7 | | | | 9,888 | | | | 88,346 | | | | 22,164 | | | | 110,510 | |
2012 | | | 99,923 | | | | 0.4 | | | | 19,240 | | | | 119,163 | | | | 18,324 | | | | 137,486 | |
2013 | | | 110,928 | | | | 0.4 | | | | 20,077 | | | | 131,004 | | | | 16,842 | | | | 147,846 | |
2014 | | | 106,902 | | | | 0.4 | | | | 20,401 | | | | 127,302 | | | | 14,519 | | | | 141,821 | |
2015 | | | 92,922 | | | | 0.4 | | | | 17,606 | | | | 110,528 | | | | 17,510 | | | | 128,038 | |
Source: CBT
90
FINANCIAL SYSTEM
THE CENTRAL BANK
The Law on the Central Bank of Turkey (No. 1715) was enacted on June 11, 1930. The Central Bank (also referred to as the “CBRT”) was established in October 1931 and opened officially on January 1, 1932. On January 14, 1970, a new Central Bank Law No. 1211 was enacted. The goal of the new Central Bank Law was to redefine the authorities and responsibilities of the Central Bank and to enrich the monetary policy tools of the Central Bank so as to enable the Central Bank to play a more active and efficient role in the economy.
The Central Bank has the exclusive right to issue bank notes in Turkey. As the sole regulator of the volume and circulation of the national currency, the Central Bank controls the monetary supply through open market operations and by setting reserve and liquidity requirements. The Central Bank’s open market operations desk maintains a portfolio of Government securities to effect repurchases, reverse repurchases, direct sales and direct purchases. On a day-to-day basis, the Central Bank also regulates liquidity through the interbank market.
The Central Bank manages the official gold and foreign exchange reserves. The Central Bank holds foreign exchange reserves in support of a range of objectives, which include assisting the Turkish Government in meeting its foreign exchange denominated domestic and foreign debt obligations, maintaining foreign exchange liquidity against external shocks, supporting the monetary and exchange rate policies and providing confidence to the markets. The Central Bank’s foreign currency reserves consist primarily of U.S. dollar and Euro denominated deposits and marketable securities issued by foreign governments, supranationals and institutions which have an explicit government guaranty. The Central Bank is also required to determine and protect the value of the national currency compared against gold and foreign currencies within guidelines set by the Government. Besides the foreign exchange market, the Central Bank oversees the domestic markets for Turkish Lira deposits, foreign currency notes and foreign currency deposits. The Central Bank also engages in lending and the granting of credits through its discount window from time to time, though it has not done so to any material extent from January 1996 to date.
The Central Bank performs the traditional functions of a central bank, including the issuance of banknotes, establishing monetary and exchange rate policy in accordance with the needs of the economy so as to maintain price stability by taking into consideration development plans and annual programs, and advising the Government regarding financial matters.
In the aftermath of the February 2001 economic crisis, a series of reforms were put into effect in 2001 and 2002, including an amendment to the Central Bank Law that provided instrument independence, accountability and transparency, declared price stability as the sole and overriding objective of monetary policy and established a Monetary Policy Committee (the “MPC”) with the responsibility of setting the inflation target together with the Government. Further, in 2002, these reforms also included the establishment of the Turkish Lira Interbank Offer Rate, which plays an important role in the pricing of credit and other financial instruments, including forward foreign exchange rates, and the commencement of a primary dealership system supported by the Central Bank, which provides the primary dealer banks with Turkish Lira liquidity.
The Central Bank continued efforts to improve the stability of financial markets by implementing policies regarding price stability. Within this framework, the Central Bank introduced the lending operations market for Government Domestic Borrowing Securities (“GDBS”) at the beginning of 2003 as a step to reinforce the primary dealer system. Hence, banks that want to lend GDBS had the opportunity to obtain additional return with low risk, while borrower primary dealer banks reduced their quotation liabilities in the secondary market.
On January 31, 2004, the Law on the Currency Unit of Turkey (Law No. 5083) was published in the Official Gazette (No. 25363). In accordance with Law No. 5083, a new currency, known as New Turkish Lira or YTL, was introduced on January 1, 2005. The conversion rate of the old Turkish Lira to the New Turkish Lira is: TL 1,000,000 = YTL 1. The subunit of the New Turkish Lira is Yeni Kurus or Ykr; 1 New Turkish Lira is equal to 100 Kurus. Turkish Lira and New Turkish Lira banknotes and coins have been in physical circulation since January 2005. However, on January 1, 2006, the old Turkish Lira banknotes were withdrawn from circulation.
Under the inflation targeting framework, the end-year inflation targets for the next three years are set with the Government during the preparation of the Medium Term Program and announced through the publication of “Monetary and Exchange Rate Policy” documents at the end of each year. The target variable is year-end inflation rates calculated by the annual percentage change of the Consumer Price Index. As part of the accountability mechanism, a symmetric uncertainty band for the inflation target is also announced. If any developments prevailed that would threaten the possibility of achieving the targets in the medium term, the Central Bank would be required to explain the reasons for the deviation from the target, to take necessary measures to ensure that inflation would revert back to the target and to inform the public of the expected duration in which inflation would converge to the target. The inflation reports have become a significant tool of the accountability mechanism. If end of quarter inflation figures breached the uncertainty band, the Central Bank would disclose the reasons for the deviation in the quarterly Inflation Report, together with the measures already taken as well as those to be taken to attain convergence to the target. The Central Bank will submit a public letter to the government if inflation falls outside the uncertainty band at the end of the year. Along with the inflation targeting regime, the Central Bank is implementing the floating exchange rate regime.
91
In line with its primary objective of achieving and maintaining price stability, the Central Bank has been conducting monetary policy within the framework of the inflation-targeting regime as of 2011. The Central Bank has also been carrying out its duty to take measures to achieve stability in the financial system. The inflation target was set as 5.5% for 2011 and 5.0% from 2012 onwards. The “uncertainty band” was maintained at 2.0% in both directions for the 2011-2015 period.
In 2011- In 2013, while focusing on price stability, the Central Bank continued to support financial stability. To this end the Central Bank maintained a flexible framework for monetary policy. The Central Bank used multiple policy instruments such as the interest rate corridor and Reserve Option Mechanism (“ROM”) to bolster financial stability without negatively affecting price stability. By allowing Turkish banks to hold a certain portion of their TL required reserves in foreign exchange (FX) and gold, ROM encourages Turkish banks to hold foreign exchange and gold reserves voluntarily. This provides the banks with the flexibility to adjust their foreign exchange reserves held at the Central Bank in response to changes in external financing conditions alleviating the volatility in the exchange rate and credit volumes caused by capital flows.
In 2015, the Central Bank continued to implement inflation targeting under a floating exchange rate regime in order to pursue its main objective of price stability. The target variable continued to be the year-end inflation rate calculated by the annual percentage change of the Consumer Price Index. The target horizon of three years remained constant, which is consistent with the 2015-2017 Medium-Term Program of the Government. The Central Bank and the Government have jointly kept the medium term inflation target at 5%. The accountability mechanism for the target remained unchanged. The uncertainty band remained at 2% in both directions. In 2014 and 2015, the Central Bank preserved the price stability-oriented monetary stance and continued to support financial stability as a complementary objective. In this context, the CBRT has maintained its policies of containing domestic market volatility led by capital flows, while supporting prudent borrowing.
MONETARY POLICY AND INFLATION
After reverting to a recovery path since 2010, the global economy continued to recover further in 2011, albeit at a slower pace. Meanwhile, the evident diversification in growth performances between the advanced and emerging economies in 2010 continued into 2011, thereby influencing monetary policy implementations in the respective countries. In the post-crisis period, advanced economies opted for additional monetary expansion and focused particularly on solving crisis-originated balance sheet problems. On the other hand, emerging economies, which also include Turkey, concentrated mainly on managing macro-financial risks due to accelerated capital flows driven by the higher search for yield as well as excess global liquidity on the back of the additional monetary expansion conducted by major central banks. Thus, seeking a more comprehensive policy, many central banks adopted a new scheme that also takes financial stability into consideration in addition to price stability. To alleviate macro financial risks stemming from the divergence between internal and external demand and fast credit growth, the weighted average of the Turkish lira required reserve ratios were raised significantly in January, March and April 2011. Moreover, FX required reserve ratios were differentiated by maturity, with short-term FX required reserve ratios being increased slightly in April 2011.
In the second quarter of 2011, core inflation indicators increased gradually as expected due to the lagged effects of the cumulative increases in import prices. The increase in import prices was considered to be the result of a relative price change in tradable goods rather than deterioration in the general pricing behavior, hence secondary effects have yet to be observed. Accordingly, in view of the slowdown in economic activity and uncertainties in the global economy, the policy rate and Turkish lira required reserve ratios were kept unchanged in the May-July period.
Envisioning that external demand might be adversely affected, while domestic demand, and hence, economic activity would slow down further amid heightened sovereign debt problems in some European countries, the Central Bank held an interim meeting on August 4th and lowered the policy rate by 50 basis points. In addition, in order to effectively enforce countercyclical liquidity measures in the event of a further deterioration in risk appetite, the interest rate corridor was narrowed by raising the overnight borrowing rate and a technical arrangement was introduced to the weekly auction method. Moreover, regulations on Turkish lira required reserves were amended in order to meet the liquidity needs of the banking system.
The excessive depreciation of the Turkish Lira since August 2011 amid the worsening global risk appetite, in addition to administered price adjustments in the last quarter of 2011, caused a fast rise in the short-term inflation. With a view to containing the adverse effects on the medium term inflation expectations and outlook, the Central Bank widened the interest rate corridor upwards delivering a sizeable borrowing rate hike in October. Meanwhile in order to prevent an unfavorable tightness in liquidity conditions due to the overnight rate hike, Turkish lira required reserve ratios were lowered in October. Moreover, in order to enhance the liquidity management of banks and help them foresee total funding costs, technical arrangements were rendered in repo auctions in November and traditional one-month-repo auctions were initiated starting from December 27, 2011 on every Friday.
Macro prudential policies in 2011 proved effective, by giving way to a balancing of the economy. However, the depreciation of the Turkish lira amid worsening global risk appetite as of August 2011 as well as administered price adjustments in the last quarter caused inflation to remarkably deviate from the target. As a result, year-end CPI inflation went far above the year-end target of 5.5%, by hitting 10.45% at end 2011.
92
Global risk appetite, which had worsened as of August 2011 due to concerns over the financial condition of the EU, gradually improved in the first quarter of 2012. At the same time, the rebalancing process in the economy became more pronounced and the current account deficit improved. Having achieved its desired outcome with respect to alleviating macro financial risks, starting in October 2011, the Central Bank’s monetary policy has focused on maintaining price stability. With the goal of containing the upside risks related to pricing behavior due to the increase in inflation in the last quarter of 2011, the Central Bank maintained a tight monetary policy position in the early months of 2012. In order to prevent second-round effects on inflation, the Central Bank implemented additional monetary tightening for eight days in December 2011. Accordingly, funding at the policy rate was suspended temporarily which resulted in the overnight money market interest rate being close to the upper limit of the Central Bank’s interest rate corridor.
In order to avoid deterioration of inflation expectations due to the rise in oil prices and other cost factors, additional monetary tightening was implemented on various days in March, April, May and June in 2012. These monetary tightening operations contributed to the elimination of excessive exchange rate volatility, supporting price stability and financial stability.
As inflation decreased, monetary policy gradually assumed a more accommodative role in the second half of the year. The improvement in global risk appetite and the decrease in the current account deficit also facilitated the gradual change in monetary policy. From June 2012 onwards, the Central Bank reduced the average cost of funding by injecting more liquidity into the market. Meanwhile, short-term money market rates moved closer to the lower limit of the interest rate corridor in the middle of the year.
Following September 2012, decisions taken by the European Central Bank reduced the tail risks regarding the global financial system. Moreover, ROM was implemented more effectively. Considered together, these developments facilitated a gradual lowering in the upper limit of the interest rate corridor. The overnight lending rate was reduced from 11.5% to 10% in September 2012 and further reduced to 9.5% in October 2012 and to 9% in November 2012. In December 2012, the Central Bank slightly reduced the policy rate by 25 basis points to 5.5% while introducing a modest tightening for foreign exchange reserve requirements in order to balance the risks posed by the accelerating capital inflows.
Overall, 2012 was marked by a more evident rebalancing process and a stable disinflation trend. Although inflation increased to double digit rates due to the depreciation in the Turkish lira and the increases in commodity prices in 2011, inflation expectations were contained, as a result of the tight monetary policy of the Central Bank. Consumer inflation declined to 6.16% by the end of 2012, which is the lowest level of consumer inflation in the last 44 years.
Capital inflows continued to be strong until May 2013. In this period, the Central Bank gradually lowered policy rates to counterbalance risks to financial stability stemming from capital inflows. Overnight lending and borrowing rates were lowered by 25 basis points consecutively in January and February. Moreover, as the need for a wide interest rate corridor decreased thanks to the ROM’s automatic stabilizer feature, the overnight lending rate was lowered by 100 basis points in March. Due to ongoing policy rate cuts in other emerging market economies and the acceleration of capital flows into Turkey, the policy rate, the overnight lending rate and the borrowing rate were cut by 50 basis points in April and May, consecutively.
As credit expansion remained above the reference value of 15%, Turkish lira and foreign exchange reserve requirement ratios were raised for some maturities in the first half of 2013 before May 2013. Also, measures were taken to increase the foreign exchange reserves of the Central Bank through ROM.
Following the global financial uncertainties that started in May 2013, Turkey, along with other emerging economies, experienced portfolio outflows, as well as increased risk premiums and depreciated exchange rates. The depreciation in the Turkish lira coupled with other factors such as rising unprocessed food prices and oil prices had an adverse effect on inflation. To contain the deterioration in inflation outlook, the Central Bank tightened monetary policy in the second half of the year. The upper bound of the interest rate corridor was raised by 75 and 50 basis points, in July and August, respectively, in order to counteract global uncertainties, the depreciation of the Turkish lira and high inflation from deteriorating overall pricing behavior. Moreover, the Central Bank changed the composition of liquidity provision and brought the overnight interbank rate close to the upper bound of the corridor by implementing additional monetary tightening.
The Central Bank also took measures to increase the predictability of the Turkish lira liquidity policy to curb the impact of global monetary policy uncertainties on the domestic economy. Accordingly, the Central Bank adopted a strategy towards reducing interest rate uncertainty. Consequently, the Central Bank started to announce additional monetary tightening days in advance and conduct foreign exchange selling auctions on these days to increase the effectiveness of additional monetary tightening. In November, one-month repo auctions were terminated and liquidity composition was mostly shifted to overnight funding to keep interbank money market rate around 7.75%. In addition, it was announced in December that the average funding cost of the Central Bank would be kept at or above 6.75%. These measures led to a fall in the volatility of overnight interest rates.
Having hovered above the uncertainty band throughout 2013, the inflation rate climbed to 7.4% by the end of the year. Annual consumer inflation was mostly shaped by unprocessed food and energy prices in 2013. Tax adjustments on tobacco products pushed inflation up in January and inflation maintained a volatile course in the subsequent period due to the unprocessed food and energy prices, completing the first half of the year significantly above the values implied by the target. In the second half of the year, weak capital flows driven by the uncertainty regarding global monetary policies caused the Turkish lira to depreciate, which increased core inflation indicators particularly via the core goods group. Against these developments, inflation expectations slightly deteriorated in the last 6 months of the year.
On October 21, 2015, the Monetary Policy Committee held a meeting at which it kept short-term interest rates constant as follows:
| | (a) | Overnight Interest Rates: the Marginal Funding Rate was kept at 10.75%, and the borrowing rate was kept at 7.25% |
| | (b) | The one-week repo rate was kept at 7.5% |
| | (c) | Late Liquidity Window Interest Rates (between 4:00 p.m. – 5:00 p.m.): the borrowing rate was kept at 0% and the lending rate was kept at 12.25% |
On December 9, 2015, the Central Bank announced the monetary and exchange rate policy for 2016 and stated that the uncertainty band will be maintained at 2% in both directions, as in previous years. On December 22, 2015, the Monetary Policy Committee kept short-term interest rates constant with prior 2015 rates.
93
Throughout 2014, inflation was volatile and remained at high levels. Main drivers of inflation were the exchange rate pass-through, especially via core goods prices, as well as the sharp increase in food prices due to drought and other adverse weather conditions. On the other hand, plummeting oil prices and partial correction in unprocessed food prices limited the deterioration in inflation.
Due to external and internal developments that affected risk perceptions in early 2014, the Turkish lira depreciated significantly and risk premiums increased notably. In order to contain the negative impact of these developments on inflation and macroeconomic stability, the CBRT decided at its interim MPC meeting on January 28, 2014, to deliver a strong and front-loaded monetary tightening and to simplify its operational framework. Accordingly, the marginal funding rate was raised from 7.75% to 12%, and the CBRT borrowing rate from 3.5% to 8%. Moreover, the late liquidity lending rate was increased from 10.25% to 15%. With regard to the simplification of the operational framework, the CBRT decided to provide liquidity from the one-week repo rate instead of the marginal funding rate, and the one-week repo rate was increased from 4.5% to 10%. In this sense, the CBRT ceased to implement additional monetary tightening.
Uncertainties regarding the monetary policy implementation in developed economies eased markedly in mid-2014. Favorable global liquidity conditions and increased risk appetite once again directed capital flows into emerging economies. In Turkey, the risk premium indicators recorded a notable improvement due to reduced domestic and external uncertainty. Hence, conditions that necessitated the strong and front-loaded monetary tightening of in the first quarter of 2014 improved to a large extent. In addition, due to the decline in energy prices and improvement in non-food inflation indicators in the second half of the year, the CBRT delivered gradual and measured rate cuts between April and August 2014. The late liquidity window lending rate was reduced from 15% to 13.5% in April 2014. In May and June, 2014, due to improvements in global liquidity conditions, waning uncertainties and improvements in risk premium indicators, the one-week repo rate was reduced by 50 and 75 basis points, respectively. Following these decisions, the rate on the funding through quantity auctions was lowered to 8.75%. The CBRT reduced the one-week repo rate to 8.25% and the overnight borrowing rate from 8% to 7.5% in July. Lastly, in August 2014, the marginal funding rate was reduced from 12% to 11.25% and the late liquidity window lending rate was reduced from 13.5% to 12.75% in August. While opting for moderate rate cuts, the CBRT maintained its tight monetary policy stance by keeping the yield curve nearly flat. Despite these rate cuts, the yield curve remained flat throughout 2014 since long-term rates remained at relatively low levels, which was an indication of a cautious monetary policy stance.
After the interim meeting in January 2014, in line with the decision to simplify the operational framework of the monetary policy, the CBRT continued to provide liquidity to the system mainly through one-week repo auctions. The provision of the CBRT funding mostly by one-week repo auctions led the average CBRT funding rate to hover around the weekly funding rate. Therefore, moderate rate cuts delivered due to waning domestic and external uncertainties after April 2014 were also reflected in the average funding rate. In September 2014, in view of the heightened geopolitical tensions and the financial market volatility, the tight monetary policy stance was invigorated by a tight liquidity policy. Thus, the Borsa Istanbul overnight repo rates that hovered around the one-week repo auction rate in July and August settled close to the upper end of the interest rate corridor.
In November 2014, in order to encourage prudent borrowing, the CBRT announced an increase in the FX reserve requirement ratios on the non-core liabilities of banks and finance corporations. The increase in FX reserve requirement ratios are structured in a way to promote longer-term borrowing. Moreover, to foster core liabilities, the CBRT announced in October 2014, that it will start to remunerate the Turkish lira component of required reserves of financial institutions with higher core liability ratios (ratio of deposits and equity to loans) than the sector average, at a higher rate, provided they do not worsen their situation. These measures aim to further strengthen the structure of the banking sector, with the goal of increasing financial stability and spurring balanced growth and domestic savings.
The macro-prudential measures and the tight monetary stance led to a notable improvement in the core inflation trend during the second half of 2014. However, elevated food prices and the delayed effects of exchange rates caused inflation to hover significantly above the target throughout the whole year. Although a decline was recorded in the last quarter, annual CPI inflation was above the uncertainty band around the inflation target by the end of 2014. Annual consumer inflation increased to 8.17% at the end of 2014, a rise of 0.8% compared to 2013. The underlying inflation trend in seasonally adjusted terms followed a downward path during the second half of 2014, despite the high levels of core inflation indicators throughout the year; inflation in core goods and services also decreased.
In the first quarter of 2015, core inflation saw a major improvement but elevated food inflation curbed a fall in annual inflation. After pulling inflation down notably in the fourth quarter of 2014, oil prices started to rise in February, and consequently the positive impact of the energy prices on inflation was restrained. The cautious monetary policy along with prudent fiscal and macroprudential policies had a favorable impact on core inflation indicators.
In the first quarter of 2015, the CBRT implemented measured policy rate cuts and maintained its cautious monetary policy stance by employing a tight liquidity policy. In view of the improved core inflation indicators, the CBRT lowered the 1-week repo auction rate from 8.25% to 7.75% in January and 7.5% in February. Overnight borrowing and lending rates were lowered by 50 basis points each in February. Rate cuts were kept modest in January and February due to ongoing global uncertainty, volatility in energy prices, rising domestic food prices and relatively high levels of inflation expectations.
94
Due to the uncertainty over global markets and the volatility in food and energy prices, the CBRT maintained its cautious monetary policy stance in the second quarter of 2015. In this period, the CBRT kept interest rates unchanged, but continued with its tight liquidity policy to contain risks to core goods inflation and inflation expectations.
In the third quarter of 2015, annual consumer inflation posted an increase due to food prices and exchange rate developments. Annual core goods inflation increased because of the cumulative depreciation in the Turkish lira. Meanwhile, exchange rate developments had a limited effect on energy prices due to the decline in oil prices.
The remuneration rate of Turkish lira required reserves increased by 50 basis points in each of September, October and December. This arrangement aims to reduce the intermediation costs of the banking sector and offer an additional support to core liabilities. In the fourth quarter of 2015, consumer price inflation increased to 8.81%, exceeding the uncertainty band around the year-end inflation target. Unprocessed food prices were the main drivers of this rise in annual inflation. The lagged effects of Turkish lira depreciation were particularly evident through core goods (goods excluding food, energy, gold and alcohol-tobacco products), inflation of which increased by 2.3% to 10.2% during this period. However, the continued fall of import prices limited the rise in CPI inflation in the fourth quarter.
The CBRT maintained its tight monetary policy and liquidity stance throughout 2015. Accordingly, the one-week repo rate, the overnight lending rate and the overnight borrowing rate were kept unchanged during the last quarter of 2015.
The Central Bank has changed its balance sheet structure in accordance with IMF agreements. The restructured balance sheets have been derived from the Central Bank Analytical Balance Sheet, as shown below:
Table 34
| | | | | | | | | | | | | | | | | | | | |
| Selected Central Bank Balance Sheet Data | | 2011 | | | 2012 | | | 2013 | | | 2014 | | | 2015 | |
| (in millions of Turkish Lira) | | | | | | | | | | | | | | | |
ASSET | | | 146,213.6 | | | | 202,022.1 | | | | 265,857.7 | | | | 281,900.3 | | | | 293,215.1 | |
Foreign Assets | | | 173,108.8 | | | | 215,570.2 | | | | 283,465.2 | | | | 299,420.5 | | | | 326,661.2 | |
Domestic Assets | | | -26,895.2 | | | | -13,548.2 | | | | 4,556.9 | | | | 5,336.8 | | | | -794.4 | |
Cash Operations | | | -6,696.4 | | | | 107.2 | | | | — | | | | — | | | | — | |
FX Revaluation Account | | | -20,198.7 | | | | -13,655.4 | | | | -22,164.5 | | | | -22,857.0 | | | | -32,651.7 | |
IMF Emergency Assistance | | | 0.0 | | | | 0 | | | | — | | | | — | | | | — | |
LIABILITY | | | 146,213.6 | | | | 202,022.1 | | | | 265,857.7 | | | | 281,900.3 | | | | 293,215.1 | |
Total Foreign Liabilities | | | 93,060.0 | | | | 137,624.1 | | | | 199,760.1 | | | | 207,749.8 | | | | 244,145.4 | |
Liabilities to Non-Residents | | | 21,779.3 | | | | 16,605.1 | | | | 16,065.2 | | | | 10,778.9 | | | | 9,711.8 | |
Liabilities to Residents | | | 71,280.7 | | | | 121,019.1 | | | | 183,695.0 | | | | 196,970.9 | | | | 234,433.6 | |
Central Bank Money | | | 53,153.6 | | | | 64,397.9 | | | | 66,097.5 | | | | 74,150.5 | | | | 49,069.8 | |
Reserve Money | | | 84,047.4 | | | | 77,572.4 | | | | 91,207.3 | | | | 107,221.1 | | | | 122,349.9 | |
Currency Issued | | | 55,103.2 | | | | 60,525.5 | | | | 74,814.6 | | | | 85,118.2 | | | | 103,042.6 | |
Deposits of Banking Sector | | | 28,782.1 | | | | 16,655.5 | | | | 16,086.1 | | | | 21,595.0 | | | | 18,799.1 | |
Extra Budgetary Funds | | | 108.0 | | | | 333.6 | | | | 242.1 | | | | 203.3 | | | | 142.7 | |
Deposits of Non-Banking Sector | | | 54.2 | | | | 57.8 | | | | 64.5 | | | | 304.5 | | | | 365.5 | |
Other Central Bank Money | | | -30,893.8 | | | | -13,174.5 | | | | -25,109.8 | | | | -33,070.5 | | | | -73,280.2 | |
Open Market Operations | | | -39,128.7 | | | | -19,400.1 | | | | -38,873.4 | | | | -46,421.9 | | | | -95,448.6 | |
Deposits of Public Sector | | | 8,234.9 | | | | 6,225.7 | | | | 13,763.7 | | | | 13,351.3 | | | | 22,168.4 | |
Source: CBRT
The following table presents key monetary aggregates for the dates indicated:
Table 35
| | | | | | | | | | | | | | | | | | | | |
| | | 2011 | | | 2012 | | | 2013 | | | 2014 | | | 2015 | |
M1 | | | 161,212.85 | | | | 179,934.55 | | | | 229,370.15 | | | | 258,293.54 | | | | 311,646.93 | |
M2 | | | 674,409.58 | | | | 743,043.39 | | | | 908,004.75 | | | | 1,015,896.40 | | | | 1,189,494.06 | |
M3 (M2 + funds received from repo transactions + money market funds + debt securities issued by banks) | | | 708,766.69 | | | | 783,455.10 | | | | 948,671.07 | | | | 1,060,143.20 | | | | 1,232,282.90 | |
95
M1 = Currency in circulation + Demand deposits (TRY, FX)
M2 = M1 + Time deposits (TRY, FX)
Source: CBT
The following table presents the discount rates of the Central Bank for the dates indicated:
Table 36
Discount Rates
| | | | |
Year | | Discount Rates | |
2011 | | | 17 | % |
2012 | | | 13.5 | % |
2013 | | | 10.25 | % |
2014 | | | 9.0 | % |
2015 | | | 9.0 | % |
Source: CBRT
BANKING SYSTEM
The Turkish banking system is currently regulated and supervised by the Banking Regulation and Supervision Agency (the “BRSA”), which is an independent public entity with administrative and financial autonomy that has supervised banks and certain other financial institutions since August 31, 2000. The BRSA, whose administrative body is the Banking Regulation and Supervision Board (“BRSB”), was established under the Law No. 4389, as amended by the current Banking Law (Law No. 5411). The Banking Act (Law No. 5411) was prepared in accordance with EU directives and international principles and standards and published in the Official Gazette dated November 1, 2005 (No. 25983).
The Savings Deposit Insurance Fund (“SDIF”) is a public legal entity with independent authority and duty to insure savings deposits and resolve instances where the BRSA intervenes in banks through the transfer or merger of these banks with another bank, the transfer of its shares to third parties, or liquidation. The duties and powers of SDIF are currently regulated by the Banking Law.
In addition to the Central Bank of the Republic of Turkey (the “CBRT”, 52 banks were operating in Turkey as of the end of 2015, including 13 investment and development banks, 5 participation banks, 34 commercial banks. As of year-end 2015, of the commercial banks in the sector, 3 were state banks, 8 were private banks, 21 were foreign banks and 2 were SDIF banks. Between 2014 and 2015, the share of local private banks in the sector by asset size decreased from 49.5% to 37.7%, while the share of foreign banks increased from 19.2% to 30.3%. During that period, the share of state banks increased from 31.3% to 32.0%.
On May 29, 2015, Turkey’s first state-owned participation bank (a financial institution whose activities are in compliance with Islamic rules), Ziraat Participation Bank, officially began operating.
As of August 28, 2015, the reserve requirement ratios (the “RRRs” and each, an “RRR”) for foreign exchange (FX) denominated liabilities of banks and financing companies were revised in order to encourage the extension of maturities of non-core liabilities. New ratios started to be applied to the liabilities after August 28, 2015 and the maintenance period began on October 23, 2015.
| | | | | | | | |
Liabilities other than Deposits/Participation Funds | | Previous
Ratios
(in %) | | | New Ratios
(in %) | |
With maturity up to (and including 1 year) | | | 20 | | | | 25 | |
With maturity up to (and including 2 years) | | | 14 | | | | 20 | |
With maturity up to (and including 3 years) | | | 8 | | | | 15 | |
With maturity up to (and including 5 years) | | | 7 | | | | 7 | |
With maturity longer than 5 years | | | 6 | | | | 5 | |
Source: CBRT
Total assets of the Turkish banking system, which was U.S.$648.1 billion in 2011, has increased 25.5% and reached U.S.$813.4 billion as of end of 2015. The total loan portfolio similarly has increased from U.S.$363.5 billion in 2011 to U.S.$512.3 billion in 2015 with a 40.9% increase. Parallel to this trend, share of loans in total assets has increased from 56.1% to 63%. This indicates that the intermediary function of banks has increased, as well. Non-performing loans, which amounted to approximately U.S.$10.1 billion in year-end 2011, increased to U.S.$16.4 billion as of December 2015. The increase in non-performing loans during the 2011-2015 period was 62.3%. The non-performing loan ratio has stayed relatively steady and was 2.7% in 2011, 2.9% in 2012, 2.8% in 2013, 2.9% in 2014 and 3.1% in 2015. The amount of provisions set aside for these loans was U.S.$12.2 billion and provisioning rate was 74.6%, which was well above the required regulatory levels, in 2015. Securities portfolio also plays significant role on the balance sheets of banks. The total amount of the securities portfolios was U.S.$113.9 billion as of December 2015. However, the share of securities in total assets has decreased from 23.4% in 2011 to 14.0% by the end of 2015.
Table 37
Main Figures of Banking Sector*
| | | | | | | | | | | | | | | | | | | | |
Billion USD | | 2011 | | | 2012 | | | 2013 | | | 2014 | | | 2015 | |
Total Assets | | | 644.7 | | | | 771.1 | | | | 813.2 | | | | 859.9 | | | | 813.4 | |
Loans | | | 361.5 | | | | 447.1 | | | | 491.6 | | | | 535.5 | | | | 512.3 | |
Securities Portfolio | | | 150.9 | | | | 151.9 | | | | 134.6 | | | | 130.0 | | | | 113.9 | |
Deposits | | | 368.2 | | | | 434.4 | | | | 443.9 | | | | 454.3 | | | | 429.8 | |
Own Funds | | | 76.6 | | | | 102.4 | | | | 90.9 | | | | 99.9 | | | | 90.5 | |
| * | Includes the data of participation banks. |
Source: BRSA
96
Table 38
Share of Main Figures by Bank Groups
| | | | | | | | | | | | | | | | | | | | | | | | | | | | | | | | | | | | | | | | | | | | | | | | | | | | | | | | | | | | | | | | | | | | | | | | | | | | | | | | |
| | | LOANS | | | TOTAL ASSETS | | | DEPOSITS | | | OWN FUNDS | |
% Shares | | 2011-12 | | | 2012-12 | | | 2013-12 | | | 2014-12 | | | 2015-12 | | | 2011-12 | | | 2012-12 | | | 2013-12 | | | 2014-12 | | | 2015-12 | | | 2011-12 | | | 2012-12 | | | 2013-12 | | | 2014-12 | | | 2015-12 | | | 2011-12 | | | 2012-12 | | | 2013-12 | | | 2014-12 | | | 2015-12 | |
Commercial Banks | | | 91.0 | | | | 90.1 | | | | 89.7 | | | | 90.2 | | | | 90.1 | | | | 91.9 | | | | 91.0 | | | | 90.4 | | | | 90.4 | | | | 90.2 | | | | 94.4 | | | | 93.8 | | | | 93.5 | | | | 93.8 | | | | 94.0 | | | | 84.6 | | | | 86.2 | | | | 85.3 | | | | 86.4 | | | | 86.7 | |
-State Owned | | | 26.5 | | | | 25.3 | | | | 26.5 | | | | 27.4 | | | | 28.8 | | | | 28.0 | | | | 27.5 | | | | 27.9 | | | | 28.2 | | | | 28.6 | | | | 32.4 | | | | 31.9 | | | | 31.8 | | | | 30.4 | | | | 31.1 | | | | 21.5 | | | | 22.8 | | | | 23.3 | | | | 25.8 | | | | 25.8 | |
-Private | | | 51.2 | | | | 51.0 | | | | 49.0 | | | | 48.4 | | | | 36.4 | | | | 50.8 | | | | 50.5 | | | | 48.0 | | | | 47.7 | | | | 36.1 | | | | 50.0 | | | | 48.7 | | | | 47.8 | | | | 48.3 | | | | 37.4 | | | | 50.1 | | | | 50.5 | | | | 48.8 | | | | 47.6 | | | | 35.8 | |
-Foreign | | | 13.2 | | | | 13.9 | | | | 14.3 | | | | 14.4 | | | | 25.0 | | | | 13.0 | | | | 13.0 | | | | 14.5 | | | | 14.6 | | | | 25.6 | | | | 12.0 | | | | 13.2 | | | | 13.9 | | | | 15.1 | | | | 25.5 | | | | 13.0 | | | | 13.0 | | | | 13.3 | | | | 13.0 | | | | 25.1 | |
Participation Banks | | | 5.6 | | | | 6.0 | | | | 5.9 | | | | 5.2 | | | | 4.8 | | | | 4.6 | | | | 5.1 | | | | 5.5 | | | | 5.2 | | | | 5.1 | | | | 5.6 | | | | 6.2 | | | | 6.5 | | | | 6.2 | | | | 6.0 | | | | 4.3 | | | | 4.1 | | | | 4.6 | | | | 4.2 | | | | 4.1 | |
Inv.& Dev. Banks | | | 3.4 | | | | 3.8 | | | | 4.4 | | | | 4.7 | | | | 5.0 | | | | 3.4 | | | | 3.8 | | | | 4.0 | | | | 4.2 | | | | 4.5 | | | | 0.0 | | | | 0.0 | | | | 0.0 | | | | 0.0 | | | | 0.0 | | | | 10.7 | | | | 9.3 | | | | 9.8 | | | | 9.1 | | | | 9.0 | |
SDIF | | | 0.0 | | | | 0.0 | | | | 0.0 | | | | 0.0 | | | | 0.0 | | | | 0.1 | | | | 0.1 | | | | 0.1 | | | | 0.1 | | | | 0.1 | | | | 0.0 | | | | 0.0 | | | | 0.0 | | | | 0.0 | | | | 0.0 | | | | 0.5 | | | | 0.4 | | | | 0.3 | | | | 0.3 | | | | 0.2 | |
TOTAL | | | 100.0 | | | | 100.0 | | | | 100.0 | | | | 100.0 | | | | 100.0 | | | | 100.0 | | | | 100.0 | | | | 100.0 | | | | 100.0 | | | | 100.0 | | | | 100.0 | | | | 100.0 | | | | 100.0 | | | | 100.0 | | | | 100.0 | | | | 100.0 | | | | 100.0 | | | | 100.0 | | | | 100.0 | | | | 100.0 | |
Source: BRSA
Table 39
Main Indicators of Turkish Banking Sector
| | | | | | | | | | | | | | | | | | | | |
(%) | | 2011-12 | | | 2012-12 | | | 2013-12 | | | 2014-12 | | | 2015-12 | |
1 NPL RATIO (*) | | | 2.7 | | | | 2.9 | | | | 2.8 | | | | 2.9 | | | | 3.1 | |
2 CAPITAL ADEQUACY RATIO | | | 16.6 | | | | 17.9 | | | | 15.3 | | | | 16.3 | | | | 15.6 | |
3 LOAN TO DEPOSIT RATIO (*) | | | 101.0 | | | | 106.1 | | | | 114.1 | | | | 121.6 | | | | 123.4 | |
4 RETURN ON ASSETS (ROA) | | | 1.7 | | | | 1.8 | | | | 1.6 | | | | 1.3 | | | | 1.2 | |
5 RETURN ON EQUITY (ROE) | | | 15.5 | | | | 15.7 | | | | 14.2 | | | | 12.2 | | | | 11.3 | |
6 NET INTEREST MARGIN | | | 3.5 | | | | 4.1 | | | | 3.7 | | | | 3.5 | | | | 3.5 | |
7 TOTAL ASSETS / GDP | | | 93.8 | | | | 96.7 | | | | 110.9 | | | | 114.0 | | | | 124.6 | |
8 LEVERAGE RATIO | | | 8.8 | | | | 9.8 | | | | 8 | | | | 8.3 | | | | 7.9 | |
| (*) | Leasing receivables and non-performing loans included in total loans. |
Source: BRSA
Main indicators of Turkish banking sector (see table above) demonstrate that the Turkish banking sector has strong fundamentals with its independent regulatory and supervisory authority, careful consideration for banking licenses, compliance with international standards, risk-based supervision, capital adequacy ratio (which is well above the regulatory level), liquidity regulations and BRSA approval for profit distribution.
The capital structures of banks in the system were the core of the restructuring program which was implemented in May 2001 and finalized in 2004. A three-phase audit was implemented to understand the capital structures of private banks. As of December 2015, the average capital adequacy ratio of the whole sector was 15.6%. As of January 2014, banks began to calculate capital adequacy ratio according to Basel III rules.
The universal banking system in Turkey allows commercial banks to engage in banking and other financial services. Three of the commercial banks in Turkey are state-owned banks. The major commercial banks are internationally recognized institutions with nationwide branch networks and deposit bases. Banks are permitted to deal in foreign exchange and to borrow and lend in foreign currency.
99
State Banks
State banks have become better at identifying problematic loans and setting aside appropriate provisions for such loans, which has increased transparency. The non-performing loans portfolio of the 3 deposit-taking state banks was TL 4,689 million as of December 2011 and TL 11,964 million as of December 2015. The provision made for these non-performing loans was TL 4,056 million in 2011 and increased to TL 9,342 million in 2015. The non-performing loan ratio of state banks has increased from 2.5% in 2011 to 2.7% in 2015.
In order to strengthen the capital structure of state banks, funds in the form of both securities and cash were injected into these banks. The equity capital of those banks was TL 31.1 billion as of December 2011, TL 41.4 billion as of December 2012, TL 45.1 billion as of December 2013, TL 59.8 billion as of December 2014 and TL 67.7 billion as of December 2015. Capital injections as well as the increased share of Treasury papers carrying zero risk-weight contributed to the increase in capital adequacy. The state banks determine lending rates while taking into account funding costs in order to achieve efficiency and profitability.
Table 40
Aggregated Balance Sheet of State Banks
| | | | | | | | | | | | | | | | | | | | | | | | | | | | | | | | | | | | | | | | |
| | | Dec. | | | Dec. | | | Dec. | | | Dec. | | | Dec. | | | Dec. | | | % Share Dec. | | | Dec. | | | Dec. | | | Dec. | |
| (million TL) | | 2011 | | | 2012 | | | 2013 | | | 2014 | | | 2015 | | | 2011 | | | 2012 | | | 2013 | | | 2014 | | | 2015 | |
Assets | | | | | | | | | | | | | | | | | | | | | | | | | | | | | | | | |
Cash and Claims on Banks | | | 17,922 | | | | 19,734 | | | | 21,551 | | | | 21,980 | | | | 27,308 | | | | 5.2 | | | | 5.2 | | | | 4.5 | | | | 3.9 | | | | 4.1 | |
Securities Portfolio | | | 110,287 | | | | 101,291 | | | | 108,854 | | | | 106,644 | | | | 110,943 | | | | 32.3 | | | | 26.9 | | | | 22.5 | | | | 19.0 | | | | 16.5 | |
Loans | | | 181,222 | | | | 200,849 | | | | 277,040 | | | | 340,448 | | | | 427,450 | | | | 53.1 | | | | 53.3 | | | | 57.3 | | | | 60.6 | | | | 63.4 | |
Loans under Follow-Up (Net) | | | 632 | | | | 1,405 | | | | 1,485 | | | | 2,310 | | | | 2,622 | | | | 0.2 | | | | 0.4 | | | | 0.3 | | | | 0.4 | | | | 0.4 | |
-Loans under Follow-Up | | | 4,689 | | | | 6,742 | | | | 8,194 | | | | 10,391 | | | | 11,964 | | | | 1.4 | | | | 1.8 | | | | 1.7 | | | | 1.8 | | | | 1.8 | |
-Provisions for Loans under Follow-Up(-) | | | 4,056 | | | | 5,338 | | | | 6,709 | | | | 8,081 | | | | 9,342 | | | | 1.2 | | | | 1.4 | | | | 1.4 | | | | 1.4 | | | | 1.4 | |
Duty Losses | | | — | | | | — | | | | — | | | | — | | | | — | | | | — | | | | | | | | | | | | | | | | | |
Other Assets | | | 31,486 | | | | 53,438 | | | | 74,448 | | | | 90,786 | | | | 105,402 | | | | 9.2 | | | | 14.2 | | | | 15.4 | | | | 16.1 | | | | 15.6 | |
Liabilities | | | | | | | | | | | | | | | | | | | | | | | | | | | | |
Deposit (1) | | | 225,330 | | | | 246,335 | | | | 300,536 | | | | 319,729 | | | | 386,953 | | | | 66.0 | | | | 65.4 | | | | 62.2 | | | | 56.9 | | | | 57.4 | |
Borrowings from Banks (2) | | | 29,637 | | | | 36,490 | | | | 55,661 | | | | 69,654 | | | | 88,069 | | | | 8,7 | | | | 9.7 | | | | 11.5 | | | | 12.4 | | | | 13.1 | |
Other Liabilities | | | 55,497 | | | | 52,483 | | | | 82.053 | | | | 112,937 | | | | 130,965 | | | | 16.2 | | | | 13.9 | | | | 17.0 | | | | 20.1 | | | | 19.4 | |
Shareholder’s Equity | | | 31,116 | | | | 41,409 | | | | 45,129 | | | | 59,848 | | | | 67,738 | | | | 9.1 | | | | 11.0 | | | | 9.3 | | | | 10.6 | | | | 10.1 | |
Balance Sheet Total | | | 341,550 | | | | 376,716 | | | | 483,378 | | | | 562,168 | | | | 673,725 | | | | 100.0 | | | | 100.0 | | | | 100.0 | | | | 100.0 | | | | 100.0 | |
| (1) | Interbank deposits are excluded. |
| (2) | This item excludes interbank deposits and interbank money market transactions. |
Source: BRSA
In the aftermath of the restructuring of state banks, a positive impact of such financial and operational restructuring is apparent in the profitability performance of the state banks. As of December 2011, the total profit of three state banks reached TL 5,373 million (Ziraat Bankasi TL 2,101, Halk Bankasi TL 2,045 and Vakifbank TL 1,227 million). As of December 2012, total profit of these banks was TL 6,706 million (Ziraat Bankasi TL 2,650 million, Halk Bankasi TL 2,595 million and Vakifbank TL 1,460 million). As of December 2013 the total profit of these three banks was TL 7,666 million (Ziraat Bankasi TL 3,330 million, Halk Bankasi TL 2,751 million and Vakifbank TL 1,586 million). As of December 2014, total profit of these three state banks reached TL 8,010 (Ziraat Bankasi TL 4,051 million, Halk Bankasi TL 2,206 million and Vakifbank TL 1,753 million). As of December 2015, total profit of these three banks increased to TL 9,408 million (Ziraat Bankasi TL 5,162 million, Halk Bankasi TL 2,315 million, Vakifbank TL 1,930 million) in 2015.
The SDIF Banks
The SDIF has taken over 26 private banks since 1994. Of these 26 banks, banking operating licenses of 5 banks were revoked and bankruptcy orders were issued for these banks and the management and control of 21 other banks were transferred to the SDIF along with the shareholders rights except dividends. The shareholder rights excluding dividends and the management and control of Bank Asya were transferred to the SDIF in 2015. The SDIF banks were subjected to an intensive financial and operational restructuring process following their takeover.
98
Total cost of financial restructuring and repayment of insured deposits amounted to U.S.$31.2 billion for 26 banks. Of this amount, U.S.$27.2 billion was obtained from public sector resources (the Undersecretariat of Treasury and the CBRT), and U.S.$4.2 billion from private sector resources (i.e., from the SDIF’s own resources). A considerable portion of the SDIF’s income comes from insurance premiums collected from banks. Cash penalties, collections, income generated from bank sales and deposits which have been subject to prescription constitute other sources of income for the SDIF. As part of the resolution operations, of the amount of U.S.$27.2 billion obtained from public sector resources, U.S.$13.4 billion was repaid to the Undersecretariat of Treasury and the CBRT as of December 31, 2015 and the SDIF will continue to repay the remaining amount. With a view to accelerate the resolution of the SDIF banks, their deposits and foreign exchange liabilities were transferred to other banks. An important portion of the SDIF banks’ deposits were sold to other banks through a series of auctions, backed by matching government securities portfolios. Auctions were realized within a separate bidding process for pools of TL and foreign exchange deposits in 5 stages. As a result of these auctions, TL 479 million and U.S.$2.59 billion in foreign exchange denominated deposits were transferred to 8 private banks.
Recovery Activities
As a result of the proceedings carried out with powers entrusted to the SDIF by Banking Law and Act No. 6183 on Procedures for Collection of Public Receivables, the SDIF made significant progress in the effective collection of public receivables. The total amount of collections made as a result of resolution operations reached U.S.$21.46 billion as of December 31, 2015. Of this amount, U.S.$158.9 million was collected in 2015, with U.S.$98.1 million collected from non-performing receivables, U.S.$31.4 million collected from subsidiaries, real estate and movables, U.S.$20.2 million collected from deposit collections and U.S.$9.2 million collected from Banks under the management of the SDIF.
Collection of Non-Performing Receivables
As a part of resolution of banks transferred to the SDIF, a total of 208,106 files of receivables worth TL 8.83 billion were transferred and assigned from the relevant banks and through other firms as of the end of 2015. Three files of receivables were transferred and assigned in 2015. All files were acquired free of charge. The net amount of collections (after deducting refunds from collection of U.S.$98 million) from non-performing loans of the SDIF in 2015 totaled U.S.$81.42 million.
Receivables from Bank Majority Shareholders
The SDIF collects receivables acquired from majority shareholders and those stemming from misuse of bank resources by majority shareholders via proceedings under Law No. 2004 and Law No. 6183, and protocols, which are agreements relating to payment of debts, or Financial Restructuring Agreements (“FRAs”) signed with majority shareholders or by exercising the authority entrusted by the Banking Law.
The SDIF has completed deals with bank majority shareholders relating to loans and terms of refunds, and has made substantial progress in collecting public receivables. If a bank majority shareholder does not fulfill its obligations, including not making duly or timely payments as required by the protocols, the SDIF intends to exercise its legal rights under any protocol or FRA.
Status of Certain Majority Shareholders
Bayindir Group—Bayindirbank: On December 27, 2012, the SDIF announced a default on certain provisions of the FRA signed on October 25, 2002, among Bayindir Group, the SDIF, and 16 other creditor banks and finance institutions, against the Bayindir Group. Legal proceedings are in progress against debtors and legal representatives in accordance with Law No. 6183. The SDIF took over shareholder rights, except dividends and management of Bakara Ilac ve Tibbi Malzeme Pazarlama Dis Ticaret AS., in accordance with the provisions of Banking Law No.5411. A protocol was signed between the SDIF and the Buyukhanli Group on August 6, 2015. The total amount of collections from Bayindir Group stood at U.S.$75.00 million as of December 31, 2015.
Uzan Group—Imar Bank: In accordance with the provisions of Law No. 6183 and the provisions of Article 15 of Banking Law No. 4389 abolished and amended by Law No. 5354, the SDIF continued to track and collect goods, rights and assets seized in line with the provisions of Law No. 6183. The gross collection from the Imar Bankasi reached U.S.$7.50 billion as of December 31, 2015. Of this amount, a total of U.S.$6.56 billion was transferred to third parties, public institutions and organizations in accordance with the Law on Amendment for Banking Law No.5472 amended by clause 5 of Article 134 of Banking Law No. 5411, and provisions of provisional Article 24. In addition, U.S.$13.19 million in collection tracked in apportioned accounts will be apportioned in accordance with the priority lists to be formed upon the conclusion of the lawsuit subject to various appeals. U.S.$35.39 million was collected from Imar in 2015. The total amount of net collections amounted to U.S.$957.32 million as of December 31, 2015.
99
Balkaner Group—Yurtbank: The follow-up and collections associated with third parties and companies, to which Ali Avni Balkaner, the majority shareholder of the Yurtbank, transferred the bank resources, are still in progress within the framework of clause 7-b of Article 15 of Banking Law No. 4389 and of Article 134 of Banking Law No. 5411. U.S.$8.64 million was collected from Balkaner Group in 2015. The total amount of collections from Balkaner Group and affiliated third party debtors reached U.S.$327.18 million as of December 31, 2015.
Korkmaz Yigit Group – Bank Ekspres: A total of U.S.$12.20 million was amicably collected from the third parties affiliated with the Group in 2015. The total amount of net collections from the Group reached U.S. $82.04 million as of December 31, 2015.
Zeytinoglu Group – Esbank: A tender offer was held in 2015 for Emzet Akaryakit Commercial and Economic Entity comprised of 10 gas stations and operated by Zeytinoglu Ticaret ve Sanayi A.S. and Emzet Akaryakit Dagitim Otomotiv Sanayi ve Ticaret A.S., and was awarded to a buyer through a handover contract. U.S.$5.76 million was collected from Zeytinoglu Group in 2015 for its debts to the SDIF and the total sum of collections amounted to U.S.$397.94 million as of December 31, 2015.
Bank Asya: As per the Fund Board’s Resolution No. 2015/27 dated February 3, 2015, in accordance with the BRSA’s Resolution No. 6187 dated February 3, 2015, pursuant to paragraph 5 of article 18 of Banking Law No. 5411, the Fund is authorized to exercise shareholder rights except dividends for the preferred shares of 123 shareholders of Bank Asya, and as per the Fund Board’s Resolution No. 2015/51 dated March 5, 2015, in accordance with the BRSA’s Resolution No. 6027 dated February 27, 2015, pursuant to paragraph 7 of article 18 of Law No. 5411, the Fund is authorized to execute shareholder rights except dividends for the Group (A) shares of two shareholders of Bank Asya. Subsequently, as per the BRSA’s Resolution No. 6318 dated May 29, 2015, management and control of Bank Asya was transferred to the SDIF along with its shareholders’ rights except dividends for the purpose of partial or full transfer, sale or merger provided that the loss is covered by the capital of the current shareholders pursuant to clause (b) of paragraph 1 of article 71 of Banking Law No.5411. As per the Fund Board’s Resolution No. 2015/134 dated May 29, 2015, the Fund began to exercise shareholder rights except dividends, and management and control of the bank. The bank continues to operate under the management and control of the Fund pursuant to article 107 of Banking Law No 5411.
Litigation
Several claimants have filed claims against the Republic ranging from U.S.$750 million to U.S.$19 billion before the International Center for the Settlement of Investment Disputes (“ICSID”) or under the United Nations Commission on International Trade Arbitration Rules (“UNCITRAL”) alleging either that (a) they have been harmed because SDIF’s takeover of banks indirectly impaired their investments in companies affiliated with these banks or their shareholders, without adequate compensation, or (b) they have been indirectly harmed because the Republic cancelled certain contracts with companies in which they allege they held investments. The Republic believes that it has meritorious defenses to all of these claims. The Republic does not believe that such proceedings will in aggregate have a material adverse impact and five of the claims against the Republic previously before ICSID and two of the claims before UNCITRAL have been dismissed.
Another UNCITRAL case initiated against Azerbaijan Government has been settled. Deep Woods, situated in New York, filed an action (claiming U.S.$16 million) against the SDIF relating to an agreement between the parties. American courts ultimately found in favor of the SDIF.
Certain arbitration cases are being handled by different Ministries. For instance Cem Uzan, alleging he has shares of CEAS-KEPEZ, initiated arbitration procedures against the Republic requesting payment in the amount of €2.5 billion. The claim was handled by the Ministry of Energy and Natural Resources and has been dismissed. Since the Imar Bank was taken over by the SDIF, the SDIF has provided the Ministry of Energy and Natural Resources with documents and information with respect to the Uzan Group as well as comments on the documents, petitions and expert reports submitted by Imar Bank.
Further, Uzan, Suzer, Cingilli Groups and Yasar Holding have filed a number of cases against the Republic in the European Court of Human Rights. These cases are generally handled by the Ministry of Justice. These cases are related to each bank being taken over by the SDIF. The documents and information with respect to these cases are provided by the SDIF for the Ministry of Justice, and the SDIF provides comments on any counterparty petitions to the Ministry of Justice.
Regulatory and Supervisory Framework
In the process of preparing the Banking Act No. 5411, international standards were considered. The main highlights of the Banking Act No. 5411 with respect to regulation and supervision include:
| | • | | The BRSA supervision of banks, financial holding, leasing, factoring and consumer finance companies, independent audit firms, asset management companies, valuation, rating and outsourcing institutions. |
| | �� | | Conformity with EU Directives in terms of the activities that banks are allowed to perform. |
| | • | | Increased transparency of the BRSA. |
| | • | | Establishing principles of corporate governance for Turkish banks and financial holding companies. |
100
| | • | | The paid-up capital for establishment of banks cannot be less than TL 30 million and increase in capital must be paid in cash free from any collusion and without using internal resources, excluding resources permitted to be added to capital by the related legislation. |
| | • | | Disclosure by banks of their most recent articles of association on their web sites to increase transparency. |
| | • | | The establishment of audit committees within banks to conduct the audit and supervisory functions of their executive boards. |
| | • | | Prohibiting the transfer of resources to finance deficits of funds established by the institutions exclusively for their employees that provide health, social aid and retirement benefits. |
| | • | | Grants extended by banks and institutions subject to consolidation in a fiscal year shall not exceed 0.4% of the bank’s shareholders’ equity. However, half of these grants shall be extended to areas that are exempted from taxes by law. |
The regulations set forth in Banking Act No. 5411 have been implemented since the end of October 2006. The regulations concentrate on capital adequacy, risk management, lending and subsidiary limits, loan loss provisioning, compliance with International Accounting Standards, independent auditing and cooperation with foreign supervisory authorities. Regulations regarding leasing, factoring and financing companies, independent audit firms, valuation and rating institutions, outsourcing institutions, principles of corporate governance for banks, audit committee and internal systems within the banks, accounting and information systems, capital adequacy and own funds, and liquidity are also important for the Turkish banking system.
The Regulation on Banks’ Corporate Governance Principles is a regulation which came into force as of November 1, 2006, which revised the corporate governance principles of banks according to principles recommended by the Basel Committee on Banking Supervision (“BCBS”). An amendment to this regulation was published in the Official Gazette dated June 06, 2011, No. 27959 and became effective in January 1, 2012, setting forth the framework for compensation policies of banks for their employees.
The Regulation on Outsourcing by Banks was published in the Official Gazette on November 5, 2011, No. 28106. With this new regulation, instead of requiring the BRSA authorization for both banks and the provider of the outsourced service/activity, a bank that has purchased an outsourced service that it will provide to customers is simply required to inform the BRSA about the outsourced activities. Moreover, the definition of outsourcing activities and exceptions/limitations to such activities has been re-defined in order to achieve greater compliance with international standards.
The Act on Bank Cards and Credit Cards No. 5464 was published in the Official Gazette No. 26095 dated March 1, 2006. The law regulates credit card issuers and provides protections for cardholders.
The Regulation on Bank Cards and Credit Cards was published in the Official Gazette No. 26458 on March 10, 2007, amended on December 17, 2010 and further amended on December 31, 2013. This regulation sets forth: the procedures and principles regarding the issuance, use, clearing and settlement of bank cards and credit cards, the rules surrounding licensing and operation of card system organizations and card issuing organizations, the rules concerning the legal form and general transaction terms of bank card and credit card contracts, the operating principles of the institutions in card payments systems, minimum payment amounts, the ratio for a particular credit card debt associated with the holder’s card limit, and installment limitations.
Department of Information Systems Compliance was formed in 2014 having been a subdivision of another department for the previous decade. Department of Information Systems Compliance is responsible of overseeing banks, independent auditors and auditing firms from an IT perspective. According to the “Auditing Bank’s Information Systems by Independent Auditing Firms” regulation, each bank’s internal controls over banking processes must be audited once a year and its controls over IT processes must be audited once every two years by an authorized independent auditor. The Department of Information Systems Compliance evaluates and takes required actions according to the independent IT Audit reports. These reports are prepared by the independent auditors following IT audits. Banks propose corrective actions for each of these findings to mitigate the risks caused by these findings. An online monitoring system (“BADES”) is used for monitoring the activities of independent audit firms and tracking the audit findings revealed by the auditors as well as the semiannual reports filed by banks comprising the corrective actions regarding these findings.
Regulations regarding IT audits performed by independent auditors were updated in 2010 by the IT Audit Subdivision at Department of the Information Management. On July 30, 2010, the BRSA issued the “Circular of Management Representation”, which became effective as of 2011, requiring banks’ board of directors to submit a written representation to the independent auditor regarding effectiveness, adequacy and compliance of the bank’s internal controls.
The BRSA started its own planned IT audit activities in 2009. The BRSA carried out IT audits of one bank and one factoring firm in 2011, 12 banks in 2012, 8 banks in 2013, 2 auditing firms and 9 banks in 2014, and 9 banks in 2015.
As an additional security precaution to prevent potential data breaches, penetration tests are conducted at each bank in accordance with the circular issued by the BRSA on July 24, 2012. According to the circular, these tests have to be performed by independent security firms and the results of the tests as well as the corrective actions taken by banks have to be reported to the BRSA by using BADES web application. The BRSA supervises this process and tracks the corrective actions since 2013.
101
“Communiqué on Principles to be Considered in Information Systems Management and Audit in e-Money and Payment Institutions” was published on the Official Gazette on June 27, 2014. The Communiqué defines principles to be adopted in IT management of e-money and payment institutions. It also includes the rules to be followed in an IT audit, which comprises the examination of controls over IT processes by an authorized independent auditor. E-money and Payment Institutions are audited by authorized independent auditors, the reports of these audits are evaluated by Department of Information Systems Compliance and results are transferred to related departments in BRSA.
Within the scope of the Law Making Amendments to the Laws on Re-structuring of some Receivables and Social Insurance and General Health Insurance Law and Some Other Laws and Decree Laws, certain articles of the Banking Law particularly regarding re-location of BRSA Headquarter to Istanbul and establishment of a “Risk Center” within the Bank’s Association of Turkey were amended. Acquisition of liability insurance coverage for valuation and rating and outsourcing companies has been made mandatory only when demanded by banks or deemed necessary by the BRSA, whereas it is still compulsory for independent audit firms.
Pursuant to principle 5 of the “Core Principles for Effective Banking Supervision” published by the BCBS, an amendment was made to the Article 8 of the Regulation on Operations of Banks Subject to Permission and Indirect Shareholding published in the Official Gazette dated February 4, 2011 and No. 27836. With the amendment Banks may establish or participate in domestic partnerships with other banks, with the BRSA’s approval.
With the Regulation on Measurement and Evaluation of Interest Rate Risk in the Banking Book under the Standard Shock Method published in the Official Gazette dated August 23, 2011 and No. 28034, the principles and procedures were set for interest rate risk arising from on-balance and off-balance banking book accounts.
The implementation process of “International Convergence of Capital Measurement and Capital Standards” (Basel II) was initiated on July 1, 2012 in the Turkish banking system following the one year parallel implementation period to facilitate the transition.
In 2013, one new law, four laws amending the Banking Law, five new regulations and 2 new communiqués were published. Additionally, fourteen regulations and three communiqués were amended and one circular was issued. The most important regulations and amendments are listed below.
| | • | | Regulation on Capital Conservation and Counter-cyclical Capital Buffers, published in the Official Gazette No. 28812, on November 5, 2013, introduces additional capital buffers—a “mandatory capital conservation buffer” of 2.5% and a “discretionary counter-cyclical buffer”, which would allow national regulators to require up to another 2.5% of capital during periods of high credit growth. Buffer requirements will be put into effect following the same time-lines of European Union and Basel Committee for this area. |
| | • | | Regulation on Own Funds of Banks, published in the Official Gazette No. 28756, on September 5, 2013, replaces the previous regulation with the aim to fully incorporate amendments and new rules introduced with Basel III accord regarding own funds. |
| | • | | Regulation on Calculation of Leverage Ratio, published in the Official Gazette No. 28812, on November 5, 2013, requires banks to calculate and report leverage ratio to help restrict cyclical movements as complementary to risk-sensitive capital calculation in line with BCBS standards and EU legislation. |
| | • | | Regulation Amending the Regulation on Measurement and Evaluation of Capital Adequacy of Banks, the risk weights applied to credit card installments has been increased by 25 basis points for 1 to 6 months, and by 50 basis points for other maturities. Accordingly, risk weight has been raised to 100% for credit card installments of 1 to 6 months, 200% for 6 to 12 months and 250% for credit card installments of more than 12 months. |
The Act on Financial Leasing, Factoring and Financing Companies No. 6361 was published in the Official Gazette No. 28496 dated December 13, 2012. The objective of this law is to regulate the establishment and operating principles of financial leasing, factoring and financing companies operating as financial institutions as well as the principles and procedures relating to financial leasing, factoring and financing contracts. Regulation on Establishment and Operation Principles of Financial Leasing, Factoring and Financing Companies No: 28627 was published on April 24, 2013. This complementary regulation sets out the principles and procedures applicable to establishment of financial leasing, factoring and financing companies, issuance of operation permits for them, opening of domestic and overseas branches by these companies, share acquisitions, transfers, merger, disintegration and liquidation, their managers, shareholders’ equity and transaction limits, internal systems, provisions, and independent audit.
In 2014, four new regulations and four new communiques were published, and fourteen regulations and ten communiques were amended. Most important of which, two communiques, published in the Official Gazette No. 29111 on September 6, 2014, allow banks to apply the internal ratings based approaches for credit risk and the advanced measurement approach for operational risk beginning January 1, 2015.
In 2015, four new regulations and four new communiques were published, and 21 regulations and six communiques were amended. During the second half of 2015 to the beginning of 2016, Turkey completed the process of Regulatory Consistency Assessment Program (“RCAP”) of BCBS. The RCAP report of Turkey was published on March 31, 2016. Turkey was assessed as fully compliant to all risk based capital standards of Basel II and Basel III as well as standards for liquidity coverage ratio. During RCAP, some minor amendments were made on a number of regulations while some new regulations have been published. Independent of RCAP, new regulations were published in 2015, the most important of which are the Regulation on Principles and Procedures Concerning Factoring Transactions, Regulation on Independent Auditing of Banks and Regulation on Principles for Repo and Reverse Repo Transactions of Banks.
102
CAPITAL MARKETS
The new Capital Markets Law No. 6362 (“CML”) came into force on December 30, 2012, when it was published in the Official Gazette numbered 28513 and superseded Capital Market Law No. 2499. It includes several new rules regarding capital market instruments and issuers, financial reporting, independent external auditing, credit rating and appraisal agencies, capital market activities, intermediary institutions, portfolio management companies, portfolio custodians, self-regulatory organizations, institutional investors, supervision and measures, capital market crimes and penalties. Upon entry into force, secondary regulations within the scope of the CML as well as studies in an effort to form the legal infrastructure compatible with the EU Directives were completed in 2014.
Exchanges and Trading Platforms
The CML yielded very important amendments in the field of operations and structure of stock exchanges. Firstly, the law has changed the definition of “stock exchange”, which previously had to be established as a public entity according to Capital Market Law No. 2499 and regulated in the same manner as a corporation. In that regard, the Istanbul Stock Exchange has been restructured and rebranded as “Borsa İstanbul AŞ.” (“Borsa Istanbul”) which is a joint stock company subject to private law. Secondly, the CML has ensured a more professional and competitive environment for Turkish stock exchanges with additional regulations in respect of market operators and tradable instruments. In 2015, shares of 6 companies whose prospectuses are approved for initial public offerings began being traded on Borsa İstanbul. These initial public offerings raised approximately U.S.$41 million. By the end of 2015, 514 companies were registered with the Capital Markets Board (“CMB”), of which 416 were traded on Borsa Istanbul. There were 117 corporations traded on the BIST Stars (former National Market), 184 corporations on the BIST Main Market (former Second National Market), 48 corporations on the Collective and Structured Products (former Collective Products Market), 33 corporations on the Watch List Market, 14 corporations on the Free Trading Platform and 20 corporations on the Emerging Companies Market making a total of 416. With respect to the securities issued by these corporations, the CML and secondary regulations have envisaged new proactive enforcement measures to combat market abuse in order to enhance investor protection and confidence.
Issuers
According to the CML, when securities are offered to the public or admitted to trading on a regulated market, a prospectus must be prepared and approved by the CMB. The Communiqué on Prospectus and Issue Document (Serial: II-5.1) came into force on July 22, 2013. The regulation relates to the implementation of the CML in respect of drafting, approving and distributing a prospectus. With this Communiqué, regulations contained in Directive 2003/71/EC of the European Parliament and of the Council have been adopted in order to harmonize the CML, and in turn Turkish legislation, with EU legislation. Prospectus formats in line with EU regulations have been approved by CMB and activities conducted in collaboration with European Securities and Markets Authority (“ESMA”) regarding harmonization of prospectus formats are complete. ESMA, with its opinion dated February 8, 2016, considered that a prospectus drawn up for share issuances according to Turkish laws and regulations can constitute a valid prospectus under the Directive 2003/71/EC for the purposes of its approval by the home competent authority of a Member State.
Collective Investment Schemes
The CML introduced a new structure where mutual funds can flourish and serve as a medium of collective investment that meets the demands of Turkish investors. Portfolio management companies (“PMCs”) are centered into the system as the only founder of the mutual funds. The overarching aim of the changes is to increase the competition in the mutual fund sector which is anticipated to lead to an increase in the performance of the mutual funds. PMCs that are not affiliated with any banking conglomerates have previously lacked the distribution channel to market their products. The CML liberates the distribution channels so that PMCs with good performances in both the mutual fund sector and other alternative investments can find their way to investors. Also, the CML regulates new types of funds such as venture capital investment funds and real estate investment funds. Another novelty brought by the CML is that portfolios of mutual funds are to be held in portfolio custodians in order to inject more credibility into the system. Portfolio custodians are assigned foremost with the task to monitor portfolio management activities, check if these activities are in line with the objectives of the funds and calculate the net asset value of the funds.
Variable capital investment companies which are a hybrid of mutual funds and investment companies were also introduced to the markets with the CML. This collective investment scheme combines the advantages of investment companies and of the mutual funds. Principles regarding investment companies with variable capital are regulated by the provisions of Securities Investment Companies Communique which came into force on May 27, 2015. Mutual funds, including those established by non-bank financial institutions, have been differentiated based on portfolio structure. To encourage individuals to invest in the capital markets, withholding tax will not be applicable for the income derived from the disposal of participation certificates of both investment funds if 51% of their portfolio is comprised of shares trading on the Borsa Istanbul provided that the holding period is more than one year and investment
103
funds if 75% of their portfolio is comprised of shares (except securities investment companies) trading on the Borsa Istanbul. Further, the withholding tax rate is set as 0% for both domestic and foreign legal entities. As of the end of 2015, the number of domestic mutual funds offered to the public equaled 431 and total net asset value of these mutual funds equaled TL 39.03 billion. Pension funds began to operate in October 2003. As of the end of 2015, the number of pension funds offered to the public was 250. The total net asset value of these funds equals TL 48 billion. According to the new Communique on Mutual Funds that came into effect in July 2014, an umbrella fund structure, which was required only for capital protected and capital guaranteed funds before, has been obligatory for all mutual funds.
As of the end of 2015, 59 hedge funds registered with total net asset value of TL 2.03 billion. As of the end of 2015, the number of exchange traded funds offered to the public equaled 11. The total net asset value of exchange-traded funds equaled TL 123 million as of the end of 2015. As of the end of 2015, the number of capital protected funds offered to the public equaled 7, down from 33 in 2014, which is primarily due to decreased demand for this type of fund. The total net asset value of capital-protected funds equals TL 158.0 million.
Securities investment companies, real estate investment companies and venture capital investment companies are other types of collective investment schemes subject to the CML. To improve the institutional investor base, the Government has exempted these investment companies from corporate tax. As of the end of 2015, the number of listed securities investment companies equaled 9, listed real estate investment companies equaled 31 and listed venture capital investment companies equaled 8. The total net asset value of securities investment companies equaled TL 437.0 million, the market value of listed venture capital investment companies equaled TL 1.3 billion and the market value of real estate investment companies equaled TL 21.3 billion. As of the end of 2015, two real estate mutual funds and one venture capital mutual fund have been formed. The sale of participation units for one of the real estate mutual funds and the venture capital mutual fund had begun by July 2016.
Trading on Turkey Electronic Fund Distribution Platform (“TEFAS”), a supermarket of funds facilitating access by investors to funds, started on January 9, 2015. TEFAS is operated by İstanbul Settlement and Custody Bank. All individual and institutional investors holding an investment account with investment institutions authorized by the Capital Markets Board or that are clients of portfolio management companies may use TEFAS.
Market Intermediaries and Infrastructure
The CML has regulated central counterparties, trade repositories, custody services, Investor Compensation Center and outsourcing of investment firms for the first time. The law also redefined investment services eschewing the previous activity type-based classification and introduced the concept of ancillary services. In order to further explain those new concepts, several regulatory works have been concluded. In this regard, a new communiqué on investment services and ancillary services was published in July of 2013. The new communiqué classified intermediary institutions based on the investment services they provide, which have been defined in the CML. Further, a new communiqué on the principles of foundation and activities of investment firms was published in December 2013. The communiqué brought new provisions especially concerning code of conduct, customer classification and protection. With this communiqué, regulations contained in Directive 2004/39/EC of the European Parliament and of the Council have been adopted in order to harmonize the capital markets legislation and in turn Turkish legislation, with EU legislation.
Intermediation in leveraged transactions on foreign exchange, commodities, precious metals or other assets which are widely known as “forex” has been the responsibility of the CMB since August 31, 2011. Under the CML, forex is classified as a derivative instrument and in the new communiqué the principles are revised to comply with the principles for other derivative instruments.
The revised Regulation on Central Clearing was published in July of 2013 and a new Regulation on Central Counter Party was published in August 2013. With the publication of Regulation on Investor Compensation Center in June of 2013, the Center was officially established. Within the framework of Capital Market Law No. 2499 and related regulations, the Central Registration Agency (“CRA”) was empowered to represent and manage the Investors Protection Fund (“IPF”). However, article 84 of the CML replaced the IPF with a new legal entity named Investment Compensation Center. The scope of the compensation consists of claims arising from failure to fulfill cash payment or capital market instrument delivery obligations with regard to assets belonging to investors kept or managed by investment firms in the name of investor in relation to investment services and activities or ancillary services.
The CRA has been authorized to operate as a Trade Repository since April 3, 2015, and is the only Trade Repository officially authorized to operate in Turkey. While being authorized as a Trade Repository, CRA is not actively collecting transaction data, since related regulations on data collection are not in force yet.
Dematerialization of Capital Market Instruments
The dematerialized system became operational for equities traded on the Borsa Istanbul in 2005 for mutual fund certificates and corporate bonds in 2006, for commercial papers in 2007 and for bank bills in 2009. As of June 30, 2012, holdings of the retail clients on government bonds and bills have been also dematerialized by the Central Registration Agency (“CRA”). As of the end of 2015, the market value of those government bonds and bills held by CRA was U.S.$63 billion.
104
Licensing of Individual Market Professionals
On June 16, 2011, the Capital Markets Licensing, Registration and Training Corporation (the “SPL”) was established. Since 2013, the examinations were organized by the SPL, the CMB and the Anadolu University. As of the end of 2015, the total number of licenses for professionals who engage in capital markets activities granted reached 69,101, as described in further detail:
Table 41
| | | | |
Types of Licenses | | Licenses Issued 2002-2015 | |
Capital Market Activities Level 2 | | | 18,103 | |
Capital Market Activities Level 1 | | | 14,905 | |
Capital Market Activities Level 3 | | | 13,062 | |
Derivative Instruments | | | 9,504 | |
Real Estate Appraiser | | | 6,079 | |
Credit Rating | | | 3,472 | |
Corporate Governance Rating | | | 3,247 | |
Residential Real Estate Appraiser | | | 729 | |
TOTAL | | | 69,101 | |
Source: CMB
Financial Reporting and Auditing Standards
Turkish Accounting Standards, as the official translation of International Financial Reporting Standards issued by the International Accounting Standards Board, that are disclosed by Turkish Public Oversight Accounting and Auditing Standards Authority, have been adopted for financial reporting of listed companies, intermediary institutions and portfolio management companies. Similarly, Turkish Auditing Standards, as the official translation of International Standards on Auditing issued by the International Federation of Accountants (“IFAC”), that are also disclosed by Public Oversight, Accounting and Auditing Standards Authority of Turkey, have been applied to audits of securities market companies and institutions according to Article 14 of the CML. There are 100 authorized audit firms operating in Turkish capital markets and 73 of them have an international membership.
Corporate Governance
Currently, the Borsa Istanbul Corporate Governance index is composed of 49 companies that have an average corporate governance rating of 9.12 out of 10. The opening value for the index was 48,082.17 and as of December 31, 2015, the value of the index has reached 62,269.
Additionally, corporate governance principles are regulated by Article 17 of CML. In line with the authority given by CML, the Communiqué on Corporate Governance (Serial: II-17.1) came into force on January 3, 2014. With this Communiqué, principles of corporate governance to be applied by corporations are determined in detail. “Corporate Governance Principles” in which the “comply or explain” approach was valid since their publication in 2003, have been adopted as a legal requirement in the new Law. Provisions such as independent board members, shareholders’ rights and high standards of disclosure are compulsory with the purpose of enhancing corporate governance for listed companies. Moreover, the CMB is explicitly granted the authority to make regulations and require listed companies to comply (partially or fully) with such rules. The concept of “significant transactions” was introduced and the CMB was authorized to make rules regarding these transactions, which include mergers and divisions, sale of all or a significant portion of assets, a significant change in the field of activity, introduction of privileges or changes in the scope and content of existing privileges and delisting. In case of significant transactions minority shareholders who vote against the transaction in the general assembly were granted a sell-out right. New quorums were defined for general assembly meetings of publicly held corporations depending on the circumstances under which meetings are held and agenda items. Also, online general assembly meetings were enabled.
Derivatives Market
The CML has brought a structural change opportunity for Turkish Derivatives Exchange. According to Article 138 of the CML, organized markets are designed to be operated under a single structure and it became possible for Turkish Derivatives Exchange to merge with Borsa Istanbul. After that, a new derivatives market was established within Borsa Istanbul, the Futures and Options Market (“VIOP”), for both futures and options as well as other derivative contracts and according to the CML, the Turkish Derivatives Exchange was merged in Borsa Istanbul. Accordingly the contracts on the Turkish Derivatives Exchange were closed to trading and started to trade in VIOP by August 5, 2013.
105
Market Statistics
The following table shows market activity in the Turkish capital markets for the periods indicated:
Table 42
| | | | | | | | | | | | | | | | | | | | |
| | | 2011 | | | 2012 | | | 2013 | | | 2014 | | | 2015 | |
Outstanding Securities (in millions of TL) | | | 472,677 | | | | 512,948 | | | | 526,972 | | | | 567,668 | | | | 594,691 | |
Private | | | 103,898 | | | | 126,406 | | | | 123,965 | | | | 153,020 | | | | 154,567 | |
Public | | | 368,728 | | | | 386,542 | | | | 403,007 | | | | 414,648 | | | | 440,124 | |
Traded value on the Borsa Istanbul Markets (in millions of TL) | | | | | | | | | | | | | | | | | | | | |
Stock Market | | | 695,328 | | | | 621,979 | | | | 816,858 | | | | 870,962 | | | | 1,025,870 | |
Bonds and Bills Market | | | 4,122,292 | | | | 6,828,000 | | | | 6,898,271 | | | | 7,645,000 | | | | 10,267,000 | |
Off-exchange bonds & bills transactions | | | 915,664 | | | | 1,102,459 | | | | 1,153,951 | | | | 1,048,346 | | | | 879,110 | |
Derivatives Market | | | 439,800 | | | | 403,900 | | | | 416,600 | | | | 435,721 | | | | 575,000 | |
Stock Market Capitalization (in millions of TL) | | | 381,152 | | | | 550,051 | | | | 503,668 | | | | 624,369 | | | | 554,880 | |
BIST National 100 Index (on TL basis | | | 51,267 | | | | 78,208 | | | | 67,801 | | | | 85,721 | | | | 71,727 | |
Number of Companies Traded | | | 373 | | | | 395 | | | | 421 | | | | 422 | | | | 416 | |
Sources: Capital Markets Board, Borsa Istanbul, Undersecretariat of Treasury
With the CML, the registration system for capital market instruments to be issued or offered to the public has been replaced with a system of prospectus or issue document approval. Data for securities sold based on approved prospectuses/issue document for the 2013-2015 period are presented below.
Table 43
| | | | | | | | | | | | | | | | | | | | | | | | | | | | |
Securities Sold (in millions of TL) | | Share | | | Asset
Backed
Securities | | | Asset
Covered
Securities | | | Corporate
Bonds | | | Lease
Certificates | | | Warrants/
Certificates | | | Total | |
2013 | | | 6,009 | | | | 516.6 | | | | 710.9 | | | | 78,155 | | | | 734,7 | | | | 71.5 | | | | 86,198 | |
2014 | | | 3,347 | | | | 451.6 | | | | 361.9 | | | | 117,680 | | | | 4,836 | | | | 68.8 | | | | 126,745 | |
2015 | | | 2,230 | | | | — | | | | 726.7 | | | | 110,228 | | | | 3,656 | | | | 51.9 | | | | 116,892 | |
Source: Capital Markets Board
In 2015, approximately TL 2,230 million (U.S.$762.8 million) has been raised through initial public offerings and capital increases through sales of shares based on approved prospectuses/issue documents.
The corporate bond market began to accelerate after 2010. The total amount of market value of outstanding corporate bonds issued domestically rose from TL 2.8 billion at the end of 2010 to TL 46.8 billion at the end of 2015.
As of December 31, 2015, there are 86 investment firms licensed to trade on stock markets, and 44 banks and 70 investment firms licensed to trade on debt securities markets at Borsa Istanbul. In addition, there are 81 intermediary institutions (banks, investment firms) licensed to trade on VIOP. Also, there are 25 firms licensed to trade on precious metals market.
In August 2009 the Borsa Istanbul Emerging Companies Market Regulation was published and in 2011 shares of small and medium sized enterprises began to trade on the ECM market. Additionally, within the framework of the restructuring of the Borsa Istanbul Stock Market segments, the Collective and Structured Products Market was established as a listed market where the shares of investment companies, real estate investment companies, and venture capital investment companies as well as the participation certificates of exchange traded funds, warrants, and other structured products are traded.
Clearing and Settlement, Central Counterparty
The Istanbul Settlement and Custody Bank Inc. (“Takasbank”), is “the Clearing and Settlement Center” for the markets of Borsa Istanbul, the custodian for pension funds and “the National Numbering Agency of Turkey”. Also, Takasbank is a specialized bank established under the Turkish Banking Law and incorporated as a non-deposit taking investment bank dedicated to securities services in Turkey. Having banking capacity, Takasbank provides its members with a money market facility and banking services including cash credits, securities lending and cross-border settlement and custody services via SWIFT and correspondent accounts. Takasbank was authorized as a FOREX Trade Repository Institution by the CMB in 2011.
106
With the new Regulation on Central Counterparty, Takasbank also acts as the central counterparty for the VIOP of Borsa Istanbul and Takasbank Securities Lending and Borrowing Market. In 2013, Takasbank was authorized as the Pre-Local Operating Unit (“Pre-LOU”) authorized to assign Legal Entity Identifier (“LEI”) Code with CMB sponsorship by the Financial Stability Board (“FSB”).
CMB has been effectively maintaining the oversight and supervision of Financial Market Infrastructures operating in Turkish capital markets, including Takasbank. After thorough examination of Takasbank’s operations in the context of Committee on Payments and Market Infrastructures (“CPMI”)—International Organization of Securities Commissions (“IOSCO”) Principles on Financial Market Infrastructures (“PFMIs”), Takasbank is found to observe the CPMI-IOSCO PFMIs. The Board of CMB Turkey, at its meeting on March 23, 2016 decided to declare the acceptance of CPMI-IOSCO PFMIs applicable to FMIs operating in Turkish capital markets and to assume the responsibilities given to itself by the PFMIs for the purposes of protecting the rights of market participants and the stability in the markets and fulfilling its oversight function towards all FMIs operating in Turkish capital markets.
International Relations
With respect to the integration of the Turkish capital markets with the EU and the alignment of Turkish legislation with the EU acquis, the CMB has been working in close contact with the European Commission and the Delegation of the European Union to Turkey as well as other EU institutions and with the CML and following secondary legislation the alignment of Turkish capital market legislation with the EU acquis has been substantially enhanced.
To this end, the CMB has signed various Memoranda of Understanding (“MoU”) and entered into collaborative arrangements with foreign regulatory and enforcement authorities and continues its efforts to sign MoUs concerning the cooperation and sharing of information with foreign authorities. The CMB which is one of the first signatories of the IOSCO MoU, signed 35 MoUs with foreign financial regulatory authorities by the end of 2015 and ongoing initiatives to sign MoUs concerning cooperation with regulatory and supervisory authorities are in progress. Moreover, the CMB has signed bilateral MoUs with 18 countries concerning the cooperation and the exchange of information for the supervision of Alternative Investment Fund Managers.
107
PUBLIC FINANCE
GENERAL
In the course of EU accession negotiations, Turkey has reformed its public financial management in accordance with EU practices and improved budget coverage, formulation, execution, accounting, audit and procurement. The main change was the introduction of the Public Financial Management and Control Law (“PFMC Law”), adopted by the Turkish Parliament in December 2003 (Law No. 5018, as amended in 2005, Law No. 5436). The enactment of the PFMC Law was the defining event that provided for a new legal framework for modern public financial management and accountability, which continues to develop in Turkey today. Since the enactment of the PFMC Law, such key concepts of a modern public financial management system as managerial responsibility models, effective and efficient use of resources, strategic planning, performance-based budgeting, a multi-year budgeting framework, accountability, fiscal transparency, modern internal audit/controls and external audit practices have been put into practice.
The public sector in Turkey includes central government agencies, social security institutions (“SSIs”), local governments (provincial governments, municipalities and villages), financial and non-financial state owned enterprises (“SOEs”) and extra-budgetary funds. The PFMC Law covers central government agencies, social security institutions and local governments which are referred to as the “general government.” All general government agencies prepare their own budgets. The central government consists of three types of agencies: (1) general budget agencies which are government entities, (2) special budget agencies which are public administrations affiliated or related to a ministry which perform a specific public service, to which revenues are allocated, and which are authorized to spend from such revenues, with the establishment and operation principles arranged through special laws and (3) regulatory and supervisory agencies which are established in the form of boards, agencies or supreme boards (agencies which are given a high degree of autonomy) by special laws.
The PFMC Law has been fully implemented and covers public financial management and control at all levels of government. Yet, there are some exceptions for the regulatory and supervisory agencies. The PFMC Law requires in many instances enacting of secondary legislation for its implementation, all of which has been completed.
The budgeting process, accounting system, internal and external audits have each been amended to be in line with the PFMC Law.
Budgeting
The new system has modernized the budgeting process according to international standards. The central budget remains the pivotal point of public finance and is prepared according to a schedule commonly used in OECD countries. There is a rolling multi-year budget framework covering the budget year and the following two years. The annual budget law is accompanied by the appropriation indicators for the following two years. The fiscal year is the calendar year.
As the initial step of the Central Government Budget preparation, a medium-term program is prepared by the Ministry of Development of Turkey (“MoD”) covering macro policies, principles, targets and main economic indicators in the context of development and strategic plans and the requirements of general economic conditions. The medium-term program is then adopted by the Council of Ministers. A medium-term fiscal plan, which is consistent with the medium-term program, is prepared by the Ministry of Finance (“MoF”) and includes total revenue and total expenditure projections, budgetary targets and proposed budget appropriation ceilings for public administrations for the following three years and is endorsed by the High Planning Council. These documents set the framework for the budget discussions and negotiations with relevant ministries (the MoF and the MoD) and spending agencies, before political reconciliation in the Cabinet and the Parliament.
The annual budget process of administrations begins in June, following a general announcement made by the MoF. Budget revenue and expenditure proposals are prepared by the administrations and reviewed by the MoF. The general budget revenue proposal is prepared by the MoF and the revenue proposals of other budgets are prepared by the relevant administrations. The investment proposals of public administrations are evaluated by the MoD. Central Government Budget Draft Law together with supporting information is prepared by the MoF and submitted to the Parliament in mid-October. Following debate, the Annual Budget Law is approved by the Parliament and promulgated by the President in December.
To align the accounts with the Government Financial Statistics standards, the budget codification system is being overhauled. Each spending item is identified in the analytical budget classification system consisting of institutional, functional, financial and economic terms, and budgets and budget reports are compiled according to this codification system. The new codification system has been gradually applied to all general government entities since 2006.
Each of the SOEs adopts an annual financial program, which is approved by the Council of Ministers. Although separate budgets for the SOEs do not exist in the Central Government Budget, there are sections in the budget of the Treasury for capital transfers to and duty losses of the SOEs.
The preparation and implementation of the budgets of SSIs and local administrations and their other financial transactions are subject to the provisions of the relevant laws without prejudice to the provisions of the PFMC Law. Social security institutions and local administrations prepare their own budgets that are approved by their own boards of directors/councils.
108
Accounting
Public revenues and expenditures are indicated on the accounts of the fiscal year of their accrual.
Establishing a uniform accounting system for general government and supervision of the system are the responsibilities of the Ministry of Finance’s General Directorate of Public Accounts. The accounting services are responsible for collecting revenue, ordering payments and recording the financial transactions of the line ministries and agencies (Article 61 of the PFMC Law). Accounting services of the public administrations within the scope of the general budget are performed by the accounting offices affiliated with the MoF. Moreover, there are three accounting offices affiliated with the Undersecretariat of the Treasury, namely, Accounting Office for External Payments, Accounting Office for Internal Payments and Accounting Office for State Debts. The MoF is responsible for compiling, consolidating and disseminating accounting data and financial statements for the central government on a monthly basis as defined in the PFMC Law.
The accounting and reporting standards for general government are set by the State Accounting Standards Board, which is established within the MoF. The MoF sets rules for the preparation of the final accounts and supervises the compilation of administration’s final accounts prepared by the strategy units of each administration within the framework of final account legislation.
The draft of the Final Accounts Law is prepared by the MoF and submitted to the Parliament by the Council of Ministers within six months of the end of the fiscal year and a copy is sent to the Turkish Court of Accounts (the “TCA”). The TCA submits a General Conformity Statement to the Parliament no later than 75 days thereafter. The draft of the Final Accounts Law is deliberated by the commissions of Parliament together with the Central Government Budget Law.
Currently, the main fiscal policy indicators are the overall balance and primary balance of the Central Government Budget. In order to submit fiscal notifications to the European Commission, huge efforts have been made to prepare accounts in accordance with ESA 95 standards. The goal is to produce accounts in accordance with ESA 95.
Internal Audit
The PFMC Law requires each public administration to assign internal auditors. Internal auditors within the line ministries and agencies will be made responsible for system, performance, financial, compliance and IT audits. The internal auditors are required to report to the head of the agency. For2015, 2,075 internal auditor positions were reserved; currently 968 have been appointed.
External Audit
External auditing is regulated by the Public Financial Management and Control (the “PFMC”) Law, no.5018, and the Law on the Turkish Court of Accounts (the “TCA”), no.6085. The TCA’s independence is secured. The TCA prepares its own budget and presents it to Parliament directly. It decides on its own audit program. The president of the TCA and the members of the TCA are elected by the Parliament. The tenure of members and auditors continues until the age of 65. The president, members and auditors may not have any other employment other than certain positions expressly designated for them. Members of the Turkish Court of Accounts cannot be dismissed, and without prejudice to the provision of Article 65 of the TCA Law, they cannot be retired before the age of 65, unless they desire so. However, the office of those who have been convicted of an offense which results in dismissal from public service shall be terminated automatically. Those certified by medical report by an official board of health of a fully equipped hospital that they are incapacitated for reasons of health shall be removed from office upon the decision of the General Assembly of Turkish Court of Accounts. The TCA is responsible for the financial, compliance and performance audits of all general governmental agencies. At present, the TCA carries out financial, compliance and performance audits of all general governmental agencies. The TCA submits The External Audit General Evaluation Report together with the individual audit reports of public administrations attached, The Accountability General Evaluation Report, The Financial Statistics Evaluation Report, The Statement of General Conformity and Annual Audit Reports of State Economic Enterprises to the Parliament. The TCA Law requires that reports of Turkish Court of Accounts, except for the cases forbidden to be announced by laws, shall be announced to the public.
Article 68 of the PFMC Law and amendments to Article 4 and 43 of TCA’s Law , specify that the TCA may audit (1) general government organizations (central government agencies, local governments and Social Security Institutions ), (2) public enterprises and their subsidiaries, and (3) joint stock companies established by special laws with more than 50% of their capital directly or indirectly owned by the public sector and (4) other public administrations (excepting professional organizations having a public status). Article 4 of TCA’s Law, provides that the TCA shall audit (1) all types of domestic and foreign borrowing, lending and repayments, utilization of foreign grants received, giving of grants, Treasury guarantees, Treasury receivables, cash management and other related matters, (2) all transfers and utilization of resources, and (3) the utilization of domestic and foreign resources and funds (including EU funds).
CENTRAL GOVERNMENT BUDGET
In 2011, the public financial balance improved significantly with respect to the 2008 – 2010 period, during which the global financial and economic crisis affected the economy. In 2011, the real GDP growth reached 8.5% while the growth target according to the Medium Term Program (“MTP”) 2011-2013 was 4.5%. As a result of this rapid economic recovery and the restructuring of certain public receivables including taxes, interest and penalties, and social security premiums, the central government tax revenues increased
109
to 19.6% of GDP (TL 253.8 billion) in 2011 compared to 19.2% of GDP (TL 210.6 billion) in 2010 and 18.1% of GDP (TL 172.4 billion) in 2009. During this period, increases in budget expenditures were limited and expenditures decreased to 24.2% of GDP (TL 272.4 billion) in 2011 from 26.8% of GDP in 2010. Improvement in the central government balance was achieved by containing expenditures which exhibited a limited increase at a rate of 6.8%, while the central government revenues increased by 16.4% in nominal terms with respect to 2010. The central government budget deficit was TL 17.8 billion in 2011 and thus the central government deficit to GDP ratio decreased to 1.4% from 3.6% in 2010.
In 2012, the central government budget revenues and expenditures reached TL 332.5 billion (23.5% of GDP) and TL 361.9 billion (25.5% of GDP), respectively. The budget deficit was TL 29.4 billion, representing 2.1% of GPD and primary surplus was TL 19 billion, representing 1.3% of GDP.
In 2013, the central government budget revenues and expenditures reached TL 389.7 billion (24.9% of GDP) and TL 408.2 billion (26.0% of GDP), respectively. The budget deficit was TL 18.5 billion, representing 1.2% of GPD and primary surplus was TL 31.4 billion, representing 2.0% of GDP.
With ongoing commitment to fiscal discipline, in 2014, the central government delivered a deficit lower than formerly anticipated in the Budget Law. Budget deficit was TL 23.3 billion in nominal terms and 1.3% as a share of GDP. In fact, it recorded a primary budget surplus of TL 26.5 billion while interest expenditure remained flat. The central government revenues reached TL 425.4 billion and expenditures were TL 448.8 billion.
In 2015, thanks to over-performance of tax revenues, budget deficit was limited to 1.2% of GDP (TL 22.6 billion) despite the acceleration on investment spending. Primary surplus was TL 30.4 billion while revenues and expenditure reached TL 483.4 and 506 billion, representing 24.7% and 25.9% of GDP, respectively, in the same period.
The main objectives of the MTP 2016-2018, announced at the beginning of 2016, are to bolster stable and inclusive growth, to decrease inflation, to maintain fiscal discipline and to lower the current account deficit. The MTP 2016-2018 targets a deficit of 1.3%, 1.0% and 0.8% for the central government budget for 2016, 2017 and 2018, respectively. The general government budget, which is estimated to run a 1.3% deficit (excluding privatization revenue) in 2016, is projected to reach a deficit of 0.6% of GDP in 2018.
Table 44
| | | | | | | | | | | | | | | | | | | | |
| | | 2011 | | | 2012 | | | 2013 | | | 2014 | | | 2015* | |
| | | (in millions of Turkish Liras) | |
CENTRAL GOVERNMENT BUDGET REVENUES | | | 296,824 | | | | 332,475 | | | | 389,682 | | | | 425,383 | | | | 483,386 | |
I. GENERAL BUDGET REVENUES | | | 286,554 | | | | 320,536 | | | | 375,564 | | | | 408,676 | | | | 464,785 | |
Tax Revenues | | | 253,809 | | | | 278,751 | | | | 326,169 | | | | 352,514 | | | | 407,475 | |
Direct Taxes | | | 82,057 | | | | 92,520 | | | | 100,442 | | | | 114,422 | | | | 128,525 | |
Indirect Taxes | | | 171,752 | | | | 186,231 | | | | 225,728 | | | | 238,093 | | | | 278,950 | |
Other | | | 32,745 | | | | 41,785 | | | | 49,395 | | | | 56,161 | | | | 57,310 | |
Non-Tax Revenues | | | 29,147 | | | | 38,049 | | | | 38,194 | | | | 45,332 | | | | 47,169 | |
Capital Revenues | | | 2,530 | | | | 2,054 | | | | 10,105 | | | | 9,549 | | | | 7,932 | |
Grants and Aids | | | 1,068 | | | | 1,652 | | | | 1,096 | | | | 1,281 | | | | 2,208 | |
II. REVENUES OF SPECIAL BUDGET AGENCIES | | | 8,174 | | | | 9,622 | | | | 11,445 | | | | 13,524 | | | | 15,093 | |
III. REVENUES OF REG. & SUPERVISORY INSTITUTIONS | | | 2,095 | | | | 2,318 | | | | 2,673 | | | | 3,183 | | | | 3,509 | |
CENTRAL GOVERNMENT BUDGET EXPENDITURES | | | 314,607 | | | | 361,887 | | | | 408,225 | | | | 448,752 | | | | 505,992 | |
PRIMARY EXPENDITURES | | | 272,375 | | | | 313,471 | | | | 358,239 | | | | 398,839 | | | | 452,987 | |
Personnel Expenditure | | | 72,914 | | | | 86,463 | | | | 96,235 | | | | 110,370 | | | | 125,046 | |
Social Security Contributions | | | 12,850 | | | | 14,728 | | | | 16,306 | | | | 18,929 | | | | 21,042 | |
Purchase of Goods and Services | | | 32,797 | | | | 32,894 | | | | 36,386 | | | | 40,801 | | | | 45,444 | |
Interest Payments | | | 42,232 | | | | 48,416 | | | | 49,986 | | | | 49,913 | | | | 53,006 | |
Domestic Interest Payments | | | 35,064 | | | | 40,702 | | | | 38,910 | | | | 38,818 | | | | 39,179 | |
Foreign Interest Payments | | | 6,668 | | | | 7,277 | | | | 7,397 | | | | 8,831 | | | | 10,305 | |
Discount and Short Term Transactions | | | 499 | | | | 437 | | | | 3,436 | | | | 2,264 | | | | 3,522 | |
Current Transfers | | | 110,499 | | | | 129,477 | | | | 148,743 | | | | 162,282 | | | | 182,787 | |
Duty Losses | | | 4,739 | | | | 3,912 | | | | 4,075 | | | | 3,836 | | | | 4,820 | |
Treasury Aids | | | 59,353 | | | | 70,184 | | | | 79,238 | | | | 83,528 | | | | 87,560 | |
Transfers to Non Profitable Institutions | | | 1,391 | | | | 926 | | | | 1,786 | | | | 2,552 | | | | 3,688 | |
Transfers to Households | | | 2,156 | | | | 2,891 | | | | 3,543 | | | | 3,782 | | | | 4,253 | |
Agricultural Subsidies | | | 6,961 | | | | 7,553 | | | | 8,684 | | | | 9,148 | | | | 9,971 | |
Other Transfers to Households | | | 1,448 | | | | 5,411 | | | | 4,048 | | | | 2,850 | | | | 5,730 | |
Social Transfers | | | 2,255 | | | | 2,922 | | | | 5,876 | | | | 7,735 | | | | 9,089 | |
110
| | | | | | | | | | | | | | | | | | | | |
Transfers to Abroad | | | 1,153 | | | | 1,296 | | | | 1,624 | | | | 1,567 | | | | 1,910 | |
Shares from Revenues | | | 31,043 | | | | 34,380 | | | | 39,869 | | | | 47,284 | | | | 55,765 | |
Capital Expenditure | | | 30,905 | | | | 34,365 | | | | 43,767 | | | | 48,201 | | | | 56,875 | |
Capital Transfers | | | 6,739 | | | | 6,006 | | | | 7,666 | | | | 7,707 | | | | 10,460 | |
Lending | | | 5,671 | | | | 9,537 | | | | 9,135 | | | | 10,550 | | | | 11,333 | |
CENTRAL GOVERNMENT BUDGET PRIMARY BALANCE | | | 24,448 | | | | 19,004 | | | | 31,443 | | | | 26,544 | | | | 30,400 | |
CENTRAL GOVERNMENT BUDGET BALANCE | | | -17,783 | | | | -29,412 | | | | -18,543 | | | | -23,370 | | | | -22,606 | |
DEFERRED PAYMENTS | | | 68 | | | | 361 | | | | 3,310 | | | | 1,078 | | | | 4,276 | |
OTHER DEFERRED PAYMENTS | | | 4,363 | | | | 1,701 | | | | 2,153 | | | | 2,145 | | | | 828 | |
ADVANCES | | | -1,543 | | | | -1,505 | | | | 708 | | | | -838 | | | | -4,140 | |
CENTRAL GOVERNMENT BUDGET CASH BALANCE | | | -14,895 | | | | -28,855 | | | | -12,372 | | | | -20,985 | | | | -21,641 | |
CENTRAL GOVERNMENT BUDGET FINANCING | | | 14,895 | | | | 28,855 | | | | 12,372 | | | | 20,985 | | | | 21,641 | |
BORROWING (NET) | | | 17,468 | | | | 22,744 | | | | 24,477 | | | | 19,823 | | | | 22,787 | |
FOREIGN BORROWING (NET) | | | 2,469 | | | | 4,976 | | | | 8,012 | | | | 8,182 | | | | -2,689 | |
Receipts | | | 13,990 | | | | 16,948 | | | | 16,692 | | | | 20,752 | | | | 10,403 | |
Payments | | | -11,522 | | | | -11,972 | | | | -8,680 | | | | -12,570 | | | | -13,092 | |
DOMESTIC BORROWING (NET) | | | 14,999 | | | | 17,769 | | | | 16,465 | | | | 11,642 | | | | 25,476 | |
-YTL Denominated T-Bills | | | -9,525 | | | | 3,684 | | | | -3,684 | | | | 0 | | | | 0 | |
Receipts | | | 725 | | | | 3,684 | | | | 0 | | | | 0 | | | | 2,591 | |
Payments | | | -10,250 | | | | 0 | | | | -3,684 | | | | 0 | | | | -2,591 | |
-YTL Denominated G-Bonds | | | 27,212 | | | | 17,824 | | | | 20,149 | | | | 11,642 | | | | 25,476 | |
Receipts | | | 111,348 | | | | 98,215 | | | | 144,528 | | | | 129,430 | | | | 90,240 | |
Payments | | | -84,136 | | | | -80,391 | | | | -124,378 | | | | -117,788 | | | | -64,764 | |
-FX Denominated G-Bonds | | | -2,688 | | | | -3,739 | | | | 0 | | | | 0 | | | | 0 | |
Receipts | | | 0 | | | | 0 | | | | 0 | | | | 0 | | | | 0 | |
Payments | | | -2,688 | | | | -3,739 | | | | 0 | | | | 0 | | | | 0 | |
NET LENDING (-) | | | -2,416 | | | | -1,923 | | | | -997 | | | | -1,197 | | | | -1,559 | |
Lending | | | 305 | | | | 153 | | | | 63 | | | | 307 | | | | 142 | |
Repayment (-) | | | 2,720 | | | | 2,076 | | | | 1,060 | | | | 1,505 | | | | 1,701 | |
PRIVATIZATION REVENUE | | | 0 | | | | 0 | | | | 0 | | | | 0 | | | | 0 | |
SDIF REVENUE SURPLUS | | | 1,300 | | | | 607 | | | | 720 | | | | 0 | | | | 0 | |
CURRENCY/DEPOSIT AND OTHER TRANSACTIONS | | | -6,289 | | | | 3,581 | | | | -13,822 | | | | -36 | | | | -2,704 | |
Sources: UT and MoF
TAXATION
The Government collects taxes on personal and corporate income, real estate, goods and services (including the value added tax), and foreign trade.
Personal Income Tax
Personal income tax is levied on a scheduler basis and includes the following features:
| | • | | Earned income received from a single employer is subject to a progressive withholding tax at marginal rates from 15% to 35%. The withholding tax is final. |
| | • | | Wage income from more than one employer is subject to declaration if the sum of all wage incomes (excluding wage income attributable to the first employer) is higher than a TL 23,000 threshold for 2011, a TL 25,000 threshold for 2012, a TL 26,000 threshold for 2013, a TL 27,000 threshold for 2014 and a TL 29,000 threshold for 2015. |
| | • | | Capital income is taxed at marginal rates from 15% to 35%. An annual tax return must be filed for unearned income not subject to a final withholding tax. |
Taxation of gains derived from the sale and retention of marketable securities and other capital market instruments, and taxation of deposit interests, repo gains and income that is derived from private finance institutions is regulated by Temporary Article 67, which was added to the Income Tax Law through Article 30 of the Law No.5281. These regulations will be applied during the period between January 1, 2006 and December 31, 2020. In particular:
111
| | • | | Interest income derived from government bonds issued prior to January 1, 2006 is subject to declaration if the total indexed amount of the gain derived from these government bonds is above a threshold level of TL 23,000 for 2011, a threshold level of TL 25,000 for 2012, a threshold level of TL 26,000 for 2013, a threshold level of TL 27,000 for 2014 and a TL 29,000 threshold for 2015. Income derived from Eurobonds is subject to this procedure regardless of the date of issue. |
| | • | | A withholding tax of 0% for non-residents and 10% for residents was applied on gains from the retention and sale of all bonds and Treasury bills issued after January 1, 2006. |
| | • | | Income from the sale of shares is subject to a withholding tax (0% for both residents and non-residents as of November 14, 2008). This provision of Temporary Article 67 of Income Tax Law does not apply to the shares of fully liable corporations listed on the Istanbul Stock Exchange (Borsa İstanbul), held for more than one year. |
| | • | | On July 27, 2010 the Assembly approved Law No. 6009 which reduces the withholding tax rate to 0% for corporations and foreign taxpayers that are determined by the Ministry of Finance to be similar to investment funds and investment trusts established in accordance with the Capital Markets Code. From October 1, 2010 onwards, the withholding tax rate is 10% for resident and non-resident natural persons. |
| | • | | Dividends (except dividends from investment trusts) are currently subject to withholding tax of 15%. 50% of dividends earned in a year will be exempted from income tax. And if the remaining 50% is above a threshold of TL 23,000 for 2011, a threshold of TL 25,000 for 2012, a threshold of TL 26,000 for 2013, a threshold of TL 27,000 for 2014 and a TL 29,000 threshold for 2015, the remaining 50% will be included in taxable income and all withholding tax can be credited. Dividends derived from investment funds and trusts are subject to withholding tax (0% for resident and non-resident corporations and foreign taxpayers that are determined by the Minister of Finance to be investment funds and investment trusts established in accordance with the Capital Markets Code, 10% for resident and non- resident natural persons and corporations other than stated above). The provisions of Temporary Article 67 of Income Tax Law do not cover the sale of participating certificates (held for more than one year), of Investment Funds of which at least 51% of such fund’s portfolio is traded on the Istanbul Stock Exchange (Borsa İstanbul). |
| | • | | Since January 1, 2013, the withholding tax rate applied on income from bank deposits varies between 10% and 18% according to account type. |
Corporate Income Tax
In 2006, a new Corporation Tax Law (Law No. 5520) was enacted and the corporate income tax rate was reduced from 30% to 20%. Law No. 5520 also provided that:
| | • | | According to Tax Procedure Law, the duration of the useful life of the asset is taken into account for the calculation of the depreciation rate of assets acquired after December 31, 2003. The duration of the useful life of an asset and the depreciation rates are determined by the Ministry of Finance. The Ministry of Finance has announced the useful lives and depreciation rates of depreciable assets through communiqués numbered 333, 339, 365, 389, 399, 406 418 and 439. Taxpayers are free to choose, either the declining balances method or straight-line method of depreciation. |
| | • | | Losses can be carried forward for 5 years. |
| | • | | Corporate taxpayers may deduct the investment allowance exemption without regard to time restrictions in cases where the investment allowance could not be deducted because of insufficient income. |
Investment Incentive System
The incentive system became effective with a Cabinet Decree dated July 14, 2009 (numbered 2009/15199), as amended by the Cabinet Decree dated June 15, 2012 (numbered 2012/3305). General incentive applications, regional incentive applications, incentives of priority investments, large-scale investment incentives, and strategic investment incentives all fall within the scope of the new incentive system.
The minimum amount of fixed investment for the general incentive system and regional incentive applications are TL1 Million for the first and second regions and TL 500,000 for the third through sixth regions. The minimum amount of fixed investments for large-scale incentive applications and strategic incentive applications must be at least TL 50 Million.
VAT Exemption: In accordance with the measure, VAT is not paid for imported and/or domestically provided machinery and equipment within the scope of the investment encouragement certificate.
Customs Duty Exemption: Customs duty is not paid for the machinery and equipment provided from abroad (imported) within the scope of the investment encouragement certificate.
Corporate/Income Tax Reduction: Calculation of income or corporate tax with reduced rates until the total value reaches the amount of contribution to the investment according to the envisioned rate of contribution.
112
Income Tax Withholding Support: The measure stipulates that the income tax regarding the additional employment generated by the investment within the scope of the investment encouragement certificate will not be subject to withholding. It is provided for regional, priority, large-scale and strategic investment only in Region 6.
Interest Support: A financial support provided for certain investment loans with a duration of at least one year that covers a certain part of payable interest or payable profit share on loans. The measure is applicable for investments to be made in Regions 3, 4, 5 or 6 and for strategic and priority investments.
Land Allocation: It means allocation of land for investments that incentive certificate is issued within the framework of the principles and procedures determined by the Ministry of Finance.
VAT Refund: VAT collected on the building & construction expenses made within the frame of strategic investments with a fixed investment amount of TL 500 million will be rebated.
Social Security Premium Support for Employer’s Share: A part of Social Security Premium Support for Employer’s Share required to be paid for additional employment, corresponding to minimum wage is met by the Ministry of Economy within the scope of incentive certificate.
Social Security Premium Support for Employee’s Share: A part of Social Security Premium Support for Employee’s Share required to be paid for additional employment, corresponding to minimum wage is met by the Ministry of Economy within the scope of incentive certificate. It is provided for regional, large-scale and strategic investments only in Region 6.
Social security contributions are payable by employees at a rate of 14% and by employers at a rate of 20.5% of gross wages. For employees whose gross earnings are below the base or above ceiling earnings, which are determined at least twice a year, these contribution rates are applied to base or ceiling amounts respectively. According to the Social Security Law amended by Law No. 5198, the base wage for Social Security contributions has been equalized to the minimum wage since July 1, 2004. Social security contributions were paid into funds that were not consolidated under the central government accounts. These funds have been combined under the Social Security Institution by the Social Security Law No. 5502. Within the same income range, there is an additional contribution to the unemployment fund of 1% by the employee and 2% by the employer.
According to Article 28 of Law No.5763, as of January 1, 2008, the amount corresponding to 5 points of an employer’s contributions shall be matched by the Treasury. Taking into account the socio-economic development index, an additional 6 points of employer’s contribution has also been provided in the insured employment workplaces which employ 10 or more insured employees in 52 provinces determined by the Council of Ministers. Article 20 of the same law provides that a percentage of social security employers’ contributions of male employees between ages 18-29 and female employees regardless of age that were recruited within 2 years of January 7, 2008 will be paid by the unemployment insurance fund according to the following scale: 100% for the first year of employment, 80% for the second year, 60% for the third year, 40% for the fourth year and 20% for the fifth year.
Value Added Tax
VAT is a broad based tax on consumer spending and normally has a neutral effect on businesses because the input VAT is deductible from the output VAT. The following transactions performed in Turkey, among others, are subject to VAT:
| | • | | the supply of goods and services in the course of commercial, industrial, agricultural, and professional activities; |
| | • | | the importation of all goods and services; and |
| | • | | activities described under VAT Law Article 1 as “deliveries and services arising from other activities”. |
Exemptions under the VAT Law can either be full or partial exemptions. Full exemptions permit deductions and refund of taxes imposed. While partial exemptions do not allow deduction and refund of taxes incurred and, based on the scope of work, provide for the incurrence of taxes as cost or expense.
The following transactions are fully exempt with the right to deduct input VAT:
| | • | | the exportation of goods; |
| | • | | the supply of services abroad; |
| | • | | the processing of goods for exports; |
| | • | | the supply of ships, aircraft, and rail transportation vehicles, and the supply of services related to the manufacture of such vehicles; |
| | • | | the supply of services to ships and aircraft at harbors or airports; |
| | • | | the supply of international transport services; |
113
| | • | | the supply of goods and services to persons engaged in the exploration for prospecting activities; |
| | • | | the supply of machinery and equipment to persons who are normally subject to tax but who have provided an investment document that the machinery and equipment are part of the investment; |
| | • | | international roaming contracts according to the reciprocity principle; |
| | • | | the supply of goods and services related to the exploration, operation and refining of gold, silver and platinum; |
| | • | | goods and services related to national security; |
| | • | | goods and construction works related to the construction, renovation and enlargement of railways connected to seaports, seaports and airports; |
| | • | | the supply of gas oil for trucks and tractor trailers which transport export goods; and |
| | • | | any kind of equipment and computer programs designated exclusively for education, employment and to improve the daily life of disabled persons. |
The following transactions are exempt from VAT without the right to deduct input VAT or refund VAT (Partial Exemptions):
| | • | | Exemptions for cultural and educational purposes; |
| | • | | Exemptions for social purposes; |
| | • | | Exemptions for military purposes; and |
| | • | | Other exemptions listed under VAT Law Article 17. |
Currently, the statutory rate of VAT is 10% for each transaction subject to VAT. However, the standard rate of 18% is applied pursuant to the Cabinet Decree Cabinet Decree No 2007/13033. A reduced rate of 1% is applied to goods and services listed on List (I) annexed to the Cabinet Decree, which includes newspapers and magazines, rental of transportation vehicles, and agricultural products. A reduced rate of 8% is applied to goods and services listed on List (II) annexed to the Cabinet Decree, which includes food products, cashier machines, cinema and theatre tickets, and books. Goods and services that do not fall onto either List (I) or List (II) are subject to the standard rate.
Developments in Tax Policy
Excise Tax
With a view toward simplifying and harmonizing the indirect tax system with the EU, a unified Excise Tax was enacted in June 2002 to consolidate a range of selective taxes on energy products, vehicles, alcohol and tobacco products, and a range of luxury consumer goods into a single tax charged on importation and domestic production of selected goods.
The Excise Tax is an important tax which comprised approximately 25.3% of total tax revenues (excluding social security contributions) in2011, 25.7% in 2012, 26.2% in 2013, 25.8% in 2014 and 26.0% in 2015.
The Excise Tax tariff is composed of four lists:
| | • | | List I includes petroleum products, natural gas, lubricating oil, solvents and derivatives of solvents; |
| | • | | List II includes registered and non-registered motor vehicles; |
| | • | | List III covers alcoholic beverages and tobacco products and cola; and |
| | • | | List IV covers a range of consumer durables and luxury goods. |
The taxpayers for List I, III and IV are producers or importers and sellers through public auction. The taxpayers for vehicles under List II which are subject to entry and registration are the persons who carry out the trade, import to use or sale by auction and the taxpayers for vehicles under List II not subject to entry and registration are their importers, manufacturers and sellers by auction before excise duty is applied.
Investment Tax Allowance System
Taxpayers can deduct, regardless of any time limitation, the amount of investment allowance exemption. However, the deductable amount may not exceed 25% of the related annual gain amount. On February 9, 2012, the Constitutional Court annulled that restriction on the deductable investment allowance, so corporate taxpayers could deduct the entire amount of investment allowance (including earnings in 2011).
114
Minimum Living Allowance
The annual gross amount of minimum wage which is received from the beginning of the calendar year in which the wage is earned is multiplied by 50% for the taxpayer him or herself, 10% for a spouse who neither works nor has an income, 7.5% for the each of the first two children, 10% for the third child, and 5% for any other children. This final number is multiplied with the rate (15%) applied to the first income bracket of the Personal Income Tax Schedule stated in Article 103 so that the minimum living allowance amount is calculated. One-twelfth of this amount is deducted from the income tax amount calculated for monthly wage income. The minimum living relief is applied to employees in the industry sector. On December 31, 2013, the Minimum Wage Commission Decision eliminated the concept of a different minimum wage based on age. Thus, one minimum wage was introduced.
Individuals whose wages are not taxed in the lump sum method may benefit from the minimum living allowance.
VAT
Effective February 2, 2011, Article 85 of Law No. 6111 on Restructuring of Certain Receivables and Amendment of Social Security and General Health Insurance Law and Other Certain Laws and Decrees amends Article 17 of the VAT Law, so that delivery of leasing certificates by asset leasing companies will be within the scope of VAT exemption. Also, transfer of movable, immovable and intangible assets by sourcing companies to leasing companies and in the final return of these assets by leasing companies to sourcing companies will fall within the scope of VAT exemptions.
With a new provisional article added to the VAT Law by Law No. 6322, effective beginning June 15, 2012 until December 31, 2023, any excess of VAT that cannot be deducted during the year and is incurred due to construction expenses relating to strategic investments in which a minimum fixed investment of TL 500 million is made upon receipt of investment incentive certificates will be refunded within the succeeding year to the applicable taxpayer. Effective February 19, 2014, Article 32 of the Law No. 6518 amends Article 17 of VAT Law, going forward, the renting, transferring or selling of intangible rights related with patented or utility invention as a result of research, development, invention and software activities in scope of Corporate Tax Law (Law No. 5520) is exempt from VAT.
Effective April 7, 2015, Article 3 of the Law No. 6637 amends provisional article 26 of VAT Law, going forward, (a) delivery of goods and services for official use or (b) delivery of free goods and services with the aim of social and economic aid, to international organizations associated with any host government or any agreements to which Turkey is a party, and any program, fund, agencies and specialized agencies connected therewith, is exempt from VAT during the term of the international agreement.
Effective April 7, 2015, the delivery of goods and services to non-citizen of Republic of Turkey managerial staff of the above-described international organizations, program fund agencies and specialized agencies, is exempt from VAT during their duty term.
Under the Financial Leasing, Factoring and Financing Companies Act dated November 21, 2012, (No. 6361), the selling of immovable property to the financial leasing company, the renting of immovable property to people who sell them, and the transfer of immovable property to the tenant at the end of the contract are all exempt from VAT.
Article 24 of Law No. 6637 Temporary Article 34 was added to the VAT Law. As of January 31, 2015, the delivery and services made on or after January 1, 2014, to persons constructing and modernizing transit oil pipeline projects are exempt from VAT.
Also, as of January 1, 2015, the VAT rate for leasing wind turbines with output power between 50 and 500 kVA was reduced from 18% to 1% by the Council of Minister’s Decree No. 2015 / 7205.
Income Tax
Personal Income Tax
With the amendment of Article 75 of the Personal Income Tax Law by Article 80 of Law No. 6111, effective February 2, 2011, the income derived from leasing certificates issued by leasing companies will be considered capital gains. Therefore, income derived from leasing certificates issued abroad will be considered within the scope of withholding according to article 94 of the Personal Income Tax Law. Provisions of Temporary article 67 of the Personal Income Tax Law will be applicable to income derived from leasing certificates issued in Turkey as for the taxation of sales and incomes derived from holding period of securities and other capital market instruments.
With the new article added to the Personal Income Tax Law by Law No. 6322, effective June 15, 2012, for investments in certain provinces determined by the Council of Ministers, during the period of the effective date of this article and December 31, 2023, for the incentive certificates to be issued by the Ministry of Economy and income tax calculated for the portion of actively recruited employees’ wages corresponding to minimum wage tax will not be paid for ten years starting from the date when such investment partially or wholly begins to operate.
With the new provisional article added to the Personal Income Tax Law by Law No. 6327, effective June 13, 2012, until December 31, 2017, natural persons who are investors (provided that hold participation shares of joint-stock companies for at least two years) will be able to deduct from their income tax base up to 75% of the capital they invest.
115
Effective June 13, 2012, the above mentioned deduction rate is set as 100% for natural persons who hold participations in corporations whose projects have been supported within the last five years within the scope of programs determined by Ministry of Science, Industry and Technology, Scientific and Technological Research Council of Turkey, Small and Medium Enterprises Development Organization.
Corporate Income Tax
Effective February 25, 2011, Article 5 of the Corporate Income Tax Law has been amended by Article 90 of Law No. 6111, so that the exemption rate of 75% which is applicable for the income derived from the sale of immovable property which is kept in the enterprise at least for two full years will be 100% for the income derived from the turnover of assets by sourcing companies to leasing companies and from the turnover of these assets by leasing companies back to the sourcing companies. The condition that the immovable property must be kept in the enterprise at least for two full years is not applicable.
Effective June 15, 2012, with the amendment of Article 15 of the Corporate Tax Law, income derived from leasing certificates issued by asset leasing companies and their compulsory payment by the intermediary company will be considered within the scope of withholding.
According to amendment of Article 32/A of the Corporate Income Tax Law by Law No. 6322, effective June 15, 2012, the Council of Ministers is authorized, as a deduction from the investment contribution amount, to apply the reduced corporate income tax rate to an investor’s revenue from other activities within the investment period and to reduce the 50% deduction rate to 0% for every city group and increase this rate to80% provided that such deduction will not exceed 50% of the total investment contribution amount and the amount of investment expense.
Effective June 15, 2012, declaration is not required for gains from foreign funds, if portfolio management companies that have a portfolio management license issued by the Capital Markets Boards are not such funds’ permanent representative, permanent establishment or legal head office, if certain conditions are met.
With clause (i) added to Article 10 of Corporate Income Tax Law (Law no: 5520) in 2015, equity companies (except those operating in the banking, finance or insurance sectors and state controlled entities) can deduct 50% of the amount calculated for the fiscal year using the weighted average interest rate last announced by Central Bank over their cash capital increase. Also newly established equity companies are allowed to deduct 50% of the amount calculated for the fiscal year using the weighted average interest rate last announced by Central Bank over the cash part of their paid capital.
New Incentive System in Corporate Income Tax Law
According to Article 32/A annexed to Corporate Income Tax Law No. 5520 pursuant to Law No. 5838, effective June 15, 2012, earnings which are stipulated in the Corporate Income Tax Law and are derived from investments made under the coverage of an incentive certificate issued by the Ministry of Economy shall be subject to reduced corporate income tax rates until such earnings reach the investment contribution rate beginning from the accounting period in which the investment begins to operate fully or partially, except for institutions operating in finance and insurance sectors, business partnerships, contracting businesses as well as the investments made under the Law No. 4283 and the Law No. 3996 and the investments made upon copyrights. Law No. 6322 provides for a reduced corporate tax rate for investments in the incentive system.
Reduced income or corporate tax rates will be imposed on the investor’s income under the incentive scheme according to certain characteristics of the investment until the amount calculated based on government’s contribution rate, determined by the same scheme and corresponding to a certain percentage of the fixed investment amount, is reached. The contribution rate to investment refers to the rate of the fixed investment subject to tax deduction, whereas tax deduction refers to the rate of income or corporate tax to be reduced until the contribution rate is reached.
Other Taxes
With an amendment to the Stamp Duty Law, effective February 25, 2011, the turnover of assets (movable, immovable and intangible) to leasing companies or sourcing companies, the establishment of mortgages in connection with these turnovers, leasing certificates and documents prepared in connection with the leasing of these assets by leasing companies will be exempt from stamp tax.
Effective February 25, 2011, Article 84 of the Law No. 6111 amended Article 123 of the Fee Law so that the turnover of assets to a leasing companies or sourcing company, and the establishment of mortgages in connection with these turnovers are exempt from fees.
Effective June 15, 2012, a new article added to the Tax Procedural Law by Law No. 6322, permits venture capital funds founded in Turkey under the supervision of the CMB to set aside from relevant corporate earnings up to the lesser of 10% of declared income or 20% of shareholder’s equity, for the purpose of adding capital to venture capital trusts and funds or purchasing shares from these funds and trusts.
116
Tax Revenues
The following table sets forth tax revenues for the years indicated:
Table 45
| | | | | | | | | | | | | | | | | | | | |
(in millions of TL) | | 2011 | | | 2012 | | | 2013 | | | 2014*** | | | 2015 | |
Total Tax Revenues | | | 253,809 | | | | 278,781 | | | | 326,169 | | | | 352,514 | | | | 407,818 | |
Personal Income Tax | | | 48,807 | | | | 56,494 | | | | 63,761 | | | | 73,902 | | | | 85,756 | |
Corporate Income Tax | | | 26,993 | | | | 29,017 | | | | 28,988 | | | | 32,305 | | | | 33,388 | |
Motor Vehicle Tax | | | 6,004 | | | | 6,716 | | | | 7,353 | | | | 7,787 | | | | 8,949 | |
Domestic Value Added Tax (VAT) | | | 29,957 | | | | 31,572 | | | | 37,995 | | | | 38,121 | | | | 46,424 | |
Excise Tax | | | 64,189 | | | | 71,706 | | | | 85,462 | | | | 91,095 | | | | 105,923 | |
Petroleum Consumption Tax (Within Excise Tax) | | | 33,573 | | | | 35,935 | | | | 45,158 | | | | 45,628 | | | | 50,830 | |
Banking and Insurance Transaction Tax | | | 4,288 | | | | 5,471 | | | | 6,160 | | | | 7,487 | | | | 9,172 | |
Stamp Duty | | | 6,464 | | | | 7,360 | | | | 9,416 | | | | 10,325 | | | | 12,045 | |
Fees | | | 8,344 | | | | 9,675 | | | | 12,948 | | | | 14,511 | | | | 16,985 | |
Special Communication Tax | | | 4,419 | | | | 4,473 | | | | 4,545 | | | | 4,640 | | | | 4,732 | |
VAT on Imports | | | 48,685 | | | | 50,000 | | | | 62,727 | | | | 64,411 | | | | 74,646 | |
Other Tax Revenues | | | 5,659 | | | | 6,297 | | | | 6,814 | | | | 7,931 | | | | 9,800 | |
Sources: Ministry of Finance General Directorate of Public Accounts, UT
| *** | Some figures of 2014 were revised according to the 2014 Final Account data. |
The following table sets forth the components of tax revenues as a percentage of GDP for the years indicated:
Table 46
| | | | | | | | | | | | | | | | | | | | |
| | | 2011 | | | 2012 | | | 2013 | | | 2014*** | | | 2015 | |
Total Tax Revenues | | | 19.56 | | | | 19.68 | | | | 20.81 | | | | 20.15 | | | | 20.88 | |
Personal Income Tax | | | 3.76 | | | | 3.99 | | | | 4.07 | | | | 4.22 | | | | 4.39 | |
Corporate Income Tax | | | 2.08 | | | | 2.05 | | | | 1.85 | | | | 1.85 | | | | 1.71 | |
Motor Vehicle Tax | | | 0.46 | | | | 0.47 | | | | 0.47 | | | | 0.45 | | | | 0.46 | |
Domestic Value Added Tax (VAT) | | | 2.31 | | | | 2.23 | | | | 2.42 | | | | 2.18 | | | | 2.38 | |
Excise Tax | | | 4.95 | | | | 5.06 | | | | 5.45 | | | | 5.21 | | | | 5.42 | |
Petroleum Consumption Tax (Within Excise Tax) | | | 2.59 | | | | 2.54 | | | | 2.88 | | | | 2.61 | | | | 2.60 | |
Banking and Insurance Transaction Tax | | | 0.33 | | | | 0.39 | | | | 0.39 | | | | 0.43 | | | | 0.47 | |
Stamp Duty | | | 0.50 | | | | 0.52 | | | | 0.60 | | | | 0.59 | | | | 0.62 | |
Fees | | | 0.64 | | | | 0.68 | | | | 0.83 | | | | 0.83 | | | | 0.87 | |
Special Communication Tax | | | 0.34 | | | | 0.32 | | | | 0.29 | | | | 0.27 | | | | 0.24 | |
VAT on Imports | | | 3.75 | | | | 3.53 | | | | 4.00 | | | | 3.68 | | | | 3.82 | |
Other Tax Revenues | | | 0.44 | | | | 0.44 | | | | 0.43 | | | | 0.45 | | | | 0.50 | |
Sources: Ministry of Finance General Directorate of Public Accounts, UT
| *** | Some figures of 2014 were revised according to the 2014 Final Account data. |
117
STATE OWNED ENTERPRISES
State owned enterprises (“SOEs”) (companies that are subject to Decree Law 233, 100% of shares of which are owned by the Treasury) continue to play an important role in the Turkish economy. As of December 31, 2015 there were 20 SOEs in the Treasury’s portfolio (including three affiliates of Turkish State Railways (“TCDD”)). Besides the Treasury’s portfolio, there are public undertakings in the Privatization Administration’s portfolio. There are also wholly or majority state owned banks, such as: T.C. Ziraat Bank, T. Halk Bank, Kalkinma Bank and Eximbank. A publicly owned satellite company, TURKSAT A.S., and a postal company, PTT A.S., together with the abovenamed banks have their own legislation. In addition, there are various publicly majority-owned companies, which are the subsidiaries of government agencies, municipalities and foundations controlled by the government.
Major non-financial companies in the Treasury’s and Privatization Administration’s portfolios are Mechanical and Chemical Industry Corporation, Turkish Grain Board, Electricity Generation Corporation, Turkish Electricity Trading and Contracting Company, Turkish Electricity Transmission Company, Petroleum Pipeline Corporation, Turkish State Railways, Turkish Coal Enterprise, Turkish Hard Coal Company, ETI Mine Works, Turkish Petroleum Corporation, CAYKUR Tea Company and Turkish Sugar Factories Inc.. Supervision, regulation and audit of the aforementioned companies is carried out by several government agencies; including, the Undersecretariat of Treasury, the Ministry of Development, the Prime Ministry, the Turkish Court of Accounts, Line Ministries and the Privatization Administration.
In addition, as of January 1, 2015, SOEs became subject to independent external audit based on the International Standards on Auditing, meaning that SOEs must also report their financial statements according to International Financial Reporting Standards. Furthermore, SOEs are required to establish internal control systems in order to enhance their corporate governance and control mechanisms in line with the international corporate governance principles.
State-owned banks Ziraat Bank and Halk Bank are public joint-stock companies, subject to banking and commercial laws only. Ziraat Bank and Halk Bank are among the largest commercial banks, holding 23.3% of total savings deposits in Turkey as of December 31, 2015.
Treasury shares at Halk Bank were taken into the privatization portfolio and program in accordance with High Privatization Council Decree No.2007/8. An initial public offering was held for 24.98% of the Halk Bank’s shares and the shares started trading on the Borsa Istanbul on May 10, 2007. In 2012, Halk Bank’s shares were offered to the public for the second time and Halk Bank’s free float rose to 48.9%.
In addition to receiving funding directly from the Government budget in the form of capital injection, SOEs are also allowed to borrow from domestic commercial banks and foreign banks.
The borrowing requirements of SOEs in the Treasury’s portfolio and of non-financial companies in the Privatization Administration’s portfolio increased from approximately TL 176 million in 2014 to TL 2.6 billion in 2015. This increase in borrowing requirement means that the SOE system does not need to be financed.
The following table summarizes information related to the financing requirements of the above-mentioned SOE System for the years indicated:
118
Table 47
| | | | | | | | | | | | | | | | | | | | |
Financing Requirements of SOE System Thousand TL | | 2011 | | | 2012 | | | 2013 | | | 2014 | | | 2015* | |
Total financing requirement | | | -8,524,490 | | | | -9,946,091 | | | | -5,818,873 | | | | -9,630,891 | | | | -12,493,108 | |
Increase (reduction) from internally generated funds | | | 3,403,913 | | | | 4,008,888 | | | | -336,334 | | | | -5,436,173 | | | | 4,138,583 | |
Net financing requirement from outside sources | | | -5,120,577 | | | | -5,937,203 | | | | -6,155,207 | | | | -15,067,065 | | | | -8,354,525 | |
Transfers from consolidated budget | | | 7,930,969 | | | | 6,676,518 | | | | 10,681,111 | | | | 14,890,689 | | | | 10,938,994 | |
Borrowing requirement | | | 2,810,392 | | | | 739,315 | | | | 4,525,904 | | | | -176,375 | | | | 2,584,469 | |
Deferred payments | | | -34,615,375 | | | | 5,564,712 | | | | -16,981,972 | | | | -16,632,851 | | | | -6,581,408 | |
Advance payments | | | 31,922,824 | | | | -6,404,801 | | | | 8,822,183 | | | | 5,788,049 | | | | -4,535,525 | |
Cash financing requirement | | | 117,841 | | | | -100,775 | | | | -3,633,885 | | | | -11,021,178 | | | | -8,532,464 | |
Change in cash | | | 574,232 | | | | -481,964 | | | | 363,267 | | | | 9,285,222 | | | | 2,784,314 | |
Securities and deposits | | | -746,396 | | | | 461,594 | | | | 61,874 | | | | -6,627 | | | | -287,959 | |
Domestic bank borrowing, net | | | 499,777 | | | | 104,352 | | | | 320,265 | | | | 2,128,555 | | | | 4,467,615 | |
Foreign borrowing, net | | | -445,454 | | | | 16,793 | | | | 2,888,480 | | | | -385,972 | | | | 1,568,493 | |
Government bonds | | | 0 | | | | 0 | | | | 0 | | | | 0 | | | | 0 0 | |
Source: Treasury
In 2015, the SOE System reported a profit of TL 2.8 billion.
SOE System investments accounted for 12.8% of total public sector fixed investments in 2011, 11.8% in 2012, 10.3% in 2013, 11.2% in 2014 and 10.2% in 2015. Budgetary transfers to the SOE System accounted for approximately, 2.5%, 1.8%, 2.6%, 3.3% and 2.2 % of central management budget expenditures in 2011, 2012, 2013, 2014 and 2015, respectively.
The following table summarizes the profits and losses of SOE System for the years indicated:
Table 48
| | | | | | | | | | | | | | | | | | | | |
Profits and Losses of SOE System Thousands of TL | | 2011 | | | 2012 | | | 2013 | | | 2014 | | | 2015* | |
Total Revenues | | | 115,306,580 | | | | 128,662,018 | | | | 118,653,579 | | | | 126,720,044 | | | | 124,404,885 | |
Total Expenditures | | | 112,711,349 | | | | 124,318,350 | | | | 115,261,669 | | | | 128,646,137 | | | | 121,653,689 | |
Profit (loss) | | | 2,595,231 | | | | 4,343,668 | | | | 3,391,910 | | | | -1,926,093 | | | | 2,751,196 | |
Profit (loss) | | | 2,595,231 | | | | 4,343,668 | | | | 3,391,910 | | | | -1,926,093 | | | | 2,751,196 | |
Source: Treasury
Electricity Sector
The restructuring process for electricity markets in Turkey has been in progress since early 2000s. Significant steps were taken towards a fundamental restructuring of SOEs in the electricity sector after the Electricity Market Law (Law No. 4628), came into effect in March 2001. The ultimate goal is to develop a transparent, competitive and liberalized electricity market, to achieve stability of supply, and to ensure environmentally friendly electricity at a low cost and of good quality.
Turkish Electricity Generation and Transmission Company was divided into three separate entities as Electricity Generation Company (“EUAS”), Turkish Electricity Transmission Company (“TEIAS”) and Turkish Electricity Trading And Contracting Company (“TETAS”) in 2001. These companies are responsible for the generation of electricity at power plants, transmission of electricity and trading of electricity, respectively.
With the completion of restructuring process, the distribution regions were divided into 21 regions. Distribution of the electricity to the final consumer is being carried out by these 21 distribution companies, all of which were privatized as of 2013.
119
While the Government keeps the ownership of TEIAS, it regulates the sector through the Energy Market Regulatory Authority. Standard regulatory functions include licensing, tariff setting, market monitoring, and dispute settlement. TEIAS operates high voltage transmission systems in Turkey and has a monopoly in this sector.
As of 2015, EUAS has 10 thermal and 72 hydroelectric power plants and it has an installed capacity of 20,325 MW in total. 7,319 MW of this capacity is from thermal power plants and 13,006 MW is from hydroelectric power plants. While Turkey has a 73,148 MW installed capacity, the share of EUAS of the installed capacity is 27.8% in the sector.
TETAS is primarily responsible for purchasing electricity from privately owned Build-Operate, Build-Operate-Transfer and Transfer of Operating Rights power plants and EUAS hydro power plants, selling the purchased electricity to electricity distribution companies and assigned supplier companies (incumbent retailers), and exporting and importing electricity.
The New Electricity Market Law (“EML”) (Law No: 6446) was enacted in March 2013. Former Electricity Market Law No. 4628 was partially amended by the new law and its title was changed to “Law on the Organization and Duties of the Energy Market Regulatory Authority.”
The EML (Law No: 6446) includes some important changes, such as amendments to license types, framing provisions for each type of market activity, specific provisions for certain license types (i.e., generation, distribution) and a preliminary licensing mechanism. It also establishes a new company, the Energy Market Operation Joint Stock Company (“EPIAS”) which is an independent private company authorized for the energy market operations. With the completion of registration procedures, EPIAS was officially founded on March 18, 2015 and began operating on September 18, 2015. EPIAS has also taken over the Market Financial Settlement Center’s functions, including carrying out the day-ahead and intra-day market activities which started on July 1, 2015. Instruments of the electricity derivative market, which is operating under Borsa Istanbul, depend on spot electricity prices that are derived from EPIAS market operations.
In order to announce the government’s intent to privatize the state-owned electricity utilities and liberalize the electricity market, the “Electricity Sector Reform and Privatization Strategy Paper” was issued on March 17, 2004 and was revised in 2009 in the light of the recent developments in the electricity market. This Strategy Paper defines the implementation procedures and principles for the electricity sector liberalization and privatization program. Within the scope of the privatization program in the electricity sector, as of 2013, all of the distribution companies have been privatized. As for the electricity generation companies, the privatization process for Yenikoy, Yatagan, Kemerkoy, Catalagzi Thermal Power Plants and Kayakoy, Esendal, Isiklar, Dere and Ivriz hydro power plants, which have a total 1,986 MW installed capacity, was completed in 2014. The privatization process for Orhaneli, Tunçbilek, Soma Thermal Power Plants, which have a total 1,565 MW installed capacity, was completed in June 2015. The privatization process of Bursa, Aliağa and Hopa power plants is ongoing.
Based on the High Planning Council Decision (14/02/2008 Nr. 2008/T-5), a Cost Based Price Adjustment Mechanism (“CPM”) was adopted on July 1, 2008. According to the CPM, tariffs of companies are revised based on changes in their electricity production and/or purchase costs. CPM has both backward and forward cost linkages. Accordingly, the revised tariffs will allow companies to realize annual financial targets in order to finance their planned investments and other expenses. Gas Sector
The sector is dominated by the government-owned Petroleum Pipeline Corporation (“BOTAS”), which is one of the most prominent SOEs in the energy sector and owns pipeline infrastructure for oil and gas transmission, LNG terminals, and gas distribution facilities.
The TANAP Project brings natural gas produced from Azerbaijan’s Shah Deniz-2 gas field and other areas of the Caspian Sea, not only to Turkey, but also to Europe. The TANAP Project, along with the South Caucasus Pipeline and the Trans-Adriatic Pipeline, forms the elements of the Southern Gas Corridor. The Southern Gas Corridor Closed Joint Stock Company (58%), BOTAS (30%) and British Petroleum (12%) are the three partners in the project. The Gas Transportation Agreement, Funding Agreement, Share Purchase Agreement and Accession Agreement, agreements supporting the TANAP Project, were signed between BOTAŞ and SOCAR on May 30, 2014 in İstanbul. The Shareholders’ Agreement and its annex Term Loan Facility Agreement were signed on March 13, 2015 in Ankara. The Groundbreaking Ceremony of the TANAP Project occurred on March 17, 2015.
Mining Sector
Eti Mine Works (“Eti Maden”), with U.S.$787 million export revenue in 2015, is an important SOE in the mining sector. The company’s operations include mining, processing and marketing of Turkey’s boron resources. Presently, Eti Maden has 73.2% of the world boron reserves, and meets approximately 50% of the world boron demand, according to the Eti Maden Boron Sector Report dated May 2016.
Turkish Coal Enterprise (“TKI”) holds 23.5% of the Turkish lignite reserves (as of the end of 2015) and sells its products mainly to thermal power plants. Lignite is used for heating and various industrial sectors are the other customers of TKI. Also, TKI distributes lignite to low-income families and receives duty-loss payments from the Treasury for this distribution.
As of the end of December 2015, EUAS owns 54.6% of Turkey’s 15.6 billion tons of lignite reserves.
120
Turkish Hard Coal Company (“TTK”) is an SOE that produces hard coal in the Zonguldak basin of Turkey. The company primarily sells its product to the energy sector. The iron and steel industry is the second largest consumer for hard coal. TTK has been receiving capital transfers from the Treasury, and receives duty-loss payments for coal distribution to low-income families.
Petroleum Sector
The Turkish Petroleum Law No. 6491, which aims to provide more competitive, transparent, reliable and stable conditions for domestic and foreign investors for upstream activities, entered into force in June 2013.
Turkish Petroleum Corporation (“TPAO”), formerly an integrated company engaged in all the activity fields of the oil industry including exploration, production, refinery, marketing and transportation, is currently only involved in the exploration, drilling and production sector in the domestic market. TPAO is responsible for approximately 68% of Turkey’s crude oil production and 53% of Turkey’s natural gas production.
On May 26, 2014, TPAO reached an agreement to acquire the French energy firm TOTAL’s 10% stake in Azerbaijan’s Shah Deniz gas project and Southern Caucasian Pipeline. The deal increased TPAO’s stake in the project to 19% from 9%, making TPAO the second largest partner in the multinational consortium.
Shah Deniz is one of the world’s largest gas-condensate fields, with reserves of about 1 trillion cubic meters of gas and 2.2 billion barrels of condensate. As of the end of 2015, TPAO’s sales revenue from the Shah Deniz gas project was U.S.$1.92 billion.
Agriculture Sector
The Turkish Grain Board (“TMO”), which is associated with the Ministry of Food, Agriculture and Livestock, is an intervention agency which regulates the grain market when necessary. TMO has nearly 4.2 million tons of storage capacity and has offices/agencies throughout Turkey, as well as licensed warehouses for grain since 2011.
The main purpose of the Tea Enterprise (“CAYKUR”) is to improve the tea agriculture and the quality of tealeaf and to produce and sell tea. CAYKUR operates 46 factories and has a nearly 55% market share in tea sales.
Railways
Turkish State Railways (“TCDD”) provides passenger and freight transport services as the only railway transportation company in Turkey. However, some major changes are targeted in the railway sector with the Law No. 6461 concerning the “Liberalization of the Turkish Railway Transport”. The law which became effective on May 1, 2013, ensures that the railway infrastructure and train/transportation operations will be separated. The law required that TCDD become an infrastructure operator and required that TCDD Transport Company be established as a subsidiary of TCDD in order to be responsible for train/transportation operations. The law ensures that railway infrastructure and freight transportation can be operated both by public and private companies and passenger transportation will be opened to private companies on May 1, 2018.
High-speed trains have been in operation on Ankara-Eskisehir line (245 km) since 2009 and Ankara-Konya line (212 km) since 2011. High-speed train operations started between Konya and Eskisehir (360 km) in 2013. Ankara-Istanbul high-speed train (533 km) operations began on July 25, 2014. Construction continues on Ankara-Izmir (624 km) and Ankara-Sivas (405 km) high-speed train lines, which are expected to be in service in the coming years. As of August 22, 2016, the infrastructure of Yerköy-Yozgat-Sorgun and Yıldızeli parts of Ankara-Sivas HST Project has been completed and the infrastructure of Polatlı-Afyonkarahisar-Banaz (Uşak) parts of Ankara-İzmir HST is under construction.
As of the end of 2015, TCDD owns 12,532 km of track, 1,213 km of which is a high-speed train track, 653 locomotives, 118 EMUs, 80 DMUs, 13 high-speed train sets, 913 passenger cars, and 19,077 wagons, according to the TCDD 2015 Sector Report.
PRIVATIZATION IMPLEMENTATIONS
Turkey aims to further enhance its functioning market economy through ensuring openness and competitiveness, upgrading productivity, strengthening the investment climate to attract more Foreign Direct Investment, encouraging private initiative/entrepreneurial skills and, as a result, promoting employment.
In furtherance of these goals, major legislative changes have taken place in Turkey since 2011 including, as amended in March 14, 2013, the Electricity Market Law and, as amended in February 14, 2011, the Company Law.
As a result, in recent years, unprecedented privatization continues and a noticeable increase in foreign investor interest has occurred. Overall privatization proceeds realized by the Turkish Privatization Administration (the “PA”) have reached U.S.$66.9 billion (on a commitment basis) as of December31, 2015, of which U.S.$49.9 billion in revenue has been generated from the privatization of blue chip companies, including: Türk Telekom, Tüpraş, Erdemir, Halkbank, Petkim and other power generation and distribution companies.
121
Cash transfers to the Treasury from the PA (including transfers from privatized companies) were U.S.$1.3 billion, U.S.$0.8 billion, U.S.$4.5 billion, U.S.$3.5 billion and U.S.$2.3 billion for the years 2011, 2012, 2013, 2014 and 2015, respectively. The total amount realized from January1, 1986 through December31, 2015 is U.S.$45.5 billion.
From the period January 1, 2011 through December 31, 2015, the privatization implementations of Turkey have resulted in a net worth of U.S. $25.1 billion (privatization implementations completed by the PA). The following is a summary of the most significant privatization implementations completed between January 1, 2011 and December 31, 2015.
Table 49
| | | | | | | | | | |
Name of the Company | | Field of
Operation | | Date of Privatization | | | Amount
(U.S. $,
million) | |
Trakya Elec. Distr. (Concession) | | Electricity Distr. | | | 12/30/2011 | | | | 575 | |
Iskenderun Sea Port of Turkish State Railways | | Port Operation | | | 12/30/2011 | | | | 372 | |
Various real estate of the Government during 2011 | | Real Estate | | | year round | | | | 161 | |
PETKİM(11% of minority shares sold to the parent Company) | | Petrochemical | | | 6/22/2012 | | | | 168.5 | |
Halkbank (Secondary Offering of 23.92 %) | | Banking | | | 11/16/2012 | | | | 2,520 | |
Various real estate of the Government during 2012 | | Real estate | | | year round | | | | 315 | |
Başkent Doğalgaz Distr. | | Natural Gas Distr. of
Ankara | | | 5/31/2013 | | | | 1,162 | |
Hamitabat Naturalgas Fired Power Generation Plant | | Power Generation | | | 8/01/2013 | | | | 105 | |
Akdeniz Elect. Distr. (Concession) | | Electricity Distr. | | | 5/28/2013 | | | | 546 | |
Boğaziçi Elect. Distr. (Concession) | | Electricity Distr. | | | 5/28/2013 | | | | 1,960 | |
Gediz Elect. Distr.(Concession) | | Electricity Distr. | | | 5/29/2013 | | | | 1,231 | |
Seyitömer Coal fired power gen. | | Power Generation | | | 6/17/2013 | | | | 2,248 | |
Aras Elect. Distr.(Concession) | | Electricity Distr. | | | 6/28/2013 | | | | 128.5 | |
Dicle Elect. Distr.(Concession) | | Electricity Distr. | | | 6/28/2013 | | | | 387 | |
Vangölü Elect. Distr. (Concession) | | Electricity Distr. | | | 7/26/2013 | | | | 118 | |
Istanbul Anatolian Side Elect. Distr. (Concession) | | Electricity Distr. | | | 7/31/2013 | | | | 1,227 | |
Kangal Coal fired power gen. | | Power Generation | | | 8/14/2013 | | | | 985 | |
Toroslar Elect. Distr. (Concession) | | Electricity Distr. | | | 9/30/2013 | | | | 1,725 | |
Various River Run Power Gen. During 2013 | | River Run Power Gen. | | | year round | | | | 195 | |
Various Real Estate of The Gov’t. During 2013 | | Real estate | | | year round | | | | 407 | |
Istanbul Salipazari Cruise Port | | Port Operation | | | 2/14/2014 | | | | 702 | |
Yatağan Coal fired power gen. | | Power Generation | | | 12/01/2014 | | | | 1,091 | |
Çatalağzı Coal fired power gen. | | Power Generation | | | 12/22/2014 | | | | 350 | |
Kemerköy.Yeniköy Coal Fired Power Gen. and Kemerköy Sea Port. | | Power Gen. & Port Oper. | | | 12/23/2014 | | | | 2,671 | |
Various Real Estate Of The Gov’t During 2014 | | Real estate | | | year round | | | | 1,512.7 | |
Soma B Coal fired power gen. | | Power Generation | | | 6/22/2015 | | | | 685.5 | |
Orhaneli Tunçbilek Coal fired power gen. | | Power Generation | | | 6/22/2015 | | | | 521 | |
Derince Port | | Port Operation | | | 2/25/2015 | | | | 543 | |
Various Real Estate Of The Gov’t During 2015 | | Real estate | | | year round | | | | 242 | |
Note: Only privatizations worth U.S.$100 million or more are listed above.
122
Table 50
Privatization implementations by the PA by years (in billion U.S.$)
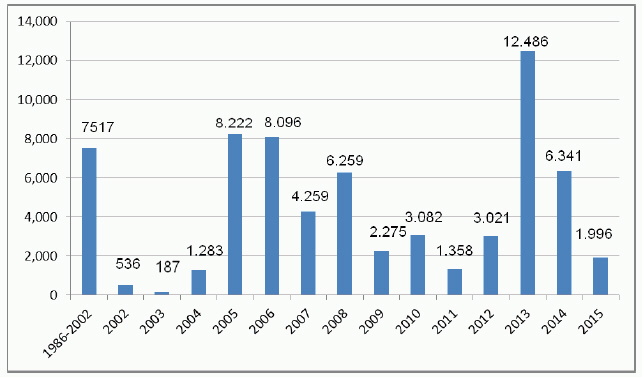
Source: Privatization Administration
The privatization program and developments with respect thereto implemented in various sectors since 2011 is summarized below.
Energy Sector
A) Electricity Distribution
Trakya Elektrik Dağıtım A.Ş. operates in the provinces of Edirne, Kırklareli and Tekirdağ. The highest bidder was Elektrik Perakende Satış A.Ş. with a bid of U.S.$622 million. The contract with the new investor was signed on December 30, 2011.
Aras Elektrik Dağıtım A.Ş. operates in the provinces of Erzincan, Bayburt, Erzurum, Kars, Ardahan, Ağrı and Igdır. KİLER A.Ş. was the highest bidder with a bid of U.S.$128 million. The contract with the new investor was signed on June 28, 2013.
Dicle Elektrik Dağıtım A.Ş. operates in the provinces of Diyarbakır, Şanlıurfa, Mardin, Batman, Siirt and Şırnak. Following a retenderingprocess in 2012, the highest bidder was İşkaya-Doğu JV. The contract in the amount of U.S.$387 million was signed on June 28, 2013.
Vangölü Elektrik Dağıtım A.Ş. operates in the provinces of Bitlis, Hakkari, Muş and Van. Following a retendering process in 2012, the highest bidder was Türkerler Construction Company with a bid of U.S.$118 million. The contract was signed on July 26, 2013.
Istanbul Anadolu Yakası Elektrik Dağıtım A.Ş. operates in the Anatolian side of Istanbul.Following a retendering process in 2012, the highest bidder was EnerjiSA. The contract in the amount of U.S.$1.2 billion was signed on July 31, 2013.
Toroslar Elektrik Dağıtım A.Ş. operates in the provinces of Adana, Gaziantep, Hatay, Mersin, Kilis and Osmaniye.Following a retendering process in 2012, the final tender was concluded on March 15, 2013. The highest bidder was EnerjiSA and the contract in the amount of U.S.$1.7 billion was signed on September 30, 2013.
Boğaziçi Elektrik Dağıtım A.Ş. operates in the European side of Istanbul. Following a retendering process in 2012, the highest bidder was Limak-Kolin-Cengiz with a bid of U.S.$1.96 billion. The contract was signed on May 28, 2013.
Gediz Elektrik Dağıtım A.Ş. operates in the provinces of İzmir and Manisa (Aegean Region). Following a retendering process in 2012, the highest bidder was Elsan, Tümaş, and Karaçay with a bid of U.S.$1.2 billion. The contract was signed on May 29, 2013.
Akdeniz Elektrik Dağıtım A.Ş. operates in the provinces of Antalya, Burdur and Isparta (West Mediterranean Region). Following a retendering process in 2012, the highest bidder was Limak-Kolin-Cengiz with a bid of U.S.$546 million. The contract was signed on May 28, 2013.
123
B) Electric Power Generation
i) Run of the River Hydroelectric Power Plants (“HEPP”)
17 small run-of-the-river power plants with a total installed capacity of 64 MW were tendered under 10 portfolios. The offers were received on October 5, 2012. Final negotiations of these tenders were completed on October 19, 2012. All of the portfolios were privatized for a total of U.S.$194 million.
Fethiye HEPP: Fethiye HEPP and its related real estate and tangible assets owned by EÜAŞ were privatized under the Transfer of Operating Rights (“TOR”) method. The highest bidder was Kuzey Birlik Enerji ve Sanayi ve Ticaret A.Ş who offeredU.S.$44.8 million. The sales agreement was signed on March 21, 2016.
Manavgat HEPP: Manavgat HEPP andits related real estate and tangible assets owned by EÜAŞ were privatized under the TOR method. The highest bidder was Assan Alüminyum ve Sanayi ve Ticaret A.Ş who offered U.S.$131.2 million. The sales agreement was signed on April 4, 2016.
Doğankent, Kürtün and Torun HEPP: Doğankent, Kürtün and Torun HEPP and their related real estate and tangible assets owned by EÜAŞ were privatized under the TOR method. The highest bidder was KLK Enerji Üretim A.Ş, established by Kolin İnşaat Turizm San. Ve Tic. A.Ş. who offered U.S.$435.2 million. The sales agreement was signed on April 4, 2016.
Karacaören 1-2 HEPP: Karacaören 1-2 HEPP and its related real estate and tangible assets owned by EÜAŞ was privatized under the TOR method. The highest bidder was Kremna Enerji Üretim A.Ş, established by Gama Enerji A.Ş. who offered U.S.$515.0 million. The sales agreement was signed on June 6, 2016.
Kadıncık 1-2 HEPP: Kadıncık 1-2 HEPP and its related real estate and tangible assets owned by EÜAŞ was privatized under the TOR method. The highest bidder was İC İçtaş, who offered U.S.$864.0 million. The sales agreement was signed on July 7, 2016.
ii) Coal fired Power Generation Plants
Seyitömer: The tender announcement was made on November 6, 2012. Final negotiations were completed on December 28, 2012. The highest bidder was Çelikler Holding with a bid of U.S.$2.2 billion. The transfer of shares was made on June 17, 2013.
Kangal: The tender announcement was made on November 6, 2012 and final negotiations were completed on February 8, 2013. The highest bidder was Konya Şeker Sanayi ve Ticaret A.Ş—Siyahkalem Mühendislik İnşaat ve Sanayii Ltd JV.with a bid of U.S.$958 million. The transfer of shares was made on August 14, 2013.
Kemerköy, Yeniköy and Port of Kemerköy: The tender announcements which were made in the second half of 2013 expired at the beginning of 2014. The final negotiations occurred on April 18, 2014. The highest bidder was IC İçtaş Enerji Üretim ve Ticaret A.Ş. with a bid of U.S.$2.7 billion. The transfer of shares was made on December 23, 2014.
Çatalağzı: The tender announcements which were made in the second half of 2013 expired at the beginning of 2014. The final negotiations occurred on April 29, 2014. The highest bidder was Demir Madencilik Petrol Ürünleri Enerji İnşaat Liman Gemi-Yat Yapım Turizm Nakliyat Sanayi ve Ticaret A.Ş. with a bid of U.S. U.S.$351 million and the second highest bidder was Elsan Elektrik Gereçleri Sanayi ve Ticaret A.Ş. with a bid of U.S. U.S.$350 million.The highest bidder abandoned the tender, however, and the second highest bidder was invited to proceed with the transfer procedure.The transfer of shares was made on December 22, 2014.
Yatağan: The tender announcements which were made in the second half of 2013 expired at the beginning of 2014. The final negotiations occurred on June 12, 2014. The highest bidder was Elsan Elektrik Gereçleri Sanayi ve Ticaret A.Ş. with a bid of U.S.$1.1 billion. The transfer of shares was made on December 12, 2014.
Orhaneli and Tunçbilek: The tender announcements which were made in the second half 2014 expired in the second half 2014. The final negotiations occurred on September 23, 2014. The highest bidder was Çelikler Taahhüt İnşaat ve Sanayi A.Ş. with a bid of U.S.$521 million.The transfer of shares was made on June 22, 2015.
Soma B: The tender announcement which was made in the second half of 2014 expired at the beginning of 2015. The final negotiations occurred on January 13, 2015. The highest bidder was Konya Şeker Sanayi ve Ticaret A.Ş. with a bid of U.S.$685.5 million. The transfer of shares was made on June 22, 2015.
124
C) Oil & Gas Supply, Power Generation and Distribution
i) Natural Gas Fired Power Generation Plants
Hamitabat: The tender announcement was made on August 10, 2012 and final negotiations were completed on March 6, 2013. The highest bidder was Limak Holding A.Ş with a bid of U.S.$105 million. The transfer of shares was made on August 1, 2013.
ii) Başkent Natural Gas Supply
The tendering of 80% shares of Başkent Natural Gas was cancelled as a result of insufficient bid prices obtained from potential investors. Under a law enacted in July of 2012, the remaining 20% of shares of Başkent Natural Gas held by the Municipality of Ankara was also included in retendering process, which was finalized in early 2013. The shares were transferred to Torunlar Gıda for a price of U.S.$1.2 million as of May 31, 2013.
iii) TP Petrol Dagittim A.S. (TP Petroleum Distribution Company)
TP Petrol Dagittim A.S.is engaged in the distribution of oil and gas. The tender announcement was made on August 1, 2016, and will expire on September 30, 2016.
Turkiye Halk Bankasi (Halkbank)
In accordance with the authorization provided to Privatization High Council by the Banking Law No. 541, an initial public offering for 24.98% of shares of the bank occurred on May 2-4, 2007 for U.S.$1.8 billion. A second tranche of shares (23.92 %) was sold through Borsa Istanbul-BIST (formerly known as Istanbul Stock Exchange) in the form of a secondary global offering in November of 2012. The proceeds from the secondary offering totaled U.S.$2.5 billion.
Sea Ports Operated By Turkish State Railways (“TCDD”) and Marinas
In accordance with the relevant provisions of the Privatization Law, the six sea ports, namely Mersin (privatized in 2007), Bandırma Samsun (privatized in 2010), İskenderun, İzmir, and Derince ports, operated by TCDD, were added to the privatization portfolio. The privatization of the sea ports was carried out through a transfer of operational rights. Of the privatization of the six sea ports, the retender of the İzmir Cruise Port expired on September 7, 2012. However, due to a lack of sufficient bids, the tender was cancelled again. Technical studies to retender the port are continuing.
The retendering of İskenderun Port under the TOR method was finalized on September 28, 2010. The highest bidder was Limak Yatırım Enerji Üretim A.Ş with a bid of U.S.$372 million. The transfer of shares was made on December 30, 2011.
The First tender of Derince Port was cancelled in 2010. Following the resolution of some technical problems, the retendering process concluded on June 5, 2014. The highest bidder was Safi Katı Yakıt Sanayi ve Ticaret A.Ş,with a bid of U.S.$543 million. The transfer of shares was made on February 25, 2015.
Each of the three highest bidders on Fenerbahçe-Kalamış Marina failed to fulfil the necessary tender obligations and the tender was canceled on April 8, 2016.
The Port of Salipazari Operated by Turkish Maritime Lines
The port of Salıpazarı, operated by Turkish Maritime Lines, and its vicinity are planned to be converted to a cruiser port. In addition to a cruiser port, the project contemplates construction of shopping centers, boutique hotels, entertainment units and cultural centers. The tender announcement, which was made in 2012, expired on April 30, 2013. The highest bidder was Doğuş Holding with a bid of U.S.$702 million. The contract was signed onFebruary 14, 2014.
Toll Motorways and Bosporus Bridges
Privatization studies of toll motorways, two Bosporus bridges, the beltways of Ankara and İzmir and the service units operated by the Turkish Highways General Directorate are almost complete. The strategy report is ready and various legal modifications have been made. The tender announcement, which was made on August 25, 2011, expired on October 31, 2012. The tender was cancelled as a result of insufficient bid price offers. A new privatization strategy is underway.
125
Milli Piyango (National Lottery)
The amendments, in respect of studies regarding the privatization process, made to the regulations regarding the grant of the License for Games of Chance and the Arrangement and Supervision of Operations subject to the License were published in the Official Gazette No. 29671 dated April 1, 2016. The privatization procedures were on April 5, 2016, through decision No. 2016/14 of the Privatization High Council. The membership of the Evaluation and Tender Commission was recomposed and a valuation report, prepared by the Evaluation Commission, was approved by the Council of Ministers. The Administrative and Technical Tender Specifications have been prepared and the tender announcement was made on May 6, 2016. The prequalification date is October 14, 2016 and the expiry date is November 8, 2016.
Dogusan East Iron Industry Construction Trade Co., Inc.
The PA has attempted to sell the shares of Dogusan East Iron Industry Construction Trade Co, Inc. five times. No bids were received in the first and second tenders (2008 and 2009). The third and fourth tenders (2011 and 2012) were canceled as a result of the investors not fulfilling their obligations. The fifth tender, made on June 23, 2016, was cancelled due to inadequacy of the bids. The PA will continue its efforts to privatize the company.
Erzurum Palandoken and Konakli Ski Resorts
The ski resorts of Erzurum Palandöken and Konaklı were constructed for 2011 Universidad Winter Games. These facilities meet international accredited winter sport standards in Turkey, with an elevation of, on average, over 2,000m. These privatization assets are comprised of real property, plant and equipment, skiing slopes, and mechanical installations (lifts, gondola lift, chairlift, and artificial snow plowing). The tender announcement to privatize the resorts was made at beginning of 2015 and expired on July 30, 2015. However, the tender was cancelled due to insufficiency of investor interest. The ownership of the resorts was transferred to the Greater City Municipality of Erzurum on July 4, 2016, and the privatization process will continue under the Terms of the Privatization Law by the Municipality of Erzurum.
EXTRA-BUDGETARY FUNDS
In 1984, due to increasing budgetary restrictions, the Government established a number of Extra Budgetary Funds (“EBFs”) with the objective of financing the implementation and administration of specific Government programs, such as incentive programs for exports and investment, social and housing programs, and public investment projects.
The following table presents, for the years indicated, the operating balance and financing of four EBFs, including the Privatization Fund, the Defense Industries Support Fund, the Social Aid and Solidarity Fund and the Support Price Stabilization Fund, for the 2010-2015 period. Since 2002, the consolidated EBF’s balance included only Privatization, Defense, Solidarity and Support Price Stabilization Funds.
Table 51
| | | | | | | | | | | | | | | | | | | | |
| Extra Budgetary Funds (Million TL) | | 2011 | | | 2012 | | | 2013 | | | 2014 | | | 2015 | |
Revenues | | | 5,763 | | | | 10,997 | | | | 7,384 | | | | 8,577 | | | | 19,378 | |
Expenditures | | | 4,522 | | | | 4,524 | | | | 9,990 | | | | 10,077 | | | | 8,962 | |
Surplus (Deficit) | | | 1,241 | | | | 6,473 | | | | -2,607 | | | | -1,500 | | | | 10,416 | |
Financing | | | -1,241 | | | | -6,473 | | | | 2,607 | | | | 1,500 | | | | -10,416 | |
Source: Ministry of Development
LOCAL GOVERNMENT
The operations of local authorities expanded rapidly following the Government’s 1984 decision to decentralize some responsibilities and to transfer substantial amounts of tax keep revenues to local authorities. Local authorities cover municipalities, special provincial administrations, municipally owned utilities, municipal unions and İlbank operations. In 2011, total expenditures by local authorities increased 18.49% to TL 44,033 million and the surplus was TL 2,525 million. In 2012, total expenditures by local authorities increased 17.01% to TL 51,525 million and the surplus was TL 220 million. In 2013, pre-local election year, total expenditures by local authorities increased 23.48% to TL 63,621 million. In 2014, total expenditures by local authorities increased 8.42% to TL 68,980 million and the deficit was TL 53.0 billion. In 2015, total expenditures by local authorities increased 5.18% to TL 66,920 million and the surplus was TL 1,200 million.
The following table presents the operating balance of the local authorities for the years indicated:
126
Table 52
| | | | | | | | | | | | | | | | | | | | |
| | | Local Authorities (Million TL) | |
| | | 2011 | | | 2012 | | | 2013 | | | 2014 | | | 2015(1) | |
Revenues | | | 46,558 | | | | 51,745 | | | | 61,328 | | | | 68,120 | | | | 78,696 | |
Expenditures | | | 44,033 | | | | 51,525 | | | | 63,621 | | | | 66,920 | | | | 77,973 | |
Surplus (Deficit) | | | 2,525 | | | | 220 | | | | -2,293 | | | | 1,200 | | | | 722 | |
Source: Ministry of Development
PUBLIC SECTOR FIXED INVESTMENT
The following table summarizes public sector fixed investment, including that of the SOEs and the EBFs, by economic sector for the years indicated:
Table 53
| | | | | | | | | | | | | | | | | | | | |
| Public Sector Fixed Investment (at current prices) | | 2011 | | | 2012 | | | 2013 | | | 2014 | | | 2015(1) | |
Agriculture | | | 9.8 | | | | 10.7 | | | | 9.6 | | | | 8.8 | | | | 9.2 | |
Mining | | | 2.3 | | | | 2.2 | | | | 1.5 | | | | 1.6 | | | | 2.0 | |
Manufacturing | | | 0.7 | | | | 0.8 | | | | 0.9 | | | | 0.7 | | | | 0.7 | |
Energy | | | 5.7 | | | | 6.0 | | | | 4.7 | | | | 5.6 | | | | 5.2 | |
Transport and communication | | | 41.3 | | | | 38.1 | | | | 38.6 | | | | 37.6 | | | | 37.9 | |
Tourism | | | 0.6 | | | | 0.7 | | | | 0.7 | | | | 0.5 | | | | 0.9 | |
Housing | | | 1.7 | | | | 1.3 | | | | 1.2 | | | | 1.0 | | | | 0.8 | |
Education | | | 12.2 | | | | 14.2 | | | | 14.4 | | | | 16.0 | | | | 13.2 | |
Health | | | 4.9 | | | | 5.3 | | | | 5.0 | | | | 5.6 | | | | 5.9 | |
Other Services | | | 20.8 | | | | 20.8 | | | | 23.3 | | | | 22.6 | | | | 24.3 | |
Total | | | 100. 0 | | | | 100.0 | | | | 100.0 | | | | 100.0 | | | | 100.0 | |
Total (millions of TL) | | | 53,247 | | | | 60,108 | | | | 78,165 | | | | 80,433 | | | | 93,637 | |
Source: Ministry of Development
PUBLIC SECTOR BORROWING REQUIREMENT
In 2011, the central government budget deficit was TL 17,783 million, representing 1.37% of GDP. Total Public Sector Borrowing Requirement (“PSBR”) was realized as 0.14% of GDP in 2011. In 2012, central government budget deficit was TL 29,412 million, representing 0.08% of GDP. Total PSBR was realized as 0.98% of GDP in 2012. In 2013, the consolidated budget deficit was TL 18,543 million, representing 1.18% of GDP. Total PSBR was recorded as 0.46% of GDP in 2013. In 2014, the consolidated budget deficit was recorded as TL 23.370 million, representing 1.34% of GDP. Total PSBR is expected to be 0.62% of GDP in 2014. In 2015, the consolidated budget deficit was recorded as TL 22,606 million, representing 1.15% of GDP. Total PSBR is expected to be -0.04% of GDP in 2015.
In 2011, total public debt stock (gross) as a percentage of GDP decreased to 42.1%. The net debt of the public sector decreased to 22.4% in 2011. In 2012, total public debt stock (gross) as a percentage of GDP declined to 39.7%. The net debt of the public sector declined to 17% in 2012. In 2013, total public debt stock (gross) as a percentage of GDP slightly increased to 39.8%. The net debt of the public sector declined to 12.6% in 2013. In 2014, total public debt stock (gross) as a percentage of GDP slightly decreased to 37.2%. The net debt of the public sector declined to 10.7% in 2014. In 2015, total public debt stock (gross) as a percentage of GDP declined to 36.8%. The net debt of the public sector declined to 8.2% in 2015.
The following table sets forth information as to Turkey’s public sector borrowing requirement for the years indicated:
127
Table 54
| | | | | | | | | | | | | | | | | | | | |
| Public Sector Borrowing Requirement (as a percentage of GDP) | | 2011 | | | 2012 | | | 2013 | | | 2014 | | | 2015(1) | |
Central Government Budget | | | 1.37 | | | | 2.08 | | | | 1.18 | | | | 1.34 | | | | 1.15 | |
Local administrations | | | -0.19 | | | | -0.02 | | | | 0.15 | | | | -0.07 | | | | -0.04 | |
SSI, UIF, EBFs and Revolving Funds | | | -0.82 | | | | -1.03 | | | | -0.58 | | | | -0.66 | | | | -1.12 | |
Social Security Institutions (SSI) | | | -0.02 | | | | 0.01 | | | | 0.33 | | | | 0.36 | | | | 0.56 | |
Unemployment Insurance Fund (UIF) | | | -0.58 | | | | -0.54 | | | | -0.59 | | | | -0.63 | | | | -0.60 | |
Revolving Funds | | | -0.12 | | | | -0.04 | | | | -0.12 | | | | -0.05 | | | | -0.03 | |
EBFs | | | -0.10 | | | | -0.46 | | | | 0.17 | | | | 0.09 | | | | -0.53 | |
SOEs | | | -0.22 | | | | -0.05 | | | | -0.29 | | | | 0.01 | | | | -0.03 | |
SOEs not under privatization | | | -0.17 | | | | -0.05 | | | | -0.09 | | | | 0.34 | | | | -0.02 | |
SOEs under privatization | | | -0.05 | | | | 0.00 | | | | -0.19 | | | | -0.33 | | | | -0.01 | |
Total | | | 0.14 | | | | 0.98 | | | | 0.46 | | | | 0.62 | | | | -0.04 | |
Source: Ministry of Development
| (1) | Provisional estimate (Medium Term Program) |
128
DEBT
GENERAL
In Turkey, the Treasury conducts domestic and external borrowing operations and issues government securities through direct sales, TAP, public offerings and auctions. A TAP sale is non-auction borrowing method used by the Government to enhance market access pursuant to which the Treasury is permitted to reissue bills or bonds of a specific amount and maturity at any time. The Treasury issues various borrowing instruments, such as zero coupon securities, inflation, revenue indexed securities, foreign exchange-denominated securities, lease certificates, Government Bonds with fixed coupon payments and floating rate notes.
The Treasury issues two kinds of domestic borrowing securities: (1) Treasury Bills, which have a maturity shorter than one year and (2) Government Bonds, which have a maturity longer than one year. These are considered “marketable” instruments. Auctions are the primary means of borrowing in domestic markets and fixed rate government bonds are the primary external borrowing instruments utilized by Turkey.
Turkey has not defaulted on any principal or interest payment on any external debt represented by bonds issued in public international markets since it began issuing such bonds in 1988.
Turkey issued the following external debt in 2014, and as of the date of this Annual Report in 2015:
| | • | | U.S.$2.5 billion of global notes on January 29, 2014, which mature on March 22, 2024 and have a 5.750% annual interest rate. |
| | • | | U.S.$1.5 billion of global notes on February 19, 2014, which mature on February 17, 2045 and have a 6.625% annual interest rate. |
| | • | | €1.0 billion of global notes on April 11, 2014, which mature on April 11, 2023 and have a 4.125% annual interest rate. |
| | • | | ¥100 billion of Samurai bonds on September 25, 2014, under the Japan Bank for International Cooperation guarantee, which mature on September 25, 2024 and have a 1.050% annual interest rate. |
| | • | | U.S.$1.0 billion of lease certificates on November 25, 2014, which mature on November 25, 2024 and have a 4.489% annual lease rate. |
| | • | | U.S.$1.5 billion of global notes on January 13, 2015, which mature on April 16, 2043 and have a 4.875% annual interest rate. |
| | • | | U.S.$1.5 billion of global notes on April 14, 2015, which mature on April 14, 2026 and have a 4.250% annual interest rate. |
The total gross outstanding external debt of Turkey was approximately U.S.$392.8 billion at the end of the first quarter of 2015, approximately U.S.$405.4 billion at the end of the second quarter of 2015, approximately U.S.$407.2 billion at the end of the third quarter of 2015 and approximately U.S.$397.9 billion at the end of the fourth quarter of 2015.
The aggregate amount of scheduled repayment of principal and interest of external debt of Turkey as of April 30, 2016, was U.S.$70.7 billion, U.S.$58.1 billion, U.S.$43.3 billion and U.S.$40.8 billion for 2016 (May-December), 2017, 2018 and 2019, respectively.
Turkey’s central government domestic debt was approximately TL 440.1 billion on December 31, 2015, compared with TL 414.6 billion on December 31, 2014. These numbers represent a 1.2% decrease (from 23.7 in 2014 to 22.5% in 2015) in the ratio of domestic debt to GDP between two years.
Turkey’s gross external debt was approximately U.S.$397.9 billion as of December 31, 2015, compared to U.S.$402.4 billion as of December 31, 2014.
On October 31, 2014, the Republic announced its 2015 financing program. According to the 2015 financing program, the Republic expects to repay (including principal and interest) a total of approximately TL 128.8 billion of debt in 2015, of which approximately TL 107.3 billion is domestic debt and approximately TL 21.5 billion is external debt. The total borrowing target for the Republic in 2015 is approximately TL 99.7 billion of which approximately TL88.0 billion would consist of domestic borrowing and approximately TL 11.8 billion would consist of external borrowings. Other sources of funds in 2015 will consist of cash primary surplus, privatization revenues, the revenues from 2-B land sales, transfers from the Unemployment Insurance Fund and the Savings Deposit Insurance Fund (SDIF), receipts from on-lending and guaranteed debt and use of cash account (which are targeted to yield TL 29.1 billion in total in 2015).
In 2015, the Republic’s average external borrowing cost for dollar-denominated issuances was approximately 4.7%.
The EU-defined general government debt to GDP ratio in 2015 was 32.9%, compared to 33.5% in 2014.
DOMESTIC DEBT
Within the framework of the government’s economic program, aimed at sustainable growth, continued disinflation and a viable debt position, there has been significant improvement in both the level and structure of the Treasury’s domestic debt in recent years, resulting from strong fiscal performance, strategic benchmarking policy and improving market sentiment. The ratio of domestic debt to GDP, which was 28.4% at the end of 2011, has progressively declined, to 23.7% as of the end of 2014 and to 22.5% as of the end of 2015.
129
Several key reforms have been implemented in the area of debt management during the last several years:
Due to the increased confidence in both domestic and international capital markets and the downward trend in inflation, there has been an increase in foreign investors’ TL-denominated debt issuances. As a result, the share of foreign investors in total domestic debt increased from 17.3% at the end of 2011, to 21.8% at the end of the 2014. By the end of the 2015, the share declined to 17.4% due to global economic conditions.
In 2010, Treasury began to issue ten-year fixed couponed and CPI Indexed Government Bonds. All of the outstanding foreign currency indexed and denominated debt securities issued in domestic market were redeemed and thereby the share of FX liabilities in total debt decreased from 1% at the end of 2011 to 0% at the end of 2015.
To further enhance the liquidity of domestic debt, the primary dealership system for government securities has been in place since May 2000, however during the May 2001—September 2002 period, it was suspended due to negative financial conditions. Currently, the primary dealership system for 2015 is in effect. In the last few years, the system contributed to the efficiency in both the primary and secondary market for government securities. The system provides greater depth and reduces volatility in the secondary market and helps to reduce rollover risk. The primary dealership system aims to create a liquid, transparent, and dependable secondary market, which in turn is expected to lead to decreased costs in the primary market.
Within the context of debt management policy, for attaining reasonable risk level and reducing borrowing cost, strategic benchmark implementation was maintained in 2015 similar to the previous years. With the implementation of strategic benchmark strategy, benchmark government bonds were reopened on a regular basis in a period of three months. In this way, by reducing the number of securities in the market, liquidity of securities was increased. For this purpose, TL denominated 2, 5 and 10 year fixed rate coupon bonds have been issued on a regular basis in line with international practice since the end of 2011.
In line with the objectives of diversifying borrowing instruments, broadening the investor base and lengthening borrowing maturities, CPI Indexed Government Bonds have continued to be issued.
With the aim of increasing domestic savings, diversifying borrowing instruments and broadening the investor base, lease certificates were issued for the first time both in domestic and international markets in 2012. Specifically, the issuance of lease certificates raised U.S.$3.75 billion from the international markets between 2012 -2014 and TL 11.5 billion from the domestic markets between 2012- 2015. In order to issue these lease certificates, the Republic enters into transactions with Hazine Müstesarligi Varlik Kiralama Anonim Sirketi, an asset leasing company incorporated in Turkey in accordance with Article 7/A of Law Number 4749 (the “Issuer”), which in turn issues these lease certificates from time to time in the domestic and global markets. On April 3, 2013, the parliamentary members of the main opposition party filed a constitutional objection with the Turkish Constitutional Court (the “Court”) challenging the legislation which allows the transactions between the Republic and the Issuer to be exempted from certain formal requirements. On November 1, 2013, the Court announced its decision to reject the constitutional objection.
Average maturity was increased in the year 2015. The average maturity of cash borrowing was 45 months in 2011, 61 months in 2012,74 months in 2013, 68 months in 2014 and 72 months in 2015. The cost of domestic public debt in local currency (including discounted treasury bills/government bonds and fixed rate government bonds) on a compounded basis was annually realized as 8.7%, 8.8%, 7.6%, 9.7% and 9.5%in the period of 2011-2015.
There has also been improvement in the structure of domestic debt stock. As a result of strategic benchmarks, which have been set in accordance with debt strategies based on risk analysis, the portion of foreign currency linked or denominated debt in the total domestic debt stock has consistently decreased and was reduced to 0% in February 2012, compared to 1.6% in 2010. The share of fixed interest rate instruments, as a proportion of the total domestic debt, increased to 58.3% in 2015 from 52.2% in 2011. On the other hand, there were no new issuances of non-cash debt securities in 2015. Therefore, the ratio of non-cash debt securities to total domestic debt declined to 0.01% at the end of 2015 from the level of 0.7% at the end of 2011.
The Treasury aims to increase maturity of borrowings in the upcoming years, while pursuing policies to mitigate market and liquidity risks and to enhance liquidity and efficiency in both the primary and secondary markets.
These, together with continued strong fiscal policies, are intended to ensure a sustainable path for domestic debt. The following tables show the domestic debt securities auctioned in years 2011-2015:
130
Treasury Auctions
Table 55
Auctions for zero coupon treasury notes in 2011:
| | | | | | | | | | | | | | | | | | | | | | | | | | | | | | | | | | | | |
| | | | | | | | | | | | | | | Sales Amount (Inc. Switching) | |
| | | Auction Date (dd.mm.yyyy) | | | Value Date (dd.mm.yyyy) | | | Maturity Date (dd.mm.yyyy) | | | Average Interest Rate (%) | | | Net Bid Amount | | | Nominal | | | Net | |
| | | | | | Term | | | Simple | | | Compound | | | (in thousands of Turkish Lira) | |
| | | | | | | | | | | | | | | | | | | | | | | | | | | | | | | | | | | | |
January | | | | | | | | | | | | | | | | | | | | | | | | | | | | | | | | | | | | |
22 Month G. Bond(665 days) | | | 10.01.2011 | | | | 12.01.2011 | | | | 07.11.2012 | | | | 13.11 | | | | 7.17 | | | | 6.98 | | | | 5,603,341 | | | | 7,778,137 | | | | 6,876,743 | |
14 Month G. Bond (420 days) | | | 17.01.2011 | | | | 19.01.2011 | | | | 14.03.2012 | | | | 8.58 | | | | 7.44 | | | | 7.39 | | | | 2,555,415 | | | | 2,374,093 | | | | 2,186,491 | |
February | | | | | | | | | | | | | | | | | | | | | | | | | | | | | | | | | | | | |
21 Month G. Bond (644 days) (r-o) | | | 01.02.2011 | | | | 02.02.2011 | | | | 07.11.2012 | | | | 14.78 | | | | 8.35 | | | | 8.10 | | | | 6,096,786 | | | | 6,873,564 | | | | 5,988,514 | |
March | | | | | | | | | | | | | | | | | | | | | | | | | | | | | | | | | | | | |
6 Month T. Bill (182 days) (R) | | | 07.03.2011 | | | | 09.03.2011 | | | | 07.09.2011 | | | | 4.06 | | | | 8.12 | | | | 8.28 | | | | 1,489,795 | | | | 754,426 | | | | 725,000 | |
20 Month G. Bond (609 days) (r-o) | | | 08.03.2011 | | | | 09.03.2011 | | | | 07.11.2012 | | | | 15.53 | | | | 9.28 | | | | 9.01 | | | | 2,917,840 | | | | 3,645,944 | | | | 3,155,819 | |
April | | | | | | | | | | | | | | | | | | | | | | | | | | | | | | | | | | | | |
22 Month G. Bond (679 days) | | | 12.04.2011 | | | | 13.04.2011 | | | | 20.02.2013 | | | | 17.19 | | | | 9.21 | | | | 8.88 | | | | 5,000,485 | | | | 4,550,107 | | | | 3,882,734 | |
May | | | | | | | | | | | | | | | | | | | | | | | | | | | | | | | | | | | | |
21 Month G. Bond (651 days) (r-o) | | | 10.05.2011 | | | | 11.05.2011 | | | | 20.02.2013 | | | | 15.33 | | | | 8.57 | | | | 8.30 | | | | 2,889,672 | | | | 4,453,720 | | | | 3,861,648 | |
June | | | | | | | | | | | | | | | | | | | | | | | | | | | | | | | | | | | | |
21 Month G. Bond (623 days) (r-o) | | | 07.06.2011 | | | | 08.06.2011 | | | | 20.02.2013 | | | | 15.81 | | | | 9.24 | | | | 8.95 | | | | 4,128,414 | | | | 3,244,716 | | | | 2,801,653 | |
July | | | | | | | | | | | | | | | | | | | | | | | | | | | | | | | | | | | | |
22 Month G. Bond (665 days) | | | 19.07.2011 | | | | 20.07.2011 | | | | 15.05.2013 | | | | 16.68 | | | | 9.13 | | | | 8.81 | | | | 4,951,950 | | | | 3,547,355 | | | | 3,040,190 | |
August | | | | | | | | | | | | | | | | | | | | | | | | | | | | | | | | | | | | |
21 Month G. Bond (651 days) (r-o) | | | 02.08.2011 | | | | 03.08.2011 | | | | 15.05.2013 | | | | 16.14 | | | | 9.02 | | | | 8.73 | | | | 5,061,320 | | | | 7,530,769 | | | | 6,484,372 | |
September | | | | | | | | | | | | | | | | | | | | | | | | | | | | | | | | | | | | |
20 Month G. Bond (616 days) (r-o) | | | 06.09.2011 | | | | 07.09.2011 | | | | 15.05.2013 | | | | 13.37 | | | | 7.90 | | | | 7.70 | | | | 1,820,957 | | | | 3,908,505 | | | | 3,447,653 | |
October | | | | | | | | | | | | | | | | | | | | | | | | | | | | | | | | | | | | |
21 Month G. Bond (644 days) | | | 11.10.2011 | | | | 12.10.2011 | | | | 17.07.2013 | | | | 15.18 | | | | 8.58 | | | | 8.32 | | | | 4,220,860 | | | | 3,480,116 | | | | 3,021,539 | |
November | | | | | | | | | | | | | | | | | | | | | | | | | | | | | | | | | | | | |
20 Month G. Bond (609 days) (r-o) | | | 15.11.2011 | | | | 16.11.2011 | | | | 17.07.2013 | | | | 18.34 | | | | 10.96 | | | | 10.59 | | | | 2,851,972 | | | | 5,773,947 | | | | 4,879,098 | |
2011 TOTAL | | | | | | | | | | | | | | | | | | | | | | | | | | | 49,588,806 | | | | 57,915,400 | | | | 50,351,453 | |
Source: UT
131
Table 56
Auctions for zero coupon treasury notes in 2012:
| | | | | | | | | | | | | | | | | | | | | | | | | | | | | | | | | | | | |
| | | | | | | | | | | | | | | | | | | | | Sales Amount (Inc. Switching) | |
| | | Auction Date (dd.mm.yyyy) | | | Value Date (dd.mm.yyyy) | | | Maturity Date (dd.mm.yyyy) | | | Average Interest Rate (%) | | | Net Bid Amount | | | Nominal | | | Net | |
| | | | | | Term | | | Simple | | | Compound | | | (in thousands of Turkish Lira) | |
| | | | | | | | | | | | | | | | | | | | | | | | | | | | | | | | | | | | |
January | | | | | | | | | | | | | | | | | | | | | | | | | | | | | | | | | | | | |
14 Month G. Bond(427 days) | | | 17.01.2012 | | | | 18.01.2012 | | | | 20.03.2013 | | | | 12.95 | | | | 11.04 | | | | 10.94 | | | | 6,122,636 | | | | 4,550,251 | | | | 4,028,470 | |
February | | | | | | | | | | | | | | | | | | | | | | | | | | | | | | | | | | | | |
13 Month G. Bond (399 days) (r-o) | | | 13.02.2012 | | | | 15.02.2012 | | | | 20.03.2013 | | | | 10.31 | | | | 10.99 | | | | 10.43 | | | | 3,395,546 | | | | 3,057,592 | | | | 2,771,093 | |
April | | | | | | | | | | | | | | | | | | | | | | | | | | | | | | | | | | | | |
11 Month G. Bond (329 days) (r-o) | | | 24.04.2012 | | | | 25.04.2012 | | | | 20.03.2013 | | | | 8.94 | | | | 9.90 | | | | 9.94 | | | | 1,557,437 | | | | 1,016,338 | | | | 932,896 | |
August | | | | | | | | | | | | | | | | | | | | | | | | | | | | | | | | | | | | |
13 Month G. Bond (392 days) | | | 14.08.2012 | | | | 15.08.2012 | | | | 11.09.2013 | | | | 8.72 | | | | 8.10 | | | | 8.07 | | | | 4,712,537 | | | | 3,197,306 | | | | 2,940,876 | |
September | | | | | | | | | | | | | | | | | | | | | | | | | | | | | | | | | | | | |
12 Month G. Bond (350 days) (r-o) | | | 25.09.2012 | | | | 26.09.2012 | | | | 11.09.2013 | | | | 6.92 | | | | 7.19 | | | | 7.21 | | | | 2,248,195 | | | | 1.476,214 | | | | 1,380,713 | |
November | | | | | | | | | | | | | | | | | | | | | | | | | | | | | | | | | | | | |
10 Month G. Bond (294 days) (r-o) | | | 20.11.2012 | | | | 21.11.2012 | | | | 11.09.2013 | | | | 4.74 | | | | 5.87 | | | | 5.90 | | | | 2,443,061 | | | | 1,435,480 | | | | 1,370,539 | |
2012 TOTAL | | | | | | | | | | | | | | | | | | | | | | | | | | | 20,479,412 | | | | 14,733,181 | | | | 13,424,587 | |
Source: UT
132
Table 57
Auctions for zero coupon treasury notes in 2013:
| | | | | | | | | | | | | | | | | | | | | | | | | | | | | | | | | | | | |
| | | | | | | | | | | | | | | | | | | | | Sales Amount (Inc. Switching) | |
| | | Auction Date | | | Value Date | | | Maturity Date | | | Average Interest Rate (%) | | | Net Bid Amount | | | Nominal | | | Net | |
| | | (dd.mm.yyyy) | | | (dd.mm.yyyy) | | | (dd.mm.yyyy) | | | Term | | | Simple | | | Compound | | | (in thousands of Turkish Lira) | |
January | | | | | | | | | | | | | | | | | | | | | | | | | | | | | | | | | | | | |
15 Month G. Bond (448 days) | | | 15.01.2013 | | | | 16.01.2013 | | | | 09.04.2014 | | | | 7.68 | | | | 6.24 | | | | 6.20 | | | | 4,031,774 | | | | 1,559,912 | | | | 1,448,656 | |
February | | | | | | | | | | | | | | | | | | | | | | | | | | | | | | | | | | | | |
14 Month G. Bond (420 days) (r-o) | | | 12.02.2013 | | | | 13.02.2013 | | | | 09.04.2014 | | | | 6.66 | | | | 5.77 | | | | 5.75 | | | | 2,391,198 | | | | 1,377,298 | | | | 1,291,286 | |
March | | | | | | | | | | | | | | | | | | | | | | | | | | | | | | | | | | | | |
15 Month G. Bond (455 days) (r-o) | | | 12.03.2013 | | | | 13.03.2013 | | | | 11.06.2014 | | | | 7.19 | | | | 5.75 | | | | 5.71 | | | | 2,300,587 | | | | 1,728,037 | | | | 1,612,201 | |
April | | | | | | | | | | | | | | | | | | | | | | | | | | | | | | | | | | | | |
14 Month G. Bond (434 days) (r-o) | | | 02.04.2013 | | | | 03.04.2013 | | | | 11.06.2014 | | | | 7.92 | | | | 6.64 | | | | 6.60 | | | | 1,884,112 | | | | 1,454,837 | | | | 1,348,065 | |
May | | | | | | | | | | | | | | | | | | | | | | | | | | | | | | | | | | | | |
15 Month G. Bond (441 days) | | | 21.05.2013 | | | | 22.05.2013 | | | | 06.08.2014 | | | | 6.18 | | | | 5.10 | | | | 5.07 | | | | 2,080,849 | | | | 748,685 | | | | 705,103 | |
June | | | | | | | | | | | | | | | | | | | | | | | | | | | | | | | | | | | | |
142 Month G. Bond (413 days) (r-o) | | | 18.06.2013 | | | | 19.06.2013 | | | | 06.08.2014 | | | | 7.71 | | | | 6.80 | | | | 6.76 | | | | 2,589,807 | | | | 1,406,231 | | | | 1,305,583 | |
July | | | | | | | | | | | | | | | | | | | | | | | | | | | | | | | | | | | | |
12 Month G. Bond (378 days) (r-o) | | | 23.07.2013 | | | | 24.07.2013 | | | | 06.08.2014 | | | | 8.84 | | | | 8.51 | | | | 8.50 | | | | 843,747 | | | | 482,530 | | | | 443,347 | |
August | | | | | | | | | | | | | | | | | | | | | | | | | | | | | | | | | | | | |
15 Month G. Bond (448 days) | | | 27.08.2013 | | | | 28.08.2013 | | | | 19.11.2014 | | | | 12.42 | | | | 10.09 | | | | 9.98 | | | | 1,609,903 | | | | 1,374,071 | | | | 1,222,238 | |
October | | | | | | | | | | | | | | | | | | | | | | | | | | | | | | | | | | | | |
13 Month G. Bond (392 days) | | | 22.10.2013 | | | | 23.10.2013 | | | | 19.11.2014 | | | | 8.26 | | | | 7.67 | | | | 7.65 | | | | 1,232,811 | | | | 664,328 | | | | 613,626 | |
November | | | | | | | | | | | | | | | | | | | | | | | | | | | | | | | | | | | | |
13 Month G. Bond (371 days) (r-o) | | | 12.11.2013 | | | | 13.11.2013 | | | | 19.11.2014 | | | | 9.05 | | | | 8.88 | | | | 8.87 | | | | 1,193,545 | | | | 1,172,112 | | | | 1,074,816 | |
2013 TOTAL | | | | | | | | | | | | | | | | | | | | | | | | | | | 20,158,333 | | | | 11,968,040 | | | | 11,064,922 | |
Source: UT
133
Table 58
Auctions for zero coupon treasury notes in 2014:
| | | | | | | | | | | | | | | | | | | | | | | | | | | | | | | | | | | | | | |
| | | | | Auction Date | | | Value Date | | | Maturity Date | | | Average Interest Rate (%) | | | Net Bid | | | Sales Amount (Inc. Switching) (in thousands TL) | |
| | | | | (dd.mm.yyyy) | | | (dd.mm.yyyy) | | | (dd.mm.yyyy) | | | Term | | | Simple | | | Compound | | | Amount 2 | | | Nominal | | | Net | |
January | | 14 Month G. Bond (427 days) | | | 21.01.2014 | | | | 22.01.2014 | | | | 25.03.2015 | | | | 12.10 | | | | 10.31 | | | | 10.22 | | | | 1,595,006 | | | | 1,618,265 | | | | 1,443,636 | |
February | | 13 Month G. Bond (399 days) (r-o) | | | 18.02.2014 | | | | 19.02.2014 | | | | 25.03.2015 | | | | 12.33 | | | | 11.25 | | | | 11.19 | | | | 2,424,094 | | | | 1,254,300 | | | | 1,116,573 | |
March | | 16 Month G. Bond (483 days) | | | 18.03.2014 | | | | 19.03.2014 | | | | 15.07.2015 | | | | 15.32 | | | | 11.55 | | | | 11.34 | | | | 1,821,922 | | | | 718,792 | | | | 623,286 | |
April | | 15 Month G. Bond (462 days) (r-o) | | | 08.04.2014 | | | | 09.04.2014 | | | | 15.07.2015 | | | | 12.80 | | | | 10.09 | | | | 9.96 | | | | 1,864,343 | | | | 1,063,652 | | | | 942,915 | |
May | | 14 Month G. Bond (413 days) (r-o) | | | 26.05.2014 | | | | 28.05.2014 | | | | 15.07.2015 | | | | 9.96 | | | | 8.78 | | | | 8.72 | | | | 2,637,550 | | | | 1,352,005 | | | | 1,229,588 | |
June | | 14 Month G. Bond (434 days) | | | 10.06.2014 | | | | 11.06.2014 | | | | 19.08.2015 | | | | 10.06 | | | | 8.44 | | | | 8.37 | | | | 1,660,498 | | | | 1,059,164 | | | | 962,337 | |
July | | 13 Month G. Bond (392 days) (r-o) | | | 22.07.2014 | | | | 23.07.2014 | | | | 19.08.2015 | | | | 9.00 | | | | 8.36 | | | | 8.33 | | | | 1,088,151 | | | | 856,475 | | | | 785,732 | |
August | | 12 Month G. Bond (371 days) (r-o) | | | 12.08.2014 | | | | 13.08.2014 | | | | 19.08.2015 | | | | 9.75 | | | | 9.56 | | | | 9.55 | | | | 1,492,025 | | | | 1,170,861 | | | | 1,066,886 | |
September | | 14 Month G. Bond (427 days) | | | 16.09.2014 | | | | 17.09.2014 | | | | 18.11.2015 | | | | 10.91 | | | | 9.30 | | | | 9.22 | | | | 2,458,774 | | | | 1,665,167 | | | | 1,501,432 | |
October | | 13 Month G. Bond (392 days) (r-o) | | | 21.10.2014 | | | | 22.10.2014 | | | | 18.11.2015 | | | | 9.51 | | | | 8.83 | | | | 8.80 | | | | 1,893,339 | | | | 1,075,862 | | | | 982,422 | |
December | | 12 Month G. Bond (364 days) | | | 16.12.2014 | | | | 17.12.2014 | | | | 16.12.2015 | | | | 8.81 | | | | 8.81 | | | | 8.81 | | | | 1,484,183 | | | | 1,186,146 | | | | 1,090,081 | |
2014 Total | | | | | | | | | | | | | | | | | | | | | | | | | | | | | 20,419,885 | | | | 13,020,689 | | | | 11,744,888 | |
Source: UT
134
Table 59
Auctions for zero coupon treasury notes in 2015:
| | | | | | | | | | | | | | | | | | | | | | | | | | | | | | | | | | | | |
| | | Auction Date (dd.mm.yyyy) | | | Value Date
(dd.mm.yyyy) | | | Maturity Date
(dd.mm.yyyy) | | | Average Interest Rate (%) | | | Net Bid Amount (in thousands) | | | Sales Amount
(Inc. Switching) (in thousands TL) | |
| | | | | Term | | | Simple | | | Compound | | | | Nominal | | | Net | |
11 Month G. Bond (336 days) (r-o) | | | 13.01.2015 | | | | 14.01.2015 | | | | 16.12.2015 | | | | 7.16 | | | | 7.75 | | | | 7.77 | | | | 1,783,801 | | | | 1,045,661 | | | | 975,832 | |
14 Month G. Bond (420 days) | | | 17.02.2015 | | | | 18.02.2015 | | | | 13.04.2016 | | | | 9.74 | | | | 8.44 | | | | 8.39 | | | | 1,017,201 | | | | 991,947 | | | | 903,902 | |
14 Month G. Bond (427 days) | | | 07.04.2015 | | | | 08.04.2015 | | | | 08.06.2016 | | | | 10.68 | | | | 9.10 | | | | 9.03 | | | | 804,330 | | | | 833,978 | | | | 753,532 | |
7 Month T. Bill (210 days) (r-o) | | | 18.05.2015 | | | | 20.05.2015 | | | | 16.12.2015 | | | | 5.59 | | | | 9.69 | | | | 9.88 | | | | 955,095 | | | | 898,916 | | | | 851,346 | |
6 Month G. Bond (182 days) (r-o) | | | 16.06.2015 | | | | 17.06.2015 | | | | 16.12.2015 | | | | 4.93 | | | | 9.85 | | | | 10.10 | | | | 292,387 | | | | 801,527 | | | | 763,887 | |
12 Month G. Bond (364 days) | | | 18.08.2015 | | | | 19.08.2015 | | | | 17.08.2016 | | | | 11.02 | | | | 11.02 | | | | 11.02 | | | | 468,436 | | | | 852,884 | | | | 768,219 | |
14 Month G. Bond (434 days) | | | 06.10.2015 | | | | 07.10.2015 | | | | 14.12.2016 | | | | 13.36 | | | | 11.21 | | | | 11.09 | | | | 785,253 | | | | 793,730 | | | | 700,157 | |
13 Month G. Bond (392 days) (r-o) | | | 17.11.2015 | | | | 18.11.2015 | | | | 14.12.2016 | | | | 11.15 | | | | 10.36 | | | | 10.32 | | | | 590,853 | | | | 654,259 | | | | 588,604 | |
2015 Total | | | | | | | | | | | | | | | | | | | | | | | | | | | 6,697,357 | | | | 6,872,902 | | | | 6,305,478 | |
Source: UT
Table 60
2011 Sales — Direct Sales and Tap Sales and Public Offers (2)
| | | | | | | | | | | | | | | | | | | | |
| | | Description | | | Issue Date
(dd.mm.yyyy) | | | Settlement Date
(dd.mm.yyyy) | | | Maturity | | | Net Amount (1) | |
February | | | | | | | | | | | | | | | | | | | | |
Revenue Indexed Bond - TL | | | Semiannually couponed | | | | 23.02.2011 | | | | 20.02.2013 | | | | 2 years | | | | 475.8 | |
August | | | | | | | | | | | | | | | | | | | | |
Revenue Indexed Bond - TL | | | Semiannually couponed | | | | 24.08.2011 | | | | 21.08.2013 | | | | 2 years | | | | 378.3 | |
| (1) | Million USD, Million TL |
| (2) | There were no tap sales and public offers in 2011. |
Source: UT
Table 61
2012 Sales — Direct Sales and Tap Sales and Public Offers (2)
| | | | | | | | | | | | | | | | | | | | |
| | | Description | | | Issue Date
(dd.mm.yyyy) | | | Settlement
Date
(dd.mm.yyyy) | | | Maturity | | | Net Amount (1) | |
February | | | | | | | | | | | | | | | | | | | | |
Revenue Indexed Bond - TL | | | Semiannually couponed | | | | 22.02.2012 | | | | 19.02.2014 | | | | 2 years | | | | 109.2 | |
October | | | | | | | | | | | | | | | | | | | | |
Lease Certificate - TL | | | Semiannually couponed | | | | 03.10.2012 | | | | 01.10.2014 | | | | 2 years | | | | 1,624.5 | |
| (1) | Million USD, Million TL |
| (2) | There were no tap sales and public offers in 2012. |
135
Source: UT
Table 62
2013 Sales – Direct Sales(1)
| | | | | | | | | | | | | | | | | | | | |
| | | Description | | | Issue Date
(dd.mm.yyyy) | | | Settlement
Date
(dd.mm.yyyy) | | | Maturity | | | Net Amount (1) | |
February | | | | | | | | | | | | | | | | | | | | |
Lease Certificate - TL | | | Semiannually couponed | | | | 19.02.2013 | | | | 18.02.2015 | | | | 2 years | | | | 1,515.3 | |
August | | | | | | | | | | | | | | | | | | | | |
Lease Certificate - TL | | | Semiannually couponed | | | | 20.08.2013 | | | | 19.08.2015 | | | | 2 years | | | | 1,817.3 | |
| (1) | Million USD, Million TL |
Source: UT
Table 63
2014 Sales - Direct Sales (1)
| | | | | | | | | | | | | | | | | | | | |
| | | Description | | | Issue Date
(dd.mm.yyyy) | | | Settlement
Date
(dd.mm.yyyy) | | | Maturity | | | Net Amount (1) | |
February | | | | | | | | | | | | | | | | | | | | |
Lease Certificate - TL | | | Semiannually couponed | | | | 19.02.2014 | | | | 17.02.2016 | | | | 2 years | | | | 1,332.8 | |
August | | | | | | | | | | | | | | | | | | | | |
Lease Certificate - TL | | | Semiannually couponed | | | | 01.10.2014 | | | | 28.09.2016 | | | | 2 years | | | | 1,839.9 | |
Source: UT
Table 64
2015 Sales - Direct Sales (1)
| | | | | | | | | | | | | | | | | | | | |
| | | Description | | | Issue Date
(dd.mm.yyyy) | | | Settlement
Date
(dd.mm.yyyy) | | | Maturity | | | Net Amount (1) | |
February | | | | | | | | | | | | | | | | | | | | |
Lease Certificate - TL | | | Semiannually couponed | | | | 18.02.2015 | | | | 15.02.2017 | | | | 2 years | | | | 1,801.5 | |
August | | | | | | | | | | | | | | | | | | | | |
Lease Certificate - TL | | | Semiannually couponed | | | | 19.08.2015 | | | | 16.08.2017 | | | | 2 years | | | | 1,588.8 | |
| (1) | Million USD, Million TL |
Source: UT
136
Table 65
Fixed Coupon TL Denominated Treasury Auctions in 2011
| | | | | | | | | | | | | | | | | | | | | | | | | | | | | | | | | | | | |
| | | Auction
Date
(dd.mm.yyyy) | | | Value
Date
(dd.mm.yyyy) | | | Maturity
Date
(dd.mm.yyyy) | | | | | | | | | | | | Sales Amount (Inc. Switching) | |
| | | | | | Average Interest Rate | | | Net
Bid Amount | | | Nominal | | | Net | |
| | | | | | Term | | | Simple | | | Compound | | | (thousand TL) | |
9 Year Semi Annual Couponed G. Bond | | | 11.01.2011 | | | | 12.01.2011 | | | | 15.01.2020 | | | | 4.28 | % | | | 8.57 | % | | | 8.75 | % | | | 3,840,709 | | | | 2,936,950 | | | | 3,431,027 | |
3 Year Quarterly Couponed G. Bond | | | 18.01.2011 | | | | 19.01.2011 | | | | 09.10.2013 | | | | 1.98 | % | | | 7.92 | % | | | 8.16 | % | | | 6,182,520 | | | | 5,334,224 | | | | 5,352,985 | |
3 Year Quarterly Couponed G. Bond | | | 31.01.2011 | | | | 02.02.2011 | | | | 29.01.2014 | | | | 2.21 | % | | | 8.84 | % | | | 9.14 | % | | | 1,887,543 | | | | 1,854,610 | | | | 1,813,778 | |
5 Year Semi Annual Couponed G. Bond | | | 01.02.2011 | | | | 02.02.2011 | | | | 27.01.2016 | | | | 4.64 | % | | | 9.27 | % | | | 9.49 | % | | | 2,322,628 | | | | 3,133,671 | | | | 3,099,925 | |
3 Year Quarterly Couponed G. Bond | | | 08.03.2011 | | | | 09.03.2011 | | | | 29.01.2014 | | | | 2.29 | % | | | 9.15 | % | | | 9.47 | % | | | 681,992 | | | | 656,314 | | | | 642,242 | |
3 Year Quarterly Couponed G. Bond | | | 11.04.2011 | | | | 13.04.2011 | | | | 29.01.2014 | | | | 2.26 | % | | | 9.04 | % | | | 9.36 | % | | | 2,582,906 | | | | 1,810,939 | | | | 1,792,270 | |
3 Year Quarterly Couponed G. Bond | | | 09.05.2011 | | | | 11.05.2011 | | | | 29.01.2014 | | | | 2.23 | % | | | 8.91 | % | | | 9.21 | % | | | 3,761,130 | | | | 4,125,056 | | | | 4,040,980 | |
5 Year Semi Annual Couponed G. Bond | | | 10.05.2011 | | | | 11.05.2011 | | | | 27.01.2016 | | | | 4.54 | % | | | 9.08 | % | | | 9.29 | % | | | 1,562,242 | | | | 1,032,474 | | | | 1,053,981 | |
3 Year Quarterly Couponed G. Bond | | | 07.06.2011 | | | | 08.06.2011 | | | | 04.06.2014 | | | | 2.28 | % | | | 9.12 | % | | | 9.44 | % | | | 1,310,341 | | | | 1,832,487 | | | | 1,778,976 | |
3 Year Quarterly Couponed G. Bond | | | 18.07.2011 | | | | 20.07.2011 | | | | 04.06.2014 | | | | 2.26 | % | | | 9.05 | % | | | 9.36 | % | | | 1,598,527 | | | | 1,733,071 | | | | 1,703,141 | |
9 Year semi Annual Couponed G. Bond | | | 19.07.2011 | | | | 20.07.2011 | | | | 15.01.2020 | | | | 4.69 | % | | | 9.39 | % | | | 9.61 | % | | | 632,241 | | | | 1,094,814 | | | | 1,220,466 | |
3 Year Quarterly Couponed G. Bond | | | 01.08.2011 | | | | 03.08.2011 | | | | 04.06.2014 | | | | 2.27 | % | | | 9.08 | % | | | 9.40 | % | | | 2,038,930 | | | | 2,914,784 | | | | 2,872,202 | |
4 Year Semi Annual Couponed G. Bond | | | 16.08.2011 | | | | 17.08.2011 | | | | 27.01.2016 | | | | 4.37 | % | | | 8.74 | % | | | 8.93 | % | | | 1,596,187 | | | | 1,208,725 | | | | 1,224,137 | |
3 Year Quarterly Couponed G. Bond | | | 05.09.2011 | | | | 07.09.2011 | | | | 04.06.2014 | | | | 1.99 | % | | | 7.95 | % | | | 8.19 | % | | | 1,991,437 | | | | 3,281,561 | | | | 3,285,802 | |
8 Year Semi Annual Couponed G. Bond | | | 06.09.2011 | | | | 07.09.2011 | | | | 15.01.2020 | | | | 4.33 | % | | | 8.67 | % | | | 8.85 | % | | | 1,165,361 | | | | 1,733,127 | | | | 1,940,550 | |
3 Year Quarterly Couponed G. Bond | | | 11.10.2011 | | | | 12.10.2011 | | | | 04.06.2014 | | | | 2.10 | % | | | 8.39 | % | | | 8.66 | % | | | 1,205,329 | | | | 1,497,898 | | | | 1,495,619 | |
3 Year Quarterly Couponed G. Bond | | | 14.11.2011 | | | | 16.11.2011 | | | | 04.06.2014 | | | | 2.41 | % | | | 9.66 | % | | | 10.01 | % | | | 1,066,426 | | | | 1,204,858 | | | | 1,178,530 | |
4 Year Semi Annual Couponed G. Bond | | | 15.11.2011 | | | | 16.11.2011 | | | | 27.01.2016 | | | | 5.05 | % | | | 10.10 | % | | | 10.35 | % | | | 372,442 | | | | 757,256 | | | | 748,811 | |
2 Year Semi Annual Couponed G. Bond | | | 06.12.2011 | | | | 07.12.2011 | | | | 04.12.2013 | | | | 5.04 | % | | | 10.09 | % | | | 10.34 | % | | | 1,543,327 | | | | 2,295,109 | | | | 2,291,461 | |
Source: UT
137
Table 66
Fixed Coupon TL Denominated Treasury Auctions in 2012
| | | | | | | | | | | | | | | | | | | | | | | | | | | | | | | | | | | | |
| | | Auction
Date
(dd.mm.yyyy) | | | Value
Date
(dd.mm.yyyy) | | | Maturity
Date
(dd.mm.yyyy) | | | | | | | | | | | | Sales Amount (Inc. Switching) | |
| | | | | | Average Interest Rate | | | Net Bid
Amount | | | Nominal | | | Net | |
| | | | | | Term | | | Simple | | | Compound | | | (thousand TL) | |
4 Year Semi Annual Couponed G. Bond | | | 23.01.2012 | | | | 25.01.2012 | | | | 27.01.2016 | | | | 5.16 | % | | | 10.31 | % | | | 10.58 | % | | | 2,684,748 | | | | 3,669,138 | | | | 3,672,508 | |
2 Year Semi Annual Couponed G. Bond | | | 24.01.2012 | | | | 25.01.2012 | | | | 04.12.2013 | | | | 5.01 | % | | | 10.03 | % | | | 10.28 | % | | | 3,171,568 | | | | 4,852,016 | | | | 4,913,786 | |
10 Year Semi Annual Couponed G. Bond | | | 24.01.2012 | | | | 25.01.2012 | | | | 12.01.2022 | | | | 4.76 | % | | | 9.51 | % | | | 9.74 | % | | | 1,135,974 | | | | 1,378,400 | | | | 1,377,294 | |
4 Year Semi Annual Couponed G. Bond | | | 13.02.2012 | | | | 15.02.2012 | | | | 27.01.2016 | | | | 4.65 | % | | | 9.3 | % | | | 9.52 | % | | | 3,263,429 | | | | 2,250,666 | | | | 2,236,268 | |
2 Year Semi Annual Couponed G. Bond | | | 14.02.2012 | | | | 15.02.2012 | | | | 04.12.2013 | | | | 4.52 | % | | | 9.03 | % | | | 9.24 | % | | | 1,868,460 | | | | 3,032,850 | | | | 3,138,366 | |
10 Year Semi Annual Couponed G. Bond | | | 14.02.2012 | | | | 15.02.2012 | | | | 12.01.2022 | | | | 4.7 | % | | | 9.4 | % | | | 9.63 | % | | | 2,098,227 | | | | 1,575,169 | | | | 1,593,209 | |
10 Year Semi Annual Couponed G. Bond | | | 05.03.2012 | | | | 07.03.2012 | | | | 12.01.2022 | | | | 4.74 | % | | | 9.48 | % | | | 9.70 | % | | | 2,383,488 | | | | 2,457,599 | | | | 2,487,189 | |
2 Year Semi Annual Couponed G. Bond | | | 06.03.2012 | | | | 07.03.2012 | | | | 05.03.2014 | | | | 4.6 | % | | | 9.19 | % | | | 9.41 | % | | | 2,498,436 | | | | 2,784,542 | | | | 2,774,850 | |
5 Year Semi Annual Couponed G. Bond | | | 13.03.2012 | | | | 14.03.2012 | | | | 08.03.2017 | | | | 4.67 | % | | | 9.34 | % | | | 9.56 | % | | | 3,438,821 | | | | 2,338,611 | | | | 2,307,232 | |
5 Year Semi Annual Couponed G. Bond | | | 17.04.2012 | | | | 18.04.2012 | | | | 08.03.2017 | | | | 4.65 | % | | | 9.31 | % | | | 9.53 | % | | | 2,258,706 | | | | 2,855,702 | | | | 2,845,882 | |
2 Year Semi Annual Couponed G. Bond | | | 24.04.2012 | | | | 25.04.2012 | | | | 05.03.2014 | | | | 4.64 | % | | | 9.27 | % | | | 9.49 | % | | | 1,651,009 | | | | 1,849,226 | | | | 1,862,817 | |
10 Year Semi Annual Couponed G. Bond | | | 24.04.2012 | | | | 25.04.2012 | | | | 12.01.2022 | | | | 4.74 | % | | | 9.48 | % | | | 9.7 | % | | | 2,298,361 | | | | 3,686,085 | | | | 3,778,020 | |
2 Year Semi Annual Couponed G. Bond | | | 08.05.2012 | | | | 09.05.2012 | | | | 05.03.2014 | | | | 4.62 | % | | | 9.25 | % | | | 9.46 | % | | | 1,955,614 | | | | 1,157,164 | | | | 1,170,207 | |
2 Year Semi Annual Couponed G. Bond | | | 19.06.2012 | | | | 20.06.2012 | | | | 05.03.2014 | | | | 4.45 | % | | | 8.9 | % | | | 9.10 | % | | | 1,544,364 | | | | 1,827,830 | | | | 1,877,617 | |
2 Year Semi Annual Couponed G. Bond | | | 10.07.2012 | | | | 11.07.2012 | | | | 05.03.2014 | | | | 3.92 | % | | | 7.85 | % | | | 8.00 | % | | | 3,864,358 | | | | 4,420,856 | | | | 4,635,455 | |
5 Year Semi Annual Couponed G. Bond | | | 06.08.2012 | | | | 08.08.2012 | | | | 08.03.2017 | | | | 3.89 | % | | | 7.78 | % | | | 7.93 | % | | | 1,852,276 | | | | 2.792.996 | | | | 3,023,670 | |
2 Year Semi Annual Couponed G. Bond | | | 07.08.2012 | | | | 08.08.2012 | | | | 05.03.2014 | | | | 3.76 | % | | | 7.52 | % | | | 7.66 | % | | | 2,204,591 | | | | 3,505,933 | | | | 3,714,745 | |
9 Year Semi Annual Couponed G. Bond | | | 07.08.2012 | | | | 08.08.2012 | | | | 12.01.2022 | | | | 4.05 | % | | | 8.11 | % | | | 8.27 | % | | | 1,116,486 | | | | 1,488,279 | | | | 1,628,489 | |
10 Year Semi Annual Couponed G. Bond | | | 24.09.2012 | | | | 26.09.2012 | | | | 14.09.2022 | | | | 4.22 | % | | | 8.44 | % | | | 8.61 | % | | | 3,688,255 | | | | 3,113,146 | | | | 3,126,596 | |
2 Year Semi Annual Couponed G. Bond | | | 25.09.2012 | | | | 26.09.2012 | | | | 24.09.2014 | | | | 3.71 | % | | | 7.42 | % | | | 7.56 | % | | | 6,145,842 | | | | 3,937,635 | | | | 3,943,108 | |
2 Year Semi Annual Couponed G. Bond | | | 16.10.2012 | | | | 17.10.2012 | | | | 24.09.2014 | | | | 3.69 | % | | | 7.38 | % | | | 7.51 | % | | | 7,533,940 | | | | 2,591,803 | | | | 2,608,522 | |
4 Year Semi Annual Couponed G. Bond | | | 05.11.2012 | | | | 07.11.2012 | | | | 08.03.2017 | | | | 3.62 | % | | | 7.23 | % | | | 7.36 | % | | | 3,251,590 | | | | 2,045,050 | | | | 2,205,895 | |
2 Year Semi Annual Couponed G. Bond | | | 06.11.2012 | | | | 07.11.2012 | | | | 24.09.2014 | | | | 3.39 | % | | | 6.78 | % | | | 6.9 | % | | | 3,904,354 | | | | 2,496,681 | | | | 2,549,305 | |
10 Year Semi Annual Couponed G. Bond | | | 06.11.2012 | | | | 07.11.2012 | | | | 14.09.2022 | | | | 3.8 | % | | | 7.6 | % | | | 7.74 | % | | | 3,070,361 | | | | 3,138,319 | | | | 3,362,677 | |
2 Year Semi Annual Couponed G. Bond | | | 11.12.2012 | | | | 12.12.2012 | | | | 24.09.2014 | | | | 2.84 | % | | | 5.69 | % | | | 5.77 | % | | | 1,574,684 | | | | 1,096,764 | | | | 1,147,344 | |
Source: UT
138
Table 67
Fixed Coupon TL Denominated Treasury Auctions in 2013
| | | | | | | | | | | | | | | | | | | | | | | | | | | | | | | | | | | | |
| | | | | | | | | | Sales Amount (in thousands TL) | |
| | | Auction
Date
(dd.mm.yyyy) | | | Value
Date
(dd.mm.yyyy) | | | Maturity
Date
(dd.mm.yyyy) | | | Average Interest Rate | | | Net
Bid Amount | | | Nominal | | | Net | |
| | | | | | Term | | | Simple | | | Compound | | | | | | | | | | |
4 Year Semi Annual Couponed G. Bond | | | 07.01.2013 | | | | 09.01.2013 | | | | 08.03.2017 | | | | 3.26 | % | | | 6.51 | % | | | 6.62 | % | | | 12,107,026 | | | | 2,847,522 | | | | 3,185,836 | |
2 Year Semi Annual Couponed G. Bond | | | 08.01.2013 | | | | 09.01.2013 | | | | 07.01.2015 | | | | 3.00 | % | | | 6.01 | % | | | 6.10 | % | | | 8,921,472 | | | | 2,472,642 | | | | 2,495,343 | |
10 Year Semi Annual Couponed G. Bond | | | 08.01.2013 | | | | 09.01.2013 | | | | 14.09.2022 | | | | 3.32 | % | | | 6.64 | % | | | 6.75 | % | | | 4,219,822 | | | | 2,369,317 | | | | 2,739,671 | |
5 Year Semi Annual Couponed G. Bond | | | 18.02.2013 | | | | 20.02.2013 | | | | 14.02.2018 | | | | 3.10 | % | | | 6.20 | % | | | 6.30 | % | | | 4,970,686 | | | | 3,029,977 | | | | 3,042,218 | |
2 Year Semi Annual Couponed G. Bond | | | 19.02.2013 | | | | 20.02.2013 | | | | 07.01.2015 | | | | 2.84 | % | | | 5.68 | % | | | 5.76 | % | | | 1,470,376 | | | | 2,305,581 | | | | 2,356,122 | |
10 Year Semi Annual Couponed G. Bond | | | 19.02.2013 | | | | 20.02.2013 | | | | 14.09.2022 | | | | 3.37 | % | | | 6.73 | % | | | 6.84 | % | | | 2,616,247 | | | | 2,150,183 | | | | 2,489,519 | |
5 Year Semi Annual Couponed G. Bond | | | 18.03.2013 | | | | 20.03.2013 | | | | 14.02.2018 | | | | 3.22 | % | | | 6.44 | % | | | 6.54 | % | | | 2,182,819 | | | | 1,366,346 | | | | 1,364,846 | |
2 Year Semi Annual Couponed G. Bond | | | 19.03.2013 | | | | 20.03.2013 | | | | 07.01.2015 | | | | 3.04 | % | | | 6.08 | % | | | 6.17 | % | | | 1,640,006 | | | | 1,651,601 | | | | 1,683,740 | |
10 Year Semi Annual Couponed G. Bond | | | 19.03.2013 | | | | 20.03.2013 | | | | 08.03.2023 | | | | 3.55 | % | | | 7.11 | % | | | 7.23 | % | | | 3,190,045 | | | | 2,195,594 | | | | 2,194,781 | |
10 Year Semi Annual Couponed G. Bond | | | 02.04.2013 | | | | 03.04.2013 | | | | 08.03.2023 | | | | 3.57 | % | | | 7.14 | % | | | 7.27 | % | | | 3,671,610 | | | | 2,606,486 | | | | 2,605,803 | |
5 Year Semi Annual Couponed G. Bond | | | 08.04.2013 | | | | 10.04.2013 | | | | 14.02.2018 | | | | 3.14 | % | | | 6.28 | % | | | 6.38 | % | | | 5,824,514 | | | | 3,451,955 | | | | 3,484,031 | |
2 Year Semi Annual Couponed G. Bond | | | 09.04.2013 | | | | 10.04.2013 | | | | 07.01.2015 | | | | 2.94 | % | | | 5.89 | % | | | 5.97 | % | | | 2,547,717 | | | | 2,060,588 | | | | 2,114,534 | |
5 Year Semi Annual Couponed G. Bond | | | 13.05.2013 | | | | 15.05.2013 | | | | 14.02.2018 | | | | 2.92 | % | | | 5.84 | % | | | 5.93 | % | | | 6,186,267 | | | | 4,969,831 | | | | 5,135,214 | |
2 Year Semi Annual Couponed G. Bond | | | 14.05.2013 | | | | 15.05.2013 | | | | 13.05.2015 | | | | 2.48 | % | | | 4.95 | % | | | 5.01 | % | | | 2,784,232 | | | | 2,691,830 | | | | 2,694,272 | |
10 Year Semi Annual Couponed G. Bond | | | 14.05.2013 | | | | 15.05.2013 | | | | 08.03.2023 | | | | 3.09 | % | | | 6.18 | % | | | 6.27 | % | | | 1,743,859 | | | | 1,576,432 | | | | 1,699,500 | |
5 Year Semi Annual Couponed G. Bond | | | 24.06.2013 | | | | 26.06.2013 | | | | 20.06.2018 | | | | 4.37 | % | | | 8.74 | % | | | 8.93 | % | | | 1,557,182 | | | | 2,472,981 | | | | 2,429,454 | |
2 Year Semi Annual Couponed G. Bond | | | 25.06.2013 | | | | 26.06.2013 | | | | 13.05.2015 | | | | 3.98 | % | | | 7.96 | % | | | 8.12 | % | | | 1,644,374 | | | | 1,650,631 | | | | 1,576,003 | |
10 Year Semi Annual Couponed G. Bond | | | 25.06.2013 | | | | 26.06.2013 | | | | 08.03.2023 | | | | 4.30 | % | | | 8.59 | % | | | 8.78 | % | | | 1,868,424 | | | | 2,986,213 | | | | 2,752,540 | |
5 Year Semi Annual Couponed G. Bond | | | 15.07.2013 | | | | 17.07.2013 | | | | 20.06.2018 | | | | 4.46 | % | | | 8.92 | % | | | 9.12 | % | | | 2,730,796 | | | | 3,724,961 | | | | 3,651,210 | |
2 Year Semi Annual Couponed G. Bond | | | 16.07.2013 | | | | 17.07.2013 | | | | 13.05.2015 | | | | 4.40 | % | | | 8.79 | % | | | 8.99 | % | | | 1,678,619 | | | | 1,844,745 | | | | 1,744,726 | |
10 Year Semi Annual Couponed G. Bond | | | 16.07.2013 | | | | 17.07.2013 | | | | 08.03.2023 | | | | 4.42 | % | | | 8.84 | % | | | 9.03 | % | | | 2,714,034 | | | | 3,108,461 | | | | 2,833,458 | |
5 Year Semi Annual Couponed G. Bond | | | 12.08.2013 | | | | 14.08.2013 | | | | 20.06.2018 | | | | 4.42 | % | | | 8.85 | % | | | 9.04 | % | | | 1,064,871 | | | | 1,543,404 | | | | 1,527,460 | |
2 Year Semi Annual Couponed G. Bond | | | 13.08.2013 | | | | 14.08.2013 | | | | 13.05.2015 | | | | 4.41 | % | | | 8.83 | % | | | 9.02 | % | | | 1,023,076 | | | | 1,559,495 | | | | 1,483,940 | |
10 Year Semi Annual Couponed G. Bond | | | 13.08.2013 | | | | 14.08.2013 | | | | 08.03.2023 | | | | 4.52 | % | | | 9.04 | % | | | 9.24 | % | | | 1,458,460 | | | | 1,841,138 | | | | 1,668,236 | |
5 Year Semi Annual Couponed G. Bond | | | 09.09.2013 | | | | 11.09.2013 | | | | 20.06.2018 | | | | 4.73 | % | | | 9.47 | % | | | 9.69 | % | | | 1,287,337 | | | | 2,365,970 | | | | 2,302,702 | |
2 Year Semi Annual Couponed G. Bond | | | 10.09.2013 | | | | 11.09.2013 | | | | 13.05.2015 | | | | 4.65 | % | | | 9.30 | % | | | 9.52 | % | | | 1,006,572 | | | | 1,503,285 | | | | 1,429,564 | |
10 Year Semi Annual Couponed G. Bond | | | 10.09.2013 | | | | 11.09.2013 | | | | 08.03.2023 | | | | 4.90 | % | | | 9.81 | % | | | 10.05 | % | | | 1,543,849 | | | | 2,670,990 | | | | 2,321,037 | |
5 Year Semi Annual Couponed G. Bond | | | 07.10.2013 | | | | 09.10.2013 | | | | 20.06.2018 | | | | 4.37 | % | | | 8.74 | % | | | 8.93 | % | | | 6,245,914 | | | | 2,980,607 | | | | 3,002,038 | |
2 Year Semi Annual Couponed G. Bond | | | 08.10.2013 | | | | 09.10.2013 | | | | 07.10.2015 | | | | 3.89 | % | | | 7.78 | % | | | 7.93 | % | | | 3,899,795 | | | | 2,216,104 | | | | 2,237,050 | |
10 Year Semi Annual Couponed G. Bond | | | 08.10.2013 | | | | 09.10.2013 | | | | 27.09.2023 | | | | 4.32 | % | | | 8.64 | % | | | 8.82 | % | | | 3,957,828 | | | | 1,714,775 | | | | 1,733,329 | |
5 Year Semi Annual Couponed G. Bond | | | 18.11.2013 | | | | 20.11.2013 | | | | 14.11.2018 | | | | 4.29 | % | | | 8.57 | % | | | 8.76 | % | | | 2,368,607 | | | | 2,108,567 | | | | 2,127,646 | |
2 Year Semi Annual Couponed G. Bond | | | 19.11.2013 | | | | 20.11.2013 | | | | 07.10.2015 | | | | 4.26 | % | | | 8.52 | % | | | 8.71 | % | | | 3,260,167 | | | | 1,598,459 | | | | 1,607,424 | |
10 Year Semi Annual Couponed G. Bond | | | 19.11.2013 | | | | 20.11.2013 | | | | 27.09.2023 | | | | 4.44 | % | | | 8.89 | % | | | 9.08 | % | | | 1,315,370 | | | | 1,866,724 | | | | 1,874,975 | |
5 Year Semi Annual Couponed G. Bond | | | 02.12.2013 | | | | 04.12.2013 | | | | 14.11.2018 | | | | 4.49 | % | | | 8.97 | % | | | 9.17 | % | | | 1,971,199 | | | | 2,088,728 | | | | 2,081,457 | |
2 Year Semi Annual Couponed G. Bond | | | 03.12.2013 | | | | 04.12.2013 | | | | 07.10.2015 | | | | 4.46 | % | | | 8.92 | % | | | 9.12 | % | | | 1,322,813 | | | | 1,777,588 | | | | 1,781,482 | |
10 Year Semi Annual Couponed G. Bond | | | 03.12.2013 | | | | 04.12.2013 | | | | 27.09.2023 | | | | 4.63 | % | | | 9.26 | % | | | 9.47 | % | | | 1,220,750 | | | | 1,428,346 | | | | 1,405,679 | |
2013 Total | | | | | | | | | | | | | | | 109,216,737 | | | | 82,798,056 | | | | 82,856,838 | |
Source: UT
139
Table 68
Fixed Coupon TL Denominated Treasury Auctions in 2014
| | | | | | | | | | | | | | | | | | | | | | | | | | | | | | | | | | | | |
| | | Auction Date (dd.mm.yyyy) | | | Value Date (dd.mm.yyyy) | | | Maturity Date (dd.mm.yyyy) | | | Average Interest Rate (%) | | | Net Bid Amount (in thousands
TL) | | | Sales Amount (Inc. Switching) (in thousands TL) | |
| | | | | | Term | | | Simple | | | Compound | | | | Nominal | | | Net | |
| | | | | | | | | | | | | | | | | | | | | | | | | | | | | | | | | | | | |
5 Year Semi Annual Couponed G. Bond (1750 days) (r-o) | | | 27.01.2014 | | | | 29.01.2014 | | | | 14.11.2018 | | | | 5.48 | % | | | 10.95 | % | | | 11.25 | % | | | 1,719,472 | | | | 3,234,752 | | | | 3,033,615 | |
2 Year Semi Annual Couponed G. Bond (616 days) (r-o) | | | 28.01.2014 | | | | 29.01.2014 | | | | 07.10.2015 | | | | 5.36 | % | | | 10.73 | % | | | 11.01 | % | | | 3,499,565 | | | | 1,574,321 | | | | 1,556,408 | |
10 Year Semi Annual Couponed G. Bond (3528 days) (r-o) | | | 28.01.2014 | | | | 29.01.2014 | | | | 27.09.2023 | | | | 5.09 | % | | | 10.17 | % | | | 10.43 | % | | | 1,564,036 | | | | 2,284,829 | | | | 2,155,806 | |
5 Year Semi Annual Couponed G.Bond (1722 days) (r-o) | | | 24.02.2014 | | | | 26.02.2014 | | | | 14.11.2018 | | | | 5.23 | % | | | 10.46 | % | | | 10.74 | % | | | 4,907,110 | | | | 2,778,831 | | | | 2,674,933 | |
2 Year Semi Annual Couponed G.Bond (728 days) | | | 25.02.2014 | | | | 26.02.2014 | | | | 24.02.2016 | | | | 5.44 | % | | | 10.88 | % | | | 11.18 | % | | | 1,727,495 | | | | 1,585,199 | | | | 1,580,077 | |
10 Year Semi Annual Couponed G.Bond (3500 days) (r-o) | | | 25.02.2014 | | | | 26.02.2014 | | | | 27.09.2023 | | | | 5.17 | % | | | 10.34 | % | | | 10.61 | % | | | 2,025,947 | | | | 2,147,660 | | | | 2,021,292 | |
5 Year Semi Annual Couponed G.Bond (1715 days) (r-o) | | | 03.03.2014 | | | | 05.03.2014 | | | | 14.11.2018 | | | | 5.36 | % | | | 10.73 | % | | | 11.01 | % | | | 2,381,819 | | | | 3,949,259 | | | | 3,772,606 | |
2 Year Semi Annual Couponed G.Bond (721 days) (r-o) | | | 04.03.2014 | | | | 05.03.2014 | | | | 24.02.2016 | | | | 5.51 | % | | | 11.03 | % | | | 11.33 | % | | | 3,476,601 | | | | 3,397,364 | | | | 3,384,726 | |
10 Year Semi Annual Couponed G.Bond (3493 days) (r-o) | | | 04.03.2014 | | | | 05.03.2014 | | | | 27.09.2023 | | | | 5.27 | % | | | 10.54 | % | | | 10.81 | % | | | 2,570,935 | | | | 3,492,565 | | | | 3,255,595 | |
5 Year Semi Annual Couponed G.Bond (1820 days) | | | 31.03.2014 | | | | 02.04.2014 | | | | 27.03.2019 | | | | 5.11 | % | | | 10.22 | % | | | 10.48 | % | | | 2,341,922 | | | | 2,545,461 | | | | 2,563,172 | |
2 Year Semi Annual Couponed G.Bond (693 days) (r-o) | | | 01.04.2014 | | | | 02.04.2014 | | | | 24.02.2016 | | | | 5.21 | % | | | 10.42 | % | | | 10.69 | % | | | 2,700,735 | | | | 1,882,281 | | | | 1,910,232 | |
10 Year Semi Annual Couponed G.Bond (3640 days) | | | 01.04.2014 | | | | 02.04.2014 | | | | 20.03.2024 | | | | 5.04 | % | | | 10.09 | % | | | 10.34 | % | | | 1,800,069 | | | | 2,086,343 | | | | 2,126,795 | |
140
| | | | | | | | | | | | | | | | | | | | | | | | | | | | | | | | | | | | |
| | | Auction Date (dd.mm.yyyy) | | | Value Date (dd.mm.yyyy) | | | Maturity Date (dd.mm.yyyy) | | | Average Interest Rate (%) | | | Net Bid Amount (in thousands
TL) | | | Sales Amount (Inc. Switching) (in thousands TL) | |
| | | | | | Term | | | Simple | | | Compound | | | | Nominal | | | Net | |
| | | | | | | | | | | | | | | | | | | | | | | | | | | | | | | | | | | | |
2 Year Semi Annual Couponed G.Bond (644 days) (r-o) | | | 20.05.2014 | | | | 21.05.2014 | | | | 24.02.2016 | | | | 4.52 | % | | | 9.04 | % | | | 9.24 | % | | | 3,592,848 | | | | 1,506,130 | | | | 1,582,913 | |
5 Year Semi Annual Couponed G.Bond (1771 days) (r-o) | | | 20.05.2014 | | | | 21.05.2014 | | | | 27.03.2019 | | | | 4.55 | % | | | 9.10 | % | | | 9.31 | % | | | 4,492,196 | | | | 3,045,026 | | | | 3,239,845 | |
10 Year Semi Annual Couponed G.Bond (3584 days) (r-o) | | | 27.05.2014 | | | | 28.05.2014 | | | | 20.03.2024 | | | | 4.48 | % | | | 8.96 | % | | | 9.16 | % | | | 2,878,952 | | | | 1,798,556 | | | | 1,993,684 | |
5 Year Semi Annual Couponed G.Bond (1757 days) (r-o) | | | 02.06.2014 | | | | 04.06.2014 | | | | 27.03.2019 | | | | 4.20 | % | | | 8.40 | % | | | 8.57 | % | | | 3,603,531 | | | | 2,345,573 | | | | 2,570,443 | |
2 Year Semi Annual Couponed G.Bond (630 days) (r-o) | | | 03.06.2014 | | | | 04.06.2014 | | | | 24.02.2016 | | | | 4.15 | % | | | 8.29 | % | | | 8.47 | % | | | 4,432,319 | | | | 1,932,148 | | | | 2,060,814 | |
10 Year Semi Annual Couponed G.Bond (3577 days) (r-o) | | | 03.06.2014 | | | | 04.06.2014 | | | | 20.03.2024 | | | | 4.45 | % | | | 8.89 | % | | | 9.09 | % | | | 2,519,330 | | | | 2,001,534 | | | | 2,231,711 | |
5 Year Semi Annual Couponed G.Bond (1820 days) | | | 14.07.2014 | | | | 16.07.2014 | | | | 10.07.2019 | | | | 4.22 | % | | | 8.45 | % | | | 8.62 | % | | | 3,683,655 | | | | 2,825,867 | | | | 2,831,936 | |
2 Year Semi Annual Couponed G.Bond (728 days) | | | 15.07.2014 | | | | 16.07.2014 | | | | 13.07.2016 | | | | 4.03 | % | | | 8.07 | % | | | 8.23 | % | | | 3,331,675 | | | | 2,234,374 | | | | 2,239,735 | |
10 Year Semi Annual Couponed G.Bond (3535 days) (r-o) | | | 15.07.2014 | | | | 16.07.2014 | | | | 20.03.2024 | | | | 4.39 | % | | | 8.78 | % | | | 8.97 | % | | | 3,737,063 | | | | 1,699,556 | | | | 1,927,517 | |
5 Year Semi Annual Couponed G.Bond (1799 days) (r-o) | | | 04.08.2014 | | | | 06.08.2014 | | | | 10.07.2019 | | | | 4.45 | % | | | 8.90 | % | | | 9.10 | % | | | 2,215,188 | | | | 2,204,433 | | | | 2,179,987 | |
2 Year Semi Annual Couponed G.Bond (707 days) (r-o) | | | 05.08.2014 | | | | 06.08.2014 | | | | 13.07.2016 | | | | 4.46 | % | | | 8.92 | % | | | 9.12 | % | | | 3,092,597 | | | | 1,888,901 | | | | 1,873,827 | |
10 Year Semi Annual Couponed G.Bond (3640 days) | | | 05.08.2014 | | | | 06.08.2014 | | | | 24.07.2024 | | | | 4.58 | % | | | 9.15 | % | | | 9.36 | % | | | 3,524,723 | | | | 1,897,394 | | | | 1,878,479 | |
5 Year Semi Annual Couponed G.Bond (1750 days) (r-o) | | | 22.09.2014 | | | | 24.09.2014 | | | | 10.07.2019 | | | | 4.56 | % | | | 9.13 | % | | | 9.33 | % | | | 3,192,639 | | | | 2,920,906 | | | | 2,898,119 | |
141
| | | | | | | | | | | | | | | | | | | | | | | | | | | | | | | | | | | | |
| | | Auction Date (dd.mm.yyyy) | | | Value Date (dd.mm.yyyy) | | | Maturity Date (dd.mm.yyyy) | | | Average Interest Rate (%) | | | Net Bid Amount (in thousands
TL) | | | Sales Amount (Inc. Switching) (in thousands TL) | |
| | | | | | Term | | | Simple | | | Compound | | | | Nominal | | | Net | |
| | | | | | | | | | | | | | | | | | | | | | | | | | | | | | | | | | | | |
2 Year Semi Annual Couponed G.Bond (658 days) (r-o) | | | 23.09.2014 | | | | 24.09.2014 | | | | 13.07.2016 | | | | 4.55 | % | | | 9.10 | % | | | 9.31 | % | | | 1,446,558 | | | | 1,563,773 | | | | 1,565,011 | |
10 Year Semi Annual Couponed G.Bond (3591 days) (r-o) | | | 23.09.2014 | | | | 24.09.2014 | | | | 24.07.2024 | | | | 4.64 | % | | | 9.27 | % | | | 9.49 | % | | | 2,824,086 | | | | 2,556,272 | | | | 2,542,647 | |
5 Year Semi Annual Couponed G.Bond (1743 days) (r-o) | | | 29.09.2014 | | | | 01.10.2014 | | | | 10.07.2019 | | | | 4.84 | % | | | 9.69 | % | | | 9.92 | % | | | 1,932,792 | | | | 2,224,371 | | | | 2,164,534 | |
2 Year Semi Annual Couponed G.Bond (651 days) (r-o) | | | 30.09.2014 | | | | 01.10.2014 | | | | 13.07.2016 | | | | 4.88 | % | | | 9.77 | % | | | 10.01 | % | | | 2,498,686 | | | | 1,707,002 | | | | 1,693,275 | |
10 Year Semi Annual Couponed G.Bond (3584 days) (r-o) | | | 30.09.2014 | | | | 01.10.2014 | | | | 24.07.2024 | | | | 4.86 | % | | | 9.71 | % | | | 9.95 | % | | | 2,720,386 | | | | 2,005,048 | | | | 1,942,850 | |
5 Year Semi Annual Couponed G.Bond (1694 days) (r-o) | | | 17.11.2014 | | | | 19.11.2014 | | | | 10.07.2019 | | | | 4.05 | % | | | 8.10 | % | | | 8.26 | % | | | 2,480,936 | | | | 2,253,310 | | | | 2,353,604 | |
2 Year Semi Annual Couponed G.Bond (728 days) | | | 18.11.2014 | | | | 19.11.2014 | | | | 16.11.2016 | | | | 3.94 | % | | | 7.88 | % | | | 8.04 | % | | | 1,673,743 | | | | 1,251,227 | | | | 1,258,458 | |
10 Year Semi Annual Couponed G.Bond (3535 days) (r-o) | | | 18.11.2014 | | | | 19.11.2014 | | | | 24.07.2024 | | | | 4.14 | % | | | 8.27 | % | | | 8.44 | % | | | 2,264,757 | | | | 1,910,229 | | | | 2,051,050 | |
Total | | | | | | | | | | | | | | | | | | | | | | | | | | | 92,854,367 | | | | 74,730,493 | | | | 75,115,696 | |
Source: UT
142
Table 69
Fixed Coupon TL Denominated Treasury Auctions in 2015
| | | | | | | | | | | | | | | | | | | | | | | | | | | | | | | | | | | | |
| | | Auction Date (dd.mm.yyyy) | | | Value Date (dd.mm.yyyy) | | | Maturity Date (dd.mm.yyyy) | | | Average Interest Rate (%) | | | Net Bid Amount (in thousands
TL) | | | Sales Amount (Inc. Switching) (in thousands TL) | |
| | | | | Term | | | Simple | | | Compound | | | | Nominal | | | Net | |
| | | | | | | | | | | | | | | | | | | | | | | | | | | | | | | | | | | | |
5 Year Semi Annual Couponed G.Bond (1645 days) (r-o) | | | 05.01.2015 | | | | 07.01.2015 | | | | 10.07.2019 | | | | 3.89 | | | | 7.79 | | | | 7.94 | | | | 3,418,311 | | | | 3,242,035 | | | | 3,460,832 | |
2 Year Semi Annual Couponed G.Bond (679 days) (r-o) | | | 06.01.2015 | | | | 07.01.2015 | | | | 16.11.2016 | | | | 3.81 | | | | 7.61 | | | | 7.76 | | | | 2,175,274 | | | | 1,297,205 | | | | 1,324,345 | |
10 Year Semi Annual Couponed G.Bond (3486 days) (r-o) | | | 06.01.2015 | | | | 07.01.2015 | | | | 24.07.2024 | | | | 3.79 | | | | 7.58 | | | | 7.73 | | | | 1,767,007 | | | | 1,829,094 | | | | 2,072,604 | |
5 Year Semi Annual Couponed G.Bond (1820 days) (r-o) | | | 09.02.2015 | | | | 11.02.2015 | | | | 05.02.2020 | | | | 3.92 | | | | 7.83 | | | | 7.99 | | | | 2,882,031 | | | | 3,086,934 | | | | 3,032,453 | |
2 Year Semi Annual Couponed G.Bond (644 days) (r-o) | | | 10.02.2015 | | | | 11.02.2015 | | | | 16.11.2016 | | | | 4.09 | | | | 8.17 | | | | 8.34 | | | | 1,574,628 | | | | 1,742,392 | | | | 1,775,808 | |
10 Year Semi Annual Couponed G.Bond (3451 days) (r-o) | | | 10.02.2015 | | | | 11.02.2015 | | | | 24.07.2024 | | | | 3.88 | | | | 7.76 | | | | 7.91 | | | | 2,843,008 | | | | 2,474,786 | | | | 2,682,600 | |
5 Year Semi Annual Couponed G.Bond (1778 days) (r-o) | | | 24.03.2015 | | | | 25.03.2015 | | | | 05.02.2020 | | | | 4.04 | | | | 8.08 | | | | 8.25 | | | | 1,724,029 | | | | 2,485,053 | | | | 2,438,381 | |
10 Year Semi Annual Couponed G.Bond (3640 days) | | | 24.03.2015 | | | | 25.03.2015 | | | | 12.03.2025 | | | | 3.99 | | | | 7.98 | | | | 8.14 | | | | 1,632,737 | | | | 2,055,377 | | | | 2,058,089 | |
5 Year Semi Annual Couponed G.Bond (1743 days) (r-o) | | | 27.04.2015 | | | | 29.04.2015 | | | | 05.02.2020 | | | | 4.86 | | | | 9.72 | | | | 9.95 | | | | 1,639,553 | | | | 3,017,451 | | | | 2,801,132 | |
5 Year Semi Annual Couponed G.Bond (1820 days) | | | 28.04.2015 | | | | 29.04.2015 | | | | 16.11.2016 | | | | 4.86 | | | | 9.71 | | | | 9.95 | | | | 3,408,691 | | | | 1,761,056 | | | | 1,787,051 | |
2 Year Semi Annual Couponed G.Bond (567 days) (r-o) | | | 28.04.2015 | | | | 29.04.2015 | | | | 12.03.2025 | | | | 4.61 | | | | 9.21 | | | | 9.43 | | | | 3,200,431 | | | | 2,603,636 | | | | 2,420,945 | |
5 Year Semi Annual Couponed G.Bond (1729 days) (r-o) | | | 11.05.2015 | | | | 13.05.2015 | | | | 05.02.2020 | | | | 4.69 | | | | 9.39 | | | | 9.61 | | | | 3,856,104 | | | | 2,424,429 | | | | 2,287,375 | |
143
| | | | | | | | | | | | | | | | | | | | | | | | | | | | | | | | | | | | |
| | | Auction Date (dd.mm.yyyy) | | | Value Date (dd.mm.yyyy) | | | Maturity Date (dd.mm.yyyy) | | | Average Interest Rate (%) | | | Net Bid Amount (in thousands
TL) | | | Sales Amount (Inc. Switching) (in thousands TL) | |
| | | | | Term | | | Simple | | | Compound | | | | Nominal | | | Net | |
| | | | | | | | | | | | | | | | | | | | | | | | | | | | | | | | | | | | |
2 Year Semi Annual Couponed G.Bond (553 days) (r-o) | | | 12.05.2015 | | | | 13.05.2015 | | | | 16.11.2016 | | | | 4.82 | | | | 9.65 | | | | 9.88 | | | | 1,028,303 | | | | 1,800,046 | | | | 1,834,894 | |
10 Year Semi Annual Couponed G.Bond (3591 days) (r-o) | | | 12.05.2015 | | | | 13.05.2015 | | | | 12.03.2025 | | | | 4.54 | | | | 9.08 | | | | 9.28 | | | | 1,010,529 | | | | 1,691,216 | | | | 1,592,144 | |
5 Year Semi Annual Couponed G.Bond (1694 days) (r-o) | | | 15.06.2015 | | | | 17.06.2015 | | | | 05.02.2020 | | | | 4.78 | | | | 9.55 | | | | 9.78 | | | | 2,053,046 | | | | 2,430,062 | | | | 2,299,159 | |
2 Year Semi Annual Couponed G.Bond (728 days) | | | 16.06.2015 | | | | 17.06.2015 | | | | 14.06.2017 | | | | 4.94 | | | | 9.89 | | | | 10.13 | | | | 507,207 | | | | 1,590,555 | | | | 1,582,379 | |
10 Year Semi Annual Couponed G.Bond (3556 days) (r-o) | | | 16.06.2015 | | | | 17.06.2015 | | | | 12.03.2025 | | | | 4.73 | | | | 9.45 | | | | 9.67 | | | | 1,650,043 | | | | 2,647,097 | | | | 2,453,780 | |
5 Year Semi Annual Couponed G.Bond (1820 days) | | | 13.07.2015 | | | | 15.07.2015 | | | | 08.07.2020 | | | | 4.75 | | | | 9.51 | | | | 9.73 | | | | 1,968,038 | | | | 2,446,643 | | | | 2,436,464 | |
2 Year Semi Annual Couponed G.Bond (700 days) (r-o) | | | 14.07.2015 | | | | 15.07.2015 | | | | 14.06.2017 | | | | 4.76 | | | | 9.52 | | | | 9.75 | | | | 1,364,036 | | | | 1,704,277 | | | | 1,718,815 | |
10 Year Semi Annual Couponed G.Bond (3528 days) (r-o) | | | 14.07.2015 | | | | 15.07.2015 | | | | 12.03.2025 | | | | 4.63 | | | | 9.26 | | | | 9.47 | | | | 3,040,130 | | | | 2,791,468 | | | | 2,638,548 | |
5 Year Semi Annual Couponed G.Bond (1785 days) (r-o) | | | 18.08.2015 | | | | 19.08.2015 | | | | 08.07.2020 | | | | 5.11 | | | | 10.21 | | | | 10.47 | | | | 1,527,335 | | | | 2,873,936 | | | | 2,811,109 | |
5 Year Semi Annual Couponed G.Bond (1757 days) (r-o) | | | 15.09.2015 | | | | 16.09.2015 | | | | 08.07.2020 | | | | 5.51 | | | | 11.03 | | | | 11.33 | | | | 1,813,731 | | | | 2,256,184 | | | | 2,157,635 | |
2 Year Semi Annual Couponed G.Bond (1736 days) (r-o) | | | 05.10.2015 | | | | 07.10.2015 | | | | 08.07.2020 | | | | 5.29 | | | | 10.59 | | | | 10.87 | | | | 3,519,798 | | | | 2,274,008 | | | | 2,223,568 | |
2 Year Semi Annual Couponed G.Bond (616 days) (r-o) | | | 06.10.2015 | | | | 07.10.2015 | | | | 14.06.2017 | | | | 5.35 | | | | 10.70 | | | | 10.98 | | | | 1,597,287 | | | | 1,195,421 | | | | 1,210,577 | |
10 Year Semi Annual Couponed G.Bond (3444 days) (r-o) | | | 06.10.2015 | | | | 07.10.2015 | | | | 12.03.2025 | | | | 5.14 | | | | 10.27 | | | | 10.54 | | | | 1,974,060 | | | | 1,682,603 | | | | 1,459,588 | |
144
| | | | | | | | | | | | | | | | | | | | | | | | | | | | | | | | | | | | |
| | | Auction Date (dd.mm.yyyy) | | | Value Date (dd.mm.yyyy) | | | Maturity Date (dd.mm.yyyy) | | | Average Interest Rate (%) | | | Net Bid Amount (in thousands
TL) | | | Sales Amount (Inc. Switching) (in thousands TL) | |
| | | | | Term | | | Simple | | | Compound | | | | Nominal | | | Net | |
| | | | | | | | | | | | | | | | | | | | | | | | | | | | | | | | | | | | |
2 Year Semi Annual Couponed G.Bond (574 days) (r-o) | | | 16.11.2015 | | | | 18.11.2015 | | | | 14.06.2017 | | | | 5.05 | | | | 10.10 | | | | 10.36 | | | | 1,482,631 | | | | 1,295,035 | | | | 1,338,200 | |
5 Year Semi Annual Couponed G.Bond (1694 days) (r-o) | | | 17.11.2015 | | | | 18.11.2015 | | | | 08.07.2020 | | | | 4.96 | | | | 9.92 | | | | 10.17 | | | | 3,212,629 | | | | 1,853,482 | | | | 1,877,800 | |
5 Year Semi Annual Couponed G.Bond (1666 days) (r-o) | | | 15.12.2015 | | | | 16.12.2015 | | | | 08.07.2020 | | | | 5.38 | | | | 10.76 | | | | 11.05 | | | | 900,000 | | | | 2,277,853 | | | | 2,258,287 | |
10 Year Semi Annual Couponed G.Bond (3374 days) (r-o) | | | 15.12.2015 | | | | 16.12.2015 | | | | 12.03.2025 | | | | 5.26 | | | | 10.52 | | | | 10.79 | | | | 886,913 | | | | 2,069,881 | | | | 1,803,713 | |
Total | | | | 59,657,524 | | | | 62,899,216 | | | | 61,838,274 | |
Source: UT
145
Table 70
Floating Rate Note Auctions of 2011
| | | | | | | | | | | | | | | | | | | | | | | | | | | | | | | | | | | | |
| | | | | | | | | | | | | | | Sales Amount (Inc. Switching) | |
| | | Auction Date | | | Value Date | | | Maturity Date | | | Average Interest Rate | | | Nominal
Bid Amount | | | Nominal | | | Net | |
| | | (dd.mm.yyyy) | | | (dd.mm.yyyy) | | | (dd.mm.yyyy) | | | Term | | | Simple | | | Compound | | | (thousand TL) | |
7 Year Quarterly Couponed G. Bond | | | 11.01.2011 | | | | 12.01.2011 | | | | 25.10.2017 | | | | 3.77 | % | | | 7.54 | % | | | 7.68 | % | | | 2,314,544 | | | | 4,755,308 | | | | 4,941,903 | |
7 Year Quarterly Couponed G. Bond | | | 31.01.2011 | | | | 02.02.2011 | | | | 24.01.2018 | | | | 3.76 | % | | | 7.52 | % | | | 7.67 | % | | | 1,632,300 | | | | 2,592,628 | | | | 2,583,601 | |
7 Year Quarterly Couponed G. Bond | | | 24.05.2011 | | | | 25.05.2011 | | | | 24.01.2018 | | | | 3.93 | % | | | 7.87 | % | | | 8.02 | % | | | 566,110 | | | | 1,398,855 | | | | 1,401,414 | |
7 Year Semi Annual Couponed G. Bond | | | 22.11.2011 | | | | 23.11.2011 | | | | 24.01.2018 | | | | 5.01 | % | | | 10.01 | % | | | 10.26 | % | | | 417,500 | | | | 410,844 | | | | 391,328 | |
Source: UT
Table 71
Floating Rate Note Auctions of 2012
| | | | | | | | | | | | | | | | | | | | | | | | | | | | | | | | | | | | |
| | | | | | | | | | | | | | | | | | | | | Sales Amount (Inc. Switching) | |
| | | Auction Date | | | Value Date | | | Maturity Date | | | Average Interest Rate | | | Nominal
Bid Amount | | | Nominal | | | Net | |
| | | (dd.mm.yyyy) | | | (dd.mm.yyyy) | | | (dd.mm.yyyy) | | | Term | | | Simple | | | Compound | | | (thousand TL) | |
7 Year Quarterly Couponed G. Bond | | | 17.01.2012 | | | | 18.01.2012 | | | | 24.01.2018 | | | | 5.07 | % | | | 10.15 | % | | | 10.41 | % | | | 4,042,410 | | | | 923,036 | | | | 887,220 | |
Source: UT
146
Table 72
Floating Rate Note Auctions of 2013
| | | | | | | | | | | | | | | | | | | | | | | | | | | | | | | | | | | | |
| | | | | | | | | | | | | | | Sales Amount
(in thousands TL) | |
| | | Auction | | | Value | | | Maturity | | | Average Interest Rate (%) | | | Nominal
Bid Amount | | | | | | | |
| | | Date
(dd.mm.yyyy) | | | Date
(dd.mm.yyyy) | | | Date
(dd.mm.yyyy) | | | Term | | | Simple | | | Compound | | | | Nominal | | | Net | |
7 Year FRN G.Bond | | | 18.03.2013 | | | | 20.03.2013 | | | | 11.03.2020 | | | | 3.40 | % | | | 6.81 | % | | | 6.93 | % | | | 4,278,710 | | | | 2,894,287 | | | | 2,842,474 | |
7 Year FRN G.Bond | | | 01.04.2013 | | | | 03.04.2013 | | | | 11.03.2020 | | | | 3.44 | % | | | 6.88 | % | | | 7.00 | % | | | 3,223,300 | | | | 2,791,547 | | | | 2,736,976 | |
7 Year FRN G.Bond | | | 13.05.2013 | | | | 15.05.2013 | | | | 11.03.2020 | | | | 3.46 | % | | | 6.93 | % | | | 7.05 | % | | | 1,118,500 | | | | 2,050,222 | | | | 2,021,191 | |
7 Year FRN G.Bond | | | 25.06.2013 | | | | 26.06.2013 | | | | 11.03.2020 | | | | 3.76 | % | | | 7.53 | % | | | 7.67 | % | | | 1,655,741 | | | | 2,956,656 | | | | 2,846,670 | |
7 Year FRN G.Bond | | | 27.08.2013 | | | | 28.08.2013 | | | | 11.03.2020 | | | | 3.95 | % | | | 7.91 | % | | | 8.06 | % | | | 2,052,200 | | | | 2,322,954 | | | | 2,222,229 | |
7 Year FRN G.Bond | | | 08.10.2013 | | | | 09.10.2013 | | | | 11.03.2020 | | | | 4.03 | % | | | 8.06 | % | | | 8.22 | % | | | 3,720,200 | | | | 2,183,360 | | | | 2,086,021 | |
7 Year FRN G.Bond | | | 19.11.2013 | | | | 20.11.2013 | | | | 11.11.2020 | | | | 4.25 | % | | | 8.51 | % | | | 8.69 | % | | | 5,017,618 | | | | 2,501,808 | | | | 2,456,348 | |
7 Year FRN G.Bond | | | 02.12.2013 | | | | 04.12.2013 | | | | 11.11.2020 | | | | 4.29 | % | | | 8.58 | % | | | 8.77 | % | | | 3,189,400 | | | | 2,515,122 | | | | 2,468,013 | |
2013 Total | | | | | | | | | | | | | | | | | | | | | | | | | | | 24,255,669 | | | | 20,215,957 | | | | 19,679,923 | |
Source: UT
Table 73
Floating Rate Note Auctions of 2014
| | | | | | | | | | | | | | | | | | | | | | | | | | | | | | | | | | | | |
| | | | | | | | | Maturity | | | Average Interest Rate (%) | | | Net Bid
Amount 2 | | | Sales Amount (Inc.
Switching)
(in thousands TL) | |
| | | Auction Date
(dd.mm.yyyy) | | | Value Date
(dd.mm.yyyy) | | | Date
(dd.mm.yyyy) | | | Term | | | Simple | | | Compound | | | | Nominal | | | Net | |
7 Year FRN G.Bond (2450 days) (r-o) | | | 24.02.2014 | | | | 26.02.2014 | | | | 11.11.2020 | | | | 4.29 | % | | | 8.58 | % | | | 8.77 | % | | | 2,818,062 | | | | 3,127,508 | | | | 3,129,200 | |
7 Year FRN G.Bond (2443 days) (r-o) | | | 04.03.2014 | | | | 05.03.2014 | | | | 11.11.2020 | | | | 4.45 | % | | | 8.91 | % | | | 9.11 | % | | | 897,662 | | | | 2,783,285 | | | | 2,744,540 | |
7 Year FRN G.Bond (2415 days) (r-o) | | | 01.04.2014 | | | | 02.04.2014 | | | | 11.11.2020 | | | | 4.46 | % | | | 8.92 | % | | | 9.12 | % | | | 2,842,018 | | | | 3,684,754 | | | | 3,656,420 | |
7 Year FRN G.Bond (2548 days) | | | 27.05.2014 | | | | 28.05.2014 | | | | 19.05.2021 | | | | 5.22 | % | | | 10.44 | % | | | 10.71 | % | | | 2,743,685 | | | | 1,545,877 | | | | 1,538,428 | |
7 Year FRN G.Bond (2541 days) (r-o) | | | 03.06.2014 | | | | 04.06.2014 | | | | 19.05.2021 | | | | 5.26 | % | | | 10.53 | % | | | 10.80 | % | | | 1,834,706 | | | | 2,535,657 | | | | 2,517,451 | |
7 Year FRN G.Bond (2499 days) (r-o) | | | 14.07.2014 | | | | 16.07.2014 | | | | 19.05.2021 | | | | 5.33 | % | | | 10.66 | % | | | 10.94 | % | | | 2,826,036 | | | | 2,049,297 | | | | 2,046,018 | |
7 Year FRN G.Bond (2478 days) (r-o) | | | 04.08.2014 | | | | 06.08.2014 | | | | 19.05.2021 | | | | 5.42 | % | | | 10.84 | % | | | 11.13 | % | | | 2,864,739 | | | | 2,067,558 | | | | 2,059,039 | |
7 Year FRN G.Bond (2430 days) (r-o) | | | 22.09.2014 | | | | 23.09.2014 | | | | 19.05.2021 | | | | 5.41 | % | | | 10.82 | % | | | 11.11 | % | | | 4,221,274 | | | | 2,371,696 | | | | 2,398,356 | |
Total | | | | | | | | | | | | | | | | | | | | | | | | | | | 21,048,182 | | | | 20,165,633 | | | | 20,089,452 | |
Source: UT
147
Table 74
Floating Rate Note Auctions of 2015
| | | | | | | | | | | | | | | | | | | | | | | | | | | | | | | | | | | | |
| | | | | | | | | Maturity | | | Average Interest Rate (%) | | | Net Bid
Amount | | | Sales Amount (Inc.
Switching)
(in thousands TL) | |
| | Auction Date
(dd.mm.yyyy) | | | Value Date
(dd.mm.yyyy) | | | Date
(dd.mm.yyyy) | | | Term | | | Simple | | | Compound | | | (in thousands
TL) | | | Nominal | | | Net | |
7 Year FRN G.Bond (2324 days) (r-o) | | | 06.01.2015 | | | | 07.01.2015 | | | | 19.05.2021 | | | | 4.40 | | | | 8.80 | | | | 9.00 | | | | 3,249,146 | | | | 1,044,041 | | | | 1,047,048 | |
7 Year FRN G.Bond (2289 days) (r-o) | | | 10.02.2015 | | | | 11.02.2015 | | | | 19.05.2021 | | | | 4.53 | | | | 9.05 | | | | 9.26 | | | | 1,173,457 | | | | 1,254,493 | | | | 1,254,065 | |
7 Year FRN G.Bond (2548 days) | | | 28.04.2015 | | | | 29.04.2015 | | | | 20.04.2022 | | | | 4.55 | | | | 9.11 | | | | 9.31 | | | | 805,509 | | | | 1,406,354 | | | | 1,331,421 | |
7 Year FRN G.Bond (2534 days) (r-o) | | | 12.05.2015 | | | | 13.05.2015 | | | | 20.04.2022 | | | | 4.50 | | | | 9.00 | | | | 9.20 | | | | 2,383,907 | | | | 1,358,755 | | | | 1,298,100 | |
7 Year FRN G.Bond (2408 days) (r-o) | | | 15.09.2015 | | | | 16.09.2015 | | | | 20.04.2022 | | | | 4.85 | | | | 9.69 | | | | 9.93 | | | | 735,605 | | | | 937,501 | | | | 892,857 | |
Total | | | | 8,347,624 | | | | 6,001,145 | | | | 5,823,490 | |
Source: UT
148
Table 75
CPI Indexed TL Denominated Auctions in 2011
| | | | | | | | | | | | | | | | | | | | | | | | | | | | | | | | | | | | |
| | | | | | | | | | | | | | | Sales Amount (Inc. Switching) | |
| | | Auction
Date
(dd.mm.yyyy) | | | Value
Date
(dd.mm.yyyy) | | | Maturity
Date
(dd.mm.yyyy) | | | Average Real Interest Rate | | | Net
Bid Amount | | | Nominal | | | Net | |
| | | | | | Term | | | Simple | | | Compound | | | (thousand TL) | |
10 Year G. Bond (Semiannually 1.5% real interest rate) | | | 18.01.2011 | | | | 19.01.2011 | | | | 06.01.2021 | | | | 1.42 | % | | | 2.84 | % | | | 2.86 | % | | | 4,087,755 | | | | 3,329,248 | | | | 3,376,283 | |
10 Year G. Bond (Semiannually 1.5% real interest rate) | | | 15.02.2011 | | | | 16.02.2011 | | | | 06.01.2021 | | | | 1.41 | % | | | 2.82 | % | | | 2.84 | % | | | 1,831,430 | | | | 1,969,384 | | | | 2,001,883 | |
10 Year G. Bond (Semiannually 1.5% real interest rate) | | | 12.04.2011 | | | | 13.04.2011 | | | | 06.01.2021 | | | | 1.42 | % | | | 2.84 | % | | | 2.86 | % | | | 1,801,320 | | | | 2,210,784 | | | | 2,265,527 | |
5 Year G. Bond (Semiannually 1.25% real interest rate) | | | 09.05.2011 | | | | 11.05.2011 | | | | 04.05.2016 | | | | 1.15 | % | | | 2.31 | % | | | 2.32 | % | | | 1,202,205 | | | | 1,140,242 | | | | 1,150,593 | |
10 Year G. Bond (Semiannually 1.5% real interest rate) | | | 02.08.2011 | | | | 03.08.2011 | | | | 21.07.2021 | | | | 1.68 | % | | | 3.36 | % | | | 3.39 | % | | | 764,939 | | | | 1,298,521 | | | | 1,258,926 | |
4 Year G. Bond (Semiannually 1.25% real interest rate) | | | 14.11.2011 | | | | 16.11.2011 | | | | 04.05.2016 | | | | 1.26 | % | | | 2.52 | % | | | 2.54 | % | | | 526,548 | | | | 1,323,430 | | | | 1,360,326 | |
Source: UT
149
Table 76
CPI Indexed TL Denominated Auctions in 2012
| | | | | | | | | | | | | | | | | | | | | | | | | | | | | | | | | | | | |
| | | | | | | | | | | | | | | Sales Amount (Inc. Switching) | |
| | | Auction
Date
(dd.mm.yyyy) | | | Value
Date
(dd.mm.yyyy) | | | Maturity
Date
(dd.mm.yyyy) | | | Average Real Interest Rate | | | Net
Bid Amount | | | Nominal | | | Net | |
| | | | | | Term | | | Simple | | | Compound | | | (thousand TL) | |
10 Year G. Bond (Semiannually 1.5% real interest rate) | | | 23.01.2012 | | | | 25.01.2012 | | | | 21.07.2021 | | | | 2.08 | % | | | 4.16 | % | | | 4.20 | % | | | 2,650,621 | | | | 2,310,156 | | | | 2,218,360 | |
10 Year G. Bond (Semiannually 1.5% real interest rate) | | | 14.02.2012 | | | | 15.02.2012 | | | | 21.07.2021 | | | | 1.85 | % | | | 3.7 | % | | | 3.73 | % | | | 5,309,008 | | | | 3,994,621 | | | | 3,968,223 | |
10 Year G. Bond (Semiannually 1.5% real interest rate) | | | 06.03.2012 | | | | 07.03.2012 | | | | 23.02.2022 | | | | 1.77 | % | | | 3.55 | % | | | 3.58 | % | | | 2,690,657 | | | | 2,355,206 | | | | 2,247,201 | |
10 Year G. Bond (Semiannually 1.5% real interest rate) | | | 17.04.2012 | | | | 18.04.2012 | | | | 23.02.2022 | | | | 1.73 | % | | | 3.47 | % | | | 3.5 | % | | | 2,305,327 | | | | 3,127,141 | | | | 3,039,204 | |
10 Year G. Bond | | | | | | | | | | | | | | | | | | | | | | | | |
(Semiannually 1.5% real interest rate) | | | 06.08.2012 | | | | 08.08.2012 | | | | 23.02.2022 | | | | 1.38 | % | | | 2.76 | % | | | 2.78 | % | | | 3,517,059 | | | | 4,317,360 | | | | 4,576,269 | |
10 Year G. Bond (Semiannually 1.5% real interest rate) | | | 05.11.2012 | | | | 07.11.2012 | | | | 26.10.2022 | | | | 0.84 | % | | | 1.69 | % | | | 1.69 | % | | | 4,773,647 | | | | 3,371,010 | | | | 3,467,755 | |
Source: UT
150
Table 77
CPI Indexed TL Denominated Auctions in 2013
| | | | | | | | | | | | | | | | | | | | | | | | | | | | | | | | | | | | |
| | | | | | | | | | | | | | | | | | Sales Amount
(in thousands TL) | |
| | | | | | | | | | | | Average Interest Rate | | | Nominal | | | | | | | |
| | | Auction
Date
(dd.mm.yyyy) | | | Value
Date
(dd.mm.yyyy) | | | Maturity
Date
(dd.mm.yyyy) | | | Term | | | Simple | | | Compound | | | Bid
Amount
(in thousands
TL) | | | Nominal | | | Net | |
January | | | | | | | | | | | | | | | | | | | | | | | | | | | | | | | | | | | | |
10 Year G. Bond | | | 07.01.2013 | | | | 09.01.2013 | | | | 26.10.2022 | | | | 0.68 | % | | | 1.35 | % | | | 1.36 | % | | | 3,477,321 | | | | 2,130,337 | | | | 2,331,867 | |
February | | | | | | | | | | | | | | | | | | | | | | | | | | | | | | | | | | | | |
10 Year G. Bond | | | 18.02.2013 | | | | 20.02.2013 | | | | 26.10.2022 | | | | 0.50 | % | | | 1.01 | % | | | 1.01 | % | | | 3,232,103 | | | | 2,611,719 | | | | 2,971,977 | |
April | | | | | | | | | | | | | | | | | | | | | | | | | | | | | | | | | | | | |
10 Year G. Bond | | | 09.04.2013 | | | | 10.04.2013 | | | | 26.10.2022 | | | | 0.48 | % | | | 0.96 | % | | | 0.96 | % | | | 3,308,900 | | | | 2,241,812 | | | | 2,606,311 | |
May | | | | | | | | | | | | | | | | | | | | | | | | | | | | | | | | | | | | |
10 Year G. Bond | | | 14.05.2013 | | | | 15.05.2013 | | | | 03.05.2023 | | | | 0.47 | % | | | 0.94 | % | | | 0.94 | % | | | 4,666,810 | | | | 2,554,300 | | | | 2,569,723 | |
June | | | | | | | | | | | | | | | | | | | | | | | | | | | | | | | | | | | | |
10 Year G. Bond | | | 24.06.2013 | | | | 26.06.2013 | | | | 03.05.2023 | | | | 1.47 | % | | | 2.93 | % | | | 2.95 | % | | | 1,338,400 | | | | 2,679,726 | | | | 2,257,668 | |
July | | | | | | | | | | | | | | | | | | | | | | | | | | | | | | | | | | | | |
10 Year G. Bond | | | 15.07.2013 | | | | 17.07.2013 | | | | 03.05.2023 | | | | 1.59 | % | | | 3.19 | % | | | 3.22 | % | | | 4,009,881 | | | | 3,917,635 | | | | 3,233,182 | |
August | | | | | | | | | | | | | | | | | | | | | | | | | | | | | | | | | | | | |
10 Year G. Bond | | | 12.08.2013 | | | | 14.08.2013 | | | | 02.08.2023 | | | | 1.47 | % | | | 2.94 | % | | | 2.96 | % | | | 3,994,101 | | | | 3,750,163 | | | | 3,769,779 | |
September | | | | | | | | | | | | | | | | | | | | | | | | | | | | | | | | | | | | |
10 Year G. Bond | | | 09.09.2013 | | | | 11.09.2013 | | | | 02.08.2023 | | | | 1.78 | % | | | 3.55 | % | | | 3.58 | % | | | 2,297,120 | | | | 2,716,387 | | | | 2,612,512 | |
October | | | | | | | | | | | | | | | | | | | | | | | | | | | | | | | | | | | | |
10 Year G. Bond | | | 07.10.2013 | | | | 09.10.2013 | | | | 02.08.2023 | | | | 1.47 | % | | | 2.94 | % | | | 2.96 | % | | | 2,571,100 | | | | 2,010,544 | | | | 2,044,444 | |
November | | | | | | | | | | | | | | | | | | | | | | | | | | | | | | | | | | | | |
10 Year G. Bond | | | 18.11.2013 | | | | 20.11.2013 | | | | 08.11.2023 | | | | 1.29 | % | | | 2.58 | % | | | 2.60 | % | | | 5,195,784 | | | | 2,503,581 | | | | 2,551,022 | |
2013 Total | | | | | | | | | | | | | | | | | | | | | | | | | | | 34,091,519 | | | | 27,116,204 | | | | 26,948,484 | |
Source: UT
151
Table 78
CPI Indexed TL Denominated Auctions in 2014
| | | | | | | | | | | | | | | | | | | | | | | | | | | | | | | | | | | | |
| | | Auction Date (dd.mm.yyyy) | | | Value Date (dd.mm.yyyy) | | | Maturity Date (dd.mm.yyyy) | | | Average Interest Rate (%) | | | Net Bid Amount (in thousands
TL) | | | Sales Amount (Inc.
Switching) (in thousands TL) | |
| | | | | | | | | | | | Term | | | Simple | | | Compound | | | | Nominal | | | Net | |
| | | | |
10 Year G. Bond (3570 days) (r-o) | | | 27.01.2014 | | | | 29.01.2014 | | | | 08.11.2023 | | | | 1.85 | % | | | 3.69 | % | | | 3.73 | % | | | 3,166,925 | | | | 3,167,990 | | | | 3,015,735 | |
5 Year G. Bond (1820 days) | | | 25.02.2014 | | | | 26.02.2014 | | | | 20.02.2019 | | | | 1.67 | % | | | 3.35 | % | | | 3.38 | % | | | 3,500,844 | | | | 2,310,746 | | | | 2,326,670 | |
5 Year G. Bond (1813 days) (r-o) | | | 03.03.2014 | | | | 05.03.2014 | | | | 20.02.2019 | | | | 1.67 | % | | | 3.33 | % | | | 3.36 | % | | | 3,754,089 | | | | 3,246,163 | | | | 3,282,719 | |
5 Year G. Bond (1785 days) (r-o) | | | 31.03.2014 | | | | 02.04.2014 | | | | 20.02.2019 | | | | 1.67 | % | | | 3.34 | % | | | 3.36 | % | | | 4,395,722 | | | | 2,505,113 | | | | 2,583,551 | |
10 Year G. Bond (3640 days) | | | 20.05.2014 | | | | 21.05.2014 | | | | 08.05.2024 | | | | 1.12 | % | | | 2.24 | % | | | 2.26 | % | | | 5,335,723 | | | | 2,518,407 | | | | 2,553,207 | |
10 Year G. Bond (3626 days) (r-o) | | | 02.06.2014 | | | | 04.06.2014 | | | | 08.05.2024 | | | | 0.91 | % | | | 1.83 | % | | | 1.84 | % | | | 4,608,794 | | | | 1,692,951 | | | | 1,791,666 | |
10 Year G. Bond (3584 days) (r-o) | | | 15.07.2014 | | | | 16.07.2014 | | | | 08.05.2024 | | | | 0.86 | % | | | 1.73 | % | | | 1.74 | % | | | 4,173,749 | | | | 1,533,612 | | | | 1,663,848 | |
10 Year G. Bond (3640 days) | | | 29.09.2014 | | | | 01.10.2014 | | | | 18.09.2024 | | | | 1.03 | % | | | 2.07 | % | | | 2.08 | % | | | 3,371,811 | | | | 2,641,006 | | | | 2,625,507 | |
Total | | | | | | | | | | | | | | | | | | | | | | | | | | | 32,307,657 | | | | 19,615,987 | | | | 19,842,902 | |
Source: UT
Table 79
CPI Indexed TL Denominated Auctions in 2015
| | | | | | | | | | | | | | | | | | | | | | | | | | | | | | | | | | | | |
| | | Auction Date (dd.mm.yyyy) | | | Value Date (dd.mm.yyyy) | | | Maturity Date (dd.mm.yyyy) | | | Average Interest Rate (%) | | | Net Bid Amount (in
thousands
TL) | | | Sales Amount (Inc. Switching) (in thousands TL) | |
| | | | | Term | | | Simple | | | Compound | | | | Nominal | | | Net | |
| | | | |
10 Year G. Bond (3542 days) (r-o) | | | 05.01.2015 | | | | 07.01.2015 | | | | 18.09.2024 | | | | 0.94 | | | | 1.89 | | | | 1.90 | | | | 3,262,704 | | | | 2,387,163 | | | | 2,476,106 | |
10 Year G. Bond (3507 days) (r-o) | | | 09.02.2015 | | | | 11.02.2015 | | | | 18.09.2024 | | | | 0.97 | | | | 1.94 | | | | 1.95 | | | | 3,787,414 | | | | 3,025,533 | | | | 3,130,159 | |
10 Year G. Bond (3640 days) | | | 27.04.2015 | | | | 29.04.2015 | | | | 16.04.2025 | | | | 1.14 | | | | 2.28 | | | | 2.29 | | | | 1,250,870 | | | | 2,920,308 | | | | 2,848,528 | |
10 Year G. Bond (3626 days) (r-o) | | | 11.05.2015 | | | | 13.05.2015 | | | | 16.04.2025 | | | | 1.17 | | | | 2.35 | | | | 2.36 | | | | 1,363,102 | | | | 2,016,973 | | | | 1,966,205 | |
10 Year G. Bond (3591 days) (r-o) | | | 15.06.2015 | | | | 17.06.2015 | | | | 16.04.2025 | | | | 1.30 | | | | 2.60 | | | | 2.62 | | | | 1,421,717 | | | | 1,941,123 | | | | 1,884,267 | |
10 Year G. Bond (3479 days) (r-o) | | | 05.10.2015 | | | | 07.10.2015 | | | | 16.04.2025 | | | | 1.60 | | | | 3.19 | | | | 3.22 | | | | 2,472,264 | | | | 1,943,799 | | | | 1,826,415 | |
Total | | | | 13,558,071 | | | | 14,234,898 | | | | 14,131,680 | |
Source: UT
152
The following table presents Turkey’s central government domestic debt at the end of the years listed:
Table 80
Central Government Domestic Debt
| | | | | | | | | | | | | | | | | | | | |
(In millions of TL) | | 2011 | | | 2012 | | | 2013 | | | 2014 | | | 2015 | |
Total Domestic Debt | | | 368,778 | | | | 386,542 | | | | 403,007 | | | | 414,649 | | | | 440,124 | |
Cash | | | 366,355 | | | | 384,672 | | | | 401,754 | | | | 414,000 | | | | 440,077 | |
Bonds | | | 366,355 | | | | 380,988 | | | | 401,754 | | | | 414,000 | | | | 440,077 | |
Bills | | | — | | | | 3,684 | | | | — | | | | — | | | | — | |
Non-Cash | | | 2,424 | | | | 1,870 | | | | 1,253 | | | | 648 | | | | 48 | |
Bonds | | | 2,424 | | | | 1,870 | | | | 1,253 | | | | 648 | | | | 48 | |
Bills | | | — | | | | — | | | | — | | | | — | | | | — | |
Source: UT
Table 81
Domestic Debt Service (1)
| | | | | | | | | | | | | | | | | | | | |
(In millions of TL) | | 2011 | | | 2012 | | | 2013 | | | 2014 | | | 2015 | |
Total Domestic Debt Service | | | 132,138 | | | | 124,720 | | | | 167,135 | | | | 157,047 | | | | 107,130 | |
Principal | | | 97,074 | | | | 84,018 | | | | 128,062 | | | | 117,788 | | | | 67,355 | |
Interest | | | 35,064 | | | | 40,702 | | | | 39,073 | | | | 39,259 | | | | 39,775 | |
| (1) | Payments on non-cash basis are included. |
Source: UT
EXTERNAL DEBT AND DEBT MANAGEMENT
Turkey’s gross external debt increased from U.S.$303.9 billion in 2011 to U.S.$397.9 billion in 2015. The main factor for this change was the increasing trend of private sector debt. Private sector debt was U.S.$200.3 billion in 2011 and U.S.$283.3 billion in 2015.
The external debt to GDP ratio was 39.3% at the end of 2011, and the ratio increased to 55.3% in 2015. The public sector external debt to GDP ratio increased from 12.2% in 2011 to 15.7% in 2015 and private sector debt to GDP increased from 25.9% in 2011 to 39.3% in 2015, while the Central Bank’s external debt to GDP decreased from 1.2% in 2011 to 0.2% in 2015.
In addition, the maturity composition of the gross external debt did not change significantly during the last five years. The ratio of the short-term external debt to total external debt decreased approximately by 1.1% in 2015, compared to 2011. At the end of 2011, the share of the short and long-term external debt to total external debt was 26.8% and 73.2%, and reached 25.7% and 74.3%, respectively, in 2015. The sectoral breakdown of external debt has changed such that the share of the “monetary authorities” and “public sector” debt in the total external debt stock declined by 2.7% and 2.6%, respectively, during this period. On the other hand, the share of “private sector” external debt of the total external debt stock increased by 5.3%. The share of “public sector,” “monetary authorities’ debt” and “private sector” debt in the total external debt stock was 28.5%, 0.3% and 71.2%, respectively, as of the end of 2015.
“At the end of 2015, Treasury-guaranteed external debt stock was U.S.$11.4 billion, representing an increase of approximately U.S.$3 billion compared to end of 2011.”
The following tables provide information as to the public and private share of external debt stock of Turkey for the periods indicated:
153
Table 82
Gross Outstanding External Debt of Turkey (1)
| | | | | | | | | | | | | | | | | | | | |
GROSS EXTERNAL DEBT- by BORROWER (Million $) | | 2011 | | | 2012 | | | 2013 | | | 2014 | | | 2015 | |
TOTAL | | | 303,895 | | | | 339,705 | | | | 390,167 | | | | 402,431 | | | | 397,872 | |
SHORT TERM (2) | | | 81,559 | | | | 100,158 | | | | 130,334 | | | | 131,638 | | | | 102,435 | |
PUBLIC SECTOR | | | 7,013 | | | | 11,040 | | | | 17,605 | | | | 17,866 | | | | 14,550 | |
GENERAL GOVERNMENT | | | 0 | | | | 0 | | | | 0 | | | | 0 | | | | 0 | |
Central Government | | | 0 | | | | 0 | | | | 0 | | | | 0 | | | | 0 | |
Local Administrations | | | 0 | | | | 0 | | | | 0 | | | | 0 | | | | 0 | |
Funds | | | 0 | | | | 0 | | | | 0 | | | | 0 | | | | 0 | |
FINANCIAL INSTITUTIONS | | | 7,013 | | | | 11,040 | | | | 17,605 | | | | 17,866 | | | | 14,550 | |
Banks | | | 7,013 | | | | 11,040 | | | | 17,605 | | | | 17,866 | | | | 14,550 | |
Non-Banking Institutions | | | 0 | | | | 0 | | | | 0 | | | | 0 | | | | 0 | |
NON-FINANCIAL INSTITUTIONS | | | 0 | | | | 0 | | | | 0 | | | | 0 | | | | 0 | |
SOE’s | | | 0 | | | | 0 | | | | 0 | | | | 0 | | | | 0 | |
Other | | | 0 | | | | 0 | | | | 0 | | | | 0 | | | | 0 | |
CBRT | | | 1,239 | | | | 1,036 | | | | 833 | | | | 342 | | | | 176 | |
Dresdner Bank Scheme | | | 1,238 | | | | 1,036 | | | | 833 | | | | 342 | | | | 176 | |
Other | | | 1 | | | | 0 | | | | 0 | | | | 0 | | | | 0 | |
PRIVATE SECTOR | | | 73,307 | | | | 88,082 | | | | 111,896 | | | | 113,430 | | | | 87,709 | |
FINANCIAL INSTITUTIONS | | | 46,522 | | | | 59,197 | | | | 77,000 | | | | 78,916 | | | | 52,495 | |
Banks | | | 45,226 | | | | 57,338 | | | | 74,640 | | | | 76,916 | | | | 50,420 | |
Non-Banking Institutions | | | 1,296 | | | | 1,859 | | | | 2,360 | | | | 2,000 | | | | 2,075 | |
NON-FINANCIAL INSTITUTIONS | | | 26,785 | | | | 28,885 | | | | 34,896 | | | | 34,514 | | | | 35,214 | |
LONG TERM | | | 222,336 | | | | 239,547 | | | | 259,833 | | | | 270,793 | | | | 295,437 | |
PUBLIC SECTOR | | | 87,266 | | | | 92,983 | | | | 98,339 | | | | 99,843 | | | | 98,729 | |
GENERAL GOVERNMENT | | | 82,990 | | | | 85,481 | | | | 89,325 | | | | 88,212 | | | | 84,460 | |
Central Government | | | 79,184 | | | | 81,710 | | | | 85,663 | | | | 85,162 | | | | 81,705 | |
Local Administrations | | | 3,789 | | | | 3,769 | | | | 3,661 | | | | 3,050 | | | | 2,755 | |
Funds | | | 17 | | | | 3 | | | | 0 | | | | 0 | | | | 0 | |
FINANCIAL INSTITUTIONS (3) | | | 3,051 | | | | 6,245 | | | | 7,833 | | | | 10,642 | | | | 13,412 | |
Banks | | | 3,051 | | | | 6,245 | | | | 7,833 | | | | 10,642 | | | | 13,412 | |
Non-Banking Institutions | | | 0 | | | | 0 | | | | 0 | | | | 0 | | | | 0 | |
NON-FINANCIAL INSTITUTIONS | | | 1,225 | | | | 1,257 | | | | 1,181 | | | | 989 | | | | 858 | |
SOE’s | | | 1,162 | | | | 1,214 | | | | 1,158 | | | | 989 | | | | 858 | |
Other (4) | | | 64 | | | | 43 | | | | 23 | | | | 0 | | | | 0 | |
CBRT | | | 8,095 | | | | 6,052 | | | | 4,401 | | | | 2,142 | | | | 1,151 | |
CBRT Loans | | | 0 | | | | 0 | | | | 0 | | | | 0 | | | | 0 | |
Dresdner Bank Scheme | | | 8,086 | | | | 6,043 | | | | 4,392 | | | | 2,133 | | | | 1,143 | |
NGTA | | | 9 | | | | 9 | | | | 9 | | | | 9 | | | | 8 | |
PRIVATE SECTOR (5) | | | 126,975 | | | | 140,512 | | | | 157,093 | | | | 168,808 | | | | 195,556 | |
FINANCIAL INSTITUTIONS | | | 47,893 | | | | 56,914 | | | | 72,900 | | | | 84,740 | | | | 104,745 | |
Banks | | | 34,902 | | | | 41,742 | | | | 54,890 | | | | 65,964 | | | | 85,857 | |
Non-Banking Institutions | | | 12,991 | | | | 15,172 | | | | 18,010 | | | | 18,776 | | | | 18,888 | |
NON-FINANCIAL INSTITUTIONS | | | 79,082 | | | | 83,598 | | | | 84,193 | | | | 84,068 | | | | 90,811 | |
154
| | | | | | | | | | | | | | | | | | | | |
GROSS EXTERNAL DEBT - by LENDER (Million $) | | 2011 | | | 2012 | | | 2013 | | | 2014 | | | 2015 | |
TOTAL | | | 303,895 | | | | 339,705 | | | | 390,167 | | | | 402,431 | | | | 397,872 | |
LOAN | | | 253,365 | | | | 274,666 | | | | 309,396 | | | | 305,858 | | | | 301,942 | |
SHORT TERM | | | 81,559 | | | | 100,144 | | | | 128,862 | | | | 127,497 | | | | 100,574 | |
PRIVATE CREDITORS | | | 81,302 | | | | 100,072 | | | | 128,856 | | | | 127,255 | | | | 100,410 | |
MONETARY INSTITUTIONS | | | 47,316 | | | | 63,550 | | | | 83,963 | | | | 81,652 | | | | 51,441 | |
NONMONETARY INSTITUTIONS | | | 33,986 | | | | 36,522 | | | | 44,893 | | | | 45,603 | | | | 48,969 | |
OFFICIAL CREDITORS | | | 257 | | | | 72 | | | | 6 | | | | 242 | | | | 164 | |
LONG TERM | | | 171,806 | | | | 174,522 | | | | 180,534 | | | | 178,361 | | | | 201,368 | |
PRIVATE CREDITORS | | | 128,037 | | | | 129,807 | | | | 133,263 | | | | 132,473 | | | | 156,768 | |
MONETARY INSTITUTIONS | | | 108,701 | | | | 111,328 | | | | 115,639 | | | | 118,080 | | | | 141,206 | |
NONBANK FINANCIAL INSTITUTIONS | | | 8,160 | | | | 10,877 | | | | 11,895 | | | | 11,758 | | | | 14,183 | |
PRIVATE INVETSTMENT & DEV. BANKS | | | 5 | | | | 3 | | | | 0 | | | | 0 | | | | 0 | |
FOREIGN COMMERCIAL BANKS | | | 71,727 | | | | 72,783 | | | | 76,263 | | | | 79,119 | | | | 99,076 | |
FOREIGN BRANCHES OF DOMESTIC BANKS AND OTHERS | | | 28,809 | | | | 27,666 | | | | 27,481 | | | | 27,203 | | | | 27,948 | |
NONMONETARY INSTITUTIONS | | | 19,336 | | | | 18,478 | | | | 17,624 | | | | 14,393 | | | | 15,562 | |
OFFICIAL CREDITORS | | | 43,769 | | | | 44,715 | | | | 47,271 | | | | 45,888 | | | | 44,600 | |
GOVERNMENTAL ORGANIZATIONS | | | 9,053 | | | | 8,595 | | | | 8,559 | | | | 8,318 | | | | 8,148 | |
PUBLIC FINANCE INSTUTITIONS | | | 2,323 | | | | 2,217 | | | | 2,152 | | | | 2,115 | | | | 1,876 | |
CENTRAL BANKS | | | 0 | | | | 0 | | | | 0 | | | | 0 | | | | 0 | |
CENTRAL GOVERNMENTS | | | 276 | | | | 214 | | | | 162 | | | | 109 | | | | 81 | |
OFFICIAL DEVELOPMENT BANKS | | | 6,454 | | | | 6,164 | | | | 6,245 | | | | 6,094 | | | | 6,191 | |
MULTILATERAL ORGANIZATIONS | | | 34,716 | | | | 36,121 | | | | 38,712 | | | | 37,570 | | | | 36,451 | |
IMF-INTERNATIONAL MONETARY FUND | | | 4,361 | | | | 2,338 | | | | 1,477 | | | | 1,389 | | | | 1,330 | |
IMF SDR ALLOCATİON | | | 1,476 | | | | 1,474 | | | | 1,477 | | | | 1,389 | | | | 1,330 | |
IBRD | | | 12,446 | | | | 13,387 | | | | 14,227 | | | | 13,112 | | | | 11,875 | |
OTHER MULTILATERAL INST. | | | 17,909 | | | | 20,395 | | | | 23,008 | | | | 23,069 | | | | 23,246 | |
BONDS (6) | | | 50,531 | | | | 65,038 | | | | 80,770 | | | | 96,573 | | | | 95,929 | |
SHORT TERM | | | 0 | | | | 14 | | | | 1,472 | | | | 4,141 | | | | 1,861 | |
LONG TERM | | | 50,531 | | | | 65,024 | | | | 79,298 | | | | 92,432 | | | | 94,068 | |
| (3) | Public Deposit Banks and Public Development & Investment Banks. |
| (4) | Public Corporations, Regulatory Institutions and Organizations. |
| (5) | Since October 1, 2001, CBRT is responsible for monitoring private sector debt. |
| (6) | All the bonds issued in foreign markets are long-term securities and the lender class of the bonds is “monetary institutions” according to the primary market issuance. |
Sources: UT, CBRT
The following tables present the relationship of Turkey’s public and private external debt to other financial indicators for, or at the end of, the periods indicated:
Table 83
Currency Composition of Outstanding External Debt (1)(2)
| | | | | | | | | | | | | | | | | | | | |
% | | 2011 | | | 2012 | | | 2013 | | | 2014 | | | 2015 | |
TOTAL | | | 100 | | | | 100 | | | | 100 | | | | 100 | | | | 100 | |
CHF | | | 0.4 | | | | 0.4 | | | | 0.6 | | | | 0.6 | | | | 0.5 | |
ECU/EUR | | | 35.6 | | | | 34.5 | | | | 35.4 | | | | 31.7 | | | | 31.8 | |
GBP | | | 0.3 | | | | 0.4 | | | | 0.3 | | | | 0.4 | | | | 0.4 | |
JPY | | | 2.5 | | | | 2.4 | | | | 1.8 | | | | 1.9 | | | | 2.1 | |
SDR | | | 1.4 | | | | 0.7 | | | | 0.4 | | | | 0.4 | | | | 0.3 | |
USD | | | 54.0 | | | | 54.7 | | | | 54.4 | | | | 57.6 | | | | 58.6 | |
TL | | | 5.6 | | | | 6.8 | | | | 6.8 | | | | 7.1 | | | | 5.9 | |
Other | | | 0.2 | | | | 0.2 | | | | 0.3 | | | | 0.3 | | | | 0.3 | |
| (2) | Reflects figures at the end of the periods indicated. |
Source: UT
155
Table 84
| | | | | | | | | | | | | | | | | | | | |
Debt Ratios | | 2011 | | | 2012 | | | 2013 | | | 2014 | | | 2015 | |
DOD / GDP (%) | | | | | | | | | | | | | | | | | | | | |
Total | | | 39.3 | | | | 43.2 | | | | 47.4 | | | | 50.3 | | | | 55.3 | |
Short Term | | | 10.5 | | | | 12.7 | | | | 15.8 | | | | 16.5 | | | | 14.2 | |
Long Term | | | 28.7 | | | | 30.5 | | | | 31.6 | | | | 33.9 | | | | 41.0 | |
Public Sector | | | 12.2 | | | | 13.2 | | | | 14.1 | | | | 14.7 | | | | 15.7 | |
Central Bank | | | 1.2 | | | | 0.9 | | | | 0.6 | | | | 0.3 | | | | 0.2 | |
Private Sector | | | 25.9 | | | | 29.1 | | | | 32.7 | | | | 35.3 | | | | 39.3 | |
FINANCIAL RATIOS (%) | | | | | | | | | | | | | | | | | | | | |
T.EXTERNAL DEBT / EXPORTS (FOB) | | | 225.3 | | | | 222.8 | | | | 257.0 | | | | 255.3 | | | | 276.6 | |
EXTERNAL DEBT SERVICE / GDP | | | 6.5 | | | | 6.6 | | | | 6.6 | | | | 6.0 | | | | 6.6 | |
EXTERNAL DEBT SERVICE / EXPORTS (FOB) | | | 37.4 | | | | 33.9 | | | | 35.7 | | | | 30.4 | | | | 32.9 | |
PRIVATE SECTOR/ EXPORTS (FOB) | | | 148.5 | | | | 149.9 | | | | 177.2 | | | | 179.1 | | | | 196.9 | |
INTEREST / GDP | | | 1.0 | | | | 1.0 | | | | 1.0 | | | | 1.1 | | | | 1.2 | |
INTEREST / EXPORTS (FOB) | | | 5.9 | | | | 5.4 | | | | 5.5 | | | | 5.4 | | | | 6.0 | |
INTERNATIONAL RESERVES (NET) / T. EXTERNAL DEBT | | | 29.1 | | | | 35.1 | | | | 33.6 | | | | 31.6 | | | | 27.8 | |
INTERNATIONAL RESERVES (NET) / SHORT TERM DEBT | | | 108.3 | | | | 119.0 | | | | 100.5 | | | | 96.7 | | | | 107.9 | |
INTERNATIONAL RESERVES (GROSS) / T. EXTERNAL DEBT | | | 25.8 | | | | 29.4 | | | | 28.4 | | | | 26.6 | | | | 23.4 | |
INTERNATIONAL RESERVES (GROSS) / SHORT TERM DEBT | | | 96.2 | | | | 99.8 | | | | 85.1 | | | | 81.2 | | | | 90.7 | |
CBRT RESERVES (GROSS) / IMPORTS (CIF) | | | 32.6 | | | | 42.2 | | | | 44.1 | | | | 44.1 | | | | 44.8 | |
CBRT RESERVES (NET) / IMPORTS (CIF) | | | 36.7 | | | | 50.4 | | | | 52.1 | | | | 52.6 | | | | 53.3 | |
CURRENT ACCOUNT BALANCE / CBRT RESERVES (GROSS) | | | -94.8 | | | | -48.0 | | | | -57.3 | | | | -40.7 | | | | -34.7 | |
CURRENT ACCOUNT BALANCE / CBRT RESERVES (NET) | | | -84.2 | | | | -40.2 | | | | -48.6 | | | | -34.2 | | | | -29.1 | |
CURRENT ACCOUNT BALANCE / GDP | | | -9.6 | | | | -6.1 | | | | -7.7 | | | | -5.4 | | | | -4.5 | |
Sources: UT, CBRT, TURKSTAT
Table 85
External Debt Service(1) (2)
| | | | | | | | | | | | | | | | | | | | |
(Million $) | | 2011 | | | 2012 | | | 2013 | | | 2014 | | | 2015 | |
Total External Debt Service | | | 50,457 | | | | 51,738 | | | | 54,194 | | | | 47,912 | | | | 47,291 | |
Principal | | | 42,462 | | | | 43,557 | | | | 45,858 | | | | 39,336 | | | | 38,651 | |
Interest | | | 7,995 | | | | 8,181 | | | | 8,336 | | | | 8,576 | | | | 8,640 | |
| (2) | Repayments through bond issues are included. |
Source: CBRT (Balance of Payment Statistics, April 2016)
The aggregate amount of scheduled repayment of principal and interest on the medium and long-term external public and private debt of Turkey (disbursed and undisbursed) is set forth below for the periods indicated:
156
Table 86
Total External Debt Service Projections (1)(2)
| | | | | | | | | | | | | | | | | | | | | | | | | | | | |
(Million $) | | 2016
(May-December) | | | 2017 | | | 2018 | | | 2019 | | | 2020 | | | 2021+ | | | TOTAL | |
GROSS TOTAL | | | 70,735 | | | | 58,128 | | | | 43,269 | | | | 40,845 | | | | 30,319 | | | | 161,756 | | | | 405,052 | |
PUBLIC SECTOR | | | 11,714 | | | | 16,463 | | | | 11,823 | | | | 12,655 | | | | 10,230 | | | | 84,854 | | | | 147,738 | |
PRINCIPAL | | | 9,137 | | | | 12,306 | | | | 8,203 | | | | 9,334 | | | | 7,360 | | | | 59,407 | | | | 105,746 | |
INTEREST | | | 2,577 | | | | 4,157 | | | | 3,620 | | | | 3,322 | | | | 2,870 | | | | 25,447 | | | | 41,992 | |
PRIVATE SECTOR | | | 59,021 | | | | 41,666 | | | | 31,447 | | | | 28,190 | | | | 20,089 | | | | 76,902 | | | | 257,314 | |
PRINCIPAL | | | 55,711 | | | | 37,066 | | | | 27,003 | | | | 23,996 | | | | 16,576 | | | | 63,305 | | | | 223,657 | |
INTEREST | | | 3,310 | | | | 4,599 | | | | 4,443 | | | | 4,194 | | | | 3,514 | | | | 13,596 | | | | 33,657 | |
| (2) | Excluding NGTA and Dresdner Accounts’ Repayments. |
Sources: UT, CBRT (Cross rates based on: 04/30/2016)
Table 87
| | | | | | | | | | |
| Central Government External Debt Of Turkey (as of December 31, 2015) | |
| (issued between January 1, 2011 and December 31, 2015) | |
| | | Agreement Date | | Currency | | Maturity
(Years) | | Outstanding
Amount
(Million USD) | |
Bond | | | 25,933 | |
| | | | | | | | | | |
Monetary Institutions | | Various
(05-Jan-2011 - 08-Apr-2015) | | USD-EUR-JYP | | Various
(5 - 31) | | | 25,933 | |
| | | | | | | | | | |
Loan | | | 4,797 | |
| | | | | | | | | | |
Governmental Organizations | | Various
(22-June-2011 - 27-Jan-2014) | | EUR-JYP | | Various
(15 - 25) | | | 339 | |
Monetary Institutions | | Various
(06-May-2011 - 18-Dec-2014) | | USD-EUR-CHF | | Various
(5 - 10) | | | 657 | |
International Organizations | | Various
(27-May-2011 - 03-Jun-2015) | | USD-EUR-ISD-SDR | | Various
(13 - 30) | | | 3,802 | |
| | | | | | | | | | |
Total | | | 30,731 | |
| | | | | | | | | | |
Source: UT
157
Table 88
External Debt of Turkey (Public Guaranteed)
| | | | | | | | | | | | | | | | | | | | |
(provided between January 1, 2011 and December 31, 2015 ) (dd.mm.yyyy) | | | | | External Debt of Turkey
(Public Guaranteed) | | | | | | | | | | |
Agreement Date | | Currency | | | Debt Disbursed and
Outstanding ($) | | | Maturity
(Year) | | | Interest Type | | | Interest Rate
/ Margin | |
05.04.2011 | | | USD | | | $ | 180,000,000.00 | | | | 27.72 | | | | LIUSD6MD | | | | 0.48 | |
05.04.2011 | | | EUR | | | $ | 97,853,100.00 | | | | 27.72 | | | | EURIBOR6MD | | | | 0.48 | |
22.06.2011 | | | JPY | | | $ | 65,816,159.49 | | | | 25.01 | | | | | | | | 1.20 | |
04.07.2011 | | | EUR | | | $ | 7,244,250.00 | | | | 14.03 | | | | EURIBOR6MD | | | | 0.67 | |
04.07.2011 | | | EUR | | | $ | 12,631,000.00 | | | | 14.03 | | | | EURIBOR6MD | | | | 0.91 | |
04.07.2011 | | | EUR | | | $ | 13,105,601.35 | | | | 14.03 | | | | LIUSD6MD | | | | 0.80 | |
04.07.2011 | | | EUR | | | $ | 14,166,666.67 | | | | 14.03 | | | | LIUSD6MD | | | | 1.16 | |
04.07.2011 | | | EUR | | | $ | 15,850,666.66 | | | | 14.03 | | | | EURIBOR6MD | | | | 1.23 | |
04.07.2011 | | | EUR | | | $ | 22,146,400.00 | | | | 14.03 | | | | LIUSD6MD | | | | 1.52 | |
04.07.2011 | | | EUR | | | $ | 24,766,666.66 | | | | 14.01 | | | | EURIBOR6MD | | | | 1.16 | |
04.07.2011 | | | EUR | | | $ | 26,314,583.33 | | | | 14.01 | | | | EURIBOR6MD | | | | 1.13 | |
04.07.2011 | | | EUR | | | $ | 27,862,500.00 | | | | 14.01 | | | | EURIBOR6MD | | | | 0.70 | |
31.10.2011 | | | EUR | | | $ | 13,860,000.00 | | | | 9.58 | | | | LIUSD6MD | | | | 0.69 | |
31.10.2011 | | | EUR | | | $ | 19,256,920.00 | | | | 9.58 | | | | LIUSD6MD | | | | 0.75 | |
31.10.2011 | | | EUR | | | $ | 27,305,250.00 | | | | 9.58 | | | | EURIBOR6MD | | | | 0.27 | |
31.10.2011 | | | EUR | | | $ | 39,007,500.00 | | | | 9.58 | | | | EURIBOR6MD | | | | 0.52 | |
05.12.2011 | | | USD | | | $ | 114,632,998.00 | | | | 24.96 | | | | WBSCLUS6A98 | | | | 0.49 | |
05.12.2011 | | | EUR | | | $ | 60,017,095.34 | | | | 24.96 | | | | WBVSLEUR6A09 | | | | 0.49 | |
05.12.2011 | | | USD | | | $ | 100,000,000.00 | | | | 27.55 | | | | LIUSD6MD | | | | 0.46 | |
05.12.2011 | | | EUR | | | $ | 77,234,850.00 | | | | 27.55 | | | | WBVSLEUR6A09 | | | | 0.47 | |
09.12.2011 | | | EUR | | | $ | 39,594,078.95 | | | | 13.52 | | | | EURIBOR6MD | | | | 0.69 | |
09.12.2011 | | | EUR | | | $ | 42,176,842.11 | | | | 13.52 | | | | | | | | 3.50 | |
09.05.2012 | | | EUR | | | $ | 22,290,000.00 | | | | 13.62 | | | | EURIBOR6MD | | | | 0.79 | |
09.05.2012 | | | EUR | | | $ | 27,862,500.00 | | | | 13.62 | | | | EURIBOR6MD | | | | 0.75 | |
09.05.2012 | | | EUR | | | $ | 31,577,500.00 | | | | 13.62 | | | | EURIBOR6MD | | | | 1.13 | |
09.05.2012 | | | EUR | | | $ | 42,351,000.00 | | | | 12.22 | | | | EURIBOR6MD | | | | 1.18 | |
09.05.2012 | | | EUR | | | $ | 45,454,500.00 | | | | 12.22 | | | | LIUSD6MD | | | | 1.62 | |
29.05.2012 | | | EUR | | | $ | 22,290,000.00 | | | | 7.54 | | | | | | | | 1.44 | |
29.05.2012 | | | EUR | | | $ | 32,000,000.00 | | | | 7.54 | | | | | | | | 1.72 | |
28.06.2012 | | | EUR | | | $ | 45,593,181.81 | | | | 8.51 | | | | | | | | 1.62 | |
28.06.2012 | | | EUR | | | $ | 45,593,181.81 | | | | 8.51 | | | | | | | | 1.94 | |
28.06.2012 | | | EUR | | | $ | 53,672,727.28 | | | | 8.51 | | | | | | | | 2.24 | |
28.06.2012 | | | EUR | | | $ | 36,703,000.00 | | | | 12.29 | | | | LIUSD6MD | | | | 1.22 | |
28.06.2012 | | | EUR | | | $ | 47,366,250.00 | | | | 12.29 | | | | EURIBOR6MD | | | | 0.91 | |
28.06.2012 | | | EUR | | | $ | 15,523,392.38 | | | | 10.35 | | | | EURIBOR6MD | | | | 1.24 | |
28.06.2012 | | | EUR | | | $ | 15,523,392.38 | | | | 10.35 | | | | | | | | 2.22 | |
28.06.2012 | | | EUR | | | $ | 21,775,849.92 | | | | 10.35 | | | | | | | | 7.70 | |
28.06.2012 | | | EUR | | | $ | 24,055,571.00 | | | | 10.35 | | | | LIUSD6MD | | | | 1.69 | |
28.06.2012 | | | EUR | | | $ | 24,055,571.00 | | | | 10.35 | | | | | | | | 2.58 | |
04.12.2012 | | | USD | | | $ | 118,422,000.00 | | | | 12.08 | | | | | | | | 3.00 | |
04.12.2012 | | | USD | | | $ | 100,000,000.00 | | | | 10.16 | | | | SWAP USD | | | | 2.72 | |
20.12.2012 | | | EUR | | | $ | 130,170,000.00 | | | | 8.58 | | | | LIUSD6MD | | | | 0.69 | |
20.12.2012 | | | EUR | | | $ | 135,170,000.00 | | | | 8.58 | | | | | | | | 2.35 | |
26.03.2013 | | | USD | | | $ | 65,522,386.00 | | | | 10.01 | | | | LIUSD6MD | | | | 1.50 | |
25.04.2013 | | | EUR | | | $ | 11,145,000.00 | | | | 11.50 | | | | EURIBOR6MD | | | | 0.69 | |
25.04.2013 | | | EUR | | | $ | 11,145,000.00 | | | | 11.50 | | | | | | | | 0.98 | |
25.04.2013 | | | EUR | | | $ | 44,580,000.00 | | | | 11.50 | | | | | | | | 0.73 | |
158
| | | | | | | | | | | | | | | | | | | | |
24.04.2013 | | | EUR | | | $ | 16,717,500.00 | | | | 11.48 | | | | EURIBOR6MD | | | | 0.74 | |
24.04.2013 | | | EUR | | | $ | 20,000,000.00 | | | | 11.48 | | | | LIUSD6MD | | | | 0.73 | |
24.04.2013 | | | EUR | | | $ | 20,000,000.00 | | | | 11.48 | | | | LIUSD6MD | | | | 0.88 | |
24.04.2013 | | | EUR | | | $ | 27,862,500.00 | | | | 11.48 | | | | EURIBOR6MD | | | | 0.74 | |
24.04.2013 | | | EUR | | | $ | 33,958,555.35 | | | | 11.48 | | | | EURIBOR6MD | | | | 0.73 | |
03.06.2013 | | | EUR | | | $ | 22,290,000.00 | | | | 10.08 | | | | EURIBOR6MD | | | | 0.05 | |
03.06.2013 | | | EUR | | | $ | 25,076,250.00 | | | | 10.08 | | | | EURIBOR6MD | | | | 0.21 | |
03.06.2013 | | | EUR | | | $ | 27,862,500.00 | | | | 10.08 | | | | EURIBOR6MD | | | | 0.19 | |
03.06.2013 | | | EUR | | | $ | 33,435,000.00 | | | | 10.08 | | | | EURIBOR6MD | | | | 0.32 | |
06.05.2013 | | | USD | | | $ | 29,463,329.47 | | | | 29.88 | | | | WBSCLUS6A98 | | | | 0.01 | |
06.05.2013 | | | USD | | | $ | 15,000,000.00 | | | | 29.88 | | | | LIUSD6MD | | | | 1.00 | |
06.05.2013 | | | USD | | | $ | 27,815,066.19 | | | | 29.84 | | | | WBSCLUS6A98 | | | | 0.80 | |
22.08.2013 | | | USD | | | $ | 84,875,374.00 | | | | 29.63 | | | | LIUSD6MD | | | | 0.47 | |
15.07.2013 | | | EUR | | | $ | 25,415,973.38 | | | | 9.05 | | | | | | | | 11.20 | |
15.07.2013 | | | EUR | | | $ | 25,540,625.00 | | | | 9.05 | | | | EURIBOR6MD | | | | 0.52 | |
16.09.2013 | | | EUR | | | $ | 55,725,000.00 | | | | 10.45 | | | | | | | | 0.65 | |
16.09.2013 | | | EUR | | | $ | 55,725,000.00 | | | | 10.45 | | | | | | | | 2.04 | |
18.09.2013 | | | EUR | | | $ | 27,862,500.00 | | | | 9.53 | | | | | | | | 1.93 | |
18.09.2013 | | | EUR | | | $ | 27,862,500.00 | | | | 9.53 | | | | | | | | 2.01 | |
18.09.2013 | | | EUR | | | $ | 33,680,000.00 | | | | 9.53 | | | | | | | | 2.69 | |
18.09.2013 | | | EUR | | | $ | 34,395,000.00 | | | | 9.53 | | | | | | | | 2.95 | |
10.10.2013 | | | EUR | | | $ | 111,450,000.00 | | | | 10.23 | | | | | | | | 3.20 | |
24.10.2013 | | | EUR | | | $ | 55,725,000.00 | | | | 9.52 | | | | EURIBOR6MD | | | | 0.65 | |
24.10.2013 | | | EUR | | | $ | 55,725,000.00 | | | | 9.52 | | | | EURIBOR6MD | | | | 0.74 | |
03.12.2013 | | | EUR | | | $ | 6,180,409.04 | | | | 9.62 | | | | | | | | 1.54 | |
03.12.2013 | | | EUR | | | $ | 11,145,000.00 | | | | 9.62 | | | | EURIBOR6MD | | | | 0.74 | |
03.12.2013 | | | EUR | | | $ | 14,354,760.00 | | | | 9.62 | | | | | | | | 0.97 | |
03.12.2013 | | | EUR | | | $ | 14,521,377.75 | | | | 9.62 | | | | EURIBOR6MD | | | | 0.33 | |
03.12.2013 | | | EUR | | | $ | 39,007,500.00 | | | | 9.62 | | | | | | | | 0.97 | |
04.12.2013 | | | EUR | | | $ | 27,862,500.00 | | | | 9.53 | | | | EURIBOR6MD | | | | 0.74 | |
04.12.2013 | | | EUR | | | $ | 27,862,500.00 | | | | 9.53 | | | | | | | | 0.65 | |
04.12.2013 | | | EUR | | | $ | 31,025,000.00 | | | | 9.53 | | | | | | | | 0.89 | |
04.12.2013 | | | EUR | | | $ | 34,542,500.00 | | | | 9.53 | | | | LIEUR6MD | | | | 0.66 | |
04.12.2013 | | | EUR | | | $ | 55,725,000.00 | | | | 9.53 | | | | EURIBOR6MD | | | | 0.41 | |
19.12.2013 | | | EUR | | | $ | 89,160,000.00 | | | | 7.83 | | | | EURIBOR6MD | | | | 0.32 | |
20.12.2013 | | | EUR | | | $ | 13,596,900.00 | | | | 19.54 | | | | | | | | 2.45 | |
30.12.2013 | | | USD | | | $ | 110,000,000.00 | | | | 15.42 | | | | | | | | 3.95 | |
19.12.2013 | | | EUR | | | $ | 54,865,000.00 | | | | 14.28 | | | | LIUSD6MD | | | | 0.85 | |
19.12.2013 | | | EUR | | | $ | 67,865,000.00 | | | | 14.28 | | | | LIUSD6MD | | | | 0.78 | |
26.06.2014 | | | EUR | | | $ | 167,175,000.00 | | | | 10.52 | | | | | | | | 3.10 | |
02.12.2014 | | | EUR | | | $ | 27,862,500.00 | | | | 12.13 | | | | | | | | 1.73 | |
10.07.2014 | | | EUR | | | $ | 30,055,006.66 | | | | 17.78 | | | | WBVSLEUR6A09 | | | | 0.27 | |
10.07.2014 | | | USD | | | $ | 465,592.60 | | | | 19.78 | | | | | | | | 0.75 | |
02.10.2014 | | | USD | | | $ | 200,952,511.21 | | | | 15.42 | | | | WBVSLUSD6A09 | | | | 0.30 | |
08.07.2014 | | | EUR | | | $ | 6,600,000.00 | | | | 9.53 | | | | LIUSD6MD | | | | 0.33 | |
08.07.2014 | | | EUR | | | $ | 11,145,000.00 | | | | 9.53 | | | | EURIBOR6MD | | | | 0.63 | |
08.07.2014 | | | EUR | | | $ | 18,636,000.00 | | | | 9.53 | | | | | | | | 2.67 | |
08.07.2014 | | | EUR | | | $ | 19,800,000.00 | | | | 9.53 | | | | | | | | 2.75 | |
08.07.2014 | | | EUR | | | $ | 22,290,000.00 | | | | 9.53 | | | | | | | | 1.32 | |
08.07.2014 | | | EUR | | | $ | 39,007,500.00 | | | | 9.53 | | | | | | | | 1.08 | |
22.08.2014 | | | USD | | | $ | 17,943,721.29 | | | | 27.58 | | | | EURIBOR6MD | | | | 0.50 | |
22.08.2014 | | | USD | | | $ | 54,710,851.40 | | | | 27.58 | | | | LIUSD6MD | | | | 0.47 | |
07.11.2014 | | | EUR | | | $ | 11,060,000.00 | | | | 9.53 | | | | | | | | 2.56 | |
159
| | | | | | | | | | | | | | | | | | | | |
07.11.2014 | | | EUR | | | $ | 11,145,000.00 | | | | 9.53 | | | | | | | | 0.94 | |
07.11.2014 | | | EUR | | | $ | 24,724,000.00 | | | | 9.53 | | | | | | | | 2.72 | |
07.11.2014 | | | EUR | | | $ | 89,160,000.00 | | | | 9.53 | | | | | | | | 0.64 | |
07.11.2014 | | | EUR | | | $ | 89,160,000.00 | | | | 9.53 | | | | | | | | 1.07 | |
07.11.2014 | | | EUR | | | $ | 123,920,000.00 | | | | 8.15 | | | | LIUSD6MD | | | | 0.60 | |
06.11.2014 | | | EUR | | | $ | 111,450,000.00 | | | | 9.53 | | | | EURIBOR6MD | | | | 0.51 | |
24.11.2014 | | | EUR | | | $ | 27,255,000.00 | | | | 13.08 | | | | LIUSD6MD | | | | 0.71 | |
24.11.2014 | | | EUR | | | $ | 27,862,500.00 | | | | 13.08 | | | | EURIBOR6MD | | | | 0.44 | |
10.12.2014 | | | EUR | | | $ | 27,862,500.00 | | | | 9.06 | | | | | | | | 0.34 | |
10.12.2014 | | | EUR | | | $ | 27,862,500.00 | | | | 9.06 | | | | | | | | 0.49 | |
26.03.2015 | | | USD | | | $ | 10,418,000.00 | | | | 12.01 | | | | LIUSD6MD | | | | 1.50 | |
26.05.2015 | | | EUR | | | $ | 2,507,460.00 | | | | 9.32 | | | | LIUSD6MD | | | | 0.68 | |
26.05.2015 | | | EUR | | | $ | 53,161,650.00 | | | | 9.32 | | | | EURIBOR6MD | | | | 0.39 | |
28.05.2015 | | | EUR | | | $ | 111,450,000.00 | | | | 9.52 | | | | EURIBOR6MD | | | | 0.40 | |
28.05.2015 | | | EUR | | | $ | 55,725,000.00 | | | | 9.52 | | | | | | | | 1.32 | |
28.05.2015 | | | EUR | | | $ | 106,811,980.03 | | | | 9.52 | | | | | | | | 11.40 | |
24.06.2015 | | | EUR | | | $ | 222,900,000.00 | | | | 10.02 | | | | | | | | 2.35 | |
03.06.2015 | | | USD | | | $ | 300,000,000.00 | | | | 14.92 | | | | LIUSD6MD | | | | 1.35 | |
25.08.2015 | | | EUR | | | $ | 55,725,000.00 | | | | 7.73 | | | | EURIBOR6MD | | | | 0.01 | |
25.08.2015 | | | EUR | | | $ | 55,725,000.00 | | | | 7.73 | | | | EURIBOR6MD | | | | 0.18 | |
06.11.2015 | | | EUR | | | $ | 27,352,500.00 | | | | 12.56 | | | | LIUSD6MD | | | | 0.74 | |
06.11.2015 | | | EUR | | | $ | 83,587,500.00 | | | | 12.56 | | | | | | | | 0.88 | |
28.12.2015 | | | USD | | | $ | 40,000,000.00 | | | | 19.73 | | | | LIUSD6MD | | | | 0.95 | |
29.12.2015 | | | USD | | | $ | 169,346,000.00 | | | | 10.30 | | | | LIUSD6MD | | | | 1.55 | |
Source: UT
RISK MANAGEMENT
In order to increase fiscal discipline, transparency, accountability and effectiveness in the management of debt and claims, Law No. 4749 implemented an active risk management strategy and took measures to limit the potential effects of guarantees and on-lent loans provided by the Treasury. In this context, to establish the necessary legal and organizational infrastructure for the management of public debt and receivables based on risk analysis, a Risk Management Unit was established. In addition, a Debt and Risk Management Committee was set up within the Undersecretariat of the Treasury to ensure coordination and efficiency in debt management. Within this framework, the debt management strategy is executed in line with the main principles of transparency, accountability and predictability.
With the help of this institutional infrastructure, the risk management unit has been operational since 2004 and continues to perform its routinely assigned duties, such as providing monthly and quarterly risk monitoring and analysis notes to the Debt and Risk Management Committee. Monthly and annual debt management reports have been published to discuss the developments in the area of public debt and risk management. Furthermore, the Risk Management Unit developed a debt strategy analysis model for the medium-term and produces valuation of the portfolio of explicit contingent liabilities of the state. Also, the Risk Management Unit produces cash flow reports, risk indicator reports and medium and long-term borrowing scenarios in order to evaluate financial risks.
The operational risk management activities regarding debt, cash and receivables management have been implemented since 2008. The existing operational risk management framework has been developed and used as an input in the completion process of Emergency and Business Continuity Plan (“EBCP”). The generation of business impact analysis and business flowcharts for critical processes have been used to improve institutional mechanisms and helped to develop the integrated strategies. In that regard, the finalization of EBCP has been a milestone regarding the management of operational risks. Accordingly, three years after the practice was conducted in 2013, the test or critical processes was repeated in March 2016 to serve for a more efficient functioning of the debt management.
The borrowing strategy aims to enhance transparency and the effectiveness of public debt management at an appropriate cost with a prudent level of risk. This is achieved through strategic benchmarking which has been used since 2004. Major components of this strategy, which are determined for a three-year period with a rolling basis in accordance with the aforementioned cost and risk analysis, are as follows for the period 2016-2018:
160
| | • | | To use fixed rate TL instruments as the major source of domestic cash borrowing and decrease the share of debt which has an interest rate refixing period of less than 12 months |
| | • | | To increase the average maturity of domestic cash borrowing taking market conditions into consideration and decrease the share of debt maturing within 12 months |
| | • | | To keep a certain level of cash reserve in order to reduce the liquidity risk associated with cash and debt management |
Tight fiscal policies and the implementation of strategic benchmarks have made an effective debt management structure possible, which in turn has reduced risk premiums.
Significant progress has been made in decreasing the public debt ratio. The general government nominal debt stock defined by EU standards to GDP ratio declined to 40.0% at the end of 2008 and increased to 46.1% in 2009 with the impact of the global financial and economic crisis. However, since then this ratio gradually improved and decreased to 32.9% at the end of 2015 due to stronger growth and positive budget performance. The 2016-2018 Medium Term Program sets EU defined debt stock to GDP targets of 31.7% by the end of 2016, 30.5% by the end of 2017 and 29.5% by the end of 2018. Moreover, as a result of borrowing policies aimed at reducing the sensitivity of debt stock to interest rate and foreign exchange rate fluctuations, the share of both floating rate and foreign currency denominated debt decreased gradually over the last decade. The share of floating rate debt stock in the Central Government debt stock fell to 32.4% in 2015 from 46.6% in 2009 and the duration of TL—denominated cash based domestic debt stock increased to 30.3 months from 7.5 months in the same period.
161