UNITED STATES
SECURITIES AND EXCHANGE COMMISSION
Washington, D.C. 20549
FORM N-CSR
CERTIFIED SHAREHOLDER REPORT OF REGISTERED
MANAGEMENT INVESTMENT COMPANIES
Investment Company Act file number: (811- 06257 )
Exact name of registrant as specified in charter: Putnam Limited Duration Government Income Fund
Address of principal executive offices: One Post Office Square, Boston, Massachusetts 02109
| Name and address of agent for service: | Beth S. Mazor, Vice President | |
| One Post Office Square | ||
| Boston, Massachusetts 02109 | ||
| Copy to: | John W. Gerstmayr, Esq. | |
| Ropes & Gray LLP | ||
| One International Place | ||
| Boston, Massachusetts 02110 | ||
| Registrant’s telephone number, including area code: | (617) 292-1000 | |
Date of fiscal year end: November 30, 2007
Date of reporting period: December 1, 2006— May 31, 2007
Item 1. Report to Stockholders:
The following is a copy of the report transmitted to stockholders pursuant to Rule 30e-1 under the Investment Company Act of 1940:
What makes Putnam different?

In 1830, Massachusetts Supreme Judicial Court Justice Samuel Putnam established The Prudent Man Rule, a legal foundation for responsible money management.
THE PRUDENT MAN RULE
All that can be required of a trustee to invest is that he shall conduct himself faithfully and exercise a sound discretion. He is to observe how men of prudence, discretion, and intelligence manage their own affairs, not in regard to speculation, but in regard to the permanent disposition of their funds, considering the probable income, as well as the probable safety of the capital to be invested.

A time-honored tradition in money management
Since 1937, our values have been rooted in a profound sense of responsibility for the money entrusted to us.
A prudent approach to investing
We use a research-driven team approach to seek consistent, dependable, superior investment results over time, although there is no guarantee a fund will meet its objectives.
Funds for every investment goal
We offer a broad range of mutual funds and other financial products so investors and their financial representatives can build diversified portfolios.
A commitment to doing what’s right for investors
We have below-average expenses and stringent investor protections, and provide a wealth of information about the Putnam funds.
Industry-leading service
We help investors, along with their financial representatives, make informed investment decisions with confidence.
Putnam Limited
Duration Government
Income Fund
5| 31| 07
Semiannual Report
| Message from the Trustees | 2 |
| About the fund | 4 |
| Performance snapshot | 6 |
| Report from the fund managers | 7 |
| Performance in depth | 14 |
| Expenses | 17 |
| Portfolio turnover | 19 |
| Risk | 20 |
| Your fund’s management | 21 |
| Terms and definitions | 24 |
| Trustee approval of management contract | 26 |
| Other information for shareholders | 32 |
| Financial statements | 33 |
| Shareholder meeting results | 66 |
Cover photograph: © Richard H. Johnson
Message from the Trustees
Dear Fellow Shareholder
Reflecting investor uncertainty about the outlook for the U.S. economy, volatility in the financial markets has been on the rise. After a downturn in March, the Dow Jones Industrial Average recently reached new record-high levels. The upward climb in the stock market has been largely unaffected by higher-trending interest rates since mid-May, though it remains to be seen whether current stock market levels are sustainable. From our perspective, we are encouraged by recent indications of moderate inflation, a low unemployment rate, and a rebound in manufacturing. We consequently believe the U.S. economy will weather this period of uncertainty.
As we communicated in proxy materials recently mailed to all Putnam fund shareholders, on February 1, 2007, Marsh & McLennan Companies, Inc. announced that it had signed a definitive agreement to sell its ownership interest in Putnam Investments Trust, the parent company of Putnam Management and its affiliates, to Great-West Lifeco Inc. Great-West Lifeco is a financial services holding company with operations in Canada, the United States, and Europe and is a member of the Power Financial Corporation group of companies. We are pleased to announce that in mid-May, shareholders voted overwhelmingly in favor of the proposed transaction. While it is still subject to regulatory approvals and other conditions, we currently expect the transaction to be completed this summer.
We would also like to take this opportunity to announce that Putnam President and Chief Executive Officer Ed Haldeman, one of your fund’s Trustees since 2004, has been named President of the Funds, assuming this role from George Putnam, III. This change will enable George Putnam to become an independent Trustee of the funds upon
2
completion of the transaction with Great-West Lifeco. Both George and Ed will continue serving on the Board of Trustees in our collective role of overseeing the Putnam funds on your behalf.
In the following pages, members of your fund’s management team discuss the fund’s performance and strategies for the fiscal period ended May 31, 2007, and provide their outlook for the months ahead. As always, we thank you for your support of the Putnam funds.

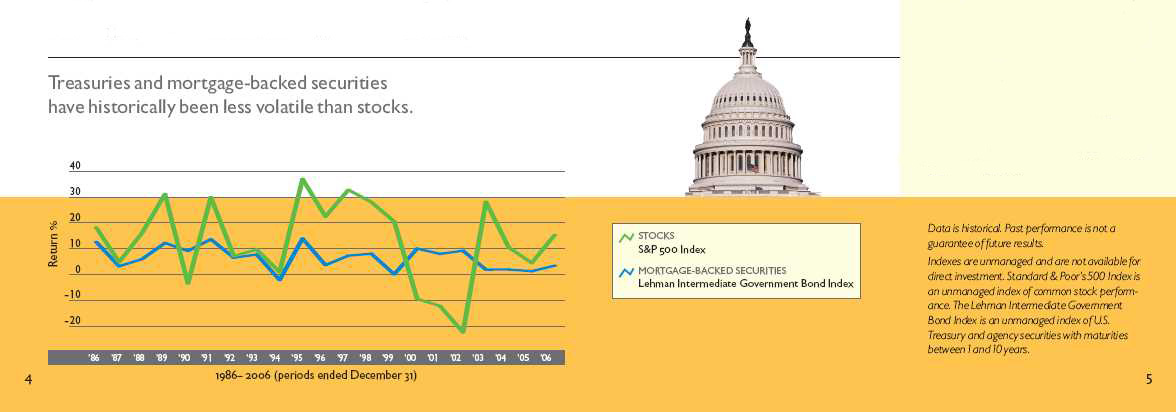
Putnam Limited Duration Government Income Fund:
investing in government and mortgage-backed securities

The U.S. government raises capital through the Bureau of the Public Debt. Every year, the Bureau holds more than 100 auctions for various government bonds (called Treasuries). U.S. Treasuries are considered a safe investment because they are backed by the full faith and credit of the federal government. For this very reason, however, Treasuries also tend to generate relatively low returns. In addition, they are not readily available to individual investors.
Putnam Limited Duration Government Income Fund is a convenient way for individuals to take advantage of the quality and relative stability of U.S. Treasuries while pursuing a higher level of income than would generally be available from Treasuries alone. The fund also invests in mortgage-backed securities (MBSs). MBSs represent a stake in the principal from and interest paid on a collection of mortgages. Most MBSs are created when government agencies, including Fannie Mae, Ginnie Mae, and Freddie Mac, buy mortgages from financial institutions and package them together by the thousands. These pools of mortgages act as collateral for the MBSs that agencies sell to financial entities, such as your fund. Because MBSs other than Ginnie Maes are not guaranteed directly by the U.S. government, and therefore carry a higher degree of risk than Treasury bonds, they also offer opportunities for higher returns.
By investing in high-quality Treasuries and MBSs as well as by limiting the fund’s duration, your fund’s management team seeks to maintain a relatively low risk profile. Duration is a measure of a fund’s sensitivity to changes in interest rates. Having a shorter- or limited-duration portfolio may help protect principal when interest rates are rising, but it can reduce the fund’s potential for appreciation when rates fall.
Putnam Limited Duration Government Income Fund pursues its income and capital preservation objectives by employing multiple income-generating strategies across government bond security types, and by carefully managing risks such as interest-rate risk.
Mutual funds that invest in government securities are not guaranteed. Mortgage-backed securities are subject to prepayment risk. Mutual funds that invest in bonds are subject to certain risks, including interest-rate risk, credit risk, and inflation risk. As interest rates rise, the prices of bonds fall. Long-term bonds are more exposed to interest-rate risk than short-term bonds. Unlike bonds, bond funds have ongoing fees and expenses. The use of derivatives involves special risks and may result in losses.
The ABCs of MBSs
MBSs (Mortgage-backed securities): MBSs are pools of mortgages used as collateral for issuing a security. These securities represent claims on the principal and interest payments made by the borrowers whose loans are in the pool.
Fannie Mae (Federal National Mortgage Association): Fannie Mae is a public company established by the U.S. government in 1938 to help make mortgage funds available to buyers. Fannie Mae does business with primary mortgage lenders (savings and loans, commercial banks, credit unions, and housing finance agencies).
Freddie Mac (Federal Home Loan Mortgage Corporation): Freddie Mac is another public company chartered by Congress to increase the funds available to mortgage financiers. Freddie Mac buys mortgages from primary lenders and develops MBSs that offer a guarantee on the payment of principal and interest.
Ginnie Mae (Government National Mortgage Association): Ginnie Mae is a government-owned corporation established in 1968 whose MBSs are backed by the full faith and credit of the U.S. government.
Performance snapshot
Putnam Limited Duration
Government Income Fund
Current performance may be lower or higher than the quoted past performance, which cannot guarantee future results. Share price, principal value, and return will fluctuate, and you may have a gain or a loss when you sell your shares. Performance of class A shares assumes reinvestment of distributions and does not account for taxes. Fund returns in bar chart do not reflect a sales charge. See pages 14-16 for additional performance information. For a portion of the periods, this fund may have limited expenses, without which returns would have been lower. A 1% short-term trading fee may apply. To obtain the most recent month-end performance, visit www.putnam.com.
* Returns for the six-month period are not annualized, but cumulative.
6
Report from the fund managers
The period in review
Your fund began the first half of its 2007 fiscal year, which ended May 31, 2007, in what we consider an anomalous interest-rate environment. Typically, longer-term interest rates are higher than shorter-term rates, to compensate investors for lending their money for longer periods of time. However, as the period began, long-term interest rates were actually slightly lower than short-and intermediate-term rates. In the final two months of the period, we saw a shift toward more normal conditions, as longer-term rates began to rise at a more rapid pace than shorter-term rates. This normalization occurred in response to data indicating that the U.S. economy remained strong and that the risk of inflation was growing. In particular, investor concerns about the growth-dampening effect of a slowdown in the housing market abated as consumer spending remained robust. Your fund was positioned to benefit from this transition, but did not perform as well during the unusual environment that characterized the first four months of the period. Consequently, its results for the period, before sales charges, were slightly behind those of its benchmark and the average for its peer group.
Market overview
Since August 2006, the Federal Reserve (the Fed) has held the federal funds rate — the benchmark rate for overnight loans between banks — steady at 5.25%, while indicating that future rate decisions will depend on whether it considers inflation or slower growth a greater risk to the economy. In March 2007, the Fed changed its bias from a tightening bias to a neutral bias, fueling a modest rally in the bond markets as more investors began to believe that the Fed’s next move might be to cut rates. Investors in this camp cited continued softening in the housing sector and a buildup of inventories across industries in the manufacturing sector in early 2007 to support their views.
However, the economic picture began to change in the final two months of
7
the period, as U.S. unemployment data remained low, income levels continued to rise, and inventory levels began to fall. The expected consequences of the softening housing market did not materialize: consumer spending remained strong and consumer confidence high. In addition, the robust health of the global economy appeared likely to eventually contribute to stronger economic growth in the United States. These factors caused yields to rise across the maturity spectrum during the final months of the semiannual period.
Strategy overview
We make two key strategic decisions in managing your fund. The first is to estimate the direction of interest rates based on factors such as economic indicators, Fed statements and strategy, and market sentiment. Based on these estimates, we then strive to position the portfolio to benefit from expected changes in interest rates and in the shape of the yield curve. The yield curve is a graphical representation of yields for bonds of comparable quality plotted from the shortest to the longest maturity. It typically slopes upward as maturity lengthens, though that “normal” state of the curve was not prevalent during most of the period, as we noted at the start of this report.
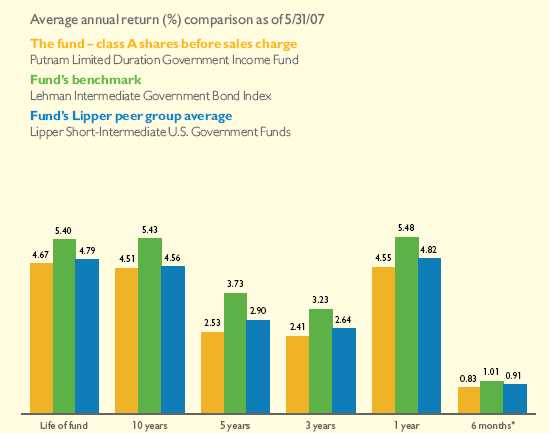
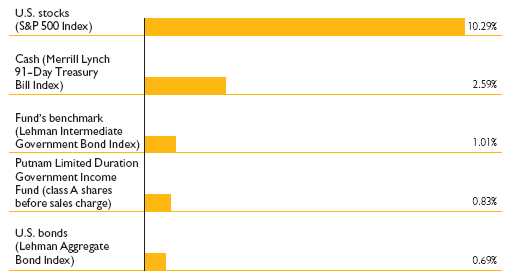
Market sector and fund performance
This comparison shows your fund’s performance in the context of different market sectors for the six months ended 5/31/07. See pages 6 and 14 for additional fund performance information. Index definitions can be found on page 25.
8
Our second major decision is to allocate portfolio holdings by market sector. We assess the relative attractiveness not only of sectors included in the benchmark (U.S. Treasuries and agencies) but also of sectors that are not in the benchmark but that are allowable investments within fund guidelines, such as mortgage-backed securities (MBSs).
In addition, we make several strategic decisions related specifically to MBSs. We evaluate the relative appeal of pass-through securities issued by the Government National Mortgage Association (known as Ginnie Maes), the Federal National Mortgage Association (Fannie Maes), and the Federal Home Loan Mortgage Corporation (Freddie Macs). We also consider the maturity (e.g., 30-year, 15-year, or adjustable-rate), coupon level (e.g., 5.5%, 6.5%, 7%), and seasoning (length of time in the market) of these securities in order to determine what we believe are the best risk/return trade-offs for the portfolio.
Your fund’s holdings
During the period, fund performance was driven primarily by our macro strategies — those that involve anticipating the direction of interest rates and the shape of the yield curve. These strategies, in turn, reflect our views on the economy and our expectations of how the bond market will respond to changing economic conditions.
As noted earlier, at the beginning of the period, the yield curve was inverted.
Comparison of the fund’s maturity and duration
This chart compares changes in the fund’s average effective maturity (a weighted average of
the holdings’ maturities) and its average effective duration (a measure of its sensitivity to
interest-rate changes).
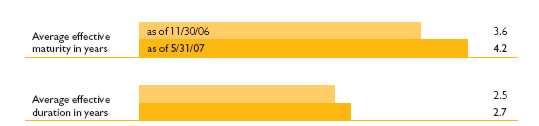
Average effective duration and average effective maturity take into account put and call features, where applicable, and reflect prepayments for mortgage-backed securities. Duration is usually shorter than maturity because it reflects interest payments on a bond prior to its maturity.
9
Short- and intermediate-term rates were slightly higher than long-term rates, so the curve sloped downward rather than upward. Strong demand for longer-term securities, which helped to keep yields on these bonds low, may have been one factor contributing to this unusual environment. In addition, the Fed’s aggressive increases to short-term rates through August 2006 may have been slightly greater than what the market considered necessary. As 2007 began, many investors believed that the Fed’s next move would be to cut interest rates. These expectations helped to drive rates lower in the early months of this year.
We held a different view, however. We believed that interest rates would eventually rise and that the relationship between rates would normalize (i.e., longer-term rates would return to being higher than shorter-term rates). This view was based primarily on the strength of the global economy and our expectation that eventually the inflationary pressures being felt by all of the other regions of the world would find their way to the United States. In line with this view, we kept the fund’s duration profile slightly shorter than that of its benchmark, and we had positioned the fund to benefit from yield curve steepening. Steepening refers to the widening of the difference in yield, which may occur as a result of a rise in yields of longer-term securities; a fall in yields of shorter-term securities; or a
Portfolio composition comparison
This chart shows how the fund’s weightings have changed over the last six months. Weightings are shown as a percentage of net assets. Holdings will vary over time. A portion of the short-term investments reflects the amount used to settle TBA (“to be announced”) purchase commitments, which are described in detail in the footnotes to the financial statements.
10
difference in the rate of a simultaneous rise or fall in the yields of longer- and shorter-term securities. During the first four months of the period, this positioning detracted from relative results versus your fund’s benchmark and peer group, as interest rates were still on the decline. Ultimately, though, rates rose, the yield curve began to steepen, and our duration and yield curve strategies contributed positively to performance.
In terms of sector allocations, we have cautiously underweighted many sectors relative to the benchmark index, given that risk premiums are just beginning to creep back into non-Treasury sectors. Typically, bond investors are rewarded for taking risk with higher yields. When these yields are compared to the yields of Treasury bonds, which are considered relatively risk free, the difference in yield is known as the yield spread or risk premium. The wider the spread, usually the higher the relative risk presented by that security. Wider spreads generally also present more opportunities for relative value fixed-income investors like Putnam to take advantage of inefficiently priced risk. Over the past several years, the relatively benign environment for financial assets, as well as investor demand for yield and willingness to take risk, has resulted in compressed spreads. This meant that investors’ reward for taking on additional risk was diminished. In many cases, we b elieved that the additional risk was not worth the nominal spread. Therefore, the fund’s investments outside of Treasuries have remained smaller than usual. However, we expect to increase these exposures as yields rise and risk premiums increase, which should create opportunities to take advantage of mispriced risk again.
In the meantime, we have maintained an underweight position in agency securities, reflecting our belief that comparable risk/reward potential could be obtained in the mortgage-backed securities (MBS) market at more attractive prices. The fund’s MBSs exposure is also currently lower than our usual allocation, but is still greater than that of the fund’s benchmark. We had reduced the allocation to these securities before the beginning of the fiscal year because we believed that their valuations had become too high.
Within the fund’s MBS holdings, we have moderated our view regarding Fannie Maes over Ginnie Maes and Freddie Macs, a strategy that proved advantageous over the period. Earlier in the year, Ginnie Maes were supported by strong demand from Asia which drove valuation levels to very high levels. Since this demand has abated, valuation levels have returned to normal. The market for Fannie Maes continues to be larger and more liquid than markets for Ginnie Maes and Freddie Macs, which helps facilitate transactions.
The portfolio’s emphasis on shorter-maturity MBSs (specifically, 15-year securities versus 30-year) benefited performance late in the period. We also continued to favor older, more seasoned securities, a positioning that was especially beneficial with regard to the
11
fund’s re-performing mortgage holdings. These securities are repackaged mortgages that had previously incurred a default; payment of principal and interest for these mortgages is now guaranteed by Fannie Mae. Re-performing mortgages are notable for their lack of volatility stemming from prepayments.
During the period, our emphasis on lower-coupon rather than premium-coupon MBSs detracted from performance. Premium-coupon securities have coupons higher than current market rates, whereas current-coupon securities, as their name indicates, reflect current rates. Because domestic banks purchased mortgages in large volume, riskier premium-coupon mortgages outperformed.
Please note that the holdings discussed in this report may not have been held by the fund for the entire period. Portfolio composition is subject to review in accordance with the fund’s investment strategy and may vary in the future.
Of special interest
Merger with Putnam U.S. Government Income Trust proposed
The fund’s Trustees have approved the merger of your fund into Putnam U.S. Government Income Trust, another open-end U.S. government securities fund whose objectives, strategy, and investments are similar to those of your fund. The proposed merger is expected to result in lower expenses for shareholders of your fund due to the larger asset base of the combined fund.
A prospectus/proxy statement containing more information about the proposed merger is expected to be sent to shareholders of your fund in the coming months. Completion of the merger is subject to a number of conditions, including approval by shareholders of your fund at a shareholder meeting.
This report is not an offer to sell, nor a solicitation of an offer to buy, shares of any fund, nor is it a solicitation of a proxy. To receive a free copy of the prospectus/proxy statement relating to the proposed merger (which contains important information about fees, expenses, and risk considerations) after a registration statement has been filed with the SEC and becomes effective, please call 1-800-225-1581. The prospectus/proxy statement will also be available without charge on the SEC’s Web site (www.sec.gov). Read the prospectus/proxy statement carefully before making any investment decisions.
12
The outlook for your fund
The following commentary reflects anticipated developments that could affect your fund over the next six months, as well as your management team’s plans for responding to them. Please note that, as described on page 12, the Trustees of your fund have proposed a merger of your fund into Putnam U.S. Government Income Trust, which, if approved by shareholders of your fund, is expected to occur as soon as practicable thereafter.
Putnam believes that the economic environment may pose some challenges for fixed-income markets in the months ahead. Bond investors are frequently leery of strong economic growth, because it is often accompanied by inflation that erodes the purchasing power of fixed-income investments. The continued strength of global economic growth is providing a buoyantly supportive environment for economic activity in the United States. U.S. inflation has persistently hovered above the Fed’s target ceiling. Without the emergence of a stumbling block to the domestic economy, such as a severe housing-related credit crunch, we believe U.S. rates will likely continue the climb we have seen over the past two months. We consider market volatility likely to continue to rise as well, as the market has entered a period of transition. We are also monitoring inflation numbers closely, as we believe the risks of higher inflation in the fourth quarter of 2007 are elevated.
Accordingly, we expect to continue positioning the fund conservatively. To minimize exposure to fluctuating rates, we are keeping duration neutral to slightly short, relative to the benchmark and peer group. Although we continue to watch for opportunities outside of the Treasury markets, yield spreads between Treasuries and other types of U.S. government securities of comparable maturity have narrowed to levels that, in our view, do not adequately compensate investors for higher risks of investing in these other securities. Therefore, rather than emphasizing sector allocation or security selection, we plan to continue to focus on macro strategies — those related to interest-rate movement or yield-curve positioning — to achieve the fund’s income and capital preservation objectives without taking undue risk.
The views expressed in this report are exclusively those of Putnam Management. They are not meant as investment advice.
Mutual funds that invest in government securities are not guaranteed. Mortgage-backed securities are subject to prepayment risk. Mutual funds that invest in bonds are subject to certain risks, including interest-rate risk, credit risk, and inflation risk. As interest rates rise, the prices of bonds fall. Long-term bonds are more exposed to interest-rate risk than short-term bonds. Unlike bonds, bond funds have ongoing fees and expenses. The use of derivatives involves special risks and may result in losses.
13
Your fund’s performance
This section shows your fund’s performance for periods ended May 31, 2007, the end of the first half of its current fiscal year. In accordance with regulatory requirements for mutual funds, we also include performance as of the most recent calendar quarter-end and expense information taken from the fund’s current prospectus. Performance should always be considered in light of a fund’s investment strategy. Data represents past performance. Past performance does not guarantee future results. More recent returns may be less or more than those shown. Investment return and principal value will fluctuate, and you may have a gain or a loss when you sell your shares. For the most recent month-end performance, please visit www.putnam.com or call Putnam at 1-800-225-1581. Class Y shares are generally only available to corporate and institutional clients and clients in other approved programs. See the Terms and Definitions section in this report for definitions of the share classes offered by your fund.
Fund performance
Total return for periods ended 5/31/07
| Class A | Class B | Class C | Class M | Class R | Class Y | ||||||
| (inception dates) | (2/16/93) | (2/16/93) | (7/26/99) | (4/3/95) | (12/1/03) | (10/1/97) | |||||
| NAV | POP | NAV | CDSC | NAV | CDSC | NAV | POP | NAV | NAV | ||
| Annual average | |||||||||||
| (life of fund) | 4.67% | 4.43% | 4.07% | 4.07% | 3.85% | 3.85% | 4.54% | 4.40% | 4.42% | 4.85% | |
| 10 years | 55.50 | 50.51 | 46.64 | 46.64 | 43.74 | 43.74 | 53.59 | 50.46 | 51.58 | 59.38 | |
| Annual average | 4.51 | 4.17 | 3.90 | 3.90 | 3.69 | 3.69 | 4.38 | 4.17 | 4.25 | 4.77 | |
| 5 years | 13.31 | 9.62 | 10.12 | 10.12 | 9.11 | 9.11 | 12.81 | 10.66 | 11.93 | 14.97 | |
| Annual average | 2.53 | 1.85 | 1.95 | 1.95 | 1.76 | 1.76 | 2.44 | 2.05 | 2.28 | 2.83 | |
| 3 years | 7.39 | 3.93 | 5.66 | 3.71 | 5.01 | 5.01 | 7.07 | 5.02 | 6.58 | 8.41 | |
| Annual average | 2.41 | 1.29 | 1.85 | 1.22 | 1.64 | 1.64 | 2.30 | 1.65 | 2.15 | 2.73 | |
| 1 year | 4.55 | 1.08 | 4.12 | 1.12 | 3.78 | 2.78 | 4.59 | 2.52 | 4.29 | 5.03 | |
| 6 months | 0.83 | –2.47 | 0.52 | –2.45 | 0.45 | –0.54 | 0.75 | –1.21 | 0.70 | 0.95 | |
Current performance may be lower or higher than the quoted past performance, which cannot guarantee future results. After sales charge returns (public offering price, or POP) for class A and M shares reflect a maximum 3.25% and 2.00% load, respectively. Class B share returns reflect the applicable contingent deferred sales charge (CDSC), which is 3% in the first year, declining to 1% in the fourth year, and is eliminated thereafter. Class C shares reflect a 1% CDSC for the first year and is eliminated thereafter. Class R and Y shares have no initial sales charge or CDSC. Performance for class C, M, R, and Y shares before their inception is derived from the historical performance of class A shares, adjusted for the applicable sales charge (or CDSC) and, except for class Y shares, the higher operating expenses for such shares.
For a portion of the periods, this fund may have limited expenses, without which returns would have been lower.
A 1% short-term trading fee may be applied to shares exchanged or sold within 7 days of purchase.
14
Comparative index returns
For periods ended 5/31/07
| Lehman | Lipper Short- | |
| Intermediate | Intermediate U.S. | |
| Government | Government Funds | |
| Bond Index | category average* | |
| Annual average | ||
| (life of fund) | 5.40% | 4.79% |
| 10 years | 69.62 | 56.30 |
| Annual average | 5.43 | 4.56 |
| 5 years | 20.10 | 15.42 |
| Annual average | 3.73 | 2.90 |
| 3 years | 10.00 | 8.13 |
| Annual average | 3.23 | 2.64 |
| 1 year | 5.48 | 4.82 |
| 6 months | 1.01 | 0.91 |
Index and Lipper results should be compared to fund performance at net asset value.
* Over the 6-month, 1-year, 3-year, 5-year, 10-year, and life-of-fund periods ended 5/31/07, there were 71, 71, 68, 59, 49, and 21 funds, respectively, in this Lipper category.
Fund performance as of most recent calendar quarter
Total return for periods ended 6/30/07
| Class A | Class B | Class C | Class M | Class R | Class Y | ||||||
| (inception dates) | (2/16/93) | (2/16/93) | (7/26/99) | (4/3/95) | (12/1/03) | (10/1/97) | |||||
| NAV | POP | NAV | CDSC | NAV | CDSC | NAV | POP | NAV | NAV | ||
| Annual average | |||||||||||
| (life of fund) | 4.67% | 4.43% | 4.07% | 4.07% | 3.85% | 3.85% | 4.53% | 4.38% | 4.42% | 4.84% | |
| 10 years | 54.69 | 49.71 | 46.14 | 46.14 | 42.92 | 42.92 | 52.47 | 49.37 | 50.74 | 58.27 | |
| Annual average | 4.46 | 4.12 | 3.87 | 3.87 | 3.64 | 3.64 | 4.31 | 4.09 | 4.19 | 4.70 | |
| 5 years | 12.85 | 9.19 | 9.65 | 9.65 | 8.68 | 8.68 | 12.12 | 10.02 | 11.46 | 14.27 | |
| Annual average | 2.45 | 1.77 | 1.86 | 1.86 | 1.68 | 1.68 | 2.31 | 1.93 | 2.19 | 2.70 | |
| 3 years | 7.43 | 3.97 | 5.68 | 3.73 | 5.04 | 5.04 | 6.88 | 4.86 | 6.61 | 8.23 | |
| Annual average | 2.42 | 1.31 | 1.86 | 1.23 | 1.65 | 1.65 | 2.24 | 1.59 | 2.16 | 2.67 | |
| 1 year | 5.06 | 1.55 | 4.41 | 1.41 | 4.27 | 3.27 | 4.66 | 2.58 | 4.79 | 5.32 | |
| 6 months | 1.44 | –1.90 | 1.32 | –1.67 | 1.06 | 0.06 | 1.35 | –0.64 | 1.51 | 1.56 | |
15
| Fund price and distribution information | ||||||||
| For the six-month period ended 5/31/07 | ||||||||
| Distributions* | Class A | Class B | Class C | Class M | Class R | Class Y | ||
| Number | 6 | 6 | 6 | 6 | 6 | 6 | ||
| Income | $0.101056 | $0.085968 | $0.082304 | $0.097250 | $0.094806 | $0.107268 | ||
| Capital gains | — | — | — | — | — | — | ||
| Total | $0.101056 | $0.085968 | $0.082304 | $0.097250 | $0.094806 | $0.107268 | ||
| Share value: | NAV | POP | NAV | NAV | NAV | POP | NAV | NAV |
| 11/30/06 | $5.03 | $5.20 | $5.05 | $5.03 | $5.06 | $5.16 | $5.03 | $5.03 |
| 5/31/07 | 4.97 | 5.14 | 4.99 | 4.97 | 5.00 | 5.10 | 4.97 | 4.97 |
| Current yield | ||||||||
| (end of period) | ||||||||
| Current | ||||||||
| dividend rate1 | 4.06% | 3.93% | 3.44% | 3.31% | 3.89% | 3.81% | 3.81% | 4.31% |
| Current 30-day | ||||||||
| SEC yield2,3 | ||||||||
| (with expense | ||||||||
| limitation) | 4.15 | 4.01 | 3.54 | 3.39 | 3.99 | 3.91 | 3.91 | 4.40 |
| Current 30-day | ||||||||
| SEC yield3 | ||||||||
| (without | ||||||||
| expense | ||||||||
| limitation) | 4.06 | 3.91 | 3.45 | 3.30 | 3.90 | 3.83 | 3.82 | 4.31 |
* Dividend sources are estimated and may vary based on final tax calculations after the fund's fiscal year-end.
1 Most recent distribution, excluding capital gains, annualized and divided by NAV or POP at end of period.
2 For a portion of the period, this fund may have limited expenses, without which yields would have been lower.
3 Based only on investment income, calculated using SEC guidelines.
Fund’s annual operating expenses
For the fiscal year ended 11/30/06
| Class A | Class B | Class C | Class M | Class R | Class Y | ||
| Net expenses* | 1.02% | 1.62% | 1.77% | 1.17% | 1.27% | 0.77% | |
| Total annual fund | |||||||
| operating expenses | 1.04 | 1.64 | 1.79 | 1.19 | 1.29 | 0.79 | |
* Reflects Putnam Management’s decision to contractually limit expenses through 11/30/07.
Expense information in this table is taken from the most recent prospectus, is subject to change, and may differ from that shown in the next section and in the financial highlights of this report. Expenses are shown as a percentage of average net assets.
16
Your fund’s expenses
As a mutual fund investor, you pay ongoing expenses, such as management fees, distribution fees (12b-1 fees), and other expenses. In the most recent six-month period, your fund limited these expenses; had it not done so, expenses would have been higher. Using the information below, you can estimate how these expenses affect your investment and compare them with the expenses of other funds. You may also pay one-time transaction expenses, including sales charges (loads) and redemption fees, which are not shown in this section and would have resulted in higher total expenses. For more information, see your fund’s prospectus or talk to your financial advisor.
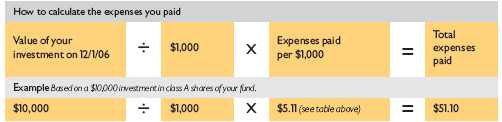
Review your fund’s expenses
The table below shows the expenses you would have paid on a $1,000 investment in Putnam Limited Duration Government Income Fund from December 1, 2006, to May 31, 2007. It also shows how much a $1,000 investment would be worth at the close of the period, assuming actual returns and expenses.
| Class A | Class B | Class C | Class M | Class R | Class Y | |
| Expenses paid per $1,000* | $ 5.11 | $ 8.10 | $ 8.85 | $ 5.86 | $ 6.35 | $ 3.86 |
| Ending value (after expenses) | $1,008.30 | $1,005.20 | $1,004.50 | $1,007.50 | $1,007.00 | $1,009.50 |
* Expenses for each share class are calculated using the fund’s annualized expense ratio for each class, which represents the ongoing expenses as a percentage of average net assets for the six months ended 5/31/07. The expense ratio may differ for each share class (see the last table in this section). Expenses are calculated by multiplying the expense ratio by the average account value for the period; then multiplying the result by the number of days in the period; and then dividing that result by the number of days in the year.
Estimate the expenses you paid
To estimate the ongoing expenses you paid for the six months ended May 31, 2007, use the calculation method below. To find the value of your investment on December 1, 2006, go to www.putnam.com and log on to your account. Click on the “Transaction History” tab in your Daily Statement and enter 12/01/2006 in both the “from” and “to” fields. Alternatively, call Putnam at 1-800-225-1581.
17
Compare expenses using the SEC’s method
The Securities and Exchange Commission (SEC) has established guidelines to help investors assess fund expenses. Per these guidelines, the table below shows your fund’s expenses based on a $1,000 investment, assuming a hypothetical 5% annualized return. You can use this information to compare the ongoing expenses (but not transaction expenses or total costs) of investing in the fund with those of other funds. All mutual fund shareholder reports will provide this information to help you make this comparison. Please note that you cannot use this information to estimate your actual ending account balance and expenses paid during the period.
| Class A | Class B | Class C | Class M | Class R | Class Y | |
| Expenses paid per $1,000* | $ 5.14 | $ 8.15 | $ 8.90 | $ 5.89 | $ 6.39 | $ 3.88 |
| Ending value (after expenses) | $1,019.85 | $1,016.85 | $1,016.11 | $1,019.10 | $1,018.60 | $1,021.09 |
* Expenses for each share class are calculated using the fund’s annualized expense ratio for each class, which represents the ongoing expenses as a percentage of average net assets for the six months ended 5/31/07. The expense ratio may differ for each share class (see the last table in this section). Expenses are calculated by multiplying the expense ratio by the average account value for the period; then multiplying the result by the number of days in the period; and then dividing that result by the number of days in the year.
Compare expenses using industry averages
You can also compare your fund’s expenses with the average of its peer group, as defined by Lipper, an independent fund-rating agency that ranks funds relative to others that Lipper considers to have similar investment styles or objectives. The expense ratio for each share class shown below indicates how much of your fund’s average net assets have been used to pay ongoing expenses during the period.
| Class A | Class B | Class C | Class M | Class R | Class Y | |
| Your fund’s annualized | ||||||
| expense ratio | 1.02% | 1.62% | 1.77% | 1.17% | 1.27% | 0.77% |
| Average annualized expense | ||||||
| ratio for Lipper peer group* | 1.02% | 1.62% | 1.77% | 1.17% | 1.27% | 0.77% |
* Putnam is committed to keeping fund expenses below the Lipper peer group average expense ratio and will limit our fund expenses if they exceed the Lipper average. The Lipper average is a simple average of front-end load funds in the peer group that excludes 12b-1 fees as well as any expense offset and brokerage service arrangements that may reduce fund expenses. To facilitate the comparison in this presentation, Putnam has adjusted the Lipper average to reflect the 12b-1 fees carried by each class of shares other than class Y shares, which do not incur 12b-1 fees. Investors should note that the other funds in the peer group may be significantly smaller or larger than the fund, and that an asset-weighted average would likely be lower than the simple average. Also, the fund and Lipper report expense data at different times and for different periods. The fund’s expense ratio shown here is annualized data for the most recent six-month period, while the quarterly updated Lipper average is based on the most recent fiscal year-end data available for the peer group funds as of 3/31/07.
18
Your fund’s
portfolio turnover
Putnam funds are actively managed by teams of experts who buy and sell securities based on intensive analysis of companies, industries, economies, and markets. Portfolio turnover is a measure of how often a fund’s managers buy and sell securities for your fund. A portfolio turnover of 100%, for example, means that the managers sold and replaced securities valued at 100% of a fund’s assets within a one-year period. Funds with high turnover may be more likely to generate capital gains and dividends that must be distributed to shareholders as taxable income. High turnover may also cause a fund to pay more brokerage commissions and other transaction costs, which may detract from performance.
Funds that invest in bonds or other fixed-income instruments may have higher turnover than funds that invest only in stocks. Short-term bond funds tend to have higher turnover than longer-term bond funds, because shorter-term bonds will mature or be sold more frequently than longer-term bonds. You can use the table below to compare your fund’s turnover with the average turnover for funds in its Lipper category.
Turnover comparisons
Percentage of holdings that change every year
| 2006 | 2005 | 2004 | 2003 | 2002 | |
| Putnam Limited Duration | |||||
| Government Income Fund | 158%* | 389%* | 263% | 509%† | 539%† |
| Lipper Short-Intermediate | |||||
| U.S. Government Funds | |||||
| category average | 148% | 124% | 130% | 166% | 145% |
* Portfolio turnover excludes dollar roll transactions.
† Portfolio turnover excludes certain Treasury note transactions executed in connection with a short-term trading strategy.
Turnover data for the fund is calculated based on the fund’s fiscal-year period, which ends on November 30. Turnover data for the fund’s Lipper category is calculated based on the average of the turnover of each fund in the category for its fiscal year ended during the indicated year. Fiscal years vary across funds in the Lipper category, which may limit the comparability of the fund’s portfolio turnover rate to the Lipper average. Comparative data for 2006 is based on information available as of 12/31/06.
19
Your fund’s risk
This risk comparison is designed to help you understand how your fund compares with other funds. The comparison utilizes a risk measure developed by Morningstar, an independent fund-rating agency. This risk measure is referred to as the fund’s Morningstar Risk.
Your fund’s Morningstar® Risk
Your fund’s Morningstar Risk is shown alongside that of the average fund in its Morningstar category. The risk bar broadens the comparison by translating the fund’s Morningstar Risk into a percentile, which is based on the fund’s ranking among all funds rated by Morningstar as of June 30, 2007. A higher Morningstar Risk generally indicates that a fund’s monthly returns have varied more widely.
Morningstar determines a fund’s Morningstar Risk by assessing variations in the fund’s monthly returns — with an emphasis on downside variations — over a 3-year period, if available. Those measures are weighted and averaged to produce the fund’s Morningstar Risk. The information shown is provided for the fund’s class A shares only; information for other classes may vary. Morningstar Risk is based on historical data and does not indicate future results. Morningstar does not purport to measure the risk associated with a current investment in a fund, either on an absolute basis or on a relative basis. Low Morningstar Risk does not mean that you cannot lose money on an investment in a fund. Copyright 2007 Morningstar, Inc. All Rights Reserved. The information contained herein (1) is proprietary to Morningstar and/or its content providers; (2) may not be copied or distributed; and (3) is not warranted to be accurate, complete, or timely. Neither Morningstar nor its content providers are responsible for any damages or losses arising from any use of this information.
20
Your fund’s management
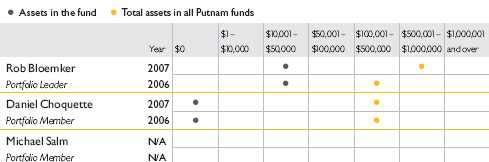
Your fund is managed by the members of the Putnam Core Fixed-Income Team. Rob Bloemker is the Portfolio Leader of the fund. Daniel Choquette and Michael Salm are Portfolio Members. The Portfolio Leader and Portfolio Members coordinate the team’s management of the fund.
For a complete listing of the members of the Putnam Core Fixed-Income Team, including those who are not Portfolio Leaders or Portfolio Members of your fund, visit Putnam’s Individual Investor Web site at www.putnam.com.
Investment team fund ownership
The table below shows how much the fund’s current Portfolio Leader and Portfolio Members have invested in the fund and in all Putnam mutual funds (in dollar ranges). Information shown is as of May 31, 2007, and May 31, 2006.
Trustee and Putnam employee fund ownership
As of May 31, 2007, all of the Trustees of the Putnam funds owned fund shares. The table below shows the approximate value of investments in the fund and all Putnam funds as of that date by the Trustees and Putnam employees. These amounts include investments by the Trustees’ and employees’ immediate family members and investments through retirement and deferred compensation plans.
| Total assets in | ||
| Assets in the fund | all Putnam funds | |
| Trustees | $ 71,000 | $ 96,000,000 |
| Putnam employees | $992,000 | $476,000,000 |
21
Fund manager compensation
The total 2006 fund manager compensation that is attributable to your fund is approximately $270,000. This amount includes a portion of 2006 compensation paid by Putnam Management to the fund managers listed in this section for their portfolio management responsibilities, calculated based on the fund assets they manage taken as a percentage of the total assets they manage. The compensation amount also includes a portion of the 2006 compensation paid to the Chief Investment Officer of the team and the Group Chief Investment Officer of the fund’s broader investment category for their oversight responsibilities, calculated based on the fund assets they oversee taken as a percentage of the total assets they oversee. This amount does not include compensation attributable to research, trading, administration, executive oversight, systems, compliance, or fund operations functions; nor does it include non-compensation costs. These percentages are determined as of the f und’s fiscal period-end. For personnel who joined Putnam Management during or after 2006, the calculation reflects annualized 2006 compensation or an estimate of 2007 compensation, as applicable.
Other Putnam funds managed by the Portfolio Leader and Portfolio Members
Rob Bloemker is also a Portfolio Leader of Putnam American Government Income Fund, Putnam Income Fund, and Putnam U.S. Government Income Trust. He is also a Portfolio Member of Putnam Diversified Income Trust and Putnam Master Intermediate Income Trust.
Daniel Choquette is also a Portfolio Member of Putnam American Government Income Fund and Putnam U.S. Government Income Trust.
Michael Salm is also a Portfolio Member of Putnam American Government Income Fund, Putnam Global Income Trust, Putnam Income Fund, and Putnam U.S. Government Income Trust.
Rob Bloemker, Daniel Choquette, and Michael Salm may also manage other accounts and variable trust funds advised by Putnam Management or an affiliate.
Changes in your fund’s Portfolio Leader and Portfolio Members
Your fund’s Portfolio Leader and Portfolio Members did not change during the year ended May 31, 2007.
Following the close of the period, Portfolio Member Rob Bloemker became the Portfolio Leader and Michael Salm became a Portfolio Member of your fund. These changes followed the departure of Portfolio Leader Kevin Cronin from your fund’s management team, although he continues in other senior management roles at Putnam.
22
Putnam fund ownership by Putnam’s Executive Board
The table below shows how much the members of Putnam’s Executive Board have invested in all Putnam mutual funds (in dollar ranges). Information shown is as of May 31, 2007, and May 31, 2006.
| $1 – | $10,001 – | $50,001 – | $100,001 – | $500,001 – | $1,000,001 | ||||
| Year | $0 | $10,000 | $50,000 | $100,000 | $500,000 | $1,000,000 | and over | ||
| Philippe Bibi | 2007 | • | |||||||
| Chief Technology Officer | 2006 | • | |||||||
| Joshua Brooks | 2007 | • | |||||||
| Deputy Head of Investments | 2006 | • | |||||||
| William Connolly | 2007 | • | |||||||
| Head of Retail Management | 2006 | • | |||||||
| Kevin Cronin | 2007 | • | |||||||
| Head of Investments | 2006 | • | |||||||
| Charles Haldeman, Jr. | 2007 | • | |||||||
| President and CEO | 2006 | • | |||||||
| Amrit Kanwal | 2007 | • | |||||||
| Chief Financial Officer | 2006 | • | |||||||
| Steven Krichmar | 2007 | • | |||||||
| Chief of Operations | 2006 | • | |||||||
| Francis McNamara, III | 2007 | • | |||||||
| General Counsel | 2006 | • | |||||||
| Jeffrey Peters | 2007 | • | |||||||
| Head of International Business | N/A | ||||||||
| Richard Robie, III | 2007 | • | |||||||
| Chief Administrative Officer | 2006 | • | |||||||
| Edward Shadek | 2007 | • | |||||||
| Deputy Head of Investments | 2006 | • | |||||||
| Sandra Whiston | 2007 | • | |||||||
| Head of Institutional Management | 2006 | • | |||||||
| N/A indicates the individual was not a member of Putnam’s Executive Board as of 5/31/06. | |||||||||
23
Terms and definitions
Important terms
Total return shows how the value of the fund’s shares changed over time, assuming you held the shares through the entire period and reinvested all distributions in the fund.
Net asset value (NAV) is the price, or value, of one share of a mutual fund, without a sales charge. NAVs fluctuate with market conditions. NAV is calculated by dividing the net assets of each class of shares by the number of outstanding shares in the class.
Public offering price (POP) is the price of a mutual fund share plus the maximum sales charge levied at the time of purchase. POP performance figures shown here assume the 3.25% maximum sales charge for class A shares and 2.00% for class M shares.
Contingent deferred sales charge (CDSC) is generally a charge applied at the time of the redemption of class B or C shares and assumes redemption at the end of the period. Your fund’s class B CDSC declines from a 3% maximum during the first year to 1% during the fourth year. After the fourth year, the CDSC no longer applies. The CDSC for class C shares is 1% for one year after purchase.
Share classes
Class A shares are generally subject to an initial sales charge and no CDSC (except on certain redemptions of shares bought without an initial sales charge).
Class B shares are not subject to an initial sales charge. They may be subject to a CDSC.
Class C shares are not subject to an initial sales charge and are subject to a CDSC only if the shares are redeemed during the first year.
Class M shares have a lower initial sales charge and a higher 12b-1 fee than class A shares and no CDSC (except on certain redemptions of shares bought without an initial sales charge).
Class R shares are not subject to an initial sales charge or CDSC and are available only to certain defined contribution plans.
Class Y shares are not subject to an initial sales charge or CDSC, and carry no 12b-1 fee. They are only available to eligible purchasers, including eligible defined contribution plans or corporate IRAs.
24
Comparative indexes
Lehman Aggregate Bond Index is an unmanaged index of U.S. investment-grade fixed-income securities.
Lehman Intermediate Government Bond Index is an unmanaged index of U.S. Treasury and agency securities with maturities between 1 and 10 years.
Merrill Lynch 91-Day Treasury Bill Index is an unmanaged index that seeks to measure the performance of U.S. Treasury bills available in the marketplace.
S&P 500 Index is an unmanaged index of common stock performance.
Indexes assume reinvestment of all distributions and do not account for fees. Securities and performance of a fund and an index will differ. You cannot invest directly in an index.
Lipper is a third-party industry-ranking entity that ranks mutual funds. Its rankings do not reflect sales charges. Lipper rankings are based on total return at net asset value relative to other funds that have similar current investment styles or objectives as determined by Lipper. Lipper may change a fund’s category assignment at its discretion. Lipper category averages reflect performance trends for funds within a category.
25
Trustee approval of
management contract
General conclusions
The Board of Trustees of the Putnam funds oversees the management of each fund and, as required by law, determines annually whether to approve the continuance of your fund’s management contract with Putnam Management. In this regard, the Board of Trustees, with the assistance of its Contract Committee consisting solely of Trustees who are not “interested persons” (as such term is defined in the Investment Company Act of 1940, as amended) of the Putnam funds (the “Independent Trustees”), requests and evaluates all information it deems reasonably necessary under the circumstances. Over the course of several months ending in June 2006, the Contract Committee met four times to consider the information provided by Putnam Management and other information developed with the assistance of the Board’s independent counsel and independent staff. The Contract Committee reviewed and discussed key aspects of this information with all of the Independe nt Trustees. Upon completion of this review, the Contract Committee recommended, and the Independent Trustees approved, the continuance of your fund’s management contract, effective July 1, 2006.
This approval was based on the following conclusions:
• That the fee schedule in effect for your fund represented reasonable compensation in light of the nature and quality of the services being provided to the fund, the fees paid by competitive funds and the costs incurred by Putnam Management in providing such services, and
• That such fee schedule represented an appropriate sharing between fund shareholders and Putnam Management of such economies of scale as may exist in the management of the fund at current asset levels.
These conclusions were based on a comprehensive consideration of all information provided to the Trustees and were not the result of any single factor. Some of the factors that figured particularly in the Trustees’ deliberations and how the Trustees considered these factors are described below, although individual Trustees may have evaluated the information presented differently, giving different weights to various factors. It is also important to recognize that the fee arrangements for your fund and the other Putnam funds are the result of many years of review and discussion between the Independent Trustees and Putnam Management, that certain aspects of such arrangements may receive greater scrutiny in some years than others, and that the Trustees’ conclusions may be based, in part, on their consideration of these same arrangements in prior years.
26
Management fee schedules and categories; total expenses
The Trustees reviewed the management fee schedules in effect for all Putnam funds, including fee levels and breakpoints, and the assignment of funds to particular fee categories. In reviewing fees and expenses, the Trustees generally focused their attention on material changes in circumstances — for example, changes in a fund’s size or investment style, changes in Putnam Management’s operating costs, or changes in competitive practices in the mutual fund industry — that suggest that consideration of fee changes might be warranted. The Trustees concluded that the circumstances did not warrant changes to the management fee structure of your fund, which had been carefully developed over the years, re-examined on many occasions and adjusted where appropriate. The Trustees focused on two areas of particular interest, as discussed further below:
• Competitiveness. The Trustees reviewed comparative fee and expense information for competitive funds, which indicated that, in a custom peer group of competitive funds selected by Lipper Inc., your fund ranked in the 56th percentile in management fees and in the 69th percentile in total expenses (less any applicable 12b-1 fees) as of December 31, 2005 (the first percentile being the least expensive funds and the 100th percentile being the most expensive funds). (Because the fund’s custom peer group is smaller than the fund’s broad Lipper Inc. peer group, this expense information may differ from the Lipper peer expense information found elsewhere in this report.) The Trustees noted that expense ratios for a number of Putnam funds, which show the percentage of fund assets used to pay for management and administrative services, distributio n (12b-1) fees and other expenses, had been increasing recently as a result of declining net assets and the natural operation of fee breakpoints.
The Trustees noted that the expense ratio increases described above were currently being controlled by expense limitations implemented in January 2004 and which Putnam Management, in consultation with the Contract Committee, has committed to maintain at least through 2007. These expense limitations give effect to a commitment by Putnam Management that the expense ratio of each open-end fund would be no higher than the average expense ratio of the competitive funds included in the fund’s relevant Lipper universe (exclusive of any applicable 12b-1 charges in each case). The Trustees observed that this commitment to limit fund expenses has served shareholders well since its inception. In order to ensure that the expenses of the Putnam funds continue to meet evolving competitive standards, the Trustees requested, and Putnam Management agreed, to implement an additional expense limitation for certain funds for the twelve months beginning January 1, 2007 equal to the average expense ratio (exclusive of 12b-1 charges) of a custom peer group of competitive funds selected by Lipper based on the size of the fund. This additional expense limitation will be applied to those open-end funds that had above-average expense ratios (exclusive of 12b-1 charges) based on the Lipper custom peer group data for the period ended December 31, 2005. This additional expense limitation will be applied to your fund.
27
• Economies of scale. Your fund currently has the benefit of breakpoints in its management fee that provide shareholders with significant economies of scale, which means that the effective management fee rate of a fund (as a percentage of fund assets) declines as a fund grows in size and crosses specified asset thresholds. Conversely, as a fund shrinks in size — as has been the case for many Putnam funds in recent years — these breakpoints result in increasing fee levels. In recent years, the Trustees have examined the operation of the existing breakpoint structure during periods of both growth and decline in asset levels. The Trustees concluded that the fee schedules in effect for the funds represented an appropriate sharing of economies of scale at current asset levels. In reaching this conclusion, the Trustees considered the Contract Committee’s stated intent to con tinue to work with Putnam Management to plan for an eventual resumption in the growth of assets, including a study of potential economies that might be produced under various growth assumptions.
In connection with their review of the management fees and total expenses of the Putnam funds, the Trustees also reviewed the costs of the services to be provided and profits to be realized by Putnam Management and its affiliates from the relationship with the funds. This information included trends in revenues, expenses and profitability of Putnam Management and its affiliates relating to the investment management and distribution services provided to the funds. In this regard, the Trustees also reviewed an analysis of Putnam Management’s revenues, expenses and profitability with respect to the funds’ management contracts, allocated on a fund-by-fund basis. Because many of the costs incurred by Putnam Management in managing the funds are not readily identifiable to particular funds, the Trustees observed that the methodology for allocating costs is an important factor in evaluating Putnam Management’s costs and profitability, both as to the Putnam fu nds in the aggregate and as to individual funds. The Trustees reviewed Putnam Management’s cost allocation methodology with the assistance of independent consultants and concluded that this methodology was reasonable and well-considered.
Investment performance
The quality of the investment process provided by Putnam Management represented a major factor in the Trustees’ evaluation of the quality of services provided by Putnam Management under your fund’s management contract. The Trustees were assisted in their review of the Putnam funds’ investment process and performance by the work of the Investment Process Committee of the Trustees and the Investment Oversight Committees of the Trustees, which meet on a regular monthly basis with the funds’ portfolio teams throughout the year. The Trustees concluded that Putnam Management generally provides a high-quality investment process — as measured by the experience and skills of the individuals assigned to the management of fund portfolios, the resources made available to such personnel, and in general the ability of Putnam Management to attract and retain high-quality personnel — but also recognize that this does not guarantee favorable investment results for every fund in every time period. The Trustees considered the investment performance of each fund over multiple time periods
28
and considered information comparing each fund’s performance with various benchmarks and with the performance of competitive funds.
The Trustees noted the satisfactory investment performance of many Putnam funds. They also noted the disappointing investment performance of certain funds in recent years and discussed with senior management of Putnam Management the factors contributing to such underperformance and actions being taken to improve performance. The Trustees recognized that, in recent years, Putnam Management has made significant changes in its investment personnel and processes and in the fund product line to address areas of underperformance. In particular, they noted the important contributions of Putnam Management’s leadership in attracting, retaining and supporting high-quality investment professionals and in systematically implementing an investment process that seeks to merge the best features of fundamental and quantitative analysis. The Trustees indicated their intention to continue to monitor performance trends to assess the effectiveness of these changes and to evaluate whether additional changes to address areas of underperformance are warranted.
In the case of your fund, the Trustees considered that your fund’s class A share cumulative total return performance at net asset value was in the following percentiles of its Lipper Inc. peer group (Lipper Short-Intermediate U.S. Government Funds) for the one-, three- and five-year periods ended March 31, 2006 (the first percentile being the best performing funds and the 100th percentile being the worst performing funds):
| One-year period | Three-year period | Five-year period |
| 90th | 66th | 66th |
(Because of the passage of time, these performance results may differ from the performance results for more recent periods shown elsewhere in this report. Over the one-, three- and five-year periods ended March 31, 2006, there were 79, 68, and 66 funds, respectively, in your fund’s Lipper peer group.* Past performance is no guarantee of future performance.)
The Trustees noted the disappointing performance for your fund for the one-year period ended March 31, 2006. In this regard, the Trustees considered Putnam Management’s view that one factor in the fund’s relative underperformance during this period was its selection of higher quality bonds during recent periods, given market conditions. The Trustees also considered Putnam Management’s belief that the fund’s investment strategy and process are designed to produce attractive relative performance over longer periods.
As a general matter, the Trustees concluded that cooperative efforts between the Trustees and Putnam Management represent the most effective way to address investment performance
* The percentile rankings for your fund’s class A share annualized total return performance in the Lipper Short-Intermediate U.S. Government Funds category for the one-, five- and ten-year periods ended June 30, 2007, were 27%, 65%, and 56%, respectively. Over the one-, five- and ten-year periods ended June 30, 2007, the fund ranked 19 out of 71, 39 out of 59, and 28 out of 49 funds, respectively. Note that this more recent information was not available when the Trustees approved the continuance of your fund’s management contract.
29
problems. The Trustees noted that investors in the Putnam funds have, in effect, placed their trust in the Putnam organization, under the oversight of the funds’ Trustees, to make appropriate decisions regarding the management of the funds. Based on the responsiveness of Putnam Management in the recent past to Trustee concerns about investment performance, the Trustees concluded that it is preferable to seek change within Putnam Management to address performance shortcomings. In the Trustees’ view, the alternative of terminating a management contract and engaging a new investment adviser for an underperforming fund would entail significant disruptions and would not provide any greater assurance of improved investment performance.
Brokerage and soft-dollar allocations; other benefits
The Trustees considered various potential benefits that Putnam Management may receive in connection with the services it provides under the management contract with your fund. These include benefits related to brokerage and soft-dollar allocations, whereby a portion of the commissions paid by a fund for brokerage may be used to acquire research services that may be useful to Putnam Management in managing the assets of the fund and of other clients. The Trustees indicated their continued intent to monitor the potential benefits associated with the allocation of fund brokerage to ensure that the principle of seeking “best price and execution” remains paramount in the portfolio trading process.
The Trustees’ annual review of your fund’s management contract also included the review of its distributor’s contract and distribution plan with Putnam Retail Management Limited Partnership and the custodian agreement and investor servicing agreement with Putnam Fiduciary Trust Company, all of which provide benefits to affiliates of Putnam Management.
Comparison of retail and institutional fee schedules
The information examined by the Trustees as part of their annual contract review has included for many years information regarding fees charged by Putnam Management and its affiliates to institutional clients such as defined benefit pension plans, college endowments, etc. This information included comparison of such fees with fees charged to the funds, as well as a detailed assessment of the differences in the services provided to these two types of clients. The Trustees observed, in this regard, that the differences in fee rates between institutional clients and the funds are by no means uniform when examined by individual asset sectors, suggesting that differences in the pricing of investment management services to these types of clients reflect to a substantial degree historical competitive forces operating in separate market places. The Trustees considered the fact that fee rates across all asset sectors are higher on average for funds than for institutional cli ents, as well as the differences between the services that Putnam Management provides to the Putnam funds and those that it provides to institutional clients of the firm, but did not rely on such comparisons to any significant extent in concluding that the management fees paid by your fund are reasonable.
30
Approval of new management contracts in connection with pending change in control
As discussed in the “Message from the Trustees” at the beginning of this shareholder report, Marsh & McLennan Companies, Inc. announced on February 1, 2007 that it had signed a definitive agreement to sell its ownership interest in Putnam Investments Trust, the parent company of Putnam Management and its affiliates, to Great-West Lifeco Inc., a member of the Power Financial Corporation group of companies. In mid-May, shareholders voted overwhelmingly in favor of the proposed transaction. While the transaction is still subject to regulatory approvals and other conditions, it is currently expected to be completed this summer.
At an in-person meeting on February 8–9, 2007, the Trustees considered the approval of new management contracts for each Putnam fund proposed to become effective upon the closing of the transaction, and the filing of a preliminary proxy statement. At an in-person meeting on March 8–9, 2007, the Trustees considered the approval of the final forms of the proposed new management contracts for each Putnam fund and the proxy statement. They reviewed the terms of the proposed new management contracts and the differences between the proposed new management contracts and the current management contracts. They noted that the terms of the proposed new management contracts were substantially identical to the current management contracts, except for certain changes developed at the initiative of the Trustees and designed largely to address inconsistencies among various of the existing contracts, which had been developed and implemented at different times in the past. In considering the approval of the proposed new management contracts, the Trustees also considered, as discussed further in the proxy statement, various matters relating to the transaction. Finally, in considering the proposed new management contracts, the Trustees also took into account their deliberations and conclusions (discussed above in the preceding paragraphs of the “Trustee Approval of Management Contract” section) in connection with the most recent annual approval of the continuance of the Putnam funds’ management contracts effective July 1, 2006, and the extensive materials that they had reviewed in connection with that approval process. Based upon the foregoing considerations, on March 9, 2007, the Trustees, including all of the Independent Trustees, unanimously approved the proposed new management contracts and determined to recommend their approval to the shareholders of the Putnam funds.
31
Other information
for shareholders
Important notice regarding delivery of shareholder documents
In accordance with SEC regulations, Putnam sends a single copy of annual and semiannual shareholder reports, prospectuses, and proxy statements to Putnam shareholders who share the same address, unless a shareholder requests otherwise. If you prefer to receive your own copy of these documents, please call Putnam at 1-800-225-1581, and Putnam will begin sending individual copies within 30 days.
Proxy voting
Putnam is committed to managing our mutual funds in the best interests of our shareholders. The Putnam funds’ proxy voting guidelines and procedures, as well as information regarding how your fund voted proxies relating to portfolio securities during the 12-month period ended June 30, 2006, are available on the Putnam Individual Investor Web site, www.putnam.com/individual, and on the SEC’s Web site, www.sec.gov. If you have questions about finding forms on the SEC’s Web site, you may call the SEC at 1-800-SEC-0330. You may also obtain the Putnam funds’ proxy voting guidelines and procedures at no charge by calling Putnam’s Shareholder Services at 1-800-225-1581.
Fund portfolio holdings
The fund will file a complete schedule of its portfolio holdings with the SEC for the first and third quarters of each fiscal year on Form N-Q. Shareholders may obtain the fund’s Forms N-Q on the SEC’s Web site at www.sec.gov. In addition, the fund’s Forms N-Q may be reviewed and copied at the SEC’s Public Reference Room in Washington, D.C. You may call the SEC at 1-800-SEC-0330 for information about the SEC’s Web site or the operation of the Public Reference Room.
32
Financial statements
A guide to financial statements
These sections of the report, as well as the accompanying Notes, constitute the fund’s financial statements.
The fund’s portfolio lists all the fund’s investments and their values as of the last day of the reporting period. Holdings are organized by asset type and industry sector, country, or state to show areas of concentration and diversification.
Statement of assets and liabilities shows how the fund’s net assets and share price are determined. All investment and noninvestment assets are added together. Any unpaid expenses and other liabilities are subtracted from this total. The result is divided by the number of shares to determine the net asset value per share, which is calculated separately for each class of shares. (For funds with preferred shares, the amount subtracted from total assets includes the liquidation preference of preferred shares.)
Statement of operations shows the fund’s net investment gain or loss. This is done by first adding up all the fund’s earnings — from dividends and interest income — and subtracting its operating expenses to determine net investment income (or loss). Then, any net gain or loss the fund realized on the sales of its holdings — as well as any unrealized gains or losses over the period — is added to or subtracted from the net investment result to determine the fund’s net gain or loss for the fiscal period.
Statement of changes in net assets shows how the fund’s net assets were affected by the fund’s net investment gain or loss, by distributions to shareholders, and by changes in the number of the fund’s shares. It lists distributions and their sources (net investment income or realized capital gains) over the current reporting period and the most recent fiscal year-end. The distributions listed here may not match the sources listed in the Statement of operations because the distributions are determined on a tax basis and may be paid in a different period from the one in which they were earned. Dividend sources are estimated at the time of declaration. Actual results may vary. Any non-taxable return of capital cannot be determined until final tax calculations are completed after the end of the fund’s fiscal year.
Financial highlights provide an overview of the fund’s investment results, per-share distributions, expense ratios, net investment income ratios, and portfolio turnover in one summary table, reflecting the five most recent reporting periods. In a semiannual report, the highlight table also includes the current reporting period.
33
The fund’s portfolio 5/31/07 (Unaudited)
| U.S. GOVERNMENT AND AGENCY MORTGAGE OBLIGATIONS (31.4%)* | ||
| Principal amount | Value | |
| U.S. Government Guaranteed Mortgage Obligations (—%) | ||
| Government National Mortgage Association Pass-Through | ||
| Certificates 4 3/4s, 2026 | $ 54,504 | $ 55,614 |
| Government National Mortgage Association Pass-Through | ||
| Certificates 7 1/2s, October 20, 2030 | 41,620 | 43,267 |
| 98,881 | ||
| U.S. Government Agency Mortgage Obligations (31.4%) | ||
| Federal Home Loan Mortgage Corporation | ||
| Pass-Through Certificates | ||
| 7 1/2s, with due dates from April 1, 2016 to December 1, 2017 | 19,070 | 19,883 |
| 6s, August 1, 2021 | 68,725 | 69,428 |
| 5 1/2s, October 1, 2018 | 607,216 | 606,149 |
| Federal National Mortgage Association Pass-Through Certificates | ||
| 7 1/2s, with due dates from October 1, 2022 to | ||
| November 1, 2030 | 161,251 | 169,271 |
| 7s, with due dates from December 1, 2031 to | ||
| December 1, 2035 | 3,889,954 | 4,055,963 |
| 7s, with due dates from September 1, 2007 to January 1, 2015 | 317,327 | 325,099 |
| 6 1/2s, August 1, 2034 | 29,068 | 29,771 |
| 6 1/2s, with due dates from February 1, 2014 to | ||
| February 1, 2017 | 917,161 | 938,229 |
| 6s, with due dates from July 1, 2021 to July 1, 2036 | 3,351,648 | 3,385,905 |
| 6s, with due dates from July 1, 2016 to June 1, 2021 | 2,439,756 | 2,465,266 |
| 6s, TBA, June 1, 2037 | 25,700,000 | 25,665,868 |
| 5 1/2s, with due dates from April 1, 2034 to March 1, 2037 | 29,903,435 | 29,211,739 |
| 5 1/2s, with due dates from January 1, 2009 to | ||
| February 1, 2021 | 1,890,414 | 1,882,326 |
| 5 1/2s, TBA, June 1, 2036 | 48,700,000 | 47,543,375 |
| 5s, with due dates from November 1, 2035 to | ||
| February 1, 2037 | 2,289,000 | 2,180,727 |
| 5s, May 1, 2021 | 55,743 | 54,349 |
| 4 1/2s, with due dates from October 1, 2020 to | ||
| October 1, 2035 | 3,543,954 | 3,363,215 |
| 4 1/2s, with due dates from July 1, 2020 to September 1, 2020 | 4,132,379 | 3,958,690 |
| 4 1/2s, TBA, June 1, 2022 | 3,300,000 | 3,157,430 |
| 129,082,683 | ||
| Total U.S. government and agency mortgage obligations (cost $130,346,320) | $ 129,181,564 | |
| U.S. GOVERNMENT AGENCY OBLIGATIONS (10.0%)* | ||
| Principal amount | Value | |
| Fannie Mae 4 1/4s, August 15, 2010 | $ 9,600,000 | $ 9,351,288 |
| Freddie Mac | ||
| 6 7/8s, September 15, 2010 | 6,752,000 | 7,100,683 |
| 6 5/8s, September 15, 2009 | 23,980,000 | 24,736,619 |
| Total U.S. government agency obligations (cost $42,242,393) | $ 41,188,590 | |
34
| U.S. TREASURY OBLIGATIONS (18.7%)* | ||
| Principal amount | Value | |
| U.S. Treasury Notes | ||
| 4 1/4s, August 15, 2014 | $ 1,300,000 | $ 1,250,234 |
| 4 1/4s, August 15, 2013 | 53,596,000 | 51,954,623 |
| 4s, February 15, 2014 | 25,000,000 | 23,765,625 |
| Total U.S. treasury obligations (cost $79,338,614) | $ 76,970,482 | |
| COLLATERALIZED MORTGAGE OBLIGATIONS (32.5%)* | ||
| Principal amount | Value | |
| Banc of America Commercial Mortgage, Inc. | ||
| Ser. 06-4, Class A4, 5.634s, 2046 | $ 660,000 | $ 658,457 |
| Ser. 06-5, Class A4, 5.414s, 2047 | 816,000 | 801,711 |
| FRB Ser. 05-1, Class A5, 4.981s, 2042 | 207,000 | 202,047 |
| Ser. 04-4, Class A6, 4.877s, 2042 | 34,000 | 33,130 |
| Commercial Mortgage Pass-Through Certificates | ||
| Ser. 06-C7, Class A4, 5.769s, 2046 | 6,752,000 | 6,970,387 |
| FRB Ser. 04-LB3A, Class A5, 5.28s, 2037 | 20,000 | 19,736 |
| Countrywide Alternative Loan Trust IFB Ser. 06-6CB, Class 1A3, | ||
| Interest Only (IO), zero %, 2036 | 4,814,359 | 6,206 |
| Credit Suisse Mortgage Capital Certificates Ser. 06-C4, Class A3, | ||
| 5.467s, 2039 | 1,341,000 | 1,321,360 |
| CS First Boston Mortgage Securities Corp. | ||
| FRB Ser. 04-C3, Class A5, 5.113s, 2036 | 76,000 | 73,731 |
| Ser. 05-C4, Class A5, 5.104s, 2038 | 64,000 | 61,841 |
| FRB Ser. 05-C5, Class A4, 5.1s, 2038 | 64,000 | 61,766 |
| Ser. 04-C3, Class A3, 4.302s, 2036 | 161,000 | 156,943 |
| Fannie Mae | ||
| Ser. 03-W6, Class PT1, 10.012s, 2042 | 1,509,216 | 1,608,736 |
| IFB Ser. 06-70, Class SM, 9.605s, 2036 | 120,625 | 125,457 |
| IFB Ser. 06-62, Class PS, 7.98s, 2036 | 591,758 | 626,933 |
| IFB Ser. 06-76, Class QB, 7.68s, 2036 | 856,304 | 902,756 |
| IFB Ser. 06-60, Class AK, 7.52s, 2036 | 261,834 | 269,220 |
| Ser. 04-T3, Class 1A4, 7 1/2s, 2044 | 1,210,741 | 1,264,030 |
| Ser. 04-T2, Class 1A4, 7 1/2s, 2043 | 281,275 | 293,663 |
| Ser. 02-T19, Class A3, 7 1/2s, 2042 | 907,179 | 944,024 |
| Ser. 02-14, Class A2, 7 1/2s, 2042 | 207,799 | 215,368 |
| Ser. 01-T10, Class A2, 7 1/2s, 2041 | 1,206,414 | 1,247,550 |
| Ser. 02-T4, Class A3, 7 1/2s, 2041 | 833,295 | 862,053 |
| Ser. 01-T12, Class A2, 7 1/2s, 2041 | 2,095,134 | 2,165,365 |
| Ser. 01-T3, Class A1, 7 1/2s, 2040 | 8,243 | 8,517 |
| Ser. 99-T2, Class A1, 7 1/2s, 2039 | 117,197 | 122,418 |
| Ser. 03-W10, Class 1A1, 7 1/2s, 2032 | 995,860 | 1,032,269 |
| Ser. 02-T1, Class A3, 7 1/2s, 2031 | 1,608,684 | 1,667,531 |
| Ser. 00-T6, Class A1, 7 1/2s, 2030 | 717,844 | 743,824 |
| Ser. 01-T5, Class A3, 7 1/2s, 2030 | 8,602 | 8,898 |
| IFB Ser. 06-63, Class SP, 7.38s, 2036 | 929,794 | 965,794 |
| IFB Ser. 06-60, Class TK, 7.32s, 2036 | 255,833 | 262,055 |
| IFB Ser. 06-104, Class GS, 7.046s, 2036 | 329,662 | 337,912 |
| Ser. 02-26, Class A1, 7s, 2048 | 949,684 | 974,784 |
35
| COLLATERALIZED MORTGAGE OBLIGATIONS (32.5%)* continued | ||
| Principal amount | Value | |
| Fannie Mae | ||
| Ser. 04-W12, Class 1A3, 7s, 2044 | $ 608,236 | $ 627,646 |
| Ser. 04-T3, Class 1A3, 7s, 2044 | 1,092,352 | 1,126,503 |
| Ser. 04-T2, Class 1A3, 7s, 2043 | 375,045 | 386,833 |
| Ser. 03-W8, Class 2A, 7s, 2042 | 3,732,000 | 3,840,569 |
| Ser. 03-W3, Class 1A2, 7s, 2042 | 358,448 | 368,169 |
| Ser. 02-T16, Class A2, 7s, 2042 | 2,491,716 | 2,558,961 |
| Ser. 02-T19, Class A2, 7s, 2042 | 1,549,817 | 1,592,166 |
| Ser. 01-T10, Class A1, 7s, 2041 | 688,820 | 705,133 |
| Ser. 02-T4, Class A2, 7s, 2041 | 1,643,154 | 1,682,790 |
| Ser. 04-W1, Class 2A2, 7s, 2033 | 2,562,214 | 2,640,998 |
| IFB Ser. 06-104, Class ES, 6.85s, 2036 | 358,338 | 369,240 |
| IFB Ser. 07-1, Class NK, IO, 6.49s, 2037 | 828,625 | 849,262 |
| IFB Ser. 06-104, Class CS, 5.76s, 2036 | 430,225 | 423,916 |
| IFB Ser. 05-74, Class CS, 5.39s, 2035 | 1,075,853 | 1,050,601 |
| IFB Ser. 06-115, Class ES, 5.28s, 2036 | 328,583 | 325,546 |
| IFB Ser. 05-74, Class CP, 5.243s, 2035 | 943,603 | 925,883 |
| IFB Ser. 07-30, Class FS, 5.187s, 2037 | 795,774 | 747,906 |
| IFB Ser. 06-27, Class SP, 5.06s, 2036 | 651,000 | 639,083 |
| IFB Ser. 06-8, Class HP, 5.06s, 2036 | 756,604 | 732,975 |
| IFB Ser. 06-8, Class WK, 5.06s, 2036 | 1,181,801 | 1,135,792 |
| IFB Ser. 05-106, Class US, 5.06s, 2035 | 1,138,771 | 1,116,909 |
| IFB Ser. 05-99, Class SA, 5.06s, 2035 | 562,342 | 546,992 |
| IFB Ser. 05-115, Class NQ, 4.988s, 2036 | 270,896 | 255,280 |
| IFB Ser. 05-114, Class SP, 4.95s, 2036 | 323,482 | 305,997 |
| IFB Ser. 05-74, Class DM, 4.877s, 2035 | 1,088,918 | 1,048,699 |
| IFB Ser. 06-60, Class CS, 4.583s, 2036 | 412,216 | 373,723 |
| IFB Ser. 05-95, Class CP, 4.089s, 2035 | 86,628 | 82,884 |
| IFB Ser. 05-106, Class JC, 3.628s, 2035 | 489,649 | 428,435 |
| IFB Ser. 05-72, Class SB, 3.575s, 2035 | 381,053 | 351,531 |
| IFB Ser. 05-83, Class QP, 3.562s, 2034 | 376,009 | 339,666 |
| IFB Ser. 05-57, Class MN, 3.303s, 2035 | 778,965 | 736,704 |
| IFB Ser. 06-90, Class SE, IO, 2.48s, 2036 | 405,006 | 37,817 |
| IFB Ser. 03-66, Class SA, IO, 2.33s, 2033 | 930,732 | 69,690 |
| IFB Ser. 07-W2, Class 3A2, IO, 1.96s, 2037 | 1,048,542 | 57,440 |
| IFB Ser. 05-113, Class AI, IO, 1.91s, 2036 | 130,792 | 9,388 |
| IFB Ser. 05-113, Class DI, IO, 1.91s, 2036 | 6,356,941 | 381,243 |
| IFB Ser. 06-60, Class SI, IO, 1.83s, 2036 | 983,358 | 66,600 |
| IFB Ser. 06-60, Class DI, IO, 1 3/4s, 2035 | 388,719 | 20,444 |
| IFB Ser. 05-65, Class KI, IO, 1.68s, 2035 | 9,559,228 | 500,952 |
| IFB Ser. 07-39, Class PI, IO, 1.44s, 2037 | 625,000 | 32,621 |
| IFB Ser. 07-30, Class WI, IO, 1.44s, 2037 | 3,759,978 | 179,979 |
| IFB Ser. 07-28, Class SE, IO, 1.43s, 2037 | 661,251 | 41,698 |
| IFB Ser. 07-W2, Class 2A2, IO, 1.43s, 2037 | 1,362,016 | 62,931 |
| IFB Ser. 06-128, Class SH, IO, 1.43s, 2037 | 839,592 | 38,873 |
| IFB Ser. 06-56, Class SM, IO, 1.43s, 2036 | 896,625 | 44,252 |
| IFB Ser. 06-12, Class SD, IO, 1.43s, 2035 | 3,543,497 | 217,925 |
| IFB Ser. 05-90, Class SP, IO, 1.43s, 2035 | 1,794,465 | 92,774 |
| IFB Ser. 07-W5, Class 2A2, IO, 1.42s, 2037 | 362,000 | 12,453 |
| IFB Ser. 07-30, Class IE, IO, 1.42s, 2037 | 1,786,049 | 120,183 |
36
| COLLATERALIZED MORTGAGE OBLIGATIONS (32.5%)* continued | |||
| Principal amount | Value | ||
| Fannie Mae | |||
| IFB Ser. 06-123, Class CI, IO, 1.42s, 2037 | $ 1,537,410 | $ 92,481 | |
| IFB Ser. 06-123, Class UI, IO, 1.42s, 2037 | 685,245 | 35,987 | |
| IFB Ser. 05-82, Class SY, IO, 1.41s, 2035 | 4,505,739 | 203,117 | |
| IFB Ser. 07-15, Class BI, IO, 1.38s, 2037 | 1,139,529 | 58,480 | |
| IFB Ser. 06-23, Class SC, IO, 1.38s, 2036 | 909,494 | 52,864 | |
| IFB Ser. 05-95, Class CI, IO, 1.38s, 2035 | 1,178,142 | 65,781 | |
| IFB Ser. 05-84, Class SG, IO, 1.38s, 2035 | 2,011,651 | 115,125 | |
| IFB Ser. 05-104, Class NI, IO, 1.38s, 2035 | 1,379,916 | 78,379 | |
| IFB Ser. 05-83, Class QI, IO, 1.37s, 2035 | 314,261 | 20,075 | |
| IFB Ser. 05-83, Class SL, IO, 1.35s, 2035 | 3,562,365 | 170,147 | |
| IFB Ser. 06-114, Class IS, IO, 1.33s, 2036 | 797,114 | 41,101 | |
| IFB Ser. 06-115, Class IE, IO, 1.32s, 2036 | 575,747 | 30,758 | |
| IFB Ser. 06-117, Class SA, IO, 1.32s, 2036 | 904,703 | 42,565 | |
| IFB Ser. 06-121, Class SD, IO, 1.32s, 2036 | 662,431 | 32,295 | |
| IFB Ser. 06-109, Class SG, IO, 1.31s, 2036 | 515,066 | 25,078 | |
| IFB Ser. 06-104, Class SY, IO, 1.3s, 2036 | 207,434 | 9,002 | |
| IFB Ser. 06-109, Class SH, IO, 1.3s, 2036 | 732,398 | 47,006 | |
| IFB Ser. 06-128, Class SC, IO, 1.28s, 2037 | 1,552,952 | 73,144 | |
| IFB Ser. 06-44, Class IS, IO, 1.28s, 2036 | 866,303 | 42,367 | |
| IFB Ser. 06-45, Class SM, IO, 1.28s, 2036 | 1,551,188 | 66,829 | |
| IFB Ser. 06-8, Class JH, IO, 1.28s, 2036 | 2,796,801 | 168,239 | |
| IFB Ser. 05-95, Class OI, IO, 1.27s, 2035 | 175,264 | 11,216 | |
| IFB Ser. 06-92, Class JI, IO, 1.26s, 2036 | 308,091 | 15,404 | |
| IFB Ser. 06-96, Class ES, IO, 1.26s, 2036 | 433,909 | 20,596 | |
| IFB Ser. 06-99, Class AS, IO, 1.26s, 2036 | 281,952 | 13,506 | |
| IFB Ser. 06-85, Class TS, IO, 1.24s, 2036 | 1,674,924 | 71,406 | |
| IFB Ser. 06-61, Class SE, IO, 1.23s, 2036 | 1,202,852 | 45,654 | |
| IFB Ser. 03-124, Class ST, IO, 1.18s, 2034 | 653,220 | 25,312 | |
| IFB Ser. 07-30, Class JS, IO, 1.12s, 2037 | 2,428,004 | 107,443 | |
| IFB Ser. 07-30, Class LI, IO, 1.12s, 2037 | 1,053,973 | 54,099 | |
| IFB Ser. 07-W2, Class 1A2, IO, 1.11s, 2037 | 3,638,563 | 150,278 | |
| Ser. 07-54, Class IA, IO, 1.09s, 2037 | 824,000 | 41,470 | |
| IFB Ser. 07-54, Class IB, IO, 1.09s, 2037 | 824,000 | 41,470 | |
| IFB Ser. 07-54, Class IC, IO, 1.09s, 2037 | 824,000 | 41,470 | |
| IFB Ser. 07-54, Class ID, IO, 1.09s, 2037 | 824,000 | 41,470 | |
| IFB Ser. 07-54, Class IE, IO, 1.09s, 2037 | 824,000 | 41,470 | |
| IFB Ser. 07-54, Class IF, IO, 1.09s, 2037 | 1,226,000 | 61,701 | |
| IFB Ser. 07-15, Class CI, IO, 1.06s, 2037 | 2,821,542 | 138,591 | |
| IFB Ser. 06-123, Class BI, IO, 1.06s, 2037 | 3,728,219 | 173,661 | |
| IFB Ser. 06-115, Class JI, IO, 1.06s, 2036 | 2,067,724 | 95,325 | |
| IFB Ser. 06-123, Class LI, IO, 1s, 2037 | 1,383,669 | 61,112 | |
| IFB Ser. 07-39, Class AI, IO, 0.8s, 2037 | 1,475,643 | 54,875 | |
| IFB Ser. 07-32, Class SD, IO, 0.79s, 2037 | 981,944 | 38,992 | |
| IFB Ser. 07-30, Class UI, IO, 0.78s, 2037 | 813,368 | 32,026 | |
| IFB Ser. 07-32, Class SC, IO, 0.78s, 2037 | 1,305,640 | 51,401 | |
| IFB Ser. 07-1, Class CI, IO, 0.78s, 2037 | 958,247 | 34,587 | |
| IFB Ser. 05-74, Class SE, IO, 0.78s, 2035 | 5,048,535 | 146,397 | |
| IFB Ser. 05-82, Class SI, IO, 0.78s, 2035 | 4,244,930 | 127,429 | |
| IFB Ser. 07-W5, Class 1A2, IO, 0.76s, 2037 | 1,812,000 | 44,394 | |
37
| COLLATERALIZED MORTGAGE OBLIGATIONS (32.5%)* continued | |||
| Principal amount | Value | ||
| Fannie Mae | |||
| IFB Ser. 05-74, Class NI, IO, 0.76s, 2035 | $ 5,197,488 | $ 200,609 | |
| Ser. 06-104, Class EK, zero %, 2036 | 165,465 | 161,251 | |
| Ser. 372, Class 1, Principal Only (PO), zero %, 2036 | 6,397,668 | 4,839,227 | |
| Ser. 371, Class 1, PO, zero %, 2036 | 951,097 | 757,732 | |
| Ser. 367, Class 1, PO, zero %, 2036 | 249,992 | 180,130 | |
| Ser. 363, Class 1, PO, zero %, 2035 | 9,540,138 | 6,906,177 | |
| Ser. 04-38, Class AO, PO, zero %, 2034 | 2,114,474 | 1,505,190 | |
| Ser. 04-61, Class CO, PO, zero %, 2031 | 440,000 | 346,751 | |
| Ser. 07-31, Class TS, IO, zero %, 2009 | 2,367,062 | 18,848 | |
| Ser. 07-15, Class IM, IO, zero %, 2009 | 916,711 | 6,956 | |
| Ser. 07-16, Class TS, IO, zero %, 2009 | 3,795,068 | 28,796 | |
| FRB Ser. 05-79, Class FE, zero %, 2035 | 255,724 | 258,949 | |
| FRB Ser. 05-45, Class FG, zero %, 2035 | 271,757 | 253,319 | |
| FRB Ser. 05-81, Class DF, zero %, 2033 | 93,849 | 95,131 | |
| FRB Ser. 06-1, Class HF, zero %, 2032 | 134,805 | 127,617 | |
| IFB Ser. 06-75, Class FY, zero %, 2036 | 191,106 | 189,254 | |
| Federal Home Loan Mortgage Corp. Structured | |||
| Pass-Through Securities | |||
| Ser. T-58, Class 4A, 7 1/2s, 2043 | 565,548 | 588,517 | |
| Ser. T-42, Class A5, 7 1/2s, 2042 | 297,873 | 308,262 | |
| Ser. T-60, Class 1A2, 7s, 2044 | 706,133 | 728,177 | |
| Ser. T-59, Class 1A2, 7s, 2043 | 1,473,139 | 1,521,886 | |
| Ser. T-55, Class 1A2, 7s, 2043 | 871,289 | 892,709 | |
| Freddie Mac | |||
| IFB Ser. 3012, Class GP, 8.917s, 2035 | 487,025 | 449,047 | |
| IFB Ser. 3202, Class PS, 7.32s, 2036 | 608,507 | 629,568 | |
| IFB Ser. 3153, Class SX, 6.65s, 2036 | 877,382 | 896,010 | |
| IFB Ser. 3081, Class DC, 5.22s, 2035 | 452,499 | 433,834 | |
| IFB Ser. 3316, Class KS, 5.187s, 2037 | 417,000 | 390,665 | |
| IFB Ser. 3114, Class GK, 5.12s, 2036 | 294,370 | 281,294 | |
| IFB Ser. 2979, Class AS, 4.767s, 2034 | 202,401 | 192,376 | |
| IFB Ser. 3153, Class UT, 4.51s, 2036 | 510,890 | 470,808 | |
| IFB Ser. 3065, Class DC, 3.9s, 2035 | 699,155 | 627,441 | |
| IFB Ser. 3031, Class BS, 3.425s, 2035 | 960,132 | 861,141 | |
| IFB Ser. 2594, Class SE, IO, 1.73s, 2030 | 1,230,649 | 53,290 | |
| IFB Ser. 2828, Class TI, IO, 1.73s, 2030 | 644,138 | 36,136 | |
| IFB Ser. 3297, Class BI, IO, 1.44s, 2037 | 2,436,214 | 137,105 | |
| IFB Ser. 3284, Class IV, IO, 1.43s, 2037 | 620,124 | 34,125 | |
| IFB Ser. 3287, Class SD, IO, 1.43s, 2037 | 984,847 | 53,966 | |
| IFB Ser. 3281, Class BI, IO, 1.43s, 2037 | 481,644 | 25,459 | |
| IFB Ser. 3028, Class ES, IO, 1.43s, 2035 | 3,334,295 | 193,733 | |
| IFB Ser. 3042, Class SP, IO, 1.43s, 2035 | 752,942 | 42,165 | |
| IFB Ser. 3045, Class DI, IO, 1.41s, 2035 | 10,021,302 | 456,104 | |
| IFB Ser. 3136, Class NS, IO, 1.38s, 2036 | 1,309,336 | 66,124 | |
| IFB Ser. 3054, Class CS, IO, 1.38s, 2035 | 717,737 | 29,659 | |
| IFB Ser. 3107, Class DC, IO, 1.38s, 2035 | 1,715,831 | 104,437 | |
| IFB Ser. 3066, Class SI, IO, 1.38s, 2035 | 4,560,061 | 263,958 | |
| IFB Ser. 2950, Class SM, IO, 1.38s, 2016 | 375,486 | 18,310 | |
| IFB Ser. 3031, Class BI, IO, 1.37s, 2035 | 641,156 | 40,345 | |
38
| COLLATERALIZED MORTGAGE OBLIGATIONS (32.5%)* continued | |||
| Principal amount | Value | ||
| Freddie Mac | |||
| IFB Ser. 3244, Class SB, IO, 1.34s, 2036 | $ 680,927 | $ 34,414 | |
| IFB Ser. 3244, Class SG, IO, 1.34s, 2036 | 806,126 | 41,118 | |
| IFB Ser. 3236, Class IS, IO, 1.33s, 2036 | 1,288,772 | 62,834 | |
| IFB Ser. 3147, Class SH, IO, 1.33s, 2036 | 2,355,836 | 127,999 | |
| IFB Ser. 3114, Class TS, IO, 1.33s, 2030 | 4,493,673 | 179,898 | |
| IFB Ser. 3128, Class JI, IO, 1.31s, 2036 | 1,310,408 | 72,613 | |
| IFB Ser. 3240, Class S, IO, 1.3s, 2036 | 2,395,541 | 136,041 | |
| IFB Ser. 3065, Class DI, IO, 1.3s, 2035 | 495,676 | 30,846 | |
| IFB Ser. 3145, Class GI, IO, 1.28s, 2036 | 1,063,385 | 61,472 | |
| IFB Ser. 3114, Class GI, IO, 1.28s, 2036 | 703,052 | 43,729 | |
| IFB Ser. 3221, Class SI, IO, 1.26s, 2036 | 1,048,120 | 49,458 | |
| IFB Ser. 3202, Class PI, IO, 1.22s, 2036 | 2,879,231 | 132,636 | |
| IFB Ser. 3201, Class SG, IO, 1.18s, 2036 | 1,343,673 | 60,881 | |
| IFB Ser. 3203, Class SE, IO, 1.18s, 2036 | 1,189,889 | 50,942 | |
| IFB Ser. 3152, Class SY, IO, 1.16s, 2036 | 1,120,373 | 59,371 | |
| IFB Ser. 3284, Class BI, IO, 1.13s, 2037 | 781,517 | 35,168 | |
| IFB Ser. 3199, Class S, IO, 1.13s, 2036 | 457,780 | 22,891 | |
| IFB Ser. 3284, Class LI, IO, 1.12s, 2037 | 1,518,626 | 82,158 | |
| IFB Ser. 3281, Class AI, IO, 1.11s, 2037 | 2,836,421 | 144,904 | |
| IFB Ser. 3012, Class UI, IO, 1.1s, 2035 | 1,201,255 | 51,655 | |
| IFB Ser. 3311, Class IA, IO, 1.09s, 2037 | 1,151,000 | 61,486 | |
| IFB Ser. 3311, Class IB, IO, 1.09s, 2037 | 1,151,000 | 61,486 | |
| IFB Ser. 3311, Class IC, IO, 1.09s, 2037 | 1,151,000 | 61,486 | |
| IFB Ser. 3311, Class ID, IO, 1.09s, 2037 | 1,151,000 | 61,486 | |
| IFB Ser. 3311, Class IE, IO, 1.09s, 2037 | 1,650,000 | 88,143 | |
| IFB Ser. 3240, Class GS, IO, 1.06s, 2036 | 1,449,045 | 68,907 | |
| IFB Ser. 3288, Class SJ, IO, 0.81s, 2037 | 1,303,878 | 46,443 | |
| IFB Ser. 3284, Class CI, IO, 0.8s, 2037 | 2,107,937 | 83,000 | |
| IFB Ser. 3291, Class SA, IO, 0.79s, 2037 | 623,851 | 20,026 | |
| IFB Ser. 3016, Class SQ, IO, 0.79s, 2035 | 1,416,867 | 38,158 | |
| IFB Ser. 3284, Class WI, IO, 0.78s, 2037 | 3,509,277 | 140,861 | |
| IFB Ser. 3012, Class IG, IO, 0.76s, 2035 | 4,311,879 | 156,152 | |
| IFB Ser. 3235, Class SA, IO, 0.63s, 2036 | 607,369 | 15,374 | |
| Ser. 246, PO, zero %, 2037 | 5,420,909 | 4,101,774 | |
| Ser. 3300, PO, zero %, 2037 | 557,175 | 428,158 | |
| Ser. 242, PO, zero %, 2036 | 6,312,846 | 4,815,134 | |
| Ser. 236, PO, zero %, 2036 | 182,151 | 138,215 | |
| FRB Ser. 3285, Class CF, zero %, 2037 | 155,994 | 143,515 | |
| FRB Ser. 3239, Class BF, zero %, 2036 | 518,972 | 568,966 | |
| FRB Ser. 3231, Class XB, zero %, 2036 | 364,113 | 357,969 | |
| FRB Ser. 3213, Class FX, zero %, 2036 | 166,582 | 162,593 | |
| FRB Ser. 3174, Class SF, zero %, 2036 | 194,906 | 198,466 | |
| FRB Ser. 3149, Class XF, zero %, 2036 | 164,288 | 152,452 | |
| FRB Ser. 3231, Class X, zero %, 2036 | 172,408 | 180,951 | |
| FRB Ser. 3228, Class XF, zero %, 2036 | 287,348 | 300,582 | |
| FRB Ser. 3084, Class TO, zero %, 2035 | 113,496 | 108,267 | |
| FRB Ser. 3048, Class XG, zero %, 2035 | 96,856 | 92,148 | |
| FRB Ser. 3030, Class CF, zero %, 2035 | 305,382 | 284,304 | |
| FRB Ser. 3074, Class FC, zero %, 2035 | 96,875 | 86,494 | |
39
| COLLATERALIZED MORTGAGE OBLIGATIONS (32.5%)* continued | |||
| Principal amount | Value | ||
| Freddie Mac | |||
| FRB Ser. 3022, Class TC, zero %, 2035 | $ 96,323 | $ 105,908 | |
| FRB Ser. 2986, Class XT, zero %, 2035 | 63,761 | 64,406 | |
| FRB Ser. 2958, Class FL, zero %, 2035 | 272,557 | 241,347 | |
| FRB Ser. 3046, Class WF, zero %, 2035 | 102,920 | 97,408 | |
| FRB Ser. 3054, Class XF, zero %, 2034 | 61,787 | 60,061 | |
| FRB Ser. 2985, Class AS, zero %, 2033 | 86,432 | 77,101 | |
| FRB Ser. 3046, Class UF, zero %, 2033 | 343,121 | 322,981 | |
| Government National Mortgage Association | |||
| IFB Ser. 07-26, Class WS, 10.56s, 2037 | 613,000 | 715,975 | |
| IFB Ser. 05-84, Class SB, 3.7s, 2035 | 356,333 | 321,666 | |
| IFB Ser. 05-68, Class DP, 3.614s, 2035 | 2,647,272 | 2,426,594 | |
| IFB Ser. 05-84, Class SL, 3.1s, 2035 | 1,823,400 | 1,599,514 | |
| IFB Ser. 05-66, Class SP, 3.1s, 2035 | 843,794 | 740,928 | |
| IFB Ser. 05-7, Class NP, 2.959s, 2033 | 254,305 | 235,761 | |
| IFB Ser. 2006-62, Class SI, IO, 2.06s, 2036 | 1,035,201 | 63,730 | |
| IFB Ser. 07-1, Class SL, IO, 2.04s, 2037 | 463,865 | 31,507 | |
| IFB Ser. 07-1, Class SM, IO, 2.03s, 2037 | 463,865 | 31,353 | |
| IFB Ser. 07-26, Class SG, IO, 1.53s, 2037 | 1,271,000 | 74,420 | |
| IFB Ser. 07-9, Class BI, IO, 1 1/2s, 2037 | 3,210,077 | 160,989 | |
| IFB Ser. 07-25, Class SA, IO, 1.48s, 2037 | 1,102,000 | 53,116 | |
| IFB Ser. 07-25, Class SB, IO, 1.48s, 2037 | 2,163,000 | 105,771 | |
| IFB Ser. 07-26, Class SA, IO, 1.48s, 2037 | 3,132,000 | 152,505 | |
| IFB Ser. 07-26, Class SL, IO, 1.48s, 2037 | 150,000 | 7,092 | |
| IFB Ser. 07-26, Class SM, IO, 1.48s, 2037 | 1,600,000 | 74,361 | |
| IFB Ser. 07-22, Class S, IO, 1.48s, 2037 | 679,989 | 42,127 | |
| IFB Ser. 07-26, Class SD, IO, 1.48s, 2037 | 1,546,000 | 84,864 | |
| IFB Ser. 07-26, Class LS, IO, 1.48s, 2037 | 2,639,000 | 155,305 | |
| IFB Ser. 06-69, Class SA, IO, 1.48s, 2036 | 714,921 | 34,744 | |
| IFB Ser. 06-38, Class SG, IO, 1.33s, 2033 | 3,113,874 | 121,030 | |
| IFB Ser. 07-9, Class DI, IO, 1.19s, 2037 | 1,619,890 | 66,979 | |
| IFB Ser. 07-9, Class AI, IO, 1.18s, 2037 | 1,206,135 | 55,003 | |
| IFB Ser. 05-65, Class SI, IO, 1.03s, 2035 | 5,877,632 | 215,434 | |
| IFB Ser. 05-68, Class KI, IO, 0.98s, 2035 | 18,822,498 | 868,236 | |
| IFB Ser. 07-27, Class SD, IO, 0.88s, 2037 | 785,000 | 23,519 | |
| IFB Ser. 07-19, Class SJ, IO, 0.88s, 2037 | 1,351,304 | 38,507 | |
| IFB Ser. 07-21, Class S, IO, 0.88s, 2037 | 1,647,480 | 56,338 | |
| IFB Ser. 07-8, Class SA, IO, 0.88s, 2037 | 1,491,386 | 52,582 | |
| IFB Ser. 07-9, Class CI, IO, 0.88s, 2037 | 2,106,503 | 65,815 | |
| IFB Ser. 07-7, Class EI, IO, 0.88s, 2037 | 777,518 | 23,227 | |
| IFB Ser. 07-1, Class S, IO, 0.88s, 2037 | 1,761,338 | 51,519 | |
| IFB Ser. 07-3, Class SA, IO, 0.88s, 2037 | 1,678,638 | 47,845 | |
| Greenwich Capital Commercial Funding Corp. | |||
| Ser. 07-GG9, Class A4, 5.444s, 2039 | 480,000 | 480,288 | |
| FRB Ser. 05-GG5, Class A5, 5.224s, 2037 | 64,000 | 62,232 | |
| GS Mortgage Securities Corp. II | |||
| Ser. 06-GG8, Class A4, 5.56s, 2039 | 832,000 | 825,460 | |
| Ser. 04-GG2, Class A6, 5.396s, 2038 | 38,000 | 37,525 | |
| Ser. 05-GG4, Class A4, 4.761s, 2039 | 162,000 | 153,202 | |
| GSR Mortgage Loan Trust Ser. 05-AR2, Class 2A1, 4.849s, 2035 | 1,710,366 | 1,689,277 | |
40
| COLLATERALIZED MORTGAGE OBLIGATIONS (32.5%)* continued | ||
| Principal amount | Value | |
| JPMorgan Chase Commercial Mortgage Securities Corp. | ||
| Ser. 06-CB16, Class A4, 5.552s, 2045 | $ 895,000 | $ 888,144 |
| Ser. 06-CB14, Class AM, 5.445s, 2044 | 1,499,000 | 1,479,513 |
| Ser. 07-LDPX, Class A3, 5.42s, 2049 | 3,087,000 | 3,028,625 |
| FRB Ser. 04-PNC1, Class A4, 5.372s, 2041 | 61,000 | 60,405 |
| Ser. 06-LDP9, Class A3, 5.336s, 2047 | 2,217,000 | 2,162,262 |
| Ser. 05-CB12, Class A4, 4.895s, 2037 | 163,000 | 154,936 |
| Ser. 04-C3, Class A5, 4.878s, 2042 | 155,000 | 147,755 |
| LB-UBS Commercial Mortgage Trust | ||
| Ser. 01-C3, Class A2, 6.365s, 2028 | 55,000 | 57,131 |
| FRB Ser. 04-C4, Class A4, 5.132s, 2029 | 62,000 | 62,601 |
| Lehman Mortgage Trust | ||
| Ser. 07-1, Class 3A2, IO, 1.93s, 2037 | 1,800,615 | 107,321 |
| IFB Ser. 07-5, Class 4A3, 8.16s, 2036 | 567,000 | 577,454 |
| FRB Ser. 07-5, Class 4A2, 5.64s, 2037 | 1,345,000 | 1,340,586 |
| IFB Ser. 06-9, Class 3A2, IO, 1.91s, 2037 | 1,025,604 | 56,302 |
| IFB Ser. 06-5, Class 2A2, IO, 1.83s, 2036 | 2,038,989 | 89,271 |
| Ser. 06-9, Class 2A3, IO, 1.3s, 2036 | 3,701,879 | 175,158 |
| IFB Ser. 06-9, Class 2A2, IO, 1.3s, 2037 | 2,619,125 | 126,265 |
| IFB Ser. 06-7, Class 2A5, IO, 1.23s, 2036 | 1,024,538 | 45,919 |
| IFB Ser. 06-6, Class 1A3, IO, 1.18s, 2036 | 1,562,568 | 64,182 |
| IFB Ser. 06-5, Class 1A3, IO, 0.08s, 2036 | 545,367 | 1,724 |
| IFB Ser. 06-4, Class 1A3, IO, 0.08s, 2036 | 1,168,695 | 6,179 |
| IFB Ser. 06-9, Class 1A6, IO, zero %, 2037 | 1,779,930 | 3,250 |
| Merrill Lynch Mortgage Trust | ||
| FRB Ser. 04-BPC1, Class A5, 4.855s, 2041 | 158,000 | 150,886 |
| FRB Ser. 05-MCP1, Class A4, 4.747s, 2043 | 154,000 | 145,225 |
| Morgan Stanley Capital I | ||
| Ser. 07-HQ11, Class A4, 5.447s, 2044 | 850,000 | 834,896 |
| Ser. 05-HQ6, Class A4A, 4.989s, 2042 | 64,000 | 61,320 |
| Residential Asset Securitization Trust IFB Ser. 06-A7CB, | ||
| Class 1A6, IO, 0.23s, 2036 | 314,602 | 2,814 |
| Structured Adjustable Rate Mortgage Loan Trust | ||
| FRB Ser. 05-18, Class 6A1, 5.254s, 2035 | 2,300,321 | 2,280,493 |
| Ser. 04-20, Class 1A2, 5.06s, 2035 | 152,019 | 151,215 |
| Wells Fargo Mortgage Backed Securities Trust | ||
| Ser. 06-AR10, Class 3A1, 5.22s, 2036 | 1,811,390 | 1,795,257 |
| Ser. 05-AR2, Class 2A1, 4.545s, 2035 | 1,427,959 | 1,407,265 |
| Ser. 04-R, Class 2A1, 4.364s, 2034 | 1,459,820 | 1,435,471 |
| Ser. 05-AR9, Class 1A2, 4.354s, 2035 | 64,931 | 63,687 |
| Total collateralized mortgage obligations (cost $138,697,170) | $ 133,759,778 | |
| ASSET-BACKED SECURITIES (1.1%)* | ||
| Principal amount | Value | |
| Countrywide Home Loans 144A | ||
| IFB Ser. 05-R1, Class 1AS, IO, 0.801s, 2035 | $ 20,396,192 | $ 508,575 |
| IFB Ser. 05-R2, Class 1AS, IO, 0.423s, 2035 | 9,663,945 | 258,609 |
41
| ASSET-BACKED SECURITIES (1.1%)* continued | |||
| Principal amount | Value | ||
| Residential Asset Mortgage Products, Inc. FRB Ser. 06-RZ2, | |||
| Class A2, 5.49s, 2036 | $ 1,656,000 | $ 1,653,930 | |
| Structured Asset Securities Corp. | |||
| Ser. 07-6, Class AI, IO, 5s, 2037 | 21,590,000 | 677,956 | |
| Ser. 07-6, Class IA, IO, 5s, 2037 | 21,590,000 | 661,963 | |
| Terwin Mortgage Trust 144A FRB Ser. 06-9HGA, Class A1, | |||
| 5.4s, 2037 | 889,486 | 888,374 | |
| Total asset-backed securities (cost $4,866,931) | $ 4,649,407 | ||
| PURCHASED OPTIONS OUTSTANDING (2.5%)* | |||
| Expiration date/ | Contract | ||
| strike price | amount | Value | |
| Option on an interest rate swap with Goldman | |||
| Sachs, International for the right to pay a fixed | |||
| rate swap of 5.16% versus the three month | |||
| USD-LIBOR-BBA maturing April 28, 2018. | Apr-08/5.16 | $ 23,384,000 | $ 754,396 |
| Option on an interest rate swap with JPMorgan | |||
| Chase Bank, N.A. for the right to pay a fixed | |||
| rate of 5.235% versus the three month | |||
| USD-LIBOR-BBA maturing on May 8, 2018. | May-08/5.235 | 24,347,000 | 707,670 |
| Option on an interest rate swap with | |||
| Deutschbank for the right to pay a fixed rate | |||
| swap of 5.385% versus the three month | |||
| USD-LIBOR-BBA maturing April 16, 2009. | Apr-09/5.385 | 17,275,000 | 552,800 |
| Option on an interest rate swap with JPMorgan | |||
| Chase Bank, N.A. for the right to pay a fixed | |||
| rate of 5.315% versus the three month | |||
| USD-LIBOR-BBA maturing on April 08, 2009. | Apr-09/5.315 | 13,713,000 | 477,439 |
| Option on an interest rate swap with Goldman | |||
| Sachs, International for the right to pay a fixed | |||
| rate swap of 5.325% versus the three month | |||
| USD-LIBOR-BBA maturing April 08, 2009. | Apr-09/5.325 | 13,713,000 | 466,374 |
| Option on an interest rate swap with | |||
| Deutschbank for the right to receive a fixed | |||
| rate swap of 5.385% versus the three month | |||
| USD-LIBOR-BBA maturing April 16, 2009. | Apr-09/5.385 | 17,275,000 | 367,958 |
| Option on an interest rate swap with JPMorgan | |||
| Chase Bank, N.A. for the right to pay a fixed | |||
| rate of 5.45% versus the three month | |||
| USD-LIBOR-BBA maturing on May 23, 2008. | May-08/5.45 | 17,029,000 | 335,063 |
| Option on an interest rate swap with JPMorgan | |||
| Chase Bank, N.A. for the right to receive a | |||
| fixed rate of 5.45% versus the three month | |||
| USD-LIBOR-BBA maturing on May 23, 2008. | May-08/5.45 | 17,029,000 | 304,461 |
42
| PURCHASED OPTIONS OUTSTANDING (2.5%)* continued | |||
| Expiration date/ | Contract | ||
| strike price | amount | Value | |
| Option on an interest rate swap with Goldman | |||
| Sachs, International for the right to receive a | |||
| fixed rate swap of 5.325% versus the three | |||
| month USD-LIBOR-BBA maturing | |||
| April 08, 2009. | Apr-09/5.325 | $ 13,713,000 | $ 268,741 |
| Option on an interest rate swap with JPMorgan | |||
| Chase Bank, N.A. for the right to receive a | |||
| fixed rate of 5.315% versus the three month | |||
| USD-LIBOR-BBA maturing on April 08, 2009. | Apr-09/5.315 | 13,713,000 | 266,847 |
| Option on an interest rate swap with JPMorgan | |||
| Chase Bank, N.A. for the right to receive a | |||
| fixed rate of 5.235% versus the three month | |||
| USD-LIBOR-BBA maturing on May 08, 2018. | May-08/5.235 | 24,347,000 | 266,108 |
| Option on an interest rate swap with Goldman | |||
| Sachs, International for the right to receive a | |||
| fixed rate swap of 5.16% versus the three | |||
| month USD-LIBOR-BBA maturing | |||
| April 28, 2018. | Apr-08/5.16 | 23,384,000 | 208,494 |
| Option on an interest rate swap with JPMorgan | |||
| Chase Bank, N.A. for the right to pay a fixed | |||
| rate of 5.215% versus the three month | |||
| USD-LIBOR-BBA maturing on May 14, 2018. | May-08/5.215 | 2,946,000 | 89,076 |
| Option on an interest rate swap with Goldman | |||
| Sachs International for the right to pay a fixed | |||
| rate of 5.1975% versus the three month | |||
| USD-LIBOR-BBA maturing on May 14, 2018. | May-08/5.198 | 2,150,000 | 66,374 |
| Option on an interest rate swap with JPMorgan | |||
| Chase Bank, N.A. for the right to pay a fixed | |||
| rate of 5.22% versus the three month | |||
| USD-LIBOR-BBA maturing on May 14, 2018. | May-08/5.22 | 2,150,000 | 64,474 |
| Option on an interest rate swap with Lehman | |||
| Brothers Special Financing, Inc. for the right to | |||
| pay a fixed rate of 5.20% versus the three | |||
| month USD-LIBOR-BBA maturing on | |||
| May 14, 2018. | May-08/5.20 | 1,473,000 | 44,557 |
| Option on an interest rate swap with Goldman | |||
| Sachs, International for the right to pay a fixed | |||
| rate swap of 4.965% versus the three month | |||
| USD-LIBOR-BBA maturing April 29, 2008. | Apr-08/4.965 | 2,000,000 | 41,773 |
| Option on an interest rate swap with JPMorgan | |||
| Chase Bank, N.A. for the right to pay a fixed | |||
| rate of 5.175% versus the three month | |||
| USD-LIBOR-BBA maturing on April 29, 2008. | Apr-08/5.175 | 1,000,000 | 31,613 |
| Option on an interest rate swap with JPMorgan | |||
| Chase Bank, N.A. for the right to receive a | |||
| fixed rate of 5.215% versus the three month | |||
| USD-LIBOR-BBA maturing on May 14, 2018. | May-08/5.215 | 2,946,000 | 31,261 |
43
| PURCHASED OPTIONS OUTSTANDING (2.5%)* continued | |||
| Expiration date/ | Contract | ||
| strike price | amount | Value | |
| Option on an interest rate swap with JPMorgan | |||
| Chase Bank, N.A. for the right to receive a | |||
| fixed rate of 5.22% versus the three month | |||
| USD-LIBOR-BBA maturing on May 14, 2018. | May-08/5.22 | $ 2,150,000 | $ 23,062 |
| Option on an interest rate swap with Goldman | |||
| Sachs International for the right to receive a | |||
| fixed rate of 5.1975% versus the three month | |||
| USD-LIBOR-BBA maturing on May 14, 2018. | May-08/5.198 | 2,150,000 | 21,819 |
| Option on an interest rate swap with Lehman | |||
| Brothers Special Financing, Inc. for the right to | |||
| pay a fixed rate of 5.21% versus the three | |||
| month USD-LIBOR-BBA maturing on | |||
| May 14, 2018. | May-08/5.21 | 589,000 | 17,531 |
| Option on an interest rate swap with Lehman | |||
| Brothers International (Europe) for the right to | |||
| receive a fixed rate of 5.20% versus the three | |||
| month USD-LIBOR-BBA maturing on | |||
| May 14, 2018. | May-08/5.20 | 1,473,000 | 14,701 |
| Option on an interest rate swap with JPMorgan | |||
| Chase Bank, N.A. for the right to pay a fixed | |||
| rate of 5.115% versus the three month | |||
| USD-LIBOR-BBA maturing on | |||
| January 9, 2018. | Jan-08/5.115 | 86,420,000 | 2,744,354 |
| Option on an interest rate swap with | |||
| Lehman Brothers for the right to pay a fixed | |||
| rate swap of 5.19% versus the three month | |||
| USD-LIBOR-BBA maturing | |||
| December 12, 2017. | Dec-07/5.19 | 57,535,000 | 1,499,650 |
| Option on an interest rate swap with | |||
| Lehman Brothers for the right to receive a | |||
| fixed rate swap of 5.19% versus the three | |||
| month USD-LIBOR-BBA maturing | |||
| December 12, 2017. | Dec-07/5.19 | 57,535,000 | 323,117 |
| Option on an interest rate swap with Goldman | |||
| Sachs, International for the right to receive a | |||
| fixed rate swap of 4.965% versus the three | |||
| month USD-LIBOR-BBA maturing | |||
| April 29, 2008. | Apr-08/4.965 | 2,000,000 | 10,030 |
| Option on an interest rate swap with JPMorgan | |||
| Chase Bank, N.A. for the right to receive a | |||
| fixed rate of 5.115% versus the three month | |||
| USD-LIBOR-BBA maturing on | |||
| January 9, 2018. | Jan-08/5.115 | 86,420,000 | 443,827 |
44
| PURCHASED OPTIONS OUTSTANDING (2.5%)* continued | |||
| Expiration date/ | Contract | ||
| strike price | amount | Value | |
| Option on an interest rate swap with JPMorgan | |||
| Chase Bank, N.A. for the right to receive a | |||
| fixed rate of 5.175% versus the three month | |||
| USD-LIBOR-BBA maturing on April 29, 2008. | Apr-08/5.175 | $ 1,000,000 | $ 9,390 |
| Option on an interest rate swap with Lehman | |||
| Brothers Special Financing, Inc. for the right to | |||
| receive a fixed rate of 5.21% versus the three | |||
| month USD-LIBOR-BBA maturing on | |||
| May 14, 2018. | May-08/5.21 | 589,000 | 6,029 |
| Total purchased options outstanding (cost $13,672,620) | $ 10,458,989 | ||
| SHORT-TERM INVESTMENTS (19.9%)* | |||
| Principal amount | Value | ||
| Interest in $319,000,000 joint repurchase agreement dated | |||
| May 31, 2007 with Bank of America Securities, LLC due June 1, | |||
| 2007 with respect to various U.S. Government obligations — | |||
| maturity value of $60,658,946 for an effective yield of 5.31% | |||
| (collateralized by Freddie Mac with a yield of 5% and a due date | |||
| of May 1, 2035, valued at $325,380,000) | $ 60,650,000 | $ 60,650,000 | |
| U.S. Treasury Bills for an effective yield of 4.86%, | |||
| September 27, 2007 # | 655,000 | 644,566 | |
| U.S. Treasury Bills for an effective yield of 4.91%, June 21, 2007 # | 687,000 | 685,126 | |
| Federal Home Loan Bank for an effective yield of 5.125%, | |||
| June 13, 2007 | 20,000,000 | 19,965,833 | |
| Total short-term investments (cost $81,945,525) | $ 81,945,525 | ||
| TOTAL INVESTMENTS | |||
| Total investments (cost $491,109,573) | $ 478,154,335 | ||
* Percentages indicated are based on net assets of $411,575,252.
# These securities were pledged and segregated with the custodian to cover margin requirements for futures contracts and written options at May 31, 2007.
At May 31, 2007, liquid assets totaling $35,095,548 have been designated as collateral for open forward commitments and futures contracts.
144A after the name of an issuer represents securities exempt from registration under Rule 144A under the Securities Act of 1933, as amended. These securities may be resold in transactions exempt from registration, normally to qualified institutional buyers.
TBA after the name of a security represents to be announced securities (Note 1).
The rates shown on Floating Rate Bonds (FRB) are the current interest rates at May 31, 2007.
The dates shown on debt obligations are the original maturity dates.
Inverse Floating Rate Bonds (IFB) are securities that pay interest rates that vary inversely to changes in the market interest rates. As interest rates rise, inverse floaters produce less current income. The interest rates shown are the current interest rates at May 31, 2007.
45
| FUTURES CONTRACTS OUTSTANDING at 5/31/07 (Unaudited) | |||||
| Unrealized | |||||
| Number of | Expiration | appreciation/ | |||
| contracts | Value | date | (depreciation) | ||
| Euro-Dollar 90 day (Long) | 91 | $ 21,536,288 | Sep-07 | $ (31,461) | |
| Euro-Dollar 90 day (Long) | 264 | 62,584,500 | Sep-09 | (267,681) | |
| Euro-Dollar 90 day (Short) | 30 | 7,098,000 | Jun-07 | 8,543 | |
| Euro-Dollar 90 day (Short) | 846 | 200,639,475 | Sep-08 | 1,008,137 | |
| U.S. Treasury Bond 20 yr (Short) | 1,568 | 171,108,000 | Sep-07 | 254,302 | |
| U.S. Treasury Note 2 yr (Short) | 92 | 18,749,313 | Sep-07 | 30,015 | |
| U.S. Treasury Note 5 yr (Short) | 845 | 88,249,688 | Sep-07 | 255,871 | |
| U.S. Treasury Note 10 yr (Long) | 2,844 | 302,530,500 | Sep-07 | (753,737) | |
| Total | $ 503,989 | ||||
| WRITTEN OPTIONS OUTSTANDING at 5/31/07 (premiums received $6,224,024) (Unaudited) | |||||
| Contract | Expiration date/ | ||||
| amount | strike price | Value | |||
| Option on an interest rate swap with JPMorgan Chase | |||||
| Bank, N.A. for the obligation to pay a fixed rate of | |||||
| 4.55% versus the three month USD-LIBOR-BBA | |||||
| maturing on July 5, 2017. | $13,600,000 | Jul-07/4.55 | $ 2 | ||
| Option on an interest rate swap with Citibank, N.A. | |||||
| for the obligation to pay a fixed rate of 5.7% versus the | |||||
| three month USD-LIBOR-BBA maturing on | |||||
| May 14, 2018. | 12,090,000 | May-08/5.70 | 331,266 | ||
| Option on an interest rate swap with Lehman Brothers | |||||
| International for the obligation to receive a fixed rate of | |||||
| 5.225% versus the three month USD-LIBOR-BBA | |||||
| maturing March 5, 2018. | 9,910,000 | Mar-08/5.225 | 266,361 | ||
| Option on an interest rate swap with Citibank, N.A. | |||||
| for the obligation to receive a fixed rate of 5.7% versus | |||||
| the three month USD-LIBOR-BBA maturing on | |||||
| May 14, 2018. | 12,090,000 | May-08/5.70 | 141,453 | ||
| Option on an interest rate swap with Lehman Brothers | |||||
| International for the obligation to pay a fixed rate of | |||||
| 5.225% versus the three month USD-LIBOR-BBA | |||||
| maturing March 5, 2018. | 9,910,000 | Mar-08/5.225 | 87,248 | ||
| Option on an interest rate swap with JPMorgan Chase | |||||
| Bank, N.A. for the obligation to receive a fixed rate of | |||||
| 4.55% versus the three month USD-LIBOR-BBA | |||||
| maturing on July 5, 2017. | 13,600,000 | Jul-07/4.55 | 942,742 | ||
| Option on an interest rate swap with JPMorgan Chase | |||||
| Bank, N.A. for the obligation to receive a fixed rate of | |||||
| 5.51% versus the three month USD-LIBOR-BBA | |||||
| maturing on May 14, 2022. | 1,473,000 | May-12/5.51 | 64,811 | ||
| Option on an interest rate swap with JPMorgan Chase | |||||
| Bank, N.A. for the obligation to pay a fixed rate of 5.51% | |||||
| versus the three month USD-LIBOR-BBA maturing on | |||||
| May 14, 2022. | 1,473,000 | May-12/5.51 | 47,981 | ||
46
WRITTEN OPTIONS OUTSTANDING at 5/31/07 (premiums received $6,224,024) (Unaudited) continued
| Contract | Expiration date/ | |||
| amount | strike price | Value | ||
| Option on an interest rate swap with Lehman Brothers | ||||
| Special Financing, Inc. for the obligation to receive a | ||||
| fixed rate of 5.515% versus the three month | ||||
| USD-LIBOR-BBA maturing on May 14, 2022. | $ 736,500 | May-12/5.515 | $ 32,028 | |
| Option on an interest rate swap with Lehman Brothers | ||||
| Special Financing, Inc. for the obligation to pay a fixed | ||||
| rate of 5.515% versus the three month USD-LIBOR-BBA | ||||
| maturing on May 14, 2022. | 736,500 | May-12/5.515 | 23,912 | |
| Option on an interest rate swap with Lehman Brothers | ||||
| Special Financing, Inc. for the obligation to pay a fixed | ||||
| rate of 5.52% versus the three month USD-LIBOR-BBA | ||||
| maturing on May 14, 2022. | 294,500 | May-12/5.52 | 9,601 | |
| Option on an interest rate swap with Lehman Brothers | ||||
| Special Financing, Inc. for the obligation to receive a fixed | ||||
| rate of 5.52% versus the three month USD-LIBOR-BBA | ||||
| maturing on May 14, 2022. | 294,500 | May-12/5.52 | 12,760 | |
| Option on an interest rate swap with JPMorgan Chase | ||||
| Bank, N.A. for the obligation to receive a fixed rate of | ||||
| 5.32% versus the three month USD-LIBOR-BBA | ||||
| maturing on January 9, 2022. | 42,602,000 | Jan-12/5.32 | 2,121,013 | |
| Option on an interest rate swap with JPMorgan Chase | ||||
| Bank, N.A. for the obligation to pay a fixed rate of 5.32% | ||||
| versus the three month USD-LIBOR-BBA maturing | ||||
| on January 9, 2022. | 42,602,000 | Jan-12/5.32 | 1,181,264 | |
| Total | $5,262,442 | |||
TBA SALE COMMITMENTS OUTSTANDING at 5/31/07 (proceeds receivable $67,289,957) (Unaudited) | |||||||
| Principal | Settlement | ||||||
| Agency | amount | date | Value | ||||
| FNMA, 6s, June 1, 2037 | $25,700,000 | 6/12/07 | $25,665,868 | ||||
| FNMA, 5 1/2s, June 1, 2037 | 39,900,000 | 6/12/07 | 38,952,375 | ||||
| FNMA, 5s, June 1, 2037 | 2,200,000 | 6/12/07 | 2,093,266 | ||||
| Total | $66,711,509 | ||||||
| INTEREST RATE SWAP CONTRACTS OUTSTANDING at 5/31/07 (Unaudited) | |||||||
| Payments | Payments | Unrealized | |||||
| Swap counterparty / | Termination | made by | received by | appreciation/ | |||
| Notional amount | date | fund per annum | fund per annum | (depreciation) | |||
| Bank of America, N.A. | |||||||
| $ 26,940,000 | 9/1/15 | 3 month USD-LIBOR-BBA | 4.53% | $(1,651,497) | |||
| 893,000 | 10/2/16 | 5.15631% | 3 month USD-LIBOR-BBA | 18,990 | |||
| 6,530,000 | 5/31/16 | 5.58909% | 3 month USD-LIBOR-BBA | (70,717) | |||
| 24,000,000 | 10/21/15 | 4.943% | 3 month USD-LIBOR-BBA | 786,567 | |||
| 45,000,000 | 8/11/15 | 4.892% | 3 month USD-LIBOR-BBA | 1,038,316 | |||
47
| INTEREST RATE SWAP CONTRACTS OUTSTANDING at 5/31/07 (Unaudited) continued | ||||
| Payments | Payments | Unrealized | ||
| Swap counterparty / | Termination | made by | received by | appreciation/ |
| Notional amount | date | fund per annum | fund per annum | (depreciation) |
| Citibank, N.A. | ||||
| $ 44,220,000 | 7/27/09 | 5.504% | 3 month USD-LIBOR-BBA | $ (775,447) |
| 131,500,000 | 4/6/09 | 3 month USD-LIBOR-BBA | 5.264% | (268,888) |
| Credit Suisse International | ||||
| 1,320,000 | 9/28/16 | 5.10886% | 3 month USD-LIBOR-BBA | 33,105 |
| Goldman Sachs International | ||||
| 1,354,000 | 5/3/16 | 5.565% | 3 month USD-LIBOR-BBA | (12,246) |
| 21,940,000 | 1/8/12 | 3 month USD-LIBOR-BBA | 4.98% | (58,933) |
| 2,270,000 | 12/20/16 | 3 month USD-LIBOR-BBA | 5.074% | (36,221) |
| 15,523,000 | 11/21/26 | 3 month USD-LIBOR-BBA | 5.2075% | (715,785) |
| 69,975,000 | 11/21/08 | 5.0925% | 3 month USD-LIBOR-BBA | 315,111 |
| 15,642,000 | 11/20/26 | 3 month USD-LIBOR-BBA | 5.261% | (621,713) |
| 69,475,000 | 11/20/08 | 5.16% | 3 month USD-LIBOR-BBA | 245,556 |
| 833,000 | 10/19/16 | 5.32413% | 3 month USD-LIBOR-BBA | 7,606 |
| JPMorgan Chase Bank, N.A. | ||||
| 200,000 | 4/17/17 | 3 month USD-LIBOR-BBA | 5.266% | (2,950) |
| 600,000 | 4/17/09 | 5.12% | 3 month USD-LIBOR-BBA | 2,771 |
| 22,000,000 | 10/21/15 | 4.916% | 3 month USD-LIBOR-BBA | 761,247 |
| 65,600,000 | 9/2/15 | 3 month USD-LIBOR-BBA | 4.4505% | (4,375,931) |
| 15,900,000 | 8/4/16 | 3 month USD-LIBOR-BBA | 5.5195% | 303,850 |
| 31,500,000 | 8/4/08 | 3 month USD-LIBOR-BBA | 5.40% | 409,352 |
| 1,847,000 | 8/2/15 | 3 month USD-LIBOR-BBA | 4.6570% | (72,235) |
| 20,759,000 | 3/8/17 | 3 month USD-LIBOR-BBA | 5.28% | (281,181) |
| 41,470,000 | 1/31/17 | 3 month USD-LIBOR-BBA | 5.415% | 459,920 |
| 7,965,000 | 1/19/09 | 5.24% | 3 month USD-LIBOR-BBA | (83,961) |
| 2,020,000 | 1/19/17 | 3 month USD-LIBOR-BBA | 5.249% | (4,759) |
| 2,147,000 | 12/19/16 | 5.0595% | 3 month USD-LIBOR-BBA | 36,691 |
| 28,000,000 | 3/30/08 | 3 month USD-LIBOR-BBA | 5.163% | (81,594) |
| 13,500,000 | 3/30/16 | 3 month USD-LIBOR-BBA | 5.2755% | (146,117) |
| 15,598,000 | 11/20/26 | 3 month USD-LIBOR-BBA | 5.266% | (610,740) |
| 69,298,000 | 11/20/08 | 5.165% | 3 month USD-LIBOR-BBA | 239,983 |
| 23,080,000 | 10/10/13 | 5.09% | 3 month USD-LIBOR-BBA | 371,979 |
| 16,590,000 | 10/10/13 | 5.054% | 3 month USD-LIBOR-BBA | 303,563 |
| 899,000 | 9/18/16 | 5.291% | 3 month USD-LIBOR-BBA | 10,442 |
| 22,000,000 | 1/17/16 | 4.946% | 3 month USD-LIBOR-BBA | 471,812 |
| 20,539,000 | 8/15/11 | 5.412% | 3 month USD-LIBOR-BBA | (330,970) |
| Lehman Brothers International (Europe) | ||||
| 20,802,000 | 3/15/09 | 4.9298% | 3 month USD-LIBOR-BBA | 176,087 |
| 6,196,000 | 10/23/16 | 5.325% | 3 month USD-LIBOR-BBA | 56,200 |
| 15,414,000 | 10/23/08 | 5.255% | 3 month USD-LIBOR-BBA | 34,285 |
| 6,196,000 | 10/23/16 | 3 month USD-LIBOR-BBA | 5.3275% | (55,069) |
| 15,414,000 | 10/23/08 | 3 month USD-LIBOR-BBA | 5.26% | (33,279) |
| 73,940,000 | 8/3/16 | 5.5675% | 3 month USD-LIBOR-BBA | (1,664,831) |
| 139,813,000 | 8/3/11 | 5.445% | 3 month USD-LIBOR-BBA | (2,409,153) |
| 38,243,000 | 2/1/17 | 3 month USD-LIBOR-BBA | 5.08% | (585,207) |
48
| INTEREST RATE SWAP CONTRACTS OUTSTANDING at 5/31/07 (Unaudited) continued | ||||
| Payments | Payments | Unrealized | ||
| Swap counterparty / | Termination | made by | received by | appreciation/ |
| Notional amount | date | fund per annum | fund per annum | (depreciation) |
| Lehman Brothers Special Financing, Inc. | ||||
| $ 23,000,000 | 3/16/09 | 4.9275% | 3 month USD-LIBOR-BBA | $ 194,981 |
| 8,600,000 | 3/16/17 | 5.034% | 3 month USD-LIBOR-BBA | 280,494 |
| 37,160,000 | 9/29/13 | 5.0555% | 3 month USD-LIBOR-BBA | 669,787 |
| 7,140,000 | 9/8/16 | 5.3275% | 3 month USD-LIBOR-BBA | 63,157 |
| 89,764,000 | 8/3/08 | 3 month USD-LIBOR-BBA | 5.425% | 1,184,194 |
| Morgan Stanley Capital Services, Inc. | ||||
| 850,000 | 2/20/17 | 5.19% | 3 month USD-LIBOR-BBA | 5,849 |
| Total | $(6,467,529) | |||
The accompanying notes are an integral part of these financial statements.
49
| Statement of assets and liabilities 5/31/07 (Unaudited) | |
| ASSETS | |
| Investment in securities, at value (Note 1): | |
| Unaffiliated issuers (identified cost $430,459,573) | $417,504,335 |
| Repurchase agreement (identified cost $60,650,000) | 60,650,000 |
| Cash | 1,839,393 |
| Interest and other receivables | 2,480,347 |
| Receivable for shares of the fund sold | 33,015 |
| Receivable for sales of delayed delivery securities (Note 1) | 70,317,543 |
| Receivable for securities sold | 22,116,060 |
| Unrealized appreciation on swap contracts (Note 1) | 8,481,895 |
| Total assets | 583,422,588 |
| LIABILITIES | |
| Payable for variation margin (Note 1) | 151,607 |
| Distributions payable to shareholders | 115,459 |
| Payable for purchases of delayed delivery securities (Note 1) | 79,506,036 |
| Payable for securities purchased | 3,752,778 |
| Payable for shares of the fund repurchased | 537,540 |
| Payable for compensation of Manager (Note 2) | 340,936 |
| Payable for investor servicing and custodian fees (Note 2) | 89,796 |
| Payable for Trustee compensation and expenses (Note 2) | 102,177 |
| Payable for administrative services (Note 2) | 1,363 |
| Payable for distribution fees (Note 2) | 129,993 |
| Written options outstanding, at value (premiums received $6,224,024) (Notes 1 and 3) | 5,262,442 |
| Unrealized depreciation on swap contracts (Note 1) | 14,949,424 |
| TBA sales commitments, at value (proceeds receivable $67,289,957) (Note 1) | 66,711,509 |
| Other accrued expenses | 196,276 |
| Total liabilities | 171,847,336 |
| Net assets | $411,575,252 |
| REPRESENTED BY | |
| Paid-in capital (Unlimited shares authorized) (Notes 1 and 4) | $429,600,521 |
| Undistributed net investment income (Note 1) | 3,993,193 |
| Accumulated net realized loss on investments (Note 1) | (4,639,714) |
| Net unrealized depreciation of investments | (17,378,748) |
| Total — Representing net assets applicable to capital shares outstanding | $411,575,252 |
| (Continued on next page) | |
50
| Statement of assets and liabilities (Continued) | |
| COMPUTATION OF NET ASSET VALUE AND OFFERING PRICE | |
| Net asset value and redemption price per class A share | |
| ($189,251,526 divided by 38,045,042 shares) | $4.97 |
| Offering price per class A share | |
| (100/96.75 of $4.97)* | $5.14 |
| Net asset value and offering price per class B share | |
| ($50,157,206 divided by 10,055,275 shares)** | $4.99 |
| Net asset value and offering price per class C share | |
| ($10,441,535 divided by 2,099,333 shares)** | $4.97 |
| Net asset value and redemption price per class M share | |
| ($5,337,559 divided by 1,068,075 shares) | $5.00 |
| Offering price per class M share | |
| (100/98.00 of $5.00)* | $5.10 |
| Net asset value, offering price and redemption price per class R share | |
| ($352,588 divided by 70,903 shares) | $4.97 |
| Net asset value, offering price and redemption price per class Y share | |
| ($156,034,838 divided by 31,426,688 shares) | $4.97 |
* On single retail sales of less than $100,000. On sales of $100,000 or more the offering price is reduced.
** Redemption price per share is equal to net asset value less any applicable contingent deferred sales charge.
The accompanying notes are an integral part of these financial statements.
51
| Statement of operations Six months ended 5/31/07 (Unaudited) | |
| INVESTMENT INCOME | $10,746,172 |
| EXPENSES | |
| Compensation of Manager (Note 2) | 1,076,505 |
| Investor servicing fees (Note 2) | 529,875 |
| Custodian fees (Note 2) | 75,885 |
| Trustee compensation and expenses (Note 2) | 28,305 |
| Administrative services (Note 2) | 13,383 |
| Distribution fees — Class A (Note 2) | 245,878 |
| Distribution fees — Class B (Note 2) | 251,861 |
| Distribution fees — Class C (Note 2) | 53,852 |
| Distribution fees — Class M (Note 2) | 11,195 |
| Distribution fees — Class R (Note 2) | 687 |
| Other | 211,927 |
| Non-recurring cost (Notes 2 and 5) | 259 |
| Cost assumed by Manager (Notes 2 and 5) | (259) |
| Fees waived and reimbursed by Manager (Note 2) | (270,944) |
| Total expenses | 2,228,409 |
| Expense reduction (Note 2) | (48,715) |
| Net expenses | 2,179,694 |
| Net investment income | 8,566,478 |
| Net realized loss on investments (Notes 1 and 3) | (1,204,946) |
| Net realized loss on swap contracts (Note 1) | (1,329,710) |
| Net realized gain on futures contracts (Note 1) | 436,608 |
| Net realized gain on written options (Notes 1 and 3) | 2,048,963 |
| Net unrealized depreciation of investments, futures contracts, swap contracts, | |
| written options, and TBA sale commitments during the period | (4,993,537) |
| Net loss on investments | (5,042,622) |
| Net increase in net assets resulting from operations | $ 3,523,856 |
The accompanying notes are an integral part of these financial statements.
52
| Statement of changes in net assets | ||
| DECREASE IN NET ASSETS | ||
| Six months ended | Year ended | |
| 5/31/07* | 11/30/06 | |
| Operations: | ||
| Net investment income | $ 8,566,478 | $ 16,845,858 |
| Net realized loss on investments | (49,085) | (1,449,326) |
| Net unrealized appreciation (depreciation) of investments | (4,993,537) | 3,042,199 |
| Net increase in net assets resulting from operations | 3,523,856 | 18,438,731 |
| Distributions to shareholders: (Note 1) | ||
| From ordinary income | ||
| Net investment income | ||
| Class A | (3,985,414) | (8,525,501) |
| Class B | (1,019,200) | (2,644,271) |
| Class C | (177,745) | (342,051) |
| Class M | (108,704) | (214,414) |
| Class R | (5,161) | (6,709) |
| Class Y | (3,407,304) | (6,037,141) |
| From net realized long-term gain on investments | ||
| Class A | — | (176,533) |
| Class B | — | (66,845) |
| Class C | — | (7,785) |
| Class M | — | (3,809) |
| Class R | — | (99) |
| Class Y | — | (94,029) |
| Redemption fees (Note 1) | 86 | 643 |
| Decrease from capital share transactions (Note 4) | (31,515,905) | (141,842,458) |
| Total decrease in net assets | (36,695,491) | (141,522,271) |
| NET ASSETS | ||
| Beginning of period | 448,270,743 | 589,793,014 |
| End of period (including undistributed net investment income | ||
| of $3,993,193 and $4,130,243, respectively) | $411,575,252 | $448,270,743 |
| ||
The accompanying notes are an integral part of these financial statements.
53
| Financial highlights | (For a common share outstanding throughout the period) | |||||||||||||
| INVESTMENT OPERATIONS: | LESS DISTRIBUTIONS: | RATIOS AND SUPPLEMENTAL DATA: | ||||||||||||
| Net | Total | Ratio of net | ||||||||||||
| Net asset | realized and | Total | From | From | Net asset | return | Net | Ratio of | investment | |||||
| value, | Net | unrealized | from | net | net realized | value, | at net | assets, | expenses to | income (loss) | Portfolio | |||
| beginning | investment | gain (loss) on | investment | investment | gain on | Total | Redemption | end | asset | end of period | average net | to average | turnover | |
| Period ended | of period | income (loss) | investments | operations | income | investments | distributions | fees | of period | value (%)(a) | (in thousands) | assets (%)(b) | net assets (%) | (%) |
| CLASS A | ||||||||||||||
| May 31, 2007** | $5.03 | .10(c) | (.06) | .04 | (.10) | — | (.10) | —(e) | $4.97 | .83* | $189,252 | .51*(c) | 2.00*(c) | 51.39*(f ) |
| November 30, 2006 | 5.02 | .18(c,d) | .01 | .19 | (.18) | —(e) | (.18) | —(e) | 5.03 | 3.96 | 202,033 | .97(c,d) | 3.43(c,d) | 158.25(f ) |
| November 30, 2005 | 5.16 | .13(c) | (.11) | .02 | (.12) | (.04) | (.16) | —(e) | 5.02 | .45 | 299,066 | 1.04(c) | 2.54(c) | 388.61(f ) |
| November 30, 2004 | 5.18 | .10(c) | —(e) | .10 | (.08) | (.04) | (.12) | —(e) | 5.16 | 2.00 | 340,044 | 1.01(c) | 1.82(c) | 262.64 |
| November 30, 2003 | 5.17 | .06 | .04 | .10 | (.06) | (.03) | (.09) | — | 5.18 | 2.00 | 439,463 | .98 | 1.26 | 509.05(g) |
| November 30, 2002 | 5.10 | .17 | .12 | .29 | (.20) | (.02) | (.22) | — | 5.17 | 5.85 | 588,232 | .97 | 3.18 | 538.64(g) |
| CLASS B | ||||||||||||||
| May 31, 2007** | $5.05 | .08(c) | (.05) | .03 | (.09) | — | (.09) | —(e) | $4.99 | .52* | $50,157 | .81*(c) | 1.65*(c) | 51.39*(f ) |
| November 30, 2006 | 5.03 | .15(c,d) | .02 | .17 | (.15) | —(e) | (.15) | —(e) | 5.05 | 3.53 | 67,917 | 1.57(c,d) | 2.83(c,d) | 158.25(f ) |
| November 30, 2005 | 5.17 | .10(c) | (.11) | (.01) | (.09) | (.04) | (.13) | —(e) | 5.03 | (.16) | 113,794 | 1.64(c) | 1.91(c) | 388.61(f ) |
| November 30, 2004 | 5.19 | .06(c) | .01 | .07 | (.05) | (.04) | (.09) | —(e) | 5.17 | 1.38 | 180,802 | 1.61(c) | 1.21(c) | 262.64 |
| November 30, 2003 | 5.18 | .03 | .04 | .07 | (.03) | (.03) | (.06) | — | 5.19 | 1.38 | 290,981 | 1.58 | .65 | 509.05(g) |
| November 30, 2002 | 5.11 | .14 | .12 | .26 | (.17) | (.02) | (.19) | — | 5.18 | 5.21 | 410,169 | 1.57 | 2.47 | 538.64(g) |
| CLASS C | ||||||||||||||
| May 31, 2007** | $5.03 | .08(c) | (.06) | .02 | (.08) | — | (.08) | —(e) | $4.97 | .45* | $10,442 | .88*(c) | 1.62*(c) | 51.39*(f ) |
| November 30, 2006 | 5.02 | .14(c,d) | .01 | .15 | (.14) | —(e) | (.14) | —(e) | 5.03 | 3.19 | 11,164 | 1.72(c,d) | 2.67(c,d) | 158.25(f ) |
| November 30, 2005 | 5.16 | .10(c) | (.12) | (.02) | (.08) | (.04) | (.12) | —(e) | 5.02 | (.31) | 13,246 | 1.79(c) | 1.79(c) | 388.61(f ) |
| November 30, 2004 | 5.18 | .06(c) | —(e) | .06 | (.04) | (.04) | (.08) | —(e) | 5.16 | 1.24 | 16,629 | 1.76(c) | 1.06(c) | 262.64 |
| November 30, 2003 | 5.17 | .02 | .04 | .06 | (.02) | (.03) | (.05) | — | 5.18 | 1.23 | 28,346 | 1.73 | .49 | 509.05(g) |
| November 30, 2002 | 5.10 | .13 | .12 | .25 | (.16) | (.02) | (.18) | — | 5.17 | 5.06 | 38,613 | 1.72 | 2.38 | 538.64(g) |
| CLASS M | ||||||||||||||
| May 31, 2007** | $5.06 | .10(c) | (.06) | .04 | (.10) | — | (.10) | —(e) | $5.00 | .75* | $5,338 | .59*(c) | 1.91*(c) | 51.39*(f ) |
| November 30, 2006 | 5.04 | .17(c,d) | .02 | .19 | (.17) | —(e) | (.17) | —(e) | 5.06 | 3.99 | 5,835 | 1.12(c,d) | 3.28(c,d) | 158.25(f ) |
| November 30, 2005 | 5.18 | .13(c) | (.12) | .01 | (.11) | (.04) | (.15) | —(e) | 5.04 | .28 | 6,481 | 1.19(c) | 2.38(c) | 388.61(f ) |
| November 30, 2004 | 5.20 | .09(c) | .01 | .10 | (.08) | (.04) | (.12) | —(e) | 5.18 | 1.85 | 8,399 | 1.16(c) | 1.66(c) | 262.64 |
| November 30, 2003 | 5.18 | .05 | .06 | .11 | (.06) | (.03) | (.09) | — | 5.20 | 2.04 | 12,376 | 1.13 | 1.12 | 509.05(g) |
| November 30, 2002 | 5.11 | .16 | .12 | .28 | (.19) | (.02) | (.21) | — | 5.18 | 5.68 | 21,874 | 1.12 | 3.07 | 538.64(g) |
| CLASS R | ||||||||||||||
| May 31, 2007** | $5.03 | .10(c) | (.07) | .03 | (.09) | — | (.09) | —(e) | $4.97 | .70* | $353 | .64*(c) | 1.99*(c) | 51.39*(f) |
| November 30, 2006 | 5.02 | .16(c,d) | .02 | .18 | (.17) | —(e) | (.17) | —(e) | 5.03 | 3.69 | 216 | 1.22(c,d) | 3.16(c,d) | 158.25(f ) |
| November 30, 2005 | 5.16 | .12(c) | (.11) | .01 | (.11) | (.04) | (.15) | —(e) | 5.02 | .20 | 164 | 1.29(c) | 2.39(c) | 388.61(f ) |
| November 30, 2004† | 5.18 | .08(c) | .01 | .09 | (.07) | (.04) | (.11) | —(e) | 5.16 | 1.78 | 72 | 1.26(c) | 1.63(c) | 262.64 |
| CLASS Y | ||||||||||||||
| May 31, 2007** | $5.03 | .11(c) | (.06) | .05 | (.11) | — | (.11) | —(e) | $4.97 | .95* | $156,035 | .39*(c) | 2.12*(c) | 51.39*(f ) |
| November 30, 2006 | 5.01 | .19(c,d) | .02 | .21 | (.19) | —(e) | (.19) | —(e) | 5.03 | 4.42 | 161,106 | .72(c,d) | 3.67(c,d) | 158.25(f ) |
| November 30, 2005 | 5.15 | .15(c) | (.12) | .03 | (.13) | (.04) | (.17) | —(e) | 5.01 | .68 | 157,041 | .79(c) | 2.80(c) | 388.61(f ) |
| November 30, 2004 | 5.17 | .11(c) | .01 | .12 | (.10) | (.04) | (.14) | —(e) | 5.15 | 2.28 | 164,676 | .76(c) | 2.07(c) | 262.64 |
| November 30, 2003 | 5.16 | .07 | .05 | .12 | (.08) | (.03) | (.11) | — | 5.17 | 2.27 | 172,240 | .73 | 1.51 | 509.05(g) |
| November 30, 2002 | 5.09 | .18 | .12 | .30 | (.21) | (.02) | (.23) | — | 5.16 | 6.13 | 185,303 | .72 | 3.55 | 538.64(g) |
| See notes to financial highlights at the end of this section. | ||||||||||||||
| The accompanying notes are an integral part of these financial statements. | ||||||||||||||
| 54 | 55 |
Financial highlights (Continued)
* Not annualized.
** Unaudited.
† For the period December 1, 2003 (commencement of operations) to November 30, 2004.
(a) Total return assumes dividend reinvestment and does not reflect the effect of sales charges.
(b) Includes amounts paid through expense offset (Note 2).
(c) Reflects an involuntary contractual expense limitation in effect during the period. As a result of such limitation, the expenses of each class reflect a reduction of the following amounts (Note 2):
| Percentage | |
| of average | |
| net assets | |
| May 31, 2007 | 0.06% |
| November 30, 2006 | 0.02 |
| November 30, 2005 | 0.01 |
| November 30, 2004 | 0.10 |
(d) Reflects a non-recurring reimbursement from Putnam Investments relating to the calculation of certain amounts paid by the fund to Putnam in previous years for transfer agent services, which amounted to less than $0.01 per share and 0.05% of average net assets for the period ended November 30, 2006.
(e) Amount represents less than $0.01 per share.
(f) Portfolio turnover excludes dollar roll transactions.
(g) Portfolio turnover excludes certain treasury note transactions executed in connection with a short-term trading strategy.
The accompanying notes are an integral part of these financial statements.
56
Notes to financial statements 5/31/07 (Unaudited)
Note 1: Significant accounting policies
Putnam Limited Duration Government Income Fund (the “fund”), a Massachusetts business trust, formerly Putnam Intermediate U.S. Government Income Fund, is registered under the Investment Company Act of 1940, as amended, as a diversified, open-end management investment company. The fund seeks high current income consistent with preservation of capital, through investments primarily in U.S. government securities.
The fund offers class A, class B, class C, class M, class R and class Y shares. Class A and class M shares are sold with a maximum front-end sales charge of 3.25% and 2.00%, respectively, and generally do not pay a contingent deferred sales charge. Class B shares, which convert to class A shares after approximately eight years, do not pay a front-end sales charge and are subject to a contingent deferred sales charge if those shares are redeemed within four years of purchase. Class C shares are subject to the same fees as class B shares, except that class C shares have a one-year 1.00% contingent deferred sales charge and do not convert to class A shares. Class R shares, which are offered to qualified employee-benefit plans are sold without a front-end sales charge or a contingent deferred sales charge. The expenses for class A, class B, class C, class M and class R shares may differ based on the distribution fee of each class, which is identified in Note 2. Class Y shares, which are sold at net asset value, are generally subject to the same expenses as class A, class B, class C, class M and class R shares, but do not bear a distribution fee. Class Y shares are sold to certain eligible purchasers including certain defined contribution plans (including corporate IRAs), bank trust departments and trust companies.
Effective October 2, 2006, a 1.00% redemption fee may apply on any shares purchased on or after such date that are redeemed (either by selling or exchanging into another fund) within 7 days of purchase. The redemption fee is accounted for as an addition to paid-in-capital. Prior to October 2, 2006, a 2.00% redemption fee applied to any shares that were redeemed (either by selling or exchanging into another fund) within 5 days of purchase.
Investment income, realized and unrealized gains and losses and expenses of the fund are borne pro-rata based on the relative net assets of each class to the total net assets of the fund, except that each class bears expenses unique to that class (including the distribution fees applicable to such classes). Each class votes as a class only with respect to its own distribution plan or other matters on which a class vote is required by law or determined by the Trustees. If the fund were liquidated, shares of each class would receive their pro-rata share of the net assets of the fund. In addition, the Trustees declare separate dividends on each class of shares.
In the normal course of business, the fund enters into contracts that may include agreements to indemnify another party under given circumstances. The fund’s maximum exposure under these arrangements is unknown as this would involve future claims that may be, but have not yet been, made against the fund. However, the fund expects the risk of material loss to be remote.
The following is a summary of significant accounting policies consistently followed by the fund in the preparation of its financial statements. The preparation of financial statements is in conformity with accounting principles generally accepted in the United States of America and requires management to make estimates and assumptions that affect the reported amounts of assets and liabilities in the financial statements and the reported amounts of increases and decreases in net assets from operations during the reporting period. Actual results could differ from those estimates.
A) Security valuation Investments, including mortgage backed securities, are valued on the basis of valuations provided by an independent pricing service approved by the Trustees or dealers selected by Putnam Investment Management LLC (“Putnam Management”), the
57
fund’s manager, and indirect wholly-owned subsidiary of Putnam, LLC. Such service providers use information with respect to transactions in bonds, quotations from bond dealers, market transactions in comparable securities and various relationships between securities in determining value. Restricted securities are also valued at fair value following procedures approved by the Trustees. Such valuations and procedures are reviewed periodically by the Trustees. The fair value of securities is generally determined as the amount that the fund could reasonably expect to realize from an orderly disposition of such securities over a reasonable period of time. By its nature, a fair value price is a good faith estimate of the value of a security at a given point in time and does not reflect an actual market price, which may be different by a material amount.
B) Joint trading account Pursuant to an exemptive order from the Securities and Exchange Commission, the fund may transfer uninvested cash balances, including cash collateral received under security lending arrangements, into a joint trading account along with the cash of other registered investment companies and certain other accounts managed by Putnam Management. These balances may be invested in issues of high-grade short-term investments having maturities of up to 397 days for collateral received under security lending arrangements and up to 90 days for other cash investments.
C) Repurchase agreements The fund, or any joint trading account, through its custodian, receives delivery of the underlying securities, the market value of which at the time of purchase is required to be in an amount at least equal to the resale price, including accrued interest. Collateral for certain tri-party repurchase agreements is held at the counterparty’s custodian in a segregated account for the benefit of the fund and the counterparty. Putnam Management is responsible for determining that the value of these underlying securities is at all times at least equal to the resale price, including accrued interest.
D) Security transactions and related investment income Security transactions are recorded on the trade date (the date the order to buy or sell is executed). Gains or losses on securities sold are determined on the identified cost basis.
Interest income is recorded on the accrual basis. All premiums/discounts are amortized/accreted on a yield-to-maturity basis. Securities purchased or sold on a delayed delivery basis may be settled a month or more after the trade date; interest income is accrued based on the terms of the securities. Losses may arise due to changes in the market value of the underlying securities or if the counterparty does not perform under the contract.
E) Stripped securities The fund may invest in stripped mortgage-backed securities which represent a participation in mortgage loans and may be structured in classes with rights to receive different portions of the interest and principal. Interest-only securities receive all of the interest and principal-only securities receive all of the principal. If the interest-only securities experience greater than anticipated prepayments of principal, the fund may fail to recoup fully its initial investment in these securities. Conversely, principal-only securities increase in value if prepayments are greater than anticipated and decline if prepayments are slower than anticipated. The market value of these securities is highly sensitive to changes in interest rates.
F) Futures and options contracts The fund may use futures and options contracts to hedge against changes in the values of securities the fund owns or expects to purchase. The fund may also write options on swaps or securities it owns or in which it may invest to increase its current returns.
The potential risk to the fund is that the change in value of futures and options contracts may not correspond to the change in value of the hedged instruments. In addition, losses may arise from changes in the value of the underlying instruments, if there is an illiquid secondary market for the contracts, or if the counterparty to the contract is unable to perform. Risks may exceed
58
amounts recognized on the Statement of assets and liabilities. When the contract is closed, the fund records a realized gain or loss equal to the difference between the value of the contract at the time it was opened and the value at the time it was closed. Realized gains and losses on purchased options are included in realized gains and losses on investment securities. If a written call option is exercised, the premium originally received is recorded as an addition to sales proceeds. If a written put option is exercised, the premium originally received is recorded as a reduction to the cost of investments.
Futures contracts are valued at the quoted daily settlement prices established by the exchange on which they trade. The fund and the broker agree to exchange an amount of cash equal to the daily fluctuation in the value of the futures contract. Such receipts or payments are known as “variation margin.” Exchange traded options are valued at the last sale price, or if no sales are reported, the last bid price for purchased options and the last ask price for written options. Options traded over-the-counter are valued using prices supplied by dealers. Futures and written option contracts outstanding at period end, if any, are listed after the fund’s portfolio.
G) Interest rate swap contracts The fund may enter into interest rate swap contracts, which are arrangements between two parties to exchange cash flows based on a notional principal amount, to manage the fund’s exposure to interest rates. Interest rate swap contracts are marked to market daily based upon quotations from an independent pricing service or market makers and the change, if any, is recorded as unrealized gain or loss. Payments received or made are recorded as realized gains or loss. Certain interest rate swap contracts may include extended effective dates. Income related to these swap contracts is accrued based on the terms of the contract. The fund could be exposed to credit or market risk due to unfavorable changes in the fluctuation of interest rates or if the counterparty defaults on its obligation to perform. Risk of loss may exceed amounts recognized on the Statement of assets and liabilities. Interest rate swap contracts outstanding at period end, if any, are listed after the fund’s portfolio.
H) TBA purchase commitmentsThe fund may enter into “TBA” (to be announced) commitments to purchase securities for a fixed unit price at a future date beyond customary settlement time. Although the unit price has been established, the principal value has not been finalized. However, the amount of the commitments will not significantly differ from the principal amount. The fund holds, and maintains until settlement date, cash or high-grade debt obligations in an amount sufficient to meet the purchase price, or the fund may enter into offsetting contracts for the forward sale of other securities it owns. Income on the securities will not be earned until settlement date. TBA purchase commitments may be considered securities themselves, and involve a risk of loss if the value of the security to be purchased declines prior to the settlement date, which risk is in addition to the risk of decline in the value of the fund& #146;s other assets. Unsettled TBA purchase commitments are valued at fair value of the underlying securities, according to the procedures described under “Security valuation” above. The contract is marked to market daily and the change in market value is recorded by the fund as an unrealized gain or loss.
Although the fund will generally enter into TBA purchase commitments with the intention of acquiring securities for its portfolio or for delivery pursuant to options contracts it has entered into, the fund may dispose of a commitment prior to settlement if Putnam Management deems it appropriate to do so.
I) TBA sale commitments The fund may enter into TBA sale commitments to hedge its portfolio positions or to sell mortgage-backed securities it owns under delayed delivery arrangements. Proceeds of TBA sale commitments are not received until the contractual settlement date. During the time a TBA sale commitment is outstanding, equivalent deliverable securities or an offsetting TBA purchase commitment deliverable
59
on or before the sale commitment date, are held as “cover” for the transaction.
Unsettled TBA sale commitments are valued at the fair value of the underlying securities, generally according to the procedures described under “Security valuation” above. The contract is marked to market daily and the change in market value is recorded by the fund as an unrealized gain or loss. If the TBA sale commitment is closed through the acquisition of an offsetting purchase commitment, the fund realizes a gain or loss. If the fund delivers securities under the commitment, the fund realizes a gain or a loss from the sale of the securities based upon the unit price established at the date the commitment was entered into. TBA sale commitments outstanding at period end, if any, are listed after the fund’s portfolio.
J) Dollar rolls To enhance returns, the fund may enter into dollar rolls (principally using TBAs) in which the fund sells securities for delivery in the current month and simultaneously contracts to purchase similar securities on a specified future date. During the period between the sale and subsequent purchase, the fund will not be entitled to receive income and principal payments on the securities sold. The fund will, however, retain the difference between the initial sales price and the forward price for the future purchase. The fund will also be able to earn interest on the cash proceeds that are received from the initial sale. The fund may be exposed to market or credit risk if the price of the security changes unfavorably or the counterparty fails to perform under the terms of the agreement.
K) Federal taxes It is the policy of the fund to distribute all of its taxable income within the prescribed time and otherwise comply with the provisions of the Internal Revenue Code of 1986 (the “Code”) applicable to regulated investment companies. It is also the intention of the fund to distribute an amount sufficient to avoid imposition of any excise tax under Section 4982 of the Code, as amended. Therefore, no provision has been made for federal taxes on income, capital gains or unrealized appreciation on securities held nor for excise tax on income and capital gains.
At November 30, 2006, the fund had a capital loss carryover of $2,742,095 available to the extent allowed by the Code to offset future net capital gain, if any. This capital loss carryover will expire on November 30, 2014.
The aggregate identified cost on a tax basis is $492,458,992, resulting in gross unrealized appreciation and depreciation of $3,341,269 and $17,645,926, respectively, or net unrealized depreciation of $14,304,657.
L) Distributions to shareholders The fund declares a distribution each day based upon the projected net investment income, for a specified period, calculated as if earned prorata throughout the period on a daily basis. Such distributions are recorded daily and paid monthly. Distributions from capital gains, if any, are recorded on the ex-dividend date and paid at least annually. The amount and character of income and gains to be distributed are determined in accordance with income tax regulations, which may differ from generally accepted accounting principles. Dividend sources are estimated at the time of declaration. Actual results may vary. Any non-taxable return of capital cannot be determined until final tax calculations are completed after the end of the fund’s fiscal year. Reclassifications are made to the fund’s capital accounts to reflect income and gains available for distribution (or available capital lo ss carryovers) under income tax regulations.
Note 2: Management fee, administrative services and other transactions
Putnam Management is paid for management and investment advisory services quarterly based on the average net assets of the fund. Such fee is based on the lesser of (i) the annual rate of 0.50% of the average net assets of the fund or (ii) 0.60% of the first $500 million of average net assets, 0.50% of the next $500 million, 0.45% of the next $500 million, 0.40% of the next $5 billion, 0.375%
60
of the next $5 billion, 0.355% of the next $5 billion, 0.34% of the next $5 billion, and 0.33% thereafter.
Putnam Management has agreed to waive fees and reimburse expenses of the fund through November 30, 2007 to the extent necessary to ensure that the fund’s expenses do not exceed the simple average of the expenses of all front-end load funds viewed by Lipper Inc. as having the same investment classification or objective as the fund. The expense reimbursement is based on a comparison of the fund’s expenses with the average annualized operating expenses of the funds in its Lipper peer group for each calendar quarter during the fund’s last fiscal year, excluding 12b-1 fees and without giving effect to any expense offset and brokerage service arrangements that may reduce fund expenses.
Putnam Management has further agreed to waive fees and reimburse expenses of the fund for the period from January 1, 2007 through December 31, 2007 to the extent necessary to ensure that the fund’s expenses do not exceed the simple average of the expenses of a custom group of competitive funds selected by Lipper Inc. based on the size of the fund. The expense reimbursement is based on a comparison of the fund’s total expenses with the average operating expenses of the funds in this Lipper custom peer group for their respective 2005 fiscal years, excluding 12b-1 fees and after adjustment for certain expense offset and brokerage service arrangements that reduced expenses of the fund.
For the period ended May 31, 2007, the fund’s expenses were limited to the lower of the limits specified above and accordingly, Putnam Management waived $270,944 of its management fee from the fund.
For the period ended May 31, 2007, Putnam Management has assumed $259 of legal, shareholder servicing and communication, audit and Trustee fees incurred by the fund in connection with certain legal and regulatory matters (including those described in Note 5).
In July 2006, questions arose regarding a potential misidentification of the characteristics of certain securities in the fund’s portfolio, and the value of these securities was adjusted. The fund currently expects to be reimbursed for losses relating to this matter by Putnam. The amount of such reimbursement has not yet been determined, but is not expected to be material to the fund.
The fund reimburses Putnam Management an allocated amount for the compensation and related expenses of certain officers of the fund and their staff who provide administrative services to the fund. The aggregate amount of all such reimbursements is determined annually by the Trustees.
Custodial functions for the fund’s assets were provided by Putnam Fiduciary Trust Company (“PFTC”), a subsidiary of Putnam, LLC, and by State Street Bank and Trust Company. Custody fees are based on the fund’s asset level, the number of its security holdings and transaction volumes. Putnam Investor Services, a division of PFTC, provided investor servicing agent functions to the fund. Putnam Investor Services received fees for investor servicing based on the number of shareholder accounts in the fund and the level of defined contribution plan assets in the fund. During the period ended May 31, 2007, the fund incurred $599,092 for custody and investor servicing agent functions provided by PFTC.
The fund has entered into arrangements with PFTC and State Street Bank and Trust Company whereby PFTC’s and State Street Bank and Trust Company’s fees are reduced by credits allowed on cash balances. For the period ended May 31, 2007, the fund’s expenses were reduced by $48,715 under these arrangements.
Each independent Trustee of the fund receives an annual Trustee fee, of which $334, as a quarterly retainer, has been allocated to the fund, and an additional fee for each Trustees meeting attended. Trustees receive additional fees for attendance at certain committee meetings, industry seminars and
61
for certain compliance-related matters. Trustees also are reimbursed for expenses they incur relating to their services as Trustees. George Putnam, III, who was not an independent Trustee during the period, also receives the foregoing fees for his services as Trustee.
The fund has adopted a Trustee Fee Deferral Plan (the “Deferral Plan”) which allows the Trustees to defer the receipt of all or a portion of Trustees fees payable on or after July 1, 1995. The deferred fees remain invested in certain Putnam funds until distribution in accordance with the Deferral Plan.
The fund has adopted an unfunded noncontributory defined benefit pension plan (the “Pension Plan”) covering all Trustees of the fund who have served as a Trustee for at least five years and were first elected prior to 2004. Benefits under the Pension Plan are equal to 50% of the Trustee’s average annual attendance and retainer fees for the three years ended December 31, 2005. The retirement benefit is payable during a Trustee’s lifetime, beginning the year following retirement, for the number of years of service through December 31, 2006. Pension expense for the fund is included in Trustee compensation and expenses in the Statement of operations. Accrued pension liability is included in Payable for Trustee compensation and expenses in the Statement of assets and liabilities. The Trustees have terminated the Pension Plan with respect to any Trustee first elected after 2003.
The fund has adopted distribution plans (the “Plans”) with respect to its class A, class B, class C, class M and class R shares pursuant to Rule 12b-1 under the Investment Company Act of 1940. The purpose of the Plans is to compensate Putnam Retail Management, a wholly-owned subsidiary of Putnam, LLC and Putnam Retail Management GP, Inc., for services provided and expenses incurred in distributing shares of the fund. The Plans provide for payments by the fund to Putnam Retail Management at an annual rate of up to 0.35%, 1.00%, 1.00%, 1.00% and 1.00% of the average net assets attributable to class A, class B, class C, class M and class R shares, respectively. The Trustees have approved payment by the fund at an annual rate of 0.25%, 0.85%, 1.00%, 0.40% and 0.50% of the average net assets attributable to class A, class B, class C, class M and class R shares, respectively.
For the period ended May 31, 2007, Putnam Retail Management, acting as underwriter, received net commissions of $3,848 and $79 from the sale of class A and class M shares, respectively, and received $15,549 and $528 in contingent deferred sales charges from redemptions of class B and class C shares, respectively.
A deferred sales charge of up to 1.00% and 0.40% is assessed on certain redemptions of class A and class M shares, respectively. For the period ended May 31, 2007, Putnam Retail Management, acting as underwriter, received $692 and no monies on class A and class M redemptions, respectively.
Note 3: Purchases and sales of securities
During the six months ended May 31, 2007, cost of purchases and proceeds from sales of investment securities other than U.S. government securities and short-term investments aggregated $168,275,200 and $164,333,306, respectively. Purchases and sales of U.S. government securities aggregated $3,954,354 and $3,649,000, respectively.
Written option transactions during the six months ended May 31, 2007 are summarized as follows:
| Contract | Premiums | |
| Amounts | Received | |
| Written options | ||
| outstanding at | ||
| beginning of period | $147,686,000 | $ 4,563,960 |
| Options written | 90,212,214 | 3,733,904 |
| Options expired | — | — |
| Options closed | (76,486,214) | (2,073,840) |
| Written options | ||
| outstanding at | ||
| end of period | $161,412,000 | $ 6,224,024 |
Note 4: Capital shares
At May 31, 2007, there was an unlimited number of shares of beneficial interest authorized. Transactions in capital shares were as follows:
62
| CLASS A | Shares | Amount |
| Six months ended 5/31/07: | ||
| Shares sold | 4,325,735 | $ 21,663,928 |
| Shares issued | ||
| in connection | ||
| with reinvestment | ||
| of distributions | 748,747 | 3,743,523 |
| 5,074,482 | 25,407,451 | |
| Shares | ||
| repurchased | (7,157,945) | (35,811,703) |
| Net decrease | (2,083,463) | $ (10,404,252) |
| Year ended 11/30/06: | ||
| Shares sold | 8,690,847 | $ 43,337,165 |
| Shares issued | ||
| in connection | ||
| with reinvestment | ||
| of distributions | 1,536,464 | 7,665,110 |
| 10,227,311 | 51,002,275 | |
| Shares | ||
| repurchased | (29,697,823) | (147,838,662) |
| Net decrease | (19,470,512) | $ (96,836,387) |
| CLASS B | Shares | Amount |
| Six months ended 5/31/07: | ||
| Shares sold | 437,582 | $ 2,198,109 |
| Shares issued | ||
| in connection | ||
| with reinvestment | ||
| of distributions | 172,569 | 865,147 |
| 610,151 | 3,063,256 | |
| Shares | ||
| repurchased | (4,009,773) | (20,121,421) |
| Net decrease | (3,399,622) | $(17,058,165) |
| Year ended 11/30/06: | ||
| Shares sold | 1,404,492 | $ 7,013,084 |
| Shares issued | ||
| in connection | ||
| with reinvestment | ||
| of distributions | 449,534 | 2,247,791 |
| 1,854,026 | 9,260,875 | |
| Shares | ||
| repurchased | (11,016,268) | (55,045,394) |
| Net decrease | (9,162,242) | $(45,784,519) |
| CLASS C | Shares | Amount |
| Six months ended 5/31/07: | ||
| Shares sold | 169,477 | $ 847,813 |
| Shares issued | ||
| in connection | ||
| with reinvestment | ||
| of distributions | 30,492 | 152,413 |
| 199,969 | 1,000,226 | |
| Shares | ||
| repurchased | (318,472) | (1,593,176) |
| Net decrease | (118,503) | $ (592,950) |
| Year ended 11/30/06: | ||
| Shares sold | 388,936 | $ 1,936,536 |
| Shares issued | ||
| in connection | ||
| with reinvestment | ||
| of distributions | 61,723 | 307,726 |
| 450,659 | 2,244,262 | |
| Shares | ||
| repurchased | (872,462) | (4,346,378) |
| Net decrease | (421,803) | $(2,102,116) |
| CLASS M | Shares | Amount |
| Six months ended 5/31/07: | ||
| Shares sold | 48,552 | $ 244,282 |
| Shares issued | ||
| in connection | ||
| with reinvestment | ||
| of distributions | 19,936 | 100,142 |
| 68,488 | 344,424 | |
| Shares | ||
| repurchased | (154,223) | (775,124) |
| Net decrease | (85,735) | $ (430,700) |
| Year ended 11/30/06: | ||
| Shares sold | 324,554 | $ 1,632,059 |
| Shares issued | ||
| in connection | ||
| with reinvestment | ||
| of distributions | 40,147 | 201,099 |
| 364,701 | 1,833,158 | |
| Shares | ||
| repurchased | (496,866) | (2,489,308) |
| Net decrease | (132,165) | $ (656,150) |
63
| CLASS R | Shares | Amount |
| Six months ended 5/31/07: | ||
| Shares sold | 59,051 | $ 296,146 |
| Shares issued | ||
| in connection | ||
| with reinvestment | ||
| of distributions | 1,028 | 5,137 |
| 60,079 | 301,283 | |
| Shares | ||
| repurchased | (32,174) | (160,807) |
| Net increase | 27,905 | $ 140,476 |
| Year ended 11/30/06: | ||
| Shares sold | 20,552 | $ 102,381 |
| Shares issued | ||
| in connection | ||
| with reinvestment | ||
| of distributions | 1,359 | 6,768 |
| 21,911 | 109,149 | |
| Shares | ||
| repurchased | (11,626) | (57,295) |
| Net increase | 10,285 | $ 51,854 |
| CLASS Y | Shares | Amount |
| Six months ended 5/31/07: | ||
| Shares sold | 950,003 | $ 4,744,831 |
| Shares issued | ||
| in connection | ||
| with reinvestment | ||
| of distributions | 683,066 | 3,407,287 |
| 1,633,069 | 8,152,118 | |
| Shares | ||
| repurchased | (2,266,052) | (11,322,432) |
| Net decrease | (632,983) | $ (3,170,314) |
| Year ended 11/30/06: | ||
| Shares sold | 3,032,740 | $ 15,040,666 |
| Shares issued | ||
| in connection | ||
| with reinvestment | ||
| of distributions | 1,232,179 | 6,131,170 |
| 4,264,919 | 21,171,836 | |
| Shares | ||
| repurchased | (3,552,290) | (17,686,976) |
| Net increase | 712,629 | $ 3,484,860 |
Note 5: Regulatory matters and litigation
In late 2003 and 2004, Putnam Management settled charges brought by the Securities and Exchange Commission (the “SEC”) and the Massachusetts Securities Division (“MSD”) in connection with excessive short-term trading by certain former Putnam employees and, in the case of charges brought by the MSD, excessive short-term trading by participants in some Putnam-administered 401(k) plans. Putnam Management agreed to pay $193.5 million in penalties and restitution, of which $153.5 million will be distributed to certain open-end Putnam funds and their shareholders after the SEC and MSD approve a distribution plan being developed by an independent consultant. The allegations of the SEC and MSD and related matters have served as the general basis for certain lawsuits, including purported class action lawsuits filed against Putnam Management and, in a limited number of cases, against some Putnam funds. Putnam Management believes that these lawsuits will ha ve no material adverse effect on the funds or on Putnam Management’s ability to provide investment management services. In addition, Putnam Management has agreed to bear any costs incurred by the Putnam funds as a result of these matters.
Putnam Management and Putnam Retail Management are named as defendants in a civil suit in which the plaintiffs allege that the management and distribution fees paid by certain Putnam funds were excessive and seek recovery under the Investment Company Act of 1940. Putnam Management and Putnam Retail Management have contested the plaintiffs’ claims and the matter is currently pending in the U.S. District Court for the District of Massachusetts. Based on currently available information, Putnam Management believes that this action is without merit and that it is unlikely to have a material effect on Putnam Management’s and Putnam Retail Management’s ability to provide services to their clients, including the fund.
64
Note 6: New accounting pronouncements
In June 2006, the Financial Accounting Standards Board (“FASB”) issued Interpretation No. 48, Accounting for Uncertainty in Income Taxes (the “Interpretation”). The Interpretation prescribes a minimum threshold for financial statement recognition of the benefit of a tax position taken or expected to be taken by a filer in the filer’s tax return. The Interpretation is not expected to have a material effect on the fund's financial statements. However, the conclusions regarding the Interpretation may be subject to review and adjustment at a later date based on factors including, but not limited to, further implementation guidance expected from the FASB, and on-going analysis of tax laws, regulations and interpretations thereof.
In September 2006, the FASB issued Statement of Financial Accounting Standards No. 157, Fair Value Measurements (the “Standard”). The Standard defines fair value, sets out a framework for measuring fair value and requires additional disclosures about fair value measurements. The Standard applies to fair value measurements already required or permitted by existing standards. The Standard is effective for financial statements issued for fiscal years beginning after November 15, 2007 and interim periods within those fiscal years. Putnam Management is currently evaluating what impact the adoption of the Standard will have on the fund’s financial statements.
Note 7: Actions by trustees
The Trustees of the Putnam Funds have approved a plan to merge the fund into Putnam U.S. Government Income Trust. The transaction is scheduled to occur in the fall of 2007. It is subject to a number of conditions, including approval of a majority of the outstanding shareholders of your fund, and there is no guarantee that it will occur.
65
Shareholder meeting
results (Unaudited)
May 15, 2007 meeting
A proposal to approve a new management contract between the fund and Putnam Investment Management, LLC was approved as follows:
| Votes for | Votes against | Abstentions |
| 62,490,177 | 1,499,150 | 1,114,727 |
| All tabulations are rounded to the nearest whole number. | ||
66
Putnam puts your
interests first
In January 2004, Putnam began introducing a number of voluntary initiatives designed to reduce fund expenses, provide investors with more useful information, and help safeguard the interests of all Putnam investors. Visit www.putnam.com for details.
Cost-cutting initiatives
Reduced sales charges The maximum sales charge for class A shares has been reduced to 5.25% for equity funds (formerly 5.75%) and 3.75% for most income funds (formerly 4.50%) . The maximum sales charge for class M shares has been reduced to 3.25% for equity funds (formerly 3.50%) .*
Lower class B purchase limit To help ensure that investors are in the most cost-effective share class, the maximum amount that can be invested in class B shares has been reduced to $100,000. (Larger trades or accumulated amounts will be refused.)
Ongoing expenses will be limited Through calendar 2007, total ongoing expenses, including management fees for all funds, will be maintained at or below the average of each fund’s industry peers in its Lipper load-fund universe. For more information, please see the Statement of Additional information.
Improved disclosure
Putnam fund prospectuses and shareholder reports have been revised to disclose additional information that will help shareholders compare funds and weigh their costs and risks along with their potential benefits. Shareholders will find easy-to-understand information about fund expense ratios, portfolio manager compensation, risk comparisons, turnover comparisons, brokerage commissions, and employee and trustee ownership of Putnam funds. Disclosure of breakpoint discounts has also been enhanced to alert investors to potential cost savings.
Protecting investors’ interests
Short-term trading fee introduced To discourage short-term trading, which can interfere with a fund’s long-term strategy, a 1% short-term trading fee may be imposed on any Putnam fund shares (other than money market funds) redeemed or exchanged within seven calendar days of purchase (for certain funds, this fee applies for 90 days).
* The maximum sales charge for class A shares of Putnam Limited Duration Government Income Fund and Putnam Floating Rate Income Fund remains 3.25% .
67
Services for shareholders
Investor services
Help your investment grow Set up a program for systematic investing from a Putnam fund or from your own savings or checking account. (Regular investing does not guarantee a profit or protect against loss in a declining market.)
Switch funds easily* You can move money from one Putnam fund to another within the same class of shares without a service charge.
Access your money easily You can have checks sent regularly or redeem shares any business day at the then-current net asset value, which may be more or less than the original cost of the shares. Class B and class C shares carry a sales charge that is applied to certain withdrawals.
How to buy additional shares You may buy shares through your financial advisor or directly from Putnam. To open an account by mail, send a check made payable to the name of the fund along with a completed fund application. To add to an existing account, complete the investment slip found at the top of your Confirmation of Activity statement and return it with a check payable to your fund.
For more information
Visit www.putnam.com A secure section of our Web site contains complete information on your account, including balances and transactions, updated daily. You may also conduct transactions, such as exchanges, additional investments, and address changes. Log on today to get your password.
Call us toll free at 1-800-225-1581 Ask a helpful Putnam representative or your financial advisor for details about any of these or other services, or see your prospectus.
*This privilege is subject to change or termination. An exchange of funds may result in a taxable event. In addition, a 1% redemption fee will be applied to shares exchanged or sold within 7 days of purchase, and, for certain funds, this fee applies on total assets redeemed or exchanged within 90 days of purchase.
68
Fund information
Founded nearly 70 years ago, Putnam Investments was built around the concept that a balance between risk and reward is the hallmark of a well-rounded financial program. We manage over 100 mutual funds in growth, value, blend, fixed income, and international.
| Investment Manager | Officers | Francis J. McNamara, III |
| Putnam Investment | Charles E. Haldeman, Jr. | Vice President and |
| Management, LLC | President | Chief Legal Officer |
| One Post Office Square | ||
| Boston, MA 02109 | Charles E. Porter | Robert R. Leveille |
| Executive Vice President, | Vice President and | |
| Principal Executive Officer, | Chief Compliance Officer | |
| Marketing Services | Associate Treasurer and | |
| Putnam Retail Management | Compliance Liaison | Mark C. Trenchard |
| One Post Office Square | Vice President and | |
| Boston, MA 02109 | Jonathan S. Horwitz | BSA Compliance Officer |
| Senior Vice President | ||
| Custodian | and Treasurer | Judith Cohen |
| State Street Bank | Vice President, Clerk and | |
| and Trust Company | Steven D. Krichmar | Assistant Treasurer |
| Vice President and | ||
| Legal Counsel | Principal Financial Officer | Wanda M. McManus |
| Ropes & Gray LLP | Vice President, Senior Associate | |
| Treasurer and Assistant Clerk | ||
| Trustees | Janet C. Smith | |
| John A. Hill, Chairman | Vice President, Principal | Nancy E. Florek |
| Jameson Adkins Baxter, | Accounting Officer and | Vice President, Assistant Clerk, |
| Vice Chairman | Assistant Treasurer | Assistant Treasurer and |
| Charles B. Curtis | Proxy Manager | |
| Myra R. Drucker | Susan G. Malloy | |
| Charles E. Haldeman, Jr. | Vice President and | |
| Paul L. Joskow | Assistant Treasurer | |
| Elizabeth T. Kennan | ||
| Kenneth R. Leibler | Beth S. Mazor | |
| Robert E. Patterson | Vice President | |
| George Putnam, III | ||
| W. Thomas Stephens | James P. Pappas | |
| Richard B. Worley | Vice President | |
| Richard S. Robie, III | ||
| Vice President |
This report is for the information of shareholders of Putnam Limited Duration Government Income Fund. It may also be used as sales literature when preceded or accompanied by the current prospectus, the most recent copy of Putnam’s Quarterly Performance Summary, and Putnam’s Quarterly Ranking Summary. For more recent performance, please visit www.putnam.com. Investors should carefully consider the investment objective, risks, charges, and expenses of a fund, which are described in its prospectus. For this and other information or to request a prospectus, call 1-800-225-1581 toll free. Please read the prospectus carefully before investing. The fund’s Statement of Additional Information contains additional information about the fund’s Trustees and is available without charge upon request by calling 1-800-225-1581.

Item 2. Code of Ethics:
Not applicable
Item 3. Audit Committee Financial Expert:
Not applicable
Item 4. Principal Accountant Fees and Services:
Not applicable
Item 5. Audit Committee of Listed Registrants
Not applicable
Item 6. Schedule of Investments:
The registrant’s schedule of investments in unaffiliated issuers is included in the report to
shareholders in Item 1 above.
Item 7. Disclosure of Proxy Voting Policies and Procedures For Closed-End Management
Investment Companies:
Not applicable
Item 8. Portfolio Managers of Closed-End Investment Companies
Not Applicable
Item 9. Purchases of Equity Securities by Closed-End Management Investment Companies and
Affiliated Purchasers:
Not applicable
Item 10. Submission of Matters to a Vote of Security Holders:
Not applicable
Item 11. Controls and Procedures:
(a) The registrant's principal executive officer and principal financial officer have concluded, based on their evaluation of the effectiveness of the design and operation of the registrant's disclosure controls and procedures as of a date within 90 days of the filing date of this report, that the design and operation of such procedures are generally effective to provide reasonable assurance that information required to be disclosed by the registrant in this report is recorded, processed, summarized and reported within the time periods specified in the Commission's rules and forms.
(b) Changes in internal control over financial reporting: Not applicable
Item 12. Exhibits:
(a)(1) Not applicable
(a)(2) Separate certifications for the principal executive officer and principal financial officer of the registrant as required by Rule 30a-2(a) under the Investment Company Act of 1940, as amended, are filed herewith.
(b) The certifications required by Rule 30a-2(b) under the Investment Company Act of 1940, as amended, are filed herewith.
SIGNATURES
Pursuant to the requirements of the Securities Exchange Act of 1934 and the Investment Company Act of 1940, the registrant has duly caused this report to be signed on its behalf by the undersigned, thereunto duly authorized.
Putnam Limited Duration Government Income Fund
By (Signature and Title):
/s/Janet C. Smith
Janet C. Smith
Principal Accounting Officer
Date: July 26, 2007
Pursuant to the requirements of the Securities Exchange Act of 1934 and the Investment Company Act of 1940, this report has been signed below by the following persons on behalf of the registrant and in the capacities and on the dates indicated.
By (Signature and Title):
/s/Charles E. Porter
Charles E. Porter
Principal Executive Officer
Date: July 26, 2007
By (Signature and Title):
/s/Steven D. Krichmar
Steven D. Krichmar
Principal Financial Officer
Date: July 26, 2007