UNITED STATES
SECURITIES AND EXCHANGE COMMISSION
Washington, D.C. 20549
FORM N-CSR
CERTIFIED SHAREHOLDER REPORT OF REGISTERED
MANAGEMENT INVESTMENT COMPANIES
Investment Company Act file number 811-06221
Brandywine Blue Fund, Inc.
(Exact name of registrant as specified in charter)
P.O. Box 4166
Greenville, DE 19807
(Address of principal executive offices) (Zip code)
William F. D’Alonzo
P.O. Box 4166
Greenville, Delaware 19807
(Name and address of agent for service)
(302) 656-3017
Registrant's telephone number, including area code:
Date of fiscal year end: September 30
Date of reporting period: March 31, 2011
Item 1. Reports to Stockholders.
| Managed by Friess Associates, LLC | Semi-Annual Report | March 31, 2011 |
Dear Fellow Shareholders:
Investor optimism overcame macro-related uncertainty in the first three months of 2011, boosting share prices for the third consecutive quarter. Stocks climbed despite rising commodity prices, unrest in oil-producing nations and a devastating earthquake in Japan.
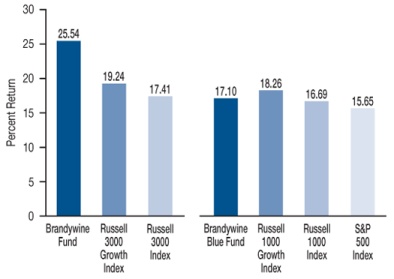
Brandywine Fund grew 9.19 percent in the March quarter, outpacing gains in the Russell 3000 and Russell 3000 Growth Indexes of 6.38 and 6.30 percent. Brandywine Blue Fund grew 4.68 percent as the S&P 500, Russell 1000 and Russell 1000 Growth Indexes gained 5.92, 6.24 and 6.03 percent.
March-quarter results contributed to a 25.54 percent return for Brandywine in the 12 months through March. The Russell 3000 and Russell 3000 Growth Indexes gained 17.41 and 19.24 percent. Brandywine Blue grew 17.10 percent in the trailing year versus gains in the S&P 500, Russell 1000 and Russell 1000 Growth of 15.65, 16.69 and 18.26 percent.
Trailing 12-Month Returns
Successful revolutions in Tunisia and Egypt inspired public demonstrations against other governments in North Africa and the Middle East, leading to a 17 percent rise in the price of oil amid the geopolitical uncertainty of the March quarter. With prices topping $100 a barrel for the first time since the fall of 2008, investors were inclined to reward the earnings prospects of the energy companies we held.
Energy holdings contributed the most to Brandywine’s quarterly results. Domestically focused drillers and producers, including Patterson-UTI Energy and SandRidge Energy (both Brandywine only), were standout performers. Patterson reported $0.37 per share in December-quarter earnings, up from a loss of $0.11 per share a year ago. SandRidge, which topped December-quarter estimates, has over the past two years transformed its reserve mix to be more heavily exposed to oil, making the company a prime beneficiary of the rise in oil prices.
| Cumulative Total Return | Brandywine % Change | Brandywine Blue % Change |
| Quarter | 9.19 | 4.68 |
| One Year | 25.54 | 17.10 |
| Five Years | -1.32 | -2.90 |
| Ten Years | 30.22 | 32.53 |
| Inception | 1,307.57* | 638.75** |
| Five Years | -0.26 | -0.59 |
| Ten Years | 2.68 | 2.86 |
| Inception | 11.04* | 10.40** |
*12/30/85 **1/10/91
Expense Ratio***
| Brandywine | 1.11% |
| Brandywine Blue | 1.17% |
***As stated in the Prospectus dated January 31, 2011
Performance data quoted represent past performance; past performance does not guarantee future results. The investment return and principal value of an investment will fluctuate so that an investor’s shares, when redeemed, may be worth more or less than their original cost. Current performance of the Funds may be lower or higher than the performance quoted. Performance data current to the most recent month end may be obtained by visiting www.brandywinefunds.com.
Holdings sensitive to consumer discretion, which accounted for the largest percentage of Brandywine’s assets, were the second largest positive influence on relative results. Tempur-Pedic International (Brandywine) was the sector’s leading contributor as a new product cycle led by its premium “Cloud” line of mattresses drove significant gains. The company grew December-quarter earnings 74 percent on 20 percent revenue growth, beating estimates. CBS Corp. (both Funds) converted its ratings lead into TV advertising success at the same time it enjoyed growth in its radio and billboard businesses, resulting in 84 percent December-quarter earnings growth.
Brandywine also benefited from strength among its holdings from the materials and industrial sectors. The financial sector was the only material detractor from results versus the Russell 3000 Growth Index, with First Niagara Financial (Brandywine) weighing the most on performance. Overall, Brandywine generated positive returns in eight out of nine economic sectors represented in its portfolio during the quarter and outperformed the index in seven out of nine instances.
Brandywine Blue also generated positive returns in eight out of nine sectors, with energy holdings as the most significant positive influence. Halliburton Co. (Brandywine Blue) was the most notable contributor in the wake of earnings strength driven by robust demand for energy-related construction services. The company exceeded March-quarter expectations as earnings grew 143 percent on 40 percent revenue growth. National Oilwell Varco (both Funds), which also beat estimates, was a standout performer as well.
While Brandywine Blue’s energy experience mirrored Brandywine’s, Brandywine Blue diverged in the two sectors that, by virtue of position size, held the most sway over the portfolio’s performance versus the Russell 1000 Growth Index.
Technology holdings comprised the largest percentage of Brandywine Blue’s assets. Although the technology sector was a modestly positive influence on absolute performance, it was the most pronounced detractor from relative results. Marvell Technology Group (Brandywine Blue) weighed on performance after providing a forecast for first-quarter sales that fell short of consensus expectations. Traditional PC demand is down amid the consumer’s strong appetite for tablet PCs. Dolby Laboratories (Brandywine Blue) and NetApp (both Funds) also impacted results.
Though a positive influence overall, consumer discretionary holdings, which represented Brandywine Blue’s second largest commitment, were the next most significant detractor from results versus the index. Royal Caribbean Cruises (both Funds) earned $0.20 per share in the December quarter versus $0.02 per share in the year ago period, exceeding expectations by $0.07 a share. Shares declined as oil prices rose. Investors grew concerned that higher fuel costs would detract from the company’s otherwise-bright 2011 earnings outlook.
Consumer discretionary holdings still comprise the largest percentage of Brandywine’s assets, followed by companies from the technology and industrial sectors. Brandywine Blue’s largest concentration of assets is in technology. The industrial sector is now the second largest in the portfolio after sales from consumer discretionary, which is the third largest.
We’re excited about the earnings strength we continue to uncover, and we’re encouraged by an environment in which individual-company fundamentals appear to be a strong and growing influence on the collective investor mindset. We’re grateful for the opportunity to serve you.
 |  |
| Bill D’Alonzo | |
| Brandywine Funds President | April 12, 2011 |
Capital Gains Update... Tax-loss carry-forwards continue to more than offset realized gains for the Brandywine Funds. In “The Bright Side of Past Fund Losses” The Wall Street Journal on April 4, 2011 wrote: “A mutual fund’s tax-loss carry-forwards act like built-in tax shelters. Funds with a large amount of embedded capital losses – both realized and unrealized – can potentially minimize their taxable distributions for years to come…This is a boon for investors holding funds in taxable accounts.” Brandywine Fund finished the March quarter with a net realized loss of $13.23 per share. Brandywine Blue Fund’s net realized loss was $14.54 per share at the end of March. The Brandywine Funds will not make capital gains distributions, which are taxable events for shareholders in taxable accounts, until gains are realized in excess of the net loss amounts. Please check upcoming reports for updates. |
Brandywine Fund
Portfolio Characteristics as of March 31, 2011
% Change in Top Ten Holdings From Book Cost
| 1. | Apple Inc. | +52.6% | | 6. | | ANSYS Inc. | -0.4% |
| 2. | National Oilwell Varco Inc. | +99.9% | | 7. | | The Walt Disney Co. | +9.5% |
| 3. | Motorola Solutions Inc. | +8.6% | | 8. | | TRW Automotive Holdings Corp. | +54.5% |
| 4. | McDermott International Inc. | +244.4% | | 9. | | Williams-Sonoma Inc. | +69.1% |
| 5. | MetroPCS Communications Inc. | +33.0% | | 10. | | Eaton Corp. | +4.3% |
| Estimated Earnings Growth Rate | The Portfolio’s Market Capitalization |
| of the Fund’s Investments | |
| | 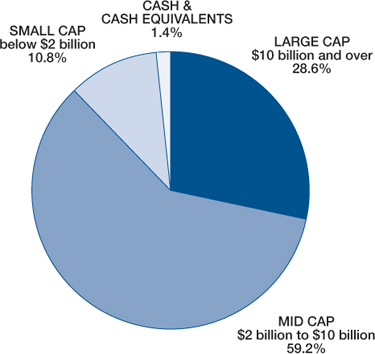 |
| The Fund’s | S&P 500’s |
| Companies | Companies |
| | |
| 23.1% | 15.3% |
| | |
Forecasted Increase in Earnings Per Share 2011 vs 2010 |
| | |
| | |
Source: Consensus estimates from Baseline Financial Services, Inc. |
This is not a forecast of the Fund’s future performance. Earnings growth for a Fund holding does not guarantee a corresponding increase in the market value of the holding or the Fund. As of March 31, 2011, the S&P 500 Index’s average annual total returns for 1, 5 and 10 years were 15.65, 2.62 and 3.29 percent. |
| |
| |
| |
| |
| |
| |
| |
| |
| |
| |
| | |
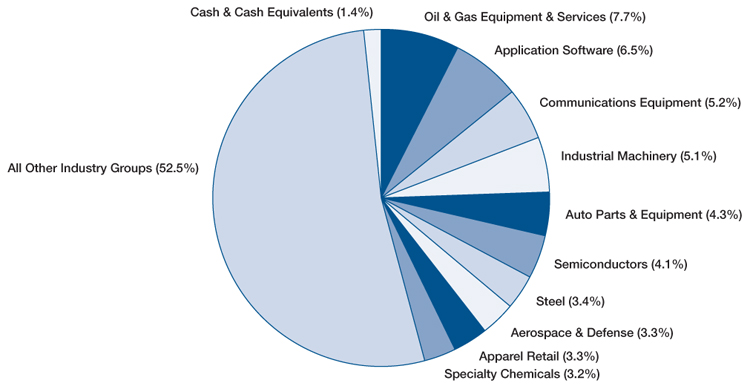
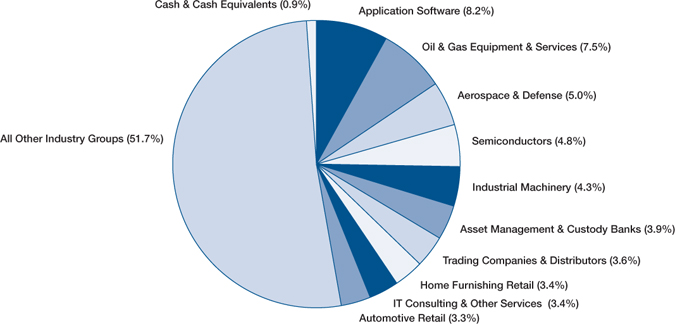
Top Ten Industry Groups
Brandywine Fund
March Quarter “Roses and Thorns”
| | $ Gain | | |
| Biggest $ Winners | (in millions) | % Gain | Reason for Move |
| SandRidge Energy Inc. | $12.9 | 73.2 | December-quarter revenue jumped 80 percent. The oil and gas producer gained ground as investors took note of increasing production following a two-year shift toward oil and away from natural gas. The company’s asset base now includes considerable low-cost, shallow reserve fields in Oklahoma and Texas. Concerns about future financing diminished during the quarter, following the establishment of a royalty trust that entitles owners to proceeds associated with future production in exchange for current funding. |
Patterson-UTI Energy Inc. | $11.5 | 34.6 | The provider of onshore contract drilling and pressure pumping services to oil and natural gas producers in North America grew December-quarter earnings to $0.37 per share from a loss of $0.11 a year ago, beating estimates by 12 percent. Rising oil prices have resulted in greater utilization and day rates for Patterson’s drilling services. At the same time, efforts to modernize equipment and expand in high-potential areas are enhancing profitability. |
MetroPCS Communications Inc. | $10.5 | 25.4 | The nation’s fifth-largest wireless carrier by number of subscribers grew December-quarter earnings 90 percent, beating the consensus estimate by 19 percent. Rolling out 4G service is bolstering the company’s competitive position and profitability as new and existing customers are attracted to its higher-margin, competitively priced smartphone plans. |
| Acme Packet Inc. | $9.5 | 34.0 | The manufacturer of telecommunications equipment that allows the delivery of real-time audio and video over the Internet grew December-quarter earnings 136 percent, beating estimates by 13 percent. Acme Packet’s session border controllers (SBCs) determine how audio and video are handled over Internet Protocol (IP) networks. The market is growing rapidly for the controllers as IP networks increasingly take the place of traditional telephone networks and are being used to enable mobile technologies. |
National Oilwell Varco Inc. | $9.0 | 17.8 | December-quarter earnings topped the consensus estimate by 9 percent and backlogged orders hit a record high. Attractive oil prices, improving economic conditions and an abundance of new deepwater drilling programs are creating demand for new rigs following a period of substantial underinvestment. National Oilwell is increasing the amount of content it provides per rig as customers turn to its broad product line of rig equipment and services to help integrate their systems and increase the safety of their operations. |
| | $ Loss | | |
| Biggest $ Losers | (in millions) | % Loss | Reason for Move |
| Silver Wheaton Corp. | $5.7 | 13.3 | The “silver streaming” company provides financing to non-silver focused mining operators in return for access at a set price to silver that is produced as a byproduct of their operations. After gaining ground late last year on strong industrial and investment-related demand for silver, shares retraced in early 2011 as sentiment regarding silver prices became volatile. We sold Silver Wheaton at a substantial gain from our original cost during the quarter. |
| Rovi Corp. | $5.4 | 12.2 | The developer of interactive programming guides, media recognition technologies and descriptive information databases embedded in consumer electronics traded lower during the quarter on concerns that expectations related to its acquisition of Sonic Solutions late last year were overly aggressive. We sold Rovi during the quarter to fund an idea with better near-term earnings visibility. |
| NII Holdings Inc. | $4.4 | 13.0 | The provider of mobile communications to business customers in South America grew December-quarter earnings 52 percent, topping estimates. While long-term growth prospects remain intact, shares traded lower as capital outlays related to numerous growth-related initiatives, including its rapid 3G network expansion in Mexico and Brazil, depressed near-term growth. We sold NII during the quarter at an overall gain from our original cost, using the proceeds to fund an idea with greater near-term earnings visibility. |
| Xerox Corp. | $3.1 | 8.1 | The provider of printers and business services grew December-quarter earnings 16 percent, topping estimates. Shares fell on confusion related to the company’s forward sales guidance, which assumed, unlike some analysts’ forecasts, that the company owned Affiliated Computer Services (ACS) for all of 2010. We sold Xerox during the quarter on concerns that synergies associated with the ACS acquisition would develop at a slower pace than expected. |
| Avery Dennison Corp. | $2.5 | 6.3 | The manufacturer of pressure-sensitive labels and office products grew December-quarter earnings 38 percent, beating estimates. Shares fell as the rapid rise in oil prices outpaced the company’s ability to pass along price increases, putting pressure on profit margins. We sold Avery during the quarter due to concerns that the company’s efforts to offset higher material costs by raising prices, accelerating material substitution and increasing productivity would take longer than expected. |
All gains/losses are calculated on an average cost basis
Brandywine Blue Fund
Portfolio Characteristics as of March 31, 2011
% Change in Top Ten Holdings From Book Cost
| 1. | Apple Inc. | +111.0% | | 6. | | Motorola Solutions Inc. | +24.6% |
| 2. | Potash Corp. of Saskatchewan Inc. | +23.1% | | 7. | | Eaton Corp. | +4.5% |
| 3. | Halliburton Co. | +65.8% | | 8. | | FedEx Corp. | -2.6% |
| 4. | National Oilwell Varco Inc. | +99.0% | | 9. | | Caterpillar Inc. | +61.2% |
| 5. | Johnson Controls Inc. | +26.2% | | 10. | | TRW Automotive Holdings Corp. | +14.6% |
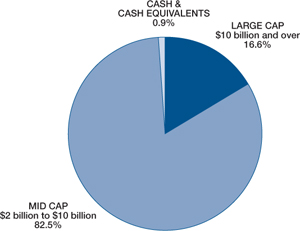
| Estimated Earnings Growth Rate | The Portfolio’s Market Capitalization |
| of the Fund’s Investments | |
| | 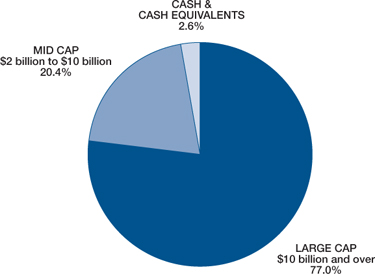 |
| The Fund’s | S&P 500’s |
| Companies | Companies |
| 17.9% | 15.3% |
| | |
Forecasted Increase in Earnings Per Share 2011 vs 2010 |
| | |
Source: Consensus estimates from Baseline Financial Services, Inc. |
This is not a forecast of the Fund’s future performance. Earnings growth for a Fund holding does not guarantee a corresponding increase in the market value of the holding or the Fund. As of March 31, 2011, the S&P 500 Index’s average annual total returns for 1, 5 and 10 years were 15.65, 2.62 and 3.29 percent. |
| |
| |
| |
| |
| |
| |
| |
| | |
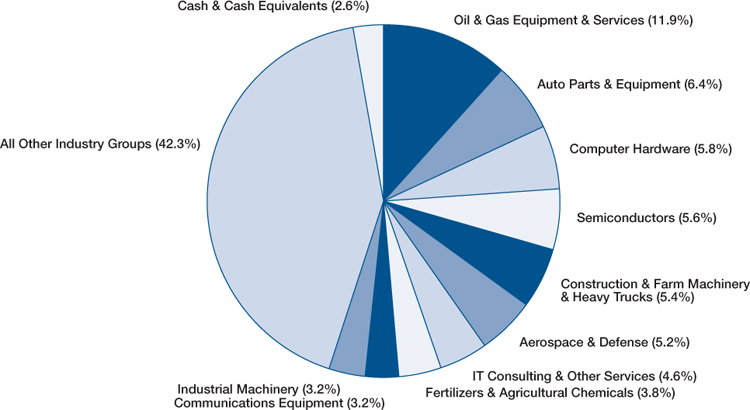
Top Ten Industry Groups
Brandywine Blue Fund
March Quarter “Roses and Thorns”
| | $ Gain | | |
| Biggest $ Winners | (in millions) | % Gain | Reason for Move |
| Halliburton Co. | $16.2 | 21.8 | The provider of oilfield services grew December-quarter earnings 143 percent, beating estimates by 8 percent. Demand for the company’s package offerings of fully integrated drilling solutions remains elevated as oil and gas wells increase in complexity and depth. Along the same lines, international opportunities are becoming more profitable as Halliburton’s foreign customers increasingly look to capitalize on modern technologies such as directional drilling. |
National Oilwell Varco Inc. | $12.8 | 17.7 | December-quarter earnings topped the consensus estimate by 9 percent and backlogged orders hit a record high. Attractive oil prices, improving economic conditions and an abundance of new deepwater drilling programs are creating demand for new rigs following a period of substantial underinvestment. National Oilwell is increasing the amount of content it provides per rig as customers turn to its broad product line of rig equipment and services to help integrate their systems and increase the safety of their operations. |
| Caterpillar Inc. | $11.1 | 14.5 | The manufacturer of construction and mining equipment grew December-quarter earnings 259 percent, beating estimates by 16 percent. Revenue increased 62 percent. The company is highly leveraged to a global recovery in industrial end markets. Through its recent acquisition of Bucyrus International, Caterpillar expanded its already-considerable footprint in international mining markets at a time when global demand for commodities is surging. |
| CBS Corp. | $10.8 | 15.1 | The operator of the CBS television network and 30 local stations grew December-quarter earnings 84 percent, beating estimates. Strong ratings relative to network television peers has led to strengthening price trends for upfront advertising as well as scatter advertising, which is advertising done on an as-needed basis. At the same time, the company’s radio and outdoor advertising segments continue to rebound, as renewed profitability has corporations looking for productive uses of cash. We sold CBS during the quarter when shares hit our target price. |
Potash Corp. of Saskatchewan Inc. | $10.4 | 13.3 | Earnings for the world’s leading producer of potash, nitrogen and phosphate products doubled in the December quarter. With 20 percent of the global capacity of potash, the company benefits as global demand for the nutrient rebounds to pre-crisis levels and price increases are steadily implemented. Tight supplies of corn, wheat and other commodities are expected to persist as diets shift in emerging countries and developed economies rebound, which bodes well for fertilizer demand going forward. |
| | $ Loss | | |
| Biggest $ Losers | (in millions) | % Loss | Reason for Move |
| NetApp Inc. | $11.9 | 18.6 | The maker of hardware and software that allows companies to more easily store, compress and access data grew January-quarter earnings 30 percent, beating the consensus estimate. Shares fell following in-line forward guidance, as the company cited supply shortages related to a flash component for the company’s new mid-range storage product. We sold NetApp during the quarter to fund an idea with greater near-term earnings visibility. |
Marvell Technology Group Ltd. | $11.1 | 20.2 | The semiconductor maker reported disappointing January-quarter results as personal computer-related sales were weaker than expected amid a consumer shift toward tablets and away from personal computers. The company’s mobile and wireless segment also suffered a setback as a key customer shifted its production for emerging markets away from 3G phones and changed its distribution agreement with Marvell. We sold Marvell during the quarter to fund an idea with greater near-term upside. |
| Silver Wheaton Corp. | $10.1 | 13.5 | The “silver streaming” company provides financing to non-silver focused mining operators in return for access at a set price to silver that is produced as a byproduct of their operations. After gaining ground late last year on strong industrial and investment-related demand for silver, shares retraced in early 2011 as sentiment regarding silver prices became volatile. We sold Silver Wheaton at a substantial gain from our original cost during the quarter. |
Dolby Laboratories Inc. | $8.9 | 20.8 | The licensor of audio technologies like surround sound reported a strong December quarter, but shares traded lower after the company reduced its earnings forecast for 2011. Reduced guidance was associated with lower shipments to personal computer manufacturers and a delay in revenue expected from a trend toward increasing production of tablet devices. We sold Dolby during the quarter to fund an idea with greater near-term earnings upside. |
| NII Holdings Inc. | $8.0 | 13.1 | The provider of mobile communications to business customers in South America grew December-quarter earnings 52 percent, topping estimates. While long-term growth prospects remain intact, shares traded lower as capital outlays related to numerous growth-related initiatives, including its rapid 3G network expansion in Mexico and Brazil, depressed near-term growth. We sold NII during the quarter at an overall gain from our original cost, using the proceeds to fund an idea with greater near-term earnings visibility. |
All gains/losses are calculated on an average cost basis
Brandywine Fund, Inc.
Statement of Assets and Liabilities
March 31, 2011 (Unaudited)
| Assets: | | | |
| Investments in securities, at value (cost $1,561,921,982) | | $ | 1,967,922,416 | |
| Receivable from investments sold | | | 12,580,836 | |
| Receivable from shareholders for purchases | | | 596,764 | |
| Dividends and interest receivable | | | 441,351 | |
| Total assets | | $ | 1,981,541,367 | |
| | | | | |
| Liabilities: | | | | |
| Payable to brokers for investments purchased | | $ | 25,324,851 | |
| Payable to adviser for management fees | | | 1,633,983 | |
| Payable to shareholders for redemptions | | | 1,065,206 | |
| Other liabilities | | | 247,882 | |
| Total liabilities | | | 28,271,922 | |
| | | | | |
| Net Assets: | | | | |
| Capital Stock, $0.01 par value; 500,000,000 shares authorized; 67,361,863 shares outstanding | | | 2,438,302,311 | |
| Net unrealized appreciation on investments | | | 406,000,434 | |
| Accumulated net realized loss on investments | | | (891,033,300 | ) |
| Net assets | | | 1,953,269,445 | |
| Total liabilities and net assets | | $ | 1,981,541,367 | |
| | | | | |
| Calculation of net asset value per share: | | | | |
Net asset value, offering and redemption price per share ($1,953,269,445 ÷ 67,361,863 shares outstanding) | | $ | 29.00 | |
The accompanying notes to financial statements are an integral part of this statement.
Schedule of Investments
March 31, 2011 (Unaudited)
| Shares | | | | Cost | | | Value | |
| | | | | | | | | |
| Common Stocks - 98.6% (a) | | | | | | |
| | | | | | | | | |
| CONSUMER DISCRETIONARY | | | | | | |
| | | Apparel Retail - 3.3% | | | | | | |
| | 359,500 | | Chico’s FAS Inc. | | $ | 4,987,360 | | | $ | 5,356,550 | |
| | 174,500 | | Express Inc. | | | 2,736,251 | | | | 3,409,730 | |
| | 282,000 | | The Finish Line Inc. | | | 4,861,529 | | | | 5,597,700 | |
| | 1,514,400 | | Foot Locker Inc. | | | 23,565,348 | | | | 29,863,968 | |
| | 328,200 | | Jos. A. Bank Clothiers Inc.* | | | 13,708,146 | | | | 16,698,816 | |
| | 166,600 | | Zumiez Inc.* | | | 4,006,562 | | | | 4,403,238 | |
| | | | Auto Parts & Equipment - 4.3% | | | | | | | | |
| | 983,200 | | Johnson Controls Inc. | | | 32,497,171 | | | | 40,871,624 | |
| | 797,700 | | TRW Automotive Holdings Corp.* | | | 28,443,772 | | | | 43,937,316 | |
| | | | Automotive Retail - 1.7% | | | | | | | | |
| | 1,030,700 | | CarMax Inc.* | | | 25,720,020 | | | | 33,085,470 | |
| | | | Broadcasting - 1.5% | | | | | | | | |
| | 372,800 | | Liberty Media-Starz* | | | 23,422,533 | | | | 28,929,280 | |
| | | | Cable & Satellite - 1.1% | | | | | | | | |
| | 439,100 | | DIRECTV* | | | 20,012,596 | | | | 20,549,880 | |
| | | | Department Stores - 1.7% | | | | | | | | |
| | 752,800 | | Nordstrom Inc. | | | 31,264,186 | | | | 33,785,664 | |
| | | | Footwear - 1.8% | | | | | | | | |
| | 415,100 | | Deckers Outdoor Corp.* | | | 33,930,031 | | | | 35,760,865 | |
| | | | Home Furnishing Retail - 2.8% | | | | | | | | |
| | 1,102,800 | | Pier 1 Imports Inc.* | | | 11,239,779 | | | | 11,193,420 | |
| | 1,064,200 | | Williams-Sonoma Inc. | | | 25,490,557 | | | | 43,100,100 | |
| | | | Home Furnishings - 1.8% | | | | | | | | |
| | 693,000 | | Tempur-Pedic International Inc.* | | | 21,552,188 | | | | 35,107,380 | |
| | | | Leisure Products - 1.7% | | | | | | | | |
| | 382,200 | | Polaris Industries Inc. | | | 30,722,829 | | | | 33,259,044 | |
| | | | Movies & Entertainment - 2.8% | | | | | | | | |
| | 1,029,300 | | The Walt Disney Co. | | | 40,496,810 | | | | 44,352,537 | |
| | 708,300 | | Regal Entertainment Group | | | 9,967,472 | | | | 9,562,050 | |
| | | | Total Consumer Discretionary | | | 388,625,140 | | | | 478,824,632 | |
| | | | This sector is 23.2% above your Fund’s cost. | | | | | | | | |
CONSUMER STAPLES | | | | | | | | |
| | | | Agricultural Products - 0.4% | | | | | | | | |
| | 452,700 | | Darling International Inc.* | | | 5,749,290 | | | | 6,957,999 | |
| | | | Packaged Foods & Meats - 0.9% | | | | | | | | |
| | 748,000 | | Smithfield Foods Inc.* | | | 18,324,789 | | | | 17,996,880 | |
| | | | Total Consumer Staples | | | 24,074,079 | | | | 24,954,879 | |
| | | | This sector is 3.7% above your Fund’s cost. | | | | | | | | |
Brandywine Fund, Inc.
Schedule of Investments (Continued)
March 31, 2011 (Unaudited)
| Shares | | | | Cost | | | Value | |
| | | | | | | | | |
| Common Stocks - 98.6% (a) (Continued) | | | | | | |
| | | | | | | | | |
| ENERGY | | | | | | |
| | | Oil & Gas Drilling - 2.0% | | | | | | |
| | 1,307,200 | | Patterson-UTI Energy Inc. | | $ | 24,485,314 | | | $ | 38,418,608 | |
| | | | Oil & Gas Equipment & Services - 7.7% | | | | | | | | |
| | 98,100 | | Basic Energy Services Inc.* | | | 2,343,807 | | | | 2,502,531 | |
| | 438,252 | | Cameron International Corp.* | | | 16,444,878 | | | | 25,024,189 | |
| | 209,000 | | Key Energy Services Inc.* | | | 2,031,331 | | | | 3,249,950 | |
| | 1,811,500 | | McDermott International Inc.* | | | 13,354,213 | | | | 45,993,985 | |
| | 678,200 | | National Oilwell Varco Inc. | | | 26,898,602 | | | | 53,760,914 | |
| | 255,400 | | Oil States International Inc.* | | | 18,720,842 | | | | 19,446,156 | |
| | | | Oil & Gas Exploration & Production - 2.6% | | | | | | | | |
| | 535,700 | | BPZ Resources Inc.* | | | 3,218,536 | | | | 2,844,567 | |
| | 573,100 | | Energy XXI (Bermuda) Ltd.* | | | 12,886,213 | | | | 19,542,710 | |
| | 2,279,600 | | SandRidge Energy Inc.* | | | 12,688,352 | | | | 29,178,880 | |
| | | | Total Energy | | | 133,072,088 | | | | 239,962,490 | |
| | | | This sector is 80.3% above your Fund’s cost. | | | | | | | | |
FINANCIALS | | | | | | | | |
| | | | Asset Management & Custody Banks - 0.8% | | | | | | | | |
| | 668,267 | | SEI Investments Co. | | | 11,615,512 | | | | 15,958,216 | |
| | | | Investment Banking & Brokerage - 0.3% | | | | | | | | |
| | 146,300 | | LPL Investment Holdings Inc.* | | | 4,615,444 | | | | 5,239,003 | |
| | | | Regional Banks - 0.9% | | | | | | | | |
| | 303,900 | | Signature Bank* | | | 10,837,390 | | | | 17,139,960 | |
| | | | Thrifts & Mortgage Finance - 2.3% | | | | | | | | |
| | 234,400 | | BankUnited Inc.* | | | 6,503,151 | | | | 6,729,624 | |
| | 2,829,900 | | First Niagara Financial Group Inc. | | | 40,788,875 | | | | 38,430,042 | |
| | | | Total Financials | | | 74,360,372 | | | | 83,496,845 | |
| | | | This sector is 12.3% above your Fund’s cost. | | | | | | | | |
HEALTH CARE | | | | | | | | |
| | | | Biotechnology - 2.1% | | | | | | | | |
| | 420,300 | | Celgene Corp.* | | | 22,073,185 | | | | 24,179,859 | |
| | 240,531 | | United Therapeutics Corp.* | | | 12,050,534 | | | | 16,120,388 | |
| | | | Health Care Equipment - 0.7% | | | | | | | | |
| | 298,000 | | Masimo Corp. | | | 8,535,018 | | | | 9,863,800 | |
| | 171,400 | | Volcano Corp.* | | | 4,197,340 | | | | 4,387,840 | |
| | | | Health Care Services - 0.3% | | | | | | | | |
| | 86,700 | | Air Methods Corp.* | | | 5,115,444 | | | | 5,830,575 | |
| | | | Pharmaceuticals - 0.9% | | | | | | | | |
| | 674,388 | | Impax Laboratories Inc.* | | | 12,127,759 | | | | 17,163,174 | |
| | | | Total Health Care | | | 64,099,280 | | | | 77,545,636 | |
| | | | This sector is 21.0% above your Fund’s cost. | | | | | | | | |
INDUSTRIALS | | | | | | | | |
| | | | Aerospace & Defense - 3.3% | | | | | | | | |
| | 43,500 | | American Science and Engineering Inc. | | | 3,276,351 | | | | 4,017,660 | |
| | 58,100 | | Ceradyne Inc.* | | | 1,464,438 | | | | 2,619,148 | |
| | 171,100 | | Precision Castparts Corp. | | | 21,639,826 | | | | 25,182,498 | |
| | 390,500 | | TransDigm Group Inc.* | | | 22,224,597 | | | | 32,735,615 | |
| | | | Air Freight & Logistics - 0.5% | | | | | | | | |
| | 260,741 | | Hub Group Inc.* | | | 6,726,217 | | | | 9,436,217 | |
| | | | Construction & Farm Machinery & Heavy Trucks - 3.0% | | | | | | | | |
| | 319,900 | | Caterpillar Inc. | | | 20,952,638 | | | | 35,620,865 | |
| | 227,727 | | Joy Global Inc. | | | 21,770,273 | | | | 22,501,705 | |
| | | | Electrical Components & Equipment - 2.2% | | | | | | | | |
| | 422,700 | | EnerSys* | | | 9,764,902 | | | | 16,802,325 | |
| | 458,200 | | Thomas & Betts Corp.* | | | 25,577,404 | | | | 27,249,154 | |
| | | | Human Resource & Employment Services - 0.8% | | | | | | | | |
| | 491,700 | | Robert Half International Inc. | | | 15,512,362 | | | | 15,046,020 | |
| | | | Industrial Machinery - 5.1% | | | | | | | | |
| | 768,600 | | Eaton Corp. | | | 40,835,123 | | | | 42,611,184 | |
| | 740,300 | | Kennametal Inc. | | | 30,020,552 | | | | 28,871,700 | |
| | 549,900 | | The Timken Co. | | | 23,932,901 | | | | 28,759,770 | |
| | | | Trading Companies & Distributors - 2.9% | | | | | | | | |
| | 515,500 | | MSC Industrial Direct Co. Inc. | | | 31,165,620 | | | | 35,296,285 | |
| | 120,900 | | Tal International Group Inc. | | | 4,352,400 | | | | 4,385,043 | |
| | 61,000 | | Textainer Group Holdings Ltd. | | | 1,682,068 | | | | 2,266,760 | |
| | 432,800 | | United Rentals Inc.* | | | 13,395,701 | | | | 14,403,584 | |
| | | | Trucking - 0.8% | | | | | | | | |
| | 1,034,800 | | Hertz Global Holdings Inc.* | | | 16,043,957 | | | | 16,173,924 | |
| | | | Total Industrials | | | 310,337,330 | | | | 363,979,457 | |
| | | | This sector is 17.3% above your Fund’s cost. | | | | | | | | |
INFORMATION TECHNOLOGY | | | | | | | | |
| | | | Application Software - 6.5% | | | | | | | | |
| | 823,100 | | ANSYS Inc.* | | | 44,788,435 | | | | 44,603,789 | |
| | 727,398 | | Autodesk Inc.* | | | 21,206,508 | | | | 32,085,526 | |
| | 161,100 | | Ebix Inc.* | | | 3,936,295 | | | | 3,810,015 | |
| | 709,300 | | Informatica Corp.* | | | 31,203,502 | | | | 37,046,739 | |
| | 156,400 | | NetScout Systems Inc.* | | | 3,605,025 | | | | 4,272,848 | |
| | 166,100 | | Taleo Corp.* | | | 5,094,317 | | | | 5,921,465 | |
| | | | Communications Equipment - 5.2% | | | | | | | | |
| | 378,093 | | Acme Packet Inc.* | | | 14,290,266 | | | | 26,829,479 | |
| | 396,013 | | Emulex Corp.* | | | 4,466,711 | | | | 4,225,459 | |
| | 1,166,800 | | Motorola Solutions Inc.* | | | 48,009,936 | | | | 52,144,292 | |
| | 130,200 | | NETGEAR Inc.* | | | 4,158,600 | | | | 4,223,688 | |
| | 394,300 | | Plantronics Inc. | | | 12,868,564 | | | | 14,439,266 | |
Brandywine Fund, Inc.
Schedule of Investments (Continued)
March 31, 2011 (Unaudited)
| Shares or | | | | | | | | |
| Principal | | | | | | | | |
| Amount | | | | Cost | | | Value | |
| | | | | | | | | |
| Common Stocks - 98.6% (a) (Continued) | | | | | | |
| | | | | | | | | |
| | | Computer Hardware - 3.0% | | | | | | |
| | 167,134 | | Apple Inc.* | | $ | 38,172,328 | | | $ | 58,237,842 | |
| | | | Electronic Manufacturing Services - 0.1% | | | | | | | | |
| | 53,300 | | Benchmark Electronics Inc.* | | | 1,053,435 | | | | 1,011,101 | |
| | | | IT Consulting & Other Services - 0.8% | | | | | | | | |
| | 304,100 | | Booz Allen Hamilton | | | | | | | | |
| | | | Holding Corp.* | | | 5,326,013 | | | | 5,476,841 | |
| | 244,000 | | Gartner Inc.* | | | 8,662,000 | | | | 10,167,480 | |
| | | | Semiconductor Equipment - 0.1% | | | | | | | | |
| | 82,300 | | FEI Co.* | | | 2,158,817 | | | | 2,775,156 | |
| | | | Semiconductors - 4.1% | | | | | | | | |
| | 443,900 | | Analog Devices Inc. | | | 16,778,638 | | | | 17,480,782 | |
| | 1,817,700 | | Atmel Corp.* | | | 22,837,065 | | | | 24,775,251 | |
| | 301,900 | | International Rectifier Corp.* | | | 9,638,907 | | | | 9,980,814 | |
| | 89,365 | | Microsemi Corp.* | | | 1,351,444 | | | | 1,850,749 | |
| | 711,534 | | OmniVision Technologies Inc.* | | | 14,513,174 | | | | 25,280,803 | |
| | | | Total Information Technology | | | 314,119,980 | | | | 386,639,385 | |
| | | | This sector is 23.1% above your Fund’s cost. | | | | | | | | |
MATERIALS | | | | | | | | |
| | | | Commodity Chemicals - 0.9% | | | | | | | | |
| | 115,700 | | Georgia Gulf Corp.* | | | 3,955,366 | | | | 4,280,900 | |
| | 112,000 | | Kronos Worldwide Inc. | | | 4,480,000 | | | | 6,546,400 | |
| | 101,500 | | Westlake Chemical Corp. | | | 5,240,528 | | | | 5,704,300 | |
| | | | Diversified Metals & Mining - 0.3% | | | | | | | | |
| | 254,700 | | Globe Specialty Metals Inc. | | | 3,968,618 | | | | 5,796,972 | |
| | | | Fertilizers & Agricultural Chemicals - 1.8% | | | | | | | | |
| | 597,900 | | Potash Corp. of Saskatchewan Inc. | | | 27,496,663 | | | | 35,234,247 | |
| | | | Metal & Glass Containers - 0.5% | | | | | | | | |
| | 140,400 | | Greif Inc. | | | 7,532,652 | | | | 9,183,564 | |
| | | | Precious Metals & Minerals - 1.4% | | | | | | | | |
| | 1,201,200 | | Stillwater Mining Co.* | | | 23,423,400 | | | | 27,543,516 | |
| | | | Specialty Chemicals - 3.2% | | | | | | | | |
| | 643,300 | | Albemarle Corp. | | | 23,474,896 | | | | 38,450,041 | |
| | 277,200 | | Lyondellbasell Industries N.V.* | | | 11,048,342 | | | | 10,963,260 | |
| | 970,400 | | PolyOne Corp. | | | 12,308,280 | | | | 13,789,384 | |
| | | | Steel - 3.4% | | | | | | | | |
| | 507,400 | | Allegheny Technologies Inc. | | | 25,537,199 | | | | 34,361,128 | |
| | 356,100 | | Carpenter Technology Corp. | | | 12,785,747 | | | | 15,209,031 | |
| | 179,800 | | Cliffs Natural Resources Inc. | | | 15,424,879 | | | | 17,670,744 | |
| | | | Total Materials | | | 176,676,570 | | | | 224,733,487 | |
| | | | This sector is 27.2% above your Fund’s cost. | | | | | | | | |
TELECOMMUNICATION SERVICES | | | | | | | | |
| | | | Wireless Telecommunication Services - 2.3% | | | | | | | | |
| | 2,788,900 | | MetroPCS Communications Inc.* | | | 34,063,274 | | | | 45,291,736 | |
| | | | Total Telecommunication Services | | | 34,063,274 | | | | 45,291,736 | |
| | | | This sector is 33.0% above your Fund’s cost. | | | | | | | | |
| | | | Total common stocks | | | 1,519,428,113 | | | | 1,925,428,547 | |
Short-Term Investments - 2.2% (a) | | | | | | | | |
| | | | Commercial Paper - 2.1% | | | | | | | | |
| $ | 40,100,000 | | Prudential Funding LLC, | | | | | | | | |
| | | | due 04/01/11, discount of 0.16% | | | 40,100,000 | | | | 40,100,000 | |
| | | | Variable Rate Demand Note - 0.1% | | | | | | | | |
| | 2,393,869 | | American Family Financial | | | | | | | | |
| | | | Services, 0.10% | | | 2,393,869 | | | | 2,393,869 | |
| | | | Total short-term investments | | | 42,493,869 | | | | 42,493,869 | |
| | | | Total investments - 100.8% | | $ | 1,561,921,982 | | | | 1,967,922,416 | |
| | | | Liabilities, less | | | | | | | | |
| | | | other assets - (0.8%) (a) | | | | | | | (14,652,971 | ) |
| | | | TOTAL NET ASSETS - 100.0% | | | | | | $ | 1,953,269,445 | |
* Non-dividend paying security.
(a) Percentages for the various classifications relate to net assets.
N.V. - Netherlands Antillies Limited Liability Corp.
The accompanying notes to financial statements are an integral part of this schedule.
Brandywine Fund, Inc.
Statement of Operations
For the Six Months Ended March 31, 2011 (Unaudited)
| Income: | | | |
| Dividends | | $ | 6,355,240 | |
| Interest | | | 50,796 | |
| Total income | | | 6,406,036 | |
| | | | | |
| Expenses: | | | | |
| Management fees | | | 9,680,615 | |
| Transfer agent fees | | | 544,800 | |
| Administrative and accounting services | | | 107,480 | |
| Printing and postage expense | | | 87,850 | |
| Custodian fees | | | 66,250 | |
| Board of Directors fees and expenses | | | 63,210 | |
| Professional fees | | | 33,895 | |
| Registration fees | | | 28,640 | |
| Other expenses | | | 20,080 | |
| Total expenses | | | 10,632,820 | |
| Net Investment Loss | | | (4,226,784 | ) |
| Net Realized Gain on Investments | | | 303,117,055 | |
| Net Increase in Unrealized Appreciation on Investments | | | 232,106,346 | |
| Net Gain on Investments | | | 535,223,401 | |
| Net Increase in Net Assets Resulting From Operations | | $ | 530,996,617 | |
Statements of Changes in Net Assets
For the Six Months Ended March 31, 2011 (Unaudited)
and for the Year Ended September 30, 2010
| | | 2011 | | | 2010 | |
| Operations: | | | | | | |
| Net investment loss | | $ | (4,226,784 | ) | | $ | (6,691,589 | ) |
| Net realized gain on investments | | | 303,117,055 | | | | 168,156,155 | |
| Net increase (decrease) in unrealized appreciation on investments | | | 232,106,346 | | | | (78,682,801 | ) |
| Net increase in net assets resulting from operations | | | 530,996,617 | | | | 82,781,765 | |
| | | | | | | | | |
| Fund Share Activities: | | | | | | | | |
| Proceeds from shares issued (6,174,358 and 5,907,401 shares, respectively) | | | 157,238,340 | | | | 129,867,845 | |
| Cost of shares redeemed (18,562,229 and 34,266,723 shares, respectively) | | | (490,719,075 | ) | | | (738,576,591 | ) |
| Net decrease in net assets derived from Fund share activities | | | (333,480,735 | ) | | | (608,708,746 | ) |
| Total Increase (Decrease) | | | 197,515,882 | | | | (525,926,981 | ) |
| | | | | | | | | |
| Net Assets at the Beginning of the Period | | | 1,755,753,563 | | | | 2,281,680,544 | |
| Net Assets at the End of the Period | | $ | 1,953,269,445 | | | $ | 1,755,753,563 | |
| (Includes undistributed net investment income of $0 and $0, respectively) | | | | | | | | |
The accompanying notes to financial statements are an integral part of these statements.
Brandywine Fund, Inc.
Financial Highlights
(Selected data for each share of the Fund outstanding throughout each period)
| | | For the Six Months | | | | | | | | | | | | | | | | |
| | | ended March 31, 2011 | | | Years Ended September 30, | |
| | | (Unaudited) | | | 2010 | | | 2009 | | | 2008 | | | 2007 | | | 2006 | |
| PER SHARE OPERATING PERFORMANCE: | | | | | | | | | | | | | | | | | | |
| Net asset value, beginning of period | | $ | 22.02 | | | $ | 21.11 | | | $ | 26.86 | | | $ | 40.98 | | | $ | 32.27 | | | $ | 31.50 | |
| | | | | | | | | | | | | | | | | | | | | | | | | |
| Income from investment operations: | | | | | | | | | | | | | | | | | | | | | | | | |
Net investment loss(1) | | | (0.06 | ) | | | (0.07 | ) | | | (0.05 | ) | | | (0.18 | ) | | | (0.19 | ) | | | (0.10 | ) |
| Net realized and unrealized gains (losses) | | | | | | | | | | | | | | | | | | | | | | | | |
| on investments | | | 7.04 | | | | 0.98 | | | | (5.59 | ) | | | (8.72 | ) | | | 9.15 | | | | 0.87 | |
| Total from investment operations | | | 6.98 | | | | 0.91 | | | | (5.64 | ) | | | (8.90 | ) | | | 8.96 | | | | 0.77 | |
| | | | | | | | | | | | | | | | | | | | | | | | | |
| Less distributions: | | | | | | | | | | | | | | | | | | | | | | | | |
| Distributions from net investment income | | | — | | | | — | | | | — | | | | — | | | | — | | | | — | |
| Distributions from net realized gains | | | — | | | | — | | | | (0.11 | ) | | | (5.22 | ) | | | (0.25 | ) | | | — | |
| Total from distributions | | | — | | | | — | | | | (0.11 | ) | | | (5.22 | ) | | | (0.25 | ) | | | — | |
| Net asset value, end of period | | $ | 29.00 | | | $ | 22.02 | | | $ | 21.11 | | | $ | 26.86 | | | $ | 40.98 | | | $ | 32.27 | |
| TOTAL RETURN | | | 31.70 | %(a) | | | 4.31 | % | | | (20.98 | %) | | | (25.16 | %) | | | 27.90 | % | | | 2.44 | % |
| | | | | | | | | | | | | | | | | | | | | | | | | |
| RATIOS/SUPPLEMENTAL DATA: | | | | | | | | | | | | | | | | | | | | | | | | |
| Net assets, end of period (in 000’s $) | | | 1,953,269 | | | | 1,755,754 | | | | 2,281,681 | | | | 3,421,787 | | | | 4,851,268 | | | | 4,066,292 | |
| Ratio of expenses to average net assets | | | 1.10 | %(b) | | | 1.11 | % | | | 1.10 | % | | | 1.08 | % | | | 1.08 | % | | | 1.08 | % |
| Ratio of net investment loss | | | | | | | | | | | | | | | | | | | | | | | | |
| to average net assets | | | (0.44 | %)(b) | | | (0.33 | %) | | | (0.25 | %) | | | (0.54 | %) | | | (0.54 | %) | | | (0.31 | %) |
| Portfolio turnover rate | | | 101 | %(a) | | | 225 | % | | | 239 | % | | | 210 | % | | | 162 | % | | | 200 | % |
| (1) | Net investment loss per share was calculated using average shares outstanding. |
The accompanying notes to financial statements are an integral part of this statement.
Definitions and Disclosures Performance data quoted represent past performance; past performance does not guarantee future results. The investment return and principal value of an investment will fluctuate so that an investor’s shares, when redeemed, may be worth more or less than their original cost. Current performance of the Funds may be lower or higher than the performance quoted. Performance data current to the most recent month end may be obtained by visiting www.brandywinefunds.com. The Funds’ investment objectives, risks, charges and expenses must be considered carefully before investing. The prospectus contains this and other important information about the investment companies, and it may be obtained by calling 1-800-656-3017, or visiting www.brandywinefunds.com. Read it carefully before investing. Fund holdings and sector weightings are subject to change at any time and are not recommendations to buy or sell any securities. Securities discussed were not held by the Funds as of 3/31/11, unless listed in the accompanying schedules of investments. Earnings growth rates quoted for the Funds refer solely to the estimated earnings growth rates of the average investment holding of the Funds based on consensus estimates from Baseline Financial Services, Inc. (Baseline) and not to the actual performance of the Funds themselves. Baseline provides analytical information and services to the investment community. The Russell 1000, Russell 1000 Growth, Russell 3000, Russell 3000 Growth and S&P 500 Indexes are unmanaged indexes commonly used to measure the performance of U.S. stocks. You cannot invest directly in an index. As of March 31, 2011, the Russell 1000 Index’s average annual total returns for 1, 5 and 10 years were 16.69, 2.93 and 3.83 percent; the Russell 1000 Growth Index’s were 18.26, 4.34 and 2.99 percent; the Russell 3000 Index’s were 17.41, 2.95 and 4.13 percent; the Russell 3000 Growth Index’s were 19.24, 4.32 and 3.26 percent; and the S&P 500 Index’s were 15.65, 2.62 and 3.29 percent. |
Brandywine Blue Fund
Statement of Assets and Liabilities
March 31, 2011 (Unaudited)
| Assets: | | | |
| Investments in securities, at value (cost $1,962,789,841) | | $ | 2,317,841,417 | |
| Receivable from investments sold | | | 48,640,831 | |
| Dividends and interest receivable | | | 3,361,540 | |
| Receivable from shareholders for purchases | | | 1,086,654 | |
| Total assets | | $ | 2,370,930,442 | |
| | | | | |
| Liabilities: | | | | |
| Payable to brokers for investments purchased | | $ | 64,012,071 | |
| Payable to adviser for management fees | | | 1,918,543 | |
| Payable to shareholders for redemptions | | | 1,877,533 | |
| Other liabilities | | | 460,662 | |
| Total liabilities | | | 68,268,809 | |
| | | | | |
| Net Assets: | | | | |
| Capital Stock, $0.01 par value; 500,000,000 shares authorized; 85,816,657 shares outstanding | | | 3,194,394,282 | |
| Net unrealized appreciation on investments | | | 355,051,576 | |
| Accumulated net realized loss on investments | | | (1,246,784,225 | ) |
| Net assets | | | 2,302,661,633 | |
| Total liabilities and net assets | | $ | 2,370,930,442 | |
| | | | | |
| Calculation of net asset value per share: | | | | |
Net asset value, offering and redemption price per share ($2,302,661,633 ÷ 85,816,657 shares outstanding) | | $ | 26.83 | |
The accompanying notes to financial statements are an integral part of this statement.
Schedule of Investments
March 31, 2011 (Unaudited)
| Shares | | | | Cost | | | Value | |
| | | | | | | | | |
| Common Stocks - 97.4% (a) | | | | | | |
| | | | | | | | | |
| CONSUMER DISCRETIONARY | | | | | | |
| | | Auto Parts & Equipment - 6.4% | | | | | | |
| | 1,885,200 | | Johnson Controls Inc. | | $ | 62,108,229 | | | $ | 78,367,764 | |
| | 1,245,800 | | TRW Automotive Holdings Corp.* | | | 59,888,007 | | | | 68,618,664 | |
| | | | Automotive Retail - 1.7% | | | | | | | | |
| | 1,191,500 | | CarMax Inc.* | | | 37,484,389 | | | | 38,247,150 | |
| | | | Cable & Satellite - 2.5% | | | | | | | | |
| | 1,233,900 | | DIRECTV* | | | 56,250,175 | | | | 57,746,520 | |
| | | | Department Stores - 2.7% | | | | | | | | |
| | 1,387,300 | | Nordstrom Inc. | | | 59,420,396 | | | | 62,262,024 | |
| | | | Movies & Entertainment - 2.9% | | | | | | | | |
| | 1,551,400 | | The Walt Disney Co. | | | 52,206,763 | | | | 66,849,826 | |
| | | | Total Consumer Discretionary | | | 327,357,959 | | | | 372,091,948 | |
| | | | This sector is 13.7% above your Fund’s cost. | | | | | | | | |
CONSUMER STAPLES | | | | | | | | |
| | | | Agricultural Products - 2.1% | | | | | | | | |
| | 1,351,500 | | Archer-Daniels-Midland Co. | | | 48,637,065 | | | | 48,667,515 | |
| | | | Drug Retail - 2.2% | | | | | | | | |
| | 1,225,800 | | Walgreen Co. | | | 45,531,759 | | | | 49,203,612 | |
| | | | Total Consumer Staples | | | 94,168,824 | | | | 97,871,127 | |
| | | | This sector is 3.9% above your Fund’s cost. | | | | | | | | |
ENERGY | | | | | | | | |
| | | | Oil & Gas Equipment & Services - 11.9% | | | | | | | | |
| | 837,200 | | Cameron International Corp.* | | | 29,462,427 | | | | 47,804,120 | |
| | 1,777,500 | | Halliburton Co. | | | 53,427,068 | | | | 88,590,600 | |
| | 2,240,600 | | McDermott International Inc.* | | | 54,117,937 | | | | 56,888,834 | |
| | 999,700 | | National Oilwell Varco Inc. | | | 39,822,741 | | | | 79,246,219 | |
| | | | Oil & Gas Exploration & Production - 2.8% | | | | | | | | |
| | 675,500 | | Noble Energy Inc. | | | 62,244,643 | | | | 65,287,075 | |
| | | | Total Energy | | | 239,074,816 | | | | 337,816,848 | |
| | | | This sector is 41.3% above your Fund’s cost. | | | | | | | | |
FINANCIALS | | | | | | | | |
| | | | Asset Management & Custody Banks - 2.4% | | | | | | | | |
| | 2,206,600 | | Invesco Ltd. | | | 50,432,507 | | | | 56,400,696 | |
| | | | Total Financials | | | 50,432,507 | | | | 56,400,696 | |
| | | | This sector is 11.8% above your Fund’s cost. | | | | | | | | |
HEALTH CARE | | | | | | | | |
| | | | Biotechnology - 2.2% | | | | | | | | |
| | 877,300 | | Celgene Corp.* | | | 46,320,097 | | | | 50,471,069 | |
| | | | Health Care Distributors - 2.5% | | | | | | | | |
| | 1,386,500 | | Cardinal Health Inc. | | | 53,886,225 | | | | 57,026,745 | |
Brandywine Blue Fund
Schedule of Investments (Continued)
March 31, 2011 (Unaudited)
| Shares or | | | | | | | | |
| Principal | | | | | | | | |
| Amount | | | | Cost | | | Value | |
| | | | | | | | | |
| Common Stocks - 97.4% (a) (Continued) | | | | | | |
| | | | | | | | | |
| | | Health Care Services - 2.8% | | | | | | |
| | 1,177,700 | | Express Scripts Inc.* | | $ | 51,936,204 | | | $ | 65,491,897 | |
| | | | Health Care Technology - 2.5% | | | | | | | | |
| | 515,700 | | Cerner Corp.* | | | 52,660,846 | | | | 57,345,840 | |
| | | | Total Health Care | | | 204,803,372 | | | | 230,335,551 | |
| | | | This sector is 12.5% above your Fund’s cost. | | | | | | | | |
INDUSTRIALS | | | | | | | | |
| | | | Aerospace & Defense - 5.2% | | | | | | | | |
| | 665,500 | | Goodrich Corp. | | | 59,711,435 | | | | 56,920,215 | |
| | 417,300 | | Precision Castparts Corp. | | | 51,764,860 | | | | 61,418,214 | |
| | | | Air Freight & Logistics - 3.0% | | | | | | | | |
| | 745,900 | | FedEx Corp. | | | 71,617,347 | | | | 69,778,945 | |
| | | | Construction & Farm Machinery & Heavy Trucks - 5.4% | | | | | | | | |
| | 622,000 | | Caterpillar Inc. | | | 42,968,102 | | | | 69,259,700 | |
| | 559,800 | | Joy Global Inc. | | | 44,967,482 | | | | 55,313,838 | |
| | | | Industrial Machinery - 3.2% | | | | | | | | |
| | 1,328,800 | | Eaton Corp. | | | 70,505,604 | | | | 73,668,672 | |
| | | | Railroads - 0.7% | | | | | | | | |
| | 156,400 | | Union Pacific Corp. | | | 13,220,234 | | | | 15,378,812 | |
| | | | Trucking - 1.8% | | | | | | | | |
| | 2,668,400 | | Hertz Global Holdings Inc.* | | | 41,744,389 | | | | 41,707,092 | |
| | | | Total Industrials | | | 396,499,453 | | | | 443,445,488 | |
| | | | This sector is 11.8% above your Fund’s cost. | | | | | | | | |
INFORMATION TECHNOLOGY | | | | | | | | |
| | | | Application Software - 2.5% | | | | | | | | |
| | 1,320,700 | | Autodesk Inc.* | | | 38,934,550 | | | | 58,256,077 | |
| | | | Communications Equipment - 3.2% | | | | | | | | |
| | 1,663,798 | | Motorola Solutions Inc.* | | | 59,677,164 | | | | 74,355,132 | |
| | | | Computer Hardware - 5.8% | | | | | | | | |
| | 297,300 | | Apple Inc.* | | | 49,090,460 | | | | 103,594,185 | |
| | 707,000 | | Hewlett-Packard Co. | | | 33,122,871 | | | | 28,965,790 | |
| | | | IT Consulting & Other Services - 4.6% | | | | | | | | |
| | 563,000 | | Cognizant Technology Solutions Corp.* | | | 35,620,714 | | | | 45,828,200 | |
| | 1,165,700 | | Teradata Corp.* | | | 57,819,336 | | | | 59,100,990 | |
| | | | Semiconductors - 5.6% | | | | | | | | |
| | 1,132,700 | | Analog Devices Inc. | | | 42,815,297 | | | | 44,605,726 | |
| | 999,100 | | Atmel Corp.* | | | 13,629,496 | | | | 13,617,733 | |
| | 1,231,900 | | Linear Technology Corp. | | | 36,015,188 | | | | 41,428,797 | |
| | 1,012,200 | | NXP Semiconductors N.V.* | | | 30,525,010 | | | | 30,366,000 | |
| | | | Systems Software - 2.8% | | | | | | | | |
| | 1,263,200 | | Check Point Software | | | | | | | | |
| | | | Technologies Ltd.* | | | 58,133,734 | | | | 64,486,360 | |
| | | | Total Information Technology | | | 455,383,820 | | | | 564,604,990 | |
| | | | This sector is 24.0% above your Fund’s cost. | | | | | | | | |
MATERIALS | | | | | | | | |
| | | | Fertilizers & Agricultural Chemicals - 3.8% | | | | | | | | |
| | 1,504,800 | | Potash Corp. of Saskatchewan Inc. | | | 72,029,764 | | | | 88,677,864 | |
| | | | Specialty Chemicals - 1.0% | | | | | | | | |
| | 557,500 | | Lyondellbasell Industries N.V.* | | | 22,247,169 | | | | 22,049,125 | |
| | | | Steel - 1.2% | | | | | | | | |
| | 288,900 | | Cliffs Natural Resources Inc. | | | 24,637,469 | | | | 28,393,092 | |
| | | | Total Materials | | | 118,914,402 | | | | 139,120,081 | |
| | | | This sector is 17.0% above your Fund’s cost. | | | | | | | | |
| | | | Total common stocks | | | 1,886,635,153 | | | | 2,241,686,729 | |
Short-Term Investments - 3.3% (a) | | | | | | | | |
| | | | Commercial Paper - 3.2% | | | | | | | | |
| $ | 73,800,000 | | Prudential Funding LLC, | | | | | | | | |
| | | | due 04/01/11, discount of 0.16% | | | 73,800,000 | | | | 73,800,000 | |
| | | | Variable Rate Demand Note - 0.1% | | | | | | | | |
| | 2,354,688 | | American Family Financial | | | | | | | | |
| | | | Services, 0.10% | | | 2,354,688 | | | | 2,354,688 | |
| | | | Total short-term investments | | | 76,154,688 | | | | 76,154,688 | |
| | | | Total investments - 100.7% | | $ | 1,962,789,841 | | | | 2,317,841,417 | |
| | | | Liabilities, less | | | | | | | | |
| | | | other assets - (0.7%) (a) | | | | | | | (15,179,784 | ) |
| | | | TOTAL NET ASSETS - 100.0% | | | | | | $ | 2,302,661,633 | |
* Non-dividend paying security.
(a) Percentages for the various classifications relate to net assets.
N.V. - Netherlands Antillies Limited Liability Corp.
The accompanying notes to financial statements are an integral part of this schedule.
Brandywine Blue Fund
Statement of Operations
For the Six Months Ended March 31, 2011 (Unaudited)
| Income: | | | |
| Dividends | | $ | 8,958,947 | |
| Interest | | | 99,406 | |
| Total income | | | 9,058,353 | |
| | | | | |
| Expenses: | | | | |
| Management fees | | | 11,053,600 | |
| Transfer agent fees | | | 1,042,000 | |
| Printing and postage expense | | | 518,300 | |
| Administrative and accounting services | | | 112,204 | |
| Board of Directors fees and expenses | | | 64,150 | |
| Custodian fees | | | 63,700 | |
| Registration fees | | | 45,925 | |
| Professional fees | | | 34,580 | |
| Other expenses | | | 30,675 | |
| Total expenses | | | 12,965,134 | |
| Net Investment Loss | | | (3,906,781 | ) |
| Net Realized Gain on Investments | | | 278,580,851 | |
| Net Increase in Unrealized Appreciation on Investments | | | 178,153,368 | |
| Net Gain on Investments | | | 456,734,219 | |
| Net Increase in Net Assets Resulting From Operations | | $ | 452,827,438 | |
Statements of Changes in Net Assets
For the Six Months Ended March 31, 2011 (Unaudited)
and for the Year Ended September 30, 2010
| | | 2011 | | | 2010 | |
| Operations: | | | | | | |
| Net investment loss | | $ | (3,906,781 | ) | | $ | (5,994,541 | ) |
| Net realized gain on investments | | | 278,580,851 | | | | 167,418,597 | |
| Net increase (decrease) in unrealized appreciation on investments | | | 178,153,368 | | | | (36,891,471 | ) |
| Net increase in net assets resulting from operations | | | 452,827,438 | | | | 124,532,585 | |
| | | | | | | | | |
| Distributions to Shareholders: | | | | | | | | |
| Distributions from net investment income ($0.06695 per share) | | | — | | | | (7,553,091 | ) |
| | | | | | | | | |
| Fund Share Activities: | | | | | | | | |
| Proceeds from shares issued (9,260,399 and 28,161,958 shares, respectively) | | | 233,973,774 | | | | 605,605,866 | |
| Net asset value of shares issued in distributions reinvested (334,201 shares) | | | — | | | | 6,963,847 | |
| Cost of shares redeemed (17,917,322 and 53,126,826 shares, respectively) | | | (441,730,684 | ) | | | (1,133,864,678 | ) |
| Net decrease in net assets derived from Fund share activities | | | (207,756,910 | ) | | | (521,294,965 | ) |
| Total Increase (Decrease) | | | 245,070,528 | | | | (404,315,471 | ) |
| | | | | | | | | |
| Net Assets at the Beginning of the Period | | | 2,057,591,105 | | | | 2,461,906,576 | |
| Net Assets at the End of the Period | | $ | 2,302,661,633 | | | $ | 2,057,591,105 | |
| (Includes undistributed net investment income of $0 and $0, respectively) | | | | | | | | |
The accompanying notes to financial statements are an integral part of these statements.
Brandywine Blue Fund
Financial Highlights
(Selected data for each share of the Fund outstanding throughout each period)
| | | For the Six Months | | | | | | | | | | | | | | | | |
| | | ended March 31, 2011 | | | Years Ended September 30, | |
| | | (Unaudited) | | | 2010 | | | 2009 | | | 2008 | | | 2007 | | | 2006 | |
| PER SHARE OPERATING PERFORMANCE: | | | | | | | | | | | | | | | | | | |
| Net asset value, beginning of period | | $ | 21.78 | | | $ | 20.67 | | | $ | 23.86 | | | $ | 38.18 | | | $ | 31.15 | | | $ | 31.33 | |
| | | | | | | | | | | | | | | | | | | | | | | | | |
| Income from investment operations: | | | | | | | | | | | | | | | | | | | | | | | | |
Net investment (loss) income(1) | | | (0.04 | ) | | | (0.06 | ) | | | 0.04 | | | | (0.07 | ) | | | (0.02 | ) | | | (0.00 | )* |
| Net realized and unrealized gains (losses) | | | | | | | | | | | | | | | | | | | | | | | | |
| on investments | | | 5.09 | | | | 1.24 | | | | (3.23 | ) | | | (10.38 | ) | | | 8.15 | | | | 0.96 | |
| Total from investment operations | | | 5.05 | | | | 1.18 | | | | (3.19 | ) | | | (10.45 | ) | | | 8.13 | | | | 0.96 | |
| | | | | | | | | | | | | | | | | | | | | | | | | |
| Less distributions: | | | | | | | | | | | | | | | | | | | | | | | | |
| Distributions from net investment income | | | — | | | | (0.07 | ) | | | — | | | | — | | | | — | | | | — | |
| Distributions from net realized gains | | | — | | | | — | | | | — | | | | (3.87 | ) | | | (1.10 | ) | | | (1.14 | ) |
| Total from distributions | | | — | | | | (0.07 | ) | | | — | | | | (3.87 | ) | | | (1.10 | ) | | | (1.14 | ) |
| Net asset value, end of period | | $ | 26.83 | | | $ | 21.78 | | | $ | 20.67 | | | $ | 23.86 | | | $ | 38.18 | | | $ | 31.15 | |
| TOTAL RETURN | | | 23.19 | %(a) | | | 5.71 | % | | | (13.37 | %) | | | (30.70 | %) | | | 26.82 | % | | | 3.47 | % |
| | | | | | | | | | | | | | | | | | | | | | | | | |
| RATIOS/SUPPLEMENTAL DATA: | | | | | | | | | | | | | | | | | | | | | | | | |
| Net assets, end of period (in 000’s $) | | | 2,302,662 | | | | 2,057,591 | | | | 2,461,907 | | | | 3,323,668 | | | | 3,304,281 | | | | 1,856,496 | |
| Ratio of expenses to average net assets | | | 1.17 | %(b) | | | 1.17 | % | | | 1.16 | % | | | 1.13 | % | | | 1.12 | % | | | 1.10 | % |
| Ratio of net investment (loss) income | | | | | | | | | | | | | | | | | | | | | | | | |
| to average net assets | | | (0.35 | %)(b) | | | (0.27 | %) | | | 0.21 | % | | | (0.23 | %) | | | (0.06 | %) | | | (0.02 | %) |
| Portfolio turnover rate | | | 115 | %(a) | | | 212 | % | | | 261 | % | | | 267 | % | | | 184 | % | | | 207 | % |
| (1) | Net investment (loss) income per share was calculated using average shares outstanding. |
| * | Amount less than $0.005 per share. |
The accompanying notes to financial statements are an integral part of this statement.
The Brandywine Funds
Notes to Financial Statements
March 31, 2011 (Unaudited)
| (1) | Summary of Significant Accounting Policies |
The following is a summary of significant accounting policies of Brandywine Fund, Inc. (the “Brandywine Fund”) and Brandywine Blue Fund (the “Blue Fund,” one of two Funds in a series of the Brandywine Blue Fund, Inc.) (collectively the “Funds”). Each Fund is registered as a diversified open-end management company under the Investment Company Act of 1940 (the “Act”), as amended. The assets and liabilities of each Fund are segregated and a shareholder’s interest is limited to the Fund in which the shareholder owns shares. The Brandywine Fund was incorporated under the laws of Maryland on October 9, 1985. The Blue Fund was incorporated under the laws of Maryland on November 13, 1990. The investment objective of each Fund is to produce long-term capital appreciation principally through investing in common stocks.
| | (a) | Each security, excluding short-term investments, is valued at the last sale price reported by the principal security exchange on which the issue is traded. Securities that are traded on the Nasdaq Markets are valued at the Nasdaq Official Closing Price, or if no sale is reported, the latest bid price. Securities which are traded over-the-counter are valued at the latest bid price. Securities for which quotations are not readily available are valued at fair value as determined by the investment adviser under the supervision of the Board of Directors. The fair value of a security may differ from the last quoted price and the Fund may not be able to sell a security at the estimated fair value. Market quotations may not be available, for example, if trading in particular securities has halted during the day and not resumed prior to the close of trading on the New York Stock Exchange. As of March 31, 2011, there were no securities that were internally fair valued. Short-term investments with maturities of 60 days or less are valued at amortized cost which approximates value. For financial reporting purposes, investment transactions are recorded on the trade date; however, for purposes of executing shareholder transactions, the Funds record changes in holdings of portfolio securities no later than the first business day after the trade date in accordance with Rule 2a-4 of the Act. Accordingly, certain differences between net asset value for financial reporting and for executing shareholder transactions may arise. |
The Funds adopted the provisions of the Financial Accounting Standards Board (“FASB”) Accounting Standards Codification “Fair Value Measurements and Disclosures” Topic 820 (“ASC 820”), effective October 1, 2008. Under ASC 820, fair value is defined as the price that would be received to sell an asset or paid to transfer a liability (i.e., the “exit price”) in an orderly transaction between market participants at the measurement date.
The Brandywine Funds
Notes to Financial Statements (Continued)
March 31, 2011 (Unaudited)
| (1) | Summary of Significant Accounting Policies (Continued) |
In determining fair value, the Funds use various valuation approaches. ASC 820 establishes a fair value hierarchy for inputs used in measuring fair value that maximizes the use of observable inputs and minimizes the use of unobservable inputs by generally requiring that the most observable inputs be used when available. Observable inputs are those that market participants would use in pricing the asset or liability based on market data obtained from sources independent of the Funds. Unobservable inputs reflect the Funds’ assumptions about the inputs market participants would use in pricing the asset or liability developed based on the best information available in the circumstances. The inputs or methodologies used for valuing securities are not necessarily an indication of the risks associated with investing in those securities.
The fair value hierarchy is categorized into three levels based on the inputs as follows:
Level 1 – Valuations based on unadjusted quoted prices in active markets for identical assets.
Level 2 – Valuations based on quoted prices for similar securities or in markets that are not active or for which all significant inputs are observable, either directly or indirectly.
Level 3 – Valuations based on inputs that are unobservable and significant to the overall fair value measurement.
The following table summarizes the Funds’ investments as of March 31, 2011, based on the inputs used to value them:
| | | Brandywine Fund | | | Blue Fund | |
| Valuation Inputs | | Investments in Securities | | | Investments in Securities | |
| Level 1 – Common Stocks | | $ | 1,925,428,547 | | | $ | 2,241,686,729 | |
| | | | | | | | | |
| Level 2 – Short-Term Commercial Paper | | | 40,100,000 | | | | 73,800,000 | |
| Variable Rate Demand Notes | | | 2,393,869 | | | | 2,354,688 | |
| Total Level 2 | | | 42,493,869 | | | | 76,154,688 | |
| Level 3 – | | | — | | | | — | |
| Total | | $ | 1,967,922,416 | | | $ | 2,317,841,417 | |
It is the Funds’ policy to recognize transfers between levels at the end of the quarterly reporting period. There were no transfers between levels during the six months ended March 31, 2011.
See the Schedule of Investments for the investments detailed by industry classification.
| | (b) | Net realized gains and losses on sales of securities are computed on the identified cost basis. |
| | (c) | Dividend income is recorded on the ex-dividend date. Interest income is recorded on the accrual basis. |
| | (d) | The Funds have investments in short-term variable rate demand notes, which are unsecured instruments. The Funds may be susceptible to credit risk with respect to these notes to the extent the issuer defaults on its payment obligation. The Funds’ policy is to monitor the creditworthiness of the issuer and nonperformance by these counterparties is not anticipated. |
| | (e) | Accounting principles generally accepted in the United States of America (“GAAP”) require that permanent differences between income for financial reporting and tax purposes be reclassified in the capital accounts. |
| | (f) | The preparation of financial statements in conformity with GAAP requires management to make estimates and assumptions that affect the reported amounts of assets and liabilities and disclosure of contingent assets and liabilities at the date of the financial statements and the reported amounts of revenues and expenses during the reporting period. Actual results could differ from these estimates. |
| | (g) | No provision has been made for Federal income taxes since the Funds have elected to be taxed as “regulated investment companies” and intend to distribute substantially all net investment company taxable income and net capital gains to shareholders and otherwise comply with the provisions of the Internal Revenue Code applicable to regulated investment companies. |
| | (h) | The Funds have reviewed all open tax years and major jurisdictions, which include Federal and the state of Maryland, and concluded that there are no significant uncertain tax positions that would require recognition in the financial statements. Open tax years are those that are open for exam by taxing authorities and, as of March 31, 2011, open Federal tax years include the tax years ended September 30, 2007 through 2010. The Funds have no examinations in progress and are also not aware of any tax positions for which it is reasonably possible that the total amounts of unrecognized tax benefits will significantly change in the next twelve months. |
The Brandywine Funds
Notes to Financial Statements (Continued)
March 31, 2011 (Unaudited)
| (2) | Investment Adviser and Management Agreements and Transactions With Related Parties |
Each Fund has a management agreement with Friess Associates, LLC (the “Adviser”), with whom certain Officers and a Director of the Funds are affiliated, to serve as investment adviser and manager. Under the terms of the agreements, each Fund will pay the Adviser a monthly management fee at the annual rate of one percent (1%) on the daily net assets of such Fund.
The Adviser entered into sub-advisory agreements with its affiliate, Friess Associates of Delaware, LLC (the “Sub-Adviser”), to assist it in the day-to-day management of each of the Funds. The Adviser and, if so delegated, the Sub-Adviser supervise the investment portfolios of the Funds, directing the purchase and sale of investment securities in the day-to-day management of the Funds. The Adviser pays the Sub-Adviser a fee equal to 110% of the monthly expenses the Sub-Adviser incurs in performing its services as Sub-Adviser. This relationship does not increase the annual management fee the Funds pay to the Adviser.
The Adviser has voluntarily agreed to reimburse each Fund for expenses over 2% of the daily net assets of the Fund. No such reimbursements were required for the six months ended March 31, 2011.
Each of the Funds pay the five independent directors annual fees of $23,300 each. The lead independent director and chairman of the audit committee are paid an additional $8,000 and $5,000 annually, respectively, divided proportionately among all the Funds. All of the corresponding fees the directors receive are paid quarterly to the directors and then invested on the payment date in shares of the Funds at the net asset value of the Funds on the payment date. The Funds also reimburse directors for travel costs incurred in order to attend meetings of the Board of Directors. For the six months ended March 31, 2011, the Funds expensed the following directors fees and costs:
| | | Brandywine | | | Blue | |
| | | Fund | | | Fund | |
| Directors Fees and Travel Costs Paid during the Period | | $ | 63,210 | | | $ | 64,150 | |
Under the Funds’ organizational documents, each Director, officer, employee or other agent of the Fund (including the Funds’ investment manager) is indemnified, to the extent permitted by the Act, against certain liabilities that may arise out of performance of their duties to the Funds. Additionally, in the normal course of business, the Funds enter into contracts that contain a variety of indemnification clauses. The Funds’ maximum exposure under these arrangements is unknown as this would involve future claims that may be made against the Funds that have not yet occurred. However, the Funds have not had prior claims or losses pursuant to these contracts and believes the risk of loss to be remote.
U.S. Bank, N.A. has made available to each Fund a credit facility pursuant to Credit Agreements effective July 22, 2004, for the purpose of having cash available to cover incoming redemptions. Each of the Funds has a $50,000,000 credit facility. Principal and interest of such loan under the Credit Agreements are due not more than 31 days after the date of the loan. Amounts under the credit facilities bear interest at a rate per annum equal to the current prime rate minus one percent on the amount borrowed. Advances will be collateralized by securities owned by the respective Fund. During the six months ended March 31, 2011, neither Fund borrowed against their Agreement. The Credit Agreements are renewable annually on December 18.
| (4) | Distributions to Shareholders |
Net investment income and net realized gains, if any, are distributed to shareholders at least annually.
| (5) | Investment Transactions |
For the six months ended March 31, 2011, purchases and proceeds of sales of investment securities (excluding short-term investments) for the Funds were as follows:
| | | | | | Sale | |
| | | Purchases | | | Proceeds | |
| Brandywine Fund | | $ | 1,888,809,444 | | | $ | 2,231,960,353 | |
| Blue Fund | | | 2,447,613,439 | | | | 2,618,966,826 | |
| (6) | Income Tax Information |
The following information for the Funds is presented on an income tax basis as of September 30, 2010:
| | | | | | | | | Gross | | | Net Unrealized | | | Distributable | | | Distributable | |
| | | Cost of | | | Unrealized | | | Unrealized | | | Appreciation | | | Ordinary | | | Long-Term | |
| | | Investments | | | Appreciation | | | Depreciation | | | on Investments | | | Income | | | Capital Gains | |
| Brandywine Fund | | $ | 1,592,853,513 | | | $ | 195,414,627 | | | $ | 25,343,425 | | | $ | 170,071,202 | | | $ | — | | | $ | — | |
| Blue Fund | | | 1,891,286,780 | | | | 206,332,768 | | | | 49,482,788 | | | | 156,849,980 | | | | — | | | | — | |
The difference, if any, between the cost amounts for financial statement and federal income tax purposes is due primarily to timing differences in recognizing certain gains and losses in security transactions.
The Brandywine Funds
Notes to Financial Statements (Continued)
March 31, 2011 (Unaudited)
| (6) | Income Tax Information (Continued) |
The tax components of dividends paid during the years ended September 30, 2010 and 2009, capital loss carryovers, which may be used to offset future capital gains, subject to Internal Revenue Code limitations (expiring in 2017 and 2018), as of September 30, 2010, and tax basis post-October losses as of September 30, 2010, which are not recognized for tax purposes until the first day of the following fiscal year are:
| | | September 30, 2010 | | | September 30, 2009 | |
| | | Ordinary | | | Long-Term | | | Net Capital | | | Post-October | | | Ordinary | | | Long-Term | |
| | | Income | | | Capital Gains | | | Loss | | | Currency | | | Income | | | Capital Gains | |
| | | Distributions | | | Distributions | | | Carryovers | | | Losses | | | Distributions | | | Distributions | |
| Brandywine Fund | | $ | — | | | $ | — | | | $ | 1,190,327,468 | | | $ | — | | | $ | 14,327,152 | | | $ | — | |
| Blue Fund | | | 7,553,091 | | | | — | | | | 1,505,316,850 | | | | 887 | | | | — | | | | — | |
For corporate shareholders in the Blue Fund, the percentage of dividend income distributed for the year ended September 30, 2010, which is designated as qualifying for the dividends received deduction is 100% (unaudited).
For the shareholders in the Blue Fund, the percentage of dividend income distributed for the year ended September 30, 2010, which is designated as qualified dividend income under the Jobs and Growth Tax Relief Act of 2003 is 100% (unaudited).
Since there were no ordinary distributions paid for the Brandywine Fund for the year ended September 30, 2010, there were no distributions designated as qualifying for the dividends received deduction for corporate shareholders nor as qualified dividend income under the Jobs and Growth Tax Relief Act of 2003 (unaudited).
Cost Discussion
Mutual fund shareholders incur two types of costs: (1) transaction costs, including sales charges (loads) on purchase payments, reinvested dividends, or other distributions; redemption fees; and exchange fees; and (2) ongoing costs, including management fees; distribution [and/or service] (12b-1) fees; and other fund expenses. Brandywine and Brandywine Blue do not have 12b-1 distribution fees. This example is intended to help you understand your ongoing costs (in dollars) of investing in the Brandywine Funds and to compare these costs with the ongoing costs of investing in other mutual funds.
In addition to the costs highlighted and described below, the only Fund transaction costs you might currently incur would be wire fees ($15 per wire), if you choose to have proceeds from a redemption wired to your bank account instead of receiving a check. Additionally, U.S. Bank charges an annual processing fee ($15) if you maintain an IRA account with the Funds. To determine your total costs of investing in the Funds, you would need to add any applicable wire or IRA processing fees you’ve incurred during the period to the costs provided in the example below.
The example is based on an investment of $1,000 invested at the beginning of the period and held for the entire period from October 1, 2010 through March 31, 2011.
Actual Expenses
The first line of the table below provides information about actual account values and actual expenses. You may use the information in this line, together with the amount you invested, to estimate the expenses that you paid over the period. Simply divide your account value by $1,000 (for example, an $8,600 account value divided by $1,000 = 8.6), then multiply the result by the number in the first line under the heading entitled “Expenses Paid During Period” to estimate the expenses you paid on your account during this period.
Hypothetical Example for Comparison Purposes
The second line of the table below provides information about hypothetical account values and hypothetical expenses based on the Fund’s actual expense ratio and an assumed rate of return of 5% per year before expenses, which is not the Fund’s actual return. The hypothetical account values and expenses may not be used to estimate the actual ending account balance or expenses you paid for the period. You may use this information to compare the ongoing costs of investing in the Funds and other funds. To do so, compare this 5% hypothetical example with the 5% hypothetical examples that appear in the shareholder reports of the other funds.
Please note that the expenses shown in the table are meant to highlight your ongoing costs only and do not reflect any transactional costs. While the Brandywine Funds currently do not assess sales charges, redemption or exchange fees, other funds do, and those costs will not be reflected in their expense example tables. Therefore, the second line of the table is useful in comparing ongoing costs only, and will not help you determine the relative total costs of owning different funds.
| | Beginning | Ending | |
| | Account | Account | Expenses Paid |
| | Value | Value | During Period* |
| | 10/01/10 | 3/31/11 | 10/01/10-3/31/11 |
| Brandywine Actual | $1,000.00 | $1,317.00 | $6.35 |
| Hypothetical (5% return before expenses) | $1,000.00 | $1,019.40 | $5.54 |
| Brandywine Blue Actual | $1,000.00 | $1,231.90 | $6.51 |
| Hypothetical (5% return before expenses) | $1,000.00 | $1,019.10 | $5.89 |
| * | Expenses are equal to the Funds’ annualized expense ratios of 1.10% and 1.17%, multiplied by the average account value over the period, multiplied by 182/365 (to reflect the one-half year period between October 1, 2010 and March 31, 2011). |
Brandywine Funds Advisory Agreements
On December 6, 2010, the Board of Directors (“Directors”) of the Funds approved the continuation of the advisory agreements with Friess Associates, LLC (“Friess”). Prior to approving the continuation of the advisory agreements, the Directors considered:
| | • | the nature, extent and quality of the services provided by Friess |
| | • | the investment performance of the Funds |
| | • | the costs of the services to be provided and profits to be realized by Friess from its relationship with the Funds |
| | • | the extent to which economies of scale would be realized as the Funds grow and whether fee levels reflect these economies of scale |
| | • | the expense ratios of the Funds |
| | • | other revenue to Friess and its affiliates from their relationship with the Funds |
| | • | the manner in which portfolio transactions for the Funds are conducted, including the use of soft dollars |
In considering the nature, extent and quality of the services provided by Friess, the Directors reviewed a report describing the portfolio management, shareholder communication and servicing, and regulatory compliance services provided by Friess to the Funds. The Directors concluded that Friess was providing essential services to the Funds. In particular, the Directors concluded that Friess was preparing reports to shareholders in addition to those required by law and continued to generate increased written communications, at Friess’ expense, to support shareholders.
The Directors compared the performance of the Funds to benchmark indexes over various periods of time and concluded that the performance of the Funds warranted the continuation of the advisory agreements.
In concluding that the advisory fees payable by the Funds were reasonable, the Directors reviewed a report of the costs of services provided, and the profits realized by Friess from its relationship with the Funds and concluded that such profits were reasonable and not excessive. The Directors also reviewed reports comparing the expense ratios and advisory fees paid by the Funds to those paid by other comparable mutual funds and concluded that the advisory fees paid by the Funds were higher than the average advisory fees paid by comparable mutual funds, but the expense ratios of the Funds were lower than the average expense ratios of comparable mutual funds. The Directors also considered the Funds’ portfolio turnover rate and that all clients of Friess pay the same 1% advisory fee. They noted that this fee would not be adjusted if economies of scale were realized during the current contract period as the Funds grew, but did not consider that factor to be significant in light of the other factors considered, particularly the fact that the profits were reasonable and not excessive. The Directors noted that having the same fee for all clients eliminated conflicts of interest that would be present if Friess charged different fees to different clients.
Finally, the Directors reviewed reports discussing the manner in which portfolio transactions for the Funds were conducted, including the use of soft dollars. Based on these reports, the Directors concluded that the research obtained by Friess was beneficial to the Funds and that Friess was executing the Funds’ portfolio transactions in a manner designed to obtain best execution for the Funds.
Additional Director Information, Proxy Voting Policy and Quarterly Portfolio Schedules
For additional information about the Directors and Officers or for a description of the policies and procedures that the Funds use to determine how to vote proxies relating to portfolio securities, please call (800) 656-3017 and request a Statement of Additional Information. One will be mailed to you free of charge. The Statement of Additional Information is also available on the website of the Securities and Exchange Commission (the “Commission”) at http://www.sec.gov or the Funds’ website at http://www.brandywinefunds.com. Information on how the Funds voted proxies relating to portfolio securities is available on the Funds’ website or the website of the Commission no later than August 31 for the prior twelve months ending June 30. The Funds file their complete schedule of portfolio holdings with the Commission for the first and third quarters of each fiscal year on Form N-Q. The Funds’ Forms N-Q are available on the Commission’s website. The Funds’ Forms N-Q may be reviewed and copied at the Commission’s Public Reference Room in Washington, D.C. Information on the operation of the Public Reference Room may be obtained by calling 1-800-SEC-0330.
Board of Directors
 |  |  |
| William F. D’Alonzo | C. Quentin S. Jackson | Stuart A. McFarland |
| CEO and CIO | Former President and CEO | Managing Partner |
| Friess Associates | Nuclear Electric Insurance Limited | Federal City Capital Advisors, LLC |
 |  |  |
| W. Richard Scarlett, III | Thomas D. Wren | James W. Zug |
| Former President and CEO | Former Senior Advisor | Former Senior Partner |
| Jackson State Bank & Trust | Promontory Financial Group, LLC | PricewaterhouseCoopers LLP |
| | | |
|  | The Brandywine Funds P.O. Box 4166Greenville, DE 19807(800) 656-3017www.brandywinefunds.combfunds@friess.com |
| | | |
Investment Adviser: Friess Associates, LLC | Administrator, Accountant & Transfer Agent: U.S. Bancorp Fund Services, LLC |
Investment Sub-Adviser: Friess Associates of Delaware, LLC | Independent Registered Public Accounting Firm: PricewaterhouseCoopers LLP |
Custodian: U.S. Bank, N.A. | Legal Counsel: Foley & Lardner LLP |
Officers: William D’Alonzo, Chairman and President; Lynda Campbell, Vice President, Secretary and Treasurer; Joseph Fields, Vice President; Gordon Kaiser, Vice President; David Marky, Chief Compliance Officer, Vice President and Assistant Secretary
Report Editor: Chris Aregood Report Staff: David Marky, Adam Rieger
| Managed by Friess Associates, LLC | Semi-Annual Report | March 31, 2011 |
Dear Fellow Shareholders:
Investor optimism overcame macro-related uncertainty in the first three months of 2011, boosting share prices for the third consecutive quarter. Stocks climbed despite rising commodity prices, unrest in oil-producing nations and a devastating earthquake in Japan.
Brandywine Advisors Midcap Growth Fund grew 7.54 percent in the March quarter as the S&P 500, Russell Midcap and Russell Midcap Growth Indexes gained 5.92, 7.63 and 7.85 percent.
Successful revolutions in Tunisia and Egypt inspired public demonstrations against other governments in North Africa and the Middle East, leading to a 17 percent rise in the price of oil amid the geopolitical uncertainty of the March quarter. With prices topping $100 a barrel for the first time since the fall of 2008, investors were inclined to reward the earnings prospects of the energy companies we held.
Energy holdings, led by equipment and service providers, contributed the most to quarterly results versus benchmarks. Onshore driller Patterson-UTI Energy was a standout performer. Patterson reported $0.37 per share in December-quarter earnings, up from a loss of $0.11 per share a year ago. Cameron International, which supplies products for offshore drilling, aided performance as well. The company exceeded estimates with 28 percent December-quarter earnings growth.
Technology holdings, which represented the largest percentage of assets during the quarter, were the next most significant positive influence. Communications equipment makers showed particular strength amid robust earnings trends. Acme Packet rose after reporting 136 percent growth in December-quarter earnings, topping expectations. Alcatel-Lucent’s December-quarter earnings more than tripled, exceeding the consensus estimate by 19 percent.
Although they contributed to the portfolio’s positive absolute performance, industrial holdings detracted most from relative results. Avery Dennison Corp. exceeded December-quarter estimates with 38 percent earnings growth, but the company’s shares fell as oil prices rose. Higher oil prices translate into higher material costs for the manufacturer of pressure-sensitive labels, raising concerns about future profit margins. Goodrich Corp. and Foster Wheeler were notable performance detractors as well.
Holdings from the financial sector also detracted from performance versus benchmarks. First Niagara Financial beat expectations with 41 percent December-quarter earnings growth, but its shares stalled midway through the quarter as regulators reviewed the company’s proposed acquisition of NewAlliance Bancshares for final approval. (The transaction was approved in early April.) Green Dot Corp. and SEI Investments also weighed on relative performance.
For more information on the companies that influenced March-quarter performance, please see Roses & Thorns on page 4.
Earlier this year, one of our teammates attended a conference with hundreds of seasoned investment pros, academics, philanthropists and others responsible for steering the investments of some of the nation’s largest and most recognized foundations and endowments. When polled to determine which among any number of investment options – gold, emerging markets, you name it – they thought offered the greatest promise in 2011, a vast majority chose U.S. equities.
| | Brandywine Advisors |
| Cumulative Total Return | % Change |
| Quarter | 7.54 |
| One Year | 22.22 |
| Five Years | -2.57 |
| Ten Years | 36.10 |
| Inception – 10/31/00 | 20.65 |
| Five Years | -0.52 |
| Ten Years | 3.13 |
| Inception – 10/31/00 | 1.82 |
*Expense Ratio – 1.28% as stated in the Prospectus dated January 31, 2011
Performance data quoted represent past performance; past performance does not guarantee future results. The investment return and principal value of an investment will fluctuate so that an investor’s shares, when redeemed, may be worth more or less than their original cost. Current performance of the Fund may be lower or higher than the performance quoted. Performance data current to the most recent month end may be obtained by visiting www.brandywinefunds.com.
A lot has happened since then, yet that opinion still appears to be widely held.
Oil prices soared as the Middle East boiled and OPEC member-state Libya descended into civil war. Natural disaster pummeled the world’s third-largest economy and left an unresolved nuclear crisis in its aftermath. Sovereign debt concerns resurfaced, with Portugal appearing destined for a European Union bailout.
For much of last year, any one of those things likely would have sparked a distinctly negative market response. For the first three months of this year, stocks suffered little more than a hiccup as investors digested all that news and more. What gives?
There is no way to know for sure, but if you believe the stock market discounts the future, there might be reason for optimism in the market’s ability to look past some pretty unsettling macro events. Maybe investors expect what we have been uncovering on the individual-company level: robust earnings strength.
The average company in the Russell Midcap Growth Index is expected to grow a respectable 16 percent in 2011. Based on Wall Street consensus forecasts, the typical Brandywine Advisors holding is expected to grow earnings 23 percent, a number we believe may be higher when the final tally is in since we aim to isolate companies with underappreciated growth potential.
Beyond the level of earnings growth, there’s significant potential for continued expansion thanks in part to uncommonly wide profit margins. Having cut back during the recession and kept costs down as the recovery took hold, many companies have been generating heaps of cash amid rising end demand. Profit margins are expected to reach their highest level in 18 years during 2011, according to data compiled by Bloomberg News.
With profit margins high and the backdrop more supportive, many companies are in a position to make capital expenditures that they have put off since the financial crisis. Cash-flush companies can also put their stockpiled funds into shareholder-friendly endeavors such as dividend payouts and share repurchases, the latter of which were higher in February than in any month since the end of 2007. Mergers and acquisitions are also likely to continue at a healthy pace considering the situation.
What’s more, stock prices remain in a reasonable range relative to earnings. The typical holding in the Brandywine Advisors portfolio sells at 17.4 times 2011 consensus earnings estimates versus 17.7 times for the Russell Midcap Growth Index. We see that as a bargain considering that the average Brandywine Advisors holding is forecasted to grow earnings more than 40 percent faster than the index’s average.
As we begin the June quarter, the consumer discretionary and technology sectors are roughly even as the largest concentrations of assets in the portfolio. Industrial holdings are not far behind as the third largest percentage. Energy, materials and industrial sector holdings are overweight versus the Russell Midcap Growth Index, while consumer staples and health care holdings represent limited positions relative to the index.
Just because the market seemed subdued when faced with macro matters of importance during the March quarter doesn’t mean we’re shrugging them off. The potential for economic reverberations from damage in Japan and high energy prices to influence individual-company earnings trends will be an integral part of our research legwork for the foreseeable future.
We’re excited about the earnings strength we have uncovered, and we’re encouraged by an environment in which individual-company fundamentals appear to be a strong and growing influence on the collective investor mindset.
We’re grateful for the opportunity to serve you.
| |
| Bill D’Alonzo | |
| Brandywine Funds President | April 15, 2011 |
Capital Gains Update . . . Brandywine Advisors Midcap Growth Fund finished the March quarter with a net realized loss of $2.39 per share. Brandywine Advisors will not make a capital gains distribution, which is a taxable event for shareholders in taxable accounts, until gains are realized in excess of the net loss amount. Please check upcoming reports for updates. |
Brandywine Advisors Midcap Growth Fund
Portfolio Characteristics as of March 31, 2011
% Change in Top Ten Holdings From Book Cost
| 1. | McDermott International Inc. | +155.5% | 6. | | Acme Packet Inc. | +74.9% |
| 2. | MSC Industrial Direct Co. Inc. | +11.5% | 7. | | Informatica Corp. | +16.4% |
| 3. | Williams-Sonoma Inc. | +44.6% | 8. | | ANSYS Inc. | -0.6% |
| 4. | CarMax Inc. | +32.7% | 9. | | Nordstrom Inc. | +5.8% |
| 5. | Albemarle Corp. | +62.9% | 10. | | Check Point Software Technologies Ltd. | +11.0% |
| Estimated Earnings Growth Rate | The Portfolio’s Market Capitalization |
of the Fund’s Investments | |
| |
| | |
Forecasted Increase in Earnings Per Share 2011 vs 2010 |
Source: Consensus estimates from Baseline Financial Services, Inc. |
This is not a forecast of the Fund’s future performance. Earnings growth for a Fund holding does not guarantee a corresponding increase in the market value of the holding or the Fund. As of March 31, 2011, the S&P 500 Index’s average annual total returns for 1, 5 and 10 years were 15.65, 2.62 and 3.29 percent. |
| |
| |
| |
| | |
Top Ten Industry Groups
Brandywine Advisors Midcap Growth Fund
March Quarter “Roses and Thorns”
| | $ Gain | | |
| Biggest $ Winners | (in thousands) | % Gain | Reason for Move |
| Acme Packet Inc. | $1,352.9 | 32.8 | The manufacturer of telecommunications equipment that allows the delivery of real-time audio and video over the Internet grew December-quarter earnings 136 percent, beating estimates by 13 percent. Acme Packet’s session border controllers (SBCs) determine how audio and video are handled over Internet Protocol (IP) networks. The market is growing rapidly for the controllers as IP networks increasingly take the place of traditional telephone networks and are being used to enable mobile technologies. |
McDermott International Inc. | $1,284.6 | 21.6 | The provider of engineering, procurement, construction, installation and related services to the offshore oil and gas industry gained ground as a considerable number of customers increased the scopes of existing projects amid higher crude prices and an improving global economic backdrop. New project wins for the company’s offshore construction services segment pushed bookings to a record high during the quarter and fueled 54 percent year-over-year backlog growth. |
MetroPCS Communications Inc. | $1,048.8 | 27.3 | The nation’s fifth-largest wireless carrier by number of subscribers grew December-quarter earnings 90 percent, beating the consensus estimate by 19 percent. Rolling out 4G service has bolstered the company’s competitive position and profitability as new and existing customers are attracted to its higher-margin, competitively priced smartphone plans. |
Tempur-Pedic International Inc. | $1,016.7 | 22.6 | The manufacturer and distributor of visco-elastic foam mattresses and pillows grew December-quarter earnings 74 percent, beating the consensus estimate by 16 percent. Revenue increased 20 percent as domestic mattress sales grew 32 percent year over year. The company has continued to benefit from pent-up demand for premium mattresses, having recently released the Cloud Luxe (the most expensive model of its Cloud line). Tempur-Pedic is expected to roll out Cloud products throughout Europe in the months ahead. |
Patterson-UTI Energy Inc. | $1,010.6 | 36.4 | The provider of onshore contract drilling and pressure pumping services to oil and natural gas producers in North America grew December-quarter earnings to $0.37 per share from a loss of $0.11 a year ago, beating estimates by 12 percent. Rising oil prices have resulted in greater utilization and day rates for Patterson’s drilling services. At the same time, efforts to modernize equipment and expand in high-potential areas should enhance profitability. |
| | $ Loss | | |
| Biggest $ Losers | (in thousands) | % Loss | Reason for Move |
| Rovi Corp. | $706.1 | 12.1 | The developer of interactive programming guides, media recognition technologies and descriptive information databases embedded in consumer electronics traded lower during the quarter on concerns that expectations related to its acquisition of Sonic Solutions late last year were overly aggressive. We sold Rovi during the quarter to fund an idea with better near-term earnings visibility. |
Dolby Laboratories Inc. | $673.9 | 20.5 | The licensor of audio technologies like surround sound reported a strong December quarter, but shares traded lower after the company reduced its earnings forecast for 2011. Reduced guidance was associated with lower shipments to personal computer manufacturers and a delay in revenue expected from a trend toward increasing production of tablet devices. We sold Dolby during the quarter to fund an idea with greater near-term earnings upside. |
| NII Holdings Inc. | $632.1 | 12.7 | The provider of mobile communications to business customers in South America grew December-quarter earnings 52 percent, topping estimates. While long-term growth prospects remain intact, shares traded lower as capital outlays related to numerous growth-related initiatives, including its rapid 3G network expansion in Mexico and Brazil, depressed near-term growth. We sold NII during the quarter at an overall gain from our original cost, using the proceeds to fund an idea with greater near-term earnings visibility. |
| Silver Wheaton Corp. | $570.1 | 12.1 | The “silver streaming” company provides financing to non-silver focused mining operators in return for access at a set price to silver that is produced as a byproduct of their operations. After gaining ground late last year on strong industrial and investment-related demand for silver, shares retraced in early 2011 as sentiment regarding silver prices became volatile. We sold Silver Wheaton at a substantial gain from our original cost during the quarter. |
Royal Caribbean Cruises Ltd. | $558.7 | 9.8 | The world’s second largest operator of cruise ships grew December-quarter earnings $0.20 per share from $0.02 a year ago, topping estimates by 54 percent. While booking trends continue to improve from depressed levels, concerns that higher fuel prices would weigh on profitability sent shares lower. We sold Royal Caribbean at an overall gain from our original cost during the quarter to fund an idea with better near-term earnings visibility. |
All gains/losses are calculated on an average cost basis
Brandywine Advisors Midcap Growth Fund
Statement of Assets and Liabilities
March 31, 2011 (Unaudited)
| Assets: | | | |
| Investments in securities, at value (cost $151,828,924) | | $ | 182,886,583 | |
| Receivable from investments sold | | | 1,019,375 | |
| Net dividends and interest receivable | | | 65,367 | |
| Receivable from shareholders for purchases | | | 13,666 | |
| Total assets | | $ | 183,984,991 | |
| | | | | |
| Liabilities: | | | | |
| Payable to brokers for investments purchased | | $ | 4,909,921 | |
| Payable to adviser for management fees | | | 147,371 | |
| Payable to shareholders for redemptions | | | 11,236 | |
| Other liabilities | | | 52,287 | |
| Total liabilities | | | 5,120,815 | |
| | | | | |
| Net Assets: | | | | |
| Capital Stock, $0.01 par value; 500,000,000 shares authorized; 19,599,427 shares outstanding | | | 194,557,936 | |
| Net unrealized appreciation on investments | | | 31,057,659 | |
| Accumulated net realized loss on investments | | | (46,751,419 | ) |
| Net assets | | | 178,864,176 | |
| Total liabilities and net assets | | $ | 183,984,991 | |
| | | | | |
| Calculation of net asset value per share: | | | | |
Net asset value, offering and redemption price per share ($178,864,176 ÷ 19,599,427 shares outstanding) | | $ | 9.13 | |
The accompanying notes to financial statements are an integral part of this statement.
Schedule of Investments
March 31, 2011 (Unaudited)
| Shares | | | | Cost | | | Value | |
Common Stocks - 99.1% (a) | | | | | | |
CONSUMER DISCRETIONARY | | | | | | |
| | | Apparel Retail - 1.2% | | | | | | |
| | 71,100 | | Chico’s FAS Inc. | | $ | 1,044,239 | | | $ | 1,059,390 | |
| | 55,800 | | Foot Locker Inc. | | | 879,612 | | | | 1,100,376 | |
| | | | Auto Parts & Equipment - 2.4% | | | | | | | | |
| | 77,100 | | TRW Automotive Holdings Corp.* | | | 2,743,927 | | | | 4,246,668 | |
| | | | Automotive Retail - 3.3% | | | | | | | | |
| | 186,800 | | CarMax Inc.* | | | 4,520,011 | | | | 5,996,280 | |
| | | | Broadcasting - 1.7% | | | | | | | | |
| | 38,200 | | Liberty Media-Starz* | | | 2,362,447 | | | | 2,964,320 | |
| | | | Department Stores - 2.7% | | | | | | | | |
| | 107,000 | | Nordstrom Inc. | | | 4,539,269 | | | | 4,802,160 | |
| | | | Footwear - 2.7% | | | | | | | | |
| | 55,300 | | Deckers Outdoor Corp.* | | | 4,560,250 | | | | 4,764,095 | |
| | | | Home Furnishing Retail - 3.4% | | | | | | | | |
| | 151,100 | | Williams-Sonoma Inc. | | | 4,231,784 | | | | 6,119,550 | |
| | | | Home Furnishings - 2.6% | | | | | | | | |
| | 93,100 | | Tempur-Pedic International Inc.* | | | 2,983,025 | | | | 4,716,446 | |
| | | | Leisure Products - 2.4% | | | | | | | | |
| | 50,000 | | Polaris Industries Inc. | | | 3,973,690 | | | | 4,351,000 | |
| | | | Total Consumer Discretionary | | | 31,838,254 | | | | 40,120,285 | |
| | | | This sector is 26.0% above your Fund’s cost. | | | | | | | | |
CONSUMER STAPLES | | | | | | | | |
| | | | Packaged Foods & Meats - 1.2% | | | | | | | | |
| | 86,300 | | Smithfield Foods Inc.* | | | 2,120,371 | | | | 2,076,378 | |
| | | | Total Consumer Staples | | | 2,120,371 | | | | 2,076,378 | |
| | | | This sector is 2.1% below your Fund’s cost. | | | | | | | | |
ENERGY | | | | | | | | |
| | | | Oil & Gas Drilling - 2.1% | | | | | | | | |
| | 128,900 | | Patterson-UTI Energy Inc. | | | 2,424,526 | | | | 3,788,371 | |
| | | | Oil & Gas Equipment & Services - 7.5% | | | | | | | | |
| | 46,600 | | Cameron International Corp.* | | | 1,566,841 | | | | 2,660,860 | |
| | 270,600 | | McDermott International Inc.* | | | 2,689,419 | | | | 6,870,534 | |
| | 50,000 | | Oil States International Inc.* | | | 3,706,172 | | | | 3,807,000 | |
| | | | Total Energy | | | 10,386,958 | | | | 17,126,765 | |
| | | | This sector is 64.9% above your Fund’s cost. | | | | | | | | |
FINANCIALS | | | | | | | | |
| | | | Asset Management & Custody Banks - 3.9% | | | | | | | | |
| | 160,200 | | Invesco Ltd. | | | 3,661,019 | | | | 4,094,712 | |
| | 120,380 | | SEI Investments Co. | | | 2,056,839 | | | | 2,874,674 | |
| | | | Investment Banking & Brokerage - 0.3% | | | | | | | | |
| | 16,400 | | LPL Investment Holdings Inc.* | | | 519,469 | | | | 587,284 | |
Brandywine Advisors Midcap Growth Fund
Schedule of Investments (Continued)
March 31, 2011 (Unaudited)
| Shares or | | | | | | | | |
| Principal | | | | | | | | |
| Amount | | | | Cost | | | Value | |
Common Stocks - 99.1% (a) (Continued) | | | | | | |
| | | Thrifts & Mortgage Finance - 3.2% | | | | | | |
| | 51,000 | | BankUnited Inc.* | | $ | 1,435,924 | | | $ | 1,464,210 | |
| | 311,757 | | First Niagara Financial Group Inc. | | | 4,529,408 | | | | 4,233,660 | |
| | | | Total Financials | | | 12,202,659 | | | | 13,254,540 | |
| | | | This sector is 8.6% above your Fund’s cost. | | | | | | | | |
HEALTH CARE | | | | | | | | |
| | | | Biotechnology - 1.3% | | | | | | | | |
| | 36,100 | | United Therapeutics Corp.* | | | 1,900,942 | | | | 2,419,422 | |
| | | | Health Care Technology - 2.5% | | | | | | | | |
| | 39,700 | | Cerner Corp.* | | | 4,058,371 | | | | 4,414,640 | |
| | | | Total Health Care | | | 5,959,313 | | | | 6,834,062 | |
| | | | This sector is 14.7% above your Fund’s cost. | | | | | | | | |
INDUSTRIALS | | | | | | | | |
| | | | Aerospace & Defense - 5.0% | | | | | | | | |
| | 50,400 | | Goodrich Corp. | | | 4,510,244 | | | | 4,310,712 | |
| | 56,000 | | TransDigm Group Inc.* | | | 3,146,569 | | | | 4,694,480 | |
| | | | Construction & Farm Machinery & Heavy Trucks - 2.3% | | | | | | | | |
| | 41,600 | | Joy Global Inc. | | | 3,352,770 | | | | 4,110,496 | |
| | | | Electrical Components & Equipment - 2.3% | | | | | | | | |
| | 67,900 | | Thomas & Betts Corp.* | | | 3,791,164 | | | | 4,038,013 | |
| | | | Human Resource & Employment Services - 1.4% | | | | | | | | |
| | 80,700 | | Robert Half International Inc. | | | 2,536,600 | | | | 2,469,420 | |
| | | | Industrial Machinery - 4.3% | | | | | | | | |
| | 98,900 | | Kennametal Inc. | | | 4,053,881 | | | | 3,857,100 | |
| | 74,100 | | The Timken Co. | | | 3,303,048 | | | | 3,875,430 | |
| | | | Trading Companies & Distributors - 3.6% | | | | | | | | |
| | 94,300 | | MSC Industrial Direct Co. Inc. | | | 5,791,577 | | | | 6,456,721 | |
| | | | Trucking - 1.8% | | | | | | | | |
| | 202,800 | | Hertz Global Holdings Inc.* | | | 3,177,207 | | | | 3,169,764 | |
| | | | Total Industrials | | | 33,663,060 | | | | 36,982,136 | |
| | | | This sector is 9.9% above your Fund’s cost. | | | | | | | | |
INFORMATION TECHNOLOGY | | | | | | | | |
| | | | Application Software - 8.2% | | | | | | | | |
| | 90,500 | | ANSYS Inc.* | | | 4,932,004 | | | | 4,904,195 | |
| | 107,300 | | Autodesk Inc.* | | | 3,032,828 | | | | 4,733,003 | |
| | 95,600 | | Informatica Corp.* | | | 4,290,479 | | | | 4,993,188 | |
| | | | Communications Equipment - 3.0% | | | | | | | | |
| | 75,700 | | Acme Packet Inc.* | | | 3,070,756 | | | | 5,371,672 | |
| | | | IT Consulting & Other Services - 3.4% | | | | | | | | |
| | 27,900 | | Booz Allen Hamilton | | | | | | | | |
| | | | Holding Corp.* | | | 543,657 | | | | 502,479 | |
| | 23,900 | | Gartner Inc.* | | | 848,450 | | | | 995,913 | |
| | 90,200 | | Teradata Corp.* | | | 4,473,725 | | | | 4,573,140 | |
| | | | Semiconductors - 4.8% | | | | | | | | |
| | 73,000 | | Analog Devices Inc. | | | 2,752,373 | | | | 2,874,740 | |
| | 252,900 | | Atmel Corp.* | | | 3,174,806 | | | | 3,447,027 | |
| | 78,500 | | NXP Semiconductors N.V.* | | | 2,367,315 | | | | 2,355,000 | |
| | | | Systems Software - 2.7% | | | | | | | | |
| | 93,800 | | Check Point Software | | | | | | | | |
| | | | Technologies Ltd.* | | | 4,313,117 | | | | 4,788,490 | |
| | | | Total Information Technology | | | 33,799,510 | | | | 39,538,847 | |
| | | | This sector is 17.0% above your Fund’s cost. | | | | | | | | |
MATERIALS | | | | | | | | |
| | | | Commodity Chemicals - 1.0% | | | | | | | | |
| | 31,500 | | Westlake Chemical Corp. | | | 1,615,914 | | | | 1,770,300 | |
| | | | Metal & Glass Containers - 2.1% | | | | | | | | |
| | 57,600 | | Greif Inc. | | | 3,301,830 | | | | 3,767,616 | |
| | | | Specialty Chemicals - 3.2% | | | | | | | | |
| | 96,800 | | Albemarle Corp. | | | 3,552,668 | | | | 5,785,736 | |
| | | | Steel - 3.0% | | | | | | | | |
| | 47,000 | | Allegheny Technologies Inc. | | | 2,376,723 | | | | 3,182,840 | |
| | 21,800 | | Cliffs Natural Resources Inc. | | | 1,858,417 | | | | 2,142,504 | |
| | | | Total Materials | | | 12,705,552 | | | | 16,648,996 | |
| | | | This sector is 31.0% above your Fund’s cost. | | | | | | | | |
TELECOMMUNICATION SERVICES | | | | | | | | |
| | | | Wireless Telecommunication Services - 2.6% | | | | | | | | |
| | 289,100 | | MetroPCS Communications Inc.* | | | 3,543,657 | | | | 4,694,984 | |
| | | | Total Telecommunication Services | | | 3,543,657 | | | | 4,694,984 | |
| | | | This sector is 32.5% above your Fund’s cost. | | | | | | | | |
| | | | Total common stocks | | | 146,219,334 | | | | 177,276,993 | |
Short-Term Investments - 3.1% (a) | | �� | | | | | | |
| | | | Commercial Paper - 2.0% | | | | | | | | |
| $ | 3,600,000 | | Prudential Funding LLC, | | | | | | | | |
| | | | due 04/01/11, discount of 0.16% | | | 3,600,000 | | | | 3,600,000 | |
| | | | Variable Rate Demand Note - 1.1% | | | | | | | | |
| | 2,009,590 | | American Family Financial | | | | | | | | |
| | | | Services, 0.10% | | | 2,009,590 | | | | 2,009,590 | |
| | | | Total short-term investments | | | 5,609,590 | | | | 5,609,590 | |
| | | | Total investments - 102.2% | | $ | 151,828,924 | | | | 182,886,583 | |
| | | | Liabilities, less | | | | | | | | |
| | | | other assets - (2.2%) (a) | | | | | | | (4,022,407 | ) |
| | | | TOTAL NET ASSETS - 100.0% | | | | | | $ | 178,864,176 | |
* Non-dividend paying security.
(a) Percentages for the various classifications relate to net assets.
N.V. - Netherlands Antillies Limited Liability Corp.
The accompanying notes to financial statements are an integral part of this schedule.
Brandywine Advisors Midcap Growth Fund
Statement of Operations
For the Six Months Ended March 31, 2011 (Unaudited)
| Income: | | | |
| Dividends | | $ | 425,316 | |
| Interest | | | 4,786 | |
| Total income | | | 430,102 | |
| | | | | |
| Expenses: | | | | |
| Management fees | | | 849,782 | |
| Service and Distribution expenses | | | 67,940 | |
| Transfer agent fees | | | 43,400 | |
| Registration fees | | | 29,020 | |
| Professional fees | | | 27,846 | |
| Administrative and accounting services | | | 20,664 | |
| Printing and postage expense | | | 19,400 | |
| Custodian fees | | | 13,470 | |
| Board of Directors fees and expenses | | | 11,410 | |
| Other expenses | | | 8,920 | |
| Net expenses | | | 1,091,852 | |
| Net Investment Loss | | | (661,750 | ) |
| Net Realized Gain on Investments | | | 26,620,686 | |
| Net Increase in Unrealized Appreciation on Investments | | | 15,497,662 | |
| Net Gain on Investments | | | 42,118,348 | |
| Net Increase in Net Assets Resulting From Operations | | $ | 41,456,598 | |
Statements of Changes in Net Assets
For the Six Months Ended March 31, 2011 (Unaudited)
and for the Year Ended September 30, 2010
| | | 2011 | | | 2010 | |
| Operations: | | | | | | |
| Net investment loss | | $ | (661,750 | ) | | $ | (506,829 | ) |
| Net realized gain on investments | | | 26,620,686 | | | | 5,213,609 | |
| Net increase in unrealized appreciation on investments | | | 15,497,662 | | | | 1,122,510 | |
| Net increase in net assets resulting from operations | | | 41,456,598 | | | | 5,829,290 | |
| | | | | | | | | |
| Fund Share Activities: | | | | | | | | |
| Proceeds from shares issued (465,149 and 5,564,472 shares, respectively) | | | 3,705,319 | | | | 39,472,170 | |
| Cost of shares redeemed (5,927,545 and 2,145,913 shares, respectively) | | | (45,078,240 | ) | | | (15,038,733 | ) |
| Net (decrease) increase in net assets derived from Fund share activities | | | (41,372,921 | ) | | | 24,433,437 | |
| Total Increase | | | 83,677 | | | | 30,262,727 | |
| | | | | | | | | |
| Net Assets at the Beginning of the Period | | | 178,780,499 | | | | 148,517,772 | |
| Net Assets at the End of the Period | | $ | 178,864,176 | | | $ | 178,780,499 | |
| (Includes undistributed net investment income of $0 and $0, respectively) | | | | | | | | |
The accompanying notes to financial statements are an integral part of these statements.
Brandywine Advisors Midcap Growth Fund
Financial Highlights
(Selected data for each share of the Fund outstanding throughout each period)
| | | For the Six Months Ended | | | | | | | | | | | | | | | | |
| | | March 31, 2011 | | | Years Ended September 30, | |
| | | (Unaudited) | | | 2010 | | | 2009 | | | 2008 | | | 2007 | | | 2006 | |
| PER SHARE OPERATING PERFORMANCE: | | | | | | | | | | | | | | | | | | |
| Net asset value, beginning of period | | $ | 7.13 | | | $ | 6.86 | | | $ | 8.65 | | | $ | 13.03 | | | $ | 10.63 | | | $ | 12.29 | |
| Income from investment operations: | | | | | | | | | | | | | | | | | | | | | | | | |
Net investment loss(1) | | | (0.03 | ) | | | (0.02 | ) | | | (0.04 | ) | | | (0.08 | ) | | | (0.07 | ) | | | (0.06 | ) |
Net realized and unrealized gains (losses) on investments | | | 2.03 | | | | 0.29 | | | | (1.75 | ) | | | (2.81 | ) | | | 3.25 | | | | (0.20 | ) |
| Total from investment operations | | | 2.00 | | | | 0.27 | | | | (1.79 | ) | | | (2.89 | ) | | | 3.18 | | | | (0.26 | ) |
| | | | | | | | | | | | | | | | | | | | | | | | | |
| Less distributions: | | | | | | | | | | | | | | | | | | | | | | | | |
| Distributions from net investment income | | | — | | | | — | | | | — | | | | — | | | | — | | | | — | |
| Distributions from net realized gains | | | — | | | | — | | | | — | | | | (1.49 | ) | | | (0.78 | ) | | | (1.40 | ) |
| Total from distributions | | | — | | | | — | | | | — | | | | (1.49 | ) | | | (0.78 | ) | | | (1.40 | ) |
| Net asset value, end of period | | $ | 9.13 | | | $ | 7.13 | | | $ | 6.86 | | | $ | 8.65 | | | $ | 13.03 | | | $ | 10.63 | |
| TOTAL RETURN | | | 28.05 | %(a) | | | 3.94 | % | | | (20.69 | %) | | | (25.22 | %) | | | 31.80 | % | | | (1.10 | %) |
| | | | | | | | | | | | | | | | | | | | | | | | | |
| RATIOS/SUPPLEMENTAL DATA: | | | | | | | | | | | | | | | | | | | | | | | | |
| Net assets, end of period (in 000’s $) | | | 178,864 | | | | 178,780 | | | | 148,518 | | | | 204,571 | | | | 261,500 | | | | 187,381 | |
| Ratio of expenses to average net assets | | | 1.28 | %(b) | | | 1.28 | % | | | 1.30 | % | | | 1.19 | % | | | 1.17 | % | | | 1.18 | % |
Ratio of net investment loss to average net assets | | | (0.78 | %)(b) | | | (0.30 | %) | | | (0.62 | %) | | | (0.71 | %) | | | (0.59 | %) | | | (0.53 | %) |
| Portfolio turnover rate | | | 108 | %(a) | | | 226 | % | | | 240 | % | | | 198 | % | | | 178 | % | | | 208 | % |
| (1) | Net investment loss per share was calculated using average shares outstanding. |
The accompanying notes to financial statements are an integral part of this statement.
Brandywine Advisors Midcap Growth Fund
Notes to Financial Statements
March 31, 2011 (Unaudited)
| (1) | Summary of Significant Accounting Policies |
The following is a summary of significant accounting policies of Brandywine Advisors Midcap Growth Fund (the “Fund”). The Fund is registered as a diversified open-end management company under the Investment Company Act of 1940 (the “Act”), as amended, and is a series of the Brandywine Blue Fund, Inc. (the “Blue Fund”). The Blue Fund was incorporated under the laws of Maryland on November 13, 1990. The assets and liabilities of each series in the Blue Fund are segregated and a shareholder’s interest is limited to the Fund in which the shareholder owns shares. The investment objective of the Fund is to produce capital appreciation principally through investing in common stocks.
| | (a) | Each security, excluding short-term investments, is valued at the last sale price reported by the principal security exchange on which the issue is traded. Securities that are traded on the Nasdaq Markets are valued at the Nasdaq Official Closing Price, or if no sale is reported, the latest bid price. Securities which are traded over-the-counter are valued at the latest bid price. Securities for which quotations are not readily available are valued at fair value as determined by the investment adviser under the supervision of the Board of Directors. The fair value of a security may differ from the last quoted price and the Fund may not be able to sell a security at the estimated fair value. Market quotations may not be available, for example, if trading in particular securities has halted during the day and not resumed prior to the close of trading on the New York Stock Exchange. As of March 31, 2011, there were no securities that were internally fair valued. Short-term investments with maturities of 60 days or less are valued at amortized cost, which approximates value. For financial reporting purposes, investment transactions are recorded on the trade date; however, for purposes of executing shareholder transactions, the Fund records changes in holdings of portfolio securities no later than the first business day after the trade date in accordance with Rule 2a-4 of the Act. Accordingly certain differences between net asset value for financial reporting and for executing shareholder transactions may arise. |
The Fund adopted the provisions of the Financial Accounting Standards Board (“FASB”) Accounting Standards Codification “Fair Value Measurements and Disclosures” Topic 820 (“ASC 820”), effective October 1, 2008. Under ASC 820, fair value is defined as the price that would be received to sell an asset or paid to transfer a liability (i.e., the “exit price”) in an orderly transaction between market participants at the measurement date.
In determining fair value, the Fund uses various valuation approaches. ASC 820 establishes a fair value hierarchy for inputs used in measuring fair value that maximizes the use of observable inputs and minimizes the use of unobservable inputs by generally requiring that the most observable inputs be used when available. Observable inputs are those that market participants would use in pricing the asset or liability based on market data obtained from sources independent of the Fund. Unobservable inputs reflect the Fund’s assumptions about the inputs market participants would use in pricing the asset or liability developed based on the best information available in the circumstances. The inputs or methodologies used for valuing securities are not necessarily an indication of the risks associated with investing in those securities.
The fair value hierarchy is categorized into three levels based on the inputs as follows:
Level 1 – Valuations based on unadjusted quoted prices in active markets for identical assets.
Level 2 – Valuations based on quoted prices for similar securities or in markets that are not active or for which all significant inputs are observable, either directly or indirectly.
Level 3 – Valuations based on inputs that are unobservable and significant to the overall fair value measurement.
Brandywine Advisors Midcap Growth Fund
Notes to Financial Statements (Continued)
March 31, 2011 (Unaudited)
| (1) | Summary of Significant Accounting Policies (Continued) |
The following table summarizes the Fund’s investments as of March 31, 2011, based on the inputs used to value them:
| Valuation Inputs | | Investments in Securities | |
| Level 1 – Common Stocks | | $ | 177,276,993 | |
| | | | | |
| Level 2 – Short-Term Commercial Paper | | | 3,600,000 | |
| Variable Rate Demand Note | | | 2,009,590 | |
| Total Level 2 | | | 5,609,590 | |
| Level 3 – | | | — | |
| Total | | $ | 182,886,583 | |
It is the Fund’s policy to recognize transfers between levels at the end of the quarterly reporting period. There were no transfers between levels during the six months ended March 31, 2011.
See the Schedule of Investments for investments detailed by industry classifications.
| | (b) | Net realized gains and losses on sales of securities are computed on the identified cost basis. |
| | (c) | Dividend income is recorded on the ex-dividend date. Interest income is recorded on an accrual basis. |
| | (d) | The Fund has investments in short-term variable rate demand notes, which are unsecured instruments. The Fund may be susceptible to credit risk with respect to these notes to the extent the issuer defaults on its payment obligation. The Fund’s policy is to monitor the creditworthiness of the issuer and nonperformance by these counterparties is not anticipated. |
| | (e) | Accounting principles generally accepted in the United States of America (“GAAP”) require that permanent differences between income for financial reporting and tax purposes be reclassified in the capital accounts. |
| | (f) | The preparation of financial statements in conformity with GAAP requires management to make estimates and assumptions that affect the reported amounts of assets and liabilities and disclosure of contingent assets and liabilities at the date of the financial statements and the reported amounts of revenues and expenses during the reporting period. Actual results could differ from these estimates. |
| | (g) | No provision has been made for Federal income taxes since the Fund has elected to be taxed as a “regulated investment company” and intends to distribute substantially all net investment company taxable income and net capital gains to shareholders and otherwise comply with the provisions of the Internal Revenue Code applicable to regulated investment companies. |
| | (h) | The Fund has reviewed all open tax years and major jurisdictions, which include Federal and the state of Maryland, and concluded that there are no significant uncertain tax positions that would require recognition in the financial statements. Open tax years are those that are open for exam by taxing authorities and, as of March 31, 2011, open Federal tax years include the tax years ended September 30, 2007 through 2010. The Fund has no examinations in progress and is also not aware of any tax positions for which it is reasonably possible that the total amounts of unrecognized tax benefits will significantly change in the next twelve months. |
| (2) | Investment Adviser and Management Agreement and Transactions With Related Parties |
The Fund has a management agreement with Friess Associates, LLC (the “Adviser”), with whom certain Officers and a Director of the Fund are affiliated, to serve as investment adviser and manager. Under the terms of the agreement, the Fund will pay the Adviser a monthly management fee at the annual rate of one percent (1%) on the daily net assets of the Fund.
The Adviser entered into a sub-advisory agreement with its affiliate, Friess Associates of Delaware, LLC (the “Sub-Adviser”), to assist it in the day-to-day management of the Fund. The Adviser and, if so delegated, the Sub-Adviser supervise the investment portfolio of the Fund, directing the purchase and sale of investment securities in the day-to-day management of the Fund. The Adviser pays the Sub-Adviser a fee equal to 110% of the monthly expenses the Sub-Adviser incurs in performing its services as Sub-Adviser. This relationship does not increase the annual management fee the Fund pays to the Adviser.
Under the management agreement, the Adviser will reimburse the Fund for expenses over 1.95% of the daily net assets of the Fund. No such reimbursements were required for the six months ended March 31, 2011.
The Fund pays each of the five independent directors annual fees of $3,400. The lead independent director and chairman of the audit committee are paid an additional $8,000 and $5,000 annually, respectively, divided proportionately among all the Brandywine Funds. All of the corresponding fees the directors receive are paid quarterly to the directors and then invested on the payment date in shares of the Fund at the net asset value of the Fund on the payment date. The Fund also reimburses directors for travel costs incurred in order to attend meetings of the Board of Directors. For the six months ended March 31, 2011, the Fund expensed the following directors fees and costs:
| Directors Fees and Travel Costs Paid during the Period | $11,410 |
The Fund has adopted a Service and Distribution Plan (the “Plan”) pursuant to Rule 12b-1 under the Act. The Plan provides that the Fund may incur certain costs which may not exceed a maximum amount equal to 0.25% per annum of the Fund’s average net assets. Payments made pursuant to the Plan may only be used to pay distribution expenses incurred in the current year.
Under the Fund’s organizational documents, each director, officer, employee or other agent of the Fund (including the Fund’s investment manager) is indemnified, to the extent permitted by the Act, against certain liabilities that may arise out of performance of their duties to the Fund. Additionally, in the normal course of business, the Fund enters into contracts that contain a variety of indemnification clauses. The Fund’s maximum exposure under these arrangements is unknown as this would involve future claims that may be made against the Fund that have not yet occurred. However, the Fund has not had prior claims or losses pursuant to these contracts and believes the risk of loss to be remote.
At March 31, 2011, approximately 77% of the outstanding shares of the Fund are owned by an affiliate of the Adviser.
U.S. Bank, N.A. has made available to the Fund a $4,000,000 uncommitted credit facility pursuant to a Credit Agreement, effective December 6, 2004, for the purpose of having cash available to cover incoming redemptions. Principal and interest of such loan under the Credit Agreement is due not more than 31 days after the date of the loan. Amounts under the credit facility bear interest at a rate per annum equal to the current prime rate minus one percent on the amount borrowed. During the six months ended March 31, 2011, the Fund did not borrow against its Agreement. The Credit Agreement is renewable annually on December 18.
Brandywine Advisors Midcap Growth Fund
Notes to Financial Statements (Continued)
March 31, 2011 (Unaudited)
| (4) | Distributions to Shareholders |
Net investment income and net realized gains, if any, are distributed to shareholders at least annually.
| (5) | Investment Transactions |
For the six months ended March 31, 2011, purchases and proceeds of sales of investment securities (excluding short-term investments) for the Fund were $180,063,118 and $215,971,396, respectively.
| (6) | Income Tax Information |
The following information for the Fund is presented on an income tax basis as of September 30, 2010:
| | | | Gross | | | Gross | | | Net Unrealized | | | Distributable | | | Distributable | |
| Cost of | | | Unrealized | | | Unrealized | | | Appreciation | | | Ordinary | | | Long-Term | |
| Investments | | | Appreciation | | | Depreciation | | | on Investments | | | Income | | | Capital Gains | |
| $ | 160,766,954 | | | $ | 17,662,412 | | | $ | 2,519,900 | | | $ | 15,142,512 | | | $ | — | | | $ | — | |
The difference, if any, between the cost amount for financial statement and federal income tax purposes is due primarily to timing differences in recognizing certain gains and losses in security transactions.
The tax components of dividends paid during the years ended September 30, 2010 and 2009, capital loss carryovers, which may be used to offset future capital gains, subject to Internal Revenue Code limitations (expiring in 2017 and 2018), as of September 30, 2010, and tax basis post-October losses as of September 30, 2010, which are not recognized for tax purposes until the first day of the following fiscal year are:
| September 30, 2010 | | | September 30, 2009 | |
| Ordinary | | | Long-Term | | | Net Capital | | | Post-October | | | Ordinary | | | Long-Term | |
| Income | | | Capital Gains | | | Loss | | | Currency | | | Income | | | Capital Gains | |
| Distributions | | | Distributions | | | Carryovers | | | Losses | | | Distribution | | | Distributions | |
| $ | — | | | $ | — | | | $ | 72,954,620 | | | $ | 55 | | | $ | — | | | $ | — | |
Since there were no ordinary distributions paid for the year ended September 30, 2010, there were no distributions designated as qualifying for the dividends received deduction for corporate shareholders nor as qualified dividend income under the Jobs and Growth Tax Relief Act of 2003.
Cost Discussion
Mutual fund shareholders incur two types of costs: (1) transaction costs, including sales charges (loads) on purchase payments, reinvested dividends, or other distributions; redemption fees; and exchange fees; and (2) ongoing costs, including management fees; distribution [and/or service] (12b-1) fees; and other fund expenses. This example is intended to help you understand your ongoing costs (in dollars) of investing in Brandywine Advisors Midcap Growth Fund and to compare these costs with the ongoing costs of investing in other mutual funds.
In addition to the costs highlighted and described below, the only Fund transaction costs you might currently incur would be wire fees ($15 per wire), if you choose to have proceeds from a redemption wired to your bank account instead of receiving a check. Additionally, U.S. Bank charges an annual processing fee ($15) if you maintain an IRA account with the Fund. To determine your total costs of investing in the Fund, you would need to add any applicable wire or IRA processing fees you’ve incurred during the period to the costs provided in the example at the end of this article.
The example is based on $1,000 invested at the beginning of the period and held for the entire period from October 1, 2010 through March 31, 2011.
Actual Expenses
The first line of the table below provides information about actual account values and actual expenses. You may use the information in this line, together with the amount you invested, to estimate the expenses that you paid over the period. Simply divide your account value by $1,000 (for example, an $8,600 account value divided by $1,000 = 8.6), then multiply the result by the number in the first line under the heading entitled “Expenses Paid During Period” to estimate the expenses you paid on your account during this period.
Hypothetical Example for Comparison Purposes
The second line of the table below provides information about hypothetical account values and hypothetical expenses based on the Fund’s actual expense ratio and an assumed rate of return of 5% per year before expenses, which is not the Fund’s actual return. The hypothetical account values and expenses may not be used to estimate the actual ending account balance or expenses you paid for the period. You may use this information to compare the ongoing costs of investing in the Fund and other funds. To do so, compare this 5% hypothetical example with the 5% hypothetical examples that appear in the shareholder reports of the other funds.
Please note that the expenses shown in the table are meant to highlight your ongoing costs only and do not reflect any transactional costs. While Brandywine Advisors Midcap Growth Fund currently does not assess sales charges, redemption or exchange fees, other funds do, and those costs will not be reflected in their expense example tables. Therefore, the second line of the table is useful in comparing ongoing costs only, and will not help you determine the relative total costs of owning different funds.
| | Beginning | Ending | |
| | Account | Account | Expenses Paid |
| | Value | Value | During Period* |
| | 10/01/10 | 3/31/11 | 10/01/10-3/31/11 |
| Brandywine Advisors Midcap Growth Fund Actual | $1,000.00 | $1,280.50 | $7.28 |
| Hypothetical (5% return before expenses) | $1,000.00 | $1,018.50 | $6.44 |
| * | Expenses are equal to the Fund’s annualized expense ratio of 1.28%, multiplied by the average account value over the period, multiplied by 182/365 (to reflect the one-half year period between October 1, 2010 and March 31, 2011). |
Brandywine Advisors Midcap Growth Fund’s Advisory Agreement
On December 6, 2010, the Board of Directors(“Directors”) of the Fund approved the continuation of the advisory agreement with Friess Associates, LLC (“Friess”). Prior to approving the continuation of the advisory agreement, the Directors considered:
| | • | the nature, extent and quality of the services provided by Friess |
| | • | the investment performance of the Fund |
| | • | the costs of the services to be provided and profits to be realized by Friess from its relationship with the Fund |
| | • | the extent to which economies of scale would be realized as the Fund grows and whether fee levels reflect these economies of scale |
| | • | the expense ratio of the Fund |
| | • | other revenue to Friess and its affiliates from their relationship with the Fund |
| | • | the manner in which portfolio transactions for the Fund are conducted, including the use of soft dollars |
In considering the nature, extent and quality of the services provided by Friess, the Directors reviewed a report describing the portfolio management, shareholder communication and servicing, and regulatory compliance services provided by Friess to the Fund. The Directors concluded that Friess was providing essential services to the Fund. In particular, the Directors concluded that Friess was preparing reports to shareholders in addition to those required by law and continued to generate increased written communications, at Friess’ expense, to support shareholders.
The Directors compared the performance of the Fund to benchmark indexes over various periods of time and concluded that the performance of the Fund warranted the continuation of the advisory agreement.
In concluding that the advisory fees payable by the Fund were reasonable, the Directors reviewed a report of the costs of services provided, and the profits realized by Friess from its relationship with the Fund and concluded that such profits were reasonable and not excessive. The Directors also reviewed reports comparing the expense ratio and advisory fee paid by the Fund to those paid by other comparable mutual funds and concluded that the advisory fee paid by the Fund was higher than the average advisory fee paid by comparable mutual funds, but the expense ratio of the Fund was lower than the average expense ratio of comparable mutual funds. The Directors also considered the Fund’s portfolio turnover rate and that all clients of Friess pay the same 1 percent advisory fee. They noted that this fee would not be adjusted if economies of scale were realized during the current contract period as the Fund grew, but did not consider that factor to be significant in light of the other factors considered, particularly the fact that the profits were reasonable and not excessive. The Directors noted that having the same fee for all clients eliminated conflicts of interest that would be present if Friess charged different fees to different clients.
Finally, the Directors reviewed reports discussing the manner in which portfolio transactions for the Fund were conducted, including the use of soft dollars. Based on these reports, the Directors concluded that the research obtained by Friess was beneficial to the Fund and that Friess was executing the Fund’s portfolio transactions in a manner designed to obtain best execution for the Fund.
Additional Director Information, Proxy Voting Policy
and Quarterly Portfolio Schedules
For additional information about the Directors and Officers or for a description of the policies and procedures that the Fund uses to determine how to vote proxies relating to portfolio securities, please call (877) 636-6460 and request a Statement of Additional Information. One will be mailed to you free of charge. The Statement of Additional Information is also available on the website of the Securities and Exchange Commission (the “Commission”) at http://www.sec.gov or the Fund’s website at http://www.brandywinefunds.com. Information on how the Fund voted proxies relating to portfolio securities is available on the Fund’s website or the website of the Commission no later than August 31 for the prior twelve months ending June 30. The Fund files its complete schedule of portfolio holdings with the Commission for the first and third quarters of each fiscal year on Form N-Q. The Fund’s Form N-Q is available on the Commission’s website. The Fund’s Form N-Q may be reviewed and copied at the Commission’s Public Reference Room in Washington, D.C. Information on the operation of the Public Reference Room may be obtained by calling 1-800-SEC-0330.
| Board of Directors | Founder |
| | | | |
William F. D’AlonzoCEO and CIOFriess Associates | C. Quentin S. JacksonFormer President andCEO Nuclear ElectricInsurance Limited | Stuart A. McFarlandManaging PartnerFederal City CapitalAdvisors, LLC | Foster S. Friess
The Brandywine Funds P.O. Box 4166 Greenville, DE 19807 (877) 636-6460 www.brandywinefunds.com bfunds@friess.com |
| | | | |
| W. Richard Scarlett, III | Thomas D. Wren | James W. Zug | |
| Former President and CEO | Former Senior Advisor | Former Senior Partner | |
| Jackson State Bank & Trust | Promontory Financial Group, LLC | PricewaterhouseCoopers LLP | |
Investment Adviser: Friess Associates, LLC | Independent Registered Public Accounting Firm : PricewaterhouseCoopers LLP |
Investment Sub-Adviser: Friess Associates of Delaware, LLC | Administrator, Accountant & Transfer Agent: U.S. Bancorp Fund Services, LLC |
Custodian: U.S. Bank, N.A. | Distributor: Quasar Distributors, LLC |
Legal Counsel: Foley & Lardner LLP | |
Officers: William D’Alonzo, Chairman and President;
Lynda Campbell, Vice President, Secretary and Treasurer; Joseph Fields, Vice President;
Gordon Kaiser, Vice President; David Marky, Chief Compliance Officer, Vice President and Assistant Secretary
Report Editor: Chris Aregood Report Staff: David Marky, Adam Rieger
Must be preceded or accompanied by prospectus. Please refer to the prospectus for important information about the investment company including investment objectives, risks, charges and expenses.
Mutual fund investing involves risk. Principal loss is possible. The Fund invests in mid-cap companies, which involve additional risks such as limited liquidity and greater volatility. Investments in foreign securities, even though publicly traded in the United States, may involve risks which are in addition to those inherent in domestic investments. Current and future portfolio holdings are subject to risk. Fund holdings and sector weightings are subject to change at any time and are not recommendations to buy or sell any securities. Securities discussed were not held by the Fund as of March 31, 2011, unless listed in the accompanying schedule of investments. References to the earnings growth rates of the Fund refer solely to the estimated earnings growth rates of the average investment holding of the Fund based on consensus estimates from Baseline Financial Services, Inc. (“Baseline”) and not to the actual performance of the Fund itself. Baseline provides analytical information and services to the investment community. The S&P 500, Russell Midcap and Russell Midcap Growth Indexes are unmanaged indexes commonly used to measure the performance of U.S. stocks.You cannot invest directly in an index.
Earnings per share (EPS) is calculated by taking the total earnings divided by the number of shares outstanding. Earnings Growth is a measure of growth in a company’s net income over a specific period, often one year. Book Value (Book Cost) is the net asset value of a company, calculated by subtracting total liabilities from total assets. The Price to Earnings (P/E) Ratio reflects the multiple of earnings at which a stock sells and is calculated by dividing current price of the stock by the company’s trailing or forward 12 months’ earnings per share.
As of March 31, 2011, the S&P 500 Index’s average annual total returns for 1, 5 and 10 years were 15.65, 2.62 and 3.29 percent; the Russell Midcap Index’s were 24.27, 4.67 and 8.52 percent; and the Russell Midcap Growth Index’s were 26.60, 4.93 and 6.94 percent.
4/11
12
Item 2. Code of Ethics.
Not applicable for semi-annual reports.
Item 3. Audit Committee Financial Expert.
Not applicable for semi-annual reports.
Item 4. Principal Accountant Fees and Services.
Not applicable for semi-annual reports.
Item 5. Audit Committee of Listed Registrants.
Not applicable to registrants who are not listed issuers (as defined in Rule 10-A3 under the Securities Exchange Act of 1934.
Item 6. Schedule of Investments.
| (a) | The Schedules of Investments in securities of unaffiliated issuers are included as part of the report to shareholders filed under Item 1 of this Form. |
Item 7. Disclosure of Proxy Voting Policies and Procedures for Closed-End Management Investment Companies
Not applicable.
Item 8. Portfolio Managers of Closed-End Management Investment Companies.
Not applicable.
Item 9. Purchases of Equity Securities By Closed-End Management Investment Company and Affiliated Purchasers.
Not applicable.
Item 10. Submission of Matters to a Vote of Security Holders.
None.
Item 11. Controls and Procedures.
| (a) | The Registrant’s disclosure controls and procedures are periodically evaluated. As of April 20, 2011, the date of the last evaluation, the Registrant’s officers have concluded that the Registrant’s disclosure controls and procedures are adequate. |
| (b) | The Registrant’s internal controls are periodically evaluated. There were no changes in the Registrant’s internal control over financial reporting that occurred during the second fiscal quarter of the period covered by this report that have materially affected, or are reasonably likely to materially affect, such controls. |
Item 12. Exhibits.
| (a) | (1) Any code of ethics or amendment thereto. Not applicable. |
(2) Certifications pursuant to Section 302 of the Sarbanes-Oxley Act of 2002. Filed herewith.
(3) Any written solicitation to purchase securities under Rule 23c-1 under the Act sent or given during the period covered by the report by or on behalf of the Registrant to 10 or more persons. Not applicable to open-end investment companies.
| (b) | Certification pursuant to Section 906 of the Sarbanes-Oxley Act of 2002. Furnished herewith. |
SIGNATURES
Pursuant to the requirements of the Securities Exchange Act of 1934 and the Investment Company Act of 1940, the registrant has duly caused this report to be signed on its behalf by the undersigned, thereunto duly authorized.
Brandywine Blue Fund, Inc.
Registrant
By /s/William F. D’Alonzo
William F. D’Alonzo, President, Principal Executive Officer
Date April 20, 2011
Pursuant to the requirements of the Securities Exchange Act of 1934 and the Investment Company Act of 1940, this report has been signed below by the following persons on behalf of the registrant and in the capacities and on the dates indicated.
Brandywine Blue Fund, Inc.
Registrant
By /s/William F. D’Alonzo
William F. D’Alonzo, President, Principal Executive Officer
Date April 20, 2011
Brandywine Blue Fund, Inc.
Registrant
By /s/Lynda J. Campbell
Lynda J. Campbell, Treasurer, Principal Financial Officer
Date April 20, 2011