SECURITIES AND EXCHANGE COMMISSION
Washington, DC 20549
FORM 10-K
ANNUAL REPORT
PURSUANT TO SECTIONS 13 OR 15(d)
OF THE SECURITITES EXCHANGE ACT OF 1934
(Mark One)
x ANNUAL REPORT PURSUANT TO SECTION 13 OR 15(d) OF THE SECURITIES EXCHANGE ACT OF 1934
For the fiscal year ended March 31, 2007
OR
TRANSITION REPORT PURSUANT TO SECTION 13 OR 15(d) OF THE SECURITIES EXCHANGE ACT OF 1934
For the transition period from _______ to _______
Commission file number 1-11056
ADVANCED PHOTONIX, INC.®
(Exact Name of Registrant as Specified in Its Charter)
Delaware | 33-0325826 |
| (State or Other Jurisdiction of | (I.R.S. Employer |
| Incorporation or Organization) | Identification No.) |
2925 Boardwalk, Ann Arbor, Michigan 48104
(Address of Principal Executive Offices) (Zip Code)
Registrant's telephone number, including area code (734) 864-5600
Securities registered pursuant to Section 12(b) of the Act: None
Securities registered pursuant to Section 12(g) of the Act:
Common Stock, $.001 Par Value
(Title of Class)
Class A Common Stock
(Title of Class)
Indicate by check mark if the registrant is a well-known seasoned issuer, as defined in Rule 405 of the Securities Act.
Yes o No x.
Indicate by check mark if the registrant is not required to file reports pursuant to Section 13 or Section 15(d) of the Act.
Yes o No x.
Indicate by check mark whether the registrant: (1) has filed all reports required to be filed by Section 13 or 15(d) of the Securities Exchange Act of 1934 during the preceding 12 months (or for such shorter period that the registrant was required to file such reports) and (2) has been subject to such filing requirements for the past 90 days.
Yes x No o
Indicate by check mark if disclosure of delinquent filers pursuant to Item 405 of Regulation S-K is not contained herein, and will not be contained, to the best of registrant's knowledge, in any definitive proxy or information statements incorporated by reference in Part III of this Form 10-K or any amendment to this Form 10-K. o
Indicate by check mark whether the registrant is a large accelerated filer or an accelerated filer (as defined in Exchange Act Rule 12b-2).
Yes o No x
Indicate by check mark whether the registrant is a shell company (as defined in Rule 12b-2 of the Exchange Act).
Yes o No x
The aggregate market value of the voting stock held by non--affiliates of the registrant as of September 29, 2006 was approximately $32.3 million.
Number of shares outstanding of the registrant's Common Stock as of June 26, 2007: 19,226,006 shares of Class A Common Stock and 31,691 shares of Class B Common Stock outstanding.
DOCUMENTS INCORPORATED BY REFERENCE
Portions of the definitive proxy statement to be filed pursuant to Regulation 14A promulgated under the Securities Exchange Act of 1934 in connection with the 2007 Annual Meeting of Stockholders of registrant have been incorporated by reference into Part III of this Form 10-K.
TABLE OF CONTENTS
| | | Page |
Part I | | 4 |
| | Item 1. | | | Business | | 4 |
| | Item 1A. | | | Risk Factors | | 10 |
| | Item 2. | | | Properties | | 15 |
| | Item 3. | | | Legal Proceedings | | 15 |
| | Item 4. | | | Submission of Matters to a Vote of Security Holders | | 15 |
| | | |
Part II | | 16 |
| | Item 5. | | | Market for Registrant’s Common Equity, Related Stockholder Matters and Issuer Purchases of Equity Securities | | 16 |
| | Item 6. | | | Selected Financial Data | | 18 |
| | Item 7. | | | Management’s Discussion and Analysis of Financial Condition and Results of Operations | | 19 |
| | Item 7A. | | | Quantitative and Qualitative Disclosures about Market Risk | | 27 |
| | Item 8. | | | Financial Statements and Supplementary Data | | 28 |
| | Item 9. | | | Changes in and Disagreements with Accountants on Accounting and Financial Disclosure | | 53 |
| | Item 9A. | | | Controls and Procedures | | 53 |
| | Item 9B. | | | Other Information | | 54 |
| | | |
Part III | | 54 |
| | Item 10. | | | Directors, Executive Officers and Corporate Governance | | 54 |
| | Item 11. | | | Executive Compensation | | 54 |
| | Item 12. | | | Security Ownership of Certain Beneficial Owners and Management and Related Stockholder Matters | | 54 |
| | Item 13. | | | Certain Relationships and Related Transactions, and Director Independence | | 55 |
| | Item 14. | | | Principal Accountant Fees and Services | | 55 |
| | | |
Part IV | | 55 |
| | Item 15. | | | Exhibits and Financial Statement Schedules | | 55 |
| | | | | | | |
Signatures | | 59 |
| Ex-31.1 | Section 302 Certification of CEO |
| Ex-31.2 | Section 302 Certification of CFO |
| Ex-32.1 | Section 906 Certification of CEO |
| Ex-32.2 | Section 906 Certification of CFO |
PART I
General
Advanced Photonix, Inc. ® (the Company, we or API), was incorporated under the laws of the State of Delaware in June 1988. The Company is engaged in the development and manufacture of optoelectronic devices and value-added sub-systems and systems. The Company serves a variety of global Original Equipment Manufacturers (OEMs), in a variety of industries. The Company supports the customer from the initial concept and design phase of the product, through testing to full-scale production. The Company has three manufacturing facilities; located in Camarillo, CA, Dodgeville, WI and Ann Arbor, MI.
Products and Technology
Our Business
API is a leading supplier of custom opto-electronic solutions, high-speed optical receivers and Terahertz sensors and instrumentation, serving a variety of global OEM markets. Our optoelectronic solutions are based on our silicon Large Area Avalanche Photodiode (LAAPD), PIN (positive-intrinsic-negative) photodiode and FILTRODE® detectors. Our patented high-speed optical receivers include Avalanche Photodiode technology (APD) and PIN photodiode technology based upon III-V materials, including InP, InAlAs, and GaAs. Our newly emerging Terahertz sensor product line is targeted to the industrial Non-Destructive Testing (NDT), quality control, homeland security and military markets. Using our patented fiber coupled technology and high speed Terahertz generation and detection sensors, we are engaged in transferring Terahertz technology from the application development laboratory to the factory floor.
We support the customer from the initial concept and design of the semiconductor, hybridization of support electronics, packaging and signal conditioning or processing from prototype through full-scale production and validation testing. The target markets served by us are Military/Aerospace, Homeland Security, Medical, Telecom, and Industrial Sensing/NDT.
During 2007, Texas Optoelectronics (TOI), Silicon Detectors Inc. (SDI) and Photonic Detectors Inc. (PDI) were dissolved. These wholly-owned subsidiaries had no assets or liabilities at the time of dissolution.
Technology & Manufacturing Capabilities
Our basic technologies and manufacturing capabilities include the following:
| | · | Optoelectronic semiconductor design and micro fabrication of Silicon (Si) and III-V compound semiconductor devices including photodetectors and terahertz transmitters/receiver antenna, |
| | · | MBE growth of high-speed III-V compound semiconductor material including GaAs, InAlAs and InP, |
| | · | Opto-electronic hybrid packaging of semiconductor devices combining opto-electronic devices with high-speed electronics and fiber optics, |
| | · | Vapor deposition and/or ion implantation for Silicon based PIN & APD photo-detectors, |
| | · | Terahertz (THz) systems, subsystems, transmitters and receivers, and |
| | · | Femtosecond laser pulse control and system integration. |
Core Products
The core product technologies used in the majority of our products are opto-electronic semiconductor devices, including photodiodes and antennae made of Si or III-V compound semiconductor material. Photodiodes and antennae sense light of varying wavelengths and intensity and convert that light and/or Terahertz wave into electrical signals. We manufacture photodiodes of varying complexity, from basic PIN photodiode to the more sophisticated APD and antennae that transmit and receive Terahertz signals (Transceiver). The APD is a specialized photodiode capable of detecting very low light levels due to an internal gain phenomenon known as avalanching. All devices are designed by our experienced engineering staff, and fabricated in state-of-the-art clean rooms. Our products include the following:
| | · | High Speed Optical Receivers (10Gb/s & 40Gb/s) which are packaged InP, InAlAs, or GaAs PIN and/or APD photodiodes with amplifiers |
| | · | Packaged PIN and APD photodiodes in Si and III-V materials (InP, InAlAs, GaAs) |
| | · | Packaged Si APD components, with and without thermo-electric coolers |
| | · | Packaged Si LAAPDcomponents |
| | · | Packaged Si photodiodes with patented FILTRODE® technology integrating optical filters directly on photodiode chips |
| | · | Terahertz Systems & subsystems utilizing III-V materials for Terahertz transmitters &/or receivers |
Terahertz Technology
The newest technology the Company is pursuing is Terahertz (THz) or the Company’s T-Ray™ technology. THz is a region of the electromagnetic (EM) Spectrum that is just beginning to be explored. THz lies between microwave and infrared waves on the EM spectrum. While microwaves and infrared waves have been explored and commercialized for decades, THz waves are in the early stages of being explored and commercialized due to the fact that they have historically been very difficult to generate and detect. Recent advances in femtosecond lasers and ultra-fast semiconductor and electro-optic devices combined with fiber-optic packaging technologies have enabled the development of practical T-Ray instrumentation and as a result application/market development of THz technology has recently accelerated. THz can be used to “look” through and beneath materials with high 2-dimensional (2-D) and 3-dimensional (3-D) spatial resolution roughly equivalent to the resolution of the human eye or better. It can also uniquely identify the chemical composition of many hidden or subsurface objects and has been determined to have non-ionizing radiation, which is not harmful to humans at the power levels commonly used today. THz imaging and spectroscopy market applications include industrial quality control through non-destructive testing (including aerospace and pharmaceutical markets); homeland security and defense screening of people, packages and bags for weapons and weapons of mass destruction; medical imaging and other scientific applications.
We have had significant Terahertz technology and product development since 1997, resulting in over 20 patents or patents pending to date. In 2001, we sold the first commercial THz product, the T-Ray™ 2000 as a laboratory bench top instrument for application development with spectroscopy and imaging capabilities targeted at the research and development and off-line diagnostic markets. In 2004, we sold the first T-Ray Manufacturing Inspection System (QA1000) for on-line, real-time inspection to NASA for the space shuttle fuel tank inspection in the Return to Flight Program. In March 2007, the Company announced its next generation THz imaging and spectroscopy system (T-Ray™ 4000) which is expected to begin shipping in the second half of fiscal 2008. The T-Ray 4000 is significantly smaller, lighter, and more powerful than previous THz generations and incorporates significant technological advancements. The system is 55 pounds and is the size of a briefcase, which is a significant reduction from the 800pounds refrigerator size QA 1000. This system is targeted at the research and industrial NDT quality control market. The T-Ray™ 4000 product will also serve as a platform for future homeland security and defense applications.
Markets
Our products serve customers in a variety of global markets, typically North America, Asia, Europe and Australia. The target markets and applications served by us are as follows:
Medical:
Telecommunications:
| · | Wireless Communications Equipment |
Homeland Security:
Recent Developments
The Company began consolidating semiconductor fabrication into its Ann Arbor, Michigan facility in June 2006. Approximately $2.2 million has been budgeted for operating expenses and capital expenditures for this consolidation. As part of the consolidation the Company relocated its corporate headquarters from Camarillo, California to Ann Arbor, Michigan in March 2006. The Michigan Economic Development Corporation (MEDC) approved a state Single Business Tax credit valued at more than $1.1 million over 10 years to win the Company’s business. The city of Ann Arbor also approved a personal property tax abatement valued at approximately $103,000 over five years to support the project.
Stock Compensation— Effective April 1, 2006, the Company adopted the Statement of Financial Accounting Standards (SFAS) No. 123(R), “Share-Based Payment: An Amendment of FASB Statements No. 123 and 95” using the modified prospective method. Under this method, compensation cost is recognized on or after the effective date for the portion of outstanding awards, for which the requisite service has not yet been rendered, based on the grant date fair value of those awards. Prior to April 1, 2006, the Company accounted for employee stock options using the intrinsic value method in accordance with Accounting Principles Board (APB) Opinion No. 25 (APB No. 25), “Accounting for Stock Issued to Employees,” and adopted the disclosure only alternative of SFAS No. 123. For stock-based awards issued on or after April 1, 2006, the Company recognizes the compensation cost on a straight-line basis over the requisite service period for the entire award. Measurement and attribution of compensation cost for awards that are unvested as of the effective date of SFAS No. 123(R) are based on the same estimate of the grant-date or modification-date fair value and the same attribution method used previously under SFAS No. 123.
In accordance with SFAS No. 148, and as required by SFAS 123(R), the required pro forma disclosure, for periods prior to adoption of SFAS 123(R), is shown below:
| | | Year ended March 31, 2006 | |
| Net Income (loss), as reported | | $ | (5,262,000 | ) |
| Net income (loss), proforma | | $ | (5,409,000 | ) |
| Basic income (loss) per share, as reported | | $ | (0.30 | ) |
| Basic income (loss) per share, proforma | | $ | (0.30 | ) |
Adoption of SFAS 123(R)
During the year ended March 31, 2007, the Company granted 90,000 stock options. The Company recorded stock-based compensation expense of $361,000 for all unvested options granted prior to and options granted after the adoption of SFAS 123(R).
As required by SFAS 123(R), management has made an estimate of expected forfeitures and is recognizing compensation costs only for those equity awards expected to vest. The cumulative effect of initially adopting SFAS 123(R) was material to the Company and represented approximately 8% of the Company’s net loss.
Raw Materials
The principal raw materials used by the Company in the manufacture of its semiconductor components and sensor assemblies are silicon and III-V material (InP, GaAs) wafers, chemicals, gases and metals used in processing wafers, gold wire, solders, and a variety of packages and substrates, including metal, printed circuit board, flex circuits, ceramic and plastic packages. All of these raw materials can be obtained from several suppliers. From time to time, particularly during periods of increased industry-wide demand, silicon wafers, III-V wafers (InP, GaAs), certain metal packages and other materials have been in short supply. However, the Company has not been materially affected by such shortages. As is typical in the industry, the Company allows for a significant lead-time (2 months or greater) between order and delivery of raw materials.
Research and Development
Since its inception in June 1988, the Company has incurred material research and development (R&D) expenses, with the intent of commercializing these investments into profitable new standard and custom product offerings. During the fiscal years ended in 2007, 2006, and 2005, research and development expenses amounted to $4,015,000, $3,019,000, and $146,000 respectively. The increase in R&D costs is primarily the result of the Picometrix, Inc. acquisition and other new non-Picometrix product R&D initiatives. The Company expects that an increase in research and development funding will be required for new projects/products as well as the continuing development of new derivatives of the Company’s current product line . The Company has in the past, and will continue to pursue customer funded, as well as internally funded, research and development projects when they are in support of the Company’s development objectives.
As we begin the new 2008 fiscal year, the following research and development projects are currently underway:
| · | The next generation photodiodes and high-speed optical receivers for both the 10G and 40G telecommunications market, |
| · | THz - Application development of the T-Ray™ 4000 product platform for research, homeland security/military, aerospace, consumer, pharmaceutical and industrial QC markets, |
| · | Si APD performance enhancements - designed specifically for certain military and medical imaging applications, and |
| · | Si PIN photodiodes developments to meet unique customer requirements, such as higher speeds, lower electrical noise, and unique multi-element geometries. |
Environmental Regulations
The photonics industry, as well as the semiconductor industry in general, is subject to governmental regulations for the protection of the environment, including those relating to air and water quality, solid and hazardous waste handling, and the promotion of occupational safety. Various federal, state and local laws and regulations require that the Company maintain certain environmental permits. The Company believes that it has obtained all necessary environmental permits required to conduct its manufacturing processes. Changes in the aforementioned laws and regulations or the enactment of new laws, regulations or policies could require increases in operating costs and additional capital expenditures and could possibly entail delays or interruptions of operations.
Backlog and Customers
The Company’s sales are made primarily pursuant to standard purchase orders for delivery of products. A substantial portion of our revenues are derived from sales to OEMs pursuant to individual purchase orders with short lead times. However, by industry practice, orders may be canceled or modified at any time. Accordingly, we do not believe that the backlog of undelivered product under these purchase orders is a meaningful indicator of our future financial performance. When customers cancel an order, they are responsible for all finished goods, all costs, direct and indirect, incurred by the Company, as well as a reasonable allowance for anticipated profits. No assurance can be given that the Company will receive these amounts after cancellation.
Customers normally purchase the Company’s products and incorporate them into products that they in turn sell in their own markets on an ongoing basis. As a result, the Company’s sales are dependent upon the success of its customers’ products and our future performance is dependent upon our success in finding new customers and receiving new orders from existing customers.
Marketing
The Company markets its products in the United States and Canada through its own technical sales engineers and through independent sales representatives. International sales, including Europe, the Middle East, Far East and Asia, are conducted direct and through foreign distributors. The Company’s products are primarily sold as components or assemblies to OEM’s. The Company markets its products and capabilities through industry specific channels, including the Internet, industry trade shows, and in print through trade journals.
Competition
In its target markets, the Company competes with different companies in each of its product platforms; custom optoelectronic, high-speed optical receiver and THz systems. The Company believes that its principal competitors for sales of custom optoelectronic products are small private companies and medium size public companies. In the high-speed optical receiver market the Company believes that its competitors are small private companies and medium to large size public companies. Because the THz product offering includes developing technology applications and markets, the Company believes the competition is mainly from small private companies and divisions of large public companies.
Because the Company specializes in devices requiring a high degree of engineering expertise to meet the requirements of specific applications, it generally does not compete with other large United States, European or Asian manufacturers of standard “off the shelf” optoelectronic components or silicon photodetectors.
Proprietary Technology
The Company utilizes proprietary design rules and processing steps in the development and fabrication of its PIN and APD photodiodes, THz transmitters and receivers, fiber-coupled THz subsystems/systems, and THz applications. The Company has a significant number of patents pending and owns the following patents:
Patent # | Title | Issue Date |
| 142,195 | HIGHLY-DOPED P-TYPE CONTACT FOR HIGH-SPEED, FRONT-SIDE ILLUMINATED PHOTODIODE | Apr-05 |
| 660,471 | HIGHLY-DOPED P-TYPE CONTRACT FOR HIGH-SPEED, FRONT-SIDE ILLUMINATED PHOTODIODE | Apr-06 |
| 765,715 | HIGHLY-DOPED P-TYPE CONTACT FOR HIGH-SPEED, FRONT-SIDE ILLUMINATED PHOTODIODE | Jan-04 |
| 1,230,578 | COMPACT FIBER PIGTAIL TERAHERTZ IMAGING SYSTEM | Aug-06 |
| 2,345,153 | HIGHLY-DOPED P-TYPE CONTACT FOR HIGH-SPEED, FRONT-SIDE ILLUMINATED PHOTODIODE | Mar-04 |
| 4,717,946 | THIN LINE JUNCTION PHOTODIODE | Jan-88 (by predecessor co.) |
| 4,782,382 | HIGH QUANTUM EFFICIENCY PHOTODIODE DEVICES | Nov-88 (by predecessor co.) |
| 5,021,854 | SILICON AVALANCHE PHOTODIODE ARRAY | Jun-91 |
| 5,057,892 | LIGHT RESPONSIVE AVALANCHE DIODE | Oct-91 |
| 5,146,296 | DEVICES FOR DETECTING AND/OR IMAGING SINGLE PHOTOELECTRON | Sep-92 |
| 5,311,044 | AVALANCHE PHOTOMULTIPLIER TUBE | May-94 |
| 5,477,075 | SOLID STATE PHOTODETECTOR WITH LIGHT RESPONSIVE REAR FACE | Dec-95 |
| 5,757,057 | LARGE AREA AVALANCHE ARRAY | May-98 |
| 5,801,430 | SOLID STATE PHOTODETECTOR WITH LIGHT RESPONSIVE REAR FACE | Sep-98 |
| 6,005,276 | SOLID STATE PHOTODETECTOR WITH LIGHT RESPONSIVE REAR FACE | Dec-99 |
| 6,029,988 | COMPACT FIBER PIGTAILED TERAHERTZ IMAGING SYSTEM | Aug-06 |
| 6,111,299 | ACTIVE LARGE AREA AVLANCHE PHOTODIODE ARRAY | Aug-00 |
| 6,262,465 | HIGHLY-DOPED P-TYPE CONTACT FOR HIGH-SPEED, FRONT-SIDE ILLUMINATED PHOTODIODE | Jul-01 |
| 6,320,191 | A DISPERSIVE PRECOMPENSATOR FOR USE IN AN ELECTROMAGNETIC RADIATION GENERATION AND DETECTION SYSTEM | Nov-01 |
| 6,816,647 | COMPACT FIBER PIGTAILED TERAHERTZ IMAGING SYSTEM | Nov-04 |
| 6,849,852 | SYSTEM AND METHOD FOR MONITORING CHANGES IN STATE OF MATTER WITH TERAHERTZ RADIATION | Feb-05 |
| 6,936,821 | AMPLIFIED PHOTOCONDUCTIVE GATE | Aug-05 |
| 7,039,275 | FOCUSING FIBER OPTIC | May-06 |
| 7,078,741 | HIGH-SPEED ENHANCED RESPONSIVITY PHOTO DETECTOR | Jul-06 |
There can be no assurance that any issued patents will provide the Company with significant competitive advantages, or that challenges will not be instituted against the validity or enforceability of any patent owned by the Company, or, if instituted, that such challenges will not be successful. The cost of litigation to uphold the validity and to prevent the infringement of a patent could be substantial. Furthermore, there can be no assurance that the Company’s APD technology will not infringe on patents or rights owned by others, licenses to which might not be available to the Company. Based on limited patent searches, contacts with others knowledgeable in the field of APD technology, and a review of the published materials, the Company believes that its competitors hold no patents, licenses or other rights to the APD technology which would preclude the Company from pursuing its intended operations.
In some cases, the Company may rely on trade secrets to protect its innovations. There can be no assurance that trade secrets will be established, that secrecy obligations will be honored or that others will not independently develop similar or superior technology. To the extent that consultants, key employees or other third parties apply technological information independently developed by them or by others to Company projects, disputes might arise as to the proprietary rights to such information which may not be resolved in favor of the Company.
Employees
As of June 27, 2007 the Company had 162 employees, comprised of 158 full time employees (including 3 officers) and 4 part time employees. Included are 25 engineering and development personnel, 10 sales and marketing personnel, 109 operations personnel, and 16 general and administrative personnel (including 3 officers). The Company may, from time to time, engage personnel to perform consulting services and to perform research and development under third party funding. In certain cases, the cost of such personnel may be included in the direct cost of the contract rather than in payroll expense. None of our employees are covered by a collective bargaining agreement. We believe our relations with our employees are good.
Item 1A Risk Factors
Investing in our Class A Common Stock involves a high degree of risk and uncertainty. You should carefully consider the risks and uncertainties described below before investing in our Class A Common Stock. Our business, prospects, financial condition and results of operations could be adversely affected due to any of the following risks. In that case, the value of our Class A Common Stock could decline, and you could lose all or part of your investment.
Risks Relating to Our Business
We are dependent upon several suppliers for a significant portion of raw materials used in the manufacturing of our products.
The principal raw materials we use in the manufacture of our semiconductor components and sensor assemblies are silicon and III-IV wafers, chemicals and gases used in processing wafers, gold wire, lead frames, and a variety of packages and substrates, including metal, printed circuit board, flex circuits, ceramic and plastic packages. All of these raw materials can be obtained from several suppliers. From time to time, particularly during periods of increased industry-wide demand, silicon wafers and other materials have been in short supply. Any significant interruption in the supply of these raw materials could have a material adverse effect on the Company.
Customer acceptance of our products is dependent on our ability to meet changing requirements.
Customer acceptance of our products is significantly dependent on our ability to offer products that meet the changing requirements of our customers, including the military, medical institutions, industrial laboratories, government agencies and industrial corporations. Any decrease in the level of customer acceptance of our products could have a material adverse effect on the Company.
We are subject to market risk through our sales to overseas markets.
A growing amount of our sales are being derived from overseas markets. These international sales are primarily focused in Europe and the Middle East. These operations are subject to risks that are inherent in operating in foreign countries, including the following:
| · | foreign countries could change regulations or impose currency restrictions and other restraints; |
| · | changes in foreign currency exchange rates and hyperinflation or deflation in the foreign countries in which we operate; |
| · | some countries impose burdensome tariffs and quotas; |
| · | political changes and economic crises may lead to changes in the business environment in which we operate; |
| · | international conflict, including terrorist acts, could significantly impact our financial condition and results of operations; and |
| · | economic downturns, political instability and war or civil disturbances may disrupt distribution logistics or limit sales in individual markets. |
In addition, we utilize third-party distributors (Distributors) to act as our representative for the geographic region that they have been assigned. These Distributors are responsible for maintaining customer account management and in some cases maintaining an inventory of products for those customers within their geographic region. Our success is dependent on these Distributors finding new customers and receiving new orders from existing customers.
Our future performance is dependent upon finding new customers and retaining our existing customers.
Customers normally purchase our products and incorporate them into products that they in turn sell in their own markets on an ongoing basis. As a result, our sales are dependent upon the success of our customers' products and our future performance is dependent upon our success in finding new customers and receiving new orders from existing customers.
In several of our markets, quality and/or reliability of our products are a major concern for our customers, not only upon the initial manufacture of the product, but for the life of the product. Many of our products are used in remote locations, or higher value assembly, making servicing of our products not feasible. Any failure of the quality and/or reliability of our products could have an adverse affect on us and on our ability to maintain or attract customers.
Customer orders are subject to cancellation or modification at any time.
Our sales are made primarily pursuant to standard purchase orders for delivery of products. However, by industry practice, orders may be canceled or modified at any time. When a customer cancels an order, they are responsible for all finished goods, all costs, direct and indirect, incurred by us, as well as a reasonable allowance for anticipated profits. No assurance can be given that we will receive these amounts after cancellation. The current backlog contains only those orders for which we have received a confirmed purchase order and also includes contracts which have scheduled shipping dates beyond the upcoming fiscal year. As such, the current backlog represents only a portion of expected annual revenues for fiscal year 2008.
The markets for many of our products are characterized by changing technology.
The markets for many of our products are characterized by changing technology, new product introductions and product enhancements, and evolving industry standards. The introduction or enhancement of products embodying new technology or the emergence of new industry standards could render existing products obsolete or result in short product life cycles. Accordingly, our ability to compete is in part dependent on our ability to continually offer enhanced and improved products.
We are dependent on key in-house manufacturing equipment or processes to deliver a custom product (solution) with the highest performance and short time to market.
We depend on key in-house manufacturing equipment and assembly processes. We believe that these key manufacturing and assembly processes give us the flexibility and responsiveness to meet our customer delivery schedule and performance specification with a custom product. This value proposition is an important component of our offering to our customers. A loss of these capabilities could have an adverse effect on our existing operations and new business growth.
Changes in the spending priorities of the federal government can materially adversely affect our business.
In fiscal year 2007, approximately 22% of our sales were related to products purchased by military contractors. Our business depends upon continued federal government expenditures on defense, intelligence, aerospace and other programs that we support. In fiscal year 2007, our sales to military contractors declined slightly. In addition, foreign military sales are affected by U.S. government regulations, regulations by the purchasing foreign government and political uncertainties in the U.S. and abroad. There can be no assurance that the U.S. defense and military budget will continue to grow or that sales of defense related items to foreign governments will continue at present levels. In addition, the terms of defense contracts with the U.S. government generally permit the government to terminate such contracts, with or without cause, at any time. Any unexpected termination of a significant U.S. government contract with a military contractor that we sell our products to could have a material adverse effect on the Company.
Our industry is highly competitive and fragmented.
We compete with a range of companies for the custom optoelectronic and silicon photodetector requirements of customers in our target markets. We believe that our principal competitors for sales of custom devices are small to medium size companies. Because we specialize in custom devices requiring a high degree of engineering expertise to meet the requirements of specific applications, we generally do not compete to any significant degree with other large United States, European or Pacific Rim manufacturers of standard “off the shelf” optoelectronic components or silicon photodetectors. We cannot assure you that we will be able to compete successfully in our markets against these or any future competitors.
Our industry is sensitive to changing economic conditions.
We believe that many factors affect our industry, including consumer confidence in the economy, interest rates, fuel prices and credit availability. The overall economic climate or Gross National Product growth has a direct impact on our customers and the demand for our products. We cannot assure you that our business will not be adversely affected as a result of an industry or general economic downturn.
We are subject to environmental regulations.
The photonics industry, as well as the semiconductor industry in general, is subject to governmental regulations for the protection of the environment, including those relating to air and water quality, solid and hazardous waste handling, and the promotion of occupational safety. Various federal, state and local laws and regulations require that we maintain certain environmental permits. We believe that we have obtained all necessary environmental permits required to conduct our manufacturing processes. Changes in the aforementioned laws and regulations or the enactment of new laws, regulations or policies could require increases in operating costs and additional capital expenditures and could possibly entail delays or interruptions of operations.
If we are unable to protect our intellectual property rights adequately, the value of our products could be diminished.
We utilize proprietary design rules and processing steps in the development and fabrication of our PIN photodiodes, APD and our THz systems and sensors. In addition, we have over 100 patents or patents pending utilized in our products. There can be no assurance that any issued patents will provide us with significant competitive advantages, or that challenges will not be instituted against the validity or enforceability of any patent utilized by us, or, if instituted, that such challenges will not be successful. The cost of litigation to uphold the validity and to prevent the infringement of a patent could be substantial and could have a material adverse effect on our operating results. Furthermore, there can be no assurance that our APD technology will not infringe on patents or rights owned by others, licenses to which might not be available to us. Based on limited patent searches, contacts with others knowledgeable in the field of APD technology, and a review of the published materials, we believe that our competitors hold no patents, licenses or other rights to the APD technology which would preclude us from pursuing our intended operations.
In some cases, we may rely on trade secrets to protect our innovations. There can be no assurance that trade secrets will be established, that secrecy obligations will be honored or that others will not independently develop similar or superior technology. To the extent that consultants, key employees or other third parties apply technological information independently developed by them or by others to our projects, disputes might arise as to the proprietary rights to such information which may not be resolved in our favor.
We face strong competition for skilled workers.
Our success depends in large part on its ability to attract and retain highly qualified scientific, technical, management, and marketing personnel. Competition for such personnel is intense and there can be no assurance that we will be able to attract and retain the personnel necessary for the development and operation of our business.
We may not be able to successfully integrate future acquisitions, which could result in our not achieving the expected benefits of the acquisition, the disruption of our business and an increase in our costs.
Over the past three years, we have acquired 3 businesses and we continually explore opportunities to acquire related businesses, some of which could be material to us. Our ability to continue to grow may depend upon identifying and successfully acquiring attractive companies, effectively integrating these companies, achieving cost efficiencies and managing these businesses as part of our company.
We may not be able to effectively integrate the acquired companies and successfully implement appropriate operational, financial and management systems and controls to achieve the benefits expected to result from these acquisitions. Our efforts to integrate these businesses could be affected by a number of factors beyond our control, such as regulatory developments, general economic conditions and increased competition. In addition, the process of integrating these businesses could cause the interruption of, or loss of momentum in, the activities of our existing business. The diversion of management’s attention and any delays or difficulties encountered in connection with the integration of these businesses could negatively impact our business and results of operations. Further, the benefits that we anticipate from these acquisitions may not develop.
Risks Relating to Our Class A Common Stock
Our share price has been volatile in the past and may decline in the future.
Our Class A Common Stock has experienced significant market price and volume fluctuations in the past and may experience significant market price and volume fluctuations in the future in response to factors such as the following, some of which are beyond our control:
| · | quarterly variations in our operating results; |
| · | operating results that vary from the expectations of securities analysts and investors; |
| · | changes in expectations as to our future financial performance, including financial estimates by securities analysts and investors; |
| · | announcements of technological innovations or new products by us or our competitors; |
| · | announcements by us or our competitors of significant contracts, acquisitions, strategic partnerships, joint ventures or capital commitments; |
| · | changes in the status of our intellectual property rights; |
| · | announcements by third parties of significant claims or proceedings against us; |
| · | additions or departures of key personnel; |
| · | future sales of our ordinary shares; and |
| · | stock market price and volume fluctuations. |
Stock markets often experience extreme price and volume fluctuations. Market fluctuations, as well as general political and economic conditions, such as a recession or interest rate or currency rate fluctuations or political events or hostilities in or surrounding the United States, could adversely affect the market price of our Class A Common Stock.
In the past, securities class action litigation has often been brought against companies following periods of volatility in the market price of its securities. We may in the future be the target of similar litigation. Securities litigation could result in substantial costs and divert management's attention and resources both of which could have a material adverse effect on our business and results of operations.
Future sales of our Class A Common Stock in the public market could lower our stock price, and conversion of our warrants and any additional capital raised by us may dilute your ownership in the Company.
We may sell additional shares of Class A Common Stock in subsequent offerings. In addition, holders of warrants to purchase our Class A Common Stock will, most likely, exercise their warrants to purchase shares of our Class A Common Stock after this registration statement is declared effective. We cannot predict the size of future issuances of our Class A Common Stock or the effect, if any, that future issuances and sales of shares of our Class A Common Stock will have on the market price of our Class A Common Stock. Sales of substantial amounts of our Class A Common Stock, including shares issued in connection with the exercise of the warrants, or the perception that such sales could occur, may adversely affect prevailing market prices for our Class A Common Stock.
The conversion of our outstanding convertible subordinated notes would result in substantial dilution to our current stockholders.
The Company currently has outstanding prime plus 1% (currently 9.25%) convertible subordinated notes due October 2007 in the principal amount of $5.5 million. These notes are convertible, at the option of the holder, at any time on or prior to maturity into shares of our common stock at an average conversion price of $2.06 per share. An aggregate of 2,666,000 shares of common stock would be issued upon the conversion of all outstanding convertible subordinated notes at these exchange rates, which would significantly dilute the voting power and ownership percentage of our existing stockholders. If the stock is not converted into common stock, we would have to pay the repurchase price in cash and the aggregate 2,666,000 of common stock would not be issued. The Company may enter into equity, debt or a combination of equity and debt transaction in order to retire the outstanding convertible note. If the Company was to enter into equity transaction or a convertible debt transaction there would be dilution to the voting power and percentage ownership of our existing shareholders.
Shares eligible for public sale in the future could decrease the price of our Class A Common Stock and reduce our future ability to raise capital.
Sales of substantial amounts of our Class A Common Stock in the public market could decrease the prevailing market price of our Class A Common Stock, which would have an adverse affect on our ability to raise equity capital in the future.
We do not intend to pay dividends.
We have never declared or paid any cash dividends on our Class A Common Stock. We currently intend to retain future earnings, if any, to finance operations and expand our business and, therefore, do not expect to pay any dividends in the foreseeable future.
The Company leases all of its executive offices, research, marketing and manufacturing facilities. At March 31, 2007, those leases consisted of primarily 95,000 square feet in three facilities. The facility located in Camarillo, California is leased through February 2009. The manufacturing facility located in Dodgeville, Wisconsin is leased through October, 2011. The corporate office and the Picometrix LLC manufacturing facility located in Ann Arbor, Michigan are leased through June 2010 with two five year renewal options. The Company believes that its existing facilities are adequate to meet its needs for the foreseeable future.
None.
| Item 4 | Submission of Matters to a Vote of Security Holders |
None.
PART II
| Item 5 | Market for Registrant’s Common Equity, Related Stockholder Matters and Issuer Purchases of Equity Securities |
The Company's Class A Common Stock is traded on the American Stock Exchange (AMEX) under the symbol "API".
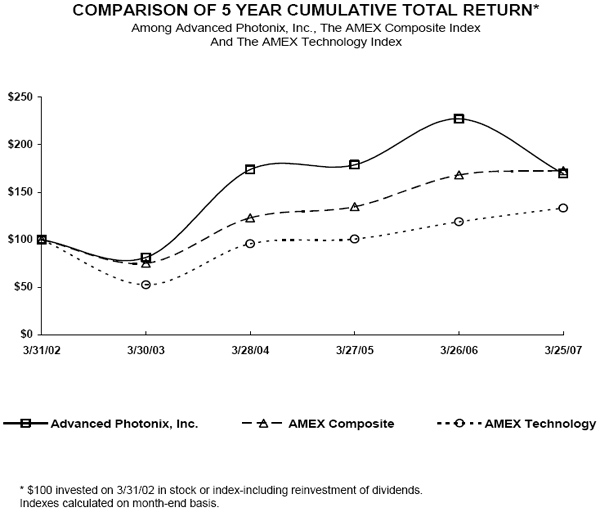
Stock Performance Graph
The graph below provides an indicator of our cumulative total stockholder return as compared with the AMEX Composite Index and the AMEX Technology Index. The graph assumes an initial investment of $100. The graph covers a period of time beginning in March 31, 2002, through March 30, 2007, which represents the last trading day of the year.
At June 26, 2007, the Company had 96 holders of record for the Class A Common Stock (including shares held in street name), representing approximately 6,000 beneficial owners of the Class A Common Stock. On the same date, there were 6 holders of record of the Class B Common Stock (none of which were held in street name).
The following table sets forth the high and low closing prices of the Company’s Class A Common Stock by quarter for fiscal years 2007 and 2006.
| | | 1st Quarter | | 2nd Quarter | | 3rd Quarter | | 4th Quarter | |
| | | 2007 | | 2006 | | 2007 | | 2006 | | 2007 | | 2006 | | 2007 | | 2006 | |
Common Stock1 | | | | | | | | | | | | | | | | | | | | | | | | | |
High | | | 2.74 | | | 3.09 | | | 2.35 | | | 3.56 | | | 2.30 | | | 3.24 | | | 2.30 | | | 2.97 | |
Low | | | 1.57 | | | 2.04 | | | 1.44 | | | 2.62 | | | 1.68 | | | 2.39 | | | 1.90 | | | 2.59 | |
1 Price ranges on the AMEX.
Quarterly Stock Market Data
The Company has never paid any cash dividends on its capital stock. The Company intends to retain earnings, if any, for use in its business and does not anticipate that any funds will be available for the payment of cash dividends on its outstanding shares in the foreseeable future. The holders of Common Stock will not be entitled to receive dividends in any year until the holders of the Class A Redeemable Convertible Preferred Stock receive an annual non-cumulative dividend preference of $.072 per share. To date, a total of 740,000 shares of Class A Redeemable Convertible Preferred Stock have been converted into 222,000 shares of Class A Common Stock, leaving outstanding 40,000 shares of Class A Redeemable Convertible Preferred Stock. The aggregate non-cumulative annual dividend preference of such Class A Redeemable Convertible Preferred Stock is $2,880. There is no public market for the Company's Class A Redeemable Convertible Preferred Stock or Class B Common Stock; however, such stock is convertible into Class A Common Stock at the option of the holder and upon transfer by the holder of the Class A Redeemable Convertible Preferred Stock.
| Item 6 | Selected Financial Data |
The selected financial data for each of the five years presented below is derived from our audited consolidated financial statements and should be read in conjunction with the consolidated financial statements, the notes to the consolidated financial statements, and “Management’s Discussion and Analysis of Financial Condition and Results of Operations”, all of which are contained in this report on Form 10-K.
| | | (in thousands, except per share data) | |
| | | 2007 | | 2006 | | 2005 | | 2004 | | 2003 | |
| | | | | | | | | | | | |
| Net Sales | | $ | 23,588 | | $ | 23,585 | | $ | 14,803 | | $ | 12,401 | | $ | 9,147 | |
| | | | | | | | | | | | | | | | | |
| Gross Profit | | $ | 10,895 | | $ | 9,183 | | $ | 4,732 | | $ | 4,297 | | $ | 2,699 | |
| as a percentage of Sales | | | 46 | % | | 39 | % | | 32 | % | | 35 | % | | 30 | % |
| | | | | | | | | | | | | | | | | |
| Net Income (Loss) | | $ | (4,646 | ) | $ | (5,262 | ) | $ | 5,078 | | $ | 794 | | $ | (803 | ) |
| | | | | | | | | | | | | | | | | |
| Earnings (Loss) per common share-Basic | | $ | (0.24 | ) | $ | (0.30 | ) | $ | 0.38 | | $ | 0.06 | | $ | (0.06 | ) |
| Earnings (Loss) per common share-Diluted | | $ | (0.24 | ) | $ | (0.30 | ) | $ | 0.33 | | $ | 0.06 | | $ | (0.06 | ) |
| Weighted average common shares outstanding | | | 19,065 | | | 17,477 | | | 13,461 | | | 13,400 | | | 12,356 | |
| | | | | | | | | | | | | | | | | |
| Total Assets | | $ | 35,242 | | $ | 38,001 | | $ | 23,355 | | $ | 12,574 | | $ | 11,552 | |
| | | | | | | | | | | | | | | | | |
| Current Liabilities | | $ | 9,253 | | $ | 5,135 | | $ | 3,185 | | $ | 2,858 | | $ | 2,640 | |
| Long Term Liabilities | | $ | 4,866 | | $ | 7,403 | | $ | 3,834 | | $ | 11 | | $ | 22 | |
| Class A redeemable convertible preferred stock | | $ | 32 | | $ | 32 | | $ | 32 | | $ | 32 | | $ | 32 | |
| Shareholders' Equity | | $ | 21,091 | | $ | 25,431 | | $ | 16,304 | | $ | 9,673 | | $ | 8,858 | |
| | | | | | | | | | | | | | | | | |
| Working Capital | | $ | 2,424 | | $ | 9,330 | | $ | 11,261 | | $ | 5,802 | | $ | 4,811 | |
| Dividends declared on Capital Stock | | $ | - | | $ | - | | $ | - | | $ | - | | $ | - | |
| Item 7 | Management’s Discussion and Analysis of Financial Condition and Results of Operation |
Forward-Looking Statements Certain statements contained in this Management’s Discussion and Analysis (MD&A), including, without limitation, statements containing the words “may,” “will,” “can,” “anticipate,” “believe,” “plan,” “estimate,” “continue,” and similar expressions constitute “forward-looking statements.” These forward-looking statements reflect our current views with respect to future events and are based on assumptions and subject to risks and uncertainties. You should not place undue reliance on these forward-looking statements. Our actual results could differ materially from those anticipated in these forward-looking statements for many reasons, including risks described in the Risk Factors sections and elsewhere in this filing. Except for our ongoing obligation to disclose material information as required by federal securities laws, we do not intend to update you concerning any future revisions to any forward-looking statements to reflect events or circumstances occurring after the date of this report. The following discussion should be read in conjunction with the Risk Factors as well as our financial statements and the related notes.
Application of Critical Accounting Policies
Application of our accounting policies requires management to make certain judgments and estimates about the amounts reflected in the financial statements. Management uses historical experience and all available information to make these estimates and judgments, although differing amounts could be reported if there are changes in the assumptions and estimates. Estimates are used for, but not limited to, the accounting for the allowance for doubtful accounts, inventory allowances, impairment costs, depreciation and amortization, warranty costs, taxes and contingencies. Management has identified the following accounting policies as critical to an understanding of our financial statements and/or as areas most dependent on management's judgments and estimates.
Revenue Recognition
In accordance with Staff Accounting Bulletin No. 104, we recognize revenue from the sale of products when the products are shipped to the customer. Revenues from the sale of services consist of non-recurring engineering charges, which are recognized when the services have been rendered. Historically, sales returns have amounted to less than 1% of net sales and all sales are recorded net of sales returns and payment discounts.
Impairment of Long-Lived Assets
The Company continually reviews the recoverability of the carrying value of long-lived assets using the methodology prescribed in Statement of Financial Accounting Standards (SFAS) 144, "Accounting for the Impairment and Disposal of Long-Lived Assets." The Company also reviews long-lived assets and the related intangible assets for impairment whenever events or changes in circumstances indicate that the carrying value of such assets may not be recoverable. Upon such an occurrence, recoverability of these assets is determined by comparing the forecasted undiscounted net cash flows to which the assets relate, to the carrying amount. If the asset is determined to be unable to recover its carrying value, then intangible assets, if any, are written down first, followed by the other long-lived assets to fair value. Fair value is determined based on discounted cash flows, appraised values or management's estimates, depending on the nature of the assets.
Deferred Tax Asset Valuation Allowance
The Company has incurred losses over the past years, which creates a deferred tax benefit. Up to 2005, we have recorded a valuation allowance that fully reserved the benefit because realization was doubtful. In 2005, with the addition of Picometrix and having had two years of profitable operations, we reduced the allowance to approximately half of the deferred asset. With the acquisition of Picometrix, we recorded a deferred tax liability to reflect the non-deductible nature of the future amortization of the intangible assets acquired. That deferred tax liability will be amortized over the same life as the intangible assets.
Inventories
The Company’s inventories are stated at standard cost (which approximates the first-in, first-out method) or market. Slow moving and obsolete inventories are reviewed throughout the year. To calculate a reserve for obsolescence, we begin with a review of our slow moving inventory. Any inventory, which has been slow moving within the past 12 months, is evaluated and reserved if deemed appropriate. In addition, any residual inventory, which is customer specific and remaining on hand at the time of contract completion, is reserved for at the standard unit cost. The complete list of slow moving and obsolete inventory is then reviewed by the production, engineering and/or purchasing departments to identify items that can be utilized in the near future. These items are then excluded from the analysis and the remaining amount of slow-moving and obsolete inventory is then reserved for. Additionally, non-cancelable open purchase orders for parts we are obligated to purchase where demand has been reduced may be reserved. Reserves for open purchase orders where the market price is lower than the purchase order price are also established. If a product that had previously been reserved for is subsequently sold, the amount of reserve specific to that item is then reversed.
RESULTS OF OPERATIONS
Fiscal Year 2007 compared to Fiscal Year 2006
REVENUES
The Company predominantly operates in one industry segment, light and radiation detection devices that it sells to multiple markets including telecommunications, industrial sensing/NDT, military/aerospace, medical and homeland security. Revenues by market consisted of the following:
| | | Twelve months ended | |
| | | March 31,2007 | | March 31,2006 | |
| Telecommunications | | $ | 5,850,000 | | | 25 | % | $ | 3,129,000 | | | 13 | % |
| Industrial Sensing/NDT | | | 10,041,000 | | | 43 | % | | 10,359,000 | | | 44 | % |
| Military/Aerospace | | | 5,157,000 | | | 22 | % | | 5,860,000 | | | 25 | % |
Medical | | | 2,467,000 | | | 10 | % | | 2,228,000 | | | 9 | % |
| Homeland Security | | | 73,000 | | | 0 | % | | 2,009,000 | | | 9 | % |
| Total Revenues | | $ | 23,588,000 | | | 100 | % | $ | 23,585,000 | | | 100 | % |
The Company's revenues for the fiscal year ended March 31, 2007 (FY 2007) were $23.6 million, same as the prior fiscal year ended March 31, 2006 (FY 2006).
Although total revenues were the same year to year, the Company saw significant increases from the telecommunications market, which increased $2.7 million, or 87 %. The industrial sensing/NDT market decreased 3% or $318,000 from the prior year attributable to the THz product platform. Sales to the military/aerospace market decreased 12% over the prior year or approximately $703,000. This decrease from the prior year was attributable to a military program that reached end of life status and as a result the Company transitioned from full volume production to production of spare parts only and from reduced THz product application development contracts. The medical market increased $239,000 or 11% over the prior year due to increased customer demand of existing design wins. Homeland security decreased $1.9 million, also attributable to a decline in THz development contracts, primarily from the Transportation Security Administration.
As planned, the new product platform of High Speed Optical Receivers (HSOR) enabled the Company to take advantage of the rapidly growing telecommunication market. While the revenue from the Homeland Security market decreased dramatically primarily due to a shifting of R&D contract priorities at the TSA, we developed and introduced our T-Ray™ 4000 product targeted at the NDT and Scientific markets. This T-Ray™ 4000 platform provides the foundation for future development targeted at the Homeland Security market.
COSTS AND EXPENSES
Although revenue did not change year to year, costs of product sales decreased $1.7 million or approximately 11.8% to $12.7 million for the FY 2007from $14.4 million for the FY 2006. This improvement in cost of sales, expressed as a percent of net sales, is a 7% improvement from the FY 2006’s cost of goods sold percentage of 61% to FY 2007 cost of goods sold percentage of 54%. The improvement is mainly due to a lower inventory write-off as a result of our focus on improving purchasing and inventory control procedures, coupled with lower overhead related spending. As a result gross profit increased $1.7 million to $10.9 million or 46% of revenue, in FY 2007, from $9.2 million, or 39% of revenue, in FY 2006, an increase of $1.7 million or 18%. This improvement in gross profit is attributable to sales product mix carrying higher gross margins in the telecommunications and medical markets.
Operating Expenses
R&D expenses increased by $1.0 million to $4.0 million during FY 2007 compared to $3.0 million in FY 2006. Approximately 22% of this increase results from having a full year (52 weeks) of R&D expenses for the HSOR and THz product platforms in FY 2007 versus 47 weeks in FY 2006. The remaining increase in R & D costs (approximately $ 780,000) is primarily the result of increased personnel related costs, the majority of which is for investment in new product development for the HSOR and next generation THz product platforms. We expect that R&D expenses will increase in the upcoming fiscal year, as we focus on new opportunities in our high growth markets.
Marketing and sales expenses increased $245,000 (or 13%) to $2.2 million in FY 2007 compared to $1.9 million in FY 2006. The increase in sales and marketing expenses was primarily due to increases in personnel-related costs and commission expenses of $320,000, offset by slight reductions in other areas. Sales and marketing expenses as a percent of revenues increased to 9% in FY 2007 compared to 8% in FY 2006.
Total general and administrative expenses increased by $500,000 (12%) to $4.7 million in FY 2007 as compared to $4.2 million in FY 2006. Expressed as a percentage of net sales, general and administrative expenses were 19.7% in FY 2007 as compared to 17.6% in FY 2006. The increase was mainly due to the relocation of corporate headquarters and additional support personnel.
Amortization expense was $1,528,000 in FY 2007 versus $1,403,000 in FY 2006. Amortization of capital financing expenses decreased from $387,000 in FY 2006 to $148,000 in FY 2007 due to the loan settlement with SBBT in FY 2007.
Stock option compensation of $361,000 is in connection with the expensing of stock options in FY 2007 which were not expensed in FY 2006. Other operating expenses incurred were related to the previously announced Wafer Fabrication consolidation to our Ann Arbor facility, which was $720,000.
Intangible asset impairment accounted for $349,000 in FY 2007 versus no impairment in FY 2006. The company recognized goodwill impairment of $140,000 in FY 2007 compared to $814,000 in FY 2006.
Financing and Other Income (Expense), net
Interest income for FY 2007 totaled approximately $ 213,000, compared to $43,000 in FY 2006, due primarily to additional debt secured in late FY 2006 which resulted in higher cash balances available for short-term investment in FY 2007. Interest expense for the year was $2,578,000, as compared to $2,714,000 in 2006, a decrease of $136,000. The decrease was the result of decreased amortization of convertible notes’ discounts by approximately $450,000 due to the conversion of approximately $4.475 million of debt into equity in FY 2006, offset by higher interest paid on the $4 million of convertible notes issued in March of 2006.
The Company recorded a favorable income tax provision of $920,000 for FY 2007 as compared to an income tax provision of $28,000 for FY 2006. The difference of $948,000 is primarily due to the projected tax savings resulting from the projected tax loss carry-forward created for FY 2007.
Net loss for FY 2007 was $4.6 million, as compared to net loss of $5.3 million in FY 2006 a decrease of $700,000. The decrease in net loss is attributable to increases in operating expenses of $2.3 million, including wafer fabrication consolidation costs of $720,000, offset by higher gross profit of $1.7 million, reduced net interest expense of $136,000, increased interest income of $170,000 and a favorable tax provision of $920,000.
Non-cash operating expenses for FY 2007 were $5,150,000 compared to $5,411,000 for FY 2006, a decrease of $261,000. The decrease was the result of a reduction in goodwill/intangible impairment and convertible note discount interest expenses of $775,000 in FY 2007, offset by an increase in amortization and depreciation expense of $133,000, an increase in stock option expense of $361,000, as a result of the adoption of SFAS No. 123 (R) for the non-cash expensing of stock option grants in FY 2007, and an increase in the warrants provision of $20,000.
FY 2006 compared to (Fiscal Year 2005)
REVENUES
The Company predominantly operates in one industry segment, light and radiation detection devices that it sells to multiple markets including telecommunications, industrial sensing/NDT, military/aerospace, medical, and homeland security. Revenues by market consisted of the following:
| | | Twelve months ended | |
| | | March 31,2006 | | March 27, 2005 | |
| Telecommunications | | $ | 3,129,000 | | | 13 | % | $ | 86,000 | | | 1 | % |
| Industrial Sensing/NDT | | | 10,359,000 | | | 44 | % | | 7,360,000 | | | 49 | % |
| Military/Aerospace | | | 5,860,000 | | | 25 | % | | 4,875,000 | | | 33 | % |
Medical | | | 2,228,000 | | | 9 | % | | 2,482,000 | | | 17 | % |
| Home Land Security | | | 2,009,000 | | | 9 | % | | -- | | | 0 | % |
| Total Revenues | | $ | 23,585,000 | | | 100 | % | $ | 14,803,000 | | | 100 | % |
The Company's revenues for FY 2006 were $23.6 million, an increase of $8.8 million, or 59% of revenues of $14.8 million for the FY 2005.
Approximately $7.6 million of the increase was attributable to revenues from Picometrix, which the Company acquired in May 2005. The remaining increase of $1.2 million reflects an overall increase in shipments of 8% to customers in each of the Company’s remaining markets over the prior year. This represents approximately $1.4 million in volume increases offset by approximately $0.2 million in price decreases to one customer in the medical market as discussed in the paragraph below.
The acquisition of Picometrix provided the Company entry into the Homeland Security market with its THz products and contracts and significantly extended its reach in the telecommunication markets with optical receiver products. The most significant revenue increases are from the telecommunications market, which increased $3 million, all coming from the Picometrix acquisition. The industrial sensing/NDT market increased 41% or $3 million, over the prior year of which $1.7 million was attributable to Picometrix. Sales to the military aerospace market increased 20% over the prior year and accounted for approximately $985,000 of the remaining increase in revenues. Homeland Security accounted for $2.0 million of the increase all attributable to Picometrix, and medical dropped $254,000 over the prior year mainly due to price reductions for one customer.
As expected, the increased diversification and larger customer base achieved through the Company’s acquisitions have resulted in net revenues meeting our expectations for the most recent fiscal year.
COSTS AND EXPENSES
Cost of product sales increased to $14.4 million in 2006 from $10.1 million in 2005. Expressed as a percent of net sales, cost of goods sold was 61% in FY 2006 compared to 68% in FY 2005. As a result, gross profit increased to $9.2 million in FY 2006 from $4.7 million in FY 2005, an increase of 96%. This increase in gross profit is primarily attributable to the acquisition of Picometrix, whose products carry higher gross margins. This increase in Gross Profit was off-set by a $1.1 million inventory write-off from a combination of obsolescence and excess inventory from prior acquisitions.
R&D costs increased by $2.9 million to $3 million during FY 2006 compared to $146,000 in FY 2005. The increase in R & D costs is the result of the Company’s Picometrix acquisition ($2.7 million) and other non-Picometrix product R&D initiatives, which amounted to $200,000. We expect that R&D expenses will increase in the upcoming fiscal year, as we focus on new opportunities brought to us as a result of the Picometrix acquisition.
Marketing and sales expenses increased by $716,000 (59%) to $1.9 million in FY 2006, which is 8% of sales, which is the same percentage as FY 2005. The acquisition of Picometrix accounted for $545,000 of the sales and marketing expense increase. Planned additions to the sales department during the year accounted for $154,000 of increased compensation, travel and related expenses. Overall advertising and marketing expenses increased by approximately $165,000, primarily associated with products sold into the telecommunications market. The Company is committed to building our sales & marketing function in the telecommunications, Homeland Security, military and industrial sensing markets and anticipates further increases in compensation, travel and related expenses during FY 2007.
Total general and administrative expenses increased by $4.1 million (151.4%) to $6.8 million (including amortization and goodwill impairment expense) in FY 2006 as compared to $2.7 million in FY 2005. Expressed as a percentage of net sales, general and administrative expenses represented 29% in FY 2006 as compared to 18% in FY 2005. The increase is primarily attributable to $2.6 million of intangible write-off and amortization, comprised of goodwill impairment of $814,000 for Texas Optoelectronics, intangible amortization of $1.4 million and amortization of financing expenses of $387,000 related to the acquisition of Picometrix. The remaining $1.5 million increased General and Administrative (G&A) costs was the result of added corporate expenses. The Sarbanes-Oxley Act section 404, internal controls, requires the Company to be compliant by fiscal year ending March 2008, based on current market capitalization. External costs required to be in compliance will materially increase over the next two years.
Interest income for FY 2006 totaled approximately $ 43,000, same as in FY 2005, due primarily to capital financing activities, which resulted in higher cash balances available for short-term investment. Interest expense for the year was $2,714,000, as compared to $330,000 in 2005. The increase was the result of capital financing activities and the related interest expense, including amortization of convertible notes’ discounts of approximately $1,978,000 and $206,000 of related party interest.
The company recorded an income tax provision of $28,000 for FY 2006 as compared to a negative income tax provision of $4.7 million for FY 2005. The difference of $4.7 million is due to the fact that the Company reversed 50% of its deferred tax valuation allowance, in the amount of $4.7 million in FY 2005.
Net loss for FY 2006 was $5.3 million, as compared to net income $5.1 million in 2005, which included the FY 2005 $4.7 million adjustment made to reduce the deferred tax valuation allowance. The decrease in net income is attributable to higher operating expenses, interest expense and the inventory write down at the California facility, offset partially by higher gross profit attributable to the Picometrix acquisition. Non-cash operating and interest expenses for FY 2006 were $5,411,000 compared to $743,000 for FY 2005, an increase of $4,668,000 which is the result of goodwill impairment of $814,000, increase interest expense of $1,802,000 related to convertible notes’ discount amortization and depreciation and intangible amortization of $2,052,000, associated with the Picometrix acquisition.
Inventory
Expense related to Inventory write-offs for FY 2006 compared to FY 2005 increased approximately $1.1 million from $36,000 in FY 2005 to $1.2 million in FY 2006. This is comprised of slow moving and obsolete inventory of approximately $821,000 of which $123,000 was associated with the acquisitions of Texas Optoelectronics Inc. (FY 2003) and Photonic Detector Inc. (Fiscal Year 2005). The balance of $698,000 was slow moving-excess-obsolete inventory from operations. The remaining $330,000 is derived from standards reductions, physical inventory quantity adjustments and scrap.
Liquidity and Capital Resources
Cash Flows
Operating Activities
Net cash provided by operating activities of $256,000 for the year ended March 31, 2007 was primarily the result of a net loss of $4,646,000, of which $5,150,000 was non-cash expenses, a decrease in accounts receivable of $800,000, an increase in accounts payable and other liabilities of $673,000, offset by a net increase in inventory of $1,005,000, deferred tax assets of $602,000 and prepaid/other assets of $114,000.
Net cash used in operating activities of $783,000 for the year ended March 31, 2006 was primarily the result of our net operating loss of $5,262,000, of which $5,411,000 was non-cash expenses, an increase in accounts receivable of $712,000 and prepaid expenses/other assets of $197,000, a decrease in accounts payable and accrued expenses of $981,000, offset by a decrease in inventory of $137,000.
Net cash provided by operating activities of $228,000 for the year ended March 27, 2005 was primarily the result of our net operating profit of $5,078,000 of which $3,935,000 was non-cash income, an increase in inventory of $291,000, an increase in prepaid acquisition and capital finance expenses of $532,000, an increase in prepaid expenses of $193,000, and a decrease in customer deposits of $477,000; offset by an increase in accounts payable and other accrued expenses of $507,000 and a decrease in accounts receivable of $71,000.
Investing Activities
Net cash used in investing activities was $2.6 million for the year ended March 31, 2007. The amount primarily consisted of capital expenditures of $2.4 million, of which $1.9 million was related to the previously announced Wafer Fabrication consolidation and corporate office move to Ann Arbor. Patent expenditures were $162,000 for the 2007 fiscal year.
Net cash used in investing activities was $3 million for the year ended March 31, 2006. The amount primarily consisted of cash paid for the acquisition of Picometrix of $3.5 million and related expenses of $936,000, net of cash acquired of $678,000 and change in restricted cash of $1.3 million. Capital expenditure activity for the year accounted for $263,000 of the cash used, and patent expenditures were $191,000 for the year.
Net cash used in investing activities was $5,048,000 for the year ended March 27, 2005. The amount primarily consisted of $4,228,000 loan to Picometrix, $1,254,000 in a restricted cash collateral account subject to release upon satisfaction of certain conditions (which conditions were subsequently met), $193,000 was used for capital expenditures required primarily for necessary computer and manufacturing equipment upgrades or replacements, and $1,117,000 for purchases of outstanding shares of PDI common stock; offset by $1,700,000 transferred from short-term investments into cash.
Financing Activities
Net cash used in financing activities was $316,000 for the year ended March 31, 2007. This primarily reflects the $2.95 million cash paid to Santa Barbara Bank & Trust Company (SBBT) to retire the outstanding term loan and line of credit, note payments of $501,000 made to related parties, offset by proceeds of a line of credit from Fifth Third Bank of $2.61 million, additional cash proceeds from a term loan by the MEDC of $172,000, and proceeds from employee exercised stock options of $355,000 and deferred tax liability on the beneficial conversion.
Net cash provided by financing activities was $8.2 million for the year ended March 31, 2006. This primarily reflects the $2.7 million cash proceeds from the term loan relating to the Picometrix acquisition reduced by ten months of loan repayment of $750,000, $5.0 million of cash proceeds from convertible notes ($1 million in September 2005 and $4 million in March 2006), $455,000 of cash paid for warrants to purchase the Company’s Class A Common Stock and $600,000 of cash proceeds from a tem loan by the MEDC. Payments of $119,000 were made during the year to equipment vendors to adhere to unsecured financing arrangements. Employees exercised stock options for approximately $47,000.
Net cash provided by financing activities was $5.0 million for the year ended March 27, 2005. The amount primarily consisted of $5.0 million obtained through private placement of a convertible note, a revolving line of credit of $1,000,000; offset by a pay-down of $900,000 against the secured term loan and repayment of a PDI line of credit of $78,000.
The Company is exposed to interest rate risk for marketable securities. We continually monitor interest rates and will attempt to utilize the best possible avenues of investment as excess cash becomes available.
Capital Resources
At March 31, 2007, the Company had unrestricted cash and cash equivalents of $3.3 million, a decrease of $2.6 million, from $5.9 million as of March 31, 2006, primarily the result of capital expenditures of $2.4 million, of which $1.9 million was for the clean room.
The Company currently has outstanding convertible subordinated notes due October 2007 in the principal amount of $5.5 million. These notes are convertible, at the option of the holder, at any time on or prior to maturity into shares of our Class A Common Stock at an average conversion price of $2.06 per share. An aggregate of 2,666,000 shares of Class A Common Stock would be issued upon the conversion of all outstanding convertible subordinated notes at these exchange rates. If the stock is not converted into common stock, the Company will have to retire the convertible notes in cash. The Company may enter into equity, debt or a combination of equity and debt transaction in order to retire the outstanding convertible note.
The Company maintains a revolving line of credit with a regional bank that provides for borrowings up to $2.0 million, based on 80% of the Company’s eligible accounts receivable and 40% of the Company’s eligible inventory, subject to certain limitations as defined by the agreement. At March 31, 2007, the outstanding balance on the line was approximately $741,000. All business assets of the Company secure the line. As most recently amended, repayment is interest only monthly, with principal due at maturity date on March 6, 2008. Interest is computed at the prime rate as published in the Wall Street Journal plus 12.5% with a floor of 8.25%. The prime interest rate was 8.25% at March 31, 2007.
In March 2007, the Company signed an equipment lease agreement with a regional bank to borrow $2.3 million. During 2007, the company borrowed $1.9 million against the line. The loan is guaranteed by all of the Company’s subsidiaries. Repayment of principal will begin June, 2007, plus interest, until maturity on May 30, 2012. Interest is computed at the prime rate as published in the Wall Street Journal.
The Company believes that current cash levels combined with our revolving line of credit and additional debt or equity financing to retire the convertible note will be sufficient for our 2008 fiscal year.
Debt
During FY 2006 $3.475 million of the $5 million Convertible debt (Convertible Debt 1st Tranche) was converted into 1,792,000 shares of Class Common Stock. At March 31, 2007, the Convertible Debt 1st Tranche balance was $1.4 million (net of debt discount).
In September 2005, the Company issued $1.0 million of convertible debt with warrants to purchase 170,164 shares of common stock (Convertible Debt 2nd Tranche). The note was converted in November 2005 into 472,678 shares of Class A Common Stock. In addition, 85,082 of the warrants were converted and the Company received $151,446 in cash. At March 31, 2007, the balance of unexercised warrants was 85,082.
In March 2006, the Company issued $4.0 million of convertible debt (Convertible Debt 2nd Tranche) with warrants to purchase 680,658 shares of common stock. Using the “Intrinsic Value” approach to valuing the beneficial conversion feature and the warrants, the Company recognized a $2.7 million debt discount on the $4.0 million principal value of the convertible note payable and is amortizing the debt discount to interest expense over the life of the note. At March 31, 2007 the balance of the Convertible Debt 2nd Tranche was $2.7 million (net of the debt discount).
The MEDC entered into two loan agreements with Picometrix LLC, one in 2004 (MEDC-loan 1) and one in 2005 (MEDC-loan 2). Both loans are unsecured. MEDC-loan 1 is for an amount up to $1,024,000 with an interest rate of 7% and is fully amortized by the end of an eight year period (ending on September 15, 2012). Interest is accrued during the first four years, but not paid, after which time principal plus accrued interest is paid over the remaining four years. On September 15, 2004, the Company borrowed $750,000 against the $1.0 million. On February 1, 2007, the Company borrowed an additional $172,000 against the remaining balance of $274,000.
MEDC-loan 2 is for an amount up to $1.2 million with an interest rate of 7% and is fully amortized by the end of a six year period (ending on September 15, 2011). Interest is accrued during the first two years and paid ratably over the third year. Beginning in the fourth year principal and accrued interest is paid over the remaining three years. On September 15, 2005 the Company borrowed $600,000 against the $1.2 million.
| | | | | | | | | | | | | | |
| | | Convertible notes - Face value | | Notes Converted | | Convertible notes - Balance 3/31/07 | | Conversion Price | | Outstanding Warrants | | Exercise Price | |
| Round 1 financing | | $ | 5,000,000 | | $ | 3,475,000 | | $ | 1,525,000 | | $ | 1.9393 | | | 680,658 | | $ | 1.78 | |
| Round 2 financing | | | 5,000,000 | | | 1,000,000 | | | 4,000,000 | | $ | 2.1156 | | | 765,740 | | $ | 1.78 | |
| Total | | $ | 10,000,000 | | $ | 4,475,000 | | $ | 5,525,000 | | | | | | 1,446,398 | | | | |
Summary of Contractual Obligations and Commitments
The following table sets forth the contractual obligations of the Company at March 31, 2007.
| | | | |
Contractual Obligations | | Payments due by period | |
| | | Total | | Within 1 year | | 1 - 3 years | | 3 - 5 years | | More than 5 years | |
| Long-term Bank loan | | $ | 2,608,000 | | $ | 1,021,000 | | $ | 1,214,000 | | $ | 373,000 | | | - | |
| Long-term MEDC loan | | | 1,522,000 | | | - | | | 937,000 | | | 585,000 | | | - | |
| Convertible notes | | | 5,525,000 | | | 5,525,000 | | | - | | | - | | | - | |
| Discount on convertible notes | | | (1,364,000 | ) | | (1,364,000 | ) | | - | | | - | | | - | |
| Debt to related parties | | | 2,401,000 | | | 550,000 | | | 1,851,000 | | | - | | | - | |
Subtotal - Balance Sheet | | | 10,692,000 | | | 5,732,000 | | | 4,002,000 | | | 958,000 | | | - | |
| Operating lease obligations | | | 3,096,000 | | | 1,170,000 | | | 1,926,000 | | | - | | | - | |
| Purchase obligations | | | 1,873,000 | | | 1,873,000 | | | - | | | - | | | - | |
Total | | $ | 15,661,000 | | $ | 8,775,000 | | $ | 5,928,000 | | $ | 958,000 | | | - | |
| Item 7A | Quantitative and Qualitative Disclosures about Market Risk |
At March 31, 2007, most of the Company’s interest rate exposure is linked to the prime rate, subject to certain limitations, offset by cash investment tied to prime rate. As such, we are at risk to the extent of changes in the prime rate and do not believe that moderate changes in the prime rate will materially affect our operating results or financial condition.
| Item 8. | Financial Statements and Supplementary Data |
The following consolidated financial statements of Advanced Photonix, Inc. are included in Item 8:
| | Page |
| | |
| REPORT OF INDEPENDENT REGISTERED PUBLIC ACCOUNTING FIRM | 29 |
| | |
| FINANCIAL STATEMENTS: | |
| | |
| Consolidated Balance Sheets, | |
| As of March 31, 2007 and March 31, 2006 | 30 |
| | |
| Consolidated Statements of Operations | |
| for the years ended March 31, 2007, March 31, 2006 and March 27, 2005 | 32 |
| | |
| Consolidated Statements of Shareholders' Equity | |
| for the years ended March 31, 2007, March 31, 2006 and March 27, 2005 | 33 |
| | |
| Consolidated Statements of Cash Flows | |
| for the years ended March 31, 2007, March 31, 2006 and March 27, 2005 | 34 |
| | |
| Notes to Consolidated Financial Statements | 36 |
REPORT OF INDEPENDENT REGISTERED PUBLIC ACCOUNTING FIRM
To the Board of Directors and Shareholders
of Advanced Photonix, Inc.:
We have audited the accompanying consolidated balance sheets of Advanced Photonix, Inc. (the "Company") as of March 31, 2007 and 2006 and the related consolidated statements of operations, shareholders' equity and cash flows for each of the years ended March 31, 2007, March 31, 2006 and March 27, 2005. These consolidated financial statements are the responsibility of the Company's management. Our responsibility is to express an opinion on these consolidated financial statements based on our audits.
We conducted our audits in accordance with the Standards of the Public Company Accounting Oversight Board (United States). Those standards require that we plan and perform the audits to obtain reasonable assurance about whether the consolidated financial statements are free of material misstatement. An audit includes examining, on a test basis, evidence supporting the amounts and disclosures in the consolidated financial statements. An audit also includes assessing the accounting principles used and significant estimates made by management, as well as evaluating the overall presentation of the consolidated financial statements. We believe that our audits provide a reasonable basis for our opinion.
In our opinion, the accompanying consolidated financial statements present fairly, in all material respects, the financial position of the Company at March 31, 2007 and 2006 and the results of its operations and its cash flows for the years ended March 31, 2007, March 31, 2006 and March 27, 2005 in conformity with accounting principles generally accepted in the United States.
/s/ Farber Hass Hurley & McEwen LLP
Camarillo, California
June 15, 2007
ADVANCED PHOTONIX, INC.
CONSOLIDATED BALANCE SHEETS
| | | | | | |
| As of: | | March 31, 2007 | | March 31, 2006 | |
Assets | | | | | | | |
| Current assets: | | | | | | | |
| Cash and cash equivalents | | $ | 3,274,000 | | $ | 5,933,000 | |
| Accounts receivable, net of allowance for doubtful accounts of $51,000 and $46,000 in 2007 and 2006, respectively | | | 3,587,000 | | | 4,387,000 | |
| Inventory, less allowance of $924,000 and $2,181,000 in 2007 and 2006, respectively | | | 4,439,000 | | | 3,434,000 | |
| Prepaid expenses and other current assets | | | 377,000 | | | 711,000 | |
| Total current assets: | | | 11,677,000 | | | 14,465,000 | |
| Equipment and leasehold improvements: | | | | | | | |
| Equipment and leasehold improvements | | | 10,301,000 | | | 7,923,000 | |
| Accumulated depreciation | | | (5,565,000 | ) | | (4,548,000 | ) |
| Equipment and leasehold improvements, net | | | 4,736,000 | | | 3,375,000 | |
| Other assets: | | | | | | | |
| Goodwill, net of accumulated amortization of $353,000 in 2007 and 2006, respectively | | | 4,579,000 | | | 4,719,000 | |
| Intangibles, net of accumulated amortization of $2,921,000 and $1,399,000 in 2007 and 2006, respectively | | | 12,285,000 | | | 14,155,000 | |
| Patents, net of accumulated amortization of $62,000 and $55,000 for 2007 and 2006, respectively | | | 45,000 | | | 16,000 | |
| Patents pending | | | 310,000 | | | 184,000 | |
| Prepaid capital finance expense, net of current portion and accumulated amortization in 2007 and 2006 of $238,000 and $181,000, respectively | | | -- | | | 84,000 | |
| Deferred income taxes | | | 1,225,000 | | | 623,000 | |
| Certificate of deposit | | | 285,000 | | | 275,000 | |
| Security deposits and other assets | | | 100,000 | | | 105,000 | |
| Total other assets | | | 18,829,000 | | | 20,161,000 | |
| Total assets: | | $ | 35,242,000 | | $ | 38,001,000 | |
(Continued)
ADVANCED PHOTONIX, INC.
CONSOLIDATED BALANCE SHEETS - Continued
| | | | |
| | | March 31, 2007 | | March 31, 2006 | |
Liabilities and shareholders' equity | | | | | | | |
| Current liabilities: | | | | | | | |
| Line of credit | | $ | 741,000 | | $ | 1,000,000 | |
| Accounts payable | | | 1,401,000 | | | 982,000 | |
| Compensation and related withholdings | | | 1,091,000 | | | 697,000 | |
| Customer deposits | | | -- | | | 1,000 | |
| Deferred income | | | -- | | | 76,000 | |
| Interest payable | | | 325,000 | | | 183,000 | |
| Other accrued expenses | | | 610,000 | | | 769,000 | |
| Current portion of long-term debt, related party | | | 550,000 | | | 500,000 | |
| Current portion of long-term debt | | | 4,535,000 | | | 927,000 | |
| Total current liabilities | | | 9,253,000 | | | 5,135,000 | |
| | | | | | | | |
| Long-term debt, less current portion | | | 3,015,000 | | | 5,002,000 | |
| Long-term debt, less current portion - related party | | | 1,851,000 | | | 2,401,000 | |
| Total liabilities | | | 14,119,000 | | | 12,538,000 | |
| | | | | | | | |
Commitments and contingencies | | | | | | | |
Class A redeemable convertible preferred stock, $.001 par value; 780,000 shares authorized; 2007 and 2006 - 40,000 shares issued and outstanding; liquidation preference $32,000 | | | 32,000 | | | 32,000 | |
| | | | | | | | |
Shareholders' equity: | | | | | | | |
Preferred stock, $.001 par value; 10,000,000 shares authorized; 780,000 shares designated Class A redeemable convertible; 2007 and 2006 - no shares issued and outstanding | | | -- | | | -- | |
Class A Common Stock, $.001 par value, 50,000,000 authorized; 2007 - 19,226,006 shares issued and outstanding; 2006 - 18,885,006 shares issued and outstanding. | | | 19,000 | | | 19,000 | |
Class B Common Stock, $.001 par value; 4,420,113 shares authorized, 2007 and 2006 - 31,691 issued and outstanding. | | | -- | | | -- | |
| Additional paid-in capital | | | 43,887,000 | | | 43,581,000 | |
| Accumulated deficit | | | (22,815,000 | ) | | (18,169,000 | ) |
| Total shareholders' equity | | | 21,091,000 | | | 25,431,000 | |
| Total liabilities and shareholders' equity | | $ | 35,242,000 | | $ | 38,001,000 | |
See notes to consolidated financial statements.
ADVANCED PHOTONIX, INC.
CONSOLIDATED STATEMENTS OF OPERATIONS
| | | | | | | | |
| For the years ended March 31, 2007, March 31, 2006 and March 27, 2005 | | 2007 | | 2006 | | 2005 | |
| | | | | | | | |
| Sales, net | | $ | 23,588,000 | | $ | 23,585,000 | | $ | 14,803,000 | |
| Cost of products sold | | | 12,693,000 | | | 14,402,000 | | | 10,071,000 | |
| Gross profit | | | 10,895,000 | | | 9,183,000 | | | 4,732,000 | |
| | | | | | | | | | | |
| Research and development expenses | | | 4,015,000 | | | 3,019,000 | | | 146,000 | |
| Sales and marketing expenses | | | 2,174,000 | | | 1,930,000 | | | 1,214,000 | |
| General and administrative expenses | | | 4,656,000 | | | 4,157,000 | | | 2,508,000 | |
| Amortization expense | | | 1,528,000 | | | 1,403,000 | | | 117,000 | |
| Amortization - capital finance expense | | | 148,000 | | | 387,000 | | | 81,000 | |
| Stock option compensation | | | 361,000 | | | -- | | | -- | |
| Wafer fabrication relocation expense | | | 720,000 | | | -- | | | -- | |
| Loss on impairment of intangible asset | | | 349,000 | | | -- | | | -- | |
| Loss on impairment of goodwill | | | 140,000 | | | 814,000 | | | -- | |
| Total operating expenses | | | 14,091,000 | | | 11,710,000 | | | 4,066,000 | |
| Income (loss) from operations | | | (3,196,000 | ) | | (2,527,000 | ) | | 666,000 | |
| | | | | | | | | | | |
| Other income (expense): | | | | | | | | | | |
| Interest income | | | 213,000 | | | 43,000 | | | 43,000 | |
| Interest expense | | | (322,000 | ) | | (322,000 | ) | | (13,000 | ) |
| Interest expense related to convertible notes | | | (504,000 | ) | | (208,000 | ) | | (141,000 | ) |
| Interest expense, warrant discount | | | (1,528,000 | ) | | (1,978,000 | ) | | (176,000 | ) |
| Interest expense, related party | | | (224,000 | ) | | (206,000 | ) | | -- | |
| Other income (expense) | | | (5,000 | ) | | (36,000 | ) | | (35,000 | ) |
| Income (Loss) before provision (benefit) for income taxes | | | (5,566,000 | ) | | (5,234,000 | ) | | 344,000 | |
| | | | | | | | | | | |
| Provision (benefit) for income taxes: | | | | | | | | | | |
| Provision (benefit) for income taxes - current | | | 62,000 | | | 28,000 | | | 18,000 | |
| Provision (benefit) for income taxes - deferred | | | | ) | | -- | | | (4.752,000 | ) |
| Total provision (benefits) for income taxes | | | -- | | | 28,000 | | | (4,734,000 | ) |
| Net income (loss) | | $ | (4,646,000 | ) | $ | (5,262,000 | ) | $ | 5,078,000 | |
| | | | | | | | | | | |
| Basic earnings (loss) per share | | $ | (0.24 | ) | $ | (0.30 | ) | $ | 0.38 | |
| Diluted earnings (loss) per share | | $ | (0.24 | ) | $ | (0.30 | ) | $ | 0.33 | |
| | | | | | | | | | | |
| Weighted average common shares outstanding | | | 19,065,000 | | | 17,477,000 | | | 13,461,000 | |
See notes to consolidated financial statements.
ADVANCED PHOTONIX, INC.
CONSOLIDATED STATEMENTS OF SHAREHOLDERS’ EQUITY
| | | | | | | | | | | | |
For the years ended March 31, 2007, March 31, 2006 and March 27, 2005 | | Class A Common Stock | | Class B Common Stock | | Additional Paid-in Capital | | Accumulated Deficit | | | |
| | Shares | | Amount | | Shares | | Amount | | Restated | | Restated | | Total | |
BALANCE AT MARCH 28, 2004 | | | 13,397,059 | | $ | 13,000 | | | 31,691 | | | -- | | $ | 27,646,000 | | $ | (17,986,000 | ) | $ | 9,673,000 | |
| Exercise of Options | | | 2,000 | | | -- | | | -- | | | -- | | | 1,000 | | | -- | | | 1,000 | |
| Shares issued to acquire PDI | | | 113,572 | | | -- | | | -- | | | -- | | | 207,000 | | | -- | | | 207,000 | |
| Discount on note payable (fair value of detachable warrants issued) | | | -- | | | -- | | | -- | | | -- | | | 1,344,000 | | | -- | | | 1,344,000 | |
| Net Income | | | -- | | | -- | | | -- | | | -- | | | -- | | | 5,078,000 | | | 5,078,000 | |
BALANCE AT MARCH 27, 2005 | | | 13,512,631 | | $ | 13,000 | | | 31,691 | | | -- | | $ | 29,198,000 | | $ | (12,907,000 | ) | $ | 16,304,000 | |
| Exercise of Options | | | 266,500 | | | -- | | | -- | | | -- | | | 272,000 | | | -- | | | 272,000 | |
| Notes Conversions | | | 2,264,560 | | | 3,000 | | | -- | | | -- | | | 4,473,000 | | | -- | | | 4,476,000 | |
| Shares issued for interest | | | 11,069 | | | -- | | | -- | | | -- | | | 21,000 | | | -- | | | 21,000 | |
| Discount on note payable (fair value of detachable warrants issued) | | | -- | | | -- | | | -- | | | -- | | | 3,732,000 | | | -- | | | 3,732,000 | |
| Warrants exercised | | | 255,246 | | | -- | | | -- | | | -- | | | 454,000 | | | -- | | | 454,000 | |
| Shares issued to acquire Picometrix | | | 2,575,000 | | | 3,000 | | | -- | | | -- | | | 5,431,000 | | | -- | | | 5,434,000 | |
| Net Income | | | -- | | | -- | | | -- | | | -- | | | -- | | | (5,262,000 | ) | | (5,262,000 | ) |
BALANCE AT MARCH 31, 2006 | | | 18,885,006 | | $ | 19,000 | | | 31,691 | | $ | - | | $ | 43,581,000 | | $ | (18,169,000 | ) | $ | 25,431,000 | |
| Exercise of Options | | | 341,000 | | | -- | | | | | | | | | 355,000 | | | | | | 355,000 | |
| Stock Compensation 123(R) | | | | | | | | | | | | | | | 361,000 | | | | | | 361,000 | |
| Adjustment of discount on note payable (fair value of detachable warrants issued) | | | | | | | | | | | | | | | (31,000 | ) | | | | | (31,000 | ) |
| Deferred tax liability on beneficial conversion | | | | | | | | | | | | | | | (379,000 | ) | | | | | (379,000 | ) |
| Net Income | | | | | | | | | | | | | | | | | | (4,646,000 | ) | | (4,646,000 | ) |
BALANCE AT MARCH 31, 2007 | | | 19,226,006 | | $ | 19,000 | | | 31,691 | | $ | -- | | $ | 43,887,000 | | $ | (22,815,000 | ) | $ | 21,091,000 | |
See notes to consolidated financial statements.
ADVANCED PHOTONIX, INC.
CONSOLIDATED STATEMENTS OF CASH FLOWS
| | | | | | | | |
| For the years ended March 31, 2007, March 31, 2006 and March 27, 2005 | | 2007 | | 2006 | | 2005 | |
| | | | | | | | |
CASH FLOWS FROM OPERATING ACTIVITIES | | | | | | | | | | |
| Net income (loss): | | $ | (4,646,000 | ) | $ | (5,262,000 | ) | $ | 5,078,000 | |
Adjustment to reconcile net income (loss) to net cash provided by (used in) operating activities: | | | | | | | | | | |
| Depreciation | | | 1,076,000 | | | 829,000 | | | 369,000 | |
| Amortization | | | 1,676,000 | | | 1,790,000 | | | 198,000 | |
| Stock compensation expense | | | 361,000 | | | -- | | | -- | |
| Goodwill impairment charges | | | 140,000 | | | 814,000 | | | -- | |
| Loss on impairment of intangible asset | | | 349,000 | | | -- | | | -- | |
| Amortization, convertible note discount | | | 1,528,000 | | | 1,978,000 | | | 176,000 | |
| Deferred income taxes | | | (602,000 | ) | | -- | | | -- | |
| Disposal of fixed assets | | | -- | | | -- | | | 56,000 | |
| Provision for warranty expense | | | 20,000 | | | -- | | | 15,000 | |
| Other provisions | | | 128,000 | | | 821,000 | | | -- | |
| Increase (decrease) in deferred tax valuation allowance | | | -- | | | -- | | | (4,749,000 | ) |
| Changes in operating assets and liabilities: | | | | | | | | | | |
| Accounts receivable | | | 800,000 | | | (712,000 | ) | | 71,000 | |
| Inventories | | | (1,133,000 | ) | | 137,000 | | | (291,000 | ) |
| Prepaid expenses and other current assets | | | 284,000 | | | (355,000 | ) | | (193,000 | ) |
| Prepaid acquisition costs | | | -- | | | -- | | | (134,000 | ) |
| Prepaid capital finance expense | | | -- | | | -- | | | (398,000 | ) |
| Other assets | | | (398,000 | ) | | 158,000 | | | -- | |
| Accounts payable | | | 419,000 | | | (336,000 | ) | | 428,000 | |
| Customer deposit liability | | | -- | | | -- | | | (477,000 | ) |
| Accrued expenses | | | 254,000 | | | (645,000 | ) | | 79,000 | |
| Net cash provided by (used in) operating activities | | | 256,000 | | | (783,000 | ) | | 228,000 | |
CASH FLOWS FROM INVESTING ACTIVITIES | | | | | | | | | | |
| Capital expenditures | | | (2,437,000 | ) | | (263,000 | ) | | (193,000 | ) |
| Patent expenditures | | | (162,000 | ) | | (191,000 | ) | | -- | |
| Short term investments | | | -- | | | -- | | | 1,700,000 | |
| Change in restricted cash | | | -- | | | 1,254,000 | | | (1,254,000 | ) |
| Cash acquired through acquisition of Photonic Detectors, Inc. | | | -- | | | -- | | | 44,000 | |
| Cash acquired through acquisition of Picotronix, Inc. | | | -- | | | 678,000 | | | -- | |
| Cash paid for Picotronix, Inc. acquisition | | | -- | | | (3,500,000 | ) | | -- | |
| Cash paid for acquisition related costs | | | -- | | | (936,000 | ) | | -- | |
Purchase of outstanding shares of Photonic Detectors, Inc. common stock | | | -- | | | -- | | | (1,117,000 | ) |
| Loan to Picometrix, Inc. | | | -- | | | -- | | | (4,228,000 | ) |
| Net cash used in investing activities | | | (2,599,000 | ) | | (2,958,000 | ) | | (5,048,000 | ) |
CASH FLOWS FROM FINANCING ACTIVITIES | | | | | | | | | | |
| Repayment of Photonic Detectors, Inc. line of credit | | | -- | | | -- | | | (78,000 | ) |
| Proceeds from bank term loan | | | 1,867,000 | | | 2,700,000 | | | -- | |
| Payments on bank term loan | | | (1,950,000 | ) | | (750,000 | ) | | (900,000 | ) |
| Advanced Photonix, Inc. revolving line of credit (asset-based) | | | (259,000 | ) | | -- | | | 1,000,000 | |
| Payments on notes payable | | | -- | | | 119,000 | | | -- | |
| Proceeds from private placement of convertible note | | | -- | | | 5,000,000 | | | 5,000,000 | |
| Proceeds from MEDC term loan | | | 172,000 | | | 600,000 | | | -- | |
| Proceeds from exercise of warrants | | | -- | | | 455,000 | | | -- | |
| Payments on related party debt | | | (501,000 | ) | | -- | | | -- | |
| | | | | | | | | | | |
| Proceeds from exercise of stock options | | | 355,000 | | | 47,000 | | | 2,000 | |
| Net cash provided by (used in) financing activities | | | (316,000 | ) | | 8,171,000 | | | 5,024,000 | |
NET INCREASE (DECREASE) IN CASH AND CASH EQUIVALENTS | | | (2,659,000 | ) | | 4,430,000 | | | 204,000 | |
CASH AND CASH EQUIVALENTS AT BEGINNING OF YEAR | | | 5,933,000 | | | 1,503,000 | | | 1,299,000 | |
CASH AND CASH EQUIVALENTS AT END OF YEAR | | $ | 3,274,000 | | $ | 5,933,000 | | $ | 1,503,000 | |
See notes to consolidated financial statements.
Supplemental disclosure of cash flow information:
| | | 2007 | | 2006 | | 2005 | |
| Cash paid for interest | | $ | 795,000 | | $ | 623,000 | | $ | 153,000 | |
| Cash paid for income taxes | | $ | 26,000 | | $ | 17,000 | | $ | 19,000 | |
Supplemental disclosure of non-cash operating, investing and financing activities:
Picometrix acquisition in FY 2006
| Assets acquired | | $ | 19,404,000 | |
| Liabilities assumed | | | (2,406,000 | ) |
| Net assets acquired | | | 16,998,000 | |
| Cash Paid | | | (3,500,000 | ) |
| Broker fees and other direct costs | | | (936,000 | ) |
| | | | 12,562,000 | |
| Non-cash investing activities: | | | | |
| Common stock issued | | | (5,433,000 | ) |
| Note payable - related | | | (2,901,000 | ) |
| Picometrix note retired | | | (4,228,000 | ) |
| Net balance | | $ | -- | |
In October 2004 (FY 2005), the Company issued $5.0 million in secured debt to be used for future acquisition. In conjunction with that debt, the Company issued warrants convertible into 850,822 shares of the Company’s common stock. The warrants issued were adjusted to present value. The adjustment was $141,000 to additional paid-in capital. The company amortized $176,000 of the discount to interest expense in FY 2005 and $938,000 of the discount to interest expense in FY 2006. The remaining balance of $230,000 will be amortized over the remaining life of the convertible note which matures in Oct 2007 or sooner if the note is converted. During FY 2006 $4,475,000 of the convertible notes was converted into 2,275,631 shares of the Company’s Class A Common Stock.
ADVANCED PHOTONIX, INC.
NOTES TO CONSOLIDATED FINANCIAL STATEMENTS
| 1. | Summary of the Company and Significant Accounting Policies |
Summary of Company
Business Description -API is a leading supplier of custom opto-electronic solutions, high-speed optical receivers and Terahertz sensors and instrumentation, serving a variety of global OEM markets including telecommunications, military/aerospace, industrial sensing/NDT, medical and homeland security. Our optoelectronic solutions are based on our siliconLAAPD, PIN photodiode and FILTRODE® detectors. Our patented high-speed optical receivers include APD and PIN photodiode technology based upon III-V materials, including InP, InAlAs, and GaAs. Our newly emerging Terahertz sensor product line is targeted to the industrial NDT, quality control, Homeland Security and military markets. Using our patented fiber coupled technology and high-speed Terahertz generation and detection sensors, we are engaged in transferring Terahertz technology from the application development laboratory to the factory floor. We have three manufacturing facilities, one in Camarillo, California, one in Dodgeville, Wisconsin and one in Ann Arbor, Michigan.
The Company’s wholly-owned subsidiary, Silicon Sensors, Inc. manufactures silicon photodiodes and optoelectronic devices in a manufacturing facility in Dodgeville, Wisconsin.
During 2007, Texas Optoelectronics, Silicon Detectors Inc. and Photonic Detectors Inc. were dissolved. These wholly-owned subsidiaries had no assets or liabilities at the time of dissolution.
| | Principles of Consolidation - The consolidated financial statements include the financial statements of the Company and its wholly-owned subsidiaries. All significant inter-company balances and transactions have been eliminated in consolidation. |
Reclassifications -Certain prior year balances have been reclassified in the consolidated financial statements to conform to the current year presentation.
| | Fiscal Year-End - Effective with the FY 2006 year-end, the Company’s fiscal year ends on the last calendar day in March. Prior fiscal years ended on the last Sunday of March. As a result of this change, fiscal year ended March 31, 2007 contains fifty-two weeks and fiscal year ended March 31, 2006 contains fifty-three weeks. The prior fiscal year ending March 27, 2005 contained fifty-two weeks. |
| | Operating Segment Information - The Company operates as one segment in accordance with SFAS 131, “Disclosures about Segments of an Enterprise and Related Information.” The Company’s chief operating decision maker and management personnel view the Company’s performance and make resource allocation decisions by looking at the Company as a whole. Although there are different product lines within the Company, they are economically similar and are also similar in terms of the five criteria set forth in SFAS 131 that must be met to combine segments. The Company’s products are light and radiation detection devices. The nature of the production process is similar for all product lines, and manufacturing for the different product lines occurs in common facilities. Generally, the same engineers with the same qualifications design and manufacture products for all product lines. The types and class of customers are similar across all product lines, and products are distributed through common channels and distributor networks. |
Significant Accounting Policies
Pervasiveness of Estimates - The preparation of consolidated financial statements in conformity with accounting principles generally accepted in the United States requires management to make estimates and assumptions that affect the reported amounts of assets and liabilities and disclosure of contingent assets and liabilities at the date of the financial statements and the reported amounts of revenues and expenses during the reporting period. Actual results could differ from those estimates.
| �� | Fair Value of Financial Instruments - The carrying value of all financial instruments potentially subject to valuation risk (principally consisting of cash equivalents, accounts receivable, accounts payable, notes receivable and notes payable) approximates fair value based upon prevailing interest rates available to the Company. |
| | Cash and Cash Equivalents - The Company considers all highly liquid investments, with an original maturity of three months or less when purchased, to be cash equivalents. |
Compensating Cash Balance— as a condition of the Master Equipment Lease Agreement with Fifth Third Bank the Company is required to maintain a compensating balance of not less than $1,500,000 as long as any indebtedness to Fifth Third is outstanding.
Accounts Receivable - Receivables are stated at amounts estimated by management to be the net realizable value. The allowance is based on specific identification. Accounts receivable are charged off when it becomes apparent based upon age or customer circumstances that such amounts will not be collected. Collateral is not typically required, nor is interest charged on accounts receivable balances.
Concentration of Credit Risk - Financial instruments, which potentially subject the Company to concentrations of credit risk, consist principally of cash equivalents and trade accounts receivable. The Company maintains cash balances at five financial institutions that are insured by the Federal Deposit Insurance Corporation (FDIC) up to $100,000. As of March 31, 2007, the Company had cash at three financial institutions in excess of federally insured amounts. As excess cash is available, the Company invests in short-term and long-term investments, primarily consisting of Government Securities Money Market instruments, and Repurchase agreements. As of March 31, 2007 and 2006, cash deposits held at financial institutions in excess of FDIC insured amounts were $2,926,000 and $1,433,000, respectively.
| | Accounts receivable are unsecured and the Company is at risk to the extent such amount becomes uncollectible. The Company performs periodic credit evaluations of its customers’ financial condition and generally does not require collateral. As of March 31, 2007, one customer comprised 11% of accounts receivable. As of March 31, 2006, one customer comprised 14% of accounts receivable. |
Inventories - Inventories, which include material, labor and manufacturing overhead, are stated at standard cost (which approximates the first in, first out method) or market. Slow moving and obsolete inventories are reviewed throughout the year. To calculate a reserve for obsolescence, we begin with a review of our slow moving inventory. Any inventory, which has been slow moving within the past 12 months, is evaluated and reserved if deemed appropriate. In addition, any residual inventory, which is customer specific and remaining on hand at the time of contract completion, is reserved for at the standard unit cost. The complete list of slow moving and obsolete inventory is then reviewed by the production, engineering and/or purchasing departments to identify items that can be utilized in the near future. These items are then excluded from the analysis and the remaining amount of slow-moving and obsolete inventory is then reserved for. Additionally, non-cancelable open purchase orders for parts we are obligated to purchase where demand has been reduced may be reserved. Reserves for open purchase orders where the market price is lower than the purchase order price are also established. If a product that had previously been reserved for is subsequently sold, the amount of reserve specific to that item is then reversed.
| | Equipment and Leasehold Improvements - Equipment and leasehold improvements are stated at cost. Depreciation and amortization are computed using the straight-line method over the estimated useful lives of the assets or lease term ranging from three to nine years. |
Intangible Assets– The Company records goodwill, which represents the excess of cost over fair value of net assets. Other intangibles are recorded at cost. These intangible assets are associated with the value of the acquired non-compete agreement, customer list, trademarks, R&D contracts, and technology/patents. These intangible assets are amortized using the straight-line method over their various estimated useful lives up to 15 years.
Patents– Patents represent costs incurred in connection with patent applications. Such costs are amortized using the straight-line method over the useful life of the patent once issued, or expensed immediately if any specific application is unsuccessful.
Impairment of Long-Lived Assets and Goodwill — The Company reviews the recoverability of the carrying value of long-lived assets using the methodology prescribed in SFAS 144. The Company reviews long-lived assets for impairment whenever events or changes in circumstances indicate that the carrying value of such assets may not be recoverable. Upon such an occurrence, recoverability of these assets is determined by comparing the forecasted undiscounted net cash flows to which the assets relate, to the carrying amount. If the asset is determined to be unable to recover its carrying value, it is written down to fair value. Fair value is determined based on discounted cash flows, appraised values or other information available in the market, depending on the nature of the assets.
The Company reviews the carrying value of goodwill and non-amortizable intangible assets using the methodology prescribed in SFAS 142, “Goodwill and Other Intangible Assets.” SFAS 142 requires that the Company not amortize goodwill and intangible assets with indefinite lives, but instead subject them to impairment tests on at least an annual basis and whenever circumstances suggest that goodwill may be impaired. Company recognizes impairment losses on long-lived assets used in operations when the undiscounted cash flows estimated to be generated by those assets are less than the assets' carrying amounts. In such circumstances, those assets are written down to estimated fair value. Long-lived assets consist primarily of goodwill and fixed assets.
Revenue Recognition — The Company recognizes revenues upon shipment. Provision for estimated losses, if any, is made in the period in which such losses are determined.
| | Revenues from research and development cost reimbursement-type contracts are recorded as costs are incurred based upon the relationship between actual incurred costs, total estimated costs and the amount of the contract or grant award. Estimation of cost is reviewed periodically and any anticipated losses are recognized in the period in which they first become determinable. |
Significant Customers — During fiscal years ended March 31, 2007 and 2006, no single customer accounted for more than 10% of the Company’s net sales. During FY 2005, two customers represented 12% and 12% of the Company’s net sales.
Product Warranty — The Company generally sells products with a limited warranty of product quality. The Company accrues for known warranty issues if a loss is probable and can be reasonably estimated, and accrues for estimated incurred but unidentified issues based on historical activity. The accruals, and the related expenses, for known issues and for estimated incurred but unidentified issues were not significant during the periods presented.
Shipping and Handling Costs — The Company’s policy is to classify shipping and handling costs as a component of Costs of Goods Sold in the Statement of Operations.
Research and Development Costs - The Company charges all research and development costs, including costs associated with development contract revenues, to expense when incurred. Manufacturing costs associated with the development of a new fabrication process or a new product are expensed until such times as these processes or products are proven through final testing and initial acceptance by the customer. Costs related to revenues on non-recurring engineering services billed to customers are generally classified as cost of product sales. The company generally retains intellectual property rights related to paid research and development contracts.
Advertising Costs — Advertising costs are expensed as incurred. Advertising expense was approximately $91,000, $133,000 and $84,000 in FY 2007, 2006 and 2005, respectively.
Accounting for Stock Option Based Compensation — Effective April 1, 2006, the Company adopted SFAS No. 123(R), “Share-Based Payment: An Amendment of FASB Statements No. 123 and 95” using the modified prospective method. Under this method, compensation cost is recognized on or after the effective date for the portion of outstanding awards, for which the requisite service has not yet been rendered, based on the grant date fair value of those awards. Prior to April 1, 2006, the Company accounted for employee stock options using the intrinsic value method in accordance with Accounting Principles Board (APB) Opinion No. 25 (APB No. 25), “Accounting for Stock Issued to Employees,” and adopted the disclosure only alternative of SFAS No. 123. For stock-based awards issued on or after April 1, 2006, the Company recognizes the compensation cost on a straight-line basis over the requisite service period for the entire award. Measurement and attribution of compensation cost for awards that are unvested as of the effective date of SFAS No. 123(R) are based on the same estimate of the grant-date or modification-date fair value and the same attribution method used under SFAS No. 123.
On November 10, 2005, the Financial Accounting Standards Board (FASB) issued FASB Staff Position No. FAS 123(R)-3 “Transition Election Related to Accounting for Tax Effects of Share-Based Payment Awards.” The Company has elected to adopt the alternative transition method provided in the FASB Staff Position for calculating the tax effects of stock-based compensation pursuant to SFAS 123(R). The alternative transition method includes simplified methods to establish the beginning balance of the additional paid-in capital pool (APIC pool) related to the tax effects of employee stock-based compensation, and to determine the subsequent impact on the APIC pool and Consolidated Statements of Cash Flows of the tax effects of employee stock-based compensation awards that are outstanding upon adoption of SFAS 123(R). As the Company is currently in a net operating loss position and has placed valuation allowances on its net deferred tax assets, there is no net impact on the Company’s APIC pool related to stock-based compensation for the year ended March 31, 2007.In accordance with SFAS No. 148, and as required by SFAS 123(R), the required pro forma disclosure, for periods prior to adoption of SFAS 123(R), is shown below (in millions, except per share data).
| | | 2006 | | 2005 | |
| Net Income (loss) , as reported | | $ | (5,262,000 | ) | $ | 5,078,000 | |
| Net income (loss), Proforma | | $ | (5,409,000 | ) | $ | 5,032,000 | |
| Basic income (loss) per share, as reported | | $ | (0.30 | ) | $ | 0.38 | |
| Basic income (loss) per share, Proforma | | $ | (0.30 | ) | $ | 0.38 | |
Accounting for Income Taxes — Income taxes are provided for taxes currently payable or refundable, and for deferred income taxes arising from future tax consequences of events that were recognized in the Company’s financial statements or tax returns. The effects of income taxes are measured based on enacted tax laws and rates applicable to periods in which the differences are expected to reverse. If necessary, a valuation allowance is established to reduce deferred income tax assets to an amount that will more likely than not be realized in accordance with SFAS No. 109 “Accounting for Income Taxes.
The Company follows the guidance established in EITF Issues No. 05-8, “Income Tax Consequences of issuing Convertible Debt with a Beneficial Conversion Feature” (EITF 05-8) which concludes that the issuance of convertible debt with a beneficial conversion feature results in a basis difference that should be accounted for as a temporary difference and the establishment of a deferred tax liability for the basis difference should result in an adjustment to additional paid in capital.
Earnings per Share — The Company presents both basic and diluted earnings (loss) per share (EPS) amounts. Basic EPS is calculated by dividing net income (loss) by the weighted average number of common shares outstanding during the period. Diluted EPS amounts are based upon the weighted average number of common and common equivalent shares outstanding during the period. The Company uses the treasury stock method to calculate the impact of stock compensation. Common equivalent shares are excluded from the computation in periods in which they have an anti-dilutive effect. The total shares excluded from the computation of earnings per share for the year ended March 31, 2007 total 3.5 million shares, representing outstanding stock options, warrants and debt convertible into shares of common stock.
Recent Pronouncements and Accounting Changes — In February 2007, the FASB issued SFAS No. 159, which permits entities to choose to measure many financial instruments and certain other items at fair value. SFAS No. 159 also includes an amendment to SFAS No. 115, “Accounting for Certain Investments in Debt and Equity Securities” which applies to all entities with available-for-sale and trading securities. This Statement is effective as of the beginning of an entity’s first fiscal year that begins after November 15, 2007. The Company is assessing the impact of SFAS No. 159 and has not determined whether it will have a material impact on the Company’s results of operations or financial position.
In September 2006, the FASB issued SFAS No. 157, “Fair Value Measurements.” The Statement defines fair value, establishes a framework for measuring fair value in generally accepted accounting principles and expands disclosures about fair value measurements, and does not require any new fair value measurements. This Statement applies under other accounting pronouncements that require or permit fair value measurements. The Statement is effective for the fiscal years beginning after November 15, 2007. The Company is assessing SFAS No. 157 and has not determined the impact the adoption of SFAS No. 157 will have its results of operations or financial position.
In June 2006, the FASB issued FASB Interpretation No. 48, “Accounting for Uncertainty in Income Taxes—an interpretation of FASB Statement No. 109” (FIN 48). The interpretation clarifies the accounting for uncertainty in income taxes recognized in a company’s financial statements in accordance with SFAS No. 109, “Accounting for Income Taxes.” Specifically, the pronouncement prescribes a recognition threshold and a measurement attribute for the financial statement recognition and measurement of a tax position taken or expected to be taken in a tax return. The interpretation also provides guidance on the related de-recognition, classification, interest and penalties, accounting for interim periods, disclosure and transition of uncertain tax positions. The interpretation is effective for fiscal years beginning after December 15, 2006. The Company is assessing FIN 48 and has not determined the impact that the adoption of FIN 48 will have on its consolidated financial statements.
| | Inventories consist of the following at March 31: |
| | | 2007 | | 2006 | |
| Raw material | | $ | 3,348,000 | | $ | 4,288,000 | |
| Work-in-process | | | 1,503,000 | | | 937,000 | |
| Finished products | | | 512,000 | | | 390,000 | |
| Total inventories | | | 5,363,000 | | | 5,615,000 | |
| Less reserve | | | (924,000 | ) | | (2,181,000 | ) |
| Inventories, net | | $ | 4,439,000 | | $ | 3,434,000 | |
| 3. | Equipment and Leasehold Improvements |
| | Equipment and leasehold improvements consist of the following at March 31: |
| | | 2007 | | 2006 | |
| Machinery and equipment | | $ | 6,449,000 | | $ | 6,133,000 | |
| Furniture and fixtures | | | 521,000 | | | 516,000 | |
| Leasehold improvements | | | 554,000 | | | 394,000 | |
| Data processing equipment | | | 555,000 | | | 439,000 | |
| Vehicles | | | 26,000 | | | 26,000 | |
| Capitalized software | | | 442,000 | | | 401,000 | |
| Total assets | | | 8,547,000 | | | 7,909,000 | |
| Accumulated depreciation | | | (5,565,000 | ) | | (4,548,000 | ) |
| | | | 2,982,000 | | | 3,361,000 | |
| Construction-in-process | | | 1,754,000 | | | 14,000 | |
| Net equipment and leasehold improvements | | $ | 4,736,000 | | $ | 3,375,000 | |
Included in the table of Equipment and Leasehold improvements above, are assets totaling $1,867,000 at March 31, 2007, representing assets leased under a capital lease (see note 6 for a description of lease terms). A significant portion of these assets are included in construction in process.
Depreciation expense was $1,076,000 for fiscal year ended March 31, 2007, $829,000 for fiscal year ended March 31, 2006 and $369,000 for fiscal year ended March 27, 2005.
| 4. | Intangible Assets and Goodwill |
Intangible Assets - In October 2004 the Company entered into a definitive agreement for $5,000,000 of senior convertible notes, (see note 6). In connection with the agreement, costs of approximately $646,000 were incurred which are being amortized over the 36-month term of the agreement or expensed when the notes are converted. In March 2006, the amortization of prepaid capital finance expense was accelerated to reflect the portion of the convertible notes that were converted during the year. The remaining balance of $69,000 will be amortized at approximately $9,900 per month over the remaining life of the notes. In March 2007, the Company paid off the SBBT Term Loan and Line of Credit. The portion of the capital finance expense related to the SBBT loan agreement was accelerated and written off in March 2007.
In December 2004 the Company acquired Photonic Detectors, Inc. The Company recorded an intangible asset of $635,000, which represents the excess of cost over fair value of net assets. This intangible asset is associated with the value of the acquired customer list. The intangible asset is being amortized over a period of 60 months beginning January 2005. Monthly amortization is approximately $10,600 per month. Each year the Company evaluates the present value of future cash flows associated with the list. Any impairment would be recognized when the expected future operating cash flows from such intangible assets is less than their carrying value. The annual intangible impairment evaluation resulted in the write-off of the PDI Customer List asset in the amount of $349,000.
In May 2005 the Company completed the acquisition of Picotronix, Inc., dba Picometrix, Inc. The Company recorded intangible assets of $14,920,000, which represents the excess of cost over fair value of net assets. These intangible assets are associated with the value of the acquired non-compete agreement, customer list, trademarks, R&D contacts, and technology/patents. These intangible assets are being amortized over their various estimated useful lives up to 15 years. Amortization is approximately $116,200 per month.
Intangible assets that have definite lives consist of the following (in thousands):
| | | | | March 31, 2007 | | March 31, 2006 | |
| | | Weighted Average Lives | | Carrying Value | | Accumulated Amortization | | Intangibles Net | | Carrying Value | | Accumulated Amortization | | Intangibles Net | |
| Non-Compete agreement | | | 3 | | $ | 130 | | $ | 82 | | $ | 48 | | $ | 130 | | $ | 38 | | $ | 92 | |
| Customer list | | | 15 | | | 475 | | | 309 | | | 166 | | | 825 | | | 170 | | | 655 | |
| Trademarks | | | 15 | | | 2,270 | | | 286 | | | 1,984 | | | 2,270 | | | 135 | | | 2,135 | |
| R&D contracts | | | 15 | | | 1,380 | | | 174 | | | 1,206 | | | 1,380 | | | 82 | | | 1,298 | |
| Patents | | | | | | 107 | | | 62 | | | 45 | | | 70 | | | 54 | | | 16 | |
| Patents pending | | | | | | 310 | | | -- | | | 310 | | | 184 | | | -- | | | 184 | |
| Technology | | | 10 | | | 10,950 | | | 2,069 | | | 8,881 | | | 10,950 | | | 975 | | | 9,975 | |
Total Intangibles | | | 11.4 | | $ | 15,622 | | $ | 2,982 | | $ | 12,640 | | $ | 15,809 | | $ | 1,454 | | $ | 14,355 | |
Amortization expense for the fiscal year ended March 31, 2007 was approximately $1,528,000 compared to $1,403,000 for the year ended March 31, 2006. Patent amortization expense was approximately $7,000, $3,000 and $3,000 in FY 2007, 2006 and 2005, respectively. The current patents held by the Company have remaining useful lives ranging from 2 years to 20 years, with a weighted average remaining useful life of 3.5 years.
Assuming no impairment to the intangible value, future amortization expense for intangible assets and patents are as follows:
Intangible Assets | | Patents | |
| | 2008 | | $ | 1,394,000 | | | 2008 | | $ | 7,000 | |
| | 2009 | | | 1,356,000 | | | 2009 | | | 6,000 | |
| | 2010 | | | 1,351,000 | | | 2010 | | | 5,500 | |
| | 2011 | | | 1,351,000 | | | 2011 | | | 5,500 | |
| | 2012 | | | 1,351,000 | | | 2012 | | | 5,000 | |
| | 2013 & after | | | 5,482,000 | | | 2013 & after | | | 16,000 | |
| | Total | | $ | 12,285,000 | | | Total | | $ | 45,000 | |
Patent pending costs will be amortized beginning the month the patents are granted.
| | Impairment of Goodwill -As a result of the Company’s annual goodwill impairment evaluation, goodwill recorded from the 2003 Texas Optoelectronics Inc. acquisition of approximately $1.4 million was reduced $140,000 in FY 2007 and $814,000 in FY 2006, based on the net present value of the estimated future cash flow as a result of the acquisition. |
| 5. | Line of Credit/Short Term Debt |
On March 6, 2007, the Company and Fifth Third entered into a Revolving Line of Credit (the Loan Agreement) providing for borrowings of up to a maximum of $2,000,000. The availability under the facility will be determined by the calculation of a borrowing base that includes a percentage of eligible accounts receivable and inventory.
The Loan Agreement contains customary representations, warranties and financial covenants. The interest rate is variable and is adjusted quarterly. The maximum interest rate will equal the prime rate. The principal loan amounts are due on March 6, 2008.
The Loan Agreement is guaranteed by each of API’s wholly-owned subsidiaries and the loan is secured by a Security Agreement among API, its Subsidiaries and Fifth Third, pursuant to which API and its subsidiaries granted to Fifth Third a first-priority security interest in certain described assets. On March 8, 2007, API drew down $741,000 under the Loan Agreement to pay off prior indebtedness.
| 6. | Long-Term Debt and Notes Payable |
In October 2004, the Company entered into a definitive agreement for the private placement to four institutional investors of $5 million aggregate principal amount of its senior convertible notes. The original Securities Purchase Agreement was filed with the Securities and Exchange Commission on October 12, 2004. The notes are convertible at the option of the holder under certain circumstances into shares of the Company’s Class A Common Stock at an initial conversion price of $1.9393 per share, subject to adjustment. The notes pay interest at an annual rate of prime plus 1% and will mature on October 12, 2007.
In connection with the transaction, the Company had issued to the investors five-year warrants to purchase 850,822 shares of the Company’s Class A Common Stock at an exercise price of $2.1156 per share, subject to adjustment. The Company has agreed to register the shares of common stock issuable upon conversion of the notes and upon exercise of the warrants for resale under the Securities Act of 1933. The investors have the option for a period of one year following effectiveness of the registration statement to acquire an additional $5 million aggregate principal amount of the notes with an initial conversion price of $2.1156 per share and five-year warrants purchasing an additional 850,822 shares of common stock. The original terms of the warrants issued and, the additional warrants to be issued, in the private placement to the investors were also modified on March 9, 2005 to reduce the exercise price from $2.1156 per share of Class A Common Stock of API to $1.78 per share. Similarly, on March 9, 2005, the terms of the notes issued in connection with the private placement (the Notes) were modified to (i) provide that the interest rate shall not be less than 6.5% at any time, (ii) increase the amount of “Permitted Indebtedness” (as such term is defined in the Notes) from $3 million to $6 million and (iii) decrease the amount of “Permitted Acquisition Indebtedness” (as such term is defined in the Notes) from $6 million to $3 million. In addition, the investors in the private placement agreed to subordinate, pursuant to a form of subordination agreement in form and substance reasonable satisfactory to them, (i) the principal and interest payments on the Notes to the “Permitted Bank Debt” (as such term is defined in the letters of agreement) and (ii) their liens on the Company’s assets to any lien granted by the Company as security for the “Permitted Bank Debt”.
In accordance with APB 14, the Company has recorded a discount to the note of $1,344,000 to account for the fair value associated with the note’s detachable warrants. Upon any exercise of the conversion feature, the notes will then be converted from debt to equity. A copy of the original agreement and all related documents were filed with the Securities and Exchange Commission on October 12, 2004 on Form 8-K, and the foregoing summary is qualified in its entirety by reference thereto.
During FY 2006, $3.475 million of the $5 million Convertible debt (Convertible Debt 1st Tranche) was converted into 1,792,000 shares leaving a Convertible Debt 1st Tranche balance of $1,439,000 (net of discount) at March 31, 2007. In addition, 170,164 of the warrants were converted and the Company received $299,490 in cash. At March 31, 2007, the balance of unexercised warrants was 680,658.
In September 2005, the Company issued $1.0 million of convertible debt with warrants to purchase 170,164 shares of common stock (Convertible Debt 2nd Tranche). The Company originally valued the warrants and recorded an increase to additional paid-in-capital amounting to $27,000. Subsequently, the Company determined that the beneficial conversion option and the warrants should have been valued using the “Intrinsic Value” approach. Accordingly, the Company recognized a $1.0 million debt discount on the $1.0 million principal value of the convertible note payable and the debt discount is amortized over the life of the note. The note was converted in November 2005 into 472,678 shares of Class A Common Stock. In addition, 85,082 of the warrants were converted and the Company received $151,446 in cash. At March 31, 2007, the balance of unexercised warrants was 85,082.
In March 2006, the Company issued $4.0 million of convertible debt (Convertible Debt 2nd Tranche) with warrants to purchase 680,658 shares of common stock. The Company originally valued the warrants and recorded an increase to additional-paid-in- capital mounting to $1.8 million. Subsequently, the Company determined that the beneficial conversion options and warrants should have been valued using the “Intrinsic Value” approach. Accordingly, the Company recognized a $2.7 million debt discount on the $4.0 million principal value of the convertible note payable and is amortizing the debt discount to interest expense over the life of the note. At March 31, 2007, the Convertible Debt 2nd Tranche was $2,722,000 (net of the debt discount).
In May 2005, the Company borrowed $2.7 million from a regional bank. Scheduled repayments were principal of $75,000 per month, plus interest, until maturity on May 2, 2008. This loan was paid in full in March 2007.
The MEDC entered into two loan agreements with Picometrix LLC, one in fiscal 2004 (MEDC-loan 1) and one in fiscal 2005 (MEDC-loan 2). Both loans are unsecured.
MEDC-loan 1 is for an amount up to $1.024 million with an interest rate of 7% and is fully amortized by the end of an eight year period (ending on September 15, 2012). Interest accrued, but unpaid in the 1st four years of this agreement will be added to the then outstanding principal of this Note. In October 2008, interest will begin to accrue on the restated principal. Commencing in October 2008, the Company will pay MEDC the restated principal and accrued interest on any unpaid balance over the remaining four years. In September 2004, the Company borrowed $750,000 against the $1.0 million. On February 1, 2007, the Company borrowed an additional $172,000.
MEDC-loan 2 is for an amount up to $1.2 million with an interest rate of 7% and is fully amortized by the end of a six year period (ending on September 15, 2011). Interest accrued, but unpaid in the 1st two years of this agreement will be added to the then outstanding principal of this Note. During the third year of this agreement, the Company will pay interest on the restated principal of the Note. Commencing in October 2008, the Company will pay MEDC the restated principal and accrued interest on any unpaid balance over the remaining three years. In September 2005 the Company borrowed $600,000 against the $1.2 million.
As a result of the acquisition of Picotronix, Inc. (dba Picometrix, Inc.), the Company issued promissory notes to the stockholders of Picometrix, (Debt to Related Parties). The notes are payable in annual installments of varying amounts through May 2009. The notes bear interest at a rate of prime plus 1.0% and are secured by all of the intellectual property of Picometrix. API has the option of prepaying the notes without penalty.
In March, 2007, API, as Lessee, entered into a Master Equipment Lease Agreement with Fifth Third Leasing Company, as Lessor, to finance the purchase of new manufacturing equipment up to an aggregate of $2,300,000 (Lease). API may purchase equipment under the Lease until June 30, 2007. The Lease will have a term expiring 60-months following the completion of all permitted purchases or June 30, 2007 whichever is earlier (the Lease Date). The interest rate for the interim period prior to the Lease Date is a variable rate based on the prime rate plus 12.5%. On the Lease Date, the Lessee has the option to fix the interest rate based on the interest swap rate then in effect plus 300 basis points, or to elect to continue to use the variable interest rate of prime plus 12.5%. API’s obligations under the Lease are secured by a first priority security interest in the purchased equipment and are guaranteed by API’s subsidiaries.
The Lease contains standard contract provisions regarding the Lessee's obligations to make payment, to maintain the equipment and to keep it insured and events constituting a default under the Lease. The Lease further provides that if no event of default exists at the end of the Lease term, the Company has the option to purchase the Equipment for $1.00. This lease has been accounted for as a capital lease in accordance with SFAS No. 13. The balance on this loan at March 31, 2007 was $1,867,000.
Debt Maturity Table (in 000’s)
| | Balance 3/31/07 | FY2008 | FY2009 | FY2010 | FY2011 | FY2012 | FY2013 & Beyond |
| Bank Term Loan -Fifth Third Bank | $1,867 | $280 | $373 | $373 | $373 | $373 | $95 |
| Credit Line - Fifth Third Bank | 741 | 741 | | | | | |
MEDC --- loan 1 | 750 | -- | 93 | 188 | 188 | 188 | 93 |
| MEDC - loan 2 | 600 | 75 | 150 | 150 | 150 | 75 | -- |
| MEDC - loan 3 | 172 | -- | 21 | 43 | 43 | 43 | 22 |
Convertible Debt 1st Tranche | 1,525 | 1,525 | | | | | |
| Discount on convertible note 1st | (86) | (86) | | | | | |
Convertible Debt 2nd Tranche | 4,000 | 4,000 | | | | | |
| Discount on convertible notes 2nd | (1,278) | (1,278) | | | | | |
| Debt to Related Parties | 2,401 | 550 | 900 | 951 | | | |
TOTAL | $10,692 | $5,807 | $1,537 | $1,705 | $754 | $679 | $210 |
The Company’s Certificate of Incorporation provides for two classes of common stock, a Class A for which 50,000,000 shares are authorized for issuance and a Class B for which 4,420,113 shares are authorized for issuance. The par value of each class is $.001. Subject to certain limited exceptions, shares of Class B Common Stock are automatically converted into an equivalent number of Class A shares upon the sale or transfer of the Class B Common Stock by the original holder. The holder of each share of Class A and Class B Common Stock is entitled to one vote per share.
The Company has authorized 10,000,000 shares of Preferred Stock, of which 780,000 shares have been designated Class A Redeemable Convertible Preferred Stock with a par value of $.001 per share. 40,000 shares of Class A Redeemable Convertible Preferred Stock (Class A Preferred) were issued and outstanding at March 31, 2007 and 2006. The Class A Preferred Stock has a liquidation preference equal to its issue price ($.80 per share) and is convertible at any time, at the option of the holder, into .3 shares of Class B Common Stock for each share of Class A Preferred Stock converted. The Class A Preferred Stock is subject to redemption at the Company’s option for $.80 per share at any time. The Company would be required to pay approximately $32,000 to redeem these shares. The holders of the Class A Preferred Stock are entitled to an annual non-cumulative dividend preference of $.072 per share when the Company’s net earnings per share of Class A Preferred Stock equal or exceed $.072. The Class A Preferred stockholders do not have voting rights except as required by applicable law.
| 8. | Stock Options and Warrants |
The Company has four stock option plans: The 1990 Incentive Stock Option and Non-Qualified Stock Option Plan, the 1991 Directors’ Stock Option Plan (The Directors’ Plan), the 1997 Employee Stock Option Plan and the 2000 Stock Option Plan. Compensation expense related to the grant of options in FY 2007 was $361,000.
The Company’s various stock option plans provide for the granting of non-qualified and incentive stock options to purchase up to 3,700,000 shares of common stock for periods not to exceed 10 years. Options typically vest at the rate of 25% per year over four years, except for options granted under The Directors’ Plan, which typically vest at the rate of 50% per year over two years. Under these plans, the option exercise price equals the stock’s market price on the date of grant. Options may be granted to employees, officers, directors and consultants. The Company has also granted options, under similar terms as above, under no specific shareholder approved plan.
Compensation expense related to the grant of options in FY 2007 was $361,000. The total unrecognized compensation expense for unvested share-based compensation awards outstanding at March 31, 2007 amounted to $339,000, which is expected to be recognized over the subsequent fiscal three years.
Stock option transactions for fiscal years 2005, 2006 and 2007 are summarized as follows:
| | | Shares (000) | | Weight Average Exercise Price | |
| Outstanding, March 28, 2004 | | | 1,961 | | $ | 1.39 | |
| Granted | | | 401 | | $ | 1.88 | |
| Exercised | | | (2 | ) | $ | 0.65 | |
| Expired | | | (5 | ) | $ | 1.86 | |
| Outstanding, March 27, 2005 | | | 2,355 | | $ | 1.47 | |
| Exercisable, March 27, 2005 | | | 1,776 | | $ | 1.48 | |
| | | | | | | | |
| Outstanding, March 27, 2005 | | | 2,355 | | $ | 1.47 | |
| Granted | | | 926 | | $ | 2.23 | |
| Exercised | | | (267 | ) | $ | 1.08 | |
| Expired | | | -- | | | -- | |
| Outstanding, March 31, 2006 | | | 3,014 | | $ | 1.74 | |
| Exercisable, March 31, 2006 | | | 2,025 | | $ | 1.64 | |
| | | | | | | | |
| Outstanding, March 31, 2006 | | | 3,014 | | $ | 1.74 | |
| Granted | | | 90 | | $ | 2.81 | |
| Exercised | | | (341 | ) | $ | 1.04 | |
| Expired | | | (223 | ) | $ | 1.74 | |
| Outstanding, March 31, 2007 | | | 2,540 | | $ | 1.90 | |
| Exercisable, March 31, 2007 | | | 1,978 | | $ | 1.81 | |
Information regarding stock options outstanding as of March 31, 2007 is as follows:
| | | | | Options Outstanding | |
| | | (in 000s) | | Weighted Average | | Weighted Average | |
| Price Range | | Shares | | Exercise Price | | Remaining Life | |
| | | | | | | | |
| $0.50 - $1.25 | | | 911 | | $ | 0.77 | | | 1.96 | |
| $1.50 - $2.50 | | | 913 | | $ | 2.01 | | | 7.71 | |
| $2.87 - $5.34 | | | 716 | | $ | 3.18 | | | 6.88 | |
| | | | | Options Exercisable | |
| | | (in 000s) | | Weighted Average | | Weighted Average | |
| Price Range | | Shares | | Exercise Price | | Remaining Life | |
| $0.50 - $1.25 | | | 881 | | $ | 0.76 | | | 1.93 | |
| $1.50 - $2.50 | | | 538 | | $ | 1.99 | | | 7.54 | |
| $2.87 - $5.34 | | | 559 | | $ | 3.27 | | | 5.77 | |
Warrants Outstanding & Exercisable
(in 000s) Shares | Exercise Price | Remaining Life (in yrs) |
| 681 | $1.78 | 3.7 |
| 766 | $1.78 | 4.5 |
The fair value of each option grant is estimated on the date of grant using the Black-Scholes option pricing model with the following weighted-average assumptions used for grants in 2007: risk-free interest rate of 4.6% - 5.0%, expected volatility of 52.9% - 58.0% and expected lives of 10 years in all periods. No dividends were assumed in the calculations.
| | In FY 2007, 2006 and 2005, the Company had export sales of approximately $4.4 million, $2.1 million and $2.5 million, respectively, made primarily to customers in North America, Asia and Europe. All foreign sales are denominated in U.S. dollars. Sales to specific countries, stated as a percentage of total sales, consist of the following: |
| | | 2007 | | 2006 | | 2005 | |
| Australia | | | -- | | | 1 | % | | -- | |
| Canada | | | 1 | % | | -- | | | 2 | % |
| Germany | | | 10 | % | | -- | | | -- | |
| Hong Kong | | | 1 | % | | -- | | | -- | |
| Israel | | | 1 | % | | -- | | | -- | |
| Japan | | | 1 | % | | -- | | | 2 | % |
| Spain | | | -- | | | -- | | | 5 | % |
| United Kingdom | | | 4 | % | | 4 | % | | 2 | % |
| All other countries | | | 1 | % | | 4 | % | | 6 | % |
| Total export sales | | | 19 | % | | 9 | % | | 17 | % |
| 10. | Employees’ Retirement Plan |
The Company maintains a 401(k) Plan which is qualified under the Internal Revenue Code. All full-time employees are eligible to participate in the Plan. Employees may make voluntary contributions to the Plan, which is matched by the Company at the rate of $1.00 for every $1.00 of employee contribution up to 3% of wages, and $.50 for every $1.00 of employee contributions on the next 2% of wages, subject to certain limitations. Employer contributions are fully vested when earned. The Company contributions and administration costs recognized as expense were approximately $255,000, $181,000 and $62,000 in FY 2007, 2006 and 2005, respectively.
At March 31, 2007, the Company had net operating loss carry forwards (NOL’s) of approximately $22.5 million for Federal income tax purposes and $2.5 million for state income tax purposes that expire at various dates through fiscal year 2027. The tax laws related to the utilization of loss carry forwards are complex and the amount of the Company’s loss carry forward that will ultimately be available to offset future taxable income may be subject to annual limitations under IRC Section 382 resulting from changes in the ownership of the Company’s common stock.
The tax effects of temporary differences that gave rise to significant portions of the deferred tax assets at March 31, 200 were substantially composed of the Company's net operating loss carry forwards for which the Company had made a deferred tax asset valuation allowance of $5.7 million based upon the acquisition of Picometrix, Inc. in May 2005. Based upon the FY 2007 results, the Company management has projected that the Company will generate sufficient future taxable income to utilize some of the carry-forwards that expire by 2027.
Realization of the deferred tax asset is dependent upon generating sufficient taxable income prior to expiration of any NOL’s. Although realization is not assured, management believes it is more likely than not that the recorded deferred asset will be realized. Accordingly the Company has decreased the deferred tax asset valuation allowance to $4.5 million at March 31, 2007. In addition, the Company has reduced the deferred tax asset by the deferred tax liability of $ 3.1 million from the Picometrix acquisition, the deferred tax liability of $379,000 relating to the beneficial conversion feature of the convertible debt for the year ending March 31, 2007, and the tax loss carry forward that expired in FY 2007.
The ultimate realization of deferred tax assets is dependent upon the generation of future taxable income during the periods in which those temporary differences become deductible. Management considers the scheduled reversal of deferred tax liabilities, projected future taxable income and tax planning strategies in making this assessment.
The tax provision for the year ended March 31, 2007 is composed of the Wisconsin state income tax. The tax provision for the year ended March 31, 2006 was composed of Wisconsin state income tax. The tax provision for the year ended March 27, 2005 was composed of Wisconsin state income tax and the minimum California franchise tax.
Below are reconciliations between the provisions for income taxes compared with the amounts at the United States federal statutory rate:
Years Ended | | March 31, 2007 | | March 31, 2006 | | March 27, 2005 | |
| Federal income tax at statutory rates | | | (1,898,000 | ) | | (1,173,000 | ) | | 177,000 | |
| State income taxes, net of federal benefit | | | (93,000 | ) | | (193,000 | ) | | 39,000 | |
| Expiration of NOL carry-forwards | | | 1,189,000 | | | 302,000 | | | (211,000 | ) |
| Change in valuation allowance | | | (1,189,000 | ) | | 972,000 | | | (4,749,000 | ) |
| Change in R&E credit carry-forwards | | | (13,000 | ) | | | | | | |
| Other | | | (22,000 | ) | | 66,000 | | | 10,000 | |
| Permanent items | | | 1,108,000 | | | 55,000 | | | | |
| Effective federal income tax | | | (920,000 | ) | | 28,000 | | | (4,734,000 | ) |
Deferred Tax Assets at March 31, 2007 are as follows, at a projected tax rate of 34% for federal income tax purposes and 5.61% for state income tax purposes:
| | | Federal | | State | |
| Current | | | -- | | | -- | |
| Long Term | | | 1,225,000 | | | -- | |
| | | | 1,225,000 | | | -- | |
The Company’s net deferred tax assets consist of the following components, for fiscal years 2007 and 2006:
| | | 2007 | | 2006 | |
| Sec. 263A adjustment | | | 45,000 | | | 36,000 | |
| Accrued bonus | | | 103,000 | | | -- | |
| Inventory reserve | | | 270,000 | | | 719,000 | |
| Utility accruals | | | -- | | | 7,000 | |
| Warranty reserve | | | 33,000 | | | 25,000 | |
| Accounts receivable allowance | | | 20,000 | | | 16,000 | |
| Accrued vacation | | | 51,000 | | | 90,000 | |
| Charitable contributions | | | 8,000 | | | 4,000 | |
| NOL Carryforwards | | | 7,524,000 | | | 7,870,000 | |
| Accumulated amortization | | | 305,000 | | | 163,000 | |
| Accumulated depreciation | | | (57,000 | ) | | (50,000 | ) |
| R&D credits | | | 563,000 | | | 675,000 | |
| Goodwill amortization | | | 322,000 | | | 322,000 | |
| California Mfg. credit | | | 39,000 | | | 39,000 | |
| Other | | | -- | | | 2,000 | |
| Total | | | 9,226,000 | | | 9,918,000 | |
| Valuation allowance | | | (4,533,000 | ) | | (5,722,000 | ) |
| Deferred tax liability - Picometrix acquisition | | | (3,089,000 | ) | | (3,573,000 | ) |
| Deferred tax-beneficial conversion | | | (379,000 | ) | | -- | |
| Net deferred tax asset | | | 1,225,000 | | | 623,000 | |
At March 31, 2007 the Company’s net operating loss carry forwards will expire on the following dates:
Federal | | California | |
Amount | | Expiration | | Amount | | Expiration | |
| | 2,226,072 | | | March 31, 2008 | | | 82,141 | | | March 31, 2013 | |
| | 3,816,200 | | | March 31, 2009 | | | 973,927 | | | March 31, 2014 | |
| | 1,947,320 | | | March 31, 2010 | | | 471,220 | | | March 31, 2014 | |
| | 30,267 | | | March 31, 2011 | | | 945,813 | | | March 31, 2017 | |
| | 1,548,581 | | | March 31, 2012 | | | | | | | |
| | 599,421 | | | March 31, 2013 | | | | | | | |
| | 250,133 | | | March 31, 2019 | | | | | | | |
| | 6,096,005 | | | March 31, 2020 | | | | | | | |
| | 82,471 | | | March 31, 2021 | | | | | | | |
| | 1,868,504 | | | March 31, 2022 | | | | | | | |
| | 50 | | | March 31, 2022 | | | | | | | |
| | 846,957 | | | March 31, 2023 | | | | | | | |
| | 753,118 | | | March 31, 2023 | | | | | | | |
| | 1,500 | | | March 31, 2024 | | | | | | | |
| | 1,500 | | | March 31, 2025 | | | | | | | |
| | 2,407,874 | | | March 31,2027 | | | | | | | |
$ | 22,475,973 | | | | | $ | 2,473,101 | | | | |
At March 31, 2007 the Company’s Federal R&D tax credit carry forwards will expire on the following dates:
Amount | | Expiration | |
| | 40,963 | | | March 31, 2007 | |
| | 80,385 | | | March 31, 2008 | |
| | 66,489 | | | March 31, 2009 | |
| | 17,847 | | | March 31, 2010 | |
| | 63,832 | | | March 31, 2011 | |
| | 34,245 | | | March 31, 2012 | |
| | 16,737 | | | March 31, 2018 | |
| | 168,399 | | | March 31, 2019 | |
| | 9,217 | | | March 31, 2020 | |
| | 100,338 | | | March 31, 2021 | |
| | 87,020 | | | March 31, 2022 | |
| | 99,925 | | | March 31, 2023 | |
| | 82,575 | | | March 31, 2024 | |
| | 143,990 | | | March 31, 2025 | |
| | 124,030 | | | March 31, 2026 | |
| | 125,000 | | | March 31, 2027 | |
| $ | 1,260,992 | | | | |
| 12. | Net Income (Loss) Per Share |
Calculations of Net income (loss) per share are in accordance with SFAS No. 128, “Earnings per Share”. Accordingly, basic earnings (loss) per share are computed by dividing net income (loss) by the weighted average number of shares outstanding for each year. The impact of Statement 128 on the calculation of earnings per share is as follows:
| | | 2007 | | 2006 Restated | | 2005 Restated | |
BASIC | | | | | | | | | | |
| Average Shares Outstanding | | | 19,065,000 | | | 17,477,000 | | | 13,461,000 | |
| Net Income (Loss) | | $ | (4,646,000 | ) | $ | (5,262,000 | ) | $ | 5,078,000 | |
| Basic Income (Loss) Per Share | | $ | (0.24 | ) | $ | (0.30 | ) | $ | 0.38 | |
| | | | | | | | | | | |
DILUTED | | | | | | | | | | |
| Average Shares Outstanding | | | 19,065,000 | | | 17,477,000 | | | 13.461,000 | |
| Net Effect of Shares Issuable pursuant to terms of convertible note, based on a weighted average | | | 783,000 | | | 1,476,000 | | | 1,176,000 | |
Net Effect of Dilutive Stock Options and Warrants based on the treasury stock method using average market price | | | 2,677,000 | | | 2,666,000 | | | 962,000 | |
Total Shares | | | 22,525,000 | | | 21,619,000 | | | 15,599,000 | |
Net Income (Loss), adjusted for interest expense on convertible note (net of tax) | | $ | (4,257,000 | ) | $ | (4,873,000 | ) | $ | 5,128,000 | |
| Diluted Earnings Per Share | | | anti dilutive | | | anti-dilutive | | $ | 0.33 | |
| | | | | | | | | | | |
| Average Market Price of Common Stock | | $ | 2.06 | | $ | 2.82 | | $ | 2.18 | |
| Ending Market Price of Common Stock | | $ | 1.96 | | $ | 2.71 | | $ | 2.11 | |
The following stock options granted to Company employees, directors, and former owners were excluded from the calculation of earnings per share in the financial statements because they were anti-dilutive for the periods reported:
2007 | | 2006 | | 2005 | |
| Exercise Price per Share ($) | | No. Shares Underlying Options | | Exercise Price per Share ($) | | No. Shares Underlying Options | | Exercise Price per Share ($) | | No. Shares Underlying Options | |
| | 2.1100 | | | 239,500 | | | | | | | | | | | | | |
| | 2.1600 | | | 6,000 | | | | | | | | | | | | | |
| | 2.2500 | | | 16,800 | | | | | | | | | | | | | |
| | 2.3200 | | | 58,400 | | | | | | | | | | | | | |
| | 2.6800 | | | 50,000 | | | | | | | | | | | | | |
| | 2.8700 | | | 87,500 | | | 2.8700 | | | 3,750 | | | 2.2500 | | | 35,400 | |
| | 2.8900 | | | 20,000 | | | 2.8900 | | | 10,000 | | | 2.5000 | | | 27,700 | |
| | 3.0940 | | | 1,000 | | | 3.0940 | | | 1,000 | | | 3.0940 | | | 1,000 | |
| | 3.1875 | | | 350,000 | | | 3.1875 | | | 350,000 | | | 3.1875 | | | 350,000 | |
| | 5.3440 | | | 50,000 | | | 5.3440 | | | 50,000 | | | 5.3440 | | | 50,000 | |
| | Total | | | 879,200 | | | Total | | | 414,750 | | | Total | | | 464,100 | |
| 13. | Related Party Transactions |
The Company’s only significant related party transactions relate to the payment of principal and interest on Debt to Related Parties (see Note 15). On March 31, 2007 the remaining balance on the notes was $2.4 million. The Company paid $500,000 of principal and $224,000 in interest to the note holders in FY 2007. Robin Risser and Steve Williamson, the Company’s CFO and CTO, respectively, are the note holders.
| 14. | Commitments & contingencies |
Leases - The Company leases all of its executive offices, research, marketing and manufacturing facilities under non-cancellable operating leases. At March 31, 2007, those leases consisted of approximately 95,000 square feet in three facilities. The facility located in Camarillo, California is leased through February 2009. The manufacturing facility located in Dodgeville, Wisconsin is leased through October 2011, subject to early termination by the Company upon six month’s written notice served after October 31, 2007. The facility located in Ann Arbor, Michigan is comprised of the Corporate office and the Picometrix LLC manufacturing plant and is leased through June 2010, with two five year options to renew at the current lease rate with a CPI adjuster. In addition, the Company has the right of first refusal to purchase the facility. The Company believes that its existing facilities are adequate to meet its needs for the foreseeable future. Minimum future lease payments under all non-cancellable operating leases are as follows:
| 2008 | | $ | 1,170,000 | |
| 2009 | | | 1,045,000 | |
| 2010 | | | 705,000 | |
| 2011 | | | 176,000 | |
| Total | | $ | 3,096,000 | |
| | Rent expense was approximately $1,264,000, $1,183,000 and $482,000 in FY 2007, 2006 and 2005, respectively. |
Legal - The Company is, from time to time, subject to legal and other matters in the normal course of its business. While the results of such matters cannot be predicted with certainty, management does not believe that the final outcome of any pending matters will have a material effect on the financial position and results of operations of the Company.
In accordance with the terms of the Lease agreement with Fifth Third Bank (note 6), the Company made an additional draw in the amount of $421,000 on April 30, 2007. The balance on this loan at April 30, 2007 was $2,288,000.
On June 12, 2007, API received a notice of a complaint for a patent infringement on a product that was part of the PDI acquisition from Opto Diode Corporation. The Company sold less than $30,000 of product since the acquisition and feels the complaint is without merit and is seeking to resolve this matter as quickly as possible.
| 16. | Quarterly Financial Data |
The table below lists financial information (unaudited) by quarter for each of the three fiscal years ending March 31, 2007, March 31, 2006, and March 27, 2005.
| | | First | | Second | | Third | | Fourth | | Total Year | |
2007 | | | | | | | | | | | |
| Net Sales | | $ | 5,668,000 | | $ | 5,878,000 | | $ | 5,881,000 | | $ | 6,161,000 | | $ | 23,588,000 | |
| Cost of Sales | | | 3,191,000 | | | 2,997,000 | | | 2,997,000 | | | 3,508,000 | | | 12,693,000 | |
| Gross Profit | | | 2,477,000 | | | 2,881,000 | | | 2,884,000 | | | 2,653,000 | | | 10,895,000 | |
| Research & Development Expenses | | | 969,000 | | | 1,019,000 | | | 1,005,000 | | | 1,022,000 | | | 4,015,000 | |
| Selling, General & Administrative Expenses | | | 2,243,000 | | | 2,441,000 | | | 2,214,000 | | | 3,178,000 | | | 10,076,000 | |
| Net Income (Loss) | | $ | (1,234,000 | ) | $ | (1,124,000 | ) | $ | (964,000 | ) | $ | (1,324,000 | ) | $ | (4,646,000 | ) |
| Basic Income (Loss) per Common Share | | $ | (0.07 | ) | $ | (0.06 | ) | $ | (0.05 | ) | $ | (0.07 | ) | $ | (0.24 | ) |
| Diluted Income (Loss) per Common Share | | | anti-dilutive | | | anti-dilutive | | | anti-dilutive | | | anti-dilutive | | | anti-dilutive | |
| Weighted Average Common Shares Outstanding | | | 18,980,000 | | | 19,026,000 | | | 19,089,000 | | | 19,165,000 | | | 19,065,000 | |
2006 | | | | | | | | | | | | | | | | |
| Net Sales | | $ | 5,077,000 | | $ | 5,194,000 | | $ | 6,511,000 | | $ | 6,803,000 | | $ | 23,585,000 | |
| Cost of Sales | | | 2,929,000 | | | 3,070,000 | | | 3,513,000 | | | 4,890,000 | | | 14,402,000 | |
| Gross Profit | | | 2,148,000 | | | 2,124,000 | | | 2,998,000 | | | 1,913,000 | | | 9,183,000 | |
| Research & Development Expenses | | | 452,000 | | | 795,000 | | | 836,000 | | | 936,000 | | | 3,019,000 | |
| Selling, General & Administrative Expenses | | | 1,669,000 | | | 1,969,000 | | | 1,902,000 | | | 3,151,000 | | | 8,691,000 | |
| Net Income (Loss) | | $ | (235,000 | ) | $ | (1,613,000 | ) | $ | (870,000 | ) | $ | (2,544,000 | ) | $ | (5,262,000 | ) |
| Basic Income (Loss) per Common Share | | $ | (0.02 | ) | $ | (0.09 | ) | $ | (0.05 | ) | $ | (0.13 | ) | $ | (0.30 | ) |
| Diluted Income (Loss) per Common Share | | | anti-dilutive | | | anti-dilutive | | | anti-dilutive | | | anti-dilutive | | | anti-dilutive | |
| Weighted Average Common Shares Outstanding | | | 15,133,000 | | | 17,252,000 | | | 18,563,000 | | | 18,882,000 | | | 17,477,000 | |
2005 | | | | | | | | | | | | | | | | |
| Net Sales | | $ | 3,253,000 | | $ | 3,709,000 | | $ | 3,852,000 | | $ | 3,989,000 | | $ | 14,803,000 | |
| Cost of Sales | | | 1,956,000 | | | 2,451,000 | | | 2,832,000 | | | 2,832,000 | | | 10,071,000 | |
| Gross Profit | | | 1,297,000 | | | 1,258,000 | | | 1,020,000 | | | 1,157,000 | | | 4,732,000 | |
| Research & Development Expenses | | | 42,000 | | | 37,000 | | | 33,000 | | | 34,000 | | | 146,000 | |
| Selling, General & Administrative Expenses | | | 902,000 | | | 982,000 | | | 870,000 | | | 1,166,000 | | | 3,920,000 | |
| Net Income (Loss) | | $ | 347,000 | | $ | 260,000 | | $ | (43,000 | ) | $ | 4,514,000 | | $ | 5,078,000 | |
| Basic Income (Loss) per Common Share | | $ | 0.03 | | $ | 0.02 | | $ | 0.00 | | $ | 0.33 | | $ | 0.38 | |
| Diluted Income (Loss) per Common Share | | $ | 0.02 | | $ | 0.02 | | $ | 0.00 | | $ | 0.30 | | $ | 0.33 | |
| Weighted Average Common Shares Outstanding | | | 13,431,000 | | | 13,431,000 | | | 13,437,000 | | | 13,544,000 | | | 13,461,000 | |
| 17. | Fourth Quarter Adjustments |
The Company recorded certain adjustments in the fourth quarter that related to events or transactions in earlier fiscal quarters in 2007. The following schedule summarizes the adjustments and the revised results of operations in the applicable quarters:
| | | June 30, 2006 | | September 29, 2006 | | December 29, 2006 | |
| | | | | | | | |
| Net Loss, as previously reported | | $ | (1,234,000 | ) | $ | (1,124,000 | ) | $ | (964,000 | ) |
| Fourth quarter adjustments | | | | | | | | | | |
| Adjust Stock Option Comp 123R | | | (18,000 | ) | | (20,000 | ) | | (20,000 | ) |
| WIP Inventory adjustment | | | (38,000 | ) | | (53,000 | ) | | (136,000 | ) |
| Total fourth quarter adjustments | | | (56,000 | ) | | (73,000 | ) | | (156,000 | ) |
| Net Loss, as adjusted | | $ | (1,290,000 | ) | $ | (1,197,000 | ) | $ | (1,120,000 | ) |
| | | | | | | | | | | |
| Net Loss per share, as previously reported | | $ | (0.07 | ) | $ | (0.06 | ) | $ | (0.05 | ) |
| Effect of adjustments | | $ | 0.00 | | $ | 0.00 | | $ | (0.01 | ) |
| Net Loss per share, as adjusted | | $ | (0.07 | ) | $ | (0.06 | ) | $ | (0.06 | ) |
| Item 9 | Changes in and Disagreements with Accountants on Accounting and Financial Disclosure |
None.
| Item 9A | Controls and Procedures |
Our Chief Executive Officer and Chief Financial Officer (the Certifying Officers) are responsible for establishing and maintaining disclosure controls and procedures for the Company. The Certifying Officers have designed such disclosure controls and procedures to ensure that material information is made known to them, particularly during the period in which this report was prepared. The Certifying Officers have evaluated the effectiveness of the Company's disclosure controls and procedures (as defined in Exchange Act Rule 13a-15(e) and 15d-15(e)) as of the end of the period covered by this annual report and believe that the Company's disclosure controls and procedures are effective based on the required evaluation. During the past twelve months, the Company transferred certain accounting functions to our Ann Arbor office. We will continue to review and assess future needs and responsibilities in all locations and may make future changes. We believe that these changes may have a material affect on our internal controls and procedures.
Disclosure Controls
As of the end of the period covered by this report, we carried out an evaluation, under the supervision and with the participation of our principal executive officer and principal financial officer, of the effectiveness of the design and operation of our disclosure controls and procedures (as such term is defined in Rules 13a-15(e) and 15d-15(e) under the Securities Exchange Act of 1934 (or Exchange Act)). Based on this evaluation, our principal executive officer and principal financial officer concluded that our disclosure controls and procedures are effective in alerting them in a timely manner to material information required to be disclosed in our periodic reports filed with the Securities Exchange Commission.
Changes in Internal Controls
During our most recent fiscal quarter, there has not occurred any change in our internal control over financial reporting (as such term is defined in Rules 13a-15(f) and 15d-15(f) under the Exchange Act) that has materially affected, or is reasonably likely to materially affect, our internal control over financial reporting.
None.
PART III
In accordance with General Instruction G (3), and except for certain of the information called for by Items 10 and 12 which is set forth below, the information called for by Items 10 through 13 of Part III is incorporated by reference from the Company’s definitive proxy statement (Proxy Statement) to be filed pursuant to Regulation 14A promulgated under the Securities Exchange Act of 1934 in connection with the Company’s 2007 Annual Meeting of Stockholders.
| Item 10 | Directors and Executive Officers |
Code of Ethics
The Company has adopted a Code of Ethics for Senior Financial Officers, pursuant to the Sarbanes-Oxley Act of 2002. The Code of Ethics is published on the Company's web site, www.advancedphotonix.com on the Investor Relations page. The Company will also provide a copy of the Code of Ethics to any person without charge upon his or her request. Any such request should be directed to our Secretary at 2925 Boardwalk, Ann Arbor, Michigan 48104. The Company intends to make all required disclosures concerning any amendments to or waivers from the Code of Ethics on its website.
| Item 11 | Executive Compensation |
The response to this item is incorporated by reference from the Company’s Proxy Statement.
| Item 12 | Security Ownership of Certain Beneficial Owners and Management |
The following table sets forth, as of March 31, 2007, the aggregated information pertaining to all securities authorized for issuance under the Company’s equity compensation plans:
| Plan Category | | Number of Securities to be issued upon exercise of outstanding options, warrants and rights | | Weighted-average exercise price of outstanding options, warrants and rights | | Number of securities remaining available for future issuance | |
| Equity compensation plans approved by shareholders | | | 1,977,500 | | $ | 1.81 | | | 150,000 | |
| Equity compensation plans not approved by shareholders | | | - | | | - | | | - | |
| Total | | | 1,977,500 | | $ | 1.81 | | | 150,000 | |
| Item 13 | Certain Relationships and Related Transactions |
The response to this item is incorporated by reference from the Company’s Proxy Statement.
| Item 14 | Principal Accounting Fees and Services |
The response to this item is incorporated by reference from the Company’s Proxy Statement.
PART IV
| Item 15 | Exhibits, Financial Statement Schedules |
The following is a list of the financial statements, schedules and exhibits filed herewith.
(1) Financial Statements: No financial statements have been filed with this Form 10-K other than those listed in Item 8.
(2) Financial Statement Schedules: Schedules for which provisions are made in the applicable accounting regulations of the Securities and Exchange Commission are not required under the related instructions, or are disclosed in the accompanying consolidated financial statements, or are inapplicable and, therefore, have been omitted.
(3) Exhibits:
Exhibit
| 2.1 | Stock Purchase Agreement dated December 21, 2004 between Advanced Photonix, Inc. and Photonic Detectors, Inc. - incorporated by reference to Exhibit 2.1 to the Registrant’s Form 8-K, as filed with the Securities and Exchange Commission on December 23, 2004 |
| 2.2 | Agreement and Plan of Merger between Advanced Photonix, Inc. and Michigan Acquisition Sub, LLC, Picotronix, Inc., Robin Risser and Steven Williamson, dated March 8, 2005 - incorporated by reference to Exhibit 2.1 to the Registrant’s Form 8-K, as filed with the Securities and Exchange Commission on March 14, 2005 |
| 3.1 | Certificate of Incorporation of the Registrant, as amended - incorporated by reference to Exhibit 3.1 to the Registrant's Registration Statement on Form S-1, filed with the Securities and Exchange Commission on November 23, 1990 |
| 3.1.1 | Amendment to Certificate of Incorporation of the Registrant, dated October 29, 1992-incorporated by reference to the Registrant's March 31, 1996 Annual Report on Form 10-K |
| 3.1.2 | Amendment to Certificate of Incorporation of the Registrant, dated September 9, 1992-incorporated by reference to the Registrant's March 31, 1996 Annual Report on Form 10-K |
| 3.2 | By-laws of the Registrant, as amended - incorporated by reference to Exhibit 3.(ii) to the Registrant’s Form 8-K as filed with the Securities and Exchange Commission on June 8, 2005 |
| 4.1 | Rights Agreement, by and between the Company and Continental Stock Transfer and Trust Company, as amended - incorporated by reference to Exhibit 4.1 to the Registrant’s Form 8-K filed with the Securities and Exchange Commission on February 9, 2005 |
| 10.1 | Advanced Photonix, Inc. 1991 Special Directors Stock Option Plan - incorporated by reference to Exhibit 10.9 to the Registrant's March 31, 1991 Annual Report on Form 10-K |
| 10.2 | Advanced Photonix, Inc. 1990 Incentive Stock Option and Non-Qualified Stock Option Plan - incorporated by reference to Exhibit No. 10.11 to the Registrant's Registration Statement on Form S-1, filed with the Securities and Exchange Commission on November 23, 1990 |
| 10.3 | Advanced Photonix, Inc. 1997 Employee Stock Option Plan - incorporated by reference to Exhibit 10.13 to the Registrant’s March 30, 1997 Annual Report on Form 10-K |
| 10.4 | Amendment No. 1 to 1997 Employee Stock Option Plan of Advanced Photonix, Inc. - incorporated by reference to Exhibit 10.14 to the Registrant’s December 28, 1997 Quarterly report on Form 10-Q |
| 10.5 | Advanced Photonix, Inc. 2000 Stock Option Plan, as amended - incorporated by reference to Exhibit 99.1 to the Registrant's Form 8-K, as filed with the Securities and Exchange Commission on November 19, 2004 |
| 10.9 | Lease Agreement dated February 23, 1998 between Advanced Photonix, Inc. and High Tech No. 1, Ltd. - incorporated by reference to Exhibit 10.9 to the Registrant's March 29, 1998 Annual Report on Form 10-K |
| 10.10 | Form of Indemnification Agreement provided to Directors and Principal Officers of Advanced Photonix, Inc. - incorporated by reference to Exhibit 10.15 to the Registrant’s December 28, 1997 Quarterly report on Form 10-Q |
| 10.11 | Employment Agreement dated August 21, 2002 between Advanced Photonix, Inc. and Paul D. Ludwig - incorporated by reference to Exhibit 10.1 to the Registrant’s Form 8-K as filed with the Securities and Exchange Commission on September 5, 2002 |
| 10.12 | Employment Agreement dated February 10, 2003 between Advanced Photonix, Inc. and Richard D. Kurtz - incorporated by reference to Exhibit 10.12 to the Registrant’s March 30, 2003 Annual Report on Form 10-KSB |
| 10.20 | Securities Purchase Agreement, Registration Rights Agreement, Senior Subordinated Convertible Note, Warrant to Purchase Class A Common Stock, and Additional Investment Right dated October 12, 2004 between Advanced Photonix, Inc. and private investors - incorporated by reference to Exhibits 10.13 through 10.13.4 to the Registrant’s Form 8-K, as filed with the Securities and Exchange Commission on October 12, 2004 |
| 10.20.1 | Letters of Agreement amending the Securities Purchase Agreement and Warrant to Purchase Class A Common Stock, dated March 9, 2005, between Advanced Photonix, Inc. and private investors - incorporated by reference to Exhibits 10.2 through 10.5 to the Registrant’s Form 8-K, as filed with the Securities and Exchange Commission on March 14, 2005 |
| 10.26.1 | Promissory Note between Picotronix, Inc. and Advanced Photonix, Inc., dated March 10, 2005 - incorporated by reference to Exhibit 10.1 to the Registrant’s Form 8-K, as filed with the Securities and Exchange Commission on March 14, 2005 |
| 10.26.2 | Secured Promissory Note between Advanced Photonix, Inc. and Robin Risser, dated May 2, 2005 - incorporated by reference to Exhibit 10.1 to the Registrant’s Form 8-K, as filed with the Securities and Exchange Commission on May 6, 2005 |
| 10.26.3 | Secured Promissory Note between Advanced Photonix, Inc. and Steven Williamson, dated May 2, 2005 - incorporated by reference to Exhibit 10.2 to the Registrant’s Form 8-K, as filed with the Securities and Exchange Commission on May 6, 2005 |
| 10.26.4 | Employment Agreement between Advanced Photonix, Inc. and Robin Risser, dated May 2, 2005 - incorporated by reference to Exhibit 10.3 to the Registrant’s Form 8-K, as filed with the Securities and Exchange Commission on May 6, 2005 |
| | 10.26.5 | | Employment Agreement between Advanced Photonix, Inc. and Steven Williamson, dated May 2, 2005 - incorporated by reference to Exhibit 10.4 to the Registrant’s Form 8-K, as filed with the Securities and Exchange Commission on May 6, 2005 |
| 10.27 | Loan Agreement between Advanced Photonix, Inc. and Fifth Third Bank, dated March 6, 2007 - incorporated by reference to Exhibit 10.1 to the Registrant’s Form 8-K, as filed with the Securities and Exchange Commission on March 9, 2007. |
| 10.27.1 | Promissory Note by Advanced Photonix, Inc. in favor of Fifth Third Bank, for $2,000,000 dated March 6, 2007 - incorporated by reference to Exhibit 10.2 to the Registrant’s Form 8-K, as filed with the Securities and Exchange Commission on March 9, 2007 |
| 10.27.2 | Security Agreement among Advanced Photonix, Inc., Silicon Sensors, Inc., Picometrix, LLC, and Fifth Third Bank - incorporated by reference to Exhibit 10.3 to the Registrant’s Form 8-K, as filed with the Securities and Exchange Commission on March 9, 2007 |
| 10.27.3 | Master Equipment Lease Agreement between Advanced Photonix, Inc. and Fifth Third Leasing Company dated March 6, 2007 - incorporated by reference to Exhibit 10.4 to the Registrant’s Form 8-K, as filed with the Securities and Exchange Commission on March 9, 2007 |
| 10.27.4 | Interim Funding Schedule between Advanced Photonix and Fifth Third Leasing Company - incorporated by reference to Exhibit 10.5 to the Registrant’s Form 8-K, as filed with the Securities and Exchange Commission on March 9, 2007 |
| 21.1 | List of Subsidiaries of Registrant - incorporated by reference to Exhibit 21.1 to the Registrant’s March 30, 2003 Annual Report on Form 10-KSB |
| | 31.1 | Certification of the Registrant’s Chairman, Chief Executive Officer and Director pursuant to Section 302 of the Sarbanes-Oxley Act of 2002 |
| | 31.2 | Certification of the Registrant’s Chairman, Chief Financial Officer and Director pursuant to Section 302 of the Sarbanes-Oxley Act of 2002 |
| | 32.1 | Certification pursuant to 18 U.S.C. Section 1350, as adopted pursuant to Section 906 of the Sarbanes-Oxley Act of 2002 |
| 32.2 | Certification pursuant to 18 U.S.C. Section 1350, as adopted pursuant to Section 906 of the Sarbanes-Oxley Act of 2002 |
SIGNATURES
Pursuant to the requirements of Section 13 or 15(d) of the Securities Exchange Act of 1934, the Registrant has duly caused this report to be signed on its behalf by the undersigned, thereunto duly authorized.
| | | |
| ADVANCED PHOTONIX, INC. | |
|
|
|
| | By: | /s/ Richard Kurtz |
| | Chief Executive Officer& President |
| | |
Date: June 29, 2007
Pursuant to the requirements of the Securities Exchange Act of 1934, this report has been signed below by the following persons on behalf of the Registrant in the capacities and on the dates indicated.
| Signature | | Title | | Date |
| | | | | |
| | | | | |
| /s/ Richard D. Kurtz | | Chairman of the Board, President, and | | June 29, 2007 |
| Richard D. Kurtz | | Chief Executive Officer | | |
| | | | | |
| s/ Robin Risser | | Chief Financial Office and Director | | June 29, 2007 |
| Robin Risser | | | | |
| | | | | |
| | | | | |
| /s/ M. Scott Farese | | Director | | June 29, 2007 |
| M. Scott Farese | | | | |
| | | | | |
| | | | | |
| /s/ Lance Brewer | | Director | | June 29, 2007 |
| Lance Brewer | | | | |
| | | | | |
| | | | | |
| /s/ Donald Pastor | | Director | | June 29, 2007 |
| Donald Pastor | | | | |
| | | | | |
| | | | | |
| /s/ Stephen P. Soltwedel | | Director | | June 29, 2007 |
| Stephen P. Soltwedel | | | | |