UNITED STATES
SECURITIES AND EXCHANGE COMMISSION
Washington, D.C. 20549
FORM N-CSR
CERTIFIED SHAREHOLDER REPORT OF REGISTERED MANAGEMENT
INVESTMENT COMPANIES
Investment Company Act File Number 811-06260
Quaker Investment Trust
(Exact name of Registrant as specified in charter)
261 North University Drive
Suite 520
Ft. Lauderdale, FL 33324
(Address of principal executive offices) (Zip code)
Alyssa D. Greenspan
Quaker Investment Trust
261 North University Drive, Suite 520
Ft. Lauderdale, FL 33324
(Name and address of agent for service)
Registrant’s telephone number, including area code: 1-888-272-0007
Date of fiscal year end: June 30, 2025
Date of reporting period: December 31, 2024
Item 1. Report to Stockholders.
| (a) | A copy of the report transmitted to stockholders pursuant to Rule 30e-1 under the Investment Company Act of 1940, as amended (the “Act”) (17 CFR § 270.30e-1), is attached hereto. |
Quaker Investment Trust - OWNS
CCM Affordable Housing MBS ETF
Principal Listing Exchange: NYSE Arca, Inc.
Semi-Annual Shareholder Report: December 31, 2024
This semi-annual shareholder report contains important information about the CCM Affordable Housing MBS ETF (the "Fund") for the period from July 1, 2024 to December 31, 2024. You can find additional information about the Fund at https://www.ccminvests.com/affordable-housing-mbs-etf-owns. You can also request this information by contacting us at 888-272-0007.
What were the Fund costs for the last six months?
(based on a hypothetical $10,000 investment)
| Fund Name | Costs of a $10,000 investment | Costs paid as a percentage of a $10,000 investment |
|---|
| CCM Affordable Housing MBS ETF | $15 | 0.30% |
|---|
Key Fund Statistics as of December 31, 2024
| Total Net Assets | Number of Portfolio Holdings | Total Advisory Fees Paid | Portfolio Turnover Rate |
|---|
| $125,451,670 | 234 | $187,374 | 12% |
|---|
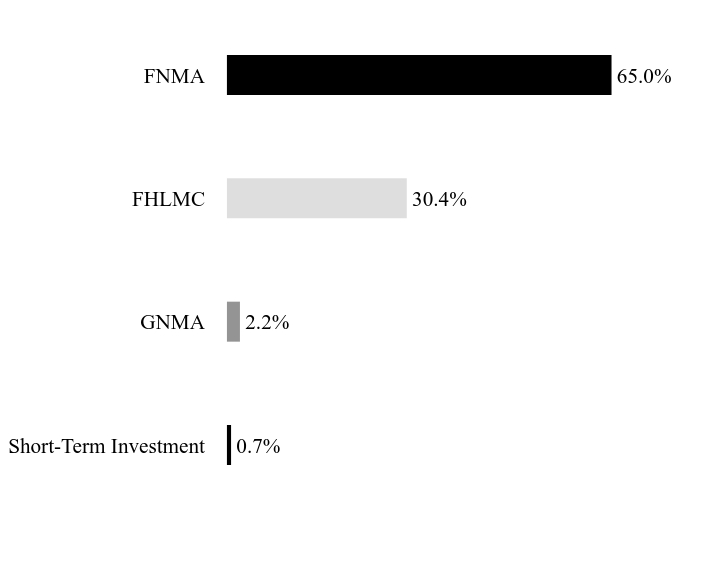
What did the Fund invest in?
Sector WeightingsFootnote Reference*
| Value | Value |
|---|
| Short-Term Investment | 0.7% |
| GNMA | 2.2% |
| FHLMC | 30.4% |
| FNMA | 65.0% |
| Footnote | Description |
Footnote* | Percentages are calculated based on total net assets. |
| Holding Name | | | Percentage of Total Net AssetsFootnote Reference(A) |
|---|
| FHLMC, 3.00%, 8/1/2052 | | | 6.7% |
| FNMA, 2.50%, 12/1/2051 | | | 4.7% |
| FNMA, 2.00%, 9/1/2051 | | | 3.0% |
| FHLMC, 2.00%, 1/1/2052 | | | 2.4% |
| FNMA, 4.50%, 9/1/2053 | | | 2.2% |
| FNMA, 3.50%, 5/1/2052 | | | 2.0% |
| FNMA, 2.50%, 8/1/2051 | | | 1.9% |
| FNMA, 2.00%, 2/1/2052 | | | 1.8% |
| FNMA, 5.00%, 12/1/2053 | | | 1.8% |
| FNMA, 5.00%, 11/1/2053 | | | 1.6% |
| Footnote | Description |
Footnote(A) | Short-Term Investments are not shown in the top ten chart. |
For additional information about the Fund, including its prospectus, financial information, holdings, and proxy voting information, call or visit:
Rule 30e-1 of the Investment Company Act of 1940 permits funds to transmit only one copy of a proxy statement, annual report or semi-annual report to shareholders (who need not be related) with the same residential, commercial or electronic address, provided that the shareholders have consented in writing and the reports are addressed either to each shareholder individually or to the shareholders as a group. This process is known as “householding” and is designed to reduce the duplicate copies of materials that shareholders receive and to lower printing and mailing costs for funds. Once implemented, if you would like to discontinue householding for your accounts, please call toll-free at 888-272-0007 to request individual copies of these documents. Once the Fund receives notice to stop householding, we will begin sending individual copies 30 days after receiving your request.
Item 2. Code of Ethics.
Not applicable for semi-annual report.
Item 3. Audit Committee Financial Expert.
Not applicable for semi-annual report.
Item 4. Principal Accountant Fees and Services.
Not applicable for semi-annual report.
Item 5. Audit Committee of Listed Registrants.
Not applicable.
Item 6. Investments.
(a) The Schedule of Investments is included as part of the Financial Statements and Other Information filed under Item 7 of this form.
(b) Not applicable.
Item 7. Financial Statements and Financial Highlights for Open-End Management Investment Companies.
Financial Statements and Financial Highlights are filed herein.
TABLE OF CONTENTS
| Financial Statements (Form N-CSRS Item 7) | |
| Schedule of Investments | 2 |
| Statement of Assets and Liabilities | 7 |
| Statement of Operations | 8 |
| Statements of Changes in Net Assets | 9 |
| Financial Highlights | 10 |
| Notes to Financial Statements | 12 |
| Other Information (Form N-CSRS Items 8-11) (Unaudited) | 31 |

| 2 | CCM Affordable Housing MBS ETF |
Schedule of Investments December 31, 2024
| | | Principal
Amount | | | Value | |
| MORTGAGE-BACKED SECURITIES - 97.55% | | | | | | | | |
| Agency Mortgage-Backed Obligations - 97.55% | | | | | | | | |
| FHLMC - 30.42% | | | | | | | | |
| 7.00%, 11/01/2053 | | $ | 170,696 | | | $ | 178,743 | |
| 6.50%, 11/01/2053 | | | 449,098 | | | | 465,990 | |
| 6.50%, 12/01/2053 | | | 524,595 | | | | 537,811 | |
| 6.50%, 02/01/2054 | | | 248,867 | | | | 254,032 | |
| 6.50%, 08/01/2054 | | | 315,112 | | | | 321,796 | |
| 6.00%, 11/01/2052 | | | 298,666 | | | | 301,280 | |
| 6.00%, 01/01/2053 | | | 179,325 | | | | 181,093 | |
| 6.00%, 02/01/2053 | | | 57,006 | | | | 57,501 | |
| 6.00%, 04/01/2053 | | | 72,066 | | | | 72,688 | |
| 6.00%, 06/01/2053 | | | 151,385 | | | | 153,626 | |
| 6.00%, 11/01/2053 | | | 319,968 | | | | 324,706 | |
| 6.00%, 11/01/2053 | | | 850,775 | | | | 855,059 | |
| 6.00%, 12/01/2053 | | | 193,537 | | | | 195,565 | |
| 6.00%, 08/01/2054 | | | 94,513 | | | | 94,980 | |
| 5.50%, 11/01/2052 | | | 82,766 | | | | 82,306 | |
| 5.50%, 01/01/2053 | | | 151,400 | | | | 151,449 | |
| 5.50%, 03/01/2053 | | | 134,857 | | | | 133,686 | |
| 5.50%, 05/01/2053 | | | 151,241 | | | | 149,686 | |
| 5.50%, 06/01/2053 | | | 131,064 | | | | 130,237 | |
| 5.50%, 09/01/2053 | | | 169,734 | | | | 168,881 | |
| 5.50%, 11/01/2053 | | | 324,704 | | | | 320,965 | |
| 5.50%, 12/01/2053 | | | 596,202 | | | | 588,763 | |
| 5.50%, 07/01/2054 | | | 635,692 | | | | 627,531 | |
| 5.50%, 11/01/2054 | | | 605,523 | | | | 597,748 | |
| 5.50%, 12/01/2054 | | | 226,007 | | | | 223,103 | |
| 5.00%, 01/01/2053 | | | 354,256 | | | | 344,404 | |
| 5.00%, 02/01/2053 | | | 356,635 | | | | 344,713 | |
| 5.00%, 04/01/2053 | | | 97,301 | | | | 94,942 | |
| 5.00%, 04/01/2053 | | | 200,810 | | | | 194,944 | |
| 5.00%, 05/01/2053 | | | 267,178 | | | | 258,456 | |
| 5.00%, 09/01/2053 | | | 148,781 | | | | 144,642 | |
| 5.00%, 09/01/2054 | | | 99,473 | | | | 96,172 | |
| 5.00%, 11/01/2054 | | | 677,955 | | | | 654,559 | |
| 4.50%, 09/01/2052 | | | 391,018 | | | | 368,571 | |
| 4.50%, 11/01/2052 | | | 431,174 | | | | 406,423 | |
| 4.50%, 12/01/2052 | | | 242,042 | | | | 228,355 | |
| 4.50%, 04/01/2053 | | | 95,576 | | | | 90,074 | |
| 4.50%, 05/01/2053 | | | 113,147 | | | | 107,030 | |
| 4.50%, 11/01/2054 | | | 239,454 | | | | 225,266 | |
| 4.00%, 10/01/2037 | | | 207,458 | | | | 199,226 | |
| 4.00%, 05/01/2052 | | | 95,819 | | | | 88,038 | |
| 4.00%, 09/01/2052 | | | 151,302 | | | | 139,046 | |
| 4.00%, 11/01/2052 | | | 131,004 | | | | 120,232 | |
| 3.50%, 04/01/2052 | | | 605,420 | | | | 536,501 | |
| 3.50%, 04/01/2052 | | | 50,790 | | | | 45,427 | |
| 3.50%, 05/01/2052 | | | 420,528 | | | | 372,604 | |
| 3.50%, 05/01/2052 | | | 873,362 | | | | 774,053 | |
| 3.00%, 09/01/2034 | | | 389,789 | | | | 366,152 | |
| 3.00%, 10/01/2037 | | | 373,988 | | | | 348,010 | |
| 3.00%, 11/01/2037 | | | 80,910 | | | | 75,289 | |
The accompanying notes are an integral part of the financial statements.
| | | Principal
Amount | | | Value | |
| MORTGAGE-BACKED SECURITIES — continued | | | | | | | | |
| 3.00%, 03/01/2052 | | $ | 114,298 | | | $ | 97,584 | |
| 3.00%, 04/01/2052 | | | 315,043 | | | | 268,945 | |
| 3.00%, 04/01/2052 | | | 324,044 | | | | 277,063 | |
| 3.00%, 04/01/2052 | | | 169,621 | | | | 144,419 | |
| 3.00%, 05/01/2052 | | | 120,893 | | | | 104,050 | |
| 3.00%, 08/01/2052 | | | 9,810,033 | | | | 8,365,617 | |
| 2.50%, 08/01/2051 | | | 1,639,977 | | | | 1,352,946 | |
| 2.50%, 09/01/2051 | | | 702,130 | | | | 579,077 | |
| 2.50%, 10/01/2051 | | | 439,324 | | | | 362,854 | |
| 2.50%, 10/01/2051 | | | 69,407 | | | | 57,321 | |
| 2.50%, 11/01/2051 | | | 523,136 | | | | 431,158 | |
| 2.50%, 12/01/2051 | | | 599,000 | | | | 490,129 | |
| 2.50%, 02/01/2052 | | | 128,812 | | | | 106,216 | |
| 2.00%, 08/01/2036 | | | 913,083 | | | | 809,430 | |
| 2.00%, 09/01/2036 | | | 700,725 | | | | 620,771 | |
| 2.00%, 11/01/2036 | | | 489,534 | | | | 435,919 | |
| 2.00%, 08/01/2051 | | | 1,788,585 | | | | 1,408,028 | |
| 2.00%, 09/01/2051 | | | 2,313,760 | | | | 1,821,472 | |
| 2.00%, 09/01/2051 | | | 286,407 | | | | 224,319 | |
| 2.00%, 10/01/2051 | | | 470,098 | | | | 371,975 | |
| 2.00%, 10/01/2051 | | | 583,187 | | | | 455,655 | |
| 2.00%, 10/01/2051 | | | 1,210,756 | | | | 954,881 | |
| 2.00%, 11/01/2051 | | | 480,220 | | | | 378,405 | |
| 2.00%, 12/01/2051 | | | 336,653 | | | | 267,000 | |
| 2.00%, 12/01/2051 | | | 927,002 | | | | 725,866 | |
| 2.00%, 01/01/2052 | | | 3,779,568 | | | | 2,952,169 | |
| 1.50%, 08/01/2036 | | | 348,713 | | | | 299,968 | |
| FNMA - 64.91% | | | | | | | | |
| 7.50%, 12/01/2053 | | | 141,304 | | | | 149,664 | |
| 7.00%, 11/01/2053 | | | 43,456 | | | | 45,836 | |
| 7.00%, 01/01/2054 | | | 442,402 | | | | 467,223 | |
| 7.00%, 02/01/2054 | | | 75,754 | | | | 78,865 | |
| 7.00%, 05/01/2054 | | | 157,856 | | | | 164,845 | |
| 6.50%, 10/01/2053 | | | 48,557 | | | | 50,012 | |
| 6.50%, 11/01/2053 | | | 611,176 | | | | 627,806 | |
| 6.50%, 12/01/2053 | | | 712,753 | | | | 731,640 | |
| 6.50%, 05/01/2054 | | | 138,964 | | | | 142,964 | |
| 6.50%, 06/01/2054 | | | 622,205 | | | | 636,656 | |
| 6.50%, 09/01/2054 | | | 109,607 | | | | 112,398 | |
| 6.00%, 11/01/2052 | | | 87,589 | | | | 88,171 | |
| 6.00%, 02/01/2053 | | | 107,382 | | | | 108,450 | |
| 6.00%, 06/01/2053 | | | 82,028 | | | | 82,484 | |
| 6.00%, 09/01/2053 | | | 343,992 | | | | 348,762 | |
| 6.00%, 10/01/2053 | | | 204,887 | | | | 207,139 | |
| 6.00%, 10/01/2053 | | | 792,119 | | | | 796,350 | |
| 6.00%, 11/01/2053 | | | 593,374 | | | | 601,417 | |
| 6.00%, 12/01/2053 | | | 1,948,246 | | | | 1,968,665 | |
| 6.00%, 01/01/2054 | | | 879,504 | | | | 891,426 | |
| 6.00%, 03/01/2054 | | | 221,406 | | | | 223,726 | |
| 6.00%, 05/01/2054 | | | 253,310 | | | | 256,121 | |
| 6.00%, 05/01/2054 | | | 397,409 | | | | 399,375 | |
| 6.00%, 07/01/2054 | | | 256,098 | | | | 258,867 | |
| 6.00%, 08/01/2054 | | | 224,320 | | | | 225,983 | |
| 6.00%, 09/01/2054 | | | 521,802 | | | | 525,346 | |
The accompanying notes are an integral part of the financial statements.
| 4 | CCM Affordable Housing MBS ETF |
| | | Principal
Amount | | | Value | |
| MORTGAGE-BACKED SECURITIES — continued | | | | | | | | |
| 6.00%, 10/01/2054 | | $ | 463,203 | | | $ | 467,319 | |
| 5.50%, 11/01/2052 | | | 539,703 | | | | 535,812 | |
| 5.50%, 04/01/2053 | | | 115,809 | | | | 114,900 | |
| 5.50%, 06/01/2053 | | | 121,150 | | | | 120,193 | |
| 5.50%, 08/01/2053 | | | 520,518 | | | | 514,018 | |
| 5.50%, 09/01/2053 | | | 410,200 | | | | 408,774 | |
| 5.50%, 10/01/2053 | | | 974,236 | | | | 965,081 | |
| 5.50%, 10/01/2053 | | | 829,170 | | | | 821,714 | |
| 5.50%, 11/01/2053 | | | 1,739,588 | | | | 1,728,301 | |
| 5.50%, 12/01/2053 | | | 621,100 | | | | 613,339 | |
| 5.50%, 12/01/2053 | | | 1,582,174 | | | | 1,566,743 | |
| 5.50%, 04/01/2054 | | | 245,169 | | | | 242,776 | |
| 5.50%, 05/01/2054 | | | 390,174 | | | | 386,366 | |
| 5.50%, 06/01/2054 | | | 215,982 | | | | 215,083 | |
| 5.50%, 08/01/2054 | | | 92,936 | | | | 91,828 | |
| 5.50%, 09/01/2054 | | | 394,543 | | | | 390,694 | |
| 5.50%, 10/01/2054 | | | 260,375 | | | | 257,130 | |
| 5.00%, 12/01/2052 | | | 462,104 | | | | 446,945 | |
| 5.00%, 12/01/2052 | | | 198,603 | | | | 192,599 | |
| 5.00%, 01/01/2053 | | | 255,083 | | | | 246,980 | |
| 5.00%, 02/01/2053 | | | 202,885 | | | | 196,109 | |
| 5.00%, 05/01/2053 | | | 97,014 | | | | 94,011 | |
| 5.00%, 06/01/2053 | | | 118,850 | | | | 115,047 | |
| 5.00%, 10/01/2053 | | | 1,218,574 | | | | 1,176,817 | |
| 5.00%, 10/01/2053 | | | 416,187 | | | | 402,090 | |
| 5.00%, 11/01/2053 | | | 2,041,192 | | | | 1,970,776 | |
| 5.00%, 12/01/2053 | | | 2,337,867 | | | | 2,257,274 | |
| 5.00%, 05/01/2054 | | | 98,976 | | | | 95,807 | |
| 5.00%, 09/01/2054 | | | 119,443 | | | | 115,576 | |
| 5.00%, 10/01/2054 | | | 113,754 | | | | 109,829 | |
| 5.00%, 12/01/2054 | | | 162,598 | | | | 157,201 | |
| 4.50%, 11/01/2052 | | | 97,082 | | | | 91,546 | |
| 4.50%, 12/01/2052 | | | 177,252 | | | | 167,083 | |
| 4.50%, 04/01/2053 | | | 454,121 | | | | 427,457 | |
| 4.50%, 05/01/2053 | | | 118,339 | | | | 111,418 | |
| 4.50%, 06/01/2053 | | | 970,030 | | | | 913,434 | |
| 4.50%, 06/01/2053 | | | 207,312 | | | | 195,660 | |
| 4.50%, 07/01/2053 | | | 1,175,250 | | | | 1,107,333 | |
| 4.50%, 08/01/2053 | | | 79,577 | | | | 74,945 | |
| 4.50%, 09/01/2053 | | | 2,892,940 | | | | 2,722,944 | |
| 4.50%, 12/01/2054 | | | 254,905 | | | | 239,802 | |
| 4.50%, 12/01/2054 | | | 136,704 | | | | 128,613 | |
| 4.00%, 03/01/2049 | | | 5,890 | | | | 5,461 | |
| 4.00%, 07/01/2049 | | | 52,478 | | | | 48,976 | |
| 4.00%, 05/01/2052 | | | 544,639 | | | | 499,053 | |
| 4.00%, 05/01/2052 | | | 169,038 | | | | 155,167 | |
| 4.00%, 05/01/2052 | | | 157,734 | | | | 146,430 | |
| 4.00%, 05/01/2052 | | | 220,433 | | | | 204,493 | |
| 4.00%, 06/01/2052 | | | 155,010 | | | | 142,492 | |
| 4.00%, 07/01/2052 | | | 153,058 | | | | 140,825 | |
| 4.00%, 09/01/2052 | | | 662,379 | | | | 606,897 | |
| 4.00%, 11/01/2052 | | | 825,679 | | | | 755,710 | |
| 4.00%, 06/01/2053 | | | 1,656,060 | | | | 1,515,973 | |
| 4.00%, 07/01/2053 | | | 1,423,683 | | | | 1,302,518 | |
The accompanying notes are an integral part of the financial statements.
| | | Principal
Amount | | | Value | |
| MORTGAGE-BACKED SECURITIES — continued | | | | | | | | |
| 4.00%, 08/01/2053 | | $ | 967,968 | | | $ | 885,986 | |
| 4.00%, 09/01/2053 | | | 2,147,642 | | | | 1,965,303 | |
| 4.00%, 04/01/2054 | | | 269,051 | | | | 246,151 | |
| 3.50%, 06/01/2028 | | | 90,899 | | | | 89,633 | |
| 3.50%, 02/01/2035 | | | 143,333 | | | | 136,311 | |
| 3.50%, 05/01/2035 | | | 73,748 | | | | 70,222 | |
| 3.50%, 09/01/2035 | | | 79,702 | | | | 75,743 | |
| 3.50%, 09/01/2035 | | | 53,761 | | | | 52,129 | |
| 3.50%, 04/01/2052 | | | 142,062 | | | | 126,191 | |
| 3.50%, 05/01/2052 | | | 366,619 | | | | 327,958 | |
| 3.50%, 05/01/2052 | | | 236,286 | | | | 210,809 | |
| 3.50%, 05/01/2052 | | | 2,789,181 | | | | 2,471,867 | |
| 3.50%, 06/01/2052 | | | 764,556 | | | | 677,490 | |
| 3.50%, 06/01/2052 | | | 92,467 | | | | 81,976 | |
| 3.50%, 06/01/2052 | | | 242,640 | | | | 215,048 | |
| 3.50%, 10/01/2052 | | | 165,623 | | | | 146,663 | |
| 3.00%, 04/01/2025 | | | 7,991 | | | | 7,955 | |
| 3.00%, 01/01/2031 | | | 10,149 | | | | 9,811 | |
| 3.00%, 08/01/2034 | | | 128,214 | | | | 120,440 | |
| 3.00%, 07/01/2035 | | | 234,416 | | | | 220,191 | |
| 3.00%, 04/01/2037 | | | 133,995 | | | | 125,900 | |
| 3.00%, 03/01/2052 | | | 1,298,909 | | | | 1,110,129 | |
| 3.00%, 03/01/2052 | | | 157,224 | | | | 134,672 | |
| 3.00%, 04/01/2052 | | | 554,913 | | | | 473,800 | |
| 3.00%, 04/01/2052 | | | 120,775 | | | | 103,927 | |
| 3.00%, 05/01/2052 | | | 220,917 | | | | 188,999 | |
| 3.00%, 05/01/2052 | | | 201,149 | | | | 171,997 | |
| 2.50%, 05/01/2026 | | | 105,755 | | | | 104,212 | |
| 2.50%, 02/01/2031 | | | 166,612 | | | | 163,074 | |
| 2.50%, 10/01/2031 | | | 317,051 | | | | 303,254 | |
| 2.50%, 02/01/2035 | | | 241,410 | | | | 235,020 | |
| 2.50%, 08/01/2035 | | | 103,799 | | | | 95,058 | |
| 2.50%, 05/01/2036 | | | 42,705 | | | | 39,104 | |
| 2.50%, 07/01/2036 | | | 441,275 | | | | 400,822 | |
| 2.50%, 08/01/2051 | | | 2,810,716 | | | | 2,320,968 | |
| 2.50%, 08/01/2051 | | | 733,212 | | | | 607,139 | |
| 2.50%, 09/01/2051 | | | 730,212 | | | | 595,099 | |
| 2.50%, 09/01/2051 | | | 1,546,318 | | | | 1,273,324 | |
| 2.50%, 10/01/2051 | | | 647,727 | | | | 532,889 | |
| 2.50%, 11/01/2051 | | | 144,416 | | | | 118,299 | |
| 2.50%, 12/01/2051 | | | 853,181 | | | | 698,274 | |
| 2.50%, 12/01/2051 | | | 7,279,578 | | | | 5,946,197 | |
| 2.50%, 01/01/2052 | | | 116,659 | | | | 96,461 | |
| 2.50%, 02/01/2052 | | | 179,948 | | | | 148,683 | |
| 2.50%, 02/01/2052 | | | 1,032,907 | | | | 856,270 | |
| 2.50%, 02/01/2052 | | | 586,455 | | | | 481,946 | |
| 2.50%, 03/01/2052 | | | 1,502,484 | | | | 1,228,233 | |
| 2.50%, 03/01/2052 | | | 684,037 | | | | 561,336 | |
| 2.50%, 03/01/2052 | | | 172,198 | | | | 142,193 | |
| 2.00%, 04/01/2036 | | | 356,656 | | | | 316,187 | |
| 2.00%, 10/01/2036 | | | 422,294 | | | | 373,655 | |
| 2.00%, 11/01/2036 | | | 644,782 | | | | 572,268 | |
| 2.00%, 05/01/2051 | | | 840,876 | | | | 655,030 | |
| 2.00%, 08/01/2051 | | | 1,663,980 | | | | 1,309,711 | |
The accompanying notes are an integral part of the financial statements.
| 6 | CCM Affordable Housing MBS ETF |
| | | Principal
Amount | | | Value | |
| MORTGAGE-BACKED SECURITIES — continued | | | | | | | | |
| 2.00%, 09/01/2051 | | $ | 4,847,925 | | | $ | 3,811,780 | |
| 2.00%, 10/01/2051 | | | 232,448 | | | | 182,537 | |
| 2.00%, 10/01/2051 | | | 553,256 | | | | 433,110 | |
| 2.00%, 10/01/2051 | | | 2,189,063 | | | | 1,723,639 | |
| 2.00%, 10/01/2051 | | | 86,595 | | | | 68,344 | |
| 2.00%, 10/01/2051 | | | 276,878 | | | | 217,411 | |
| 2.00%, 11/01/2051 | | | 399,942 | | | | 315,358 | |
| 2.00%, 12/01/2051 | | | 709,021 | | | | 554,335 | |
| 2.00%, 12/01/2051 | | | 994,439 | | | | 782,017 | |
| 2.00%, 12/01/2051 | | | 50,117 | | | | 39,569 | |
| 2.00%, 01/01/2052 | | | 201,988 | | | | 158,069 | |
| 2.00%, 01/01/2052 | | | 105,006 | | | | 83,132 | |
| 2.00%, 02/01/2052 | | | 1,156,274 | | | | 910,351 | |
| 2.00%, 02/01/2052 | | | 2,941,221 | | | | 2,299,398 | |
| 1.50%, 10/01/2036 | | | 314,316 | | | | 271,947 | |
| 1.50%, 10/01/2036 | | | 71,989 | | | | 61,840 | |
| GNMA - 2.22% | | | | | | | | |
| 5.00%, 03/20/2050 | | | 111,309 | | | | 109,788 | |
| 4.50%, 02/20/2050 | | | 320,949 | | | | 307,528 | |
| 4.00%, 10/20/2050 | | | 115,698 | | | | 107,780 | |
| 4.00%, 01/20/2051 | | | 9,466 | | | | 8,818 | |
| 3.50%, 12/20/2050 | | | 1,537,095 | | | | 1,383,522 | |
| 2.50%, 08/20/2051 | | | 1,039,832 | | | | 865,462 | |
| | | | | | | | |
TOTAL MORTGAGE-BACKED SECURITIES (Cost $132,194,489) | | | | | | | 122,384,886 | |
| | | Shares | | | | |
| SHORT-TERM INVESTMENT - 0.70% | | | | | | | | |
| Money Market Fund - 0.70% | | | | | | |
| First American Government Obligations Fund Cl X, 4.41% (a) | | | 876,703 | | | | 876,703 | |
TOTAL SHORT-TERM INVESTMENT
(Cost $876,703) | | | | | | | 876,703 | |
| | | | | | | | | |
| Total Investments (Cost $133,071,192) - 98.25% | | | | | | $ | 123,261,589 | |
| Other Assets Exceeding Liabilities, Net - 1.75% | | | | | | | 2,190,081 | |
| NET ASSETS - 100.00% | | | | | | $ | 125,451,670 | |
| (a) | The rate shown is the 7-day effective yield as of December 31, 2024. |
FHLMC — Federal Home Loan Mortgage Corporation
FNMA — Federal National Mortgage Association
GNMA — Government National Mortgage Association
The following table sets forth information about the level within the fair value hierarchy at which the Fund’s investments are measured at December 31, 2024:
| Assets | | Level 1 | | | Level 2 | | | Level 3 | | | Total | |
| Mortgage-Backed Securities | | $ | — | | | $ | 122,384,886 | | | $ | — | | | $ | 122,384,886 | |
| Short-Term Investment | | | 876,703 | | | | — | | | | — | | | | 876,703 | |
| Total Investments in Securities | | $ | 876,703 | | | $ | 122,384,886 | | | $ | — | | | $ | 123,261,589 | |
The accompanying notes are an integral part of the financial statements.
Statement of Assets and Liabilities as of December 31, 2024
| | | CCM Affordable Housing MBS ETF | |
| Assets: | | | |
| Investments, at fair value (identified cost — $133,071,192) | | $ | 123,261,589 | |
| Cash | | | 1,864,081 | |
| Receivables: | | | | |
| Dividends and interest | | | 413,113 | |
| Due from Advisor | | | 13,713 | |
| Due from Chief Compliance Officer | | | 3,158 | |
| Prepaid expenses | | | 80,362 | |
| Total Assets | | | 125,636,016 | |
| | | | | |
| Liabilities: | | | | |
| Payables: | | | | |
| Legal fees | | | 54,968 | |
| Audit fees | | | 45,123 | |
| Trustees' fees | | | 23,396 | |
| Exchange Listing fees | | | 20,824 | |
| Custody fees | | | 20,560 | |
| Miscellaneous fees | | | 7,430 | |
| Pricing fees | | | 3,538 | |
| Administration fees | | | 2,541 | |
| Printing fees | | | 2,011 | |
| Other accrued expenses | | | 3,955 | |
| Total Liabilities | | $ | 184,346 | |
| | | | | |
| Net Assets: | | $ | 125,451,670 | |
| Net Assets consist of: | | | | |
| Paid-in capital | | $ | 142,497,105 | |
| Total distributable loss | | | (17,045,435 | ) |
| Net Assets | | $ | 125,451,670 | |
| Net Assets — (Unlimited shares of beneficial interest with no par value authorized; 7,450,000 shares outstanding) | | $ | 125,451,670 | |
| Net Asset Value, offering and redemption price per share | | $ | 16.84 | |
The accompanying notes are an integral part of the financial statements.
Statement of Operations for the six months ended December 31, 2024
| | | CCM Affordable Housing MBS ETF | |
| Investment Income: | | | |
| Interest | | $ | 2,553,798 | |
| Total investment income | | | 2,553,798 | |
| Expenses: | | | | |
| Investment advisory fees | | | 187,374 | |
| Total expenses | | | 187,374 | |
| Less: | | | | |
| Net expenses | | | 187,374 | |
| Net investment income | | | 2,366,424 | |
| Realized and unrealized gain (loss) on: | | | | |
| investments | | | (9,051 | ) |
| Net realized gain (loss) | | | (9,051 | ) |
| Unrealized appreciation (depreciation) on: | | | | |
| investments | | | 236,318 | |
| Net unrealized appreciation (depreciation) | | | 236,318 | |
| Net realized and unrealized gain (loss) | | | 227,267 | |
| Net increase in net assets resulting from operations: | | $ | 2,593,691 | |
The accompanying notes are an integral part of the financial statements.
Statements of Changes in Net Assets
| | | CCM Affordable Housing MBS ETF | |
| | | | For the Six-Month Period Ended December 31, 2024 (Unaudited) | | | | For the Fiscal Year Ended June 30, 2024(1) | | | | For the Fiscal Year Ended June 30, 2023 | |
| Operations: | | | | | | | | | | | | |
| Net investment income (loss) | | $ | 2,366,424 | | | $ | 4,054,847 | | | $ | 2,549,379 | |
| Net realized gain (loss) | | | (9,051 | ) | | | (4,634,207 | ) | | | (655,922 | ) |
| Net change in unrealized appreciation (depreciation) | | | 236,318 | | | | 2,634,428 | | | | (3,257,788 | ) |
| Net increase (decrease) in net assets resulting from operations | | | 2,593,691 | | | | 2,055,068 | | | | (1,364,331 | ) |
| Distributions | | | (2,307,747 | ) | | | (3,990,047 | ) | | | (2,915,245 | ) |
| Capital share transactions: | | | | | | | | | | | | |
| Shares issued | | | 7,729,945 | | | | 13,345,128 | | | | 26,909,850 | |
| Shares redeemed | | | — | | | | (5,041,502 | ) | | | (3,375,453 | ) |
| Increase in net assets from capital share transactions | | | 7,729,945 | | | | 8,303,626 | | | | 23,534,397 | |
| Increase in net assets | | | 8,015,889 | | | | 6,368,647 | | | | 19,254,821 | |
| Net Assets: |
| Beginning of period/year | | | 117,435,781 | | | | 111,067,134 | | | | 91,812,313 | |
| End of period/year | | $ | 125,451,670 | | | $ | 117,435,781 | | | $ | 111,067,134 | |
| Share Transactions: |
| Shares Issued | | | 450,000 | | | | 800,000 | | | | 1,550,000 | |
| Shares redeemed | | | — | | | | (300,000 | ) | | | (200,000 | ) |
| Increase in shares | | | 450,000 | | | | 500,000 | | | | 1,350,000 | |
Amount designated as "-" is $0.
| (1) | Effective as of close of business on March 18, 2024, the Impact Shares Affordable Housing MBS ETF (the "Affordable Housing Predecessor Fund") was reorganized into the CCM Affordable Housing MBS ETF. Information presented prior to March 18, 2024 is that of the Affordable Housing Predecessor Fund. See Note 1 in the Notes to Financial Statements. |
The accompanying notes are an integral part of the financial statements.
| 10 | Quaker Investment Trust |
Financial Highlights - Per share data (for a share outstanding throughout the period/year)
CCM Affordable Housing MBS ETF | | For the Period Ended December 31, 2024 (Unaudited) | | | For the Fiscal Year Ended June 30, 2024(1) | | | For the Fiscal Year Ended June 30, 2023 | | | For the Period Ended June 30, 2022(2) | |
| Net Asset Value, Beginning of Period/Year | | $ | 16.78 | | | $ | 17.09 | | | $ | 17.83 | | | $ | 20.00 | |
| Investment Operations: | | | | | | | | | | | | | | | | |
Net investment Income (loss)* | | | 0.33 | | | | 0.59 | | | | 0.44 | | | | 0.14 | |
| Net realized and unrealized gain (loss) | | | 0.05 | | | | (0.32 | ) | | | (0.69 | ) | | | (1.97 | ) |
| Total from investment operations | | | 0.38 | | | | 0.27 | | | | (0.25 | ) | | | (1.83 | ) |
| Distributions from: | | | | | | | | | | | | | | | | |
| Net investment income | | | (0.32 | ) | | | (0.58 | ) | | | (0.49 | ) | | | (0.34 | ) |
| Total distributions | | | (0.32 | ) | | | (0.58 | ) | | | (0.49 | ) | | | (0.34 | ) |
| Net Asset Value, End of Period/Year | | $ | 16.84 | | | $ | 16.78 | | | $ | 17.09 | | | $ | 17.83 | |
| Market Price, End of Period/Year $ | | $ | 16.89 | | | $ | 16.83 | | | $ | 17.10 | | | $ | 17.88 | |
| Total return(3) | | | 2.21 | % | | | 1.62 | % | | | (1.38 | )% | | | (9.22 | )% |
| Ratios/Supplemental Data | | | | | | | | | | | | | | | | |
| Net assets, End of Period/Year (in 000s) | | $ | 125,452 | | | $ | 117,436 | | | $ | 111,067 | | | $ | 91,812 | |
| Ratio of expenses to average net assets Before fee waiver | | | 0.30 | % | | | 0.57 | % | | | 0.51 | % | | | 0.53 | %(a) |
| After fee waiver | | | 0.30 | % | | | 0.30 | % | | | 0.30 | % | | | 0.30 | %(a) |
Ratio of net investment income to average net assets Before fee waiver | | | 3.78 | % | | | 3.27 | % | | | 2.31 | % | | | 0.58 | %(a) |
| After fee waiver | | | 3.78 | % | | | 3.54 | % | | | 2.52 | % | | | 0.81 | %(a) |
| Portfolio turnover rate(4) | | | 12 | % | | | 58 | % | | | 26 | % | | | 78 | % |
| * | Per share data calculated using average shares method. |
| (a) | Annualized. |
| (1) | Effective as of close of business on March 18, 2024, the Impact Shares Affordable Housing MBS ETF (the "Affordable Housing Predecessor Fund") was reorganized into the CCM Affordable Housing MBS ETF. Information presented prior to March 18, 2024 is that of the Affordable Housing Predecessor Fund. See Note 1 in the Notes to Financial Statements. |
| (2) | Commenced operations on July 26, 2021. |
The accompanying notes are an integral part of the financial statements.
Financial Highlights - Per share data (for a share outstanding throughout the period/year)
| (3) | Total return is based on the change in net asset value of a share during the year or period and assumes reinvestment of dividends and distributions at net asset value. Total return is for the period indicated and periods of less than one year have not been annualized. The return shown does not reflect the deduction of taxes that a shareholder would pay on Fund distributions or the redemption of Fund shares. |
| (4) | Portfolio turnover rate is for the period indicated and has not been annualized. Excludes effect of in-kind transfers. |
The accompanying notes are an integral part of the financial statements.
| 12 | Quaker Investment Trust |
Notes to Financial Statements December 31, 2024
Note 1 – ORGANIZATION
The Quaker Investment Trust (the “Trust”), an open-end management investment company, was originally organized as a Massachusetts business trust on October 24, 1990, and was reorganized as a Delaware statutory trust on September 30, 2018. The Trust is registered under the Investment Company Act of 1940, as amended (the “Act”). The Trust’s Declaration of Trust permits the Trustees to issue an unlimited number of shares of beneficial interest for each of its series. The CCM Affordable Housing MBS ETF (“the Fund”) is currently the only series of the Trust. The financial statements herein are those of the Fund. The Fund is classified as a non-diversified portfolio under the Act. The primary investment objective of the Fund is to generate a level of current income. Community Capital Management, LLC (“CCM” or “Adviser”) has managed the Fund since March 18, 2024.
The Fund is the successor to the Impact Shares Affordable Housing MBS ETF (the “Predecessor ETF”). The Predecessor ETF was managed by Impact Shares, Corp., the Predecessor ETF's investment adviser (the "Predecessor Advisor") and was sub-advised by CCM. The reorganization of the Predecessor Fund into the Fund was approved by the Board of Trustees of Impact Shares Trust I on June 12, 2023, the Trust's Board of Trustees on June 8, 2023, and by shareholders of the Affordable Housing Predecessor ETF on September 15, 2023. The reorganization was effective as of close of business on March 18, 2024, the Impact Shares Affordable Housing MBS ETF (the “Affordable Housing Predecessor Fund”) was reorganized into the CCM Affordable Housing MBS ETF. The Affordable Housing Predecessor ETF liquidated in connection with the reorganization, and shares of such Fund are no longer available for purchase. Information presented prior to March 18, 2024 is that of the Affordable Housing Predecessor Fund.
The reorganization was accomplished by the following tax-free exchange in which each shareholder of the Affordable Housing Predecessor ETF received the same aggregate share net asset value (“NAV”) in the corresponding classes as noted below:
| Shares Issued: 6,750,000 | | Net Assets: $114,144,124 |
The net unrealized appreciation of investments transferred was $(11,935,315) as of the date of the acquisition.
Shares of the Fund are listed and traded on the NYSE Arca, Inc. (the "Exchange"). Market prices for the Fund shares ("Shares") may be different from their net asset value ("NAV"). The Fund issues and redeems Shares on a continuous basis, at NAV only in a large specified number of Shares, called "Creation Units." Creation Units are to be issued and redeemed principally in kind for a basket of securities and a balancing cash amount. Shares generally will trade in the secondary market in amounts less than a Creation Unit at market prices that change throughout the day.
Note 2 – SIGNIFICANT ACCOUNTING POLICIES
The following are significant accounting policies, which are consistently followed in the preparation of the financial statements of the Fund. The Fund is an investment company that applies the accounting and reporting guidance issued in Topic 946 by the U.S. Financial Accounting Standards Board (“FASB”).
Use of Estimates — The preparation of financial statements, in conformity with U.S. generally accepted accounting principles (“U.S. GAAP”) requires management to make estimates and assumptions that affect the reported amounts of assets and liabilities and disclosure of contingent assets and liabilities as of the date of the financial statements and the reported amounts of increases and decreases in net assets from operations during the reporting period. Actual results could differ from those estimates and such differences could be material.
Security Valuation — Securities listed on a securities exchange, market or automated quotation system for which quotations are readily available (except for securities traded on the NASDAQ Stock Market (the “NASDAQ”)), including securities traded over the counter, are valued at the last quoted sale price on the primary exchange or market (foreign or domestic) on which they are traded (or at approximately 4:00 pm Eastern Time if a security’s primary exchange is normally open at that time), or, if there is no such reported sale, at the most recent quoted bid. For securities traded on NASDAQ, the NASDAQ Official Closing Price will be used.
If available, debt securities, including mortgage-backed obligations, are priced based upon valuations provided by independent, third-party pricing agents. The third-party pricing agents generally value debt securities at an evaluated bid price by employing methodologies that utilize actual market transactions, broker-supplied valuations, or other methodologies designed to identify the fair value for such securities. Such methodologies generally consider such factors as security prices, yields, maturities, call features, ratings and developments relating to specific securities in arriving at valuations. On the first day a new debt security purchase is recorded, if a price is not available on the automated pricing feeds from our primary and secondary pricing vendors nor is it available from an independent broker, the security may be valued at its purchase price. Each day thereafter, the debt security will be valued according to the Fund’s Fair Value Procedures until an independent source can be secured. Debt obligations with remaining maturities of sixty days or less may be valued at their amortized cost, if the Valuation Designee (discussed below) concludes it approximates fair value after taking into account factors such as credit, liquidity and interest rate conditions as well as issuer specific factors.
Foreign securities listed on foreign exchanges are valued based on quotations from the primary market in which they are traded and are translated from the local currency into U.S. dollars using current exchange rates. Foreign securities may trade on weekends or other days when the Fund does not calculate NAV. As a result, the fair value of these investments may change on days when you cannot buy or redeem shares of the Fund.
| 14 | Quaker Investment Trust |
Prices for most securities held in the Fund are provided daily by recognized independent pricing agents. If a security price cannot be obtained from an independent, third-party pricing agent, the Fund seeks to obtain a bid price from at least one independent broker. Portfolio securities for which market quotations are readily available are valued at their current market value. When market quotations are not readily available (or are deemed unreliable) for one or more portfolio securities, the 1940 Act requires the Fund to use the investment’s fair value, as determined in good faith. Pursuant to Rule 2a-5 under the 1940 Act, the Board has designated the Adviser as the valuation designee to perform fair value determinations, subject to Board oversight. Pursuant to the Valuation Designee’s fair value policies and procedures, securities for which market quotations are not readily available or for which the market price is determined to be unreliable, may include but are not limited to securities that are subject to legal or contractual restrictions on resale, securities for which no or limited trading activity has occurred for a period of time, or securities that are otherwise deemed to be illiquid (i.e., securities that cannot be disposed of within seven days at approximately the price at which the security is currently priced by the Fund which holds the security).
Market quotations may also be not “readily available” if a significant event occurs after the close of the principal exchange on which a portfolio security trades (but before the time for calculation of such Fund’s NAV) if that event affects or is likely to affect (more than minimally) the NAV per share of such Fund. In determining the fair value price of a security, the Valuation Designee may use a number of other methodologies, including those based on discounted cash flows, multiples, recovery rates, yield to maturity or discounts to public comparables. The Valuation Designee may also employ independent pricing services.
Fair value pricing involves judgments that are inherently subjective and inexact; as a result, there can be no assurance that fair value pricing will reflect actual market value, and it is possible that the fair value determined for a security will be materially different from the value that actually could be or is realized upon the sale of that asset. Valuing the Fund’s investments using fair value pricing will result in using prices for those investments that may differ from current market valuations. Use of fair value prices and certain current market valuations could result in a difference between the prices used to calculate the Fund’s NAV and the prices used by each applicable Underlying Index, which, in turn, could result in a difference between the Fund’s performance and the performance of its Underlying Index.
In accordance with the authoritative guidance on fair value measurements and disclosure under U.S. GAAP, the Fund discloses fair value of its investments in a hierarchy that prioritizes the inputs to valuation techniques used to measure the fair value. The objective of a fair value measurement is to determine the price that would be received to sell an asset or paid to transfer a liability in an orderly transaction between market participants at the measurement date (an exit price). Accordingly, the fair value hierarchy gives the highest priority to quoted prices (unadjusted) in active markets for identical assets or liabilities (Level 1) and the lowest priority to unobservable inputs (Level 3). The three levels of the fair value hierarchy are described below:
| ● | Level 1 — Unadjusted quoted prices in active markets for identical, unrestricted assets or liabilities that the Fund has the ability to access at the measurement date; |
| ● | Level 2 — Quoted prices which are not active, or inputs that are observable (either directly or indirectly) for substantially the full term of the asset or liability; and |
| ● | Level 3 — Prices, inputs or exotic modeling techniques which are both significant to the fair value measurement and unobservable (supported by little or no market activity). |
The valuation techniques used by the Fund to measure fair value during the six months ended December 31, 2024 maximized the use of observable inputs and minimized the use of unobservable inputs.
For the six months ended December 31, 2024, there have been no significant changes to the Fund’s fair valuation methodologies.
For details of the investment classification, reference the Schedule of Investments.
Federal Income Taxes — It is the Fund’s intention to qualify as a regulated investment company for Federal income tax purposes by complying with the appropriate provisions of Subchapter M of the Internal Revenue Code of 1986 (the “Code”), as amended. Accordingly, no provisions for federal income taxes have been made in the financial statements.
The Fund evaluates tax positions taken or expected to be taken in the course of preparing the Fund’s tax returns to determine whether it is “more-likely-than not” (i.e., greater than 50-percent) that each tax position will be sustained upon examination by a taxing authority based on the technical merits of the position. Tax positions not deemed to meet the more-likely-than-not threshold are recorded as a tax benefit or expense in the current period. The Fund did not record any tax provision in the current period. However, management’s conclusions regarding tax positions taken may be subject to review and adjustment at a later date based on factors including, but not limited to, examination by tax authorities (i.e., the last 3 year ends, as applicable), on-going analysis of and changes to tax laws, regulations and interpretations thereof. As of and during the six months ended December 31, 2024, the Fund did not have a liability for any unrecognized tax benefits. The Fund recognizes interest and penalties, if any, related to unrecognized tax benefits as income tax expense in the Statement of Operations. For the six months ended December 31, 2024, the Fund did not recognize any interest or penalties.
| 16 | Quaker Investment Trust |
Security Transactions and Investment Income — Security transactions are accounted for on trade date. Costs used in determining realized gains and losses on the sale of investment securities are based on specific identification. Dividend income is recorded on the ex-dividend date. Interest income is recognized on the accrual basis. Withholding taxes and reclaims on foreign dividends have been provided for in accordance with the Fund’s understanding of the applicable country’s tax rules and rates. Discounts and premiums on securities purchased are accreted and amortized using the effective interest method. Realized gains (losses) on paydowns of mortgage-backed and asset backed securities are recorded as an adjustment to interest income.
Dividends and Distributions to Shareholders — The Fund intends to declare and pay dividends of net investment income quarterly and to pay any capital gain distributions on an annual basis. There is no fixed dividend rate, and there can be no assurance that the Fund will pay any dividends or make any capital gain distributions. All distributions are recorded on ex-dividend date.
Cash and Cash Equivalents — Idle cash may be swept into various time deposits and is classified as cash and cash equivalents on the Statement of Assets and Liabilities. The Fund maintains cash in bank deposit accounts which, at times, may exceed United States federally insured limits (“FDIC”). Amounts swept overnight are available on the next business day.
Cash Overdraft Charges — Per the terms of an agreement with the U.S. Bank, N.A., if the Fund has a cash overdraft on a given day, it will be assessed an overdraft charge. Cash overdraft charges are included in other fees on the Statement of Operations.
Creation Units — The Fund issues and redeem Shares at NAV and only in large blocks of Shares currently comprised of 50,000. Shares (each such block of Shares for the Fund are called a “Creation Unit” or multiples thereof).
Purchasers of Creation Units at NAV must pay a standard creation transaction fee of $500 per transaction. The fee is a single charge and will be the same regardless of the number of Creation Units purchased by an investor on the same day. An Authorized Participant (“Authorized Participants”) who holds Creation Units and wishes to redeem at NAV would also pay a standard redemption transaction fee of $500 per transaction to the custodian on the date of such redemption, regardless of the number of Creation Units redeemed that day. Creations and redemptions are also subject to an additional variable charge of up to 1% of the net asset value per Creation Unit, inclusive of the standard transaction fee, for (i) in-kind creations or redemptions effected outside the normal Clearing Process, (ii) in whole or partial cash creations, (iii) in whole or partial cash redemptions or (iv) non-standard orders. The variable component is primarily designed to cover non-standard charges, e.g., brokerage, taxes, foreign exchange, execution, market impact and other costs and expenses related to the execution of trades resulting from such transaction. In all cases, the Transaction Fee will be limited in accordance with the requirements of the SEC applicable to management investment companies offering redeemable securities.
The Fund may determine not to charge the variable portion of a Transaction Fee on certain orders when the Adviser has determined that doing so is in the best interests of Fund shareholders, e.g., for redemption orders that facilitate the rebalance of the Fund’s portfolio in a more tax efficient manner than could be achieved without such order. The variable portion of a Transaction Fee may be higher or lower than the trading expenses incurred by a Fund with respect to the transaction.
Except when aggregated in Creation Units, Shares are not redeemable securities of the Fund. Shares of the Fund may only be purchased or redeemed by certain financial institutions. An Authorized Participant is either (i) a broker-dealer or other participant in the clearing process through the Continuous Net Settlement System of the National Securities Clearing Corporation or (ii) a Depository Trust Company (“DTC”) participant and, in each case, must have executed an Authorized Participant Agreement with the Fund’s distributor. Most retail investors will not qualify as Authorized Participants or have the resources to buy and sell whole Creation Units. Therefore, they will be unable to purchase or redeem the Shares directly from the Fund. Rather, most retail investors will purchase Shares in the secondary market with the assistance of a broker and will be subject to customary brokerage commissions or fees.
The size of a creation unit for a Fund may be changed from time to time in the future if determined to be in the best interests of the Fund by the President of the Fund.
If a Creation Unit is purchased or redeemed in cash, a higher transaction fee will be charged. The following table discloses the Creation Unit breakdown based on the NAV as of December 31, 2024:
| | | Creation Unit Shares | | | Creation Fee | | | Value at December 31, 2024 | | | Redemption Fee | |
| CCM Affordable Housing MBS ETF | | | 50,000 | | | $ | 500 | | | $ | 842,000 | | | $ | 500 | |
Foreign Currency Translation — The books and records of the Fund was maintained in U.S. dollars. Investment securities and other asset and liabilities denominated in a foreign currency are translated into U.S. dollars on the date of valuation. Purchases and sales of investment securities, income and expenses are translated into U.S. dollars at the relevant rates of exchange prevailing on the respective dates of such transactions. The Fund does not isolate that portion of realized or unrealized gains and losses resulting from changes in the foreign exchange rate from fluctuations arising from changes in the market prices of the securities. These gains and losses are included in net realized and unrealized gains and losses on investments on the Statement of Operations. Net realized and unrealized gains and losses on foreign currency transactions represent net foreign exchange gains or losses from foreign currency exchange contracts, disposition of foreign currencies, currency gains or losses realized between trade and settle dates on securities transactions and the difference between the amount of the investment income and foreign withholding taxes recorded on the Fund’s books and the U.S. dollar equivalent amounts actually received or paid.
| 18 | Quaker Investment Trust |
Indemnifications — In the normal course of business, the Fund enters into contracts that provide general indemnifications. The Fund’s maximum exposure under these arrangements is dependent on future claims that may be made against the Fund and, therefore, cannot be established; however, based on experience, the risk of loss from such claims is considered remote.
Note 3 – AGREEMENTS
Investment Advisory Agreement
Community Capital Management, LLC (“CCM” or the “Adviser”) serves as the investment adviser to the Fund. CCM oversees all investment advisory and portfolio management services and assists in managing and supervising all aspects of the general day-to-day business activities and operations of the Fund, including custodial, transfer agency, dividend disbursing, accounting, auditing, compliance and related services. Additionally, CCM furnishes offices, necessary facilities, equipment and personnel.
Quaker Investment Trust (the “Trust”) and CCM have received “manager of managers” exemptive relief from the SEC that permits the Trust and CCM, subject to the approval of the Board, to appoint a “wholly-owned” or unaffiliated sub-adviser, as defined in the exemptive relief, or to change the terms of a sub-advisory agreement with a “wholly-owned” or unaffiliated sub-adviser without first obtaining shareholder approval. The exemptive order further permits the Trust and CCM to add or to change a “wholly-owned” or unaffiliated sub-adviser or to change the fees paid to such parties from time to time without the expense and delays associated with obtaining shareholder approval of the change and to disclose sub-advisers’ fees only in the aggregate in its registration statement. Any increase in the aggregate advisory fee paid by the Fund remains subject to shareholder approval. The Trust and CCM continue to have ultimate responsibility (subject to oversight by the Board) to oversee the sub-advisers and recommend their hiring, termination, and replacement. The Fund will notify shareholders of any change of the Fund’s sub-adviser.
Prior to March 18, 2024 Impact Shares, Corp. was the Adviser to the Fund. For the services it provided the Affordable Housing ETF, the Fund paid the Adviser an annual fee, payable monthly, at the rate of 0.30% of the Fund's Average Daily Managed Assets. The Adviser voluntarily agreed to waive all advisory fees payable by the Fund in excess of 0.25% of the average daily net assets of the Fund until the Fund's net assets are greater than $100 million. During the period ended March 18, 2024, the Adviser voluntarily waived advisory fees payable to the Fund; a portion of which was reimbursed to the Adviser from the sub-advisor under its expense limitation agreement with the Fund. These waived fees are not recoupable by the Adviser or the sub-advisor in future periods.
Prior to March 18, 2024, Impact Shares engaged a sub-adviser, Community Capital Management, LLC. ("CCM") to provide the day-to-day management of the portfolio of the Affordable Housing ETF. CCM contractually agreed to limit the total annual operating expenses (exclusive of fees paid by the Fund pursuant to its distribution plan under Rule 12b-1 under the Investment Company Act of 1940, as amended, taxes, brokerage commissions and other transaction costs, interest payments, acquired fund fees and expenses, extraordinary expenses and dividend expenses on short sales) of the Fund to 0.30%.
From the period ended March 18, 2024 to June 30, 2024, for the services it provides to the CCM Affordable Housing MBS ETF, the Fund pays the Adviser an annual fee, payable monthly, at the rate of 0.30% of the Fund’s average daily managed assets. Under the Investment Advisory Agreement, the Adviser, among other things: (i) continuously furnishes an investment program for the Fund; (ii) determines the investments to be purchased, held, sold or exchanged by the Fund and the portion, if any, of the assets of the Fund to be held uninvested; (iii) makes changes in the investments of the Fund; (iv) monitors the Fund’s performance and considers ways to improve the performance of the Fund and (v) votes, exercises consents and exercises all other rights pertaining to such securities on behalf of the Fund. The Fund bears all remaining expenses. The Adviser has contractually agreed to limit the total annual operating expenses (exclusive of fees paid by the Fund pursuant to its distribution plan under Rule 12b-1 under the Investment Company Act of 1940, as amended, taxes, brokerage commissions and other transaction costs, interest payments, acquired fund fees and expenses, extraordinary expenses and dividend expenses on short sales) of the Fund to 0.30% through October 31, 2025. This contract may not be terminated without the action or consent of the Fund’s Board of Trustees. Pursuant to its expense limitation agreement with the Fund, the Adviser is entitled to recoup any fees that it waived and/or Fund expenses that it paid for a period of three years following such fee waivers and expense payments, to the extent that such recoupment by the Adviser will not cause the Fund to exceed any applicable expense limitation that was in place for the Fund when the fees were waived or expenses were paid. During the six months ended December 31, 2024, the Adviser voluntarily waived $187,374 of advisory fees payable by the Fund.
| 20 | Quaker Investment Trust |
As of December 31, 2024, the Fund had fees which were previously waived and/or reimbursed to the Fund by the Adviser, which may be subject to possible future recapture, up to the expense cap in place at the time the expenses were waived and reimbursed to the Fund, as follows:
| Fiscal Year | Subject to Repayment until December 31: | Amount |
| 2024 | 2027 | $123,964 |
For the six-months ended December 31, 2024, the Adviser did not recapture any previously waived fees.
Additionally, each Investment Advisory Agreement remains in force for an initial two-year period and from year to year thereafter, subject to annual approval by (a) the Board or (b) a “vote of a majority of the outstanding voting securities” (as defined in the 1940 Act) of the Fund; provided that in either event continuance is also approved by a majority of the Independent Trustees, by a vote cast in person at a meeting called for the purpose of voting such approval. Each Investment Advisory Agreement may be terminated at any time, without payment of any penalty, by vote of the Trust’s Board, or by a “vote of a majority of the outstanding voting securities” (as defined in the 1940 Act) of the Fund, or by the Adviser, in each case on not more than 60 days’ nor less than 30 days’ prior written notice to the other party. Each Investment Advisory Agreement will automatically terminate in the event of its “assignment,” as defined by the 1940 Act and the rules thereunder, or upon the termination of the relevant.
Distribution Agreement
SEI Investments Distribution Co. (the “Distributor”) serves as the Fund’s underwriter and distributor of Shares pursuant to a Distribution Agreement. Under the Distribution Agreement, the Distributor, as agent, receives orders to purchase shares in Creation Units and transmits such orders to the Fund’s custodian and transfer agent. The Distributor has no obligation to sell any specific quantity of Fund shares. The Distributor bears the following costs and expenses relating to the distribution of shares: (i) the expenses of maintaining its registration or qualification as a dealer or broker under federal or state laws; (ii) filing fees; and (iii) all other expenses incurred in connection with the distribution services, that are not reimbursed by the Adviser, as contemplated in the Distribution Agreement. The Distributor does not maintain any secondary market in Fund Shares.
The Fund has adopted a Distribution and Service Plan (the “Plan”) pursuant to Rule 12b-1 under the 1940 Act. In accordance with the Plan, the Fund is authorized to pay an amount up to 0.25% of its average net assets each year for certain distribution-related activities. For the six months ended December 31, 2024, no fees were charged by the Distributor under the Plan. No payments have yet been authorized by the Board, nor are any such expected to be made by a Fund under the Plan during the current fiscal year.
Administrator, Custodian and Transfer Agent
SEI Investments Global Funds Services (“the Administrator”), serves as the Fund’s administrator pursuant to an Administration Agreement. Prior to March 18, 2024, Tidal ETF Services LLC, an affiliate of Toroso, served as the Fund's administrator, pursuant to an Administration Agreement and SEI Global Funds Services serves as the Fund's sub-administrator.
U.S. Bank, N.A. serves as the Fund's custodian and U.S. Bank Global Fund Services serves as the Fund's transfer agency and dividend disbursing services.
Prior to March 18, 2024, the Bank of New York Mellon served as the Fund's Custodian and Transfer Agent pursuant to a Custodian Agreement and Transfer Agency Services Agreement.
Note 4 – INVESTMENT TRANSACTIONS
For the six months ended December 31, 2024, the purchases and sales of investments in securities, excluding in-kind transactions and short-term securities were:
| Purchases: | | | |
| U.S. Government | | $ | 20,382,132 | |
| Other | | | – | |
| Sales and Maturities: | | | | |
| U.S. Government | | $ | 14,719,027 | |
| Other | | | – | |
The Fund did not have in-kind transactions for the six months ended December 31, 2024.
Note 5 – TAX INFORMATION
The amount and character of income and capital gain distributions to be paid, if any, are determined in accordance with Federal income tax regulations, which may differ from U.S. GAAP. As a result, net investment income (loss) and net realized gain (loss) on investment transactions for a reporting period may differ significantly from distributions during such period. These book/tax differences may be temporary or permanent. To the extent these differences are permanent in nature, they are charged or credited to distributable earnings or paid-in capital, as appropriate, in the period that the differences arise.
The tax character of dividends and distributions paid during the fiscal years ending June 30, 2024 and June 30, 2023 were as follows:
| 22 | Quaker Investment Trust |
| | | Fiscal Year Ended June 30, 2024 | | | Fiscal Year Ended June 30, 2023 | |
| Distributions declared from: | | | | | | |
| Ordinary income | | $ | 3,990,047 | | | $ | 2,915,245 | |
| Total Distributions | | $ | 3,990,047 | | | $ | 2,915,245 | |
As of June 30, 2024, the components of distributable earnings (accumulated losses) on a tax basis were as follows:
| Undistributed ordinary income | | $ | 64,320 | |
| Capital loss carryforwards | | | (7,310,083 | ) |
| Unrealized depreciation, net | | | (10,085,616 | ) |
| Accumulated losses, net | | $ | (17,331,379 | ) |
For Federal income tax purposes, capital losses incurred may be carried forward and applied against future capital gains.
Funds are permitted to carry forward capital losses for an unlimited period. Additionally, capital losses that are carried forward will retain their character as either short-term or long-term capital. Capital loss carryforwards are as follows:
| Short-Term | | | Long-Term | | | Total Capital Loss Carryforwards | |
| $ | (2,520,449 | ) | | $ | (4,789,634 | ) | | $ | (7,310,083) | |
The Federal tax cost and aggregate gross unrealized appreciation and depreciation on investments and foreign currency transactions held by the Fund at December 31, 2024, were as follows:
| Cost of investments | | $ | 133,071,192 | |
| Gross unrealized appreciation | | | 408,008 | |
| Gross unrealized depreciation | | | (10,217,611 | ) |
| Net depreciation on investments | | $ | (9,809,603 | ) |
Note 6 – RISKS OF INVESTING IN THE FUND
As with all exchange traded funds (“ETFs”), a shareholder of the Fund is subject to the risk that his or her investment could lose money. The Fund is subject to the principal risks noted below, any of which may adversely affect the Fund’s NAV, trading price, yield, total return and ability to meet its investment objective. A more complete description of principal risks is included in the prospectus under the heading “Principal Risks”.
Under normal circumstances, the Fund will invest at least 80% of its net assets in mortgage-backed securities backed by pools of mortgage loans that the Fund’s Adviser believes were made to minority families, low-income families, and/or families that live in persistent poverty areas. An investment in the Fund is not a bank deposit and is not insured or guaranteed by the FDIC or any other government agency. As with any investment company, there is no guarantee that the Fund will achieve its goal.
Active Investment Management Risk – The Fund is actively managed. The Adviser’s judgments about the attractiveness, relative value, or potential appreciation of a particular sector, security or investment strategy may prove to be incorrect, and may cause the Fund to incur losses. There can be no assurance that the Adviser’s investment techniques and decisions will produce the desired results. There is no guarantee that the Fund’s investment objective will be achieved.
Asset Class Risk – Securities in the Fund’s portfolio may underperform in comparison to the general securities markets or other asset classes.
Call Risk – Some debt securities may be redeemed, or “called,” at the option of the issuer before their stated maturity date. In general, an issuer will call its debt securities if they can be refinanced by issuing new debt securities which bear a lower interest rate. The Fund is subject to the possibility that during periods of falling interest rates an issuer will call its high yielding debt securities. The Fund would then be forced to invest the proceeds at lower interest rates, likely resulting in a decline in the Fund’s income.
Cash Transaction Risk – The Fund will effect some or all of its creations and redemptions for cash rather than in-kind. As a result, an investment in the Fund may be less tax-efficient than an investment in an ETF that effects all of its creations and redemptions in-kind. Because the Fund may effect redemptions for cash, it may be required to sell portfolio securities in order to obtain the cash needed to distribute redemption proceeds. A sale of shares may result in capital gains or losses and may also result in higher brokerage costs.
Counterparty Risk – Fund transactions involving a counterparty are subject to the risk that the counterparty will not fulfill its obligation to the Fund. Counterparty risk may arise because of the counterparty’s financial condition (i.e., financial difficulties, bankruptcy, or insolvency), market activities and developments, or other reasons, whether foreseen or not. A counterparty’s inability to fulfill its obligation may result in significant financial loss to the Fund. The Fund may be unable to recover its investment from the counterparty or may obtain a limited recovery, and/or recovery may be delayed. These risks may be greater when engaging in over-the-counter transactions or when the Fund conducts business with a limited number of counterparties.
| 24 | Quaker Investment Trust |
Credit Risk – An issuer or other obligated party of a debt security may be unable or unwilling to make dividend, interest and/or principal payments when due. In addition, the value of a debt security may decline because of concerns about the issuer’s ability or unwillingness to make such payments. In certain cases, the issuer could be late in paying interest or principal, or could fail to pay its financial obligations altogether.
Extension Risk – Extension risk is the risk that, when interest rates rise, certain obligations will be paid off by the issuer (or other obligated party) more slowly than anticipated, causing the value of these debt securities to fall. Rising interest rates tend to extend the duration of debt securities, making their market value more sensitive to changes in interest rates. The value of longer-term debt securities generally changes more in response to changes in interest rates than shorter-term debt securities. As a result, in a period of rising interest rates, securities may exhibit additional volatility and may lose value.
Fixed-Income Risk – The market value of the Fund’s fixed-income securities responds to economic developments, particularly interest rate changes, as well as to perceptions about the creditworthiness of individual issuers, including governments. Generally, the Fund’s fixed- income securities will decrease in value if interest rates rise and increase in value if interest rates fall. Normally, the longer the maturity or duration of the fixed-income securities the Fund owns, the more sensitive the value of the Fund’s shares will be to changes in interest rates.
Inflation Risk – Inflation risk is the risk that the value of assets or income from investments will be less in the future as inflation decreases the value of money. As inflation increases, the present value of the Fund’s assets and distributions may decline.
Interest Rate Risk – Interest rate risk is the risk that the value of the debt securities in the Fund’s portfolio will decline because of rising market interest rates. Interest rate risk is generally lower for shorter term debt securities and higher for longer-term debt securities. Duration is a reasonably accurate measure of a debt security’s price sensitivity to changes in interest rates and a common measure of interest rate risk. Duration measures a debt security’s expected life on a present value basis, taking into account the debt security’s yield, interest payments and final maturity. In general, duration represents the expected percentage change in the value of a security for an immediate 1% change in interest rates. For example, the price of a debt security with a three-year duration would be expected to drop by approximately 3% in response to a 1% increase in interest rates. Therefore, prices of debt securities with shorter durations tend to be less sensitive to interest rate changes than debt securities with longer durations. As the value of a debt security changes over time, so will its duration. Rising market interest rates could have unpredictable effects on the markets and may expose fixed-income and related markets to heightened volatility. To the extent that the Fund invests in fixed-income securities, an increase in market interest rates may lead to increased redemptions and increased portfolio turnover, which could reduce liquidity for certain investments, adversely affect values, and increase costs. Increased redemptions may cause the Fund to liquidate portfolio positions when it may not be advantageous to do so and may lower returns. If dealer capacity in fixed-income markets is insufficient for market conditions, it may further inhibit liquidity and increase volatility in the fixed- income markets. Further, recent and potential future changes in government policy may affect interest rates.
Liquidity Risk – The Fund may hold certain investments that may trade over-the-counter or in limited volume or lack an active trading market. Accordingly, the Fund may not be able to sell or close out of such investments at favorable times or prices (or at all), or at the prices approximating those at which the Fund currently values them. Illiquid securities may trade at a discount from comparable, more liquid investments and may be subject to wide fluctuations in market value. The prices of illiquid securities may be more volatile than more liquid investments. The risks associated with illiquid securities may be greater in times of financial stress.
Market Price Variance Risk – Fund shares are listed for trading on NYSE and can be bought and sold in the secondary market at prevailing market prices. The market prices of shares will fluctuate in response to changes in the NAV and supply and demand for shares. As a result, the trading prices of Shares may deviate significantly from NAV during periods of market volatility. The Adviser cannot predict whether shares will trade above, below or at their NAV. Given the fact that shares can be created and redeemed in Creation Units, the Adviser believes that large discounts or premiums to the NAV of shares should not be sustained in the long-term. In addition, the securities held by the Fund may be traded in markets that close at a different time than NYSE. Liquidity in those securities may be reduced after the applicable closing times.
Accordingly, during the time when NYSE is open but after the applicable market closing, fixing or settlement times, bid-ask spreads and the resulting premium or discount to the Shares’ NAV may widen. Further, secondary markets may be subject to irregular trading activity, wide bid/ask spreads and extended trade settlement periods, which could cause a material decline in the Fund’s NAV. In times of market stress, market makers and authorized participants may step away from their respective roles in making a market in Fund shares or in executing purchase and redemption orders, which could lead to variances between the market price of Fund shares and the underlying value of those shares. Also, in stressed market conditions, the market for Fund shares may become less liquid in response to deteriorating liquidity of the Fund’s portfolio holdings, which could lead to differences between the market price of the Fund’s shares and the underlying value of those shares. During periods of high market volatility, the Fund share may trade at a significant discount to its NAV, and in these circumstances certain types of brokerage orders may expose an investor to an increased risk of loss. A “stop order,” sometimes called a “stop- loss order,” may cause the Fund share to be sold at the next prevailing market price once the “stop” level is reached, which during a period of high volatility can be at a price that is substantially below NAV. By including a “limit” criterion with your brokerage order, you may be able to limit the size of the loss resulting from the execution of an ill-timed stop order. The Fund’s shares may be listed or traded on U.S. and non-U.S. stock exchanges other than the U.S. stock exchange where the Fund’s primary listing is maintained and may otherwise be made available to non-U.S. investors through funds or structured investment vehicles similar to depositary receipts. There can be no assurance that the Fund’s shares will continue to trade on any such stock exchange or in any market or that the Fund’s shares will continue to meet the requirements for listing or trading on any exchange or in any market. The Fund’s shares may be less actively traded in certain markets than in others, and investors are subject to the execution and settlement risks and market standards of the market where they or their broker direct their trades for execution. Certain information available to investors who trade Fund shares on a U.S. stock exchange during regular U.S. market hours may not be available to investors who trade in other markets, which may result in secondary market prices in such markets being less efficient.
| 26 | Quaker Investment Trust |
The Fund’s investment results are measured based upon the daily NAV of the Fund. Investors purchasing and selling shares in the secondary market may not experience investment results consistent with those experienced by those purchasing and redeeming directly with the Fund.
Mortgage-Related Securities Risk – Mortgage-related securities are subject to the same risks as investments in other types of debt securities, including credit risk, interest rate risk, liquidity risk and valuation risk. However, these investments make the Fund more susceptible to adverse economic, political or regulatory events that affect the value of real estate. Mortgage-related securities are also significantly affected by the rate of prepayments and modifications of the mortgage loans underlying those securities, as well as by other factors such as borrower defaults, delinquencies, realized or liquidation losses and other shortfalls. Mortgage-related securities are particularly sensitive to prepayment risk, given that the term to maturity for mortgage loans is generally substantially longer than the expected lives of those securities. As the timing and amount of prepayments cannot be accurately predicted, the timing of changes in the rate of prepayments of the mortgage loans may significantly affect the Fund’s actual yield to maturity on any mortgage-related securities. Along with prepayment risk, mortgage-related securities are significantly affected by interest rate risk.
Non-Diversification Risk – As a non-diversified fund for purposes of the 1940 Act, the Fund may invest a larger portion of its assets in the securities of fewer issuers than a diversified fund. The Fund’s investment in fewer issuers may result in the Fund’s shares being more sensitive to the economic results of those issuers. An investment in the Fund could fluctuate in value more than an investment in a diversified fund. Although the Fund is “non-diversified” for purposes of the 1940 Act, the Fund intends to comply with the diversification requirements under Subchapter M of the Code in order to be eligible to qualify as a regulated investment company.
Operational and Technology Risk – Cyber-attacks, disruptions, or failures that affect the Fund’s service providers, index providers, Authorized Participants, market makers, counterparties, market participants, or issuers of securities held by the Fund may adversely affect the Fund and its shareholders, including by causing losses for the Fund or impairing Fund operations.
Prepayment Risk – Prepayment risk is the risk that the issuer of a debt security will repay principal prior to the scheduled maturity date. Debt securities allowing prepayment may offer less potential for gains during a period of declining interest rates, as the Fund may be required to reinvest the proceeds of any prepayment at lower interest rates. These factors may cause the value of an investment in the Fund to change.
Securities Market Risk – The value of securities owned by the Fund may go up or down, sometimes rapidly or unpredictably, due to factors affecting particular companies or the securities markets generally. A general downturn in the securities market may cause multiple asset classes to decline in value simultaneously. Many factors, including terrorism, war, natural disasters and the spread of infectious disease including epidemics or pandemics such as the COVID-19 outbreak can affect this value and you may lose money by investing in the Fund. These conditions (and their aftermath) have led, and in the future may lead, to increased short-term market volatility and may have adverse long- term effects on U.S. and world economies and markets generally. Likewise, natural and environmental disasters, including earthquakes, fires, floods, hurricanes, tsunamis and weather-related phenomena generally, as well as the spread of infectious disease including epidemics or pandemics such as the COVID-19 outbreak, can be highly disruptive to economies and markets, adversely affecting individual companies, sectors, industries, markets, currencies, interest and inflation rates, credit ratings, investor sentiment, and other factors affecting the value of the Fund’s investments. To the extent the Fund takes significant positions in one or more specific sectors, countries or regions, the Fund will be subject to the risks associated with such sector(s), country(ies) or region(s) to a greater extent than would be a more broadly diversified fund.
Significant Exposure Risk – To the extent that the Fund invests a large percentage of its assets in a single asset class or the securities of issuers within the same country, state, region, industry or sector, an adverse economic, business or political development may affect the value of the Fund’s investments more than if the Fund were more broadly diversified. A significant exposure makes the Fund more susceptible to any single occurrence and may subject the Fund to greater market risk than a fund that is more broadly diversified.
| 28 | Quaker Investment Trust |
Specified Pools Risk – The Fund is expected to primarily invest in specified pools of mortgage loans. This may cause the Fund to take longer to fully achieve its principal investment strategy.
Trading Issues Risk – Although the shares of the Fund are listed for trading on the Exchange, there can be no assurance that an active trading market for such shares will develop or be maintained. Trading in shares on the Exchange may be halted due to market conditions or for reasons that, in the view of the Exchange, make trading in shares inadvisable. In addition, trading in shares on the Exchange is subject to trading halts caused by extraordinary market volatility pursuant to the Exchange’s “circuit breaker” rules. Market makers are under no obligation to make a market in the Fund’s shares, and authorized participants are not obligated to submit purchase or redemption orders for Creation Units. In the event market makers cease making a market in the Fund’s shares or authorized participants stop submitting purchase or redemption orders for Creation Units, Fund shares may trade at a larger premium or discount to their net asset value. There can be no assurance that the requirements of the Exchange necessary to maintain the listing of the Fund will continue to be met or will remain unchanged. The Fund may have difficulty maintaining its listing on the Exchange in the event the Fund’s assets are small or the Fund does not have enough shareholders.
Transactions Risk – The Fund may purchase securities via to-be-announced transactions (“TBA Transactions”). In such a transaction, the purchase price of the securities is typically fixed at the time of the commitment, but delivery and payment can take place a month or more after the date of the commitment. At the time of delivery of the securities, the value may be more or less than the purchase or sale price. Purchasing securities in a TBA Transaction may give rise to investment leverage and may increase the Fund’s volatility. Default by, or bankruptcy of, a counterparty to a TBA Transaction would expose the Fund to possible losses because of an adverse market action, expenses or delays in connection with the purchase or sale of the pools specified in such transaction.
U.S. Government Securities Risk – U.S. government securities are subject to interest rate risk but generally do not involve the credit risks associated with investments in other types of debt securities. As a result, the yields available from U.S. government securities are generally lower than the yields available from other debt securities. U.S. government securities are guaranteed only as to the timely payment of interest and the payment of principal when held to maturity. While securities issued or guaranteed by U.S. federal government agencies (such as Ginnie Mae) are backed by the full faith and credit of the U.S. Department of the Treasury, securities issued by government sponsored entities (such as Fannie Mae and Freddie Mac) are solely the obligation of the issuer and generally do not carry any guarantee from the U.S. government.
Obligations of U.S. Government agencies, authorities, instrumentalities and sponsored enterprises (such as Fannie Mae and Freddie Mac) have historically involved little risk of loss of principal if held to maturity. However, the maximum potential liability of the issuers of some of these securities may greatly exceed their current resources and no assurance can be given that the U.S. Government would provide financial support to any of these entities if it is not obligated to do so by law.
Fannie Mae and Freddie Mac have been operating under conservatorship, with the Federal Housing Finance Administration (“FHFA”) acting as their conservator, since 2008. The entities are dependent upon the continued support of the U.S. Department of the Treasury and FHFA in order to continue their business operations. These factors, among others, could affect the future status and role of Fannie Mae or Freddie Mac and the value of their securities and the securities that they guarantee. Additionally, the U.S. Government and its agencies and instrumentalities do not guarantee the market values of their securities, which may fluctuate.
Valuation Risk – The Fund is subject to the risk of mispricing or improper valuation of its investments, in particular to the extent that its securities are fair valued.
An investment in the Fund is not a bank deposit and is not insured or guaranteed by the FDIC or any other government agency. As with any investment company, there is no guarantee that the Fund will achieve its goal.
Note 7 – OTHER
At December 31, 2024, all shares issued by the Fund were in Creation Unit aggregations to Authorized Participants through primary market transactions (e.g., transactions directly with the Fund). However, the individual shares that make up those Creation Units are traded on the Exchange (e.g., secondary market transactions). Some of those individual shares have been bought and sold by persons that are not Authorized Participants. Each Authorized Participant has entered into an agreement with the Fund's Distributor.
Note 8 – NEW ACCOUNTING PRONOUNCEMENT
In this reporting period, the Fund adopted FASB Accounting Standards Update 2023-07, Segment Reporting (Topic 280) - Improvements to Reportable Segment Disclosures (“ASU 2023-07”). Adoption of the new standard impacted financial statement disclosures only and did not affect the Fund’s financial position or the results of its operations. An operating segment is defined in Topic 280 as a component of a public entity that engages in business activities from which it may recognize revenues and incur expenses, has operating results that are regularly reviewed by the public entity’s chief operating decision maker (CODM) to make decisions about resources to be allocated to the segment and assess its performance, and has discrete financial information available. The management of the Fund’s Adviser acts as the Fund’s CODM. The Fund represents a single operating segment, as the CODM monitors the operating results of the Fund as a whole and the Fund’s long-term strategic asset allocation is pre-determined in accordance with the Fund’s single investment objective which is executed by the Fund’s portfolio managers. The financial information in the form of the Fund’s schedule of investments, total returns, expense ratios and changes in net assets (i.e., changes in net assets resulting from operations, subscriptions and redemptions), which are used by the CODM to assess the segment’s performance versus the Fund’s comparative benchmarks and to make resource allocation decisions for the Fund’s single segment, is consistent with that presented within the Fund’s financial statements. Segment assets are reflected on the accompanying Statement of Assets and Liabilities as “total assets” and significant segment expenses are listed on the accompanying Statement of Operations.
| 30 | Quaker Investment Trust |
Note 9 – SUBSEQUENT EVENTS
The Fund has evaluated the need for additional disclosures and/or adjustments resulting from subsequent events through the date the financial statements were issued. Based on this evaluation, no additional disclosure and/or adjustments were required to the financial statements.
Other Information (Form N-CSRS Items 8-11) December 31, 2024
Item 8. Changes in and Disagreements with Accountants for Open-End Management Investment Companies.
Not applicable.
Item 9. Proxy Disclosures for Open-End Management Investment Companies.
There were no matters submitted to a vote of shareholders during the period covered by this report.
Item 10. Remuneration Paid to Directors, Officers, and Others of Open-End Management Investment Companies.
Included within the Statement(s) of Operations of the financial statements filed under Item 7.
Item 11. Statement Regarding Basis for Approval of Investment Advisory Contract.
Not applicable.
THIS PAGE INTENTIONALLY LEFT BLANK.
This report is intended for the Fund’s shareholders. It may not be distributed to prospective investors unless it is preceded by or accompanied by the Fund’s prospectus. An investor should read the prospectus carefully before investing or sending money. A prospectus may be obtained by calling the Fund at 1-888-272-0007.

261 North University Drive ▪ Suite 520 ▪ Ft. Lauderdale, FL 33324
954-217-7999 ▪ Fax: 954-385-9299 ▪ Toll Free: 888-272-0007 ▪ www.ccminvests.com
Item 8. Changes in and Disagreements with Accountants for Open-End Management Investment Companies.
Included under Item 7.
Item 9. Proxy Disclosures for Open-End Management Investment Companies.
Included under Item 7.
Item 10. Remuneration Paid to Directors, Officers, and Others of Open-End Management Investment Companies.
Included under Item 7.
Item 11. Statement Regarding Basis for Approval of Investment Advisory Contract.
Not applicable.
Item 12. Disclosure of Proxy Voting Policies and Procedures for Closed-End Management Investment Companies.
Not applicable.
Item 13. Portfolio Managers of Closed-End Management Investment Companies.
Not applicable.
Item 14. Purchases of Equity Securities by Closed-End Management Investment Company and Affiliated Purchasers.
Not applicable.
Item 15. Submission of Matters to a Vote of Security Holders.
There have been no changes to the procedures by which shareholders may recommend nominees to the Registrant’s Board of Trustees during the period covered by this report.
Item 16. Controls and Procedures.
| (a) | The Registrant's principal executive and principal financial officers, or persons performing similar functions, have concluded that the Registrant's disclosure controls and procedures, as defined in Rule 30a-3(c) under the Act (17 CFR § 270.30a-3(c)), as of a date within 90 days of the filing date of the report, are effective based on the evaluation of these controls and procedures required by Rule 30a-3(b) under the Act (17 CFR § 270.30a-3(b)) and Rule 13a-15(b) or Rule 15d-15(b) under the Securities Exchange Act of 1934, as amended (17 CFR § 240.13a-15(b) or § 240.15d-15(b)). |
| (b) | There has been no change in the Registrant's internal control over financial reporting (as defined in Rule 30a-3(d) under the Act (17 CFR § 270.30a-3(d)) that occurred during the period covered by this report that has materially affected, or is reasonably likely to materially affect, the Registrant's internal control over financial reporting. |
Item 17. Disclosure of Securities Lending Activities for Closed-End Management Investment Companies.
Not applicable.
Item 18. Recovery of Erroneously Awarded Compensation.
(a) Not applicable.
(b) Not applicable.
Item 19. Exhibits.
| (a)(1) | Not applicable for semi-annual report. |
SIGNATURES
Pursuant to the requirements of the Securities Exchange Act of 1934 and the Investment Company Act of 1940, the Registrant has duly caused this report to be signed on its behalf by the undersigned, thereunto duly authorized.
| (Registrant) | Quaker Investment Trust | |
| | | |
| By (Signature and Title) | /s/ Alyssa D. Greenspan | |
| | Alyssa D. Greenspan, | |
| Date: March 7, 2025 | President and Principal Executive Officer | |
| | | |
Pursuant to the requirements of the Securities Exchange Act of 1934 and the Investment Company Act of 1940, this report has been signed below by the following persons on behalf of the Registrant and in the capacities and on the dates indicated.
| By (Signature and Title) | /s/ Alyssa D. Greenspan | |
| | Alyssa D. Greenspan, | |
| Date: March 7, 2025 | President and Principal Executive Officer | |
| By (Signature and Title) | /s/ James H. Malone | |
| | James H. Malone, | |
| Date: March 7, 2025 | Treasurer and Principal Financial Officer | |