
First Quarter 2017 Earnings Release Investor Presentation NASDAQ: CARO April 25, 2017
2 Disclaimer Certain statements in this presentation contain “forward - looking statements” within the meaning of the Private Securities Litigation Reform Act of 1995 , such as statements relating to future plans and expectations, and are thus prospective . Such forward - looking statements include but are not limited to statements with respect to plans, objectives, expectations, and intentions and other statements that are not historical facts, and other statements identified by words such as “believes,” “expects,” “anticipates,” “estimates,” “intends,” “plans,” “targets,” and “projects,” as well as similar expressions . Such statements are subject to risks, uncertainties, and other factors which could cause actual results to differ materially from future results expressed or implied by such forward - looking statements . Although we believe that the assumptions underlying the forward - looking statements are reasonable, any of the assumptions could prove to be inaccurate . Therefore, we can give no assurance that the results contemplated in the forward - looking statements will be realized . The inclusion of this forward - looking information should not be construed as a representation by Carolina Financial Corporation (“Carolina Financial” or the “Company”) or any other person that such future events, plans, or expectations will occur or be achieved . In addition to factors previously disclosed in the reports filed by Carolina Financial with the Securities and Exchange Commission (the “SEC”), additional risks and uncertainties may include, but are not limited to : ( 1 ) competitive pressures among depository and other financial institutions may increase significantly and have an effect on pricing, spending, third - party relationships and revenues ; ( 2 ) the strength of the United States economy in general and the strength of the local economies in which we conduct operations may be different than expected resulting in, among other things, a deterioration in the credit quality or a reduced demand for credit, including the resultant effect on the Company’s loan portfolio and allowance for loan losses ; ( 3 ) the rate of delinquencies and amounts of charge - offs, the level of allowance for loan loss, the rates of loan growth, or adverse changes in asset quality in our loan portfolio, which may result in increased credit risk - related losses and expenses ; ( 4 ) the risk that the preliminary financial information reported herein and our current preliminary analysis will be different when our review is finalized ; ( 5 ) changes in the U . S . legal and regulatory framework including, but not limited to, the Dodd - Frank Act and regulations adopted thereunder ; ( 6 ) adverse conditions in the stock market, the public debt market and other capital markets (including changes in interest rate conditions) could have a negative impact on the Company ; 7 ) the business related to acquisitions may not be integrated successfully or such integration may take longer to accomplish than expected ; ( 8 ) the expected cost savings and any revenue synergies from acquisitions may not be fully realized within expected timeframes ; and ( 9 ) disruption from acquisitions may make it more difficult to maintain relationships with clients, associates, or suppliers . Additional factors that could cause our results to differ materially from those described in the forward - looking statements can be found in the reports (such as our Annual Report on Form 10 - K, Quarterly Reports on Form 10 - Q and Current Reports on Form 8 - K) filed with the SEC and available at the SEC’s Internet site (http : //www . sec . gov) . All subsequent written and oral forward - looking statements concerning the Company or any person acting on its behalf is expressly qualified in its entirety by the cautionary statements above . We do not undertake any obligation to update any forward - looking statement to reflect circumstances or events that occur after the date the forward - looking statements are made . This presentation and the accompanying news release contain financial information determined by methods other than in accordance with generally accepted accounting principles (“GAAP”) . Such statements should be read along with the tables in the accompanying news release, which provide a reconciliation of non - GAAP measures to GAAP measures . This presentation and the accompanying news release discuss financial measures, such as core deposits, tangible book value, operating earnings and net income related to segments of the Company, which are non - GAAP measures . We believe that such non - GAAP measures are useful because they enhance the ability of investors and management to evaluate and compare the Company’s operating results from period to period in a meaningful manner . Non - GAAP measures should not be considered as an alternative to any measure of performance as promulgated under GAAP . Investors should consider the Company’s performance and financial condition as reported under GAAP and all other relevant information when assessing the performance or financial condition of the company . Non - GAAP measures have limitations as analytical tools, and investors should not consider them in isolation or as a substitute for analysis of the Company's results or financial condition as reported under GAAP .
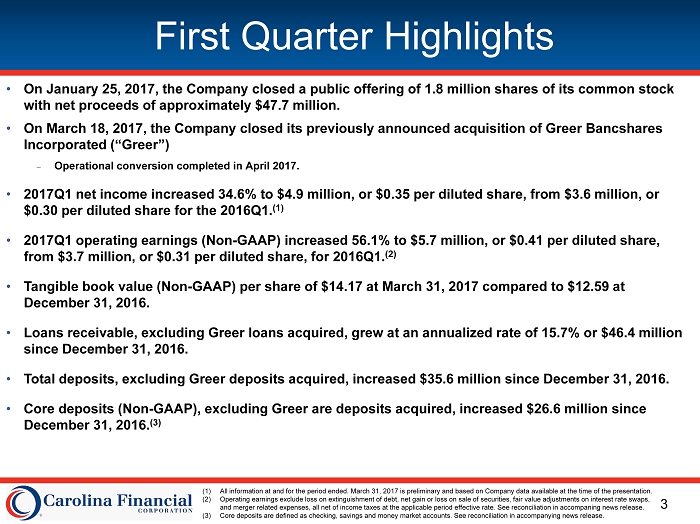
3 First Quarter Highlights • On January 25, 2017, the Company closed a public offering of 1.8 million shares of its common stock with net proceeds of approximately $47.7 million. • On March 18, 2017, the Company closed its previously announced acquisition of Greer Bancshares Incorporated (“Greer”) – O perational conversion completed in April 2017. • 2017Q1 net income increased 34.6% to $4.9 million, or $0.35 per diluted share, from $3.6 million, or $0.30 per diluted share for the 2016Q1. (1) • 2017Q1 operating earnings (Non - GAAP) increased 56.1% to $5.7 million, or $0.41 per diluted share, from $3.7 million, or $0.31 per diluted share, for 2016Q1. (2) • Tangible book value (Non - GAAP) per share of $14.17 at March 31, 2017 compared to $ 12.59 at December 31, 2016. • Loans receivable, excluding Greer loans acquired, grew at an annualized rate of 15.7% or $46.4 million since December 31, 2016 . • Total deposits, excluding Greer deposits acquired, increased $35.6 million since December 31, 2016. • Core deposits (Non - GAAP), excluding Greer are deposits acquired, increased $26.6 million since December 31, 2016 . (3) (1) All information at and for the period ended. March 31, 2017 is preliminary and based on Company data available at the time of th e presentation. (2) Operating earnings exclude loss on extinguishment of debt, net gain or loss on sale of securities, fair value adjustments on int erest rate swaps, and merger related expenses, all net of income taxes at the applicable period effective rate. See reconciliation in accompaning news release. (3) Core deposits are defined as checking, savings and money market accounts. See reconciliation in accompanying news release.
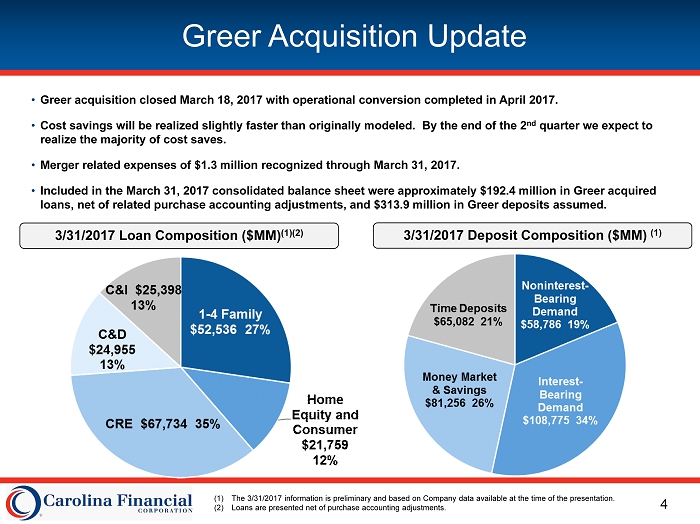
4 Greer Acquisition Update • Greer acquisition closed March 18, 2017 with operational conversion completed in April 2017. • Cost savings will be realized slightly faster than originally modeled. By the end of the 2 nd quarter we expect to realize the majority of cost saves. • Merger related expenses of $1.3 million recognized through March 31, 2017. • Included in the March 31, 2017 consolidated balance sheet were approximately $192.4 million in Greer acquired loans, net of related purchase accounting adjustments, and $313.9 million in Greer deposits assumed. (1) The 3/31/2017 information is preliminary and based on Company data available at the time of the presentation. (2) Loans are presented net of purchase accounting adjustments. 3/31/2017 Loan Composition ($M M ) (1)(2) 3/31/2017 Deposit Composition ($MM) ( 1 )
5 Community Banking Segment Results
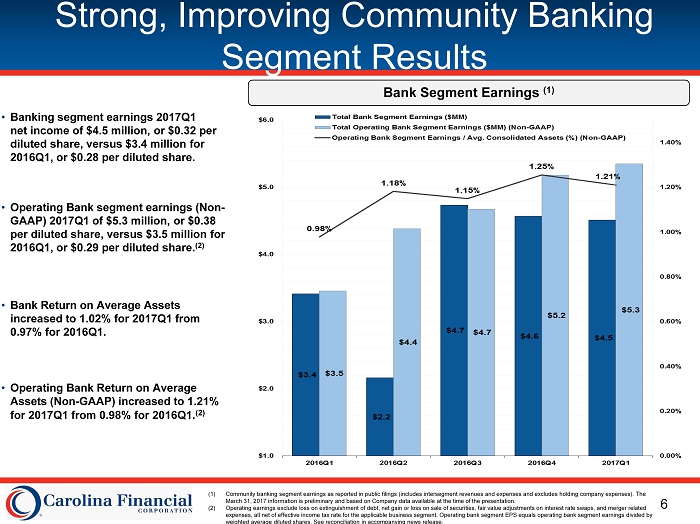
6 Strong, Improving Community Banking Segment Results Bank Segment Earnings (1) • Banking segment earnings 2017Q1 net income of $4.5 million, or $0.32 per diluted share, versus $3.4 million for 2016Q1, or $0.28 per diluted share. • Operating Bank segment earnings (Non - GAAP) 2017Q1 of $5.3 million, or $0.38 per diluted share, versus $3.5 million for 2016Q1, or $0.29 per diluted share. (2) • Bank Return on Average Assets increased to 1.02% for 2017Q1 from 0.97% for 2016Q1. • Operating Bank Return on Average Assets (Non - GAAP) increased to 1.21% for 2017Q1 from 0.98% for 2016Q1 . ( 2) 2011Y 2012Y ($18.7) (1) Community banking segment earnings as reported in public filings (includes intersegment revenues and expenses and excludes ho ldi ng company expenses). The March 31, 2017 information is preliminary and based on Company data available at the time of the presentation. (2) Operating earnings exclude loss on extinguishment of debt, net gain or loss on sale of securities, fair value adjustments on interest rate swaps, and merger related expenses , all net of effective income tax rate for the applicable business segment. Operating bank segment EPS equals operating bank segment earni ngs divided by weighted average diluted shares. See reconciliation in accompanying news release.
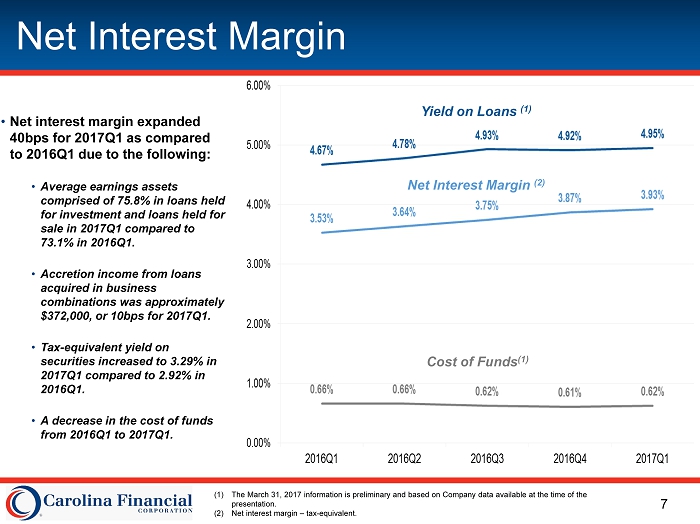
7 Net Interest Margin (1) The March 31, 2017 information is preliminary and based on Company data available at the time of the presentation. (2) Net interest margin – tax - equivalent. • Net interest margin expanded 40bps for 2017Q1 as compared to 2016Q1 due to the following: • Average earnings assets comprised of 75.8% in loans held for investment and loans held for sale in 2017Q1 compared to 73.1% in 2016Q1. • Accretion income from loans acquired in business combinations was approximately $372,000, or 10bps for 2017Q1. • Tax - equivalent yield on securities increased to 3.29% in 2017Q1 compared to 2.92% in 2016Q1. • A decrease in the cost of funds from 2016Q1 to 2017Q1. Cost of Funds (1) Yield on Loans (1) Net Interest Margin (2)
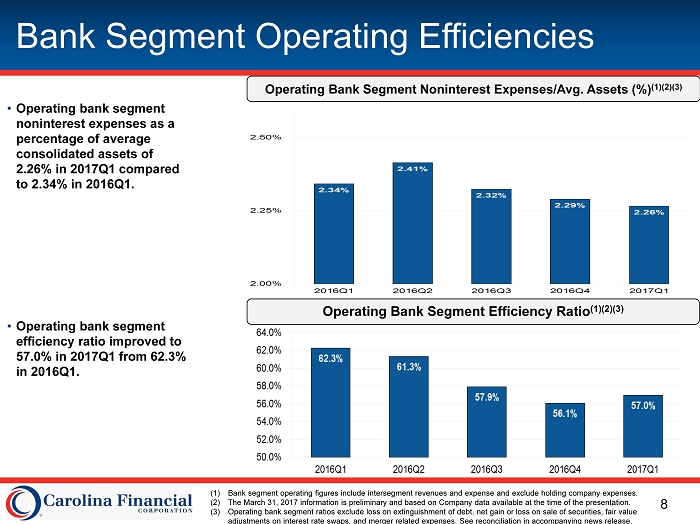
8 Bank Segment Operating Efficiencies • Operating bank s egment n oninterest expenses as a percentage of average consolidated assets of 2.26% in 2017Q1 compared to 2.34% in 2016Q1. • Operating bank segment efficiency ratio improved to 57.0% in 2017Q1 from 62.3% in 2016Q1. Operating Bank Segment Noninterest Expenses/Avg. Assets (%) (1)(2)(3) (1) Bank segment operating figures include intersegment revenues and expense and exclude holding company expenses. (2) The March 31, 2017 information is preliminary and based on Company data available at the time of the presentation. (3) Operating bank segment ratios exclude loss on extinguishment of debt, net gain or loss on sale of securities, fair value adjustments on interest rate swaps, and merger related expenses. See reconciliation in accompanying news release. ( 2 ) Operating Bank Segment Efficiency Ratio (1)(2)(3)
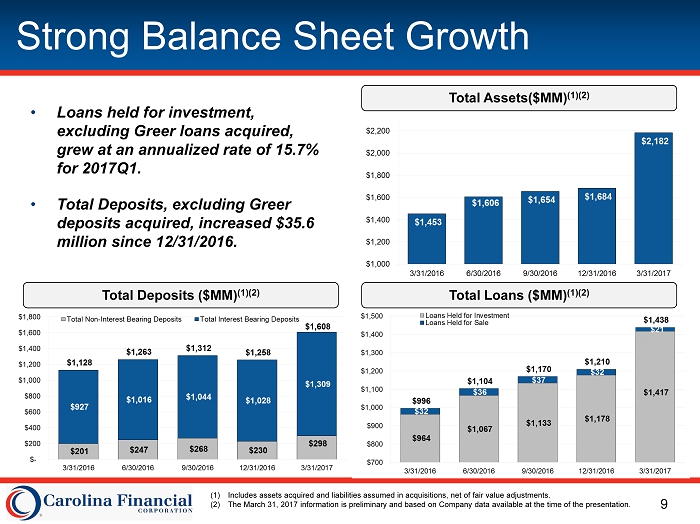
9 Strong Balance Sheet Growth • Loans held for investment, excluding Greer loans acquired, grew at an annualized rate of 15.7% for 2017Q1. • Total Deposits, excluding Greer deposits acquired, increased $35.6 million since 12/31/2016. Total Deposits ($MM) ( 1 )(2) Total Loans ($MM) (1)(2) Total Assets($MM) ( 1 )(2) (1) Includes assets acquired and liabilities assumed in acquisitions, net of fair value adjustments. (2) The March 31, 2017 information is preliminary and based on Company data available at the time of the presentation.
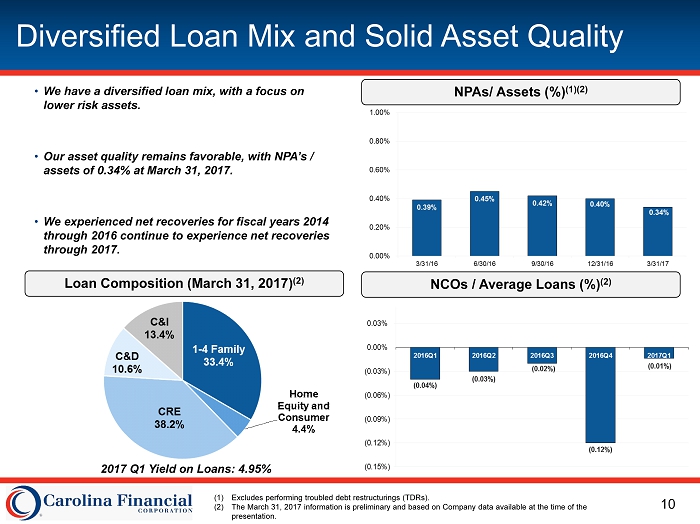
10 Diversified Loan Mix and Solid Asset Quality NPAs/ Assets (%) (1)(2) • We have a diversified loan mix, with a focus on lower risk assets. • Our asset quality remains favorable, with NPA’s / assets of 0.34% at March 31, 2017. • We experienced net recoveries for fiscal years 2014 through 2016 continue to experience net recoveries through 2017. (1) Excludes performing troubled debt restructurings (TDRs ). (2) The March 31, 2017 information is preliminary and based on Company data available at the time of the presentation. NCOs / Average Loans (%) ( 2) Loan Composition (March 31, 2017) (2) 2017 Q1 Yield on Loans: 4.95%
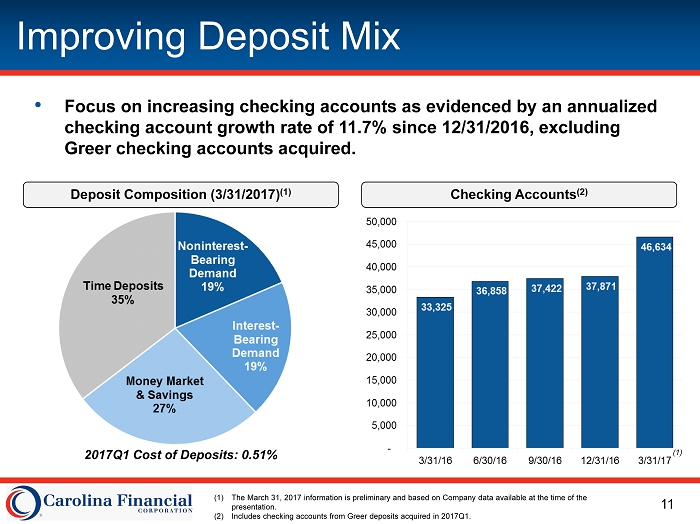
11 Improving Deposit Mix Deposit Composition (3/31/2017) (1) Checking Accounts (2) • Focus on increasing checking accounts as evidenced by an annualized checking account growth rate of 11.7% since 12/31/2016, excluding Greer checking accounts acquired. 2017Q1 Cost of Deposits: 0.51% (1) The March 31, 2017 information is preliminary and based on Company data available at the time of the presentation. (2) Includes checking accounts from Greer deposits acquired in 2017Q1. (1)
12 Attractive Wholesale Mortgage Platform
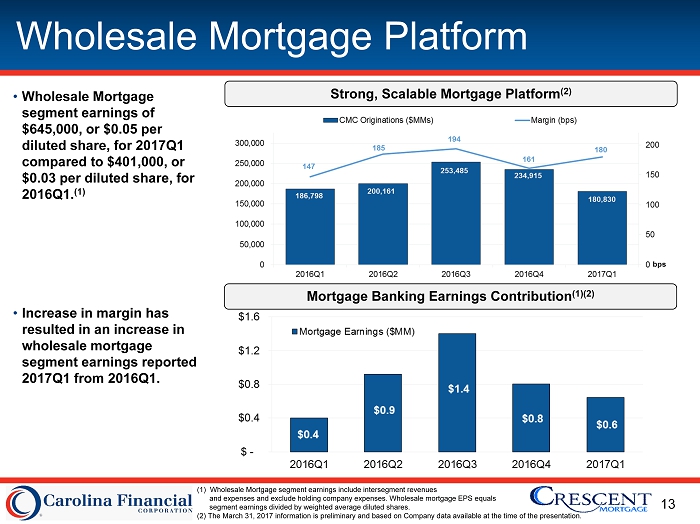
13 Wholesale Mortgage Platform Strong, Scalable Mortgage Platform (2 ) • Wholesale Mortgage segment earnings of $645,000, or $0.05 per diluted share, for 2017Q1 compared to $401,000, or $0.03 per diluted share, for 2016Q1. (1) • Increase in margin has resulted in an increase in wholesale mortgage segment earnings reported 2017Q1 from 2016Q1. Mortgage Banking Earnings Contribution (1)(2) (1) Wholesale Mortgage segment earnings include intersegment revenues and expenses and exclude holding company expenses. Wholesale mortgage EPS equals segment earnings divided by weighted average diluted shares. (2) The March 31, 2017 information is preliminary and based on Company data available at the time of the presentation.
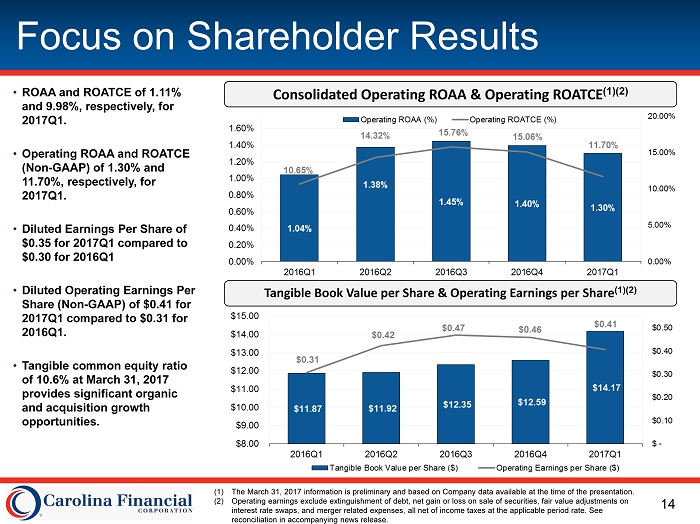
14 Focus on Shareholder Results • ROAA and ROATCE of 1.11% and 9.98%, respectively, for 2017Q1. • Operating ROAA and ROATCE (Non - GAAP) of 1.30% and 11.70%, respectively, for 2017Q1. • Diluted Earnings Per Share of $ 0.35 for 2017Q1 compared to $ 0.30 for 2016Q1 • Diluted Operating Earnings Per Share (Non - GAAP) of $ 0.41 for 2017Q1 compared to $ 0.31 for 2016Q1. • Tangible common equity ratio of 10.6% at March 31, 2017 provides significant organic and acquisition growth opportunities. Consolidated Operating ROAA & Operating ROATCE (1)(2) Tangible Book Value per Share & Operating Earnings per Share (1)(2) (1) The March 31, 2017 information is preliminary and based on Company data available at the time of the presentation. (2) Operating earnings exclude extinguishment of debt, net gain or loss on sale of securities, fair value adjustments on interest rate swaps, and merger related expenses , all net of income taxes at the applicable period rate . See reconciliation in accompanying news release.