
Third Quarter 2018 Earnings Release Investor Presentation NASDAQ: CARO October 24, 2018

2 Disclaimer Certain statements in this presentation contain “forward - looking statements” within the meaning of the Private Securities Litigation Reform Act of 1995 , such as statements relating to future plans and expectations, and are thus prospective . Such forward - looking statements include but are not limited to statements with respect to plans, objectives, expectations, and intentions and other statements that are not historical facts, and other statements identified by words such as “believes,” “expects,” “anticipates,” “estimates,” “intends,” “plans,” “targets,” and “projects,” as well as similar expressions . Such statements are subject to risks, uncertainties, and other factors which could cause actual results to differ materially from future results expressed or implied by such forward - looking statements . Although we believe that the assumptions underlying the forward - looking statements are reasonable, any of the assumptions could prove to be inaccurate . Therefore, we can give no assurance that the results contemplated in the forward - looking statements will be realized . The inclusion of this forward - looking information should not be construed as a representation by Carolina Financial Corporation (“Carolina Financial” or the “Company”) or any person that such future events, plans, or expectations will occur or be achieved . In addition to factors previously disclosed in the reports filed by Carolina Financial with the Securities and Exchange Commission (the “SEC”), additional risks and uncertainties may include, but are not limited to : ( 1 ) competitive pressures among depository and other financial institutions may increase significantly and have an effect on pricing, spending, third - party relationships and revenues ; ( 2 ) the strength of the United States economy in general and the strength of the local economies in which we conduct operations may be different than expected resulting in, among other things, a deterioration in the credit quality or a reduced demand for credit, including the resultant effect on the Company’s loan portfolio and allowance for loan losses ; ( 3 ) the rate of delinquencies and amounts of charge - offs, the level of allowance for loan loss, the rates of loan growth, or adverse changes in asset quality in our loan portfolio, which may result in increased credit risk - related losses and expenses ; ( 4 ) the risk that the preliminary financial information reported herein and our current preliminary analysis will be different when our review is finalized ; ( 5 ) changes in the U . S . legal and regulatory framework including, but not limited to, the Dodd - Frank Act and regulations adopted thereunder ; ( 6 ) adverse conditions in the stock market, the public debt market and other capital markets (including changes in interest rate conditions) could have a negative impact on the Company ; ( 7 ) the business related to acquisitions may not be integrated successfully or such integration may take longer to accomplish than expected ; ( 8 ) the expected cost savings and any revenue synergies from acquisitions may not be fully realized within expected timeframes ; ( 9 ) disruption from acquisitions may make it more difficult to maintain relationships with clients, associates, or suppliers ; and ( 10 ) the impact of recent and future hurricanes and other natural disasters on our loan portfolio and the economic prospects of our coastal markets . Additional factors that could cause our results to differ materially from those described in the forward - looking statements can be found in the reports (such as our Annual Report on Form 10 - K, Quarterly Reports on Form 10 - Q and Current Reports on Form 8 - K) filed with the SEC and available at the SEC’s Internet site (http : //www . sec . gov) . All subsequent written and oral forward - looking statements concerning the Company or any person acting on its behalf is expressly qualified in its entirety by the cautionary statements above . We do not undertake any obligation to update any forward - looking statement to reflect circumstances or events that occur after the date the forward - looking statements are made . This presentation and the accompanying news release contain financial information determined by methods other than in accordance with generally accepted accounting principles (“GAAP”) . Such statements should be read along with the tables in the accompanying news release, which provide a reconciliation of non - GAAP measures to GAAP measures . This presentation and the accompanying news release discuss financial measures, such as core deposits, tangible book value, operating earnings and net income related to segments of the Company, which are non - GAAP measures . We believe that such non - GAAP measures are useful because they enhance the ability of investors and management to evaluate and compare the Company’s operating results from period to period in a meaningful manner . Non - GAAP measures should not be considered as an alternative to any measure of performance as promulgated under GAAP . Investors should consider the Company’s performance and financial condition as reported under GAAP and all other relevant information when assessing the performance or financial condition of the company . Non - GAAP measures have limitations as analytical tools, and investors should not consider them in isolation or as a substitute for analysis of the Company's results or financial condition as reported under GAAP .

3 Third Quarter Highlights • 2018 Q 3 net income was $ 15 . 2 million, or $ 0 . 66 per diluted share compared to $ 8 . 0 million, or $ 0 . 49 per diluted share for the 2017 Q 3 . ( 1 ) • 2018 Q 3 operating earnings (Non - GAAP) increased 94 . 7 % to $ 15 . 4 million, or $ 0 . 67 per diluted share, from $ 7 . 9 million, or $ 0 . 49 per diluted share, for 2017 Q 3 . ( 2 ) • Loans receivable, gross grew at an annualized rate of 7 . 9 % or $ 137 . 9 million since December 31 , 2017 . • Provision for loan losses in 2018 Q 3 of $ 750 , 000 primarily driven by organic loan growth and hurricane related impacts . • Total deposits increased $ 154 . 7 million since December 31 , 2017 . • Core deposits (Non - GAAP) increased $ 49 . 0 million since December 31 , 2017 . ( 3 ) • Tangible common book value per share (Non - GAAP) of $ 18 . 69 at September 30 , 2018 compared to $ 15 . 71 December 31 , 2017 . (1) All information at and for the period ended September 30, 2018 is preliminary and based on Company data available at the time of the presentation. (2) Operating earnings exclude loss on extinguishment of debt, net gain or loss on sale of securities, fair value adjustments on int erest rate swaps, and merger related expenses, all net of income taxes at the applicable period effective rate. (3) Core deposits are defined as demand deposits, savings accounts and money market accounts.

4 Hurricane Florence Impact • Hurricane Florence made landfall on September 14 th near Wilmington, North Carolina as a Category 2 storm . • Our businesses experienced impacts in September due to business interruptions, particularly in the wholesale mortgage business . • A number of our branches are located in directly affected areas . Approximately 2 / 3 of our branches were closed beginning approximately September 11 , 2018 as a result of evacuation orders . As of Monday, September 17 , 51 of 62 branches were re - opened . As of today, all but one branch are fully operational . Customer support functions remained operational to assist customers . • To assist customers through the hurricane, we waived foreign ATM fees for the weeks before and after the hurricane . • The impact of Florence on our markets is not completely known . However, a number of effects of the hurricane impacted our operating earnings . These areas include : – Limited mortgage banking activities throughout most of September in Eastern and Coastal markets . – Delayed closings on mortgage loans, in which we provided free extensions to customers, reducing margin . – Costs related to relocating employees, repairs of facilities, compensation costs and contributions to relief efforts . – Delayed closings on commercial loans and limited business activity for most of September in the affected areas . – Increased provision for loan losses for unknown effects of Florence . • The aggregate financial effects of these items was a reduction in income and increased expense of approximately $ 500 , 000 to $ 600 , 000 pretax for the quarter .

5 Community Banking Segment

6 Community Banking Segment Results Bank Segment Earnings (1) • 2018Q3 community banking segment net income of $15.3 million, or $0.67 per diluted share, versus $7.8 million for 2017Q3, or $0.48 per diluted share. • 2018Q3 operating earnings (Non - GAAP) of $15.4 million, or $0.67 per diluted share, versus $7.7 million for 2017Q3, or $0.48 per diluted share. (2) • Segment results were impacted by Hurricane Florence as discussed earlier. • Segment Return on Average Assets was 1.67% for 2018Q3 compared to 1.41% for 2017Q3. • Segment Operating Return on Average Assets (Non - GAAP) increased to 1.68% for 2018Q3 from 1.39% for 2017Q3. ( 2) 2011Y 2012Y ($18.7) (1) Community banking segment earnings as reported in public filings (includes intersegment revenues and expenses and excludes ho ldi ng company expenses). The September 30, 2018 information is preliminary and based on Company data available at the time of the presentation. (2) Operating earnings exclude loss on extinguishment of debt, net gain or loss on sale of securities, fair value adjustments on interest rate swaps, and merger related expenses , all net of effective income tax rate for the applicable business segment, adjusted for the Tax Act impact on deferred tax assets and lia bil ities. Operating bank segment EPS equals operating bank segment earnings divided by weighted average diluted shares. $7.8 $6.1 $4.0 $14.9 $15.3 $7.7 $10.9 $14.9 $15.6 $15.4 1.39% 1.43% 1.69% 1.72% 1.69% 0.00% 0.50% 1.00% 1.50% 2.00% 2.50% $1.0 $2.0 $3.0 $4.0 $5.0 $6.0 $7.0 $8.0 $9.0 $10.0 $11.0 $12.0 $13.0 $14.0 $15.0 $16.0 $17.0 $18.0 $19.0 $20.0 2017Q3 2017Q4 2018Q1 2018Q2 2018Q3 Total Community Banking Net Income ($MM) Total Community Banking Operating Earnings ($MM) (Non-GAAP) Community Banking Operating Earnings / Avg. Consolidated Assets (%) (Non-GAAP)

7 5.07% 5.32% 5.49% 5.43% 5.51% 3.94% 4.19% 4.20% 4.11% 4.15% 0.70% 0.68% 0.73% 0.85% 0.92% 0.00% 1.00% 2.00% 3.00% 4.00% 5.00% 6.00% 2017Q3 2017Q4 2018Q1 2018Q2 2018Q3 Net Interest Margin (1) The September 30, 2018 information is preliminary and based on Company data available at the time of the presentation. (2) Net interest margin – tax - equivalent. Net interest margin - TEY increased 4bps for 2018Q3 as compared to 2018Q2. Increases in the yield on loans and securities were partially offset by increases in the costs of funds. Yield on loans, excluding loan accretion income, increased 3bps from 2018Q2. TEY on securities increased to 3.59% in 2018Q3 compared to 3.43% in 2018Q2. Accretion income from loans acquired was approximately $2.2 million , or 37bps for 2018Q3 compared to $1.9 million, or 32bps for 2018Q2. Increase in the cost of funds of 7bps between 2018Q2 to 2018Q3. Continued rate hikes of 25bps each: 3 - 16 - 2017, 6 - 15 - 2017, 12 - 14 - 2017, 3 - 21 - 2018, 6 - 13 - 2018 and 9 - 26 - 2018. Yield on Loans (1) Net Interest Margin (2) Cost of Funds (1)
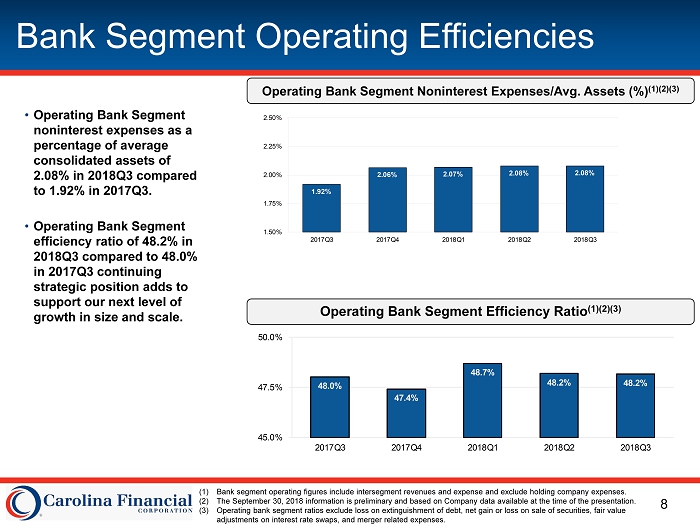
8 Bank Segment Operating Efficiencies • Operating Bank Segment noninterest expenses as a percentage of average consolidated assets of 2.08% in 2018Q3 compared to 1.92% in 2017Q3. • Operating Bank S egment efficiency ratio of 48.2% in 2018Q3 compared to 48.0% in 2017Q3 continuing strategic position adds to support our next level of growth in size and scale. Operating Bank Segment Noninterest Expenses/Avg. Assets (%) (1)(2)(3) (1) Bank segment operating figures include intersegment revenues and expense and exclude holding company expenses. (2) The September 30, 2018 information is preliminary and based on Company data available at the time of the presentation. (3) Operating bank segment ratios exclude loss on extinguishment of debt, net gain or loss on sale of securities, fair value adjustments on interest rate swaps, and merger related expenses. ( 2 ) Operating Bank Segment Efficiency Ratio (1)(2)(3) 1.92% 2.06% 2.07% 2.08% 2.08% 1.50% 1.75% 2.00% 2.25% 2.50% 2017Q3 2017Q4 2018Q1 2018Q2 2018Q3 48.0% 47.4% 48.7% 48.2% 48.2% 45.0% 47.5% 50.0% 2017Q3 2017Q4 2018Q1 2018Q2 2018Q3

9 Strong Balance Sheet Growth • Loans receivable, gross grew at an annualized rate of 7.9% since 12 - 2017. • Total deposits increased $154.7 million since 12 - 2017. Total Deposits ($MM) ( 1 )(2) Total Loans ($MM) (1)(2) Total Assets($MM) ( 1 )(2) (1) Includes assets acquired and liabilities assumed in acquisitions, net of fair value adjustments. (2) The September 30, 2018 information is preliminary and based on Company data available at the time of the presentation. $333 $526 $548 $578 $567 $1,374 $2,079 $2,129 $2,131 $2,192 $1,708 $2,605 $2,677 $2,709 $2,760 $- $500 $1,000 $1,500 $2,000 $2,500 $3,000 $3,500 2017Q3 2017Q4 2018Q1 2018Q2 2018Q3 Total Non-Interest Bearing Deposits Total Interest Bearing Deposits $1,484 $2,308 $2,367 $2,414 $2,444 $27 $35 $25 $39 $25 $1,511 $2,343 $2,392 $2,454 $2,469 $- $500 $1,000 $1,500 $2,000 $2,500 $3,000 2017Q3 2017Q4 2018Q1 2018Q2 2018Q3 Loans Held for Investment Loans Held for Sale $2,257 $3,519 $3,553 $3,693 $3,721 $1,000 $1,500 $2,000 $2,500 $3,000 $3,500 $4,000 2017Q3 2017Q4 2018Q1 2018Q2 2018Q3

10 Diversified Loan Mix and Solid Asset Quality NPAs/ Assets (%) (1)(2) • We have a diversified loan mix, with a focus on lower risk assets. • Our asset quality remains favorable, with NPA’s / assets of 0.32% at September 30, 2018. • Provision for loan loss of $750,000 in 2018Q3 primarily driven by organic loan growth and potential hurricane related impacts. (1) Excludes performing troubled debt restructurings (TDRs ) and purchased credit impaired loans.. (2) September 30, 2018 information is preliminary and based on Company data available at the time of the presentation. NCOs / Average Loans (%) ( 2) Loan Composition (9/30/2018) (2) 2018Q3 Yield on Loans: 5.51% 0.29% 0.20% 0.30% 0.28% 0.32% 0.10% 0.15% 0.20% 0.25% 0.30% 0.35% 9/30/17 12/31/17 3/31/18 6/30/18 9/30/18 0.02% 0.02% (0.21%) 0.04% 0.02% (0.25%) (0.22%) (0.19%) (0.16%) (0.13%) (0.10%) (0.07%) (0.04%) (0.01%) 0.02% 0.05% 2017Q3 2017Q4 2018Q1 2018Q2 2018Q3 1 - 4 Family 30.1% Home Equity and Consumer 4.3% CRE 39.5% C&D 12.6% C&I 13.6%

11 Improving Deposit Mix Deposit Composition (9/30/2018) (1) • We grew Total Deposits $154.7 million and Core Deposits $49 million since December 31, 2017. 2018Q3 Cost of Deposits: 0.73% (1) The September 30, 2018 information is preliminary and based on Company data available at the time of the presentation. (1) Noninterest - Bearing Demand 21% Interest - Bearing Demand 21% Money Market & Savings 23% Time Deposits 35%
12 Wholesale Mortgage Segment
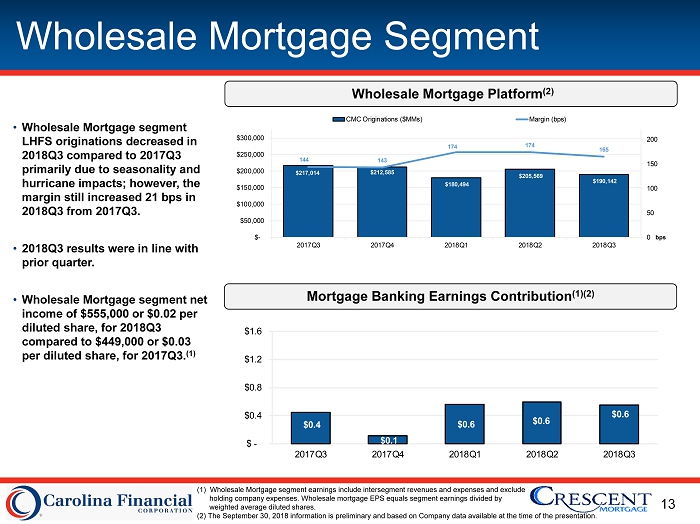
13 Wholesale Mortgage Segment Wholesale Mortgage Platform (2 ) • Wholesale Mortgage segment LHFS originations decreased in 2018Q3 compared to 2017Q3 primarily due to seasonality and hurricane impacts; however, the margin still increased 21 bps in 2018Q3 from 2017Q3. • 2018Q3 results were in line with prior quarter. • Wholesale Mortgage segment net income of $555,000 or $0.02 per diluted share, for 2018Q3 compared to $449,000 or $0.03 per diluted share, for 2017Q3. (1) Mortgage Banking Earnings Contribution (1)(2) (1) Wholesale Mortgage segment earnings include intersegment revenues and expenses and exclude holding company expenses. Wholesale mortgage EPS equals segment earnings divided by weighted average diluted shares. (2) The September 30, 2018 information is preliminary and based on Company data available at the time of the presentation. $0.4 $0.1 $0.6 $0.6 $0.6 $ - $0.4 $0.8 $1.2 $1.6 2017Q3 2017Q4 2018Q1 2018Q2 2018Q3 $217,014 $212,585 $180,494 $205,569 $190,142 144 143 174 174 165 0 50 100 150 200 $- $50,000 $100,000 $150,000 $200,000 $250,000 $300,000 2017Q3 2017Q4 2018Q1 2018Q2 2018Q3 bps CMC Originations ($MMs) Margin (bps)

14 Focus on Stockholder Results • ROAA and ROATCE of 1.66% and 14.68%, respectively, for 2018Q3. • Operating ROAA and ROATCE (Non - GAAP) of 1.68% and 14.85%, respectively, for 2018Q3. • On June 11, 2018, the Company completed the sale of 1.5 million shares of its common stock with net proceeds of approximately $63.0 million. • Diluted Earnings Per Share of $0.66 2018Q3 compared to $0.49 for 2017Q3. • Diluted Operating Earnings Per Share (Non - GAAP) of $0.67 for 2018Q3 compared to $0.49 for 2017Q3. • Tangible Common Book Value per share of $18.69 for 2018Q3 compared to $15.27 for 2017Q3. Consolidated Operating ROAA & Operating ROATCE (1)(2) Tangible Book Value per Share & Operating Earnings per Share (1)(2) (1) The September 30, 2018 information is preliminary and based on Company data available at the time of the presentation. (2) Operating earnings exclude extinguishment of debt, net gain or loss on sale of securities, fair value adjustments on interest rate swaps, and merger related expenses , all net of income taxes at the applicable period rate . $15.27 $15.71 $15.71 $18.11 $18.69 $0.49 $0.57 $0.71 $0.73 $0.67 $ - $0.10 $0.20 $0.30 $0.40 $0.50 $0.60 $0.70 $0.80 $10.00 $11.00 $12.00 $13.00 $14.00 $15.00 $16.00 $17.00 $18.00 $19.00 2017Q3 2017Q4 2018Q1 2018Q2 2018Q3 Tangible Book Value per Share ($) Operating Earnings per Share ($) 1.42% 1.46% 1.70% 1.72% 1.68% 13.08% 15.44% 18.06% 17.74% 14.85% 0.00% 5.00% 10.00% 15.00% 20.00% 0.00% 0.20% 0.40% 0.60% 0.80% 1.00% 1.20% 1.40% 1.60% 1.80% 2017Q3 2017Q4 2018Q1 2018Q2 2018Q3 Operating ROAA (%) Operating ROATCE (%)