
First Quarter 2019 Earnings Release Investor Presentation NASDAQ: CARO April 24, 2019
2 Disclaimer Certain statements in this presentation contain “forward - looking statements” within the meaning of the Private Securities Litigation Reform Act of 1995 , such as statements relating to future plans and expectations, and are thus prospective . Such forward - looking statements include but are not limited to statements with respect to plans, objectives, expectations, and intentions and other statements that are not historical facts, and other statements identified by words such as “believes,” “expects,” “anticipates,” “estimates,” “intends,” “plans,” “targets,” and “projects,” as well as similar expressions . Such statements are subject to risks, uncertainties, and other factors which could cause actual results to differ materially from future results expressed or implied by such forward - looking statements . Although we believe that the assumptions underlying the forward - looking statements are reasonable, any of the assumptions could prove to be inaccurate . Therefore, we can give no assurance that the results contemplated in the forward - looking statements will be realized . The inclusion of this forward - looking information should not be construed as a representation by Carolina Financial Corporation (“Carolina Financial” or the “Company”) or any person that such future events, plans, or expectations will occur or be achieved . In addition to factors previously disclosed in the reports filed by Carolina Financial with the Securities and Exchange Commission (the “SEC”), additional risks and uncertainties may include, but are not limited to : ( 1 ) competitive pressures among depository and other financial institutions may increase significantly and have an effect on pricing, spending, third - party relationships and revenues ; ( 2 ) the strength of the United States economy in general and the strength of the local economies in which we conduct operations may be different than expected resulting in, among other things, a deterioration in the credit quality or a reduced demand for credit, including the resultant effect on the Company’s loan portfolio and allowance for loan losses ; ( 3 ) the rate of delinquencies and amounts of charge - offs, the level of allowance for loan loss, the rates of loan growth, or adverse changes in asset quality in our loan portfolio, which may result in increased credit risk - related losses and expenses ; ( 4 ) the risk that the preliminary financial information reported herein and our current preliminary analysis will be different when our review is finalized ; ( 5 ) changes in the U . S . legal and regulatory framework including, but not limited to, the Dodd - Frank Act and regulations adopted thereunder ; ( 6 ) adverse conditions in the stock market, the public debt market and other capital markets (including changes in interest rate conditions) could have a negative impact on the Company ; ( 7 ) the business related to acquisitions may not be integrated successfully or such integration may take longer to accomplish than expected ; ( 8 ) the expected cost savings and any revenue synergies from acquisitions may not be fully realized within expected timeframes ; ( 9 ) disruption from acquisitions may make it more difficult to maintain relationships with clients, associates, or suppliers ; and ( 10 ) the impact of hurricanes and other natural disasters on our loan portfolio and the economic prospects of our coastal markets . Additional factors that could cause our results to differ materially from those described in the forward - looking statements can be found in the reports (such as our Annual Report on Form 10 - K, Quarterly Reports on Form 10 - Q and Current Reports on Form 8 - K) filed with the SEC and available at the SEC’s Internet site (http : //www . sec . gov) . All subsequent written and oral forward - looking statements concerning the Company or any person acting on its behalf is expressly qualified in its entirety by the cautionary statements above . We do not undertake any obligation to update any forward - looking statement to reflect circumstances or events that occur after the date the forward - looking statements are made . This presentation and the accompanying news release contain financial information determined by methods other than in accordance with generally accepted accounting principles (“GAAP”) . Such statements should be read along with the tables in the accompanying news release, which provide a reconciliation of non - GAAP measures to GAAP measures . This presentation and the accompanying news release discuss financial measures, such as core deposits, tangible book value, operating earnings, net interest margin - core and yield on loans receivable - core, which are non - GAAP measures . We believe that such non - GAAP measures are useful because they enhance the ability of investors and management to evaluate and compare the Company’s operating results from period to period in a meaningful manner . Non - GAAP measures should not be considered as an alternative to any measure of performance as promulgated under GAAP . Investors should consider the Company’s performance and financial condition as reported under GAAP and all other relevant information when assessing the performance or financial condition of the company . Non - GAAP measures have limitations as analytical tools, and investors should not consider them in isolation or as a substitute for analysis of the Company's results or financial condition as reported under GAAP .

3 First Quarter Highlights • 2019 Q 1 net income increased 258 . 6 % to $ 14 . 5 million, or $ 0 . 65 per diluted share compared to $ 4 . 1 million, or $ 0 . 19 per diluted share for 2018 Q 1 . ( 1 ) • 2019 Q 1 operating earnings (Non - GAAP) decreased 1 . 8 % to $ 14 . 7 million, or $ 0 . 66 per diluted share, from $ 14 . 9 million, or $ 0 . 71 per diluted share, for 2018 Q 1 . ( 2 ) • Loans receivable, gross grew $ 66 . 3 million from December 31 , 2018 , or at an annualized rate of 10 . 5 % . • Provision for loan losses in 2019 Q 1 of $ 700 , 000 primarily driven by organic loan growth . There was no provision for loan losses recorded during 2018 Q 1 . • Total deposits increased $ 98 . 9 million from December 31 , 2018 . • Tangible common book value per share (Non - GAAP) of $ 20 . 10 at March 31 , 2019 compared to $ 19 . 36 at December 31 , 2018 . • On December 3 , 2018 , the Company announced that the Board of Directors approved a plan to repurchase up to $ 25 , 000 , 000 in shares of the Company’s common stock through open market and privately negotiated transactions over the next three years . During the first quarter, the Company repurchased approximately 129 , 000 shares at an average price of $ 32 . 33 . (1) All information at and for the period ended March 31, 2019 is preliminary and based on Company data available at the time of the presentation. (2) Operating earnings exclude loss on extinguishment of debt, net gain or loss on sale of securities, fair value adjustments on int erest rate swaps, and merger related expenses, all net of income taxes at the applicable period effective rate.
4 Community Banking Segment

5 Community Banking Segment Results Bank Segment Earnings (1) • 2019Q1 community banking segment net income of $14.8 million, or $0.66 per diluted share, versus $4.0 million for 2018Q1, or $0.19 per diluted share. • 2019Q1 operating earnings (Non - GAAP) of $14.9 million, or $0.67 per diluted share, versus $14.9 million for 2018Q1, or $0.71 per diluted share. (2) • Segment Return on Average Assets was 1.55% for 2019Q1 compared to 0.45% for 2018Q1. • Segment Operating Return on Average Assets (Non - GAAP ) decreased to 1.56% for 2019Q1 from 1.69% for 2018Q1. (2) 2011Y 2012Y ($18.7) (1) Community banking segment earnings as reported in public filings (includes intersegment revenues and expenses and excludes ho ldi ng company expenses). The March 31, 2019 information is preliminary and based on Company data available at the time of the presentation. (2) Operating earnings exclude loss on extinguishment of debt, net gain or loss on sale of securities, fair value adjustments on int erest rate swaps, and merger related expenses, all net of effective income tax rate for the applicable business segment, adjusted for the Tax Act impact on deferred tax ass ets and liabilities. Operating bank segment EPS equals operating bank segment earnings divided by weighted average diluted shares.
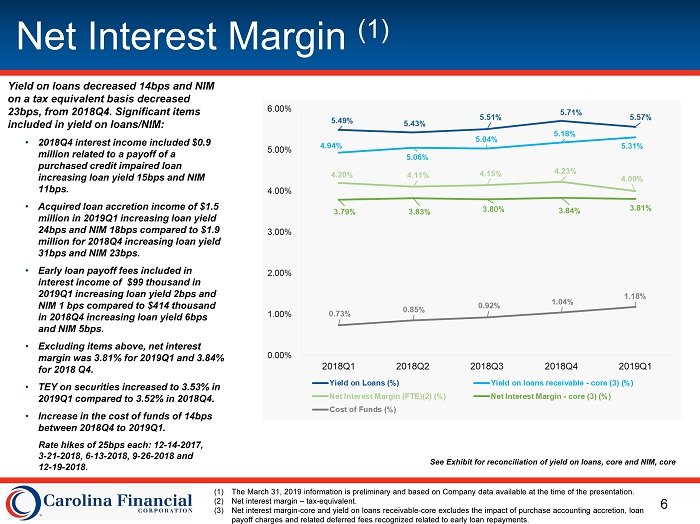
6 Net Interest Margin (1) (1) The March 31, 2019 information is preliminary and based on Company data available at the time of the presentation. (2) Net interest margin – tax - equivalent. (3) Net interest margin - core and yield on loans receivable - core excludes the impact of purchase accounting accretion, loan payoff charges and related deferred fees recognized related to early loan repayments. Yield on loans decreased 14bps and NIM on a tax equivalent basis decreased 23bps, from 2018Q4. Significant items included in yield on loans/NIM: • 2018Q4 interest income included $0.9 million related to a payoff of a purchased credit impaired loan increasing loan yield 15bps and NIM 11bps. • Acquired loan accretion income of $1.5 million in 2019Q1 increasing loan yield 24bps and NIM 18bps compared to $1.9 million for 2018Q4 increasing loan yield 31bps and NIM 23bps. • Early loan payoff fees included in interest income of $99 thousand in 2019Q1 increasing loan yield 2bps and NIM 1 bps compared to $414 thousand in 2018Q4 increasing loan yield 6bps and NIM 5bps. • Excluding items above, net interest margin was 3.81% for 2019Q1 and 3.84% for 2018 Q4. • TEY on securities increased to 3.53% in 2019Q1 compared to 3.52% in 2018Q4. • Increase in the cost of funds of 14bps between 2018Q4 to 2019Q1. Rate hikes of 25bps each: 12 - 14 - 2017, 3 - 21 - 2018, 6 - 13 - 2018, 9 - 26 - 2018 and 12 - 19 - 2018. See Exhibit for reconciliation of yield on loans, core and NIM, core
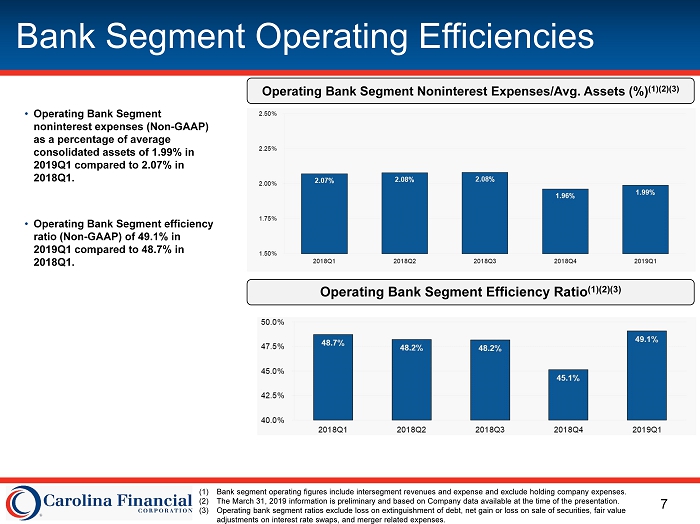
7 Bank Segment Operating Efficiencies • Operating Bank Segment noninterest expenses (Non - GAAP) as a percentage of average consolidated assets of 1.99% in 2019Q1 compared to 2.07% in 2018Q1. • Operating Bank Segment efficiency ratio (Non - GAAP) of 49.1% in 2019Q1 compared to 48.7% in 2018Q1. Operating Bank Segment Noninterest Expenses/Avg. Assets (%) (1)(2)(3) (1) Bank segment operating figures include intersegment revenues and expense and exclude holding company expenses. (2) The March 31, 2019 information is preliminary and based on Company data available at the time of the presentation. (3) Operating bank segment ratios exclude loss on extinguishment of debt, net gain or loss on sale of securities, fair value adjustments on interest rate swaps, and merger related expenses. Operating Bank Segment Efficiency Ratio (1)(2)(3)
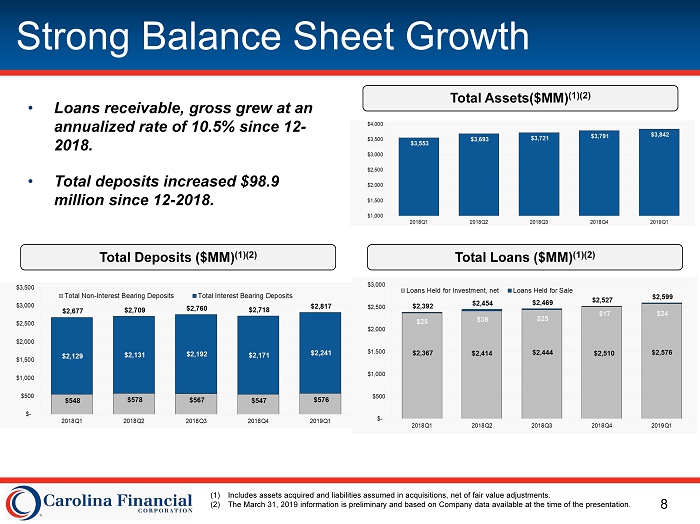
8 Strong Balance Sheet Growth • Loans receivable, gross grew at an annualized rate of 10.5% since 12 - 2018. • Total deposits increased $98.9 million since 12 - 2018. Total Deposits ($MM) (1)(2) Total Loans ($MM) (1)(2) Total Assets($MM) (1)(2) (1) Includes assets acquired and liabilities assumed in acquisitions, net of fair value adjustments. (2) The March 31, 2019 information is preliminary and based on Company data available at the time of the presentation.

9 Diversified Loan Mix and Solid Asset Quality NPAs/ Assets (%) (1)(2) • We have a diversified loan mix, with a focus on lower risk assets. • Our asset quality remains favorable, with NPA’s / assets of 0.34% at March 31, 2019. • Provision for loan loss of $700,000 in 2019Q1 primarily driven by organic loan growth. (1) Excludes performing troubled debt restructurings (TDRs) and purchased credit impaired loans. (2) March 31, 2019 information is preliminary and based on Company data available at the time of the presentation. NCOs / Average Loans (%) (2) Loan Composition (3/31/2019) (2) 2019Q1 Yield on Loans: 5.57%

10 Improving Deposit Mix Deposit Composition (3/31/2019) (1) • We grew Total Deposits $98.9 million since December 31, 2018. 2019Q1 Cost of Deposits: 0.93% (1) The March 31, 2019 information is preliminary and based on Company data available at the time of the presentation. (1)

11 Wholesale Mortgage Segment
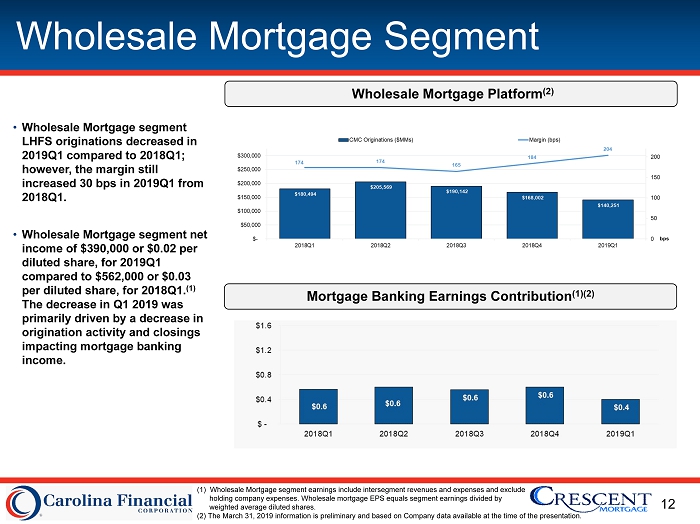
12 Wholesale Mortgage Segment Wholesale Mortgage Platform (2) • Wholesale Mortgage segment LHFS originations decreased in 2019Q1 compared to 2018Q1; however, the margin still increased 30 bps in 2019Q1 from 2018Q1. • Wholesale Mortgage segment net income of $390,000 or $0.02 per diluted share, for 2019Q1 compared to $562,000 or $0.03 per diluted share, for 2018Q1. (1) The decrease in Q1 2019 was primarily driven by a decrease in origination activity and closings impacting mortgage banking income. Mortgage Banking Earnings Contribution (1)(2) (1) Wholesale Mortgage segment earnings include intersegment revenues and expenses and exclude holding company expenses. Wholesale mortgage EPS equals segment earnings divided by weighted average diluted shares. (2) The March 31, 2019 information is preliminary and based on Company data available at the time of the presentation.
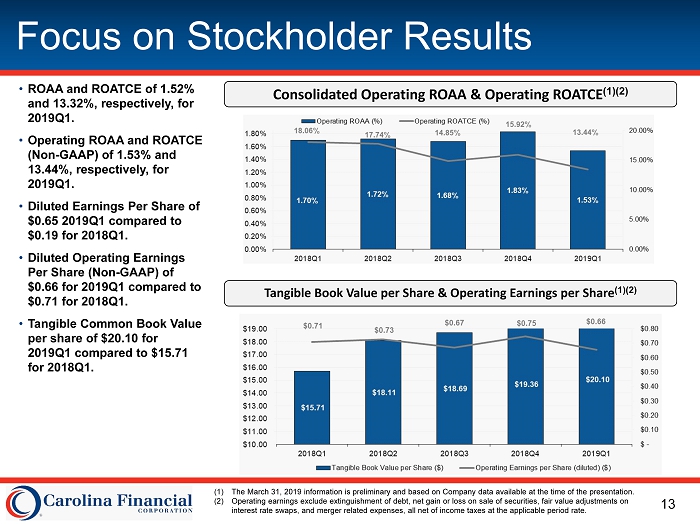
13 Focus on Stockholder Results • ROAA and ROATCE of 1.52% and 13.32%, respectively, for 2019Q1. • Operating ROAA and ROATCE (Non - GAAP) of 1.53% and 13.44%, respectively, for 2019Q1. • Diluted Earnings Per Share of $0.65 2019Q1 compared to $0.19 for 2018Q1. • Diluted Operating Earnings Per Share (Non - GAAP) of $0.66 for 2019Q1 compared to $0.71 for 2018Q1. • Tangible Common Book Value per share of $20.10 for 2019Q1 compared to $15.71 for 2018Q1. Consolidated Operating ROAA & Operating ROATCE (1)(2) Tangible Book Value per Share & Operating Earnings per Share (1)(2) (1) The March 31, 2019 information is preliminary and based on Company data available at the time of the presentation. (2) Operating earnings exclude extinguishment of debt, net gain or loss on sale of securities, fair value adjustments on interest rate swaps, and merger related expenses, all net of income taxes at the applicable period rate.
14 Overall Summary of the 2019 First Quarter • Very good loan growth of $ 66 . 3 million and deposit growth of $ 98 . 9 million . • Organic loan growth resulting in provision for loan losses of $ 700 , 000 with NPAs remaining flat . • OREO expense of $ 186 , 000 , primarily as a result of deciding to dispose of a ten year OREO property . • Net interest margin - core (Non - GAAP) ( 2 ) declining just 3 basis points in historically difficult period due to seasonality . • Weak mortgage operations in the first two and a half months : – CMC declined over prior quarter approximately $ 209 , 000 , after tax . – Good expense control in mortgage ; however, it was somewhat offset by severance paid early in the quarter . – Mortgage locks improved over the last 40 days with current pipelines similar to year ago periods . • Overall strong expense control with operating Bank noninterest expense / average assets remaining under 2 % . • Tangible book value increase to $ 20 . 10 , an increase of 27 . 9 % from March 31 , 2018 . • Operating return on average tangible assets (Non - GAAP) of 1 . 59 % for the quarter ended March 31 , 2019 . (1) All information at and for the period ended March 31, 2019 is preliminary and based on Company data available at the time of the presentation. (2) Net interest margin - core excludes the impact of purchase accounting accretion, loan payoff charges and related deferral fees rec ognized related to early loan repayments.

15 Exhibit (1) (1) The March 31, 2019 information is preliminary and based on Company data available at the time of the presentation. (2) Net interest margin – tax - equivalent. (3) Net interest margin – core and yield on loans receivable – core excludes the impact of purchase accounting accretion, loan payof f charges and related deferred fees recognized related to early loan repayments. Reconciliation of Non-GAAP Financial Measures - Consolidated (Unaudited) March 31, 2019 December 31, 2018 September 30, 2018 June 30, 2018 March 31, 2018 Net interest margin-tax equivalent (2) 33,899$ 35,349 34,298 33,320 32,571 Purchased loan accretion and early payoff charges and deferred fees (1,617) (3,283) (2,831) (2,226) (3,151) Net interest margin - core (3) (Non-GAAP) 32,282$ 32,066 31,467 31,094 29,420 Loans receivable interest income 34,813$ 34,969 33,357 32,497 31,458 Purchased loan accretion and early payoff charges and deferred fees (1,617) (3,283) (2,831) (2,226) (3,151) Loans receivable interest income - core (3) (Non-GAAP) 33,196$ 31,686 30,526 30,271 28,307 Average loans receivable 2,535,192 2,428,603 2,402,075 2,401,075 2,322,203 Average interest earning assets 3,432,818 3,322,894 3,282,426 3,253,708 3,144,910 Net interest margin-tax equivalent (2) 4.00% 4.23% 4.15% 4.11% 4.20% Net interest margin-core (3) (Non-GAAP) 3.81% 3.84% 3.80% 3.83% 3.79% Yield on loans receivable-core (3) (Non-GAAP) 5.31% 5.18% 5.04% 5.06% 4.94% (In thousands) For the Three Months Ended