UNITED STATES
SECURITIES AND EXCHANGE COMMISSION
WASHINGTON, D.C. 20549
__________________
FORM 20-F
_________________________
| [ ] | REGISTRATION STATEMENT PURSUANT TO SECTION 12(b) OR (g) OF THE SECURITIES EXCHANGE ACT OF 1934. |
| [X] | ANNUAL REPORT PURSUANT TO SECTION 13 OR 15(d) OF THE SECURITIES EXCHANGE ACT OF 1934 FOR THE FISCAL YEAR ENDED DECEMBER 31, 2003 |
| [ ] | TRANSITION REPORT PURSUANT TO SECTION 13 OR 15 (d) OF THE SECURITIES EXCHANGE ACT OF 1934 FOR THE TRANSACTION PERIOD FROM ______________ TO ___________________ |
Commission File Number 0-18939
BERKLEY RESOURCES INC.
(Exact name of Company as specified in its charter)
A CORPORATION FORMED UNDER THE LAWS OF BRITISH COLUMBIA, CANADA
(Jurisdiction of Incorporation or Organization)
455 Granville Street, Suite 400
Vancouver, British Columbia V6C 1T1
Canada
(Address of principal executive offices)
Securities registered or to be registered pursuant to Section 12(b) of the Act: NONE
Securities registered or to be registered pursuant to Section 12(g) of the Act:
________________________________
Common Shares, without Par Value (Title of Class) |
Securities for which there is a reporting obligation pursuant to Section 15(d) of the Act: NONE
The number of outstanding Common Shares as of December 31, 2003 was 6,810,934.
Indicate by check mark whether the Company (1) has filed all reports required to be filed by Section 13 or 15(d) of the Securities Exchange Act of 1934 during the preceding 12 months (or for such shorter period that the Company was required to file such reports), and (2) has been subject to such filing requirements for the past 90 days. [X] Yes [ ] No
Indicate by check mark which financial statement item the Company has elected to follow.
Item 17 [X] Item 18 [ ]
(Applicable only to issuers involved in bankruptcy proceedings during the past five years)
Indicate by check mark whether the Company has filed all documents and reports required to be filed by Sections 12, 13 or 15(d) of the Securities Exchange Act of 1934 subsequent to the distribution of securities under a plan confirmed by a court. NOT APPLICABLE
TABLE OF CONTENTS
| Introduction...................................................................................................................................................................................................................................................3 |
| Currency.........................................................................................................................................................................................................................................................3 |
| Forward-looking Statements......................................................................................................................................................................................................................3 |
| Part I................................................................................................................................................................................................................................................................4 |
| Item 1. Identity of Directors, Senior Management and Advisors.................................................................................................................................................4 |
| Item 2. Offer Statistics and Expected Timetable...............................................................................................................................................................................4 |
| Item 3. Key Information.......................................................................................................................................................................................................................4 |
| Item 4. Information on the Company.................................................................................................................................................................................................9 |
| Item 5. Operating and Financial Review and Prospects................................................................................................................................................................14 |
| Item 6. Directors, Senior Management and Employees................................................................................................................................................................17 |
| Item 7. Major Shareholders and Related Party Transactions.......................................................................................................................................................21 |
| Item 8. Financial Information.............................................................................................................................................................................................................21 |
| Item 9. The Offer and Listing............................................................................................................................................................................................................22 |
| Item 10. Additional Information........................................................................................................................................................................................................23 |
| Item 11. Quantitative and Qualitative Disclosures About Market Risk.....................................................................................................................................27 |
| Item 12. Description of Securities Other than Equity Securities..................................................................................................................................................27 |
| Part II............................................................................................................................................................................................................................................................27 |
| Item 13. Defaults, Dividend Arrearages and Delinquencies........................................................................................................................................................27 |
| Item 14. Material Modifications to the Rights of Security Holders and Use of Proceeds.......................................................................................................27 |
| Item 15. Controls and Procedures....................................................................................................................................................................................................27 |
| Item 16. [Reserved].............................................................................................................................................................................................................................28 |
| Item 16A. Audit Committee Financial Expert..................................................................................................................................................................................28 |
| Item 16B. Code of Ethics....................................................................................................................................................................................................................28 |
| Item 16C. Principal Accountant Fees and Services.......................................................................................................................................................................28 |
| Item 16D. Exemptions from the Listing Standards for Audit Committees..................................................................................................................................28 |
| Item 16E. Purchases of Equity Securities by the Issuer and Affiliated Purchasers..................................................................................................................28 |
| Part III...........................................................................................................................................................................................................................................................29 |
| Item 17. Financial Statements............................................................................................................................................................................................................29 |
| Item 18. Financial Statements............................................................................................................................................................................................................29 |
| Item 19. Exhibits..................................................................................................................................................................................................................................29 |
2
Introduction
Berkley Resources Inc., which we refer to as the "Company", was organized under the Company Act of the Province of British Columbia, Canada on July 18, 1986 under the name of Berkley Resources Inc. by virtue of a statutory amalgamation among Fortune Island Mines Ltd., Kerry Mining Ltd. and Berkley Resources Inc. The principal executive office of the Company is located at 455 Granville Street, Suite 400, Vancouver, British Columbia V6C 1T1, and its telephone number is 604-682-3701. The principal business of the Company is that of a drilling participant in various oil and gas properties principally located in Alberta and Saskatchewan, Canada. In August 2001, the Company purchased the remaining interest in the office building that it occupies and became its sole owner. As a result, the Company now leases the other offices that it does not occupy to other businesses.
In this annual report on Form 20-F, which we refer to as the "Annual Report", except as otherwise indicated or as the context otherwise requires, the "Company", "we" or "us" refers to Berkley Resources Inc.
You should rely only on the information contained in this Annual Report. We have not authorized anyone to provide you with information that is different. The information in this Annual Report may only be accurate on the date of this Annual Report or on or as at any other date provided with respect to specific information.
Currency
Unless we otherwise indicate in this Annual Report, all references to "Canadian Dollars", "CDN$" or "$" are to the lawful currency of Canada and all references to "U.S. Dollars" or "U.S. $" are to the lawful currency of the United States
Forward-looking Statements
The following discussion contains forward-looking statements within the meaning of the United States Private Securities Legislation Reform Act of 1995 concerning the Company's plans which may affect the future operating results and financial position. Such statements are subject to risks and uncertainties that could cause our actual results and financial position to differ materially from those anticipated in the forward-looking statements. These factors include, but are not limited to, the factors set forth in the sections entitled "Risk Factors" in Item 3.D., and "Operating and Financial Review and Prospects" in Item 5. Statements concerning reserves and resources may also be deemed to constitute forward-looking statements to the extent that such statements reflect the conclusion that such reserves and resources may be economically exploitable. Any statements that express or involve discussions with respect to predictions, expectations, plans, projections, objectives, assumptions or future events or performance (often, but not always, using words or phrases such as "expects" or "does not expect," "is expected," "anticipates," "does not anticipate," "plans," "estimates," or "intends," or stating that certain actions, events or results "may," "could," "would," or "will" be taken, occur or be achieved) are not statements of historical fact and may be "forward-looking statements."
3
Part I
Item 1. Identity of Directors, Senior Management and Advisors
Not applicable.
Item 2. Offer Statistics and Expected Timetable
Not applicable.
Item 3. Key Information
A. Selected Financial Data
The selected historical financial information presented in the table below for each of the years ended December 31, 2003, 2002, 2001, 2000 and 1999, is derived from the audited financial statements of the Company. The audited financial statements and notes for the balance sheets as at December 31, 2003 and December 31, 2002, and the statements of operations for each of the years in the three year period ended December 31, 2003, are included in this Annual Report. The selected historical financial information for the years ended December 31, 2000 and 1999, presented in the table below are derived from financial statements of the Company that are not included in this Annual Report. The selected financial information presented below should be read in conjunction with the Company's financial statements and the notes thereto (Item 17) and the Operating and Financial Review and Prospects (Item 5) included elsewhere in this Annual Report.
The selected financial information for each of the years ended December 31, 2003, 2002 and 2001 has been prepared in accordance with Canadian generally accepted accounting principles, which is referred to as "Canadian GAAP", and United States generally accepted accounting principles, which is referred to as "U.S. GAAP", and the selected financial data for each of the years ended December 31, 2000 and 1999 has been prepared in accordance with Canadian GAAP.
Canadian GAAP | Year Ended December 31 | ||||
2003 | 2002 | 2001 | 2000 | 1999 | |
Operations | |||||
| Oil and Gas Revenue | $606,133 | $406,138 | $637,497 | $678,789 | $488,022 |
| Oil and Gas Production Expense | 243,717 | 189,681 | 257,862 | 184,168 | 148,063 |
| Amortization and Depletion | 79,500 | 39,900 | 482,700 | 97,600 | 66,700 |
| Rental Revenue | 238,599 | 235,670 | 208,592 | 174,025 | 177,463 |
| Rental Operations Expense | 238,884 | 218,318 | 191,879 | 186,734 | 170,973 |
| Net Income (loss) | (255,456) | (127,647) | (292,576) | 201,165 | 62,514 |
| Net Income Per Share (loss) | (0.04) | (.02) | (.051) | .042 | .013 |
As at December 31 | |||||
2003 | 2002 | 2001 | 2000 | 1999 | |
Balance Sheet | |||||
| Total Assets | 3,615,691 | 3,829,235 | 3,855,897 | 4,367,927 | 3,773,678 |
| Short Term Debt | 711,222 | 758,102 | 909,017 | 894,059 | 287,665 |
| Shareholders' Equity | 2,767,967 | 3,015,933 | 2,893,580 | 2,986,156 | 2,784,991 |
| Number of shares issued and outstanding | 6,810,934 | 6,795,934 | 5,795,934 | 4,795,934 | 4,795,934 |
U.S. GAAP | Year Ended December 31 | ||||
2003 | 2002 | 2001 | 2000 | 1999 | |
Operations | |||||
| Oil and Gas Revenue | $606,133 | $406,138 | $637,497 | $678,789 | $488,022 |
| Rental Revenue | 238,599 | 235,670 | 208,592 | 174,025 | 177,463 |
| Net Income (loss) | (255,456) | (191,847) | (240,576) | 183,965 | 44,514 |
| Net Income Per Share (loss) | (0.04) | (0.03) | (0.042) | 0.038 | 0.009 |
As at December 31 | |||||
2003 | 2002 | 2001 | 2000 | 1999 | |
Balance Sheet | |||||
| Total Assets | 3,811,591 | 3,927,035 | 4,039,497 | 4,499,527 | 3,922,478 |
| Total Liabilities | 847,724 | 813,302 | 962,317 | 1,381,771 | 988,687 |
| Shareholders' Equity | 2,865,767 | 3,113,733 | 3,077,180 | 3,117,756 | 2,933,791 |
4
Exchange Rates
The following table sets forth information as to the period end, average, high and low exchange rate data for Canadian Dollars and U.S. Dollars for the periods indicated based on the noon buying rate in New York City for cable transfers in Canadian Dollars as certified for customs purposes by the Federal Reserve Bank of New York (Canadian dollar = U.S. $1).
Year Ended: December 31 | Average | Period End | High | Low |
| 2000 | 1.4855 | 1.4995 | 1.5600 | 1.4350 |
| 2001 | 1.5487 | 1.5925 | 1.6023 | 1.4933 |
| 2002 | 1.5704 | 1.5800 | 1.6128 | 1.5108 |
| 2003 | 1.4008 | 1.2923 | 1.5750 | 1.2923 |
| 2004 | 1.3017 | 1.2034 | 1.3970 | 1.1775 |
The following table sets forth the high and low exchange rate for the past six months. As of June 21, 2005, the exchange rate was $1.2310 for each U.S. $1.00.
Month | High | Low | |||||
| December 2004 | $ | 1.2401 | $ | 1.1856 | |||
| January 2005 | $ | 1.2422 | $ | 1.1982 | |||
| February 2005 | $ | 1.2562 | $ | 1.2294 | |||
| March 2005 | $ | 1.2463 | $ | 1.2017 | |||
| April 2005 | $ | 1.2568 | $ | 1.2146 | |||
| May 2005 | $ | 1.2703 | $ | 1.2373 | |||
5
B. Capitalization and Indebtedness
Not Applicable.
C. Reasons for the Offer and Use of Proceeds
Not Applicable.
D. Risk Factors
In addition to the other information presented in this Annual Report, the following should be considered carefully in evaluating the Company and its business. This Annual Report contains forward-looking statements that involve risk and uncertainties. The Company's actual results may differ materially from the results discussed in the forward-looking statements. Factors that might cause such a difference include, but are not limited to, those discussed below and elsewhere in this Annual Report.
Failure to Locate Commercial Quantities of Hydrocarbons and Geological Risks. There is no assurance that commercial quantities of hydrocarbons will be discovered. Geological conditions are variable and of limited predictability. Even if production is commenced from a well or field, production will inevitably decline over the course of time, reducing the operating profitability of the enterprise and eventually causing its termination.
Oil and Natural Gas Prices.The Company has little control over the price it receives for its products. Prices are determined by the worldwide supply of and demand for energy. Levels of production maintained by the Organization of Petroleum Exporting Countries, referred to as "OPEC", member nations and other major oil producing countries are expected to continue to be a major determinant of oil price movements in the future. As a result, future oil price movements cannot be predicted with any certainty. Similarly, during the past several years, the market price for natural gas has been subject to significant fluctuations on a monthly basis as well as from year to year. These frequent changes in the market price make it impossible for the Company to predict natural gas price movements with any certainty. Oil prices started the year 2003 at U.S. $32.23 per barrel compared to 2002 at U.S. $19.80 per barrel for West Texas Intermediate, or "WTI". Oil prices held steady throughout 2003 to close at year-end 2003 at U.S. $32.78. The 2003 full year average price for WTI was U.S. $30.99 compared to $26.15 per barrel in 2002. Natural gas prices opened the year 2003 at Cdn $6.18 per thousand cubic feet, referred to as "mcf", and closed year-end at Cdn $6.38. The full year 2003 average price for natural gas at the Alberta Energy Company trading hub at Suffield, Alberta, referred to as "AECO", was Cdn $6.70 compared to an average of Cdn $4.07 for year 2002.
The Company cannot provide assurance that it will be able to market all oil or natural gas that the Company produces or, if such oil or natural gas can be marketed, that favorable price and contractual terms can be negotiated. Changes in oil and natural gas prices may significantly affect the revenues and cash flow of the Company and the value of its oil and natural gas properties. Further, significant declines in the prices of oil and natural gas may have a material adverse effect on the business and financial condition of the Company.
It May Be Difficult to Enforce Civil Liabilities Against the Company. Because the assets of the Company and its subsidiary, as well as the Company¢s jurisdiction of incorporation and the residences of its officers and directors, are mostly located outside of the United States, it may be difficult or impossible to enforce judgments granted by a court in the United States against the assets of the Company and its subsidiaries or the directors and officers of the Company who reside outside the United States.
Operating History and Significant Historical Operating Losses.We commenced operations in the early 1980’s. We have seven major areas in production. The majority of wells on the properties, proved reserves and future production attributable to these properties are more susceptible to estimation discrepancies than fields with larger reserves and longer production histories.
We experienced earnings in fiscal 1999 and 2000 of $62,514 and $201,165 respectively. In fiscal 2001, 2002 and 2003, we reported losses of $292,576, $127,647 and $255,456, respectively. As at December 31, 2003, we had an accumulated deficit of $563,849. Our future viability should be considered in light of the risks and difficulties frequently encountered by companies engaged in the junior stages of oil and gas exploration, development and production activities.
Penny Stock Rules May Make it More Difficult to Trade the Company's Common Shares.The Securities and Exchange Commission, which we refer to as the "SEC", has adopted regulations which generally define a "penny stock" to be any equity security that has a market price, as defined, of less than U.S.$5.00 per share or an exercise price of less than U.S.$5.00 per share, subject to certain exceptions. Our securities may be covered by the penny stock rules, which impose additional sales practice requirements on broker-dealers who sell to persons other than established customers and accredited investors such as institutions with assets in excess of U.S.$5,000,000 or an individual with net worth in excess of U.S.$1,000,000 or annual income exceeding U.S.$200,000 or U.S.$300,000 jointly with his or her spouse. For transactions covered by this rule, the broker-dealers must make a special suitability determination for the purchase and receive the purchaser¢s written agreement of the transaction prior to the sale. Consequently, the rule may affect the ability of broker-dealers to sell our securities and also affect the ability of our investors to sell their shares in the secondary market.
6
No Reliable Information Regarding Reserves. The Company has engaged independent petroleum consultants to compile oil and gas reserve information with respect to its major properties and does have reliable information regarding the quantities of natural gas or oil that may be recoverable from these properties in future years, if any. There can be no assurance, however, that such information has been accurately compiled or is not based on assumptions which may prove to be inaccurate. Furthermore, if any one of our major properties stop producing, it could have a material adverse effect on our business, financial condition and operating results.
We are Dependent on Seven Areas. The Company currently receives substantially all of its income from seven discrete areas. If any one of the seven areas stop producing, it could have a material adverse effect on our business, financial condition and operating results.
Risks Pertaining to Acquisitions and Joint Ventures. Part of our business strategy is to expand through acquisitions and is therefore dependent upon our ability to complete suitable acquisitions and effectively integrate acquired assets into our operations. Suitable acquisitions, on terms acceptable to us, may not be available in the future or may require us to assume certain liabilities, including, without limitation, environmental liabilities, known or unknown.
Exploration and Development Risks. Exploration and development of natural gas and oil involves a high degree of risk that no commercial production will be obtained or that the production will be insufficient to recover drilling and completion costs. The costs of drilling, completing and operating wells is sometimes uncertain, and cost overruns in exploration and development operations can adversely affect the economics of a project. Our drilling operations may be curtailed, delayed or canceled as a result of numerous factors, including title problems, joint venture partner and/or operator decisions, equipment failures, weather conditions, marine accidents, fires and explosions, compliance with governmental requirements, and shortages or delays in the delivery of equipment. Furthermore, the completion of a well does not ensure a profit on the investment or a recovery of drill, completion and tie-in costs.
Replacement of Reserves. In general, the rate of production from natural gas and oil properties declines as reserves are depleted. The rate of decline depends on reservoir characteristics and other factors. Except to the extent we acquire properties containing proven reserves or conduct successful exploration and development activities, or both, our estimated proven reserves will decline as reserves are exploited. Our future natural gas and oil production, and therefore cash flow from operations and net earnings, are highly dependent upon our level of success in finding or acquiring additional economically recoverable reserves. The business of exploring for, developing and acquiring reserves is capital intensive. To the extent cash flow from operations is reduced and external sources of capital become limited or unavailable, our ability to make the necessary capital investment to maintain or expand our asset base of natural gas and oil reserves could be materially impaired.
Estimating of Reserves and Future Net Cash Flows Risk.Estimating natural gas, natural gas liquids and crude oil reserves, and future net cash flows includes numerous uncertainties, many of which may be beyond our control. Such estimates are essential in our decision-making as to whether further investment is warranted. These estimates are derived from several factors and assumptions, some of which are:
| · | reservoir characteristics based on variable geological, geophysical and engineering assessments; |
· future rates of production based on historical draw-down rates;
| · | future net cash flows based on commodity price/quality assumptions, production costs, taxes and investment decisions; |
· recoverable reserves based on estimated future net cash flows; and
| · | compliance expectations based on assumed federal, provincial and environmental laws and regulations. |
Ultimately, actual production rates, reserves recovered, commodity prices, production costs, government regulations or taxation may differ materially from those assumed in earlier reserve estimates. Higher or lower differences could materially impact our production, revenues, production costs, depletion expense, taxes and capital expenditures.
Reserve estimates and net present values reported by us elsewhere in this Annual Report are based on estimated commodity prices and associated production costs that are assumed constant for the life of the reserves. Actual future prices and costs may be materially higher or lower.
We have historically invested a significant portion of our capital budget in drilling exploratory wells in search of unproved oil and gas reserves. We cannot be certain that the exploratory wells we drill will be productive or that we will recover all or any portion of our investments. In order to increase the chances for exploratory success, we often invest in seismic or other geoscience data to assist us in identifying potential drilling objectives. Additionally, the cost of drilling, completing and testing exploratory wells is often uncertain at the time of our initial investment. Depending on complications encountered while drilling, the final cost of the well may significantly exceed that which we originally estimated.
Potential Variability in Quarterly Operating Results. Demand for our products will generally increase during the winter because they are often used as heating fuels. The amount of such increased demand will depend to some extent upon the severity of winter. Accordingly, our net operating revenues are likely to increase during winter months, although the amount of increase and its effect on profitability cannot be predicted. Because of the seasonality of our business and continuous fluctuations in the prices of our products, our operating results for any past quarterly period may not necessarily be indicative of results for future periods and there can be no assurance that we will be able to maintain steady levels of profitability on a quarterly or annual basis in the future.
Competition and Business Risk Management. The natural gas and oil industry is highly competitive. We experience competition in all aspects of our business, including: searching for, developing and acquiring reserves; obtaining pipeline and/or facilities processing capacity, leases, licenses and concessions; and obtaining the equipment and labor needed to conduct operations and market natural gas and oil. Our competitors include multinational energy companies, other independent natural gas and oil concerns and individual producers and operators. Because both natural gas and oil are fungible commodities, the principal form of competition with respect to product sales is price competition. Many competitors have financial and other resources substantially greater than those available to us and, accordingly, may be better able to respond to factors such as changes in worldwide natural gas or oil prices, levels of production, the cost and availability of alternative fuels or the application of government regulations. Such factors, which are beyond our control, may affect demand for our natural gas and oil production. We expect a high degree of competition to continue.
7
Shortage of Supplies and Equipment. Our ability to conduct operations in a timely and cost effective manner is subject to the availability of natural gas and crude oil field supplies, rigs, equipment and service crews. Although none are expected currently, any shortage of certain types of supplies and equipment could result in delays in our operations as well as in higher operating and capital costs.
Interruption from Severe Weather. Our operations are conducted principally in Alberta and Saskatchewan. The weather during colder seasons in these areas can be extreme and can cause interruption or delays in our drilling and construction operations.
Dependence on Third-Party Pipelines. Substantially all our sales of oil and natural gas were effected through deliveries to local third-party gathering systems to processing plants in Alberta and Saskatchewan. In addition, we rely on access to interprovincial pipelines for the sale and distribution of substantially all of our gas. As a result, a curtailment of our sale of natural gas by pipelines or by third-party gathering systems, an impairment of our ability to transport natural gas on interprovincial pipelines or a material increase in the rates charged to us for the transportation of natural gas by reason of a change in federal or provincial regulations or for any other reason, could have a material adverse effect upon us. In such event, we would have to obtain other transportation arrangements or we would have to construct alternative pipelines. There can be no assurance that we would have economical transportation alternatives or that it would be feasible for us to construct pipelines. In the event such circumstances were to occur, our field netbacks from the affected wells would be suspended until, and if, such circumstances could be resolved.
Operating Hazards and Uninsured Risks. The oil and gas business involves a variety of operating risks, including fire, explosion, pipe failure, casing collapse, abnormally pressured formations, adverse weather conditions, governmental and political actions, premature reservoir declines, and environmental hazards such as oil spills, gas leaks and discharges of toxic gases. The occurrences of any of these events with respect to any property operated or owned (in whole or in part) by us could have a material adverse impact on us. We, and the operators of our properties, maintain insurance in accordance with customary industry practices and in amounts that we believe to be reasonable. However, insurance coverage is not always economically feasible and is not obtained to cover all types of operational risks. The occurrence of a significant event that is not fully insured could have a material adverse effect on our financial condition.
As our reserves of natural gas, natural gas liquids and crude oil decline, our success at replacing and adding to them is highly reliant on further exploration and development. To the extent we succeed, our operating cash flows and other capital sources may become insufficient so as to impair our ability to re-invest capital.
Kyoto Protocol Risk. The Kyoto Protocol treaty, referred to as the "Protocol", was established in 1997 to reduce emissions of greenhouse gases, referred to as "GHG", that are believed to be responsible for increasing the earth's surface temperatures and affecting the global climate change. Canada ratified the Protocol in December 2002. Since the implementation of the Protocol, approximately 160 countries have committed to reduce GHG internationally. The Protocol was legally made effective internationally on February 16, 2005 and Canada has committed to meet a six percent reduction of emission over base-year 1990 during the period 2008 to 2012. Canadian government assurances of cost and volume limits suggest that incremental risks and liabilities attributable to addressing Protocol related policies are manageable. While we believe we are a low-emission producer, it is not possible to predict the impact of how Protocol-related issues will ultimately be resolved and to what extent their impact will affect our future unit operating costs and capital expenditures.
We will not be able to develop our reserves or make acquisitions if we are unable to generate sufficient cash flow or raise capital. If we are unable to increase our reserves, our business will be adversely affected because we will eventually run out of reserves.We will be required to make substantial capital expenditures to develop our existing reserves, to discover new oil and gas reserves and to make acquisitions. We will be unable to accomplish these tasks if we are unable to generate sufficient cash flow or raise capital in the future.
We are Subject to Government Regulation on the Removal of Natural Gas from Canada. The price of natural gas sold is not regulated and, therefore, is determined by negotiation between buyers and sellers. Exports of natural gas from Canada require the approval of the National Energy Board, or the "NEB". All exports of natural gas require the issuance by the NEB of a license and the approval of the Governor in Council. Exporters are free to negotiate prices with purchasers but natural gas export sales contracts, or any amendment, agreement or change pertaining thereto, requires NEB approval.
The government of Alberta also regulates the removal of natural gas from its province, based on such factors as reserve availability, transportation arrangements and market conditions. In each Canadian province, the relevant regulatory agency must approve any proposed export. The U.S. represents a significant market for Canadian natural gas and any significant change in access to such market will have an effect on the price of natural gas in Canada.
On January 1, 1994, the North American Free Trade Agreement, referred to as “NAFTA”, among the Governments of Canada, the U.S. and Mexico became effective. In the context of energy resources, Canada may only impose restrictions on the export of energy goods to the U.S. or Mexico where such restrictions do not: (i) reduce the proportion of energy resources exported relative to domestic use in Canada; (ii) impose an export price higher than the domestic price; or (iii) disrupt normal channels of supply. All three countries are prohibited from imposing minimum export or import price requirements.
NAFTA prohibits discriminatory border restrictions and export taxes. The agreement also requires each party to seek to ensure that, in the application of any energy regulatory measures, regulatory bodies avoid disruption of contractual arrangements and provide for orderly and equitable implementation appropriate to such measures.
The Company's Investments are Subject to Environmental Regulation. All phases of the oil and natural gas business are subject to environmental regulation pursuant to a variety of Canadian, U.S., federal, provincial, state and municipal laws and regulations, as well as international conventions, which are collectively referred to as the “Environmental Legislation”. Environmental Legislation regulates, among other things, the release, emission, handling, storage, use, transportation and disposal of various substances and wastes associated with the oil and natural gas industry. In addition, Environmental Legislation requires that refineries, pipelines, service stations, wells, facility sites and waste storage and disposal facilities be operated, maintained, decommissioned and reclaimed in accordance with prescribed provincial, territorial or federal standards. A breach of such Environmental Legislation may result in suspension or revocation of necessary licenses and authorizations, liability for clean-up costs, damages and the imposition of fines and penalties.
8
Where they are probable and can be reasonably estimated, future removal and site restoration costs (as those terms are used under the accounting recommendations of the Canadian Institute of Chartered Accountants), net of expected recoveries, are provided for in the Company's financial statements. Costs are estimated in current dollars based on current requirements of Environmental Legislation, costs, technology and industry standards and are included in the capital costs of the oil and gas properties. The liability for site restoration is adjusted annually for the passage of time and revisions to the original estimates. The annual charge is included in operations through depletion and accretion. Removal and site restoration expenditures are charged to the accumulated provision as incurred. Based on these parameters, estimated future removal and site restoration costs primarily related to upstream properties has been provided for in the financial statements of the Company. Not all future removal and site restoration costs are foreseeable and not all such costs, even if foreseeable, can be reasonably estimated based on the parameters noted above and, as such, are not included in the future removal and site restoration cost provisions. Although the Company currently does not expect that its future removal and site restoration costs will have a material adverse effect on its financial condition or results of operations, there can be no assurance that such costs could not have such an effect.
Environmental Legislation also imposes, among other things, restrictions and obligations in connection with the generation, handling, storage, transportation, treatment and disposal of hazardous materials and waste and in connection with spills, releases, and emissions of various substances into the air, soil, subsoil, water and groundwater. In addition, certain types of operations, including exploration and development projects and significant changes to certain existing projects, may require the submission and approval of environmental impact assessments, which could impose additional costs or delays or prevent the completion of a project. Compliance with Environmental Legislation can require significant expenditures, and failure to comply with Environmental Legislation may result in the imposition of fines and penalties. The Company is committed to protecting and conserving the natural environment and complying with applicable Environmental Legislation. The Company believes that it is currently in substantial compliance with all existing material Environmental Legislation. The Company does not believe that the costs of complying with Environmental Legislation will have a material adverse effect on its financial condition or results of operations. However, there can be no assurance that the costs of complying with Environmental Legislation will not have such an effect.
Item 4. Information on the Company
A. History and Development of the Company
The Company was organized under the Company Act of the Province of British Columbia, Canada on July 18, 1986 under the name of Berkley Resources Inc. by virtue of a statutory amalgamation among Fortune Island Mines Ltd., Kerry Mining Ltd. and Berkley Resources Inc. The principal executive office of the Company is located at 455 Granville Street, Suite 400, Vancouver, British Columbia V6C 1T1, and its telephone number is 604-682-3701. The principal business of the Company is that of a drilling participant in various oil and gas properties principally located in Alberta and Saskatchewan, Canada. In August 2001, the Company purchased the remaining interest in the office building that it occupies and became its sole owner. As a result, the Company now leases the other offices that it does not occupy to other businesses.
The Company presently participates in approximately 32 oil and gas wells in Alberta and Saskatchewan ranging from one percent to 35% working interests. Substantially all of the Company's oil and gas revenue is produced from seven discrete areas. Three are natural gas producers, three produce oil and one has a combination of oil and gas. Five areas have been producing for several years while two (one oil and one gas) are new developments. Since December 31, 2001, the Company has made principal capital expenditures of $25,458 for the year ended December 31, 2002, $582,707 for the year ended December 31, 2003 and $2,540,288 for the year ended December 31, 2004. In 2003, a major portion of the expenditures were in connection with the acquisition of the Dollard interest in southwestern Saskatchewan. In 2004, a major portion of the expenditures were incurred in connection with the drilling program conducted on the Brazeau area (as to approximately $1.3 million net) and the Senex area (as to approximately $1.0 million net). In 2005, approximately $1.7 million, gross, of capital expenditures have been made on the 3-D seismic program on the Senex area (as to approximately $0.340 million net) and the Brazeau area program (as to approximately $0.8 million net). In 2005, the Company also divested itself of its interests in a substantial portion of its Halkirk area leases for approximately $112,500. These capital expenditures were primarily financed through the issuance of 2,871,043 common shares for aggregate gross proceeds of $2,680,520.
Effective March 1, 2004, the Company swapped its±7.68% WI in most of its Skiff area leases and 25 oil and injection wells located thereon for a 15 to 20% interest in the Senex area of northern central Alberta. The Senex area now has four completed wells on the acquired lands, three of which are considered capable of producing oil in economic quantities. The Company also sold its interest in a substantial portion of its Halkirk area leases effective March 1, 2005. These were low interest properties with complex partnership issues. These transactions result in the Company presently holding participating interests in approximately 22 oil and gas wells in Alberta capable of production in economic quantities and ten in Saskatchewan.
The Company also owns a 100% interest in an office building and land in the downtown core of Vancouver, British Columbia, Canada.
B. Business Overview
The Company’s principal business activities are the acquisition, development and exploration, production, and marketing of petroleum and natural gas reserves and the management of the Company’s real estate holdings.
The investments made by the Company in petroleum and natural gas properties are chosen on the basis of, among other things: (i) the amount of cash available; (ii) the desired diversification of oil as contrasted by natural gas exploration; (iii) the geographical area in which the property is located; (iv) the nature and extent of available geological and geophysical data concerning the property; and (v) the time at which it is desirable to commence drilling activities, for reasons such as the availability of drilling equipment and the provisions of the drilling rights agreement and other relevant agreements.
9
In making an investment, the Company will enter into an operating agreement, which we refer to as an "Operating Agreement", with other investors. The Operating Agreement sets forth the participating interest of the parties and incorporates the operating procedures manual, referred to as the "Manual", adopted by the Canadian Association of Petroleum Landmen. According to the Manual, the parties' interest and liability in each investment is several, and not joint, with the other participants. The interest of the Company in the lands, wells and equipment is that of tenants in common. Each investor in a drilling property is deemed to be a "Joint Operator", and an "Operator" is the party appointed to carry out the operations of the drilling program for the joint account. The Company would be one of the Joint Operators in any Operating Agreement in which it participates. Each Joint Operator owns a share of the petroleum substances produced from the wells which is proportionate to that Joint Operator's ownership interest. Each Joint Operator, at its own expense, takes in kind and separately disposes of its proportionate share of production. If the Joint Operator fails or refuses to take its share of the products, the Operator has the authority to sell on behalf of that Joint Operator its share of the production. The Operator is delegated the authority to manage the exploration, development and operation of the joint lands. The Operator typically has the authority to commit on behalf of all Joint Operators up to $25,000 without separate written approval of all Joint Operators. Prior to commencement of work on any well covered by the Operating Agreement, the Operator must submit to each Joint Operator a program of drilling and an estimate of drilling costs and completion costs for approval by all Joint Operators.
Any assignment or transfer of the Company¢s interest in an Operating Agreement is subject to the procedures set forth in the Manual. The Company may be required to offer its interest to the Joint Operators prior to attempting a sale to a third party. In addition, the Company may "farmout" a portion of its interest and retain an overriding royalty on production.
The oil and gas industry deals in two basic forms of ownership interests, namely "Working Interest" and "Overriding Royalties":
| (i) | Working Interest, or "WI": WI means the percentage of undivided interest held by a Joint Operator (i.e. leaseholder) in a specific tract of land (i.e. joint lands). The WI held by all Joint Operators in any specific tract of joint lands must total 100%. Each WI party is responsible for its WI percentage share of costs incurred to conduct "work" (i.e. drilling, seismic, production etc.) on the joint lands. WI are always considered to be an active interest in the costs, risks and benefits associated with the joint lands and operations conducted thereon and the oil or gas produced therefrom. |
| (ii) | Overriding Royalties, or "ORR's": ORR's are a specified share of oil and/or gas as and when produced. ORR's are free and clear of costs, risk and expense to the holder of the ORR. Usually ORR's are based on gross production and as such are referred to as "Gross" ORR's or "GORR's". ORR's are considered a passive interest in as much as the holder of an ORR is not subject to any cost, risk or expense, nor is the ORR holder involved in any decision-making with respect to the royalty lands. |
The Company's program for investing in drilling programs is based on several factors. The Company endeavors to obtain and review geological opinions on the property involved and if it is not the Operator of the well, it considers the reputation of the Operator. The Company attempts to identify drilling programs offering a low to medium risk on its investments. The Company also tries to keep a balance between investments in oil and gas. The Company attempts to reduce its risks by spreading its investments over several drilling ventures. The Company has not borrowed money for purposes of investing in any oil or gas venture.
In each investment, the Operator maintains its own staff or retains independent operating personnel (including landmen, geologists, accountants and engineers) that are employed to conduct the oil and gas operations of each joint venture, including supervision of the drilling and producing activities of the joint venture, and therefore the Company does not maintain independent staff or employees. The Operator exercises general control over the activities of the joint venture and has the authority to determine the timing of commencing, completing or abandoning any particular well authorized for drilling by the Joint Operators. The Operator maintains all records which are available to the Company upon reasonable request and at its expense. Most geotechnical information (such as well logs, geological and geophysical interpretative data) remains in the possession of the Operator but is available to a Joint Operator upon request.
Operating Costs and Special Project Charges
In Canada, the relationship of all investors in a drilling program is that of Joint Operators. The property on which drilling is conducted is deemed "joint lands" and is held by the Joint Operators as tenants in common. The Joint Operators are owners of the undeveloped joint lands and each Joint Operator is entitled to its percentage of the production and can dispose of it as it deems necessary. Therefore, the gross revenue from oil or gas production is the percentage of oil and gas owned by the Company which it has sold to a buyer company. Each Joint Operator, such as the Company, must pay its share of the expenses incurred in extracting its share of the production from the well. The Company¢s investment in any one drilling program ranges from approximately $20,000 to $2,000,000, the majority of which must be paid prior to any production revenue being realized.
Company Activity
The Company continues to pursue its dual objectives: (i) to participate in developing new drilling prospects; and (ii) to purchase on-line production whenever the right opportunity is found. Areas of significant Company activity are as follows:
| 1. | John Lake, Alberta (Twp 55 Rge 1 W4M) - This sweet natural gas producing area is located in east central Alberta and was acquired by the Company through a farm in arrangement . The Company holds a 10.00% WI in this area which is operated by Crescent Point Energy Partnership. |
| 2. | Carbon Area, Alberta (Twp 29 Rge 22 W4M) - This natural gas producing area is operated by ATCO Gas and is located in central Alberta. It was acquired by the Company through a joint venture agreement. The Company’s interest is a 6.00% to 10.00% WI. |
| 3. | Halkirk Area, Alberta (Twp 38 Rge 16 W4M) - This oil/natural gas producing area is operated by Compton Petroleum Partnership and is located in east central Alberta. It was acquired by the Company pursuant to a joint venture agreement. The Company’s WI's range from 3.125% to 6.25%. This area is operationally complex due to partnership and processing issues. The Company sold its interest in a substantial portion of the Halkirk properties effective March 1, 2005 for approximately $112,500. |
10
| 4. | Zama/Virgo Area, Alberta (Twp 114 Rge 5 W6M) - The Company holds a 5.00% ORR on this oil production operated by Apache Canada Ltd. It is located in northwest Alberta and was acquired in the mid 1990s by the Company through a lease purchase and farm out arrangement. |
| 5. | Dollard Area, Saskatchewan (Twp 6 Rge 19 W3M) - This on-line oil production was purchased in late 2003 for a cash cost to the Company of $365,970. This property is located in southwestern Saskatchewan. Some infill drilling was conducted in 2004 which should increase the Company’s net daily production from this area to about 25 to 30 barrels per day. Infill drilling, retooling of some facilities and planned cleanup work will use up some cash in the short term. These expenditures are expected to provide increased production and cash flow into 2005 and beyond. |
| 6. | Senex Area, Alberta (Twp 92/93 Rge 6/7 W5M) - This multi-zone prospect was acquired by the Company on March 1, 2004 pursuant to the swap of its Skiff property discussed below. The Company holds a 15% to 20% WI in 14 sections over this oil and gas prospect. An extensive 3-D seismic program was conducted over the joint lands in early 2005 at a cost of approximately $1.7 million (the Company's 20% share amounted to $340,000). Drilling is expected to resume in the middle of 2005. Two suspended wells acquired in the swap were recompleted and placed into production at an initial monthly average of approximately 75 barrels per day. Three additional wells were drilled in late 2004. Two are producing oil while the third is suspended. |
| 7. | Leduc Area, Alberta (Twp 49 Rge 26 W4M) - This D-1 (Wabamun) gas prospect was completed and placed into production in August 2004. This single well produces at 1.4 million cubic feet per day, or "mmcf/d". The Company holds a 4.00% WI in this project. Additional wells are expected to be drilled or tested in 2005. |
| 8. | Crossfield Area, Alberta (Twp 28 Rge 1 W5M) - This natural gas prospect is located 50 miles north of Calgary and is near ready to drill. The property was acquired through a joint leasing program. We have surveyed the location and acquired the surface lease. Formal licencing procedures will take time to complete as this is a “sour-gas” prospect. The Company holds a 35% WI in this project, which has as its primary objective, natural gas in the Crossfield formation at a depth of approximately 9,800 feet. The test well has targeted projected reserves of 30 to 50 billion cubic feet of natural gas and drilling costs are estimated at $2.5 million of which the Company's share is estimated at approximately $875,000. |
| 9. | Brazeau Area, Alberta (Twp 46 Rge 13 W5M) - This Nisku (D-2) natural gas prospect was drilled in the second half of 2004. The Company participated with two major oil and gas operators in completing this project which was placed into production in February 2005 at the initial rate of 4.0 mmfc/d. The Company paid 30% of the well costs to earn its 19.50 % WI. The test well cost approximately $7.1 million of which the Company's share was approximately $2.13 million. |
| 10. | Sturgeon Lake Area, Alberta (Twp 70 Rge 24 W5M) -This oil prospect is a well-defined seismic opportunity with projected recoverable reserves of five to ten million barrels and is located in central Alberta. It was acquired by the Company through a direct joint lease purchase. The Company holds a 27.50% WI in this prospect and it proposes to participate for ±15% of the drilling costs and farm out the remaining ±12.50%. The person to which the Company has farmed out the remaining 12.5% WI expects to complete the purchase of a 28.25% WI and have this project drill-ready by the fourth quarter of 2004. The Company's level of participation in the well costs will be influenced by the surface location obtained by the person to whom the Company has farmed out the remaining 12.5% WI. The preferred but more difficult to obtain surface location closer to the bottom-hole target (which is under Sturgeon Lake) would see well costs of about $2.2 million. The fallback location which is more distant from the bottom-hole target would see drilling costs projected at $3.1 million. |
| 11. | Skiff Area, Alberta (Twp 5 Rge 14 W4M) - The Company swapped its 5% to 10% interests in this oil producing property for a 15% to 20% WI in the Senex area in northern central Alberta effective March 1, 2004. |
| 12. | Other Propects - The Company will continue to seekout and develop new drilling opportunities for its own account and jointly with other operators. |
As reported throughout 2004, high oil and gas prices have provided the larger oil and gas producers with huge amounts of unbudgeted cash which they are now using to purchase on-line production as well as conduct aggressive drilling programs. This is the first time in several years that conventional oil and gas companies have been able or willing to compete with Income Trust Funds for on-line production. The ever increasing prices paid for on-line production and the threat of increasing interest rates has cooled-down Income Trust Funds to some degree. Also, Income Trust Funds must, by design, distribute large amounts of their cash to unit holders. These distributions do not seem to be finding their way back to industry as quickly as in the past thus opening the field to cash strong conventional operators. The Company continues its watch for on-line production that may be found below the radar of both Income Trust Funds and cash strong mid-sized operators; however these opportunities are very limited.
Reserves
Through to December 31, 2003, the Company engaged independent petroleum consultants to compile oil and gas reserve information with respect to its two major producing properties, Skiff and John Lake. The Company had access to similar oil and gas reserve information from other Joint Operators or the Operator of the other major properties. Some information was obtained from the unrelated Joint Operator¢s independent petroleum consultants. Since the Joint Operator for whom the report was prepared had a different percentage ownership from that of the Company, it is necessary to adjust the numbers to reflect the Company¢s percentage of ownership. Furthermore, the oil and gas reserve information relied upon by the Company in its financial statements ascertains the reserves on pricing assumptions which are not permitted under SEC rules but are acceptable under Canadian accounting rules. Effective December 31, 2004, the Company had all of its major producing properties evaluated by independent petroleum consultants who assigned total recoverable reserves to the Company's interest of 541,000 barrels of oil equivalent, or "boe": 40% was comprised of natural gas and 60% was comprised of oil and liquids. Natural gas is converted to boe at the industry standard rate of 6:1. The Company has an average interest of 15.23% in 8.504 billion cubic feet of recoverable natural gas or 1.295 billion cubic feet net, which equates to 216,000 boe, and 20.17% in 1.614 million barrels of recoverable oil which equates to 325,000 barrels net.
11
Competition
The crude oil and natural gas industry, domestically and in the international arena, is highly competitive by nature. The Company must compete with integrated oil and natural gas companies and independent producers and marketers of crude oil and natural gas products in all aspects of the Company's business. This competition extends to exploration, property and asset acquisition and the selling of the Company's crude oil and natural gas products. The financial strength of the Company's competitors may be at times greater than that of the Company.
Government Regulation and Environmental Matters
Government Regulation
On March 28, 1985, an agreement regarding energy pricing and taxation, known as the Western Accord, was entered into by the Government of Canada and the Canadian provinces of Alberta, Saskatchewan and British Columbia. The Western Accord called for the deregulation of Canadian crude oil pricing and marketing, proposed changes to domestic natural gas pricing, and announced the elimination of an amendment to a number of federal oil and gas taxes, charges and incentives. Based on the Western Accord, crude oil pricing, including synthetic oil pricing, was deregulated June 1, 1985, so that prices would be negotiated between the buyer and seller.
On October 31, 1985, the Province of Alberta and the Canadian government reached an agreement that provided a framework for natural gas deregulation. The agreement established a mechanism to allow prices to be negotiated directly between consumers and producers. After November 1, 1985, the price of natural gas exported to the United States or sold in Canada was deregulated.
At the present time, Canadian natural gas is supplied to California by two pipelines: (i) a direct link through the San Francisco based Pacific Gas Transmission Company; and (ii) a displacement link via Pacific International Transmission Company. Both lines are presently committed. Pacific Gas Transmission has announced a proposed expansion of its pipeline which will deliver more Alberta natural gas to California. In 1998, construction of a new pipeline covering approximately 620 miles was completed, running from Alberta to the Montana border and to Opal, Wyoming, connecting with the Kern River Gas Transmission Co. pipeline which runs to southern California. California is an important market for Alberta natural gas producers because of the growing demand for natural gas in that state, but such importance has shifted slightly due to the integration of U.S. Midwest markets through the Alliance Pipeline system, which commenced operations in 1999.
Since 1974, the Province of Alberta has had a program entitled "Price-Sensitive Alberta Royalty Tax Credit Program", referred to as the "Tax Credit Program". The Tax Credit Program provided for a refund of portions of the royalties paid to the Province of Alberta by the producers on the sale of oil and gas produced in Alberta. The refund amount to producers is based on the price received for the oil and gas produced. For financial statement purposes, the Company accounts for the tax credit by reducing its operating expenses by the amount of the credit resulting in an increase in income before taxes. For tax purposes, since it is intended not to be taxed, the amount of the credit is reinstated as an operating expense and thus reduces taxable income. The maximum credit available to a company is $1.0 million.
Environmental Matters
Environmental regulations impose, among other things, restrictions, liabilities and obligations in connection with the generation, handling, use, storage, transportation, treatment and disposal of hazardous substances and waste, and in connection with spills, releases and emissions of various substances to the environment. Environmental regulation also requires that wells, facility sites and other properties associated with our operations be operated, maintained, abandoned and reclaimed to the satisfaction of applicable regulatory authorities. In addition, certain types of operations, including exploration and development projects and changes to certain existing projects, may require the submission and approval of environmental impact assessments or permit applications. Compliance with environmental regulation can require significant expenditures, including expenditures for clean up costs and damages arising out of contaminated properties and failure to comply with environmental regulations may result in the imposition of fines and penalties. We believe that we are in substantial compliance with such laws and regulations, however, such laws and regulations may change in the future in a manner which will increase the burden and cost of compliance.
In 1994, the United Nations' Framework Convention on Climate Change came into force and three years later led to the Protocol which requires, upon ratification, nations to reduce their emissions of carbon dioxide and other greenhouse gases. In December 2002, the Canadian federal government ratified the Protocol. If certain conditions are met and the Protocol enters into force internationally, Canada will be required to reduce its GHG emissions. Currently, the upstream crude oil and natural gas sector is in discussions with various provincial and federal levels of government regarding the development of GHG regulations for the industry. It is premature to predict what impact these potential regulations could have on the Company's sector but it is possible that the Company would face increases in operating costs in order to comply with a GHG emissions target.
Certain laws and governmental regulations may impose liability on us for personal injuries, clean-up costs, environmental damages and property damages, as well as administrative, civil and criminal penalties. We maintain limited insurance coverage for sudden and accidental environmental damages, but do not maintain insurance coverage for the full potential liability that could be caused by sudden and accidental environmental damage. Accordingly, we may be subject to liability or may be required to cease production from properties in the event of such damages.
Each province in Canada has its own regulatory authorities which oversee, licence and monitor all oil and gas activity including seismic, drilling, production, transportation, processing and environmental matters related thereto. In Alberta, where most of the Company’s assets are located, that authority is the Alberta Energy and Utilities Board or the "AEUB". In order to explore any claim or lease, it is necessary to obtain a geophysical or drilling license and it may be necessary to post a bond with notices to several Canadian governmental agencies, including the provincial environmental agency. The procurement of drilling licenses has had no material adverse impact on the Company¢s operations. In certain areas defined as "sensitive areas," the provincial environmental agency requires special work permits. The Company's investments do not include property located within any defined "sensitive areas".
12
Interruption from Severe Weather
Presently, our operations are conducted principally in the central region of Alberta and in Saskatchewan. The weather can be extreme at times due to cold or rain which can cause interruption or delays in our drilling and construction operations.
C. Organizational Structure
The Company has no subsidiaries.
D. Property, Plants and Equipment
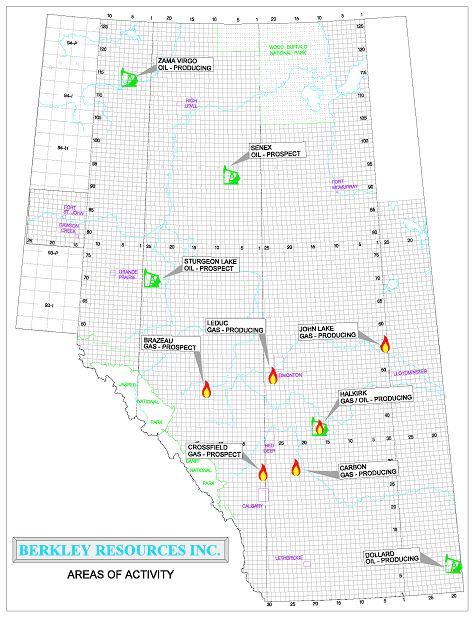
The Company is in the business of participating in various oil and gas drilling ventures in Alberta and Saskatchewan, by entering into Operating Agreements with other investors. Operating Agreements specify that each investors' ownership in the lands, wells and equipment is that of tenants-in-common. The following map sets forth the Company's more significant areas of activity:
The following is a description of the various interests of the Company in its oil and gas properties as at June 1, 2005:
Lease No. | Description | Interest | Status |
Berry | |||
34305 | Sec.29-27-13 W4M | 8.92867% | Not Producing |
Brazeau | Sec.13-46-13 W5M | 30.00% WI BPO | Producing - gas |
| 19.50% WI APO | |||
Carbon | |||
| 047790068 | Sec.29-29-22 W4M | 6%WI | Producing - gas |
| 32443 | Sec.32-29-22 W4M | 6.25%WI | Producing - gas |
| 25906 | Sec.28-29-22 W4M | 6.25%WI | Producing - gas |
| 0477010002 | Sec.31-29-22 W4M | 10%WI | Producing - gas |
Crossfield | Twp 28 Rge 1 W5M | 35% WI | Prep. to drill |
Dollard Economy Creek | Twp 6/7 Rge 19 W3M | 20% WI | Producing - oil |
5498120007 5498120007 5498120008 5498120008 | Sec.3-70-1W6M Sec.10-70-1W6M Secs.4, 5, 8&9-70-1W6M Sec.17-70-1W6M | 25%WI 50%WI 25%WI 50%WI | Not Producing Not Producing Not Producing Not Producing |
0598040371 | Secs.20&21-70-1 W6M | 50%WI | Not Producing |
North Halkirk | |||
| 34397 | Sec.14-39-16 W4M | 6.25%WI | Not Producing |
| 34398 | S1/2 & N1/2 Sec.22-39-16 W4M | 6.25%WI | Not Producing |
26457 | N/2 Sec.22-39-16 W4M | 6.25%WI | Not Producing |
South Halkirk | |||
| 34282 | Sec.16 38-16 W4M | 3.125%WI | Producing - gas/oil |
| 32298 | Sec.20-38-16 W4M | 6.25%WI | Producing - gas/oil |
| Freehold | Sec.E/2 19-38-16 W4M | 6.25%WI | Producing - gas/oil |
| Freehold A-8057 | Sec.8-38-16 W4M | 6.25%WI | Producing - gas/oil |
| PanCan PNG 16258 | NE/4 Sec.17-38-16 W4M | 6.25%WI | Producing - gas/oil |
| 0478020150 | S/2&NE/4 Sec.18-38-16 W4M | 3.125%WI | Producing - gas/oil |
0478080305 | SE/4 Sec.20-38-16 W4M | 0.75%WI | Producing - gas/oil |
Haven | |||
| 047939297 | Sec.12-25-4 W4M | 0.3%WI | Not Producing |
| Sec.7, 18-25-3 W4M | 0.3%WI | Not Producing | |
38054 | Sec.7, 18&20-25-4 W4M | 0.50%WI | Not Producing |
John Lake | |||
| 40852 | All Sec.26&27-55-1 W4M | 10%WI | Producing - gas |
| Sec.1-56-1 W4M | 10%WI | Producing - gas | |
| 485070102 | W/2 36-55-1 W4M | 10%WI | Producing - gas |
| 487040220 | E/2 Sec.36-55-1 W4M | 10%WI | Producing - gas |
| 40854 | NW/4 12-56-1 W4M SE/4 14-56-1-W4M | 10%WI 10%WI | Producing - gas Producing - gas |
| 40853A | All Sec.15-56-1-W4M | 10%WI | Producing - gas |
| 40855A | All Sec.24-56-1 W4M | 10%WI | Producing - gas |
| 40856 | All Sec.34-56-1 W4M | 10%WI | Producing - gas |
Leduc Manyberries | All Sec.33-49-26 W4M | 4% WI | Producing - gas |
| 35828 | SE Sec.23-5-5 W4M | 50%WI | Not Producing |
| 26592 | W/2 Sec.23-5-5 W4M | 50%WI | Not Producing |
| 01818 | NE/4 Sec.23-5-5 W4M | 50%WI | Not Producing |
Oyen | |||
| 30364 | S/2 Sec.16-29-4 W4M | 1%WI | Not Producing |
| 30365 | SW/4 Sec. 24-29-5 W4M | 0.750%WI | Not Producing |
| 29517 | N/2 Sec.24-29-5 W4M | 0.750%WI | Not Producing |
Senex | Twp 92/93 Rge 6/7 W5M | 15/20% WI | Producing - oil |
Sibbald | |||
| 39367 | Sec.2,4, E/2 9&10-28-1 W4M | 0.50%WI | Producing - gas |
| 0476122257 | W/2 9-28-1 W4M Sec.3-28-1 W4M | 0.25%WI 0.25%WI | Not Producing Not Producing |
| 29513 | S/2 Sec.15-28-1 W4M | 1.00%WI | Producing - gas |
| 6359A | N/2 Sec.15&S/2 Sec.22-28-1 | 1.00%WI | Not Producing |
Skiff | |||
| Sawtooth | NW1/4Sec.16,SE1/4Sec.20;Lsds 2, 7&8 & SW1/4Sec.21-5-14 W4M | 7.67%WI | Producing - oil |
| 0484080300 | NW1/4Sec.29-4-14 W4M | 10.526%WI | Producing - oil |
| W1/2Sec.32-4-14 W4M | 5.26315% | Producing - oil | |
| 048307070286 | Lsds.3,4&5 of Sec.5-5-14 | 5.50%WI | Producing - oil |
| Lsds.6 of Sec.5-5 14 W4M | 5.50%WI | Producing - oil | |
| NW1/4 of Sec.9-5-14 W4M | 5.50%WI | Producing - oil | |
| 32596 | Lsd.5 of Sec.16-5-14 W4M | 10%WI | Producing - oil |
| 0483030060 | NW1/4 of Sec.16-5-14-W4M | 10%WI | Producing - oil |
| 0496100384 | W1/2&Lsd.10,15-5-14 W4M | 10%WI | Producing - oil |
| 36854 | Lsd.1&NW1/4 of Sec.21-5-14 | 10%WI | Producing - oil |
| Lsds.2,7&8 & SW1/4 of Sec.21-5-14 W4M | 10%WI | Producing - oil | |
| 7865A | NE1/4 of Sec.21-5-14 W4M | 10%WI | Producing - oil |
| 0486070002 | NW1/4 of Sec.22-5-14 W4M | 6.30%WI | Producing - oil |
| 0477080167 | SW1/4 of Sec.28-5-14 W4M | 10%WI | Producing - oil |
Sturgeon Lake | |||
| 5495080092 | Sec.23,26,27,34,35-70-24 W5M | 27.5%WI | Not Producing |
Zama Virgo | |||
| 0591080261 | N/2 Sec.20-114-5 W6M | 5.00% GORR | Producing - oil |
| 091120175 | NW/4 Sec.26-114-5 W6M | 5.00% GORR | Producing - oil |
| 092020380 | W/2 Sec.22-115-5 W6M | Sliding Scale ORR | Producing - oil |
| 093020449 | SE/4 Sec.27-114-5 W6M | 50% of 10% GORR | Producing - oil |
Office Building | |||
455 Granville Street Vancouver, Canada | Lot B, Block 22, District Lot 541, Plan 8227 | 100% | N/A |
13
Productive Wells and Acreage
The following chart of the Company's total gross and net productive wells, expressed separately for oil and gas, and the total gross and net developed acres (i.e., acres spaced or assignable to productive wells) by the geographic areas is as at June 1, 2005.
GeographicRegion | Total GrossWells | Total Net ProductiveWells | Target OilOr Gas | Total GrossDeveloped Acres | Total NetDeveloped Acres |
| Alberta | 22 | 1.1 oil - 2.0 gas | both | 12,166 | 2,433 |
| Saskatchewan | 10 | 2 | oil | 4,480 | 850 |
Undeveloped Acreage
As at June 1, 2005, the amounts of undeveloped acreage, both leases and concessions, in the western Canada (Alberta) geographic area consists of 40,554 gross acres and 5,488 net acres. The remaining terms on the leases within those properties are variable. Producing leases continue for duration of productive lives.
Drilling Activity
The following table explains the number of productive and dry exploratory or development wells drilled in the last three fiscal years. A dry well (hole) is an exploratory or a development well found to be incapable of producing either oil or gas in sufficient quantities to justify completion as an oil or gas well. A productive well is an exploratory or a development well that is not a dry well. The number of wells drilled refers to the number of wells (holes) completed at any time during the fiscal years, regardless of when drilling was initiated. The term "completion" refers to the installation of permanent equipment for the production of oil or gas, or, in the case of a dry hole, to the reporting of abandonment to the appropriate agency.
Delivery Commitments
The Company has no obligation to provide a fixed and determinable quantity of oil or gas in the near future under existing contracts or agreements or material information concerning the estimated availability of oil and gas from any principal sources.See also Item 3. D. Risk Factors regarding quantity and price limitation by government agencies.
Item 5. Operating and Financial Review and Prospects
This discussion and analysis of the operating results and the financial position of the Company for the years ended December 31, 2003 and 2002 should be read in conjunction with the financial statements and the related notes attached hereto.
A. Operating Results
The Company's principal business is participating in various oil and gas drilling ventures in western Canada. The Company has interests in various wells which vary from 1.00% to 35% and covers, as at December 31, 2003, approximately 50 oil and gas wells. Based on its oil and gas revenues for the year ended December 31, 2003, the Company received substantially all of its income from five properties: (i) John Lake; (ii) Skiff; (iii) Zama/Virgo; (iv) Halkirk; and (v) Carbon. In December 2003 the Company purchased on-line oil production in Dollard, Saskatchewan which produces approximately 25 barrels per day net. The effect of this purchase will be reflected in the 2004 results.
Overall Performance
The Company operates in two distinct segments, oil and gas and real estate rental. An overview analysis by segment is as follows:
Oil and Gas
The Company has continued its commitment to prospect development with the objective of bringing prospects to drilling stage and then farming out the drilling to other parties. The strong cash position enjoyed by many operators due to high oil and gas prices has resulted in a strong demand for drillable prospects. The Company expects this situation to enable it to leverage-up its investment in prospects developed by it and brought to drilling stage.
During the year ended December 31, 2003, the Company participated in approximately 40 oil and gas wells in Alberta and ten in Saskatchewan ranging from 1% to 35% working interests. Substantially all of the oil and gas revenue the Company received in 2003 was from five major leases: John Lake; Halkirk; Carbon; Skiff; and Zama/Virgo. There are four producing gas wells in John Lake; four gas wells in Carbon; seven producing gas wells in Halkirk; 20 producing oil wells in Skiff and two producing oil wells in Zama/Virgo. All five areas have been producing for over ten years. The Company was not the Operator of any of these wells.
Oil and Gas Industry Overview
Sustained strong pricing for both oil and natural gas continued to be the dominant issue for the industry throughout the fiscal year 2003. Oil prices opened on January 1, 2003 at U.S. $32.23 per barrel for WTI and closed at December 31, 2003 at $32.78. Natural gas prices reflected the strong oil prices by increasing from Cdn. $6.18 per mcf at January 1, 2003 to close December 31, 2003 at $6.68. Natural gas storage throughout North America was filled on schedule which should provide a calming influence on prices into 2004. Regardless of this factor, the large amounts of unbudgeted cash accruing to the industry from high commodity prices is having an unsettling effect on everything from land prices to cost of field services. The Company has attempted to navigate a prudent course through these volatile circumstances, seeking out long-term opportunities in this overheated environment.
14
The Company has positioned itself to grow its cash flow by enhancing existing properties while at the same time investing in new opportunities that will expose the Company to substantial growth. The Company intends to continue with these dual objectives throughout 2004 and into 2005 with the awareness that success in one or more of its exploration projects will significantly enhance shareholder value and change the nature of the Company’s oil and gas operations.
Real estate
The office building continues to have near full occupancy, with consistent operating results within a narrow range. In all material respects, the building achieves breakeven on an operating and cash flow basis. There are no changes foreseen with respect to this segment.
Results of Operations
The Company's balance sheet as at December 31, 2003, as compared to December 31, 2002, reflects its expenditures on oil and gas properties and equipment and rental income for the period ended December 31, 2003 and the results of its operations for fiscal year December 31, 2003. Overall, total assets decreased by $213,544 and total liabilities increased by $34,422. The Company's working capital decreased from $431,740 at December 31, 2002 to a working capital deficiency of $280,293 at December 31, 2003.
Revenues
Oil and gas revenues increased by approximately $199,995 from 2002 to 2003 after decreasing by approximately $231,000 from 2001 to 2002. The total oil and gas revenues were $606,133 in 2003. Of the total oil and gas revenues of $406,138 in 2002, the Company received $135,122 from the John Lake leases, $107,695 from the Skiff leases, $67,200 from the Halkirk leases, $46,153 from the Carbon leases, and $42,762 from the Zama/Virgo leases. Of the total oil and gas revenues of $606,133 in 2003, the Company received $201,660 from the John Lake leases, $160,746 from the Skiff leases, $100,315 from the Halkirk leases, $68,857 from the Carbon leases and $63,826 from the Zama/Virgo leases. In general, factors affecting the oil and gas revenues are a combination of oil and gas production and price fluctuations. The increase in revenue in 2003 was mainly due to price increases. The Company's oil and gas operating costs increased by approximately $54,036 from $189,681 in 2002 to $243,717 in 2003 after decreasing by approximately $68,000 from 2001 to 2002. The increase in operating costs was primarily due to increased royalties and costs associated with acquiring on-line production. Amortization and depletion expense is determined by the unit of production method. Accordingly, depletion fluctuates with levels of production and reserves and is not directly related to oil and gas revenues which are also dependent upon price fluctuations. Interest income decreased from $23,506 for the year ended December 31, 2002 to $23,469 for the year ended December 31, 2003.
Rental revenue for 2003 was $238,599, an increase of $2,929 compared to $235,670 in 2002. The increase was primarily due to rental rate increases. Rental profit before interest and amortization was $40,003 in 2003 compared to $67,062 for 2002 and $75,549 for 2001.
Expenses
The Company's administration expenses for the year ended December 31, 2003 of $501,799 shows an increase of approximately $156,737 from the December 31, 2002 year end amount of $345,062. The increase in administration expenses arose primarily from an increase of $93,027 for consulting and management fees, a decrease of $11,617 for professional fees and a increase of $47,701 for administrative services. The increase of $93,027 in consulting and management fees arose primarily from the management contract with a former director and related individual ($30,000 for the year) and $30,000 in fees to the president of the Company. The increase of $47,701 in office expenses was due to added space in Calgary, Alberta.
Accounts payable and accrued liabilities increased by approximately $62,544 from December 31, 2002 to December 31, 2003 after decreasing by approximately $150,915 from December 31, 2001 to December 31, 2002.
Accounts receivable fluctuate from year to year depending on the timing of production receipts from operators and amounts due from participants in oil and gas activities. Accounts receivable increased by approximately $905 from December 31, 2002 to December 31, 2003 and decreased by approximately $7,000 from December 31, 2001 to December 31, 2002.
Impact of Inflation
Inflation was modest through 2003. Dramatic swings in world oil prices have affected the Company much more than inflation. At the end of 2003 all provincial and federal fiscal regimes were stable which enabled the oil and gas industry to operate within a predictable environment.
B. Liquidity and Capital Resources
As of December 31, 2003, the Company had a working capital deficit of $280,293, compared with working capital of $431,740 as of December 31, 2002. The Company drew down its cash reserves to buy on-line production which will provide increased cash flow through future years. Cash flow is projected as sufficient to cover operating needs for the next fiscal year. New project drilling will be financed by joint ventures or arranging new financing through the issuance of common shares.The Company's financial statements are prepared in accordance with Canadian GAAP. US GAAP has certain notable differences which are set out on Note 14 to the financial statements of the Company which are included in this Annual Report.
C. Research and Development, Patents and License, etc.
Not Applicable.
15
D. Trend Information
The year 2003 saw steady to strong oil prices opening at U.S.$32.23 per barrel for WTI to a year-end close of U.S.$32.78. The 2003 full year average price for WTI was U.S.$30.99/barrel compared to the 2002 average price of U.S.$26.15.
Natural gas prices held steady during 2003 where the full year average price for natural gas at the AECO was $6.70 per mcf compared to $4.07 average for year 2002.
Regardless of these and other specific influences on oil and gas prices from time to time, the management of the Company believes that U.S.$25.00 per barrel for WTI oil is a reasonable, industry accepted benchmark on which to base investment decisions. This benchmark price for oil will translate into natural gas prices within the range of Cdn $3.75 to $6.00 per mcf.
The oil and gas industry will view the year 2003 as one of continued recovery and stabilization. The events of September 11, 2001, the Iraq war and the Enron debacle resulted in increased government presence in all businesses throughout North America. Canada had the added issue of the Protocol which relates to an international agreement to reduce GHG emissions.
Income trust funds continued to dominate the purchase and sale of on-line production in Canada in 2003. Income trust funds provide preferred tax treatment to unit investors and are by design a harvesting process, returning very little capital to industry for the development of new prospects. The Company has responded to this situation by partnering with other smaller operators and developing its own prospects such as Crossfield.
The Company continues to work with its operating partner to farm out the drilling of the Sturgeon Lake Leduc (D-3) oil prospect. This prospect is located in central Alberta at township 71 range 23 W5M. The Company holds a 27.50% WI in this high opportunity, but costly, prospect.
Major oil and gas producers had a very profitable year in 2003. Large-scale projects such as new oil sands plants and major gas pipelines, such as the Mackenzie Valley line, are again on the front burner as the larger producers seek ways to invest their unbudgeted cash.
E. Off-balance sheet arrangements
The Company does not have any off-balance sheet arrangements.
F. Tabular disclosure of contractual obligations
Payments due by period | ||||||||||||||||
Total Amount | Less than one year | One to three years | Three to five years | More than five years | ||||||||||||
| $ | $ | $ | $ | $ | ||||||||||||
| Consulting Agreements | 288,000 | 96,000 | 192,000 | - | - | |||||||||||
| G. | Safe Harbor |
Certain statements in this Annual Report, including those appearing under this Item 5, constitute "forward-looking statements" within the meaning of the United States Private Securities Litigation Reform Act of 1995, Section 21E of the United States Securities Exchange Act of 1934, as amended, and Section 27A of the United States Securities Act of 1933, as amended. Additionally, forward-looking statements may be made orally or in press releases, conferences, reports, on our website or otherwise, in the future, by us or on our behalf. Such statements are generally identifiable by the terminology used such as "plans", "expects", "estimates", "budgets", "intends", "anticipates", "believes", "projects", "indicates", "targets", "objective", "could", "may", or other similar words.The forward-looking statements are subject to known and unknown risks and uncertainties and other factors that may cause actual results, levels of activity and achievements to differ materially from those expressed or implied by such statements. Such factors include, among others: market prices for natural gas, natural gas liquids and oil products; the ability to produce and transport natural gas, natural gas liquids and oil; the results of exploration and development drilling and related activities; economic conditions in the countries and provinces in which we carry on business, especially economic slowdown; actions by governmental authorities including increases in taxes, changes in environmental and other regulations, and renegotiations of contracts; political uncertainty, including actions by insurgent groups or other conflict; the negotiation and closing of material contracts; and the other factors discussed in Item 3 Key Information - "Risk Factors", and in other documents that we file with the SEC. The impact of any one factor on a particular forward-looking statement is not determinable with certainty as such factors are interdependent upon other factors; our course of action would depend upon our assessment of the future considering all information then available. In that regard, any statements as to future natural gas, natural gas liquids or oil production levels; capital expenditures; the allocation of capital expenditures to exploration and development activities; sources of funding of our capital program; drilling of new wells; demand for natural gas, natural gas liquids and oil products; expenditures and allowances relating to environmental matters; dates by which certain areas will be developed or will come on-stream; expected finding and development costs; future production rates; ultimate recoverability of reserves; dates by which transactions are expected to close; cash flows; uses of cash flows; collectability of receivables; availability of trade credit; expected operating costs; expenditures and allowances relating to environmental matters; debt levels; and changes in any of the foregoing are forward-looking statements, and there can be no assurances that the expectations conveyed by such forward-looking statements will, in fact, be realized.
Although we believe that the expectations conveyed by the forward-looking statements are reasonable based on information available to us on the date such forward-looking statements were made, no assurances can be given as to future results, levels of activity, achievements or financial condition.
16
Readers should not place undue reliance on any forward-looking statement and should recognize that the statements are predictions of future results, which may not occur as anticipated. Actual results could differ materially from those anticipated in the forward-looking statements and from historical results, due to the risks and uncertainties described above, as well as others not now anticipated. The foregoing statements are not exclusive and further information concerning us, including factors that could materially affect our financial results, may emerge from time to time. We do not intend to update forward-looking statements to reflect actual results or changes in factors or assumptions affecting such forward-looking statements.
Item 6. Directors, Senior Management and Employees
A. Directors and Senior Management
The following is a list of the Company's directors and officers as at December 31, 2003.
Name | Position Held | Principal Occupation, Business orEmployment for the Last Five Years | Director/OfficerSince |
Louis Wolfin(1) | Director and Former Chief Executive Officer | Mining Executive; CEO and Director of Bralorne Gold Mines Ltd., Director of Coral Gold Resources Ltd., Director of Avino Silver & Gold Mines Ltd., Director of Levon Resources Ltd. and Director of Cresval Capital Corp. | 1986 - Present |
Matt Wayrynen(1) | President and Director | Corporate Executive; President and Director of Coral Gold Resources Ltd., VP, Operations and Director of Bralorne Gold Mines Ltd., Retired Real Estate and Investment Adviser. | June 2002 - Present |
| Lloyd Andrews | Director and Chairman | Retired Businessman; Director of Smith Barney Mutual Fund; Director of Coral Gold Resources Ltd.; Director of Bralorne Gold Mines Ltd.; and Senior Consultant to Chem Nuclear Systems and Flow International. | June 2002 - Present |
| James O’Byrne | Director | Oil and Gas Consultant; President of O’Byrne Resource Management Ltd. | June 2003- Present |
| Andrea Regnier | Secretary | Director and/or officer of several reporting issuers | July 2003- July 2004 |
______________________________________________
(1) Mr. Matt Wayrynen is the son-in-law of Mr. Louis Wolfin.
B. Compensation
Compensation of Directors
The directors of the Company have not been paid fees or other cash compensation in their capacity as directors. The Company has no arrangements, standard or otherwise, pursuant to which its directors are compensated by the Company or its subsidiaries for their services in their capacity as directors, or for committee participation, or involvement in special assignments during the fiscal year ended December 31, 2003, except that directors may be reimbursed for actual expenses reasonably incurred in connection with the performance of their duties as directors and certain directors may be compensated for services as consultants or experts. Incentive stock options, however, have been granted to non-executive directors and other insiders of the Company and are outstanding to purchase an aggregate of 870,000 common shares of the Company as follows:
Name of Optionee | No. of Shares | Exercise Price Per Share | Date of Grant | Expiry Date | |||||||||
| Louis Wolfin | 195,000 5,000 | $ $ | 0.34 0.52 | April 25, 2000 September 19, 2003 | April 25, 2005 September 19, 2008 | ||||||||
| Lloyd Andrews | 300,000 | $ | 0.52 | September 19, 2003 | September 19, 2008 | ||||||||
| James O'Byrne | 20,000 50,000 | $ $ | 0.34 0.52 | April 25, 2000 September 19, 2003 | April 25, 2005 September 19, 2008 | ||||||||
| Matt Wayrynen | 300,000 | $ | 0.52 | September 19, 2003 | September 19, 2008 | ||||||||
No pension plan or retirement benefit plans have been instituted by the Company and none are proposed at this time.
The following table sets forth particulars concerning the compensation of the Company's executives for the Company¢s calendar year ended December 31, 2003.
17
Summary Compensation Table | |||||||
Annual Compensation | Long-Term Compensation Awards | ||||||
Name/Principal Position | Year | Salary(1) $ | Bonus for the Year $ | Other AnnualCompensation $ | Securities Under Options/SARsGranted(2) (#) | Restricted Shares/UnitsAwarded $ | All OtherCompensation $ |
Matt Wayrynen President | 2003 2002(3) | $60,000 $30,000 | NIL NIL | NIL NIL | 300,000 NIL | NIL NIL | NIL NIL |
(1) No executive officer earned in excess of $100,000.
(2) Represents total common shares under option as of the end of the calendar year.
(3) Became the president in July, 2002.
No pension plan or retirement benefit plans have been instituted by the Company and none are proposed at this time.
C. Board Practices
The board of directors of the Company consists of four directors: Matt Wayrynen, Lloyd Andrews, Louis Wolfin and James O'Byrne. Each of the directors will serve until the next Annual General Meeting of shareholders. The officers of the Company are elected by the board and serve at the pleasure of the board. The size and experience of the board is important for providing the Company with effective governance. The board’s mandate and responsibilities can be effectively and efficiently administered through the four directors. The chairman of the board is not a member of management. The board has functioned, and is of the view that it can continue to function, independently of management as required.
The board has considered the relationships of each director to the Company and considers two of the four directors to be "unrelated" (Messrs. Andrews and O'Byrne). "Unrelated director", means a director who is independent of management and free from any interest and any business or other relationship which could reasonably be perceived to materially interfere with the director’s ability to act with a view to the best interest of the Company, other than interest and relationships arising solely from shareholdings.
Two of the directors (Messrs. Matt Wayrynen and Louis Wolfin) are related family members.
Procedures are in place to allow the board to function independently. The board has experienced directors that have made a significant contribution to the Company’s success, and are satisfied that it is not constrained in its access to information, in its deliberations or in its ability to satisfy the mandate established by law to supervise the business and affairs of the Company. The Company’s chairman and independent directors meet in the absence of managing directors. Committees meet independent of management and other directors. Committees appoint a chairman from their number who presides over the committee meetings.
The Company has no standard arrangement pursuant to which directors are compensated by the Company for their services in their capacity as directors. Further, the Company has no contracts with any of its directors that provide for payments upon termination.
Mandate of the Board of Directors, its Committees and Management
The role of the board is to oversee the conduct of the Company’s business, including the supervision of management, and determining the Company’s strategy. Management is responsible for the Company’s day to day operations, including proposing its strategic direction and presenting budgets and business plans to the board of directors for consideration and approval. The strategic plan takes into account, among other things, the opportunities and risks of the Company’s business. Management provides the board with periodic assessments as to those risks and the implementation of the Company’s systems to manage those risks. The board reviews the personnel needs of the Company from time to time, having particular regard to succession issues relating to senior management. Management is responsible for the training and development of personnel. The board assesses how effectively the Company communicates with shareholders, but has not adopted a formal communications policy. Through the audit committee, and in conjunction with its auditors, the board assesses the adequacy of the Company’s internal control and management information systems. The board looks to management to keep it informed of all significant developments relating to or effecting the Company’s operations. Major financings, acquisitions, dispositions and investments are subject to board approval. A formal mandate for the board of directors and the chief executive officer has not been considered necessary since the relative allocation of responsibility is well understood by both management and the board.
The board has established that they will meet at a minimum of every three months, unless additional meetings are required. The board and committees may take action at these regularly held meetings or at a meeting by conference call or by written consent.
18
Committees
Audit Committee
The audit committee assists the board in its oversight of the Company’s financial statements and other related public disclosures, the Company’s compliance with legal and regulatory requirements relating to financial reporting, the external auditors, qualifications and independence and the performance of the internal audit function and the external auditors. The committee has direct communications channels with the Company’s auditors. The committee reviews the Company’s financial statements and related management’s discussion and analysis of financial and operating results. The committee can retain legal, accounting or other advisors.
The audit committee consists of three directors (Messrs. Matt Wayrynen, Lloyd Andrews and Louis Wolfin) one of whom is unrelated (Messer. Andrews) and all of whom are financially literate, and have accounting or related financial expertise. "Financially literate" means the ability to read and understand a balance sheet, an income statement, and a cash flow statement. "Accounting or related financial expertise" means the ability to analyze and interpret a full set of financial statements, including the notes attached thereto, in accordance with Canadian GAAP.
It is intended that this committee will eventually be comprised solely of unrelated directors.
The board has adopted a charter for the audit committee which is reviewed annually and sets out the role and oversight responsibilities of the audit committee with respect to:
| - | its relationship with and expectation of the external auditors, including the establishment of the independence of the external auditor and the approval of any non-audit mandates of the external auditor; |
| - | determination of which non-audit services the external auditor is prohibited from providing; |
| - | the engagement, evaluation, remuneration, and termination of the external auditors; |
| - | appropriate funding for the payment of the auditor’s compensation and for any advisors retained by the audit committee; |
| - | its relationship with and expectation of the internal auditor; |
| - | its oversight of internal control; |
| - | disclosure of financial and related information; and |
| - | any other matter that the audit committee feels is important to its mandate or that which the board chooses to delegate to it. |
D. Employees
The Company has no full time employees.
E. Share Ownership
The following table sets for the share ownership of the directors and officers of the Company as of December 31, 2003.
Name of Beneficial Owner | Number of Shares | Percent |
| Louis Wolfin | Nil | Nil |
Matt Wayrynen(1) | 1,471,756 | 21.61 |
| Lloyd Andrews | 105,000 | 1.54 |
| James O'Byrne | 5,000 | 0.07 |
| Andrea Regnier | Nil | Nil |
| All Officers and Directors as a Group (five in number) | 1,581,756 | 23.22 |
______________________________
(1)1,434,756 shares are held by his spouse.
Options Granted to Directors and Officers During the Fiscal Year ended December 31, 2003
Name of Officer | Securities Under Option | Exercise Price | Purchase Price, if any | Expiration Date | |||||||||
| Louis Wolfin | 5,000 | $ | 0.52 | N/A | September 19, 2008 | ||||||||
| Jim O’Byrne | 50,000 | $ | 0.52 | N/A | September 19, 2008 | ||||||||
| Matt Wayrynen | 300,000 | $ | 0.52 | N/A | September 19, 2008 | ||||||||
| Lloyd Andrews | 300,000 | $ | 0.52 | N/A | September 19, 2008 | ||||||||
| Andrea Regnier | 15,000 | $ | 0.52 | N/A | September 19, 2008 | ||||||||
19
Outstanding Options
The following information, as of December 31, 2003, reflects outstanding options held by directors, officers and employees of the Company.
Name | No. of Shares | Date of Grant | Exercise Price | Expiration Date of Option | |||||||||
| Ernest Calvert | 195,000 | 04/25/00 | $ | 0.34 | 04/25/05 | ||||||||
| Louis Wolfin | 195,000 | 04/25/00 | $ | 0.34 | 04/25/05 | ||||||||
James O¢Byrne | 20,000 | 04/25/00 | $ | 0.34 | 04/25/05 | ||||||||
| Jim Baylis | 5,000 | 04/25/00 | $ | 0.34 | 04/25/05 | ||||||||
| E. M. Freddie Chapel | 2,500 | 04/25/00 | $ | 0.34 | 04/25/05 | ||||||||
| Louis Wolfin | 5,000 | 09/19/03 | $ | 0.52 | 09/19/09 | ||||||||
| James O’Byrne | 50,000 | 09/19/03 | $ | 0.52 | 09/19/09 | ||||||||
| Andrea Regnier | 15,000 | 09/19/03 | $ | 0.52 | 09/19/09 | ||||||||
| David Wolfin | 50,000 | 09/19/03 | $ | 0.52 | 09/19/09 | ||||||||
| Matt Wayrynen | 300,000 | 09/19/03 | $ | 0.52 | 09/19/09 | ||||||||
| Lloyd Andrews | 300,000 | 09/19/03 | $ | 0.52 | 09/19/09 | ||||||||
| Suki Beckow | 10,000 | 09/19/03 | $ | 0.52 | 09/19/08 | ||||||||
| John Ross | 5,000 | 09/19/03 | $ | 0.52 | 9/19/08 | ||||||||
| David Wolfin | 150,000 | 11/26/03 | $ | 0.57 | 09/19/09 | ||||||||
| Options held by officers and directors as a group | 1,080,000 | ||||||||||||
20
Item 7. Major Shareholders and Related Party Transactions
A. Major Shareholders
As far as it is known to the Company, it is not directly or indirectly owned or controlled by any other corporation or by the Canadian Government or any foreign government, or by any other natural or legal person.
The following sets forth, as of December 31, 2003, the share ownership of directors, officers and persons known to the Company to own beneficially five percent (5%) or more of the outstanding shares of each class of the Company¢s voting securities. The Company's major shareholders do not have different voting rights and there are no arrangements known to the Company which may at a subsequent date result in a change of control of the Company:
Name | Number of Shares of Common Stock Owned | Percent of Class | |||||
| Matt Wayrynen | 37,000 | * | |||||
| Lisa Wayrynen** | 1,434,756 | 21.06 | % | ||||
* Less than 1%.
** Spouse of Matt Wayrynen, the Company's president.
B. Related Party Transactions
The Company owns a certain office building located in Vancouver, British Columbia. Tenants in this office building include several companies in which Messrs. Wolfin and Calvert have an interest. For the year 2003, 2002 and 2001, these related companies paid annual rent to the Company of $31,200, $31,200 and $31,200, respectively. The Company believes such rent was comparable to the rent that would have been charged to an unaffiliated third party.
For the year 2003, 2002 and 2001, the Company paid to other companies whose shareholders are directors of the Company $55,592, $48,291 and $46,969, respectively, for accounting, administrative and premises expenses, and $69,927, $117,000 and $36,000, respectively, for consulting and management fees and expenses.
On May 1, 2002, the Company entered into an employment contract with the former President/CEO Mr. Ernest Calvert, that terminates December 31, 2006. The agreement provides for an annual salary of $60,000 payable monthly for Mr. Calvert¢s continued services as a consultant to the Company. In addition, on May 1, 2002 the Company entered into an employment contract with the named former executive officer¢s wife, namely Janie Calvert, for accounting services. The agreement provides for an annual salary of $36,000 payable monthly and terminates December 31, 2006.
C. Interests of Experts and Counsel
Not Applicable.
Item 8. Financial Information
A. Consolidated Statements and Other Financial Information
1. The following financial statements of the Company are attached to this Annual Report:
Auditors' Report.
Balance Sheet as at December 31, 2003 and 2002.
Statements of Operations for the years ended December 31, 2003, 2002 and 2001.
Statements of Retained Earnings (Deficit) for the years ended December 31, 2003, 2002 and 2001.
Statements of Cash flows for the years ended December 31, 2003, 2002 and 2001.
Notes to the Financial Statements.
2. The Company has never paid any dividends and does not intend to in the near future.
21
B. Significant Changes
None.
Item 9. The Offer and Listing
A. Offer and Listing Details
The Common stock of the Company is listed on theTSX Venture Exchange under the symbol "BKS."
As of December 31, 2003, 2.19% of the Company¢s outstanding common stock was registered in the names of U.S. residents. There were, as of December 31, 2003, 32 record holders in the United States. The Company¢s common stock is issued in registered form and the percentage of shares reported to be held by record holders in the United States is taken from the records of Computershare Trust Company of Canada in the City of Vancouver, the registrar and transfer agent for the common stock.
The high and low prices expressed in Canadian dollars on theTSX Venture Exchange for the Company's common stock for the last six months, for each quarter for the last two fiscal years, and for the five most recent fiscal years is as follows:
TSX Venture Exchange (Canadian Dollars) | |||||||
Last Six Months | High | Low | |||||
| May, 2005 | 1.00 | 0.85 | |||||
| April 2005 | 1.15 | 0.85 | |||||
| March 2005 | 1.35 | 0.90 | |||||
| February 2005 | 1.44 | 1.15 | |||||
| January 2005 | 1.49 | 1.20 | |||||
| December 2004 | 1.39 | 1.14 | |||||
2004 | High | Low | |||||
| Fourth Quarter | 1.50 | 0.96 | |||||
| Third Quarter | 1.13 | 0.65 | |||||
| Second Quarter | 1.04 | 0.75 | |||||
| First Quarter | 1.09 | 0.72 | |||||
2003 | High | Low | |||||
| Fourth Quarter | 0.80 | 0.68 | |||||
| Third Quarter | 0.80 | 0.60 | |||||
| Second Quarter | 0.64 | 0.42 | |||||
| First Quarter | 0.53 | 0.40 | |||||
Five Most Recent Fiscal Years | High | Low | |||||
| December 31, 2004 | 1.50 | 0.72 | |||||
| December 31, 2003 | 0.80 | 0.40 | |||||
| December 31, 2002 | 0.60 | 0.28 | |||||
| December 31, 2001 | 0.45 | 0.28 | |||||
| December 31, 2000 | 0.51 | 0.20 | |||||
B. Plan of Distribution
Not Applicable.
C. Markets
The Company¢s common stock is listed in Canada on theTSX Venture Exchange under the symbol "BKS".
D. Selling Shareholders
Not Applicable.
22
E. Dilution
Not Applicable.
F. Expenses of the Issue
Not Applicable.
Item 10. Additional Information
A. Share Capital
Not Applicable.
B. Memorandum and Articles of Association
Fortune Island Mines Ltd., which was incorporated on the first day of February, 1966, under the name Fortune Island Mines Ltd. (N.P.L.), under Certificate No. 68018, which converted to a limited company Fortune Island Mines Ltd., on the eight day of July, 1982, and Kerry Mining Ltd., which was incorporated on the 26th day of February, 1973, under the name Kerry Mining Ltd. (N.P.L.),under Certificate No. 116112, which converted to a limited company Kerry Mining Ltd., on the seventh day of July, 1982, and the Company, which was incorporated on the 29th day of January, 1974, under the name Trevlac Resources, Inc., under Certificate No. 124754 and subsequently changed its name to Berkley Resources Inc., on the 30th day of July, 1976, were amalgamated on July 18, 1986, pursuant to the Company Act as one company with the name Berkley Resources Inc.
Common Shares
All issued and outstanding common shares are fully paid and non-assessable. Each holder of record of common shares is entitled to one vote for each common share so held on all matters requiring a vote of shareholders, including the election of directors. The holders of common shares will be entitled to dividends on a pro-rata basis, if and when as declared by the board of directors. There are no preferences, conversion rights, preemptive rights, subscription rights, or restrictions or transfers attached to the common shares. In the event of liquidation, dissolution, or winding up of the Company, the holders of common shares are entitled to participate in the assets of the Company available for distribution after satisfaction of the claims of creditors.
Powers and Duties of Directors
The directors shall manage or supervise the management of the affairs and business of the Company and shall have authority to exercise all such powers of the Company as are not, by the Company Act or by the Memorandum or the Articles, required to be exercised by the Company in a general meeting.
Directors will serve as such until the next annual meeting. In general, a director who is, in any way, directly or indirectly interested in an existing or proposed contract or transaction with the Company whereby a duty or interest might be created to conflict with his duty or interest as a director, shall declare the nature and extent of his interest in such contract or transaction or the conflict or potential conflict with his duty and interest as a director. Such director shall not vote in respect of any such contract or transaction with the Company in which he is interested and if he shall do so, his vote shall note be counted, but he shall be counted in the quorum present at the meeting at which such vote is taken. However, notwithstanding the foregoing, directors shall have the right to vote on determining the remuneration of the directors.
The directors may from time to time on behalf of the Company: (a) borrow money in such manner and amount from such sources and upon such terms and conditions as they think fit; (b) issue bonds, debentures and other debt obligations; and (c) mortgage, charge or give other security on the whole or any part of the property and assets of the Company.
The majority of the directors of the Company must be persons ordinarily resident in Canada and one director of the Company must be ordinarily resident in British Columbia. There is no age limitation, other than the statutorily prescribed minimum age requirement of 18 years, or minimum share ownership, for the Company¢s directors.
Shareholders
An annual general meeting shall be held once in every calendar year at such time and place as may be determined by the directors. A quorum at an annual general meeting and special meeting shall be two shareholders or one shareholder and a proxy holder representing another shareholder. There is no limitation imposed by the laws of Canada or by the charter or other constituent documents of the Company on the right of a non-resident to hold or vote the common shares, other than as provided in the Investment Canada Act, referred to as the "Investment Act", discussed below under "Item 10. Additional Information, D. Exchange Controls."
In accordance with British Columbia law, directors shall be elected by an "ordinary resolution" which means (a) a resolution passed by the shareholders of the Company at a general meeting by a simple majority of the votes cast in person or by proxy, or (b) a resolution that has been submitted to the shareholders of the Company who would have been entitled to vote on it in person or by proxy at a general meeting of the Company and that has been consented to in writing by such shareholders of the Company holding shares carrying not less than the prescribed majority of the votes entitled to be cast on it.
23
Under British Columbia law certain items such as an amendment to the Company's articles or entering into a merger, requires approval by a special resolution which shall mean (a) a resolution passed by a majority of not less than the prescribed majority of the votes cast by the shareholders of the Company who, being entitled to do so, vote in person or by proxy at a general meeting of the company; and (b) a resolution consented to in writing by every shareholder of the Company who would have been entitled to vote in person or by proxy at a general meeting of the Company, and a resolution so consented to is deemed to be a special resolution passed at a general meeting of the Company.
Recent Developments
On March 29, 2004, the British Columbia legislature enacted the British Columbia Business Corporations Act ("BCBCA") and repealed the British Columbia Company Act (the "Company Act"). The BCBCA removes many of the restrictions contained in the Company Act, including restrictions on the residency of directors, the location of annual general meetings and limits on authorized share capital. As well, the BCBCA uses new forms and terminology and has replaced the Memorandum with a Notice of Articles. At the Company's annual and special general meeting, held on June 13, 2005, shareholders were asked to approve:
| 1. | a special resolution to remove the application of the Pre-existing Company Provisions, as defined in the Business Corporations Act (British Columbia); |
| 2. | a special resolution to alter the Company's share structure to an unlimited number of common shares without par value; and |
| 3. | a special resolution to approve new articles for the Company. |
The regulations under the BCBCA effectively added certain provisions, called "Pre-Existing Company Provisions" or "PCPs", to every company's Notice of Articles. The PCPs provide that the number of votes required to pass a special resolution (formerly also referred to as a special resolution under the Company Act) or a special separate resolution is at least three-quarters of the votes cast by shareholders present in person or by proxy at the meeting. This is the majority that was required under the Company Act. The BCBCA allows a special resolution to be passed by at least two-thirds of the votes cast by shareholders present in person or by proxy at the meeting. The Company proposes to amend its Notice of Articles to delete the PCPs so that the provisions of the BCBCA permitting a two-thirds majority will apply to the Company.
The shareholders have approved the above resolutions and therefore special resolutions will require a two-thirds majority vote, instead of a three-quarters majority vote. Management believes that this provides the Company with greater flexibility for future corporate activities and is consistent with special resolution requirements for companies in other jurisdictions.
C. Material Contracts
Other than as otherwise disclosed in this Annual Report, the Company has not entered into any material contracts.
D. Exchange Controls
There is no law, governmental decree or regulation in Canada that restricts the export or import of capital or affects the remittance of dividends, interest or other payments to a non-resident holder of common shares other than withholding tax requirements. Any such remittances to United States residents are subject to withholding tax. See "Taxation".
There is no limitation imposed by the laws of Canada or by the charter or other constating documents of the Company on the right of a non-resident to hold or vote the common shares, other than as provided in the Investment Act. The following discussion summarizes the principal features of the Investment Act for a non-resident who proposes to acquire the common shares.
The Investment Act generally prohibits implementation of a reviewable investment by an individual, government or agency thereof, corporation, partnership, trust or joint venture (each an "entity") that is not a "Canadian" as defined in the Investment Act (a "non-Canadian"), unless after review, the Director of Investments appointed by the minister responsible for the Investment Act is satisfied that the investment is likely to be of net benefit to Canada. An investment in the common shares by a non-Canadian other than a "WTO Investor" (as that term is defined by the Investment Act, and which term includes entities which are nationals of or are controlled by nationals of member states of the World Trade Organization) when the Company was not controlled by a WTO Investor, would be reviewable under the Investment Act if it was an investment to acquire control of the Company and the value of the assets of the Company, as determined in accordance with the regulations promulgated under the Investment Act, equals or exceeds $5 million for direct acquisition and over $50 million for indirect acquisition, or if an order for review was made by the federal cabinet on the grounds that the investment related to Canada's cultural heritage or national identity, regardless of the value of the assets of the Company. An investment in the common shares by a WTO Investor, or by a non-Canadian when the Company was controlled by a WTO Investor, would be reviewable under the Investment Act if it was an investment to acquire control of the Company and the value of the assets of the Company, as determined in accordance with the regulations promulgated under the Investment Act, was not less than a specified amount, which for 2004 is any amount in excess of $137 million. A non-Canadian would acquire control of the Company for the purposes of the Investment Act if the non-Canadian acquired a majority of the common shares. The acquisition of one third or more, but less than a majority of the common shares, would be presumed to be an acquisition of control of the Company unless it could be established that, on the acquisition, the Company was not controlled in fact by the acquirer through the ownership of the common shares.
24
Certain transactions relating to the common shares would be exempt from the Investment Act, including: (i) an acquisition of the common shares by a person in the ordinary course of that person's business as a trader or dealer in securities; (ii) an acquisition of control of the Company in connection with the realization of security granted for a loan or other financial assistance and not for a purpose related to the provisions of the Investment Act; and (iii) an acquisition of control of the Company by reason of an amalgamation, merger, consolidation or corporate reorganization following which the ultimate direct or indirect control in fact of the Company, through the ownership of the common shares, remained unchanged.
E. Taxation
Canadian Federal Income Tax Consequences
The following summarizes the principal Canadian federal income tax consequences applicable to the holding and disposition of common shares in the capital of the Company by a United States resident, and who holds common shares solely as capital property (a "U.S. Holder"). This summary is based on the current provisions of the Income Tax Act (Canada) (the "Tax Act"), the regulations thereunder, all amendments thereto publicly proposed by the government of Canada, the published administrative practices of Revenue Canada, Customs, Excise and Taxation, and on the current provisions of the Canada-United States Income Tax Convention, 1980, as amended (the "Treaty"). Except as otherwise expressly provided, this summary does not take into account any provincial, territorial or foreign (including without limitation, any U.S.) tax law or treaty. It has been assumed that all currently proposed amendments will be enacted substantially as proposed and that there is no other relevant change in any governing law or practice, although no assurance can be given in these respects.
Each U.S. Holder is advised to obtain tax and legal advice applicable to such U.S. Holder's particular circumstances.
Every U.S. Holder is liable to pay a Canadian withholding tax on every dividend that is or is deemed to be paid or credited to the U.S. Holder on the U.S. Holder's common shares. The statutory rate of withholding tax is 25% of the gross amount of the dividend paid. The Treaty reduces the statutory rate with respect to dividends paid to a U.S. Holder for the purposes of the Treaty. Where applicable, the general rate of withholding tax under the Treaty is 15% of the gross amount of the dividend, but if the U.S. Holder is a company that owns at least 10% of the voting stock of the Company and beneficially owns the dividend, the rate of withholding tax is 5% for dividends paid or credited after 1996 to such corporate U.S. Holder. The Company is required to withhold the applicable tax from the dividend payable to the U.S. Holder, and to remit the tax to the Receiver General of Canada for the account of the U. S. Holder.
Pursuant to the Tax Act, a U.S. Holder will not be subject to Canadian capital gains tax on any capital gain realized on an actual or deemed disposition of a common share, including a deemed disposition on death, provided that the U.S. Holder did not hold the common share as capital property used in carrying on a business in Canada, and that neither the U. S. Holder nor persons with whom the U.S. Holder did not deal at arms length (alone or together) owned or had the right or an option to acquire 25% or more of the issued shares of any class of the Company at any time in the five years immediately preceding the disposition.
United States Tax Consequences
Passive Foreign Investment Companies
The Treaty essentially calls for taxation of shareholders by the shareholder's country of residence. In those instances in which a tax may be assessed by the other country, a corresponding credit against the tax owed in the country of residence is generally available, subject to limitations.
Under Section 1296 of the Internal Revenue Code of the United States, referred to as the "Code", a foreign investment corporation is treated as a passive foreign investment company, referred to as a "PFIC", if it earns 75% or more of its gross income from passive sources or if 50% or more of the value of its assets produce passive income. The Company has not been a PFIC for United States federal income tax purposes for prior taxable years and believes that it will not be treated as a PFIC for the current and future taxable years, but this conclusion is a factual determination made annually and subject to change.
Controlled Foreign Corporations
Sections 951 through 964 and Section 1248 of the Code relate to controlled foreign corporations, referred to as "CFCs". A foreign corporation that qualifies as a CFC will not be treated as a PFIC with respect to a shareholder during the portion of the shareholder's holding period after December 31, 1997, during which the shareholder is a 10% United States shareholder and the corporation is a CFC. The PFIC provisions continue to apply in the case of PFIC that is also a CFC with respect to shareholders that are less than 10% United States shareholders.
The 10% United States shareholders of a CFC are subject to current U.S. tax on their pro rata shares of certain income of the CFC and their pro-rata shares of the CFC's earnings invested in certain U.S. property. The effect is that the CFC provisions may impute some portion of such a corporation's undistributed income to certain shareholders on a current basis and convert into dividend income some portion of gains on dispositions of stock which would otherwise qualify for capital gains treatment.
The Company does not believe that it will be a CFC. Even if the Company were classified as a CFC in a future year, however, the CFC rules referred to above would apply only with respect to 10% shareholders.
Personal Holding Company/Foreign Personal Holding Company/Foreign Investment Company
A corporation will be classified as a personal holding company, referred to as a "PHC", if at any time during the last half of a tax year: (i) five or fewer individuals (without regard to their citizenship or residence) directly or indirectly or by attribution own more than 50% in value of the corporation's stock; and (ii) at least 60% of its ordinary gross income, as specially adjusted, consists of personal holding company income (defined generally to include dividends, interest, royalties, rents and certain other types of passive income). A PHC is subject to a United States federal income tax of 39.6% on its undistributed personal holding company income (generally limited, in the case of a foreign corporation, to United States source income).
25
A corporation will be classified as a foreign personal holding company, referred to as an "FPHC", and not a PHC, if at any time during a tax year: (i) five or fewer individual United States citizens or residents directly or indirectly or by attribution own more than 50% of the total combined voting power or value of the corporation's stock; and (ii) at least 60% of its gross income consists of foreign personal holding company income (defined generally to include dividends, interest, royalties, rents and certain other types of passive income). Each United States shareholder in a FPHC is required to include in gross income, as a dividend, an allocable share of the FPHC's undistributed foreign personal holding company income (generally the taxable income of the FPHC, as specially adjusted).
A corporation will be classified as a foreign investment company, referred to as an "FIC", if for any taxable year it: (i) is registered under the Investment Company Act of 1940, as amended, as a management company or share investment trust or is engaged primarily in the business of investing or trading in securities or commodities (or any interest therein); and (ii) 50% or more of the value or the total combined voting power of all the corporation's stock is owned directly or indirectly (including stock owned through the application of attribution rules) by United States persons. In general, unless an FIC elects to distribute 90% or more of its taxable income (determined under United States tax principles as specially adjusted) to its shareholders, gain on the sale or exchange of FIC stock is treated as ordinary income (rather than capital gain) to the extent of such shareholder's ratable share of the corporation's earnings and profits for the period during which such stock was held.
The Company believes that it is not and will not be a PHC, FPHC or FIC. However, no assurance can be given as to the Company's future status.
Other Consequences
To the extent a shareholder is not subject to the tax regimes outlined above with respect to foreign corporations that are PFIC, PHC, FPHC or FIC, the following discussion describes the United States federal income tax consequences arising from the holding and disposition of the Company's Common Shares.
U.S. Holders
A "U.S. Holder" includes a holder of common shares who is a citizen or resident of the United States, a corporation created or organized in or under the laws of the United States or of any political subdivision thereof and any other person or entity whose ownership of common shares is effectively connected with the conduct of a trade or business in the United States. A U.S. Holder does not include persons subject to special provisions of federal income tax laws, such as tax exempt organizations, qualified retirement plans, financial institutions, insurance companies, real estate investment trusts, regulated investment companies, broker-dealers, non-resident alien individuals or foreign corporations whose ownership of common shares is not effectively connected with the conduct of a trade or business in the United States and shareholders who acquired their stock through the exercise of employee stock options or otherwise as compensation.
Distribution of Common Shares
U.S. Holders receiving dividend distributions (including constructive dividends) with respect to the Company's common shares are required to include in gross income for United States federal income tax purposes the gross amount of such distribution to the extent that the Company has current or accumulated earnings or profits, without reduction for any Canadian income tax withheld from such distributions. Such Canadian tax withheld may be credited, subject to certain limitations, against the U.S. Holder's United States federal income tax liability or, alternatively, may be deducted in computing the U.S. Holder's United States federal income tax by those who itemize deductions. (See more detailed discussions at "Foreign Tax Credit" below). To the extent that distributions exceed current or accumulated earnings and profits of the Company, they will be treated first as a return of capital up to the U.S. Holder's adjusted basis in the common shares and thereafter as a gain from the sale or exchange of such shares. Preferential tax rates for the long-term capital gains are applicable to a U.S. Holder that is an individual, estate or trust. There are currently no preferential tax rates for long-term capital gains for a U.S. Holder which is a corporation.
Dividends paid on the Company's common shares will not generally be eligible for the dividends received deduction provided to corporations receiving dividends from certain United States corporations. A U.S. Holder which is a corporation may, under certain circumstances, be entitled to a 70% deduction of the United States source portion of dividends received from the Company if such U.S. Holder owns shares representing at least 10% of the voting power and value of the Company.
Foreign Tax Credit
A U.S. Holder who pays (or has withheld from distribution) Canadian income tax with respect to the ownership of the Company's common shares may be entitled, at the option of the U.S. Holder, to either a deduction or a tax credit for such foreign tax paid or withheld. Generally, it will be more advantageous to claim a tax credit, because a credit reduces United States federal income taxes on a dollar-for-dollar basis, while a deduction merely reduces the taxpayer's income subject to tax. This election is made on a year-by-year basis and generally applies to all foreign income taxes paid by (or withheld from) the U.S. Holder during that year. There are significant and complex limitations which apply to the credit, among which is the general limitation that the credit cannot exceed the proportionate share of the U.S. Holder's United States income tax liability that the U.S. Holder's foreign source income bears to his or its worldwide taxable income. In the determination of the application of this limitation, the various items of income and deduction must be classified into foreign and domestic sources. Complex rules govern this classification process. There are further limitations on the foreign tax credit for certain types of income, such as "passive income", "high withholding tax interest", "financial services income", "shipping income" and certain other classifications of income. The availability of foreign tax credit and the application of the limitations on the credit are fact specific and holders and prospective holders of common shares should consult their own tax advisors regarding their individual circumstances.
26
Disposition of Common Shares
A U.S. Holder will recognize gain and loss upon the sale of the common shares equal to the difference, if any, between: (i) the amount of cash plus the fair market value of any property received; and (ii) the shareholder's tax basis in the common shares. The gain or loss will be capital gain or loss if the shares are a capital asset in the hands of the U.S. Holder, and will be a short-term or long-term capital gain or loss depending on each U.S. Holder's holding period. Gains and losses are netted and combined according to special rules in arriving at the overall capital gain or loss for a particular tax year. Deductions for net capital losses are subject to significant limitations. For U.S. Holders who are individuals, any unused portion of such net capital loss may be carried over to be used in later tax years until such net capital loss is thereby exhausted. For U.S. Holders which are corporations (other than corporations subject to Subchapter S of the Code), an unused capital loss may be carried back three years from the loss year and carried forward five years from the loss year to be offset against capital gains until such net capital loss is thereby exhausted.
The foregoing discussion is based upon the sections of the Code, Treasury Regulations, published Internal Revenue Service rulings, published administrative positions of the Internal Revenue Service and court decisions that are currently applicable, any or all of which could be materially adversely changed, possibly on a retroactive basis, at any time. In addition, this discussion does not consider the potential effects, both adverse and beneficial, of recently proposed legislation which, if enacted could be applied, possibly on a retroactive basis, at any time. A holder or prospective holder of the Company's common shares should consult his or her own tax advisors about federal, state local and foreign tax consequences of purchasing, owning and disposing of the common shares of the Company.
F. Dividends and Paying Agents
Not Applicable.
G. Statement by Experts
Not Applicable.
H. Documents on Display
The Company files annual reports and other information with the SEC. You may read and copy any document that we file at the SEC's Public Reference Room at 450 Fifth Street, N.W., Room 1024, Washington, D.C. 20549 or on its website at www.sec.gov. Please call the SEC at 1-800-SEC-0330 for more information about the Public Reference Room. The Company also files its annual reports and other information with the Canadian Securities Administrators via SEDAR at www.sedar.com.
Copies of the Company's material contracts are kept in the Company's administrative headquarters.
I. Subsidiary Information
None.
Item 11. Quantitative and Qualitative Disclosures About Market Risk
Because the Company is a small business issuer, this section is inapplicable.
Item 12. Description of Securities Other than Equity Securities
Not Applicable.
Part II
Item 13. Defaults, Dividend Arrearages and Delinquencies
None.
Item 14. Material Modifications to the Rights of Security Holders and Use of Proceeds
None.
Item 15. Controls and Procedures
The Company carried out an evaluation, under the supervision and with the participation of the Company's management, including the Company's chief executive officer along with the Company's principal financial officer, of the effectiveness of the design and operation of the Company's disclosure controls and procedures pursuant to Rule 13a-14 of the Securities Exchange Act of 1934, as amended. Based upon that evaluation, the Company's chief executive officer along with the Company's principal financial officer concluded that the Company's disclosure controls and procedures as of the end of the fiscal year covered by this Form 20-F are effective in timely alerting them to material information relating to the Company required to be included in this Form 20-F.
27
Item 16. [Reserved]
Item 16A. Audit Committee Financial Expert
The Company did not have an Audit Committee Financial Expert during the fiscal year ended December 31, 2003 as it was not a requirement at that time to have one. Subsequent to the implementation of the requirement that the Audit Committee have an Audit Committee Financial Expert, the Company appointed an individual with such qualifications to its board of directors.
Item 16B. Code of Ethics
The Company has not currently adopted a code of ethics but is evaluating its internal procedures to determine the necessity of same.
Item 16C. Principal Accountant Fees and Services
The independent auditor for the fiscal year ended December 31, 2002 was Collins Barrow, Chartered Accountants and the independent auditor for the fiscal year ended December 31, 2003 was Hoogendoorn Vellmer, Chartered Accountants.
Audit Fees
The aggregate fees billed by the Company’s external auditors for professional services rendered for the audit of the Company's annual financial statements for the fiscal year ended December 31, 2003 was $18,000 and December 31, 2002 was $20,000.
Audit-Related Fees
There were no fees billed for assurance and related services by the principal accountant that were reasonably related to the performance of the audit or review of the Company's financial statements for the years ended December 31, 2003 and December 31, 2002.
Tax Fees
The aggregate fees billed for tax compliance, tax advice and tax planning rendered by our independent auditors for the fiscal year ended December 31, 2003 was $1,500 and December 31, 2002 was $4,000. The services comprising these fees were regarding preparation of corporate tax returns and taxation advisory services.
All Other Fees
Other than referred to above, there were no aggregate fees billed for professional services rendered by the Company’s independent auditors for the fiscal years ended December 31, 2003 and December 31, 2002.
The Audit Committee approved 100% of the fees paid to the principal accountant for audit-related, tax and other fees in the fiscal year 2003. The Audit Committee pre-approves all non-audit services to be performed by the auditor in accordance with the Audit Committee Charter. No time was expended on the principal accountant's engagement to audit the Company's financial statements for the most recent fiscal year that was attributed to work performed by persons other than the principal accountant's full-time, permanent employees.
Item 16D. Exemptions from the Listing Standards for Audit Committees
Not applicable.
Item 16E. Purchases of Equity Securities by the Issuer and Affiliated Purchasers
None.
28
Part III
Item 17. Financial Statements
The following Financial Statements pertaining to the Company are filed as part of this annual report:
Auditors' Report ..........................................................................….………….F-2
Balance Sheets............................................................................…….………..F-3
Statements of Operations................................................................………….F-4
Statements of Deficit.....................................................................…………....F-5
Statements of Cash Flows.............................................................…F-6 thru F-7
Notes to Financial Statements......................................................... F-8 thru F-19
Item 18. Financial Statements
See Item 17.
Item 19. Exhibits
| A. | Audited Financial Statements and Financial Statement Schedules: |
Auditors' Report ............................................................................................. F-2
Balance Sheets................................................................................................ F-3
Statements of Operations.............................................................................. F-4
Statements of Deficit...................................................................................... F-5
Statements of Cash Flows.............................................................. F-6 thru F-7
Notes to Financial Statements....................................................... F-8 thru F-19
| B. | Exhibits |
Exhibit Number | Name |
1. Memorandum of Berkley Resources Inc.*
1. Memorandum of Berkley Resources Inc.*
2. Articles of Berkley Resources Inc.*
12.1 Certification of the Principal Executive Officer under the Sarbanes-Oxley Act
12.2 Certification of the Principal Financial Officer under the Sarbanes-Oxley Act
13 Certificate under section 906
___________________________
* Previously filed.
29
SIGNATURE
The registrant hereby certifies that it meets all of the requirements for filing on Form 20-F and that it has duly caused and authorized the undersigned to sign this annual report on its behalf.
BERKLEY RESOURCES INC.
Dated: June 29, 2005 By: /s/ Matt Wayrynen
Matt Wayrynen, President
30
BERKLEY RESOURCES INC.
FINANCIAL STATEMENTS
DECEMBER 31, 2003
F-1
AUDITORS’ REPORT
To the Shareholders of
Berkley Resources Inc.
We have audited the balance sheet of Berkley Resources Inc. as at December 31, 2003 and the statements of operations, deficit, and cash flows for the year then ended. These financial statements are the responsibility of the company’s management. Our responsibility is to express an opinion on these financial statements based on our audit.
We conducted our audit in accordance with Canadian and United States generally accepted auditing standards. Those standards require that we plan and perform an audit to obtain reasonable assurance whether the financial statements are free of material misstatement. An audit includes examining, on a test basis, evidence supporting the amounts and disclosures in the financial statements. An audit also includes assessing the accounting principles used and significant estimates made by management, as well as evaluating the overall financial statement presentation.
In our opinion, these financial statements present fairly, in all material respects, the financial position of the Company as at December 31, 2003 and the results of its operations and its cash flows for the year then ended in accordance with Canadian generally accepted accounting principles. We also report that in our opinion, these principles have been applied, except for the method of accounting for site restoration liabilities as explained in Note 2(e) to the financial statements, on a basis consistent with that of the preceding year.
The comparative financial statements as at December 31, 2002 and for the two year period then ended are based on financial statements audited by other auditors who expressed an unqualified opinion thereon in their report dated April 11, 2003.
Vancouver, Canada | "Hoogendoorn Vellmer" |
March 31, 2004 | Chartered Accountants |
F-2
BERKLEY RESOURCES INC. BALANCE SHEETS | |||||||
December 31, | |||||||
2003 | 2002 | ||||||
| $ | $ | ||||||
ASSETS | |||||||
Current | |||||||
| Cash | 235,225 | 36,230 | |||||
| Bankers’ acceptance and treasury bills | - | 950,730 | |||||
| Accounts receivable | 122,063 | 121,158 | |||||
| Taxes recoverable | 44,492 | 4,122 | |||||
| Prepaid expenses | 29,149 | 26,622 | |||||
| Computer software held for resale | - | 50,980 | |||||
| 430,929 | 1,189,842 | ||||||
Oil and gas properties and equipment (Note 3) | 1,109,391 | 529,651 | |||||
Rental property (Note 4) | 2,075,370 | 2,089,386 | |||||
Other capital assets (Note 5) | 1 | 20,356 | |||||
3,615,691 | 3,829,235 | ||||||
LIABILITIES | |||||||
Current | |||||||
| Accounts payable and accrued liabilities | 145,413 | 82,869 | |||||
| Bank loan (Note 6) | 565,809 | 675,233 | |||||
| 711,222 | 758,102 | ||||||
Site restoration liabilities | 136,502 | 55,200 | |||||
| 847,724 | 813,302 | ||||||
SHAREHOLDERS’ EQUITY | |||||||
Share capital (Note 7) | 3,256,816 | 3,249,326 | |||||
Contributed surplus (Note 8) | 75,000 | 75,000 | |||||
Deficit | (563,849 | ) | (308,393 | ) | |||
| 2,767,967 | 3,015,933 | ||||||
3,615,691 | 3,829,235 | ||||||
NOTE 1 - NATURE OF OPERATIONS
Approved by the Directors:
“Louis Wolfin” | Director | “Matt Wayrynen” | Director |
F-3
BERKLEY RESOURCES INC. STATEMENTS OF OPERATIONS | ||||||||||
Years Ended December 31, | ||||||||||
2003 | 2002 | 2001 | ||||||||
| $ | $ | $ | ||||||||
OIL AND GAS REVENUE | 606,133 | 406,138 | 637,497 | |||||||
Oil and gas production expenses | ||||||||||
| Operating costs | 243,717 | 189,681 | 257,862 | |||||||
| Amortization and depletion | 79,500 | 39,900 | 482,700 | |||||||
| Accretion of site restoration liabilities | 4,769 | - | - | |||||||
| 327,986 | 229,581 | 740,562 | ||||||||
| NET OIL AND GAS INCOME (LOSS) | 278,147 | 176,557 | (103,065 | ) | ||||||
RENTAL REVENUE | 238,599 | 235,670 | 208,592 | |||||||
Rental operations expenses | ||||||||||
| Operating costs | 198,596 | 168,608 | 133,043 | |||||||
| Interest on bank loan | 26,272 | 35,110 | 46,536 | |||||||
| Amortization | 14,016 | 14,600 | 12,300 | |||||||
| 238,884 | 218,318 | 191,879 | ||||||||
| NET RENTAL INCOME (LOSS) | (285 | ) | 17,352 | 16,713 | ||||||
GENERAL AND ADMINISTRATION EXPENSES | ||||||||||
| Administrative, office services and premises | 151,868 | 104,167 | 137,735 | |||||||
| Amortization | 20,354 | 3,413 | 2,277 | |||||||
| Consulting and management fees | 252,027 | 159,000 | 72,000 | |||||||
| Shareholder information | 11,032 | 3,056 | - | |||||||
| Professional fees | 54,342 | 65,959 | 45,019 | |||||||
| Transfer agent’s fees and expenses | 12,176 | 9,467 | 6,154 | |||||||
| (501,799 | ) | (345,062 | ) | (263,185 | ) | |||||
OTHER INCOME (EXPENSES) | ||||||||||
| Computer software written off | (54,988 | ) | - | - | ||||||
| Interest and other income | 23,469 | 23,506 | 56,961 | |||||||
| (31,519 | ) | 23,506 | 56,961 | |||||||
LOSS FOR THE YEAR | (255,456 | ) | (127,647 | ) | (292,576 | ) | ||||
LOSS PER SHARE | (0.04 | ) | (0.02 | ) | (0.05 | ) | ||||
WEIGHTED AVERAGE NUMBER OF SHARES OUTSTANDING | 6,797,184 | 6,382,350 | 5,851,520 | |||||||
F-4
BERKLEY RESOURCES INC. STATEMENTS OF DEFICIT |
Years Ended December 31, | ||||||||||
2003 | 2002 | 2001 | ||||||||
| $ | $ | $ | ||||||||
(DEFICIT) RETAINED EARNINGS, beginning of year | (308,393 | ) | (180,746 | ) | 111,830 | |||||
| Loss for the year | (255,456 | ) | (127,647 | ) | (292,576 | ) | ||||
(DEFICIT), end of year | (563,849 | ) | (308,393 | ) | (180,746 | ) | ||||
F-5
BERKLEY RESOURCES INC.
STATEMENTS OF CASH FLOWS
Years Ended December 31, | ||||||||||
2003 | 2002 | 2001 | ||||||||
| $ | $ | $ | ||||||||
CASH PROVIDED BY (USED IN): | ||||||||||
OPERATING ACTIVITIES | ||||||||||
| Loss for the year | (255,456 | ) | (127,647 | ) | (292,576 | ) | ||||
| Items not requiring cash in the year | ||||||||||
| Accretion of site restoration liability | 4,769 | - | - | |||||||
| Amortization and depletion | 113,870 | 57,913 | 497,277 | |||||||
| Computer software written off | 54,988 | - | - | |||||||
| Stock based compensation | 2,390 | - | - | |||||||
| (79,439 | ) | (69,734 | ) | 204,701 | ||||||
| Net change in non-cash working capital balances | ||||||||||
| Accounts receivable | (905 | ) | 6,955 | 105,388 | ||||||
| Prepaid expenses | (2,527 | ) | (25,131 | ) | 261 | |||||
| Computer software held for resale | (4,008 | ) | (50,980 | ) | - | |||||
| Taxes recoverable | (40,370 | ) | - | - | ||||||
| Accounts payable and accrued liabilities | 62,545 | (43,225 | ) | (80,124 | ) | |||||
| (64,704 | ) | (182,115 | ) | 230,226 | ||||||
INVESTING ACTIVITIES | ||||||||||
| Treasury bills | - | - | 150,000 | |||||||
| Oil and gas properties and equipment, net | (582,707 | ) | (25,458 | ) | (201,915 | ) | ||||
| Rental property | - | - | (444,854 | ) | ||||||
| Other capital assets | - | (17,800 | ) | - | ||||||
| (582,707 | ) | (43,258 | ) | (496,769 | ) | |||||
FINANCING ACTIVITIES | ||||||||||
| Repayment of bank loan | (109,424 | ) | (107,690 | ) | (73,653 | ) | ||||
| Issuance of common shares | 5,100 | 250,000 | 200,000 | |||||||
| (104,324 | ) | 142,310 | 126,347 | |||||||
Decrease in cash for the year | (751,735 | ) | (83,063 | ) | (140,196 | ) | ||||
CASH, beginning of the year | 986,960 | 1,070,023 | 1,210,219 | |||||||
CASH, end of the year | 235,225 | 986,960 | 1,070,023 | |||||||
CASH IS COMPRISED OF: | ||||||||||
| Cash | 235,225 | 36,230 | 32,653 | |||||||
| Bankers’ acceptances and treasury bills | - | 950,730 | 1,037,370 | |||||||
235,225 | 986,960 | 1,070,023 | ||||||||
F-6
BERKLEY RESOURCES INC.
STATEMENTS OF CASH FLOWS (continued)
Years Ended December 31, | ||||||||||
2003 | 2002 | 2001 | ||||||||
| $ | $ | $ | ||||||||
SUPPLEMENTAL DISCLOSURE OF NON-CASH FINANCING AND INVESTING ACTIVITIES | ||||||||||
| Future removal and reclamation liability accrued as property cost, net of accumulated amortization of $55,200 | 76,533 | - | - | |||||||
SUPPLEMENTAL STATEMENTS OF CASH FLOWS DISCLOSURE | ||||||||||
| Taxes | - | - | - | |||||||
| Interest on long term debt | 26,272 | 35,110 | 46,536 | |||||||
F-7
BERKLEY RESOURCES INC. NOTES TO FINANCIAL STATEMENTS |
NOTE 1 - NATURE OF OPERATIONS
Berkley Resources Inc. (“the Company”) was created on the amalgamation of Fortune Island Mines Ltd., Kerry Mining Ltd. and Berkley Resources Ltd. under the Company Act (British Columbia) on July 18, 1986 The Company is in the business of acquisition, exploration, development and production from petroleum and natural gas interests in Alberta and Saskatchewan, Canada. The Company also rents commercial office space in a building it owns in Vancouver, Canada.
The Company will likely have to periodically raise additional funds to participate in future exploration and development work on its petroleum and natural gas properties. Management intends to issue additional shares in the upcoming year for this purpose.
NOTE 2- SIGNIFICANT ACCOUNTING POLICIES
| (a) | Basis of presentation |
These financial statements are prepared in accordance with Canadian generally accepted accounting principles, which do not materially differ from accounting principles generally accepted in the United States, except as disclosed in Note 14.
| (b) | Currency |
All amounts in these financial statements are expressed in Canadian dollars.
| (c) | Revenue recognition |
Revenue associated with the sale of crude oil, natural gas and liquids represent the sales value of the Company’s share of petroleum production during the year received from third party purchasers on delivery. Differences between production and amounts delivered and sold are not significant.
Rental revenue is recognized on a monthly basis under the terms of lease agreements with tenants.
| (d) | Oil and gas properties and equipment |
Berkley follows the full cost method of accounting for oil and gas properties and equipment whereby all costs of acquiring, exploring for and developing oil and gas reserves are capitalized. The Company does not capitalize any amount of interest or administrative expenses.
Capitalized costs of proven reserves and equipment are depleted using a unit of production method based upon estimated proven reserves (energy content) net of royalties.
Unless a significant amount of reserves is involved, proceeds received from the disposition of oil and gas properties are credited to the relevant cost centre. In the event of a significant sale of reserves, a proportionate amount of cost and accumulated deletion, based upon the ratio of reserves sold to total reserves, is removed from the appropriate cost centre and the resultant profit or loss taken into income.
In accordance with guidelines published by the Canadian Institute of Chartered Accountants, the company applies an annual “ceiling test” by cost centre to ensure that capitalized costs net of accumulated depletion do not exceed the estimated future net revenues from production of proven reserves (based on commodity prices in effect at the financial statement date and current operating costs) plus unproven reserves at cost less provisions for impairment. The aggregate future value for all cost centres is further reduced for recurring general and administrative costs, future financing costs and income taxes. Capitalized costs in excess of this ceiling test limit are written off as additional depletion.
Substantially all of the Company’s oil and gas interests are conducted jointly with others. The financial statements reflect only the Company’s share of assets, liabilities, and operations.
F-8
BERKLEY RESOURCES INC. NOTES TO FINANCIAL STATEMENTS |
NOTE 2- SIGNIFICANT ACCOUNTING POLICIES (continued)
| (e) | Site restoration liability |
In accordance with the new Handbook Section 3110 of the Canadian Institute of Chartered Accountants, the Company recognizes the fair value of its liability for asset retirement obligations, which in the oil and gas industry are categorized as “site restoration costs”, in the year in which such liability is incurred. Upon recognition of an asset retirement obligation, the capitalized cost of the oil and gas property is increased by the same amount as the liability. In periods subsequent to initial measurement, the asset retirement obligation is adjusted for both the passage of time and revisions to the original estimates. This new Handbook Section has been applied prospectively commencing January 1, 2003. The Company evaluated its site restoration costs effective January 1, 2003 on a present value basis, giving regard to known estimated site restoration costs and the estimated time period in which the restoration work will need to be performed. The present value of the site restoration costs were added to the capitalized cost of the oil and gas properties interest, and recorded as a liability at the equivalent amount. The amount of the previous liability recorded on a unit of production depletion basis was transferred to accumulated amortization of oil and gas properties. The effect of adoption of Section 3110 was to increase oil and gas costs subject to depletion by $24,087 from $529,651 to $553,738 at January 1, 2003, and to increase the recorded site restoration liability by $24,087 to $79,287 from $55,200 previously recorded.
There was no material change in net income for fiscal 2003 due to the adoption of the new accounting recommendation.
| (f) | Rental property and other capital assets |
Land and building are recorded at cost, net of accumulated amortization on the building. The cost of the building is amortized over its estimated useful life, currently at the rate of 4% per annum by the declining balance method.
Other capital assets were written down to nominal value in 2003 and are no longer subject to amortization.
| (g) | Financial instruments |
The Company’s financial instruments include cash, accounts receivable, taxes recoverable, accounts payable and accrued liabilities and bank loan. The carrying values of these financial instruments approximate their fair values.
The Company is not exposed to significant credit or currency risk on financial instruments. It is exposed to interest risk on its bank loan.
| (h) | Use of estimates |
The preparation of financial statements in conformity with Canadian generally accepted accounting principles requires management to make estimates and assumptions that affect the reported amounts of assets and liabilities and disclosure of contingent assets and liabilities at the date of the financial statements and the reported amounts of revenues and expenses during the reporting period. Actual results could differ from those estimates. Significant areas requiring the use of management estimates relate to the determination of useful lives of oil and gas properties and equipment and the rental property for purposes of calculating amortization and depletion.
F-9
BERKLEY RESOURCES INC. NOTES TO FINANCIAL STATEMENTS |
NOTE 2- SIGNIFICANT ACCOUNTING POLICIES (continued)
| (i) | Stock based compensation plan |
Compensation expense is recorded for the estimated fair value of stock options granted to non-employees. As permitted by CICA, Handbook Section 3870, the Company has adopted the disclosure-only method of reporting for stock options granted to employees. Prior to the enactment of Section 3870 effective January 1, 2002, no compensation was reported when stock options were granted to employees or non-employees.
| (j) | Loss per share |
Basic loss per share is calculated by dividing the loss for the year by the weighted average number of shares outstanding in the year. Diluted loss per share on the potential exercise of share options and warrants is not presented where it is anti-dilutive.
| (k) | Income taxes |
Future income tax assets and liabilities are recorded where the accounting net book value of assets and liabilities differ from their corresponding tax bases. The benefit of future income tax assets is only recognized when their realization is considered more likely than not.
NOTE 3 - OIL AND GAS PROPERTIES AND EQUIPMENT
2003 | 2002 | ||||||
| $ | $ | ||||||
| Oil and gas properties and equipment, cost | 4,093,518 | 3,379,078 | |||||
| Less: Accumulated amortization and depletion | (2,984,127 | ) | 2,849,427 | ||||
1,109,391 | 529,651 | ||||||
Oil and gas properties and equipment includes the cost of unproven properties of approximately $208,000 (2002 - $373,000) which are currently not subject to depletion.
NOTE 4 - RENTAL PROPERTY
2003 | 2002 | ||||||
| $ | $ | ||||||
| Building, at cost | 447,652 | 447,652 | |||||
| Less: Accumulated amortization | (111,276 | ) | (97,260 | ) | |||
| 336,376 | 350,392 | ||||||
| Land, at cost | 1,738,994 | 1,738,994 | |||||
2,075,370 | 2,089,386 | ||||||
F-10
BERKLEY RESOURCES INC.
NOTES TO FINANCIAL STATEMENTS
NOTE 5 - OTHER CAPITAL ASSETS
2003 | 2002 | ||||||||||||
| Cost | Accumulated Amortization | Net | Net | ||||||||||
| $ | $ | $ | $ | ||||||||||
| Computer equipment | 12,836 | (12,836 | ) | - | 17,173 | ||||||||
| Furniture and fixtures | 5,585 | (5,585 | ) | - | 449 | ||||||||
| Truck | 39,040 | (39.039 | ) | 1 | 2,734 | ||||||||
57,461 | (57,460 | ) | 1 | 20,356 | |||||||||
Amortization of $20,354 for the 2003 fiscal year includes additional amortization of $17,800 recorded as the result of the revaluation of the Company’s computer equipment. Amortization recorded for fiscal year 2002 was $3,413.
NOTE 6 - BANK LOAN
The bank loan is payable to the Canadian Imperial Bank of Commerce, bears interest at prime plus 0.50% per annum, is due on demand, and is secured by a first mortgage over the rental property and an assignment of rents.
The Company is currently making monthly payments of $11,900 towards interest and reduction of principal.
NOTE 7 - SHARE CAPITAL
(a) Authorized |
100,000,000 common shares, without par value (increased in the year from 20,000,000 shares) |
2003 | 2002 | ||||||||||||
| Number of Shares | Amount | Number of Shares | Amount | ||||||||||
| $ | $ | $ | $ | ||||||||||
| Balance, beginning of year | 6,795,934 | 3,249,326 | 5,795,934 | 2,999,326 | |||||||||
| Issued in the year: | |||||||||||||
| Exercise of stock options | 15,000 | 5,100 | - | - | |||||||||
| Exercise of warrants | - | - | 1,000,000 | 250,000 | |||||||||
| Stock based compensation | - | 2,390 | - | - | |||||||||
Balance, end of year | 6,810,934 | 3,256,816 | 6,795,934 | 3,249,326 | |||||||||
F-11
BERKLEY RESOURCES INC.
NOTES TO FINANCIAL STATEMENTS
NOTE 7 - SHARE CAPITAL (continued)
(b) Warrants | |||||||||||||
| The changes in share purchase warrants in the current and previous year are as follows: | |||||||||||||
2003 | 2002 | ||||||||||||
| Number of shares subject to warrants | Exercise price per share | Number of shares subject to warrants | Exercise price per share | ||||||||||
| Balance, beginning of year | - | - | 1,000,000 | $ | 0.25 | ||||||||
| Activity in the year | |||||||||||||
| Granted | - | - | - | - | |||||||||
| Exercised | - | - | (1,000,000 | ) | $ | 0.25 | |||||||
| Balance, end of year | - | - | - | - | |||||||||
(c) Management incentive options
2003 | 2002 | ||||||||||||
Number of shares subject to option | Weighted Average exercise price per share | Number of shares subject to option | Weighted average exercise price per share | ||||||||||
Balance outstanding, beginning of year | 437,500 | $ | 0.34 | 457,500 | $ | 0.34 | |||||||
| Activity in the year | |||||||||||||
| Granted | 885,000 | 0.53 | - | - | |||||||||
| Exercised | (15,000 | ) | 0.34 | - | - | ||||||||
| Lapsed | (5,000 | ) | 0.52 | (20,000 | ) | 0.34 | |||||||
| Balance outstanding, end of year | 1,302,500 | $ | 0.49 | 437,500 | $ | 0.34 | |||||||
Vested, end of year | 653,750 | $ | 0.40 | 437,500 | $ | 0.34 | |||||||
A summary of management incentive options outstanding is as follows:
Exercise Price Per Share | Expiry Date | Number of Shares Remaining Subject to Options at December 31: | ||||||||
2003 | 2002 | |||||||||
| $0.34 | April 25, 2005 | 422,500 | 437,500 | |||||||
| $0.52 | September19, 2008 | 730,000 | - | |||||||
| $0.57 | September 19, 2008 | 150,000 | - | |||||||
F-12
BERKLEY RESOURCES INC.
NOTES TO FINANCIAL STATEMENTS
NOTE 7 - SHARE CAPITAL (continued)
(c) Management incentive options (continued)
The Company has established a 2003 Stock Option Plan (the “Plan”) which provides for the granting of options to acquire up to 1,300,000 shares. The Plan provides for the granting of options to employees and service providers, with no single optionee to be granted options in excess of 5% of the number of issued shares of the Company. All options are to be granted at market price, and the term of the options granted is not to exceed five years. Options to acquire a total of 735,000 shares have been granted and are outstanding at December 31,2003 under the Plan.
In accordance with theCICA Handbook Section 3870 (“Section 3870”) Stock Based Compensation and other Stock-Based Payments,the Company recognizes compensation expense for the estimated fair value of stock options granted to non-employees after January 1, 2002. In 2003, the Company granted 270,000 stock options to non-employee consultants, having a weighted average life of five years, vesting over 18 months, and exercisable at the weighted average price of $0.55 per share. The company recorded stock based compensation expense of $2,390 on account of these stock options, which remain outstanding at December 31, 2003. There were no stock options granted to non-employees in 2002.
As permitted bySection 3870, the Company has elected to not record compensation expense for stock options granted to employees. In 2003, a total of 615,000 stock options were granted to employees, having a remaining weighted average life of 5 years, vesting over an 18 month period, and exercisable at a price of $0.52 per share. There were no stock options granted to employees in 2002. Had compensation expense for the stock options granted to employees been recorded based upon the fair value of the stock options, additional compensation expense for 2003 would have been approximately $11,000 (2002: Nil).
Section 3870 requires the following pro forma disclosure assuming this additional compensation expense:
Years ended December 31, | ||||||||||
2003 | 2002 | 2001 | ||||||||
| $ | $ | $ | ||||||||
| Loss for the year excluding additional compensation | 255,456 | 127,647 | 292,576 | |||||||
| Pro-forma stock based compensation | 11,000 | - | - | |||||||
| Pro-forma loss including additional compensation | 266,456 | 127,647 | 292,576 | |||||||
| Pro forma basic and diluted loss per share | $ | 0.04 | $ | 0.02 | $ | 0.04 | ||||
The fair value of the options granted to both employees and non-employees was estimated at the date of granting using the Black-Scholes option pricing model with the following assumptions: risk free interest rate of 3.5%, dividend yield of 0%, volatility factor of 13%, and a weighted average life of 5 years.
F-13
BERKLEY RESOURCES INC.
NOTES TO FINANCIAL STATEMENTS
NOTE 7 - SHARE CAPITAL (continued)
(c) Management incentive options (continued)
The Black-Scholes valuation model was developed for use in estimating the fair value of traded options which are fully transferable and freely traded. In addition, option valuation models require the input of highly subjective assumptions including estimated stock price volatility. Because the Company’s stock options have characteristics significantly different from those of traded options, and because changes in the subjective input assumptions can materially affect the fair value estimate, in management’s opinion, the existing models do not necessarily provide a reliable single measure of the fair value of its employee stock options.
Pro-forma results of operations may be materially different from actual results realized.
NOTE 8 - CONTRIBUTED SURPLUS
Contributed surplus represents the value ascribed to 150,000 common shares issued for natural resource properties and subsequently surrendered to the company by way of gift, for cancellation. There were no changes in contributed surplus between January 1, 2000 and December 31, 2003
NOTE 9 - INCOME TAXES
The potential benefit of net operating loss carry forwards has not been recognized in the financial statements since the Company cannot be assured that it is more likely than not that such benefit will be utilized in future years. The components of the net deferred tax asset, the statutory tax rate, the effective rate and the elected amount of the valuation allowance are as follows:
December 31, | ||||||||||
2003 | 2002 | 2001 | ||||||||
| Statutory rate | 40 | % | 40 | % | 44 | % | ||||
| $ | $ | $ | ||||||||
| Income taxes recovered at the | ||||||||||
| Canadian statutory rate | 102,000 | 51,000 | 128,700 | |||||||
| Benefit of tax losses not recognized | ||||||||||
| in year | (102,000 | ) | (51,000 | ) | (128,700 | ) | ||||
| Income tax recovery (expense) | ||||||||||
| recognized in year | - | - | - | |||||||
F-14
BERKLEY RESOURCES INC.
NOTES TO FINANCIAL STATEMENTS
NOTE 9 - INCOME TAXES (continued)
The approximate tax effects of each type of temporary difference that gives rise to future tax assets are as follows:
December 31, | ||||||||||
2003 | 2002 | 2001 | ||||||||
| $ | $ | $ | ||||||||
| Operating loss carry forwards, | ||||||||||
| expiring 2004 - 2010 | 66,000 | 1,000 | - | |||||||
| Undeducted resource properties | ||||||||||
| acquisition and exploration expenditures | 500,000 | 244,000 | 233,000 | |||||||
| Deferred tax assets | 566,000 | 245,000 | 233,000 | |||||||
| Less: valuation allowance | (566,000 | ) | (245,000 | ) | (233,000 | ) | ||||
| Net deferred tax assets | - | - | - | |||||||
NOTE 10 - RELATED PARTY TRANSACTIONS
| (a) | Accounts receivable at December 31, 2003 include $22,060 due from Directors and their private companies (2002: $10,000). |
| (b) | Management and consulting fees totaling $225,927 were paid to Directors and their private companies in 2003 (2002: $117,000). |
| (c) | Administrative services, office supplies and accounting charges totaling $55,592 were paid to a private company owned by public companies having common Directors (2002: $48,291). |
NOTE 11 - COMMITTMENTS
Under the terms of Consulting Agreements with a Director and his spouse, the Company is required to make the following future payments, by fiscal year:
| 2004 | $ | 96,000 | ||
| 2005 | 96,000 | |||
| 2006 | 96,000 | |||
| $ | 288,000 | |||
F-15
BERKLEY RESOURCES INC.
NOTES TO FINANCIAL STATEMENTS
NOTE 12 - SEGMENT DISCLOSURE
The Company operates in two segments - oil and gas and real estate rental. Operating results by segment are reported in the statement of operations. Total assets and capital expenditures by operating segment are as follows.
2003 | 2002 | ||||||
Assets by operating segment | $ | $ | |||||
| Oil and gas | 1,251,126 | 654,931 | |||||
| Real estate | 2,076,203 | 2,089,386 | |||||
Assets not allocated | |||||||
| Head office | 288,362 | 1,084,918 | |||||
| 3,615,691 | 3,829,235 | ||||||
2003 | 2002 | ||||||
Capital expenditures by segment | $ | $ | |||||
| Oil and gas | 582,707 | 25,458 | |||||
| Head office | 17,800 | ||||||
582,707 | 43,258 | ||||||
All of the Company’s operations are in Canada. Two customers accounted for 34% and 12% of enterprise revenue respectively in 2003 (2002: 53% and 25%)
Rental revenue of $6,000 (2002: $6,000) has been eliminated on consolidation representing the rental of office premises by the corporate head office.
NOTE 13 - COMPARATIVE FIGURES
Certain of the comparative figures for 2002 and 2001 have been reclassified, where applicable, to conform to the presentation adopted for the current year.
F-16
BERKLEY RESOURCES INC.
NOTES TO FINANCIAL STATEMENTS
NOTE 14 - DIFFERENCES BETWEEN CANADIAN AND UNITED STATES GENERALLY ACCEPTED
ACCOUNTING PRINCIPLES
The financial statements of Berkley have been prepared in accordance with Canadian generally accepted accounting principles (“Canadian GAAP”) which differs in certain material respects from accounting principles generally accepted in the United States of America (“US GAAP”). The material differences between Canadian and US GAAP and their effect on Berkley’s financial statements are summarized below:
Statement of operations | ||||||||||
2003 | 2002 | 2001 | ||||||||
| $ | $ | $ | ||||||||
| Loss for the year under Canadian GAAP | (255,456 | ) | (127,647 | ) | (292,576 | ) | ||||
(Additional) reduction in depletion of oil and gas properties under US GAAP (a) | - | (14,200 | ) | 52,000 | ||||||
Increase in compensation expense arising from stock options (b) | - | (50,000 | ) | - | ||||||
| Loss for the year under US GAAP | (255,456 | ) | (191,847 | ) | (240,576 | ) | ||||
| Loss per share under US GAAP | (0.04 | ) | (0.03 | ) | (0.04 | ) | ||||
Statement of Cash Flows | ||||||||||
2003 | 2002 | 2001 | ||||||||
| $ | $ | $ | ||||||||
| Decrease in cash during the year- Canadian GAAP | (751,735 | ) | (83,063 | ) | (140,196 | ) | ||||
| Decrease (increase) in marketable securities (c) | 950,730 | (240,022 | ) | 567,270 | ||||||
Increase (decrease) in cash during the year under US GAAP | 198,895 | (323,085 | ) | 427,074 | ||||||
Balance Sheets | |||||||||||||
2003 | 2002 | ||||||||||||
Canadian GAAP | US GAAP | Canadian GAAP | US GAAP | ||||||||||
| $ | $ | $ | $ | ||||||||||
| Oil and gas properties (a) | 1,109,391 | 1,207,191 | 529,651 | 627,451 | |||||||||
| Shareholder’s equity (a) | 2,767,967 | 2,865,767 | 3,015,933 | 3,113,733 | |||||||||
F-17
BERKLEY RESOURCES INC. NOTES TO FINANCIAL STATEMENTS |
NOTE 14 - DIFFERENCES BETWEEN CANADIAN AND UNITED STATES GENERALLY ACCEPTED
ACCOUNTING PRINCIPLES (continued)
| (a) | Under US GAAP the ceiling test for impairment used in connection with the full cost method of accounting for oil and gas operations requires the discounting of future net operating revenues by 10%, but without taking into account provisions for future administrative costs. Under Canadian GAAP, the ceiling test is based on undiscounted future net operating revenues, but does require taking into account future administrative costs. The cumulative difference between Canadian and US GAAP since inception of oil and gas operations to December 31, 2003 is that additional depletion of $97,800 has been recorded under Canadian GAAP. There was no provision for impairment required in 2003 on the basis of the ceiling test applied by either of the Canadian or US methods. In 2002, additional depletion of $14,200 was required under US GAAP. In 2001, additional depletion under US GAAP was $52,000 less than under Canadian GAAP. |
| (b) | Stock compensation expense of $50,000 in 2001 under US GAAP relates to benefit measured by the intrinsic value method in accordance with APB 25. |
Under CICA Handbook Section 3870 (Canadian GAAP), the Company accounts for stock option compensation similar to United States APB 25 and SFAS 123. Where the fair value of options granted does not exceed the exercise price, and where the stock options are granted to employees, the disclosure only provisions permitted by SFAS 123 are followed. For options when there is an intrinsic value, or the grantees are non-employees, the Company records compensation expense to operations.
| (c) | Under US GAAP, banker’s acceptances and treasury bills held at December 31, 2002 and 2001 would have been classified as marketable securities rather than cash. |
| (d) | Pro-forma disclosure of asset retirement obligations |
SFAS 143 “Accounting for Asset Retirement Obligations” requires the recognition of the estimated fair value of asset retirement obligations as a liability commencing for all fiscal years beginning after June 15, 2002. The Company has adopted CICA Handbook Section 3110, which is in all material respects the same as FASB 143, effective January 1, 2003. Accordingly, there were no differences between Canadian GAAP and US GAAP in respect of the accounting for asset retirement obligations.
Pro-forma disclosure of the effect of SFAS 143 for years for which a balance sheet is presented (2002) prior to adoption is as follows.
2002 | |||||||
As reported | Pro-forma adoption of SFAS 143 | ||||||
| $ | $ | ||||||
| Oil and gas property costs | 3,379,078 | 3,458,365 | |||||
| Accumulated amortization, oil and gas property costs | (2,849,427 | ) | (2,904,627 | ) | |||
| 529,651 | 553,738 | ||||||
| Site restoration liabilities | 55,200 | 79,287 | |||||
| Loss for the year | 127,647 | 132,349 | |||||
| Loss per share | (0.04 | ) | (0.02 | ) | |||
F-18
BERKLEY RESOURCES INC.
SCHEDULE OF ADDITIONS TO
OIL AND GAS PROPERTIES AND EQUIPMENT,
RENTAL PROPERTIES AND OTHER CAPITAL ASSETS, AT COST
| Balance, Beginning of the Year | Amortization and Depletion Expense for the Year | Provision for Site restoration | Retirements | Balance, End of the Year | ||||||||||||
| $ | $ | $ | $ | $ | ||||||||||||
Year ended December 31, 2003 | ||||||||||||||||
| Oil and gas properties and | ||||||||||||||||
| equipment | 3,379,078 | 582,707 | 131,733 | - | 4,093,518 | |||||||||||
| Rental property | 2,186,646 | - | - | - | 2,186,646 | |||||||||||
| Other capital assets | 75,261 | - | - | (17,800 | ) | 57,461 | ||||||||||
5,640,985 | 582,707 | 131,733 | (17,800 | ) | 6,337,625 | |||||||||||
Year ended December 31, 2002 | ||||||||||||||||
| Oil and gas properties and | ||||||||||||||||
| equipment | 3,353,620 | 25,458 | - | - | 3,379,078 | |||||||||||
| Rental property | 2,186,646 | - | - | - | 2,186,646 | |||||||||||
| Other capital assets | 57,461 | 17,800 | - | - | 75,261 | |||||||||||
5,597,727 | 43,258 | - | - | 5,640,985 | ||||||||||||
Year ended December 31, 2001 | ||||||||||||||||
| Oil and gas properties and | ||||||||||||||||
| equipment | 3,343,154 | 10,466 | - | - | 3,353,620 | |||||||||||
| Rental property | 1,537,328 | 649,318 | - | - | 2,186,646 | |||||||||||
| Other capital assets | 57,461 | - | - | - | 57,461 | |||||||||||
4,937,943 | 659,784 | - | - | 5,597,727 | ||||||||||||
F-19
EXHIBIT INDEX
Exhibit Number | Name |
1. Memorandum of Berkley Resources Inc.*
2. Articles of Berkley Resources Inc.*
12.1 Certification of the Principal Executive Officer under the Sarbanes-Oxley Act
12.2 Certification of the Principal Financial Officer under the Sarbanes-Oxley Act
13 Certificate under section 906
_______________________________
* Previously filed.