BERKLEY RESOURCES INC.
STATEMENT OF RESERVES DATA AND
OTHER OIL AND GAS INFORMATION
FORM 51-101 F1
EFFECTIVE DECEMBER 31, 2005
PREPARED APRIL 25, 2006
April 27, 2006
1
TABLE OF CONTENTS
| TABLE OF CONTENTS | 2 |
| GLOSSARY OF SELECTED TERMS | 3 |
| MONETARY REFERENCES | 3 |
| FORWARD LOOKING STATEMENTS | 4 |
| STATEMENT OF RESERVE DATA AND OTHER OIL AND GAS INFORMATION | 4 |
| Oil and Gas Reserves and Net Present Values - Constant Case | 5 |
| Oil and Gas Reserves and Net Present Values - Forecast Case | 7 |
| PRICING ASSUMPTIONS | 10 |
| RECONCILIATIONS OF CHANGE IN RESERVES AND FUTURE NET REVENUE | 10 |
| SIGNIFICANT FACTORS AND UNCERTAINTIES | 10 |
| OTHER OIL AND GAS INFORMATION | 10 |
| Crude Oil and Natural Gas Wells | 11 |
| Oil and Gas Activity | 11 |
| Exploration and Development Drilling Activity | 11 |
| Forward Contracts and Financial Instruments | 12 |
| Abandonment and Reclamation Costs | 12 |
| Acquisition, Exploration and Development Costs Incurred | 12 |
| Production History | 12 |
| APPENDIX | |
Appendix Attachment: NI 51-101 Tables prepared by AJM Petroleum Consultants | 14 |
2
GLOSSARY OF SELECTED TERMS
The following are selected abbreviations and definitions of terms used herein:
“bbl” means billion barrels of total petroleum liquids;
“boe” means barrels of oil equivalent natural gas converted at 6 mscf of natural gas per barrel of oil;
“boe/day” means barrels of oil equivalent per day;
“bopd” means barrels of oil per day;
“Effective Date” means the effective date of the information contained in this Statement of Reserves Data and Other Oil and Gas Information, being December 31, 2005;
“mbbl” means thousands of barrels of oil;
“mboe” means thousands of barrels of oil equivalent;
“mbtu” means thousands of British Thermal Units;
“mcf” means thousands of cubic feet;
“mscf” means thousands of standard cubic feet;
“mscf/day” means thousands of standard cubic feet per day;
“mstb” means thousands of stock tank barrels;
“NGL’s” means natural gas liquids including condensate;
“NI 51-101” means National Instrument 51-101 - Standards of Disclosure for Oil and Gas Activities of the Canadian Securities Administrators;
“Preparation Date” means the date of preparation of this Statement of Reserves Data and Other Oil and Gas Information, being April 25, 2006;
“stb” means stock tank barrel; and
“Berkley” or the “Company” means Berkley Resources Inc., a British Columbia corporation.
References to oil, gas, natural gas liquids, reserves (gross, net, proved, probable, possible, developed, developed producing, developed non-producing, undeveloped), constant prices and costs, forecast prices and costs, operating costs, development costs, future net revenue and future income tax expenses, shall unless expressly stated to be to the contrary, have the meaning attributed to such terms as set out in NI 51-101, Companion Policy 51-101CP and all forms referenced therein.
MONETARY REFERENCES
All monetary references contained in this Statement of Reserves Data and Other Oil and Gas Information are in Canadian dollars unless otherwise specified.
3
FORWARD LOOKING STATEMENTS
This Statement of Reserves Data and Other Oil and Gas Information contains forward-looking statements. These statements relate to future events or Berkley’s future performance. All statements other than statements of historical fact are forward-looking statements. In some cases, forward-looking statements can be identified by terminology such as “may”, “will”, “should”, “expect”, “plan”, “anticipate”, “believe”, “estimate”, “predict”, “potential”, “continue”, or the negative of these terms or other comparable terminology. These statements are only predictions. Actual events or results may differ materially. Undue reliance should not be placed on these forward looking statements, as there can be no assurance that the plans, intentions or expectations upon which they are based will occur. By its nature, forward-looking information involves numerous assumptions, known and unknown risks and uncertainties, both general and specific, that contribute to the possibility that the predictions, forecasts, projections and other forward-looking statements will not occur.
Although Berkley believes that the expectations reflected in the forward-looking statements are reasonable, there can be no assurance that such expectations will prove to be correct. Berkley cannot guarantee future results, levels of activity, performance, or achievements. Moreover, Berkley does not assume responsibility for the accuracy and completeness of the forward-looking statements.
Statements relating to “reserves” or “resources” are deemed to be forward-looking statements, as they involve the implied assessment, based on certain estimates and assumptions that the resources and reserves described can be profitably produced in the future. All forward-looking statements contained in this Statement of Reserves Data and Other Oil and Gas Information are expressly qualified by this cautionary statement. Berkley is not under any duty to update any of the forward-looking statements after the date hereof to conform such statements to actual results or to changes in Berkley’s expectations.
STATEMENT OF RESERVES DATA AND OTHER OIL AND GAS INFORMATION
In accordance with the requirements of NI 51-101, the following Statement of Reserves Data and Other Oil and Gas Information for Berkley is dated with an Effective Date of December 31, 2005 and a Preparation Date of April 25, 2006.
AJM Petroleum Consultants (“Evaluator”) prepared the reserve report, dated as of April 25, 2006, with an effective date of December 31, 2005 (the “Report”) which evaluates the proved and probable crude oil, natural gas and NGL reserves attributable to Berkley’s interests in its properties and net present value of estimated future cash flow from such reserves, based on both forecasted and constant price and cost assumptions. This Report accounts for approximately 100% of the Company’s reserves. The reserves information contained in the Report was prepared and is presented in accordance with the requirements of NI 51-101.
In preparing the Report, the Evaluator obtained basic information from Berkley, which included land data, well information, geological information, reservoir studies, estimates of on-stream dates, contract information, current hydrocarbon product prices, operating costs data, capital budget forecasts, financial data and future operating plans. Other engineering, geological or economic data required to conduct the evaluation and upon which this Report is based, was obtained from public records, other operators and from the Evaluator’s non-confidential files. The extent and character of ownership and the accuracy of all factual data supplied for the independent evaluation, from all sources, was accepted by the Evaluator as represented by Berkley.
The following tables, based on the Report, show the estimated share of Berkley’s crude oil, natural gas and NGL reserves in its properties and the net present value of estimated future net revenue for these reserves, using constant and forecast prices and costs as indicated. All evaluations of the present value of estimated future net revenue in these reports are stated after provision for estimated future capital expenditures, well abandonment and reclamation costs (including the offsetting salvage value of tangible equipment after abandonment) but prior to income taxes and indirect costs and do not necessarily represent the fair market value of the reserves. The recovery and reserve estimates of Berkley’s oil, NGL and natural gas reserves provided herein are estimates only and there is no guarantee that the estimated reserves will be recovered. Actual reserves may be greater than or less than the estimates provided herein.
4
References to oil, gas, natural gas liquids, reserves (gross, net, proved, probable, possible, developed, developed producing, developed non-producing, undeveloped), constant prices and costs, forecast prices and costs, operating, costs, development costs, future net revenue and future income tax expenses shall, unless expressly stated to be to the contrary, have the meaning attributed to such terms as set out in National Instrument 51-101, Companion Policy 51-101CP and all forms referenced therein.
BERKLEY RESOURCES INC.
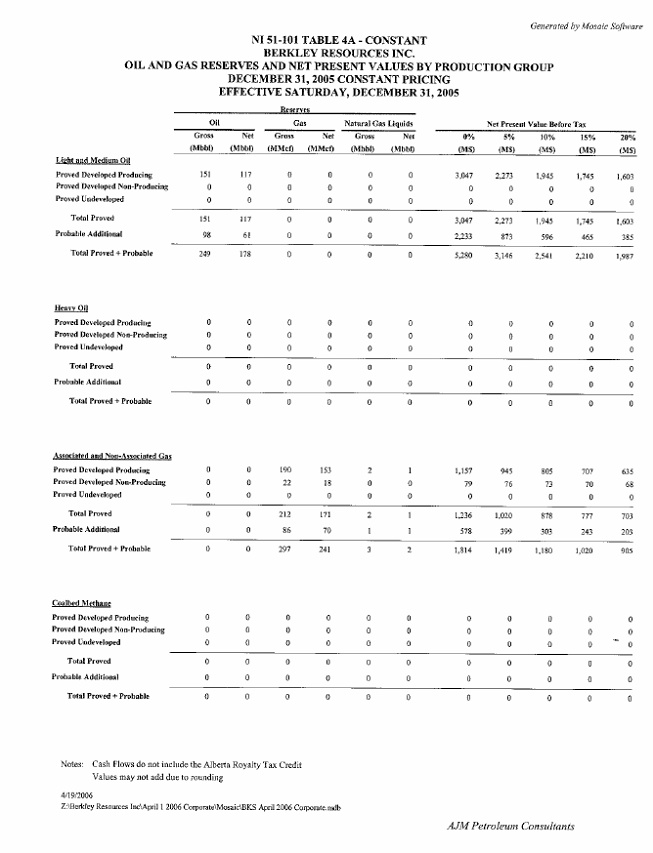
SUMMARY OF OIL AND GAS RESERVES AND NET PRESENT VALUE OF FUTURE NET REVENUE ITEM 2.1
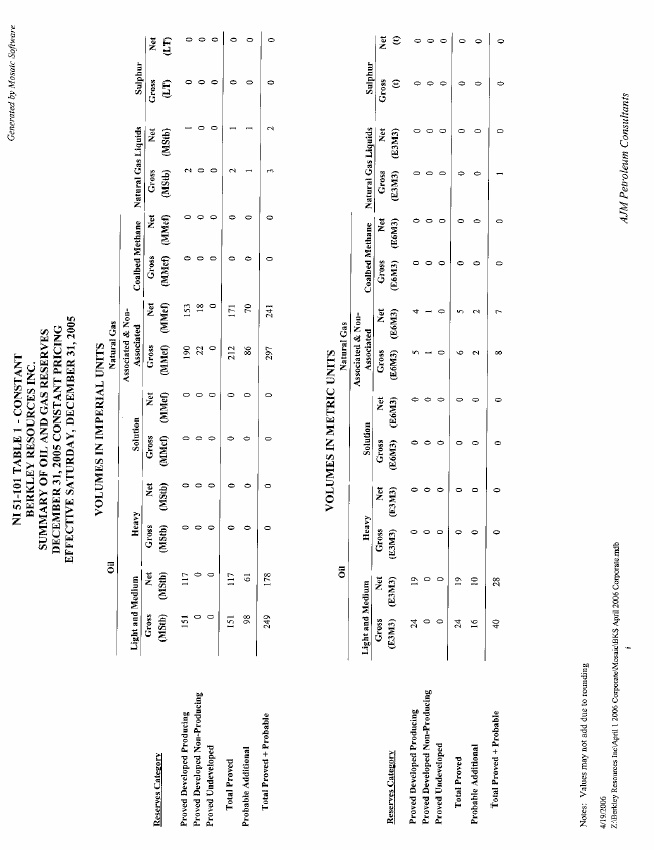
Constant Prices and Costs
Proved Reserves and Net Present Value
As at December 31, 2005
Total Company
Constant Case
Oil | NGL’s | Natural Gas | Before Tax Discounted At | After Tax Discounted At | ||||||
Gross (1) (MBbl) | Net(2) (MBbl) | Gross (1) (MBbl) | Net(2) (MBbl) | Gross(1) (MMcf) | Net(2) (MMcf) | 0% (M$) | 10% (M$) | 0% (M$) | 10% (M$) | |
Proved | ||||||||||
| Developed Producing | 151 | 117 | 2 | 1 | 190 | 153 | 4,424 | 2,938 | 3,704 | 2,587 |
| Developed Non-Producing | 0 | 0 | 0 | 0 | 22 | 18 | 85 | 79 | 55 | 49 |
| Undeveloped | 0 | 0 | 0 | 0 | 0 | 0 | 0 | 0 | 0 | 0 |
| Total Proved | 151 | 117 | 2 | 1 | 212 | 171 | 4,509 | 3,017 | 3,759 | 2,636 |
Notes:
| (1) | Gross Reserves means Berkley’s working interest (operating and non-operating) share before deduction of royalties and income taxes. |
| (2) | Net Reserves means Berkley’s working interest (operating and non-operating) share after deduction of royalties but before deduction of income taxes. |
5
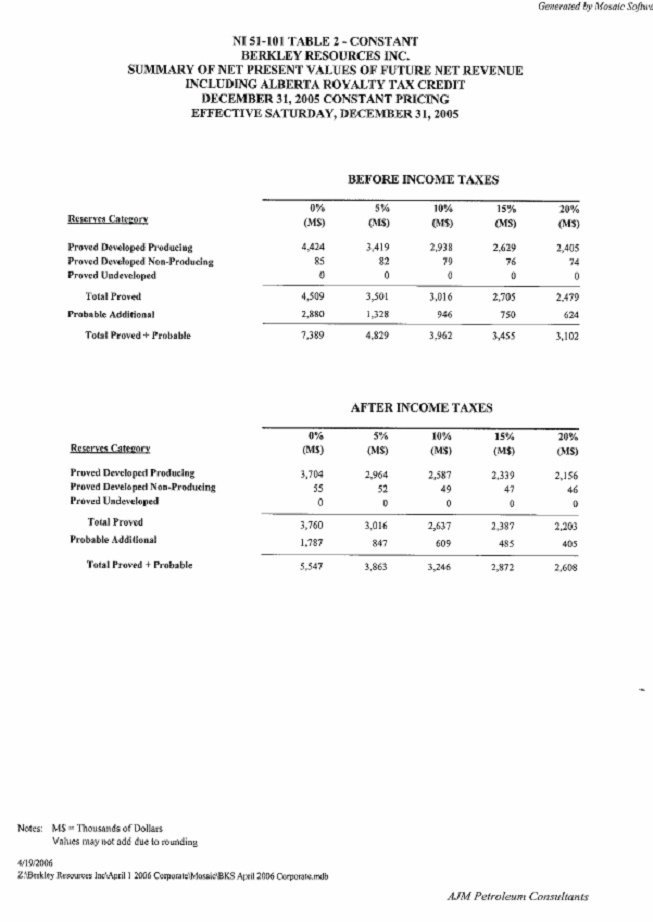
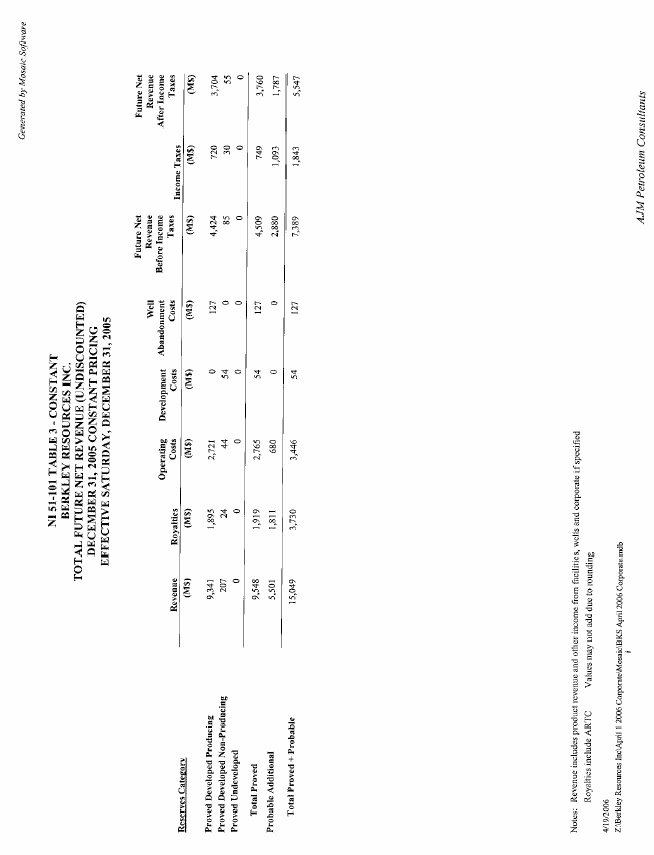
Additional Information - Future Net Revenue
As at December 31, 2005
Total Company
Constant Case
Future Gross Revenue (M$) | Royalties Net of ARTC (M$) | Operating Costs (M$) | Development Costs (M$) | Abandonment Costs (M$) | Future Net Revenue Before Income Tax (M$) | Future Income Tax (M$) | Future Net Revenue After Income Tax (M$) | |
Total Proved | 9,548 | (1,919) | (2,939) | (54) | (127) | 4,509 | (749) | (3,760) |
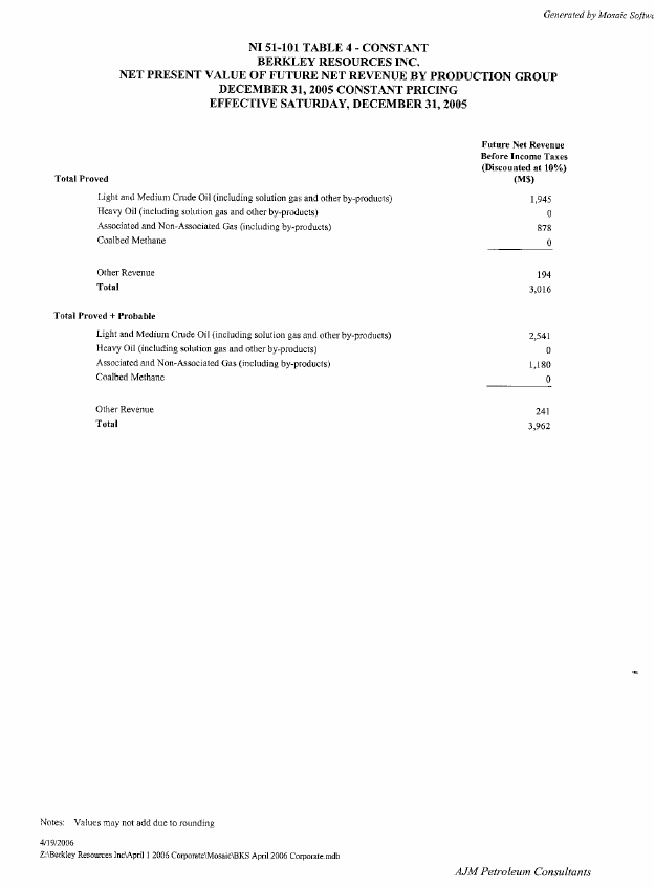
Additional Information - Future Net Revenue By Production Group
(Before Future Income Tax)
As at December 31, 2005
Total Company
Constant Case
| Discounted | ||
Reserves Category | Production Group | at 10% (M$) |
Total Proved | Oil (MBbl) | 1,945 |
| Total Proved | Natural Gas (MMcf) | 878 |
| Total Proved | Other | 194 |
| 3,017 |
Proved Reserves and Net Present Value (By Area)
As at December 31, 2005
Constant Case
Oil | NGL’s | Natural Gas | Before Tax Discounted At | ||||
| Gross (MBbl) | Net (MBbl) | Gross (MBbl) | Net (MBbl) | Gross (MMcf) | Net (MMcf) | 10% (M$) | |
Carbon | 0 | 0 | 1 | 1 | 87 | 79 | 400 |
John Lake | 0 | 0 | 1 | 0 | 80 | 55 | 300 |
Leduc | 0 | 0 | 0 | 0 | 23 | 19 | 146 |
Senex | 39 | 28 | 0 | 0 | 22 | 18 | 1,432 |
| 39 | 28 | 2 | 1 | 212 | 171 | 2,278 | |
Alberta Royalty Tax Credit | 194 | ||||||
Total Alberta | 39 | 28 | 2 | 1 | 212 | 171 | 2,472 |
East Dollard, Saskatchewan | 112 | 89 | 0 | 0 | 0 | 0 | 615 |
Abandonments - Gas | (41) | ||||||
Abandonments - Oil | (29) | ||||||
Total Canada | 151 | 117 | 2 | 1 | 212 | 171 | 3,017 |
6
BERKLEY RESOURCES INC.
SUMMARY OF OIL AND GAS RESERVES AND NET PRESENT VALUE OF FUTURE NET
REVENUE ITEM 2.2
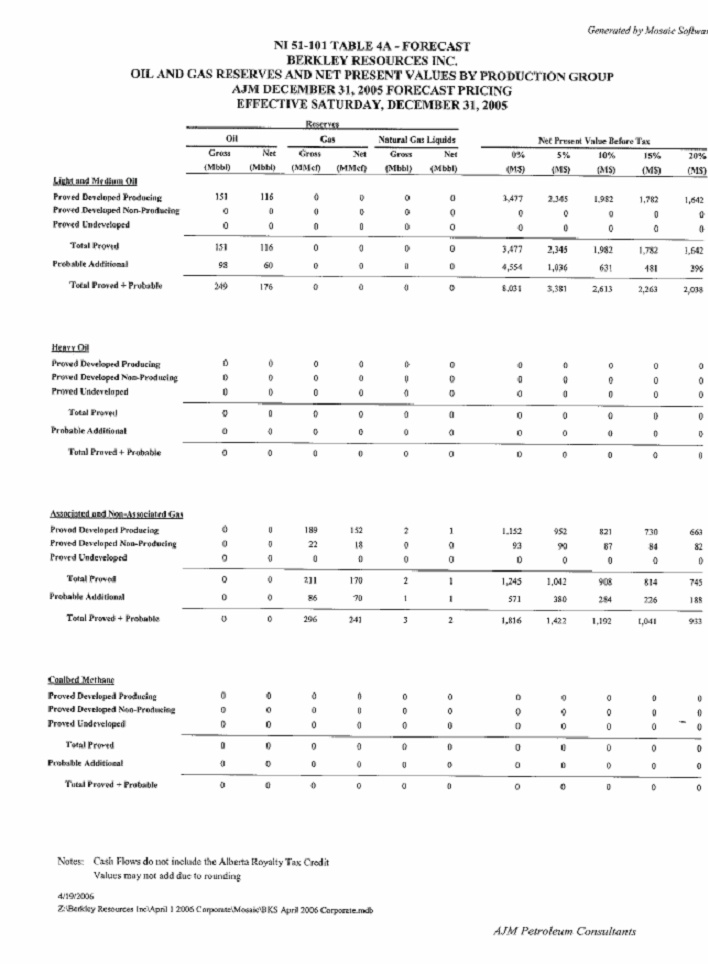
Forecast Prices and Costs
Proved Plus Probable Reserves and Net Present Value
As at December 31, 2005
Total Company
Forecast Case
Oil | NGL’s | Natural Gas | Before Tax Discounted At | After Tax Discounted At | ||||||||||||
Gross (MBbl | Net (MBbl) | Gross (MBbl) | Net (MBbl) | Gross (MMcf) | Net (MMcf) | 0% (M$) | 5% (M$) | 10% (M$) | 15% (M$) | 20% (M$) | 0% (M$) | 5% (M$) | 10% (M$) | 15% (M$) | 20% (M$) | |
| Proved | ||||||||||||||||
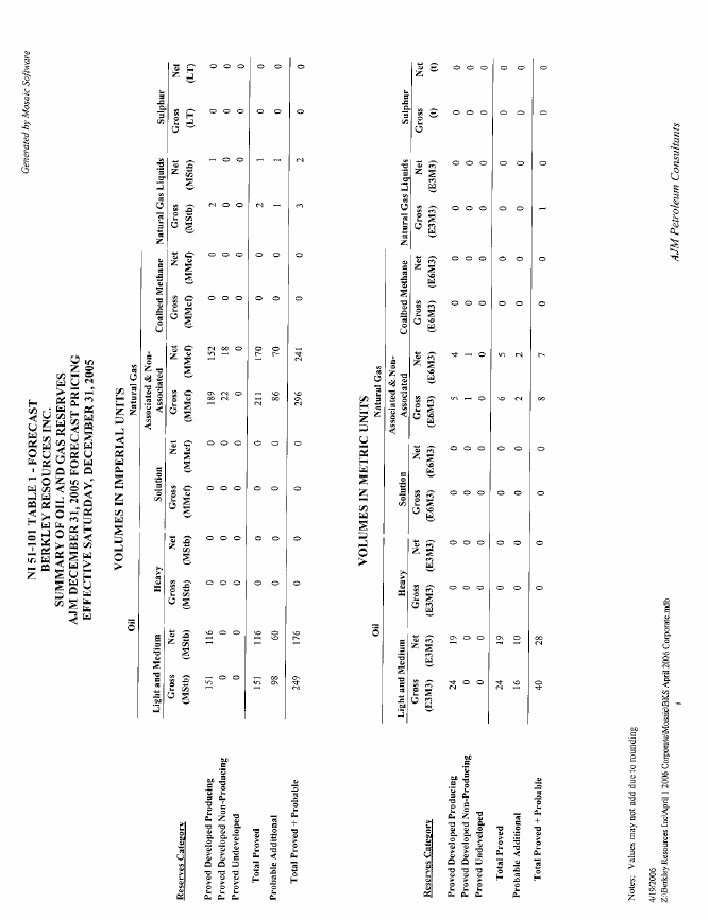
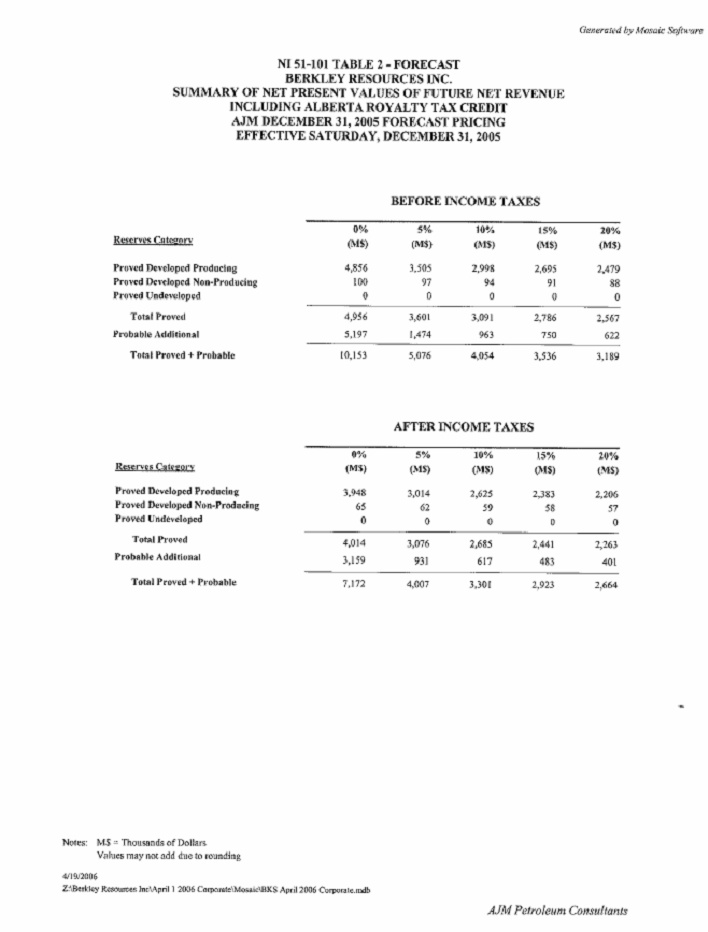
Developed Producing | 151 | 116 | 2 | 1 | 189 | 152 | 4,856 | 3,505 | 2,998 | 2,695 | 2,479 | 3,948 | 3,014 | 2,625 | 2,383 | 2,206 |
Developed Non-Producing | 0 | 0 | 0 | 0 | 22 | 18 | 100 | 97 | 94 | 91 | 88 | 65 | 62 | 59 | 58 | 57 |
| Undeveloped | 0 | 0 | 0 | 0 | 0 | 0 | 0 | 0 | 0 | 0 | 0 | 0 | 0 | 0 | 0 | 0 |
| Total Proved | 151 | 116 | 2 | 1 | 211 | 170 | 4,956 | 3,602 | 3,092 | 2,786 | 2,567 | 4,013 | 3,076 | 2,684 | 2,441 | 2,263 |
| Probable | 98 | 60 | 1 | 1 | 85 | 71 | 5,197 | 1,474 | 962 | 750 | 622 | 3,159 | 931 | 617 | 483 | 401 |
| Total Proved plus Probable | 249 | 176 | 3 | 2 | 296 | 241 | 10,153 | 5,076 | 4,054 | 3,536 | 3,189 | 7,172 | 4,007 | 3,301 | 2,924 | 2,664 |
Notes:
| (1) | Gross Reserves means Berkley’s working interest (operating and non-operating) share before deduction of royalties and income taxes. |
| (2) | Net Reserves means Berkley’s working interest (operating and non-operating) share after deduction of royalties but before deduction of income taxes. |
Additional Information - Future Net Revenue
As at December 31, 2005
Total Company
Forecast Case
Future Gross Revenue (M$) | Royalties Net of ARTC (M$) | Operating Costs (M$) | Development Costs (M$) | Abandonment Costs (M$) | Future Net Revenue Before Income Tax (M$) | Future Income Tax (M$) | Future Net Revenue After Income Tax (M$) | |
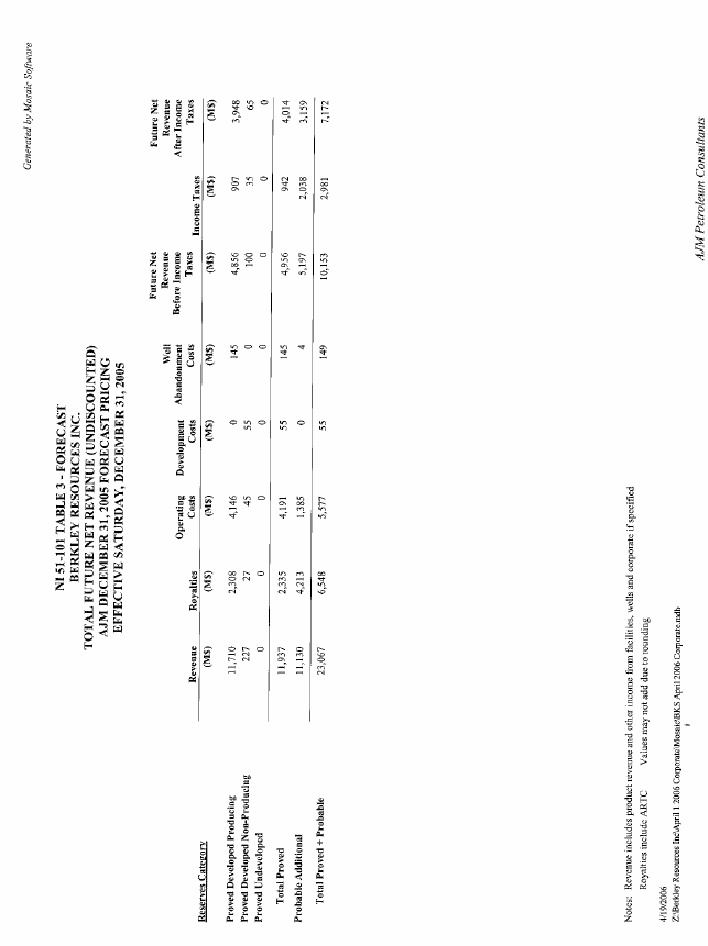
Total Proved | 11,937 | (2,335) | (4,446) | (55) | (145) | 4,956 | (942) | 4,014 |
| Probable | 11,130 | (4,213) | (1,716) | 0 | (4) | 5,197 | (2,038) | 3,159 |
| Total Proved plus Probable | 23,067 | (6,548) | (6,162) | (55) | (149) | 10,153 | (2,980) | 7,173 |
7
Additional Information - Future Net Revenue by Production Group
(Before Future Income Tax)
As at December 31, 2005
Total Company
Forecast Case
Reserves Category | Production Group | Discounted at 10% (M$) |
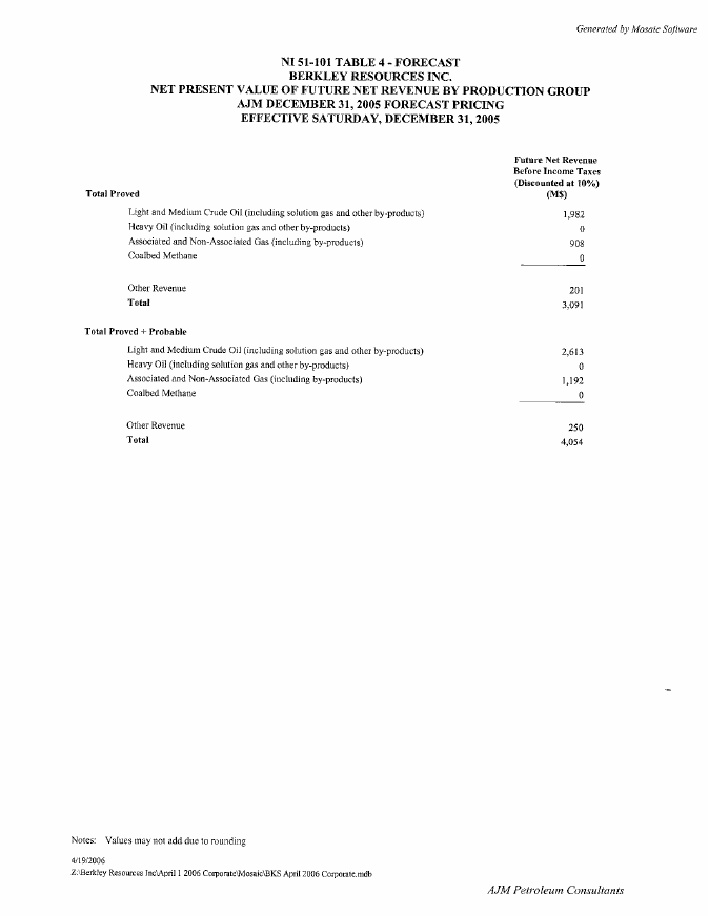
Total Proved | Oil (MBbl) | 1,982 |
| Total Proved | Natural Gas (MMcf) | 908 |
| Total Proved | Other | 201 |
| 3,091 | ||
| Total Proved plus Probable | Oil (MBbl) | 2,612 |
| Total Proved plus Probable | Natural Gas (MMcf) | 1,192 |
| Total Proved plus Probable | Other | 250 |
| 4,054 |
8
Proved Plus Probable Reserves and Net Present Value (By Area)
As at December 31, 2005
Forecast Case
Oil | NGL’s | Natural Gas | Before Tax Discounted At | ||||
Gross (MBbl) | Net (MBbl) | Gross (MBbl) | Net (MBbl) | Gross (MMcf) | Net (MMcf) | 10% (M$) | |
Proved | |||||||
Carbon | 0 | 0 | 1 | 1 | 87 | 79 | 395 |
John Lake | 0 | 0 | 1 | 0 | 79 | 54 | 311 |
Leduc | 0 | 0 | 0 | 0 | 23 | 19 | 161 |
Senex | 39 | 28 | 0 | 0 | 22 | 18 | 1,486 |
| 39 | 28 | 2 | 1 | 211 | 170 | 2,353 | |
Alberta Royalty Tax Credit | 201 | ||||||
Total Alberta | 39 | 28 | 2 | 1 | 211 | 170 | 2,554 |
East Dollard, Saskatchewan | 112 | 88 | 0 | 0 | 0 | 0 | 615 |
Abandonments - Gas | (45) | ||||||
Abandonments - Oil | (32) | ||||||
Total Canada | 151 | 116 | 2 | 1 | 211 | 170 | 3,092 |
Probable | |||||||
Carbon | 0 | 0 | 0 | 0 | 31 | 27 | 68 |
John Lake | 0 | 0 | 0 | 0 | 25 | 18 | 76 |
Leduc | 0 | 0 | 1 | 1 | 27 | 23 | 126 |
Senex | 16 | 12 | 0 | 0 | 2 | 3 | 442 |
| 16 | 12 | 1 | 1 | 85 | 71 | 712 | |
Alberta Royalty Tax Credit | 49 | ||||||
Total Alberta | 16 | 12 | 1 | 1 | 85 | 71 | 761 |
East Dollard, Saskatchewan | 82 | 48 | 0 | 0 | 0 | 0 | 198 |
Abandonments - Gas | 0 | ||||||
Abandonments - Oil | 3 | ||||||
Total Canada | 98 | 60 | 1 | 1 | 85 | 71 | 962 |
Proved Plus Probable | |||||||
Carbon | 0 | 0 | 1 | 1 | 118 | 106 | 463 |
John Lake | 0 | 0 | 1 | 0 | 104 | 72 | 387 |
Leduc | 0 | 0 | 1 | 1 | 50 | 42 | 287 |
Senex | 55 | 40 | 0 | 0 | 24 | 21 | 1,928 |
| 55 | 40 | 3 | 2 | 296 | 241 | 3,065 | |
Alberta Royalty Tax Credit | 250 | ||||||
Total Alberta | 55 | 40 | 3 | 2 | 296 | 241 | 3,315 |
East Dollard, Saskatchewan | 194 | 136 | 0 | 0 | 0 | 0 | 813 |
Abandonments - Gas | (45) | ||||||
Abandonments - Oil | (29) | ||||||
Total Canada | 249 | 176 | 3 | 2 | 296 | 241 | 4,054 |
9
PRICING ASSUMPTIONS
Constant Prices and Costs - December 31, 2005
AJM Petroleum Consultants used the following price and exchange rate and inflation rate assumptions as of December 31, 2005 in estimating Berkley’s reserves data using constant prices and costs.
Crude Oil and Natural Gas Liquids Prices
Oil | Natural Gas | NGL’s | Inflation Rate | Exchange Rate | ||
West Texas Intermediate ($US) | Edmonton Light Sweet Crude (Cdn$/stb) | Alberta Par Price ($/mcf) | Alberta Spot Sales ($/mcf) | ($/bbl)) | % Per Annum | $US/$Cdn |
61.04 | 68.12 | 9.78 | 9.43 | - | 0 | 0.8577 |
Forecast Prices and Costs
December 31, 2005
AJM Petroleum Consultants used the following price and exchange rate and inflation rate assumptions as of December 31, 2005 in estimating Berkley’s reserves data using forecast prices and costs.
Crude Oil and Natural Gas Liquids Prices
Oil | Natural Gas | NGL’s | Inflation Rate | Exchange Rate | |||
| Year | West Texas Intermediate ($US) | Edmonton Light Sweet Crude (Cdn$/stb) | Alberta Par Price ($/mcf) | Alberta Spot Sales ($/mcf) | ($/bbl)) | % Per Annum | $US/$Cdn |
2006 | 60.00 | 69.60 | 11.25 | 11.30 | 73.10 | 0.0 | 0.85 |
| 2007 | 60.00 | 69.60 | 10.05 | 10.30 | 74.55 | 2.0 | 0.85 |
| 2008 | 60.00 | 69.70 | 8.30 | 8.30 | 76.15 | 2.0 | 0.85 |
| 2009 | 58.00 | 67.40 | 7.80 | 8.50 | 75.10 | 2.0 | 0.85 |
| 2010 | 55.00 | 63.85 | 7.80 | 8.50 | 72.55 | 2.0 | 0.85 |
RECONCILATIONS OF CHANGES IN RESERVES AND FUTURE NET REVENUE
Reserves Reconciliation
The following table sets forth a reconciliation of Berkley’s total net proved, probable and proved plus probable reserves as at December 31, 2005 against such reserves as at December 31, 2004 based on forecast price and cost assumptions:
LIGHT AND MEDIUM OIL | ASSOCIATED AND NON-ASSOCIATED GAS | NATURAL GAS LIQUIDS | |||||||
Factors | Net Proved (mbbl) | Net Probable (mbbl) | Net Proved Plus Probable (mbbl) | Net Proved (mmcf) | Net Probable (mmcf) | Net Proved Plus Probable (mmcf) | Net Proved (mbbl) | Net Probable (mbbl) | Net Proved Plus Probable (mbbl) |
December 31, 2004 | 28 | 56 | 84 | 772 | 111 | 883 | 25 | 3 | 28 |
| Extensions | - | - | - | - | - | - | - | - | - |
| Improved Recovery | - | - | - | - | - | - | - | - | - |
| Technical Revisions | 95 | 4 | 99 | (529) | (40) | (569) | (24) | (2) | (26) |
| Discoveries | - | - | - | - | - | - | - | - | - |
| Acquisitions | - | - | - | - | - | - | - | - | - |
| Dispositions | - | - | - | - | - | - | - | - | - |
| Economic Factors | - | - | - | - | - | - | - | - | - |
| Production | (7) | - | (7) | (73) | - | (73) | - | - | - |
December 31, 2005 | 116 | 60 | 176 | 170 | 71 | 241 | 1 | 1 | 2 |
Future Net Revenue Reconciliation
The following table sets forth a reconciliation of the estimate of the future net revenue discounted at 10%, attributable to net proved reserves as evaluated in Reports using constant prices and cost assumptions:
Period and Factor | Before Tax 2005(M$) | After Tax 2005 (M$) |
December 31, 2004 | 5,278 | 5,278 |
Sales and Transfers of Oil and Gas Produced during the Period Net of Production Costs and Royalties(1) | (801) | (801) |
Net Change in Sales and Transfer Prices and in Production Costs and Royalties related to Future Production(2) | 529 | 529 |
Changes in Previously Estimated Future Development Costs Incurred During the Period(3) | - | - |
Changes in Estimated Future Development Costs (4) | 353 | 353 |
Net Change Resulting from Extensions and Improved Recovery(5) | 346 | 346 |
Net Change Resulting from Discoveries(5) | - | - |
Changes Resulting from Acquisitions of Reserves(5) | - | - |
Changes Resulting from Dispositions of Reserves(5) | (3,215) | (3,215) |
| Net Change Resulting from Revisions in Quantity Estimates | 527 | 527 |
Accretion of Discount(6) | (381) | |
Net Change of Income Taxes(7) | - | - |
Other Significant Factors(8) | - | - |
| December 31, 2005 | 3,017 | 2,636 |
Notes:
| (1) | Company actual before income taxes, excluding G&A. |
| (2) | The impact of changes in prices and other economic factors on future net revenue |
| (3) | Actual capital expenditures relating to the exploration, development and production of oil and gas reserves. |
| (4) | The change in forecast development costs. |
| (5) | End of period net present value of the related reserves. |
| (6) | Estimated as 10% of the beginning of period net present value. |
| (7) | The difference between forecast income taxes at beginning of period and the actual taxes for the period plus forecast income taxes at the end of period. |
| (8) | Includes changes due to revised production profiles, development timing, operating costs, royalty rates, actual price received in 2005 versus forecast, etc. |
ADDITIONAL INFORMATION RELATING TO BERKLEY’S RESERVE DATA
Significant Factors and Uncertainties
The process of estimating oil and gas reserves is complex. It requires significant judgments and decisions based on available geological, geophysical, engineering and economic data. These estimates may change substantially as additional data from ongoing development activities and production performance becomes available and as economic conditions impacting oil and gas processing and costs change. The reserve estimates contained herein are based on current production forecasts, prices and economic conditions and are evaluated by an independent engineering firm.
As circumstances change and additional data become available, reserve estimates also change. Estimates made are reviewed and revised, either upward or downward, as warranted by the new information. Revisions are often required due to changes in well performance, prices, economic conditions and governmental restrictions.
Although every reasonable effort is made to ensure that reserve estimates are accurate, reserve estimation is an inferential science. As a result, the subjective decisions, new geological or production information and a changing environment may impact these estimates. Revisions to reserve estimates can arise from changes in year-end oil and gas prices and reservoir performance. Such revisions can be either positive or negative. The reserve estimates of the Company’s oil, NGL and natural gas reserves provided in the Statements of Reserves Data and Other Oil and Gas Information are estimates only and there is no assurance or guarantee that the estimated reserves will be recovered. Actual reserves may be greater or less than the estimates provided herein.
OTHER OIL AND GAS INFORMATION
Crude Oil and Natural Gas Wells
The following table summarizes the Company’s interest, as at December 31, 2005, in producing and non-producing crude oil and natural gas wells:
Oil | Gas | |||||||
Location | Producing | Non-Producing | Producing | Non-Producing | ||||
Gross(1) | Net(2) | Gross(1) | Net(2) | Gross(1) | Net(\2) | Gross(1) | Net(2) | |
Alberta | 4.0 | 1.5 | 1.0 | 0.1 | 15.0 | 1.0 | 11.0 | 1.1 |
| Saskatchewan | 10.0 | 0.8 | - | - | - | - | - | - |
COMPANY TOTAL | 14.0 | 2.3 | 1.0 | 1.0 | 15.0 | 1.0 | 11.0 | 1.1 |
Notes:
| (1) | “Gross Wells” are all wells in which the Company has an interest. |
| (2) | “Net Wells” are the aggregate percentage of Berkley’s interest in Gross Wells. |
10
Oil and Gas Activity
The Company has continued to pursue quality projects with experienced partners in high opportunity areas. This approach has provided an overall good result, however individual projects will range from very good (Senex Area) to disappointing (Sturgeon Lake) to challenging (Brazeau Area). New prospect development is highly competitive as established operators are cash rich as a result of record high oil and gas prices while at the same time unwilling to do farmout or joint venture deals, preferring to keep for themselves any reasonably drill-worthy prospect. Accordingly, the Company will put its primary efforts into fully developing its existing projects and enhancing its representation in new projects now underway such as Crossfield, Alberta.
The Company presently holds working interests in approximately 40 oil and gas wells in Alberta and Saskatchewan with its working interests ranging from 1% to 35%. Efforts continue to purge the Company’s asset base of minor interest properties which will enable the Company to focus on higher interest opportunities. Generally the Company does not operate joint interest ventures; however Crossfield, Alberta is an exception where the Company holds the largest interest at 35%. Presently almost all of the Company’s production comes from six discrete areas. Three are natural gas and three produce oil, four areas have been producing for several years while two projects (one oil and one gas) are new developments.
The Company experienced mixed results in its drilling program during 2005. Its 15% participation in the Sturgeon Lake project combined with its 12.50% farmout portion was the correct balance for this high-risk high-opportunity prospect. Unfortunately the test well was not successful and this project has been abandoned. The Brazeau project lived-up to its initial promise for 100 days by producing an average of four million cubic feet of gas per day (4.00 mmcf/d) before the otherwise often beneficial fracture system in the Nisku formation opened itself up to the underlying water which then overpowered the gas production from a depth of 11,500’. The Company considers it unlikely that any curative work can be done economically and therefore it has taken a full write-down of the gas reserves allocated at year-end 2004 which it now considers to be ‘stranded’. These projects were offset by the success and opportunity at Senex and Crossfield respectively as follows:
a. Senex Area, Alberta (Townships. 92/93, Ranges 6/7 W5M);
The Company (20% ±) and its operating partner Onefour Energy Ltd. (80% ±) have increased their land holdings in this Area to 46.25 sections. The lands now contain eight wells completed as producers or potential producers: two are shallow gas completions; three are completed as pumping oilwells; two are cased as potential oilwells and one is a strong flowing oilwell capable of producing up to 500/600 barrels/day but currently being produced at 200/300 barrels/day while production facilities are being constructed. The one non-producing well drilled on the lands will be used to provide water disposal capabilities for the production facility.
None of the producing oilwells has any significant water production at this time, however the flowing oilwell is expected to gradually produce an increasing amount of water. Also the Company and its partner have a three to seven well follow-up program planned based on the success of this well with drilling to commence in August 2006. The 3-D seismic program conducted in January 2005 and extended during the first quarter of 2006, provides strong support for the proposed follow-up drilling program. While operators are restricted for environmental reasons from drilling in this Area until August, the Company and its partner are planning an aggressive 3-D seismic supported drilling program from August 2006 through March 2007 particularly in relation to developing the shallow gas and extension drilling related to the deeper flowing oilwell prospect.
11
b. Crossfield West Area, Alberta (Township 28, Range 1 W5M):
The licencing process to drill this sour-gas prospect is well underway. The Company (35%) and its partners have negotiated extensions to certain of its freehold leases which will maintain our existing drilling lease block of six sections; however major competition has entered the immediate area of our lease block with an undisclosed party paying over three million dollars for near and adjacent leases at the March 22, 2006 Alberta Crown Sale. BP Canada added $532,000 for a one section parcel diagonally offsetting our lands. The highest price paid at the Sale was for a one section lease laterally adjoining our block where a broker paid $770,304 ($3,009/hectare). We do not know the identity of the purchaser nor its willingness to do a joint venture. Regardless, the Company and its partners will continue to move ahead with our own drilling plans.
Summary
The Company has been successful in developing new projects which offer significant upside opportunities. The Senex project offers a long-range exploitation opportunity that could occupy the Company’s attention well into the future. The Crossfield project is a worthy venture in its own right, however when these are added to other existing projects, management believes the Company must be seen as having placed itself in a very opportune position to add shareholder value both in the short and long terms.
Forward Contracts and Financial Instruments
Berkley has no forward contracts or financial instruments.
Abandonment and Reclamation Costs
The Company uses its Evaluator to estimate its abandonment and reclamation costs. The costs are estimated on an area by area basis. The industry’s historical costs are used when available. If representative comparisons are not readily available, an estimate is prepared based on the various regulatory abandonment requirements.
The total of such costs, forecast net of estimated salvage value, is $127,000 (undiscounted) and $71,000 (discounted at 10%) in respect of proved reserves.
Acquisition, Exploration and Development Costs Incurred
The following table sets out the Company’s property acquisition, exploration and development costs for the fiscal year ended December 31, 2005:
Proved | |||||
Property Acquisition (M$) | Exploration (M$) | Development (M$) | Unproved (M$) | Total | |
| Alberta/Saskatchewan | |||||
| and Total: | (73) | 2,521 | 84 | 43 | 2,575 |
Production History
Production Volume by Area
The following table discloses for each important area and in total, the Company’s gross production volumes for the financial year ended December 31, 2005 for each production type:
12
Oil (bbls) | Natural Gas (mcf) | |
| Alberta | ||
| Brazeau | 0 | 43,489 |
| John Lake | 0 | 30,064 |
| Carbon | 0 | 8,897 |
| Leduc | 0 | 12,957 |
| Senex | 2,270 | 0 |
| Minor | 0 | 735 |
| 2,270 | 96,142 | |
| Saskatchewan | ||
| Dollard | 7,114 | 0 |
Company Total | 9,384 | 96,142 |
Total Year 2005 | Avg. Daily Production | Price Received | Royalties Paid | Production Costs | Netback |
| Oil/bbl | 25.7 | $47.04 | $10.96 | $20.42 | $15.66 |
| Gas/mcf | 263.4 | $ 9.52 | $ 1.45 | $ 1.81 | $ 6.26 |
13
APPENDIX ATTACHMENT:
NATIONAL INSTRUMENT 51-101 TABLES
PREPARED BY AJM PETROLEUM CONSULTANTS
14
15
16
17
18
19
20
21
22
23
24
FORM 51-101F2
REPORT ON RESERVES DATA
To the board of directors of Berkley Resources Inc. (the “Company”):
| 1. | We have evaluated the Company’s reserves data on certain properties as at December 31, 2005. The reserves data consist of the following: |
(a) (i) proved and proved plus probable oil and gas reserves estimated as at December 31, 2005 using forecast prices and costs; and
(ii) the related estimated future net revenue; and
(b) (i) proved oil and gas reserves estimated as at December 31, 2005 using constant prices and costs; and
| (ii) | the related estimated future net revenue. |
2. The reserves data are the responsibility of the Company’s management. Our responsibility is to express an opinion on the reserves data based on our evaluation.
We carried out our evaluation in accordance with standards set out in the Canadian Oil and Gas Evaluation Handbook (the “COGE Handbook”) prepared jointly by the Society of Petroleum Evaluation Engineers (Calgary Chapter) and the Canadian Institute of Mining, Metallurgy and Petroleum (Petroleum Society).
| 3. | Those standards require that we plan and perform an evaluation to obtain reasonable assurance as to whether the reserves data are free of material misstated. An evaluation also includes assessing whether the reserves data are in accordance with principles and definitions presented in the COGE Handbook. |
| 4. | The following table sets forth the estimated future net revenue (before deduction of income taxes) attributed to proved plus probable reserves, estimated using forecast prices and costs calculated using a discount rate of 10 percent, included in the reserves data of the Company evaluated by us for the year ended December 31, 2005 and identifies the portion thereof that we have evaluated and reported on the Company’s management and board of directors. |
Independent Qualified Reserves Evaluator | Description and Preparation Data of Evaluation Report | Location of Reserves (Country or Foreign Geographic Area) | Net Present Value of Future Net Revenue (before income taxes, 10% discount rate) | |||
Audited | Evaluated | Reviewed | Total | |||
AJM Petroleum Consultants | December 31, 2005 | Canada | 0 | 4,054 | 0 | 4,054 |
5. In our opinion, the reserves data evaluated by us have, in all material respects, been determined and are in accordance with the COGE Handbook. We express no opinion on the reserves data that we reviewed but did not audit or evaluate.
6. We have no responsibility to update our reports referred to in paragraph 4 for events and circumstances occurring after their respective preparation dates.
25
7. Because the reserves data are based on judgments regarding future events, actual results will vary and the variations may be material.
Executed as to our reports referred to above:
AJM Petroleum Consultants
Calgary, Alberta, Canada
April 27, 2006
“Signed Lynn Kis”
Signed: Lynn Kis, P. Eng.
26
FORM 51-101F3
REPORT OF MANAGEMENT AND DIRECTORS
ON OIL AND GAS DISCLOSURE
Report of Management and Directors
on Reserves Data and Other Information
Management of Berkley Resources Inc. (the “Company”) are responsible for the preparation and disclosure of information with respect to the Company’s oil and gas activities in accordance with securities regulatory requirements This information includes reserves data, which consist of the following:
(a) (i) proved and proved plus probable oil and gas reserves estimated as at December 31, 2005 using forecast prices and costs; and
(ii) the related estimated future net revenue; and
(b) (i) proved oil and gas reserves estimated as at December 31, 2005 using constant prices and costs; and
(ii) the related estimated future net revenue.
An independent qualified reserves evaluator has evaluated the Company’s reserves data. The report of the independent qualified reserves evaluator will be filed with securities regulatory authorities concurrently with this report.
The board of directors of the Company has:
| (a) | reviewed the Company’s procedures for providing information to theindependent qualified reserves evaluator; |
(b) met with the independent qualified reserves evaluator to determine whether any restrictions affected the ability of the independent qualified reserves evaluators to report without reservation; and
(c) reviewed the reserves data with management and the independent qualified reserves evaluator.
The board of directors has reviewed the Company’s procedures for assembling and reporting other information associated with oil and gas activities and has reviewed that information with management. The board of directors has approved:
| (a) | the content and filing with securities regulatory authorities of the reserves data and other oil and gas information; |
| (b) | the filing of the report of the independent qualified reserves evaluator on the reserves data; and |
27
| (c) | the content and filing of this report. |
Because the reserves data are based on judgments regarding future events, actual results will vary and the variations may be material.
“Matt L. Wayrynen”
Matt L. Wayrynen
Executive Chairman, Chief Executive Officer and Director
“Lindsay E. Gorrill”
Lindsay E. Gorrill,
President, Chief Operating Officer and Director
“James E. O’Byrne”
James E. O’Byrne
Manager, Oil and Gas Operations and Director
“Lloyd J. Andrews”
Lloyd J. Andrews, Chairman and Director
“Louis Wolfin”
Louis Wolfin, Director
“Ronald Andrews”
Ronald Andrews, VP Human Relations and Director
“David Wolfin”
David Wolfin, VP Finance and Director
“Phillip Piffer”
Phillip Piffer, Director
April 27, 2006
28