UNITED STATES
SECURITIES AND EXCHANGE COMMISSION
WASHINGTON, D.C. 20549
FORM 20-F
[ ] REGISTRATION STATEMENT PURSUANT TO SECTION 12(b) OR 12(g) OF THE SECURITIES EXCHANGE ACT OF 1934.
OR
[X] ANNUAL REPORT PURSUANT TO SECTION 13 OR 15(d) OF THE SECURITIES EXCHANGE ACT OF 1934
For the fiscal year ended December 31, 2007 OR
[ ] TRANSITION REPORT PURSUANT TO SECTION 13 OR 15 (d) OF THE SECURITIES EXCHANGE ACT OF 1934
For the transition period from ______________to ___________________
OR
[ ] SHELL COMPANY REPORT PURSUANT TO SECTION 13 OR 15(d) OF THE SECURITIES EXCHANGE ACT OF 1934
Date of event requiring this shell company report______________
Commission File Number 0-18939
BERKLEY RESOURCES INC.
(Exact name of Registrant as specified in its charter)
A CORPORATION FORMED UNDER THE LAWS OF BRITISH COLUMBIA, CANADA
(Jurisdiction of Incorporation or Organization)
455 Granville Street, Suite 400
Vancouver, British Columbia V6C 1T1, Canada
(Address of principal executive offices)
Securities registered or to be registered pursuant to Section 12(b) of the Act: NONE
Securities registered or to be registered pursuant to Section 12(g) of the Act:
Common Shares, without Par Value
(Title of Class)
Securities for which there is a reporting obligation pursuant to Section 15(d) of the Act: NONE
The number of outstanding Common Shares as of December 31, 2007 was 21,451,608
Indicate by check mark if the Registrant is a well-known seasoned issuer, as defined in Rule 405 of the Securities Act.
[ ] Yes [X] No
If this report is an annual or transition report, indicate by check mark if the registrant is not required to file reports pursuant to Section 13 or 15(d) of the Securities Exchange Act of 1934. [ ] Yes [X] No
Indicate by check mark whether the Registrant: (1) has filed all reports required to be filed by Section 13 or 15(d) of the Securities Exchange Act of 1934 during the preceding 12 months (or for such shorter period that the registrant was required to file such reports), and (2) has been subject to such filing requirements for the past 90 days. [X] Yes [ ] No
Indicate by check mark whether the Registrant is a large accelerated filer, an accelerated filer, or a non-accelerated filer. See definition of "accelerated filer and large accelerated filer" in Rule 12b-2 of the Exchange Act. (Check on):
| Large Accelerated File [ ] | Accelerated Filer [ ] | Non-Accelerated Filer [X] |
Indicate by check mark which financial statement item the Registrant has elected to follow. Item 17 [X] Item 18 [ ] If this is an annual report, indicate by check mark whether the Registrant is a shell company (as defined in Rule 12b-2 of the Exchange Act). Yes [ ] No [X]
(APPLICABLE ONLY TO ISSUERS INVOLVED IN BANKRUPTCY PROCEEDINGS DURING THE PAST FIVE YEARS.)
Indicate by check mark whether the Registrant has filed all documents and reports required to be filed by Sections 12, 13 or 15(d) of the Securities Exchange Act of 1934 subsequent to the distribution of securities under a plan confirmed by a court. NOT APPLICABLE
TABLE OF CONTENTS
2
Introduction
Berkley Resources Inc., which we refer to as the "Company", was organized under theCompany Act of the Province of British Columbia, Canada on July 18, 1986 under the name of Berkley Resources Inc. by virtue of a statutory amalgamation among Fortune Island Mines Ltd., Kerry Mining Ltd. and Berkley Resources Inc. The principal executive office of the Company is located at 455 Granville Street, Suite 400, Vancouver, British Columbia V6C 1T1, and its telephone number is 604-682-3701. The principal business of the Company is that of a drilling participant in various oil and gas properties principally located in Alberta and Saskatchewan, Canada. In August 2001, the Company purchased the remaining interest in the office building that it occupies and became its sole owner. As a result, the Company now leases the other offices that it does not occupy to other businesses. Subsequent to December 31, 2006, the Company signed an agreement to sell this building and the transaction is expected to close on September 7, 2007.
In this annual report on Form 20-F, which we refer to as the "Annual Report", except as otherwise indicated or as the context otherwise requires, the "Company", "we" or "us" refers to Berkley Resources Inc.
You should rely only on the information contained in this Annual Report. We have not authorized anyone to provide you with information that is different. The information in this Annual Report may only be accurate on the date of this Annual Report or on or as at any other date provided with respect to specific information.
Currency
Unless we otherwise indicate in this Annual Report, all references to "Canadian Dollars", "CDN$" or "$" are to the lawful currency of Canada and all references to "U.S. Dollars" or "U.S. $" are to the lawful currency of the United States.
Forward-looking Statements
The following discussion contains forward-looking statements within the meaning of the United States Private Securities Legislation Reform Act of 1995 concerning the Company's plans which may affect the future operating results and financial position. Such statements are subject to risks and uncertainties that could cause our actual results and financial position to differ materially from those anticipated in the forward-looking statements. These factors include, but are not limited to, the factors set forth in the sections entitled "Risk Factors" in Item 3.D., and "Operating and Financial Review and Prospects" in Item 5. Statements concerning reserves and resources may also be deemed to constitute forward-looking statements to the extent that such statements reflect the conclusion that such reserves and resources may be economically exploitable. Any statements that express or involve discussions with respect to predictions, expectations, plans, projections, objectives, assumptions or future events or performance (often, but not always, using words or phrases such as "expects" or "does not expect", "is expected", "anticipates", "does not anticipate", "plans", "estimates", or "intends", or stating that certain actions, events or results "may", "could", "would", or "will" be taken, occur or be achieved) are not statements of historical fact and may be "forward-looking statements".
Part I
Item 1. Identity of Directors, Senior Management and Advisors
Not applicable.
3
Item 2. Offer Statistics and Expected Timetable
Not applicable.
Item 3. Key Information
A. Selected Financial Data
The selected historical financial information presented in the table below for each of the years ended December 31, 2007, 2006, 2005, 2004 and 2003 is derived from the audited financial statements of the Company. The audited financial statements and notes for the balance sheets as at December 31, 2007 and December 31, 2006, and the statements of operations for each of the years in the three year period ended December 31, 2007, are included in this Annual Report at item 17. The selected historical financial information for the years ended December 31, 2004 and 2003, presented in the table below are derived from financial statements of the Company that are not included in this Annual Report. The selected financial information presented below should be read in conjunction with the Company's financial statements and the notes thereto (Item 17) and the Operating and Financial Review and Prospects (Item 5) included elsewhere in this Annual Report.
The selected financial information for each of the years ended December 31, 2007, 2006 and 2005 has been prepared in accordance with Canadian generally accepted accounting principles, which is referred to as "Canadian GAAP", and United States generally accepted accounting principles, which is referred to as "U.S. GAAP", and the selected financial data for each of the years ended December 31, 2004 and 2003 has been prepared in accordance with Canadian GAAP only. For a description of the differences between Canadian GAAP and U.S. GAAP, see Note 17 of the Company’s financial statements included elsewhere in this Annual Report.
| Year Ended December 31 | |||||||||||||||
| Canadian GAAP | 2005 | ||||||||||||||
| 2007 | 2006 | (Restated)i | 2004 | 2003 | |||||||||||
| Operations | |||||||||||||||
| Oil and Gas Revenue | $ | 1,715,924 | $ | 1,568,681 | $ | 1,408,858 | $ | 866,811 | $ | 606,133 | |||||
| Oil and Gas Production Expense | 1,017,313 | 828,575 | 608,045 | 416,254 | 243,717 | ||||||||||
| Interest On Loans | 134,264 | 59,652 | - | - | - | ||||||||||
| Amortization and Depletion | 1,428,068 | 1,162,790 | 667,794 | 262,775 | 79,500 | ||||||||||
| Write-down of oil and gas | |||||||||||||||
| properties | 4,083,000 | 2,385,000 | - | - | - | ||||||||||
| Net Oil and Gas Income (Loss) | (4,946,721 | ) | (2,867,336 | ) | 133,019 | 187,782 | 278,147 | ||||||||
| Loss for the Period from | |||||||||||||||
| Continuing Operationsii | (5,380,576 | ) | (3,068,631 | ) | (467,346 | ) | (715,910 | ) | N/A2 | ||||||
| Net Income (loss) | (3,525,922 | ) | (3,236,759 | ) | (522,458 | ) | (729,034 | ) | (255,456 | ) | |||||
| Basic and Diluted Loss Per Share | |||||||||||||||
| Before Discontinued Operations2 | (0.27 | ) | (0.21 | ) | (0.05 | ) | (0.10 | ) | N/A2 | ||||||
| Net Income Per Share (loss) | (0.18 | ) | (0.22 | ) | (0.05 | ) | (0.10 | ) | (0.04 | ) | |||||
4
| As at December 31 | |||||||||||||||
| 2005 | |||||||||||||||
| 2007 | 2006 | (Restated)1 | 2004 | 2003 | |||||||||||
| Balance Sheet | |||||||||||||||
| Total Assets | $ | 5,771,772 | $ | 11,896,697 | $ | 9,991,350 | $ | 6,759,346 | $ | 3,615,691 | |||||
| Oil and Gas Properties and | |||||||||||||||
| Equipment | 5,456,007 | 8,581,024 | 5,339,531 | 3,389,679 | 1,109,391 | ||||||||||
| Assets of Discontinued | |||||||||||||||
| Operations2 | - | 2,038,924 | 2,049,015 | N/A | N/A | ||||||||||
| Current liabilities | 996,647 | 4,461,639 | 2,400,426 | 1,968,601 | 711,222 | ||||||||||
| Shareholders' Equity | 4,634,975 | 7,299,365 | 7,505,485 | 4,747,715 | 2,767,967 | ||||||||||
| Number of shares issued and | |||||||||||||||
outstanding | 21,451,608 | 18,857,608 | 14,184,955 | 9,681,977 | 6,810,934 | ||||||||||
| Year Ended December 31 | |||||||||||||||
| U.S. GAAP | 2005 | ||||||||||||||
| 2007 | 2006 | (Restated)1 | 2004 | 2003 | |||||||||||
| Operations | |||||||||||||||
| Oil and Gas Revenue | $ | 1,715,924 | $ | 1,568,681 | $ | 1,408,858 | $ | 866,811 | $ | 606,133 | |||||
| Rental Revenue | 165,490 | 249,211 | 238,466 | 232,607 | 238,599 | ||||||||||
| Net Income (loss) | (3,244,329 | ) | (4,514,878 | ) | (2,863,271 | ) | (729,034 | ) | (255,456 | ) | |||||
| Net Income Per Share (loss) | (0.16 | ) | (0.31 | ) | (0.29 | ) | (0.10 | ) | (0.04 | ) | |||||
| As at December 31 | |||||||||||||||
| 2005 | |||||||||||||||
| 2007 | 2006 | (Restated)1 | 2004 | 2003 | |||||||||||
| Balance Sheet | |||||||||||||||
| Total Assets | 4,097,296 | 9,251,001 | 7,689,747 | $ | 6,857,146 | $ | 3,713,491 | ||||||||
| Total Liabilities | 1,136,797 | 4,597,314 | 2,485,865 | 2,011,631 | 847,724 | ||||||||||
| Shareholders' Equity | 2,852,799 | 3,719,643 | 5,164,672 | 4,845,515 | 2,865,767 | ||||||||||
| 1 | See Note 18 of the financial statements included elsewhere in this Annual Report (Item 17) | |
| 1 | Subsequent to the year end, the Company entered into an agreement to sell its real estate assets in Vancouver, British Columbia, such assets are now disclosed as Discontinued operations, see Note 2 of the financial statements included elsewhere in this Annual Report (Item 17) | |
Exchange Rates
The following table sets forth information as to the fiscal year end, average, high and low exchange rate data for Canadian Dollars and U.S. Dollars for the periods indicated based on the noon buying rate in New York City for cable transfers in Canadian Dollars as certified for customs purposes by the Federal Reserve Bank of New York (Canadian dollar = U.S. $1).
| Year Ended: | ||||||||||||
| December 31 | Average | Period End | High | Low | ||||||||
| 2003 | 1.4008 | 1.2923 | 1.5750 | 1.2923 | ||||||||
| 2004 | 1.3017 | 1.2034 | 1.3970 | 1.1775 | ||||||||
| 2005 | 1.2116 | 1.1656 | 1.2703 | 1.1507 | ||||||||
| 2006 | 1.1340 | 1.1652 | 1.1726 | 1.0989 | ||||||||
| 2007 | 1.0748 | 0.9913 | 1.1853 | 0.9170 |
The following table sets forth the high and low exchange rate for the past six months. As of June 30, 2008, the exchange rate was $1.0186 for each U.S. $1.00.
| Month | High | Low | ||||
| December 2007 | $ 1.0217 | $ 0.9785 | ||||
| January 2008 | $ 1.0324 | $ 0.9905 | ||||
| February 2008 | $1.0190 | $0.9719 | ||||
| March 2008 | $1.0279 | $0.9798 | ||||
| April 2008 | $1.0270 | $1.0025 | ||||
| May 2008 | $1.0189 | $0.9844 |
5
B. Capitalization and Indebtedness
Not Applicable.
C. Reasons for the Offer and Use of Proceeds
Not Applicable.
D. Risk Factors
In addition to the other information presented in this Annual Report, the following should be considered carefully in evaluating the Company and its business. This Annual Report contains forward-looking statements that involve risk and uncertainties. The Company's actual results may differ materially from the results discussed in the forward-looking statements. Factors that might cause such a difference include, but are not limited to, those discussed below and elsewhere in this Annual Report.
Failure to Locate Commercial Quantities of Hydrocarbons and Geological Risks.There is no assurance that commercial quantities of hydrocarbons will be discovered. Geological conditions are variable and of limited predictability. Even if production is commenced from a well or field, production will inevitably decline over the course of time, reducing the operating profitability of the enterprise and eventually causing its termination.
Oil and Natural Gas Prices.The Company has little control over the price it receives for its products. Prices are determined by the worldwide supply of and demand for energy. Levels of production maintained by the Organization of Petroleum Exporting Countries, referred to as "OPEC", member nations and other major oil producing countries are expected to continue to be a major determinant of oil price movements in the future. As a result, future oil price movements cannot be predicted with any certainty. Similarly, during the past several years, the market price for natural gas has been subject to significant fluctuations on a monthly basis as well as from year to year. These frequent changes in the market price make it impossible for the Company to predict natural gas price movements with any certainty. Oil prices fluctuated during 2007 between U.S.$63.50 and U.S.$95.50 per barrel, ending the year at approximately U.S.$95.00 per barrel ($per barrel for West Texas Intermediate, referred to as "WTI". Natural gas prices have also been very volatile fluctuating between U.S.$6.25/mcf and U.S.$8.50/mcf during the year, ending 2007 at a price of approximately U.S.$7.50/mcf. Costs of all related services have been high for 2007.
The Company cannot provide assurance that it will be able to market all oil or natural gas that the Company produces or, if such oil or natural gas can be marketed, that favorable price and contractual terms can be negotiated. Changes in oil and natural gas prices may significantly affect the revenues and cash flow of the Company and the value of its oil and natural gas properties. Further, significant declines in the prices of oil and natural gas may have a material adverse effect on the business and financial condition of the Company.
It May Be Difficult to Enforce Civil Liabilities Against the Company. Because the assets of the Company, as well as the Company's jurisdiction of incorporation and the residences of its officers and directors, are mostly located outside of the United States, it may be difficult or impossible to enforce judgments granted by a court in the United States against the assets of the Company and its subsidiaries or the directors and officers of the Company who reside outside the United States.
6
Operating History and Significant Historical Operating Losses.We commenced operations in the early 1980’s. We have five major properties which have been in production since the mid-1980’s. The majority of wells on the properties, proved reserves and future production attributable to these properties are more susceptible to estimation discrepancies than fields with larger reserves and longer production histories.
In fiscal 2003, 2004, 2005, 2006 and 2007, we reported losses of $255,456, $729,034, $522,458, $3,236,759 and $3,525,922 respectively. As at December 31, 2007, we had an accumulated deficit of $8,743,150. Our future viability should be considered in light of the risks and difficulties frequently encountered by companies engaged in the junior stages of oil and gas exploration, development and production activities. As at December 31, 2007, the Company did not have sufficient financial resources to meet its flow through expenditure requirements in the 2008 fiscal year in conjunction with its flow through financings. The Company has until the end of 2008 to meet these requirements.
Penny Stock Rules May Make it More Difficult to Trade the Company's Common Shares.The Securities and Exchange Commission, which we refer to as the "SEC", has adopted regulations which generally define a "penny stock" to be any equity security that has a market price, as defined, of less than U.S. $5.00 per share or an exercise price of less than U.S. $5.00 per share, subject to certain exceptions. Our securities may be covered by the penny stock rules, which impose additional sales practice requirements on broker-dealers who sell to persons other than established customers and accredited investors such as institutions with assets in excess of U.S. $5,000,000 or an individual with net worth in excess of U.S. $1,000,000 or annual income exceeding U.S. $200,000 or U.S. $300,000 jointly with his or her spouse. For transactions covered by this rule, the broker-dealers must make a special suitability determination for the purchase and receive the purchaser's written agreement of the transaction prior to the sale. Consequently, the rule may affect the ability of broker-dealers to sell our securities and also affect the ability of our investors to sell their shares in the secondary market.
No Reliable Information Regarding Reserves. The Company has engaged independent petroleum consultants to compile oil and gas reserve information with respect to its major properties and does have reliable information regarding the quantities of natural gas or oil that may be recoverable from these properties in future years, if any. There can be no assurance, however, that such information has been accurately compiled or is not based on assumptions which may prove to be inaccurate. Furthermore, if any one of our major properties stop producing, it could have a material adverse effect on our business, financial condition and operating results.
We are Dependent on a Limited Number of our Properties. The Company currently receives substantially all of its income from a limited number of its properties. If any one of these properties stop producing, it could have a material adverse effect on our business, financial condition and operating results.
Risks Pertaining to Acquisitions and Joint Ventures. Part of our business strategy is to expand through acquisitions and is therefore dependent upon our ability to complete suitable acquisitions and effectively integrate acquired assets into our operations. Suitable acquisitions, on terms acceptable to us, may not be available in the future or may require us to assume certain liabilities, including, without limitation, environmental liabilities, known or unknown.
7
Exploration and Development Risks. Exploration and development of natural gas and oil involves a high degree of risk that no commercial production will be obtained or that the production will be insufficient to recover drilling and completion costs. The costs of drilling, completing and operating wells is sometimes uncertain, and cost overruns in exploration and development operations can adversely affect the economics of a project. Our drilling operations may be curtailed, delayed or canceled as a result of numerous factors, including title problems, joint venture partner and/or operator decisions, equipment failures, weather conditions, marine accidents, fires and explosions, compliance with governmental requirements, and shortages or delays in the delivery of equipment. Furthermore, the completion of a well does not ensure a profit on the investment or a recovery of drill, completion and tie-in costs.
Replacement of Reserves.In general, the rate of production from natural gas and oil properties declines as reserves are depleted. The rate of decline depends on reservoir characteristics and other factors. Except to the extent we acquire properties containing proven reserves or conduct successful exploration and development activities, or both, our estimated proven reserves will decline as reserves are exploited. Our future natural gas and oil production, and therefore cash flow from operations and net earnings, are highly dependent upon our level of success in finding or acquiring additional economically recoverable reserves. The business of exploring for, developing and acquiring reserves is capital intensive. To the extent cash flow from operations is reduced and external sources of capital become limited or unavailable, our ability to make the necessary capital investment to maintain or expand our asset base of natural gas and oil reserves could be materially impaired.
Estimating of Reserves and Future Net Cash Flows Risk.Estimating natural gas, natural gas liquids and crude oil reserves, and future net cash flows includes numerous uncertainties, many of which may be beyond our control. Such estimates are essential in our decision-making as to whether further investment is warranted. These estimates are derived from several factors and assumptions, some of which are:
- reservoir characteristics based on variable geological, geophysical and engineering assessments;
- future rates of production based on historical draw-down rates;
- future net cash flows based on commodity price/quality assumptions, production costs, taxes and investment decisions;
- recoverable reserves based on estimated future net cash flows; and
- compliance expectations based on assumed federal, provincial and environmental laws and regulations.
Ultimately, actual production rates, reserves recovered, commodity prices, production costs, government regulations or taxation may differ materially from those assumed in earlier reserve estimates. Higher or lower differences could materially impact our production, revenues, production costs, depletion expense, taxes and capital expenditures.
Reserve estimates and net present values reported by us elsewhere in this Annual Report are based on estimated commodity prices and associated production costs that are assumed constant for the life of the reserves. Actual future prices and costs may be materially higher or lower.
We have historically invested a significant portion of our capital budget in drilling exploratory wells in search of unproved oil and gas reserves. We cannot be certain that the exploratory wells we drill will be productive or that we will recover all or any portion of our investments. In order to increase the chances for exploratory success, we often invest in seismic or other geoscience data to assist us in identifying potential drilling objectives. Additionally, the cost of drilling, completing and testing exploratory wells is often uncertain at the time of our initial investment. Depending on complications encountered while drilling, the final cost of the well may significantly exceed that which we originally estimated.
8
Potential Variability in Quarterly Operating Results.Demand for our products will generally increase during the winter because they are often used as heating fuels. The amount of such increased demand will depend to some extent upon the severity of winter. Accordingly, our net operating revenues are likely to increase during winter months, although the amount of increase and its effect on profitability cannot be predicted. Because of the seasonality of our business and continuous fluctuations in the prices of our products, our operating results for any past quarterly period may not necessarily be indicative of results for future periods and there can be no assurance that we will be able to maintain steady levels of profitability on a quarterly or annual basis in the future.
Competition and Business Risk Management.The natural gas and oil industry is highly competitive. We experience competition in all aspects of our business, including: searching for, developing and acquiring reserves; obtaining pipeline and/or facilities processing capacity, leases, licenses and concessions; and obtaining the equipment and labor needed to conduct operations and market natural gas and oil. Our competitors include multinational energy companies, other independent natural gas and oil concerns and individual producers and operators. Because both natural gas and oil are fungible commodities, the principal form of competition with respect to product sales is price competition. Many competitors have financial and other resources substantially greater than those available to us and, accordingly, may be better able to respond to factors such as changes in worldwide natural gas or oil prices, levels of production, the cost and availability of alternative fuels or the application of government regulations. Such factors, which are beyond our control, may affect demand for our natural gas and oil production. We expect a high degree of competition to continue.
Shortage of Supplies and Equipment.Our ability to conduct operations in a timely and cost effective manner is subject to the availability of natural gas and crude oil field supplies, rigs, equipment and service crews. Although none are expected currently, any shortage of certain types of supplies and equipment could result in delays in our operations as well as in higher operating and capital costs.
Interruption from Severe Weather. Our operations are conducted principally in Alberta and Saskatchewan. The weather during colder seasons in these areas can be extreme and can cause interruption or delays in our drilling and construction operations.
Dependence on Third-Party Pipelines.Substantially all our sales of oil and natural gas were effected through deliveries to local third-party gathering systems to processing plants in Alberta and Saskatchewan. In addition, we rely on access to interprovincial pipelines for the sale and distribution of substantially all of our gas. As a result, a curtailment of our sale of natural gas by pipelines or by third-party gathering systems, an impairment of our ability to transport natural gas on interprovincial pipelines or a material increase in the rates charged to us for the transportation of natural gas by reason of a change in federal or provincial regulations or for any other reason, could have a material adverse effect upon us. In such event, we would have to obtain other transportation arrangements or we would have to construct alternative pipelines. There can be no assurance that we would have economical transportation alternatives or that it would be feasible for us to construct pipelines. In the event such circumstances were to occur, our field netbacks from the affected wells would be suspended until, and if, such circumstances could be resolved.
Operating Hazards and Uninsured Risks.The oil and gas business involves a variety of operating risks, including fire, explosion, pipe failure, casing collapse, abnormally pressured formations, adverse weather conditions, governmental and political actions, premature reservoir declines, and environmental hazards such as oil spills, gas leaks and discharges of toxic gases. The occurrences of any of these events with respect to any property operated or owned (in whole or in part) by us could have a material adverse impact on us. We, and the operators of our properties, maintain insurance in accordance with customary industry practices and in amounts that we believe to be reasonable. However, insurance coverage is not always economically feasible and is not obtained to cover all types of operational risks. The occurrence of a significant event that is not fully insured could have a material adverse effect on our financial condition.
9
We will not be able to develop our reserves or make acquisitions if we are unable to generate sufficient cash flow or raise capital. If we are unable to increase our reserves, our business will be adversely affected because we will eventually run out of reserves.We will be required to make substantial capital expenditures to develop our existing reserves, to discover new oil and gas reserves and to make acquisitions. We will be unable to accomplish these tasks if we are unable to generate sufficient cash flow or raise capital in the future.
We are Subject to Government Regulation on the Removal of Natural Gas from Canada.The price of natural gas sold is not regulated and, therefore, is determined by negotiation between buyers and sellers. Exports of natural gas from Canada require the approval of the National Energy Board, or the "NEB". All exports of natural gas require the issuance by the NEB of a license and the approval of the Governor in Council. Exporters are free to negotiate prices with purchasers but natural gas export sales contracts, or any amendment, agreement or change pertaining thereto, requires NEB approval.
The government of the Province of Alberta also regulates the removal of natural gas from its province, based on such factors as reserve availability, transportation arrangements and market conditions. In each Canadian province, the relevant regulatory agency must approve any proposed export. The United States represents a significant market for Canadian natural gas and any significant change in access to such market will have an effect on the price of natural gas in Canada.
The Company's Investments are Subject to Environmental Regulation. All phases of the oil and natural gas business are subject to environmental regulation pursuant to a variety of Canadian, United States, federal, provincial, state and municipal laws and regulations, as well as international conventions, which are collectively referred to as the "Environmental Legislation". Environmental Legislation regulates, among other things, the release, emission, handling, storage, use, transportation and disposal of various substances and wastes associated with the oil and natural gas industry. In addition, Environmental Legislation requires that refineries, pipelines, service stations, wells, facility sites and waste storage and disposal facilities be operated, maintained, decommissioned and reclaimed in accordance with prescribed provincial, state, territorial or federal standards. A breach of such Environmental Legislation may result in the suspension or revocation of necessary licenses and authorizations, liability for clean-up costs, damages and the imposition of fines and penalties.
Where they are probable and can be reasonably estimated, future removal and site restoration costs (as those terms are used under the accounting recommendations of the Canadian Institute of Chartered Accountants), net of expected recoveries, are provided for in the Company's financial statements. Costs are estimated in current dollars based on current requirements of Environmental Legislation, costs, technology and industry standards and are included in the capital costs of the oil and gas properties. The liability for site restoration is adjusted annually for the passage of time and revisions to the original estimates. The annual charge is included in the operations through depletion and accretion. Removal and site restoration expenditures are charged to the accumulated provision as incurred. Based on these parameters, estimated future removal and site restoration costs primarily related to upstream properties has been provided for in the financial statements of the Company. Not all future removal and site restoration costs are foreseeable and not all such costs, even if foreseeable, can be reasonably estimated based on the parameters noted above and, as such, are not included in the future removal and site restoration cost provisions. Although the Company currently does not expect that its future removal and site restoration costs will have a material adverse effect on its financial condition or results of operations, there can be no assurance that such costs could not have such an effect.
10
Environmental Legislation also imposes, among other things, restrictions and obligations in connection with the generation, handling, storage, transportation, treatment and disposal of hazardous materials and waste and in connection with spills, releases, and emissions of various substances into the air, soil, subsoil, water and groundwater. In addition, certain types of operations, including exploration and development projects and significant changes to certain existing projects, may require the submission and approval of environmental impact assessments, which could impose additional costs or delays or prevent the completion of a project. Compliance with Environmental Legislation can require significant expenditures, and failure to comply with Environmental Legislation may result in the imposition of fines and penalties. The Company is committed to protecting and conserving the natural environment and complying with applicable Environmental Legislation. The Company believes that it is currently in substantial compliance with all existing material Environmental Legislation. The Company does not believe that the costs of complying with Environmental Legislation will have a material adverse effect on its financial condition or results of operations. However, there can be no assurance that the costs of complying with Environmental Legislation will not have such an effect.
Judgments based upon the civil liability provisions of the United States federal securities laws may be difficult to enforce.The ability of investors to enforce judgments of United States courts based upon the civil liability provisions of the United States federal securities laws against the Company and the directors and officers of the Company may be limited due to the fact that the Company and these persons reside outside of the United States and, in respect of the directors and officers, their assets are located outside the United States. There is uncertainty as to whether Canadian courts would: (i) enforce judgments of United States courts obtained against the Company or its directors and officers predicated upon the civil liability provisions of the United States federal securities laws, or (ii) entertain original actions brought in Canadian courts against the Company or such persons predicated upon the federal securities laws of the United States, as such laws may conflict with Canadian laws. In Canada, civil rights are within the legislative jurisdiction of the Provinces, and the Province of British Columbia, in which the Company and the majority of its directors and officers are resident, does not have laws for the reciprocal enforcement of judgments of United States courts.
Our directors may be associated with other reporting companies.Certain of the Company's directors and officers serve as directors or officers of other reporting companies or have significant shareholdings in other reporting companies and, to the extent that such other companies may participate in ventures in which the Company may participate, the directors of the Company may have a conflict of interest in negotiating and concluding terms respecting the extent of such participation. See “Item 6 – Directors, Senior Management and Employees” and “Item 7 – Major Shareholders and Related Party Transactions”.
We depend on certain key personnel.We strongly depend on the business and technical expertise of our management and key personnel. There is little possibility that this dependence will decrease in the near term. We carry no “key man” life insurance on any of our executives. As our operations expand, we will require additional key personnel and related resources.
Our share price has been volatile in recent years.In recent years, the securities markets in the United States and Canada have experienced a high level of price and volume volatility, and the market price of securities of many petroleum companies have experienced wide fluctuations in price which have not necessarily been related to the operating performance, underlying asset values or prospects of such companies. In particular, the per share price of the Company’s Common Shares fluctuated from a high of $1.09 to a low of $0.51 on the TSX Venture Exchange within the twelve month period preceding the date of this Annual Report. There can be no assurance that continual fluctuations in price will not occur.
11
Our common shares are quoted on the Pink Sheets over-the-counter securities market, referred to as the "Pink Sheets". Trading in stock quoted on the Pink Sheets is often thin and characterized by wide fluctuations in trading prices, due to many factors that may have little to do with our operations or business prospects. This volatility could depress the market price of our common stock for reasons unrelated to operating performance. Moreover, the Pink Sheets is not a stock exchange, and trading of securities on the Pink Sheets is often more sporadic than the trading of securities listed on a quotation system like the Nasdaq or a stock exchange like the American Stock Exchange. Accordingly, shareholders may have difficulty reselling any of the shares.
We do not expect to pay dividends.The Company has not paid any dividends since incorporation and it has no plans to pay dividends for some time. The directors of the Company will determine if and when dividends should be declared and paid in the future based on the Company’s financial position at the relevant time. All of the Common Shares are entitled to an equal share of any dividends declared and paid.
Other sections of this Annual Report may include additional factors that could adversely affect our business and financial performance. Moreover, we operate in a very competitive and rapidly changing environment. New risk factors emerge from time to time and it is not possible for our management to predict all risk factors, nor can we assess the impact of all factors on our business or the extent to which any factor, or combination of factors, may cause actual results to differ materially from those contained in any forward-looking statements.
Item 4. Information on the Company
A. History and Development of the Company
The Company was organized under theCompany Actof the Province of British Columbia on July 18, 1986 under the name of Berkley Resources Inc. by virtue of a statutory amalgamation among Fortune Island Mines Ltd., Kerry Mining Ltd. and Berkley Resources Inc. The principal executive office of the Company is located at 455 Granville Street, Suite 400, Vancouver, British Columbia V6C 1T1, and its telephone number is 604-682-3701. The principal business of the Company is that of a drilling participant in various oil and gas properties principally located in Alberta and Saskatchewan, Canada.
The Company presently participates in approximately 63 oil and gas wells in Alberta and Saskatchewan ranging from one percent to 35% working interests. Substantially all of the Company's oil and gas revenue is produced from nine discrete areas. Four are natural gas producers, three produce oil and two have a combination of oil and gas. Eight areas have been producing for several years while one oil producer is a new development. Since December 31, 2003, the Company has made principal capital expenditures of $1,301,715 for the year ended December 31, 2004, $3,859,162 for the year ended December 31, 2005 and $6,739,047 for the year ended December 31, 2006. In 2006, a major portion of the expenditures were incurred in connection with the Brazeau, Sturgeon Lake and Senex projects. In 2007, $1,842,000 of capital expenditures have been made on Senex. These capital expenditures were primarily financed through the issuance of shares under a private placement and a mortgage on the Company's real estate assets.
In August 2001, the Company purchased the remaining interest in the office building that it occupies and became its sole owner. On August 31, 2007, the Company sold the office building for $4 million. From the proceeds, $3.3 million was used to pay the Company’s outstanding corporate debt and the balance was used for exploration and working capital purposes. This property had been disclosed as discontinued operations in the December 31, 2006 year end and subsequent financial statements. Please refer to Note 2 of the financial statements, included elsewhere in this Annual Report (Item 17) for further disclosure regarding this transaction.
12
B. Business Overview
The Company’s principal business activities are the acquisition, development and exploration, production, and marketing of petroleum and natural gas reserves.
The investments made by the Company in petroleum and natural gas properties are chosen on the basis of, among other things: (i) the amount of cash available; (ii) the desired diversification of oil as contrasted by natural gas exploration; (iii) the geographical area in which the property is located; (iv) the nature and extent of available geological and geophysical data concerning the property; and (v) the time at which it is desirable to commence drilling activities, for reasons such as the availability of drilling equipment and the provisions of the drilling rights agreement and other relevant agreements.
In making an investment, the Company will enter into an operating agreement, which we refer to as an "Operating Agreement", with other investors. The Operating Agreement sets forth the participating interest of the parties and incorporates the operating procedures manual, referred to as the "Manual", adopted by the Canadian Association of Petroleum Landmen. According to the Manual, the parties' interest and liability in each investment is several, and not joint, with the other participants. The interest of the Company in the lands, wells and equipment is that of tenants in common. Each investor in a drilling property is deemed to be a "Joint Operator", and an "Operator" is the party appointed to carry out the operations of the drilling program for the joint account. The Company usually is one of the Joint Operators in any Operating Agreement in which it participates. Each Joint Operator owns a share of the petroleum substances produced from the wells which is proportionate to that Joint Operator's ownership interest. Each Joint Operator, at its own expense, takes in kind and separately disposes of its proportionate share of production. If the Joint Operator fails or refuses to take its share of the products, the Operator has the authority to sell on behalf of that Joint Operator its share of the production. The Operator is delegated the authority to manage the exploration, development and operation of the joint lands. The Operator typically has the authority to commit on behalf of all Joint Operators up to $25,000 without separate written approval of all Joint Operators. Prior to commencement of work on any well covered by the Operating Agreement, the Operator must submit to each Joint Operator a program of drilling and an estimate of drilling costs and completion costs for approval by all Joint Operators.
Any assignment or transfer of the Company's interest in an Operating Agreement is subject to the procedures set forth in the Manual. The Company may be required to offer its interest to the Joint Operators prior to attempting a sale to a third party. In addition, the Company may "farmout" a portion of its working interest or retain an overriding royalty on production.
The oil and gas industry deals in two basic forms of ownership interests, namely "Working Interest" and "Overriding Royalties":
| (i) | Working Interest, or "WI": WI means the percentage of undivided interest held by a Joint Operator in a specific tract of land (i.e. joint lands). The WI held by all Joint Operators in any specific tract of joint lands must total 100%. Each WI party is responsible for its WI percentage share of costs incurred to conduct "work" (i.e. drilling, seismic, production etc.) on the joint lands. WI are always considered to be an active interest in the costs, risks and benefits associated with the joint lands and operations conducted thereon and the oil or gas produced therefrom. | |
| (ii) | Overriding Royalties, or "ORR's": ORR's are a specified share of oil and/or gas as and when produced. ORR's are free and clear of costs, risk and expense to the holder of the ORR. Usually ORR's are based on gross production and as such are referred to as "Gross" ORR's or "GORR's". ORR's are considered a passive interest in as much as the holder of an ORR is not subject to any cost, risk or expense, nor is the ORR holder involved in any decision-making with respect to the royalty lands. |
13
The Company's program for investing in drilling programs is based on several factors. The Company endeavors to obtain and review geological opinions on the property involved and if it is not the Operator of the well, it considers the reputation of the Operator. The Company attempts to identify drilling programs offering a low to medium risk on its investments. The Company also tries to keep a balance between investments in oil and gas. The Company attempts to reduce its risks by spreading its investments over several drilling ventures. The Company has not borrowed money for purposes of investing in any oil or gas venture.
In each investment, the Operator maintains its own staff or retains independent operating personnel (including landmen, geologists, accountants and engineers) that are employed to conduct the oil and gas operations of each joint venture, including supervision of the drilling and producing activities of the joint venture, and therefore the Company does not maintain independent staff or employees. The Operator exercises general control over the activities of the joint venture and has the authority to determine the timing of commencing, completing or abandoning any particular well authorized for drilling by the Joint Operators. The Operator maintains all records which are available to the Company upon reasonable request and at its expense. Most geotechnical information (such as well logs, geological and geophysical interpretative data) remains in the possession of the Operator but is available to a Joint Operator upon request.
Operating Costs and Special Project Charges
In Canada, the relationship of all investors in a drilling program is that of Joint Operators. The property on which drilling is conducted is deemed "joint lands" and is held by the Joint Operators as tenants in common. The Joint Operators are owners of the undeveloped joint lands and each Joint Operator is entitled to its percentage of the production and can dispose of it as it deems necessary. Therefore, the gross revenue from oil or gas production is the percentage of oil and gas owned by the Company which it has sold to a buyer company. Each Joint Operator, such as the Company, must pay its share of the expenses incurred in extracting its share of the production from the well. The Company's investment in any one drilling program ranges from approximately $20,000 to $2,000,000, the majority of which must be paid prior to any production revenue being realized.
Company Activity
The Company continues to pursue its dual objectives: (i) to participate in developing new drilling prospects; and (ii) to purchase on-line production whenever the right opportunity is found. Areas of Company activity are as follows:
| 1. | John Lake, Alberta (Twp 55 Rge 1 W4M) - This sweet natural gas producing area is located in east central Alberta and was acquired by the Company through a farm in arrangement. The Company holds a 10.00% WI in this area which is operated by Crescent Point Energy Partnership. | |
| 2. | Carbon Area, Alberta (Twp 29 Rge 22 W4M) - This natural gas producing area is operated by ATCO Gas and is located in central Alberta. It was acquired by the Company through a joint venture agreement. The Company’s interest is a 6.00% to 10.00% WI | |
| 3. | Zama/Virgo Area, Alberta (Twp 114 Rge 5 W6M) - The Company holds a 5.00% ORR on this oil production operated by Apache Canada Ltd. It is located in northwest Alberta and was acquired in the mid 1990s by the Company through a lease purchase and farm out arrangement. |
14
| 4. | Dollard Area, Saskatchewan (Twp 6 Rge 19 W3M) - This on-line oil production was purchased in late 2003 for a cash cost to the Company of $365,970. This property is located in southwestern Saskatchewan. The Company’s net daily production from this area is approximately 25 to 30 barrels per day. Infill drilling, retooling of some facilities and planned cleanup work will use up some cash in the short term. These expenditures are expected to provide increased production and cash flow over the longer term. | |
| 5. | Senex Area, Alberta (Twp 92/93 Rge 6/7 W5M) - This multi-zone prospect was acquired by the Company on March 1, 2004 pursuant to the swap of its Skiff property. The Company holds a 15% to 20% WI in approximately 70 sections over this oil and gas prospect. These land holdings will provide the Company with a very large block on which to develop all three productive formations identified to date. The formations are: Keg River (oil), Slave Point (oil) and Blue Sky (gas). During the year ended December 31, 2007, the Company and its partner changed their focus on this program and concentrated on stabilizing production from the Keg River producing wells while the capital program was put on hold. As of the date of this MD&A, the Company has an unresolved dispute with its partner with respect to the Senex area operations that is subject to a default notice. Several items in this account are disputed by the Company. The outcome of this dispute is undeterminable at this time. | |
| 6. | Leduc Area, Alberta (Twp 49 Rge 26 W4M) - This D-1 (Wabamun) gas prospect was completed and placed into production in August 2004. This single well produces at 1.0 million cubic feet per day, or "mmcf/d". The Company holds a 4.00% WI in this project. | |
| 7. | Crossfield Area, Alberta (Twp 28 Rge 1 W5M) - This natural gas prospect is located 50 miles north of Calgary and is ready to drill. The property was acquired through a joint leasing program. We have surveyed the location and acquired the surface lease. Formal licencing procedures will take time to complete as this is a "sour-gas" prospect. The Company holds a 35% WI in this project, which has as its primary objective, natural gas in the Crossfield formation at a depth of approximately 9,800 feet. The test well has targeted projected reserves of 30 to 50 billion cubic feet of natural gas and drilling costs are estimated at $4.0 million of which the Company's share is estimated at approximately $1,400,000. | |
| 8. | Brazeau Area, Alberta (Twp 46 Rge 13 W5M) - This Nisku (D-2) natural gas prospect was drilled in the second half of 2004. The Company participated with two major oil and gas operators in completing this project which was placed into production in February 2005 at the initial rate of 4.0 mmfc/d. The Company paid 30% of the well costs to earn its 19.50 % WI. The test well cost approximately $7.1 million of which the Company's share was approximately $2.13 million. The test well produced natural gas for approximately 100 days in 2005 then loaded up with water. It is unlikely that it will be returned to economic production over the long term and accordingly the Company took a 100% write down of this property in 2005. The well has been suspended. | |
| 9. | Other Prospects - The Company will continue to seek out and develop new drilling opportunities for its own account and jointly with other operators. |
15
The oil and gas industry has gone through a turbulent time over the last 18 months even with record prices. Berkeley believes the current market position will benefit oil and gas junior companies like Berkley. Oil prices fluctuated between $51 US and $119.38 US per barrel from January 1, 2007 to April 22, 2008 with prices closing at $119.38 US on April 22, 2008 ($ per barrel for West Texas Intermediate (WTI)). Natural gas prices have also been very volatile through the last 15 months fluctuating between $5.50/mcf US and $10.50 US during this same time closing, at $10.20 US on April 22, 2008. Cost of all related services have been high for 2007 although rig utilization in Alberta is down and should translate into reduced drilling costs for 2008.
Competition
The crude oil and natural gas industry, domestically and in the international arena, is highly competitive by nature. The Company must compete with integrated oil and natural gas companies and independent producers and marketers of crude oil and natural gas products in all aspects of the Company's business. This competition extends to exploration, property and asset acquisition and the selling of the Company's crude oil and natural gas products. The financial strength of the Company's competitors may at times be greater than that of the Company.
Government Regulation and Environmental Matters
Government Regulation
Government regulations have a material effect on us to the extent that they require us to conduct field operations and extraction activities according to prescribed environmentally-safe and environmentally sensitive regulations. Also, government regulations may restrict the commencement or re-commencement of field activities in certain properties in which we hold an interest for the purpose of exploration. Examples of types of governmental laws and regulations that may have a material effect on our business include:
requirements to acquire permits before commencing drilling operations;
requirements to restrict the substances that can be released into the environment in connection with drilling and production activities;
limitations on, or prohibitions to, drilling in protected areas such as offshore areas; and
requirements to mitigate and remediate the effects caused by drilling and production operations.
Each province in Canada has its own regulatory authorities which oversee, licence and monitor all oil and gas activity including seismic, drilling, production, transportation, processing and environmental matters related thereto. In Alberta, where most of the Company’s assets are located, that authority is the Alberta Energy and Utilities Board or the "AEUB". In order to explore any claim or lease, it is necessary to obtain a geophysical or drilling license and it may be necessary to post a bond with notices to several Canadian governmental agencies, including the provincial environmental agency. The procurement of drilling licenses has had no material adverse impact on the Company's operations. In certain areas defined as "sensitive areas", the provincial environmental agency requires special work permits. The Company's investments do not include property located within any defined "sensitive areas".
The main bodies of regulations that apply to us in the areas in which we have significant field operations are the Oil and Gas Conservation Act of Alberta, the Oil & Gas Conservation Act and Regulations of Saskatchewan and theCrown Minerals Act of Saskatchewan andPetroleum and Natural Gas Regulationsof Saskatchewan.
16
Since 1974, the Province of Alberta has had a program entitled "Price-Sensitive Alberta Royalty Tax Credit Program", referred to as the "Tax Credit Program". The Tax Credit Program provided for a refund of portions of the royalties paid to the Province of Alberta by the producers on the sale of oil and gas produced in Alberta. The refund amount to producers is based on the price received for the oil and gas produced. For financial statement purposes, the Company accounts for the tax credit by reducing its operating expenses by the amount of the credit resulting in an increase in income before taxes. For tax purposes, since it is intended not to be taxed, the amount of the credit is reinstated as an operating expense and thus reduces taxable income. The maximum credit available to a company is $1.0 million. As of January 1, 2007 this tax credit is no longer applicable to the Company.
Environmental Matters
Environmental regulations impose, among other things, restrictions, liabilities and obligations in connection with the generation, handling, use, storage, transportation, treatment and disposal of hazardous substances and waste, and in connection with spills, releases and emissions of various substances to the environment. Environmental regulation also requires that wells, facility sites and other properties associated with our operations be operated, maintained, abandoned and reclaimed to the satisfaction of applicable regulatory authorities. In addition, certain types of operations, including exploration and development projects and changes to certain existing projects, may require the submission and approval of environmental impact assessments or permit applications. Compliance with environmental regulation can require significant expenditures, including expenditures for clean up costs and damages arising out of contaminated properties and failure to comply with environmental regulations may result in the imposition of fines and penalties. Although we are not the principal operator of most of our oil and gas projects, our communications with such operators have led us to believe that we are in substantial compliance with such laws and regulations, however, such laws and regulations may change in the future in a manner which will increase the burden and cost of compliance.
Certain laws and governmental regulations may impose liability on us for personal injuries, clean-up costs, environmental damages and property damages, as well as administrative, civil and criminal penalties. We maintain limited insurance coverage for sudden and accidental environmental damages, but do not maintain insurance coverage for the full potential liability that could be caused by sudden and accidental environmental damage. Accordingly, we may be subject to liability or may be required to cease production from properties in the event of such damages.
Interruption from Severe Weather
Presently, our operations are conducted principally in the central region of Alberta and in Saskatchewan. The weather can be extreme at times due to cold or rain which can cause interruption or delays in our drilling and construction operations.
C. Organizational Structure
The Company has no subsidiaries.
D. Property, Plants and Equipment
The Company is in the business of participating in various oil and gas drilling ventures in Alberta and Saskatchewan, by entering into Operating Agreements with other investors. Operating Agreements specify that each investors' ownership in the lands, wells and equipment is that of tenants-in-common. The following map sets forth the Company's more significant areas of activity:
17
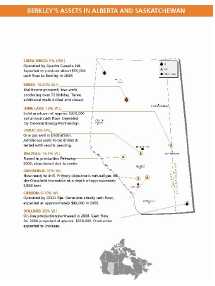
The following is a description of the various interests of the Company in its oil and gas properties as at June 1, 2008.
| Lease No. | Description |
|
| Interest |
|
| Status | ||
| Brazeau | Sec.13-46-13 W5M |
|
| 30.00% WI BPO |
|
| Written off | ||
|
| 19.50% WI APO |
|
| |||||
|
|
|
| ||||||
| Carbon |
|
|
|
| |||||
| 047790068 | Sec.29-29-22 W4M |
|
| 6%WI |
|
| Producing - gas | ||
| 32443 | Sec.32-29-22 W4M |
|
| 6.25%WI |
|
| Producing - gas | ||
| 25906 | Sec.28-29-22 W4M |
|
| 6.25%WI |
|
| Producing - gas | ||
| 0477010002 | Sec.31-29-22 W4M |
|
| 10%WI |
|
| Producing - gas | ||
|
|
|
| ||||||
| Crossfield | Twp 28 Rge 1 W5M |
|
| 35% WI |
|
| Licensing to drill | ||
|
|
|
| ||||||
| Dollard | Twp 6/7 Rge 19 W3M |
|
| 20% WI |
|
| Producing - oil | ||
|
|
|
| ||||||
| North Halkirk |
|
|
|
| |||||
| 34398 | S1/2 Sec.22-39-16 W4M |
|
| 6.25%WI |
|
| Producing – gas/oil | ||
| 26457 | N/2 Sec.22-39-16 W4M |
|
| 6.25%WI |
|
| Producing – gas/oil | ||
|
|
|
| ||||||
| John Lake |
|
|
|
| |||||
| 40852 | All Sec.26&27-55-1 W4M |
|
| 10%WI |
|
| Producing - gas | ||
Sec.1-56-1 W4M |
|
| 10%WI |
|
| Producing - gas | |||
| 485070102 | W/2 36-55-1 W4M |
|
| 10%WI |
|
| Producing - gas | ||
| 487040220 | E/2 Sec.36-55-1 W4M |
|
| 10%WI |
|
| Producing - gas | ||
| 40853A | All Sec.15-56-1-W4M |
|
| 10%WI |
|
| Producing - gas | ||
| 40855A | All Sec.24-56-1 W4M |
|
| 10%WI |
|
| Producing - gas | ||
| 40856 | All Sec.34-56-1 W4M |
|
| 10%WI |
|
| Producing - gas | ||
|
|
|
| ||||||
| Leduc |
|
|
|
| |||||
All Sec.33-49-26 W4M |
|
| 4% WI |
|
| Producing – gas |
18
| Lease No. | Description |
|
| Interest |
|
| Status | ||
NW/4 Sec 28-49-26 W4 |
|
| 4.27% WI |
|
| Standing - oil | |||
|
|
|
| ||||||
| Oyen |
|
|
|
| |||||
| 30364 | S/2 Sec.16-29-4 W4M |
|
| 1%WI |
|
| Not Producing | ||
|
|
|
| ||||||
| Senex | Twp 92/93 Rge 6/7 W5M |
|
| 15/20% WI |
|
| Producing - oil | ||
|
|
|
| Exploration | |||||
| Sibbald |
|
|
|
| |||||
| 39367 | Sec.2,4, E/2 9&10-28-1 W4M |
|
| 0.50%WI |
|
| Producing - gas | ||
| 0476122257 | W/2 9-28-1 W4M |
|
| 0.25%WI |
|
| Not Producing | ||
Sec.3-28-1 W4M |
|
| 0.25%WI |
|
| Not Producing | |||
| 29513 | S/2 Sec.15-28-1 W4M |
|
| 1.00%WI |
|
| Producing - gas | ||
| 6359A | N/2 Sec.15&S/2 Sec.22-28-1 |
|
| 1.00%WI |
|
| Not Producing | ||
|
|
|
| ||||||
| Skiff |
|
|
|
| |||||
| 0484080300 | NW1/4Sec.29-4-14 W4M |
|
| 10.526%WI |
|
| Producing - oil | ||
W1/2Sec.32-4-14 W4M |
|
| 5.26315% |
|
| Producing - oil | |||
| 048307070286 | SW/4 of Sec.5-5-14 |
|
| 5.50%WI |
|
| Producing - oil | ||
|
|
|
| ||||||
| Zama Virgo |
|
|
|
| |||||
| 092020380 | W/2 Sec.22-115-5 W6M |
|
| Sliding Scale |
|
| Producing - oil |
Productive Wells and Acreage
The following chart of the Company's total gross and net productive wells, expressed separately for oil and gas, and the total gross and net developed acres (i.e., acres spaced or assignable to productive wells) by the geographic areas is as at June 1, 2008.
| Total Gross | Total Net | ||||||||||||||
| Total Gross | Total Net | Target Oil | Developed | Developed | |||||||||||
| Geographic Region | Wells | Productive Wells | Or Gas | Acres | Acres | ||||||||||
| Alberta | 494 | 7.80 | both | 33,232 | 4,805 | ||||||||||
| Saskatchewan | 14 | 2.60 | oil | 1,280 | 237 |
Undeveloped Acreage
As at June 1, 2008, the amounts of undeveloped acreage, both leases and concessions, in the western Canada (Alberta) geographic area consists of 18,640 gross acres and 3,012 net acres. The remaining terms on the leases within those properties are variable. Producing leases continue for the duration of productive lives.
19
Drilling Activity
The following table explains the number of productive and dry exploratory or development wells drilled in the last three fiscal years. A dry well (hole) is an exploratory or a development well found to be incapable of producing either oil or gas in sufficient quantities to justify completion as an oil or gas well. A productive well is an exploratory or a development well that is not a dry well. The number of wells drilled refers to the number of wells (holes) completed at any time during the fiscal years, regardless of when drilling was initiated. The term "completion" refers to the installation of permanent equipment for the production of oil or gas, or, in the case of a dry hole, to the reporting of abandonment to the appropriate agency.
| Exploratory Wells Drilled | Development Wells Drilled | ||||||||||||||
| Geographic | Number of Net | Number of Net | Number of Net | Number of Net | |||||||||||
| Region | Year | Productive | Dry | Productive | Dry | ||||||||||
| Alberta | 2007 | Nil | Nil | Nil | Nil | ||||||||||
| 2006 | 1.80 | Nil | 1.80 | Nil | |||||||||||
| 2005 | 0.50 | Nil | 0.20 | Nil | |||||||||||
| Saskatchewan | 2007 | Nil | Nil | Nil | Nil | ||||||||||
| 2006 | Nil | Nil | Nil | Nil | |||||||||||
| 2005 | Nil | Nil | 0.18 | Nil | |||||||||||
Delivery Commitments
The Company has no obligation to provide a fixed and determinable quantity of oil or gas in the near future under existing contracts or agreements or material information concerning the estimated availability of oil and gas from any principal sources.See also Item 3. D. Risk Factors regarding quantity and price limitation by government agencies.
Reserves and Production
Reserves
The Company engages independent petroleum consultants to compile oil and gas reserve information with respect to its producing properties. Effective December 31, 2006, the Company had all of its major producing properties evaluated by AJM Petroleum Consultants who assigned total recoverable reserves to the Company's interest of 258,000 barrels of oil equivalent, or "boe": 20% was comprised of natural gas and 80% was comprised of oil and liquids. Natural gas is converted to boe at the industry standard rate of 6:1. The reduction in reserves from 2005 to 2006 was entirely related to our independent petroleum engineers assigning no economic reserves for our Slave Point zone in our Senex play this year.
The following table summarizes estimated net quantities of: (i) proved developed non-producing oil and gas reserves; and (ii) total proved developed oil and gas reserves. Please note that such estimates are inherently imprecise and are continually subject to revisions based on production history, results of additional exploration and development, prices of oil and gas, and other factors.
| December 31, 2007 | December 31, 2006 | December 31, 2005 | ||||||||||||||||
| Oil | Natural | Oil | Natural | Oil | Natural | |||||||||||||
| (barrels) | Gas (mcf) | (barrels) | Gas (mcf) | (barrels) | Gas (mcf) | |||||||||||||
| Proved, Developed Non- | ||||||||||||||||||
| Producing Reserves | 124,000 | 235,000 | 14,400 | 21,600 | Nil | 22,000 | ||||||||||||
| Total Proved and | ||||||||||||||||||
| Developed Reserves | 60,000 | 321,000 | 140,600 | 235,900 | 150,600 | 211,500 | ||||||||||||
Please note that the evaluation of the reserves was prepared in accordance with Canadian National Instrument 51-101. Proved developed oil and gas reserves are reserves that can be expected to be recovered through existing wells with existing equipment and operating methods. Proved developed reserves include additional oil and gas expected to be obtained through the application of fluid injection or other improved recovery techniques for supplementing the natural forces and mechanisms of primary recovery.
20
Production
The following table summarizes the quantities of net oil and of gas produced for each of the last three fiscal years.
| For the Period Ending | |||||||||
| December 31, 2007 | December 31, 2006 | December 31, 2005 | |||||||
| Oil (barrels) | 20,684 | 20,541 | 9,384 | ||||||
| Natural Gas (mcf) | 41,164 | 52,312 | 96,142 | ||||||
| Natural Gas Liquids | Nominal | Nominal | Nominal |
Item 5. Operating and Financial Review and Prospects
The following discussion and analysis of the operations, results and financial position of Berkley Resources Inc. (the “Company” or “Berkley”) for the period ended December 31, 2007 should be read in conjunction with the December 31, 2007 year-end financial statements and the related notes.
This Management Discussion and Analysis (“MD&A”) is dated April 29, 2008 and discloses specified information up to that date. Berkley is classified as a “venture issuer” for the purposes of National Instrument 51-102. The Company’s financial statements are prepared in accordance with generally accepted accounting principles in Canada. Unless otherwise cited, references to dollar amounts are in Canadian dollars.
We recommend that readers consult the “Cautionary Statement” on the last page of this report.
Description of Business
The Company’s principal business activities are the acquisition, development, exploration and production of petroleum and natural gas reserves in Alberta and Saskatchewan. The Company is a reporting issuer in British Columbia and Alberta and trades on the TSX Venture Exchange under the symbol BKS, on the OTC as a foreign issuer under the symbol BRKDF and on the Frankfurt Stock Exchange under the symbol W80 and WKN 871666.
Overall Performance
During the year ended December 31, 2007, the Company became a pure oil and gas company after the sale of the Company’s real estate assets in Vancouver, B.C. The Company used the proceeds of the sale to pay the Company’s outstanding corporate debt and the balance was used for exploration and working capital purposes.
Oil and Gas Industry Overview
The oil and gas industry has gone through a turbulent time over the last 18 months even with record prices. Berkeley believes the current market position will benefit oil and gas junior companies like Berkley. Oil prices fluctuated between $51 US and $119.38 US per barrel from January 1, 2007 to April 22, 2008 with prices closing at $119.38 US on April 22, 2008 ($ per barrel for West Texas Intermediate (WTI)). Natural gas prices have also been very volatile through the last 15 months fluctuating between $5.50/mcf US and $10.50 US during this same time closing, at $10.20 US on April 22, 2008. Cost of all related services have been high for 2007 although rig utilization in Alberta is down and should translate into reduced drilling costs for 2008.
21
Company Activity
Senex Area, Alberta (Townships. 92/93, Ranges 6/7 W5M):
Berkley (20% ±) and its operating partner Onefour Energy Ltd. (80% ±) have approximately 70 sections. These land holdings will provide the Company with a very large block on which to develop all three productive formations identified to date. The formations are: Keg River (oil), Slave Point (oil) and Blue Sky (gas).
During the year ended December 31, 2007, the Company and its partner changed their focus on this program and concentrated on stabilizing production from the Keg River producing wells while the capital program was put on hold.
As of April 29, 2008, the Company has an unresolved dispute with its partner with respect to the Senex area operations that is subject to a default notice. Several items in this account are disputed by the Company. The outcome of this dispute is undeterminable at this time.
Crossfield West Area, Alberta (Township 28, Range 1 W5M):
The licensing process of this sour-gas prospect is stalled. The Company (35%) and its partners have negotiated extensions to certain of its freehold leases which will maintain our existing drilling lease block of six sections. The Company’s licensing hearing has been postponed and the Company is waiting to schedule a new hearing.
Summary
The Company has made a major commitment to the Senex Area in north-central Alberta. Large resources of oil have been identified in two Devonian formations and a significant natural gas reserve in shallow lower Cretaceous sand. As stated above, we are currently focused on stabilizing our Keg River producers. The licensing process at Crossfield has been postponed and the Company is working towards a new hearing date.
Real Estate
The Company sold its real estate property in downtown Vancouver for $4 million on August 31, 2007. From the proceeds, $3.3 million was used to pay the Company’s outstanding corporate debt and the balance was used for exploration and working capital purposes. This property had been disclosed as discontinued operations in the December 31, 2006 year end and subsequent financial statements.
22
Selected Annual Information
The following financial data is derived from the Company’s financial statements for the three most recently completed financial years:
| December 31, | December 31, | December | |||||||
| 2007 | 2006 | 31, 2005 | |||||||
| $ | $ | $ | |||||||
| Total oil and gas revenues | 1,715,924 | 1,568,681 | 1,408,858 | ||||||
| Loss for the year before discontinued operations | (5,380,576 | ) | (3,068,631 | ) | (467,346 | ) | |||
| Discontinued operations | 1,854,654 | (168,128 | ) | (55,112 | ) | ||||
| Loss per share before discontinued operations | (0.27 | ) | (0.21 | ) | (0.05 | ) | |||
| Loss per share after discontinued operations | (0.18 | ) | (0.22 | ) | (0.05 | ) | |||
| Total assets | 5,771,772 | 11,896,679 | 9,991,350 | ||||||
| Total liabilities | 1,136,797 | 4,597,314 | 2,485,865 | ||||||
| Working capital (Deficit) | (683,930 | ) | (3,189,632 | ) | (99,421 | ) |
Total oil and gas revenues increased by $147,243 over the 2006 fiscal year. Included in discontinued operations for fiscal 2007 was a gain on the sale of the building of $1,949,368. The increase in total assets from fiscal 2005 to fiscal 2006 was largely due to the Company raising cash through equity and debt financing and using those funds in developing its oil and gas properties during fiscal 2006. Expansion of new oil and gas properties was actually $2,381,576, net of a write-down of $4,083,000 and amortization, depletion and accretion of $1,428,068. Total assets in fiscal 2005 have been restated as a result of a reduction in that year’s write-down of $1,400,000 to oil and gas properties. The result is an increase in total assets of $1,400,000 and a decrease in the loss for the year of the same amount. Total assets incurred a dramatic decrease of $6,124,907 in fiscal 2007 and ended with a total of $5,771,772. There were two significant factors causing this decline. In fiscal 2007, there was a current year write-down of $4,083,000 in oil and gas properties and the sale of the real estate assets, which had a carrying cost of $2,038,924 in the prior year, has removed that asset from the balance sheet.
Total liabilities increased by $2,111,449 from fiscal 2005 to fiscal 2006 due in large part to the Company acquiring a loan of $2,800,000 from Quest Capital Corp. and settling the $1,500,000 loan from IMOR Capital Corp. and increasing its loan with the CIBC from $322,146 to $577,612. In the following year, fiscal 2007, these liabilities were fully settled with the proceeds from the sale of the building. This caused liabilities to significantly drop during that period. The Company now has no long term debt except for an asset retirement obligation of $140,150.
Results of Operations
Three months ended December 31, 2007 (“Q4-2007”) compared with the three months ended December 31, 2006 (“Q4-2006”).
Oil and Gas
Oil and gas revenue was $472,254 for Q4-2007 compared to $378,287 for Q4-2006, an increase of $93,967. The increase in revenue is due primarily to higher oil prices. The production expenses for Q4-2007 were higher at $4,954,896 compared to $3,290,316 for Q4-2006, an increase of $1,664,580. There were decreases of $28,883 in operating costs and $50,815 in interest charges while there were increases of $46,278 in amortization, depletion and accretion and $1,698,000 in write-downs of oil and gas properties. The demand for labour, services and equipment has continued to put upward pressure on prices but the Company had less operating activity during the current year. The reduction in interest charges are due to no loans existing in Q4-2007. There was a net loss of $4,482,642 for Q4-2007 compared to $2,912,029 reported for Q4-2006, an increase of $1,570,613. The increase in oil and gas property write-downs in Q4-2007 accounts for most of the difference.
23
Head Office - General and Administrative Expenses
General and administrative expenses totaled $176,405 for Q4-2007 compared with $156,329 for Q4-2006. The increase of $20,076 is a combination of cost increases and decreases. Increases of $11,946 in administrative, office services and premises, $13,829 in stock based compensation and $11,953 in professional fees. There were decreases of $2,483 in management fees, $2,011 in consulting fees, $11,243 in filing and transfer agent fees, and $1,367 in shareholder information. Administrative, office services and premises expenses increased in Q4-2007 due to the tax owing on the renouncement of flow-through expenditures using the look-back rule. Professional fees increased as a result of higher audit fees. Filing and transfer agent fees were lower as a result of a reclassification of $8,820 to share issuance costs which were associated with a private placement. Both comparative quarters each had a recapture of $134,247 in financing fees on debt. Q4-2006 had an adjustment of this amount which deferred the financing fees to the 2007 fiscal year. In 2007 however, there was an adoption of a new accounting policy concerning financial instruments which required the amount of $134,247 to be applied against the opening deficit instead of being recorded as part of the 2007 operations.
Real Estate (Discontinued Operations)
There was a net rental gain before other items of $7,430 for Q4-2007 compared to a net rental loss before other items of $33,905 for Q4-2006, a difference of $41,335. While the building continued to be at or near full capacity in Q4-2006, there were interest charges on long term debt of $47,039 which turned a net gain into a loss. In Q4-2007, there were no real estate operations and no long term debt subject to interest charges but instead year end adjustments associated with the finalization of the sale. Otherwise, monthly operating costs stayed pretty consistent along with monthly revenues in Q4-2006. There was no amortization recorded for either quarter due to the status of the asset being changed to that of an asset being held for sale during the 2006 fiscal year.
There were no other income or expense items so the net gain or loss for the comparative quarters did not change from their net rental gains before other items.
Loss for the Period
There was a loss for Q4-2007 of $3,786,130 compared with a loss of $2,060,027 for Q4-2006, a difference of $1,726,103. As noted above, there were losses in all three segments in both Q4-2007 and Q4-2006. The write-downs to oil and gas properties in both comparative quarters played the primary role in determining the net losses.
Twelve months ended December 31, 2007 (“2007”) compared with the twelve months ended December 31, 2006 (“2006”).
Oil and Gas
In total, there was a net oil and gas loss of $4,946,721 for 2007, compared to $2,867,336 for 2006, an increase of $2,079,385. Revenue was up $147,243 due to higher oil prices but operating costs were up by $188,738. Production expenses increased by $2,226,628 in 2007. As was the case above in the fourth quarter comparison the year end ceiling test write-downs of the oil and gas properties caused the significant losses. Overall there were increases in of $188,738 in operating costs, $74,612 in interest on loans, $265,278 in amortization, depletion and accretion, and 1,698,000 in write-downs.
24
Head Office - General and Administrative Expenses
General and administrative costs for 2007 were $1,253,810 compared to $1,256,996 for 2006, a decrease of $3,186. There were increases of $15,439 in administrative, office services and premises, $41,855 in stock based compensation, $59,171 in management fees, and $19,317 in shareholder information. The administrative, office services and premises expense was higher in 2007 due to taxes associated with flow-through expenditure renouncements using the look-back rule. Management fees were higher due to the timing of bonus payments otherwise base management fees did not change very much. Shareholder information costs were higher due to increased efforts to raise company awareness through promotional materials and trade show participation.
In 2007, there were decreases of $69,105 in consulting fees, $3,406 in professional fees, $61,753 in finance fees on debt, and $4,600 in filing and transfer agent fees. Consulting fees were lower due to the expiration of some financial consulting agreements in the current year whereas these agreements were in effect for a longer period of time in the prior year. Filing and transfer agent fees were lower due to a smaller private placement in 2007 compared to 2006 and the reclassification of some TSX Venture Exchange fees to share issuance costs in 2007. The finance fees on debt in fiscal 2007 was nil instead of $134,247 because of the adoption of a new financial instruments accounting policy as explained in the fourth quarter comparative section above.
Real Estate (Discontinued Operations)
The net rental loss before other items for 2007 was $94,714 compared to $168,128 in 2006, a decrease of $73,414. The real estate operations wrapped up at the end of August 2007 and as such, 2007 had four fewer months of rental revenue and operating costs. Otherwise, monthly revenues and operating costs remained fairly consistent and the building was at or near capacity. As was the case with the three month comparison, the current period’s interest charges were considerably less with the full settlement of all outstanding long term debt with the building sale proceeds.
Overall, there was a net income for 2007 of $1,854,654 compared to a net loss of $168,128 in 2006, a positive difference of $2,022,782. Once again, the gain from the sale of the building of $1,949,368 created a net income situation for the current period instead of a loss.
Loss for the Period
There was an overall loss of $3,525,922 for 2007 compared with $3,236,759 for 2006, an increase of $289,163. Both comparative years had significant write-downs in the oil and gas properties but the increase in write-down in the current year was more than offset by the gain on the sale of the building.
25
Summary of Quarterly Results
| Period Ended | 2007 | 2007 | 2007 | 2007 | 2006 | 2006 | 2006 | 2006 |
| Dec 31 Q4 $ | Sep 30 Q3 $ | June 30 Q2 $ | Mar 31 Q1 $ | Dec 31 Q4 $ | Sep 30 Q3 $ | Jun 30 Q2 $ | Mar 31 Q1 $ | |
| Net oil and gasincome (loss) | (4,482,642) | (281,167) | (142,153) | (40,759) | (2,912,029) | 19,890 | (51,335) | 76,138 |
| Discontinuedoperations | (17,913) | 1,941,312 | (42,015) | (26,730) | (33,905) | (64,441) | (36,694) | (33,088) |
| Income (loss)for the period | (3,786,130) | 1,228,718 | (590,577) | (377,933) | (2,060,027) | (504,034) | (404,968) | (267,730) |
| Basic anddiluted income(loss) per shareafterdiscontinuedoperations | (0.07) | 0.06 | (0.03) | (0.02) | (0.13) | (0.04) | (0.03) | (0.02) |
Liquidity
At December 31, 2007 the Company had current assets of $312,718, of which $47,058 was comprised of cash. Current liabilities totaled $996,647, of which there is no longer bank loans included since the sale of the real estate property. Current assets were used to further investment in oil and gas properties and equipment by $2,381,576 in 2007.
Total working capital deficiency at December 31, 2007 is $683,930. This amount has been drastically reduced from a deficiency balance of $3,189,632 on December 31, 2006 due to the proceeds from the sale of the real estate property being used to pay out a bank demand loan of $539,749 and a loan of $2,800,000 to Quest.
The Company is addressing its’ working capital needs by pursuing additional equity financing. During the twelve month period ended December 31, 2007, the Company raised $1,400,100 with a flow-through private placement and $264,000 with a non-flow-through private placement. The Company also has an agreement with a financial consultant to explore other financial opportunities.
Capital Resources
The Company plans to continue its participation in the two projects discussed above. The Company expects to finance expenditures on these projects through private placements, existing production revenue and a farm out of a portion of its property interests (if required). In addition, the Company may make further oil and gas expenditures on new properties as finances permit.
Off-Balance Sheet Arrangements
The Company has no off-balance sheet arrangements.
Related Party Transactions
Amounts owing to related parties at December 31, 2007 consists of $7,000 (2006 - $16,651) due to Directors of the Company for Directors fees and expense reimbursements; and $7,261 (2006 - $51,782) to Oniva International Services Corp. (“Oniva”), a private company owned by public companies having common Directors that provides administrative services, office supplies and accounting services.
26
Management and consulting fees totalling $296,999 were paid to Directors and their private companies in 2007 (2006: $237,828).
Consulting fees totalling $16,000 were paid to a former Director and his spouse in 2007 (2006: $96,000). The consulting fees made in 2007 concluded a five year agreement
During the year, current and/or former Directors and/or Officers exercised nil options (2006: nil options for total proceeds of $Nil). In addition, current and/or former Directors and Officers subscribed for nil shares of the Company for total proceeds of $Nil (2006: 145,500 shares of the Company for total proceeds of $130,950).
Administrative services, office supplies and accounting charges totalling $110,161 were paid to Oniva (2006: $113,865). The Company takes part in a cost sharing arrangement to reimburse Oniva for a variable percentage of its overhead expenses, to reimburse 100% of its out-of-pocket expenses incurred on behalf of the Company, and to pay a percentage fee based on the total overhead and corporate expenses. The agreement may be terminated with one-month notice by either party.
The transactions were in the normal course of operations and agreed to by the related party and the Company and have had been measured at the exchange amount.
Disclosure of Management Compensation
During the year, $104,999 (2006: $69,328) was paid to the President for services as director and officer of the Company, $102,000 (2006: $66,000) was paid to the C.E.O. for services as director and officer of the Company, $32,000 (2006: $42,500) was paid to the V.P. Finance for services as director and officer of the Company, $60,000 (2006: $60,000) was paid to the V.P. Operations for services as director and officer of the Company, and $11,072 (2006: $11,692) was paid to the Secretary for services as an officer of the Company.
Changes in Accounting Policies
Effective January 1, 2007, the Company adopted the following new accounting standards issued by the Canadian Institute of Chartered Accountants (“CICA”). These accounting policy changes were adopted on a prospective basis with no restatement of prior period financial statements:
Section 1530Comprehensive Income
Section 3251Equity
Section 3855Financial Instruments – Recognition and Measurement
Section 3861Financial Instruments – Disclosure and Presentation
Section 3865Hedges
These standards address the classification, recognition and measurement of financials instruments, the inclusion of other comprehensive income, and establish the standards for hedge accounting. Upon the adoption of these new standards the Company had no available-for-sale investments. There were no other opening adjustments recorded on the adoption of these standards. The Company has determined that there is no affect of these new standards on its current year financial statements and has not yet determined its affect on subsequent year’s financial statements.
27
Financial Instruments
Section 3855 requires all financial assets and liabilities, including derivatives, to be carried at fair value on the Company’s balance sheet with the exception of loans and receivables, investments that are intended to be held to maturity and non-trading financial liabilities which are carried at cost or amortized cost.
The Company has reviewed and classified its financial instruments as follows:
- Cash is classified as a financial asset held for trading and is measured at its fair value. Gains or losses related to periodic revaluation are recorded to net income or loss.
- Accounts receivable are classified as loans and receivables and are initially measured at their fair value. Subsequent periodic revaluations are recorded at their amortized cost using the effective interest rate method.
- Accounts payable, accrued liabilities and revolving credit facility are classified as other liabilities and are initially measured at fair value. Subsequent periodic revaluations are recorded at their amortized cost using the effective interest rate method.
On January 1, 2007, the Company also adopted CICA Section 1506Accounting Changes, which expands requirements relating to voluntary changes in accounting principles, and requires the Company to disclose new sources of GAAP that have been issued but are not yet effective. The Company has not made any voluntary changes in accounting principles affecting these financial statements.
Outstanding Share Data
The Company’s authorized share capital consists of unlimited common shares without par value.
As at December 31, 2007 and April 29, 2008 the Company had 21,451,608 issued and outstanding common shares.
The following is a summary of stock options outstanding as at December 31, 2007 and April 29,2008:
Expiry Date | Exercise Price Per Share | Number of Shares Remaining Subject to Options |
| September 19, 2008 | $0.52 | 580,500 |
| September 19, 2008 | $0.57 | 150,000 |
| October 19, 2009 | $0.81 | 200,000 |
| October 29, 2009 | $0.77 | 37,500 |
| December 23, 2010 | $0.90 | 637,500 |
| September 21, 2011 | $0.56 | 595,000 |
| July 4, 2012 | $0.55 | 350,000 |
| 2,550,500 |
28
The following is a summary of share purchase warrants outstanding as at December 31, 2007 and April 29, 2008:
| Expiry Date | Exercise Price Per Share | Number of Underlying Shares |
| January 12, 2009 | $1.00 | 220,000 |
Commitment
As at December 31, 2007, $1,400,100 of eligible Canadian exploration expenditures had not yet been expended by the Company. The Company is committed to spend this amount on qualifying expenditures by December 31, 2008.
Disclosure Controls and Procedures
The Chief Executive Officer and the Chief Financial Officer of the Company are responsible for evaluating the effectiveness of the Company’s disclosure controls and procedures and have concluded, based on our evaluation, that they are effective as at December 31, 2007 to ensure that information required to be disclosed in reports filed or submitted under Canadian securities legislation is recorded, processed, summarized and reported within the time period specified in those rules and regulations.
Internal Controls over Financial Reporting
The Chief Executive Officer and the Chief Financial Officer of the Company are responsible for designing internal controls over financial reporting, or causing them to be designed under their supervision, to provide reasonable assurance regarding the reliability of financial reporting and the preparation of financial statements for external purposes in accordance with Canadian GAAP. The Company assessed the design of the internal controls over financial reporting as at December 31, 2007 and concluded that there are material weaknesses in internal controls over financial reporting, which are as follows:
| a) | Due to the limited number of staff resources, the Company believes there are instances where a lack of segregation of duties exist to provide effective controls; and | |
| b) | Due to the limited number of staff resources, the Company may not have the necessary in- house knowledge to address complex accounting and tax issues that may arise. |
The weaknesses and their related risks are not uncommon in a company the size of the Company because of limitations in size and number of staff. The Company believes it has taken steps to mitigate these risks by consulting outside advisors and involving the Audit Committee and Board of Directors in reviews and consultations where necessary. However, these weaknesses in internal controls over financial reporting could result in a more than remote likelihood that a material misstatement would not be prevented or detected. The Company believes that it must take additional steps to further mitigate these risks by consulting outside advisors on a more regular and timely basis.
There have been no changes in the Company’s internal controls over financial reporting that occurred during the quarter ended December 31, 2007 that have materially affected, or are reasonably likely to materially affect, the Company’s internal controls over financial reporting.
Additional Information
Additional information relating to the Company is available on SEDAR atwww.sedar.com.
29
| Cautionary Statement This MD&A is based on a review of the Company’s operations, financial position and plans for the future based on facts and circumstances as of April 22, 2008. Except for historical information or statements of fact relating to the Company, this document contains “forward-looking statements” within the meaning of applicable Canadian securities regulations. There can be no assurance that such statements will prove to be accurate, and future events and actual results could differ materially from those anticipated in such statements. Important factors that could cause actual results to differ materially from our expectations are disclosed in the Company’s documents filed from time to time via SEDAR with the Canadian regulatory agencies to whose policies we are bound. Forward-looking statements are based on the estimates and opinions of management on the date the statements are made, and we do not undertake any obligation to update forward-looking statements should conditions or our estimates or opinions change. These statements involve known and unknown risks, uncertainties, and other factor that may cause the Company’s actual results, levels of activity, performance or achievements to be materially different from any future results, levels of activity, performance or achievement expressed or implied by these forward-looking statements. |
Item 6. Directors, Senior Management and Employees
A. Directors and Senior Management
The following is a list of the Company's directors and officers as at December 31, 2007.
|
| Principal Occupation, Business or |
|
| Director/Officer | ||||
| Name | Position Held |
|
| Employment for the Last Five Years |
|
| Since | ||
| Louis Wolfin(1)(2)(3) | Director and Former Chief Executive Officer |
|
| Mining Executive; Chief Executive Officer and Director of Bralorne Gold Mines Ltd., President and Director of Coral Gold Resources Ltd., Director of Avino Silver & Gold Mines Ltd., Chief Executive Officer and Director of Levon Resources Ltd. and Director of Cresval Capital Corp. |
|
| 1986 – June 2007 | ||
| Matt Wayrynen(1) | Chief Executive Officer, Executive Chairman and Director |
|
| Corporate Executive; Vice-President of Coral Gold Resources Ltd., VP, Operations, Director of Quinto Technology Inc., Director of Bralorne Gold Mines Ltd., Retired Real Estate and Investment Adviser. |
|
| June 2002 - Present | ||
| Lloyd Andrews | Chairman and Director |
|
| Retired Businessman; Director of Coral Gold Resources Ltd.; Director of Bralorne Gold Mines Ltd. and Director of Avino Silver & Gold Mines Ltd. |
|
| June 2002 – Present | ||
| James O’Byrne | Director and VP Operations |
|
| Oil and Gas Consultant; President of O’Byrne Resource Management Ltd. |
|
| June 2003- Present | ||
| Lindsay E. Gorrill | President, Chief Operating Officer and Director |
|
| Corporate Executive; Chief Financial Officer of Coral Gold Resources Ltd.; Former President and Chief Executive Officer of WGI Heavy Minerals Incorporated; Manager, KPMG. |
|
| July 2004-Present | ||
| David Wolfin(3) | Director and VP Finance |
|
| Mining Executive; Director and VP Finance of |
|
| June 2005 - |
30
|
| Bralorne Gold Mines Ltd., Director of Coral Gold Resources Ltd., Director and President of Avino Silver & Gold Mines Ltd., Director of Mill Bay Ventures Inc., Director and President of Gray Rock Resources Ltd. Director of Cresval Capital Corp. and Director of Levon Resources Ltd. |
|
| Present | ||||
| Ronald Andrews | Director |
|
| Owner and operator of Andrews Orchards from 1972 to present, Director of North Coast Live Insurance Company. |
|
| June 2005 - Present | ||
| Phillip Piffer | Director |
|
| President and CEO of Genesis Fueltech Inc. from June 2001 to present. |
|
| November 2005 - Present | ||
| Tyrone Docherty | Director |
|
| President, Chief Executive Officer and Director of Quinto Technology Inc. from 1997 to present. |
|
| August 2006 – Present | ||
| Mimy Fernandez- Maldonado | Corporate Secretary |
|
| Officer of six other reporting issuers; Former Corporate Secretary of three other reporting issuers. |
|
| September 2007- Present |
| (1) | Mr. Matt Wayrynen is the son-in-law of Mr. Louis Wolfin. | |
| (2) | Mr. Louis Wolfin did not stand for re-election to the board at the annual general meeting of shareholders held on June 12, 2007 and is no longer on the board of directors of the Company. | |
| (3) | Mr. David Wolfin is the son of Mr. Louis Wolfin. | |
B. Compensation
Compensation of Directors
Each director of the Company who receives less than $3,000 per month is compensated $500 per quarter in their capacities as directors during the most recently completed financial year. The Chairman of each committee is also paid an additional $500 per quarter. The management directors of the Company have not been paid fees or other cash compensation in their capacity as directors. The Company has no arrangements, standard or otherwise, pursuant to which its directors are compensated by the Company or its subsidiaries for their services in their capacity as directors, or for committee participation, or involvement in special assignments during the fiscal year ended December 31, 2007, except that directors may be reimbursed for actual expenses reasonably incurred in connection with the performance of their duties as directors and certain directors may be compensated for services as consultants or experts. The Company paid an aggregate of $102,000 to Wear Wolfin Designs Ltd., a private BC corporation controlled by the spouse of Matt Wayrynen, the Chief Executive Officer, Executive Chairman and a director of the Company for management advisory services. The Company paid an aggregate of $60,000 to O’Byrne Resource Management Ltd., a private Alberta corporation controlled by Jim O’Byrne, the VP Operations and a director of the Company for management advisory services. The Company paid an aggregate of $30,000 to Intermark Capital Corp, a BC private corporation controlled by David Wolfin, VP Finance and a director of the Company for management advisory services. The Company paid an aggregate of US$104,999 to Lindsay Gorrill, the Chief Operating Officer, President and a director of the Company for management advisory services. Incentive stock options, have been granted to non-executive directors and other insiders of the Company and are outstanding to purchase an aggregate of 2,147,500 common shares of the Company as follows:
31
| Exercise Price Per | ||||||||
| Name of Optionee | No. of Shares | Share | Date of Grant | Expiry Date | ||||
| Lloyd J. Andrews | 172,500 | $0.52 | September 19, 2003 | September 19, 2008 | ||||
| 45,000 | $0.90 | December 23, 2005 | December 23, 2010 | |||||
| 100,000 | $0.55 | July 4, 2007 | July 4, 2012 | |||||
| James O'Byrne | 50,000 | $0.52 | September 19, 2003 | September 19, 2008 | ||||
| 20,000 | $0.81 | October 19, 2004 | October 19, 2009 | |||||
| 100,000 | $0.90 | December 23, 2005 | December 23, 2010 | |||||
| 50,000 | $0.56 | September 21, 2006 | September 21, 2011 | |||||
| Matt Wayrynen | 300,000 | $0.52 | September 19, 2003 | September 19, 2008 | ||||
| 50,000 | $0.90 | December 23, 2005 | December 23, 2010 | |||||
| 100,000 | $0.56 | September 21, 2006 | September 21, 2011 | |||||
| 80,000 | $0.55 | July 4, 2007 | July 4, 2012 | |||||
| Lindsay Gorrill | 50,000 | $0.81 | October 19, 2004 | October 19, 2009 | ||||
| 150,000 | $0.90 | December 23, 2005 | December 23, 2010 | |||||
| 100,000 | $0.56 | September 21, 2006 | September 21, 2011 | |||||
| 120,000 | $0.55 | July 4, 2007 | July 4, 2012 | |||||
| Ron Andrews | 50,000 | $0.81 | October 19, 2004 | October 19, 2009 | ||||
| 50,000 | $0.90 | December 23 2005 | December 23, 2010 | |||||
| David Wolfin | 50,000 | $0.52 | September 19, 2003 | September 19, 2008 | ||||
| 150,000 | $0.57 | November 26, 2003 | September 19, 2008 | |||||
| 50,000 | $0.56 | September 21, 2006 | September 26, 2011 | |||||
| Phillip Piffer | 50,000 | $0.90 | December 23, 2005 | December 23, 2010 | ||||
| 50,000 | $0.56 | September 21, 2006 | September 26, 2011 | |||||
| Tyrone Docherty | 30,000 | $0.56 | September 21, 2006 | September 21, 2011 | ||||
| 1,967,500 |
No pension plan or retirement benefit plans have been instituted by the Company and none are proposed at this time.
The Company does not have an employment Contract with its executive officers, and there are no contractual provisions for termination of employment or change in responsibilities.
The following table sets forth particulars concerning the compensation of the Company's executives for the Company's calendar year ended December 31, 2007.
32
| Summary Compensation Table | ||||||||||||||
| Annual Compensation | Long-Term Compensation Awards | |||||||||||||
| Securities Under | Restricted | |||||||||||||
| Name/Principal | Bonus for | Other Annual | Options/SARs | Shares/Units | All Other | |||||||||
| Position | Year | Salary(1) | the Year | Compensation | Granted(2) | Awarded | Compensation | |||||||
| $ | $ | $ | # | # | $ | |||||||||
| Matt Wayrynen | 2007 | 72,000 | 30,000 | Nil | 530,000 | Nil | 1,230 | |||||||
| Chief Executive | 2006 | 66,000 | Nil | Nil | 450,000 | Nil | 1,504 | |||||||
| Officer and | 2005 | 60,000 | 40,000 | Nil | 350,000 | Nil | 1,389 | |||||||
| Executive | ||||||||||||||
| Chairman | ||||||||||||||
| Lindsay Gorrill | 2007 | 64,999 | 40,000 | Nil | 420,000 | Nil | Nil | |||||||
| President and | 2006 | 69,327 | Nil | Nil | 300,000 | Nil | Nil | |||||||
| Chief Operating | 2005 | 11,392 | 30,000 | Nil | 200,000 | Nil | Nil | |||||||
| Officer | ||||||||||||||
| (1) | No executive officer earned in excess of $150,000. | |
| (2) | Represents total common shares under option as of the end of the calendar year. | |
C. Board Practices
As of December 31, 2007, the board of directors of the Company consisted of eight directors: Matt Wayrynen, Lloyd J. Andrews, Tyrone Docherty, James O'Byrne, Lindsay Gorrill, David Wolfin, Ronald Andrews and Phillip Piffer. Each of the directors will serve until the next annual general meeting of shareholders. The officers of the Company are elected by the board and serve at the pleasure of the board. The size and experience of the board is important for providing the Company with effective governance. The board’s mandate and responsibilities can be effectively and efficiently administered through the five directors. The chairman of the board is not a member of management. The board has functioned, and is of the view that it can continue to function, independently of management as required.
The board has considered the relationships of each director to the Company and considers four of the eight directors to be "unrelated" (Messrs. L.J. Andrews, R. Andrews, Docherty and Piffer). "Unrelated director", means a director who is independent of management and free from any interest and any business or other relationship which could reasonably be perceived to materially interfere with the director’s ability to act with a view to the best interest of the Company, other than interest and relationships arising solely from shareholdings.
Messrs. Matt Wayrynen and David Wolfin are related family members. Messrs. Lloyd J. Andrews and Ronald Andrews are also related family members.
Procedures are in place to allow the board to function independently. The board has experienced directors that have made a significant contribution to the Company’s success, and are satisfied that it is not constrained in its access to information, in its deliberations or in its ability to satisfy the mandate established by law to supervise the business and affairs of the Company. The Company’s chairman and independent directors meet in the absence of managing directors. Committees meet independent of management and other directors. Committees appoint a chairman from their number who presides over the committee meetings.
33
Mandate of the Board of Directors, its Committees and Management
The role of the board is to oversee the conduct of the Company’s business, including the supervision of management, and determining the Company’s strategy. Management is responsible for the Company’s day to day operations, including proposing its strategic direction and presenting budgets and business plans to the board of directors for consideration and approval. The strategic plan takes into account, among other things, the opportunities and risks of the Company’s business. Management provides the board with periodic assessments as to those risks and the implementation of the Company’s systems to manage those risks. The board reviews the personnel needs of the Company from time to time, having particular regard to succession issues relating to senior management. Management is responsible for the training and development of personnel. The board assesses how effectively the Company communicates with shareholders, but has not adopted a formal communications policy. Through the audit committee, the board assesses the adequacy of the Company’s internal control and management information systems. The board looks to management to keep it informed of all significant developments relating to or effecting the Company’s operations. Major financings, acquisitions, dispositions and investments are subject to board approval. A formal mandate for the board of directors and the chief executive officer has not been considered necessary since the relative allocation of responsibility is well understood by both management and the board.
The board has established that they will meet at a minimum of every three months, unless additional meetings are required. The board and committees may take action at these regularly held meetings or at a meeting by conference call or by written consent.
Committees
Audit Committee
The audit committee assists the board in its oversight of the Company’s financial statements and other related public disclosures, the Company’s compliance with legal and regulatory requirements relating to financial reporting, the external auditors, qualifications and independence and the performance of the internal audit function and the external auditors. The committee has direct communications channels with the Company’s auditors. The committee reviews the Company’s financial statements and related management’s discussion and analysis of financial and operating results. The committee can retain legal, accounting or other advisors.
The audit committee consists of three directors (Messrs. Piffer, R. Andrews, and David Wolfin) two of whom are independent (Messrs. Piffer and R. Andrews), meaning that the member has no direct or indirect material relationship with the Company, which could, in the view of the board of directors, reasonably interfere with the exercise of a member's judgment. Each of the members of the audit committee is financially literate, and has accounting or related financial expertise. "Financially literate" means the ability to read and understand a set of financial statements that present a breadth of complexity of accounting issues that are generally comparable to the breadth and complexity of the issues that can reasonably be expected to be raised by the Company's financial statements. "Accounting or related financial expertise" means the ability to analyze and interpret a full set of financial statements, including the notes attached thereto, in accordance with Canadian GAAP.
It is intended that this committee will eventually be comprised solely of unrelated directors.
The board has adopted a charter for the audit committee which is reviewed annually and sets out the role and oversight responsibilities of the audit committee with respect to:
- its relationship with and expectation of the external auditors, including the establishment of the independence of the external auditor and the approval of any non-audit mandates of the external auditor;
- determination of which non-audit services the external auditor is prohibited from providing;
34
- the engagement, evaluation, remuneration, and termination of the external auditors;
- appropriate funding for the payment of the auditor’s compensation and for any advisors retained by the audit committee;
- its relationship with and expectation of the internal auditor;
- its oversight of internal control;
- disclosure of financial and related information; and
- any other matter that the audit committee feels is important to its mandate or that which the board chooses to delegate to it.
Compensation Committee
The board also has a compensation committee. The compensation committee recommends to the board the compensation of the Company's directors and the Chief Executive officer which the compensation committee feels is suitable. Its recommendations are reached primarily by comparison of the remuneration paid by the Company with publicly available information on remuneration paid by other reporting issuers that the committee feels are similarly placed within the same business of the Company. As of June 28, 2008, the compensation committee was comprised of Ronald Andrews, Lloyd J. Andrews and Matt Wayrynen.
Corporate Governance Committee
The corporate governance committee of the board manages the corporate governance system of the board and assists the board in fulfilling its duties to meet applicable legal, regulatory and self-regulatory business principles and codes of best practice. As of June 28, 2008 the corporate governance committee consisted of Lloyd J. Andrews, Ronald Andrews, Matt Wayrynen and Phillip Piffer.
D. Employees
The Company has no full time employees.
E. Share Ownership
The following table sets for the share ownership of the directors and officers of the Company as of June 20, 2008.
| Name of Beneficial Owner | Number of Shares | Percent | ||||
| Matt Wayrynen(1) | 1,300,356 | 6.06% | ||||
| Lloyd Andrews | 325,500 | 1.52% | ||||
| James O'Byrne | 50,000 | 0.23% | ||||
| Lindsay Gorrill | 78,000 | 0.36% | ||||
| David Wolfin | 80,300 | 0.37% | ||||
| Ronald Andrews | 108,500 | 0.51% | ||||
| Phillip Piffer | Nil | Nil | ||||
| Tyrone Docherty | Nil | Nil | ||||
| Kelly Hyslop | Nil | Nil | ||||
| Lisa Sharp | Nil | Nil | ||||
| Mimy Fernandez-Maldonado | Nil | Nil | ||||
| All Officers and Directors as a Group (nine in number) | 1,942,656 | 9.06% |
| 1 | 1,009,556 shares are held by his spouse. | |
35
On June 27, 2006, the shareholders approved the 2006 Stock Option Plan, which we refer to as the "Plan". The Plan provided for the grant of incentive stock options to insiders, employees, and other service providers to the Company for up to 2,837,000 common shares. To date, stock options to purchase a total of up to 2,545,000 shares have been granted under the plan, leaving options for 292,000 shares available for issuance.
Options Granted to Directors and Officers During the Fiscal Year
| Securities | Exercise | Purchase | ||||||||||
| Name of Director/Officer | Under Option | Price | Price, if any | Expiration Date | ||||||||
| Lindsay Gorrill | 120,000 | $ 0.55 | N/A | 07/04/12 | ||||||||
| Lloyd J. Andrews | 100,000 | $ 0.55 | N/A | 07/04/12 | ||||||||
| Matt Wayrynen | 180,000 | $ 0.55 | N/A | 07/04/12 |
Item 7. Major Shareholders and Related Party Transactions
A. Major Shareholders
As far as it is known to the Company, it is not directly or indirectly owned or controlled by any other corporation or by the Canadian Government or any foreign government, or by any other natural or legal person.
The following sets forth, as at June 20, 2008, the share ownership of directors, officers and persons known to the Company to own beneficially five percent (5%) or more of the outstanding shares of each class of the Company's voting securities. The Company's major shareholders do not have different voting rights and there are no arrangements known to the Company which may at a subsequent date result in a change of control of the Company.
| Name | Number of Shares of Common Stock Owned | Percent of Class | ||||
| Matt Wayrynen | 1,300,356(1) | 6.06% |
| (1) | 1,009,556 shares (4.71%) are held by his spouse. | |
B. Related Party Transactions
There is no amount due from related parties.
Due to related parties consists of $7,000 (2006 - $16,651) due to Directors of the Company for Directors’ fees and expense reimbursements and $7,261 (2006 - $51,782) to a private company owned by public companies having common Directors that provides administrative services, office supplies and accounting services.
Management and consulting fees totaling $296,999 were paid to Directors and their private companies in 2007 (2006: $237,828).
In 2006, current and/or former Directors and Officers subscribed for 145,500 shares of the Company for total proceeds of $130,950.
Consulting fees totaling $16,000 were paid to a former Director and his spouse in 2007 (2006: $96,000).
36
Administrative services, office supplies and accounting charges totaling $110,161 were paid to Oniva International Services Corporation (“Oniva”), a private company owned by public companies having common Directors (2006: $113,865).
The Company takes part in a cost sharing arrangement to reimburse Oniva for a variable percentage of its overhead expenses, to reimburse 100% of its out-of-pocket expenses incurred on behalf of the Company, and to pay a percentage fee based on the total overhead and corporate expenses. The agreement may be terminated with one-month notice by either party.
The transactions were in the normal course of operations and agreed to by the related parties and the Company and have had been measured at the exchange amount.
C. Interests of Experts and Counsel
Not Applicable.
Item 8. Financial Information
A. Financial Statements and Other Financial Information
| 1. | The following financial statements of the Company are attached to this Annual Report: |
Auditors' Report. | |
| 2. | The Company has never paid any dividends and does not intend to in the near future. |
B. Significant Changes
On September 5, 2007 the Company announced that it had completed the previously announced sale of the Company’s real estate assets consisting of an office building located at 455 Granville Street, Vancouver, BC to Pender-Granville Properties Limited Partnership (the “Purchaser”). The Company received $4,000,000 gross proceeds from the sale.
On June 3, 2008 the Company announced that it had arranged a non-brokered private placement of up to 2,800,000 units at a price of $0.18 per unit, each unit consisting of one common share and one non-transferrable share purchase warrant. Each warrant will entitle the investor to purchase one additional share at a price of $0.30 during the first year of closing. The net proceeds of the offering will be used for additional exploration and development work and for general working capital requirements. This transaction will be subject to regulatory approval.
37
On July 11, 2008 the Company announced the sale of twenty-five (25%) percent participation in its Crossfield Project to an individual, in an arms length transaction, for the sum of $300,000. The Company estimates that it will cost approximately $6,000,000 to licence, drill, complete and tie-in the first of four wells planned for this Project. Each of the subsequent three wells are expected to cost about $5,000,000 for total exposure to 100% interest being $20/22,000,000. The new Participant is a well financed individual, experienced in oil and gas investments. He will be a significant asset to the Crossfield Project. The Company now holds between 35% and 50% interest in this Project which is a well defined, seismically controlled, sour-gas prospect in the Crossfield member of the Wabamun formation. This is the same formation that has produced nearly 1 tcf (one trillion cubic feet) of its projected 1.8 tcf of natural gas reserves from the giant Crossfield gas field situated two to five miles east of the Berkley et al prospect which in turn is about 25 miles north of the City of Calgary.
The Company now plans to move forward with the licencing process which will include a public hearing later this year. Success there would enable the parties to commence drilling during the first quarter, 2009.
Item 9. The Offer and Listing
A. Offer and Listing Details
As of December 31, 2007, 3.11% of the Company's outstanding common stock was registered in the names of United States residents. There were, as of December 31, 2007, 32 record holders in the United States. The Company's common stock is issued in registered form and the percentage of shares reported to be held by record holders in the United States is taken from the records of Computershare Trust Company of Canada in the city of Vancouver, the registrar and transfer agent for the common stock.
The high and low prices expressed in Canadian dollars on the TSX Venture Exchange for the Company's common stock for the last six months, for each quarter for the last two fiscal years, and for the five most recent fiscal years is as follows:
| TSX Venture Exchange | ||||||
| (Canadian Dollars) | ||||||
| Last Six Months | High | Low | ||||
| May 2008 | 0.21 | 0.16 | ||||
| April 2008 | 0.20 | .018 | ||||
| March 2008 | 0.18 | .015 | ||||
| February 2008 | 0.20 | .015 | ||||
| January 2008 | 0.21 | 0.14 | ||||
| December 2007 | 0.23 | 0.16 | ||||
| 2007 | High | Low | ||||
| Fourth Quarter | 0.41 | 0.16 | ||||
| Third Quarter | 0.65 | 0.38 | ||||
| Second Quarter | 0.74 | 0.55 | ||||
| First Quarter | 0.91 | 0.51 | ||||
| 2006 | ||||||
| Fourth Quarter | 0.93 | 0.65 | ||||
| Third Quarter | 0.76 | 0.61 | ||||
| Second Quarter | 1.08 | 0.66 | ||||
| First Quarter | 1.10 | 0.70 | ||||
38
| TSX Venture Exchange | ||||||
| (Canadian Dollars) | ||||||
| Five Most Recent Fiscal Years | ||||||
| December 31, 2007 | 0.91 | 0.16 | ||||
| December 31, 2006 | 1.10 | 0.61 | ||||
| December 31, 2005 | 1.50 | 0.66 | ||||
| December 31, 2004 | 1.50 | 0.72 | ||||
| December 31, 2003 | 0.80 | 0.40 | ||||
B. Plan of Distribution
Not Applicable.
C. Markets
The Company's common stock is listed in Canada on the TSX Venture Exchange under the symbol "BKS", in the United States on the Pink Sheets under the symbol "BRKDF" and in Germany on the Frankfurt Stock Exchange under the symbol "W8O" and "WKN 87166".
D. Selling Shareholders
Not Applicable.
E. Dilution
Not Applicable.
F. Expenses of the Issue
Not Applicable.
Item 10. Additional Information
A. Share Capital
Not Applicable.
B. Memorandum and Articles of Association
Fortune Island Mines Ltd., which was incorporated on the first day of February, 1966, under the name Fortune Island Mines Ltd. (N.P.L.), under Certificate No. 68018, which converted to a limited company Fortune Island Mines Ltd., on the eight day of July, 1982, and Kerry Mining Ltd., which was incorporated on the 26th day of February, 1973, under the name Kerry Mining Ltd. (N.P.L.),under Certificate No. 116112, which converted to a limited company Kerry Mining Ltd., on the seventh day of July, 1982, and the Company, which was incorporated on the 29th day of January, 1974, under the name Trevlac Resources, Inc., under Certificate No. 124754 and subsequently changed its name to Berkley Resources Inc., on the 30th day of July, 1976, were amalgamated on July 18, 1986, pursuant to the Company Act as one company with the name Berkley Resources Inc.
39
Common Shares
All issued and outstanding common shares are fully paid and non-assessable. Each holder of record of common shares is entitled to one vote for each common share so held on all matters requiring a vote of shareholders, including the election of directors. The holders of common shares will be entitled to dividends on a pro-rata basis, if and when as declared by the board of directors. There are no preferences, conversion rights, preemptive rights, subscription rights, or restrictions or transfers attached to the common shares. In the event of liquidation, dissolution, or winding up of the Company, the holders of common shares are entitled to participate in the assets of the Company available for distribution after satisfaction of the claims of creditors.
Powers and Duties of Directors
The directors shall manage or supervise the management of the affairs and business of the Company and shall have authority to exercise all such powers of the Company as are not, by the Business Corporations Act of British Columbia or by the Articles of Incorporation, required to be exercised by the Company in a general meeting.
Directors will serve as such until the next annual meeting. In general, a director who is, in any way, directly or indirectly interested in an existing or proposed contract or transaction with the Company whereby a duty or interest might be created to conflict with his duty or interest as a director, shall declare the nature and extent of his interest in such contract or transaction or the conflict or potential conflict with his duty and interest as a director. Such director shall not vote in respect of any such contract or transaction with the Company in which he is interested and if he shall do so, his vote shall note be counted, but he shall be counted in the quorum present at the meeting at which such vote is taken. However, notwithstanding the foregoing, directors shall have the right to vote on determining the remuneration of the directors.
The directors may from time to time on behalf of the Company: (a) borrow money in such manner and amount from such sources and upon such terms and conditions as they think fit; (b) issue bonds, debentures and other debt obligations; and (c) mortgage, charge or give other security on the whole or any part of the property and assets of the Company.
The majority of the directors of the Company must be persons ordinarily resident in Canada and one director of the Company must be ordinarily resident in British Columbia. There is no age limitation, other than the statutorily prescribed minimum age requirement of 18 years, or minimum share ownership, for the Company's directors.
Shareholders
An annual general meeting shall be held once in every calendar year at such time and place as may be determined by the directors. A quorum at an annual general meeting and special meeting shall be two shareholders or one shareholder and a proxy holder representing another shareholder. There is no limitation imposed by the laws of Canada or by the charter or other constituent documents of the Company on the right of a non-resident to hold or vote the common shares, other than as provided in the Investment Canada Act, referred to as the "Investment Act", discussed below under "Item 10. Additional Information, D. Exchange Controls."
In accordance with British Columbia law, directors shall be elected by an "ordinary resolution" which means (a) a resolution passed by the shareholders of the Company at a general meeting by a simple majority of the votes cast in person or by proxy; or (b) a resolution that has been submitted to the shareholders of the Company who would have been entitled to vote on it in person or by proxy at a general meeting of the Company and that has been consented to in writing by such shareholders of the Company holding shares carrying not less than the prescribed majority of the votes entitled to be cast on it.
40
Under British Columbia law certain items such as an amendment to the Company's articles or entering into a merger, requires approval by a special resolution which shall mean (a) a resolution passed by a majority of not less than the prescribed majority of the votes cast by the shareholders of the Company who, being entitled to do so, vote in person or by proxy at a general meeting of the company; and (b) a resolution consented to in writing by every shareholder of the Company who would have been entitled to vote in person or by proxy at a general meeting of the Company, and a resolution so consented to is deemed to be a special resolution passed at a general meeting of the Company.
C. Material Contracts
Other than as otherwise disclosed in this Annual Report, the Company has not entered into any material contracts.
D. Exchange Controls
There is no law, governmental decree or regulation in Canada that restricts the export or import of capital or affects the remittance of dividends, interest or other payments to a non-resident holder of common shares other than withholding tax requirements. Any such remittances to United States residents are subject to withholding tax. See "Taxation".
There is no limitation imposed by the laws of Canada or by the charter or other constating documents of the Company on the right of a non-resident to hold or vote the common shares, other than as provided in the Investment Act. The following discussion summarizes the principal features of the Investment Act for a non-resident who proposes to acquire the common shares.
The Investment Act generally prohibits implementation of a reviewable investment by an individual, government or agency thereof, corporation, partnership, trust or joint venture, each referred to as an "entity", each an "entity" that is not a "Canadian" as defined in the Investment Act, referred to as a "non-Canadian", unless after review, the Director of Investments appointed by the minister responsible for the Investment Act is satisfied that the investment is likely to be of net benefit to Canada. An investment in the common shares by a non-Canadian other than a "WTO Investor" (as that term is defined by the Investment Act, and which term includes entities which are nationals of or are controlled by nationals of member states of the World Trade Organization) when the Company was not controlled by a WTO Investor, would be reviewable under the Investment Act if it was an investment to acquire control of the Company and the value of the assets of the Company, as determined in accordance with the regulations promulgated under the Investment Act, equals or exceeds $5 million for direct acquisition and over $50 million for indirect acquisition, or if an order for review was made by the federal cabinet on the grounds that the investment related to Canada's cultural heritage or national identity, regardless of the value of the assets of the Company. An investment in the common shares by a WTO Investor, or by a non-Canadian when the Company was controlled by a WTO Investor, would be reviewable under the Investment Act if it was an investment to acquire control of the Company and the value of the assets of the Company, as determined in accordance with the regulations promulgated under the Investment Act, was not less than a specified amount, which for 2006 is any amount in excess of $265 million. A non-Canadian would acquire control of the Company for the purposes of the Investment Act if the non-Canadian acquired a majority of the common shares. The acquisition of one third or more, but less than a majority of the common shares, would be presumed to be an acquisition of control of the Company unless it could be established that, on the acquisition, the Company was not controlled in fact by the acquirer through the ownership of the common shares.
41
Certain transactions relating to the common shares would be exempt from the Investment Act, including: (i) an acquisition of the common shares by a person in the ordinary course of that person's business as a trader or dealer in securities; (ii) an acquisition of control of the Company in connection with the realization of security granted for a loan or other financial assistance and not for a purpose related to the provisions of the Investment Act; and (iii) an acquisition of control of the Company by reason of an amalgamation, merger, consolidation or corporate reorganization following which the ultimate direct or indirect control in fact of the Company, through the ownership of the common shares, remained unchanged.
E. Taxation
Canadian Federal Income Tax Consequences
The following summarizes the principal Canadian federal income tax consequences applicable to the holding and disposition of common shares in the capital of the Company by a United States resident, and who holds common shares solely as capital property, referred to as a "U.S. Holder". This summary is based on the current provisions of the Income Tax Act (Canada), referred to as the "Tax Act", the regulations thereunder, all amendments thereto publicly proposed by the government of Canada, the published administrative practices of Revenue Canada, Customs, Excise and Taxation, and on the current provisions of the Canada-United States Income Tax Convention, 1980, as amended, referred to as the "Treaty". Except as otherwise expressly provided, this summary does not take into account any provincial, territorial or foreign (including without limitation, any United States) tax law or treaty. It has been assumed that all currently proposed amendments will be enacted substantially as proposed and that there is no other relevant change in any governing law or practice, although no assurance can be given in these respects.Each U.S. Holder is advised to obtain tax and legal advice applicable to such U.S. Holder's particular circumstances.
Every U.S. Holder is liable to pay a Canadian withholding tax on every dividend that is or is deemed to be paid or credited to the U.S. Holder on the U.S. Holder's common shares. The statutory rate of withholding tax is 25% of the gross amount of the dividend paid. The Treaty reduces the statutory rate with respect to dividends paid to a U.S. Holder for the purposes of the Treaty. Where applicable, the general rate of withholding tax under the Treaty is 15% of the gross amount of the dividend, but if the U.S. Holder is a company that owns at least 10% of the voting stock of the Company and beneficially owns the dividend, the rate of withholding tax is 5% for dividends paid or credited after 1996 to such corporate U.S. Holder. The Company is required to withhold the applicable tax from the dividend payable to the U.S. Holder, and to remit the tax to the Receiver General of Canada for the account of the U. S. Holder.
Pursuant to the Tax Act, a U.S. Holder will not be subject to Canadian capital gains tax on any capital gain realized on an actual or deemed disposition of a common share, including a deemed disposition on death, provided that the U.S. Holder did not hold the common share as capital property used in carrying on a business in Canada, and that neither the U. S. Holder nor persons with whom the U.S. Holder did not deal at arms length (alone or together) owned or had the right or an option to acquire 25% or more of the issued shares of any class of the Company at any time in the five years immediately preceding the disposition.
42
United States Tax Consequences
Passive Foreign Investment Companies
The Treaty essentially calls for taxation of shareholders by the shareholder's country of residence. In those instances in which a tax may be assessed by the other country, a corresponding credit against the tax owed in the country of residence is generally available, subject to limitations.
Under Section 1296 of the Internal Revenue Code of the United States, referred to as the "Code", a foreign investment corporation is treated as a passive foreign investment company, referred to as a "PFIC", if it earns 75% or more of its gross income from passive sources or if 50% or more of the value of its assets produce passive income. The Company has not been a PFIC for United States federal income tax purposes for prior taxable years and believes that it will not be treated as a PFIC for the current and future taxable years, but this conclusion is a factual determination made annually and subject to change.
Controlled Foreign Corporations
Sections 951 through 964 and Section 1248 of the Code relate to controlled foreign corporations, referred to as "CFCs". A foreign corporation that qualifies as a CFC will not be treated as a PFIC with respect to a shareholder during the portion of the shareholder's holding period after December 31, 1997, during which the shareholder is a 10% United States shareholder and the corporation is a CFC. The PFIC provisions continue to apply in the case of PFIC that is also a CFC with respect to shareholders that are less than 10% United States shareholders.
The 10% United States shareholders of a CFC are subject to current United States tax on their pro rata shares of certain income of the CFC and their pro-rata shares of the CFC's earnings invested in certain United States property. The effect is that the CFC provisions may impute some portion of such a corporation's undistributed income to certain shareholders on a current basis and convert into dividend income some portion of gains on dispositions of stock which would otherwise qualify for capital gains treatment.
The Company does not believe that it will be a CFC. Even if the Company were classified as a CFC in a future year, however, the CFC rules referred to above would apply only with respect to 10% shareholders.
Personal Holding Company/Foreign Personal Holding Company/Foreign Investment Company
A corporation will be classified as a personal holding company, referred to as a "PHC", if at any time during the last half of a tax year: (i) five or fewer individuals (without regard to their citizenship or residence) directly or indirectly or by attribution own more than 50% in value of the corporation's stock; and (ii) at least 60% of its ordinary gross income, as specially adjusted, consists of personal holding company income (defined generally to include dividends, interest, royalties, rents and certain other types of passive income). A PHC is subject to a United States federal income tax of 39.6% on its undistributed personal holding company income (generally limited, in the case of a foreign corporation, to United States source income).
A corporation will be classified as a foreign personal holding company, referred to as an "FPHC", and not a PHC, if at any time during a tax year: (i) five or fewer individual United States citizens or residents directly or indirectly or by attribution own more than 50% of the total combined voting power or value of the corporation's stock; and (ii) at least 60% of its gross income consists of foreign personal holding company income (defined generally to include dividends, interest, royalties, rents and certain other types of passive income). Each United States shareholder in a FPHC is required to include in gross income, as a dividend, an allocable share of the FPHC's undistributed foreign personal holding company income (generally the taxable income of the FPHC, as specially adjusted).
43
A corporation will be classified as a foreign investment company, referred to as an "FIC", if for any taxable year it: (i) is registered under the Investment Company Act of 1940, as amended, as a management company or share investment trust or is engaged primarily in the business of investing or trading in securities or commodities (or any interest therein); and (ii) 50% or more of the value or the total combined voting power of all the corporation's stock is owned directly or indirectly (including stock owned through the application of attribution rules) by United States persons. In general, unless an FIC elects to distribute 90% or more of its taxable income (determined under United States tax principles as specially adjusted) to its shareholders, gain on the sale or exchange of FIC stock is treated as ordinary income (rather than capital gain) to the extent of such shareholder's ratable share of the corporation's earnings and profits for the period during which such stock was held.
The American Job Creation Act of 2004 repealed these rules. The Company was not a PHC, FPHC or FIC.
Other Consequences
To the extent a shareholder is not subject to the tax regimes outlined above with respect to foreign corporations that are PFIC, PHC, FPHC or FIC, the following discussion describes the United States federal income tax consequences arising from the holding and disposition of the Company's Common Shares.
U.S. Holders
A "U.S. Holder" includes a holder of common shares who is a citizen or resident of the United States, a corporation created or organized in or under the laws of the United States or of any political subdivision thereof and any other person or entity whose ownership of common shares is effectively connected with the conduct of a trade or business in the United States. A U.S. Holder does not include persons subject to special provisions of federal income tax laws, such as tax exempt organizations, qualified retirement plans, financial institutions, insurance companies, real estate investment trusts, regulated investment companies, broker-dealers, non-resident alien individuals or foreign corporations whose ownership of common shares is not effectively connected with the conduct of a trade or business in the United States and shareholders who acquired their stock through the exercise of employee stock options or otherwise as compensation.
Distribution of Common Shares
U.S. Holders receiving dividend distributions (including constructive dividends) with respect to the Company's common shares are required to include in gross income for United States federal income tax purposes the gross amount of such distribution to the extent that the Company has current or accumulated earnings or profits, without reduction for any Canadian income tax withheld from such distributions. Such Canadian tax withheld may be credited, subject to certain limitations, against the U.S. Holder's United States federal income tax liability or, alternatively, may be deducted in computing the U.S. Holder's United States federal income tax by those who itemize deductions. (See more detailed discussions at "Foreign Tax Credit" below). To the extent that distributions exceed current or accumulated earnings and profits of the Company, they will be treated first as a return of capital up to the U.S. Holder's adjusted basis in the common shares and thereafter as a gain from the sale or exchange of such shares. Preferential tax rates for the long-term capital gains are applicable to a U.S. Holder that is an individual, estate or trust. There are currently no preferential tax rates for long-term capital gains for a U.S. Holder which is a corporation.
44
Dividends paid on the Company's common shares will not generally be eligible for the dividends received deduction provided to corporations receiving dividends from certain United States corporations. A U.S. Holder which is a corporation may, under certain circumstances, be entitled to a 70% deduction of the United States source portion of dividends received from the Company if such U.S. Holder owns shares representing at least 10% of the voting power and value of the Company.
Foreign Tax Credit
A U.S. Holder who pays (or has withheld from distribution) Canadian income tax with respect to the ownership of the Company's common shares may be entitled, at the option of the U.S. Holder, to either a deduction or a tax credit for such foreign tax paid or withheld. Generally, it will be more advantageous to claim a tax credit, because a credit reduces United States federal income taxes on a dollar-for-dollar basis, while a deduction merely reduces the taxpayer's income subject to tax. This election is made on a year-by-year basis and generally applies to all foreign income taxes paid by (or withheld from) the U.S. Holder during that year. There are significant and complex limitations which apply to the credit, among which is the general limitation that the credit cannot exceed the proportionate share of the U.S. Holder's United States income tax liability that the U.S. Holder's foreign source income bears to his or its worldwide taxable income. In the determination of the application of this limitation, the various items of income and deduction must be classified into foreign and domestic sources. Complex rules govern this classification process. There are further limitations on the foreign tax credit for certain types of income, such as "passive income", "high withholding tax interest", "financial services income", "shipping income" and certain other classifications of income. The availability of foreign tax credit and the application of the limitations on the credit are fact specific and holders and prospective holders of common shares should consult their own tax advisors regarding their individual circumstances.
Disposition of Common Shares
A U.S. Holder will recognize gain and loss upon the sale of the common shares equal to the difference, if any, between: (i) the amount of cash plus the fair market value of any property received; and (ii) the shareholder's tax basis in the common shares. The gain or loss will be capital gain or loss if the shares are a capital asset in the hands of the U.S. Holder, and will be a short-term or long-term capital gain or loss depending on each U.S. Holder's holding period. Gains and losses are netted and combined according to special rules in arriving at the overall capital gain or loss for a particular tax year. Deductions for net capital losses are subject to significant limitations. For U.S. Holders who are individuals, any unused portion of such net capital loss may be carried over to be used in later tax years until such net capital loss is thereby exhausted. For U.S. Holders which are corporations (other than corporations subject to Subchapter S of the Code), an unused capital loss may be carried back three years from the loss year and carried forward five years from the loss year to be offset against capital gains until such net capital loss is thereby exhausted.
The foregoing discussion is based upon the sections of the Code, Treasury Regulations, published Internal Revenue Service rulings, published administrative positions of the Internal Revenue Service and court decisions that are currently applicable, any or all of which could be materially adversely changed, possibly on a retroactive basis, at any time. In addition, this discussion does not consider the potential effects, both adverse and beneficial, of recently proposed legislation which, if enacted could be applied, possibly on a retroactive basis, at any time. A holder or prospective holder of the Company's common shares should consult his or her own tax advisors about federal, state local and foreign tax consequences of purchasing, owning and disposing of the common shares of the Company.
45
F. Dividends and Paying Agents
Not Applicable.
G. Statement by Experts
Not Applicable.
H. Documents on Display
The Company files annual reports and other information with the SEC. You may read and copy any document that we file at the SEC's Public Reference Room at 100F Street, N.E., Washington, D.C. 20549 or on its website at www.sec.gov. Please call the SEC at 1-800-SEC-0330 for more information about the Public Reference Room. The Company also files its annual reports and other information with the Canadian Securities Administrators via SEDAR at www.sedar.com.
Copies of the Company's material contracts are kept in the Company's administrative headquarters.
I. Subsidiary Information
None.
Item 11. Quantitative and Qualitative Disclosures About Market Risk
Not Applicable.
Item 12. Description of Securities Other than Equity Securities
Not Applicable.
Part II
Item 13. Defaults, Dividend Arrearages and Delinquencies
None.
Item 14. Material Modifications to the Rights of Security Holders and Use of Proceeds
None.
Item 15. Controls and Procedures
The Company carried out an evaluation under the supervision, and with the participation, of the Company’s management, including the Company’s chief executive officer and principal financial officer, of the effectiveness of the design and operation of the Company’s disclosure controls and procedures pursuant to Rule 13(a)-15(b) of the Securities Exchange Act of 1934, as amended. Based upon that evaluation, the Company’s chief executive officer and principal financial officer concluded that the Company’s disclosure controls and procedures as of the end of the fiscal year covered by this Form 20-F are:
| 1. | effective in timely alerting them to information relating to the Company required to be included in this Form 20-F; and |
| 2. | effective in ensuring that information required to be disclosed by the issuer in the reports that it files or submits under the Act is recorded, processed, summarized and reported, within the time periods specified in the Commission’s rules and forms. |
46
Item 16A. Audit Committee Financial Expert
The board of directors determined that Mr. Phillip Piffer is qualified as an Audit Committee Financial Expert. Mr. Piffer is independent as determined by the NASD listing standards.
Item 16B. Code of Ethics
The Company has not currently adopted a code of ethics but is evaluating its internal procedures to determine the necessity of same.
Item 16C. Principal Accountant Fees and Services
The independent auditor for the fiscal year ended December 31, 2007 and for the fiscal year ended December 31, 2006 was Meyers Norris Penny LLP.
Audit Fees
The aggregate fees billed by the Company’s external auditors for professional services rendered for the audit of the Company's annual financial statements for the fiscal year ended December 31, 2007 was $56,500 and December 31, 2006 was $67,400.
Audit-Related Fees
The aggregate fees billed for assurance and related services by the principal accountant that are reasonably related to the performance of the audit or review of the Company's financial statements for the year ended December 31, 2007 was $7,150 and December 31, 2006 was $2,148.
Tax Fees
The aggregate fees billed for tax compliance, tax advice and tax planning rendered by our independent auditors for the fiscal year ended December 31, 2007 was $2,900 and December 31, 2006 was $2,022. The services comprising these fees were in conjunction with the preparation of corporate tax returns and taxation advisory services.
All Other Fees
Other than referred to above, there were no aggregate fees billed for professional services rendered by the Company’s independent auditors for the fiscal years ended December 31, 2007 and December 31, 2006.
The audit committee approved 100% of the fees paid to the principal accountant for audit-related, tax and other fees in the fiscal year 2007. The audit committee pre-approves all non-audit services to be performed by the auditor in accordance with the Audit Committee Charter. No time was expended on the principal accountant's engagement to audit the Company's financial statements for the most recent fiscal year that were attributed to work performed by persons other than the principal accountant's full-time, permanent employees.
47
Item 16D. Exemptions from the Listing Standards for Audit Committees
Not applicable.
Item 16E. Purchases of Equity Securities by the Issuer and Affiliated Purchasers
None.
48
Part III
Item 17. Financial Statements
The following Financial Statements pertaining to the Company are filed as part of this annual report:
| Auditors' Report | 53 |
| Balance Sheets | 54 |
| Statements of Operations | 55 |
| Statements of Deficit | 56 |
| Statements of Cash Flows | 57 |
| Notes to Financial Statements. | 58 thru 79 |
Item 18. Financial Statements
See Item 17.
Item 19. Exhibits
| 1. | Audited Financial Statements and Financial Statement Schedules: | |
| Auditors' Report | 53 | |
| Balance Sheets | 54 | |
| Statements of Operations | 55 | |
| Statements of Deficit | 56 | |
| Statements of Cash Flows | 57 | |
| Notes to Financial Statements. | 58 thru 79 | |
| 2. | Exhibits | |
| Exhibit Number | Name | |
| 1. | Memorandum of Berkley Resources Inc.* | |
| 2. | Articles of Berkley Resources Inc.* | |
| 12.1 | Certification of the Principal Executive Officer under the Sarbanes-Oxley Act | |
| 12.2 | Certification of the Principal Financial Officer under the Sarbanes-Oxley Act | |
| 13.1 | Certificate of the Principal Executive Officer under section 906 | |
| 13.2 | Certificate of the Principal Financial Officer under section 906 | |
| 15.1 | Consent of Experts |
| * Previously filed. | |
| 1 See Note 18 of the financial statements included elsewhere in this Annual Report (Item 17) | |
2 Subsequent to the year end, the Company entered into an agreement to sell its real estate assets in Vancouver, British Columbia, such assets are now disclosed as Discontinued operations, see Note 2 of the financial statements included elsewhere in this Annual Report (Item 17) | |
49
SIGNATURE
The registrant hereby certifies that it meets all of the requirements for filing on Form 20-F and that it has duly caused and authorized the undersigned to sign this annual report on its behalf.
| BERKLEY RESOURCES INC. | |
| Dated: July 14, 2008 | By:/s/ Matt Wayrynen |
| Matt Wayrynen, Chief Executive Officer and | |
| Executive Chairman |
50

BERKLEY RESOURCES INC.
Financial Statements
DECEMBER 31, 2007 and 2006
Canadian Funds
Index
Statements of Operations and Comprehensive Loss
51
MANAGEMENT’S RESPONSIBILITY FOR FINANCIAL REPORTING
The accompanying financial statements are the responsibility of, and have been prepared by, the management of Berkley Resources Inc. in accordance with Canadian generally accepted accounting principle in Canada with a reconciliation to generally accepted accounting principles in the United Sates. When alternative methods exist, the Company has chosen those that it deems most appropriate in the circumstances, in order to ensure that the financial statements are presented fairly in all respects
To fulfill this responsibility, the Company maintains appropriate systems of internal control, policies and procedures. These systems of internal control, policies and procedures help ensure that the Company’s reporting practices and accounting and administrative procedures provide reasonable assurance that the financial information is relevant, reliable, and accurate, and that assets are safeguarded and transactions are executed in accordance with proper authorization. Where appropriate, these financial statements reflect estimates based on judgments of management.
Meyers Norris Penny LLP, the independent auditors appointed by Berkley Resources Inc.’s shareholders, have examined the financial statements of the Company. The independent auditors’ responsibility is to express a professional opinion on the fairness of the financial statements. The auditors’ report outlines the auditors’ opinion and the scope of their examination and their report follows.
The financial statements have also been reviewed by the Directors of Berkley Resources Inc. and by its Audit Committee. The Audit Committee is comprised of independent directors, and meets periodically during the year with the independent auditors and management. The independent auditors have full and unrestricted access to the Audit Committee.
| “Signed” | “Signed” |
| Matthew Wayrynen | Lindsay Gorrill |
| Executive Chairman and Chief Executive Officer | President and Chief Operating Officer |
| April 18, 2008 |
52
To the shareholders of Berkley Resources Inc.:
We have audited the balance sheets of Berkley Resources Inc. as at December 31, 2007 and 2006 and the statements of operations and comprehensive loss, deficit and cash flows for the years then ended. These financial statements are the responsibility of the Company’s management. Our responsibility is to express an opinion on these financial statements based on our audits.
We conducted our audits in accordance with Canadian generally accepted auditing standards and the standards of the Public Company Accounting Oversight Board (United States). These standards require that we plan and perform an audit to obtain reasonable assurance whether the financial statements are free of material misstatement. The Company is not required to have, nor were we engaged to perform, an audit of its internal control over financial reporting. Our audit included consideration of internal control over financial reporting as a basis for designing audit procedures that are appropriate in the circumstances, but not for the purpose of expressing an opinion on the effectiveness of the Company’s internal control over financial reporting. An audit includes examining, on a test basis, evidence supporting the amounts and disclosures in the financial statements. An audit also includes assessing the accounting principles used and significant estimates made by management, as well as evaluating the overall financial statement presentation.
In our opinion, these financial statements present fairly, in all material respects, the financial position of the Company as at December 31, 2007 and 2006 and the results of its operations and its cash flows for the years then ended in accordance with Canadian generally accepted accounting principles.
The financial statements as at and for the year ended December 31, 2005, prior to the adjustment for certain error corrections as described in Note 17, were audited by the other auditors, who expressed an opinion without reservation on these statements in their report dated April 10, 2006. We have audited the adjustments to the 2005 financial statements and in our opinion, such adjustments, in all material respects, are appropriate and have been properly applied.
| Calgary, Canada | MEYERS NORRIS PENNY LLP |
| April 18, 2008 | Independent Registered Chartered Accountants |
Comments by Independent Registered Chartered Accountants on Canada - United States of America Reporting Differences
The standards of the Public Company Accounting Oversight Board (United States) require the addition of explanatory paragraphs (following the opinion paragraph) when the financial statements are affected by conditions and events that cast substantial doubt on the Company’s ability to continue as a going concern, such as those described in Note 1 to the financial statements. Our report to the shareholders dated April 18, 2008 is expressed in accordance with Canadian reporting standards which do not require a reference to such conditions and events in the report of the independent registered chartered accountants when these are properly accounted for and adequately disclosed in the financial statements.
| Calgary, Canada | MEYERS NORRIS PENNY LLP |
| April 18, 2008 | Independent Registered Chartered Accountants |
53
| BERKLEY RESOURCES INC. | ||||||
BALANCE SHEETS | ||||||
| December 31, 2007 and 2006 | ||||||
| As at | 2007 | 2006 | ||||
| ASSETS | ||||||
| Current Assets | ||||||
| Cash | $ | 47,057 | $ | 498,246 | ||
| Accounts receivable | 247,372 | 607,436 | ||||
| Taxes recoverable | 12,168 | 16,145 | ||||
| Prepaid expenses | 6,120 | 15,933 | ||||
| Deferred financing fees | - | 134,247 | ||||
| 312,717 | 1,272,007 | |||||
| Oil and gas properties and equipment(Note 5) | 5,456,007 | 8,581,024 | ||||
| Other property and equipment(Note 6) | 3,048 | 4,724 | ||||
| Assets of discontinued operations(Note 2) | - | 2,038,924 | ||||
| 5,459,055 | 10,624,672 | |||||
| $ | 5,771,772 | $ | 11,896,679 | |||
| LIABILITIES | ||||||
| Current Liabilities | ||||||
| Accounts payable and accrued liabilities | $ | 982,386 | $ | 1,015,594 | ||
| Due to related parties (Note 12b) | 14,261 | 68,433 | ||||
| Bank loans and liabilities of discontinued operations (Note 2 and 7) | - | 3,377,612 | ||||
| 996,647 | 4,461,639 | |||||
| Asset Retirement Obligation(Note 8) | 140,150 | 135,675 | ||||
| 1,136,797 | 4,597,314 | |||||
| Going concern (Note 1) | ||||||
| Commitment (Note 14) | ||||||
| Correction of error (Note 17) | ||||||
| Subsequent event (Note 18) | ||||||
| SHAREHOLDERS' EQUITY | ||||||
| Share Capital(Note 9) | 12,347,593 | 11,577,934 | ||||
| Contributed Surplus(Note 10) | 1,030,532 | 804,412 | ||||
| Deficit | (8,743,150 | ) | (5,082,981 | ) | ||
| 4,634,975 | 7,299,365 | |||||
| $ | 5,771,772 | $ | 11,896,679 |
| Approved by the Directors: | |||
| “Matt Wayrynen” | Director | “Lindsay Gorrill” | Director |
The accompanying notes form an integral part of these financial statements.
54
BERKLEY RESOURCES INC. | |||||||||
STATEMENTS OF OPERATIONS AND COMPREHENSIVE LOSS | |||||||||
For the Years Ended December 31 | |||||||||
| 2007 | 2006 | 2005 | |||||||
| (Restated) | |||||||||
| OIL AND GAS REVENUE | $ | 1,715,924 | $ | 1,568,681 | $ | 1,408,858 | |||
| Oil and gas production expenses | |||||||||
| Operating costs | 1,017,313 | 828,575 | 608,045 | ||||||
| Interest on loans | 134,264 | 59,652 | - | ||||||
| Amortization, depletion and accretion | 1,428,068 | 1,162,790 | 667,794 | ||||||
| Write-down of oil and gas properties | 4,083,000 | 2,385,000 | - | ||||||
| 6,662,645 | 4,436,017 | 1,275,839 | |||||||
| NET OIL AND GAS INCOME (LOSS) | (4,946,721 | ) | (2,867,336 | ) | 133,019 | ||||
| GENERAL AND ADMINISTRATIVE EXPENSES | |||||||||
| Administrative, office services and premises | 327,956 | 312,517 | 244,233 | ||||||
| Stock-based compensation | 219,451 | 177,596 | 173,538 | ||||||
| Management fees | 296,999 | 237,828 | 201,393 | ||||||
| Consulting fees | 173,140 | 242,245 | 209,174 | ||||||
| Professional fees | 168,855 | 172,261 | 163,544 | ||||||
| Finance fees on debt | - | 61,753 | 95,427 | ||||||
| Filing and transfer agent fees | 21,131 | 25,731 | 17,130 | ||||||
| Shareholder information | 44,224 | 24,907 | 69,717 | ||||||
| Amortization | 2,054 | 2,158 | 1,462 | ||||||
| (1,253,810 | ) | (1,256,996 | ) | (1,175,618 | ) | ||||
| OTHER INCOME (EXPENSES) | |||||||||
| Interest expense | (50,593 | ) | (848 | ) | (10,487 | ) | |||
| Interest and other income | 7,517 | 24,450 | 2,034 | ||||||
| (1,296,886 | ) | (1,233,394 | ) | (1,184,071 | ) | ||||
| LOSS BEFORE INCOME TAXES AND DISCONTINUED | |||||||||
| OPERATIONS | (6,243,607 | ) | (4,100,730 | ) | (1,051,052 | ) | |||
| Recovery of future income taxes (Note 11a) | 863,031 | 1,032,099 | 583,706 | ||||||
| LOSS BEFORE DISCONTINUED OPERATIONS | (5,380,576 | ) | (3,068,631 | ) | (467,346 | ) | |||
| Discontinued operations (Note 2) | 1,854,654 | (168,128 | ) | (55,112 | ) | ||||
| LOSS AND COMPREHENSIVE LOSS FOR THE YEAR | $ | (3,525,922 | ) | $ | (3,236,759 | ) | $ | (522,458 | ) |
| BASIC AND DILUTED LOSS PER SHARE BEFORE | |||||||||
| DISCONTINUED OPERATIONS | $ | (0.27 | ) | $ | (0.21 | ) | $ | (0.05 | ) |
| BASIC AND DILUTED LOSS PER SHARE AFTER | |||||||||
| DISCONTINUED OPERATIONS | $ | (0.18 | ) | $ | (0.22 | ) | $ | (0.05 | ) |
| WEIGHTED AVERAGE NUMBER OF SHARES | |||||||||
| OUTSTANDING | 20,063,734 | 14,646,442 | 9,849,082 | ||||||
The accompanying notes form an integral part of these financial statements.
55
| BERKLEY RESOURCES INC. | |||||||||
| STATEMENTS OF DEFICIT | |||||||||
| For the Years Ended December 31 | |||||||||
| 2007 | 2006 | 2005 | |||||||
| (Restated) | |||||||||
| DEFICIT,beginning of year | $ | (5,082,981 | ) | $ | (1,846,222 | ) | $ | (1,323,764 | ) |
| Change in accounting policy (note 4) | (134,247 | ) | - | - | |||||
| Loss for the year | (3,525,922 | ) | (3,236,759 | ) | (522,458 | ) | |||
| DEFICIT,end of year | $ | (8,743,150 | ) | $ | (5,082,981 | ) | $ | (1,846,222 | ) |
The accompanying notes form an integral part of these financial statements.
56
BERKLEY RESOURCES INC. | |||||||||
| STATEMENTS OF CASH FLOWS | |||||||||
| For the Years Ended December 31 | |||||||||
| 2007 | 2006 | 2005 | |||||||
| (Restated) | |||||||||
| CASH PROVIDED BY (USED IN) FROM | |||||||||
| CONTINUING OPERATIONS | |||||||||
| OPERATING ACTIVITIES | |||||||||
| Loss for the period from continuing operations | $ | (5,380,576 | ) | $ | (3,068,631 | ) | $ | (467,346 | ) |
| Items not requiring cash in the year | |||||||||
| Amortization, depletion and accretion | 1,430,122 | 1,164,948 | 669,256 | ||||||
| Finance fees on debt | - | 61,753 | - | ||||||
| Fair value of options issued for services | 2,269 | - | - | ||||||
| Write-down of oil and gas properties | 4,083,000 | 2,385,000 | - | ||||||
| Recovery of future income taxes | (863,031 | ) | (1,032,099 | ) | (583,706 | ) | |||
| Stock-based compensation | 219,451 | 177,596 | 173,538 | ||||||
| (508,765 | ) | (311,433 | ) | (208,258 | ) | ||||
| Net change in non-cash working capital balances: | |||||||||
| Accounts receivable | 360,064 | (328,580 | ) | (133,434 | ) | ||||
| Taxes recoverable | 3,977 | 6,180 | 8,754 | ||||||
| Prepaid expenses | 9,813 | 85,756 | (9,189 | ) | |||||
| Due from related party | - | 3,454 | 18,606 | ||||||
| Prepaid oil and gas costs | - | 295,350 | 81,343 | ||||||
| Accounts payable and accrued liabilities | (33,208 | ) | 662,231 | 1,833 | |||||
| Due to related parties | (54,172 | ) | (56,484 | ) | 124,917 | ||||
| (222,291 | ) | 356,474 | (115,428 | ) | |||||
| INVESTING ACTIVITIES | |||||||||
| Proceeds on disposal of oil and gas property | - | - | 112,500 | ||||||
| Oil and gas properties and equipment, net | (2,381,576 | ) | (6,739,047 | ) | (3,859,162 | ) | |||
| Other property and equipment | (378 | ) | (433 | ) | (5,548 | ) | |||
| (2,381,954 | ) | (6,739,480 | ) | (3,752,210 | ) | ||||
| FINANCING ACTIVITIES | |||||||||
| Issuance of common shares (net of issue costs) | 1,637,090 | 3,689,142 | 3,615,396 | ||||||
| Decrease in cash from continuing operations | (967,155 | ) | (2,693,864 | ) | (252,242 | ) | |||
| Increase in cash from discontinued operations(Note 2) | 515,966 | 1,297,429 | 1,434,245 | ||||||
| Cash, beginning of year | 498,246 | 1,894,681 | 712,678 | ||||||
| Cash, end of year | $ | 47,057 | $ | 498,246 | $ | 1,894,681 | |||
| SUPPLEMENTAL STATEMENTS OF CASH | |||||||||
| FLOWS DISCLOSURE | |||||||||
| Interest paid on bank loans | $ | 249,910 | $ | 273,100 | $ | 99,532 |
The accompanying notes form an integral part of these financial statements.
57
| BERKLEY RESOURCES INC. |
| NOTES TO FINANCIAL STATEMENTS |
| December 31, 2007 and 2006 |
| 1. | Nature of Operations and Going Concern |
Berkley Resources Inc. (the “Company” or “Berkley”) was created on the amalgamation of Fortune Island Mines Ltd., Kerry Mining Ltd. and Berkley Resources Ltd. under the Company Act (British Columbia) on July 18, 1986. The Company is in the business of acquisition, exploration, development and production from petroleum and natural gas interests in Alberta and Saskatchewan, Canada. The Company also rented commercial office space in a building it owns in Vancouver, Canada. The commercial rental operations have been discontinued as a result of the sale of the building during the year ended December 31, 2007 (Note 2). | |
These financial statements have been prepared on the basis of accounting principles applicable to a going concern which assumes that Berkley will continue in operation for the foreseeable future in regards to its oil and gas operations and will be able to realize its assets and discharge its liabilities in the normal course of operations. | |
Adverse conditions and events cast substantial doubt upon the validity of this assumption. The Company has incurred significant operating losses over the past several fiscal years and as at December 31, 2007 the Company does not have sufficient financial resources to meet its flow through expenditure requirements in 2008. As at December 31, 2007, the Company had a working capital deficit of $683,930 (2006 – $3,189,632). | |
The Company’s ability to continue as a going concern is dependent upon its ability to raise additional capital through the issuance of treasury shares or debt and achieve profitable operations in the future. The Management of the Company has developed a strategy to address this uncertainty, including additional equity and/or debt financing; however, there are no assurances that any such financing can be obtained on favourable terms, if at all. | |
If the going concern assumption were not appropriate for these financial statements, then adjustments would be necessary in the carrying values of assets and liabilities, reported revenues and expenses, and the balance sheet classifications used. | |
| 2. | Discontinued Operations |
During March 2007, the Company entered into an agreement to sell its real estate assets in Vancouver, British Columbia. Therefore the rental property asset and liability amounts are now disclosed asAssets of discontinued operationsandBank loans and liabilities of discontinued operationsrespectively on the Balance Sheet and the operations segment disclosed as discontinued operations on the Statement of Operations. The rental property asset was sold for $4,000,000 on August 31, 2007 and had a carrying value of $2,038,924 which resulted in a gain on the sale of $1,949,368. There were costs of $11,708 in legal fees applied against the sale. Proceeds of the sale were used to pay out the loans entirely to the Canadian Imperial Bank of Commerce ($539,749) and Quest Capital Corp. ($2,800,000) plus accrued interest on the loans of $37,863. | |
Summarized financial information relating to the discontinued operations are as follows: | |
Assets: |
| December 31, 2007 | December 31, 2006 | ||||||
| Building, at cost | $ | - | $ | 447,652 | |||
| Less: Accumulated amortization | - | (147,722 | ) | ||||
| - | 299,930 | ||||||
| Land, at cost | - | 1,738,994 | |||||
| $ | - | $ | 2,038,924 |
58
| BERKLEY RESOURCES INC. |
| NOTES TO FINANCIAL STATEMENTS |
| December 31, 2007 and 2006 |
| 2. | Discontinued Operations - Continued |
| Liabilities: | |||||||
| December 31, 2007 | December 31, 2006 | ||||||
| Canadian Imperial Bank of Commerce loan | $ | - | $ | 577,612 | |||
| Quest Capital Corp. loan | - | 2,800,000 | |||||
| $ | - | $ | 3,377,612 |
Operating results: | ||||||||||
| 2007 | 2006 | 2005 | ||||||||
| Rental revenue | $ | 165,490 | $ | 249,211 | $ | 238,466 | ||||
| Rental operations expenses | ||||||||||
| Operating costs | 144,558 | 193,800 | 180,779 | |||||||
| Interest on bank loan | 115,646 | 213,448 | 99,532 | |||||||
| Amortization | - | 10,091 | 13,267 | |||||||
| 260,204 | 417,339 | 293,578 | ||||||||
| Net rental loss before other items | (94,714 | ) | (168,128 | ) | (55,112 | ) | ||||
| Gain on sales of assets | 1,949,368 | - | - | |||||||
| Net rental gain (loss) | $ | 1,854,654 | $ | (168,128 | ) | $ | (55,112 | ) | ||
| Cash flows: | ||||||||||
| 2007 | 2006 | 2005 | ||||||||
| Operating activities | ||||||||||
| Gain (loss) for the year | $ | 1,854,654 | $ | (168,128 | ) | $ | (55,112 | ) | ||
| Items not requiring cash | ||||||||||
| Amortization | - | 10,091 | 13,267 | |||||||
| Gain on disposal of building | (1,949,368 | ) | - | - | ||||||
| (94,714 | ) | (158,037 | ) | (41,845 | ) | |||||
| Investing activities | ||||||||||
| Proceeds from sale of building, net | 3,988,292 | - | - | |||||||
| Financing activities | ||||||||||
| Bank and other loans received | - | 3,055,466 | 1,600,000 | |||||||
| Bank and other loans repaid | (3,377,612 | ) | (1,600,000 | ) | �� | (123,910 | ) | |||
| (3,377,612 | ) | 1,455,466 | 1,476,090 | |||||||
| Net cash increase from discontinued operations | $ | 515,966 | $ | 1,297,429 | $ | 1,434,245 |
59
| BERKLEY RESOURCES INC. |
| NOTES TO FINANCIAL STATEMENTS |
| December 31, 2007 and 2006 |
| 3. | Significant Accounting Policies | |
| a) | Basis of presentation | |
These financial statements are prepared in accordance with Canadian generally accepted accounting principles, which do not materially differ from accounting principles generally accepted in the United States, except as disclosed in Note 16. | ||
Certain comparative balances have been reclassified to conform with current year financial statement presentation. | ||
| b) | Foreign currency translation | |
The accounts of the Company are maintained in Canadian dollars. Monetary assets and liabilities are translated into Canadian dollars at the year end exchange rates. Non-monetary assets and liabilities are translated using historical rates of exchange. Revenues and expenses are translated at the rate of exchange in effect on the transaction date and exchange gains and losses on translation are included in operations. | ||
| c) | Revenue recognition | |
Revenue from the sale of crude oil, natural gas and liquids is recognized when title passes to the third party purchaser, delivery has taken place and collection is reasonably assured. The Company assesses third party purchaser creditworthiness, both before entering into contracts and throughout the revenue recognition process. | ||
Rental revenue is recognized on a monthly basis under the terms of lease agreements with tenants. | ||
| d) | Oil and gas properties and equipment | |
Berkley follows the full cost method of accounting for oil and gas properties and equipment whereby all costs of acquiring, exploring for and developing oil and gas reserves are capitalized. Such costs include land acquisition costs, geological and geophysical expenses, carrying charges on non- producing properties, costs of drilling both productive and non-productive wells, costs of production equipment and overhead charges relating to acquisition, exploration and development activities. The Company does not capitalize interest or administrative expenses. | ||
Capitalized costs of proven reserves and equipment are depleted using a unit of production method based upon estimated proven reserves before royalties. For purposes of this calculation, reserves are converted to common units on the basis that six thousand cubic feet of natural gas is equivalent to one barrel of oil. | ||
Costs of acquiring and evaluating unproved properties are initially excluded from depletion calculations. These unevaluated properties are assessed periodically to ascertain whether impairment has occurred. When proved reserves are assigned or the property is considered to be impaired, the cost of the property or the amount of the impairment is added to costs subject to depletion calculations. | ||
Unless a significant amount of reserves is involved, proceeds received from the disposition of oil and gas properties are credited to the relevant cost centre unless this results in a change of 20% or more in the depletion rate. In the event of a significant sale of reserves, a proportionate amount of cost and accumulated depletion, based upon the ratio of reserves sold to total reserves, is removed from the appropriate cost centre and the resultant profit or loss taken into income. | ||
60
| BERKLEY RESOURCES INC. |
| NOTES TO FINANCIAL STATEMENTS |
| December 31, 2007 and 2006 |
| 3. | Significant Accounting Policies-Continued | ||
| d) | Oil and gas properties and equipment -Continued | ||
The Company performs a ceiling test in a two-stage test performed at least annually: | |||
| i) | Impairment is recognized if the carrying value of the oil and gas assets less accumulated depletion and amortization and the lesser of cost and fair value of unproven properties exceeds the estimated future cash flows from proved oil and gas reserves, on an undiscounted basis, using forecast prices and costs. | ||
| ii) | If impairment is indicated by applying the calculations described in i) above, the Company will measure the amount of the impairment by comparing the carrying value of the oil and gas assets less accumulated depletion and amortization and the lesser of cost and fair value of unproven properties to the estimated future cash flows from the proved and probable oil and gas reserves, discounted at the Company’s risk-free rate of interest, using forecast prices and costs. Any impairment is included in earnings for the year. | ||
Substantially all of the Company’s oil and gas interests are conducted jointly with others. The financial statements reflect only the Company’s share of assets, liabilities, and operations. As at 31 December 2007 and 2006, the Company does not operate any of its oil and gas interests. | |||
| e) | Asset retirement obligation | ||
The recognition of the fair value of obligations associated with the retirement of tangible long-lived assets are recorded in the period the asset is put to use, with the corresponding increase to the carrying amount of the related asset. The obligations recognized are statutory, contractual or legal obligations. The liability is accreted over time for changes in the fair value of the liability through charges to asset retirement accretion which is included in depletion, amortization and accretion expense. The costs capitalized to the related assets are amortized to earnings in a manner consistent with the depreciation and amortization of the underlying assets. Revisions to the estimated timing of cash flows or to the original estimated undiscounted costs could also result in an increase or decrease to the obligation. Actual costs incurred upon settlement of the retirement obligation are charged against the obligation to the extent of the liability recorded. | |||
| f) | Rental property and other capital assets | ||
Land and building are recorded at cost, net of accumulated amortization on the building. The cost of the building is amortized over its estimated useful life at the rate of 4% per annum by the declining balance method. No amortization was taken on the building in the current year, subsequent to these operations being discontinued. | |||
Other capital assets consist of computer equipment, furniture and equipment and are amortized at the following rates per annum by the declining balance method: | |||
| Computer equipment | 30% |
| Furniture, fixtures and equipment | 20% |
61
| BERKLEY RESOURCES INC. |
| NOTES TO FINANCIAL STATEMENTS |
| December 31, 2007 and 2006 |
| 3. | Significant Accounting Policies-Continued | |
| g) | Use of estimates | |
The preparation of financial statements in conformity with Canadian generally accepted accounting principles requires management to make estimates and assumptions that affect the reported amounts of assets and liabilities and disclosure of contingent assets and liabilities at the date of the financial statements and the reported amounts of revenues and expenses during the reporting period. Actual results could differ from those estimates. The amounts recorded for depletion and depreciation of petroleum and natural gas properties, the provision for asset retirement obligations, valuation allowances for future income tax assets and assumptions used in determining the fair value of non-cash stock-based compensation are based on estimates. The ceiling test is based on estimates of proven reserves, production rates, oil and gas prices and other relevant assumptions. By their nature, these estimates are subject to measurement uncertainty and the effect on the financial statements of changes in such estimates, in future periods, could be significant. | ||
| h) | Stock-based compensation plan | |
Stock based compensation expense is recorded for the estimated fair value of stock options granted. The estimated fair value of the options at the date of grant is accrued and charged to operations, with an offsetting credit to contributed surplus, on a straight-line basis over the vesting period. If and when the stock options are ultimately exercised, the applicable amounts of contributed surplus are transferred to share capital. In the event that vested options expire, previously recognized compensation expense associated with such stock options is not reversed. In the event that unvested options are cancelled, previously recognized compensation expense associated with such options is reversed. | ||
| i) | Loss per share | |
Basic loss per share is computed by dividing income available to common shareholders by the weighted average number of common shares outstanding during the period. The computation of diluted loss per share assumes the conversion, exercise or contingent issuance of securities only when such conversion, exercise or issuance would have a dilutive effect on loss per share. The dilutive effect of convertible securities is reflected in diluted loss per share by application of the "if converted" method. The dilutive effect of outstanding options and warrants and their equivalents is reflected in diluted loss per share by application of the treasury stock method. This method assumes the proceeds from the exercise of dilutive options and warrants are used to purchase common shares at the weighted average market price during the period. | ||
| j) | Income taxes | |
The Company follows the asset and liability method of accounting for future income taxes. Under this method, future income tax assets and liabilities are recorded based on temporary differences between the carrying amount of balance sheet items and their corresponding tax bases. In addition, the future benefits of income tax assets, including unused tax losses, are recognized, subject to a valuation allowance, to the extent that it is more likely than not that such future benefits will ultimately be realized. Future income tax assets and liabilities are measured using enacted tax rates and laws expected to apply when the tax liabilities or assets are to be either settled or realized. | ||
62
| BERKLEY RESOURCES INC. |
| NOTES TO FINANCIAL STATEMENTS |
| December 31, 2007 and 2006 |
| 3. | Significant Accounting Policies-Continued | |
| k) | Variable interest entities | |
A variable interest entity (VIE) is one in which either the equity investment at risk is insufficient to permit the VIE to finance its activities without additional subordinated financial support, or the holders of the equity at risk lack the characteristics of a controlling financial interest. The primary beneficiary is defined as the party that will absorb a majority of the VIE’s expected losses, receive a majority of the VIE’s expected residual returns, or both. The Company has reviewed the criteria for a primary beneficiary and has determined that it has not met that criteria and therefore has not consolidated the variable interest entities. | ||
| l) | Flow-through shares | |
Canadian Income Tax Legislation permits an enterprise to issue securities referred to as flow-through shares, whereby the investor can claim the tax deductions arising from the renunciation of the related resource expenditures. When resource expenditures are renounced to the investors, the renouncement documents are filed with the taxation authorities, and the Company has reasonable assurance that the expenditures will be completed, future income tax liabilities are recognized (renounced expenditures multiplied by the effective tax rate) thereby reducing share capital. | ||
If a company has sufficient unused tax losses and deductions (“losses”) to offset all or part of the future income tax liabilities and no future income tax assets have been previously recognized on such losses, a portion of such unrecognized losses (losses multiplied by the effective corporate tax rate) is recorded as income up to the amount of the future income tax liability that was previously recognized on the renounced expenditures. | ||
| m) | Recent accounting pronouncements | |
CICA Section 1400General Standards of Financial Statement Presentationprovides revised guidance on management’s responsibility to assess and disclose the Company’s ability to continue as a going concern. On January 1, 2008 the Company will adopt this standard and management is currently assessing its impact on the Company’s interim and annual financial statements for fiscal 2008. | ||
CICA Section 1535Capital Disclosuresestablishes standards for the disclosure of the Company’s objectives, policies and processes for managing capital, capital management strategies, as well as quantitative information about capital. On January 1, 2008 the Company will adopt this standard, and management is currently assessing its impact on the Company’s interim and annual financial statements for fiscal 2008. | ||
CICA Section 3031Inventoriescontains expanded guidance related to cost measurement and disclosure requirements. On January 1, 2008 the Company will adopt this standard, and no significant impact is expected on the Company’s interim and annual financial statements for fiscal 2008. | ||
63
| BERKLEY RESOURCES INC. |
| NOTES TO FINANCIAL STATEMENTS |
| December 31, 2007 and 2006 |
| 3. | Significant Accounting Policies-Continued | |
| m) | Recent accounting pronouncements-Continued | |
CICA Section 3064Goodwill and Intangible Assetsreplaces Section 3062Goodwill and Intangible Assets, and Section 3450Research and Development Costs,which also resulted in amendments to related guidance contained in AcG-11Enterprises in the Development Stageand Section 1000Financial Statement Concepts.These pronouncements and amendments affect the recognition and measurement of intangible assets that include deferred costs related to mineral property exploration. On January 1, 2009 the Company will adopt this standard, and management is currently assessing its impact on the Company’s interim and annual financial statements for fiscal 2009. | ||
CICA Section 3862Financial Instruments - Disclosuresand Section 3863Financial Instruments - Presentationreplaces Section 3861Financial Instruments - Disclosure and Presentation. These new sections revise and enhance current disclosure requirements for financial instruments, and place an increased emphasis on disclosure of risk exposure and risk assessments. On January 1, 2008 the Company will adopt this standard and management is currently assessing its impact on the Company’s interim and annual financial statements for fiscal 2008. | ||
In February 2008, the CICA Accounting Standards Board confirmed that public companies will be required to prepare interim and annual financial statements under International Financial Reporting Standards (“IFRS”) for fiscal years beginning on or after January 1, 2011. Management is currently assessing the impact of adopting IFRS and it has not yet determined its affect on the Company’s financial statements. | ||
| 4. | Accounting Changes | |
Effective January 1, 2007, the Company adopted the following new accounting standards issued by the Canadian Institute of Chartered Accountants (“CICA”). These accounting policy changes were adopted on a prospective basis with no restatement of prior period financial statements: | ||
| a) | Section 1530Comprehensive Income | |
Effective January 1, 2007 comprehensive loss is comprised of the sum of the net loss and other comprehensive income or loss which includes unrealized gains or losses from changes in the fair market value of available-for-sale investments, changes in the fair market value of derivative instruments designated as cash flow hedges and currency translation adjustments on self-sustaining foreign operations. The Company does not have any derivative instruments, self-sustaining foreign operations or available-for-sale investments and currently the Company’s other comprehensive income (loss) is $nil and not shown on the balance sheet. | ||
| b) | Section 3251Equity | |
| c) | Section 3855Financial Instruments – Recognition and Measurement | |
Section 3855 requires all financial assets and liabilities, including derivatives, to be carried at fair value on the Company’s balance sheet with the exception of loans and receivables, investments that are intended to be held to maturity and non-trading financial liabilities which are carried at cost or amortized cost. Transaction costs attributable to financial instruments classified as other than held-for- trading can be included in the recognized amount of the related financial instrument and recognized over the life of the resulting financial instrument or recognized in net income immediately. Transaction costs attributable to financial instruments classified as held-for-trading must be recognized in net income immediately. | ||
64
| BERKLEY RESOURCES INC. |
| NOTES TO FINANCIAL STATEMENTS |
| December 31, 2007 and 2006 |
| 4. | Accounting Changes- Continued | ||
| c) | Section 3855Financial Instruments – Recognition and Measurement - Continued | ||
The Company has reviewed and classified its financial instruments as follows: | |||
Cash is classified as a financial asset held for trading and is measured at its fair value. Gains or losses related to periodic revaluation are recorded to net income or loss. | |||
Accounts receivable are classified as loans and receivables and are initially measured at their fair value. Subsequent periodic revaluations are recorded at their amortized cost using the effective interest rate method. | |||
Accounts payable, accrued liabilities and revolving credit facility are classified as other liabilities and are initially measured at fair value. Subsequent periodic revaluations are recorded at their amortized cost using the effective interest rate method. | |||
Prior to January 1, 2007 transaction costs were recorded as deferred financing fees and recognized in the statement of operations on a straight-line basis over the life of the financial instrument based on the principal outstanding. Upon adoption of Section 3855, the Company chose to recognize transaction costs relating to bank loans of discontinued operations in net income immediately. Thus a charge to retained earnings as outlined below was required. | |||
| January 1, 2007 | ||
| Deficit - increase | 134,247 | |
| Deferred financing fees -decrease | 134,247 |
There were no other opening adjustments recorded on the adoption of this standard. | ||
| d) | Section 3861Financial Instruments – Disclosure and Presentation | |
| e) | Section 3865Hedges | |
This new standard specifies the circumstances under which hedge accounting is permissible and how hedge accounting may be performed. On adoption of these standards, the Company did not have any agreements or contracts which are following hedge accounting. | ||
| f) | Section 1506Accounting changes | |
This new standard expands requirements relating to voluntary changes in accounting principles, and requires the Company to disclose new sources of GAAP that have been issued but are not yet effective. The Company has not made any voluntary changes in accounting principles affecting these financial statements. |
65
| BERKLEY RESOURCES INC. |
| NOTES TO FINANCIAL STATEMENTS |
| December 31, 2007 and 2006 |
| 5. | Oil and Gas Properties and Equipment |
| 2007 | 2006 | ||||||
| Oil and gas properties and equipment, cost | $ | 18,417,734 | $ | 16,035,651 | |||
| Less: Accumulated amortization and depletion | (8,878,727 | ) | (5,069,627 | ) | |||
| Write-down of oil and gas properties | (4,083,000 | ) | (2,385,000 | ) | |||
| $ | 5,456,007 | $ | 8,581,024 |
Future development costs related to proven undeveloped reserves of $Nil (2006 – $Nil) have been included in the depletion base calculation at December 31, 2007.
At December 31, 2007, oil and gas properties and equipment includes the cost of unproven properties of approximately $1,108,931 (2006 - $3,832,346) which are currently not subject to depletion.
The benchmark prices, on which the ceiling test is based, are as follows:
| Crude Oil | Natural Gas | |
Edmonton | ||
| Par Price | AECO | |
| Year | CDN$/bbl | CDN$/mcf |
| 2008 | 85.65 | 6.90 |
| 2009 | 84.75 | 7.75 |
| 2010 | 87.05 | 8.10 |
| 2011 | 87.25 | 8.50 |
| 2012 | 85.40 | 8.65 |
| 2013 | 84.60 | 9.10 |
| 2014 | 86.30 | 9.30 |
| 2015 | 88.05 | 9.50 |
| 2016 | 89.80 | 9.65 |
| 2017 | 91.60 | 9.85 |
Benchmark prices increase at a rate of 2% per year for both oil and gas after 2017.
For the year ended December 31, 2007, a ceiling test write-down of $4,083,000 (2006 – $2,385,000) was required.
During the year ended December 31, 2007, five property areas produced more than 90% (2006 – 95%) of the total oil and gas revenue. There is no guarantee that this revenue will continue in future periods. In addition, $Nil of 2007 revenue (2006 – $70,013) came from a well that was abandoned in fiscal 2006 and is unlikely to produce any future revenue.
66
| BERKLEY RESOURCES INC. |
| NOTES TO FINANCIAL STATEMENTS |
| December 31, 2007 and 2006 |
| 6. | Other Property and Equipment |
| Accumulated | |||||||||||||
| Cost | Amortization | Net 2007 | Net 2006 | ||||||||||
| Computer equipment | $ | 28,760 | $ | (27,404 | ) | $ | 1,356 | $ | 2,609 | ||||
| Furniture, fixtures and equipment | 8,521 | (6,830 | ) | 1,691 | 2,114 | ||||||||
| Truck | 39,040 | (39,039 | ) | 1 | 1 | ||||||||
| $ | 76,321 | $ | (73,273 | ) | $ | 3,048 | $ | 4,724 |
| 7. | Bank Loans and Liabilities of Discontinued Operations |
| 2007 | 2006 | ||||||
| Canadian Imperial Bank of Commerce | $ | - | $ | 577,612 | |||
| Quest Capital Corp. | - | 2,800,000 | |||||
| $ | - | $ | 3,377,612 |
The bank loan payable to the Canadian Imperial Bank of Commerce (“CIBC”) that was subject to interest at prime plus 1.00% per annum, due on demand, and secured by a first mortgage in the amount of $650,000 over the Company’s rental property and an assignment of rents and insurance was paid out upon the completion of the sale of the discontinued operations on August 31, 2007.
The bank loan payable to Quest Capital Corp (“Quest”) that was subject to interest at 12.00% per annum with monthly interest only payments of approximately $28,000 and secured by a promissory note, a second mortgage and assignment of rents over the Company’s real estate, a first charge debenture over the oil and gas assets and a general security agreement was paid out upon the completion of the sale of the discontinued operations on August 31, 2007.
In addition, the Company has a $50,000 revolving demand credit line with the CIBC that bears interest at prime plus 1% per annum. As at December 31, 2007 and 2006, there was a nil balance outstanding with regard to the credit line.
67
| BERKLEY RESOURCES INC. |
| NOTES TO FINANCIAL STATEMENTS |
| December 31, 2007 and 2006 |
| 8. | Asset Retirement Obligation |
The following table sets out the activity for the Company’s asset retirement obligation: |
| 2007 | 2006 | ||||||
| Opening balance | $ | 135,675 | $ | 85,439 | |||
| Accretion | 3,968 | 2,790 | |||||
| Additions | 507 | 47,446 | |||||
| $ | 140,150 | $ | 135,675 |
The Company estimates the total undiscounted amount of cash flows required to settle its asset retirement obligation is approximately $249,147 (2006 – $217,700) which will be incurred between 2008 and 2018. The asset retirement obligation calculation assumes a credit adjusted discount rate of 6% and an inflation rate of 1.5% .
| 9. | Share Capitala) Authorized: |
Unlimited common shares, without par value |
| 2007 | 2006 | |||||||||||
| Number | Number of | |||||||||||
| Issued and fully paid: | of Shares | Amount | Shares | Amount | ||||||||
| Balance, beginning of year | 18,857,608 | $ | 11,577,934 | 14,184,955 | $ | 8,762,671 | ||||||
| Issued in the year for cash: | ||||||||||||
| Pursuant to private placements: | ||||||||||||
| - flow-through for cash | 2,154,000 | 1,400,100 | 3,613,015 | 3,251,713 | ||||||||
| - non-flow-through for cash(Note 10i) | 440,000 | 264,000 | 755,600 | 680,040 | ||||||||
| - non-flow-through for services | - | - | 301,538 | 196,000 | ||||||||
| Exercise of stock options | - | - | - | - | ||||||||
| Exercise of warrants | - | - | 2,500 | 3,750 | ||||||||
| Share issuance costs | - | (27,010 | ) | - | (246,361 | ) | ||||||
| Fair value of private placement Warrants (Note | ||||||||||||
| 10i) | - | (4,400 | ) | - | (37,780 | ) | ||||||
| Future income taxes on renouncement of | ||||||||||||
| resource property expenditures | - | (870,259 | ) | - | (1,114,694 | ) | ||||||
| Future income taxes on share issue costs | - | 7,228 | - | 82,595 | ||||||||
| Balance, end of year | 21,451,608 | $ | 12,347,593 | 18,857,608 | $ | 11,577,934 | ||||||
68
| BERKLEY RESOURCES INC. |
| NOTES TO FINANCIAL STATEMENTS |
| December 31, 2007 and 2006 |
| 9. | Share Capital-Continued | |
| b) | Warrants | |
| 2007 | 2006 | |||||||||||
| Number of | Number of | |||||||||||
| Shares Subject | Exercise price | Shares Subject | Exercise price | |||||||||
| to Warrants | range | to Warrants | range | |||||||||
| Outstanding, beginning of year | 1,013,800 | $1.20/$1.50 | 1,925,232 | $1.10/$1.50 | ||||||||
| Issued | 220,000 | $1.00 | 377,800 | $1.20/$1.50 | ||||||||
| Exercised | - | - | (2,500 | ) | $1.50 | |||||||
| Expired | (1,013,800 | ) | $1.25/$1.50 | (1,286,732 | ) | $1.10/$1.50 | ||||||
| Outstanding, end of year | 220,000 | $1.00 | 1,013,800 | $1.20/$1.50 | ||||||||
At December 31, the following share purchase warrants were outstanding:
Exercise price |
|
|
| 2007 |
|
| 2006 | ||
Range |
| Expiry date |
|
| Number of warrants |
|
| Number of warrants | |
$1.25 |
| December 28, 2007 |
|
| - |
|
| 636,000 | |
$1.20/$1.50 |
| April 30, 2007 / December 31, 2007 |
|
| - |
|
| 377,800 | |
$1.00 |
| January 12, 2009 |
|
| 220,000 |
|
| - | |
|
|
| 220,000 |
|
| 1,013,800 |
| c) | Stock options | ||
The Company has adopted a 2007 Stock Option Plan (“the Plan”) which provides for the granting of options to acquire up to 2,837,000 shares. The Plan provides for the granting of options to employees and service providers, with no single optionee to be granted options in excess of 5% of the number of issued shares of the Company. All options granted are to be within the allowable discount off market price and the term of the options granted is not to exceed five years. Options granted under the plan vest as follows: | |||
| i) | 20% during the first six months after the date of the grant; | ||
| ii) | 20% at the end of nine months after the date of grant; | ||
| iii) | 20% at the end of the twelve months after the date of grant; | ||
| iv) | 20% at the end of the fifteen months after the date of grant; | ||
| v) | 20% at the end of the eighteen months after the date of grant. | ||
| 2007 | 2006 | |||||||||||
| Weighted | Weighted | |||||||||||
| Number of | average | Number of | average | |||||||||
| Shares Subject | exercise price | Shares Subject | exercise price | |||||||||
| to Options | per share | to Options | per share | |||||||||
| Balance outstanding, beginning of year | 2,214,000 | $ | 0.68 | 1,634,000 | $ | 0.72 | ||||||
| Activity in the year | ||||||||||||
| Granted | 350,000 | $ | 0.55 | 600,000 | $ | 0.56 | ||||||
| Exercised | - | - | - | - | ||||||||
| Cancelled | (13,500 | ) | $ | 0.70 | (20,000 | ) | $ | 0.78 | ||||
| Balance outstanding, end of year | 2,550,500 | $ | 0.66 | 2,214,000 | $ | 0.68 | ||||||
| Exercisable, end of year | 2,150,539 | $ | 0.68 | 1,428,333 | $ | 0.68 | ||||||
69
| BERKLEY RESOURCES INC. |
| NOTES TO FINANCIAL STATEMENTS |
| December 31, 2007 and 2006 |
| 9. | Share Capital-Continued | |
| c) | Stock options -Continued | |
A summary of stock options outstanding is as follows: | ||
| 2007 | 2006 | |||
| Exercise Price | Number of Shares Remaining | |||
| Per Share | Expiry Date | Subject to Options at December 31 | ||
| $0.52 | September 19, 2008 | 580,500 | 580,500 | |
| $0.57 | September 19, 2008 | 150,000 | 150,000 | |
| $0.74 | September 19, 2008 | - | 6,000 | |
| $0.81 | October 19, 2009 | 200,000 | 200,000 | |
| $0.77 | October 29, 2009 | 37,500 | 37,500 | |
| $0.90 | December 23, 2010 | 637,500 | 640,000 | |
| $0.56 | September 21, 2011 | 595,000 | 600,000 | |
| $0.55 | July 4, 2012 | 350,000 | - | |
| 2,550,500 | 2,214,000 | |||
The fair value of the stock options granted were $81,180 (2006: $198,900) determined on the date of grant using the Black-Scholes option pricing model with the following weighted average assumptions:
| 2007 | 2006 | ||
| Risk free interest rate | 4.50% | 3.91% | |
| Expected life | 3 years | 3 years | |
| Volatility factor | 57% | 55% | |
| Dividend yield | 0% | 0% |
Option pricing models require the input of highly subjective assumptions including the expected price volatility. Changes in the subjective input assumptions can materially affect the fair value estimate, and therefore the existing models do not necessarily provide a reliable single measure of the fair value of the Company’s stock options.
| 10. | Contributed Surplus |
| 2007 | 2006 | ||||||
| Balance, beginning of year | $ | 804,412 | $ | 589,036 | |||
| Stock-based compensation on issue of options | 219,451 | 177,596 | |||||
| Stock-based compensation on issue of options for consulting services | 2,269 | - | |||||
| Value of warrants (i and ii) | 4,400 | 37,780 | |||||
| Balance, end of year | $ | 1,030,532 | $ | 804,412 |
| i) | During the year the Company issued 440,000 units at $0.60 per unit for total proceeds of $264,000 with each unit consisting of one common share of the Company and one half warrant exercisable to January 12, 2009 at $1.00 per warrant. Management determined that $0.01 of the $0.60 unit price was applicable to the half warrant, therefore $4,400 of total proceeds was been reflected in contributed surplus. Should these warrants be exercised the applicable amount of contributed surplus will be transferred to share capital. | |
| ii) | During the year ended December 31, 2006 the Company issued 755,600 units at $0.90 per unit for total proceeds of $680,040 with each unit consisting of one common share of the Company and one half warrant exercisable to April 30, 2007 at $1.20 per warrant and exercisable to December 31, 2007 at $1.50. Management determined that $0.05 of the $0.90 unit price was applicable to the half warrant, |
70
| BERKLEY RESOURCES INC. |
| NOTES TO FINANCIAL STATEMENTS |
| December 31, 2007 and 2006 |
therefore $37,780 of total proceeds was been reflected in contributed surplus. Should these warrants be exercised the applicable amount of contributed surplus will be transferred to share capital.
| 11. | Income Taxes | |
| a) | Reconciliation of accounting and taxable income, for the years ended December 31 are as follows: | |
| 2007 | 2006 | 2005 | ||||||||
| (Restated) | ||||||||||
| Net income (loss) for the year before taxes | $ | (4,523,200 | ) | $ | (4,268,855 | ) | $ | (1,106,164 | ) | |
| Combined federal and provincial income tax rate | 34.12% | 34.12% | 34.12% | |||||||
| Computed income tax expense (reduction) | (1,543,316 | ) | (1,456,533 | ) | (377,423 | ) | ||||
| Increase (decrease) resulting from: | ||||||||||
| Non deductible Crown Royalties, net | - | 22,290 | 33,956 | |||||||
| Resource loss (allowance) | - | (12,658 | ) | 12,292 | ||||||
| Stock-based compensation | 74,877 | 60,596 | 59,211 | |||||||
| Deferred financing fees | 45,805 | 21,070 | - | |||||||
| Meals and entertainment | 1,533 | 1,323 | 1,857 | |||||||
| Tax adjustment from rate change and other | 574,517 | (892 | ) | 250 | ||||||
| Non-taxable portion of capital gain | (355,766 | ) | - | - | ||||||
| Change in valuation allowance | 339,319 | 332,705 | (313,849 | ) | ||||||
| Recovery of income taxes | $ | (863,031 | ) | $ | (1,032,099 | ) | $ | (583,706 | ) |
| b) | The components of the future income tax asset (liability) balances for the years ended December 31, are as follows: |
| 2007 | 2006 | ||||||
| Future income tax assets | |||||||
| Non-capital losses | $ | 315,300 | $ | 401,972 | |||
| Share issuance costs | 83,464 | 148,615 | |||||
| Property and equipment | 605,587 | 105,150 | |||||
| Asset retirement obligation | 37,508 | 46,292 | |||||
| Cumulative eligible capital | 1,740 | 2,386 | |||||
| Future income tax liabilities | |||||||
| Oil and gas properties tax value in excess of book value | - | (135 | ) | ||||
| Allowance | (1,043,599 | ) | (704,280 | ) | |||
| Future income tax asset (liability) | $ | - | $ | - |
Future income tax assets are recorded when it is more likely then not, that they will be recovered in future periods. A full valuation allowance has been taken on the future income tax assets as this criteria has not been met.
71
| BERKLEY RESOURCES INC. |
| NOTES TO FINANCIAL STATEMENTS |
| December 31, 2007 and 2006 |
| 11. | Income Taxes-Continued | |
| c) | The Company has non-capital losses which may be applied to reduce future years' taxable income. At December 31, 2007, these losses expire as follows: | |
| 2008 | 10,711 | |||
| 2009 | 58,684 | |||
| 2010 | 52,613 | |||
| 2014 | 265,611 | |||
| 2015 | 208,700 | |||
| 2026 | 581,795 | |||
| ; | $ | 1,178,114 |
| d) | Canadian development and exploration expenditures | |
As at December 31, 2007, the Company had $5,160,120 (2006 - $8,580,628) of unused Canadian exploration and development expenses available to offset future taxable income of the Company. The tax benefit of these expenses carry forward indefinitely. | ||
| e) | Flow-through shares | |
In 2007, the Company issued flow-through shares in the amount of $1,400,100 (2006 - $3,251,713), excluding share issue costs, to finance eligible Canadian exploration expenditures. The resource expenditure deductions for income tax purposes related to exploration activities are renounced to investors in accordance with income tax legislation, and as a result tax deductibility of these costs are not available to the Company. | ||
As at the respective year ends the subscription value of the flow-through shares of $1,400,100 (2006 – $3,251,713) had not yet been renounced to the shareholders, and $1,400,100 (2006 – $2,673,196) of eligible Canadian exploration expenditures had not yet been expended by the Company. The Company is committed to spend this amount on qualifying expenditures by December 31, 2008. Subsequent to the year-end, the Company renounced the $1,400,100 (2006 - $3,251,713) to the flow-through shareholders under the CRA look back rules. |
| 12. | Related Party Transactions | |
| a) | There is no amount due from related parties. | |
| b) | Due to related parties consists of $7,000 (2006 - $16,651) due to Directors of the Company for Directors’ fees and expense reimbursements and $7,261 (2006 - $51,782) to a private company owned by public companies having common Directors that provides administrative services, office supplies and accounting services. | |
| c) | Management and consulting fees totalling $296,999 were paid to Directors and their private companies in 2007 (2006: $237,828). | |
| d) | In 2006, current and/or former Directors and Officers subscribed for 145,500 shares of the Company for total proceeds of $130,950. | |
| e) | Consulting fees totalling $16,000 were paid to a former Director and his spouse in 2007 (2006: $96,000). | |
| f) | Administrative services, office supplies and accounting charges totalling $110,161 were paid to Oniva International Services Corporation (“Oniva”), a private company owned by public companies having common Directors (2006: $113,865). | |
72
| BERKLEY RESOURCES INC. |
| NOTES TO FINANCIAL STATEMENTS |
| December 31, 2007 and 2006 |
| 12. | Related Party Transactions -Continued |
The Company takes part in a cost sharing arrangement to reimburse Oniva for a variable percentage of its overhead expenses, to reimburse 100% of its out-of-pocket expenses incurred on behalf of the Company, and to pay a percentage fee based on the total overhead and corporate expenses. The agreement may be terminated with one-month notice by either party. | |
The transactions were in the normal course of operations and agreed to by the related parties and the Company and have had been measured at the exchange amount. | |
| 13. | Risk Management |
The carrying values of financial assets and liabilities approximate their fair value due to their short periods to maturity. The Company is exposed to interest risk on its line of credit facility with the Canadian Imperial Bank of Commerce. | |
| 14. | Commitment |
As at December 31, 2007 $1,400,100 of eligible Canadian exploration expenditures had not yet been expended by the Company. The Company is committed to spend this amount on qualifying expenditures by December 31, 2008. | |
| 15. | Segment Disclosure |
The Company operated in two segments – oil and gas and real estate rental. Operating results by segment are reported in the statement of operations. Total assets and capital expenditures by operating segment are as follows: |
| 2007 | 2006 | ||||||
| Assets by operating segment | |||||||
| Oil and gas | $ | 5,717,253 | $ | 9,182,115 | |||
| Real estate (Discontinued Operations) | - | 2,090,035 | |||||
Assets not allocated | |||||||
| Head office | 54,519 | 624,529 | |||||
| $ | 5,771,772 | $ | 11,896,679 | ||||
| 2007 | 2006 | ||||||
| Capital expenditures by segment | |||||||
| Oil and gas | $ | 2,381,954 | $ | 6,739,480 | |||
| Head office | - | - | |||||
| $ | 2,381,954 | $ | 6,739,480 |
All of the Company’s operations are in Canada. Rental revenue of $4,000 (2006: $6,000) has been eliminated on roll-up of the divisions representing the rental of office premises by the corporate head office.
73
| BERKLEY RESOURCES INC. |
| NOTES TO FINANCIAL STATEMENTS |
| December 31, 2007 and 2006 |
| 16. | Reconciliation Between Canadian and United States Generally Accepted Accounting Policies |
The financial statements of Berkley have been prepared in accordance with Canadian generally accepted accounting principles (“Canadian GAAP”) which differs in certain material respects from accounting principles generally accepted in the United States of America (“US GAAP”). The material differences between Canadian GAAP and US GAAP and their effect on Berkley’s financial statements are summarized below: |
| 2005 | ||||||||||||
| 2005 | As previously | |||||||||||
| Statement of Operations | 2007 | 2006 | As restated | reported | ||||||||
| Loss for the year under Canadian GAAP | $ | (3,525,922 | ) | $ | (3,236,759 | ) | $ | (522,458 | ) | $ | (1,922,458 | ) |
| Reduction in (additional) impairment of oil | ||||||||||||
| and gas properties under US GAAP (a) | 588,730 | (665,784 | ) | (2,301,603 | ) | (600,000 | ) | |||||
| Depletion, amortization and accretion expense | ||||||||||||
| (a) | 382,472 | 321,709 | - | - | ||||||||
| Remove tax impact on renouncement of flow- | ||||||||||||
| through shares | (689,609 | ) | (934,044 | ) | (39,210 | ) | (583,706 | ) | ||||
| Loss for the year under US GAAP | $ | (3,244,329 | ) | $ | (4,514,878 | ) | $ | (2,863,271 | ) | $ | (3,106,164 | ) |
| Loss per share under US GAAP | $ | (0.16 | ) | $ | (0.31 | ) | $ | (0.29 | ) | $ | (0.32 | ) |
| 2005 | ||||||||||||
| 2005 | As previously | |||||||||||
| Statement of Cash Flows | 2007 | 2006 | As restated | reported | ||||||||
| Increase (decrease) in cash for the year under | ||||||||||||
| Canadian GAAP | $ | (451,188 | ) | $ | (1,396,435 | ) | $ | 1,182,003 | $ | 1,182,003 | ||
| Increase (decrease) in cash during the year under | ||||||||||||
| US GAAP | $ | (451,188 | ) | $ | (1,396,435 | ) | $ | 1,182,003 | $ | 1,182,003 |
| Balance Sheets | 2007 | 2006 | ||||
| Oil and gas properties - Canadian GAAP | $ | 5,456,007 | $ | 8,581,024 | ||
| Additional impairment under US GAAP (a) | (2,378,657 | ) | (2,967,387 | ) | ||
| Depletion, amortization and accretion expense (a) | 704,181 | 321,709 | ||||
| Oil and gas properties - US GAAP | 3,781,531 | 5,935,346 | ||||
| Other liabilities - US GAAP (d and i) | (107,700 | ) | (934,044 | ) | ||
| Shareholders' equity - Canadian GAAP | 4,634,975 | 7,299,365 | ||||
| Share capital (e) | 12,347,593 | 11,577,934 | ||||
| Contributed surplus | 1,030,532 | 804,412 | ||||
| Deficit | (8,743,150 | ) | (5,082,981 | ) | ||
| 4,634,975 | 7,299,365 | |||||
| Impairment of oil and gas properties | (2,378,657 | ) | (2,967,387 | ) | ||
| Depletion, amortization and accretion | 704,181 | 321,709 | ||||
| Tax impact on renouncement of flow-through shares | (107,700 | ) | (934,044 | ) | ||
| Shareholders' equity - US GAAP | $ | 2,852,799 | $ | 3,719,643 |
74
| BERKLEY RESOURCES INC. |
| NOTES TO FINANCIAL STATEMENTS |
| December 31, 2007 and 2006 |
| 16. | Reconciliation Between Canadian and United States Generally Accepted Accounting Policies-Continued | |
| a) | Under US GAAP the ceiling test for impairment used in connection with the full cost method of accounting for oil and gas operations requires the discounting of future net operating revenues by 10% using proved reserves only under constant pricing. Under Canadian GAAP, the ceiling test is based on discounted future net operating revenues using the Company’s risk-free rate of interest for proved and probable reserves at forecasted pricing. | |
At December 31, 2007, the Company applied a ceiling test to its oil and gas properties using December 31, 2007 prices of: | ||
| Gas (per thousand cubic feet) | $ 6.30 CDN |
| Crude oil (per barrel) | $76.53 CDN |
The application of the US GAAP ceiling test resulted in a decrease to the carrying value of the oil and gas properties of $3,494,270. Under Canadian GAAP, the application of this test required an additional impairment to that required under US GAAP of $588,730 for a total reduction in the carrying value of the oil and gas properties of $4,083,000.
At December 31, 2006, the Company applied a ceiling test to its oil and gas properties using December 31, 2006 prices of:
| Gas (per thousand cubic feet) | $ 5.95 CDN |
| Crude oil (per barrel) | $60.20 CDN |
The application of the US GAAP ceiling test resulted in a decrease to the carrying value of the oil and gas properties of $3,050,784. Under Canadian GAAP, the application of this test required a reduced impairment of $2,385,000 to the carrying value of the oil and gas properties for a difference between the two of $665,784.
At December 31, 2005, the Company applied a ceiling test to its oil and gas properties using December 31, 2005 prices of:
| Gas (per thousand cubic feet) | $ 9.54 CDN |
| Crude oil (per barrel) | $59.44 CDN |
The application of the US GAAP ceiling test resulted in an additional impairment to carrying value of the oil and gas properties of $2,301,603. The change from the previously reported impairment amount of $600,000 was a result of the ceiling test initially being calculated using a discount rate of 5% as opposed to the 10% discount rate that is required for constant pricing under US GAAP. The revised write-down for the year ended December 31, 2005 reflects the write-down required as a result of the carrying value of the oil and gas properties exceeding the ceiling test value under US GAAP.
In addition, the cumulative difference between Canadian GAAP and US GAAP since inception of oil and gas operations to December 31, 2007 is that additional depletion of $704,181 (2006 – $321,709, 2005 - $Nil) has been recorded under US GAAP.
75
| BERKLEY RESOURCES INC. |
| NOTES TO FINANCIAL STATEMENTS |
| December 31, 2007 and 2006 |
| 16. | Reconciliation Between Canadian and United States Generally Accepted Accounting Policies-Continued | |
| b) | During 2004, the Company adopted the fair value based method of accounting under Canadian GAAP for stock based compensation, as described in Notes 3i and 4a, with retroactive application with restatement of the prior year’s statement of operations. Statement of Financial Accounting Standards (“SFAS”) No. 148, Accounting for Stock-based Compensation – Transition and Disclosure, issued by the United States Financial Accounting Standards Board (“FASB”) provides alternative methods of transition for entities that voluntarily change to the fair value based method of accounting and amends the disclosure provisions of SFAS No. 123, Accounting for Stock-based Compensation. For US GAAP purposes, the Company has adopted SFAS No. 123 and its amendment SFAS No. 123R, prospectively as of January 1, 2003. As a result, the stock option compensation expense recognized in 2007 is not materially different between US and Canadian GAAP. | |
| Stock Options | |||||||
| December 31, 2007 | Number of options |
|
| Aggregate Intrinsic Value | |||
| Options outstanding at end of year | 2,550,500 |
| $ | 574,519 | |||
| Options exercisable at end of year | 2,150,539 |
| $ | 469,667 |
| c) | Pro-forma disclosure of asset retirement obligations | |
SFAS 143 “Accounting for Asset Retirement Obligations” requires the recognition of the estimated fair value of asset retirement obligations as a liability commencing for all fiscal years beginning after June 15, 2002. The Company has adopted CICA Handbook Section 3110, which is in all material respects the same as FASB 143, effective January 1, 2003. Accordingly, there were no material differences between Canadian GAAP and US GAAP in respect of the accounting for asset retirement obligations. | ||
| d) | Under Canadian GAAP, the future income taxes are calculated based on enacted or substantially enacted tax rates applicable to future years. Under US GAAP, only enacted rates are used in the calculation of future income taxes. This difference in GAAP did not result in a difference in the financial position, results of operations or cash flows of the Company for the years ended December 31, 2007, 2006 and 2005. | |
Under Canadian income tax legislation, a company is permitted to issue shares whereby the company agrees to incur qualifying expenditures and renounce the related income tax deductions to the investors. The Company has accounted for the issue of flow-through shares using a method in accordance with Canadian GAAP. At the time of issue, the funds received are recorded as share capital. At the time the expenditures are renounced for tax purposes, the tax effect of the expenditures is debited to share capital and a related future tax liability is created. This liability may be subsequently removed with tax assets. For US GAAP, the premium paid in excess of the market value is credited to other liabilities and included in income as the qualifying expenditures are made and renounced. There was a premium received for the 2006 and 2007 flow-through offerings (note 16i). | ||
Also, notwithstanding whether there is a specific requirement to segregate the funds, the flow-through funds which are unexpended at the balance sheet dates are considered to be restricted and are not considered cash or cash equivalents under US GAAP. At December 31, 2007, unexpended flow- through funds were $1,400,100 (2006 - $2,673,196)(Note 11e). | ||
| e) | In May 2003, the FASB issued Statement No. 150 (“SFAS No. 150”), Accounting for Certain Financial Instruments with Characteristics of both Liabilities and Equity. SFAS No. 150 establishes standards for classifying and measuring as liabilities certain financial instruments that embody obligations of the issuer and have characteristics of both liabilities and equity. SFAS No. 150 represents a significant change in practice in the accounting for a number of financial instruments, including mandatorily redeemable equity instruments and certain equity derivatives. SFAS No. 150 is effective for all financial instruments created or modified after May 31, 2003, and to other instruments as of September 1, 2003. The Company has not issued any financial instruments that fall under the scope of SFAS No. 150 and the adoption of this statement did not have a material impact on the Company’s financial position or results of operations. |
76
| BERKLEY RESOURCES INC. |
| NOTES TO FINANCIAL STATEMENTS |
| December 31, 2007 and 2006 |
| 16. | Reconciliation Between Canadian and United States Generally Accepted Accounting Policies-Continued | ||
| f) | In December 2004, FASB issued SFAS No. 153, “Exchanges of Nonmonetary Assets - An Amendment of APB Opinion No. 29”. The guidance in APB Opinion No. 29, “Accounting for Nonmonetary Transactions”, is based on the principle that exchanges of nonmonetary assets should be measured based on the fair value of the assets exchanged. The guidance in that Opinion, however, included certain exceptions to that principle. SFAS No. 153 amends Opinion No. 29 to eliminate the exception for nonmonetary exchanges of similar productive assets and replaces it with a general exception for exchanges of nonmonetary assets that do not have commercial substance. A nonmonetary exchange has commercial substance if the future cash flows of the entity are expected to change significantly as a result of the exchange. The provisions of SFAS No. 153 are effective for nonmonetary asset exchanges occurring in fiscal periods beginning after June 15, 2005. Early application is permitted and companies must apply the standard prospectively. The adoption of this standard is not expected to have a material effect on the Company’s results of operations or financial position. | ||
| g) | In May 2005, the FASB issued SFAS 154, “Accounting Changes and Error Corrections,” which replaces APB Opinion No. 20, “Accounting Changes,” and supersedes FASB Statement No. 3, “Reporting Accounting Changes in Interim Financial Statements – an amendment of APB Opinion No. 28. ” SFAS 154 requires retrospective application to prior periods’ financial statements of changes in accounting principle, unless it is impracticable to determine either the period-specific effects or the cumulative effect of the change. When it is impracticable to determine the period-specific effects of an accounting change on one or more individual prior periods presented, SFAS 154 requires that the new accounting principle be applied to the balances of assets and liabilities as of the beginning of the earliest period for which retrospective application is practicable and that a corresponding adjustment be made to the opening balance of retained earnings for that period rather than being reported in an income statement. When it is impracticable to determine the cumulative effect of applying a change in accounting principle to all prior periods, SFAS 154 requires that the new accounting principle be applied as if it were adopted prospectively from the earliest date practicable. SFAS 154 shall be effective for accounting changes and corrections of errors made in fiscal years beginning after December 15, 2005. The Company does not expect the provisions of SFAS 154 will have a significant impact on its results of operations. | ||
| h) | In February 2006, the FASB issued SFAS No. 155, “Accounting for Certain Hybrid Financial Instruments, an amendment of FASB Statements No. 133 and 140.” This statement permits fair value re-measurement for any hybrid financial instrument that contains an embedded derivative that otherwise would require bifurcation. It establishes a requirement to evaluate interests in securitized financial assets to identify interests that are freestanding derivatives or that are hybrid financial instruments that contain an embedded derivative requiring bifurcation. In addition, SFAS 155 clarifies which interest-only strips and principal-only strips are not subject to the requirements of Statement 133. It also clarifies that concentrations of credit risk in the form of subordination are not embedded derivatives. SFAS 155 amends Statement 140 to eliminate the prohibition on a qualifying special- purpose entity from holding a derivative financial instrument that pertains to a beneficial interest other than another derivative financial instrument. This Statement is effective for all financial instruments acquired or issued after the beginning of an entity’s first fiscal year that begins after September 15, 2006. The adoption of this standard is not expected to have a material effect on the Company’s results of operations or financial position. | ||
77
| BERKLEY RESOURCES INC. |
| NOTES TO FINANCIAL STATEMENTS |
| December 31, 2007 and 2006 |
| 16. | Reconciliation Between Canadian and United States Generally Accepted Accounting Policies-Continued | |
| i) | Under United States GAAP SFAS 109, if flow-through shares are sold at a premium, the premium is recorded as a liability. If flow-through shares are sold at a discount, the discount is recorded as an asset. As restricted cash is spent, the premium or discount is recognized as income or expense, respectively. | |
The December 2006 flow-through shares were priced at $0.90 and the fair market of the Company’s shares was $0.85. | ||
Premium on flow-through share issuance is as follows: | ||
| 3,613,015 flow-through shares at $0.90 | $ | 3,251,713 | ||
| 3,613,015 flow-through shares at $0.85 | 3,071,063 | |||
| Premium on flow-through shares | $ | 180,650 |
The December 2007 flow-through shares were priced at $0.65 and the fair market of the Company’s shares was $0.60.
Premium on flow-through share issuance is as follows:
| 2,154,000 flow-through shares at $0.65 | $ | 1,400,100 | ||
| 2,154,000 flow-through shares at $0.60 | 1,292,400 | |||
| Premium on flow-through shares | $ | 107,700 |
| j) | Presentation | ||
There are different presentations between Canadian and U.S. GAAP which are as follows: | |||
| 1) | No subtotal is permitted under U.S. GAAP within cashflow from operations on the statement of cashflows. | ||
| 2) | Under U.S. GAAP, there is no difference between net income and total comprehensive income. | ||
78
| BERKLEY RESOURCES INC. |
| NOTES TO FINANCIAL STATEMENTS |
| December 31, 2007 and 2006 |
| 17. | Correction of error |
In 2006 the Company determined that the 2005 financial statements erroneously stated a write-down against its oil and gas properties and equipment. The original ceiling test calculations resulted in a write-down of $1,400,000 which was applied against operations in 2005. A correction in the calculations in accordance with Canadian GAAP resulted in no write-down being required. An adjustment has been made to credit the write- down expense and debit accumulated amortization and depletion for the amount of $1,400,000. The following outlines the adjustment to the 2005 financial statements: |
| December 31, 2005 | December 31, 2005 | |||||||||
| as previously reported | Adjustment | as restated | ||||||||
| Asset | ||||||||||
| Oil & gas properties and equipment | $ | 3,939,531 | $ | 1,400,000 | $ | 5,339,531 | ||||
| Equity | ||||||||||
| Deficit | 3,246,222 | (1,400,000 | ) | 1,846,222 | ||||||
| Expense | ||||||||||
| Write-down of oil and gas properties | 1,400,000 | (1,400,000 | ) | - | ||||||
| Net oil and gas income (loss) | (1,266,981 | ) | 1,400,000 | 133,019 | ||||||
| Loss or the year | $ | (1,922,458 | ) | $ | 1,400,000 | $ | (522,458 | ) |
| 18. | Subsequent Event |
Subsequent to year end, the Company received a default notice concerning amounts owing to its joint venture partner with respect to the Senex area operations. There are several items in this account that are in dispute and each party is bringing forth its position to the courts. The outcome of this dispute is undeterminable at this time. |
79
EXHIBIT INDEX
| Exhibit Number | Name |
| 1. | Memorandum of Berkley Resources Inc.* |
| 2. | Articles of Berkley Resources Inc.* |
| 12.1 | Certification of the Principal Executive Officer under the Sarbanes-Oxley Act |
| 12.2 | Certification of the Principal Financial Officer under the Sarbanes-Oxley Act |
| 13.1 | Certificate of the Principal Executive Officer under section 906 |
| 13.2 | Certificate of the Principal Financial Officer under section 906 |
| 15.1 | Consent of Experts |
| * Previously filed. | |
80