
ManpowerGroup Second Quarter Results | July 24, 2017 Exhibit 99.2

ManpowerGroup July 2017 2 FORWARD-LOOKING STATEMENT This presentation contains statements, including financial projections, that are forward- looking in nature. These statements are based on managements’ current expectations or beliefs, and are subject to known and unknown risks and uncertainties regarding expected future results. Actual results might differ materially from those projected in the forward-looking statements. Additional information concerning factors that could cause actual results to materially differ from those in the forward-looking statements is contained in the ManpowerGroup Inc. Annual Report on Form 10-K dated December 31, 2016, which information is incorporated herein by reference, and such other factors as may be described from time to time in the Company’s SEC filings. Any forward-looking statements in this presentation speak only as of the date hereof. The Company assumes no obligation to update or revise any forward-looking statements.
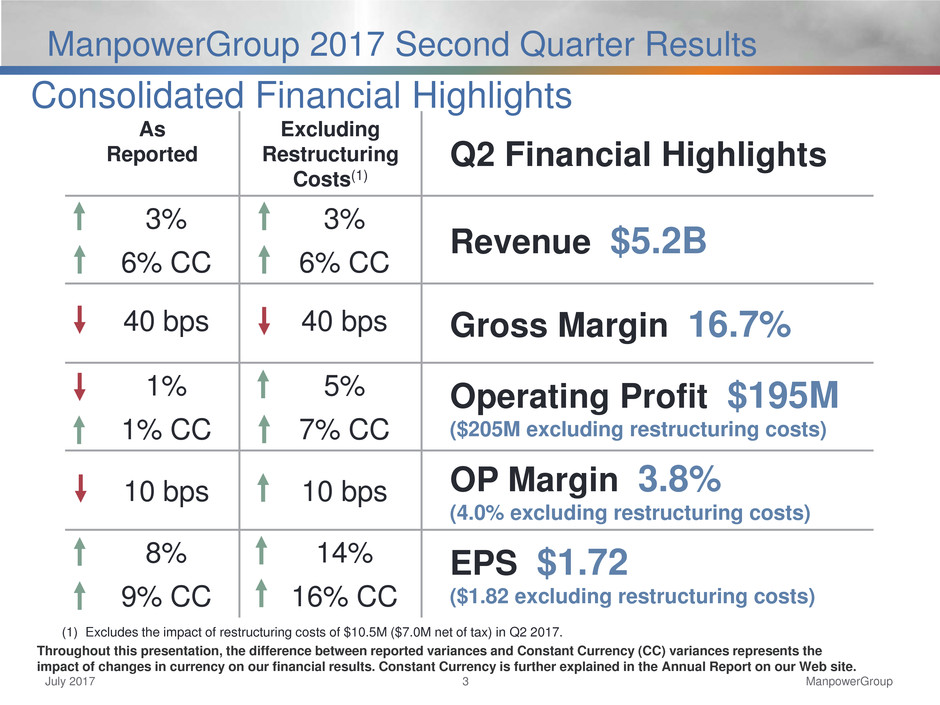
ManpowerGroup July 2017 3 ManpowerGroup 2017 Second Quarter Results Throughout this presentation, the difference between reported variances and Constant Currency (CC) variances represents the impact of changes in currency on our financial results. Constant Currency is further explained in the Annual Report on our Web site. As Reported Excluding Restructuring Costs(1) Q2 Financial Highlights 3% 3% Revenue $5.2B 6% CC 6% CC 40 bps 40 bps Gross Margin 16.7% 1% 5% Operating Profit $195M ($205M excluding restructuring costs) 1% CC 7% CC 10 bps 10 bps OP Margin 3.8% (4.0% excluding restructuring costs) 8% 14% EPS $1.72 ($1.82 excluding restructuring costs) 9% CC 16% CC (1) Excludes the impact of restructuring costs of $10.5M ($7.0M net of tax) in Q2 2017. Consolidated Financial Highlights
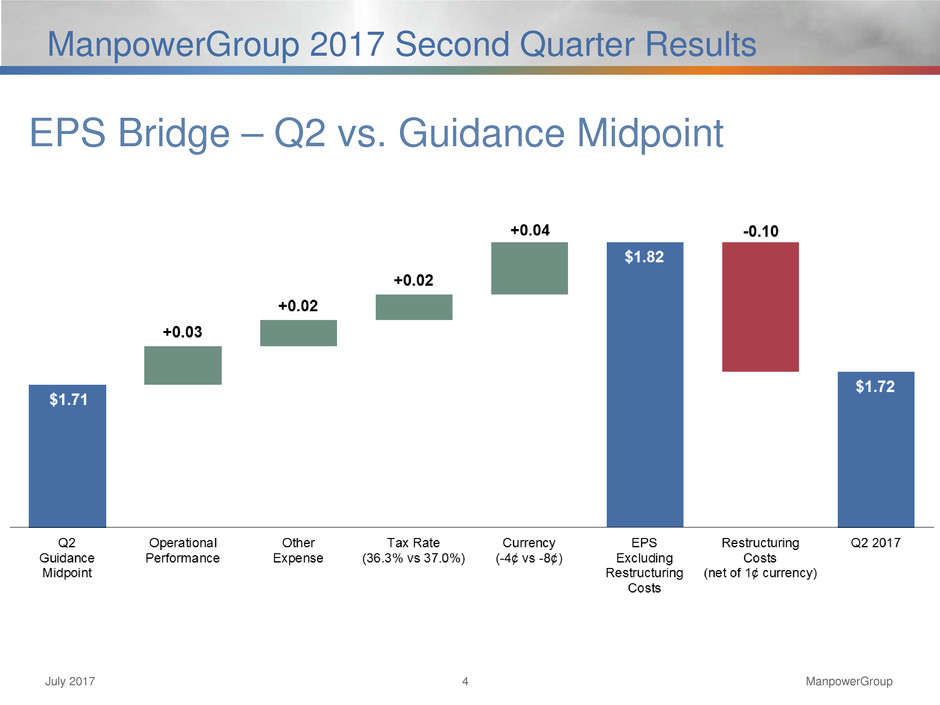
ManpowerGroup July 2017 4 ManpowerGroup 2017 Second Quarter Results EPS Bridge – Q2 vs. Guidance Midpoint

ManpowerGroup July 2017 5 ManpowerGroup 2017 Second Quarter Results Consolidated Gross Margin Change 17.1% 16.7% Q2 2016 Staffing Right Management / Solutions Currency Q2 2017 -0.3% -0.2% +0.1%
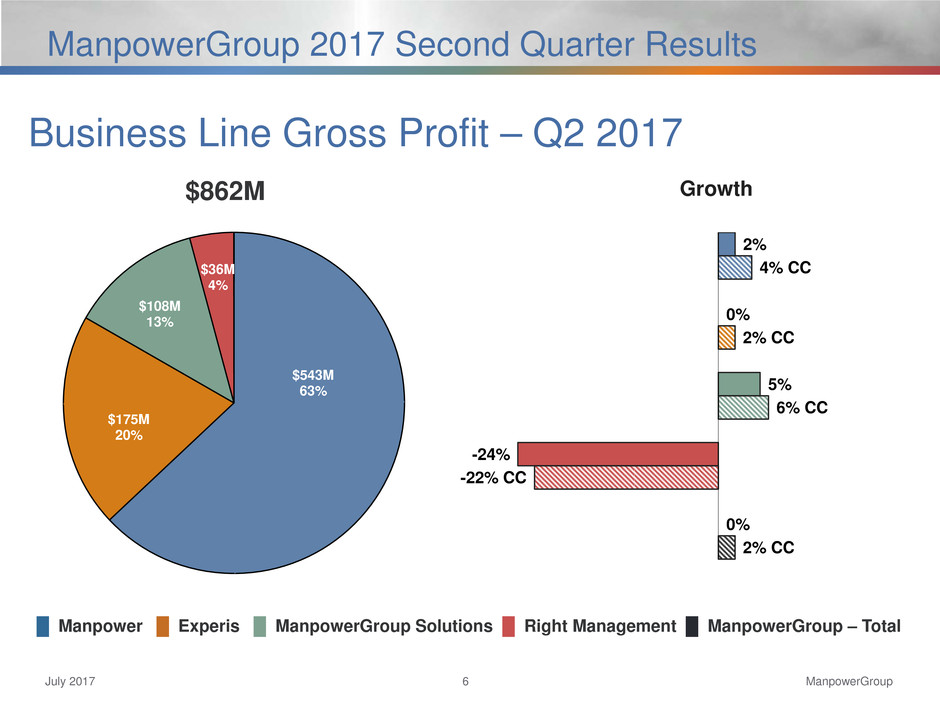
ManpowerGroup July 2017 6 ManpowerGroup 2017 Second Quarter Results 2% 4% CC 0% 2% CC 5% 6% CC -24% -22% CC 0% 2% CC Growth █ Manpower █ Experis █ ManpowerGroup Solutions █ Right Management █ ManpowerGroup – Total Business Line Gross Profit – Q2 2017 $543M 63% $175M 20% $108M 13% $36M 4% $862M

ManpowerGroup July 2017 7 ManpowerGroup 2017 Second Quarter Results SG&A Expense Bridge – Q2 YoY (in millions of USD) 656.6 664.7 667.1 Q2 2016 Currency Acquisitions Operational Impact Q2 2017 Excluding Restructuring Costs Restructuring Costs Q2 2017 -15.7 +5.8 +10.5 +1.8 13.2% % of Revenue 12.7% % of Revenue % of Revenue 12.9%

ManpowerGroup July 2017 8 ManpowerGroup 2017 Second Quarter Results As Reported Excluding Restructuring Costs(1) Q2 Financial Highlights 2% 2% Revenue $1.1B 1% CC 1% CC 7% 19% OUP $58M 7% CC 19% CC 40 bps 100 bps OUP Margin 5.4% Operating Unit Profit (OUP) is the measure that we use to evaluate segment performance. OUP is equal to segment revenues less direct costs and branch and national headquarters operating costs. Americas Segment (20% of Revenue) (1) Excludes the impact of restructuring costs of $6.3M in Q2 2017.
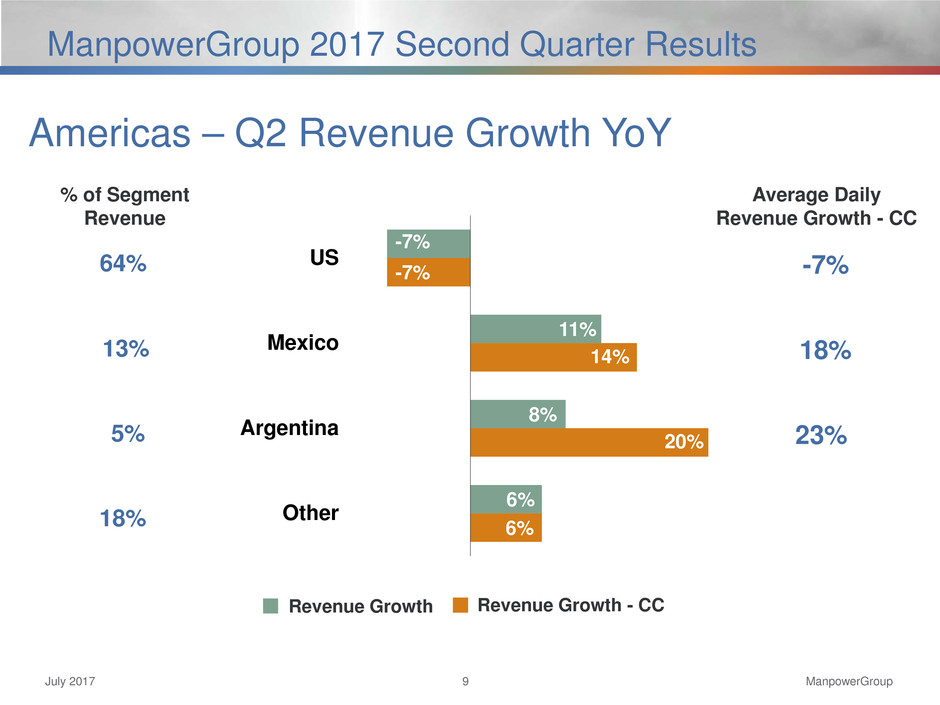
ManpowerGroup July 2017 9 ManpowerGroup 2017 Second Quarter Results Revenue Growth - CC Revenue Growth % of Segment Revenue Americas – Q2 Revenue Growth YoY Average Daily Revenue Growth - CC -7% 11% 8% 6% -7% 14% 20% 6% US Mexico Argentina Other 64% 13% 5% 18% -7% 18% 23%

ManpowerGroup July 2017 10 ManpowerGroup 2017 Second Quarter Results As Reported Q2 Financial Highlights 11% Revenue $2.1B 13% CC 8% OUP $110M 10% CC 10 bps OUP Margin 5.2% Southern Europe Segment (41% of Revenue)
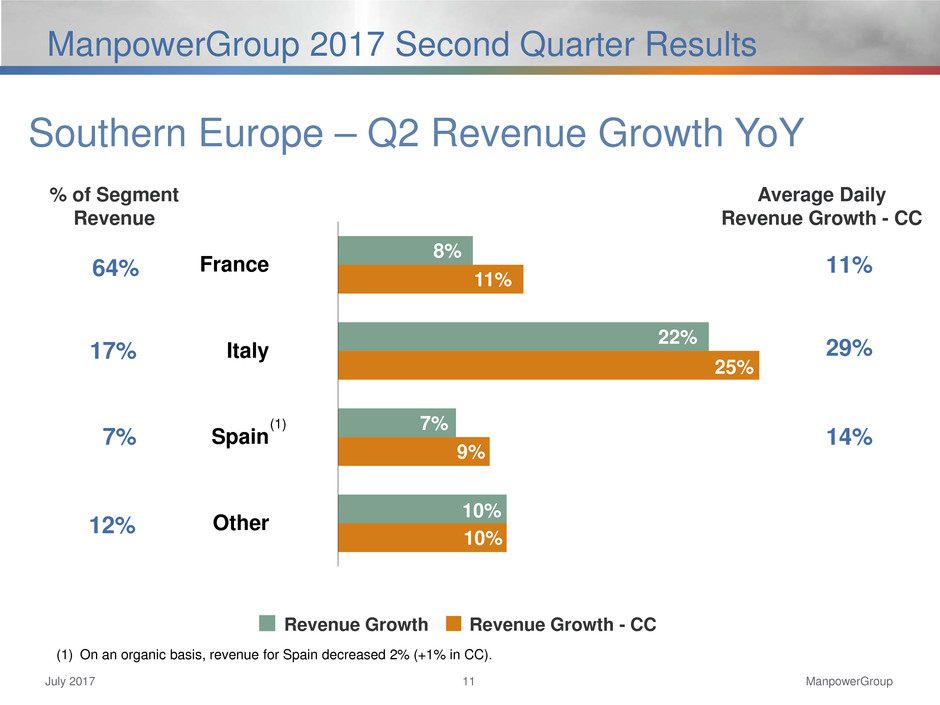
ManpowerGroup July 2017 11 ManpowerGroup 2017 Second Quarter Results Southern Europe – Q2 Revenue Growth YoY Revenue Growth - CC Revenue Growth % of Segment Revenue (1) (1) On an organic basis, revenue for Spain decreased 2% (+1% in CC). Average Daily Revenue Growth - CC 8% 22% 7% 10% 11% 25% 9% 10% France Italy Spain Other 64% 17% 7% 12% 11% 29% 14%
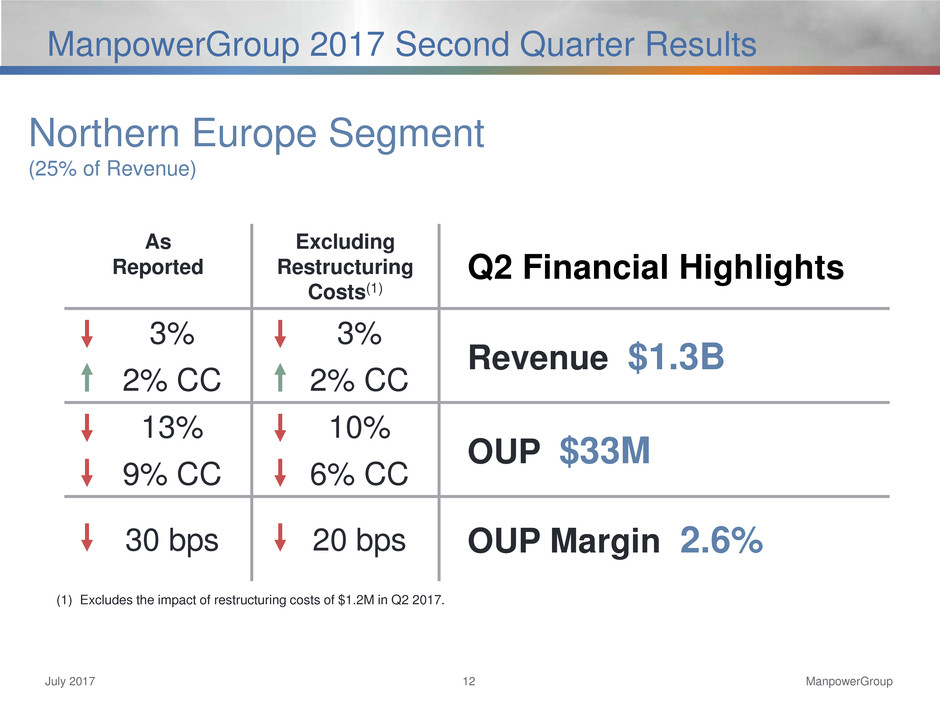
ManpowerGroup July 2017 12 ManpowerGroup 2017 Second Quarter Results As Reported Excluding Restructuring Costs(1) Q2 Financial Highlights 3% 3% Revenue $1.3B 2% CC 2% CC 13% 10% OUP $33M 9% CC 6% CC 30 bps 20 bps OUP Margin 2.6% (1) Excludes the impact of restructuring costs of $1.2M in Q2 2017. Northern Europe Segment (25% of Revenue)
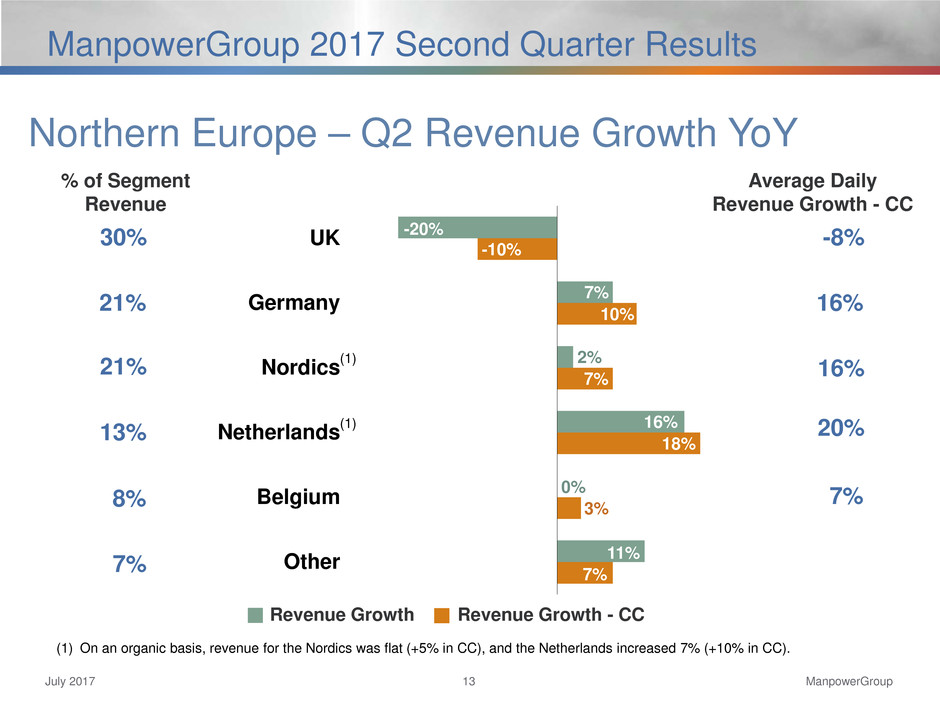
ManpowerGroup July 2017 13 ManpowerGroup 2017 Second Quarter Results -20% 7% 2% 16% 0% 11% -10% 10% 7% 18% 3% 7% UK Germany Nordics Netherlands Belgium Other 30% 21% 21% 13% 8% 7% -8% 16% 16% 20% 7% Northern Europe – Q2 Revenue Growth YoY Revenue Growth - CC Revenue Growth % of Segment Revenue (1) On an organic basis, revenue for the Nordics was flat (+5% in CC), and the Netherlands increased 7% (+10% in CC). (1) (1) Average Daily Revenue Growth - CC
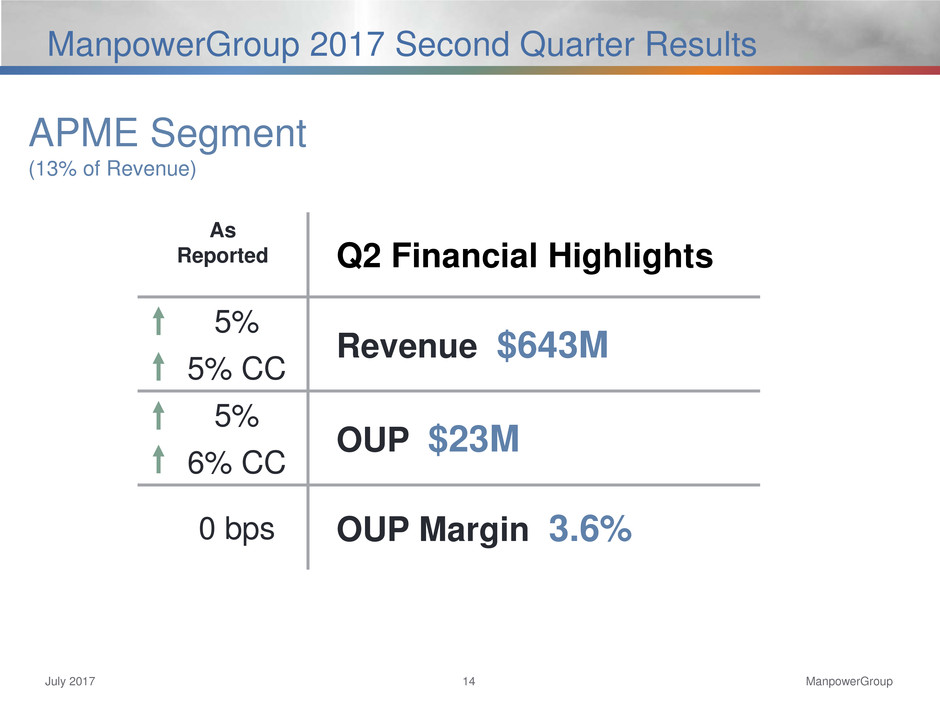
ManpowerGroup July 2017 14 ManpowerGroup 2017 Second Quarter Results As Reported Q2 Financial Highlights 5% Revenue $643M 5% CC 5% OUP $23M 6% CC 0 bps OUP Margin 3.6% APME Segment (13% of Revenue)

ManpowerGroup July 2017 15 ManpowerGroup 2017 Second Quarter Results 2% -4% 13% 5% -5% 12% Japan Australia/NZ Other 34% 23% 43% 3% -2% APME – Q2 Revenue Growth YoY Revenue Growth - CC Revenue Growth % of Segment Revenue Average Daily Revenue Growth - CC

ManpowerGroup July 2017 16 ManpowerGroup 2017 Second Quarter Results As Reported Excluding Restructuring Costs(1) Q2 Financial Highlights 22% 22% Revenue $57B 20% CC 20% CC 41% 27% OUP $8M 41% CC 27% CC 500 bps 140 bps OUP Margin 14.8% Right Management Segment (1% of Revenue) (1) Excludes the impact of restructuring costs of $2.0M in Q2 2017.

ManpowerGroup July 2017 17 ManpowerGroup 2017 Second Quarter Results Cash Flow Summary – 6 Months YTD (in millions of USD) 2017 2016 Net Earnings 191 187 Non-cash Provisions and Other 92 96 Change in Operating Assets/Liabilities (135) (21) Capital Expenditures (26) (31) Free Cash Flow 122 231 Change in Debt (4) (21) Acquisitions of Businesses, including Contingent Considerations, net of cash acquired (34) (44) Other Equity Transactions 18 (1) Repurchases of Common Stock (116) (291) Dividends Paid (62) (61) Effect of Exchange Rate Changes 48 - Other 3 3 Change in Cash (25) (184)

ManpowerGroup July 2017 18 ManpowerGroup 2017 Second Quarter Results Balance Sheet Highlights Total Debt (in millions of USD) Total Debt to Total Capitalization Total Debt Net Debt (Cash) -221 -231 125 227 109 318 516 468 855 825 834 891 -300 0 300 600 900 2013 2014 2015 2016 Q1 Q2 2017 15% 14% 24% 25% 25% 26% 0% 10% 20% 30% 2013 2014 2015 2016 Q1 Q2 2017

ManpowerGroup July 2017 19 ManpowerGroup 2017 Second Quarter Results (1) The $600M agreement requires that we comply with a Leverage Ratio (net Debt-to-EBITDA) of not greater than 3.5 to 1 and a Fixed Charge Coverage Ratio of not less than 1.5 to 1, in addition to other customary restrictive covenants. As defined in the agreement, we had a net Debt-to-EBITDA ratio of 0.84 and a fixed charge coverage ratio of 5.09 as of June 30, 2017. As of June 30, 2017, there were $0.8M of standby letters of credit issued under the agreement. (2) Represents subsidiary uncommitted lines of credit & overdraft facilities, which total $297.7M. Total subsidiary borrowings are limited to $300M due to restrictions in our Revolving Credit Facility, with the exception of Q3 when subsidiary borrowings are limited to $600M. Interest Rate Maturity Date Total Outstanding Remaining Available Euro Notes - €350M 4.505% Jun 2018 400 - Euro Notes - €400M 1.913% Sep 2022 454 - Revolving Credit Agreement 2.22% Sep 2020 - 599 Uncommitted lines and Other Various Various 37 261 Total Debt 891 860 Debt and Credit Facilities – June 30, 2017 (in millions of USD) (2) (1)

ManpowerGroup July 2017 20 ManpowerGroup 2017 Second Quarter Results Third Quarter Outlook Revenue Total Up 5-7% (Up 4-6% CC) Americas Down 2-4% (Down 2-4% CC) Southern Europe Up 12-14% (Up 10-12% CC) Northern Europe Up 2-4% (Up 1-3% CC) APME Up 2-4% (Up 5-7% CC) Right Management Down 16-18% (Down 16-18% CC) Gross Profit Margin 16.5 – 16.7% Operating Profit Margin 4.0 – 4.2% Tax Rate 37.0% EPS $1.90 – $1.98 (favorable $0.02 currency)
ManpowerGroup July 2017 21 ManpowerGroup 2017 Second Quarter Results Strong performance in the second quarter, with improving top line growth and solid bottom line performance. Continued slow growth environment but improving economic and labor market outlook in many parts of the world, particularly in Europe. Our extensive portfolio of services and solutions bridges the gap between supply and demand. We help companies engage productive and skilled talent where and when they need them, and we help individuals find meaningful and sustainable employment while acquiring additional skills and work experience. Much of our progress in innovation, efficiency, and new service offerings will be enabled by leveraging technology and strengthening our digital capabilities. Our investments in these areas are helping to build relationships with clients and candidates while improving our productivity. Key Take Aways