Exhibit 99.2

Manpower Inc.
2005 1st Quarter Results
April 19, 2005
Forward Looking Statement:
This presentation includes forward-looking statements which are subject to risks and uncertainties. Actual results might differ materially from those projected in the forward-looking statements. Forward-looking statements can be identified by words such as “expect,” “plan,” “may,” “will,” and similar expressions. Additional information concerning factors that could cause actual results to materially differ from those in the forward-looking statements is contained in the Company’s Annual Report on Form 10-K dated December 31, 2004, which information is incorporated herein by reference, and such other factors as may be described from time to time in the Company’s SEC filings.
Consolidated Financial Highlights
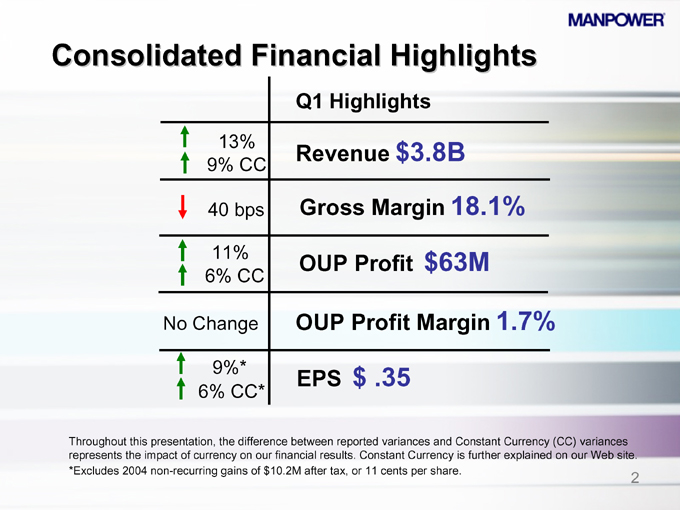
Q1 Highlights
13% 9% CC Revenue $3.8B
40 bps Gross Margin 18.1%
11% 6% CC OUP Profit $63M
No Change OUP Profit Margin 1.7%
9%* 6% CC* EPS $ .35
Throughout this presentation, the difference between reported variances and Constant Currency (CC) variances represents the impact of currency on our financial results. Constant Currency is further explained on our Web site. *Excludes 2004 non-recurring gains of $10.2M after tax, or 11 cents per share.
2
Consolidated Financial Highlights
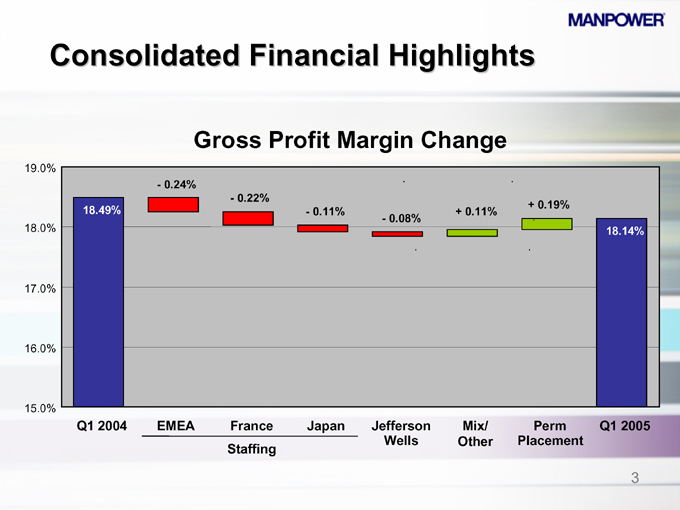
Gross Profit Margin Change
19.0% 18.0% 17.0% 16.0% 15.0%
18.49%
- 0.24%
- 0.22%
- 0.11%
- 0.08%
+ 0.11%
+ 0.19%
18.14%
Q1 2004 EMEA France Japan Jefferson Mix/ Perm Q1 2005 Wells Other Placement Staffing
3
Consolidated Financial Highlights
We made investments in the first quarter as anticipated:
- 70 new offices
- 200+ permanent recruiters
Expense and efficiency initiatives progressing and having positive impacts.
Overall market is still optimistic, however, customers and prospects are continuing to be measured in their personnel decisions.
4
United States Segment
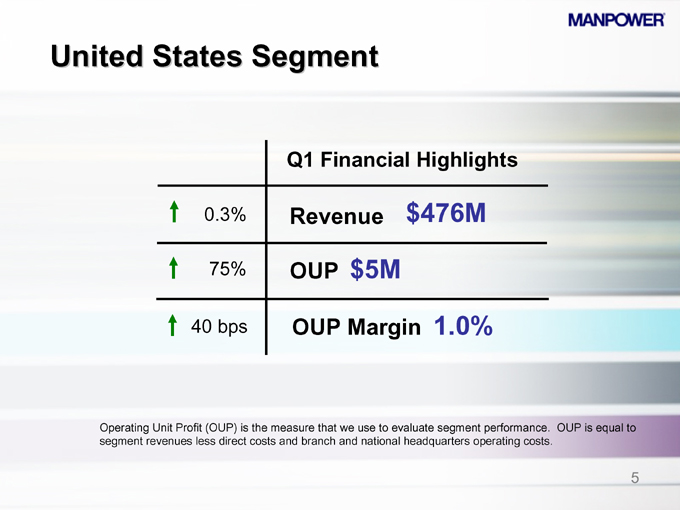
Q1 Financial Highlights
0.3% Revenue $476M
75% OUP $5M
40 bps OUP Margin 1.0%
Operating Unit Profit (OUP) is the measure that we use to evaluate segment performance. OUP is equal to segment revenues less direct costs and branch and national headquarters operating costs.
5
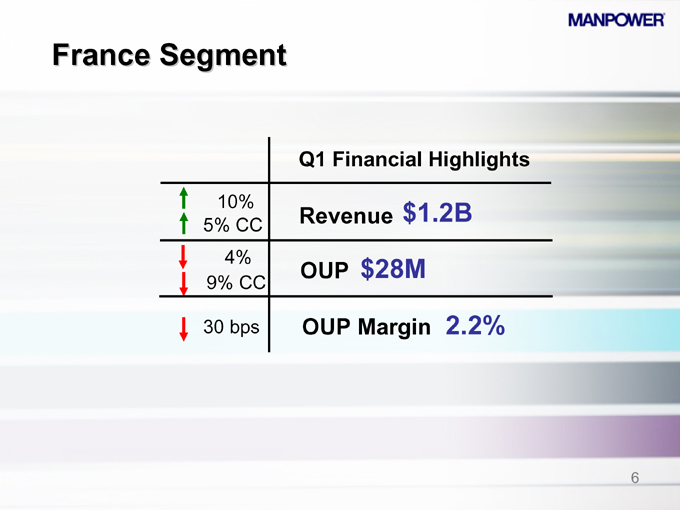
France Segment
Q1 Financial Highlights
10% $1.2B
5% CC Revenue
4% 9% CC OUP $28M
30 bps OUP Margin 2.2%
6
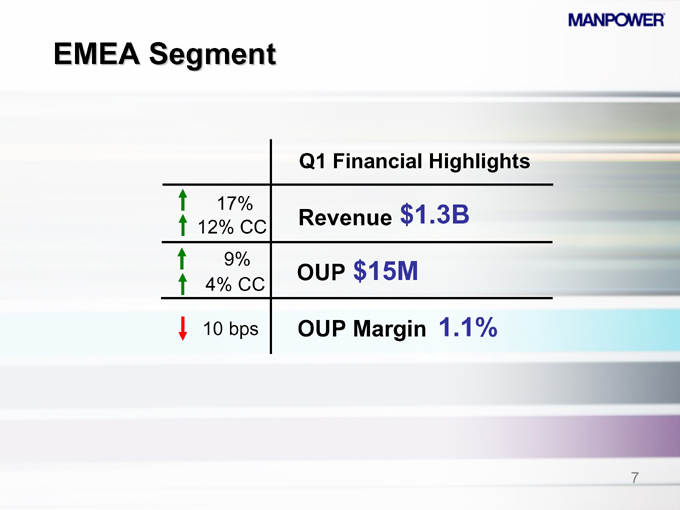
EMEA Segment
Q1 Financial Highlights
17% 12% CC Revenue $1.3B
9% 4% CC OUP $15M
10 bps OUP Margin 1.1%
7
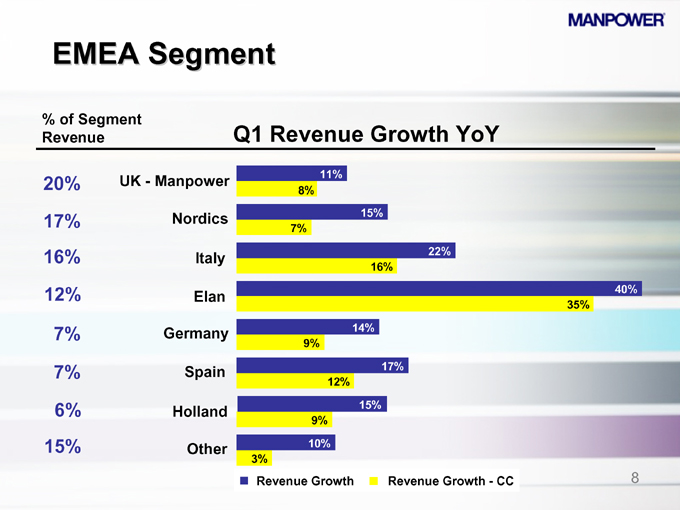
EMEA Segment
% of Segment Revenue Q1 Revenue Growth YoY
20% UK - Manpower 11%
8%
17% Nordics 15%
7%
16% Italy 22%
16%
12% Elan 40%
35%
7% Germany 14%
9%
7% Spain 17%
12%
6% Holland 15%
9%
15% Other 10%
3%
Revenue Growth Revenue Growth - CC
8
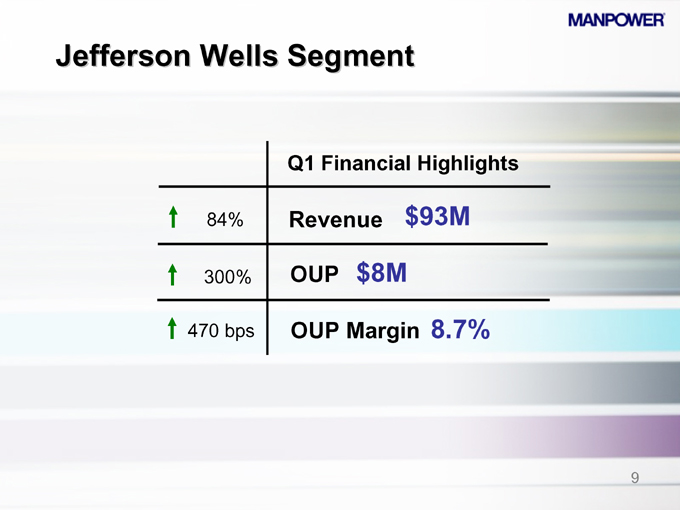
Jefferson Wells Segment
Q1 Financial Highlights
84% Revenue $93M
300% OUP $8M
470 bps OUP Margin 8.7%
9
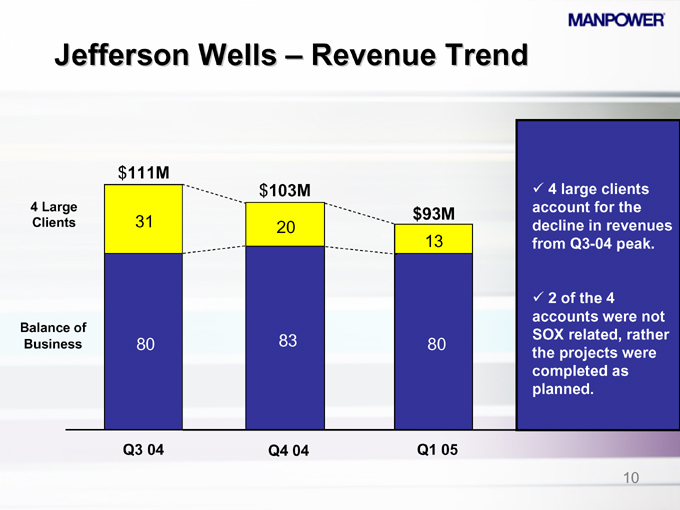
Jefferson Wells – Revenue Trend
4 Large Clients
Balance of Business $111M
31
80 $103M
20
83 $93M
13
80
Q3 04 Q4 04 Q1 05
4 large clients account for the decline in revenues from Q3-04 peak.
2 of the 4 accounts were not SOX related, rather the projects were completed as planned.
10
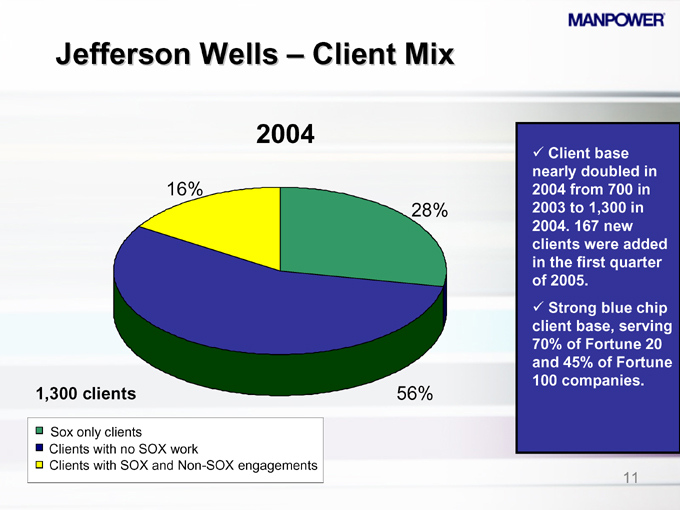
Jefferson Wells – Client Mix
2004
16%
28%
56%
1,300 clients
Sox only clients
Clients with no SOX work
Clients with SOX and Non-SOX engagements
Client base nearly doubled in 2004 from 700 in 2003 to 1,300 in 2004. 167 new clients were added in the first quarter of 2005.
Strong blue chip client base, serving 70% of Fortune 20 and 45% of Fortune 100 companies.
11
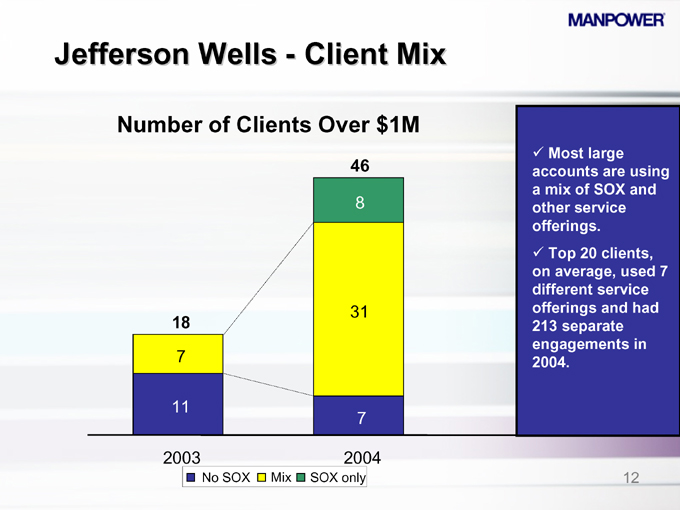
Jefferson Wells—Client Mix
Number of Clients Over $1M
46
8 31 7
18
7
11
2003 2004
No SOX Mix SOX only
Most large accounts are using a mix of SOX and other service offerings.
Top 20 clients, on average, used 7 different service offerings and had 213 separate engagements in 2004.
12

Jefferson Wells – Future Outlook
Jefferson Wells’ market position is strong and future growth prospects are solid.
Pipeline of sales opportunities are currently at record levels.
Transitioning contractors to full-time staff to support future growth.
Retention program implemented to retain highly skilled salaried professionals.
13
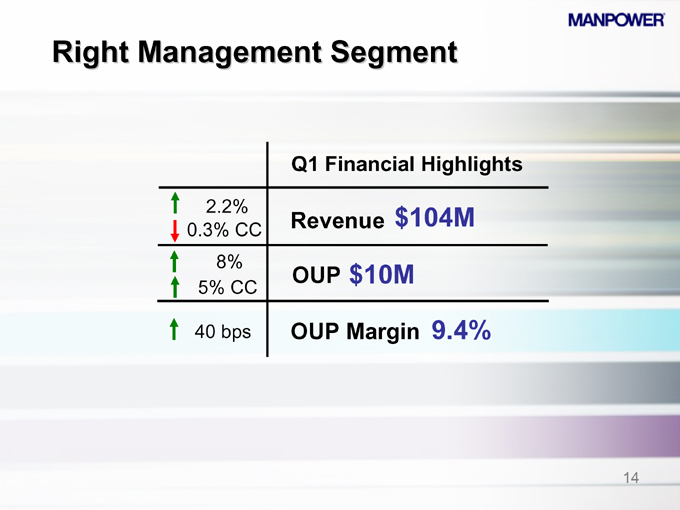
Right Management Segment
Q1 Financial Highlights
2.2% $104M
0.3% CC Revenue
8%
OUP $10M
5% CC
40 bps OUP Margin 9.4%
14
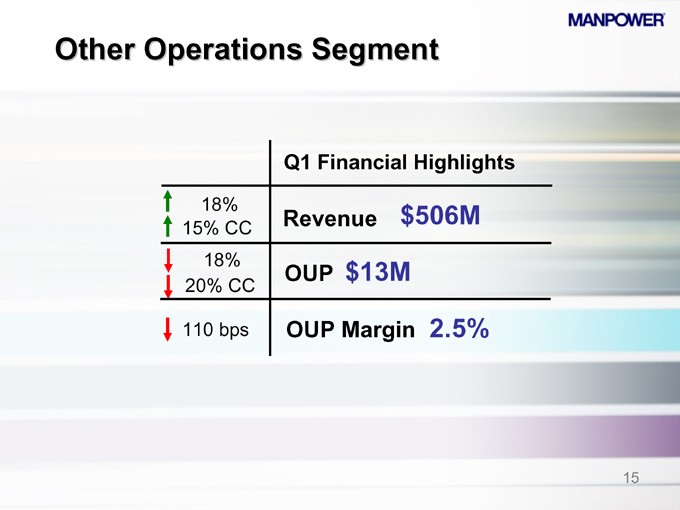
Other Operations Segment
Q1 Financial Highlights
18% $506M
15% CC Revenue
18% $13M
OUP
20% CC
110 bps OUP Margin 2.5%
15
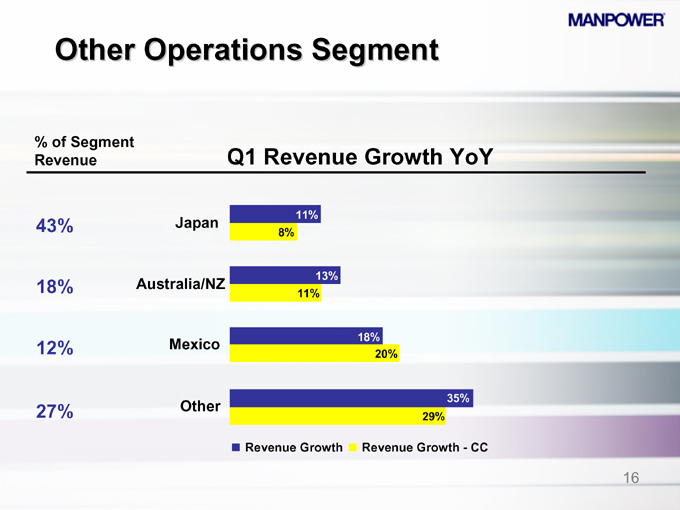
Other Operations Segment
% of Segment Revenue Q1 Revenue Growth YoY
11%
43% Japan
8%
13%
18% Australia/NZ
11%
Mexico 18%
12% 20%
35%
27% Other
29%
Revenue Growth Revenue Growth - CC
16

Financial Highlights
17
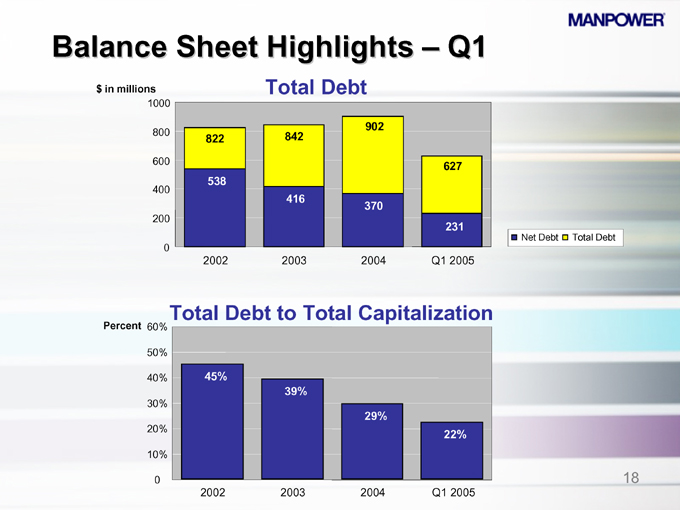
Balance Sheet Highlights – Q1
Total Debt $ in millions
1000 800 600 400 200 0
2002 2003 2004 Q1 2005
822
538
842
416
902
370
627
231
Total Debt to Total Capitalization
Percent 60% 50% 40% 30% 20% 10% 0
2002 2003 2004 Q1 2005
45%
39%
29%
22%
Net Debt Total Debt
18
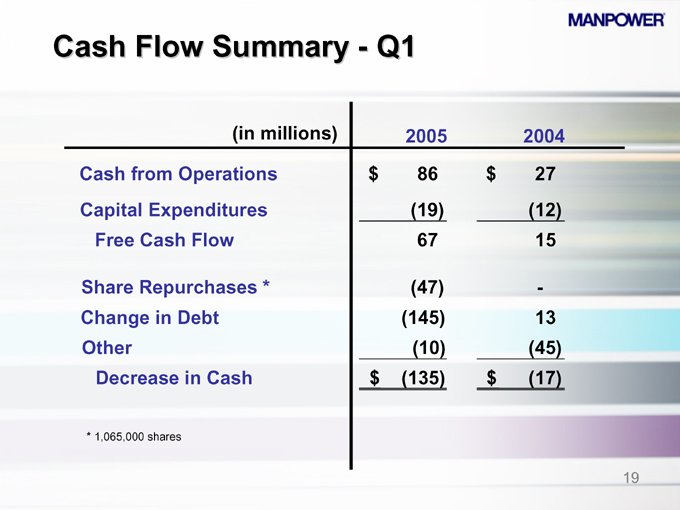
Cash Flow Summary - Q1
(in millions) 2005 2004
Cash from Operations $86 $27
Capital Expenditures (19) (12)
Free Cash Flow 67 15
Share Repurchases * (47) -
Change in Debt (145) 13
Other (10) (45)
Decrease in Cash $(135) $(17)
* 1,065,000 shares
19
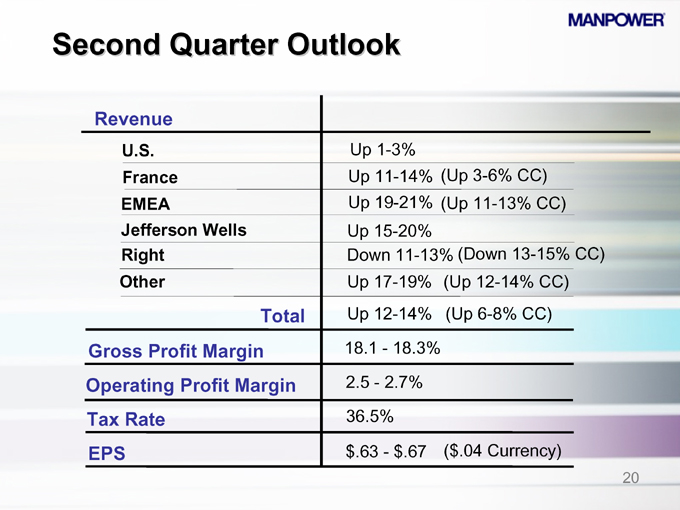
Second Quarter Outlook
Revenue
U.S. Up 1-3%
France Up 11-14% (Up 3-6% CC)
EMEA Up 19-21% (Up 11-13% CC)
Jefferson Wells Up 15-20%
Right Down 11-13% (Down 13-15% CC)
Other Up 17-19% (Up 12-14% CC)
Total Up 12-14% (Up 6-8% CC)
Gross Profit Margin 18.1 - 18.3%
Operating Profit Margin 2.5 - 2.7%
Tax Rate 36.5%
EPS $.63 - $.67 ($.04 Currency)
20

Manpower Inc.
2005 1st Quarter Results
April 19, 2005
Questions