Exhibit 99.2

Exhibit 99.2
Manpower Inc. 2005 2nd Quarter Results July 19, 2005
Forward Looking Statement:
This presentation includes forward-looking statements which are subject to risks and uncertainties. Actual results might differ materially from those projected in the forward-looking statements. Forward-looking statements can be identified by words such as “expect,” “plan,” “may,” “will,” and similar expressions. Additional information concerning factors that could cause actual results to materially differ from those in the forward-looking statements is contained in the Company’s Annual Report on Form 10-K dated December 31, 2004, which information is incorporated herein by reference, and such other factors as may be described from time to time in the Company’s SEC filings.
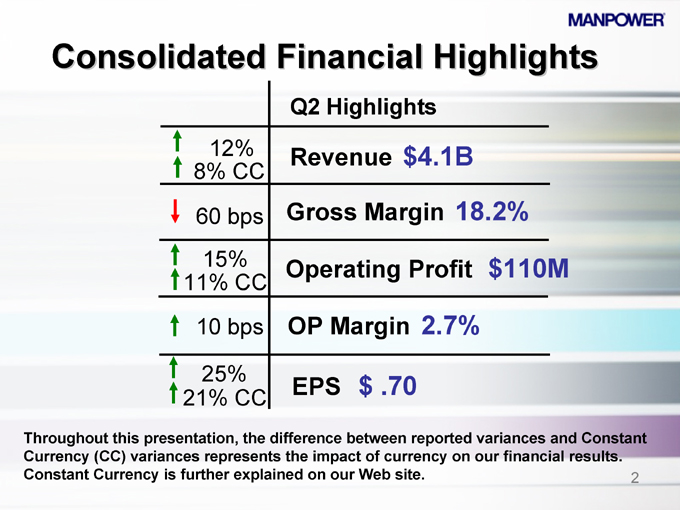
Consolidated Financial Highlights
Q2 Highlights
12% 8% CC Revenue $4.1B
60 bps Gross Margin 18.2%
15% 11% CC Operating Profit $110M
10 bps OP Margin 2.7%
25% 21% CC EPS $.70
Throughout this presentation, the difference between reported variances and Constant Currency (CC) variances represents the impact of currency on our financial results.
Constant Currency is further explained on our Web site.
2
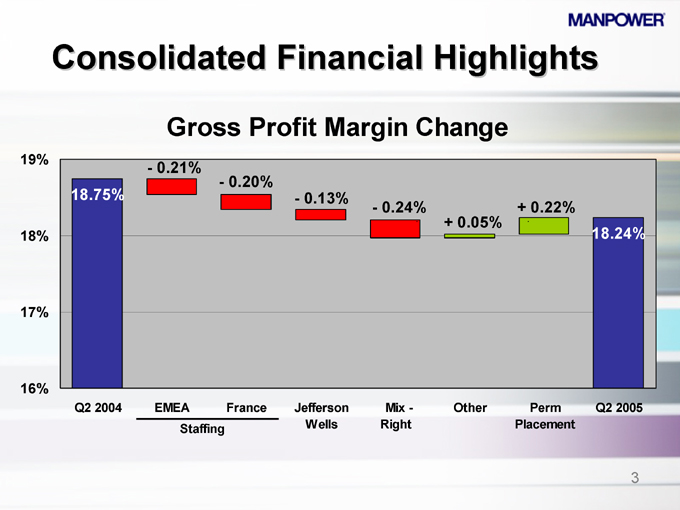
Consolidated Financial Highlights
Gross Profit Margin Change
19%
18%
17%
16%
18.75%
- 0.21%
- 0.20%
- 0.13%
- 0.24%
+ 0.05%
+ 0.22%
18.24%
Q2 2004
EMEA
France
Staffing
Jefferson Wells
Mix -Right
Other
Perm Placement
Q2 2005
3
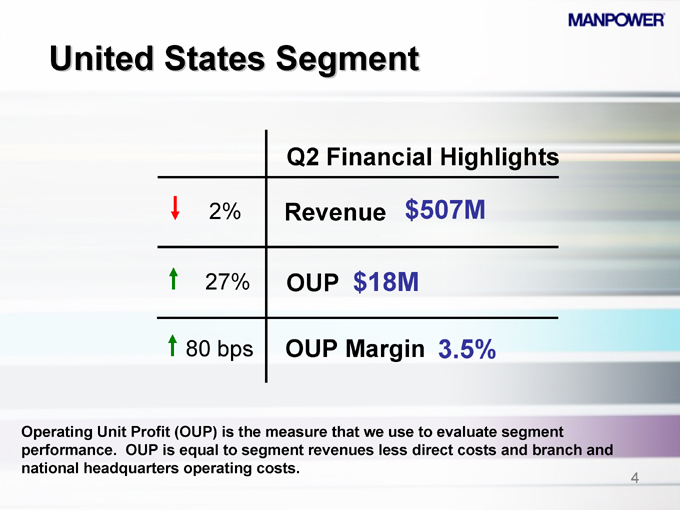
United States Segment
Q2 Financial Highlights
2% Revenue $507M
27% OUP $18M
80 bps OUP Margin 3.5%
Operating Unit Profit (OUP) is the measure that we use to evaluate segment performance. OUP is equal to segment revenues less direct costs and branch and national headquarters operating costs.
4
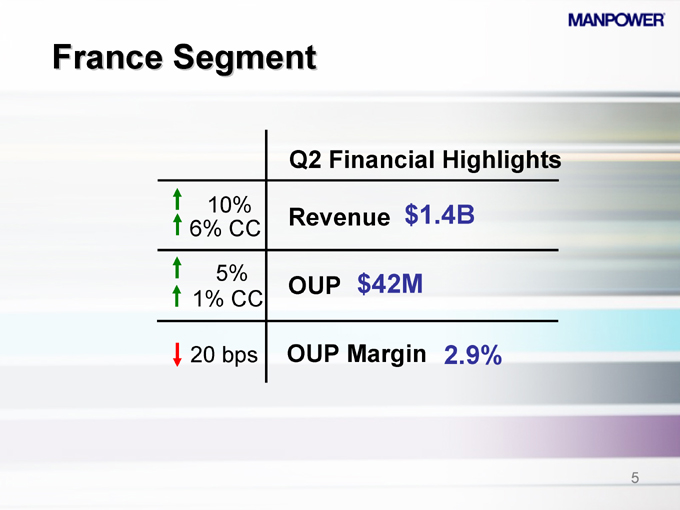
France Segment
Q2 Financial Highlights
10% 6% CC $1.4B Revenue
5% 1% CC $42M OUP
20 bps OUP Margin 2.9%
5
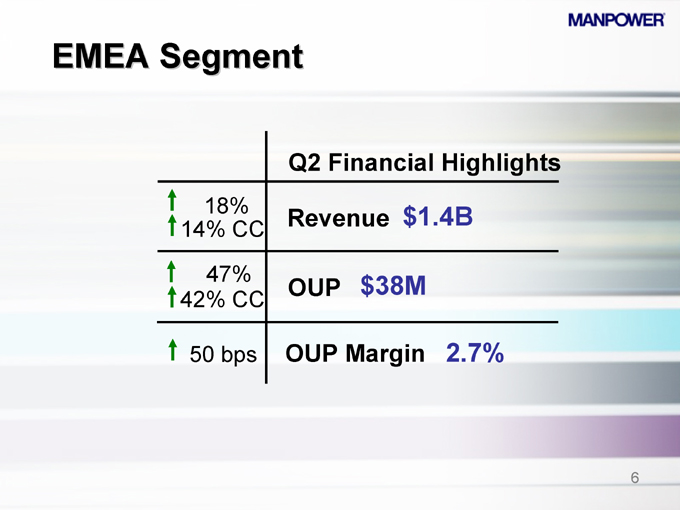
EMEA Segment
Q2 Financial Highlights
18% 14% CC $1.4B Revenue
47% 42% CC $38M OUP
50 bps OUP Margin 2.7%
6
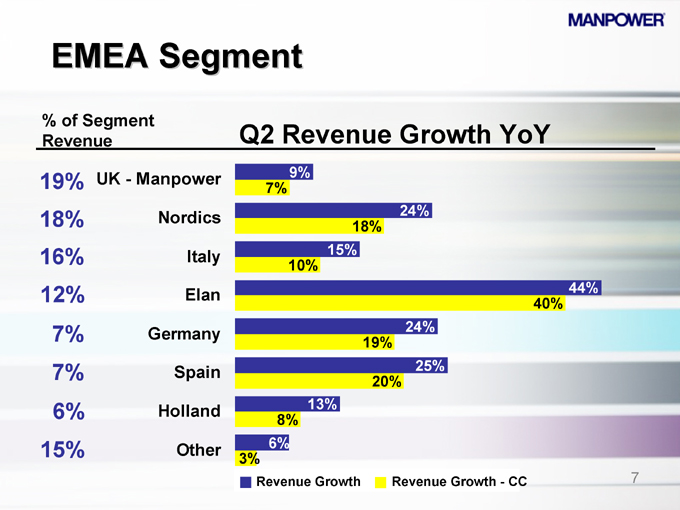
EMEA Segment
% of Segment
Revenue Q2 Revenue Growth YoY
19% UK—Manpower 9%
7%
18% Nordics 24%
18%
16% Italy 15%
10%
12% Elan 44%
40%
7% Germany 24%
19%
7% Spain 25%
20%
6% Holland 13%
8%
15% Other 6%
3%
Revenue Growth
Revenue Growth—CC
7
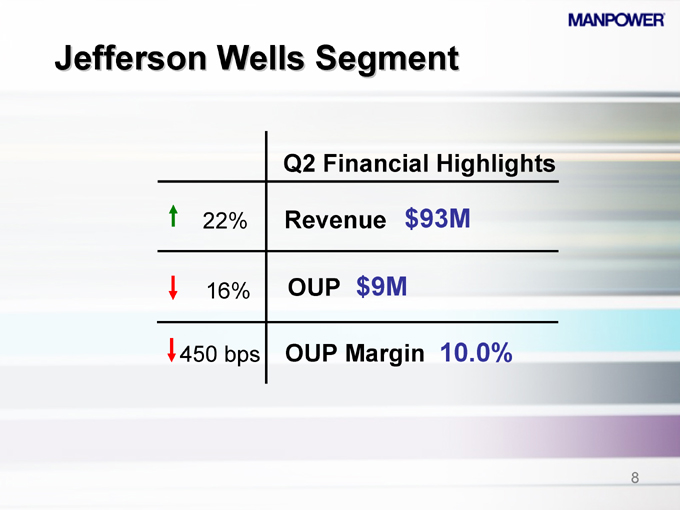
Jefferson Wells Segment
Q2 Financial Highlights
22% Revenue $93M
16% OUP $9M
450 bps OUP Margin 10.0%
8
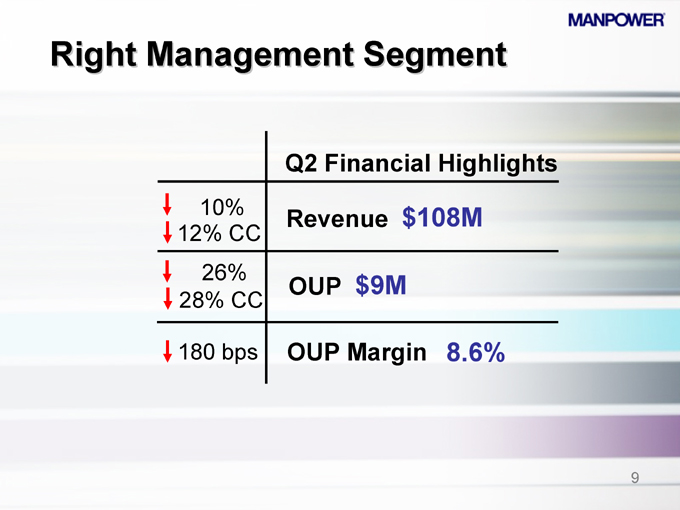
Right Management Segment
Q2 Financial Highlights
10% 12% CC Revenue $108M
26% 28% CC OUP $9M
180 bps OUP Margin 8.6%
9
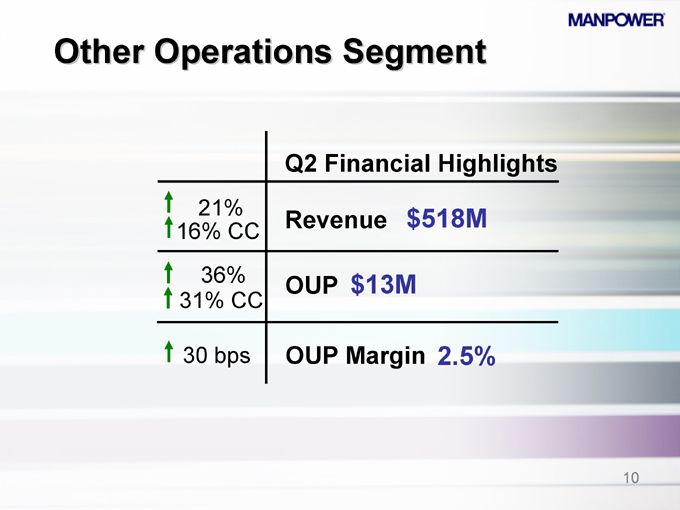
Other Operations Segment
Q2 Financial Highlights
21% 16% CC $518M Revenue
36% 31% CC OUP $13M
30 bps OUP Margin 2.5%
10
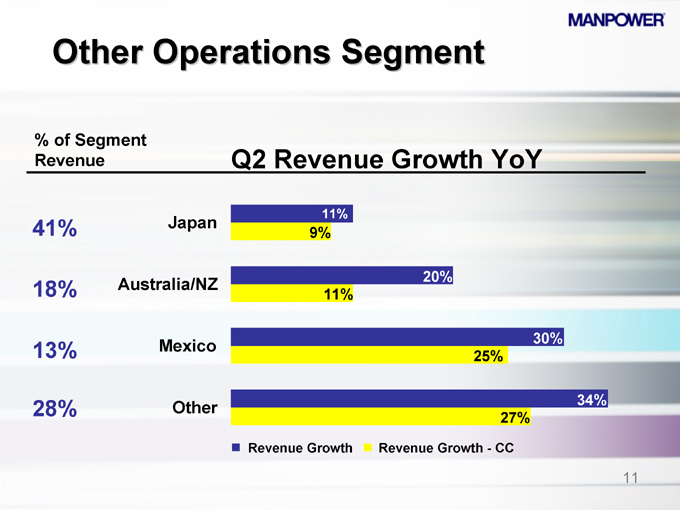
Other Operations Segment
% of Segment
Revenue Q2 Revenue Growth YoY
11%
41% Japan
9%
Australia/NZ 20%
18% 11%
Mexico 30%
13% 25%
28% Other 34%
27%
Revenue Growth
Revenue Growth—CC
11

Financial Highlights
12
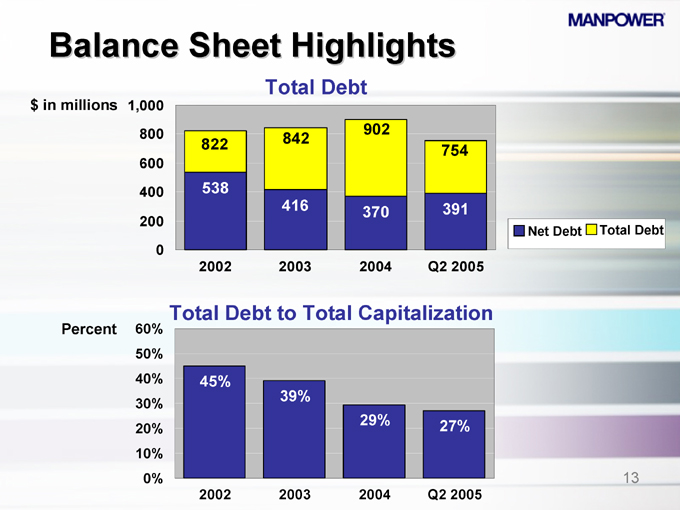
Balance Sheet Highlights
Total Debt $ in millions
1,000 800
600 400
200 0
822
538
842
416
902
370
754
391
2002 2003 2004 Q2 2005
Net Debt
Total Debt
Total Debt to Total Capitalization
Percent
60% 50% 40% 30% 20% 10% 0%
45%
39%
29%
27%
2002 2003 2004 Q2 2005
13
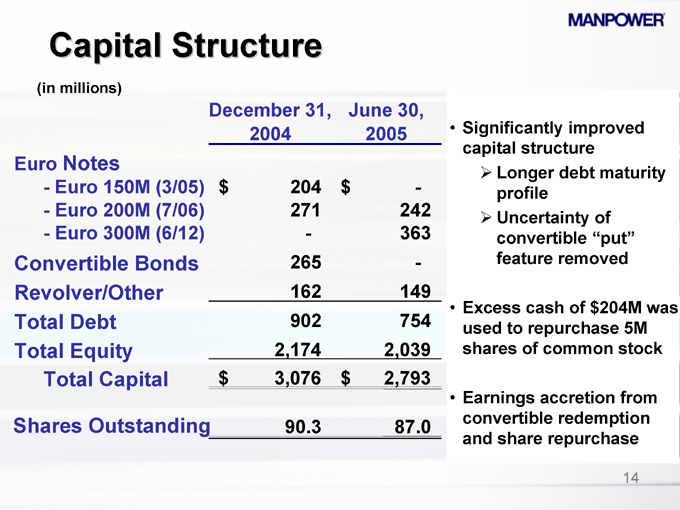
Capital Structure
(in millions)
December 31, 2004 June 30, 2005
Euro Notes
- Euro 150M (3/05) $204 $-
- Euro 200M (7/06) 271 242
- Euro 300M (6/12) - 363
Convertible Bonds 265 -
Revolver/Other 162 149
Total Debt 902 754
Total Equity 2,174 2,039
Total Capital $3,076 $2,793
Shares Outstanding 90.3 87.0
Significantly improved capital structure
Longer debt maturity profile
Uncertainty of convertible “put” feature removed
Excess cash of $204M was used to repurchase 5M shares of common stock
Earnings accretion from convertible redemption and share repurchase
14

Cash Flow Summary – First Half
(in millions) 2005 2004
Cash from Operations $98 $68
Capital Expenditures (36) (27)
Free Cash Flow 62 41
Share Repurchases * (204) -
Change in Debt (32) 9
Other 5 (36)
Change in Cash $(169) $14
* 5,000,000 shares
15
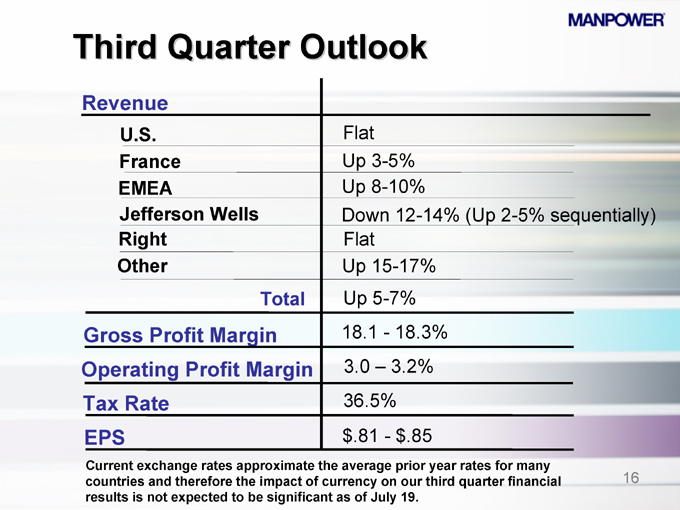
Third Quarter Outlook
Revenue
U.S. Flat
France Up 3-5%
EMEA Up 8-10%
Jefferson Wells Down 12-14% (Up 2-5% sequentially)
Right Flat
Other Up 15-17%
Total Up 5-7%
Gross Profit Margin 18.1—18.3%
Operating Profit Margin 3.0 – 3.2%
Tax Rate 36.5%
EPS $.81—$.85
Current exchange rates approximate the average prior year rates for many countries and therefore the impact of currency on our third quarter financial results is not expected to be significant as of July 19.
16

Manpower Inc. 2005 2nd Quarter Results July 19, 2005
Questions