ManpowerGroup Fourth Quarter Results | January 31, 2020 Exhibit 99.2
FORWARD-LOOKING STATEMENT This presentation contains statements, including financial projections, that are forward-looking in nature. These statements are based on management’s current expectations or beliefs, and are subject to known and unknown risks and uncertainties regarding expected future results. Actual results might differ materially from those projected in the forward-looking statements. Additional information concerning factors that could cause actual results to materially differ from those in the forward-looking statements is contained in the ManpowerGroup Inc. Annual Report on Form 10-K dated December 31, 2018, which information is incorporated herein by reference, and such other factors as may be described from time to time in the Company’s SEC filings. Any forward-looking statements in this presentation speak only as of the date hereof. The Company assumes no obligation to update or revise any forward-looking statements. We reference certain non-GAAP financial measures, which we believe provide useful information for investors. We include a reconciliation of these measures, where appropriate, to GAAP on the Investor Relations section of our website at manpowergroup.com.
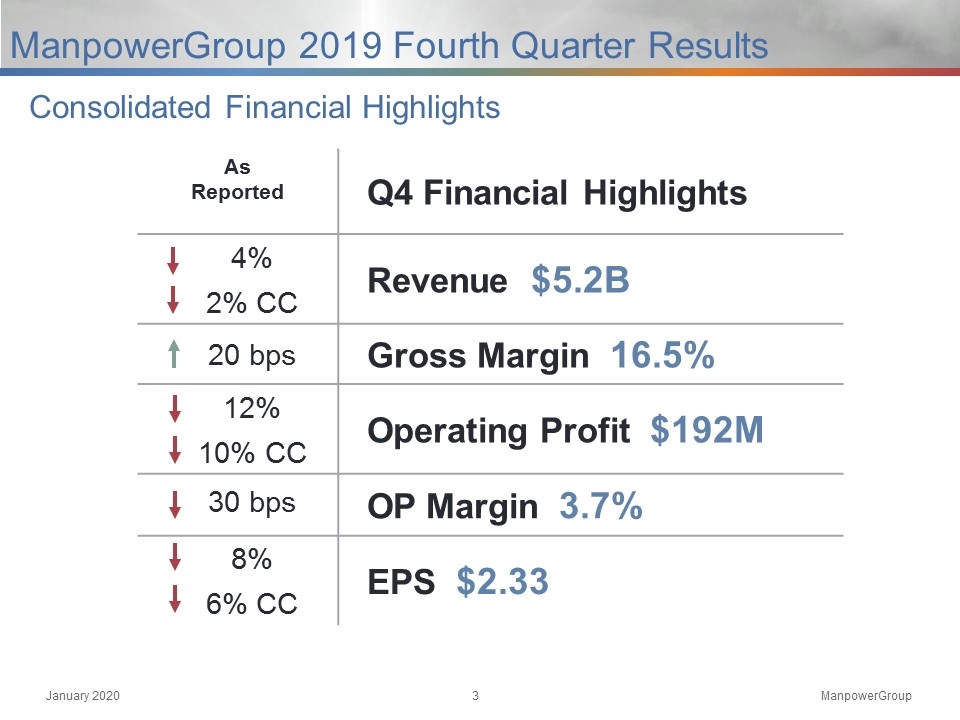
As Reported Q4 Financial Highlights 4% Revenue $5.2B 2% CC 20 bps Gross Margin 16.5% 12% Operating Profit $192M 10% CC 30 bps OP Margin 3.7% 8% EPS $2.33 6% CC Consolidated Financial Highlights ManpowerGroup 2019 Fourth Quarter Results
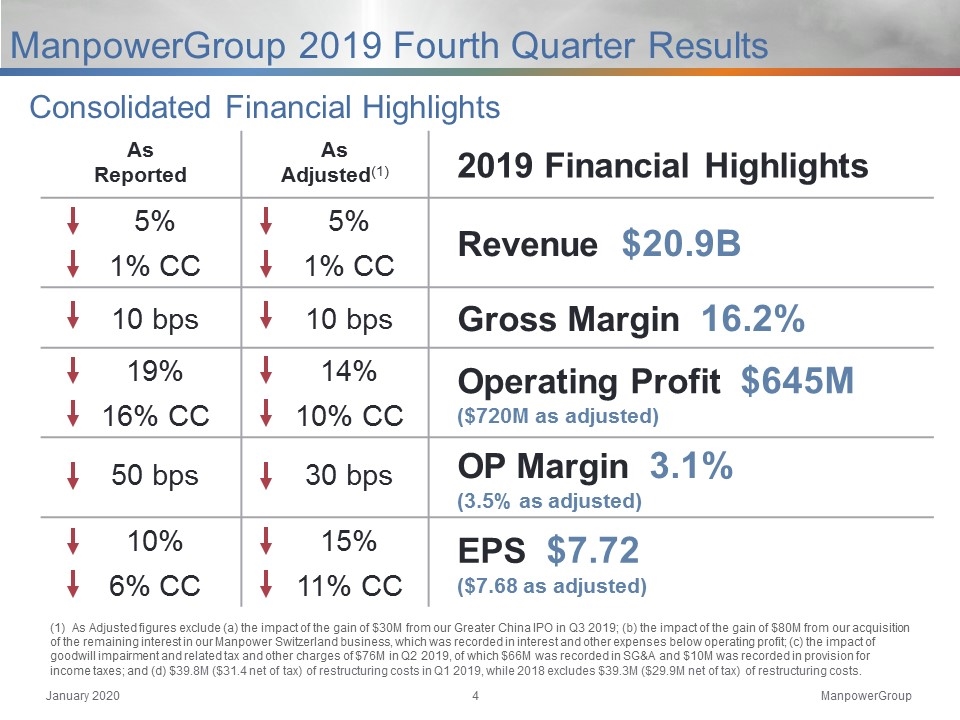
Consolidated Financial Highlights ManpowerGroup 2019 Fourth Quarter Results As Reported As Adjusted(1) 2019 Financial Highlights 5% 5% Revenue $20.9B 1% CC 1% CC 10 bps 10 bps Gross Margin 16.2% 19% 14% Operating Profit $645M ($720M as adjusted) 16% CC 10% CC 50 bps 30 bps OP Margin 3.1% (3.5% as adjusted) 10% 15% EPS $7.72 ($7.68 as adjusted) 6% CC 11% CC As Adjusted figures exclude (a) the impact of the gain of $30M from our Greater China IPO in Q3 2019; (b) the impact of the gain of $80M from our acquisition of the remaining interest in our Manpower Switzerland business, which was recorded in interest and other expenses below operating profit; (c) the impact of goodwill impairment and related tax and other charges of $76M in Q2 2019, of which $66M was recorded in SG&A and $10M was recorded in provision for income taxes; and (d) $39.8M ($31.4 net of tax) of restructuring costs in Q1 2019, while 2018 excludes $39.3M ($29.9M net of tax) of restructuring costs.
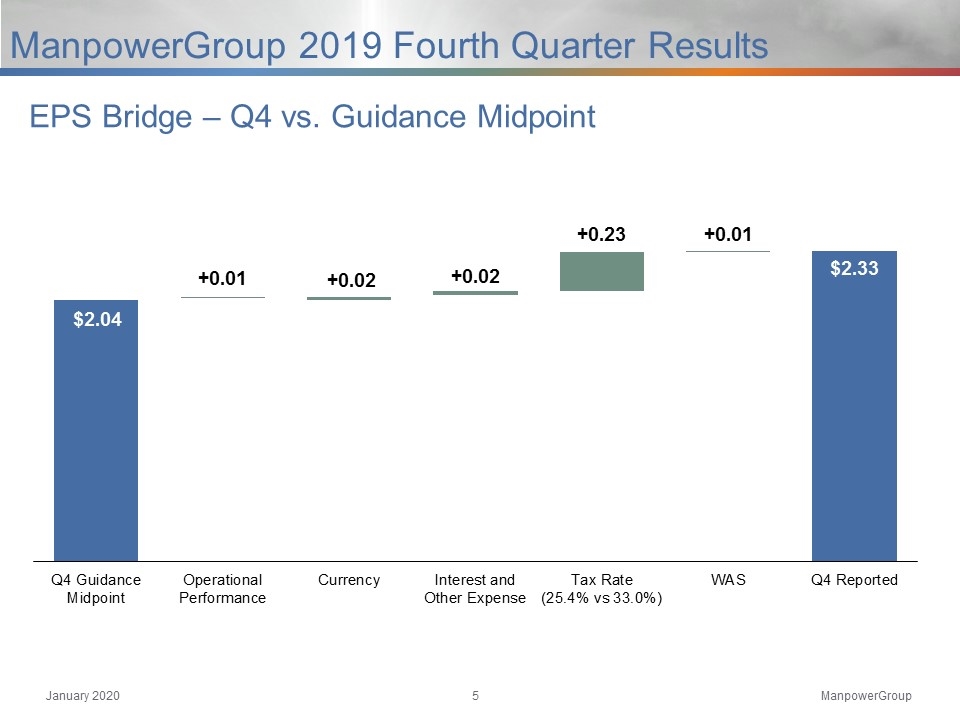
EPS Bridge – Q4 vs. Guidance Midpoint ManpowerGroup 2019 Fourth Quarter Results
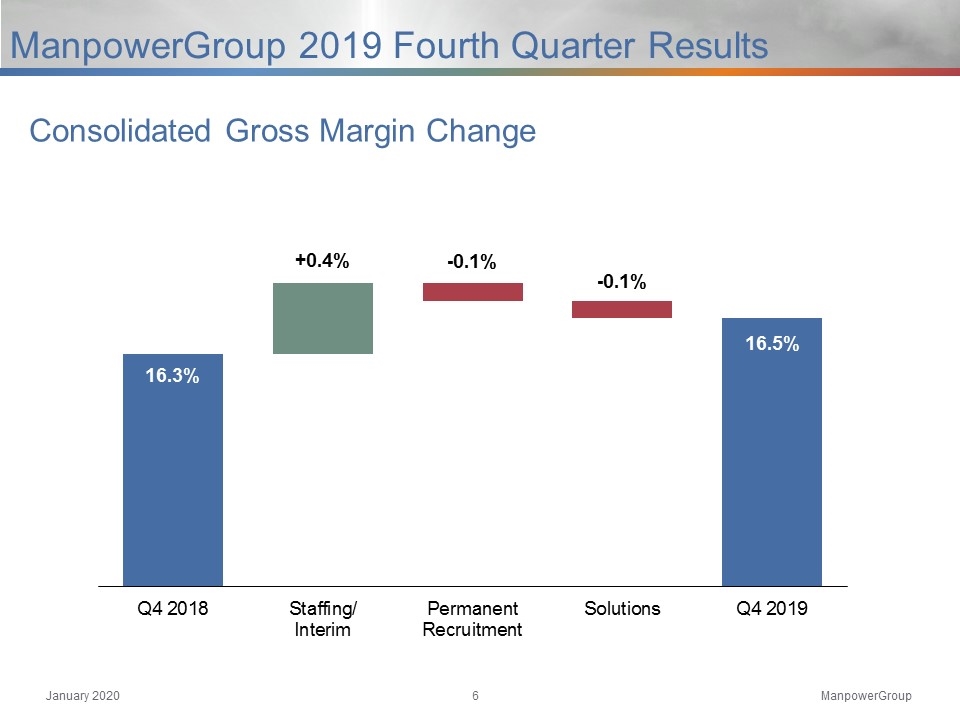
Consolidated Gross Margin Change ManpowerGroup 2019 Fourth Quarter Results
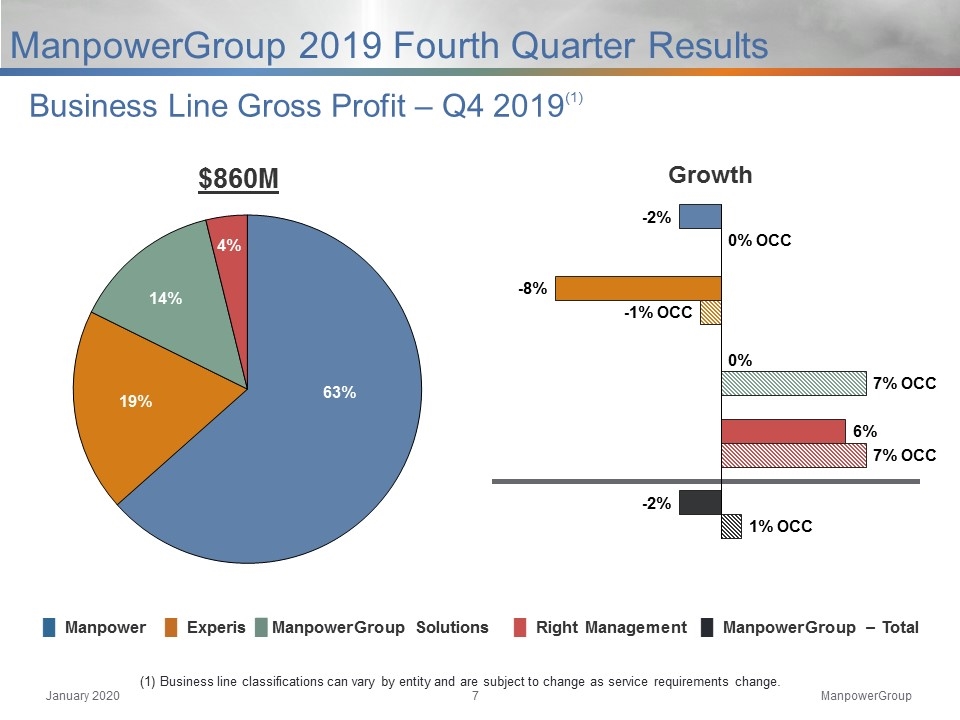
Growth Business Line Gross Profit – Q4 2019(1) (1) Business line classifications can vary by entity and are subject to change as service requirements change. ManpowerGroup 2019 Fourth Quarter Results █ Manpower █ Experis █ ManpowerGroup Solutions █ Right Management █ ManpowerGroup – Total
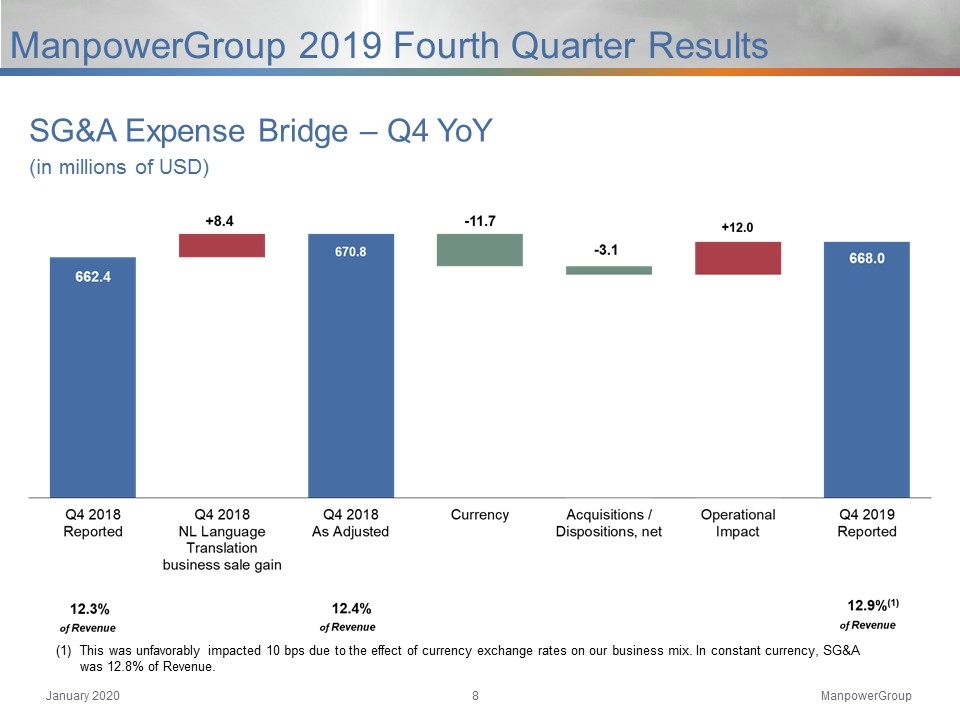
SG&A Expense Bridge – Q4 YoY (in millions of USD) ManpowerGroup 2019 Fourth Quarter Results This was unfavorably impacted 10 bps due to the effect of currency exchange rates on our business mix. In constant currency, SG&A was 12.8% of Revenue.
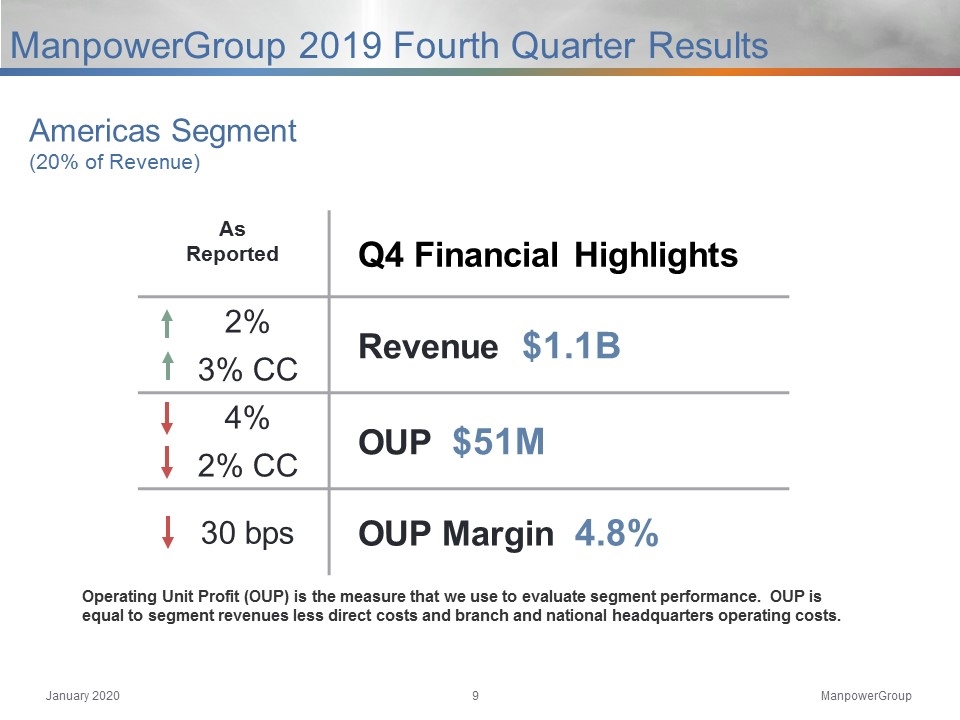
As Reported Q4 Financial Highlights 2% Revenue $1.1B 3% CC 4% OUP $51M 2% CC 30 bps OUP Margin 4.8% Operating Unit Profit (OUP) is the measure that we use to evaluate segment performance. OUP is equal to segment revenues less direct costs and branch and national headquarters operating costs. Americas Segment (20% of Revenue) ManpowerGroup 2019 Fourth Quarter Results
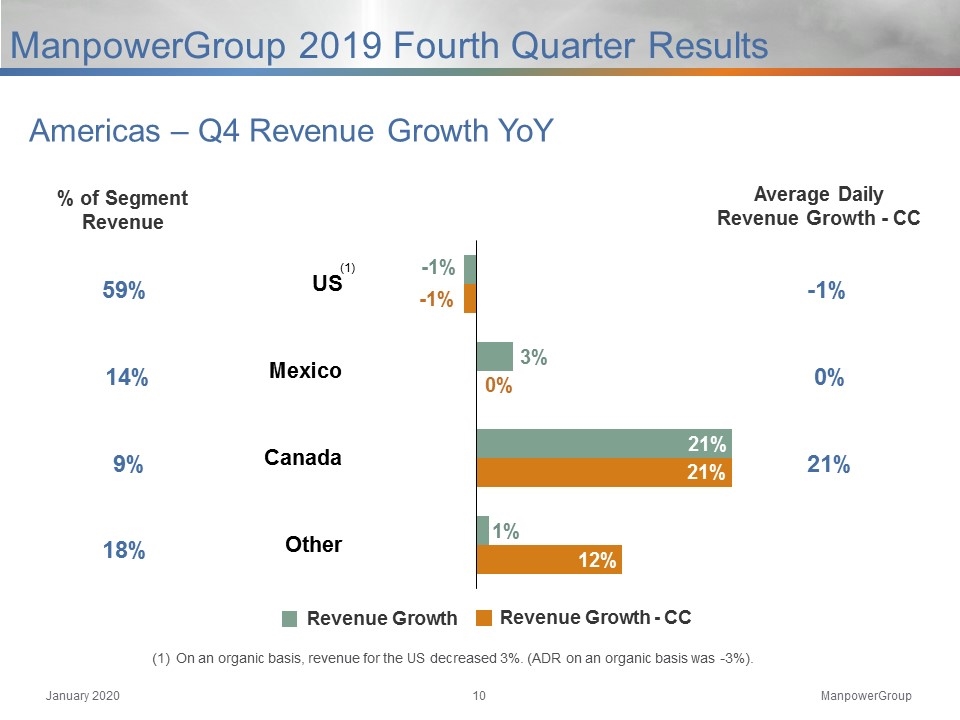
Revenue Growth - CC Revenue Growth % of Segment Revenue Americas – Q4 Revenue Growth YoY Average Daily Revenue Growth - CC ManpowerGroup 2019 Fourth Quarter Results On an organic basis, revenue for the US decreased 3%. (ADR on an organic basis was -3%). (1)
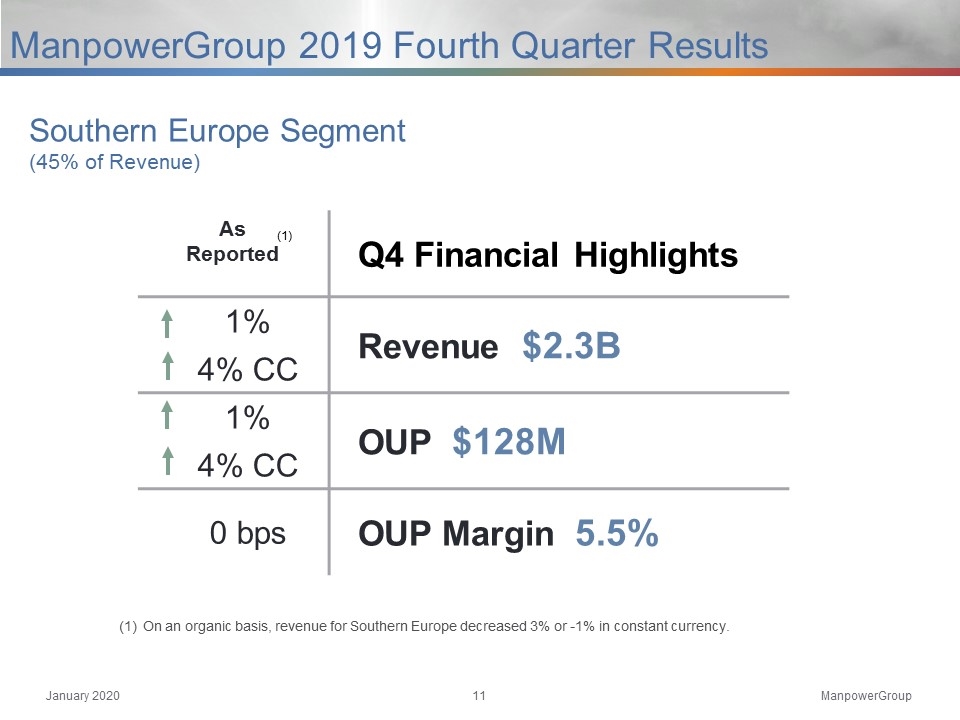
As Reported Q4 Financial Highlights 1% Revenue $2.3B 4% CC 1% OUP $128M 4% CC 0 bps OUP Margin 5.5% Southern Europe Segment (45% of Revenue) ManpowerGroup 2019 Fourth Quarter Results On an organic basis, revenue for Southern Europe decreased 3% or -1% in constant currency. (1)
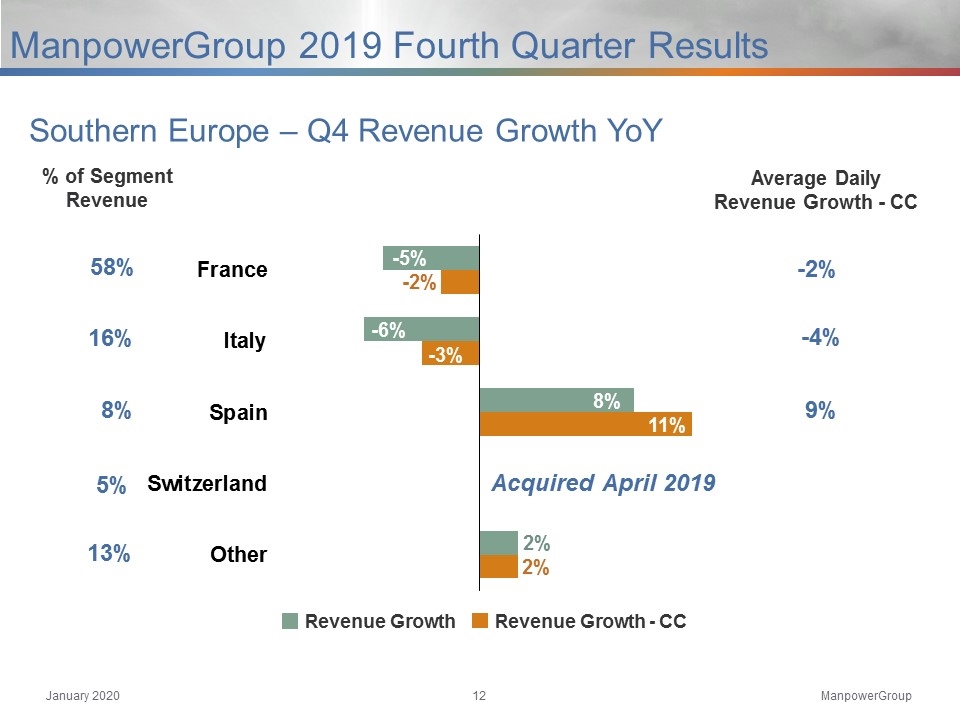
Southern Europe – Q4 Revenue Growth YoY Revenue Growth - CC Revenue Growth % of Segment Revenue Average Daily Revenue Growth - CC ManpowerGroup 2019 Fourth Quarter Results
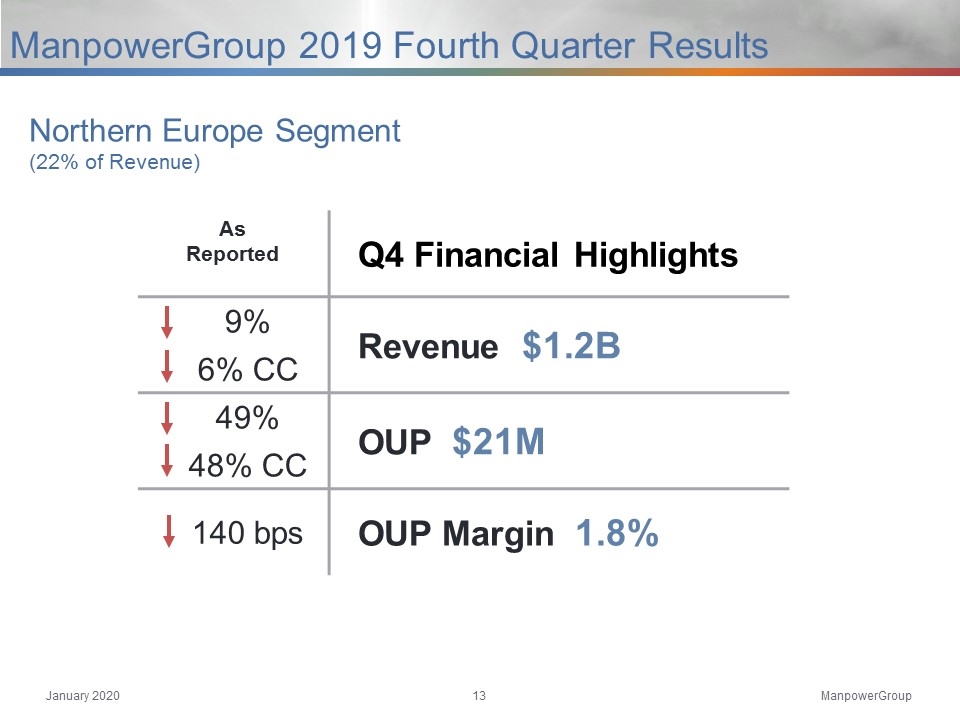
Northern Europe Segment (22% of Revenue) ManpowerGroup 2019 Fourth Quarter Results As Reported Q4 Financial Highlights 9% Revenue $1.2B 6% CC 49% OUP $21M 48% CC 140 bps OUP Margin 1.8%
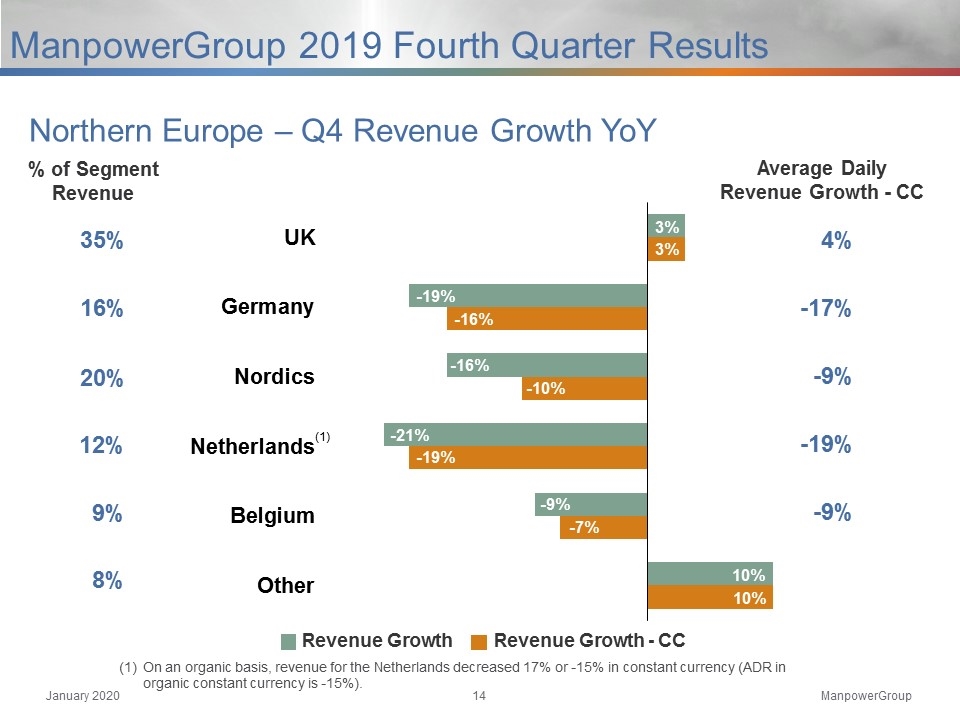
Northern Europe – Q4 Revenue Growth YoY Revenue Growth - CC Revenue Growth % of Segment Revenue Average Daily Revenue Growth - CC ManpowerGroup 2019 Fourth Quarter Results (1) On an organic basis, revenue for the Netherlands decreased 17% or -15% in constant currency (ADR in organic constant currency is -15%).
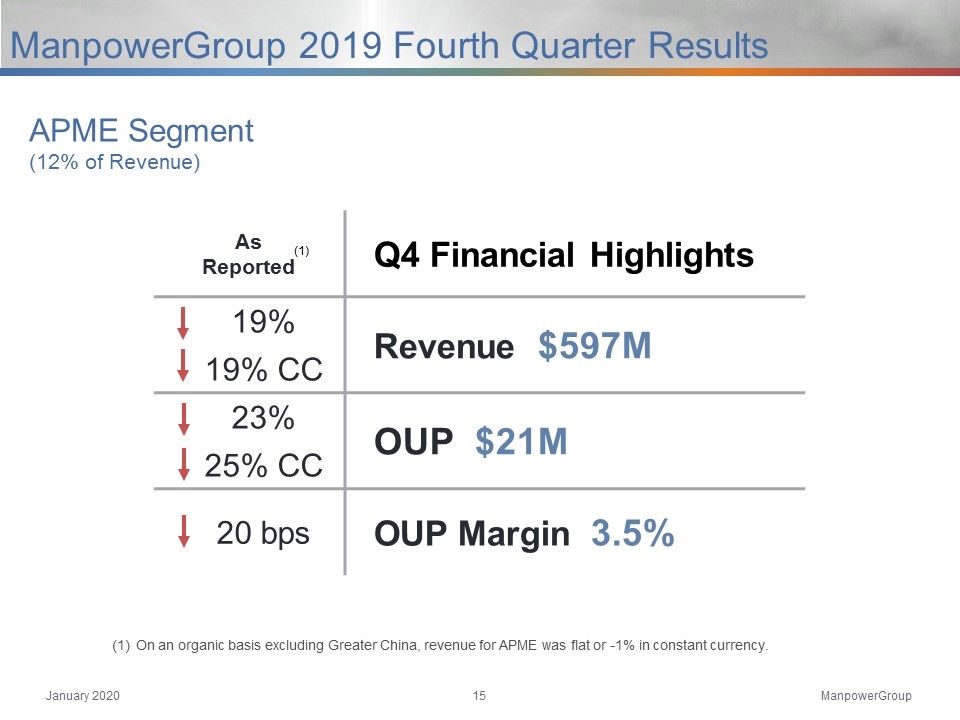
APME Segment (12% of Revenue) ManpowerGroup 2019 Fourth Quarter Results As Reported Q4 Financial Highlights 19% Revenue $597M 19% CC 23% OUP $21M 25% CC 20 bps OUP Margin 3.5% (1) On an organic basis excluding Greater China, revenue for APME was flat or -1% in constant currency.
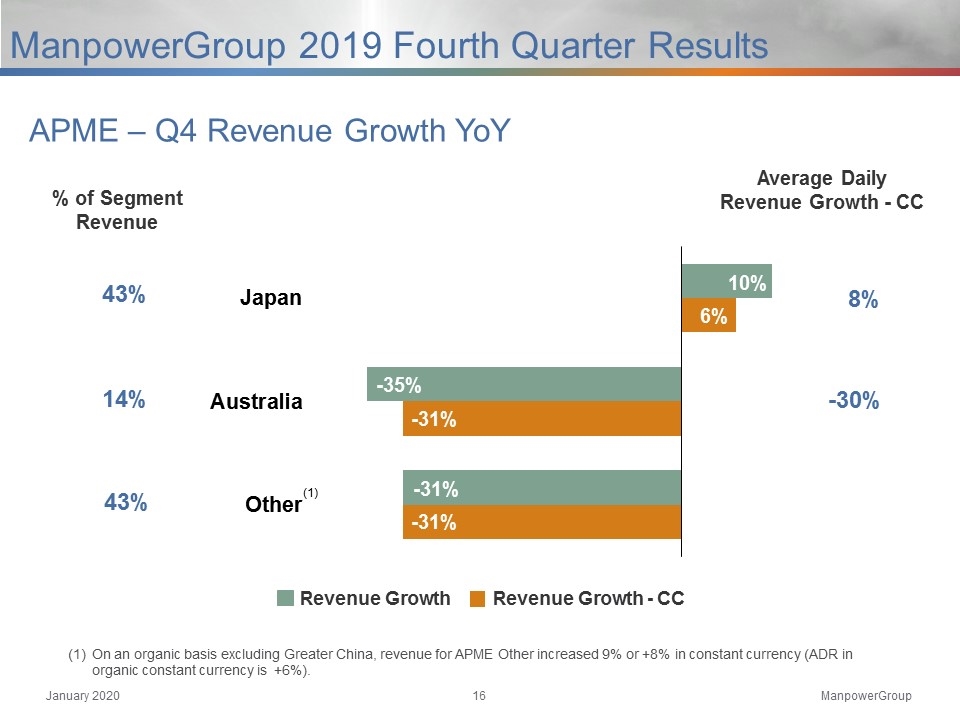
APME – Q4 Revenue Growth YoY Revenue Growth - CC Revenue Growth % of Segment Revenue Average Daily Revenue Growth - CC On an organic basis excluding Greater China, revenue for APME Other increased 9% or +8% in constant currency (ADR in organic constant currency is +6%). (1) ManpowerGroup 2019 Fourth Quarter Results

Right Management Segment (1% of Revenue) ManpowerGroup 2019 Fourth Quarter Results As Reported Q4 Financial Highlights 4% Revenue $52M 5% CC 22% OUP $11M 23% CC 330 bps OUP Margin 21.9%
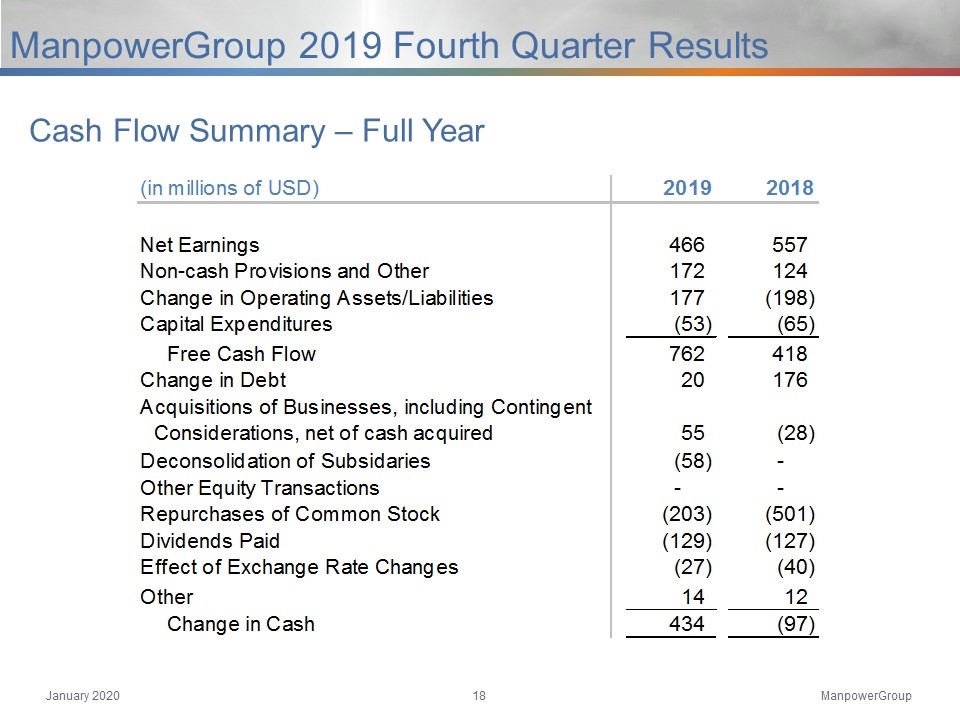
Cash Flow Summary – Full Year ManpowerGroup 2019 Fourth Quarter Results
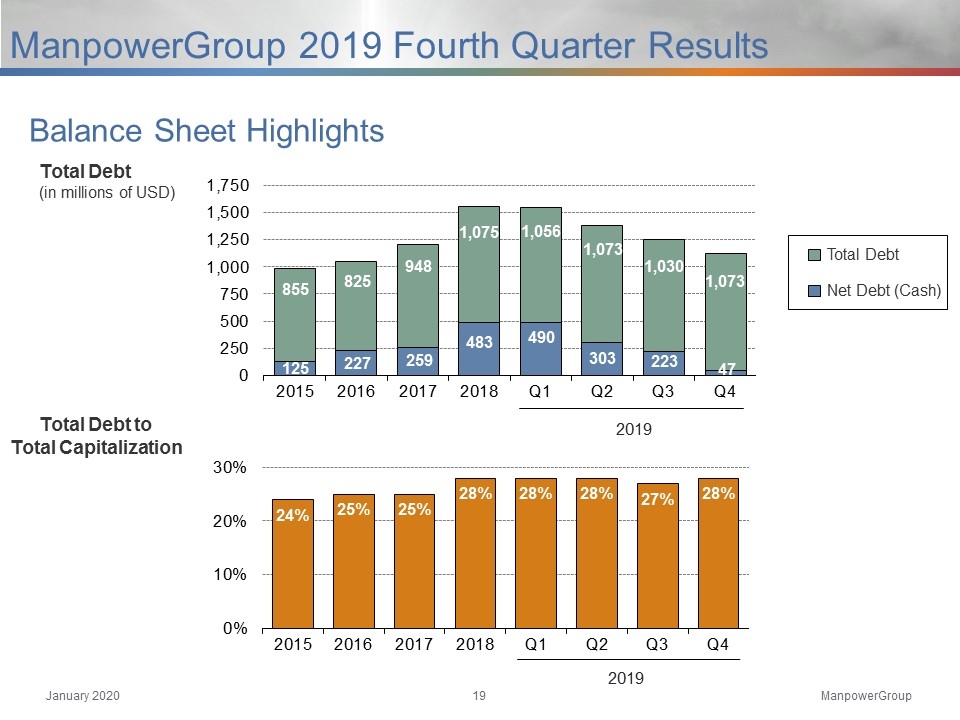
Balance Sheet Highlights Total Debt (in millions of USD) Total Debt to Total Capitalization Total Debt Net Debt (Cash) ManpowerGroup 2019 Fourth Quarter Results
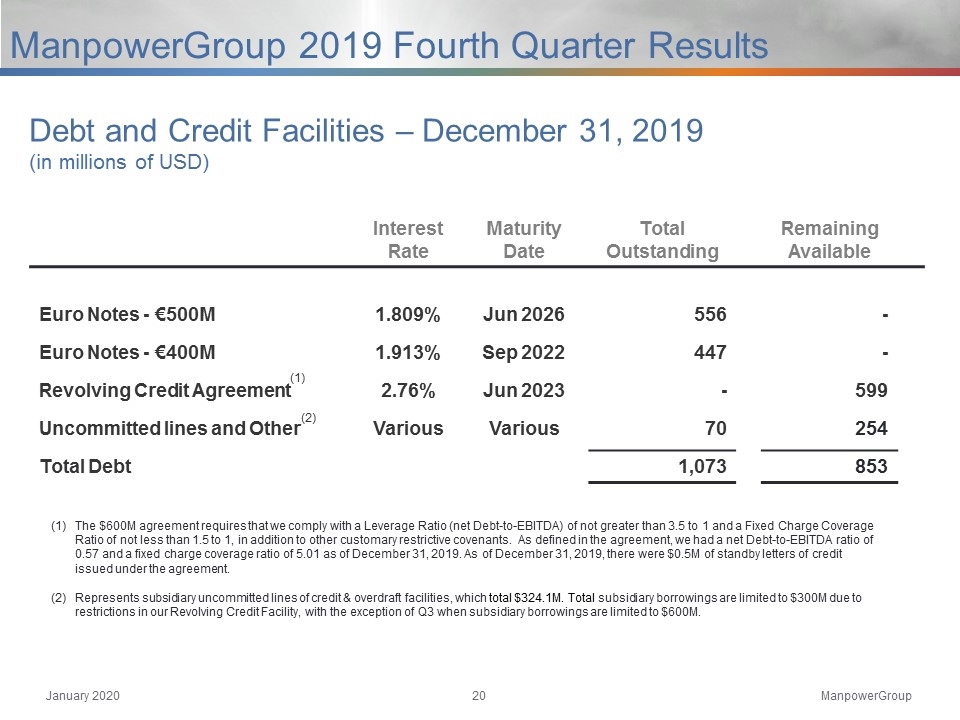
Interest Rate Maturity Date Total Outstanding Remaining Available Euro Notes - €500M 1.809% Jun 2026 556 - Euro Notes - €400M 1.913% Sep 2022 447 - Revolving Credit Agreement 2.76% Jun 2023 - 599 Uncommitted lines and Other Various Various 70 254 Total Debt 1,073 853 Debt and Credit Facilities – December 31, 2019 (in millions of USD) (2) (1) The $600M agreement requires that we comply with a Leverage Ratio (net Debt-to-EBITDA) of not greater than 3.5 to 1 and a Fixed Charge Coverage Ratio of not less than 1.5 to 1, in addition to other customary restrictive covenants. As defined in the agreement, we had a net Debt-to-EBITDA ratio of 0.57 and a fixed charge coverage ratio of 5.01 as of December 31, 2019. As of December 31, 2019, there were $0.5M of standby letters of credit issued under the agreement. Represents subsidiary uncommitted lines of credit & overdraft facilities, which total $324.1M. Total subsidiary borrowings are limited to $300M due to restrictions in our Revolving Credit Facility, with the exception of Q3 when subsidiary borrowings are limited to $600M. ManpowerGroup 2019 Fourth Quarter Results
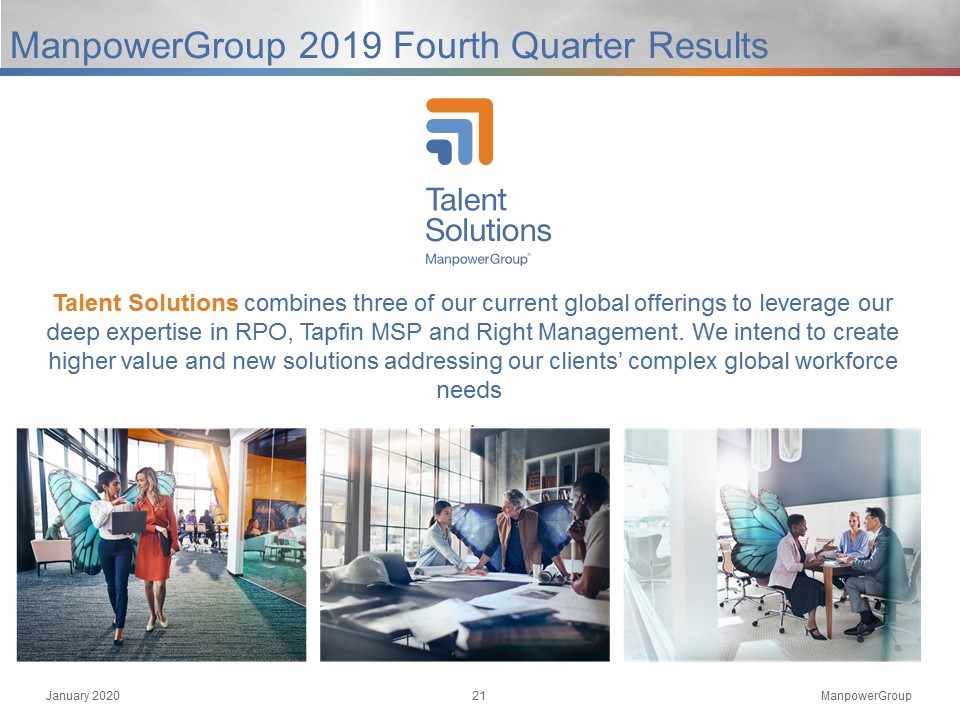
ManpowerGroup 2019 Fourth Quarter Results Talent Solutions combines three of our current global offerings to leverage our deep expertise in RPO, Tapfin MSP and Right Management. We intend to create higher value and new solutions addressing our clients’ complex global workforce needs. .
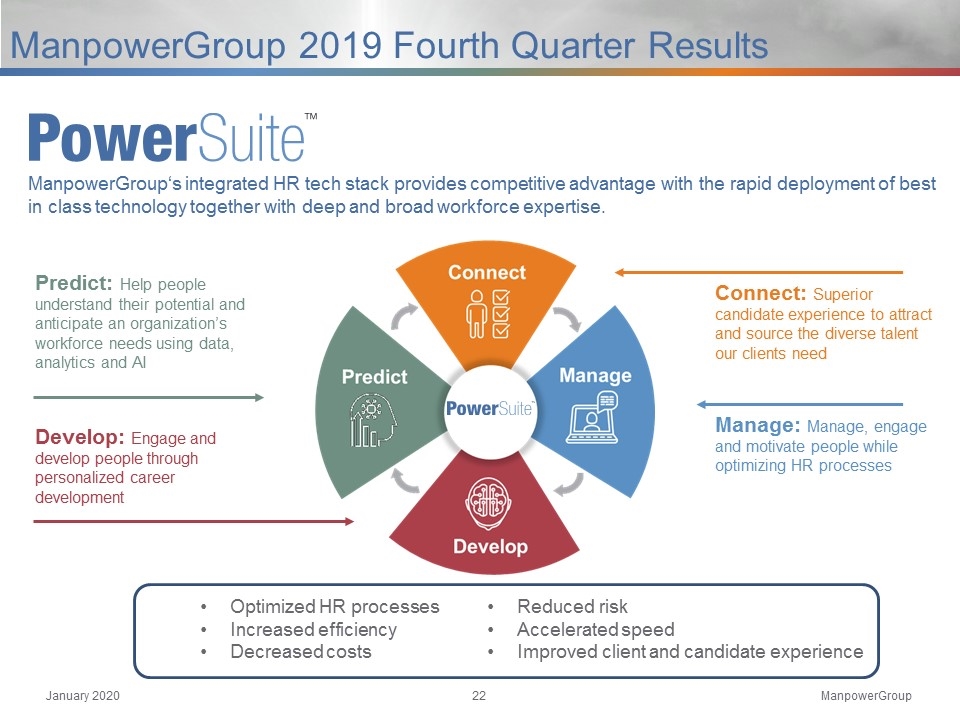
ManpowerGroup 2019 Fourth Quarter Results ManpowerGroup‘s integrated HR tech stack provides competitive advantage with the rapid deployment of best in class technology together with deep and broad workforce expertise. Predict: Help people understand their potential and anticipate an organization’s workforce needs using data, analytics and AI Develop: Engage and develop people through personalized career development Connect: Superior candidate experience to attract and source the diverse talent our clients need Manage: Manage, engage and motivate people while optimizing HR processes Increased efficiency and speed, optimized HR and reduced risk through technology Optimized HR processes Increased efficiency Decreased costs Reduced risk Accelerated speed Improved client and candidate experience
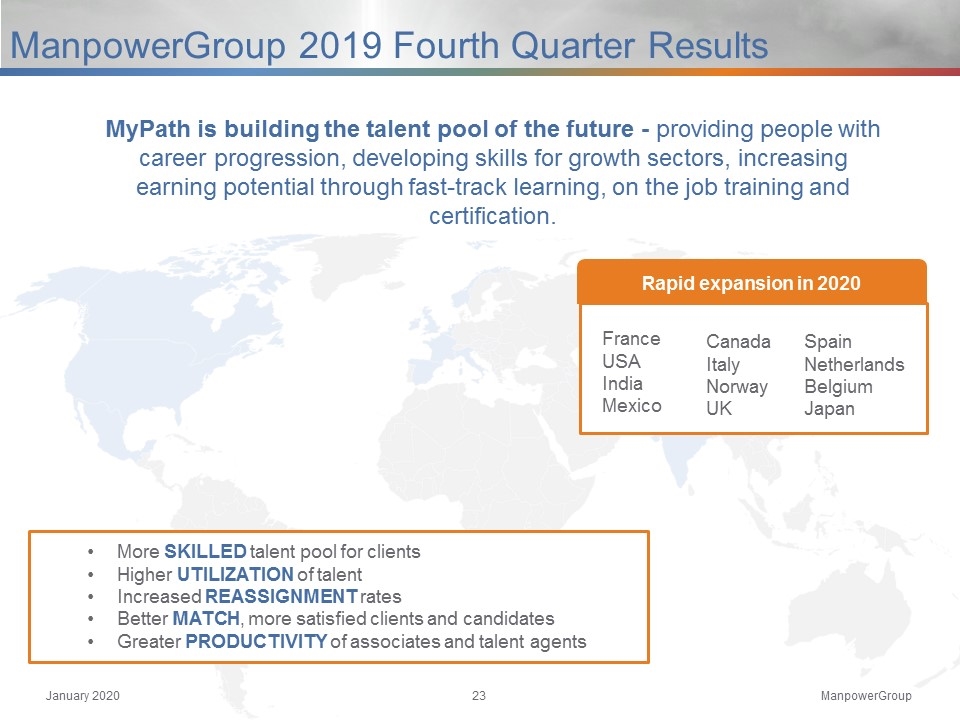
ManpowerGroup 2019 Fourth Quarter Results MyPath is building the talent pool of the future - providing people with career progression, developing skills for growth sectors, increasing earning potential through fast-track learning, on the job training and certification. France USA India Mexico Rapid expansion in 2020 Canada Italy Norway UK Spain Netherlands Belgium Japan More SKILLED talent pool for clients Higher UTILIZATION of talent Increased REASSIGNMENT rates Better MATCH, more satisfied clients and candidates Greater PRODUCTIVITY of associates and talent agents
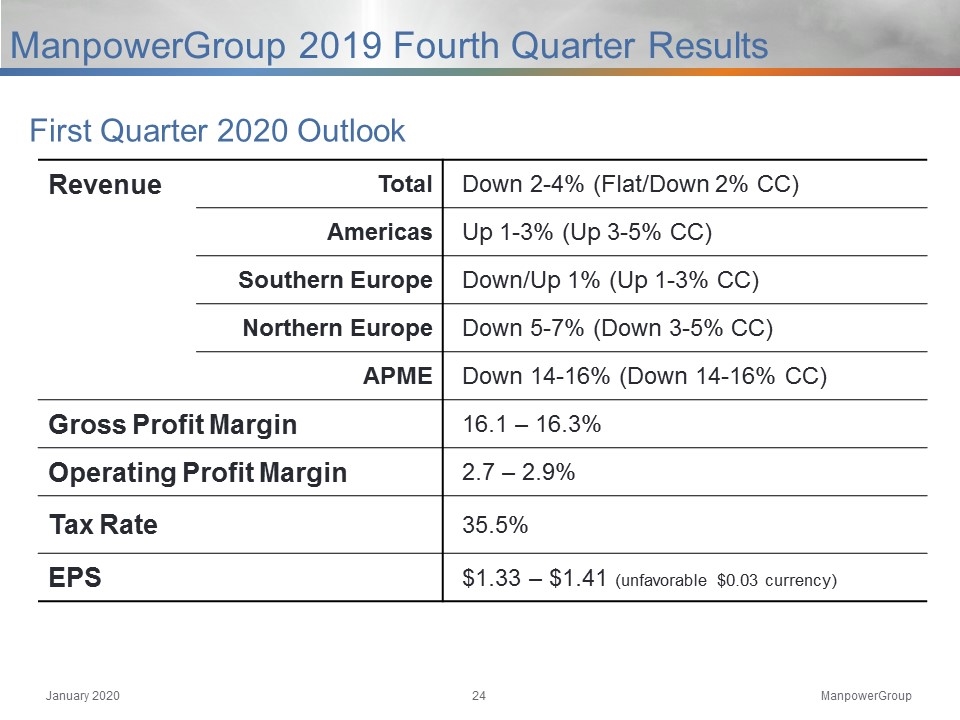
First Quarter 2020 Outlook ManpowerGroup 2019 Fourth Quarter Results Revenue Total Down 2-4% (Flat/Down 2% CC) Americas Up 1-3% (Up 3-5% CC) Southern Europe Down/Up 1% (Up 1-3% CC) Northern Europe Down 5-7% (Down 3-5% CC) APME Down 14-16% (Down 14-16% CC) Gross Profit Margin 16.1 – 16.3% Operating Profit Margin 2.7 – 2.9% Tax Rate 35.5% EPS $1.33 – $1.41 (unfavorable $0.03 currency)
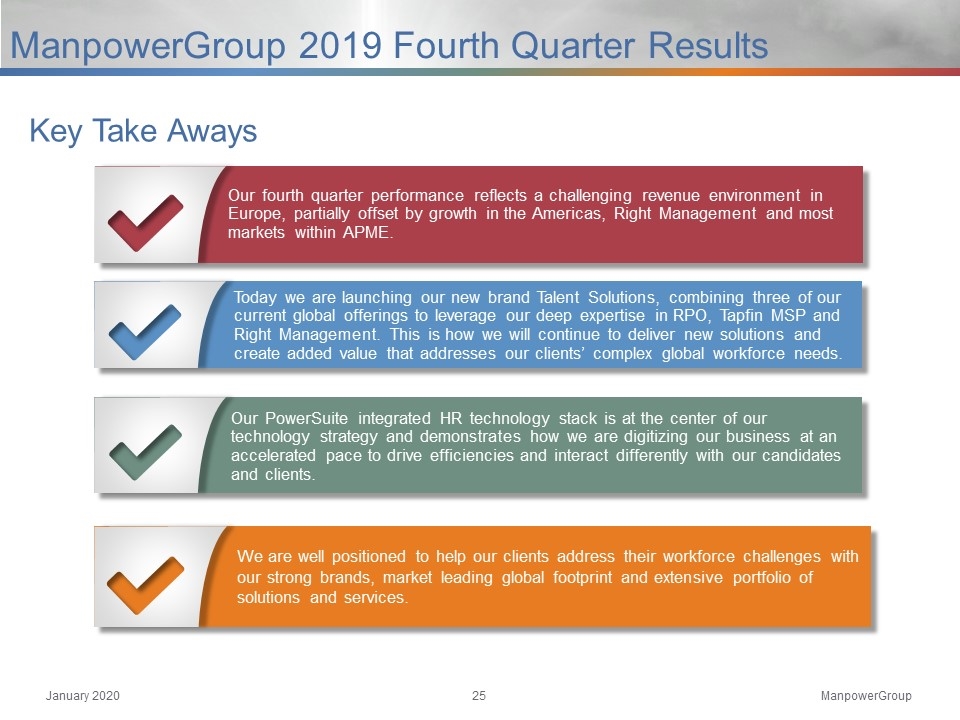
Our fourth quarter performance reflects a challenging revenue environment in Europe, partially offset by growth in the Americas, Right Management and most markets within APME. Today we are launching our new brand Talent Solutions, combining three of our current global offerings to leverage our deep expertise in RPO, Tapfin MSP and Right Management. This is how we will continue to deliver new solutions and create added value that addresses our clients’ complex global workforce needs. Our PowerSuite integrated HR technology stack is at the center of our technology strategy and demonstrates how we are digitizing our business at an accelerated pace to drive efficiencies and interact differently with our candidates and clients. We are well positioned to help our clients address their workforce challenges with our strong brands, market leading global footprint and extensive portfolio of solutions and services. Key Take Aways ManpowerGroup 2019 Fourth Quarter Results
Appendix
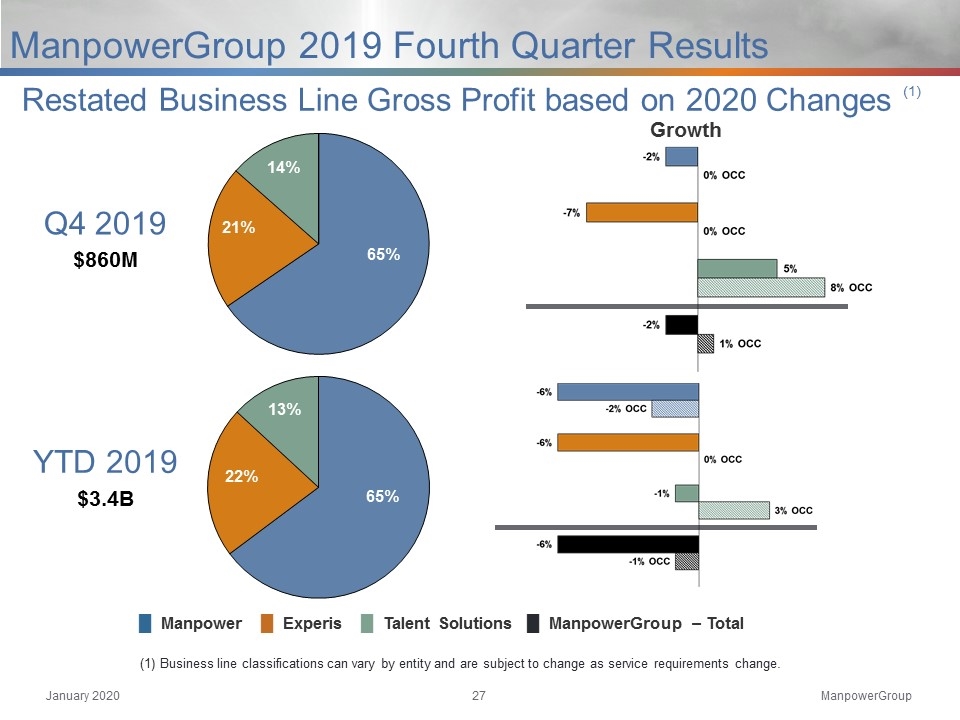
Growth █ Manpower █ Experis █ Talent Solutions █ ManpowerGroup – Total Restated Business Line Gross Profit based on 2020 Changes (1) (1) Business line classifications can vary by entity and are subject to change as service requirements change. ManpowerGroup 2019 Fourth Quarter Results Q4 2019 $860M YTD 2019 $3.4B


