UNITED STATES
SECURITIES AND EXCHANGE COMMISSION
Washington, D.C. 20549
FORM N-CSR
CERTIFIED SHAREHOLDER REPORT OF REGISTERED
MANAGEMENT INVESTMENT COMPANIES
Investment Company Act File Number: 811-06275
T. Rowe Price Balanced Fund, Inc.
(Exact name of registrant as specified in charter)
100 East Pratt Street, Baltimore, MD 21202
(Address of principal executive offices)
David Oestreicher
100 East Pratt Street, Baltimore, MD 21202
(Name and address of agent for service)
Registrant’s telephone number, including area code: (410) 345-2000
Date of fiscal year end: December 31
Date of reporting period: December 31, 2024
Item 1. Reports to Shareholders
(a) Report pursuant to Rule 30e-1
Annual Shareholder Report
December 31, 2024
This annual shareholder report contains important information about Balanced Fund (the "fund") for the period of January 1, 2024 to December 31, 2024. You can find the fund’s prospectus, financial information on Form N‑CSR (which includes required tax information for dividends), holdings, proxy voting information, and other information atwww.troweprice.com/prospectus. You can also request this information without charge by contacting T. Rowe Price at 1‑800‑638‑5660 or info@troweprice.com or contacting your intermediary.
What were the fund costs for the last year? (based on a hypothetical $10,000 investment)
| | Costs of a $10,000 investment | Costs paid as a percentage of a $10,000 investment |
|---|
| Balanced Fund - Investor Class | $58 | 0.55% |
|---|
What drove fund performance during the past 12 months?
Equity markets were broadly positive in 2024, while fixed income markets were mixed. U.S. stocks produced strong gains, and various equity indexes reached new all-time highs during the year. The equity market was buoyed by generally favorable corporate earnings and by continuing interest in companies expected to benefit from artificial intelligence developments. Developed non-U.S. equity markets were mostly positive in 2024, helped by looser monetary policies from various central banks around the world. However, many markets surrendered some of their gains in the fourth quarter amid rising geopolitical tensions. U.S. taxable investment-grade bonds produced positive returns in 2024. U.S. Treasury bill yields declined, as the Federal Reserve reduced the fed funds target rate by 50 basis points in mid-September and by an additional 50 basis points in the fourth quarter.
Versus the Morningstar Moderate Target Risk Index, security selection within U.S. large-cap growth stocks contributed to relative results. The fund’s greater exposure to U.S large-caps compared to small- and mid-caps was also additive during a period of stronger performance for large-caps.
Conversely, an overweight allocation to real assets equities was detrimental to relative results, as this sector lagged broader global equities over the trailing 12 months. Unfavorable security selection within high yield bonds also detracted.
The fund seeks to provide capital growth, current income, and preservation of capital through a portfolio of stocks and fixed income securities. It normally invests approximately 65% of total assets in U.S. and foreign common stocks and 35% in fixed income securities.
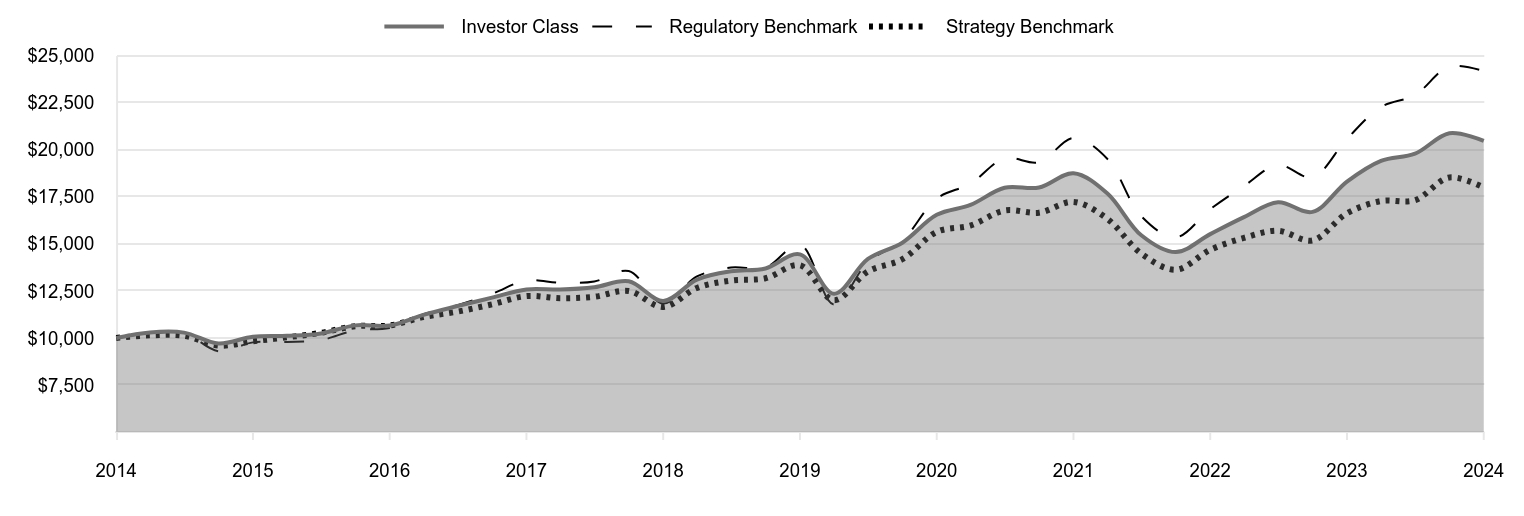
How has the fund performed?
Cumulative Returns of a Hypothetical $10,000 Investment as of December 31, 2024
| Investor Class | Regulatory Benchmark | Strategy Benchmark |
|---|
| 2014 | 10,000 | 10,000 | 10,000 |
|---|
| 2015 | 10,293 | 10,231 | 10,137 |
|---|
| 2015 | 10,283 | 10,266 | 10,115 |
|---|
| 2015 | 9,705 | 9,296 | 9,596 |
|---|
| 2015 | 10,065 | 9,764 | 9,821 |
|---|
| 2016 | 10,112 | 9,787 | 10,032 |
|---|
| 2016 | 10,240 | 9,884 | 10,273 |
|---|
| 2016 | 10,667 | 10,408 | 10,622 |
|---|
| 2016 | 10,661 | 10,531 | 10,663 |
|---|
| 2017 | 11,228 | 11,259 | 11,109 |
|---|
| 2017 | 11,695 | 11,740 | 11,398 |
|---|
| 2017 | 12,141 | 12,348 | 11,785 |
|---|
| 2017 | 12,580 | 13,056 | 12,225 |
|---|
| 2018 | 12,575 | 12,931 | 12,115 |
|---|
| 2018 | 12,695 | 13,000 | 12,187 |
|---|
| 2018 | 13,009 | 13,555 | 12,495 |
|---|
| 2018 | 11,961 | 11,827 | 11,644 |
|---|
| 2019 | 13,102 | 13,267 | 12,655 |
|---|
| 2019 | 13,541 | 13,746 | 13,050 |
|---|
| 2019 | 13,694 | 13,742 | 13,170 |
|---|
| 2019 | 14,442 | 14,973 | 13,859 |
|---|
| 2020 | 12,346 | 11,774 | 12,005 |
|---|
| 2020 | 14,197 | 14,036 | 13,534 |
|---|
| 2020 | 15,063 | 15,178 | 14,184 |
|---|
| 2020 | 16,545 | 17,406 | 15,636 |
|---|
| 2021 | 17,068 | 18,202 | 15,975 |
|---|
| 2021 | 17,981 | 19,548 | 16,771 |
|---|
| 2021 | 17,993 | 19,342 | 16,658 |
|---|
| 2021 | 18,755 | 20,633 | 17,230 |
|---|
| 2022 | 17,690 | 19,527 | 16,336 |
|---|
| 2022 | 15,456 | 16,469 | 14,484 |
|---|
| 2022 | 14,562 | 15,346 | 13,626 |
|---|
| 2022 | 15,518 | 16,844 | 14,684 |
|---|
| 2023 | 16,419 | 18,075 | 15,319 |
|---|
| 2023 | 17,209 | 19,191 | 15,699 |
|---|
| 2023 | 16,700 | 18,538 | 15,183 |
|---|
| 2023 | 18,309 | 20,584 | 16,626 |
|---|
| 2024 | 19,411 | 22,271 | 17,276 |
|---|
| 2024 | 19,792 | 22,910 | 17,322 |
|---|
| 2024 | 20,880 | 24,425 | 18,530 |
|---|
| 2024 | 20,477 | 24,183 | 18,000 |
|---|
202501-4140694, 202502-4108138
Average Annual Total Returns
| | 1 Year | 5 Years | 10 Years |
|---|
| Balanced Fund (Investor Class) | 11.84% | 7.23% | 7.43% |
|---|
| MSCI All Country World Index Net (Regulatory Benchmark) | 17.49 | 10.06 | 9.23 |
|---|
| Morningstar Moderate Target Risk Index (Strategy Benchmark) | 8.27 | 5.37 | 6.05 |
|---|
The preceding line graph shows the value of a hypothetical $10,000 investment in the fund over the past 10 fiscal year periods or since inception (for funds lacking 10-year records). The fund’s performance information included in the line graph and table above is compared with a regulatory required index that represents an overall securities market (Regulatory Benchmark). In addition, the line graph and table may also include one or more indexes that more closely aligns to the fund's investment strategy (Strategy Benchmark(s)). Due to new SEC Rules on shareholder reporting the fund adopted a new broad-based securities market index, referred to as the Regulatory Benchmark. Market index returns do not include expenses, which are deducted from fund returns. The fund's total return figures reflect the reinvestment of dividends and capital gains, if any.Neither the fund’s returns nor the index returns reflect the deduction of taxes that a shareholder would pay on fund distributions or redemptions of fund shares.The fund’s past performance is not a good predictor of the fund’s future performance.Updated performance information can be found at www.troweprice.com.
What are some fund statistics?
- Total Net Assets (000s)$4,599,799
- Number of Portfolio Holdings1,589
- Investment Advisory Fees Paid (000s)$17,720
- Portfolio Turnover Rate39.2%
What did the fund invest in?
Security Allocation (as a % of Net Assets)
| Common Stocks | 61.3% |
| Corporate Bonds | 8.3 |
| U.S. Government & Agency Mortgage-Backed Securities | 8.1 |
| U.S. Government Agency Obligations (Excluding Mortgage-Backed) | 7.9 |
| Bond Mutual Funds | 5.2 |
| Equity Mutual Funds | 4.2 |
| Asset-Backed Securities | 1.5 |
| Non-U.S. Government Mortgage-Backed Securities | 1.3 |
| Short-Term and Other | 2.2 |
Top Ten Holdings (as a % of Net Assets)
| U.S. Treasury Notes | 5.4% |
| T. Rowe Price Institutional High Yield Fund - Institutional Class | 4.7 |
| T. Rowe Price Real Assets Fund - I Class | 4.2 |
| Federal National Mortgage Assn. | 4.0 |
| NVIDIA | 2.8 |
| Microsoft | 2.6 |
| Apple | 2.6 |
| U.S. Treasury Bonds | 2.5 |
| Amazon.com | 1.9 |
| Government National Mortgage Assn. | 1.8 |
If you invest directly with T. Rowe Price, you can elect to receive future shareholder reports or other important documents through electronic delivery by enrolling at www.troweprice.com/paperless. If you invest through a financial intermediary such as an investment advisor, a bank, retirement plan sponsor or a brokerage firm, please contact that organization and ask if it can provide electronic delivery.
MSCI and Morningstar do not accept any liability for any errors or omissions in the indexes or data, and hereby expressly disclaim all warranties of originality, accuracy, completeness, timeliness, merchantability and fitness for a particular purpose. No party may rely on any indexes or data contained in this communication. Visit www.troweprice.com/en/us/market-data-disclosures for additional legal notices & disclaimers.
Balanced Fund
Investor Class (RPBAX)
T. Rowe Price Investment Services, Inc.
100 East Pratt Street
Baltimore, MD 21202
Annual Shareholder Report
December 31, 2024
This annual shareholder report contains important information about Balanced Fund (the "fund") for the period of January 1, 2024 to December 31, 2024. You can find the fund’s prospectus, financial information on Form N‑CSR (which includes required tax information for dividends), holdings, proxy voting information, and other information atwww.troweprice.com/prospectus. You can also request this information without charge by contacting T. Rowe Price at 1‑800‑638‑5660 or info@troweprice.com or contacting your intermediary.
What were the fund costs for the last year? (based on a hypothetical $10,000 investment)
| | Costs of a $10,000 investment | Costs paid as a percentage of a $10,000 investment |
|---|
| Balanced Fund - I Class | $45 | 0.42% |
|---|
What drove fund performance during the past 12 months?
Equity markets were broadly positive in 2024, while fixed income markets were mixed. U.S. stocks produced strong gains, and various equity indexes reached new all-time highs during the year. The equity market was buoyed by generally favorable corporate earnings and by continuing interest in companies expected to benefit from artificial intelligence developments. Developed non-U.S. equity markets were mostly positive in 2024, helped by looser monetary policies from various central banks around the world. However, many markets surrendered some of their gains in the fourth quarter amid rising geopolitical tensions. U.S. taxable investment-grade bonds produced positive returns in 2024. U.S. Treasury bill yields declined, as the Federal Reserve reduced the fed funds target rate by 50 basis points in mid-September and by an additional 50 basis points in the fourth quarter.
Versus the Morningstar Moderate Target Risk Index, security selection within U.S. large-cap growth stocks contributed to relative results. The fund’s greater exposure to U.S large-caps compared to small- and mid-caps was also additive during a period of stronger performance for large-caps.
Conversely, an overweight allocation to real assets equities was detrimental to relative results, as this sector lagged broader global equities over the trailing 12 months. Unfavorable security selection within high yield bonds also detracted.
The fund seeks to provide capital growth, current income, and preservation of capital through a portfolio of stocks and fixed income securities. It normally invests approximately 65% of total assets in U.S. and foreign common stocks and 35% in fixed income securities.
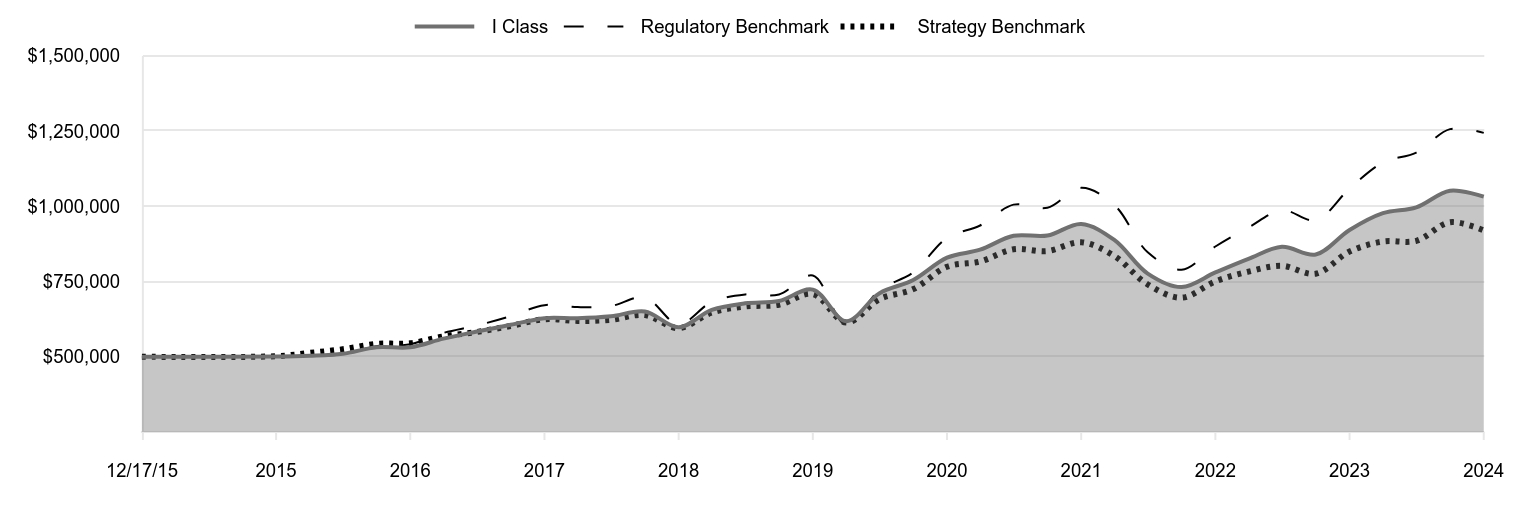
How has the fund performed?
Cumulative Returns of a Hypothetical $500,000 Investment as of December 31, 2024
| I Class | Regulatory Benchmark | Strategy Benchmark |
|---|
| 12/17/15 | 500,000 | 500,000 | 500,000 |
|---|
| 12/31/15 | 500,934 | 502,118 | 501,822 |
|---|
| 3/31/16 | 503,506 | 503,314 | 512,595 |
|---|
| 6/30/16 | 510,144 | 508,291 | 524,917 |
|---|
| 9/30/16 | 531,633 | 535,240 | 542,779 |
|---|
| 12/31/16 | 531,541 | 541,606 | 544,831 |
|---|
| 3/31/17 | 560,074 | 579,021 | 567,638 |
|---|
| 6/30/17 | 583,597 | 603,764 | 582,415 |
|---|
| 9/30/17 | 606,095 | 635,052 | 602,199 |
|---|
| 12/31/17 | 628,276 | 671,440 | 624,692 |
|---|
| 3/31/18 | 628,040 | 664,984 | 619,034 |
|---|
| 6/30/18 | 634,285 | 668,532 | 622,734 |
|---|
| 9/30/18 | 650,210 | 697,125 | 638,441 |
|---|
| 12/31/18 | 597,824 | 608,228 | 594,977 |
|---|
| 3/31/19 | 655,417 | 682,281 | 646,617 |
|---|
| 6/30/19 | 677,380 | 706,924 | 666,848 |
|---|
| 9/30/19 | 685,302 | 706,741 | 672,978 |
|---|
| 12/31/19 | 723,032 | 770,001 | 708,178 |
|---|
| 3/31/20 | 618,123 | 605,489 | 613,430 |
|---|
| 6/30/20 | 711,142 | 721,857 | 691,536 |
|---|
| 9/30/20 | 754,785 | 780,546 | 724,757 |
|---|
| 12/31/20 | 829,097 | 895,164 | 798,978 |
|---|
| 3/31/21 | 855,589 | 936,085 | 816,308 |
|---|
| 6/30/21 | 901,693 | 1,005,293 | 856,964 |
|---|
| 9/30/21 | 902,597 | 994,694 | 851,188 |
|---|
| 12/31/21 | 941,147 | 1,061,104 | 880,395 |
|---|
| 3/31/22 | 888,043 | 1,004,220 | 834,721 |
|---|
| 6/30/22 | 776,175 | 846,954 | 740,083 |
|---|
| 9/30/22 | 731,340 | 789,194 | 696,273 |
|---|
| 12/31/22 | 779,995 | 866,243 | 750,318 |
|---|
| 3/31/23 | 825,202 | 929,529 | 782,772 |
|---|
| 6/30/23 | 865,213 | 986,948 | 802,186 |
|---|
| 9/30/23 | 839,905 | 953,367 | 775,831 |
|---|
| 12/31/23 | 921,191 | 1,058,565 | 849,539 |
|---|
| 3/31/24 | 976,982 | 1,145,328 | 882,770 |
|---|
| 6/30/24 | 996,476 | 1,178,191 | 885,108 |
|---|
| 9/30/24 | 1,051,691 | 1,256,115 | 946,834 |
|---|
| 12/31/24 | 1,031,743 | 1,243,694 | 919,770 |
|---|
202501-4140694, 202502-4108138
Average Annual Total Returns
| | 1 Year | 5 Years | Since Inception 12/17/15 |
|---|
| Balanced Fund (I Class) | 12.00% | 7.37% | 8.34% |
|---|
| MSCI All Country World Index Net (Regulatory Benchmark) | 17.49 | 10.06 | 10.61 |
|---|
| Morningstar Moderate Target Risk Index (Strategy Benchmark) | 8.27 | 5.37 | 6.98 |
|---|
The preceding line graph shows the value of a hypothetical $500,000 investment in the fund over the past 10 fiscal year periods or since inception (for funds lacking 10-year records). The fund’s performance information included in the line graph and table above is compared with a regulatory required index that represents an overall securities market (Regulatory Benchmark). In addition, the line graph and table may also include one or more indexes that more closely aligns to the fund's investment strategy (Strategy Benchmark(s)). Due to new SEC Rules on shareholder reporting the fund adopted a new broad-based securities market index, referred to as the Regulatory Benchmark. Market index returns do not include expenses, which are deducted from fund returns. The fund's total return figures reflect the reinvestment of dividends and capital gains, if any.Neither the fund’s returns nor the index returns reflect the deduction of taxes that a shareholder would pay on fund distributions or redemptions of fund shares.The fund’s past performance is not a good predictor of the fund’s future performance.Updated performance information can be found at www.troweprice.com.
What are some fund statistics?
- Total Net Assets (000s)$4,599,799
- Number of Portfolio Holdings1,589
- Investment Advisory Fees Paid (000s)$17,720
- Portfolio Turnover Rate39.2%
What did the fund invest in?
Security Allocation (as a % of Net Assets)
| Common Stocks | 61.3% |
| Corporate Bonds | 8.3 |
| U.S. Government & Agency Mortgage-Backed Securities | 8.1 |
| U.S. Government Agency Obligations (Excluding Mortgage-Backed) | 7.9 |
| Bond Mutual Funds | 5.2 |
| Equity Mutual Funds | 4.2 |
| Asset-Backed Securities | 1.5 |
| Non-U.S. Government Mortgage-Backed Securities | 1.3 |
| Short-Term and Other | 2.2 |
Top Ten Holdings (as a % of Net Assets)
| U.S. Treasury Notes | 5.4% |
| T. Rowe Price Institutional High Yield Fund - Institutional Class | 4.7 |
| T. Rowe Price Real Assets Fund - I Class | 4.2 |
| Federal National Mortgage Assn. | 4.0 |
| NVIDIA | 2.8 |
| Microsoft | 2.6 |
| Apple | 2.6 |
| U.S. Treasury Bonds | 2.5 |
| Amazon.com | 1.9 |
| Government National Mortgage Assn. | 1.8 |
If you invest directly with T. Rowe Price, you can elect to receive future shareholder reports or other important documents through electronic delivery by enrolling at www.troweprice.com/paperless. If you invest through a financial intermediary such as an investment advisor, a bank, retirement plan sponsor or a brokerage firm, please contact that organization and ask if it can provide electronic delivery.
MSCI and Morningstar do not accept any liability for any errors or omissions in the indexes or data, and hereby expressly disclaim all warranties of originality, accuracy, completeness, timeliness, merchantability and fitness for a particular purpose. No party may rely on any indexes or data contained in this communication. Visit www.troweprice.com/en/us/market-data-disclosures for additional legal notices & disclaimers.
Balanced Fund
I Class (RBAIX)
T. Rowe Price Investment Services, Inc.
100 East Pratt Street
Baltimore, MD 21202
Item 1. (b) Notice pursuant to Rule 30e-3.
Not applicable.
Item 2. Code of Ethics.
The registrant has adopted a code of ethics, as defined in Item 2 of Form N-CSR, applicable to its principal executive officer, principal financial officer, principal accounting officer or controller, or persons performing similar functions. A copy of this code of ethics is filed as an exhibit to this Form N-CSR. No substantive amendments were approved or waivers were granted to this code of ethics during the period covered by this report.
Item 3. Audit Committee Financial Expert.
The registrant’s Board of Directors has determined that Mr. Paul F. McBride qualifies as an audit committee financial expert, as defined in Item 3 of Form N-CSR. Mr. McBride is considered independent for purposes of Item 3 of Form N-CSR.
Item 4. Principal Accountant Fees and Services.
(a) – (d) Aggregate fees billed for the last two fiscal years for professional services rendered to, or on behalf of, the registrant by the registrant’s principal accountant were as follows:
| | | | | | | | | | |
| | | 2024 | | | 2023 | | | |
Audit Fees | | $ | 33,841 | | | $ | 34,808 | |
Audit-Related Fees | | | - | | | | - | |
Tax Fees | | | - | | | | - | |
All Other Fees | | | - | | | | - | |
Audit fees include amounts related to the audit of the registrant’s annual financial statements and services normally provided by the accountant in connection with statutory and regulatory filings. Audit-related fees include amounts reasonably related to the performance of the audit of the registrant’s financial statements and specifically include the issuance of a report on internal controls and, if applicable, agreed-upon procedures related to fund acquisitions. Tax fees include amounts related to services for tax compliance, tax planning, and tax advice. The nature of these services specifically includes the review of distribution calculations and the preparation of Federal, state, and excise tax returns. All other fees include the registrant’s pro-rata share of amounts for agreed-upon procedures in conjunction with service contract approvals by the registrant’s Board of Directors/Trustees.
(e)(1) The registrant’s audit committee has adopted a policy whereby audit and non-audit services performed by the registrant’s principal accountant for the registrant, its investment adviser, and any entity controlling, controlled by, or under common control with the investment adviser that provides ongoing services to the registrant require pre-approval in advance at regularly scheduled audit committee meetings. If such a service is required between regularly scheduled audit committee meetings, pre-approval may be authorized by one audit committee member with ratification at the next scheduled audit committee meeting. Waiver of pre-approval for audit or non-audit services requiring fees of a de minimis amount is not permitted.
(2) No services included in (b) – (d) above were approved pursuant to paragraph (c)(7)(i)(C) of Rule 2-01 of Regulation S-X.
(f) Less than 50 percent of the hours expended on the principal accountant’s engagement to audit the registrant’s financial statements for the most recent fiscal year were attributed to work performed by persons other than the principal accountant’s full-time, permanent employees.
(g) The aggregate fees billed for the most recent fiscal year and the preceding fiscal year by the registrant’s principal accountant for non-audit services rendered to the registrant, its investment adviser, and any entity controlling, controlled by, or under common control with the investment adviser that provides ongoing services to the registrant were $1,262,000 and $1,524,000, respectively.
(h) All non-audit services rendered in (g) above were pre-approved by the registrant’s audit committee. Accordingly, these services were considered by the registrant’s audit committee in maintaining the principal accountant’s independence.
(i) Not applicable.
(j) Not applicable.
Item 5. Audit Committee of Listed Registrants.
Not applicable.
Item 6. Investments.
(a) Not applicable. The complete schedule of investments is included in Item 7 of this Form N-CSR.
(b) Not applicable.
Item 7. Financial Statements and Financial Highlights for Open-End Management Investment Companies.
(a – b) Report pursuant to Regulation S-X.
Financial
Highlights
Portfolio
of
Investments
Financial
Statements
and
Notes
Additional
Fund
Information
Financial
Statements
and
Other
Information
For
more
insights
from
T.
Rowe
Price
investment
professionals,
go
to
troweprice.com
.
T.
ROWE
PRICE
RPBAX
Balanced
Fund
RBAIX
Balanced
Fund–
.
I Class
For
a
share
outstanding
throughout
each
period
The
accompanying
notes
are
an
integral
part
of
these
financial
statements.
Investor
Class
..
Year
..
..
Ended
.
12/31/24
12/31/23
12/31/22
12/31/21
12/31/20
NET
ASSET
VALUE
Beginning
of
period
$
25.22
$
22.22
$
28.20
$
27.24
$
24.94
Investment
activities
Net
investment
income
(1)(2)
0.55
0.51
0.43
0.37
0.40
Net
realized
and
unrealized
gain/loss
2.42
3.45
(5.29)
3.22
3.15
Total
from
investment
activities
2.97
3.96
(4.86)
3.59
3.55
Distributions
Net
investment
income
(0.58)
(0.52)
(0.44)
(0.38)
(0.41)
Net
realized
gain
(1.33)
(0.44)
(0.68)
(2.25)
(0.84)
Total
distributions
(1.91)
(0.96)
(1.12)
(2.63)
(1.25)
NET
ASSET
VALUE
End
of
period
$
26.28
$
25.22
$
22.22
$
28.20
$
27.24
Ratios/Supplemental
Data
Total
return
(2)(3)
11.84%
17.99%
(17.26)%
13.36%
14.57%
Ratios
to
average
net
assets:
(2)
Gross
expenses
before
waivers/payments
by
Price
Associates
0.60%
0.60%
0.61%
0.57%
0.58%
Net
expenses
after
waivers/
payments
by
Price
Associates
0.55%
0.55%
0.57%
0.53%
0.55%
Net
investment
income
2.06%
2.15%
1.74%
1.27%
1.63%
Portfolio
turnover
rate
39.2%
40.9%
97.7%
91.9%
75.7%
Net
assets,
end
of
period
(in
millions)
$2,484
$2,490
$2,318
$4,224
$4,087
0%
0%
0%
0%
0%
(1)
Per
share
amounts
calculated
using
average
shares
outstanding
method.
(2)
Includes
the
impact
of
expense-related
arrangements
with
Price
Associates.
(3)
Total
return
reflects
the
rate
that
an
investor
would
have
earned
on
an
investment
in
the
fund
during
each
period,
assuming
reinvestment
of
all
distributions,
and
payment
of
no
redemption
or
account
fees,
if
applicable.
For
a
share
outstanding
throughout
each
period
The
accompanying
notes
are
an
integral
part
of
these
financial
statements.
I
Class
..
Year
..
..
Ended
.
12/31/24
12/31/23
12/31/22
12/31/21
12/31/20
NET
ASSET
VALUE
Beginning
of
period
$
25.20
$
22.21
$
28.20
$
27.23
$
24.94
Investment
activities
Net
investment
income
(1)(2)
0.59
0.54
0.49
0.41
0.43
Net
realized
and
unrealized
gain/loss
2.42
3.44
(5.31)
3.22
3.14
Total
from
investment
activities
3.01
3.98
(4.82)
3.63
3.57
Distributions
Net
investment
income
(0.62)
(0.55)
(0.49)
(0.41)
(0.44)
Net
realized
gain
(1.33)
(0.44)
(0.68)
(2.25)
(0.84)
Total
distributions
(1.95)
(0.99)
(1.17)
(2.66)
(1.28)
NET
ASSET
VALUE
End
of
period
$
26.26
$
25.20
$
22.21
$
28.20
$
27.23
Ratios/Supplemental
Data
Total
return
(2)(3)
12.00%
18.10%
(17.12)%
13.51%
14.67%
Ratios
to
average
net
assets:
(2)
Gross
expenses
before
waivers/payments
by
Price
Associates
0.47%
0.47%
0.47%
0.45%
0.46%
Net
expenses
after
waivers/payments
by
Price
Associates
0.42%
0.42%
0.43%
0.41%
0.43%
Net
investment
income
2.20%
2.28%
2.02%
1.39%
1.74%
Portfolio
turnover
rate
39.2%
40.9%
97.7%
91.9%
75.7%
Net
assets,
end
of
period
(in
millions)
$2,116
$1,889
$1,669
$1,173
$871
0%
0%
0%
0%
0%
(1)
Per
share
amounts
calculated
using
average
shares
outstanding
method.
(2)
Includes
the
impact
of
expense-related
arrangements
with
Price
Associates.
(3)
Total
return
reflects
the
rate
that
an
investor
would
have
earned
on
an
investment
in
the
fund
during
each
period,
assuming
reinvestment
of
all
distributions,
and
payment
of
no
redemption
or
account
fees,
if
applicable.
T.
ROWE
PRICE
Balanced
Fund
December
31,
2024
Shares/Par
$
Value
(Cost
and
value
in
$000s)
‡
ASSET-BACKED
SECURITIES
1.5%
AmeriCredit
Automobile
Receivables
Trust
Series 2021-2,
Class
D
1.29%,
6/18/27
2,100,000
2,026
Bayview
Opportunity
Master
Fund
VII
Series 2024-CAR1,
Class
A,
FRN
SOFR30A
+
1.10%,
5.669%,
12/26/31 (1)
178,056
178
BRE
Grand
Islander
Timeshare
Issuer
Series 2019-A,
Class
A
3.28%,
9/26/33 (1)
149,999
147
CarMax
Auto
Owner
Trust
Series 2021-1,
Class
D
1.28%,
7/15/27
1,205,000
1,195
CarMax
Auto
Owner
Trust
Series 2023-3,
Class
A3
5.28%,
5/15/28
735,000
741
CarMax
Auto
Owner
Trust
Series 2023-3,
Class
B
5.47%,
2/15/29
580,000
587
CarMax
Auto
Owner
Trust
Series 2024-1,
Class
B
5.17%,
8/15/29
105,000
106
CarMax
Auto
Owner
Trust
Series 2024-3,
Class
A3
4.89%,
7/16/29
400,000
402
Carvana
Auto
Receivables
Trust
Series 2021-P4,
Class
C
2.33%,
2/10/28
1,715,000
1,599
Carvana
Auto
Receivables
Trust
Series 2024-N1,
Class
A3
5.60%,
3/10/28 (1)
195,000
197
Carvana
Auto
Receivables
Trust
Series 2024-N1,
Class
B
5.63%,
5/10/30 (1)
235,000
237
Carvana
Auto
Receivables
Trust
Series 2024-N3,
Class
B
4.67%,
12/10/30 (1)
3,420,000
3,388
CCG
Receivables
Trust
Series 2024-1,
Class
A2
4.99%,
3/15/32 (1)
2,715,000
2,729
CIFC
Funding
Series 2018-1A,
Class
A1R,
CLO,
FRN
3M
TSFR
+
1.32%,
5.794%,
1/18/38 (1)
520,000
519
CyrusOne
Data
Centers
Issuer
I
Series 2024-2A,
Class
A2
4.50%,
5/20/49 (1)
2,330,000
2,221
Shares/Par
$
Value
(Cost
and
value
in
$000s)
‡
Drive
Auto
Receivables
Trust
Series 2024-2,
Class
B
4.52%,
7/16/29
1,800,000
1,787
Driven
Brands
Funding
Series 2020-1A,
Class
A2
3.786%,
7/20/50 (1)
630,715
605
Driven
Brands
Funding
Series 2020-2A,
Class
A2
3.237%,
1/20/51 (1)
1,164,698
1,091
Driven
Brands
Funding
Series 2021-1A,
Class
A2
2.791%,
10/20/51 (1)
1,457,752
1,318
Elara
HGV
Timeshare
Issuer
Series 2023-A,
Class
A
6.16%,
2/25/38 (1)
395,183
403
Elara
HGV
Timeshare
Issuer
Series 2023-A,
Class
B
6.53%,
2/25/38 (1)
317,735
322
Elmwood
Series 2022-7A,
Class
AR,
CLO,
FRN
3M
TSFR
+
1.50%,
6.147%,
1/17/37 (1)
1,385,000
1,394
Enterprise
Fleet
Financing
Series 2024-3,
Class
A3
4.98%,
8/21/28 (1)
155,000
156
Enterprise
Fleet
Financing
Series 2024-3,
Class
A4
5.06%,
3/20/31 (1)
110,000
110
Enterprise
Fleet
Financing
Series 2024-4,
Class
A2
4.69%,
7/20/27 (1)
455,000
456
Enterprise
Fleet
Financing
Series 2024-4,
Class
A4
4.70%,
6/20/31 (1)
670,000
666
Ford
Credit
Auto
Owner
Trust
Series 2020-2,
Class
C
1.74%,
4/15/33 (1)
1,665,000
1,619
Ford
Credit
Auto
Owner
Trust
Series 2023-1,
Class
A
4.85%,
8/15/35 (1)
2,565,000
2,575
Ford
Credit
Floorplan
Master
Owner
Trust
Series 2020-2,
Class
B
1.32%,
9/15/27
1,275,000
1,244
Golub
Capital
Partners
Series 2019-43A,
Class
A1R,
CLO,
FRN
3M
TSFR
+
1.34%,
5.889%,
10/20/37 (1)
2,175,000
2,175
Shares/Par
$
Value
(Cost
and
value
in
$000s)
‡
Hardee's
Funding
Series 2024-1A,
Class
A2
7.253%,
3/20/54 (1)
1,672,363
1,708
Highbridge
Loan
Management
Series 5A-2015,
Class
A1R3,
CLO,
FRN
3M
TSFR
+
1.06%,
6.068%,
10/15/30 (1)
630,000
631
Huntington
Bank
Auto
Credit-Linked
Notes
Series 2024-1,
Class
B1
6.153%,
5/20/32 (1)
191,602
194
Invesco
U.S.
Series 2023-1A,
Class
AR,
CLO,
FRN
3M
TSFR
+
1.57%,
6.202%,
4/22/37 (1)
720,000
723
Jamestown
XV
Series 2020-15A,
Class
A1R,
CLO,
FRN
3M
TSFR
+
1.37%,
6.026%,
7/15/35 (1)
1,160,000
1,164
Jersey
Mike's
Funding
Series 2019-1A,
Class
A2
4.433%,
2/15/50 (1)
279,885
276
Jersey
Mike's
Funding
Series 2021-1A,
Class
A2I
2.891%,
2/15/52 (1)
49,750
48
KKR
Series 2022-43A,
Class
A1R,
CLO,
FRN
3M
TSFR
+
1.75%,
6.406%,
1/15/36 (1)
1,075,000
1,081
Madison
Park
Funding
XXXIII
Series 2019-33A,
Class
AR,
CLO,
FRN
3M
TSFR
+
1.29%,
5.946%,
10/15/32 (1)
1,205,000
1,206
MVW
Series 2019-2A,
Class
A
2.22%,
10/20/38 (1)
422,654
412
Navient
Private
Education
Refi
Loan
Trust
Series 2019-CA,
Class
A2
3.13%,
2/15/68 (1)
377,945
369
Navient
Private
Education
Refi
Loan
Trust
Series 2020-GA,
Class
A
1.17%,
9/16/69 (1)
249,218
229
Navistar
Financial
Dealer
Note
Master
Owner
Trust
Series 2024-1,
Class
A
5.59%,
4/25/29 (1)
165,000
167
Neuberger
Berman
XXI
Series 2016-21A,
Class
A1R3,
CLO,
FRN
3M
TSFR
+
1.32%,
5.792%,
1/20/39 (1)
415,000
415
OCP
Series 2017-13A,
Class
AR2,
CLO,
FRN
3M
TSFR
+
1.34%,
5.90%,
11/26/37 (1)
1,910,000
1,912
Shares/Par
$
Value
(Cost
and
value
in
$000s)
‡
Octane
Receivables
Trust
Series 2024-RVM1,
Class
A
5.01%,
1/22/46 (1)
870,000
869
Palmer
Square
Series 2020-3A,
Class
A1R2,
CLO,
FRN
3M
TSFR
+
1.65%,
6.173%,
11/15/36 (1)
1,405,000
1,411
Porsche
Innovative
Lease
Owner
Trust
Series 2024-2A,
Class
A4
4.26%,
9/20/30 (1)
790,000
784
Post
Road
Equipment
Finance
Series 2024-1A,
Class
A2
5.59%,
11/15/29 (1)
129,874
131
Progress
Residential
Trust
Series 2024-SFR4,
Class
A
3.10%,
7/17/41 (1)
2,505,000
2,297
Progress
Residential
Trust
Series 2024-SFR5,
Class
A
3.00%,
8/9/29 (1)
345,000
314
Santander
Bank
Auto
Credit-Linked
Notes
Series 2022-C,
Class
B
6.451%,
12/15/32 (1)
416,006
418
Santander
Drive
Auto
Receivables
Trust
Series 2021-1,
Class
E
2.51%,
12/15/28
4,100,000
4,025
Santander
Drive
Auto
Receivables
Trust
Series 2021-3,
Class
E
2.70%,
10/16/28 (1)
4,300,000
4,220
Santander
Drive
Auto
Receivables
Trust
Series 2024-5,
Class
A3
4.62%,
11/15/28
800,000
799
Santander
Drive
Auto
Receivables
Trust
Series 2024-5,
Class
B
4.63%,
8/15/29
900,000
896
SBNA
Auto
Lease
Trust
Series 2024-A,
Class
A3
5.39%,
11/20/26 (1)
180,000
181
SBNA
Auto
Lease
Trust
Series 2024-A,
Class
A4
5.24%,
1/22/29 (1)
175,000
176
SCF
Equipment
Leasing
Series 2024-1A,
Class
C
5.82%,
9/20/32 (1)
390,000
395
SEB
Funding
Series 2024-1A,
Class
A2
7.386%,
4/30/54 (1)
400,000
409
Shares/Par
$
Value
(Cost
and
value
in
$000s)
‡
ServiceMaster
Funding
Series 2021-1,
Class
A2I
2.865%,
7/30/51 (1)
1,555,686
1,397
Signal
Peak
Series 2018-5A,
Class
A1R,
CLO,
FRN
3M
TSFR
+
1.55%,
6.176%,
4/25/37 (1)
2,220,000
2,235
SMB
Private
Education
Loan
Trust
Series 2018-B,
Class
A2A
3.60%,
1/15/37 (1)
246,209
242
SMB
Private
Education
Loan
Trust
Series 2020-B,
Class
A1A
1.29%,
7/15/53 (1)
673,837
625
SMB
Private
Education
Loan
Trust
Series 2021-A,
Class
APT1
1.07%,
1/15/53 (1)
1,403,809
1,245
Synchrony
Card
Funding
Series 2023-A1,
Class
A
5.54%,
7/15/29
585,000
593
TPIC
SPV
I
Series 2024-1A,
Class
A
7.131%,
11/30/44,
Acquisition
Date:
12/10/24,
Cost $1,685 (2)
1,685,000
1,685
U.S.
Bank
Series 2023-1,
Class
B
6.789%,
8/25/32 (1)
133,853
136
Verdant
Receivables
Series 2023-1A,
Class
A2
6.24%,
1/13/31 (1)
317,110
322
Verdant
Receivables
Series 2024-1A,
Class
A2
5.68%,
12/12/31 (1)
170,000
172
Total
Asset-Backed
Securities
(Cost
$69,412)
68,705
BOND
MUTUAL
FUNDS
5.2%
T.
Rowe
Price
Inflation
Protected
Bond
Fund
-
I
Class,
3.22% (3)(4)
2,211,631
22,426
T.
Rowe
Price
Institutional
High
Yield
Fund
-
Institutional
Class,
6.73% (3)(4)
27,701,490
216,903
T.
Rowe
Price
Limited
Duration
Inflation
Focused
Bond
Fund
-
I
Class,
2.91% (3)(4)
102,720
474
Total
Bond
Mutual
Funds
(Cost
$256,228)
239,803
Shares/Par
$
Value
(Cost
and
value
in
$000s)
‡
COMMON
STOCKS
61.3%
COMMUNICATION
SERVICES
4.9%
Diversified
Telecommunication
Services
0.4%
AT&T
19,531
445
BT
Group
(GBP) (5)
2,927,022
5,276
KT
(KRW)
131,837
3,923
Nippon
Telegraph
&
Telephone
(JPY)
8,780,100
8,770
18,414
Entertainment
0.5%
Netflix (6)
22,694
20,228
Sea,
ADR (6)
20,691
2,195
Spotify
Technology (6)
1,400
627
Walt
Disney
12,800
1,425
24,475
Interactive
Media
&
Services
3.2%
Alphabet,
Class
A
106,572
20,174
Alphabet,
Class
C
304,061
57,906
LY
(JPY)
754,600
1,995
Meta
Platforms,
Class
A
101,705
59,549
NAVER
(KRW)
24,952
3,330
Pinterest,
Class
A (6)
19,700
571
Tencent
Holdings
(HKD)
38,200
2,039
145,564
Media
0.4%
Charter
Communications,
Class
A (6)
4,700
1,611
Comcast,
Class
A
212,511
7,975
CyberAgent
(JPY)
379,100
2,609
WPP
(GBP)
598,871
6,173
18,368
Wireless
Telecommunication
Services
0.4%
T-Mobile
U.S.
81,764
18,048
18,048
Total
Communication
Services
224,869
CONSUMER
DISCRETIONARY
7.0%
Automobile
Components
0.4%
Autoliv,
SDR
(SEK)
48,151
4,484
Denso
(JPY)
365,000
5,032
Dowlais
Group
(GBP)
1,184,819
996
Magna
International (5)
92,604
3,870
Shares/Par
$
Value
(Cost
and
value
in
$000s)
‡
Stanley
Electric
(JPY)
103,800
1,702
16,084
Automobiles
1.2%
Subaru
(JPY)
106,500
1,892
Suzuki
Motor
(JPY)
357,700
4,008
Tesla (6)
91,685
37,026
Toyota
Motor
(JPY)
546,800
10,677
53,603
Broadline
Retail
2.1%
Alibaba
Group
Holding,
ADR
17,123
1,452
Amazon.com (6)
394,517
86,553
Isetan
Mitsukoshi
Holdings
(JPY)
243,600
4,183
Next
(GBP)
52,285
6,202
98,390
Hotels,
Restaurants
&
Leisure
1.3%
Airbnb,
Class
A (6)
1,577
207
Amadeus
IT
Group
(EUR)
71,314
5,034
Booking
Holdings
2,988
14,845
Chipotle
Mexican
Grill (6)
127,509
7,689
Compass
Group
(GBP)
313,461
10,430
Domino's
Pizza
858
360
DoorDash,
Class
A (6)
14,759
2,476
Hilton
Worldwide
Holdings
4,756
1,175
Las
Vegas
Sands
18,590
955
Marriott
International,
Class
A
4,588
1,280
McDonald's
41,536
12,041
Norwegian
Cruise
Line
Holdings (6)
12,482
321
Royal
Caribbean
Cruises
5,579
1,287
Starbucks
5,161
471
Wingstop
1,151
327
Wynn
Resorts
3,504
302
59,200
Household
Durables
0.4%
NVR (6)
190
1,554
Panasonic
Holdings
(JPY)
475,100
4,856
Persimmon
(GBP)
161,305
2,409
Sony
Group
(JPY)
461,200
9,720
18,539
Specialty
Retail
1.2%
AutoZone (6)
2,624
8,402
Bath
&
Body
Works
4,441
172
Shares/Par
$
Value
(Cost
and
value
in
$000s)
‡
Burlington
Stores (6)
2,476
706
Carvana (6)
55,004
11,186
Home
Depot
28,770
11,191
Kingfisher
(GBP)
1,633,519
5,078
Lowe's
7,282
1,797
O'Reilly
Automotive (6)
1,057
1,253
Ross
Stores
60,003
9,077
TJX
35,258
4,259
Tractor
Supply
62,505
3,316
Ulta
Beauty (6)
714
311
56,748
Textiles,
Apparel
&
Luxury
Goods
0.4%
Cie
Financiere
Richemont,
Class
A
(CHF)
29,412
4,449
Deckers
Outdoor (6)
2,600
528
Kering
(EUR)
9,910
2,448
Lululemon
Athletica (6)
7,082
2,708
Moncler
(EUR)
75,821
4,003
NIKE,
Class
B
5,127
388
Samsonite
International
(HKD)
768,000
2,118
Tapestry
13,673
893
17,535
Total
Consumer
Discretionary
320,099
CONSUMER
STAPLES
3.8%
Beverages
0.8%
Coca-Cola
189,184
11,779
Constellation
Brands,
Class
A
2,285
505
Diageo
(GBP)
165,882
5,271
Heineken
(EUR)
71,609
5,103
Keurig
Dr
Pepper
309,453
9,940
Kirin
Holdings
(JPY) (5)
123,200
1,600
Monster
Beverage (6)
6,444
339
PepsiCo
17,870
2,717
37,254
Consumer
Staples
Distribution
&
Retail
0.7%
Costco
Wholesale
6,014
5,510
Dollar
General
11,472
870
Dollar
Tree (6)
30,092
2,255
Seven
&
i
Holdings
(JPY)
502,700
7,881
Sysco
2,379
182
Target
6,535
883
Walmart
162,070
14,643
Shares/Par
$
Value
(Cost
and
value
in
$000s)
‡
Welcia
Holdings
(JPY)
66,900
872
33,096
Food
Products
0.6%
Barry
Callebaut
(CHF) (5)
1,094
1,457
Lamb
Weston
Holdings
1,800
120
Mondelez
International,
Class
A
81,437
4,864
Nestle
(CHF)
202,812
16,639
Wilmar
International
(SGD)
1,739,800
3,949
27,029
Household
Products
0.6%
Clorox
3,000
487
Colgate-Palmolive
123,163
11,197
Kimberly-Clark
4,825
632
Procter
&
Gamble
91,902
15,408
27,724
Personal
Care
Products
1.0%
Kenvue
919,488
19,631
L'Oreal
(EUR)
16,934
5,995
Puig
Brands,
Class
B
(EUR) (6)
88,485
1,631
Unilever
(GBP)
292,801
16,637
43,894
Tobacco
0.1%
Altria
Group
13,058
683
Philip
Morris
International
32,775
3,944
4,627
Total
Consumer
Staples
173,624
ENERGY
2.5%
Energy
Equipment
&
Services
0.3%
Schlumberger
265,040
10,162
TechnipFMC
59,500
1,722
11,884
Oil,
Gas
&
Consumable
Fuels
2.2%
Chevron
73,847
10,696
ConocoPhillips
126,531
12,548
Diamondback
Energy
35,827
5,870
EOG
Resources
10,658
1,306
EQT
134,382
6,196
Equinor
(NOK)
374,381
8,880
Expand
Energy
26,485
2,637
Exxon
Mobil
153,687
16,532
Hess
1,916
255
Shares/Par
$
Value
(Cost
and
value
in
$000s)
‡
Marathon
Petroleum
7,207
1,005
Phillips
66
35,689
4,066
Range
Resources
235,437
8,471
Shell,
ADR
129,936
8,141
Suncor
Energy
7,569
270
Targa
Resources
6,160
1,100
Texas
Pacific
Land
300
332
TotalEnergies
(EUR)
198,061
11,035
Valero
Energy
7,401
907
Williams
54,362
2,942
103,189
Total
Energy
115,073
FINANCIALS
10.8%
Banks
3.4%
ANZ
Group
Holdings
(AUD)
202,633
3,570
Bank
of
America
468,071
20,572
Citigroup
103,147
7,261
DBS
Group
Holdings
(SGD)
173,600
5,563
DNB
Bank
(NOK)
486,717
9,717
Fifth
Third
Bancorp
19,797
837
HDFC
Bank
(INR)
249,614
5,162
Huntington
Bancshares
176,114
2,865
ING
Groep
(EUR)
565,148
8,857
Intesa
Sanpaolo
(EUR)
1,086,239
4,357
JPMorgan
Chase
135,870
32,569
KeyCorp
241,581
4,141
Mitsubishi
UFJ
Financial
Group
(JPY)
712,000
8,312
National
Bank
of
Canada
(CAD)
83,285
7,592
Popular
3,400
320
Skandinaviska
Enskilda
Banken,
Class
A
(SEK)
243,657
3,339
Societe
Generale
(EUR)
106,990
3,003
Standard
Chartered
(GBP)
548,508
6,753
Sumitomo
Mitsui
Trust
Group
(JPY)
117,308
2,740
Truist
Financial
5,386
234
UniCredit
(EUR)
134,609
5,391
United
Overseas
Bank
(SGD)
287,900
7,646
Wells
Fargo
41,489
2,914
Western
Alliance
Bancorp
4,063
339
154,054
Capital
Markets
1.6%
Ares
Management,
Class
A
4,625
819
Bank
of
New
York
Mellon
14,793
1,137
Shares/Par
$
Value
(Cost
and
value
in
$000s)
‡
Blackrock
1,834
1,880
Blackstone
3,461
597
Bridgepoint
Group
(GBP)
706,060
3,158
Brookfield
(CAD)
106,467
6,119
Cboe
Global
Markets
2,463
481
Charles
Schwab
225,611
16,698
CME
Group
29,480
6,846
CVC
Capital
Partners
(EUR) (6)
178,368
3,944
Goldman
Sachs
Group
15,555
8,907
Julius
Baer
Group
(CHF)
88,765
5,758
KKR
11,683
1,728
Macquarie
Group
(AUD)
33,008
4,514
Moody's
800
379
Morgan
Stanley
38,742
4,871
MSCI
212
127
S&P
Global
9,703
4,832
State
Street
9,000
883
TPG
6,500
408
Tradeweb
Markets,
Class
A
5,022
658
74,744
Consumer
Finance
0.3%
American
Express
41,162
12,216
Capital
One
Financial
4,000
713
Synchrony
Financial
14,100
917
13,846
Financial
Services
2.8%
Adyen
(EUR) (6)
2,245
3,336
Apollo
Global
Management
7,697
1,271
Berkshire
Hathaway,
Class
B (6)
68,719
31,149
Block (6)
4,800
408
Challenger
(AUD)
332,393
1,234
Corebridge
Financial
213,516
6,391
Corpay (6)
19,660
6,653
Edenred
(EUR)
61,311
2,016
Equitable
Holdings
20,449
965
Fiserv (6)
94,797
19,473
Global
Payments
9,628
1,079
Mastercard,
Class
A
41,358
21,778
Mitsubishi
HC
Capital
(JPY)
307,800
2,028
Visa,
Class
A
102,050
32,252
Voya
Financial
12,434
856
130,889
Shares/Par
$
Value
(Cost
and
value
in
$000s)
‡
Insurance
2.6%
AIA
Group
(HKD)
726,000
5,215
Allstate
42,806
8,253
American
International
Group
22,036
1,604
AXA
(EUR)
377,350
13,430
Axis
Capital
Holdings
4,644
411
Chubb
46,441
12,832
Definity
Financial
(CAD)
75,609
3,074
Great-West
Lifeco
(CAD)
90,015
2,985
Hartford
Financial
Services
Group
12,224
1,337
Mandatum
(EUR)
412,976
1,921
Marsh
&
McLennan
20,632
4,382
MetLife
55,340
4,531
Muenchener
Rueckversicherungs-Gesellschaft
(EUR)
30,442
15,389
Progressive
11,401
2,732
RenaissanceRe
Holdings
3,913
974
Sampo,
Class
A
(EUR)
158,103
6,458
Storebrand
(NOK)
520,374
5,549
Sun
Life
Financial
(CAD)
83,950
4,985
Tokio
Marine
Holdings
(JPY)
300,700
10,792
Travelers
28,878
6,956
Zurich
Insurance
Group
(CHF)
10,626
6,320
120,130
Mortgage
Real
Estate
Investment
Trusts
0.1%
Annaly
Capital
Management,
REIT
215,316
3,940
3,940
Total
Financials
497,603
HEALTH
CARE
7.1%
Biotechnology
0.5%
AbbVie
20,821
3,700
Amgen
6,499
1,694
Argenx,
ADR (6)
7,973
4,903
BeiGene,
ADR (6)
2,800
517
Biogen (6)
4,642
710
Genmab
(DKK) (6)
11,381
2,377
Gilead
Sciences
13,062
1,206
Regeneron
Pharmaceuticals (6)
9,083
6,470
Vertex
Pharmaceuticals (6)
2,428
978
22,555
Health
Care
Equipment
&
Supplies
1.3%
Abbott
Laboratories
10,022
1,134
Alcon
(CHF)
45,233
3,835
Shares/Par
$
Value
(Cost
and
value
in
$000s)
‡
Becton
Dickinson
&
Company
28,044
6,362
Boston
Scientific (6)
16,657
1,488
Cooper (6)
7,800
717
Edwards
Lifesciences (6)
10,200
755
Elekta,
Class
B
(SEK)
364,500
2,013
EssilorLuxottica
(EUR)
22,178
5,410
GE
HealthCare
Technologies
28,249
2,209
Intuitive
Surgical (6)
26,234
13,693
Koninklijke
Philips
(EUR) (6)
271,255
6,871
Medtronic
9,339
746
Siemens
Healthineers
(EUR)
135,296
7,145
Stryker
15,976
5,752
Zimmer
Biomet
Holdings
12,291
1,298
59,428
Health
Care
Providers
&
Services
1.6%
Cencora
47,508
10,674
Cigna
Group
18,153
5,013
CVS
Health
12,600
566
Elevance
Health
40,510
14,944
HCA
Healthcare
5,259
1,579
Humana
6,441
1,634
McKesson
2,050
1,168
Molina
Healthcare (6)
9,110
2,651
Quest
Diagnostics
4,800
724
Tenet
Healthcare (6)
50,745
6,406
UnitedHealth
Group
57,922
29,300
74,659
Life
Sciences
Tools
&
Services
0.8%
Danaher
48,683
11,175
ICON (6)
1,695
356
Mettler-Toledo
International (6)
877
1,073
Repligen (6)
5,116
736
Revvity
64,956
7,250
Thermo
Fisher
Scientific
30,291
15,758
36,348
Pharmaceuticals
2.9%
Astellas
Pharma
(JPY)
387,600
3,764
AstraZeneca,
ADR
367,225
24,061
Bayer
(EUR)
98,640
1,970
Bristol-Myers
Squibb
6,894
390
Chugai
Pharmaceutical
(JPY)
97,500
4,298
Eli
Lilly
42,221
32,595
Shares/Par
$
Value
(Cost
and
value
in
$000s)
‡
Johnson
&
Johnson
72,164
10,436
Merck
26,806
2,667
Novartis
(CHF)
119,946
11,678
Novo
Nordisk,
Class
B
(DKK)
127,066
10,963
Pfizer
40,770
1,082
Roche
Holding
(CHF)
40,669
11,371
Sanofi
(EUR)
128,661
12,507
Sanofi,
ADR
11,900
574
Shionogi
(JPY)
113,600
1,593
Viatris
74,282
925
Zoetis
1,769
288
131,162
Total
Health
Care
324,152
INDUSTRIALS
&
BUSINESS
SERVICES
6.4%
Aerospace
&
Defense
1.2%
Boeing (6)
47,748
8,451
General
Dynamics
16,971
4,472
General
Electric
71,646
11,950
Howmet
Aerospace
8,965
981
L3Harris
Technologies
29,572
6,218
Lockheed
Martin
689
335
Melrose
Industries
(GBP)
978,383
6,761
Northrop
Grumman
11,388
5,344
RTX
8,089
936
Safran
(EUR)
36,321
7,958
TransDigm
Group
2,030
2,573
55,979
Air
Freight
&
Logistics
0.0%
FedEx
2,564
721
721
Building
Products
0.1%
Carrier
Global
14,174
968
Johnson
Controls
International
7,505
592
Owens
Corning
12,600
2,146
Trane
Technologies
2,990
1,104
Trex (6)
1,000
69
4,879
Commercial
Services
&
Supplies
0.4%
Cintas
13,152
2,403
Copart (6)
13,492
774
Element
Fleet
Management
(CAD)
421,764
8,527
Shares/Par
$
Value
(Cost
and
value
in
$000s)
‡
Republic
Services
29,567
5,948
Veralto
4,598
469
Waste
Connections
3,317
569
Waste
Management
3,738
754
19,444
Construction
&
Engineering
0.1%
Worley
(AUD)
416,461
3,521
3,521
Electrical
Equipment
1.2%
ABB
(CHF)
203,568
10,992
AMETEK
55,454
9,996
Emerson
Electric
5,292
656
GE
Vernova
11,146
3,666
Hubbell
2,430
1,018
Legrand
(EUR)
66,898
6,507
Mitsubishi
Electric
(JPY)
403,400
6,812
Prysmian
(EUR)
140,449
8,988
Rockwell
Automation
29,167
8,336
Vertiv
Holdings,
Class
A
3,802
432
57,403
Ground
Transportation
0.8%
Central
Japan
Railway
(JPY)
140,900
2,644
CSX
145,491
4,695
Norfolk
Southern
41,781
9,806
Old
Dominion
Freight
Line
47,340
8,351
Saia (6)
1,964
895
Uber
Technologies (6)
27,310
1,647
Union
Pacific
30,884
7,043
35,081
Industrial
Conglomerates
0.7%
DCC
(GBP)
55,962
3,586
Honeywell
International
9,478
2,141
Roper
Technologies
8,982
4,669
Siemens
(EUR)
116,956
22,806
33,202
Machinery
1.1%
Caterpillar
2,413
875
Cummins
19,762
6,889
Deere
27,405
11,611
Dover
5,400
1,013
Esab
4,189
502
Shares/Par
$
Value
(Cost
and
value
in
$000s)
‡
Fortive
16,500
1,238
IDEX
3,564
746
Ingersoll
Rand
7,932
718
KION
Group
(EUR)
66,820
2,206
Parker-Hannifin
7,400
4,707
Sandvik
(SEK)
250,744
4,496
SMC
(JPY)
5,000
1,942
Stanley
Black
&
Decker
20,773
1,668
THK
(JPY)
101,700
2,346
Westinghouse
Air
Brake
Technologies
56,005
10,618
Xylem
1,000
116
51,691
Passenger
Airlines
0.0%
Delta
Air
Lines
4,645
281
United
Airlines
Holdings (6)
5,910
574
855
Professional
Services
0.3%
Booz
Allen
Hamilton
Holding
1,900
245
Equifax
2,810
716
Paylocity
Holding (6)
2,700
539
Recruit
Holdings
(JPY)
110,800
7,701
TechnoPro
Holdings
(JPY)
168,900
3,158
Teleperformance
(EUR)
19,787
1,697
Verisk
Analytics
2,705
745
14,801
Trading
Companies
&
Distributors
0.5%
Ashtead
Group
(GBP)
26,552
1,643
Bunzl
(GBP)
119,326
4,913
Fastenal
9,893
711
Ferguson
Enterprises
23,342
4,051
Mitsubishi
(JPY)
199,400
3,263
SiteOne
Landscape
Supply (6)
3,901
514
Sumitomo
(JPY)
273,100
5,910
WW
Grainger
400
422
21,427
Total
Industrials
&
Business
Services
299,004
INFORMATION
TECHNOLOGY
14.2%
Communications
Equipment
0.2%
Arista
Networks (6)
8,896
983
Cisco
Systems
38,682
2,290
Shares/Par
$
Value
(Cost
and
value
in
$000s)
‡
LM
Ericsson,
Class
B
(SEK)
711,130
5,759
9,032
Electronic
Equipment,
Instruments
&
Components
0.8%
Amphenol,
Class
A
62,027
4,308
Hamamatsu
Photonics
(JPY)
159,000
1,768
Keysight
Technologies (6)
85,106
13,671
Largan
Precision
(TWD)
19,000
1,547
Murata
Manufacturing
(JPY)
152,100
2,413
Omron
(JPY)
58,500
1,970
TE
Connectivity
63,386
9,062
Teledyne
Technologies (6)
2,696
1,251
Zebra
Technologies,
Class
A (6)
2,836
1,095
37,085
IT
Services
0.3%
Accenture,
Class
A
11,964
4,209
Gartner (6)
600
291
International
Business
Machines
6,564
1,443
MongoDB (6)
2,443
569
Nomura
Research
Institute
(JPY)
132,100
3,878
Shopify,
Class
A (6)
47,315
5,031
Snowflake,
Class
A (6)
686
106
15,527
Semiconductors
&
Semiconductor
Equipment
6.0%
Advanced
Micro
Devices (6)
42,137
5,090
Analog
Devices
29,667
6,303
ASML
Holding
(EUR)
20,439
14,316
ASML
Holding
7,303
5,061
BE
Semiconductor
Industries
(EUR)
19,105
2,619
Broadcom
211,655
49,070
First
Solar (6)
2,200
388
KLA
3,433
2,163
Lam
Research
2,579
186
Marvell
Technology
22,814
2,520
Micron
Technology
41,300
3,476
Monolithic
Power
Systems
4,245
2,512
NVIDIA
956,630
128,466
NXP
Semiconductors
29,962
6,228
QUALCOMM
22,230
3,415
Renesas
Electronics
(JPY)
208,400
2,637
Taiwan
Semiconductor
Manufacturing
(TWD)
681,969
22,164
Taiwan
Semiconductor
Manufacturing,
ADR
15,218
3,005
Texas
Instruments
55,068
10,326
Shares/Par
$
Value
(Cost
and
value
in
$000s)
‡
Tokyo
Electron
(JPY)
27,900
4,194
274,139
Software
4.2%
Adobe (6)
5,897
2,622
Atlassian,
Class
A (6)
1,555
378
Autodesk (6)
4,144
1,225
BILL
Holdings (6)
12,595
1,067
Cadence
Design
Systems (6)
7,337
2,204
Canva,
Acquisition
Date:
8/16/21
-
12/17/21,
Cost $668 (2)(6)
(7)
392
519
Confluent,
Class
A (6)
19,455
544
Crowdstrike
Holdings,
Class
A (6)
7,514
2,571
Datadog,
Class
A (6)
7,686
1,098
Descartes
Systems
Group (6)
1,587
180
Dynatrace (6)
9,366
509
Fair
Isaac (6)
461
918
Fortinet (6)
29,623
2,799
Gen
Digital
43,262
1,185
Gusto,
Acquisition
Date:
10/4/21,
Cost $216 (2)(6)(7)
7,517
140
HubSpot (6)
614
428
Intuit
10,506
6,603
Microsoft
287,214
121,061
Oracle
21,972
3,661
Palo
Alto
Networks (6)
3,920
713
Salesforce
18,798
6,285
SAP
(EUR)
58,146
14,302
ServiceNow (6)
16,420
17,407
Synopsys (6)
13,080
6,349
Zscaler (6)
1,800
325
195,093
Technology
Hardware,
Storage
&
Peripherals
2.7%
Apple
471,641
118,108
Pure
Storage,
Class
A (6)
6,600
406
Samsung
Electronics
(KRW)
145,185
5,181
Western
Digital (6)
12,465
743
124,438
Total
Information
Technology
655,314
MATERIALS
2.2%
Chemicals
1.2%
Air
Liquide
(EUR)
43,243
7,030
Akzo
Nobel
(EUR)
58,233
3,495
Asahi
Kasei
(JPY)
317,800
2,190
Shares/Par
$
Value
(Cost
and
value
in
$000s)
‡
BASF
(EUR)
75,673
3,318
CF
Industries
Holdings
9,023
770
Covestro
(EUR) (6)
62,745
3,770
Johnson
Matthey
(GBP)
142,464
2,390
Linde
30,934
12,951
Mosaic
125,966
3,096
PPG
Industries
25,522
3,049
RPM
International
1,312
161
Sherwin-Williams
34,634
11,773
Umicore
(EUR) (5)
115,352
1,191
55,184
Construction
Materials
0.1%
Martin
Marietta
Materials
5,801
2,996
Vulcan
Materials
3,238
833
3,829
Containers
&
Packaging
0.2%
Ball
11,942
659
International
Paper
167,546
9,017
Packaging
Corp.
of
America
3,562
802
10,478
Metals
&
Mining
0.6%
Antofagasta
(GBP)
246,877
4,891
BHP
Group
(AUD)
115,963
2,829
BHP
Group
(GBP) (5)
175,793
4,285
Franco-Nevada
38,986
4,584
Freeport-McMoRan
83,548
3,182
South32
(AUD)
824,353
1,729
Southern
Copper
16,855
1,536
Steel
Dynamics
6,833
780
Wheaton
Precious
Metals
28,119
1,581
25,397
Paper
&
Forest
Products
0.1%
Stora
Enso,
Class
R
(EUR)
252,930
2,546
West
Fraser
Timber (5)
8,299
718
3,264
Total
Materials
98,152
REAL
ESTATE
0.8%
Health
Care
Real
Estate
Investment
Trusts
0.0%
Welltower,
REIT
10,117
1,275
1,275
Shares/Par
$
Value
(Cost
and
value
in
$000s)
‡
Industrial
Real
Estate
Investment
Trusts
0.1%
Prologis,
REIT
14,515
1,534
Rexford
Industrial
Realty,
REIT
25,370
981
Segro
(GBP)
168,060
1,474
3,989
Office
Real
Estate
Investment
Trusts
0.0%
Great
Portland
Estates
(GBP)
253,703
915
915
Real
Estate
Management
&
Development
0.2%
CBRE
Group,
Class
A (6)
4,434
582
CoStar
Group (6)
3,959
284
Mitsui
Fudosan
(JPY)
773,000
6,182
7,048
Residential
Real
Estate
Investment
Trusts
0.1%
American
Homes
4
Rent,
Class
A,
REIT
8,019
300
AvalonBay
Communities,
REIT
2,008
442
Camden
Property
Trust,
REIT
1,158
134
Equity
LifeStyle
Properties,
REIT
23,853
1,589
Essex
Property
Trust,
REIT
2,193
626
Sun
Communities,
REIT
5,260
647
3,738
Retail
Real
Estate
Investment
Trusts
0.1%
Kimco
Realty,
REIT
17,421
408
Regency
Centers,
REIT
4,961
367
Scentre
Group
(AUD)
2,236,111
4,733
Simon
Property
Group,
REIT
2,738
472
5,980
Specialized
Real
Estate
Investment
Trusts
0.3%
American
Tower,
REIT
8,051
1,477
CubeSmart,
REIT
6,407
274
Equinix,
REIT
5,265
4,964
Public
Storage,
REIT
24,879
7,450
14,165
Total
Real
Estate
37,110
UTILITIES
1.6%
Electric
Utilities
0.9%
Constellation
Energy
29,372
6,571
Duke
Energy
1,012
109
Entergy
10,698
811
Evergy
6,900
425
Shares/Par
$
Value
(Cost
and
value
in
$000s)
‡
Exelon
239,315
9,008
FirstEnergy
7,819
311
NextEra
Energy
73,274
5,253
PG&E
110,370
2,227
Redeia
(EUR)
144,289
2,464
Southern
11,198
922
Xcel
Energy
170,962
11,543
39,644
Gas
Utilities
0.1%
Atmos
Energy
38,287
5,332
5,332
Independent
Power
&
Renewable
Electricity
Producers
0.1%
Electric
Power
Development
(JPY)
198,200
3,235
Vistra
4,287
591
3,826
Multi-Utilities
0.5%
Ameren
101,216
9,022
CMS
Energy
7,900
526
Engie
(EUR)
457,627
7,258
National
Grid
(GBP)
628,238
7,464
Sempra
900
79
24,349
Total
Utilities
73,151
Total
Common
Stocks
(Cost
$1,341,946)
2,818,151
CONVERTIBLE
PREFERRED
STOCKS
0.0%
INFORMATION
TECHNOLOGY
0.0%
Software
0.0%
Canva,
Series
A,
Acquisition
Date:
11/4/21
-
12/17/21,
Cost $43 (2)(6)(7)
25
33
Canva,
Series
A-3,
Acquisition
Date:
12/17/21,
Cost $3 (2)(6)(7)
2
2
Databricks,
Series
G,
Acquisition
Date:
2/1/21,
Cost $229 (2)
(6)(7)
3,879
359
Databricks,
Series
H,
Acquisition
Date:
8/31/21,
Cost $625 (2)
(6)(7)
8,505
787
Databricks,
Series
I,
Acquisition
Date:
9/14/23,
Cost $112 (2)
(6)(7)
1,526
141
Shares/Par
$
Value
(Cost
and
value
in
$000s)
‡
Gusto,
Series
E,
Acquisition
Date:
7/13/21,
Cost $317 (2)(6)(7)
10,431
194
Total
Information
Technology
1,516
Total
Convertible
Preferred
Stocks
(Cost
$1,329)
1,516
CORPORATE
BONDS
8.3%
AbbVie,
2.95%,
11/21/26
920,000
893
AbbVie,
3.20%,
5/14/26 (5)
420,000
413
AbbVie,
4.50%,
5/14/35
1,900,000
1,769
AbbVie,
4.70%,
5/14/45
915,000
802
AbbVie,
4.80%,
3/15/29
1,260,000
1,258
ABN
AMRO
Bank,
4.75%,
7/28/25 (1)
940,000
937
AerCap
Ireland
Capital,
2.45%,
10/29/26
935,000
894
AerCap
Ireland
Capital,
5.75%,
6/6/28 (5)
1,840,000
1,875
AerCap
Ireland
Capital,
6.15%,
9/30/30
225,000
235
AerCap
Ireland
Capital,
6.50%,
7/15/25
365,000
368
AHS
Hospital,
5.024%,
7/1/45
1,600,000
1,480
AIB
Group,
VR,
6.608%,
9/13/29 (1)(5)(8)
650,000
679
Alcon
Finance,
2.60%,
5/27/30 (1)
1,300,000
1,144
Alexandria
Real
Estate
Equities,
3.95%,
1/15/27 (5)
655,000
644
Allstate,
5.55%,
5/9/35
1,000,000
1,010
Ally
Financial,
2.20%,
11/2/28
700,000
625
Altria
Group,
2.35%,
5/6/25
415,000
411
Amazon.com,
3.875%,
8/22/37
1,645,000
1,451
Ameren,
5.70%,
12/1/26
1,820,000
1,851
America
Movil,
2.875%,
5/7/30 (5)
2,525,000
2,257
America
Movil,
6.375%,
3/1/35
300,000
317
American
Express,
VR,
6.489%,
10/30/31 (8)
2,785,000
2,973
American
Honda
Finance,
5.65%,
11/15/28 (5)
1,655,000
1,700
Amgen,
2.77%,
9/1/53
447,000
258
Amphenol,
5.05%,
4/5/29
895,000
896
Anheuser-Busch
InBev
Worldwide,
5.55%,
1/23/49
2,120,000
2,094
APA
Infrastructure,
4.25%,
7/15/27 (1)
620,000
615
Appalachian
Power,
4.45%,
6/1/45
2,450,000
1,992
Arthur
J
Gallagher,
4.85%,
12/15/29
360,000
358
AT&T,
2.25%,
2/1/32
1,400,000
1,155
AT&T,
3.50%,
6/1/41 (5)
680,000
521
Athene
Global
Funding,
4.86%,
8/27/26 (1)
2,935,000
2,931
Atlassian,
5.25%,
5/15/29
575,000
579
Atmos
Energy,
4.15%,
1/15/43
1,500,000
1,251
AutoZone,
3.125%,
4/21/26 (5)
650,000
637
AutoZone,
5.05%,
7/15/26
2,690,000
2,704
Avolon
Holdings
Funding,
5.75%,
3/1/29 (1)
3,175,000
3,213
Shares/Par
$
Value
(Cost
and
value
in
$000s)
‡
Banco
Santander,
3.49%,
5/28/30
200,000
182
Banco
Santander,
5.439%,
7/15/31
3,600,000
3,593
Banco
Santander
Chile,
2.70%,
1/10/25 (1)
1,322,000
1,321
Banco
Santander
Mexico
Institucion
de
Banca
Multiple
Grupo
Financiero
Santand,
5.375%,
4/17/25 (1)
1,110,000
1,110
Bank
of
America,
6.11%,
1/29/37
900,000
930
Bank
of
America,
6.75%,
6/1/28
700,000
740
Bank
of
America,
VR,
2.299%,
7/21/32 (8)
2,240,000
1,869
Bank
of
America,
VR,
2.676%,
6/19/41 (5)(8)
3,450,000
2,380
Bank
of
America,
Series N,
VR,
2.651%,
3/11/32 (8)
2,325,000
2,002
Bank
of
Montreal,
2.65%,
3/8/27 (5)
2,035,000
1,952
Bank
of
New
York
Mellon,
VR,
6.474%,
10/25/34 (8)
1,885,000
2,024
Banner
Health,
1.897%,
1/1/31
670,000
552
Barclays,
VR,
2.852%,
5/7/26 (8)
1,880,000
1,869
Barclays,
VR,
5.674%,
3/12/28 (8)
750,000
758
BAT
Capital,
4.39%,
8/15/37
1,385,000
1,197
BAT
Capital,
5.834%,
2/20/31
810,000
827
Bayer
U.S.
Finance,
6.375%,
11/21/30 (1)
1,540,000
1,586
Baylor
Scott
&
White
Holdings,
3.967%,
11/15/46
1,850,000
1,476
Becton
Dickinson
&
Company,
2.823%,
5/20/30
1,380,000
1,231
Becton
Dickinson
&
Company,
3.70%,
6/6/27
1,956,000
1,908
Berkshire
Hathaway
Energy,
5.15%,
11/15/43 (5)
1,350,000
1,290
BlackRock
Funding,
4.70%,
3/14/29 (5)
785,000
786
BNP
Paribas,
VR,
2.219%,
6/9/26 (1)(8)
1,315,000
1,296
BNP
Paribas,
VR,
2.871%,
4/19/32 (1)(8)
3,100,000
2,638
Boardwalk
Pipelines,
4.45%,
7/15/27
385,000
381
Booking
Holdings,
3.65%,
3/15/25
1,515,000
1,511
Boston
Properties,
3.65%,
2/1/26
1,165,000
1,147
BPCE,
4.50%,
3/15/25 (1)
1,000,000
998
Brighthouse
Financial
Global
Funding,
1.55%,
5/24/26 (1)(5)
1,110,000
1,059
Bristol-Myers
Squibb,
5.10%,
2/22/31
490,000
493
Brixmor
Operating
Partnership,
3.90%,
3/15/27
565,000
553
Brixmor
Operating
Partnership,
4.125%,
6/15/26
1,220,000
1,207
Broadcom,
5.05%,
7/12/29 (5)
3,600,000
3,607
Burlington
Northern
Santa
Fe,
4.375%,
9/1/42
1,400,000
1,208
Burlington
Northern
Santa
Fe,
6.15%,
5/1/37
650,000
695
Cadence
Design
Systems,
4.30%,
9/10/29
965,000
945
Cameron
LNG,
2.902%,
7/15/31 (1)
575,000
500
Cameron
LNG,
3.701%,
1/15/39 (1)
475,000
380
Canadian
National
Railway,
5.85%,
11/1/33
1,155,000
1,208
Canadian
Natural
Resources,
2.95%,
7/15/30
1,700,000
1,511
Canadian
Pacific
Railway,
1.75%,
12/2/26
930,000
880
Canadian
Pacific
Railway,
3.50%,
5/1/50
1,695,000
1,200
Shares/Par
$
Value
(Cost
and
value
in
$000s)
‡
Capital
One
Financial,
3.65%,
5/11/27
1,215,000
1,181
Capital
One
Financial,
VR,
6.051%,
2/1/35 (8)
365,000
371
Cardinal
Health,
3.41%,
6/15/27
1,570,000
1,520
Cardinal
Health,
3.75%,
9/15/25 (5)
1,005,000
998
Carvana,
12.00%,
12/1/28,
(9.00%
Cash
or
12.00%
PIK) (1)(9)
245,959
263
Carvana,
13.00%,
6/1/30,
(11.00%
Cash
or
13.00%
PIK) (1)(9)
433,180
475
Carvana,
14.00%,
6/1/31,
(14.00%
PIK) (1)(9)
516,762
618
Caterpillar
Financial
Services,
5.00%,
5/14/27
3,320,000
3,354
CBRE
Services,
5.50%,
4/1/29
555,000
564
Celulosa
Arauco
y
Constitucion,
4.20%,
1/29/30 (1)(5)
505,000
469
Charter
Communications
Operating,
3.70%,
4/1/51
1,425,000
891
Charter
Communications
Operating,
4.908%,
7/23/25
569,000
568
Citigroup,
VR,
2.976%,
11/5/30 (5)(8)
2,750,000
2,471
Citigroup,
VR,
4.075%,
4/23/29 (8)
2,000,000
1,941
CMS
Energy,
4.70%,
3/31/43
840,000
716
CMS
Energy,
4.875%,
3/1/44
1,200,000
1,072
CNO
Global
Funding,
2.65%,
1/6/29 (1)
3,255,000
2,943
Coca-Cola
Europacific
Partners,
1.50%,
1/15/27 (1)
2,400,000
2,238
Comcast,
4.15%,
10/15/28
2,455,000
2,395
CommonSpirit
Health,
2.782%,
10/1/30
755,000
665
Corebridge
Financial,
4.40%,
4/5/52 (5)
4,505,000
3,612
Cox
Communications,
2.95%,
10/1/50 (1)
2,775,000
1,608
CRH
America
Finance,
3.95%,
4/4/28 (1)
2,600,000
2,514
Crown
Castle,
2.25%,
1/15/31
1,440,000
1,212
Crown
Castle,
2.90%,
3/15/27
735,000
705
Crown
Castle
Towers,
3.663%,
5/15/25 (1)
485,000
482
Cummins,
4.90%,
2/20/29
320,000
322
CVS
Health,
1.875%,
2/28/31 (5)
1,745,000
1,414
Daimler
Trucks
Finance
North
America,
3.65%,
4/7/27 (1)(5)
2,155,000
2,097
Danske
Bank,
VR,
5.705%,
3/1/30 (1)(8)
395,000
401
Discover
Bank,
2.70%,
2/6/30
2,000,000
1,764
Discover
Financial
Services,
3.75%,
3/4/25
590,000
589
DTE
Energy,
5.10%,
3/1/29
2,570,000
2,572
Duke
Energy,
2.65%,
9/1/26 (5)
640,000
619
Duke
Energy,
3.75%,
9/1/46
500,000
369
Duke
Energy,
4.85%,
1/5/27
2,660,000
2,667
Elevance
Health,
4.65%,
1/15/43
915,000
786
Enbridge,
4.25%,
12/1/26
590,000
585
Enbridge,
5.625%,
4/5/34 (5)
770,000
772
Enbridge,
6.20%,
11/15/30
345,000
362
Enbridge
Energy
Partners,
5.50%,
9/15/40
245,000
235
Energy
Transfer,
3.75%,
5/15/30
765,000
712
Energy
Transfer,
5.25%,
4/15/29
1,225,000
1,230
Shares/Par
$
Value
(Cost
and
value
in
$000s)
‡
Eni,
5.50%,
5/15/34 (1)
735,000
728
Enterprise
Products
Operating,
4.60%,
1/11/27
2,830,000
2,827
Equitable
Financial
Life
Global
Funding,
1.40%,
7/7/25 (1)(5)
780,000
767
ERAC
USA
Finance,
4.50%,
2/15/45 (1)
505,000
430
Essex
Portfolio,
2.65%,
3/15/32
1,430,000
1,218
Exelon,
5.15%,
3/15/29
590,000
594
Fidelity
National
Financial,
4.50%,
8/15/28
2,065,000
2,030
Fifth
Third
Bancorp,
VR,
4.895%,
9/6/30 (8)
595,000
584
Fifth
Third
Bancorp,
VR,
6.339%,
7/27/29 (8)
460,000
478
FirstEnergy
Transmission,
5.00%,
1/15/35 (1)
270,000
260
Fiserv,
3.20%,
7/1/26
1,100,000
1,076
Fiserv,
5.45%,
3/15/34
2,035,000
2,040
Ford
Motor
Credit,
5.125%,
11/5/26
1,265,000
1,263
Ford
Motor
Credit,
7.122%,
11/7/33
640,000
668
Foundry
JV
Holdco,
6.15%,
1/25/32 (1)
705,000
709
GATX,
6.05%,
3/15/34
1,675,000
1,739
General
Motors,
4.00%,
4/1/25
1,120,000
1,117
General
Motors
Financial,
2.40%,
4/10/28
3,205,000
2,941
George
Washington
University,
Series 2014,
4.30%,
9/15/44
975,000
834
Georgia
Power,
5.004%,
2/23/27
685,000
690
Goldman
Sachs
Group,
6.75%,
10/1/37
700,000
752
Goldman
Sachs
Group,
VR,
2.615%,
4/22/32 (5)(8)
1,300,000
1,107
Goldman
Sachs
Group,
VR,
2.908%,
7/21/42 (8)
1,710,000
1,187
Goldman
Sachs
Group,
VR,
4.692%,
10/23/30 (8)
2,115,000
2,070
HCA,
4.125%,
6/15/29
1,895,000
1,803
HCA,
4.375%,
3/15/42
775,000
625
Health
Care
Service
A
Mutual
Legal
Reserve,
5.45%,
6/15/34 (1)
1,020,000
1,010
Healthcare
Realty
Holdings,
3.625%,
1/15/28
1,075,000
1,022
Healthpeak
OP,
2.125%,
12/1/28
655,000
587
Healthpeak
OP,
2.875%,
1/15/31
360,000
315
High
Street
Funding
Trust
I,
4.111%,
2/15/28 (1)
1,800,000
1,730
HSBC
Bank
USA,
5.875%,
11/1/34
950,000
959
HSBC
Holdings,
VR,
5.719%,
3/4/35 (5)(8)
1,145,000
1,151
HSBC
Holdings,
VR,
7.399%,
11/13/34 (8)
1,445,000
1,566
Humana,
2.15%,
2/3/32 (5)
1,145,000
912
Humana,
3.70%,
3/23/29
1,120,000
1,054
Humana,
5.95%,
3/15/34 (5)
830,000
831
Hyundai
Capital
America,
2.00%,
6/15/28 (1)(5)
2,435,000
2,188
Hyundai
Capital
America,
5.35%,
3/19/29 (1)
240,000
241
Hyundai
Capital
America,
6.50%,
1/16/29 (1)
420,000
438
Iberdrola
International,
6.75%,
9/15/33
1,000,000
1,067
Icon
Investments
Six,
5.849%,
5/8/29
290,000
295
Shares/Par
$
Value
(Cost
and
value
in
$000s)
‡
Illinois
Tool
Works,
3.90%,
9/1/42
1,200,000
975
Ingersoll
Rand,
5.176%,
6/15/29 (5)
3,515,000
3,547
Intercontinental
Exchange,
5.25%,
6/15/31
1,500,000
1,515
IQVIA,
6.25%,
2/1/29
730,000
752
Jackson
National
Life
Global
Funding,
1.75%,
1/12/25 (1)
3,430,000
3,426
JDE
Peet's,
1.375%,
1/15/27 (1)
2,240,000
2,076
John
Deere
Capital,
2.125%,
3/7/25
1,955,000
1,946
John
Deere
Capital,
4.40%,
9/8/31 (5)
2,230,000
2,160
John
Deere
Capital,
4.50%,
1/8/27 (5)
1,330,000
1,330
JPMorgan
Chase,
VR,
2.956%,
5/13/31 (8)
3,820,000
3,407
JPMorgan
Chase,
VR,
5.299%,
7/24/29 (8)
3,125,000
3,151
Kilroy
Realty,
4.375%,
10/1/25
480,000
477
Kroger,
5.00%,
9/15/34
630,000
609
L3Harris
Technologies,
3.832%,
4/27/25
570,000
568
Liberty
Mutual
Group,
4.85%,
8/1/44 (1)
1,700,000
1,474
Lloyds
Banking
Group,
VR,
5.462%,
1/5/28 (8)
1,015,000
1,024
MassMutual
Global
Funding
II,
5.10%,
4/9/27 (1)(5)
2,340,000
2,363
Mayo
Clinic,
Series 2013,
4.00%,
11/15/47
1,500,000
1,212
McDonald's,
1.45%,
9/1/25
940,000
920
MedStar
Health,
Series 20A,
3.626%,
8/15/49
905,000
646
Microchip
Technology,
5.05%,
3/15/29 (5)
805,000
804
Micron
Technology,
4.185%,
2/15/27
880,000
867
Mid-Atlantic
Interstate
Transmission,
4.10%,
5/15/28 (1)
2,640,000
2,563
Mississippi
Power,
3.95%,
3/30/28
1,435,000
1,398
Mitsubishi
UFJ
Financial
Group,
2.193%,
2/25/25
2,200,000
2,189
Mohawk
Industries,
5.85%,
9/18/28
1,385,000
1,414
Mondelez
International,
4.75%,
2/20/29 (5)
2,970,000
2,955
Moody's,
2.00%,
8/19/31 (5)
2,195,000
1,817
Morgan
Stanley,
4.30%,
1/27/45
1,150,000
945
Morgan
Stanley,
6.25%,
8/9/26 (5)
755,000
772
Morgan
Stanley,
VR,
3.217%,
4/22/42 (8)
1,445,000
1,065
Morgan
Stanley,
VR,
5.656%,
4/18/30 (5)(8)
3,540,000
3,592
Motorola
Solutions,
5.00%,
4/15/29
800,000
799
National
Bank
of
Canada,
5.60%,
12/18/28
2,560,000
2,599
New
York
State
Electric
&
Gas,
5.30%,
8/15/34 (1)
1,075,000
1,063
NextEra
Energy
Capital
Holdings,
2.44%,
1/15/32
1,895,000
1,579
NextEra
Energy
Capital
Holdings,
5.749%,
9/1/25
680,000
684
NiSource,
3.49%,
5/15/27
1,730,000
1,683
NiSource,
3.95%,
3/30/48
1,775,000
1,352
Nucor,
2.70%,
6/1/30
455,000
406
Nucor,
3.95%,
5/1/28
1,996,000
1,939
Nutrien,
4.00%,
12/15/26
830,000
812
Occidental
Petroleum,
5.375%,
1/1/32 (5)
1,285,000
1,257
Shares/Par
$
Value
(Cost
and
value
in
$000s)
‡
Omnicom
Group,
3.60%,
4/15/26
830,000
816
O'Reilly
Automotive,
3.60%,
9/1/27
1,825,000
1,771
O'Reilly
Automotive,
5.00%,
8/19/34
2,165,000
2,098
O'Reilly
Automotive,
5.75%,
11/20/26
390,000
397
Owens
Corning,
5.70%,
6/15/34
995,000
1,011
PACCAR
Financial,
5.00%,
5/13/27 (5)
2,885,000
2,916
Pacific
Gas
&
Electric,
2.10%,
8/1/27 (5)
1,340,000
1,249
Perrigo
Finance
Unlimited,
4.90%,
6/15/30
1,510,000
1,414
Pioneer
Natural
Resources,
1.125%,
1/15/26
755,000
728
PPL
Capital
Funding,
3.10%,
5/15/26
2,200,000
2,148
Principal
Financial
Group,
3.40%,
5/15/25
2,460,000
2,447
Public
Storage
Operating,
1.95%,
11/9/28
1,210,000
1,089
Realty
Income,
3.10%,
12/15/29
2,130,000
1,952
Realty
Income,
3.95%,
8/15/27
1,490,000
1,462
RELX
Capital,
3.00%,
5/22/30
945,000
855
Republic
Services,
3.375%,
11/15/27 (5)
1,045,000
1,010
Republic
Services,
5.00%,
12/15/33
2,235,000
2,190
RGA
Global
Funding,
5.448%,
5/24/29 (1)(5)
1,630,000
1,651
Rogers
Communications,
3.625%,
12/15/25
610,000
603
Rogers
Communications,
4.50%,
3/15/42
2,935,000
2,477
Roper
Technologies,
2.95%,
9/15/29
380,000
347
Roper
Technologies,
3.80%,
12/15/26 (5)
1,085,000
1,068
Ross
Stores,
1.875%,
4/15/31
450,000
371
Sabine
Pass
Liquefaction,
4.20%,
3/15/28
1,335,000
1,303
Sabine
Pass
Liquefaction,
4.50%,
5/15/30
560,000
542
Santander
Holdings
USA,
VR,
2.49%,
1/6/28 (8)
1,365,000
1,294
Santander
Holdings
USA,
VR,
6.342%,
5/31/35 (8)
725,000
732
Santander
U.K.
Group
Holdings,
VR,
2.469%,
1/11/28 (8)
1,605,000
1,519
SBA
Tower
Trust,
2.836%,
1/15/25 (1)
1,135,000
1,134
Sempra,
3.30%,
4/1/25
835,000
831
Simon
Property
Group,
2.65%,
2/1/32
1,810,000
1,542
Simon
Property
Group,
3.80%,
7/15/50
1,865,000
1,372
Skandinaviska
Enskilda
Banken,
5.125%,
3/5/27 (1)
2,800,000
2,824
Solventum,
5.40%,
3/1/29 (1)
1,660,000
1,666
South
Bow
USA
Infrastructure
Holdings,
5.026%,
10/1/29 (1)
420,000
412
Southern,
5.70%,
3/15/34
1,540,000
1,581
Southern
California
Edison,
5.15%,
6/1/29
2,775,000
2,797
Southern
Gas
Capital,
4.95%,
9/15/34
1,525,000
1,482
Spectra
Energy
Partners,
3.375%,
10/15/26
480,000
469
Standard
Chartered,
VR,
2.608%,
1/12/28 (1)(8)
1,000,000
952
Standard
Chartered,
VR,
5.688%,
5/14/28 (1)(8)
640,000
647
T-Mobile
USA,
5.75%,
1/15/34
1,860,000
1,911
Tampa
Electric,
6.15%,
5/15/37
1,000,000
1,035
Shares/Par
$
Value
(Cost
and
value
in
$000s)
‡
Targa
Resources,
5.50%,
2/15/35
745,000
735
Targa
Resources
Partners,
5.00%,
1/15/28
1,168,000
1,155
Teachers
Insurance
&
Annuity
Assn.
of
America,
4.90%,
9/15/44 (1)
1,800,000
1,608
Texas
Instruments,
1.375%,
3/12/25
650,000
646
Thomson
Reuters,
3.35%,
5/15/26
405,000
397
Time
Warner
Cable,
6.55%,
5/1/37
450,000
433
Time
Warner
Cable,
6.75%,
6/15/39
530,000
521
TJX,
1.60%,
5/15/31 (5)
375,000
307
Toronto-Dominion
Bank,
4.994%,
4/5/29 (5)
2,795,000
2,792
TotalEnergies
Capital
International,
2.986%,
6/29/41
2,630,000
1,891
Toyota
Motor
Credit,
4.80%,
1/5/26 (5)
2,935,000
2,943
Transcontinental
Gas
Pipe
Line,
4.60%,
3/15/48
1,645,000
1,375
Transurban
Finance,
2.45%,
3/16/31 (1)
1,445,000
1,220
Transurban
Finance,
3.375%,
3/22/27 (1)
395,000
381
Transurban
Finance,
4.125%,
2/2/26 (1)
335,000
332
Travelers,
6.25%,
6/15/37
750,000
804
Trinity
Health,
4.125%,
12/1/45
725,000
594
Uber
Technologies,
4.30%,
1/15/30
2,395,000
2,319
United
Airlines
PTT,
Series 2019-1,
Class
AA,
4.15%,
8/25/31
861,096
817
UnitedHealth
Group,
3.75%,
7/15/25
645,000
642
UnitedHealth
Group,
4.70%,
4/15/29
3,125,000
3,098
Verizon
Communications,
2.10%,
3/22/28
460,000
422
Verizon
Communications,
2.65%,
11/20/40
2,470,000
1,684
Verizon
Communications,
4.00%,
3/22/50
2,000,000
1,521
VMware,
1.40%,
8/15/26
3,125,000
2,960
Vodafone
Group,
4.25%,
9/17/50
775,000
602
Vodafone
Group,
4.875%,
6/19/49
2,045,000
1,760
Volkswagen
Group
of
America
Finance,
3.35%,
5/13/25 (1)
1,395,000
1,387
Volkswagen
Group
of
America
Finance,
6.45%,
11/16/30 (1)
2,015,000
2,084
Vulcan
Materials,
4.50%,
6/15/47
590,000
492
Walt
Disney,
3.70%,
10/15/25
525,000
521
Waste
Connections,
3.20%,
6/1/32
2,315,000
2,024
Wells
Fargo,
VR,
2.393%,
6/2/28 (8)
3,915,000
3,672
Wells
Fargo,
VR,
3.068%,
4/30/41 (8)
3,995,000
2,887
Wells
Fargo,
VR,
6.303%,
10/23/29 (8)
905,000
941
Westpac
New
Zealand,
5.195%,
2/28/29 (1)
1,855,000
1,862
Williams,
5.10%,
9/15/45
1,735,000
1,567
Williams,
5.15%,
3/15/34
245,000
239
Willis
North
America,
4.50%,
9/15/28 (5)
1,370,000
1,346
Woodside
Finance,
3.70%,
9/15/26 (1)
738,000
722
Woodside
Finance,
3.70%,
3/15/28 (1)
1,187,000
1,133
Workday,
3.70%,
4/1/29
750,000
714
Shares/Par
$
Value
(Cost
and
value
in
$000s)
‡
WP
Carey,
3.85%,
7/15/29 (5)
1,470,000
1,396
Total
Corporate
Bonds
(Cost
$408,543)
382,628
EQUITY
MUTUAL
FUNDS
4.2%
T.
Rowe
Price
Real
Assets
Fund
-
I
Class (4)
13,885,627
192,455
Total
Equity
Mutual
Funds
(Cost
$173,302)
192,455
FOREIGN
GOVERNMENT
OBLIGATIONS
&
MUNICIPALITIES
0.4%
Autoridad
del
Canal
de
Panama,
4.95%,
7/29/35 (1)
510,000
480
Corp
Nacional
del
Cobre
de
Chile,
3.00%,
9/30/29 (1)
2,645,000
2,353
Province
of
Alberta
Canada,
4.50%,
1/24/34 (5)
2,760,000
2,673
Province
of
British
Columbia,
4.20%,
7/6/33
2,648,000
2,520
Province
of
Manitoba
Canada,
4.30%,
7/27/33
2,595,000
2,486
Republic
of
Panama,
3.298%,
1/19/33
2,100,000
1,585
Republic
of
Peru,
5.375%,
2/8/35
660,000
636
Republic
of
Poland,
3.25%,
4/6/26
1,030,000
1,013
United
Mexican
States,
2.659%,
5/24/31
3,439,000
2,799
United
Mexican
States,
3.50%,
2/12/34
2,315,000
1,847
Total
Foreign
Government
Obligations
&
Municipalities
(Cost
$20,600)
18,392
MUNICIPAL
SECURITIES
0.7%
California
0.2%
Bay
Area
Toll
Auth.,
Series S-10,
3.176%,
4/1/41
2,900,000
2,224
California,
Build
America,
GO,
7.625%,
3/1/40
2,200,000
2,592
Inland
Valley
Dev.
Agency,
Tax
Allocation,
Series B,
5.50%,
3/1/33 (10)
695,000
697
Los
Angeles
Airport,
Series C,
Build
America,
7.053%,
5/15/40
1,000,000
1,123
Univ.
of
California
Regents,
Series J,
4.131%,
5/15/45
365,000
320
6,956
Georgia
0.1%
Fulton
County,
Build
America,
GO,
5.148%,
7/1/39
2,665,000
2,608
2,608
Illinois
0.0%
Chicago
O'Hare
Int'l
Airport,
Series B,
Build
America,
6.395%,
1/1/40
755,000
794
Chicago
O'Hare
Int'l
Airport,
Senior
Lien,
Series D,
2.346%,
1/1/30
975,000
872
Illinois
Toll
Highway
Auth.,
Series A,
Build
America,
6.184%,
1/1/34
470,000
489
Shares/Par
$
Value
(Cost
and
value
in
$000s)
‡
Metropolitan
Water
Reclamation
Dist.
of
Greater
Chicago,
Build
America,
GO,
5.72%,
12/1/38
500,000
502
2,657
Maryland
0.0%
Maryland
HHEFA,
Univ.
of
Maryland
Medical
System,
Series B,
4.665%,
7/1/36
1,800,000
1,713
1,713
Michigan
0.1%
Detroit
City
School
Dist.,
Qualified
School
Construction
Bonds,
GO,
6.645%,
5/1/29
2,000,000
2,132
2,132
New
Jersey
0.0%
New
Jersey
Turnpike
Auth.,
Series F,
Build
America,
7.414%,
1/1/40
415,000
475
475
New
York
0.0%
Metropolitan
Transportation
Auth.,
Build
America,
7.336%,
11/15/39
210,000
245
New
York
City
Transitional
Fin.
Auth.
Future
Tax
Secured
Revenue,
Build
America,
5.508%,
8/1/37
950,000
937
New
York
City
Water
&
Sewer
System,
Build
America,
6.011%,
6/15/42
245,000
248
New
York
State
Dormitory
Auth.,
Series F,
Build
America,
5.628%,
3/15/39
1,300,000
1,301
Port
Auth.
of
New
York
&
New
Jersey,
3.139%,
2/15/51
800,000
565
Port
Auth.
of
New
York
&
New
Jersey,
Series 182,
5.31%,
8/1/46
1,400,000
1,337
4,633
Ohio
0.0%
JobsOhio
Beverage
System,
Liquid
Profits,
Series B,
3.985%,
1/1/29
845,000
836
836
Pennsylvania
0.0%
Philadelphia
Auth.
for
IDA,
3.964%,
4/15/26
405,000
402
402
South
Carolina
0.1%
South
Carolina
Public
Service
Auth.,
Series C,
5.784%,
12/1/41
2,000,000
2,011
2,011
Texas
0.0%
Central
Texas
Turnpike
System,
Series C,
3.029%,
8/15/41
1,820,000
1,344
Dallas/Fort
Worth
Int'l
Airport,
Series A,
2.994%,
11/1/38
1,155,000
948
Tarrant
County
Cultural
Ed.
Fac.
Fin.,
Series A,
4.366%,
11/15/47
1,200,000
1,008
Shares/Par
$
Value
(Cost
and
value
in
$000s)
‡
Texas
Private
Activity
Bond
Surface
Transportation,
North
Tarrant
Express,
Series B,
3.922%,
12/31/49
1,900,000
1,503
4,803
Virginia
0.1%
Univ.
of
Virginia,
Series B,
2.584%,
11/1/51
3,675,000
2,238
Virginia
Public
Building
Auth.,
Series B-2,
Build
America,
5.90%,
8/1/30
695,000
707
2,945
Wisconsin
0.1%
PFA,
Bayhealth
Medical
Center,
Series B,
3.405%,
7/1/51
2,910,000
2,001
2,001
Total
Municipal
Securities
(Cost
$38,832)
34,172
NON-U.S.
GOVERNMENT
MORTGAGE-BACKED
SECURITIES
1.3%
Angel
Oak
Mortgage
Trust,
Series 2020-6,
Class
A2,
CMO,
ARM,
1.518%,
5/25/65 (1)
224,523
202
Angel
Oak
Mortgage
Trust,
Series 2021-1,
Class
A1,
CMO,
ARM,
0.909%,
1/25/66 (1)
786,109
654
Angel
Oak
Mortgage
Trust,
Series 2021-2,
Class
A1,
CMO,
ARM,
0.985%,
4/25/66 (1)
775,298
659
Angel
Oak
Mortgage
Trust,
Series 2023-3,
Class
A1,
CMO,
STEP,
4.80%,
9/26/67 (1)
1,742,929
1,713
BANK5,
Series 2024-5YR12,
Class
A3,
ARM,
5.902%,
12/15/57
705,000
726
BANK5,
Series 2024-5YR8,
Class
A3,
5.884%,
8/15/57
1,155,000
1,187
Barclays
Mortgage
Loan
Trust,
Series 2021-NQM1,
Class
A3,
CMO,
ARM,
2.189%,
9/25/51 (1)
796,958
710
Bayview
Financing
Trust,
Series 2024-2F,
Class
A,
CMO,
ARM,
8.10%,
9/25/29,
Acquisition
Date:
8/29/24,
Cost $1,682 (2)(7)
1,681,586
1,682
BBCMS
Mortgage
Trust,
Series 2019-BWAY,
Class
D,
ARM,
1M
TSFR
+
2.274%,
6.671%,
11/15/34 (1)
605,000
9
BBCMS
Mortgage
Trust,
Series 2024-5C27,
Class
A3,
6.014%,
7/15/57
285,000
294
BIG
Commercial
Mortgage
Trust,
Series 2022-BIG,
Class
A,
ARM,
1M
TSFR
+
1.342%,
5.739%,
2/15/39 (1)
3,098,681
3,092
BMO
Mortgage
Trust,
Series 2024-5C4,
Class
A3,
ARM,
6.526%,
5/15/57
455,000
478
BMO
Mortgage
Trust,
Series 2024-5C5,
Class
A3,
5.857%,
2/15/57
3,135,000
3,211
BMO
Mortgage
Trust,
Series 2024-C9,
Class
A5,
5.759%,
7/15/57
3,295,000
3,408
Citigroup
Mortgage
Loan
Trust,
Series 2020-EXP2,
Class
A3,
CMO,
ARM,
2.50%,
8/25/50 (1)
788,999
664
Shares/Par
$
Value
(Cost
and
value
in
$000s)
‡
Commercial
Mortgage
Trust,
Series 2015-LC21,
Class
A4,
3.708%,
7/10/48
3,700,000
3,679
Connecticut
Avenue
Securities
Trust,
Series 2024-R04,
Class
1A1,
CMO,
ARM,
SOFR30A
+
1.00%,
5.569%,
5/25/44 (1)
631,961
632
Cross
Mortgage
Trust,
Series 2024-H4,
Class
A1,
CMO,
STEP,
6.147%,
7/25/69 (1)
349,220
351
Ellington
Financial
Mortgage
Trust,
Series 2019-2,
Class
A3,
CMO,
ARM,
3.046%,
11/25/59 (1)
119,763
115
Ellington
Financial
Mortgage
Trust,
Series 2020-2,
Class
A1,
CMO,
ARM,
1.178%,
10/25/65 (1)
545,231
508
Ellington
Financial
Mortgage
Trust,
Series 2021-2,
Class
A1,
CMO,
ARM,
0.931%,
6/25/66 (1)
488,951
399
Extended
Stay
America
Trust,
Series 2021-ESH,
Class
B,
ARM,
1M
TSFR
+
1.494%,
5.891%,
7/15/38 (1)
1,078,969
1,080
Flagstar
Mortgage
Trust,
Series 2021-5INV,
Class
A2,
CMO,
ARM,
2.50%,
7/25/51 (1)
2,191,177
1,747
Galton
Funding
Mortgage
Trust,
Series 2018-1,
Class
A23,
CMO,
ARM,
3.50%,
11/25/57 (1)
73,772
65
GS
Mortgage
Securities
Trust,
Series 2015-GC32,
Class
A4,
3.764%,
7/10/48
950,000
944
GS
Mortgage
Securities
Trust,
Series 2018-GS9,
Class
A4,
ARM,
3.992%,
3/10/51
1,250,000
1,206
GS
Mortgage-Backed
Securities
Trust,
Series 2020-INV1,
Class
A14,
CMO,
ARM,
2.912%,
10/25/50 (1)
259,518
217
JPMorgan
Barclays
Bank
Commercial
Mortgage
Securities
Trust,
Series 2015-C31,
Class
A3,
3.801%,
8/15/48
1,986,290
1,968
JPMorgan
Chase
Commercial
Mortgage
Securities
Trust,
Series 2020-609M,
Class
A,
ARM,
1M
TSFR
+
1.734%,
6.132%,
10/15/33 (1)
2,510,000
2,485
JPMorgan
Chase
Commercial
Mortgage
Securities
Trust,
Series 2022-OPO,
Class
B,
3.377%,
1/5/39 (1)
760,000
680
JPMorgan
Mortgage
Trust,
Series 2019-INV3,
Class
A15,
CMO,
ARM,
3.50%,
5/25/50 (1)
469,306
414
JPMorgan
Mortgage
Trust,
Series 2019-INV3,
Class
A3,
CMO,
ARM,
3.50%,
5/25/50 (1)
543,689
479
MHC
Commercial
Mortgage
Trust,
Series 2021-MHC,
Class
B,
ARM,
1M
TSFR
+
1.215%,
5.612%,
4/15/38 (1)
2,876,000
2,871
Morgan
Stanley
Bank
of
America
Merrill
Lynch
Trust,
Series 2015-C24,
Class
AS,
ARM,
4.036%,
5/15/48
1,375,000
1,330
Morgan
Stanley
Bank
of
America
Merrill
Lynch
Trust,
Series 2015-C27,
Class
AS,
4.068%,
12/15/47
2,775,000
2,707
Morgan
Stanley
Capital
I
Trust,
Series 2014-150E,
Class
A,
3.912%,
9/9/32 (1)
2,140,000
1,878
Morgan
Stanley
Residential
Mortgage
Loan
Trust,
Series 2021-
2,
Class
A9,
CMO,
ARM,
2.50%,
5/25/51 (1)
446,221
355
Shares/Par
$
Value
(Cost
and
value
in
$000s)
‡
New
Residential
Mortgage
Loan
Trust,
Series 2022-INV1,
Class
A4,
CMO,
ARM,
3.00%,
3/25/52 (1)
1,625,703
1,345
OBX
Trust,
Series 2019-EXP3,
Class
1A9,
CMO,
ARM,
3.50%,
10/25/59 (1)
125,777
111
OBX
Trust,
Series 2019-EXP3,
Class
2A2,
CMO,
ARM,
1M
TSFR
+
1.214%,
5.553%,
10/25/59 (1)
41,822
42
Provident
Funding
Mortgage
Trust,
Series 2019-1,
Class
B1,
CMO,
ARM,
3.18%,
12/25/49 (1)
1,221,000
1,024
PSMC
Trust,
Series 2021-2,
Class
A3,
CMO,
ARM,
2.50%,
5/25/51 (1)
1,741,396
1,540
SDR
Commercial
Mortgage
Trust,
Series 2024-DSNY,
Class
A,
ARM,
1M
TSFR
+
1.392%,
5.789%,
5/15/39 (1)
1,060,000
1,060
Sequoia
Mortgage
Trust,
Series 2018-CH2,
Class
A3,
CMO,
ARM,
4.00%,
6/25/48 (1)
145,186
133
SG
Residential
Mortgage
Trust,
Series 2019-3,
Class
A1,
CMO,
ARM,
2.703%,
9/25/59 (1)
4,927
5
Starwood
Mortgage
Residential
Trust,
Series 2019-INV1,
Class
A3,
CMO,
ARM,
2.916%,
9/27/49 (1)
336,829
333
Starwood
Mortgage
Residential
Trust,
Series 2020-INV1,
Class
A1,
CMO,
ARM,
1.027%,
11/25/55 (1)
221,798
210
Structured
Agency
Credit
Risk
Debt
Notes,
Series 2021-
DNA7,
Class
M1,
CMO,
ARM,
SOFR30A
+
0.85%,
5.419%,
11/25/41 (1)
781,475
780
Structured
Agency
Credit
Risk
Debt
Notes,
Series 2024-DNA2,
Class
A1,
CMO,
ARM,
SOFR30A
+
1.25%,
5.819%,
5/25/44 (1)
918,869
922
Towd
Point
Mortgage
Trust,
Series 2018-1,
Class
A1,
CMO,
ARM,
3.00%,
1/25/58 (1)
72,600
71
Towd
Point
Mortgage
Trust,
Series 2024-1,
Class
A1,
CMO,
ARM,
4.707%,
3/25/64 (1)
2,160,370
2,157
Towd
Point
Mortgage
Trust,
Series 2024-3,
Class
A1B,
CMO,
ARM,
5.153%,
7/25/65 (1)
91,522
89
TX
Trust,
Series 2024-HOU,
Class
A,
ARM,
1M
TSFR
+
1.591%,
5.988%,
6/15/39 (1)
170,000
170
Verus
Securitization
Trust,
Series 2019-INV3,
Class
A1,
CMO,
ARM,
3.692%,
11/25/59 (1)
299,278
295
Verus
Securitization
Trust,
Series 2021-1,
Class
A1,
CMO,
ARM,
0.815%,
1/25/66 (1)
359,646
316
Verus
Securitization
Trust,
Series 2023-INV1,
Class
A1,
CMO,
STEP,
5.999%,
2/25/68 (1)
928,683
931
Verus
Securitization
Trust,
Series 2024-INV1,
Class
A2,
CMO,
STEP,
6.318%,
3/25/69 (1)
1,398,306
1,407
Total
Non-U.S.
Government
Mortgage-Backed
Securities
(Cost
$61,217)
57,740
Shares/Par
$
Value
(Cost
and
value
in
$000s)
‡
PREFERRED
STOCKS
0.1%
CONSUMER
DISCRETIONARY
0.1%
Automobiles
0.1%
Dr.
Ing.
h.c.
F.
Porsche
(EUR) (5)
49,990
3,029
Total
Consumer
Discretionary
3,029
Total
Preferred
Stocks
(Cost
$4,241)
3,029
U.S.
GOVERNMENT
&
AGENCY
MORTGAGE-BACKED
SECURITIES
8.1%
U.S.
Government
Agency
Obligations
6.4%
Federal
Home
Loan
Mortgage
2.50%,
5/1/30
491,109
469
3.00%,
1/1/29
-
8/1/43
2,729,950
2,422
3.50%,
3/1/42
-
3/1/46
4,479,861
4,072
4.00%,
9/1/40
-
6/1/42
1,373,175
1,296
4.50%,
6/1/39
-
5/1/42
803,254
780
5.00%,
12/1/35
-
8/1/40
357,344
354
5.50%,
1/1/38
-
12/1/39
116,722
118
6.00%,
2/1/28
-
8/1/38
11,902
12
6.50%,
8/1/32
5,035
5
7.00%,
6/1/32
10,342
10
Federal
Home
Loan
Mortgage,
ARM
1Y
CMT
+
2.25%,
7.079%,
10/1/36
2,885
3
RFUCCT1Y
+
1.726%,
7.597%,
7/1/35
11,341
12
RFUCCT1Y
+
1.75%,
6.125%,
2/1/35
11,856
12
RFUCCT1Y
+
1.916%,
6.291%,
2/1/37
12,042
12
RFUCCT1Y
+
1.944%,
6.579%,
12/1/36
30,241
31
RFUCCT1Y
+
2.031%,
6.796%,
11/1/36
19,376
20
Federal
Home
Loan
Mortgage,
UMBS
1.50%,
2/1/36
712,058
615
2.00%,
8/1/36
-
5/1/52
20,588,908
16,365
2.50%,
3/1/42
-
5/1/52
28,829,231
23,716
3.00%,
11/1/34
-
1/1/52
3,034,416
2,624
3.50%,
6/1/33
204,239
198
4.00%,
12/1/49
-
2/1/50
1,551,986
1,436
4.50%,
9/1/37
-
11/1/52
2,843,982
2,681
5.00%,
10/1/51
-
7/1/54
3,661,630
3,543
5.50%,
8/1/53
-
10/1/54
7,006,501
6,946
6.00%,
8/1/54
3,638,036
3,656
6.50%,
10/1/53
-
9/1/54
3,788,547
3,886
7.00%,
6/1/54
394,564
411
Shares/Par
$
Value
(Cost
and
value
in
$000s)
‡
Federal
Home
Loan
Mortgage
Multifamily
Structured
PTC
2.206%,
6/25/25
78,276
78
2.952%,
2/25/27
465,778
458
4.40%,
10/25/30
6,100,000
5,981
Federal
Home
Loan
Mortgage
Multifamily
Structured
PTC,
ARM
2.347%,
11/25/31
10,510,000
8,966
3.71%,
9/25/32
4,580,000
4,228
4.43%,
2/25/33
3,645,000
3,531
Federal
National
Mortgage
Assn.
3.50%,
6/1/42
-
1/1/44
1,884,094
1,708
4.00%,
11/1/40
530,284
504
4.50%,
7/1/40
378,674
364
Federal
National
Mortgage
Assn.,
ARM
RFUCCT1Y
+
1.539%,
6.835%,
7/1/35
7,302
7
RFUCCT1Y
+
1.855%,
6.105%,
1/1/37
2,622
3
Federal
National
Mortgage
Assn.,
UMBS
1.50%,
4/1/37
-
1/1/42
6,819,348
5,707
2.00%,
5/1/36
-
5/1/52
68,082,122
54,582
2.50%,
10/1/31
-
5/1/52
31,568,743
26,395
3.00%,
1/1/27
-
3/1/52
25,421,747
22,440
3.50%,
11/1/26
-
1/1/52
15,472,565
14,027
4.00%,
11/1/40
-
9/1/52
11,717,058
10,892
4.50%,
4/1/37
-
7/1/53
9,875,963
9,402
5.00%,
2/1/34
-
7/1/53
5,022,930
4,889
5.50%,
2/1/35
-
7/1/54
10,115,556
10,041
6.00%,
3/1/28
-
8/1/54
14,331,108
14,502
6.50%,
1/1/28
-
1/1/55
8,113,596
8,313
7.00%,
9/1/25
-
3/1/54
408,881
426
7.50%,
9/1/26
38
—
8.00%,
7/1/26
44
—
UMBS,
TBA,
5.00%,
1/1/55 (11)
9,430,000
9,101
292,250
U.S.
Government
Obligations
1.7%
Government
National
Mortgage
Assn.
1.50%,
12/20/36
-
5/20/37
742,619
642
2.00%,
1/20/51
-
3/20/52
17,278,907
13,836
2.50%,
8/20/50
-
1/20/52
17,731,093
14,820
3.00%,
9/15/42
-
6/20/52
13,471,954
11,738
3.50%,
9/15/41
-
1/20/49
8,467,401
7,688
4.00%,
2/15/41
-
10/20/52
8,267,935
7,683
4.50%,
6/15/39
-
4/20/53
5,747,671
5,488
5.00%,
12/20/34
-
8/20/52
4,977,688
4,904
5.50%,
2/20/34
-
9/20/54
2,436,227
2,440
Shares/Par
$
Value
(Cost
and
value
in
$000s)
‡
6.00%,
8/20/34
-
11/20/52
1,684,839
1,708
6.50%,
3/15/26
89
—
7.50%,
9/15/25
-
9/15/26
624
—
8.00%,
8/15/25
-
11/15/25
975
1
8.50%,
6/20/26
367
—
Government
National
Mortgage
Assn.,
CMO
3.00%,
11/20/47
-
12/20/47
127,583
115
3.50%,
10/20/50
1,010,000
812
Government
National
Mortgage
Assn.,
TBA (11)
2.50%,
1/20/55
1,305,000
1,090
5.00%,
1/20/55
650,000
631
5.50%,
1/20/55
6,260,000
6,208
6.00%,
1/20/55
845,000
851
80,655
Total
U.S.
Government
&
Agency
Mortgage-Backed
Securities
(Cost
$403,417)
372,905
U.S.
GOVERNMENT
AGENCY
OBLIGATIONS
(EXCLUDING
MORTGAGE-BACKED)
7.9%
U.S.
Treasury
Obligations
7.9%
U.S.
Treasury
Bonds,
1.125%,
5/15/40
1,715,000
1,032
U.S.
Treasury
Bonds,
1.375%,
8/15/50
2,415,000
1,178
U.S.
Treasury
Bonds,
1.75%,
8/15/41
4,815,000
3,116
U.S.
Treasury
Bonds,
1.875%,
2/15/51
8,550,000
4,759
U.S.
Treasury
Bonds,
2.00%,
2/15/50
28,385,000
16,490
U.S.
Treasury
Bonds,
2.00%,
8/15/51
6,795,000
3,884
U.S.
Treasury
Bonds,
2.25%,
2/15/52
4,225,000
2,563
U.S.
Treasury
Bonds,
2.375%,
5/15/51
3,665,000
2,307
U.S.
Treasury
Bonds,
2.50%,
2/15/46
2,975,000
2,033
U.S.
Treasury
Bonds,
2.75%,
8/15/47
16,080,000
11,311
U.S.
Treasury
Bonds,
2.875%,
8/15/45 (12)
4,185,000
3,086
U.S.
Treasury
Bonds,
3.00%,
11/15/44
3,200,000
2,429
U.S.
Treasury
Bonds,
3.00%,
5/15/45
10,640,000
8,040
U.S.
Treasury
Bonds,
3.00%,
11/15/45
11,185,000
8,410
U.S.
Treasury
Bonds,
3.00%,
2/15/47
1,150,000
852
U.S.
Treasury
Bonds,
3.00%,
2/15/48
2,000,000
1,467
U.S.
Treasury
Bonds,
3.00%,
8/15/48
3,905,000
2,853
U.S.
Treasury
Bonds,
3.00%,
8/15/52
1,565,000
1,124
U.S.
Treasury
Bonds,
3.625%,
2/15/53
1,320,000
1,073
U.S.
Treasury
Bonds,
3.625%,
5/15/53
15,630,000
12,721
U.S.
Treasury
Bonds,
3.875%,
2/15/43
1,500,000
1,324
U.S.
Treasury
Bonds,
4.00%,
11/15/52
3,985,000
3,474
U.S.
Treasury
Bonds,
4.25%,
2/15/54
4,025,000
3,676
Shares/Par
$
Value
(Cost
and
value
in
$000s)
‡
U.S.
Treasury
Bonds,
4.25%,
8/15/54
5,635,000
5,154
U.S.
Treasury
Bonds,
4.75%,
11/15/53
9,170,000
9,080
U.S.
Treasury
Notes,
0.625%,
5/15/30 (12)
16,700,000
13,707
U.S.
Treasury
Notes,
0.75%,
3/31/26
3,200,000
3,065
U.S.
Treasury
Notes,
0.75%,
1/31/28
1,185,000
1,065
U.S.
Treasury
Notes,
0.875%,
6/30/26
16,410,000
15,615
U.S.
Treasury
Notes,
0.875%,
11/15/30
5,770,000
4,722
U.S.
Treasury
Notes,
1.125%,
2/15/31
7,555,000
6,235
U.S.
Treasury
Notes,
1.875%,
2/28/27
24,230,000
23,053
U.S.
Treasury
Notes,
1.875%,
2/15/32
7,175,000
6,038
U.S.
Treasury
Notes,
2.25%,
8/15/27
27,540,000
26,176
U.S.
Treasury
Notes,
2.75%,
8/15/32
16,360,000
14,517
U.S.
Treasury
Notes,
2.875%,
5/15/32
2,930,000
2,633
U.S.
Treasury
Notes,
3.625%,
5/31/28
29,365,000
28,723
U.S.
Treasury
Notes,
3.625%,
8/31/29
12,095,000
11,717
U.S.
Treasury
Notes,
3.875%,
8/15/34
9,970,000
9,434
U.S.
Treasury
Notes,
4.00%,
2/29/28
4,225,000
4,188
U.S.
Treasury
Notes,
4.00%,
6/30/28
8,590,000
8,503
U.S.
Treasury
Notes,
4.00%,
2/15/34 (5)
14,380,000
13,776
U.S.
Treasury
Notes,
4.125%,
9/30/27
8,000,000
7,970
U.S.
Treasury
Notes,
4.125%,
10/31/27
19,030,000
18,959
U.S.
Treasury
Notes,
4.125%,
11/30/29
6,605,000
6,533
U.S.
Treasury
Notes,
4.25%,
2/28/29
8,065,000
8,030
U.S.
Treasury
Notes,
4.25%,
6/30/29
4,835,000
4,810
U.S.
Treasury
Notes,
4.50%,
5/31/29
2,200,000
2,211
U.S.
Treasury
Notes,
4.50%,
11/15/33
6,450,000
6,424
361,540
Total
U.S.
Government
Agency
Obligations
(Excluding
Mortgage-Backed)
(Cost
$413,350)
361,540
SHORT-TERM
INVESTMENTS
1.3%
Money
Market
Funds
1.3%
T.
Rowe
Price
Treasury
Reserve
Fund,
4.52% (4)(13)
60,755,770
60,756
Total
Short-Term
Investments
(Cost
$60,756)
60,756
Shares/Par
$
Value
(Cost
and
value
in
$000s)
‡
SECURITIES
LENDING
COLLATERAL
1.0%
INVESTMENTS
IN
A
POOLED
ACCOUNT
THROUGH
SECURITIES
LENDING
PROGRAM
WITH
JPMORGAN
CHASE
BANK 0.3%
Money
Market
Funds 0.3%
T.
Rowe
Price
Government
Reserve
Fund,
4.53% (4)(13)
14,818,833
14,819
Total
Investments
in
a
Pooled
Account
through
Securities
Lending
Program
with
JPMorgan
Chase
Bank
14,819
INVESTMENTS
IN
A
POOLED
ACCOUNT
THROUGH
SECURITIES
LENDING
PROGRAM
WITH
STATE
STREET
BANK
AND
TRUST
COMPANY 0.7%
Money
Market
Funds 0.7%
T.
Rowe
Price
Government
Reserve
Fund,
4.53% (4)(13)
32,864,177
32,864
Total
Investments
in
a
Pooled
Account
through
Securities
Lending
Program
with
State
Street
Bank
and
Trust
Company
32,864
Total
Securities
Lending
Collateral
(Cost
$47,683)
47,683
Total
Investments
in
Securities
101.3%
of
Net
Assets
(Cost
$3,300,856)
$
4,659,475
‡
Shares/Par
and
Notional
Amount
are
denominated
in
U.S.
dollars
unless
otherwise
noted.
(1)
Security
was
purchased
pursuant
to
Rule
144A
under
the
Securities
Act
of
1933
and
may
be
resold
in
transactions
exempt
from
registration
only
to
qualified
institutional
buyers.
Total
value
of
such
securities
at
period-end
amounts
to
$164,769
and
represents
3.6%
of
net
assets.
(2)
Security
cannot
be
offered
for
public
resale
without
first
being
registered
under
the
Securities
Act
of
1933
and
related
rules
("restricted
security").
Acquisition
date
represents
the
day
on
which
an
enforceable
right
to
acquire
such
security
is
obtained
and
is
presented
along
with
related
cost
in
the
security
description.
The
fund
may
have
registration
rights
for
certain
restricted
securities.
Any
costs
related
to
such
registration
are
generally
borne
by
the
issuer.
The
aggregate
value
of
restricted
securities
(excluding
144A
holdings)
at
period
end
amounts
to
$5,542
and
represents
0.1%
of
net
assets.
(3)
SEC
30-day
yield
(4)
Affiliated
Companies
(5)
See
Note
4.
All
or
a
portion
of
this
security
is
on
loan
at
December
31,
2024.
(6)
Non-income
producing
.
.
.
.
.
.
.
.
.
.
(7)
See
Note
2.
Level
3
in
fair
value
hierarchy.
(8)
Security
is
a
fix-to-float
security,
which
carries
a
fixed
coupon
until
a
certain
date,
upon
which
it
switches
to
a
floating
rate.
Reference
rate
and
spread
are
provided
if
the
rate
is
currently
floating.
(9)
Security
has
the
ability
to
pay
in-kind
or
pay
in
cash.
When
applicable,
separate
rates
of
such
payments
are
disclosed.
(10)
Insured
by
Assured
Guaranty
Municipal
Corporation
(11)
See
Note
4
.
To-Be-Announced
purchase
commitment.
Total
value
of
such
securities
at
period-end
amounts
to
$17,881
and
represents
0.4%
of
net
assets.
(12)
At
December
31,
2024,
all
or
a
portion
of
this
security
is
pledged
as
collateral
and/or
margin
deposit
to
cover
future
funding
obligations.
(13)
Seven-day
yield
1M
TSFR
One
month
term
SOFR
(Secured
overnight
financing
rate)
3M
TSFR
Three
month
term
SOFR
(Secured
overnight
financing
rate)
1Y
CMT
One
year
U.S.
Treasury
note
constant
maturity
ADR
American
Depositary
Receipts
ARM
Adjustable
Rate
Mortgage
(ARM);
rate
shown
is
effective
rate
at
period-end.
The
rates
for
certain
ARMs
are
not
based
on
a
published
reference
rate
and
spread
but
may
be
determined
using
a
formula
based
on
the
rates
of
the
underlying
loans.
AUD
Australian
Dollar
CAD
Canadian
Dollar
CHF
Swiss
Franc
CLO
Collateralized
Loan
Obligation
CMO
Collateralized
Mortgage
Obligation
DKK
Danish
Krone
EUR
Euro
FRN
Floating
Rate
Note
GBP
British
Pound
GO
General
Obligation
HHEFA
Health
&
Higher
Educational
Facility
Authority
HKD
Hong
Kong
Dollar
IDA
Industrial
Development
Authority/Agency
INR
Indian
Rupee
JPY
Japanese
Yen
KRW
South
Korean
Won
NOK
Norwegian
Krone
PFA
Public
Finance
Authority/Agency
PIK
Payment-in-kind
PTT
Pass-Through
Trust
REIT
A
domestic
Real
Estate
Investment
Trust
whose
distributions
pass-through
with
original
tax
character
to
the
shareholder
RFUCCT1Y
Twelve
month
FTSE
USD
IBOR
Consumer
Cash
Fallback
.
.
.
.
.
.
.
.
.
.
SDR
Swedish
Depository
Receipts
SEK
Swedish
Krona
SGD
Singapore
Dollar
SOFR30A
30-day
Average
SOFR
(Secured
overnight
financing
rate)
STEP
Stepped
coupon
bond
for
which
the
coupon
rate
of
interest
adjusts
on
specified
date(s);
rate
shown
is
effective
rate
at
period-end.
TBA
To-Be-Announced
TWD
Taiwan
Dollar
UMBS
Uniform
Mortgage-Backed
Securities
VR
Variable
Rate;
rate
shown
is
effective
rate
at
period-end.
The
rates
for
certain
variable
rate
securities
are
not
based
on
a
published
reference
rate
and
spread
but
are
determined
by
the
issuer
or
agent
and
based
on
current
market
conditions.
(Amounts
in
000s)
SWAPS
0.0%
Description
Notional
Amount
$
Value
Initial
$
Value
Unrealized
$
Gain/(Loss)
CENTRALLY
CLEARED
SWAPS
0.0%
Credit
Default
Swaps,
Protection
Sold
0.0%
Protection
Sold
(Relevant
Credit:
Markit
CDX.NA.IG-S42,
5
Year
Index),
Receive
1.00%
Quarterly,
Pay
upon
credit
default,
6/20/29
27,500
627
592
35
Protection
Sold
(Relevant
Credit:
Markit
CDX.NA.IG-S43,
5
Year
Index),
Receive
1.00%
Quarterly,
Pay
upon
credit
default,
12/20/29
25,000
566
573
(7)
Total
Centrally
Cleared
Credit
Default
Swaps,
Protection
Sold
28
Total
Centrally
Cleared
Swaps
28
Net
payments
(receipts)
of
variation
margin
to
date
(17)
Variation
margin
receivable
(payable)
on
centrally
cleared
swaps
$
11
FUTURES
CONTRACTS
($000s)
Expiration
Date
Notional
Amount
Value
and
Unrealized
Gain
(Loss)
Long,
456
U.S.
Treasury
Notes
five
year
contracts
3/25
48,475
$
(207)
Long,
30
U.S.
Treasury
Notes
ten
year
contracts
3/25
3,263
(33)
Long,
279
U.S.
Treasury
Notes
two
year
contracts
3/25
57,365
(5)
Short,
21
Ultra
U.S.
Treasury
Notes
ten
year
contracts
3/25
(2,338)
33
Net
payments
(receipts)
of
variation
margin
to
date
164
Variation
margin
receivable
(payable)
on
open
futures
contracts
$
(48)
AFFILIATED
COMPANIES
($000s)
The
fund
may
invest
in
certain
securities
that
are
considered
affiliated
companies.
As
defined
by
the
1940
Act,
an
affiliated
company
is
one
in
which
the
fund
owns
5%
or
more
of
the
outstanding
voting
securities,
or
a
company
that
is
under
common
ownership
or
control.
The
following
securities
were
considered
affiliated
companies
for
all
or
some
portion
of
the
year
ended
December
31,
2024.
Net
realized
gain
(loss),
investment
income,
change
in
net
unrealized
gain/loss,
and
purchase
and
sales
cost
reflect
all
activity
for
the
period
then
ended.
Affiliate
Net
Realized
Gain
(Loss)
Change
in
Net
Unrealized
Gain/Loss
Investment
Income
T.
Rowe
Price
Inflation
Protected
Bond
Fund
-
I
Class,
3.22%
$
—
$
(477)
$
887
T.
Rowe
Price
Institutional
High
Yield
Fund
-
Institutional
Class,
6.73%
(312)
158
14,136
T.
Rowe
Price
Limited
Duration
Inflation
Focused
Bond
Fund
-
I
Class,
2.91%
438
12
83
T.
Rowe
Price
Real
Assets
Fund
-
I
Class
(21)
(2,198)
3,657
T.
Rowe
Price
Government
Reserve
Fund,
4.53%
—
—
—++
T.
Rowe
Price
Treasury
Reserve
Fund,
4.52%
—
—
3,840
Totals
$
105#
$
(2,505)
$
22,603+
The
accompanying
notes
are
an
integral
part
of
these
financial
statements.
AFFILIATED
COMPANIES
(CONTINUED)
($000s)
Supplementary
Investment
Schedule
Affiliate
Value
12/31/23
Purchase
Cost
Sales
Cost
Value
12/31/24
T.
Rowe
Price
Inflation
Protected
Bond
Fund
-
I
Class,
3.22%
$
15
$
22,888
$
—
$
22,426
T.
Rowe
Price
Institutional
High
Yield
Fund
-
Institutional
Class,
6.73%
203,169
17,038
3,462
216,903
T.
Rowe
Price
Limited
Duration
Inflation
Focused
Bond
Fund
-
I
Class,
2.91%
111
10,573
10,222
474
T.
Rowe
Price
Real
Assets
Fund
-
I
Class
179,767
15,907
1,021
192,455
T.
Rowe
Price
Government
Reserve
Fund,
4.53%
47,322
¤
¤
47,683
T.
Rowe
Price
Treasury
Reserve
Fund,
4.52%
62,473
¤
¤
60,756
Total
$
540,697^
#
Capital
gain
distributions
from
underlying
Price
funds
represented
$0
of
the
net
realized
gain
(loss).
++
Excludes
earnings
on
securities
lending
collateral,
which
are
subject
to
rebates
and
fees
as
described
in
Note
4.
+
Investment
income
comprised
$22,603
of
dividend
income
and
$0
of
interest
income.
¤
Purchase
and
sale
information
not
shown
for
cash
management
funds.
^
The
cost
basis
of
investments
in
affiliated
companies
was
$537,969.
T.
ROWE
PRICE
Balanced
Fund
December
31,
2024
Statement
of
Assets
and
Liabilities
($000s,
except
shares
and
per
share
amounts)
Assets
Investments
in
securities,
at
value
(cost
$3,300,856)
$
4,659,475
Interest
and
dividends
receivable
11,386
Receivable
for
shares
sold
2,652
Receivable
for
investment
securities
sold
968
Foreign
currency
(cost
$488)
483
Variation
margin
receivable
on
centrally
cleared
swaps
11
Other
assets
4,984
Total
assets
4,679,959
Liabilities
Obligation
to
return
securities
lending
collateral
47,683
Payable
for
investment
securities
purchased
25,849
Payable
for
shares
redeemed
4,476
Investment
management
fees
payable
1,536
Due
to
affiliates
273
Variation
margin
payable
on
futures
contracts
48
Payable
to
directors
4
Other
liabilities
291
Total
liabilities
80,160
NET
ASSETS
$
4,599,799
T.
ROWE
PRICE
Balanced
Fund
December
31,
2024
Statement
of
Assets
and
Liabilities
($000s,
except
shares
and
per
share
amounts)
The
accompanying
notes
are
an
integral
part
of
these
financial
statements.
Net
Assets
Consist
of:
Total
distributable
earnings
(loss)
$
1,366,893
Paid-in
capital
applicable
to
175,090,079
shares
of
$0.01
par
value
capital
stock
outstanding;
1,000,000,000
shares
authorized
3,232,906
NET
ASSETS
$
4,599,799
NET
ASSET
VALUE
PER
SHARE
Investor
Class
(Net
assets:
$2,483,959;
Shares
outstanding:
94,516,035)
$
26.28
I
Class
(Net
assets:
$2,115,840;
Shares
outstanding:
80,574,044)
$
26.26
Year
Ended
12/31/24
Investment
Income
(Loss)
Income
Dividend
(net
of
foreign
taxes
of
$2,277)
$
69,888
.
Interest
50,601
Securities
lending
160
Other
7
Total
income
120,656
Expenses
Investment
management
20,054
Shareholder
servicing
Investor
Class
$
3,907
I
Class
380
4,287
Prospectus
and
shareholder
reports
Investor
Class
62
I
Class
14
76
Custody
and
accounting
442
Legal
and
audit
93
Registration
89
Directors
15
Miscellaneous
47
Waived
/
paid
by
Price
Associates
(
2,334
)
Total
expenses
22,769
Net
investment
income
97,887
The
accompanying
notes
are
an
integral
part
of
these
financial
statements.
Year
Ended
12/31/24
Realized
and
Unrealized
Gain
/
Loss
–
Net
realized
gain
(loss)
Securities
287,329
Futures
(
129
)
Swaps
358
Foreign
currency
transactions
(
18
)
Net
realized
gain
287,540
Change
in
net
unrealized
gain
/
loss
Securities
131,543
Futures
(
2,011
)
Swaps
28
Other
assets
and
liabilities
denominated
in
foreign
currencies
(
392
)
Change
in
net
unrealized
gain
/
loss
129,168
Net
realized
and
unrealized
gain
/
loss
416,708
INCREASE
IN
NET
ASSETS
FROM
OPERATIONS
$
514,595
Statement
of
Changes
in
Net
Assets
The
accompanying
notes
are
an
integral
part
of
these
financial
statements.
Year
.
.
.
.
.
.
.
.
.
.
.
.
.
.
Ended
.
.
.
.
.
.
.
.
.
.
.
.
.
.
12/31/24
12/31/23
Increase
(Decrease)
in
Net
Assets
Operations
Net
investment
income
$
97,887
$
91,856
Net
realized
gain
287,540
138,160
Change
in
net
unrealized
gain
/
loss
129,168
459,323
Increase
in
net
assets
from
operations
514,595
689,339
Distributions
to
shareholders
Net
earnings
Investor
Class
(
175,314
)
(
94,011
)
I
Class
(
148,720
)
(
72,647
)
Decrease
in
net
assets
from
distributions
(
324,034
)
(
166,658
)
Capital
share
transactions
*
Shares
sold
Investor
Class
311,663
250,084
I
Class
334,485
180,759
Distributions
reinvested
Investor
Class
168,852
90,614
I
Class
143,275
69,982
Shares
redeemed
Investor
Class
(
597,897
)
(
469,857
)
I
Class
(
330,257
)
(
251,684
)
Increase
(decrease)
in
net
assets
from
capital
share
transactions
30,121
(
130,102
)
Net
Assets
Increase
during
period
220,682
392,579
Beginning
of
period
4,379,117
3,986,538
End
of
period
$
4,599,799
$
4,379,117
*Share
information
(000s)
Shares
sold
Investor
Class
11,622
10,489
I
Class
12,393
7,582
Distributions
reinvested
Investor
Class
6,381
3,702
I
Class
5,418
2,862
Shares
redeemed
Investor
Class
(
22,215
)
(
19,757
)
I
Class
(
12,226
)
(
10,600
)
Increase
(decrease)
in
shares
outstanding
1,373
(
5,722
)
NOTES
TO
FINANCIAL
STATEMENTS
T.
Rowe
Price
Balanced
Fund,
Inc. (the
fund) is
registered
under
the
Investment
Company
Act
of
1940
(the
1940
Act)
as a
diversified, open-end
management
investment
company. The
fund
seeks to
provide
capital
growth,
current
income,
and
preservation
of
capital
through
a
portfolio
of
stocks
and
fixed-
income
securities.
The
fund
has two classes
of
shares:
the
Balanced
Fund
(Investor
Class)
and
the
Balanced
Fund–I
Class
(I
Class).
I
Class
shares
require
a
$500,000
initial
investment
minimum,
although
the
minimum
generally
is
waived
or
reduced
for
financial
intermediaries,
eligible
retirement
plans,
and
certain
other
accounts. Each
class
has
exclusive
voting
rights
on
matters
related
solely
to
that
class;
separate
voting
rights
on
matters
that
relate
to
both
classes;
and,
in
all
other
respects,
the
same
rights
and
obligations
as
the
other
class.
NOTE
1
-
SIGNIFICANT
ACCOUNTING
POLICIES
Basis
of
Preparation
The fund
is
an
investment
company
and
follows
accounting
and
reporting
guidance
in
the
Financial
Accounting
Standards
Board
(FASB)
Accounting
Standards
Codification
Topic
946
(ASC
946).
The
accompanying
financial
statements
were
prepared
in
accordance
with
accounting
principles
generally
accepted
in
the
United
States
of
America
(GAAP),
including,
but
not
limited
to,
ASC
946.
GAAP
requires
the
use
of
estimates
made
by
management.
Management
believes
that
estimates
and
valuations
are
appropriate;
however,
actual
results
may
differ
from
those
estimates,
and
the
valuations
reflected
in
the
accompanying
financial
statements
may
differ
from
the
value
ultimately
realized
upon
sale
or
maturity.
Investment
Transactions,
Investment
Income,
and
Distributions
Investment
transactions
are
accounted
for
on
the
trade
date
basis.
Income
and
expenses
are
recorded
on
the
accrual
basis.
Realized
gains
and
losses
are
reported
on
the
identified
cost
basis. Premiums
and
discounts
on
debt
securities
are
amortized
for
financial
reporting
purposes. Paydown
gains
and
losses
are
recorded
as
an
adjustment
to
interest
income. Income
tax-related
interest
and
penalties,
if
incurred,
are
recorded
as
income
tax
expense. Dividends
received
from other
investment
companies are
reflected
as
dividend income;
capital
gain
distributions
are
reflected
as
realized
gain/loss. Dividend
income and
capital
gain
distributions
are
recorded
on
the
ex-dividend
date. Earnings
on
investments
recognized
as
partnerships
for
federal
income
tax
purposes
reflect
the
tax
character
of
such
earnings. Distributions
from
REITs
are
initially
recorded
as
dividend
income
and,
to
the
extent
such
represent
a
return
of
capital
or
capital
gain
for
tax
purposes,
are
reclassified
when
such
information
becomes
available. Non-cash
dividends,
if
any,
are
recorded
at
the
fair
market
value
of
the
asset
received. Proceeds
from
litigation
payments,
if
any,
are
included
in
either
net
realized
gain
(loss)
or
change
in
net
unrealized
gain/loss
from
securities. Distributions
to
shareholders
are
recorded
on
the
ex-dividend
date. Income
distributions,
if
any,
are
declared
and
paid
by
each
class quarterly. A
capital
gain
distribution,
if
any, may
also
be
declared
and
paid
by
the
fund
annually.
Currency
Translation
Assets,
including
investments,
and
liabilities
denominated
in
foreign
currencies
are
translated
into
U.S.
dollar
values
each
day
at
the
prevailing
exchange
rate,
using
the
mean
of
the
bid
and
asked
prices
of
such
currencies
against
U.S.
dollars
as
provided
by
an
outside
pricing
service.
Purchases
and
sales
of
securities,
income,
and
expenses
are
translated
into
U.S.
dollars
at
the
prevailing
exchange
rate
on
the
respective
date
of
such
transaction.
The
effect
of
changes
in
foreign
currency
exchange
rates
on
realized
and
unrealized
security
gains
and
losses
is
not
bifurcated
from
the
portion
attributable
to
changes
in
market
prices.
Class
Accounting
Shareholder
servicing,
prospectus,
and
shareholder
report
expenses
incurred
by
each
class
are
charged
directly
to
the
class
to
which
they
relate.
Expenses
common
to
all
classes
and
investment
income
are
allocated
to
the
classes
based
upon
the
relative
daily
net
assets
of
each
class’s
settled
shares;
realized
and
unrealized
gains
and
losses
are
allocated
based
upon
the
relative
daily
net
assets
of
each
class’s
outstanding
shares.
Capital
Transactions
Each
investor’s
interest
in
the
net
assets
of the
fund
is
represented
by
fund
shares. The
fund’s
net
asset
value
(NAV)
per
share
is
computed
at
the
close
of
the
New
York
Stock
Exchange
(NYSE),
normally
4
p.m.
Eastern
time,
each
day
the
NYSE
is
open
for
business.
However,
the
NAV
per
share
may
be
calculated
at
a
time
other
than
the
normal
close
of
the
NYSE
if
trading
on
the
NYSE
is
restricted,
if
the
NYSE
closes
earlier,
or
as
may
be
permitted
by
the
SEC.
Purchases
and
redemptions
of
fund
shares
are
transacted
at
the
next-computed
NAV
per
share,
after
receipt
of
the
transaction
order
by
T.
Rowe
Price
Associates,
Inc.,
or
its
agents.
New
Accounting
Guidance
In December
2023,
the
FASB
issued
Accounting
Standards
Update
(ASU),
ASU
2023-09,
Income
Taxes
(Topic
740)
–
Improvements
to
Income
Taxes
Disclosures,
which
enhances
the
transparency
of
income
tax
disclosures.
The
ASU
requires
public
entities,
on
an
annual
basis,
to
provide
disclosure
of
specific
categories
in
the
rate
reconciliation,
as
well
as
disclosure
of
income
taxes
paid
disaggregated
by
jurisdiction.
The
amendments
under
this
ASU
are
required
to
be
applied
prospectively
and
are
effective
for
fiscal
years
beginning
after
December
15,
2024.
Management
expects
that
adoption
of
the
guidance
will
not
have
a
material
impact
on
the
fund’s
financial
statements.
Indemnification
In
the
normal
course
of
business, the
fund
may
provide
indemnification
in
connection
with
its
officers
and
directors,
service
providers,
and/or
private
company
investments. The
fund’s
maximum
exposure
under
these
arrangements
is
unknown;
however,
the
risk
of
material
loss
is
currently
considered
to
be
remote.
NOTE
2
-
VALUATION
Fair
Value
The
fund’s
financial
instruments
are
valued
at
the
close
of
the
NYSE
and
are
reported
at
fair
value,
which
GAAP
defines
as
the
price
that
would
be
received
to
sell
an
asset
or
paid
to
transfer
a
liability
in
an
orderly
transaction
between
market
participants
at
the
measurement
date. The fund’s
Board
of
Directors
(the
Board)
has
designated
T.
Rowe
Price
Associates,
Inc.
as
the
fund’s
valuation
designee
(Valuation
Designee).
Subject
to
oversight
by
the
Board,
the
Valuation
Designee
performs
the
following
functions
in
performing
fair
value
determinations:
assesses
and
manages
valuation
risks;
establishes
and
applies
fair
value
methodologies;
tests
fair
value
methodologies;
and
evaluates
pricing
vendors
and
pricing
agents.
The
duties
and
responsibilities
of
the
Valuation
Designee
are
performed
by
its
Valuation
Committee. The
Valuation
Designee provides
periodic
reporting
to
the
Board
on
valuation
matters.
Various
valuation
techniques
and
inputs
are
used
to
determine
the
fair
value
of
financial
instruments.
GAAP
establishes
the
following
fair
value
hierarchy
that
categorizes
the
inputs
used
to
measure
fair
value:
Level
1
–
quoted
prices
(unadjusted)
in
active
markets
for
identical
financial
instruments
that
the
fund
can
access
at
the
reporting
date
Level
2
–
inputs
other
than
Level
1
quoted
prices
that
are
observable,
either
directly
or
indirectly
(including,
but
not
limited
to,
quoted
prices
for
similar
financial
instruments
in
active
markets,
quoted
prices
for
identical
or
similar
financial
instruments
in
inactive
markets,
interest
rates
and
yield
curves,
implied
volatilities,
and
credit
spreads)
Level
3
–
unobservable
inputs
(including
the Valuation
Designee’s assumptions
in
determining
fair
value)
Observable
inputs
are
developed
using
market
data,
such
as
publicly
available
information
about
actual
events
or
transactions,
and
reflect
the
assumptions
that
market
participants
would
use
to
price
the
financial
instrument.
Unobservable
inputs
are
those
for
which
market
data
are
not
available
and
are
developed
using
the
best
information
available
about
the
assumptions
that
market
participants
would
use
to
price
the
financial
instrument.
GAAP
requires
valuation
techniques
to
maximize
the
use
of
relevant
observable
inputs
and
minimize
the
use
of
unobservable
inputs.
When
multiple
inputs
are
used
to
derive
fair
value,
the
financial
instrument
is
assigned
to
the
level
within
the
fair
value
hierarchy
based
on
the
lowest-level
input
that
is
significant
to
the
fair
value
of
the
financial
instrument.
Input
levels
are
not
necessarily
an
indication
of
the
risk
or
liquidity
associated
with
financial
instruments
at
that
level
but
rather
the
degree
of
judgment
used
in
determining
those
values.
Valuation
Techniques
Equity
securities,
including
exchange-traded
funds, listed
or
regularly
traded
on
a
securities
exchange
or
in
the
over-the-
counter
(OTC)
market
are
valued
at
the
last
quoted
sale
price
or,
for
certain
markets,
the
official
closing
price
at
the
time
the
valuations
are
made.
OTC
Bulletin
Board
securities
are
valued
at
the
mean
of
the
closing
bid
and
asked
prices.
A
security
that
is
listed
or
traded
on
more
than
one
exchange
is
valued
at
the
quotation
on
the
exchange
determined
to
be
the
primary
market
for
such
security.
Listed
securities
not
traded
on
a
particular
day
are
valued
at
the
mean
of
the
closing
bid
and
asked
prices
for
domestic
securities
and
the
last
quoted
sale
or
closing
price
for
international
securities.
The
last
quoted
prices
of
non-U.S.
equity
securities
may
be
adjusted
to
reflect
the
fair
value
of
such
securities
at
the
close
of
the
NYSE,
if
the Valuation
Designee
determines
that
developments
between
the
close
of
a
foreign
market
and
the
close
of
the
NYSE
will
affect
the
value
of
some
or
all
of
the
fund’s portfolio
securities.
Each
business
day,
the
Valuation
Designee uses
information
from
outside
pricing
services
to
evaluate
the
quoted
prices
of
portfolio
securities
and,
if
appropriate,
decide whether
it
is
necessary
to
adjust
quoted
prices
to
reflect
fair
value
by
reviewing
a
variety
of
factors,
including
developments
in
foreign
markets,
the
performance
of
U.S.
securities
markets,
and
the
performance
of
instruments
trading
in
U.S.
markets
that
represent
foreign
securities
and
baskets
of
foreign
securities. The Valuation
Designee
uses
outside
pricing
services
to
provide
it
with
quoted
prices
and
information
to
evaluate
or
adjust
those
prices.
The Valuation
Designee
cannot
predict
how
often
it
will
use
quoted
prices
and
how
often
it
will
determine
it
necessary
to
adjust
those
prices
to
reflect
fair
value.
Debt
securities
generally
are
traded
in
the over-the-counter
(OTC)
market
and
are
valued
at
prices
furnished
by
independent
pricing
services
or
by
broker
dealers
who
make
markets
in
such
securities.
When
valuing
securities,
the
independent
pricing
services
consider
factors
such
as,
but
not
limited
to,
the
yield
or
price
of
bonds
of
comparable
quality,
coupon,
maturity,
and
type,
as
well
as
prices
quoted
by
dealers
who
make
markets
in
such
securities.
Investments
in
mutual
funds
are
valued
at
the
mutual
fund’s
closing
NAV
per
share
on
the
day
of
valuation.
Futures
contracts
are
valued
at
closing
settlement
prices.
Swaps
are
valued
at
prices
furnished
by
an
independent
pricing
service
or
independent
swap
dealers.
Assets
and
liabilities
other
than
financial
instruments,
including
short-term
receivables
and
payables,
are
carried
at
cost,
or
estimated
realizable
value,
if
less,
which
approximates
fair
value.
Investments
for
which
market
quotations are
not
readily
available
or
deemed
unreliable
are
valued
at
fair
value
as
determined
in
good
faith
by
the
Valuation
Designee.
The
Valuation
Designee
has
adopted
methodologies
for
determining
the
fair
value
of
investments
for
which
market
quotations
are
not
readily
available
or
deemed
unreliable,
including
the
use
of
other
pricing
sources.
Factors
used
in
determining
fair
value
vary
by
type
of
investment
and
may
include
market
or
investment
specific
considerations.
The
Valuation
Designee typically
will
afford
greatest
weight
to
actual
prices
in
arm’s
length
transactions,
to
the
extent
they
represent
orderly
transactions
between
market
participants,
transaction
information
can
be
reliably
obtained,
and
prices
are
deemed
representative
of
fair
value.
However,
the
Valuation
Designee may
also
consider
other
valuation
methods
such
as
market-based
valuation
multiples;
a
discount
or
premium
from
market
value
of
a
similar,
freely
traded
security
of
the
same
issuer;
discounted
cash
flows;
yield
to
maturity;
or
some
combination.
Fair
value
determinations
are
reviewed
on
a
regular
basis.
Because
any
fair
value
determination
involves
a
significant
amount
of
judgment,
there
is
a
degree
of
subjectivity
inherent
in
such
pricing
decisions. Fair
value
prices
determined
by
the
Valuation
Designee could
differ
from
those
of
other
market
participants,
and
it
is
possible
that
the
fair
value
determined
for
a
security
may
be
materially
different
from
the
value
that
could
be
realized
upon
the
sale
of
that
security.
Valuation
Inputs
The
following
table
summarizes
the
fund’s
financial
instruments,
based
on
the
inputs
used
to
determine
their
fair
values
on
December
31,
2024
(for
further
detail
by
category,
please
refer
to
the
accompanying
Portfolio
of
Investments):
NOTE
3
-
DERIVATIVE
INSTRUMENTS
During
the
year ended
December
31,
2024,
the
fund
invested
in
derivative
instruments.
As
defined
by
GAAP,
a
derivative
is
a
financial
instrument
whose
value
is
derived
from
an
underlying
security
price,
foreign
exchange
rate,
interest
rate,
index
of
prices
or
rates,
or
other
variable;
it
requires
little
or
no
($000s)
Level
1
Level
2
Level
3
Total
Value
Assets
Fixed
Income
Securities
1
$
—
$
1,238,342
$
—
$
1,238,342
Bond
Mutual
Funds
239,803
—
—
239,803
Common
Stocks
2,046,170
771,322
659
2,818,151
Convertible
Preferred
Stocks
—
—
1,516
1,516
Equity
Mutual
Funds
192,455
—
—
192,455
Non-U.S.
Government
Mortgage-Backed
Securities
—
56,058
1,682
57,740
Preferred
Stocks
—
3,029
—
3,029
Short-Term
Investments
60,756
—
—
60,756
Securities
Lending
Collateral
47,683
—
—
47,683
Total
Securities
2,586,867
2,068,751
3,857
4,659,475
Swaps*
—
35
—
35
Futures
Contracts*
33
—
—
33
Total
$
2,586,900
$
2,068,786
$
3,857
$
4,659,543
Liabilities
Swaps*
$
—
$
7
$
—
$
7
Futures
Contracts*
245
—
—
245
Total
$
245
$
7
$
—
$
252
1
Includes
Asset-Backed
Securities,
Corporate
Bonds,
Foreign
Government
Obligations
&
Municipalities,
Municipal
Securities,
U.S.
Government
&
Agency
Mortgage-Backed
Securities
and
U.S.
Government
Agency
Obligations
(Excluding
Mortgage-Backed).
*
The
fair
value
presented
includes
cumulative
gain
(loss)
on
open
futures
contracts
and
centrally
cleared
swaps;
however,
the
net
value
reflected
on
the
accompanying
Portfolio
of
Investments
is
only
the
unsettled
variation
margin
receivable
(payable)
at
that
date.
initial
investment
and
permits
or
requires
net
settlement
or
delivery
of
cash
or
other
assets.
The
fund
invests
in
derivatives
only
if
the
expected
risks
and
rewards
are
consistent
with
its
investment
objectives,
policies,
and
overall
risk
profile,
as
described
in
its
prospectus
and
Statement
of
Additional
Information.
The
fund
may
use
derivatives
for
a
variety
of
purposes
and
may
use
them
to
establish
both
long
and
short
positions
within
the
fund’s
portfolio.
Potential
uses
include
to
hedge
against
declines
in
principal
value,
increase
yield,
invest
in
an
asset
with
greater
efficiency
and
at
a
lower
cost
than
is
possible
through
direct
investment,
to
enhance
return,
or
to
adjust
portfolio
duration
and
credit
exposure.
The
risks
associated
with
the
use
of
derivatives
are
different
from,
and
potentially
much
greater
than,
the
risks
associated
with
investing
directly
in
the
instruments
on
which
the
derivatives
are
based.
The
fund
values
its
derivatives
at
fair
value
and
recognizes
changes
in
fair
value
currently
in
its
results
of
operations.
Accordingly,
the
fund
does
not
follow
hedge
accounting,
even
for
derivatives
employed
as
economic
hedges.
Generally,
the
fund
accounts
for
its
derivatives
on
a
gross
basis.
It
does
not
offset
the
fair
value
of
derivative
liabilities
against
the
fair
value
of
derivative
assets
on
its
financial
statements,
nor
does
it
offset
the
fair
value
of
derivative
instruments
against
the
right
to
reclaim
or
obligation
to
return
collateral.
The
following
table
summarizes
the
fair
value
of
the
fund’s
derivative
instruments
held
as
of
December
31,
2024,
and
the
related
location
on
the
accompanying
Statement
of
Assets
and
Liabilities,
presented
by
primary
underlying
risk
exposure:
Additionally,
the
amount
of
gains
and
losses
on
derivative
instruments
recognized
in
fund
earnings
during
the
year ended
December
31,
2024,
and
the
related
location
on
the
accompanying
Statement
of
Operations
is
summarized
in
the
following
table
by
primary
underlying
risk
exposure:
($000s)
Location
on
Statement
of
Assets
and
Liabilities
Fair
Value*
Assets
Interest
rate
derivatives
Futures
$
33
Credit
derivatives
Centrally
Cleared
Swaps
35
*
Total
$
68
*
Liabilities
Interest
rate
derivatives
Futures
$
245
Credit
derivatives
Centrally
Cleared
Swaps
7
Total
$
252
*
The
fair
value
presented
includes
cumulative
gain
(loss)
on
open
futures
contracts
and
centrally
cleared
swaps;
however,
the
value
reflected
on
the
accompanying
Statement
of
Assets
and
Liabilities
is
only
the
unsettled
variation
margin
receivable
(payable)
at
that
date.
($000s)
Location
of
Gain
(Loss)
on
Statement
of
Operations
Futures
Swaps
Total
Realized
Gain
(Loss)
Interest
rate
derivatives
$
(129)
$
—
$
(129)
Credit
derivatives
—
358
358
Total
$
(129)
$
358
$
229
Counterparty
Risk
and
Collateral
The
fund
invests
in
exchange-traded
and/or
centrally
cleared
derivative
contracts,
such
as
futures,
exchange-traded
options,
and
centrally
cleared
swaps.
Counterparty
risk
on
such
derivatives
is
minimal
because
the
clearinghouse
provides
protection
against
counterparty
defaults.
For
futures
and
centrally
cleared
swaps,
the
fund
is
required
to
deposit
collateral
in
an
amount
specified
by
the
clearinghouse
and
the
clearing
firm
(margin
requirement),
and
the
margin
requirement
must
be
maintained
over
the
life
of
the
contract.
Each
clearinghouse
and
clearing
firm,
in
its
sole
discretion,
may
adjust
the
margin
requirements
applicable
to
the
fund.
Collateral may
be
in
the
form
of
cash
or
debt
securities
issued
by
the
U.S.
government
or
related
agencies.
Cash
posted
by
the
fund
is
reflected
as
cash
deposits
in
the
accompanying
financial
statements
and
generally
is
restricted
from
withdrawal
by
the
fund;
securities
posted
by
the
fund
are
so
noted
in
the
accompanying
Portfolio
of
Investments;
both
remain
in
the
fund’s
assets.
While
typically
not
sold
in
the
same
manner
as
equity
or
fixed
income
securities,
exchange-traded
or
centrally
cleared
derivatives
may
be
closed
out
only
on
the
exchange
or
clearinghouse
where
the
contracts
were
cleared.
This
ability
is
subject
to
the
liquidity
of
underlying
positions. As
of
December
31,
2024,
securities
valued
at $2,339,000
had
been
posted
by
the
fund
for
exchange-
traded
and/or
centrally
cleared
derivatives.
Futures
Contracts
The
fund
is
subject
to interest
rate
risk in
the
normal
course
of
pursuing
its
investment
objectives
and
uses
futures
contracts
to
help
manage
such
risk.
The fund
may
enter
into
futures
contracts
to
manage
exposure
to
interest
rate
and
yield
curve
movements,
security
prices,
foreign
currencies,
and
mortgage
prepayments;
as
an
efficient
means
of
adjusting
exposure
to
all
or
part
of
a
target
market;
as
a
cash
management
tool;
or
to
adjust
portfolio
duration. A
futures
contract
provides
for
the
future
sale
by
one
party
and
purchase
by
another
of
a
specified
amount
of
a
specific
underlying
financial
instrument
at
an
agreed-upon
price,
date,
time,
and
place.
The
fund
currently
($000s)
Location
of
Gain
(Loss)
on
Statement
of
Operations
Futures
Swaps
Total
Change
in
Unrealized
Gain
(Loss)
Interest
rate
derivatives
$
(2,011)
$
—
$
(2,011)
Credit
derivatives
—
28
28
Total
$
(2,011)
$
28
$
(1,983)
invests
only
in
exchange-traded
futures,
which
generally
are
standardized
as
to
maturity
date,
underlying
financial
instrument,
and
other
contract
terms.
Payments
are
made
or
received
by
the
fund
each
day
to
settle
daily
fluctuations
in
the
value
of
the
contract
(variation
margin),
which
reflect
changes
in
the
value
of
the
underlying
financial
instrument.
Variation
margin
is
recorded
as
unrealized
gain
or
loss
until
the
contract
is
closed.
The
value
of
a
futures
contract
included
in
net
assets
is
the
amount
of
unsettled
variation
margin;
net
variation
margin
receivable
is
reflected
as
an
asset
and
net
variation
margin
payable
is
reflected
as
a
liability
on
the
accompanying
Statement
of
Assets
and
Liabilities.
When
a
contract
is
closed,
a
realized
gain
or
loss
is
recorded
on
the
accompanying
Statement
of
Operations.
Risks
related
to
the
use
of
futures
contracts
include
possible
illiquidity
of
the
futures
markets,
contract
prices
that
can
be
highly
volatile
and
imperfectly
correlated
to
movements
in
hedged
security
values
and/
or
interest
rates,
and
potential
losses
in
excess
of
the
fund’s
initial
investment.
During
the
year ended
December
31,
2024,
the
volume
of
the
fund’s
activity
in
futures,
based
on
underlying
notional
amounts,
was
generally
between
1%
and
4%
of
net
assets.
Swaps
The
fund
is
subject
to
credit
risk in
the
normal
course
of
pursuing
its
investment
objectives
and
uses
swap
contracts
to
help
manage
such
risk.
The
fund
may
use
swaps
in
an
effort
to
manage
both
long
and
short
exposure
to
changes
in
interest
rates,
inflation
rates,
and
credit
quality;
to
adjust
overall
exposure
to
certain
markets;
to
enhance
total
return
or
protect
the
value
of
portfolio
securities;
to
serve
as
a
cash
management
tool;
or
to
adjust
portfolio
duration
and
credit
exposure.
Swap
agreements
can
be
settled
either
directly
with
the
counterparty
(bilateral
swap)
or
through
a
central
clearinghouse
(centrally
cleared
swap).
Fluctuations
in
the
fair
value
of
a
contract
are
reflected
in
unrealized
gain
or
loss
and
are
reclassified
to
realized
gain
or
loss
on
the
accompanying
Statement
of
Operations upon
contract
termination
or
cash
settlement.
Net
periodic
receipts
or
payments
required
by
a
contract
increase
or
decrease,
respectively,
the
value
of
the
contract
until
the
contractual
payment
date,
at
which
time
such
amounts
are
reclassified
from
unrealized
to
realized
gain
or
loss
on
the
accompanying
Statement
of
Operations.
For
bilateral
swaps,
cash
payments
are
made
or
received
by
the
fund
on
a
periodic
basis
in
accordance
with
contract
terms;
unrealized
gain
on
contracts
and
premiums
paid
are
reflected
as
assets
and
unrealized
loss
on
contracts
and
premiums
received
are
reflected
as
liabilities
on
the
accompanying
Statement
of
Assets
and
Liabilities.
For
bilateral
swaps,
premiums
paid
or
received
are
amortized
over
the
life
of
the
swap
and
are
recognized
as
realized
gain
or
loss
on
the
accompanying
Statement
of
Operations.
For
centrally
cleared
swaps,
payments
are
made
or
received
by
the
fund
each
day
to
settle
the
daily
fluctuation
in
the
value
of
the
contract
(variation
margin).
Accordingly,
the
value
of
a
centrally
cleared
swap
included
in
net
assets
is
the
unsettled
variation
margin;
net
variation
margin
receivable
is
reflected
as
an
asset
and
net
variation
margin
payable
is
reflected
as
a
liability
on
the
accompanying
Statement
of
Assets
and
Liabilities.
Credit
default
swaps
are
agreements
where
one
party
(the
protection
buyer)
agrees
to
make
periodic
payments
to
another
party
(the
protection
seller)
in
exchange
for
protection
against
specified
credit
events,
such
as
certain
defaults
and
bankruptcies
related
to
an
underlying
credit
instrument,
or
issuer
or
index
of
such
instruments.
Upon
occurrence
of
a
specified
credit
event,
the
protection
seller
is
required
to
pay
the
buyer
the
difference
between
the
notional
amount
of
the
swap
and
the
value
of
the
underlying
credit,
either
in
the
form
of
a
net
cash
settlement
or
by
paying
the
gross
notional
amount
and
accepting
delivery
of
the
relevant
underlying
credit.
For
credit
default
swaps
where
the
underlying
credit
is
an
index,
a
specified
credit
event
may
affect
all
or
individual
underlying
securities
included
in
the
index
and
will
be
settled
based
upon
the
relative
weighting
of
the
affected
underlying
security(ies)
within
the
index. Generally,
the
payment
risk
for
the
seller
of
protection
is
inversely
related
to
the
current
market
price
or
credit
rating
of
the
underlying
credit
or
the
market
value
of
the
contract
relative
to
the
notional
amount,
which
are
indicators
of
the
markets’
valuation
of
credit
quality.
As
of
December
31,
2024,
the
notional
amount
of
protection
sold
by
the
fund
totaled $52,500,000
(1.1%
of
net
assets),
which
reflects
the
maximum
potential
amount
the
fund
could
be
required
to
pay
under
such
contracts.
Risks
related
to
the
use
of
credit
default
swaps
include
the
possible
inability
of
the
fund
to
accurately
assess
the
current
and
future
creditworthiness
of
underlying
issuers,
the
possible
failure
of
a
counterparty
to
perform
in
accordance
with
the
terms
of
the
swap
agreements,
potential
government
regulation
that
could
adversely
affect
the
fund’s
swap
investments,
and
potential
losses
in
excess
of
the
fund’s
initial
investment.
During
the
year ended
December
31,
2024,
the
volume
of
the
fund’s
activity
in
swaps,
based
on
underlying
notional
amounts,
was
generally
between
0%
and
2%
of
net
assets.
NOTE
4
-
OTHER
INVESTMENT
TRANSACTIONS
Consistent
with
its
investment
objective, the
fund
engages
in
the
following
practices
to
manage
exposure
to
certain
risks
and/or
to
enhance
performance.
The
investment
objective,
policies,
program,
and
risk
factors
of the
fund
are
described
more
fully
in the
fund’s prospectus
and
Statement
of
Additional
Information.
Emerging
and
Frontier
Markets
The fund
invests,
either
directly
or
through
investments
in
other
T.
Rowe
Price
funds,
in
securities
of
companies
located
in,
issued
by
governments
of,
or
denominated
in
or
linked
to
the
currencies
of
emerging
and
frontier
market
countries.
Emerging
markets,
and
to
a
greater
extent
frontier
markets, tend
to
have
economic
structures
that
are
less
diverse
and
mature,
less
developed
legal
and
regulatory
regimes,
and
political
systems
that
are
less
stable,
than
those
of
developed
countries.
These
markets
may
be
subject
to
greater
political,
economic,
and
social
uncertainty
and
differing
accounting
standards
and
regulatory
environments
that
may
potentially
impact
the
fund’s
ability
to
buy
or
sell
certain
securities
or
repatriate
proceeds
to
U.S.
dollars.
Emerging
markets
securities
exchanges
are
more
likely
to
experience
delays
with
the
clearing
and
settling
of
trades,
as
well
as
the
custody
of
holdings
by
local
banks,
agents,
and
depositories.
Such
securities
are
often
subject
to
greater
price
volatility,
less
liquidity,
and
higher
rates
of
inflation
than
U.S.
securities.
Investing
in
frontier
markets
is
typically
significantly
riskier
than
investing
in
other
countries,
including
emerging
markets.
Restricted
Securities
The
fund
invests
in
securities
that
are
subject
to
legal
or
contractual
restrictions
on
resale.
Prompt
sale
of
such
securities
at
an
acceptable
price
may
be
difficult
and
may
involve
substantial
delays
and
additional
costs.
Collateralized
Loan
Obligations
The
fund
invests
in
collateralized
loan
obligations
(CLOs)
which
are
entities
backed
by
a
diversified
pool
of
syndicated
bank
loans.
The
cash
flows
of
the
CLO
can
be
split
into
multiple
segments,
called
“tranches”
or
“classes”,
which
will
vary
in
risk
profile
and
yield.
The
riskiest
segments,
which
are
the
subordinate
or
“equity”
tranches,
bear
the
greatest
risk
of
loss
from
defaults
in
the
underlying
assets
of
the
CLO
and
serve
to
protect
the
other,
more
senior,
tranches.
Senior
tranches
will
typically
have
higher
credit
ratings
and
lower
yields
than
the
securities
underlying
the
CLO.
Despite
the
protection
from
the
more
junior
tranches,
senior
tranches
can
experience
substantial
losses.
Mortgage-Backed
Securities
The
fund
invests
in
mortgage-backed
securities
(MBS
or
pass-through
certificates)
that
represent
an
interest
in
a
pool
of
specific
underlying
mortgage
loans
and
entitle
the
fund
to
the
periodic
payments
of
principal
and
interest
from
those
mortgages.
MBS
may
be
issued
by
government
agencies
or
corporations,
or
private
issuers.
Most
MBS
issued
by
government
agencies
are
guaranteed;
however,
the
degree
of
protection
differs
based
on
the
issuer.
MBS are
sensitive
to
changes
in
economic
conditions
that
affect
the
rate
of
prepayments
and
defaults
on
the
underlying
mortgages;
accordingly,
the
value,
income,
and
related
cash
flows
from
MBS
may
be
more
volatile
than
other
debt
instruments.
TBA
Purchase,
Sale
Commitments
and
Forward
Settling
Mortgage
Obligations
The
fund
enters
into
to-be-announced
(TBA)
purchase
or
sale
commitments
(collectively,
TBA
transactions),
pursuant
to
which
it
agrees
to
purchase
or
sell,
respectively,
mortgage-backed
securities
for
a
fixed
unit
price,
with
payment
and
delivery
at
a
scheduled
future
date
beyond
the
customary
settlement
period
for
such
securities.
With
TBA
transactions,
the
particular
securities
to
be
received
or
delivered
by
the
fund
are
not
identified
at
the
trade
date;
however,
the
securities
must
meet
specified
terms,
including
rate
and
mortgage
term,
and
be
within
industry-accepted
“good
delivery”
standards.
The
fund
may
enter
into
TBA
transactions
with
the
intention
of
taking
possession
of
or
relinquishing
the
underlying
securities,
may
elect
to
extend
the
settlement
by
“rolling”
the
transaction,
and/or
may
use
TBA
transactions
to
gain
or
reduce
interim
exposure
to
underlying
securities.
To
mitigate
counterparty
risk,
the
fund
has
entered
into
Master
Securities
Forward
Transaction
Agreements
(MSFTA)
with
counterparties
that
provide
for
collateral
and
the
right
to
offset
amounts
due
to
or
from
those
counterparties
under
specified
conditions.
Subject
to
minimum
transfer
amounts,
collateral
requirements
are
determined
and
transfers
made
based
on
the
net
aggregate
unrealized
gain
or
loss
on
all
TBA
commitments
and
other
forward
settling
mortgage
obligations
with
a
particular
counterparty
(collectively,
MSFTA
Transactions).
At
any
time,
the
fund’s
risk
of
loss
from
a
particular
counterparty
related
to
its
MSFTA
Transactions
is
the
aggregate
unrealized
gain
on
appreciated
MSFTA
Transactions
in
excess
of
unrealized
loss
on
depreciated
MSFTA
Transactions
and
collateral
received,
if
any,
from
such
counterparty. As
of
December
31,
2024,
no
collateral
was
pledged
by
the
fund
or
counterparties
for
MSFTA
Transactions.
Securities
Lending
The fund
may
lend
its
securities
to
approved
borrowers
to
earn
additional
income.
Its
securities
lending
activities
are
administered
by
a
lending
agent
in
accordance
with
a
securities
lending
agreement.
Security
loans
generally
do
not
have
stated
maturity
dates,
and
the
fund
may
recall
a
security
at
any
time.
The
fund
receives
collateral
in
the
form
of
cash
or
U.S.
government
securities.
Collateral
is
maintained
over
the
life
of
the
loan
in
an
amount
not
less
than
the
value
of
loaned
securities;
any
additional
collateral
required
due
to
changes
in
security
values
is
delivered
to
the
fund
the
next
business
day.
Cash
collateral
is
invested
in
accordance
with
investment
guidelines
approved
by
fund
management.
Additionally,
the
lending
agent
indemnifies
the
fund
against
losses
resulting
from
borrower
default.
Although
risk
is
mitigated
by
the
collateral
and
indemnification,
the
fund
could
experience
a
delay
in
recovering
its
securities
and
a
possible
loss
of
income
or
value
if
the
borrower
fails
to
return
the
securities,
collateral
investments
decline
in
value,
and
the
lending
agent
fails
to
perform.
Securities
lending
revenue
consists
of
earnings
on
invested
collateral
and
borrowing
fees,
net
of
any
rebates
to
the
borrower,
compensation
to
the
lending
agent,
and
other
administrative
costs.
In
accordance
with
GAAP,
investments
made
with
cash
collateral
are
reflected
in
the
accompanying
financial
statements,
but
collateral
received
in
the
form
of
securities
is
not.
At
December
31,
2024,
the
value
of
loaned
securities
was
$46,243,000;
the
value
of
cash
collateral
and
related
investments
was
$47,683,000.
Other
Purchases
and
sales
of
portfolio
securities
other
than
in-kind
transactions,
if
any, short-term
and
U.S.
government securities
aggregated $1,090,711,000 and
$1,286,468,000,
respectively,
for
the
year ended
December
31,
2024. Purchases
and
sales
of
U.S.
government
securities
aggregated $691,153,000 and
$677,982,000,
respectively,
for
the
year ended
December
31,
2024.
NOTE
5
-
FEDERAL
INCOME
TAXES
Generally,
no
provision
for
federal
income
taxes
is
required
since
the
fund
intends
to continue
to
qualify
as
a
regulated
investment
company
under
Subchapter
M
of
the
Internal
Revenue
Code
and
distribute
to
shareholders
all
of
its taxable
income
and
gains.
Distributions
determined
in
accordance
with
federal
income
tax
regulations
may
differ
in
amount
or
character
from
net
investment
income
and
realized
gains
for
financial
reporting
purposes.
The
fund
files
U.S.
federal,
state,
and
local
tax
returns
as
required.
The
fund’s
tax
returns
are
subject
to
examination
by
the
relevant
tax
authorities
until
expiration
of
the
applicable
statute
of
limitations,
which
is
generally
three
years
after
the
filing
of
the
tax
return
but
which
can
be
extended
to
six
years
in
certain
circumstances.
Tax
returns
for
open
years
have
incorporated
no
uncertain
tax
positions
that
require
a
provision
for
income
taxes.
Capital
accounts
within
the
financial
reporting
records
are
adjusted
for
permanent
book/tax
differences
to
reflect
tax
character
but
are
not
adjusted
for
temporary
differences.
The
permanent
book/tax
adjustments,
if
any,
have
no
impact
on
results
of
operations
or
net
assets.
The
permanent
book/tax
adjustments
relate
primarily
to
deemed
distributions
on
shareholder
redemptions.
The
tax
character
of
distributions
paid
for
the
periods
presented
was
as
follows:
At
December
31,
2024,
the
tax-basis
cost
of
investments
(including
derivatives,
if
any)
and
gross
unrealized
appreciation
and
depreciation
were as
follows:
($000s)
December
31,
2024
December
31,
2023
Ordinary
income
(including
short-term
capital
gains,
if
any)
$
110,666
$
91,897
Long-term
capital
gain
213,368
74,761
Total
distributions
$
324,034
$
166,658
($000s)
Cost
of
investments
$
3,332,928
Unrealized
appreciation
$
1,582,972
Unrealized
depreciation
(255,374)
Net
unrealized
appreciation
(depreciation)
$
1,327,598
At
December
31,
2024,
the
tax-basis
components
of
accumulated
net
earnings
(loss)
were
as
follows:
Temporary
differences
between
book-basis
and
tax-basis
components
of
total
distributable
earnings
(loss)
arise
when
certain
items
of
income,
gain,
or
loss
are
recognized
in
different
periods
for
financial
statement
purposes
versus
for
tax
purposes;
these
differences
will
reverse
in
a
subsequent
reporting
period.
The
temporary
differences
relate
primarily
to
the
deferral
of
losses
from
wash
sales
and
the
realization
of
gains/losses
on
passive
foreign
investment
companies.
NOTE
6
-
FOREIGN TAXES
The
fund
is
subject
to
foreign
income
taxes
imposed
by
certain
countries
in
which
it
invests.
Additionally,
capital
gains
realized
upon
disposition
of
securities
issued
in
or
by
certain
foreign
countries
are
subject
to
capital
gains
tax
imposed
by
those
countries.
All
taxes
are
computed
in
accordance
with
the
applicable
foreign
tax
law,
and,
to
the
extent
permitted,
capital
losses
are
used
to
offset
capital
gains.
Taxes
attributable
to
income
are
accrued
by
the
fund
as
a
reduction
of
income.
Current
and
deferred
tax
expense
attributable
to
capital
gains
is
reflected
as
a
component
of
realized
or
change
in
unrealized
gain/
loss
on
securities
in
the
accompanying
financial
statements.
To
the
extent
that
the
fund
has
country
specific
capital
loss
carryforwards,
such
carryforwards
are
applied
against
net
unrealized
gains
when
determining
the
deferred
tax
liability.
Any
deferred
tax
liability
incurred
by
the
fund
is
included
in
either
Other
liabilities
or
Deferred
tax
liability
on
the
accompanying
Statement
of
Assets
and
Liabilities.
($000s)
Undistributed
long-term
capital
gain
$
39,295
Net
unrealized
appreciation
(depreciation)
1,327,598
Total
distributable
earnings
(loss)
$
1,366,893
NOTE
7
-
RELATED
PARTY
TRANSACTIONS
The
fund
is
managed
by
T.
Rowe
Price
Associates,
Inc.
(Price
Associates),
a
wholly
owned
subsidiary
of
T.
Rowe
Price
Group,
Inc.
(Price
Group). Price
Associates
has
entered
into
a
sub-advisory
agreement(s)
with
one
or
more
of
its
wholly
owned
subsidiaries,
to
provide
investment
advisory
services
to
the
fund.
The
investment
management
agreement
between
the
fund
and
Price
Associates
provides
for
an
annual
investment
management
fee,
which
is
computed
daily
and
paid
monthly. The
fee
consists
of
an
individual
fund
fee,
equal
to
0.15%
of
the
fund’s
average
daily
net
assets,
and
a
group
fee.
The
group
fee
rate
is
calculated
based
on
the
combined
net
assets
of
certain
mutual
funds
sponsored
by
Price
Associates
(the
group)
applied
to
a
graduated
fee
schedule,
with
rates
ranging
from
0.48%
for
the
first
$1
billion
of
assets
to
0.260%
for
assets
in
excess
of
$845
billion.
The
fund’s
group
fee
is
determined
by
applying
the
group
fee
rate
to
the
fund’s
average
daily
net
assets. At
December
31,
2024,
the
effective
annual
group
fee
rate
was
0.28%.
The Investor
Class is
subject
to
a
contractual
expense
limitation
through
the
expense
limitation
date
indicated
in
the
table
below.
This
agreement
will
continue
through
the
expense
limitation
date
indicated
in
the
table
below,
and
may
be
renewed,
revised,
or
revoked
only
with
approval
of
the
fund’s
Board.
During
the
limitation
period,
Price
Associates
is required
to
waive
or
pay
any
expenses
(excluding
interest;
expenses
related
to
borrowings,
taxes,
and
brokerage;
non-recurring,
extraordinary
expenses;
and
acquired
fund
fees
and
expenses)
that
would
otherwise
cause
the class’s ratio
of
annualized
total
expenses
to
average
net
assets
(net
expense
ratio)
to
exceed
its
expense
limitation.
The
class
is
required
to
repay
Price
Associates
for
expenses
previously
waived/paid
to
the
extent
the
class’s net
assets
grow
or
expenses
decline
sufficiently
to
allow
repayment
without
causing
the class’s net
expense
ratio
(after
the
repayment
is
taken
into
account)
to
exceed
the
lesser
of:
(1)
the
expense
limitation
in
place
at
the
time
such
amounts
were
waived;
or
(2)
the class’s
current
expense
limitation.
However,
no
repayment
will
be
made
more
than
three
years
after
the
date
of
a
payment
or
waiver.
The
I
Class
is
also
subject
to
an
operating
expense
limitation
(I
Class
Limit)
pursuant
to
which
Price
Associates
is
contractually
required
to
pay
all
operating
expenses
of
the
I
Class,
excluding
management
fees;
interest;
expenses
related
to
borrowings,
taxes,
and
brokerage; non-recurring,
extraordinary expenses; and
acquired
fund
fees
and
expenses, to
the
extent
such
operating
expenses,
on
an
annualized
basis,
exceed
the
I
Class
Limit. This
agreement
will
continue
through
the
expense
limitation
date
indicated
in
the
table
below,
and
may
be
renewed,
revised,
or
revoked
only
with
approval
of
the
fund’s
Board.
The
I
Class
is
required
to
repay
Price
Associates
for
expenses
previously
paid
to
the
extent
the
class’s
net
assets
grow
or
expenses
decline
sufficiently
to
allow
repayment
without
causing
the
class’s
operating
expenses
(after
the
repayment
is
taken
into
account)
to
exceed
the
lesser
of:
(1)
the
I
Class
Limit
in
place
at
the
time
such
amounts
were
paid;
or
(2)
the
current
I
Class
Limit.
However,
no
repayment
will
be
made
more
than
three
years
after
the
date
of
a
payment
or
waiver.
In
addition,
the
fund
has
entered
into
service
agreements
with
Price
Associates
and
two
wholly
owned
subsidiaries
of
Price
Associates,
each
an
affiliate
of
the
fund
(collectively,
Price).
Price
Associates
provides
certain
accounting
and
administrative
services
to
the
fund.
T.
Rowe
Price
Services,
Inc.
provides
shareholder
and
administrative
services
in
its
capacity
as
the
fund’s
transfer
and
dividend-disbursing
agent.
T.
Rowe
Price
Retirement
Plan
Services,
Inc.
provides
subaccounting
and
recordkeeping
services
for
certain
retirement
accounts
invested
in
the
Investor
Class.
For
the
year
ended
December
31,
2024,
expenses
incurred
pursuant
to
these
service
agreements
were
$119,000
for
Price
Associates;
$1,872,000
for
T.
Rowe
Price
Services,
Inc.;
and
$909,000
for
T.
Rowe
Price
Retirement
Plan
Services,
Inc.
All
amounts
due
to
and
due
from
Price,
exclusive
of
investment
management
fees
payable,
are
presented
net
on
the
accompanying
Statement
of
Assets
and
Liabilities.
T.
Rowe
Price
Investment
Services,
Inc.
(Investment
Services)
serves
as
distributor
to
the
fund.
Pursuant
to
an
underwriting
agreement,
no
compensation
for
any
distribution
services
provided
is
paid
to
Investment
Services
by
the
fund
(except
for
12b-1
fees
under
a
Board-approved
Rule
12b-1
plan).
The fund
may
invest
its
cash
reserves
in
certain
open-end
management
investment
companies
managed
by
Price
Associates
and
considered
affiliates
of
the
fund:
the
T.
Rowe
Price
Government
Reserve
Fund
or
the
T.
Rowe
Price
Treasury
Reserve
Fund,
organized
as
money
market
funds
(together,
the
Price
Reserve
Funds).
The
Price
Reserve
Funds
are
offered
as
short-term
investment
options
to
mutual
funds,
trusts,
and
other
accounts
managed
by
Price
Associates
or
its
affiliates
and
are
not
available
for
direct
purchase
by
members
Investor
Class
I
Class
Expense
limitation/I
Class
Limit
0.79%
0.05%
Repayment
date
04/30/26
04/30/26
(Waived)/repaid
during
the
period
($000s)
$—
$—
of
the
public.
Cash
collateral
from
securities
lending,
if
any,
is
invested
in
the
T.
Rowe
Price
Government
Reserve Fund. The
Price
Reserve
Funds
pay
no
investment
management
fees.
The
fund
may
also
invest
in
certain
other
T.
Rowe
Price
funds
(Price
Funds)
as
a
means
of
gaining
efficient
and
cost-effective
exposure
to
certain
markets.
The
fund
does
not
invest
for
the
purpose
of
exercising
management
or
control;
however,
investments
by
the
fund
may
represent
a
significant
portion
of
an
underlying
Price
Fund’s
net
assets.
Each
underlying
Price
Fund
is
an
open-
end
management
investment
company
managed
by
Price
Associates
and
is
considered
an
affiliate
of
the
fund.
To
ensure
that
the
fund
does
not
incur
duplicate
management
fees
(paid
by
the
underlying
Price
Fund(s)
and
the
fund),
Price
Associates
has
agreed
to
permanently
waive
a
portion
of
its
management
fee
charged
to
the
fund
in
an
amount
sufficient
to
fully
offset
that
portion
of
management
fees
paid
by
each
underlying
Price
Fund
related
to
the
fund’s
investment
therein.
Annual
management
fee
rates
and
amounts
waived
related
to
investments
in
the
underlying
Price
Fund(s)
for
the
year
ended
December
31,
2024,
are
as
follows:
Total
management
fee
waived
was
allocated
ratably
in
the
amounts
of
$1,299,000
and
$1,035,000 for
the
Investor
Class
and
I
Class,
respectively,
for
the
year ended
December
31,
2024.
The fund may
participate
in
securities
purchase
and
sale
transactions
with
other
funds
or
accounts
advised
by
Price
Associates
(cross
trades),
in
accordance
with
procedures
adopted
by the
fund’s
Board
and
Securities
and
Exchange
Commission
rules,
which
require,
among
other
things,
that
such
purchase
and
sale
cross
trades
be
effected
at
the
independent
current
market
price
of
the
($000s)
Effective
Management
Fee
Rate
Management
Fee
Waived
T.
Rowe
Price
Inflation
Protected
Bond
Fund
-
I
Class
0.17%
$
15
T.
Rowe
Price
Institutional
High
Yield
Fund
-
Institutional
Class
0.50%
1,050
T.
Rowe
Price
Limited
Duration
Inflation
Focused
Bond
Fund
-
I
Class
0.25%
23
T.
Rowe
Price
Real
Assets
Fund
-
I
Class
0.64%
1,246
Total
Management
Fee
Waived
$
2,334
security.
During
the
year
ended
December
31,
2024,
the
aggregate
value
of
purchases
and
sales
cross
trades
with
other
funds
or
accounts
advised
by
Price
Associates
was
less
than
1%
of
the
fund’s
net
assets
as
of
December
31,
2024.
NOTE
8
-
SEGMENT
REPORTING
Operating
segments
are
defined
as
components
of
a
company
that
engage
in
business
activities
and
for
which
discrete
financial
information
is
available
and
regularly
reviewed
by
the
chief
operating
decision
maker
(CODM)
in
deciding
how
to
allocate
resources
and
assess
performance.
The
Management
Committee
of
Price
Associates
acts
as
the
fund’s
CODM.
The
fund
makes
investments
in
accordance
with
its
investment
objective
as
outlined
in
the
Prospectus
and
is
considered
one
reportable
segment
because
the
CODM
allocates
resources
and
assesses
the
operating
results
of
the
fund
on
the
whole.
The
fund’s
revenue
is
derived
from
investments
in
portfolio
of
securities.
The
CODM
allocates
resources
and
assesses
performance
based
on
the
operating
results
of
the
fund,
which
is
consistent
with
the
results
presented
in
the
statement
of
operations,
statement
of
changes
in
net
assets
and
financial
highlights.
The
CODM
compares
the
fund’s
performance
to
its
benchmark
index
and
evaluates
the
positioning
of
the
fund
in
relation
to
its
investment
objective.
The
measure
of
segment
assets
is
net
assets
of
the
fund
which
is
disclosed
in
the
statement
of
assets
and
liabilities.
The
accounting
policies
of
the
segment
are
the
same
as
those
described
in
the
summary
of
significant
accounting
policies.
The
financial
statements
include
all
details
of
the
segment
assets,
segment
revenue
and
expenses;
and
reflect
the
financial
results
of
the
segment.
NOTE
9
-
INTERFUND
LENDING
PROGRAM
Price
Associates
has
developed
and
manages
an
interfund
lending
program
that
provides
temporary
liquidity
to
the
T.
Rowe
Price-sponsored
mutual
funds.
The
program
permits
the
borrowing
and
lending
of
cash
between
the
fund
and
other
T.
Rowe
Price-sponsored
mutual
funds
at
rates
beneficial
to
both
the
borrowing
and
lending
funds.
Pursuant
to
program
guidelines,
the
fund
may
lend
up
to
15%
of
its
net
assets,
and
no
more
than
5%
of
its
net
assets
may
be
lent
to
any
one
borrower.
Loans
totaling
10%
or
more
of
a
borrowing
fund’s
total
assets
require
collateralization
at
102%
of
the
value
of
the
loan;
loans
of
less
than
10%
are
unsecured.
During
the
year ended
December
31,
2024,
the
fund
earned $2,000
in
interest
income
related
to
loans
made
to
other
funds
on
one day
in
the
average
amount
of
$11,400,000
and
at
an
average
annual
rate
of
6.93%.
At
December
31,
2024,
there
were
no
loans
outstanding.
NOTE
10
-
OTHER
MATTERS
Unpredictable environmental,
political,
social
and
economic
events,
including
but
not
limited
to,
environmental
or
natural
disasters,
war
and
conflict
(including
Russia’s
military
invasion
of
Ukraine
and
the
conflict
in
Israel,
Gaza
and
surrounding
areas),
terrorism,
geopolitical
developments
(including
trading
and
tariff
arrangements,
sanctions
and
cybersecurity
attacks),
and
public
health
epidemics
(including
the
global
outbreak
of
COVID-19)
and
similar
public
health
threats,
may
significantly
affect
the
economy
and
the
markets
and
issuers
in
which
a
fund
invests.
The
extent
and
duration
of
such
events
and
resulting
market
disruptions
cannot
be
predicted.
These
and
other
similar
events
may
cause
instability
across
global
markets,
including
reduced
liquidity
and
disruptions
in
trading
markets,
while
some
events
may
affect
certain
geographic
regions,
countries,
sectors,
and
industries
more
significantly
than
others,
and
exacerbate
other
pre-existing
political,
social,
and
economic
risks.
The
fund’s
performance
could
be
negatively
impacted
if
the
value
of
a
portfolio
holding
were
harmed
by
these
or
such
events.
Management
actively
monitors
the
risks
and
financial
impacts
arising
from
such
events.
REPORT
OF
INDEPENDENT
REGISTERED
PUBLIC
ACCOUNTING
FIRM
To
the
Board
of
Directors
and
Shareholders
of
T.
Rowe
Price
Balanced
Fund,
Inc.
Opinion
on
the
Financial
Statements
We
have
audited
the
accompanying
statement
of
assets
and
liabilities,
including
the
portfolio
of
investments,
of
T.
Rowe
Price
Balanced
Fund,
Inc.
(the
"Fund")
as
of
December
31,
2024,
the
related
statement
of
operations
for
the
year
ended
December
31,
2024,
the
statement
of
changes
in
net
assets
for
each
of
the
two
years
in
the
period
ended
December
31,
2024,
including
the
related
notes,
and
the
financial
highlights
for
each
of
the
five
years
in
the
period
ended
December
31,
2024
(collectively
referred
to
as
the
“financial
statements”).
In
our
opinion,
the
financial
statements
present
fairly,
in
all
material
respects,
the
financial
position
of
the
Fund
as
of
December
31,
2024,
the
results
of
its
operations
for
the
year
then
ended,
the
changes
in
its
net
assets
for
each
of
the
two
years
in
the
period
ended
December
31,
2024
and
the
financial
highlights
for
each
of
the
five
years
in
the
period
ended
December
31,
2024
in
conformity
with
accounting
principles
generally
accepted
in
the
United
States
of
America.
Basis
for
Opinion
These
financial
statements
are
the
responsibility
of
the
Fund’s
management.
Our
responsibility
is
to
express
an
opinion
on
the
Fund’s
financial
statements
based
on
our
audits.
We
are
a
public
accounting
firm
registered
with
the
Public
Company
Accounting
Oversight
Board
(United
States)
(PCAOB)
and
are
required
to
be
independent
with
respect
to
the
Fund
in
accordance
with
the
U.S.
federal
securities
laws
and
the
applicable
rules
and
regulations
of
the
Securities
and
Exchange
Commission
and
the
PCAOB.
We
conducted
our
audits
of
these
financial
statements
in
accordance
with
the
standards
of
the
PCAOB.
Those
standards
require
that
we
plan
and
perform
the
audit
to
obtain
reasonable
assurance
about
whether
the
financial
statements
are
free
of
material
misstatement,
whether
due
to
error
or
fraud.
Our
audits
included
performing
procedures
to
assess
the
risks
of
material
misstatement
of
the
financial
statements,
whether
due
to
error
or
fraud,
and
performing
procedures
that
respond
to
those
risks.
Such
procedures
included
examining,
on
a
test
basis,
evidence
regarding
the
amounts
and
disclosures
in
the
financial
statements.
Our
audits
also
included
evaluating
the
accounting
principles
used
and
significant
estimates
made
by
management,
as
well
as
evaluating
the
overall
presentation
of
the
financial
statements.
Our
procedures
included
confirmation
of
securities
owned
as
of
December
31,
2024
by
correspondence
with
the
custodians,
transfer
agent
and
brokers;
when
replies
were
not
received
from
brokers,
we
performed
other
auditing
procedures.
We
believe
that
our
audits
provide
a
reasonable
basis
for
our
opinion.
/s/
PricewaterhouseCoopers
LLP
Baltimore,
Maryland
February
18,
2025
We
have
served
as
the
auditor
of
one
or
more
investment
companies
in
the
T.
Rowe
Price
group
of
investment
companies
since
1973.
REPORT
OF
INDEPENDENT
REGISTERED
PUBLIC
ACCOUNTING
FIRM
(continued)
TAX
INFORMATION
(UNAUDITED)
FOR
THE
TAX
YEAR
ENDED 12/31/24
We
are
providing
this
information
as
required
by
the
Internal
Revenue
Code.
The
amounts
shown
may
differ
from
those
elsewhere
in
this
report
because
of
differences
between
tax
and
financial
reporting
requirements.
The
fund’s
distributions
to
shareholders
included:
$229,937,000
from
long-term
capital
gains,
subject
to
a
long-term
capital
gains
tax
rate
of
not
greater
than
20%
For
nonresident
alien
shareholders,
100%
of
short-term
capital
gain
dividends
distributed
by
the
fund
for
the
fiscal
year
are
qualified
short-term
capital
gains.
For
taxable
non-corporate
shareholders,
$43,644,000
of
the
fund's
income
represents
qualified
dividend
income
subject
to
a
long-term
capital
gains
tax
rate
of
not
greater
than
20%.
For
corporate
shareholders,
$20,765,000
of
the
fund's
income
qualifies
for
the
dividends-received
deduction.
For
shareholders
subject
to
interest
expense
deduction
limitation
under
Section
163(j),
$55,756,000
of
the
fund’s
income
qualifies
as
a
Section
163(j)
interest
dividend
and
can
be
treated
as
interest
income
for
purposes
of
Section
163(j),
subject
to
holding
period
requirements
and
other
limitations.
For
individuals
and
certain
trusts
and
estates
which
are
entitled
to
claim
a
deduction
of
up
to
20%
of
their
combined
qualified
real
estate
investment
trust
(REIT)
dividends,
$2,235,000
of
the
fund's
income
qualifies
as
qualified
real
estate
investment
trust
(REIT)
dividends.
100
East
Pratt
Street
Baltimore,
MD
21202
T.
Rowe
Price
Investment
Services,
Inc.
Call
1-800-225-5132
to
request
a
prospectus
or
summary
prospectus;
each
includes
investment
objectives,
risks,
fees,
expenses,
and
other
information
that
you
should
read
and
consider
carefully
before
investing.
F68-050
2/25
Item 8. Changes in and Disagreements with Accountants for Open-End Management Investment Companies.
Not applicable.
Item 9. Proxy Disclosures for Open-End Management Investment Companies.
Not applicable.
Item 10. Remuneration Paid to Directors, Officers, and Others of Open-End Management Investment Companies.
Remuneration paid to Directors is included in Item 7 of this Form N-CSR.
Item 11. Statement Regarding Basis for Approval of Investment Advisory Contract.
If applicable, see Item 7.
Item 12. Disclosure of Proxy Voting Policies and Procedures for Closed-End Management Investment Companies.
Not applicable.
Item 13. Portfolio Managers of Closed-End Management Investment Companies.
Not applicable.
Item 14. Purchases of Equity Securities by Closed-End Management Investment Company and Affiliated Purchasers.
Not applicable.
Item 15. Submission of Matters to a Vote of Security Holders.
There has been no change to the procedures by which shareholders may recommend nominees to the registrant’s board of directors.
Item 16. Controls and Procedures.
(a) The registrant’s principal executive officer and principal financial officer have evaluated the registrant’s disclosure controls and procedures within 90 days of this filing and have concluded that the registrant’s disclosure controls and procedures were effective, as of that date, in ensuring that information required to be disclosed by the registrant in this Form N-CSR was recorded, processed, summarized, and reported timely.
(b) The registrant’s principal executive officer and principal financial officer are aware of no change in the registrant’s internal control over financial reporting that occurred during the period covered by this report that has materially affected, or is reasonably likely to materially affect, the registrant’s internal control over financial reporting.
Item 17. Disclosure of Securities Lending Activities for Closed-End Management Investment Companies.
Not applicable.
Item 18. Recovery of Erroneously Awarded Compensation.
Not applicable.
Item 19. Exhibits.
(a)(1) The registrant’s code of ethics pursuant to Item 2 of Form N-CSR is attached.
(2) Listing standards relating to recovery of erroneously awarded compensation: not applicable.
(3) Separate certifications by the registrant’s principal executive officer and principal financial officer, pursuant to Section 302 of the Sarbanes-Oxley Act of 2002 and required by Rule 30a-2(a) under the Investment Company Act of 1940, are attached.
(b) A certification by the registrant’s principal executive officer and principal financial officer, pursuant to Section 906 of the Sarbanes-Oxley Act of 2002 and required by Rule 30a-2(b) under the Investment Company Act of 1940, is attached.
SIGNATURES
Pursuant to the requirements of the Securities Exchange Act of 1934 and the Investment Company Act of 1940, the registrant has duly caused this report to be signed on its behalf by the undersigned, thereunto duly authorized.
| | | | |
T. Rowe Price Balanced Fund, Inc. |
By | | /s/ David Oestreicher | | |
| | David Oestreicher | | |
| | Principal Executive Officer | | |
| | |
Date | | February 18, 2025 | | |
Pursuant to the requirements of the Securities Exchange Act of 1934 and the Investment Company Act of 1940, this report has been signed below by the following persons on behalf of the registrant and in the capacities and on the dates indicated.
| | | | |
By | | /s/ David Oestreicher | | |
| | David Oestreicher | | |
| | Principal Executive Officer | | |
| | |
Date | | February 18, 2025 | | |
| | | | |
By | | /s/ Alan S. Dupski | | |
| | Alan S. Dupski | | |
| | Principal Financial Officer | | |
| | |
Date | | February 18, 2025 | | |