UNITED STATES
SECURITIES AND EXCHANGE COMMISSION
Washington, D.C. 20549
FORM N-CSR
CERTIFIED SHAREHOLDER REPORT OF REGISTERED
MANAGEMENT INVESTMENT COMPANIES
Investment Company Act File Number: 811-06275
| T. Rowe Price Balanced Fund, Inc. |
| (Exact name of registrant as specified in charter) |
| 100 East Pratt Street, Baltimore, MD 21202 |
| (Address of principal executive offices) |
| David Oestreicher |
| 100 East Pratt Street, Baltimore, MD 21202 |
| (Name and address of agent for service) |
Registrant’s telephone number, including area code: (410) 345-2000
Date of fiscal year end: December 31
Date of reporting period: June 30, 2012
Item 1. Report to Shareholders
 |
| Balanced Fund | June 30, 2012 |
The views and opinions in this report were current as of June 30, 2012. They are not guarantees of performance or investment results and should not be taken as investment advice. Investment decisions reflect a variety of factors, and the managers reserve the right to change their views about individual stocks, sectors, and the markets at any time. As a result, the views expressed should not be relied upon as a forecast of the fund’s future investment intent. The report is certified under the Sarbanes-Oxley Act, which requires mutual funds and other public companies to affirm that, to the best of their knowledge, the information in their financial reports is fairly and accurately stated in all material respects.
REPORTS ON THE WEB
Sign up for our E-mail Program, and you can begin to receive updated fund reports and prospectuses online rather than through the mail. Log in to your account at troweprice.com for more information.
Manager’s Letter
Fellow Shareholders
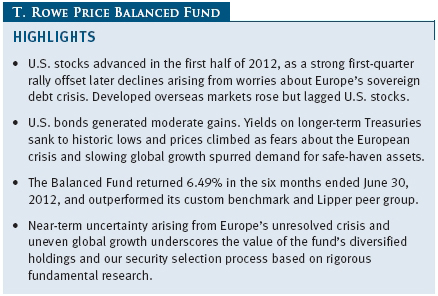
U.S. stocks gained in the first half of 2012, driven entirely by a strong first-quarter rally as the U.S. economy strengthened and European leaders took steps to contain the region’s debt crisis. Stocks pared some of their gains in the second quarter, however, as the eurozone crisis entered a new phase centered on Spain and global economic data weakened. U.S. bonds advanced, supported by long-term U.S. Treasuries, as Europe’s turmoil and uncertainty about the global outlook spurred demand for more conservative assets. Outside the U.S., stocks in developed markets rose modestly due to strength in Asia and most of Europe but fell sharply in some troubled peripheral eurozone countries.
PERFORMANCE REVIEW
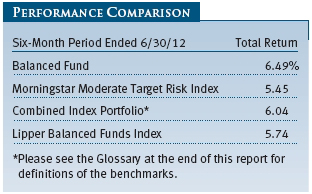
The Balanced Fund returned 6.49% for the six months ended June 30, 2012. As shown in the Performance Comparison table, the fund exceeded both the combined index portfolio and the Lipper peer group. The combined index portfolio is composed of multiple indexes representing the broad asset classes in which the Balanced Fund invests.
Our holdings in U.S. large-cap growth stocks and non-U.S. developed market stocks accounted for most of the fund’s outperformance versus the benchmark, while our positioning in investment-grade bonds also lifted relative returns. Conversely, our holdings in domestic large-cap value stocks weighed on relative performance. Among the sectors not held in the benchmark, our allocation to high yield bonds helped relative results, but was offset by our holdings in real assets stocks.
MARKET ENVIRONMENT
U.S. stocks rallied sharply in the first quarter as the economy showed signs of improvement and European leaders made progress in containing the region’s debt crisis. However, the tenor of economic news turned more negative in the spring. After growing strongly in the first quarter, monthly jobs growth from April to June weakened and the unemployment rate remained stuck at 8.2%, reinforcing other indicators suggesting that the U.S. recovery was losing steam. Investors also grew anxious about a slowdown in China, where data increasingly showed that the world’s second-largest economy was cooling after decades of rapid growth. The S&P 500 rose to its highest level in almost four years on April 2, 2012, but erased most of its year-to-date gains by June 1 before clawing its way higher by month-end amid heightened anxiety about the global outlook.
Europe’s fiscal problems continued to dominate investor sentiment. The worsening debt crisis upended the political landscape in several countries and reignited worries about a disorderly Greek default and the survival of the currency zone. By the end of our reporting period, Spain sought a bailout for its troubled banks, Greece voted for a party committed to staying in the euro and forming a coalition government, and European leaders at the end of June agreed on new measures to contain the crisis. The latest summit produced some positive steps toward closer economic integration, but once again left many details unaddressed and failed to resolve fundamental problems facing the eurozone. Most European markets produced decent returns, but stock markets in Greece, Italy, Spain, and Portugal fell as they struggled with recession and austerity measures. Developed Asian markets rose.

U.S. bonds generated moderate gains in the year’s first half. In the investment-grade universe, corporate bonds did very well, and longer-term Treasuries also posted solid gains as growing global uncertainty spurred investors to seek refuge in U.S. government debt. In June, the Federal Reserve said it would extend until year-end a stimulus program aimed at suppressing long-term interest rates by selling short-term securities and using the proceeds to buy longer-term securities. The extension of the program, known as Operation Twist, helped sustain demand for longer-dated Treasuries. High yield outpaced investment-grade bonds as yield-hungry investors sought greater returns in a low interest rate environment. Outside the U.S., sovereign bonds in developed Europe posted mild gains in dollar terms as the dollar strengthened against the euro and other major currencies.
ASSET ALLOCATION STRATEGY
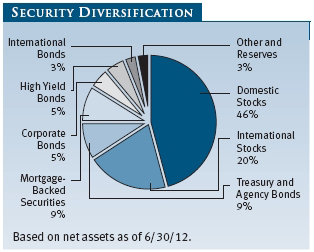
The Balanced Fund seeks to provide capital growth and current income by investing in a combination of U.S. and international stocks and fixed income securities. Our current strategy allocates 65% of the portfolio to stocks and the remaining 35% to bonds. Within stocks, we believe that valuations are reasonable, while the current low-yield environment is less favorable for bond returns. We are neutral between U.S. and non-U.S. stocks. U.S. corporate earnings are healthy and stock prices are attractive compared with their historical levels, though we expect earnings growth will moderate given signs of recent softening in the economy. Additionally, U.S. stocks offer dividend yields that in many cases are competitive with bond yields.
The fund is currently underweight real assets stocks relative to U.S. and international stocks. Real assets include investments that have physical properties such as energy, real estate, commodities, and infrastructure and provide a hedge against inflation. We believe that the muted global outlook will continue to weigh on commodity prices, while consumer price inflation remains subdued, thanks to falling energy prices. For valuation reasons, we prefer growth stocks over value. We believe that the current low-growth environment favors growth stocks, which tend to be less reliant on a strong economy to generate rising corporate earnings.
In the fixed income segment, we continue to favor high yield over investment-grade bonds. Many high yield bond issuers have taken advantage of low interest rates to refinance debt, extend maturities, and shore up their balance sheets. Additionally, yield spreads relative to other sectors remain at attractive levels in the current low-yield environment, particularly given our outlook for a slowly improving economy.
PORTFOLIO REVIEW
Domestic Stocks
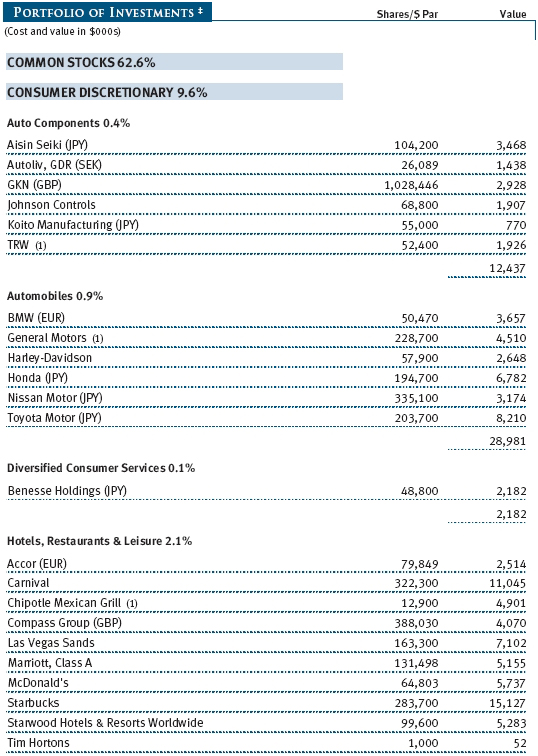
Apple, our largest individual stock holding at the end of June, was by far the top absolute contributor. Apple shares soared 44% in the year’s first half as the company continues to benefit from the widespread appeal of its iPhone, iPad, and other devices. Internet retailer Amazon.com and online travel agency Priceline.com also contributed significantly to absolute returns. Amazon’s shares rallied after it reported surprisingly strong earnings and revenue in April, driven by buoyant demand for its Kindle electronic reading device. Priceline’s stock performed well as international bookings, which account for most of its revenue, remained resilient despite an uncertain global economy. Apple’s rise also lifted AT&T, another large contributor, which continues to benefit from the iPhone’s tremendous commercial success. (Please refer to our portfolio of investments for a complete list of holdings and the amount each represents in the portfolio.)
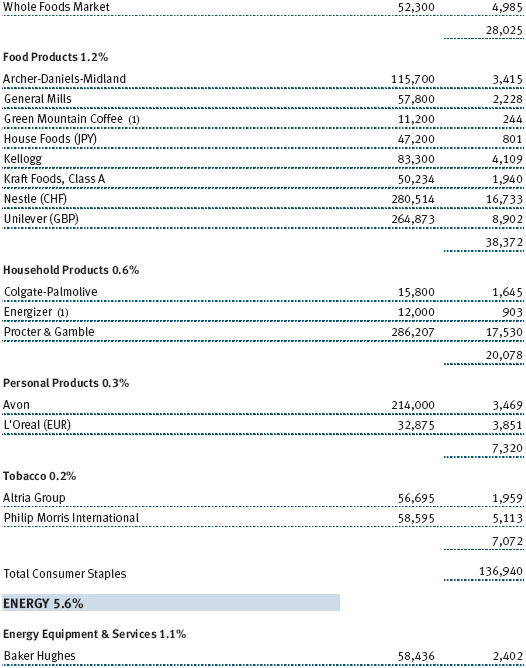
The fund’s biggest absolute decliners spanned a range of sectors. Shares of Procter & Gamble fared poorly as the consumer products maker repeatedly reduced its profit forecasts over the past year, most recently in June, and lost market share. Dell was another poor performer, as the personal computer maker grapples with slowing global PC sales as consumers increasingly buy tablets and smartphones. Exelon, the largest U.S. power producer, was a hefty decliner as falling natural gas prices drove down wholesale electricity prices, which hurt revenue for most domestic power companies. Internet search engine leader Google was the biggest absolute decliner amid concerns about a decline in average price per click, or the amount paid by advertisers each time someone clicks on their online ad.
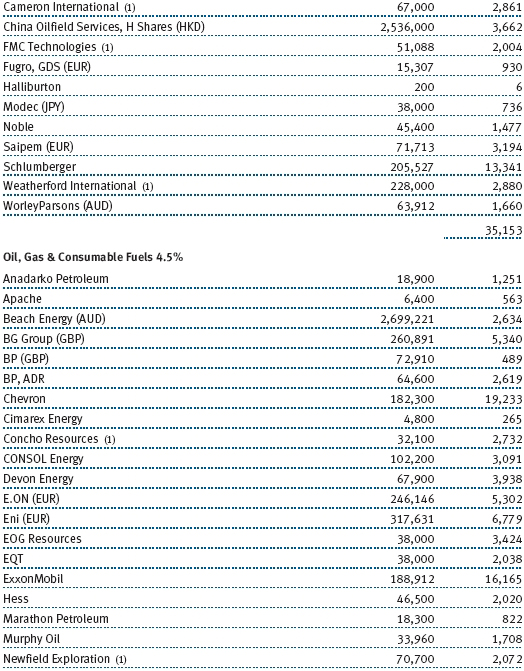
The Real Assets Fund detracted from relative returns. This fund—which invests mostly in assets with physical properties such as energy, commodities, and infrastructure—was weighed by a steep drop in energy prices, particularly oil and natural gas. Many U.S. companies have employed technology to more efficiently extract oil and natural gas in areas around the country through the use of hydraulic fracturing—a drilling technique known as fracking—which has helped push natural gas prices to their lowest level in a decade.
International Stocks
Many of the fund’s top non-U.S. contributors hailed from a variety of sectors. Tencent Holdings, China’s biggest Internet company, was a significant contributor to absolute returns. Tencent shares surged to a record high in May as revenue from online advertising, gaming, and various social networking businesses continued to exceed expectations. SembCorp Industries, a Singaporean industrial group focused on utilities, was another sizable contributor as it posted strong earnings, won new contracts, and expanded in overseas markets. Toyota Motor lifted absolute returns as Japan’s biggest automaker bounced back faster than expected from last year’s supply disruptions due to natural disasters in Japan and Thailand.
Among decliners, many of the fund’s largest non-U.S. detractors were energy names whose shares fell along with their U.S. peers as oil and natural gas prices slumped. Anglo-Dutch oil producer Royal Dutch Shell and Brazilian state-backed oil company Petrobras ranked among the biggest absolute detractors. Australia’s BHP Billiton, the world’s biggest mining company, fared poorly as commodities prices tumbled from last year, when high demand sent prices for many commodities to record levels. Like most miners, BHP is suffering from slumping global demand stemming from China’s economic slowdown, the weak U.S. recovery, and Europe’s ongoing debt crisis. Finally, Tesco was a significant detractor, as the top UK supermarket chain struggled to revitalize business in its home market after losing market share and reporting a string of quarterly sales declines.
As we noted in our annual report last December, we plan to continue gradually increasing the fund’s international equity exposure in the coming months, moving from roughly 20% earlier in 2011 to approximately 30% of its traditional equity allocation. The fund’s domestic equity exposure will decrease, and we will maintain the current overall allocation to stocks and bonds. International developed and emerging market stocks have risen as a percentage of the global equity market and now represent over half of the world market capitalization. These areas often include countries that enjoy faster economic growth rates than the U.S. and companies with greater long-term earnings growth potential or more favorable valuations.
Domestic Bonds
Our investment-grade holdings, particularly in corporate bonds and commercial mortgage-backed securities, contributed to relative performance. Additionally, our exposure to high yield bonds—a segment that is not held in the benchmark—lifted absolute and relative returns. High yield bonds posted strong returns over the past six months as they benefited from healthy demand from investors seeking yield in a low interest rate environment. We continue to favor high yield over investment-grade bonds. Companies issuing high yield bonds exhibit solid fundamentals, with most issuers paying off or refinancing their debt and improving their balance sheets. Default rates have crept higher in recent months, but we expect them to remain below levels reflected in current valuations. We believe that high yield bonds can do well even in a low-growth environment, although they would be challenged if the U.S. were to enter a recession.
OUTLOOK
Our global growth expectations are modest for the next several quarters. We expect the U.S. economy to continue along a course of low growth in an environment of abundant policy uncertainties and weakness abroad. Continued job and income growth remain critical for self-sustained recovery, although recent disappointing jobs data suggest that employers are still reluctant to hire. Global financial markets remain volatile over the uncertainty associated with the European debt crisis, Greece’s potential exit from the euro, and leaders’ incremental approach to policymaking in the region, which allows contagion risk to linger. We believe that risk aversion will remain high and markets will stay volatile while the eurozone crisis seeks resolution.
Notwithstanding these risks, U.S. corporate earnings growth and balance sheets appear strong and stocks are reasonably valued. We continue to believe that a balanced portfolio strategy combined with prudent security selection can mitigate risks yet still offer attractive long-term growth opportunities and that the current uncertainty underscores the value of the fund’s diversified holdings.
Thank you for investing with T. Rowe Price.
Respectfully submitted,

Charles M. Shriver
Chairman of the portfolio’s Investment Advisory Committee
July 20, 2012
The committee chairman has day-to-day responsibility for managing the portfolio and works with committee members in developing and executing the portfolio’s investment program.
RISKS OF INVESTING IN STOCKS
As with all stock mutual funds, the fund’s share price can fall because of weakness in the stock market, a particular industry, or specific holdings. Stock markets can decline for many reasons, including adverse political or economic developments, changes in investor psychology, or heavy institutional selling. The prospects for an industry or company may deteriorate because of a variety of factors, including disappointing earnings or changes in the competitive environment. In addition, the investment manager’s assessment of companies held in a fund may prove incorrect, resulting in losses or poor performance even in rising markets.
RISKS OF INTERNATIONAL INVESTING
Funds that invest overseas generally carry more risk than funds that invest strictly in U.S. assets. Risks can result from varying stages of economic and political development; differing regulatory environments, trading days, and accounting standards; currency fluctuations; and higher transaction costs of non-U.S. markets. Investments outside the United States could be subject to governmental actions, such as capital or currency controls, nationalization of a company or industry, expropriation of assets, or imposition of high taxes.
RISKS OF INVESTING IN BONDS
Funds that invest in bonds are subject to interest rate risk, the decline in bond prices that usually accompanies a rise in interest rates. Longer-maturity bonds typically decline more than those with shorter maturities. Funds that invest in bonds are also subject to credit risk, the chance that any fund holding could have its credit rating downgraded or that a bond issuer will default (fail to make timely payments of interest or principal), potentially reducing the fund’s income level and share price.
GLOSSARY
Barclays U.S. Aggregate Bond Index: An unmanaged index that tracks domestic investment-grade bonds, including corporate, government, and mortgage-backed securities.
Combined index portfolio: An unmanaged portfolio of 52% domestic stocks (S&P 500 Index), 35% bonds (Barclays U.S. Aggregate Bond Index), and 13% international stocks (MSCI EAFE Index).
Lipper indexes: Fund benchmarks that consist of a small number (10 to 30) of the largest mutual funds in a particular category as tracked by Lipper Inc.
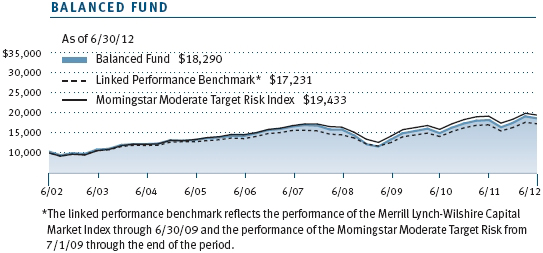
Merrill Lynch-Wilshire Capital Market Index: A market capitalization-weighted index including the Wilshire 5000, Merrill Lynch High Yield II, and Domestic Master indexes. This index was discontinued on June 30, 2009.
Morningstar Moderate Target Risk Index: An index that represents a portfolio of global equities (fixed at 60%), bonds, and other asset classes.
MSCI EAFE Index: An index that measures equity market performance of developed countries in the Europe, Australasia, and Far East regions.
S&P 500 Index: An unmanaged index that tracks the stocks of 500 primarily large-cap U.S. companies.

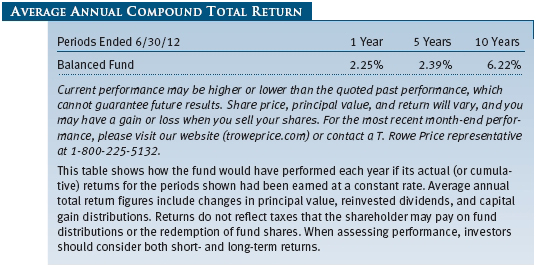
Performance and Expenses
| Growth of $10,000 |
This chart shows the value of a hypothetical $10,000 investment in the fund over the past 10 fiscal year periods or since inception (for funds lacking 10-year records). The result is compared with benchmarks, which may include a broad-based market index and a peer group average or index. Market indexes do not include expenses, which are deducted from fund returns as well as mutual fund averages and indexes.
| Fund Expense Example |
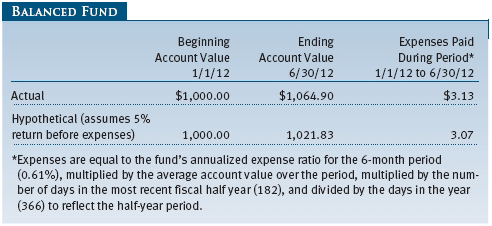
As a mutual fund shareholder, you may incur two types of costs: (1) transaction costs, such as redemption fees or sales loads, and (2) ongoing costs, including management fees, distribution and service (12b-1) fees, and other fund expenses. The following example is intended to help you understand your ongoing costs (in dollars) of investing in the fund and to compare these costs with the ongoing costs of investing in other mutual funds. The example is based on an investment of $1,000 invested at the beginning of the most recent six-month period and held for the entire period.
Actual Expenses
The first line of the following table (Actual) provides information about actual account values and expenses based on the fund’s actual returns. You may use the information on this line, together with your account balance, to estimate the expenses that you paid over the period. Simply divide your account value by $1,000 (for example, an $8,600 account value divided by $1,000 = 8.6), then multiply the result by the number on the first line under the heading “Expenses Paid During Period” to estimate the expenses you paid on your account during this period.
Hypothetical Example for Comparison Purposes
The information on the second line of the table (Hypothetical) is based on hypothetical account values and expenses derived from the fund’s actual expense ratio and an assumed 5% per year rate of return before expenses (not the fund’s actual return). You may compare the ongoing costs of investing in the fund with other funds by contrasting this 5% hypothetical example and the 5% hypothetical examples that appear in the shareholder reports of the other funds. The hypothetical account values and expenses may not be used to estimate the actual ending account balance or expenses you paid for the period.
Note: T. Rowe Price charges an annual account service fee of $20, generally for accounts with less than $10,000. The fee is waived for any investor whose T. Rowe Price mutual fund accounts total $50,000 or more; accounts electing to receive electronic delivery of account statements, transaction confirmations, prospectuses, and shareholder reports; or accounts of an investor who is a T. Rowe Price Preferred Services, Personal Services, or Enhanced Personal Services client (enrollment in these programs generally requires T. Rowe Price assets of at least $100,000). This fee is not included in the accompanying table. If you are subject to the fee, keep it in mind when you are estimating the ongoing expenses of investing in the fund and when comparing the expenses of this fund with other funds.
You should also be aware that the expenses shown in the table highlight only your ongoing costs and do not reflect any transaction costs, such as redemption fees or sales loads. Therefore, the second line of the table is useful in comparing ongoing costs only and will not help you determine the relative total costs of owning different funds. To the extent a fund charges transaction costs, however, the total cost of owning that fund is higher.
Unaudited

The accompanying notes are an integral part of these financial statements.
Unaudited


The accompanying notes are an integral part of these financial statements.
Unaudited
The accompanying notes are an integral part of these financial statements.
Unaudited

The accompanying notes are an integral part of these financial statements.
Unaudited

The accompanying notes are an integral part of these financial statements.
Unaudited
| Notes to Financial Statements |
T. Rowe Price Balanced Fund, Inc. (the fund), is registered under the Investment Company Act of 1940 (the 1940 Act) as a diversified, open-end management investment company. The fund commenced operations on December 31, 1939. The fund seeks to provide capital growth, current income, and preservation of capital through a portfolio of stocks and fixed-income securities.
NOTE 1 - SIGNIFICANT ACCOUNTING POLICIES
Basis of Preparation The accompanying financial statements were prepared in accordance with accounting principles generally accepted in the United States of America (GAAP), which require the use of estimates made by management. Management believes that estimates and valuations are appropriate; however, actual results may differ from those estimates, and the valuations reflected in the accompanying financial statements may differ from the value ultimately realized upon sale or maturity.
Investment Transactions, Investment Income, and Distributions Income and expenses are recorded on the accrual basis. Premiums and discounts on debt securities are amortized for financial reporting purposes. Paydown gains and losses are recorded as an adjustment to interest income. Dividends received from mutual fund investments are reflected as dividend income; capital gain distributions are reflected as realized gain/loss. Earnings on investments recognized as partnerships for federal income tax purposes reflect the tax character of such earnings. Dividend income and capital gain distributions are recorded on the ex-dividend date. Income tax-related interest and penalties, if incurred, would be recorded as income tax expense. Investment transactions are accounted for on the trade date. Realized gains and losses are reported on the identified cost basis. Distributions to shareholders are recorded on the ex-dividend date. Income distributions are declared and paid quarterly. Capital gain distributions, if any, are generally declared and paid by the fund annually.
Currency Translation Assets, including investments, and liabilities denominated in foreign currencies are translated into U.S. dollar values each day at the prevailing exchange rate, using the mean of the bid and asked prices of such currencies against U.S. dollars as quoted by a major bank. Purchases and sales of securities, income, and expenses are translated into U.S. dollars at the prevailing exchange rate on the date of the transaction. The effect of changes in foreign currency exchange rates on realized and unrealized security gains and losses is reflected as a component of security gains and losses.
Rebates and Credits Subject to best execution, the fund may direct certain security trades to brokers who have agreed to rebate a portion of the related brokerage commission to the fund in cash. Commission rebates are reflected as realized gain on securities in the accompanying financial statements and totaled $18,000 for the six months ended June 30, 2012. Additionally, the fund earns credits on temporarily uninvested cash balances held at the custodian, which reduce the fund’s custody charges. Custody expense in the accompanying financial statements is presented before reduction for credits.
New Accounting Pronouncements In May 2011, the Financial Accounting Standards Board (FASB) issued amended guidance to align fair value measurement and disclosure requirements in U.S. GAAP with International Financial Reporting Standards. The guidance is effective for fiscal years and interim periods beginning on or after December 15, 2011. Adoption had no effect on net assets or results of operations.
In December 2011, the FASB issued amended guidance to enhance disclosure for offsetting assets and liabilities. The guidance is effective for fiscal years and interim periods beginning on or after January 1, 2013. Adoption will have no effect on the fund’s net assets or results of operations.
NOTE 2 - VALUATION
The fund’s financial instruments are reported at fair value as defined by GAAP. The fund determines the values of its assets and liabilities and computes its net asset value per share at the close of the New York Stock Exchange (NYSE), normally 4 p.m. ET, each day that the NYSE is open for business.
Valuation Methods Equity securities listed or regularly traded on a securities exchange or in the over-the-counter (OTC) market are valued at the last quoted sale price or, for certain markets, the official closing price at the time the valuations are made, except for OTC Bulletin Board securities, which are valued at the mean of the latest bid and asked prices. A security that is listed or traded on more than one exchange is valued at the quotation on the exchange determined to be the primary market for such security. Listed securities not traded on a particular day are valued at the mean of the latest bid and asked prices for domestic securities and the last quoted sale price for international securities.
Debt securities are generally traded in the OTC market. Securities with remaining maturities of one year or more at the time of acquisition are valued at prices furnished by dealers who make markets in such securities or by an independent pricing service, which considers the yield or price of bonds of comparable quality, coupon, maturity, and type, as well as prices quoted by dealers who make markets in such securities. Securities with remaining maturities of less than one year at the time of acquisition generally use amortized cost in local currency to approximate fair value. However, if amortized cost is deemed not to reflect fair value or the fund holds a significant amount of such securities with remaining maturities of more than 60 days, the securities are valued at prices furnished by dealers who make markets in such securities or by an independent pricing service.
Investments in mutual funds are valued at the mutual fund’s closing net asset value per share on the day of valuation. Investments in private investment companies are valued at the entity’s net asset value (or equivalent) as of the valuation date. Financial futures contracts are valued at closing settlement prices. Swaps are valued at prices furnished by independent swap dealers or by an independent pricing service.
Other investments, including restricted securities and private placements, and those financial instruments for which the above valuation procedures are inappropriate or are deemed not to reflect fair value, are stated at fair value as determined in good faith by the T. Rowe Price Valuation Committee, established by the fund’s Board of Directors (the Board). Subject to oversight by the Board, the Valuation Committee develops pricing-related policies and procedures and approves all fair-value determinations. The Valuation Committee regularly makes good faith judgments, using a wide variety of sources and information, to establish and adjust valuations of certain securities as events occur and circumstances warrant. For instance, in determining the fair value of private-equity instruments, the Valuation Committee considers a variety of factors, including the company’s business prospects, its financial performance, strategic events impacting the company, relevant valuations of similar companies, new rounds of financing, and any negotiated transactions of significant size between other investors in the company. Because any fair-value determination involves a significant amount of judgment, there is a degree of subjectivity inherent in such pricing decisions.
For valuation purposes, the last quoted prices of non-U.S. equity securities may be adjusted under the circumstances described below. If the fund determines that developments between the close of a foreign market and the close of the NYSE will, in its judgment, materially affect the value of some or all of its portfolio securities, the fund will adjust the previous closing prices to reflect what it believes to be the fair value of the securities as of the close of the NYSE. In deciding whether it is necessary to adjust closing prices to reflect fair value, the fund reviews a variety of factors, including developments in foreign markets, the performance of U.S. securities markets, and the performance of instruments trading in U.S. markets that represent foreign securities and baskets of foreign securities. A fund may also fair value securities in other situations, such as when a particular foreign market is closed but the fund is open. The fund uses outside pricing services to provide it with closing prices and information to evaluate and/or adjust those prices. The fund cannot predict how often it will use closing prices and how often it will determine it necessary to adjust those prices to reflect fair value. As a means of evaluating its security valuation process, the fund routinely compares closing prices, the next day’s opening prices in the same markets, and adjusted prices. Additionally, trading in the underlying securities of the fund may take place in various foreign markets on certain days when the fund is not open for business and does not calculate a net asset value. As a result, net asset values may be significantly affected on days when shareholders cannot make transactions.
Valuation Inputs Various inputs are used to determine the value of the fund’s financial instruments. These inputs are summarized in the three broad levels listed below:
Level 1 – quoted prices in active markets for identical financial instruments
Level 2 – observable inputs other than Level 1 quoted prices (including, but not limited to, quoted prices for similar financial instruments, interest rates, prepayment speeds, and credit risk)
Level 3 – unobservable inputs
Observable inputs are those based on market data obtained from sources independent of the fund, and unobservable inputs reflect the fund’s own assumptions based on the best information available. The input levels are not necessarily an indication of the risk or liquidity associated with financial instruments at that level. For example, non-U.S. equity securities actively traded in foreign markets generally are reflected in Level 2 despite the availability of closing prices because the fund evaluates and determines whether those closing prices reflect fair value at the close of the NYSE or require adjustment, as described above. The following table summarizes the fund’s financial instruments, based on the inputs used to determine their values on June 30, 2012:

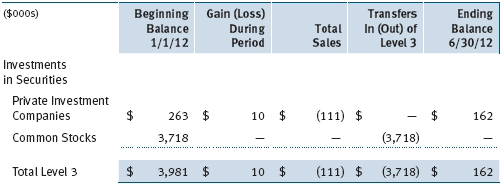
Following is a reconciliation of the fund’s Level 3 holdings for the six months ended June 30, 2012. Transfers into and out of Level 3 are reflected at the value of the financial instrument at the beginning of the period. Gain (loss) reflects both realized and change in unrealized gain (loss) on Level 3 holdings during the period, if any, and is included on the accompanying Statement of Operations. The change in unrealized gain (loss) on Level 3 instruments held at June 30, 2012, totaled $10,000 for the six months ended June 30, 2012.
NOTE 3 - DERIVATIVE INSTRUMENTS
During the six months ended June 30, 2012, the fund invested in derivative instruments. As defined by GAAP, a derivative is a financial instrument whose value is derived from an underlying security price, foreign exchange rate, interest rate, index of prices or rates, or other variable; it requires little or no initial investment and permits or requires net settlement. The fund invests in derivatives only if the expected risks and rewards are consistent with its investment objectives, policies, and overall risk profile, as described in its prospectus and Statement of Additional Information. The fund may use derivatives for a variety of purposes, such as seeking to hedge against declines in principal value, increase yield, invest in an asset with greater efficiency and at a lower cost than is possible through direct investment, or to adjust credit exposure. The risks associated with the use of derivatives are different from, and potentially much greater than, the risks associated with investing directly in the instruments on which the derivatives are based. Investments in derivatives can magnify returns positively or negatively; however, the fund at all times maintains sufficient cash reserves, liquid assets, or other SEC-permitted asset types to cover the settlement obligations under its open derivative contracts.
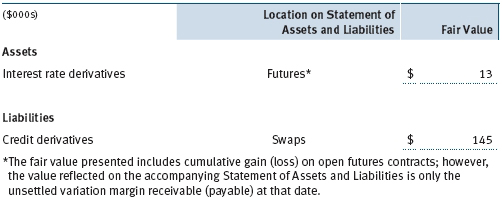
The fund values its derivatives at fair value, as described below and in Note 2, and recognizes changes in fair value currently in its results of operations. Accordingly, the fund does not follow hedge accounting, even for derivatives employed as economic hedges. The fund does not offset the fair value of derivative instruments against the right to reclaim or obligation to return collateral. The following table summarizes the fair value of the fund’s derivative instruments held as of June 30, 2012, and the related location on the accompanying Statement of Assets and Liabilities, presented by primary underlying risk exposure:
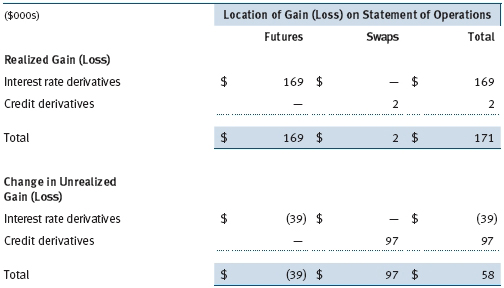
Additionally, the amount of gains and losses on derivative instruments recognized in fund earnings during the six months ended June 30, 2012, and the related location on the accompanying Statement of Operations is summarized in the following table by primary underlying risk exposure:
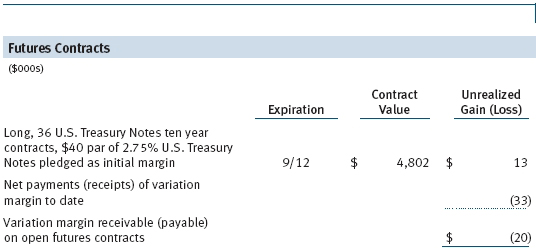
Futures Contracts The fund is subject to interest rate risk in the normal course of pursuing its investment objectives and uses futures contracts to help manage such risk. The fund may enter into futures contracts to manage exposure to interest rates, security prices, foreign currencies, and credit quality; as an efficient means of adjusting exposure to all or part of a target market; to enhance income; as a cash management tool; and/or to adjust credit exposure. A futures contract provides for the future sale by one party and purchase by another of a specified amount of a particular underlying financial instrument at an agreed-upon price, date, time, and place. The fund currently invests only in exchange-traded futures, which generally are standardized as to maturity date, underlying financial instrument, and other contract terms. Upon entering into a futures contract, the fund is required to deposit with the broker cash or securities in an amount equal to a certain percentage of the contract value (margin deposit); the margin deposit must then be maintained at the established level over the life of the contract. Subsequent payments are made or received by the fund each day to settle daily fluctuations in the value of the contract (variation margin), which reflect changes in the value of the underlying financial instrument. Variation margin is recorded as unrealized gain or loss until the contract is closed. The value of a futures contract included in net assets is the amount of unsettled variation margin; net variation margin receivable is reflected as an asset, and net variation margin payable is reflected as a liability on the accompanying Statement of Assets and Liabilities. Risks related to the use of futures contracts include possible illiquidity of the futures markets, contract prices that can be highly volatile and imperfectly correlated to movements in hedged security values and/or interest rates, and potential losses in excess of the fund’s initial investment. During the six months ended June 30, 2012, the fund’s exposure to futures, based on underlying notional amounts, was generally less than 1% of net assets.
Credit Default Swaps The fund is subject to credit risk in the normal course of pursuing its investment objectives and uses swap contracts to help manage such risk. The fund may use swaps in an effort to manage exposure to changes in interest rates, inflation rates, and credit quality; to adjust overall exposure to certain markets; to enhance total return or protect the value of portfolio securities; to serve as a cash management tool; and/or to adjust portfolio duration or credit exposure. Credit default swaps are agreements where one party (the protection buyer) agrees to make periodic payments to another party (the protection seller) in exchange for protection against specified credit events, such as certain defaults and bankruptcies related to an underlying credit instrument, or issuer or index of such instruments. Upon occurrence of a specified credit event, the protection seller is required to pay the buyer the difference between the notional amount of the swap and the value of the underlying credit, either in the form of a net cash settlement or by paying the gross notional amount and accepting delivery of the relevant underlying credit. For credit default swaps where the underlying credit is an index, a specified credit event may affect all or individual underlying securities included in the index and will be settled based upon the relative weighting of the affected underlying security(s) within the index. Generally, the payment risk for the seller of protection is inversely related to the current market price of the underlying credit; or, in the case of an index swap, the market value of the contract relative to the notional amount. Therefore, the payment risk increases as the price of the relevant underlying credit, or market value of the index swap, declines due to market valuations of credit quality. As of June 30, 2012, the notional amount of protection sold by the fund totaled $2,150,000 (0.1% of net assets), which reflects the maximum potential amount the fund could be required to pay under such contracts. The value of a swap included in net assets is the unrealized gain or loss on the contract plus or minus any unamortized premiums paid or received, respectively. Appreciated swaps and premiums paid are reflected as assets, and depreciated swaps and premiums received are reflected as liabilities on the accompanying Statement of Assets and Liabilities. Net periodic receipts or payments required by swaps are accrued daily and are recorded as realized gain or loss for financial reporting purposes when settled; fluctuations in the fair value of swaps are reflected in the change in net unrealized gain or loss and are reclassified to realized gain or loss upon termination prior to maturity or cash settlement. Risks related to the use of credit default swaps include the possible inability of the fund to accurately assess the current and future creditworthiness of underlying issuers, the possible failure of a counterparty to perform in accordance with the terms of the swap agreements, potential government regulation that could adversely affect the fund’s swap investments, and potential losses in excess of the fund’s initial investment. During the six months ended June 30, 2012, the fund’s exposure to swaps, based on underlying notional amounts, was generally less than 1% of net assets.
NOTE 4 - OTHER INVESTMENT TRANSACTIONS
Consistent with its investment objective, the fund engages in the following practices to manage exposure to certain risks and/or to enhance performance. The investment objective, policies, program, and risk factors of the fund are described more fully in the fund’s prospectus and Statement of Additional Information.
Restricted Securities The fund may invest in securities that are subject to legal or contractual restrictions on resale. Prompt sale of such securities at an acceptable price may be difficult and may involve substantial delays and additional costs.
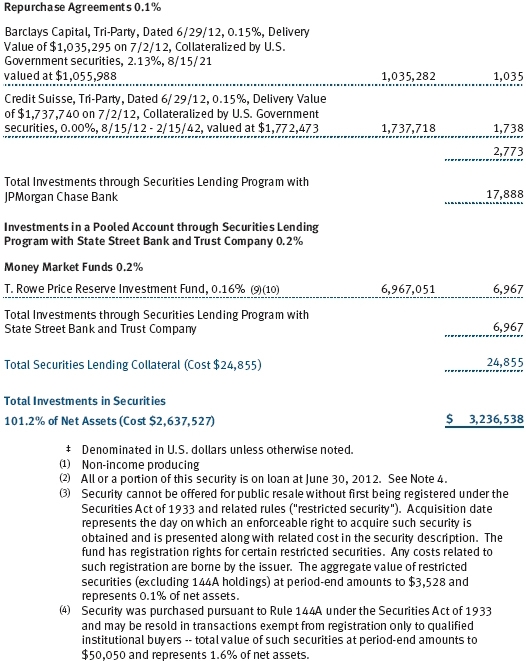
Repurchase Agreements All repurchase agreements are fully collateralized by U.S. government securities. Collateral is in the possession of the fund’s custodian or, for tri-party agreements, the custodian designated by the agreement. Collateral is evaluated daily to ensure that its market value exceeds the delivery value of the repurchase agreements at maturity. Although risk is mitigated by the collateral, the fund could experience a delay in recovering its value and a possible loss of income or value if the counterparty fails to perform in accordance with the terms of the agreement.
TBA Purchase and Sale Commitments During the six months ended June 30, 2012, the fund entered into to be announced (TBA) purchase and/or sale commitments, pursuant to which it agrees to purchase or sell, respectively, mortgage-backed securities for a fixed unit price, with payment and delivery at a scheduled future date beyond the customary settlement period for such mortgage-backed securities. With TBA transactions, the particular securities to be delivered are not identified at the trade date; however, delivered securities must meet specified terms, including issuer, rate, and mortgage term, and be within industry-accepted “good delivery” standards. The fund generally enters into TBA purchase transactions with the intention of taking possession of the underlying mortgage securities; however, for either purchase or sale transactions, the fund also may extend the settlement by “rolling” the transaction. Until settlement, the fund maintains cash reserves and liquid assets sufficient to settle its TBA commitments.
Securities Lending The fund lends its securities to approved brokers to earn additional income. It receives as collateral cash and U.S. government securities valued at 102% to 105% of the value of the securities on loan. Collateral is maintained over the life of the loan in an amount not less than the value of loaned securities as determined at the close of fund business each day; any additional collateral required due to changes in security values is delivered to the fund the next business day. Cash collateral is invested by the fund’s lending agent(s) in accordance with investment guidelines approved by management. Although risk is mitigated by the collateral, the fund could experience a delay in recovering its securities and a possible loss of income or value if the borrower fails to return the securities or if collateral investments decline in value. Securities lending revenue recognized by the fund consists of earnings on invested collateral and borrowing fees, net of any rebates to the borrower and compensation to the lending agent. In accordance with GAAP, investments made with cash collateral are reflected in the accompanying financial statements, but collateral received in the form of securities are not. On June 30, 2012, the value of cash collateral investments was $24,855,000, and the value of loaned securities was $24,373,000.
T. Rowe Price Term Asset-Backed Opportunity Fund, L.L.C. During the six months ended June 30, 2012, the fund was invested in the T. Rowe Price Term Asset-Backed Opportunity Fund, L.L.C. (private fund), a private investment company managed by T. Rowe Price Associates, Inc., that participates in the Term Asset-Backed Securities Loan Facility (TALF) program created and administered by the Federal Reserve Bank of New York (FRBNY). The TALF program provided eligible borrowers with term loans secured by eligible asset-backed securities and/or commercial mortgage-backed securities, which were either owned by the borrower or purchased by the borrower and subsequently pledged as collateral for a TALF loan. TALF loans generally are nonrecourse in nature. The private fund is treated as a partnership for federal income tax purposes. It has a limited life extending five years from the date on which the TALF program closed for any new loans, which was June 30, 2010. The private fund can have two possible extensions (one year each) with the consent of a majority of its investors. Invested capital generally will be returned to investors as underlying securities are liquidated and the TALF loans are repaid or mature, with the balance paid at maturity of the private fund. Ownership interests in the private fund may not be redeemed, sold, or assigned. As of June 30, 2012, outstanding capital commitments may no longer be called by the private fund.
When-Issued Securities The fund may enter into when-issued purchases and/or sales commitments, pursuant to which it agrees to purchase or sell, respectively, the underlying security for a fixed unit price, with payment and delivery at a scheduled future date generally beyond the customary settlement period for such securities. When-issued refers to securities that have not yet been issued but will be issued in the future and may include new securities or securities obtained through a corporate action on a current holding. The fund normally purchases when-issued securities with the intention of taking possession but may enter into a separate agreement to sell the securities before the settlement date. Until settlement, the fund maintains cash reserves and liquid assets sufficient to settle its when-issued commitments. Amounts realized on when-issued transactions are included with realized gain/loss on securities in the accompanying financial statements.
Counterparty Risk and Collateral The fund has entered into collateral agreements with certain counterparties to mitigate counterparty risk associated with certain over-the-counter (OTC) financial instruments, including swaps, forward currency exchange contracts, TBA purchase commitments, and OTC options (collectively, covered OTC instruments). Subject to certain minimum exposure requirements (which typically range from $100,000 to $500,000), collateral requirements generally are determined and transfers made based on the net aggregate unrealized gain or loss on all OTC instruments covered by a particular collateral agreement with a specified counterparty. Collateral, both pledged by the fund to a counterparty and pledged by a counterparty to the fund, is held in a segregated account by a third-party agent and can be in the form of cash or debt securities issued by the U.S. government or related agencies. Securities posted as collateral by the fund to a counterparty are so noted in the accompanying Portfolio of Investments and remain in the fund’s assets. As of June 30, 2012, securities valued at $263,000 had been posted by the fund to counterparties for covered OTC instruments. Collateral pledged by counterparties to the fund is not included in the fund’s assets because the fund does not obtain effective control over those assets. As of June 30, 2012, no collateral was pledged by counterparties to the fund for covered OTC instruments.
At any point in time, the fund’s risk of loss from counterparty credit risk on covered OTC instruments is the aggregate unrealized gain on appreciated covered OTC instruments in excess of collateral, if any, pledged by the counterparty to the fund. In accordance with the terms of the relevant derivatives agreements, counterparties to OTC derivatives may be able to terminate derivative contracts prior to maturity after the occurrence of certain stated events, such as a decline in net assets above a certain percentage or a failure by the fund to perform its obligations under the contract. Upon termination, all transactions would typically be liquidated and a net amount would be owed by or payable to the fund. Counterparty risk related to exchange-traded futures and options contracts is minimal because the exchange’s clearinghouse provides protection against counterparty defaults. Generally, for exchange-traded derivatives such as futures and options, each broker, in its sole discretion, may change margin requirements applicable to the fund. As of June 30, 2012, securities valued at $44,000 had been posted by the fund to the broker for exchange-traded derivatives.
Other Purchases and sales of portfolio securities other than short-term and U.S. government securities aggregated $485,149,000 and $407,965,000, respectively, for the six months ended June 30, 2012. Purchases and sales of U.S. government securities aggregated $599,452,000 and $594,226,000, respectively, for the six months ended June 30, 2012.
NOTE 5 - FEDERAL INCOME TAXES
No provision for federal income taxes is required since the fund intends to continue to qualify as a regulated investment company under Subchapter M of the Internal Revenue Code and distribute to shareholders all of its taxable income and gains. Distributions determined in accordance with federal income tax regulations may differ in amount or character from net investment income and realized gains for financial reporting purposes. Financial reporting records are adjusted for permanent book/tax differences to reflect tax character but are not adjusted for temporary differences. The amount and character of tax-basis distributions and composition of net assets are finalized at fiscal year-end; accordingly, tax-basis balances have not been determined as of the date of this report.
The fund intends to retain realized gains to the extent of available capital loss carryforwards. Net realized capital losses may be carried forward indefinitely to offset future realized capital gains. As of December 31, 2011, the fund had $2,029,000 of available capital loss carryforwards.
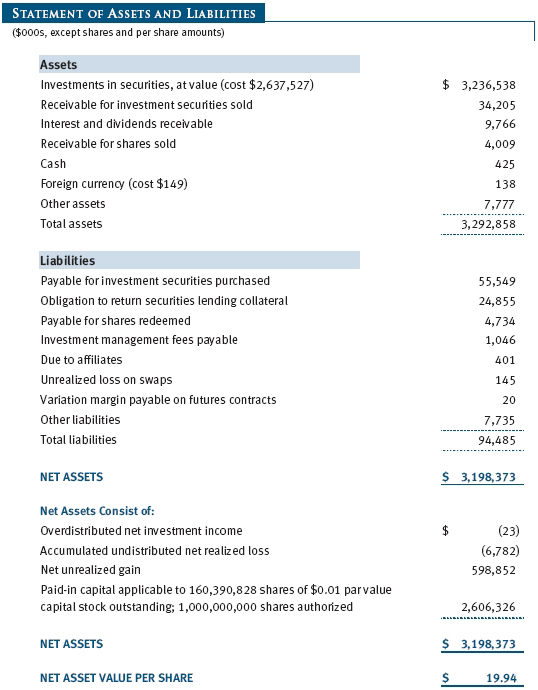
At June 30, 2012, the cost of investments for federal income tax purposes was $2,703,235,000. Net unrealized gain aggregated $533,144,000 at period-end, of which $669,990,000 related to appreciated investments and $136,846,000 related to depreciated investments.
NOTE 6 - RELATED PARTY TRANSACTIONS
The fund is managed by T. Rowe Price Associates, Inc. (Price Associates), a wholly owned subsidiary of T. Rowe Price Group, Inc. (Price Group). The investment management agreement between the fund and Price Associates provides for an annual investment management fee, which is computed daily and paid monthly. The fee consists of an individual fund fee, equal to 0.15% of the fund’s average daily net assets, and a group fee. The group fee rate is calculated based on the combined net assets of certain mutual funds sponsored by Price Associates (the group) applied to a graduated fee schedule, with rates ranging from 0.48% for the first $1 billion of assets to 0.28% for assets in excess of $300 billion. The fund’s group fee is determined by applying the group fee rate to the fund’s average daily net assets. At June 30, 2012, the effective annual group fee rate was 0.30%.
In addition, the fund has entered into service agreements with Price Associates and two wholly owned subsidiaries of Price Associates (collectively, Price). Price Associates computes the daily share price and provides certain other administrative services to the fund. T. Rowe Price Services, Inc., provides shareholder and administrative services in its capacity as the fund’s transfer and dividend disbursing agent. T. Rowe Price Retirement Plan Services, Inc., provides subaccounting and recordkeeping services for certain retirement accounts invested in the fund. For the six months ended June 30, 2012, expenses incurred pursuant to these service agreements were $93,000 for Price Associates; $368,000 for T. Rowe Price Services, Inc.; and $1,613,000 for T. Rowe Price Retirement Plan Services, Inc. The total amount payable at period-end pursuant to these service agreements is reflected as Due to Affiliates in the accompanying financial statements.
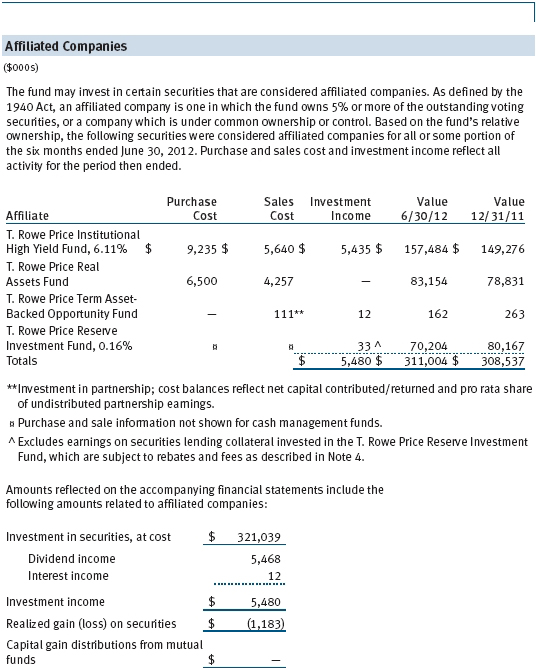
The fund may invest in the T. Rowe Price Reserve Investment Fund and the T. Rowe Price Government Reserve Investment Fund (collectively, the T. Rowe Price Reserve Investment Funds), open-end management investment companies managed by Price Associates and considered affiliates of the fund. The T. Rowe Price Reserve Investment Funds are offered as cash management options to mutual funds, trusts, and other accounts managed by Price Associates and/or its affiliates and are not available for direct purchase by members of the public. The T. Rowe Price Reserve Investment Funds pay no investment management fees.
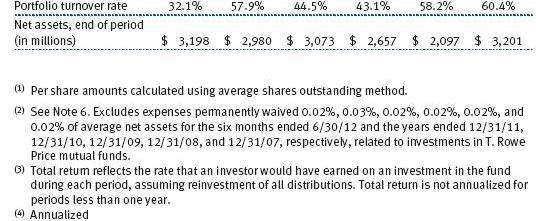
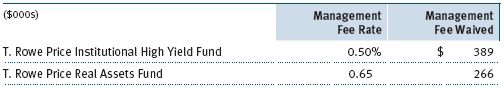
The fund may also invest in certain T. Rowe Price institutional funds and/or the T. Rowe Price Real Assets Fund (collectively, the underlying institutional funds) as a means of gaining efficient and cost-effective exposure to certain markets. The underlying institutional funds are open-end management investment companies managed by Price Associates and are considered affiliates of the fund. Each institutional fund pays an all-inclusive management and administrative fee to Price Associates; Real Assets Fund pays a management fee to Price Associates as well as operating expenses. To ensure that the fund does not incur duplicate management fees, Price Associates has agreed to permanently waive a portion of its management fee charged to the fund in an amount sufficient to fully offset the management fees paid by the underlying institutional funds related to fund assets invested therein. Accordingly, the accompanying Statement of Operations includes management fees permanently waived pursuant to this agreement. Annual fee rates and amounts waived within the accompanying Statement of Operations related to shares of the underlying institutional funds for the six months ended June 30, 2012, are as follows:
| Information on Proxy Voting Policies, Procedures, and Records |
A description of the policies and procedures used by T. Rowe Price funds and portfolios to determine how to vote proxies relating to portfolio securities is available in each fund’s Statement of Additional Information, which you may request by calling 1-800-225-5132 or by accessing the SEC’s website, sec.gov. The description of our proxy voting policies and procedures is also available on our website, troweprice.com. To access it, click on the words “Our Company” at the top of our corporate homepage. Then, when the next page appears, click on the words “Proxy Voting Policies” on the left side of the page.
Each fund’s most recent annual proxy voting record is available on our website and through the SEC’s website. To access it through our website, follow the directions above, then click on the words “Proxy Voting Records” on the right side of the Proxy Voting Policies page.
| How to Obtain Quarterly Portfolio Holdings |
The fund files a complete schedule of portfolio holdings with the Securities and Exchange Commission for the first and third quarters of each fiscal year on Form N-Q. The fund’s Form N-Q is available electronically on the SEC’s website (sec.gov); hard copies may be reviewed and copied at the SEC’s Public Reference Room, 100 F St. N.E., Washington, DC 20549. For more information on the Public Reference Room, call 1-800-SEC-0330.
| Approval of Investment Management Agreement |
On March 6, 2012, the fund’s Board of Directors (Board), including a majority of the fund’s independent directors, approved the continuation of the investment management agreement (Advisory Contract) between the fund and its investment advisor, T. Rowe Price Associates, Inc. (Advisor). In connection with its deliberations, the Board requested, and the Advisor provided, such information as the Board (with advice from independent legal counsel) deemed reasonably necessary. The Board considered a variety of factors in connection with its review of the Advisory Contract, also taking into account information provided by the Advisor during the course of the year, as discussed below:
Services Provided by the Advisor
The Board considered the nature, quality, and extent of the services provided to the fund by the Advisor. These services included, but were not limited to, directing the fund’s investments in accordance with its investment program and the overall management of the fund’s portfolio, as well as a variety of related activities such as financial, investment operations, and administrative services; compliance; maintaining the fund’s records and registrations; and shareholder communications. The Board also reviewed the background and experience of the Advisor’s senior management team and investment personnel involved in the management of the fund, as well as the Advisor’s compliance record. The Board concluded that it was satisfied with the nature, quality, and extent of the services provided by the Advisor.
Investment Performance of the Fund
The Board reviewed the fund’s average annual total returns over the three-month and 1-, 3-, 5-, and 10-year periods, as well as the fund’s year-by-year returns, and compared these returns with a wide variety of previously agreed upon comparable performance measures and market data, including those supplied by Lipper and Morningstar, which are independent providers of mutual fund data.
On the basis of this evaluation and the Board’s ongoing review of investment results, and factoring in the relative market conditions during certain of the performance periods, the Board concluded that the fund’s performance was satisfactory.
Costs, Benefits, Profits, and Economies of Scale
The Board reviewed detailed information regarding the revenues received by the Advisor under the Advisory Contract and other benefits that the Advisor (and its affiliates) may have realized from its relationship with the fund, including any research received under “soft dollar” agreements and commission-sharing arrangements with broker-dealers. The Board considered that the Advisor may receive some benefit from soft-dollar arrangements pursuant to which research is received from broker-dealers that execute the applicable fund’s portfolio transactions. The Board received information on the estimated costs incurred and profits realized by the Advisor from managing T. Rowe Price mutual funds. The Board also reviewed estimates of the profits realized from managing the fund in particular, and the Board concluded that the Advisor’s profits were reasonable in light of the services provided to the fund.
The Board also considered whether the fund benefits under the fee levels set forth in the Advisory Contract from any economies of scale realized by the Advisor. Under the Advisory Contract, the fund pays a fee to the Advisor for investment management services composed of two components—a group fee rate based on the combined average net assets of most of the T. Rowe Price mutual funds (including the fund) that declines at certain asset levels and an individual fund fee rate based on the fund’s average daily net assets—and the fund pays its own expenses of operations. The Board concluded that the advisory fee structure for the fund continued to provide for a reasonable sharing of benefits from any economies of scale with the fund’s investors.
Fees
The Board was provided with information regarding industry trends in management fees and expenses, and the Board reviewed the fund’s management fee rate, operating expenses, and total expense ratio in comparison with fees and expenses of other comparable funds based on information and data supplied by Lipper. The information provided to the Board indicated that the fund’s management fee rate (after including reductions of the management fee that resulted from the fund’s investments in T. Rowe Price Institutional Funds) was above the median for certain groups of comparable funds but below the median for other groups of comparable funds. The information also indicated that the fund’s total expense ratio was below the median for comparable funds.
The Board also reviewed the fee schedules for institutional accounts and private accounts with similar mandates that are advised or subadvised by the Advisor and its affiliates. Management provided the Board with information about the Advisor’s responsibilities and services provided to institutional account clients, including information about how the requirements and economics of the institutional business are fundamentally different from those of the mutual fund business. The Board considered information showing that the mutual fund business is generally more complex from a business and compliance perspective than the institutional business and that the Advisor generally performs significant additional services and assumes greater risk in managing the fund and other T. Rowe Price mutual funds than it does for institutional account clients.
On the basis of the information provided and the factors considered, the Board concluded that the fees paid by the fund under the Advisory Contract are reasonable.
Approval of the Advisory Contract
As noted, the Board approved the continuation of the Advisory Contract. No single factor was considered in isolation or to be determinative to the decision. Rather, the Board concluded, in light of a weighting and balancing of all factors considered, that it was in the best interests of the fund and its shareholders for the Board to approve the continuation of the Advisory Contract (including the fees to be charged for services thereunder). The independent directors were advised throughout the process by independent legal counsel.
Item 2. Code of Ethics.
A code of ethics, as defined in Item 2 of Form N-CSR, applicable to its principal executive officer, principal financial officer, principal accounting officer or controller, or persons performing similar functions is filed as an exhibit to the registrant’s annual Form N-CSR. No substantive amendments were approved or waivers were granted to this code of ethics during the registrant’s most recent fiscal half-year.
Item 3. Audit Committee Financial Expert.
Disclosure required in registrant’s annual Form N-CSR.
Item 4. Principal Accountant Fees and Services.
Disclosure required in registrant’s annual Form N-CSR.
Item 5. Audit Committee of Listed Registrants.
Not applicable.
Item 6. Investments.
(a) Not applicable. The complete schedule of investments is included in Item 1 of this Form N-CSR.
(b) Not applicable.
Item 7. Disclosure of Proxy Voting Policies and Procedures for Closed-End Management Investment Companies.
Not applicable.
Item 8. Portfolio Managers of Closed-End Management Investment Companies.
Not applicable.
Item 9. Purchases of Equity Securities by Closed-End Management Investment Company and Affiliated Purchasers.
Not applicable.
Item 10. Submission of Matters to a Vote of Security Holders.
Not applicable.
Item 11. Controls and Procedures.
(a) The registrant’s principal executive officer and principal financial officer have evaluated the registrant’s disclosure controls and procedures within 90 days of this filing and have concluded that the registrant’s disclosure controls and procedures were effective, as of that date, in ensuring that information required to be disclosed by the registrant in this Form N-CSR was recorded, processed, summarized, and reported timely.
(b) The registrant’s principal executive officer and principal financial officer are aware of no change in the registrant’s internal control over financial reporting that occurred during the registrant’s second fiscal quarter covered by this report that has materially affected, or is reasonably likely to materially affect, the registrant’s internal control over financial reporting.
Item 12. Exhibits.
(a)(1) The registrant’s code of ethics pursuant to Item 2 of Form N-CSR is filed with the registrant’s annual Form N-CSR.
(2) Separate certifications by the registrant's principal executive officer and principal financial officer, pursuant to Section 302 of the Sarbanes-Oxley Act of 2002 and required by Rule 30a-2(a) under the Investment Company Act of 1940, are attached.
(3) Written solicitation to repurchase securities issued by closed-end companies: not applicable.
(b) A certification by the registrant's principal executive officer and principal financial officer, pursuant to Section 906 of the Sarbanes-Oxley Act of 2002 and required by Rule 30a-2(b) under the Investment Company Act of 1940, is attached.
SIGNATURES
Pursuant to the requirements of the Securities Exchange Act of 1934 and the Investment Company Act of 1940, the registrant has duly caused this report to be signed on its behalf by the undersigned, thereunto duly authorized.
T. Rowe Price Balanced Fund, Inc.
| By | /s/ Edward C. Bernard | |
| Edward C. Bernard | ||
| Principal Executive Officer | ||
| Date August 16, 2012 | ||
Pursuant to the requirements of the Securities Exchange Act of 1934 and the Investment Company Act of 1940, this report has been signed below by the following persons on behalf of the registrant and in the capacities and on the dates indicated.
| By | /s/ Edward C. Bernard | |
| Edward C. Bernard | ||
| Principal Executive Officer | ||
| Date August 16, 2012 | ||
| By | /s/ Gregory K. Hinkle | |
| Gregory K. Hinkle | ||
| Principal Financial Officer | ||
| Date August 16, 2012 | ||