UNITED STATES
SECURITIES AND EXCHANGE COMMISSION
Washington, D.C. 20549
FORM N-CSR
CERTIFIED SHAREHOLDER REPORT OF REGISTERED
MANAGEMENT INVESTMENT COMPANIES
Investment Company Act File Number: 811-06275
| T. Rowe Price Balanced Fund, Inc. |
| (Exact name of registrant as specified in charter) |
| 100 East Pratt Street, Baltimore, MD 21202 |
| (Address of principal executive offices) |
| David Oestreicher |
| 100 East Pratt Street, Baltimore, MD 21202 |
| (Name and address of agent for service) |
Registrant’s telephone number, including area code: (410) 345-2000
Date of fiscal year end: December 31
Date of reporting period: June 30, 2019
 |
| Balanced Fund | June 30, 2019 |
| RPBAX | Investor Class |
| RBAIX | I Class |
Beginning on January 1, 2021, as permitted by SEC regulations, paper copies of the T. Rowe Price funds’ annual and semiannual shareholder reports will no longer be mailed, unless you specifically request them. Instead, shareholder reports will be made available on the funds’ website (troweprice.com/prospectus), and you will be notified by mail with a website link to access the reports each time a report is posted to the site.
If you already elected to receive reports electronically, you will not be affected by this change and need not take any action. At any time, shareholders who invest directly in T. Rowe Price funds may generally elect to receive reports or other communications electronically by enrolling attroweprice.com/paperlessor, if you are a retirement plan sponsor or invest in the funds through a financial intermediary (such as an investment advisor, broker-dealer, insurance company, or bank), by contacting your representative or your financial intermediary.
You may elect to continue receiving paper copies of future shareholder reports free of charge. To do so, if you invest directly with T. Rowe Price, please call T. Rowe Price as follows: IRA, nonretirement account holders, and institutional investors,1-800-225-5132; small business retirement accounts,1-800-492-7670. If you are a retirement plan sponsor or invest in the T. Rowe Price funds through a financial intermediary, please contact your representative or financial intermediary or follow additional instructions if included with this document. Your election to receive paper copies of reports will apply to all funds held in your account with your financial intermediary or, if you invest directly in the T. Rowe Price funds, with T. Rowe Price. Your election can be changed at any time in the future.
| T. ROWE PRICE BALANCED FUND |
HIGHLIGHTS
| ■ | The Balanced Fund posted strong absolute returns for the six-month period ended June 30, 2019. The fund outperformed its Lipper and Morningstar benchmarks but trailed its combined index portfolio. |
| ■ | Tactical decisions to overweight or underweight various asset classes and sectors detracted from relative performance, while the inclusion of diversifying sectors, especially high yield bonds, was positive. |
| ■ | During the reporting period, we incrementally scaled back our exposure to stocks from a neutral allocation, as we anticipate greater volatility given persistent uncertainties. We also reduced our allocation to international equities and moved to an overweight in high yield bonds. |
| ■ | Near-term risks to global markets include repercussions from potential monetary policy missteps and an escalation in trade tensions. We believe that the Balanced Fund’s broad diversification across asset classes, investment styles, and geography, combined with T. Rowe Price’s strengths in fundamental research, are conducive to generating attractive risk-adjusted returns over time in a variety of market environments. |

Log in to your account attroweprice.comfor more information.
*Certain mutual fund accounts that are assessed an annual account service fee can also save money by switching to e-delivery.
CIO Market Commentary
Dear Shareholder
Markets overcame a bout of volatility in May and recorded exceptional returns in the six months ended June 30, 2019. The large-cap S&P 500 Index reached record highs and notched its best start to a year in over two decades. Overseas equity markets were also strong, while bond prices rose as longer-term interest rates fell to their lowest levels since late 2016.
Markets rebounded to start the year, as many of the worries behind the sell-off in late 2018 receded. Investors seemed most relieved by a dovish pivot in monetary policy. The S&P 500 scored its best daily gain for the period on January 4, after Federal Reserve Chair Jerome Powell pledged that the central bank would respond with all the tools at its disposal to counteract an economic downturn or financial turmoil. The Fed soon paused and kept rates steady following a series of quarterly hikes stretching back to late 2017.
Investors also seemed comforted by progress in U.S.-China trade relations. In March, President Donald Trump postponed a threatened tariff increase on Chinese goods and remarked that the two sides were “getting very close” to a deal. Encouraging statements continued to flow from the White House, and speculation grew that Chinese President Xi Jinping would soon visit Washington to sign an agreement.
Hopes for a deal were dashed in early May, however, sending stocks sharply lower. With negotiations at a standstill, on May 10, the administration increased the tariff rate to 25% from 10% on $200 billion in Chinese goods, as the president had long threatened. China soon retaliated with its own tariffs.A technological “cold war” also seemed to be developing, with both sides taking measures to cut off the other’s access to key components and raw materials. Stocks fell sharply in response, and the small- and mid-cap indexes moved back into correction territory, or down more than 10% from the highs they established late in the previous summer.
Another turn in trade policy in June helped stocks recover their losses. The White House abandoned an earlier threat to put tariffs on Mexican imports in response to immigration issues, and President Trump again softened his stance on China. Markets were closed on the final weekend of the month, when the president announced that he and President Xi had agreed to resume trade negotiations and arranged a truce that would at least temporarily prevent the imposition of further tariffs.
An even bigger factor in the June rebound appeared to be growing confidence that the Fed would cut interest rates rather than merely keep them steady. Fed Chair Powell pledged that policymakers were paying close attention to the impact of trade tensions on the economy and would “act as appropriate to sustain the expansion.” Policymakers also dropped references to being “patient” in adjusting monetary policy. By the end of the month, futures markets were pricing in 75 basis points (0.75 percentage point) of cuts in the second half of the year, with a reasonable chance of more to come in 2020.
The dovish shift in Fed policy has been driven by accumulating evidence of slowing global growth. Rising trade barriers have taken a heavy toll on the global manufacturing sector, and business investment has pulled back as managers confront additional sources of uncertainty, such as the possibility of a disorderly Brexit this October. As a result, corporate earnings growth has stalled in the U.S. and turned negative in other major markets. On the positive side, consumers remain in much better shape, particularly domestically.
We see little evidence to suggest a recession is on the horizon. Indeed, with markets at all-time highs, investors seem willing to bet that this decade-long economic recovery still has legs. We will keep a close eye on developments and rely on our careful fundamental research to avoid pitfalls; I am confident our strategic investing approach will continue to serve our shareholders well.
Thank you for your continued confidence in T. Rowe Price.
Sincerely,

Robert Sharps
Group Chief Investment Officer
Management’s Discussion of Fund Performance
INVESTMENT OBJECTIVE
The fund seeks to provide capital growth, current income, and preservation of capital through a portfolio of stocks and fixed income securities.
FUND COMMENTARY
How did the fund perform in the past six months?
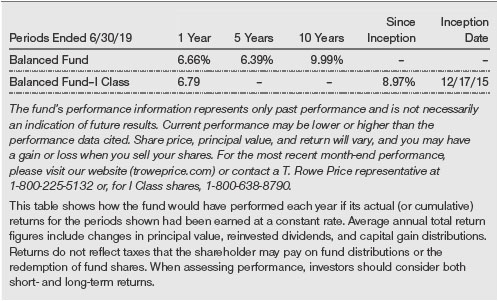
The Balanced Fund returned 13.21% in the six months ended June 30, 2019. The fund outperformed its Lipper and Morningstar benchmarks but lagged its combined index portfolio, which is a custom benchmark composed of multiple indexes that represent the asset classes in which the fund invests.(Returns for I Class shares varied slightly, reflecting a different fee structure.Past performance cannot guarantee future results.)

What factors influenced the fund’s performance?
Tactical allocation decisions to overweight or underweight various asset classes versus the fund’s combined index portfolio benchmark detracted from relativereturns. Equities and fixed income securities advanced during the period, and a modest allocation to cash—which generated tepid gains and underperformed both stocks and bonds—weighed on relative performance. An overweight to international equities also hurt returns as they lagged U.S. equities.
Exposure to sectors and asset classes that are not included in the fund’s benchmark was marginally positive. High yield bonds outpaced investment-grade issues and contributed to relative results. The sector benefited from a recovery in risk assets, as falling Treasury rates drove investor preference for more attractive yields.
Overall, security selection was neutral. U.S. large-cap equities generated strong returns and outperformed their respective benchmarks, but underperformance among international equities and real assets securities countered the positive impact. U.S. investment-grade bonds also trailed their benchmark and weighed on relative results.
How is the fund positioned?
At the end of the reporting period, we were underweight to stocks relative to bonds. We incrementally scaled back our exposure to equities from a neutral allocation as we anticipate greater market volatility given slowing global growth as well as persistent geopolitical and rising policy uncertainties. We expect modest returns from bonds as the low-yield environment offers a weakfoundation for significant upside. Nevertheless, bonds offer diversification benefits and may help to provide a buffer against equity market volatility.

Stocks
On a regional basis, we moderated our overweight to international stocks. Despite the attractive valuations of stocks outside the U.S., trade risks and softening economic growth trajectories could present challenges. In Europe, political risks in Italy andFrance that loomed over markets in 2018 have eased, but uncertainty surrounds the nature and impact of Britain’s expected withdrawal from the European Union at the end of October. Japanese equities remain supported by better relative valuations, but their dependence on global trade could be problematic as global growth momentum fades and trade tensions linger.
We reduced our underweight to U.S. equities. In our view, the U.S. market is less vulnerable to fading global economic growth, but diminishing earnings growth, prolonged trade uncertainty, and elevated valuations pose headwinds. We favor U.S. growth stocks relative to value stocks. Although the technology sector is vulnerable to potentially tighter regulation and supply chain disruptions due to unresolved trade tensions, we believe that secular growth companies may still benefit in a slowing economic environment. On the other hand, U.S. value stocks are cheaper, but they lack a catalyst to advance.
We remain underweight to inflation-sensitive real assets equities because we expect slower global growth in the near term and longer-term imbalances between energy supply and demand.
Bonds
We are underweight to U.S. investment-grade bonds as their yields are expected to remain low for the near future, given the Fed’s accommodative stance. A sharp sell-off in risk assets late in 2018 created attractive opportunities to add to our high yield exposure. The yield carry on high yield bonds is attractive, and the sector is supported by broadly positive corporate fundamentals and low default expectations.

What is portfolio management’s outlook?
Risk assets recorded a strong start to 2019 as many fears that led to the late-2018 sell-off receded. Despite some volatility driven by the resurgence of U.S.-China trade tensions and a moderating outlook for global growth, the Fed’s dovish pivot and overall optimism helped to fuel an equity market rally. With the tailwind from U.S. fiscal stimulus fading, the anticipated boost to long-term growth through capital expenditure has failed to materialize, as uncertainty has discouraged spending. In Europe, monetary policy remains supportive withan accommodative European Central Bank; however, unresolved Brexit negotiations and the region’s vulnerability to trade risks and China’s slowing economy pose potential headwinds. China’s stimulus measures (though domestically focused) and a more stable U.S. dollar should help support emerging markets economies.
The shift in Fed policy and a broader easing of financial and liquidity conditions have reduced the near-term likelihood of a recession, but the accommodative stance leaves global central banks ill-equipped to respond to a more pronounced downturn. While a step back from tightening policies may help to stabilize global growth, it is unlikely that it will be sufficient to ignite an economic reacceleration. Near-term risks to global markets include repercussions from potential monetary policy missteps and an escalation in trade tensions.
In our view, recent flare-ups in volatility coupled with above-average valuations in many asset classes—against a backdrop filled with geopolitical and monetary policy risks—underscore the value of our strategic investment approach. Given the confluence of positive and negative forces that can drive global financial markets, we believe that the Balanced Fund’s broad diversification across asset classes, investment styles, and geography, combined with T. Rowe Price’s strengths in fundamental research, are conducive to generating attractive risk-adjusted returns over time in a variety of market environments.
The views expressed reflect the opinions of T. Rowe Price as of the date of this report and are subject to change based on changes in market, economic, or other conditions. These views are not intended to be a forecast of future events and are no guarantee of future results.
RISKS OF INVESTING IN STOCKS
As with all stock mutual funds, the fund’s share price can fall because of weakness in the stock market, a particular industry, or specific holdings. Stock markets can decline for many reasons, including adverse political or economic developments, changes in investor psychology, or heavy institutional selling. The prospects for an industry or company may deteriorate because of a variety of factors, including disappointing earnings or changes in the competitive environment. In addition, the investment manager’s assessment of companies held in a fund may prove incorrect, resulting in losses or poor performance even in rising markets.
RISKS OF INTERNATIONAL INVESTING
Funds that invest overseas generally carry more risk than funds that invest strictly in U.S. assets. Risks can result from varying stages of economic and political development; differing regulatory environments, trading days, and accounting standards; currency fluctuations; and higher transaction costs of non-U.S. markets. Investments outside the United States could be subject to governmental actions such as capital or currency controls, nationalization of a company or industry, expropriation of assets, or imposition of high taxes.
RISKS OF INVESTING IN BONDS
Funds that invest in bonds are subject to interest rate risk, the decline in bond prices that usually accompanies a rise in interest rates. Longer-maturity bonds typically decline more than those with shorter maturities. Funds that invest in bonds are also subject to credit risk, the chance that any fund holding could have its credit rating downgraded or that a bond issuer will default (fail to make timely payments of interest or principal), potentially reducing the fund’s income level and share price.
BENCHMARK INFORMATION
Combined Index Portfolio:An unmanaged portfolio of 45.5% domestic stocks (S&P 500 Index), 19.5% international stocks (MSCI EAFE Index), and 35.0% bonds (Bloomberg Barclays U.S. Aggregate Bond Index).
Note: Bloomberg Index Services Ltd. Copyright © 2019, Bloomberg Index Services Ltd. Used with permission.
Note: MSCI makes no express or implied warranties or representations and shall have no liability whatsoever with respect to any MSCI data contained herein. The MSCI data may not be further redistributed or used as a basis for other indices or any securities or financial products. This report is not approved, reviewed, or produced by MSCI.
GROWTH OF $10,000
This chart shows the value of a hypothetical $10,000 investment in the fund over the past 10 fiscal year periods or since inception (for funds lacking 10-year records). The result is compared with benchmarks, which include a broad-based market index and may also include a peer group average or index. Market indexes do not include expenses, which are deducted from fund returns as well as mutual fund averages and indexes.

AVERAGE ANNUAL COMPOUND TOTAL RETURN
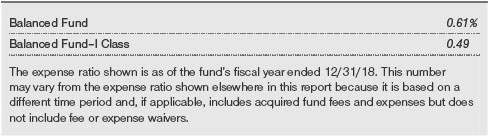
EXPENSE RATIO
FUND EXPENSE EXAMPLE
As a mutual fund shareholder, you may incur two types of costs: (1) transaction costs, such as redemption fees or sales loads, and (2) ongoing costs, including management fees, distribution and service (12b-1) fees, and other fund expenses. The following example is intended to help you understand your ongoing costs (in dollars) of investing in the fund and to compare these costs with the ongoing costs of investing in other mutual funds. The example is based on an investment of $1,000 invested at the beginning of the most recent six-month period and held for the entire period.
Please note that the fund has two share classes: The original share class (Investor Class) charges no distribution and service (12b-1) fee, and the I Class shares are also available to institutionally oriented clients and impose no 12b-1 or administrative fee payment. Each share class is presented separately in the table.
Actual Expenses
The first line of the following table (Actual) provides information about actual account values and expenses based on the fund’s actual returns. You may use the information on this line, together with your account balance, to estimate the expenses that you paid over the period. Simply divide your account value by $1,000 (for example, an $8,600 account value divided by $1,000 = 8.6), then multiply the result by the number on the first line under the heading “Expenses Paid During Period” to estimate the expenses you paid on your account during this period.
Hypothetical Example for Comparison Purposes
The information on the second line of the table (Hypothetical) is based on hypothetical account values and expenses derived from the fund’s actual expense ratio and an assumed 5% per year rate of return before expenses (not the fund’s actual return). You may compare the ongoing costs of investing in the fund with other funds by contrasting this 5% hypothetical example and the 5% hypothetical examples that appear in the shareholder reports of the other funds. The hypothetical account values and expenses may not be used to estimate the actual ending account balance or expenses you paid for the period.
Note:T. Rowe Price charges an annual account service fee of $20, generally for accounts with less than $10,000. The fee is waived for any investor whose T. Rowe Price mutual fund accounts total $50,000 or more; accounts electing to receive electronic delivery of account statements, transaction confirmations, prospectuses, and shareholder reports; or accounts of an investor who is a T. Rowe Price Personal Services or Enhanced Personal Services client (enrollment in these programs generally requires T. Rowe Price assets of at least $250,000). This fee is not included in the accompanying table. If you are subject to the fee, keep it in mind when you are estimating the ongoing expenses of investing in the fund and when comparing the expenses of this fund with other funds.
You should also be aware that the expenses shown in the table highlight only your ongoing costs and do not reflect any transaction costs, such as redemption fees or sales loads. Therefore, the second line of the table is useful in comparing ongoing costs only and will not help you determine the relative total costs of owning different funds. To the extent a fund charges transaction costs, however, the total cost of owning that fund is higher.

Unaudited


The accompanying notes are an integral part of these financial statements.
Unaudited


The accompanying notes are an integral part of these financial statements.
Unaudited


The accompanying notes are an integral part of these financial statements.
Unaudited

The accompanying notes are an integral part of these financial statements.
Unaudited
The accompanying notes are an integral part of these financial statements.
Unaudited

The accompanying notes are an integral part of these financial statements.
Unaudited
| NOTES TO FINANCIAL STATEMENTS |
T. Rowe Price Balanced Fund, Inc. (the fund) is registered under the Investment Company Act of 1940 (the 1940 Act) as a diversified, open-end management investment company. The fund seeks to provide capital growth, current income, and preservation of capital through a portfolio of stocks and fixed-income securities. The fund has two classes of shares: the Balanced Fund (Investor Class) and the Balanced Fund–I Class (I Class). I Class shares require a $1 million initial investment minimum, although the minimum generally is waived for retirement plans, financial intermediaries, and certain other accounts. Each class has exclusive voting rights on matters related solely to that class; separate voting rights on matters that relate to both classes; and, in all other respects, the same rights and obligations as the other class.
NOTE 1 - SIGNIFICANT ACCOUNTING POLICIES
Basis of PreparationThe fund is an investment company and follows accounting and reporting guidance in the Financial Accounting Standards Board (FASB)Accounting Standards CodificationTopic 946 (ASC 946). The accompanying financial statements were prepared in accordance with accounting principles generally accepted in the United States of America (GAAP), including, but not limited to, ASC 946. GAAP requires the use of estimates made by management. Management believes that estimates and valuations are appropriate; however, actual results may differ from those estimates, and the valuations reflected in the accompanying financial statements may differ from the value ultimately realized upon sale or maturity. Certain prior year amounts in the accompanying financial statements and financial highlights have been restated to conform to current year presentation.
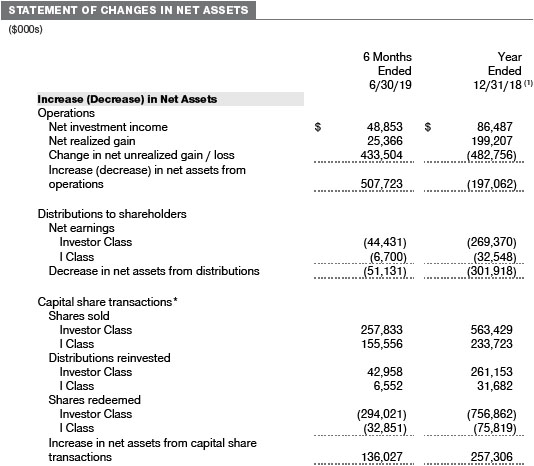
Investment Transactions, Investment Income, and DistributionsInvestment transactions are accounted for on the trade date basis. Income and expenses are recorded on the accrual basis. Realized gains and losses are reported on the identified cost basis. Premiums and discounts on debt securities are amortized for financial reporting purposes. Paydown gains and losses are recorded as an adjustment to interest income. Income tax-related interest and penalties, if incurred, are recorded as income tax expense. Dividends received from mutual fund investments are reflected as dividend income; capital gain distributions are reflected as realized gain/loss. Dividend income and capital gain distributions are recorded on the ex-dividend date. Distributions from REITs are initially recorded as dividend income and, to the extent such represent a return of capital or capital gain for tax purposes, are reclassified when such information becomes available. Distributionsto shareholders are recorded on the ex-dividend date. Income distributions, if any, are declared and paid by each class quarterly. A capital gain distribution may also be declared and paid by the fund annually.
Currency TranslationAssets, including investments, and liabilities denominated in foreign currencies are translated into U.S. dollar values each day at the prevailing exchange rate, using the mean of the bid and asked prices of such currencies against U.S. dollars as quoted by a major bank. Purchases and sales of securities, income, and expenses are translated into U.S. dollars at the prevailing exchange rate on the respective date of such transaction. The effect of changes in foreign currency exchange rates on realized and unrealized security gains and losses is not bifurcated from the portion attributable to changes in market prices.
Class AccountingShareholder servicing, prospectus, and shareholder report expenses incurred by each class are charged directly to the class to which they relate. Expenses common to both classes and investment income are allocated to the classes based upon the relative daily net assets of each class’s settled shares; realized and unrealized gains and losses are allocated based upon the relative daily net assets of each class’s outstanding shares.
New Accounting GuidanceIn March 2017, the FASB issued amended guidance to shorten the amortization period for certain callable debt securities held at a premium. The guidance is effective for fiscal years and interim periods beginning after December 15, 2018. Adoption will have no effect on the fund’s net assets or results of operations.
IndemnificationIn the normal course of business, the fund may provide indemnification in connection with its officers and directors, service providers, and/or private company investments. The fund’s maximum exposure under these arrangements is unknown; however, the risk of material loss is currently considered to be remote.
NOTE 2 - VALUATION
The fund’s financial instruments are valued and each class’s net asset value (NAV) per share is computed at the close of the New York Stock Exchange (NYSE), normally 4 p.m. ET, each day the NYSE is open for business. However, the NAV per share may be calculated at a time other than the normal close of the NYSE if trading on the NYSE is restricted, if the NYSE closes earlier, or as may be permitted by the SEC.
Fair ValueThe fund’s financial instruments are reported at fair value, which GAAP defines as the price that would be received to sell an asset or paid to transfer a liability in an orderly transaction between market participants at the measurement date. TheT. Rowe Price Valuation Committee (the Valuation Committee) is an internal committee that has been delegated certain responsibilities by the fund’s Board of Directors (the Board) to ensure that financial instruments are appropriately priced at fair value in accordance with GAAP and the 1940 Act. Subject to oversight by the Board, the Valuation Committee develops and oversees pricing-related policies and procedures and approves all fair value determinations. Specifically, the Valuation Committee establishes procedures to value securities; determines pricing techniques, sources, and persons eligible to effect fair value pricing actions; oversees the selection, services, and performance of pricing vendors; oversees valuation-related business continuity practices; and provides guidance on internal controls and valuation-related matters. The Valuation Committee reports to the Board and has representation from legal, portfolio management and trading, operations, risk management, and the fund’s treasurer.
Various valuation techniques and inputs are used to determine the fair value of financial instruments. GAAP establishes the following fair value hierarchy that categorizes the inputs used to measure fair value:
Level 1 – quoted prices (unadjusted) in active markets for identical financial instruments that the fund can access at the reporting date
Level 2 – inputs other than Level 1 quoted prices that are observable, either directly or indirectly (including, but not limited to, quoted prices for similar financial instruments in active markets, quoted prices for identical or similar financial instruments in inactive markets, interest rates and yield curves, implied volatilities, and credit spreads)
Level 3 – unobservable inputs
Observable inputs are developed using market data, such as publicly available information about actual events or transactions, and reflect the assumptions that market participants would use to price the financial instrument. Unobservable inputs are those for which market data are not available and are developed using the best information available about the assumptions that market participants would use to price the financial instrument. GAAP requires valuation techniques to maximize the use of relevant observable inputs and minimize the use of unobservable inputs. When multiple inputs are used to derive fair value, the financial instrument is assigned to the level within the fair value hierarchy based on the lowest-level input that is significant to the fair value of the financial instrument. Input levels are not necessarily an indication of the risk or liquidity associated with financial instruments at that level but rather the degree of judgment used in determining those values.
Valuation TechniquesEquity securities listed or regularly traded on a securities exchange or in the over-the-counter (OTC) market are valued at the last quoted sale price or, for certain markets, the official closing price at the time the valuations are made. OTC Bulletin Board securities are valued at the mean of the closing bid and asked prices. A security that is listed or traded on more than one exchange is valued at the quotation on the exchange determined to be the primary market for such security. Listed securities not traded on a particular day are valued at the mean of the closing bid and asked prices for domestic securities and the last quoted sale or closing price for international securities.
For valuation purposes, the last quoted prices of non-U.S. equity securities may be adjusted to reflect the fair value of such securities at the close of the NYSE. If the fund determines that developments between the close of a foreign market and the close of the NYSE will affect the value of some or all of its portfolio securities, the fund will adjust the previous quoted prices to reflect what it believes to be the fair value of the securities as of the close of the NYSE. In deciding whether it is necessary to adjust quoted prices to reflect fair value, the fund reviews a variety of factors, including developments in foreign markets, the performance of U.S. securities markets, and the performance of instruments trading in U.S. markets that represent foreign securities and baskets of foreign securities. The fund may also fair value securities in other situations, such as when a particular foreign market is closed but the fund is open. The fund uses outside pricing services to provide it with quoted prices and information to evaluate or adjust those prices. The fund cannot predict how often it will use quoted prices and how often it will determine it necessary to adjust those prices to reflect fair value. As a means of evaluating its security valuation process, the fund routinely compares quoted prices, the next day’s opening prices in the same markets, and adjusted prices.
Actively traded equity securities listed on a domestic exchange generally are categorized in Level 1 of the fair value hierarchy. Non-U.S. equity securities generally are categorized in Level 2 of the fair value hierarchy despite the availability of quoted prices because, as described above, the fund evaluates and determines whether those quoted prices reflect fair value at the close of the NYSE or require adjustment. OTC Bulletin Board securities, certain preferred securities, and equity securities traded in inactive markets generally are categorized in Level 2 of the fair value hierarchy.
Debt securities generally are traded in the over-the-counter (OTC) market and are valued at prices furnished by dealers who make markets in such securities or by an independent pricing service, which considers the yield or price of bonds of comparable quality, coupon, maturity, and type, as well as prices quoted by dealers who make markets in such securities. Generally, debt securities are categorized in Level 2 of the fair value hierarchy; however, to the extent the valuations include significant unobservable inputs, the securities would be categorized in Level 3.
Investments in mutual funds are valued at the mutual fund’s closing NAV per share on the day of valuation and are categorized in Level 1 of the fair value hierarchy. Financial futures contracts are valued at closing settlement prices and are categorized in Level 1 of the fair value hierarchy. Assets and liabilities other than financial instruments, including short-term receivables and payables, are carried at cost, or estimated realizable value, if less, which approximates fair value.
Thinly traded financial instruments and those for which the above valuation procedures are inappropriate or are deemed not to reflect fair value are stated at fair value as determined in good faith by the Valuation Committee. The objective of any fair value pricing determination is to arrive at a price that could reasonably be expected from a current sale. Financial instruments fair valued by the Valuation Committee are primarily private placements, restricted securities, warrants, rights, and other securities that are not publicly traded.
Subject to oversight by the Board, the Valuation Committee regularly makes good faith judgments to establish and adjust the fair valuations of certain securities as events occur and circumstances warrant. For instance, in determining the fair value of an equity investment with limited market activity, such as a private placement or a thinly traded public company stock, the Valuation Committee considers a variety of factors, which may include, but are not limited to, the issuer’s business prospects, its financial standing and performance, recent investment transactions in the issuer, new rounds of financing, negotiated transactions of significant size between other investors in the company, relevant market valuations of peer companies, strategic events affecting the company, market liquidity for the issuer, and general economic conditions and events. In consultation with the investment and pricing teams, the Valuation Committee will determine an appropriate valuation technique based on available information, which may include both observable and unobservable inputs. The Valuation Committee typically will afford greatest weight to actual prices in arm’s length transactions, to the extent they represent orderly transactions between market participants, transaction information can be reliably obtained, and prices are deemed representative of fair value. However, the Valuation Committee may also consider other valuation methods such as market-based valuation multiples; a discount or premium from market value of a similar, freely traded security of the same issuer; or some combination. Fair value determinations are reviewed on a regular basis and updated as information becomes available, including actual purchase and sale transactions of the issue. Because any fair value determination involves a significant amount of judgment, there is a degree of subjectivity inherent in such pricing decisions, and fair value prices determined by the Valuation Committee could differ from those of other market participants. Depending on the relative significance of unobservable inputs, including the valuation technique(s) used, fair valued securities may be categorized in Level 2 or 3 of the fair value hierarchy.
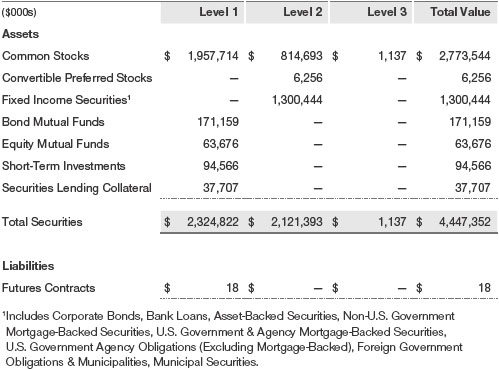
Valuation InputsThe following table summarizes the fund’s financial instruments, based on the inputs used to determine their fair values on June 30, 2019 (for further detail by category, please refer to the accompanying Portfolio of Investments):
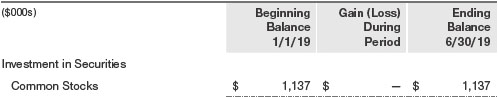
Following is a reconciliation of the fund’s Level 3 holdings for the six months ended June 30, 2019. Gain (loss) reflects both realized and change in unrealized gain/loss on Level 3 holdings during the period, if any, and is included on the accompanying Statement of Operations. The change in unrealized gain/loss on Level 3 instruments held at June 30, 2019, totaled $0 for the six months ended June 30, 2019.
NOTE 3 - DERIVATIVE INSTRUMENTS
During the six months ended June 30, 2019, the fund invested in derivative instruments. As defined by GAAP, a derivative is a financial instrument whose value is derived from an underlying security price, foreign exchange rate, interest rate, index of prices or rates, or other variable; it requires little or no initial investment and permits or requires net settlement. The fund invests in derivatives only if the expected risks and rewards are consistent with its investment objectives, policies, and overall risk profile, as described in its prospectus and Statement of Additional Information. The fund may use derivatives for a variety of purposes, such as seeking to hedge against declines in principal value, increase yield, invest in an asset with greater efficiency and at a lower cost than is possible through direct investment, to enhance return, or to adjust credit exposure.The risks associated with the use of derivatives are different from, and potentially much greater than, the risks associated with investing directly in the instruments on which the derivatives are based. The fund at all times maintains sufficient cash reserves, liquid assets, or other SEC-permitted asset types to cover its settlement obligations under open derivative contracts.
The fund values its derivatives at fair value and recognizes changes in fair value currently in its results of operations. Accordingly, the fund does not follow hedge accounting, even for derivatives employed as economic hedges. Generally, the fund accounts for its derivatives on a gross basis. It does not offset the fair value of derivative liabilities against the fair value of derivative assets on its financial statements, nor does it offset the fair value of derivative instruments against the right to reclaim or obligation to return collateral. As of June 30, 2019, the fund held interest rate futures with cumulative unrealized gain of $659,000 and cumulative unrealized loss of $27,000; the value reflected on the accompanying Statement of Assets and Liabilities is the related unsettled variation margin.
Additionally, during the six months ended June 30, 2019, the fund recognized $1,155,000 of realized gain on Futures and a $677,000 change in unrealized gain/loss on Futures related to its investments in interest rate derivatives; such amounts are included on the accompanying Statement of Operations.
Counterparty Risk and CollateralThe fund invests in exchange-traded or centrally cleared derivative contracts, such as futures, exchange-traded options, and centrally cleared swaps. Counterparty risk on such derivatives is minimal because the clearing-house provides protection against counterparty defaults. For futures and centrally cleared swaps, the fund is required to deposit collateral in an amount specified by the clearing-house and the clearing firm (margin requirement), and the margin requirement must be maintained over the life of the contract. Each clearinghouse and clearing firm, in its sole discretion, may adjust the margin requirements applicable to the fund.
Collateral may be in the form of cash or debt securities issued by the U.S. government or related agencies. Cash posted by the fund is reflected as cash deposits in the accompanying financial statements and generally is restricted from withdrawal by the fund; securities posted by the fund are so noted in the accompanying Portfolio of Investments; both remain in the fund’s assets. While typically not sold in the same manner as equity or fixed income securities, exchange-traded or centrally cleared derivatives may be closed out only on the exchange or clearinghouse where the contracts were traded. This ability is subject to the liquidity of underlying positions. As of June 30, 2019, securities valued at $534,000 had been posted by the fund for exchange-traded and/or centrally cleared derivatives.
Futures ContractsThe fund is subject to interest rate risk in the normal course of pursuing its investment objectives and uses futures contracts to help manage such risk. The fund may enter into futures contracts to manage exposure to interest rate and yield curve movements, security prices, foreign currencies, credit quality, and mortgage prepayments; as an efficient means of adjusting exposure to all or part of a target market; to enhance income; as a cash management tool; or to adjust portfolio duration and credit exposure. A futures contract provides for the future sale by one party and purchase by another of a specified amount of a specific underlying financial instrument at an agreed upon price, date, time, and place. The fund currently invests only in exchange-traded futures, which generally are standardized as to maturity date, underlying financial instrument, and other contract terms. Payments are made or received by the fund each day to settle daily fluctuations in the value of the contract (variation margin), which reflect changes in the value of the underlying financial instrument. Variation margin is recorded as unrealized gain or loss until the contract is closed. The value of a futures contract included in net assets is the amount of unsettled variation margin; net variation margin receivable is reflected as an asset and net variation margin payable is reflected as a liability on the accompanying Statement of Assets and Liabilities. Risks related to the use of futures contracts include possible illiquidity of the futures markets, contract prices that can be highly volatile and imperfectly correlated to movements in hedged security values and/or interest rates, and potential losses in excess of the fund’s initial investment. During the six months ended June 30, 2019, the volume of the fund’s activity in futures, based on underlying notional amounts, was generally between 0% and 3% of net assets.
NOTE 4 - OTHER INVESTMENT TRANSACTIONS
Consistent with its investment objective, the fund engages in the following practices to manage exposure to certain risks and/or to enhance performance. The investment objective, policies, program, and risk factors of the fund are described more fully in the fund’s prospectus and Statement of Additional Information.
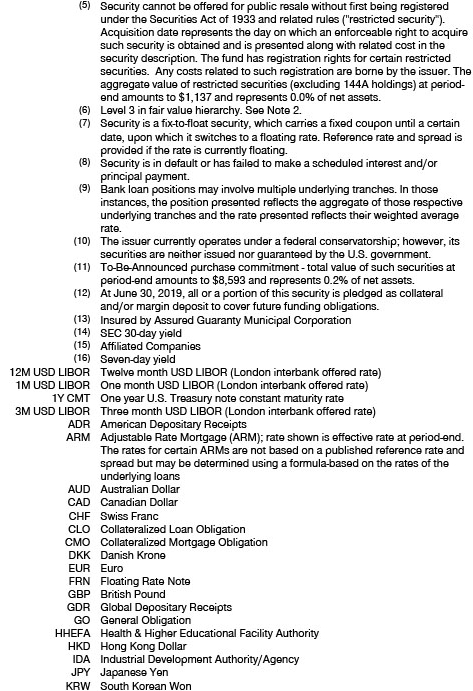
Restricted SecuritiesThe fund may invest in securities that are subject to legal or contractual restrictions on resale. Prompt sale of such securities at an acceptable price may be difficult and may involve substantial delays and additional costs.
Collateralized Loan ObligationsThe fund may invest in collateralized loan obligations (CLOs) which are entities backed by a diversified pool of syndicated bank loans. The cash flows of the CLO can be split into multiple segments, called “tranches” or “classes”, which will vary in risk profile and yield. The riskiest segments, which are the subordinate or “equity” tranches, bear the greatest risk of loss from defaults in the underlying assets of the CLO and serve to protect the other, more senior, tranches. Senior tranches will typically have higher credit ratings and lower yields than the securities underlying the CLO. Despite the protection from the more junior tranches, senior tranches can experience substantial losses.
TBA Purchase, Sale Commitments and Forward Settling Mortgage ObligationsThe fund may enter into to-be-announced (TBA) purchase or sale commitments (collectively, TBA transactions), pursuant to which it agrees to purchase or sell, respectively, mortgage-backed securities for a fixed unit price, with payment and delivery at a scheduled future date beyond the customary settlement period for such securities. With TBA transactions, the particular securities to be received or delivered by the fund are not identified at the trade date; however, the securities must meet specified terms, including issuer, rate, and mortgage term, and be within industry-accepted “good delivery” standards. The fund may enter into TBA transactions with the intention of taking possession of or relinquishing the underlying securities, may elect to extend the settlement by “rolling” the transaction, and/or may use TBA transactions to gain or reduce interim exposure to underlying securities. Until settlement, the fund maintains liquid assets sufficient to settle its commitment to purchase a TBA or, in the case of a sale commitment, the fund maintains an entitlement to the security to be sold.
To mitigate counterparty risk, the fund has entered into Master Securities Forward Transaction Agreements with counterparties that provide for collateral and the right to offset amounts due to or from those counterparties under specified conditions. Subject to minimum transfer amounts, collateral requirements are determined and transfers made based on the net aggregate unrealized gain or loss on all TBA commitments and other forward settling mortgage obligations with a particular counterparty (collectively, MSFTA Transactions). At any time, the fund’s risk of loss from a particular counterparty related to its MSFTA Transactions is the aggregate unrealized gain on appreciated MSFTA Transactions in excess of unrealized loss on depreciated MSFTA Transactions and collateral received, if any, from such counterparty. As of June 30, 2019, no collateral was pledged by the fund or counterparties for MSFTA Transactions.
Bank LoansThe fund may invest in bank loans, which represent an interest in amounts owed by a borrower to a syndicate of lenders. Bank loans are generally noninvestment grade and often involve borrowers whose financial condition is highly leveraged. Bank loans may be in the form of either assignments or participations. A loan assignment transfers all legal, beneficial, and economic rights to the buyer, and transfer typically requires consent of both the borrower and agent. In contrast, a loan participation generally entitles the buyer to receive the cash flows from principal, interest, and any fee payments on a portion of a loan; however, the seller continues to hold legal title to that portion of the loan. As a result, the buyer of a loan participation generally has no direct recourse against the borrower and is exposed to credit risk of both the borrower and seller of the participation. Bank loans often have extended settlement periods, generally may be repaid at any time at the option of the borrower, and may require additional principal to be funded at the borrowers’ discretion at a later date (e.g. unfunded commitments and revolving debt instruments). Until settlement, the fund maintains liquid assets sufficient to settle its unfunded loan commitments. The fund reflects both the funded portion of a bank loan as well as its unfunded commitment in the Portfolio of Investments. However, if a credit agreement provides no initial funding of a tranche and funding of the full commitment at a future date(s) is at the borrower’s discretion and considered uncertain, a loan is reflected in the Portfolio of Investments only if, and only to the extent that, the fund has actually settled a funding commitment.
Securities LendingThe fund may lend its securities to approved borrowers to earn additional income. Its securities lending activities are administered by a lending agent in accordance with a securities lending agreement. Security loans generally do not have stated maturity dates, and the fund may recall a security at any time. The fund receives collateral in the form of cash or U.S. government securities. Collateral is maintained over the life of the loan in an amount not less than the value of loaned securities; any additional collateral required due to changes in security values is delivered to the fund the next business day. Cash collateral is invested in accordance with investment guidelines approved by fund management. Additionally, the lending agent indemnifies the fund against losses resulting from borrower default. Although risk is mitigated by the collateral and indemnification, the fund could experience a delay in recovering its securities and a possible loss of income or value if the borrower fails to return the securities, collateral investments decline in value, and the lending agent fails to perform. Securities lending revenue consists of earnings on invested collateral and borrowing fees, net of any rebates to the borrower, compensation to the lending agent, and other administrative costs. In accordance with GAAP, investments made with cash collateral are reflected in the accompanying financial statements, but collateral received in the form of securities is not. At June 30, 2019, the value of loaned securities was $35,296,000; the value of cash collateral and related investments was $37,707,000.
Mortgage-Backed SecuritiesThe fund may invest in mortgage-backed securities (MBS or pass-through certificates) that represent an interest in a pool of specific underlying mortgage loans and entitle the fund to the periodic payments of principal and interest from those mortgages. MBS may be issued by government agencies or corporations, or private issuers. Most MBS issued by government agencies are guaranteed; however, the degree of protection differs based on the issuer. MBS are sensitive to changes in economic conditions that affect the rate of prepayments and defaults on the underlying mortgages; accordingly, the value, income, and related cash flows from MBS may be more volatile than other debt instruments.
OtherPurchases and sales of portfolio securities other than short-term and U.S. government securities aggregated $694,994,000 and $641,753,000, respectively, for the six months ended June 30, 2019. Purchases and sales of U.S. government securities aggregated $384,688,000 and $343,301,000, respectively, for the six months ended June 30, 2019.
NOTE 5 - FEDERAL INCOME TAXES
No provision for federal income taxes is required since the fund intends to continue to qualify as a regulated investment company under Subchapter M of the Internal Revenue Code and distribute to shareholders all of its taxable income and gains. Distributions determined in accordance with federal income tax regulations may differ in amount or character from net investment income and realized gains for financial reporting purposes. Financial reporting records are adjusted for permanent book/tax differences to reflect tax character but are not adjusted for temporary differences. The amount and character of tax-basis distributions and composition of net assets are finalized at fiscal year-end; accordingly, tax-basis balances have not been determined as of the date of this report.
At June 30, 2019, the cost of investments for federal income tax purposes was $3,365,893,000. Net unrealized gain aggregated $1,082,094,000 at period-end, of which $1,174,662,000 related to appreciated investments and $92,568,000 related to depreciated investments.
NOTE 6 - RELATED PARTY TRANSACTIONS
The fund is managed by T. Rowe Price Associates, Inc. (Price Associates), a wholly owned subsidiary of T. Rowe Price Group, Inc. (Price Group). The investment management agreement between the fund and Price Associates provides for an annual investmentmanagement fee, which is computed daily and paid monthly. The fee consists of an individual fund fee, equal to 0.15% of the fund’s average daily net assets, and a group fee. The group fee rate is calculated based on the combined net assets of certain mutual funds sponsored by Price Associates (the group) applied to a graduated fee schedule, with rates ranging from 0.48% for the first $1 billion of assets to 0.265% for assets in excess of $650 billion. The fund’s group fee is determined by applying the group fee rate to the fund’s average daily net assets. At June 30, 2019, the effective annual group fee rate was 0.29%.
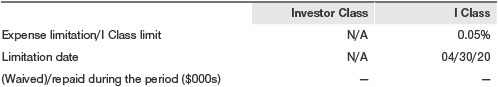
The I Class is subject to an operating expense limitation (I Class Limit) pursuant to which Price Associates is contractually required to pay all operating expenses of the I Class, excluding management fees; interest; expenses related to borrowings, taxes, and brokerage; and other non-recurring expenses permitted by the investment management agreement, to the extent such operating expenses, on an annualized basis, exceed the I Class Limit. This agreement will continue through the limitation date indicated in the table below, and may be renewed, revised, or revoked only with approval of the fund’s Board. The I Class is required to repay Price Associates for expenses previously paid to the extent the class’s net assets grow or expenses decline sufficiently to allow repayment without causing the class’s operating expenses (after the repayment is taken into account) to exceed the lesser of: (1) the I Class Limit in place at the time such amounts were paid; or (2) the current I Class Limit. However, no repayment will be made more than three years after the date of a payment or waiver.
In addition, the fund has entered into service agreements with Price Associates and two wholly owned subsidiaries of Price Associates, each an affiliate of the fund (collectively, Price). Price Associates provides certain accounting and administrative services to the fund. T. Rowe Price Services, Inc. provides shareholder and administrative services in its capacity as the fund’s transfer and dividend-disbursing agent. T. Rowe Price Retirement Plan Services, Inc. provides subaccounting and recordkeeping services for certain retirement accounts invested in the Investor Class. For the six months ended June 30, 2019, expenses incurred pursuant to these service agreements were $34,000 for Price Associates; $563,000 for T. Rowe Price Services, Inc.; and $832,000 for T. Rowe Price Retirement Plan Services, Inc. All amounts due to and due from Price, exclusive of investment management fees payable, are presented net on the accompanying Statement of Assets and Liabilities.
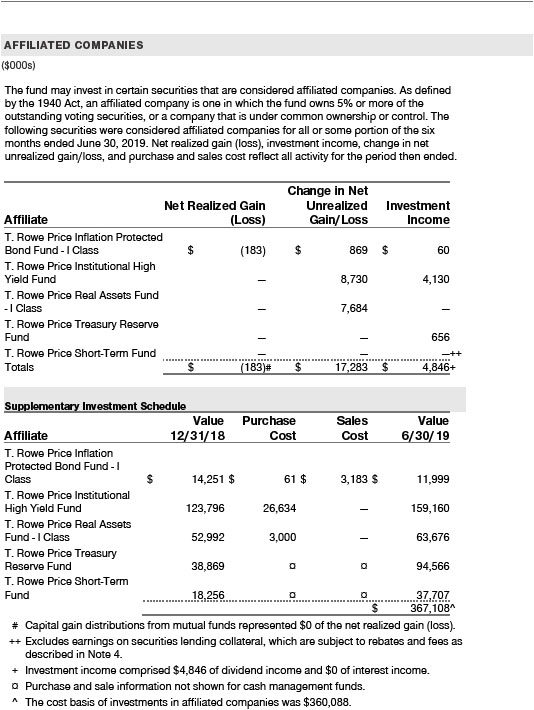
The fund may invest its cash reserves in certain open-end management investment companies managed by Price Associates and considered affiliates of the fund: the T. Rowe Price Government Reserve Fund or the T. Rowe Price Treasury Reserve Fund, organized as money market funds, or the T. Rowe Price Short-Term Fund, a short-term bond fund (collectively, the Price Reserve Funds). The Price Reserve Funds are offered as short-term investment options to mutual funds, trusts, and other accounts managed by Price Associates or its affiliates and are not available for direct purchase by members of the public. Cash collateral from securities lending is invested in the T. Rowe Price Short-Term Fund. The Price Reserve Funds pay no investment management fees.
The fund may also invest in certain other T. Rowe Price funds (Price Funds) as a means of gaining efficient and cost-effective exposure to certain markets. The fund does not invest for the purpose of exercising management or control; however, investments by the fund may represent a significant portion of an underlying Price Fund’s net assets. Each underlying Price Fund is an open-end management investment company managed by Price Associates and is considered an affiliate of the fund. To ensure that the fund does not incur duplicate management fees (paid by the underlying Price Fund(s) and the fund), Price Associates has agreed to permanently waive a portion of its management fee charged to the fund in an amount sufficient to fully offset that portion of management fees paid by each underlying Price Fund related to the fund’s investment therein. Annual management fee rates and amounts waived related to investments in the underlying Price Fund(s) for the six months ended June 30, 2019, are as follows:

Total management fee waived was allocated ratably in the amounts of $472,000 in Investor Class and $61,000 in I Class, respectively, for the six months ended June 30, 2019.
The fund may participate in securities purchase and sale transactions with other funds or accounts advised by Price Associates (cross trades), in accordance with procedures adopted by the fund’s Board and Securities and Exchange Commission rules, which require, among other things, that such purchase and sale cross trades be effected at the independent current market price of the security. During the six months ended June 30, 2019, the fund had no purchases or sales cross trades with other funds or accounts advised by Price Associates.
INFORMATION ON PROXY VOTING POLICIES, PROCEDURES, AND RECORDS
A description of the policies and procedures used by T. Rowe Price funds and portfolios to determine how to vote proxies relating to portfolio securities is available in each fund’s Statement of Additional Information. You may request this document by calling 1-800-225-5132 or by accessing the SEC’s website, sec.gov.
The description of our proxy voting policies and procedures is also available on our corporate website. To access it, please visit the following Web page:
https://www3.troweprice.com/usis/corporate/en/utility/policies.html
Scroll down to the section near the bottom of the page that says, “Proxy Voting Policies.” Click on the Proxy Voting Policies link in the shaded box.
Each fund’s most recent annual proxy voting record is available on our website and through the SEC’s website. To access it through T. Rowe Price, visit the website location shown above, and scroll down to the section near the bottom of the page that says, “Proxy Voting Records.” Click on the Proxy Voting Records link in the shaded box.
HOW TO OBTAIN QUARTERLY PORTFOLIO HOLDINGS
Effective for reporting periods on or after March 1, 2019, a fund, except a money market fund, files a complete schedule of portfolio holdings with the Securities and Exchange Commission (SEC) for the first and third quarters of each fiscal year as an exhibit to its reports on Form N-PORT. Prior to March 1, 2019, a fund, including a money market fund, filed a complete schedule of portfolio holdings with the SEC for the first and third quarters of each fiscal year on Form N-Q. A money market fund files detailed month-end portfolio holdings information on Form N-MFP with the SEC each month and posts a complete schedule of portfolio holdings on its website (troweprice.com) as of each month-end for the previous six months. A fund’s Forms N-PORT, N-MFP and N-Q are available electronically on the SEC’s website (sec.gov).
APPROVAL OF INVESTMENT MANAGEMENT AGREEMENT
Each year, the fund’s Board of Directors (Board) considers the continuation of the investment management agreement (Advisory Contract) between the fund and its investment advisor, T. Rowe Price Associates, Inc. (Advisor), on behalf of the fund. In that regard, at an in-person meeting held on March 11–12, 2019 (Meeting), the Board, including a majority of the fund’s independent directors, approved the continuation of the fund’s Advisory Contract. At the Meeting, the Board considered the factors and reached the conclusions described below relating to the selection of the Advisor and the approval of the Advisory Contract. The independent directors were assisted in their evaluation of the Advisory Contract by independent legal counsel from whom they received separate legal advice and with whom they met separately.
In providing information to the Board, the Advisor was guided by a detailed set of requests for information submitted by independent legal counsel on behalf of the independent directors. In considering and approving the Advisory Contract, the Board considered the information it believed was relevant, including, but not limited to, the information discussed below. The Board considered not only the specific information presented in connection with the Meeting but also the knowledge gained over time through interaction with the Advisor about various topics. The Board meets regularly and, at each of its meetings, covers an extensive agenda of topics and materials and considers factors that are relevant to its annual consideration of the renewal of the T. Rowe Price funds’ advisory contracts, including performance and the services and support provided to the funds and their shareholders.
Services Provided by the Advisor
The Board considered the nature, quality, and extent of the services provided to the fund by the Advisor. These services included, but were not limited to, directing the fund’s investments in accordance with its investment program and the overall management of the fund’s portfolio, as well as a variety of related activities such as financial, investment operations, and administrative services; compliance; maintaining the fund’s records and registrations; and shareholder communications. The Board also reviewed the background and experience of the Advisor’s senior management team and investment personnel involved in the management of the fund, as well as the Advisor’s compliance record. The Board concluded that it was satisfied with the nature, quality, and extent of the services provided by the Advisor.
Investment Performance of the Fund
The Board took into account discussions with the Advisor and reports that it receives throughout the year relating to fund performance. In connection with the Meeting, the Board reviewed the fund’s net annualized total returns for the 1-, 2-, 3-, 4-, 5-, and 10-year periods as of September 30, 2018, and compared these returns with the performance of a peer group of funds with similar investment programs and a wide variety of other previously agreed-upon comparable performance measures and market data, including those supplied by Broadridge, which is an independent provider of mutual fund data.
On the basis of this evaluation and the Board’s ongoing review of investment results, and factoring in the relative market conditions during certain of the performance periods, the Board concluded that the fund’s performance was satisfactory.
Costs, Benefits, Profits, and Economies of Scale
The Board reviewed detailed information regarding the revenues received by the Advisor under the Advisory Contract and other benefits that the Advisor (and its affiliates) may have realized from its relationship with the fund, including any research received under “soft dollar” agreements and commission-sharing arrangements with broker-dealers.The Board considered that the Advisor may receive some benefit from soft-dollar arrangements pursuant to which research is received from broker-dealers that execute the fund’s portfolio transactions. The Board received information on the estimated costs incurred and profits realized by the Advisor from managing the T. Rowe Price funds. The Board also reviewed estimates of the profits realized from managing the fund in particular, and the Board concluded that the Advisor’s profits were reasonable in light of the services provided to the fund.
The Board also considered whether the fund benefits under the fee levels set forth in the Advisory Contract from any economies of scale realized by the Advisor. Under the Advisory Contract, the fund pays a fee to the Advisor for investment management services composed of two components—a group fee rate based on the combined average net assets of most of the T. Rowe Price funds (including the fund) that declines at certain asset levels and an individual fund fee rate based on the fund’s average daily net assets—and the fund pays its own expenses of operations. The Board concluded that the advisory fee structure for the fund continued to provide for a reasonable sharing of benefits from any economies of scale with the fund’s investors.
Fees and Expenses
The Board was provided with information regarding industry trends in management fees and expenses. Among other things, the Board reviewed data for peer groups that were compiled by Broadridge, which compared: (i) contractual management fees, total expenses, actual management fees, and nonmanagement expenses of the Investor Class of the fund with a group of competitor funds selected by Broadridge (Expense Group) and (ii) total expenses, actual management fees, and nonmanagement expenses of the Investor Class of the fund with a broader set of funds within the Lipper investment classification (Expense Universe). The Board considered the fund’s contractual management fee rate, actual management fee rate (which reflects the management fees actually received from the fund by the Advisor after any applicable waivers, reductions, or reimbursements), operating expenses, and total expenses (which reflect the net total expense ratio of the fund after any waivers, reductions, or reimbursements) in comparison with the information for the Broadridge peer groups. Broadridge generally constructed the peer groups by seeking the most comparable funds based on similar investment classifications and objectives, expense structure, asset size, and operating components and attributes and ranked funds into quintiles, with the first quintile representing thefunds with the lowest relative expenses and the fifth quintile representing the funds with the highest relative expenses. When compared against mixed-asset target allocation growth funds, the information provided to the Board indicated that the fund’s contractual management fee ranked in the first quintile (Expense Group), the fund’s actual management fee rate ranked in the first quintile (Expense Group and Expense Universe), and the fund’s total expenses ranked in the first quintile (Expense Group and Expense Universe). When compared against balanced funds at the request of the Advisor, the information provided to the Board indicated that the fund’s contractual management fee ranked in the first quintile (Expense Group), the fund’s actual management fee rate ranked in the first quintile (Expense Group and Expense Universe), and the fund’s total expenses ranked in the first quintile (Expense Group and Expense Universe).
The Board also reviewed the fee schedules for institutional accounts and private accounts with similar mandates that are advised or subadvised by the Advisor and its affiliates. Management provided the Board with information about the Advisor’s responsibilities and services provided to subadvisory and other institutional account clients, including information about how the requirements and economics of the institutional business are fundamentally different from those of the mutual fund business. The Board considered information showing that the Advisor’s mutual fund business is generally more complex from a business and compliance perspective than its institutional account business and considered various relevant factors, such as the broader scope of operations and oversight, more extensive shareholder communication infrastructure, greater asset flows, heightened business risks, and differences in applicable laws and regulations associated with the Advisor’s proprietary mutual fund business. In assessing the reasonableness of the fund’s management fee rate, the Board considered the differences in the nature of the services required for the Advisor to manage its mutual fund business versus managing a discrete pool of assets as a subadvisor to another institution’s mutual fund or for an institutional account and that the Advisor generally performs significant additional services and assumes greater risk in managing the fund and other T. Rowe Price funds than it does for institutional account clients.
On the basis of the information provided and the factors considered, the Board concluded that the fees paid by the fund under the Advisory Contract are reasonable.
Approval of the Advisory Contract
As noted, the Board approved the continuation of the Advisory Contract. No single factor was considered in isolation or to be determinative to the decision. Rather, the Board concluded, in light of a weighting and balancing of all factors considered, that it was in the best interests of the fund and its shareholders for the Board to approve the continuation of the Advisory Contract (including the fees to be charged for services thereunder).
Item 1. (b) Notice pursuant to Rule 30e-3.
Not applicable.
Item 2. Code of Ethics.
A code of ethics, as defined in Item 2 of Form N-CSR, applicable to its principal executive officer, principal financial officer, principal accounting officer or controller, or persons performing similar functions is filed as an exhibit to the registrant’s annual Form N-CSR. No substantive amendments were approved or waivers were granted to this code of ethics during the registrant’s most recent fiscal half-year.
Item 3. Audit Committee Financial Expert.
Disclosure required in registrant’s annual Form N-CSR.
Item 4. Principal Accountant Fees and Services.
Disclosure required in registrant’s annual Form N-CSR.
Item 5. Audit Committee of Listed Registrants.
Not applicable.
Item 6. Investments.
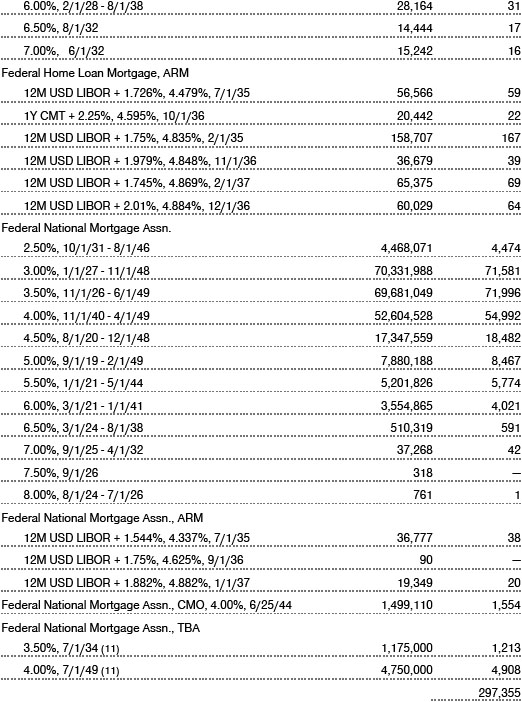
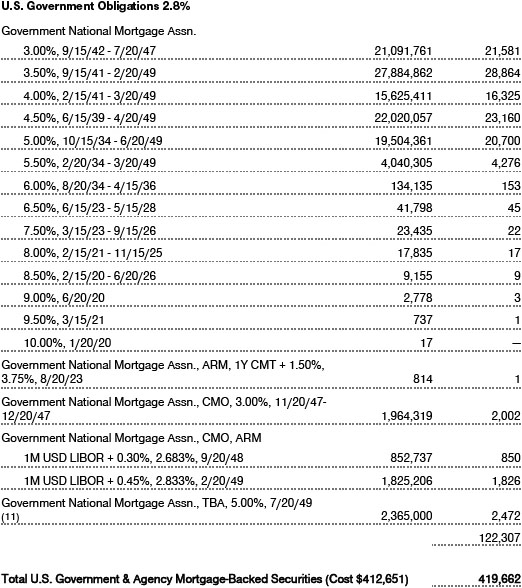
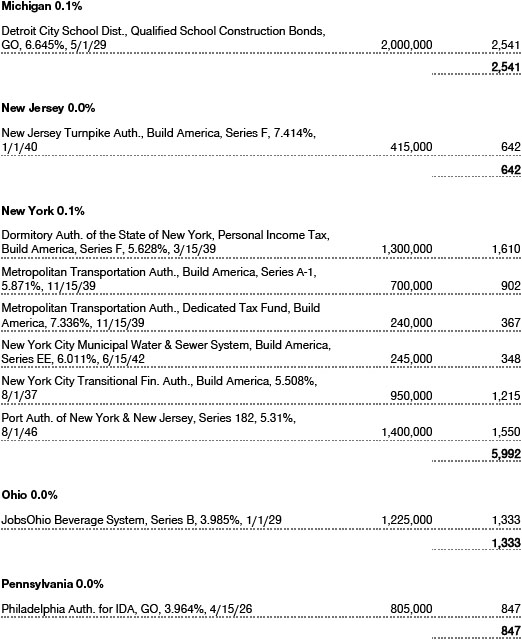
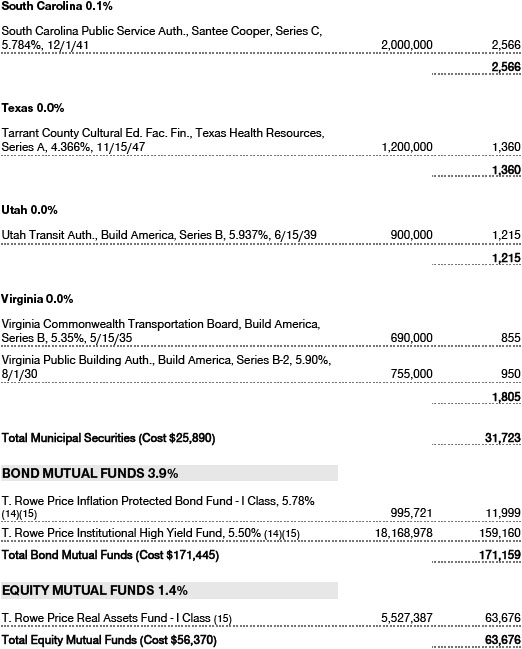
(a) Not applicable. The complete schedule of investments is included in Item 1 of this Form N-CSR.
(b) Not applicable.
Item 7. Disclosure of Proxy Voting Policies and Procedures for Closed-End Management Investment Companies.
Not applicable.
Item 8. Portfolio Managers of Closed-End Management Investment Companies.
Not applicable.
Item 9. Purchases of Equity Securities by Closed-End Management Investment Company and Affiliated Purchasers.
Not applicable.
Item 10. Submission of Matters to a Vote of Security Holders.
Not applicable.
Item 11. Controls and Procedures.
(a) The registrant’s principal executive officer and principal financial officer have evaluated the registrant’s disclosure controls and procedures within 90 days of this filing and have concluded that the registrant’s disclosure controls and procedures were effective, as of that date, in ensuring that information required to be disclosed by the registrant in this Form N-CSR was recorded, processed, summarized, and reported timely.
(b) The registrant’s principal executive officer and principal financial officer are aware of no change in the registrant’s internal control over financial reporting that occurred during the period covered by this report that has materially affected, or is reasonably likely to materially affect, the registrant’s internal control over financial reporting.
Item 12. Disclosure of Securities Lending Activities for Closed-End Management Investment Companies.
Not applicable.
Item 13. Exhibits.
(a)(1) The registrant’s code of ethics pursuant to Item 2 of Form N-CSR is filed with the registrant’s annual Form N-CSR.
(2) Separate certifications by the registrant's principal executive officer and principal financial officer, pursuant to Section 302 of the Sarbanes-Oxley Act of 2002 and required by Rule 30a-2(a) under the Investment Company Act of 1940, are attached.
(3) Written solicitation to repurchase securities issued by closed-end companies: not applicable.
(b) A certification by the registrant's principal executive officer and principal financial officer, pursuant to Section 906 of the Sarbanes-Oxley Act of 2002 and required by Rule 30a-2(b) under the Investment Company Act of 1940, is attached.
SIGNATURES
Pursuant to the requirements of the Securities Exchange Act of 1934 and the Investment Company Act of 1940, the registrant has duly caused this report to be signed on its behalf by the undersigned, thereunto duly authorized.
T. Rowe Price Balanced Fund, Inc.
| By | /s/ David Oestreicher | |||||
| David Oestreicher | ||||||
| Principal Executive Officer | ||||||
| Date | August 16, 2019 | |||||
Pursuant to the requirements of the Securities Exchange Act of 1934 and the Investment Company Act of 1940, this report has been signed below by the following persons on behalf of the registrant and in the capacities and on the dates indicated.
| By | /s/ David Oestreicher | |||||
| David Oestreicher | ||||||
| Principal Executive Officer | ||||||
| Date | August 16, 2019 | |||||
| By | /s/ Catherine D. Mathews | |||||
| Catherine D. Mathews | ||||||
| Principal Financial Officer | ||||||
| Date | August 16, 2019 | |||||