Free Writing Prospectus
Filed Pursuant to Rule 433
Registration Statement Nos. 333-206773, 333-206773-01 and 333-206773-02
Floorplan securitization

Registration Statement Nos. 333-206773, 333-206773-01 and 333-206773-02 Ford Credit Floorplan Corporation and Ford Credit Floorplan LLC (the "depositors") Ford Credit Floorplan Master Owner Trust A (the "issuer") This document constitutes a free writing prospectus for purposes of the Securities Act of 1933. The depositors have filed a registration statement (including a prospectus) with the SEC for the offering to which this communication relates. Before you invest, you should read the prospectus in that registration statement and other documents the depositors have filed with the SEC for more complete information about the depositors, the issuer and this offering. You may get these documents for free by visiting EDGAR on the SEC Website at www.sec.gov. Alternatively, you may request that a copy of the prospectus be sent to you by calling toll-free 1-888-603-5847. Free Writing Prospectus F-1

Ford Credit has been financing dealer vehicle inventory since 1959 and has been securitizing floorplan loans since 1991 Over the past five years, Ford Credit financed approximately 76% to 80% of all Ford and Lincoln dealer new vehicle inventory in the U.S. Floorplan receivables are secured primarily by the financed vehicles and payment is required when the vehicle is sold Ford Credit’s floorplan portfolio has historically experienced very low losses Low losses are primarily a function of strong risk management practices and servicing: Continuous dealer monitoring of: Financial health Payment performance Vehicle collateral status Intensification of risk management actions as dealer risk increases Use of proprietary risk rating assessment and behavioral scoring models Ford Credit leverages access to dealer information through Ford relationship Ford Credit regularly audits dealer inventory and sales records by VIN to verify each receivable is paid following the sale of the financed vehicle floorplan OVERVIEW Floorplan Securitization F-2
Ford Credit’s current floorplan securitization trust was established in 2001 as a master trust (similar to a revolving credit card securitization trust) and has issued more than 40 series The Trust offers floorplan asset-backed securities though various channels: Public transactions Rule 144A transactions Other private transactions trust OVERVIEW Floorplan securitization F-3
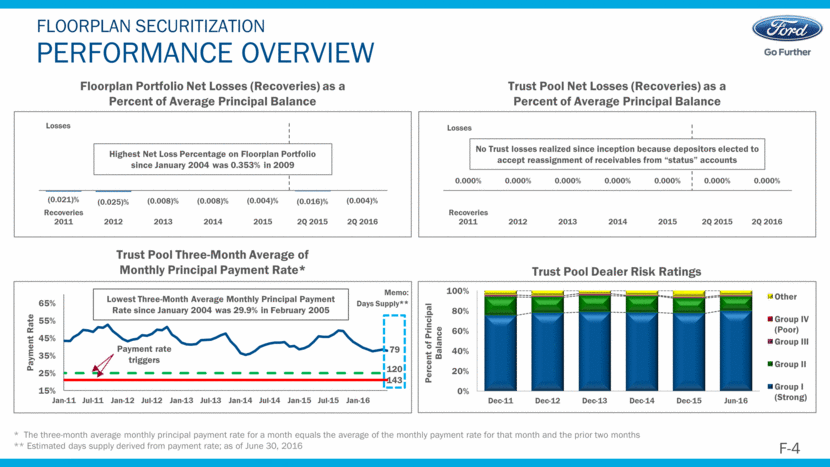
Performance overview Floorplan securitization Floorplan Portfolio Net Losses (Recoveries) as a Percent of Average Principal Balance Trust Pool Net Losses (Recoveries) as a Percent of Average Principal Balance Trust Pool Three-Month Average of Monthly Principal Payment Rate* Trust Pool Dealer Risk Ratings * The three-month average monthly principal payment rate for a month equals the average of the monthly payment rate for that month and the prior two months ** Estimated days supply derived from payment rate; as of June 30, 2016 Memo: Days Supply** Lowest Three-Month Average Monthly Principal Payment Rate since January 2004 was 29.9% in February 2005 No Trust losses realized since inception because depositors elected to accept reassignment of receivables from “status” accounts F-4 15% 25% 35% 45% 55% 65% Jan-11 Jul-11 Jan-12 Jul-12 Jan-13 Jul-13 Jan-14 Jul-14 Jan-15 Jul-15 Jan-16 Payment Rate Payment rate triggers 79 120 143 0.000% 0.000% 0.000% 0.000% 0.000% 0.000% 0.000% Recoveries 2011 2012 2013 2014 2015 2Q 2015 2Q 2016 Losses 0% 20% 40% 60% 80% 100% Dec-11 Dec-12 Dec-13 Dec-14 Dec-15 Jun-16 Percent of Principal Balance Other Group IV (Poor) Group III Group II Group I (Strong) (0.021)% (0.025)% (0.008)% (0.008)% (0.004)% (0.016)% (0.004)% Recoveries 2011 2012 2013 2014 2015 2Q 2015 2Q 2016 Losses Highest Net Loss Percentage on Floorplan Portfolio since January 2004 was 0.353% in 2009
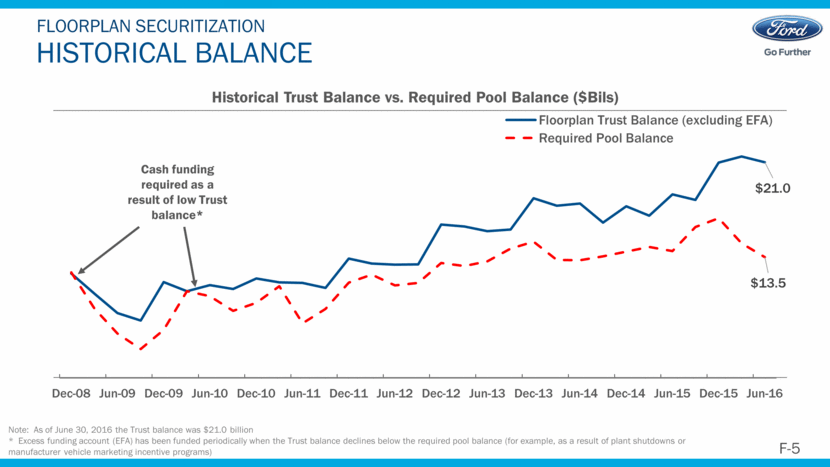
Note: As of June 30, 2016 the Trust balance was $21.0 billion * Excess funding account (EFA) has been funded periodically when the Trust balance declines below the required pool balance (for example, as a result of plant shutdowns or manufacturer vehicle marketing incentive programs) Historical Balance Floorplan securitization Cash funding required as a result of low Trust balance* Historical Trust Balance vs. Required Pool Balance ($Bils) F-5 $21.0 $13.5 Dec-08 Jun-09 Dec-09 Jun-10 Dec-10 Jun-11 Dec-11 Jun-12 Dec-12 Jun-13 Dec-13 Jun-14 Dec-14 Jun-15 Dec-15 Jun-16 Floorplan Trust Balance (excluding EFA) Required Pool Balance
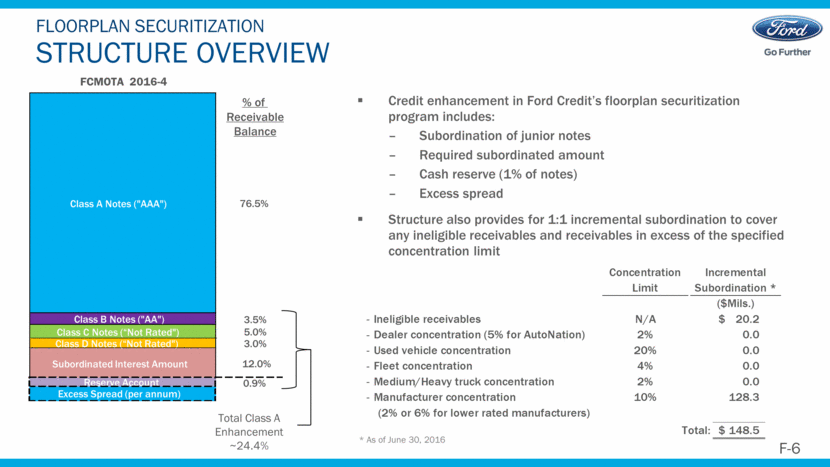
Credit enhancement in Ford Credit’s floorplan securitization program includes: Subordination of junior notes Required subordinated amount Cash reserve (1% of notes) Excess spread Structure also provides for 1:1 incremental subordination to cover any ineligible receivables and receivables in excess of the specified concentration limit structure OVERVIEW Floorplan securitization * As of June 30, 2016 % of Receivable Balance Total Class A Enhancement ~24.4% Class A Notes ("AAA") 76.5% Class B Notes ("AA") 3.5% Class C Notes (“Not Rated") 5.0% Class D Notes (“Not Rated") 3.0% Subordinated Interest Amount 12.0% Reserve Account 0.9% Excess Spread (per annum) F-6 FCMOTA 2016-4 Concentration Limit Incremental Subordination * ($Mils.) Ineligible receivables N/A $ 20.2 Dealer concentration (5% for AutoNation) 2% 0.0 Used vehicle concentration 20% 0.0 Fleet concentration 4% 0.0 Medium/Heavy truck concentration 2% 0.0 Manufacturer concentration 10% 128.3 (2% or 6% for lower rated manufacturers) Total: $ 148.5
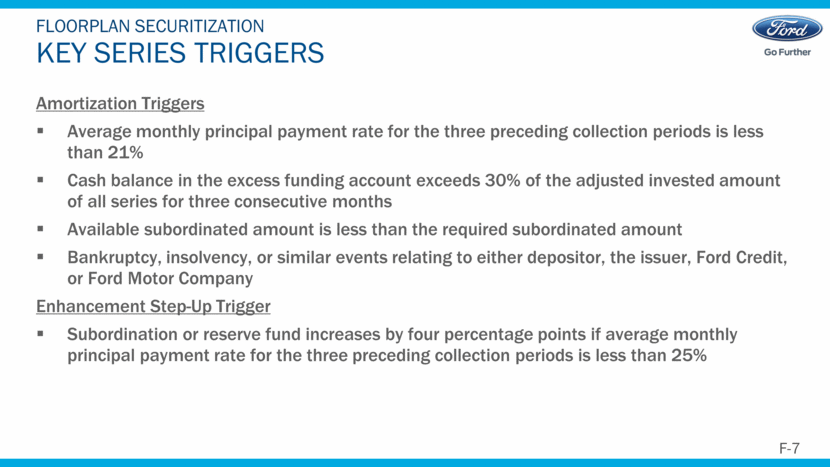
Amortization Triggers Average monthly principal payment rate for the three preceding collection periods is less than 21% Cash balance in the excess funding account exceeds 30% of the adjusted invested amount of all series for three consecutive months Available subordinated amount is less than the required subordinated amount Bankruptcy, insolvency, or similar events relating to either depositor, the issuer, Ford Credit, or Ford Motor Company Enhancement Step-Up Trigger Subordination or reserve fund increases by four percentage points if average monthly principal payment rate for the three preceding collection periods is less than 25% Key Series Triggers Floorplan securitization F-7
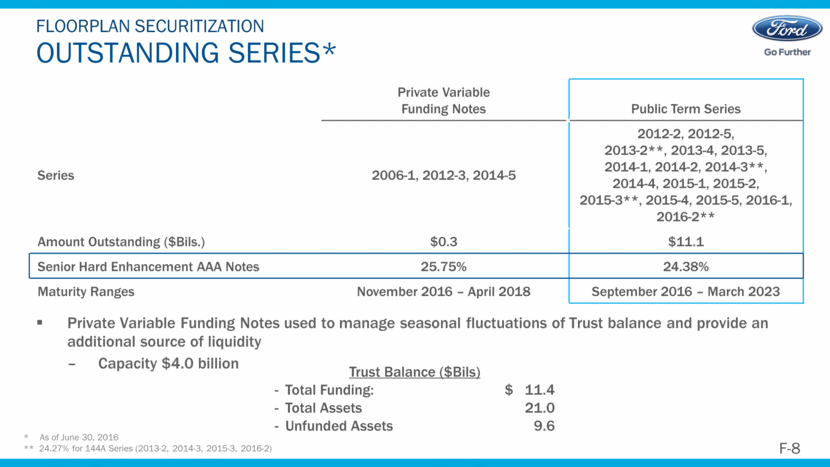
Private Variable Funding Notes Public Term Series Series 2006-1, 2012-3, 2014-5 2012-2, 2012-5, 2013-2**, 2013-4, 2013-5, 2014-1, 2014-2, 2014-3**, 2014-4, 2015-1, 2015-2, 2015-3**, 2015-4, 2015-5, 2016-1, 2016-2** Amount Outstanding ($Bils.) $0.3 $11.1 Senior Hard Enhancement AAA Notes 25.75% 24.38% Maturity Ranges November 2016 – April 2018 September 2016 – March 2023 Private Variable Funding Notes used to manage seasonal fluctuations of Trust balance and provide an additional source of liquidity Capacity $4.0 billion OUTSTANDING SERIES* Floorplan securitization * As of June 30, 2016 ** 24.27% for 144A Series (2013-2, 2014-3, 2015-3, 2016-2) Trust Balance ($Bils) Total Funding: $ 11.4 Total Assets 21.0 Unfunded Assets 9.6 F-8
Servicing and risk management
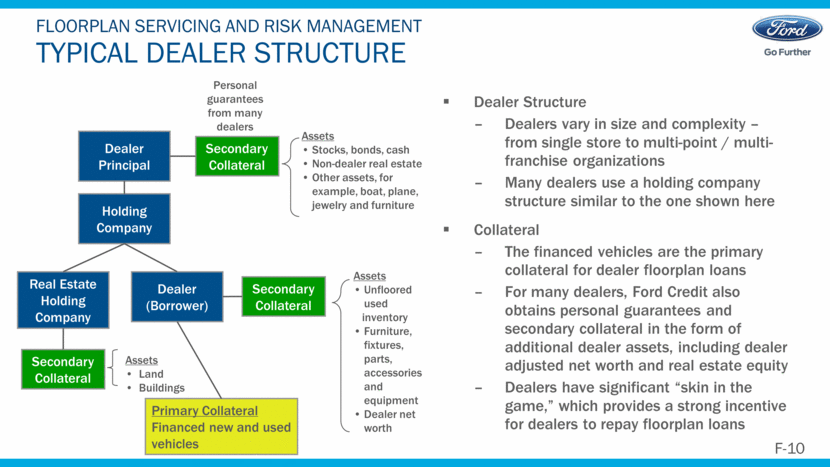
Dealer Structure Dealers vary in size and complexity – from single store to multi-point / multi-franchise organizations Many dealers use a holding company structure similar to the one shown here Collateral The financed vehicles are the primary collateral for dealer floorplan loans For many dealers, Ford Credit also obtains personal guarantees and secondary collateral in the form of additional dealer assets, including dealer adjusted net worth and real estate equity Dealers have significant “skin in the game,” which provides a strong incentive for dealers to repay floorplan loans Typical Dealer Structure Floorplan Servicing and risk management Assets Stocks, bonds, cash Non-dealer real estate Other assets, for example, boat, plane, jewelry and furniture Assets Unfloored used inventory Furniture, fixtures, parts, accessories and equipment Dealer net worth Assets Land Buildings Personal guarantees from many dealers Dealer Principal Secondary Collateral Holding Company Real Estate Holding Company Dealer (Borrower) Secondary Collateral Secondary Collateral Primary Collateral Financed new and used vehicles F-10
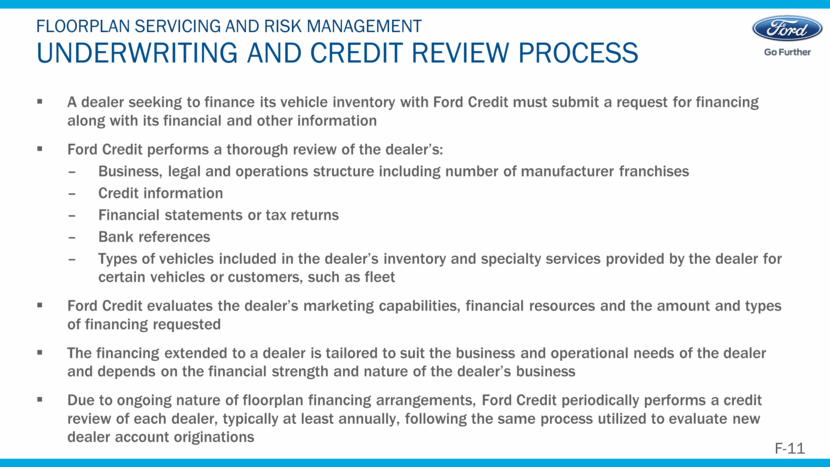
A dealer seeking to finance its vehicle inventory with Ford Credit must submit a request for financing along with its financial and other information Ford Credit performs a thorough review of the dealer’s: Business, legal and operations structure including number of manufacturer franchises Credit information Financial statements or tax returns Bank references Types of vehicles included in the dealer’s inventory and specialty services provided by the dealer for certain vehicles or customers, such as fleet Ford Credit evaluates the dealer’s marketing capabilities, financial resources and the amount and types of financing requested The financing extended to a dealer is tailored to suit the business and operational needs of the dealer and depends on the financial strength and nature of the dealer’s business Due to ongoing nature of floorplan financing arrangements, Ford Credit periodically performs a credit review of each dealer, typically at least annually, following the same process utilized to evaluate new dealer account originations Underwriting and credit review process Floorplan Servicing and risk management F-11
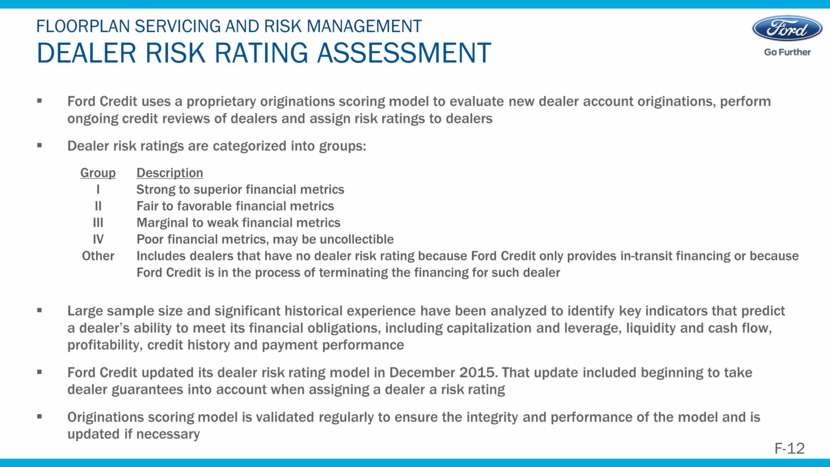
Ford Credit uses a proprietary originations scoring model to evaluate new dealer account originations, perform ongoing credit reviews of dealers and assign risk ratings to dealers Dealer risk ratings are categorized into groups: Large sample size and significant historical experience have been analyzed to identify key indicators that predict a dealer’s ability to meet its financial obligations, including capitalization and leverage, liquidity and cash flow, profitability, credit history and payment performance Ford Credit updated its dealer risk rating model in December 2015. That update included beginning to take dealer guarantees into account when assigning a dealer a risk rating Originations scoring model is validated regularly to ensure the integrity and performance of the model and is updated if necessary Dealer RISK RATING Assessment Floorplan Servicing and risk management Group Description I Strong to superior financial metrics II Fair to favorable financial metrics III Marginal to weak financial metrics IV Poor financial metrics, may be uncollectible Other Includes dealers that have no dealer risk rating because Ford Credit only provides in-transit financing or because Ford Credit is in the process of terminating the financing for such dealer F-12
Ford Credit uses a proprietary behavioral scoring model, Monthly Accounts Review (MAR), to assess each dealer monthly MAR rating directs the intensity and frequency of Ford Credit’s dealer monitoring and controls Large sample size and significant historical experience have been analyzed to identify key indicators that predict a dealer’s near-term ability to meet its financial obligations MAR utilizes the dealer’s most recent unadjusted financial metrics, payment performance and credit line utilization MAR allows Ford Credit to identify behavior risks and appropriately allocate resources to resolve issues before they escalate MAR is validated regularly to ensure integrity and performance of the model and is updated if necessary Dealer Behavioral Assessment Floorplan Servicing and risk management F-13
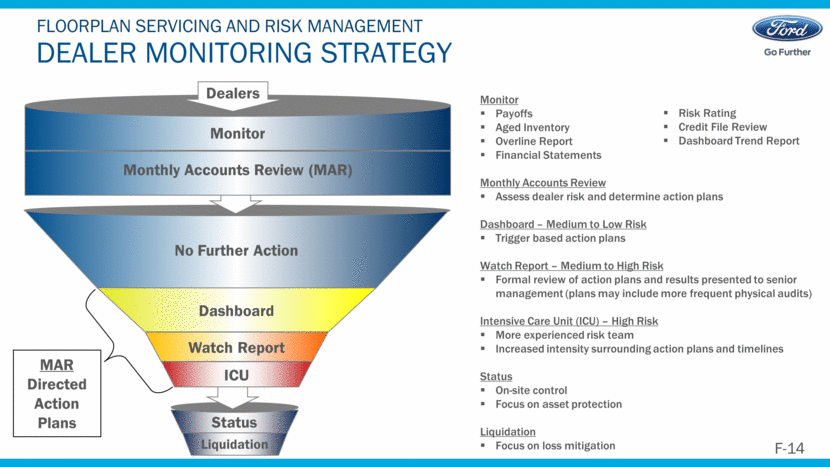
Dealer Monitoring Strategy Floorplan Servicing and risk management Monitor Payoffs Aged Inventory Overline Report Financial Statements Monthly Accounts Review Assess dealer risk and determine action plans Dashboard – Medium to Low Risk Trigger based action plans Watch Report – Medium to High Risk Formal review of action plans and results presented to senior management (plans may include more frequent physical audits) Intensive Care Unit (ICU) – High Risk More experienced risk team Increased intensity surrounding action plans and timelines Status On-site control Focus on asset protection Liquidation Focus on loss mitigation Risk Rating Credit File Review Dashboard Trend Report Liquidation Monitor Dealers Watch Report Status MAR Directed Action Plans No Further Action Monthly Accounts Review (MAR) Dashboard ICU F-14
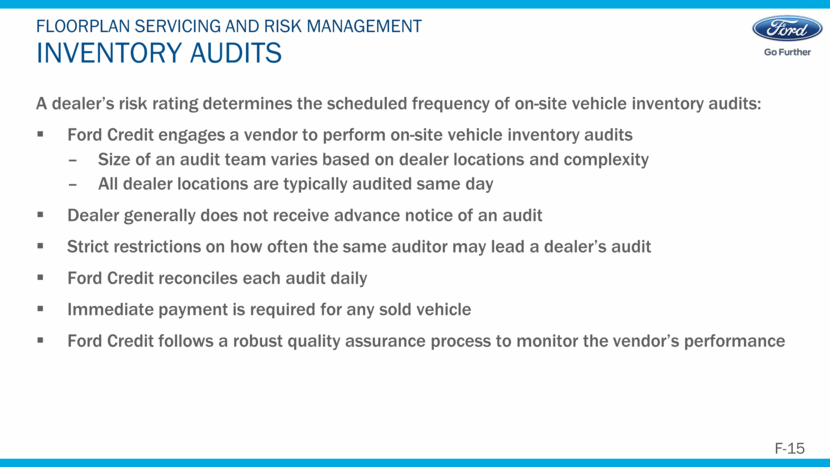
A dealer’s risk rating determines the scheduled frequency of on-site vehicle inventory audits: Ford Credit engages a vendor to perform on-site vehicle inventory audits Size of an audit team varies based on dealer locations and complexity All dealer locations are typically audited same day Dealer generally does not receive advance notice of an audit Strict restrictions on how often the same auditor may lead a dealer’s audit Ford Credit reconciles each audit daily Immediate payment is required for any sold vehicle Ford Credit follows a robust quality assurance process to monitor the vendor’s performance Inventory Audits Floorplan Servicing and risk management F-15
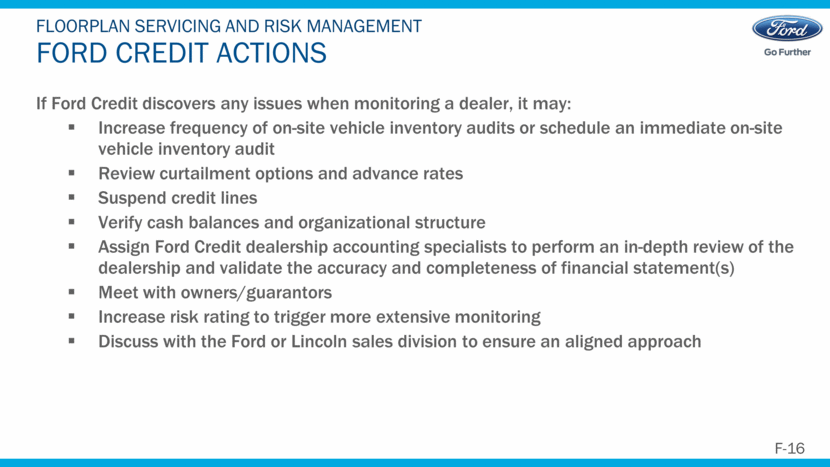
If Ford Credit discovers any issues when monitoring a dealer, it may: Increase frequency of on-site vehicle inventory audits or schedule an immediate on-site vehicle inventory audit Review curtailment options and advance rates Suspend credit lines Verify cash balances and organizational structure Assign Ford Credit dealership accounting specialists to perform an in-depth review of the dealership and validate the accuracy and completeness of financial statement(s) Meet with owners/guarantors Increase risk rating to trigger more extensive monitoring Discuss with the Ford or Lincoln sales division to ensure an aligned approach Ford Credit Actions Floorplan Servicing and risk management F-16
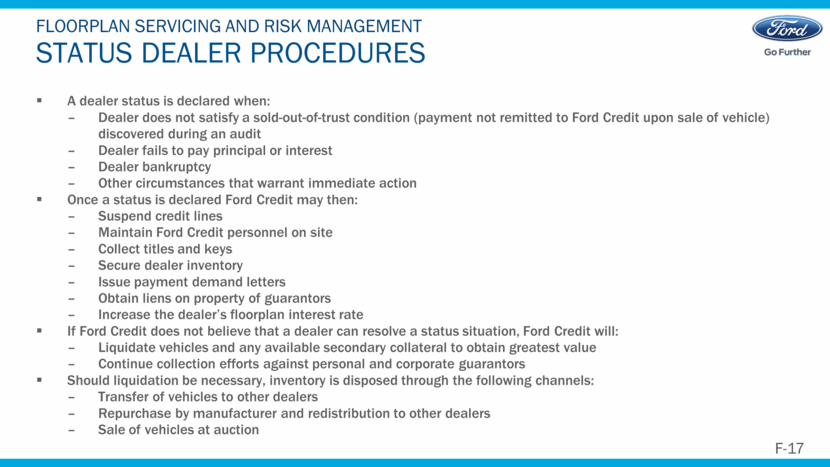
A dealer status is declared when: Dealer does not satisfy a sold-out-of-trust condition (payment not remitted to Ford Credit upon sale of vehicle) discovered during an audit Dealer fails to pay principal or interest Dealer bankruptcy Other circumstances that warrant immediate action Once a status is declared Ford Credit may then: Suspend credit lines Maintain Ford Credit personnel on site Collect titles and keys Secure dealer inventory Issue payment demand letters Obtain liens on property of guarantors Increase the dealer’s floorplan interest rate If Ford Credit does not believe that a dealer can resolve a status situation, Ford Credit will: Liquidate vehicles and any available secondary collateral to obtain greatest value Continue collection efforts against personal and corporate guarantors Should liquidation be necessary, inventory is disposed through the following channels: Transfer of vehicles to other dealers Repurchase by manufacturer and redistribution to other dealers Sale of vehicles at auction Status Dealer Procedures Floorplan Servicing and risk management F-17
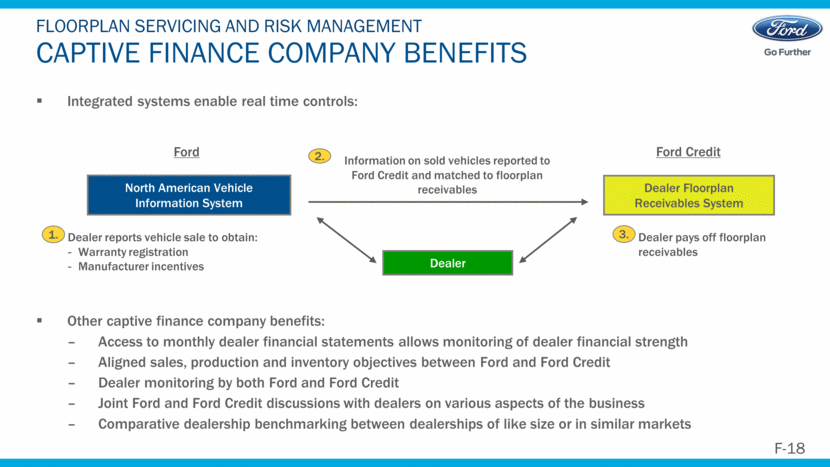
Integrated systems enable real time controls: Other captive finance company benefits: Access to monthly dealer financial statements allows monitoring of dealer financial strength Aligned sales, production and inventory objectives between Ford and Ford Credit Dealer monitoring by both Ford and Ford Credit Joint Ford and Ford Credit discussions with dealers on various aspects of the business Comparative dealership benchmarking between dealerships of like size or in similar markets Captive Finance Company Benefits Floorplan Servicing and risk management 1. Dealer Floorplan Receivables System North American Vehicle Information System Ford Credit Ford Dealer Information on sold vehicles reported to Ford Credit and matched to floorplan receivables Dealer pays off floorplan receivables Dealer reports vehicle sale to obtain: Warranty registration Manufacturer incentives 2. 3. F-18
Floorplan appendix

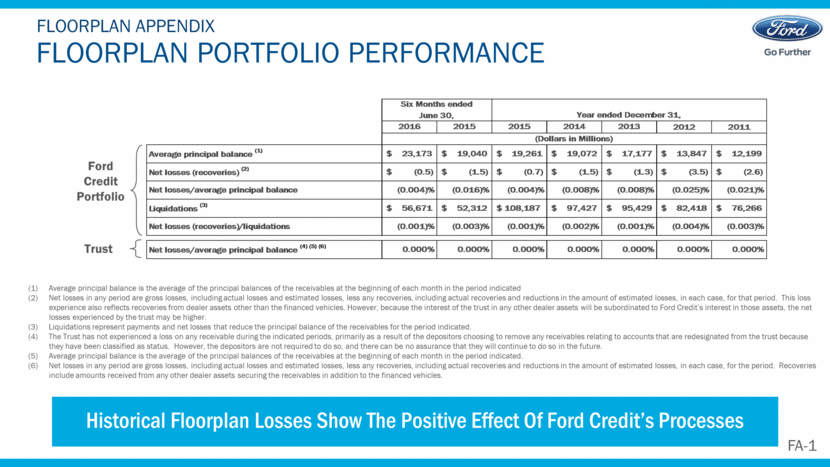
FLOORPLAN PORTFOLIO PERFORMANCE Floorplan appendix Historical Floorplan Losses Show The Positive Effect Of Ford Credit’s Processes (1) Average principal balance is the average of the principal balances of the receivables at the beginning of each month in the period indicated (2) Net losses in any period are gross losses, including actual losses and estimated losses, less any recoveries, including actual recoveries and reductions in the amount of estimated losses, in each case, for that period. This loss experience also reflects recoveries from dealer assets other than the financed vehicles. However, because the interest of the trust in any other dealer assets will be subordinated to Ford Credit’s interest in those assets, the net losses experienced by the trust may be higher. (3) Liquidations represent payments and net losses that reduce the principal balance of the receivables for the period indicated. (4) The Trust has not experienced a loss on any receivable during the indicated periods, primarily as a result of the depositors choosing to remove any receivables relating to accounts that are redesignated from the trust because they have been classified as status. However, the depositors are not required to do so, and there can be no assurance that they will continue to do so in the future. (5) Average principal balance is the average of the principal balances of the receivables at the beginning of each month in the period indicated. (6) Net losses in any period are gross losses, including actual losses and estimated losses, less any recoveries, including actual recoveries and reductions in the amount of estimated losses, in each case, for the period. Recoveries include amounts received from any other dealer assets securing the receivables in addition to the financed vehicles. Ford Credit Portfolio Trust FA-1 Six Months ended June 30, Year ended December 31, 2016 2015 2015 2014 2013 2012 2011 (Dollars in Millions) Average principal balance (1) $ 23,173 $ 19,040 $ 19,261 $ 19,072 $ 17,177 $ 13,847 $ 12,199 Net losses (recoveries) (2) $ (0.5) $ (1.5) $ (0.7) $ (1.5) $ (1.3) $ (3.5) $ (2.6) Net losses/average principal balance (0.004)% (0.016)% (0.004)% (0.008)% (0.008)% (0.025)% (0.021)% Liquidations (3) $ 56,671 $ 52,312 $ 108,187 $ 97,427 $ 95,429 $ 82,418 $ 76,266 Net losses (recoveries)/liquidations (0.001)% (0.003)% (0.001)% (0.002)% (0.001)% (0.004)% (0.003)% Net losses/average principal balance (4) (5) (6) 0.000% 0.000% 0.000% 0.000% 0.000% 0.000% 0.000%
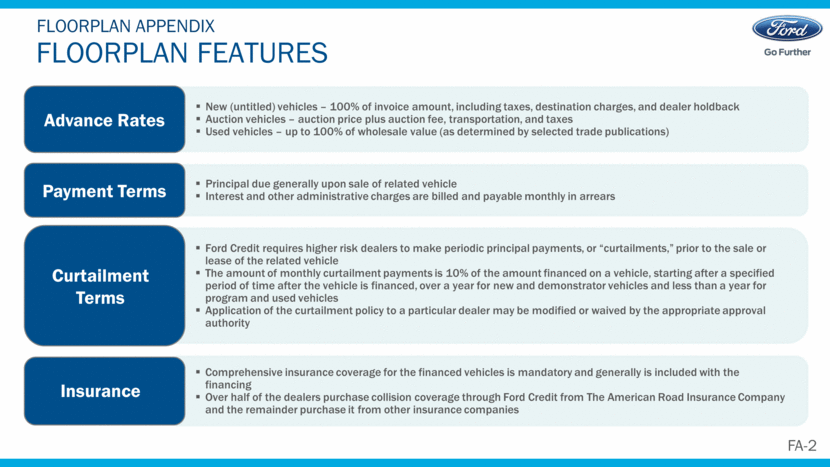
Floorplan Features Floorplan appendix New (untitled) vehicles – 100% of invoice amount, including taxes, destination charges, and dealer holdback Auction vehicles – auction price plus auction fee, transportation, and taxes Used vehicles – up to 100% of wholesale value (as determined by selected trade publications) Advance Rates Principal due generally upon sale of related vehicle Interest and other administrative charges are billed and payable monthly in arrears Payment Terms Ford Credit requires higher risk dealers to make periodic principal payments, or “curtailments,” prior to the sale or lease of the related vehicle The amount of monthly curtailment payments is 10% of the amount financed on a vehicle, starting after a specified period of time after the vehicle is financed, over a year for new and demonstrator vehicles and less than a year for program and used vehicles Application of the curtailment policy to a particular dealer may be modified or waived by the appropriate approval authority Curtailment Terms Comprehensive insurance coverage for the financed vehicles is mandatory and generally is included with the financing Over half of the dealers purchase collision coverage through Ford Credit from The American Road Insurance Company and the remainder purchase it from other insurance companies Insurance FA-2
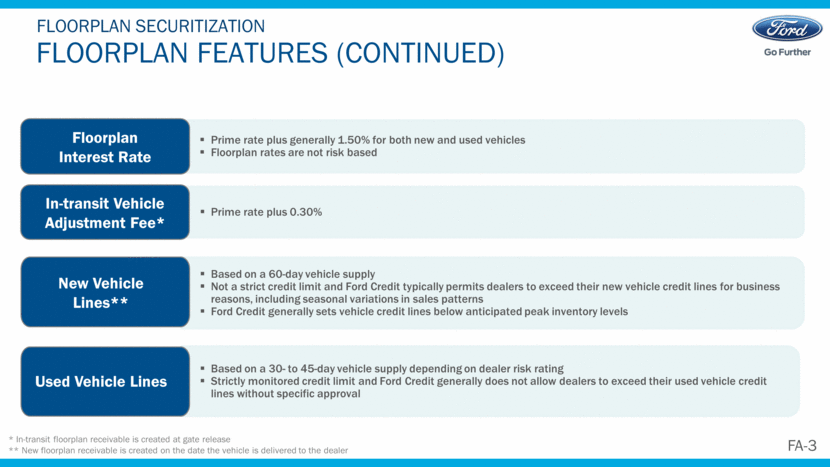
Floorplan Features (Continued) Floorplan securitization * In-transit floorplan receivable is created at gate release ** New floorplan receivable is created on the date the vehicle is delivered to the dealer Prime rate plus generally 1.50% for both new and used vehicles Floorplan rates are not risk based Floorplan Interest Rate Prime rate plus 0.30% In-transit Vehicle Adjustment Fee* Based on a 60-day vehicle supply Not a strict credit limit and Ford Credit typically permits dealers to exceed their new vehicle credit lines for business reasons, including seasonal variations in sales patterns Ford Credit generally sets vehicle credit lines below anticipated peak inventory levels New Vehicle Lines** Based on a 30- to 45-day vehicle supply depending on dealer risk rating Strictly monitored credit limit and Ford Credit generally does not allow dealers to exceed their used vehicle credit lines without specific approval Used Vehicle Lines FA-3
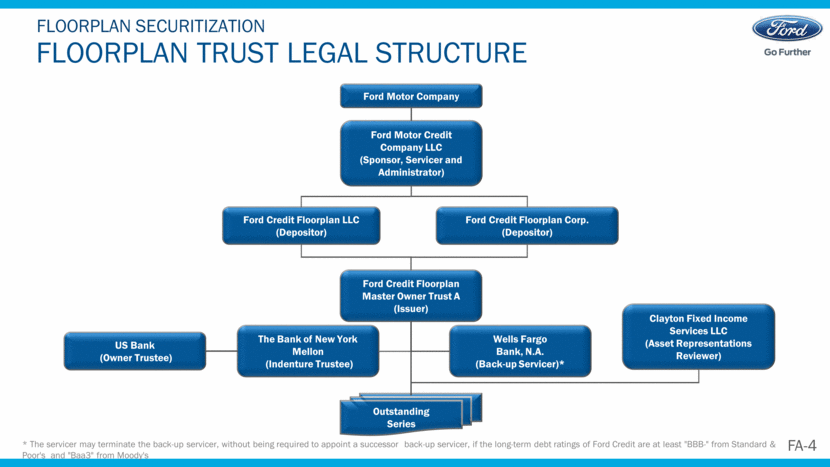
Floorplan Trust legal Structure Floorplan securitization * The servicer may terminate the back-up servicer, without being required to appoint a successor back-up servicer, if the long-term debt ratings of Ford Credit are at least "BBB-" from Standard & Poor's and "Baa3" from Moody's Ford Credit Floorplan LLC (Depositor) The Bank of New York Mellon (Indenture Trustee) Ford Credit Floorplan Corp. (Depositor) Ford Motor Credit Company LLC (Sponsor, Servicer and Administrator) Ford Motor Company Wells Fargo Bank, N.A. (Back-up Servicer)* Ford Credit Floorplan Master Owner Trust A (Issuer) Outstanding Series Clayton Fixed Income Services LLC (Asset Representations Reviewer) FA-4 US Bank (Owner Trustee)