UNITED STATES
SECURITIES AND EXCHANGE COMMISSION
Washington, D.C. 20549
FORM N-CSR
CERTIFIED SHAREHOLDER REPORT OF REGISTERED
MANAGEMENT INVESTMENT COMPANIES
Investment Company Act file number: 811-06241
Loomis Sayles Funds II
(Exact name of Registrant as specified in charter)
399 Boylston Street, Boston, Massachusetts 02116
(Address of principal executive offices) (Zip code)
Coleen Downs Dinneen, Esq.
Natixis Distributors, L.P.
399 Boylston Street
Boston, Massachusetts 02116
(Name and address of agent for service)
Registrant’s telephone number, including area code: (617) 449-2810
Date of fiscal year end: September 30
Date of reporting period: September 30, 2008
Item 1. Reports to Stockholders.
The Registrant’s annual report transmitted to shareholders pursuant to Rule 30e-1 under the Investment Company Act of 1940 is as follows:

INCOME FUNDS
ANNUAL REPORT
September 30, 2008
Loomis Sayles Core Plus Bond Fund
Loomis Sayles High Income Fund
Loomis Sayles International Bond Fund
Loomis Sayles Limited Term Government and Agency Fund
Loomis Sayles Strategic Income Fund


TABLE OF CONTENTS
Management Discussion and Performancepage 1
Portfolio of Investmentspage 18
Financial Statementspage 51
LOOMIS SAYLES CORE PLUS BOND FUND
PORTFOLIO PROFILE
Objective:
Seeks a high level of current income consistent with what the fund considers reasonable risk
Strategy:
Invests primarily in U.S. corporate and U.S. government bonds
Fund Inception:
November 7, 1973
Managers:
Peter W. Palfrey, CFA
Richard G. Raczkowski
Loomis, Sayles & Company, L.P.
Symbols:
| | |
| Class A | | NEFRX |
| Class B | | NERBX |
| Class C | | NECRX |
| Class Y | | NERYX |
What You Should Know:
Fixed-income securities are subject to credit risk and interest rate risk; their value generally rises when prevailing interest rates fall and falls when rates rise.
The fund can invest a significant percentage of assets in debt securities that are rated below investment grade and the value of fund shares can be adversely affected by changes in economic conditions or other circumstances. Lower rated debt securities have speculative characteristics and may be subject to greater price volatility than higher rated investments. In addition, the secondary market for these securities may lack liquidity. The fund can also invest a significant percentage of assets in foreign securities and the value of the fund shares can be adversely affected by changes in currency exchange rates, political, and economic developments. In emerging markets, these risks can be significant. Fund shares should be viewed as a long-term investment.
Management Discussion
Negative news that characterized the financial markets during the fiscal year ended September 30, 2008 reached a crescendo in the closing month. Early in the period, concern focused on securities backed by subprime and other high-risk loans. By September the crisis had accelerated. Banks had pulled back from lending, and Secretary of the Treasury Henry Paulson and Ben Bernanke, Chairman of the Federal Reserve Board, led policy makers in a series of moves designed to restore stability – a still elusive goal.
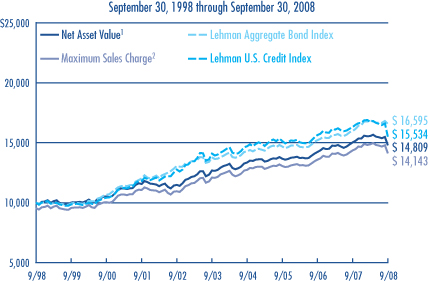
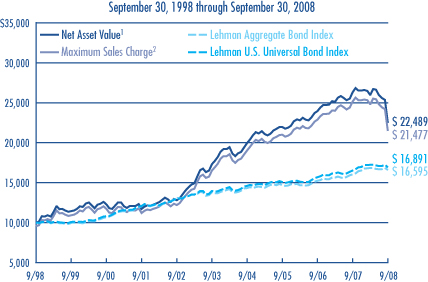
During this turbulent 12-month period, Loomis Sayles Core Plus Bond Fund provided a total return of -1.61%, based on the net asset value of Class A shares and $0.61 in reinvested dividends. The fund underperformed its broad-based benchmark, Lehman Aggregate Bond Index, which returned 3.65% for the period, but it outperformed the -2.45% average return on the funds in its Morningstar Intermediate-Term Bond peer group. The fund’s 30-day SEC yield as of September 30, 2008 was 5.38%.
HOW DID THE MARKETS GET HERE?
A prolonged period of risky lending practices came to an end as home prices declined in value. The Federal Reserve unleashed a series of initiatives designed to ease the situation. At first, this seemed to help, but as the downturn intensified, investor apprehension spread to loans of all types. A series of failures involving some of the country’s oldest and largest financial institutions contributed to a widespread crisis in confidence. The third quarter saw a rapid-fire, surprising series of events culminating in September. As the month ended, a comprehensive plan designed to get credit flowing again by purging bank balance sheets of distressed loans was passed into law, but no one knows how well it will work or if other intervention may be needed.
HOW DID THE FUND RESPOND?
Sector allocation and security selection within the investment-grade and high-yield credit markets, as well as the fund’s position in asset-backed securities, provided some protection amid dwindling investor confidence. We made several opportunistic trades designed to capitalize on selected bonds issued by financial companies that had been hit hard. Security selection within investment-grade utilities was also a positive during the year. In general, we maintained a high level of liquidity in the portfolio, including holdings in Treasuries, agency and mortgage-backed securities. We also increased the fund’s exposure to securities denominated in the Japanese yen as part of our efforts to hedge against increased risk aversion in the U.S. markets.
However, our small allocation to certain types of AAA-rated and ABS home equity bonds detracted from overall performance. Both investment-grade and high-yield financials also declined in price in response to some high-profile bankruptcies and the bailout of Fannie Mae and Freddie Mac. Risk-averse investors around the world fled to the relative safety of U.S. Treasuries, causing yields to plunge. Our defensive strategy and a longer duration than the benchmark were also negatives.
WHAT NOW?
Between the Federal Reserve and the Treasury, massive sums have been brought to bear in an effort to keep the financial system moving forward. Recession risk has grown and economic headwinds include a tight credit environment and the loss of wealth from home and stock price declines. Our current forecast is for a sharp decline in growth in the fourth quarter of 2008, followed by a more moderate decline in the first quarter of 2009. In financials, we see more consolidation, more regulation and tighter lending standards ahead. While the economy is likely to remain weak for at least the next several quarters, we believe that risk markets – markets other than Treasuries, including credit and structured products – currently offer compelling value on a risk/return basis. We have recently increased our allocation to the investment grade and high yield sectors, and have made opportunistic additions to the ABS and commercial mortgage-backed markets. As a result, we believe we are well positioned to take advantage of the eventual recovery we anticipate in risk markets.
1
LOOMIS SAYLES CORE PLUS BOND FUND
Investment Results through September 30, 2008
PERFORMANCE IN PERSPECTIVE
The charts comparing the fund’s performance to two indexes provide you with a general sense of how it performed. The fund’s total return for the period shown below appears with and without sales charges and includes fund expenses and fees. An index measures the performance of a theoretical portfolio. Unlike a fund, the index is unmanaged and does not have expenses that affect the results. It is not possible to invest directly in an index. Investors would incur transaction costs and other expenses if they purchased the securities necessary to match the index.
Growth of a $10,000 Investment in Class A Shares4
Average Annual Returns — September 30, 20084
| | | | | | | | | |
| | | | |
| | | 1 YEAR | | | 5 YEARS | | | 10 YEARS | |
Class A (Inception 11/7/73) | | | | | | | | | |
Net Asset Value1 | | -1.61 | % | | 3.13 | % | | 4.00 | % |
With Maximum Sales Charge2 | | -6.02 | | | 2.18 | | | 3.53 | |
| | | | |
Class B (Inception 9/13/93) | | | | | | | | | |
Net Asset Value1 | | -2.21 | | | 2.39 | | | 3.25 | |
With CDSC3 | | -6.88 | | | 2.05 | | | 3.25 | |
| | | | |
Class C (Inception 12/30/94) | | | | | | | | | |
Net Asset Value1 | | -2.32 | | | 2.37 | | | 3.23 | |
With CDSC3 | | -3.25 | | | 2.37 | | | 3.23 | |
| | | | |
Class Y (Inception 12/30/94) | | | | | | | | | |
Net Asset Value1 | | -1.36 | | | 3.40 | | | 4.36 | |
| | | | |
| COMPARATIVE PERFORMANCE | | 1 YEAR | | | 5 YEARS | | | 10 YEARS | |
Lehman Aggregate Bond Index | | 3.65 | % | | 3.78 | % | | 5.20 | % |
Lehman U.S. Credit Index | | -4.79 | | | 1.94 | | | 4.50 | |
Morningstar Int.-Term Bond Fund Avg. | | -2.45 | | | 2.15 | | | 4.09 | |
See page 11 for a description of the indexes.
All returns represent past performance and do not guarantee future results. Periods of less than one year are not annualized. Share price and return will vary and you may have a gain or loss when you sell your shares. All results include reinvestment of any dividends and capital gains. Current returns may be higher or lower than those shown. For performance current to the most recent month-end, visit www.funds.natixis.com. Class Y shares are available to certain investors, as described in the prospectus.
The table and graph do not reflect taxes shareholders might owe on any fund distributions or when they redeem their shares.
PORTFOLIO FACTS
| | | | |
| |
| | | % of Net Assets as of |
| CREDIT QUALITY | | 9/30/08 | | 9/30/07 |
Aaa | | 59.1 | | 66.4 |
Aa | | 5.6 | | 1.4 |
A | | 4.8 | | 3.4 |
Baa | | 14.6 | | 13.1 |
Ba | | 4.8 | | 6.4 |
B | | 5.7 | | 3.9 |
Caa | | 0.5 | | 0.8 |
Ca | | 0.3 | | — |
Not Rated* | | 3.8 | | 1.9 |
Short-term and other | | 0.8 | | 2.7 |
Credit quality is based on ratings from Moody’s Investors Service.
* Securities that are not rated by Moody’s may be rated by another rating agency or by Loomis Sayles.
| | | | | | |
| |
| | | % of Net Assets as of | |
| EFFECTIVE DURATION | | 9/30/08 | | | 9/30/07 | |
1 year or less | | 8.8 | | | 6.5 | |
1-5 years | | 39.7 | | | 46.8 | |
5-10 years | | 40.0 | | | 27.0 | |
10+ years | | 11.5 | | | 19.7 | |
Average Effective Duration | | 5.7 | years | | 5.8 | years |
Portfolio characteristics will vary.
EXPENSE RATIOS AS STATED IN THE MOST RECENT PROSPECTUS
| | | | | | |
| Share Class | | Gross Expense Ratio5 | | | Net Expense Ratio6 | |
A | | 1.09 | % | | 0.90 | % |
B | | 1.85 | | | 1.65 | |
C | | 1.82 | | | 1.65 | |
Y | | 0.75 | | | 0.65 | |
NOTES TO CHARTS
1 | Does not include a sales charge. |
2 | Includes maximum sales charge of 4.50%. |
3 | Performance for Class B shares assumes a maximum 5% contingent deferred sales charge (“CDSC”) applied when you sell shares, which declines annually between years 1-6 according to the following schedule: 5, 4, 3, 3, 2, 1, 0%. Class C shares performance assumes a 1% CDSC applied when you sell shares within one year of purchase. |
4 | Fund performance has been increased by expense reductions and reimbursements, if any, without which performance would have been lower. |
5 | Before reductions and reimbursements. |
6 | After reductions and reimbursements. Expense reductions are contractual and are set to expire on 1/31/09. |
2
LOOMIS SAYLES HIGH INCOME FUND
PORTFOLIO PROFILE
Objective:
Seeks high current income plus the opportunity for capital appreciation to produce a high total return
Strategy:
Invests primarily in lower-quality fixed-income securities
Fund Inception:
February 22, 1984
Managers:
Matthew J. Eagan, CFA
Kathleen C. Gaffney, CFA
Elaine M. Stokes
Loomis, Sayles & Company, L.P.
Symbols:
| | |
| Class A | | NEFHX |
| Class B | | NEHBX |
| Class C | | NEHCX |
| Class Y | | NEHYX |
What You Should Know:
Fixed-income securities are subject to credit risk and interest rate risk; their value generally rises when prevailing interest rates fall and falls when rates rise.
The fund can invest a significant percentage of assets in debt securities that are rated below investment grade and the value of fund shares can be adversely affected by changes in economic conditions or other circumstances. Lower rated debt securities have speculative characteristics and may be subject to greater price volatility than higher rated investments. In addition, the secondary market for these securities may lack liquidity. The fund can also invest a significant percentage of assets in foreign securities and the value of the fund shares can be adversely affected by changes in currency exchange rates, political, and economic developments. In emerging markets, these risks can be significant. Fund shares should be viewed as a long-term investment.
Management Discussion
The credit crisis that took down major financial institutions and shook the broader economy led investors to shun corporate bonds of all quality levels and seek relative safety in U.S. Treasury issues. Lack of confidence drained liquidity from the credit markets and yield spreads (the difference in yields available from high- and low-quality bonds) widened dramatically.
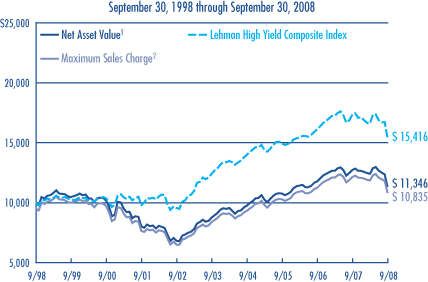
For the fiscal year ended September 30, 2008, Loomis Sayles High Income Fund’s total return was -10.98% based on the net asset value of Class A shares and $0.35 in reinvested dividends. Although in absolute terms the fund’s return was disappointing, it held up better than its benchmark, the Lehman High Yield Composite Index, which returned -11.24% for the period, and the -11.29% return on Morningstar’s High Yield Bond category. As of September 30, 2008, the fund’s 30-day SEC yield was 8.48%.
HOW DID THE MARKETS GET HERE?
The period’s results were largely shaped by the precipitous decline in bond prices that took place in the final quarter of the fund’s fiscal year. The pursuit of safety broadened to a stampede, and prices of Treasury securities rose dramatically as frightened investors sold off corporate bonds.
HOW DID THIS AFFECT THE FUND?
The fund gained an edge on its benchmark thanks to its reduced stake in below-investment grade bonds in the battered financial sector. Non-U.S. dollar investments were the fund’s best performers, thanks to strong results from countries in Asia and Latin America. Securities denominated in Singapore’s dollar and the Japanese yen recorded solid gains as a result of strengthening currencies and positive trends in their domestic markets. Results were also favorable in Mexico, where yields on peso-denominated bonds remained attractive. Certain convertible bonds were positive contributors to performance, and the fund’s small allocation to asset-backed securities was modestly favorable.
However, an upward move by the U.S. dollar, especially during the quarter ended September 30, 2008, had a negative impact on most of the portfolio’s holdings denominated in foreign currencies. Declines in Iceland’s krona and South Korea’s won overshadowed positive local returns. The massive flight to U.S. Treasuries left virtually all sectors of the portfolio in negative territory. Not even high-quality issues escaped.
Damage was most severe in the financial sector, as many prominent Wall Street institutions faced collapse and some were acquired by other firms; investment-grade bonds in this group were the most affected. Below-investment-grade industrial bonds – especially those issued by debt-heavy technology and communications companies – also suffered. Auto and gaming issues fell as consumers cut back sharply on discretionary spending. Equity and preferred holdings, chiefly financials and securities of government-sponsored enterprises, also hurt the fund’s performance.
WHAT NOW?
Economic growth in the United States is still slowing. We expect weak home prices and job concerns to continue to restrain consumer spending – a primary economic engine. However, the Federal Reserve Board and the Treasury have brought massive sums to bear in an effort to get the financial system back on track, and similar efforts have been launched in other leading economies. Our current forecast is for a slight decline in growth for the fourth quarter of 2008 and the first quarter of 2009. We see more consolidation, more regulation and tighter lending standards ahead.
On the positive side, prices of high-yield bonds have fallen significantly and bondholders are earning generous yields, at least for now. We think today’s low bond prices may already reflect bad news to come. In the meantime, there are large pools of cash on the sidelines. If the government’s policy initiatives succeed in thawing credit markets, the crisis could ease. A recovery might then begin some time in 2009 and prices of high-yield bonds could recover.
3
LOOMIS SAYLES HIGH INCOME FUND
Investment Results through September 30, 2008
PERFORMANCE IN PERSPECTIVE
The charts comparing the fund’s performance to an index provide you with a general sense of how it performed. The fund’s total return for the period shown below appears with and without sales charges and includes fund expenses and fees. An index measures the performance of a theoretical portfolio. Unlike a fund, the index is unmanaged and does not have expenses that affect the results. It is not possible to invest directly in an index. Investors would incur transaction costs and other expenses if they purchased the securities necessary to match the index.
Growth of a $10,000 Investment in Class A Shares4
Average Annual Returns — September 30, 20084
| | | | | | | | | | | | |
| | | | | |
| | | 1 YEAR | | | 5 YEARS | | | 10 YEARS | | | SINCE
INCEPTION | |
Class A (Inception 2/22/84) | | | | | | | | | | | | |
Net Asset Value1 | | -10.98 | % | | 5.24 | % | | 1.27 | % | | — | |
With Maximum Sales Charge2 | | -14.96 | | | 4.27 | | | 0.80 | | | — | |
| | | | | |
CLASS B (Inception 9/20/93) | | | | | | | | | | | | |
Net Asset Value1 | | -11.64 | | | 4.48 | | | 0.53 | | | — | |
With CDSC3 | | -15.78 | | | 4.17 | | | 0.53 | | | — | |
| | | | | |
CLASS C (Inception 3/2/98) | | | | | | | | | | | | |
Net Asset Value1 | | -11.62 | | | 4.44 | | | 0.51 | | | — | |
With CDSC3 | | -12.45 | | | 4.44 | | | 0.51 | | | — | |
| | | | | |
CLASS Y (Inception 2/29/08) | | | | | | | | | | | | |
Net Asset Value1 | | — | | | — | | | — | | | -9.10 | % |
| | | | | |
| COMPARATIVE PERFORMANCE | | 1 YEAR | | | 5 YEARS | | | 10 YEARS | | | SINCE CLASS Y
INCEPTION7 | |
Lehman High Yield Composite Index | | -11.24 | % | | 4.38 | % | | 4.42 | % | | -7.60 | % |
Morningstar High Yield Bond Fund Avg. | | -11.29 | | | 3.59 | | | 3.57 | | | -7.00 | |
See page 11 for a description of the indexes.
All returns represent past performance and do not guarantee future results. Periods of less than one year are not annualized. Share price and return will vary and you may have a gain or loss when you sell your shares. All results include reinvestment of dividends and capital gains. Current returns may be higher or lower than those shown. For performance current to the most recent month-end, visit www.funds.natixis.com. Performance history includes periods from a predecessor fund. Class Y shares are available to certain investors, as described in the prospectus.
The table and graph do not reflect taxes shareholders might owe on any fund distributions or when they redeem their shares.
PORTFOLIO FACTS
| | | | |
| |
| | | % of Net Assets as of |
| CREDIT QUALITY | | 9/30/08 | | 9/30/07 |
Aaa | | 17.3 | | 15.5 |
Aa | | 2.0 | | 1.9 |
A | | 1.0 | | 0.7 |
Baa | | 7.6 | | 8.9 |
Ba | | 14.9 | | 17.4 |
B | | 28.9 | | 24.9 |
Caa | | 16.4 | | 15.9 |
Ca | | 0.5 | | — |
C | | 0.0 | | — |
Not Rated* | | 10.1 | | 11.7 |
Short-term and other | | 1.3 | | 3.1 |
Credit quality is based on ratings from Moody’s Investors Service.
* Securities that are not rated by Moody’s may be rated by another rating agency or by Loomis Sayles.
| | | | | | |
| |
| | | % of Net Assets as of | |
| EFFECTIVE MATURITY | | 9/30/08 | | | 9/30/07 | |
1 year or less | | 16.0 | | | 4.2 | |
1-5 years | | 25.7 | | | 21.9 | |
5-10 years | | 28.5 | | | 19.4 | |
10+ years | | 29.8 | | | 54.5 | |
Average Effective Maturity | | 8.8 | years | | 13.8 | years |
Portfolio characteristics will vary.
EXPENSE RATIOS AS STATED IN THE MOST RECENT PROSPECTUS
| | | | | | |
| Share Class | | Gross Expense Ratio5 | | | Net Expense Ratio6 | |
A | | 1.43 | % | | 1.15 | % |
B | | 2.18 | | | 1.90 | |
C | | 2.17 | | | 1.90 | |
Y | | 1.16 | | | 0.90 | |
NOTES TO CHARTS
1 | Does not include a sales charge. |
2 | Includes maximum sales charge of 4.50%. |
3 | Performance for Class B shares assumes a maximum 5% contingent deferred sales charge (“CDSC”) applied when you sell shares, which declines annually between years 1-6 according to the following schedule: 5, 4, 3, 3, 2, 1, 0%. Class C shares performance assumes a 1% CDSC applied when you sell shares within one year of purchase. |
4 | Fund performance has been increased by expense reductions and reimbursements, if any, without which performance would have been lower. |
5 | Before reductions and reimbursements. |
6 | After reductions and reimbursements. Expense reductions are contractual and are set to expire on 1/31/09. |
7 | The since-inception comparative performance figures shown for Class Y shares are calculated from 3/1/08. |
4
LOOMIS SAYLES INTERNATIONAL BOND FUND
PORTFOLIO PROFILE
Objective:
Seeks high total return through a combination of high income and capital appreciation
Strategy:
Invests primarily in fixed-income securities located outside the U.S.
Fund Inception:
February 1, 2008
Managers:
Lynda L. Schweitzer, CFA
Kenneth M. Buntrock, CFA, CIC
David W. Rolley, CFA
Loomis, Sayles & Company, L.P.
Symbols:
| | |
| Class A | | LSIAX |
| Class C | | LSICX |
| Class Y | | LSIYX |
What You Should Know:
Fixed-income securities are subject to credit risk and interest rate risk; their value generally rises when prevailing interest rates fall and falls when interest rates rise. The fund may also invest in public or private debt obligations issued or guaranteed by U.S. or non-U.S. issuers. The fund can invest a significant percentage of assets in foreign securities and the value of the fund shares can be adversely affected by changes in currency exchange rates, political, and economic developments. In emerging markets these risks can be significant. The fund can invest a significant percentage of assets in debt securities that are rated below investment grade. Lower-rated debt securities have speculative characteristics and may be subject to greater price volatility than higher-rated investments. In addition, the secondary market for these securities may lack liquidity. Fund shares should be viewed as a long-term investment.
Management Discussion
Loomis Sayles International Bond Fund was launched February 1, 2008, at the start of what has proved to be an exceptionally volatile period for the world’s stock and bond markets. A crisis in the credit markets that began in the U.S. mortgage markets was exacerbated by failures and near-collapses of several large, international financial institutions. This led to deteriorating confidence in the financial sector globally during 2008. Investors fled to the safety of government securities in the United States and elsewhere. This global flight-to-quality led to negative performance by corporate bonds generally. At the same time, the U.S. dollar strengthened against most major foreign currencies.
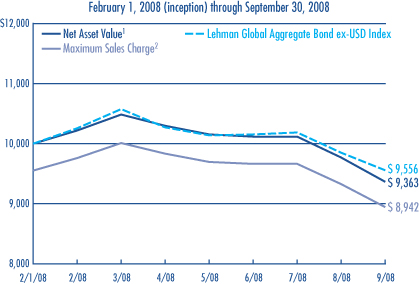
Against this backdrop, the fund’s Class A shares returned -6.37% at net asset value for the eight months from the beginning of February through the end of the fiscal year on September 30, 2008, assuming reinvestment of $0.19 in dividends. For the same period, the benchmark Lehman Global Aggregate Bond ex-USD Index returned -4.44%, while the average return of funds in Morningstar’s World Bond category was -5.31%. The fund’s 30-day SEC yield as of September 30, 2008 was 3.23%.
WHAT HELPED AND WHAT HURT PERFORMANCE?
The Fund’s emphasis on corporate bonds was the primary factor in it’s underperformance relative to the Lehman index, as corporate bonds trailed government bonds in most major world markets. Investors around the world sought the safety of high-quality assets in their home markets, creating demand that drove up prices of local government bonds.
In the course of the eight-month period, the U.S. dollar staged a strong rally against most markets. In particular, European currencies and currencies of major commodity exporters declined versus the U.S. dollar. In absolute terms, this hurt the fund’s performance, but its underweight position relative to the benchmark in some of the weaker markets limited the damage. However, the fund’s holdings in bonds denominated in the Icelandic krona, the Singapore dollar and the Malaysian ringgit detracted from the fund’s return as these local markets declined during the period. We sold the fund’s holdings in Malaysian currency and were selling its Singapore holdings as the period ended.
On the positive side, the fund’s duration and yield curve strategy benefited relative returns. Its longer duration relative to the Lehman index was beneficial, as was its exposure to longer-maturity securities denominated in the euro when bond yields fell in the course of the year, elevating bond prices. Bonds denominated in euros were the largest single block in the portfolio, followed by bonds denominated in the Japanese yen.
WHAT LIES AHEAD?
Both investment-grade and high-yield debt suffered one of their worst months on record in September, as the difference in yield between higher- and lower-rated bonds widened to levels we find startling. Given the tumultuous events of recent weeks, we believe the U.S. economy will fall into recession and that world growth will be considerably weaker than in previous years. The U.S. Federal Reserve and other central banks are cutting short-term interest rates to try to stimulate economic growth and major governments around the world are taking other actions to avert major downturns.
We measure the price of credit by yield spreads – the difference in yield between higher- and lower-quality securities. Debt issues may never have been cheaper than they are right now, especially in light of our forecast for a moderate to average global recession through the end of 2008 and probably the first half of 2009.
We believe it is important to own bonds when they are discounted as a result of fear in the markets in order to capture the potential for price appreciation if fundamentals improve. We think that once this flight to quality ends, the U.S. dollar should weaken and our non-dollar holdings can begin adding value.
5
LOOMIS SAYLES INTERNATIONAL BOND FUND
Investment Results through September 30, 2008
PERFORMANCE IN PERSPECTIVE
The charts comparing the fund’s performance to an index provide you with general sense of how it performed. The fund’s total return for the period shown below appears with and without sales charges and includes fund expenses and fees. An index measures the performance of a theoretical portfolio. Unlike a fund, an index is unmanaged and does not have expenses that affect the results. It is not possible to invest directly in an index. Investors would incur transaction costs and other expenses if they purchased the securities necessary to match the index.
Growth of $10,000 Investment in Class A Shares4
Average Annual Returns — September 30, 20084
| | | |
| | |
| | | SINCE
INCEPTION | |
CLASS A (Inception 2/1/08) | | | |
Net Asset Value1 | | -6.37 | % |
With Maximum Sales Charge2 | | -10.57 | |
| | |
CLASS C (Inception 2/1/08) | | | |
Net Asset Value1 | | -6.95 | |
With CDSC3 | | -7.87 | |
| | |
CLASS Y (Inception 2/1/08) | | | |
Net Asset Value1 | | -6.39 | |
| | |
| COMPARATIVE PERFORMANCE | | SINCE
INCEPTION7 | |
Lehman Global Aggregate Bond ex-USD Index | | -4.44 | % |
Morningstar World Bond Fund Avg. | | -5.31 | |
See page 11 for a description of the indexes.
All returns represent past performance and do not guarantee future results. Periods of less than one year are not annualized. Share price and return will vary and you may have a gain or loss when you sell your shares. All results include reinvestment of dividends and capital gains. Current returns may be higher or lower than those shown. For performance current to the most recent month-end, visit www.funds.natixis.com. Class Y shares are available to certain investors, as described in the prospectus.
The table does not reflect taxes shareholders might owe on any fund distributions or when they redeem their shares.
PORTFOLIO FACTS
| | | |
| | | % of Net
Assets as of | |
| CREDIT QUALITY | | 9/30/08 | |
Aaa | | 54.2 | |
Aa | | 18.7 | |
A | | 8.3 | |
Baa | | 10.5 | |
Ba | | 3.1 | |
B | | 0.5 | |
Caa | | 0.7 | |
Not Rated* | | 2.3 | |
Short-term and other | | 1.7 | |
|
Credit quality is based on ratings from Moody’s Investors Service. * Securities that are not rated by Moody’s may be rated by another rating agency or by Loomis Sayles. | |
| | | % of Net
Assets
as of | |
| EFFECTIVE MATURITY | | 9/30/08 | |
1 year or less | | 12.5 | |
1-5 years | | 18.4 | |
5-10 years | | 55.2 | |
10+ years | | 13.9 | |
Average Effective Maturity | | 8.1 | years |
Portfolio characteristics will vary.
EXPENSE RATIOS AS STATED IN THE MOST RECENT PROSPECTUS
| | | | | |
| Share Class | | Gross Expense Ratio5 | | Net Expense Ratio6 | |
A | | 1.15% | | 1.10 | % |
C | | 1.90 | | 1.85 | |
Y | | 0.90 | | 0.85 | |
NOTES TO CHARTS
1 | Does not include a sales charge. |
2 | Includes maximum sales charge of 4.50%. |
3 | Class C shares performance assumes a 1% CDSC applied when you sell shares within one year of purchase. |
4 | Fund performance has been increased by expense reductions and reimbursements, if any, without which performance would have been lower. |
5 | Before reductions and reimbursements. |
6 | After reductions and reimbursements. Expense reductions are contractual and are set to expire on 1/31/09. |
7 | The since-inception comparative performance figures shown for all share classes are calculated from 2/1/08. |
6
LOOMIS SAYLES LIMITED TERM GOVERNMENTAND AGENCY FUND
PORTFOLIO PROFILE
Objective:
Seeks a high current return consistent with preservation of capital
Strategy:
Invests primarily in securities issued or guaranteed by the U.S. government, its agencies or instrumentalities
Fund Inception:
January 3, 1989
Managers:
John Hyll
Clifton V. Rowe, CFA
Loomis, Sayles & Company, L.P.
Symbols:
| | |
| Class A | | NEFLX |
| Class B | | NELBX |
| Class C | | NECLX |
| Class Y | | NELYX |
What You Should Know:
Fixed-income securities are subject to credit risk and interest rate risk; their value generally rises when prevailing interest rates fall and falls when rates rise. Securities issued by the U.S. government are guaranteed by the U.S. government if held to maturity; mutual funds that invest in these securities are not guaranteed. Securities issued by U.S. government agencies may not be government guaranteed.
Management Discussion
As the credit crunch gained momentum and economic conditions deteriorated during the 12 months ended September 30, 2008, investors’ risk aversion mounted. Early in the period, concern focused on securities representing subprime and other high-risk loans. By September the crisis had reached a crescendo. Banks had pulled back from lending even to one another, and Secretary of the Treasury Henry Paulson and Ben Bernanke, Chairman of the Federal Reserve Board, led policy makers in a series of moves designed to restore stability – a still elusive goal.
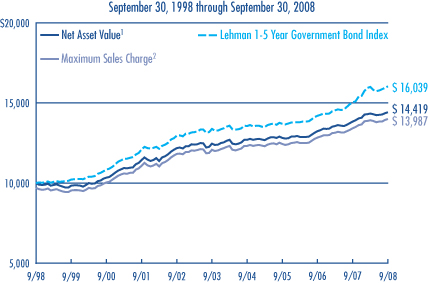
Despite the turmoil, for the fiscal year ended September 30, 2008, Loomis Sayles Limited Term Government and Agency Fund’s total return was 4.29% based on the net asset value of Class A shares and $0.49 in reinvested dividends. However, the fund lagged its benchmark and came in slightly ahead of its peer group of mutual funds for the period. The Lehman 1-5 Year Government Bond Index returned 6.74% and the average return on the funds in Morningstar’s Short Government category was 4.23%. The fund’s 30-day SEC yield as of September 30, 2008 was 3.71%.
WHAT HAPPENED TO THE MARKETS?
A prolonged period of risky lending practices came to an end as home prices declined in value. The Federal Reserve unleashed a series of initiatives, including rate cuts, designed to ease the situation. At first, this seemed to help, but as the downturn intensified, investor apprehension spread to loans of all types. A series of failures involving some of the country’s oldest and largest financial institutions contributed to a widespread crisis in confidence. The fund’s final quarter saw a rapid-fire series of surprising events, with most of the action in September. As the month ended, a comprehensive plan designed to get credit flowing again by purging bank balance sheets of distressed loans was passed into law, but no one knows how well it will work or if other intervention may be needed.
WERE THERE ANY BRIGHT SPOTS FOR THE FUND?
U.S. Treasury securities were strong performers during the year. Despite other sectors’ yield advantage, they could not keep pace with Treasuries. Spiraling demand from risk-averse investors drove prices up, causing yields to plummet. Prices of mortgage-related bonds issued and backed by federal agencies also held up relatively well, primarily due to their income advantage.
WHICH FORCES HAD THE WORST IMPACT?
Within the government-related sector, bonds issued by government sponsored entities like Freddie Mac and Fannie Mae lagged the returns on both mortgage-backed and Treasury securities, although the worst performers in the mortgage market were securities that did not have government guarantees. As the real estate markets deteriorated throughout the year, the effects spread to other markets, including corporate bonds and asset-backed securities. Investor appetite for these sectors diminished sharply as investors became increasingly risk-averse.
WHAT NOW?
We continue to emphasize high-quality, mortgage-backed securities issued by government agencies because we expect this sector to benefit from its yield advantage. We also continue to emphasize high-quality asset backed securities, including those backed by automobile loans and credit card receivables, as well as securities backed by mortgages on commercial properties. We see relatively little risk of rating downgrades on the senior holdings we selected.
By the end of September, investor fears had reached such an extreme that even high-quality securities had declined in value, creating potential opportunities across a wide range of issues and sectors. As a result of past Federal Reserve rate cuts and expectations of more cuts, the yield curve is steep, by historical standards, making longer maturity securities potentially attractive. We are on the lookout for specific opportunities to capitalize on this situation.
7
LOOMIS SAYLES LIMITED TERM GOVERNMENTAND AGENCY FUND
Investment Results through September 30, 2008
PERFORMANCE IN PERSPECTIVE
The charts comparing the fund’s performance to an index provide you with a general sense of how it performed. The fund’s total return for the period shown below appears with and without sales charges and includes fund expenses and fees. An index measures the performance of a theoretical portfolio. Unlike a fund, the index is unmanaged and does not have expenses that affect the results. It is not possible to invest directly in an index. Investors would incur transaction costs and other expenses if they purchased the securities necessary to match the index.
Growth of a $10,000 Investment in Class A Shares4
Average Annual Returns — September 30, 20084
| | | | | | | | | |
| | | | |
| | | 1 YEAR | | | 5 YEARS | | | 10 YEARS | |
Class A (Inception 1/3/89) | | | | | | | | | |
Net Asset Value1 | | 4.29 | % | | 2.97 | % | | 3.73 | % |
With Maximum Sales Charge2 | | 1.17 | | | 2.33 | | | 3.41 | |
| | | | |
Class B (Inception 9/27/93) | | | | | | | | | |
Net Asset Value1 | | 3.52 | | | 2.21 | | | 3.01 | |
With CDSC3 | | -1.47 | | | 1.85 | | | 3.01 | |
| | | | |
Class C (Inception 12/30/94) | | | | | | | | | |
Net Asset Value1 | | 3.62 | | | 2.23 | | | 3.02 | |
With CDSC3 | | 2.62 | | | 2.23 | | | 3.02 | |
| | | | |
Class Y (Inception 3/31/94) | | | | | | | | | |
Net Asset Value1 | | 4.55 | | | 3.21 | | | 4.06 | |
| | | | |
| COMPARATIVE PERFORMANCE | | 1 YEAR | | | 5 YEARS | | | 10 YEARS | |
Lehman 1-5 Yr Gov’t Bond Index | | 6.74 | % | | 3.72 | % | | 4.84 | % |
Morningstar Short Gov’t Fund Avg. | | 4.23 | | | 2.82 | | | 3.87 | |
See page 11 for a description of the indexes.
All returns represent past performance and do not guarantee future results. Periods of less than one year are not annualized. Share price and return will vary and you may have a gain or loss when you sell your shares. All results include reinvestment of dividends and capital gains. Current returns may be higher or lower than those shown. For performance current to the most recent month-end, visit www.funds.natixis.com. Performance history includes periods from a predecessor fund. Class Y shares are available to certain investors, as described in the prospectus.
The table and graph do not reflect taxes shareholders might owe on any fund distributions or when they redeem their shares.
PORTFOLIO FACTS
| | | | | | |
| |
| | | % of Net Assets as of | |
| FUND COMPOSITION | | 9/30/08 | | | 9/30/07 | |
Mortgage Related | | 67.6 | | | 60.7 | |
Treasuries | | 4.6 | | | 9.3 | |
Asset-Backed Securities | | 3.5 | | | 5.7 | |
Agency | | 3.0 | | | 3.3 | |
ABS Credit Card | | 2.7 | | | — | |
Mortgage Backed Securities | | 2.0 | | | 1.1 | |
Automotive | | 1.8 | | | — | |
Hybrid ARMs | | 1.6 | | | 2.5 | |
Collateralized Mortgage Obligation | | 0.1 | | | 0.2 | |
Short Term Investments & Other | | 13.1 | | | 17.2 | |
| |
| | | % of Net Assets as of | |
| EFFECTIVE MATURITY | | 9/30/08 | | | 9/30/07 | |
1 year or less | | 19.0 | | | 20.9 | |
1-5 years | | 74.5 | | | 63.2 | |
5-10 years | | 6.5 | | | 15.9 | |
10+ years | | n/a | | | n/a | |
Average Effective Maturity | | 3.0 | years | | 3.2 | years |
Portfolio characteristics will vary.
EXPENSE RATIOS AS STATED IN THE MOST RECENT PROSPECTUS
| | | | | | |
| Share Class | | Gross Expense Ratio5 | | | Net Expense Ratio6 | |
A | | 1.10 | % | | 0.90 | % |
B | | 1.85 | | | 1.65 | |
C | | 1.85 | | | 1.65 | |
Y | | 0.75 | | | 0.65 | |
NOTES TO CHARTS
1 | Does not include a sales charge. |
2 | Includes maximum sales charge of 3.00%. |
3 | Performance for Class B shares assumes a maximum 5% contingent deferred sales charge (“CDSC”) applied when you sell shares, which declines annually between years 1-6 according to the following schedule: 5, 4, 3, 3, 2, 1, 0%. Class C shares performance assumes a 1% CDSC applied when you sell shares within one year of purchase. |
4 | Fund performance has been increased by expense reductions and reimbursements, if any, without which performance would have been lower. |
5 | Before reductions and reimbursements. |
6 | After reductions and reimbursements. Expense reductions are contractual and are set to expire on 1/31/09. |
8
LOOMIS SAYLES STRATEGIC INCOME FUND
PORTFOLIO PROFILE
Objective:
Seeks high current income, with a secondary objective of capital growth
Strategy:
Invests primarily in income-producing securities in the U.S. and around the world
Fund Inception:
May 1, 1995
Managers:
Daniel J. Fuss, CFA, CIC
Kathleen C. Gaffney, CFA
Associate Managers:
Matthew J. Eagan, CFA
Elaine M. Stokes
Loomis, Sayles & Company, L.P.
Symbols:
| | |
| Class A | | NEFZX |
| Class B | | NEZBX |
| Class C | | NECZX |
| Class Y | | NEZYX |
What You Should Know:
Fixed-income securities are subject to credit risk and interest rate risk; their value generally rises when prevailing interest rates fall and falls when rates rise.
The fund can invest a significant percentage of assets in debt securities that are rated below investment grade and the value of fund shares can be adversely affected by changes in economic conditions or other circumstances. Lower rated debt securities have speculative characteristics and may be subject to greater price volatility than higher rated investments. In addition, the secondary market for these securities may lack liquidity. The fund can also invest a significant percentage of assets in foreign securities and the value of the fund shares can be adversely affected by changes in currency exchange rates, political, and economic developments. In emerging markets, these risks can be significant. Fund shares should be viewed as a long-term investment.
Management Discussion
The cascading credit crisis that began with falling home prices and defaults on subprime mortgages led to extreme weakness in fixed-income and equity markets around the globe. Faced with growing uncertainty, investors sought to avoid as much risk as possible, abandoning investment-grade and high-yield corporate bonds and seeking safety in U.S. Treasury securities. In the weakened financial sector, banks began closing down interbank lending and leaving other potential borrowers with nowhere to turn. As the period drew to a close, the Federal Reserve Board and Congress were marshalling resources in an effort to address the spreading loss of confidence and to restore liquidity to the markets.
For the fiscal year ended September 30, 2008, Class A shares of Loomis Sayles Strategic Income Fund returned -14.54% at net asset value, including $1.01 in dividends and $0.01 in capital gains reinvested during the period. These results were significantly behind the fund’s benchmark, the Lehman Aggregate Bond Index, which returned 3.65% for the period. The fund also trailed Morningstar’s Multisector Bond category, which had an average return of -6.41%. The fund’s focus on credit sectors, the strength of the U.S. dollar and some adverse security choices all contributed to the fund’s decline in value. However, the fund’s 30-day SEC yield on September 30, 2008 was 8.42%.
WERE THERE ANY BRIGHT SPOTS FOR THE FUND?
U.S. Treasury securities led all portfolio sectors as risk-averse investors drove prices up, but depressing yields. Mortgage-related bonds issued and backed by federal agencies also held up relatively well. Overseas, global growth trends were intact for much of this 12-month period. Strong commodity prices aided returns on holdings denominated in the currencies of Mexico, Singapore and Malaysia until shrinking demand undercut prices of industrial commodities.
WHICH FORCES HAD THE WORST IMPACT?
Results for the first eight months of fiscal 2008 were not out of line with what has occurred historically during cyclical economic downturns. In keeping with our established discipline, we sought to take advantage of what appeared to be attractive valuations in anticipation of positive returns when the markets recover. However, September’s turmoil let loose a flood of market disruptions.
Much of the fund’s underperformance occurred in September, when financials, investment-grade and high-yield corporates, as well as emerging-market holdings all declined in value. Negative events surrounding several major financial institutions had direct negative impacts on performance. Holdings in the communications, technology and consumer arenas suffered as companies found it increasingly difficult to obtain loans. Global economic prospects also dimmed in the closing quarter of the fiscal period, undercutting the value of holdings tied to Iceland’s krona, the British pound and the Canadian dollar.
WHAT NOW?
This is not the first period of severe market volatility that Loomis funds have faced while building strong performance histories over prolonged periods. In each of those cases, as now, our focus was on the opportunities presented by carefully selected securities whose prices had fallen sharply.
Although the end of the current turmoil is not yet in sight, we believe attractive valuations abound in a wide range of market sectors. Low prices mean higher yields. There is also potential for substantial price appreciation if the right combination of policy initiatives allows conditions to stabilize. This stabilization is especially important in the housing market, where our analysts believe values may soon bottom. Looking past the current turbulence, we anticipate an economic upturn beginning some time next year, but limits on credit availability may hold back any recovery.
9
LOOMIS SAYLES STRATEGIC INCOME FUND
Investment Results through September 30, 2008
PERFORMANCE IN PERSPECTIVE
The charts comparing the fund’s performance to two indexes provide you with a general sense of how it performed. The fund’s total return for the period shown below appears with and without sales charges and includes fund expenses and fees. An index measures the performance of a theoretical portfolio. Unlike a fund, the index is unmanaged and does not have expenses that affect the results. It is not possible to invest directly in an index. Investors would incur transaction costs and other expenses if they purchased the securities necessary to match the index.
Growth of a $10,000 Investment in Class A Shares4
Average Annual Returns — September 30, 20084
| | | | | | | | | | | | |
| | | | | |
| | | 1 YEAR | | | 5 YEARS | | | 10 YEARS | | | SINCE
INCEPTION | |
Class A (Inception 5/1/95) | | | | | | | | | | | | |
Net Asset Value1 | | -14.54 | % | | 5.39 | % | | 8.44 | % | | — | |
With Maximum Sales Charge2 | | -18.41 | | | 4.43 | | | 7.94 | | | — | |
| | | | | |
Class B (Inception 5/1/95) | | | | | | | | | | | | |
Net Asset Value1 | | -15.19 | | | 4.58 | | | 7.62 | | | — | |
With CDSC3 | | -19.17 | | | 4.26 | | | 7.62 | | | — | |
| | | | | |
Class C (Inception 5/1/95) | | | | | | | | | | | | |
Net Asset Value1 | | -15.19 | | | 4.58 | | | 7.63 | | | — | |
With CDSC3 | | -15.99 | | | 4.58 | | | 7.63 | | | — | |
| | | | | |
Class Y (Inception 12/1/99) | | | | | | | | | | | | |
Net Asset Value1 | | -14.34 | | | 5.65 | | | — | | | 7.97 | % |
| | | | | |
| COMPARATIVE PERFORMANCE | | 1 YEAR | | | 5 YEARS | | | 10 YEARS | | | SINCE
CLASS Y
INCEPTION5 | |
Lehman Aggregate Bond Index | | 3.65 | % | | 3.78 | % | | 5.20 | % | | 5.90 | % |
Lehman U.S. Universal Bond Index | | 2.32 | | | 3.89 | | | 5.38 | | | 5.97 | |
Morningstar Multisector Bond Fund Avg. | | -6.41 | | | 3.89 | | | 5.22 | | | 5.29 | |
See page 11 for a description of the indexes.
All returns represent past performance and do not guarantee future results. Periods of less than one year are not annualized. Share price and return will vary and you may have a gain or loss when you sell your shares. All results include reinvestment of dividends and capital gains. Current returns may be higher or lower than those shown. Performance history includes periods from a predecessor fund. For performance current to the most recent month-end, visit www.funds.natixis.com. Class Y shares are available to certain investors, as described in the prospectus.
The table and graph do not reflect taxes shareholders might owe on any fund distributions or when they redeem their shares.
PORTFOLIO FACTS
| | | | |
| |
| | | % of Net Assets as of |
| CREDIT QUALITY | | 9/30/08 | | 9/30/07 |
Aaa | | 18.3 | | 32.6 |
Aa | | 4.1 | | 2.7 |
A | | 8.1 | | 6.5 |
Baa | | 32.0 | | 22.7 |
Ba | | 10.0 | | 9.9 |
B | | 10.3 | | 9.5 |
Caa | | 7.4 | | 5.6 |
Ca | | 0.8 | | — |
C | | 0.0 | | — |
Not Rated* | | 8.8 | | 7.4 |
Short-term and other | | 0.2 | | 3.1 |
Credit quality is based on ratings from Moody’s Investor Service.
* Securities that are not rated by Moody’s may be rated by another rating agency or by Loomis Sayles.
| | | | | | |
| |
| | | % of Net Assets as of | |
| EFFECTIVE MATURITY | | 9/30/08 | | | 9/30/07 | |
1 year or less | | 8.6 | | | 10.9 | |
1-5 years | | 20.6 | | | 17.6 | |
5-10 years | | 28.2 | | | 19.4 | |
10+ years | | 42.6 | | | 52.1 | |
Average Effective Maturity | | 13.8 | years | | 15.6 | years |
Portfolio characteristics will vary.
EXPENSE RATIOS AS STATED IN THE MOST RECENT PROSPECTUS
| | | | | | |
| Share Class | | Gross Expense Ratio6 | | | Net Expense Ratio7 | |
A | | 1.01 | % | | 1.01 | % |
B | | 1.77 | | | 1.77 | |
C | | 1.75 | | | 1.75 | |
Y | | 0.74 | | | 0.74 | |
NOTES TO CHARTS
1 | Does not include a sales charge. |
2 | Includes maximum sales charge of 4.50%. |
3 | Performance for Class B shares assumes a maximum 5% contingent deferred sales charge (“CDSC”) applied when you sell shares, which declines annually between years 1-6 according to the following schedule: 5, 4, 3, 3, 2, 1, 0%. Class C share performance assumes a 1.00% CDSC applied when you sell shares within one year of purchase. |
4 | Fund performance has been increased by expense reductions and reimbursements, if any, without which performance would have been lower. |
5 | The since-inception comparative performance figures shown for Class Y are calculated from 12/1/99. |
6 | Before reductions and reimbursements. |
7 | After reductions and reimbursements. Expense reductions are contractual and are set to expire on 1/31/09. |
10
ADDITIONAL INFORMATION
The views expressed in this report reflect those of the portfolio managers as of the dates indicated. The managers’ views are subject to change at any time without notice based on changes in market or other conditions. References to specific securities or industries should not be regarded as investment advice. Because the funds are actively managed, there is no assurance that they will continue to invest in the securities or industries mentioned.
For more complete information on any Natixis Fund, contact your financial professional or call Natixis Funds and ask for a free prospectus, which contains more complete information including charges and other ongoing expenses. Investors should consider a fund’s objective, risks and expenses carefully before investing. This and other fund information can be found in the prospectus. Please read the prospectus carefully before investing.
INDEX/AVERAGE DESCRIPTIONS
Lehman Aggregate Bond Index is an unmanaged index of investment-grade bonds with one- to ten-year maturities issued by the U.S. government, its agencies and U.S. corporations.
Lehman Global Aggregate Bond ex-USD Index is an unmanaged index which provides a broad-based measure of the international investment-grade bond market.
Lehman High Yield Composite Index is a market-weighted, unmanaged index of fixed-rate, non-investment grade debt.
Lehman 1-5 Year Government Bond Index is an unmanaged, market-weighted index of bonds issued by the U.S. government and its agencies, with maturities between one and five years.
Lehman U.S. Credit Index is an unmanaged index that includes all publicly issued, fixed-rate, nonconvertible, dollar-denominated, SEC-registered, U.S. investment-grade corporate debt, and foreign debt that meets specific maturity, liquidity and quality requirements.
Lehman U.S. Universal Bond Index is an unmanaged index representing a blend of the Lehman Aggregate Bond Index, the High Yield Index, and the Emerging Market Index, among other indexes.
Morningstar Fund Averages are the average performance without sales charge of funds with similar investment objectives, as calculated by Morningstar, Inc.
PROXY VOTING INFORMATION
A description of the funds’ proxy voting policies and procedures is available without charge, upon request, by calling Natixis Funds at 800-225-5478; on the funds’ website at www.funds.natixis.com; and on the Securities and Exchange Commission’s (SEC’s) website at www.sec.gov. Information regarding how the funds voted proxies relating to portfolio securities during the 12-month period ended June 30, 2008 is available from the funds’ website and the SEC’s website.
QUARTERLY PORTFOLIO SCHEDULES
The funds file a complete schedule of portfolio holdings with the SEC for the first and third quarters of each fiscal year on Form N-Q. The funds’ Forms N-Q are available on the SEC’s website at www.sec.gov and may be reviewed and copied at the SEC’s Public Reference Room in Washington, DC. Information on the operation of the Public Reference Room may be obtained by calling
1-800-SEC-0330.
| | | | |
| NOT FDIC INSURED | | MAY LOSE VALUE | | NO BANK GUARANTEE |
11
UNDERSTANDING FUND EXPENSES
As a mutual fund shareholder, you incur different costs: transaction costs, including sales charges (loads) on purchases, redemption fees and certain exchange fees and ongoing costs, including management fees, distribution and/or service fees (12b-1 fees), and other fund expenses. In addition, each fund assesses a minimum balance fee of $20 on an annual basis for accounts that fall below the required minimum to establish an account. Certain exemptions may apply. These costs are described in more detail in the funds’ prospectuses. The examples below are intended to help you understand the ongoing costs of investing in the funds and help you compare these with the ongoing costs of investing in other mutual funds.
The first line in the table of each Class of fund shares shows the actual account values and actual fund expenses you would have paid on a $1,000 investment in the fund from April 1, 2008 through September 30, 2008. To estimate the expenses you paid over the period, simply divide your account value by $1,000 (for example $8,600 account value divided by $1,000 = 8.60) and multiply the result by the number in the Expenses Paid During Period column as shown below for your Class.
The second line in the table of each Class of fund shares provides information about hypothetical account values and hypothetical expenses based on the fund’s actual expense ratios and an assumed rate of return of 5% per year before expenses, which is not the fund’s actual return. The hypothetical account values and expenses may not be used to estimate the actual ending account balance or expenses you paid on your investment for the period. You may use this information to compare the ongoing costs of investing in the fund and other funds. To do so, compare this 5% hypothetical example with the 5% hypothetical examples that appear in the shareholder reports of the other funds.
Please note that the expenses shown reflect ongoing costs only, and do not include any transaction costs such as sales charges, redemption fees, or exchange fees. Therefore, the second line in the table of each fund is useful in comparing ongoing costs only, and will not help you determine the relative costs of owning different funds. If transaction costs were included, total costs would be higher.
| | | | | | |
| LOOMIS SAYLES CORE PLUS BOND FUND | | BEGINNING ACCOUNT VALUE 4/1/08 | | ENDING ACCOUNT VALUE 9/30/08 | | EXPENSES PAID DURING PERIOD* 4/1/08 – 9/30/08 |
Class A | | | | | | |
Actual | | $1,000.00 | | $949.90 | | $4.39 |
Hypothetical (5% return before expenses) | | $1,000.00 | | $1,020.50 | | $4.55 |
Class B | | | | | | |
Actual | | $1,000.00 | | $946.30 | | $8.03 |
Hypothetical (5% return before expenses) | | $1,000.00 | | $1,016.75 | | $8.32 |
Class C | | | | | | |
Actual | | $1,000.00 | | $946.60 | | $8.03 |
Hypothetical (5% return before expenses) | | $1,000.00 | | $1,016.75 | | $8.32 |
Class Y | | | | | | |
Actual | | $1,000.00 | | $951.30 | | $3.17 |
Hypothetical (5% return before expenses) | | $1,000.00 | | $1,021.75 | | $3.29 |
| * | Expenses are equal to the Fund’s annualized expense ratio (after fee reduction/reimbursement): 0.90%, 1.65%, 1.65% and 0.65% for Class A, B, C and Y respectively, multiplied by the average account value over the period, multiplied by the number of days in the most recent fiscal half-year, divided by 366 (to reflect the half-year period). |
12
UNDERSTANDING FUND EXPENSES
| | | | | | |
| LOOMIS SAYLES HIGH INCOME FUND | | BEGINNING ACCOUNT VALUE 4/1/08 | | ENDING ACCOUNT VALUE 9/30/08 | | EXPENSES PAID DURING PERIOD* 4/1/08 – 9/30/08 |
CLASS A | | | | | | |
Actual | | $1,000.00 | | $913.50 | | $5.50 |
Hypothetical (5% return before expenses) | | $1,000.00 | | $1,019.25 | | $5.81 |
CLASS B | | | | | | |
Actual | | $1,000.00 | | $910.10 | | $9.07 |
Hypothetical (5% return before expenses) | | $1,000.00 | | $1,015.50 | | $9.57 |
CLASS C | | | | | | |
Actual | | $1,000.00 | | $910.20 | | $9.07 |
Hypothetical (5% return before expenses) | | $1,000.00 | | $1,015.50 | | $9.57 |
CLASS Y1 | | | | | | |
Actual | | $1,000.00 | | $914.40 | | $4.31 |
Hypothetical (5% return before expenses) | | $1,000.00 | | $1,020.50 | | $4.55 |
| * | Expenses are equal to the Fund’s annualized expense ratio (after fee reduction/reimbursement): 1.15%, 1.90%, 1.90% and 0.90%, for Class A, B, C, and Y, respectively, multiplied by the average account value over the period, multiplied by the number of days in the most recent fiscal half-year, divided by 366 (to reflect the half-year period). |
1 | Class Y commenced operations on February 29, 2008. |
| | | | | | |
| LOOMIS SAYLES INTERNATIONAL BOND FUND1 | | BEGINNING ACCOUNT VALUE 4/1/08 | | ENDING ACCOUNT VALUE 9/30/08 | | EXPENSES PAID DURING PERIOD* 4/1/08 – 9/30/08 |
CLASS A | | | | | | |
Actual | | $1,000.00 | | $893.30 | | $5.21 |
Hypothetical (5% return before expenses) | | $1,000.00 | | $1,019.50 | | $5.55 |
CLASS C | | | | | | |
Actual | | $1,000.00 | | $888.30 | | $8.73 |
Hypothetical (5% return before expenses) | | $1,000.00 | | $1,015.75 | | $9.32 |
CLASS Y | | | | | | |
Actual | | $1,000.00 | | $892.90 | | $4.02 |
Hypothetical (5% return before expenses) | | $1,000.00 | | $1,020.75 | | $4.29 |
| * | Expenses are equal to the Fund’s annualized expense ratio (after fee reduction/reimbursement): 1.10%, 1.85% and 0.85%, for Class A, C and Y, respectively, multiplied by the average account value over the period, multiplied by the number of days in the most recent fiscal half-year, divided by 366 (to reflect the half-year period). |
1 | Fund commenced operations on February 1, 2008. |
13
UNDERSTANDING FUND EXPENSES
| | | | | | |
LOOMIS SAYLES LIMITED TERM GOVERNMENT AND
AGENCY FUND | | BEGINNING ACCOUNT VALUE 4/1/08 | | ENDING ACCOUNT VALUE 9/30/08 | | EXPENSES PAID DURING PERIOD* 4/1/08 – 9/30/08 |
CLASS A | | | | | | |
Actual | | $1,000.00 | | $1,005.30 | | $4.51 |
Hypothetical (5% return before expenses) | | $1,000.00 | | $1,020.50 | | $4.55 |
CLASS B | | | | | | |
Actual | | $1,000.00 | | $1,001.50 | | $8.26 |
Hypothetical (5% return before expenses) | | $1,000.00 | | $1,016.75 | | $8.32 |
CLASS C | | | | | | |
Actual | | $1,000.00 | | $1,002.40 | | $8.26 |
Hypothetical (5% return before expenses) | | $1,000.00 | | $1,016.75 | | $8.32 |
CLASS Y | | | | | | |
Actual | | $1,000.00 | | $1,006.50 | | $3.26 |
Hypothetical (5% return before expenses) | | $1,000.00 | | $1,021.75 | | $3.29 |
| * | Expenses are equal to the Fund’s annualized expense ratio (after fee reduction/reimbursement): 0.90%, 1.65%, 1.65% and 0.65% for Class A, B, C and Y, respectively, multiplied by the average account value over the period, multiplied by the number of days in the most recent fiscal half-year, divided by 366 (to reflect the half-year period). |
| | | | | | |
| LOOMIS SAYLES STRATEGIC INCOME FUND | | BEGINNING ACCOUNT VALUE 4/1/08 | | ENDING ACCOUNT VALUE 9/30/08 | | EXPENSES PAID DURING PERIOD* 4/1/08 – 9/30/08 |
CLASS A | | | | | | |
Actual | | $1,000.00 | | $866.20 | | $4.53 |
Hypothetical (5% return before expenses) | �� | $1,000.00 | | $1,020.15 | | $4.90 |
CLASS B | | | | | | |
Actual | | $1,000.00 | | $862.80 | | $8.01 |
Hypothetical (5% return before expenses) | | $1,000.00 | | $1,016.40 | | $8.67 |
CLASS C | | | | | | |
Actual | | $1,000.00 | | $862.20 | | $8.01 |
Hypothetical (5% return before expenses) | | $1,000.00 | | $1,016.40 | | $8.67 |
CLASS Y | | | | | | |
Actual | | $1,000.00 | | $866.60 | | $3.36 |
Hypothetical (5% return before expenses) | | $1,000.00 | | $1,021.40 | | $3.64 |
| * | Expenses are equal to the Fund’s annualized expense ratio (after fee reduction/reimbursement): 0.97%, 1.72%, 1.72% and 0.72% for Class A, B, C and Y, respectively, multiplied by the average account value over the period, multiplied by the number of days in the most recent fiscal half-year, divided by 366 (to reflect the half-year period). |
14
BOARD APPROVALOFTHE EXISTING ADVISORYAND SUB-ADVISORY AGREEMENTS
The Board of Trustees, including the Independent Trustees, considers matters bearing on each Fund’s advisory agreement, or with respect to a newly formed fund, proposed advisory agreement (collectively, the “Agreements”) at most of its meetings throughout the year. Each year, usually in the spring, the Contract Review and Governance Committee of the Board meets to review the Agreements to determine whether to recommend that the full Board approve the continuation of the Agreements, typically for an additional one-year period with respect to existing Funds, and an initial two-year term for funds that are newly formed, such as Loomis Sayles International Bond Fund. After the Committee has made its recommendation, the full Board, including the Independent Trustees, determines whether to approve the continuation of the Agreements.
In connection with these meetings, the Trustees receive materials that the Funds’ investment adviser believe to be reasonably necessary for the Trustees to evaluate the Agreements. These materials generally include, among other items, (i) information on the investment performance of existing Funds peer groups of funds, and the Funds’ performance benchmarks, (ii) information on the Funds’ existing or proposed advisory fee and other expenses, including information comparing the Funds’ expenses to those of peer groups of funds and information about any applicable expense caps and fee “breakpoints,” (iii) sales and redemption data in respect of the existing Funds, (iv) information about the profitability of the existing Agreements to the Funds’ adviser ( the “Adviser”), and (v) information obtained through the completion of a questionnaire by the Adviser (the Trustees are consulted as to the information requested through that questionnaire). The Board of Trustees, including the Independent Trustees, also consider other matters such as (i) the Adviser’s financial results and financial condition, (ii) the Fund’s investment objective and strategies and the size, education and experience of the Adviser’s investment staff and its use of technology, external research and trading cost measurement tools, (iii) arrangements or proposed arrangements in respect of the distribution of the Funds’ shares and the related costs, (iv) the procedures employed to determine the value of the Funds’ assets, (v) the allocation of the Funds’ brokerage, if any, including allocations to brokers affiliated with the Advisers and the use of “soft” commission dollars to pay Fund expenses and to pay for research and other similar services, (vi) the resources devoted to, and the record of compliance with, the Funds’ investment policies and restrictions, policies on personal securities transactions and other compliance policies, and (vii) the general economic outlook with particular emphasis on the mutual fund industry. Throughout the process, the Trustees are afforded the opportunity to ask questions of and request additional materials from the Adviser.
In addition to the materials requested by the Trustees in connection with the annual consideration of the continuation of the Agreements, and with respect to all Funds other than Loomis Sayles International Bond Fund, which is newly formed, the Trustees receive materials in advance of each regular quarterly meeting of the Board of Trustees that provide detailed information about the Funds’ investment performance and the fees charged to the Funds for advisory and other services. This information generally includes, among other things, an internal performance rating for each Fund based on agreed-upon criteria, graphs showing performance and fee differentials against each Fund’s peer group, performance ratings provided by a third-party, total return information for various periods, and third-party performance rankings for various periods comparing a Fund against its peer group. The portfolio management team for each Fund makes periodic presentations to the Contract Review and Governance Committee and/or the full Board of Trustees, and Funds identified as presenting possible performance concerns may be subject to more frequent board presentations and reviews. In addition, each quarter the Trustees are provided with detailed statistical information about each Fund’s portfolio.
The Board of Trustees most recently approved the continuation of the existing Agreements at their meeting held in June 2008. The Agreements were continued for a one-year period for all Funds. With respect to Loomis Sayles International Bond Fund, the Trustees, including the Independent Trustees, unanimously approved the Agreement for the Fund for an initial two-year term at an in-person meeting held in November 2007. In considering whether to approve the continuation of the Agreements, the Board of Trustees, including the Independent Trustees, did not identify any single factor as determinative. Matters considered by the Trustees, including the Independent Trustees, in connection with their approval of the Agreements included the following:
The nature, extent and quality of the services provided to the Funds under the Agreements. The Trustees considered the nature, extent and quality of the services provided or to be provided by the Adviser and its affiliates to the Funds and the resources dedicated or to be dedicated to the Funds by the Adviser and its affiliates, including recent or planned investments by the Adviser in additional personnel or other resources. They also took note of the competitive market for talented personnel, in particular, for personnel who have contributed to the generation of strong investment performance. They considered the need for the Adviser to offer competitive compensation in order to attract and retain capable personnel. In the case of Loomis Sayles Strategic Income Fund, which had experienced substantial net cash inflows, the Trustees considered factors including (1) the additional efforts required to manage the Fund’s portfolio in such circumstances (including the need to identify additional portfolio securities for investment as the portfolio grows), (2) the additional personnel and other resources required to manage the portfolio in such circumstances, (3) the possible
15
BOARD APPROVALOFTHE EXISTING ADVISORYAND SUB-ADVISORY AGREEMENTS
effects of such cash inflows on the Fund’s ability to achieve attractive investment returns and (4) the benefits to the Fund of such net cash inflows (including lower expense ratios).
For each Fund, the Trustees also considered the benefits to shareholders of investing in a mutual fund that is part of a family of funds that offers shareholders the right to exchange shares of one type of fund for shares of another type of fund, and provides a variety of fund and shareholder services.
After reviewing these and related factors, the Trustees concluded, within the context of their overall conclusions regarding each of the Agreements, that the nature, extent and quality of services provided or to be provided under the Agreements supported the renewal or approval of the Agreements.
Investment performance of the Funds and the Advisers. As noted above, the Trustees received information about the performance of the Funds over various time periods, including information which compared the performance of the Funds to the performance of peer groups of funds and the Funds’ respective performance benchmarks. In addition, the Trustees also reviewed data prepared by an independent third party which analyzed the performance of the Funds using a variety of performance metrics, including metrics which also measured the performance of the Funds on a risk adjusted basis. Because Loomis Sayles International Bond Fund had not yet commenced operations, performance information for that Fund was not considered, although the Board considered the performance of the Fund’s Adviser.
With respect to each Fund, the Board concluded that the Fund’s performance and/or other relevant factors supported the renewal or approval of the Agreement relating to that Fund. In the case of each Fund that had performance that lagged that of a relevant peer group for certain (although not necessarily all) periods, the Board concluded that other factors relevant to performance supported renewal of the Funds’ Agreements. These factors varied from Fund to Fund, but included one or more of the following: (1) that the underperformance was attributable, to a significant extent, to investment decisions (such as security selection or sector allocation) by the Fund’s Adviser that were reasonable and consistent with the Fund’s investment objective and policies and (2) reductions in the Fund’s expense levels resulting from decreased expenses and/or increased assets were not yet fully reflected in the Fund’s performance results.
The Trustees also considered the Adviser’s performance and reputation generally, the Funds’ performance as a fund family generally (as noted by certain financial publications), and the historical responsiveness of the Advisers to Trustee concerns about performance and the willingness of the Advisers to take steps intended to improve performance.
After reviewing these and related factors, the Trustees concluded, within the context of their overall conclusions regarding each of the Agreements, that the performance of the Funds and the Adviser and/or other relevant factors supported the renewal or approval of the Agreements.
The costs of the services to be provided and profits to be realized by the Adviser and its affiliates from their respective relationships with the Funds. The Trustees considered the fees charged or to be charged to the Funds for advisory services as well as the total expense levels of the Funds. This information included comparisons (provided both by management and also by an independent third party) of the Funds’ advisory fees and total expense levels to those of their peer groups and information about the advisory fees charged by the Advisers to comparable accounts. In considering the fees charged to comparable accounts, the Trustees considered, among other things, management’s representations about the differences between managing mutual funds as compared to other types of accounts, including the additional resources required to effectively manage mutual fund assets. In evaluating each Fund’s advisory fees, the Trustees also took into account the demands, complexity and quality of the investment management of such Fund. The Trustees considered that over the past several years, management had made recommendations regarding reductions in advisory fee rates, implementation of advisory fee breakpoints and the institution of advisory fee waivers and expense caps for various Funds in the Fund family. They noted that, as of December 31, 2007, all of the Natixis Funds in this report have expense caps in place, and they considered the amounts waived or reimbursed by the Adviser under these caps. The Trustees noted that the Loomis Sayles Strategic Income Fund had an advisory fee rate that was above the median of a peer group of Funds. The Trustees considered the circumstances that accounted for such relatively higher expenses. The Trustees noted that for the Loomis Sayles Strategic Income Fund, the Fund’s total expense ratio was below the median even though the advisory fee was above the median. For Loomis Sayles Strategic Income Fund, the Trustees also considered that management was recommending an additional breakpoint in the advisory fee schedule.
16
BOARD APPROVALOFTHE EXISTING ADVISORYAND SUB-ADVISORY AGREEMENTS
The Trustees also considered the compensation directly or indirectly received or to be received by the Adviser and its affiliates from their relationships with the Funds. The Trustees reviewed information provided by management as to the profitability of the Advisers’ and their affiliates’ relationships with the Funds, and information about the allocation of expenses used to calculate profitability. They also reviewed information provided by management about the effect of distribution costs and Fund growth on Adviser profitability, including information regarding resources spent on distribution activities and the increase in net sales for the family of funds. When reviewing profitability, the Trustees also considered information about court cases in which adviser profitability was an issue, the performance of the relevant Funds, the expense levels of the Funds, and whether the Adviser had implemented breakpoints and/or expense caps with respect to such Funds.
After reviewing these and related factors, the Trustees concluded, within the context of their overall conclusions regarding each of the Agreements, that the advisory fees charged or proposed to be charged to each of the Funds were fair and reasonable, and that the costs of these services generally and the related profitability of the Adviser and its affiliates in respect of their relationships with the Funds supported the renewal or approval of the Agreements.
Economies of Scale. The Trustees considered the existence of any economies of scale in the provision of services by the Adviser and whether those economies are shared with the Funds through breakpoints in their investment advisory fees or other means, such as expense waivers. The Trustees noted that each of the Funds was subject to an expense cap or waiver. The Trustees also considered management’s representation that for certain Funds, the Funds’ Adviser did not benefit from economies of scale in providing services to the Funds (because of the investment style of the Fund, the small size of the Fund or for other reasons). For Loomis Sayles Strategic Income Fund, the Trustees considered that management proposed implementing an additional breakpoint in response to the growth of assets in the Fund. In considering these issues, the Trustees also took note of the costs of the services provided (both on an absolute and a relative basis) and the profitability to the Adviser and its affiliates of their relationships with the Funds, as discussed above.
After reviewing these and related factors, the Trustees considered, within the context of their overall conclusions regarding each of the Agreements, that the extent to which economies of scale were shared with the Funds supported the renewal of the Agreements.
The Trustees also considered other factors, which included but were not limited to the following:
| · | | whether each Fund, other than Loomis Sayles International Bond Fund, has operated in accordance with its investment objective and the Fund’s record of compliance with its investment restrictions, and the compliance programs of the Funds and the Adviser. They also considered the compliance-related resources the Adviser and its affiliates were providing or would be providing to the Funds. |
| · | | the nature, quality, cost and extent of administrative and shareholder services performed or to be performed by the Adviser and its affiliates, both under the Agreements and under separate agreements covering administrative services. |
| · | | so-called “fallout benefits” to the Adviser, such as the engagement of affiliates of the existing or potential Adviser to provide distribution, administrative and brokerage services to the Funds, and the benefits of research made available to the Adviser by reason of brokerage commissions generated by the Funds’ securities transactions. The Trustees considered the possible conflicts of interest associated with these fallout and other benefits, and the reporting, disclosure and other processes in place to disclose and monitor such possible conflicts of interest. |
Based on their evaluation of all factors that they deemed to be material, including those factors described above, and assisted by the advice of independent counsel, the Trustees, including the Independent Trustees, concluded that each of the existing advisory agreements should be continued through June 30, 2009 and that the advisory agreement for Loomis Sayles International Bond Fund should be continued until November 16, 2009.
17
LOOMIS SAYLES CORE PLUS BOND FUND — PORTFOLIOOF INVESTMENTS
Investments as of September 30, 2008
| | | | | | |
Principal
Amount (‡) | | Description | | Value (†) |
| | | | | | |
| | Bonds and Notes — 96.4% of Net Assets | | | |
| | | Asset-Backed Securities — 2.5% | | | |
| $ | 189,062 | | Countrywide Asset-Backed Certificates, Series 2004-S1, Class A2, 3.872%, 3/25/2020 | | $ | 181,743 |
| | 1,095,000 | | Countrywide Asset-Backed Certificates, Series 2004-S1, Class A3, 4.615%, 2/25/2035 | | | 786,320 |
| | 3,314,587 | | Countrywide Asset-Backed Certificates, Series 2006-S4, Class A3, 5.804%, 7/25/2034 | | | 2,154,482 |
| | 1,118,858 | | Residential Asset Securities Corp., Series 2003-KS10, Class AI4, 4.470%, 3/25/2032 | | | 984,708 |
| | 276,553 | | WFS Financial Owner Trust, Series 2004-4, Class A4, 3.440%, 5/17/2012 | | | 271,697 |
| | | | | | |
| | | | | | 4,378,950 |
| | | | | | |
| | | Automotive — 0.8% | | | |
| | 955,000 | | Ford Motor Co., 7.450%, 7/16/2031(b) | | | 410,650 |
| | 865,000 | | Ford Motor Credit Co., 7.000%, 10/01/2013 | | | 531,592 |
| | 810,000 | | Ford Motor Credit Co., 8.000%, 12/15/2016 | | | 512,145 |
| | | | | | |
| | | | | | 1,454,387 |
| | | | | | |
| | | Banking — 2.7% | | | |
| | 1,970,000 | | Bank of America Corp., 5.750%, 12/01/2017 | | | 1,670,536 |
| | 1,670,000 | | Citigroup, Inc., 6.500%, 8/19/2013 | | | 1,484,243 |
| | 735,000 | | HSBC Finance Corp., 7.000%, 5/15/2012 | | | 714,275 |
| | 825,000 | | JPMorgan Chase & Co., 6.000%, 1/15/2018 | | | 752,294 |
| | | | | | |
| | | | | | 4,621,348 |
| | | | | | |
| | | Brokerage — 4.0% | | | |
| | 1,365,000 | | Bear Stearns Cos., Inc. (The), 6.400%, 10/02/2017 | | | 1,274,769 |
| | 625,000 | | Goldman Sachs Group, Inc., 5.300%, 2/14/2012 | | | 563,278 |
| | 1,040,000 | | Goldman Sachs Group, Inc., 6.150%, 4/01/2018 | | | 864,775 |
| | 1,230,000 | | Merrill Lynch & Co., Inc., 5.450%, 2/05/2013 | | | 1,108,010 |
| | 1,670,000 | | Merrill Lynch & Co., Inc., 6.875%, 4/25/2018 | | | 1,477,532 |
| | 800,000 | | Morgan Stanley, 4.000%, 1/15/2010 | | | 656,007 |
| | 615,000 | | Morgan Stanley, 5.375%, 10/15/2015 | | | 381,174 |
| | 435,000 | | Morgan Stanley, Series F, MTN, 6.625%, 4/01/2018 | | | 287,879 |
| | 515,000 | | Morgan Stanley, Series F, MTN, 5.550%, 4/27/2017 | | | 319,264 |
| | | | | | |
| | | | | | 6,932,688 |
| | | | | | |
| | | Building Materials — 0.7% | | | |
| | 815,000 | | Owens Corning, Inc.,
7.000%, 12/01/2036 | | | 655,159 |
| | 795,000 | | USG Corp., 6.300%, 11/15/2016 | | | 600,225 |
| | | | | | |
| | | | | | 1,255,384 |
| | | | | | |
| | | | | | |
Principal
Amount (‡) | | Description | | Value (†) |
| | | | | | |
| | | Construction Machinery — 0.1% | | | |
| $ | 220,000 | | Caterpillar Financial Service Corp., 5.450%, 4/15/2018 | | $ | 196,820 |
| | | | | | |
| | | Diversified Manufacturing — 0.6% | | | |
| | 1,200,000 | | Crane Co., 6.550%, 11/15/2036 | | | 1,093,007 |
| | | | | | |
| | | Electric — 1.9% | | | |
| | 290,000 | | AES Corp., 7.750%, 10/15/2015 | | | 263,175 |
| | 570,000 | | AES Corp., 8.000%, 10/15/2017 | | | 514,425 |
| | 950,000 | | Enersis SA, Chile, 7.375%, 1/15/2014(b) | | | 959,284 |
| | 355,000 | | Florida Power & Light Co., 4.950%, 6/01/2035 | | | 284,976 |
| | 690,000 | | Ipalco Enterprises, Inc., 144A, 7.250%, 4/01/2016 | | | 658,950 |
| | 590,000 | | Southern California Edison Co., 7.625%, 1/15/2010 | | | 612,804 |
| | | | | | |
| | | | | | 3,293,614 |
| | | | | | |
| | | Food & Beverage — 1.4% | | | |
| | 815,000 | | Dean Foods Co., 7.000%, 6/01/2016(b) | | | 709,050 |
| | 815,000 | | Dr Pepper Snapple Group, Inc., 144A, 6.820%, 5/01/2018 | | | 786,685 |
| | 925,000 | | Kraft Foods, Inc., 6.875%, 2/01/2038 | | | 851,578 |
| | | | | | |
| | | | | | 2,347,313 |
| | | | | | |
| | | Government Guaranteed — 4.5% | | | |
| | 138,000,000 | | Kreditanstalt fuer Wiederaufbau, 1.850%, 9/20/2010 (JPY) | | | 1,319,423 |
| | 472,000,000 | | Kreditanstalt fuer Wiederaufbau, EMTN, 2.050%, 9/21/2009 (JPY) | | | 4,484,903 |
| | 210,000,000 | | Oesterreichische Kontrollbank AG, 1.800%, 3/22/2010 (JPY) | | | 1,999,039 |
| | | | | | |
| | | | | | 7,803,365 |
| | | | | | |
| | | Government Owned — No Guarantee — 0.6% | | | |
| | 1,098,000 | | Pemex Project Funding Master Trust, 7.875%, 2/01/2009 | | | 1,108,361 |
| | | | | | |
| | | Healthcare — 0.9% | | | |
| | 575,000 | | HCA, Inc., 7.500%, 12/15/2023 | | | 421,216 |
| | 485,000 | | Hospira, Inc., 6.050%, 3/30/2017 | | | 462,420 |
| | 670,000 | | Medco Health Solutions, 7.250%, 8/15/2013 | | | 710,326 |
| | | | | | |
| | | | | | 1,593,962 |
| | | | | | |
| | | Hybrid ARMs — 0.3% | | | |
| | 525,619 | | JPMorgan Mortgage Trust, Series 2006-A7, Class 1A3, 5.924%, 1/25/2037(c) | | | 512,574 |
| | | | | | |
| | | Independent Energy — 1.1% | | | |
| | 290,000 | | Chesapeake Energy Corp., 6.500%, 8/15/2017 | | | 253,750 |
| | 385,000 | | Chesapeake Energy Corp., 6.875%, 11/15/2020 | | | 329,175 |
| | 830,000 | | TEPPCO Partners LP, 7.550%, 4/15/2038 | | | 737,843 |
See accompanying notes to financial statements.
18
LOOMIS SAYLES CORE PLUS BOND FUND — PORTFOLIOOF INVESTMENTS (continued)
Investments as of September 30, 2008
| | | | | | |
Principal
Amount (‡) | | Description | | Value (†) |
| | | | | | |
| | | Independent Energy — continued | | | |
| $ | 825,000 | | XTO Energy, Inc., 6.375%, 6/15/2038 | | $ | 673,608 |
| | | | | | |
| | | | | | 1,994,376 |
| | | | | | |
| | | Media Cable — 2.2% | | | |
| | 1,470,000 | | Comcast Corp., 6.950%, 8/15/2037 | | | 1,253,841 |
| | 755,000 | | Cox Communications, Inc., 6.750%, 3/15/2011 | | | 766,915 |
| | 1,085,000 | | CSC Holdings, Inc., Senior Note, Series B, 7.625%, 4/01/2011 | | | 1,041,600 |
| | 873,000 | | Time Warner Cable, Inc., 6.550%, 5/01/2037 | | | 707,032 |
| | | | | | |
| | | | | | 3,769,388 |
| | | | | | |
| | | Metals & Mining — 0.8% | | | |
| | 890,000 | | Steel Dynamics, Inc, 7.375%, 11/01/2012 | | | 814,350 |
| | 710,000 | | United States Steel Corp., 6.650%, 6/01/2037 | | | 528,033 |
| | | | | | |
| | | | | | 1,342,383 |
| | | | | | |
| | | Mortgage Backed Securities — 4.4% | | | |
| | 795,000 | | Banc of America Commercial Mortgage, Inc., Series 2005-6, Class A2, 5.165%, 9/10/2047 | | | 776,619 |
| | 850,000 | | Banc of America Commercial Mortgage, Inc., Series 2006-1, Class A2, 5.334%, 9/10/2045 | | | 821,822 |
| | 1,305,000 | | Banc of America Commercial Mortgage, Inc., Series 2007-2, Class A2, 5.634%, 4/10/2049 | | | 1,218,643 |
| | 1,245,000 | | Bear Stearns Commercial Mortgage Securities, Inc., Series 2005-PW10, Class A2, 5.270%, 12/11/2040 | | | 1,219,023 |
| | 710,000 | | Citigroup/Deutsche Bank Commercial Mortgage Trust, Series 2006-CD2, Class A2, 5.408%, 1/15/2046 | | | 687,363 |
| | 1,500,000 | | GS Mortgage Securities Corp. II, Series 2005-GG4, Class A4A, 4.751%, 7/10/2039 | | | 1,345,784 |
| | 1,710,000 | | LB-UBS Commercial Mortgage Trust, Series 2005-C3, Class A3, 4.647%, 7/15/2030 | | | 1,626,365 |
| | | | | | |
| | | | | | 7,695,619 |
| | | | | | |
| | | Mortgage Related — 34.9% | | | |
| | 960,000 | | Credit Suisse Mortgage Capital Certificates, Series 2008-C1, Class A3, 6.219%, 2/15/2041(c) | | | 844,389 |
| | 914,744 | | FHLMC, 4.000%, 7/01/2019 | | | 875,279 |
| | 1,678,493 | | FHLMC, 4.500%, 12/01/2034 | | | 1,592,534 |
| | 439,396 | | FHLMC, 5.000%, 11/01/2018 | | | 440,748 |
| | 1,217,558 | | FHLMC 5.500%, with various maturities in 2018(d) | | | 1,235,399 |
| | 1,543,566 | | FHLMC, 5.949%, 11/01/2036(c) | | | 1,555,450 |
| | 178,555 | | FHLMC, 6.000%, 6/01/2035 | | | 181,590 |
| | | | | | |
Principal
Amount (‡) | | Description | | Value (†) |
| | | | | | |
| | | Mortgage Related — continued | | | |
| $ | 722,573 | | FNMA, 4.000%, 6/01/2019 | | $ | 691,398 |
| | 5,061,559 | | FNMA 4.500%, with various maturities from 2019 to 2035(d) | | | 4,901,998 |
| | 5,770,000 | | FNMA, 5.000%, 2/13/2017 | | | 5,897,875 |
| | 936,694 | | FNMA, 5.500%, 5/01/2018 | | | 951,777 |
| | 2,333,381 | | FNMA 6.000%, with various maturities from 2016 to 2034(d) | | | 2,375,566 |
| | 1,316,549 | | FNMA, 6.044%, 2/01/2037(c) | | | 1,325,492 |
| | 1,632,821 | | FNMA 6.500%, with various maturities from 2029 to 2036(d) | | | 1,679,134 |
| | 1,863,599 | | FNMA, 6.500%, 11/01/2037 | | | 1,912,934 |
| | 207,551 | | FNMA 7.000%, with various maturities in 2030(d) | | | 218,176 |
| | 205,805 | | FNMA 7.500%, with various maturities from 2024 to 2032(d) | | | 222,361 |
| | 13,382,003 | | GNMA 5.000%, with various maturities from 2035 to 2038(d) | | | 13,141,990 |
| | 8,455,194 | | GNMA 5.500%, with various maturities from 2034 to 2038(d) | | | 8,473,502 |
| | 2,890,651 | | GNMA, 5.500%, 2/15/2037 | | | 2,897,998 |
| | 5,791,987 | | GNMA 6.000%, with various maturities from 2029 to 2037(d) | | | 5,888,084 |
| | 637,516 | | GNMA 6.500%, with various maturities from 2028 to 2032(d) | | | 656,257 |
| | 360,579 | | GNMA 7.000%, with various maturities from 2025 to 2029(d) | | | 380,819 |
| | 121,982 | | GNMA 7.500%, with various maturities from 2025 to 2030(d) | | | 131,731 |
| | 60,357 | | GNMA, 8.000%, 11/15/2029 | | | 66,239 |
| | 116,618 | | GNMA 8.500%, with various maturities from 2017 to 2023(d) | | | 128,646 |
| | 20,669 | | GNMA 9.000%, with various maturities in 2016(d) | | | 22,593 |
| | 42,682 | | GNMA 11.500%, with various maturities from 2013 to 2015(d) | | | 48,703 |
| | 1,800,000 | | Greenwich Capital Commercial Funding Corp., Series 2005-GG5, Class A2, 5.117%, 4/10/2037 | | | 1,762,939 |
| | | | | | |
| | | | | | 60,501,601 |
| | | | | | |
| | | Non-Captive Consumer — 0.7% | | | |
| | 215,000 | | SLM Corp., Series A, MTN, 5.000%, 10/01/2013 | | | 133,300 |
| | 120,000 | | SLM Corp., Series A, MTN, 5.000%, 6/15/2018 | | | 66,000 |
| | 35,000 | | SLM Corp., Series A, MTN, 5.375%, 5/15/2014 | | | 21,700 |
| | 825,000 | | SLM Corp., Series A, MTN, 8.450%, 6/15/2018 | | | 561,000 |
| | 245,000 | | SLM Corp., MTN, 5.050%, 11/14/2014 | | | 149,450 |
See accompanying notes to financial statements.
19
LOOMIS SAYLES CORE PLUS BOND FUND — PORTFOLIOOF INVESTMENTS (continued)
Investments as of September 30, 2008
| | | | | | |
Principal
Amount (‡) | | Description | | Value (†) |
| | | | | | |
| | | Non-Captive Consumer — continued | | | |
| $ | 420,000 | | SLM Corp., MTN, 5.625%, 8/01/2033 | | $ | 210,000 |
| | | | | | |
| | | | | | 1,141,450 |
| | | | | | |
| | | Non-Captive Diversified — 3.2% | | | |
| | 20,000 | | CIT Group, Inc., 5.400%, 2/13/2012 | | | 11,497 |
| | 207,000 | | CIT Group, Inc., 5.400%, 1/30/2016 | | | 100,188 |
| | 396,000 | | CIT Group, Inc., 5.650%, 2/13/2017 | | | 193,235 |
| | 395,000 | | CIT Group, Inc., 5.800%, 10/01/2036 | | | 180,663 |
| | 34,000 | | CIT Group, Inc., 5.850%, 9/15/2016(b) | | | 16,490 |
| | 492,000 | | CIT Group, Inc., Series A, MTN, 6.000%, 4/01/2036 | | | 201,720 |
| | 360,000 | | CIT Group, Inc., GMTN, 5.000%, 2/13/2014 | | | 203,641 |
| | 338,000 | | CIT Group, Inc., GMTN, 5.000%, 2/01/2015 | | | 167,072 |
| | 115,000 | | CIT Group, Inc., MTN, 5.125%, 9/30/2014 | | | 56,713 |
| | 1,180,000 | | General Electric Capital Corp., 5.625%, 9/15/2017 | | | 1,012,735 |
| | 2,910,000 | | GMAC LLC, 6.625%, 5/15/2012 | | | 1,232,001 |
| | 930,000 | | GMAC LLC, 8.000%, 11/01/2031 | | | 350,868 |
| | 1,430,000 | | HKCG Finance Ltd., 144A, 6.250%, 8/07/2018 | | | 1,406,692 |
| | 335,000 | | International Lease Finance Corp., 5.000%, 4/15/2010 | | | 248,157 |
| | 205,000 | | International Lease Finance Corp., 6.375%, 3/25/2013 | | | 129,460 |
| | 120,000 | | International Lease Finance Corp., Series R, MTN, 5.300%, 5/01/2012 | | | 87,288 |
| | 40,000 | | International Lease Finance Corp., Series R, MTN, 5.550%, 9/05/2012 | | | 29,416 |
| | | | | | |
| | | | | | 5,627,836 |
| | | | | | |
| | | Oil Field Services — 0.5% | | | |
| | 190,000 | | Nabors Industries, Inc., 144A, 6.150%, 2/15/2018 | | | 181,148 |
| | 750,000 | | Weatherford International Ltd., 6.500%, 8/01/2036 | | | 646,531 |
| | | | | | |
| | | | | | 827,679 |
| | | | | | |
| | | Paper — 1.2% | | | |
| | 565,000 | | Georgia-Pacific Corp., 7.375%, 12/01/2025 | | | 456,237 |
| | 755,000 | | Georgia-Pacific Corp., 7.750%, 11/15/2029 | | | 622,875 |
| | 735,000 | | Georgia-Pacific Corp., 8.000%, 1/15/2024 | | | 646,800 |
| | 365,000 | | Georgia-Pacific Corp., 8.875%, 5/15/2031 | | | 317,550 |
| | | | | | |
| | | | | | 2,043,462 |
| | | | | | |
| | | | | | |
Principal
Amount (‡) | | Description | | Value (†) |
| | | | | | |
| | | Pipelines — 0.7% | | | |
| $ | 1,150,000 | | NGPL Pipeco LLC, 144A, 6.514%, 12/15/2012 | | $ | 1,151,863 |
| | | | | | |
| | | Property & Casualty Insurance — 0.2% | | | |
| | 475,000 | | Willis North America, Inc., 6.200%, 3/28/2017 | | | 412,993 |
| | | | | | |
| | | Real Estate Investment Trusts — 0.9% | | | |
| | 195,000 | | Colonial Realty, LP, Senior Note, 4.750%, 2/01/2010 | | | 188,486 |
| | 640,000 | | Colonial Realty, LP, Senior Note, 5.500%, 10/01/2015 | | | 549,965 |
| | 1,250,000 | | iStar Financial, Inc., Senior Note, 6.000%, 12/15/2010(b) | | | 746,875 |
| | | | | | |
| | | | | | 1,485,326 |
| | | | | | |
| | | Sovereigns — 2.1% | | | |
| | 296,000,000 | | Canadian Government, 1.900%, 3/23/2009(b) (JPY) | | | 2,795,431 |
| | 925,000 | | Indonesia Government International Bond, 144A, 7.750%, 1/17/2038 | | | 832,500 |
| | | | | | |
| | | | | | 3,627,931 |
| | | | | | |
| | | Supranational — 1.2% | | | |
| | 217,000,000 | | Inter-American Development Bank, 1.900%, 7/08/2009 (JPY) | | | 2,055,392 |
| | | | | | |
| | | Technology — 3.6% | | | |
| | 745,000 | | Corning, Inc., 7.250%, 8/15/2036 | | | 660,419 |
| | 540,000 | | Equifax, Inc., 7.000%, 7/01/2037 | | | 455,446 |
| | 1,180,000 | | Fiserv, Inc., 6.125%, 11/20/2012 | | | 1,144,211 |
| | 1,660,000 | | Freescale Semiconductor, Inc., 10.125%, 12/15/2016(b) | | | 1,062,400 |
| | 605,000 | | Lender Processing Services, Inc., 144A, 8.125%, 7/01/2016 | | | 589,875 |
| | 85,000 | | Motorola, Inc., 6.500%, 9/01/2025 | | | 65,209 |
| | 115,000 | | Motorola, Inc., 6.500%, 11/15/2028(b) | | | 85,939 |
| | 185,000 | | Motorola, Inc., 6.625%, 11/15/2037 | | | 134,855 |
| | 295,000 | | Nortel Networks Corp., 6.875%, 9/01/2023 | | | 118,000 |
| | 920,000 | | Northern Telecom Capital Corp., 7.875%, 6/15/2026 | | | 404,800 |
| | 195,000 | | Pitney Bowes, Inc., 5.250%, 1/15/2037 | | | 179,478 |
| | 870,000 | | Xerox Corp., 6.350%, 5/15/2018 | | | 795,268 |
| | 683,000 | | Xerox Corp., 6.400%, 3/15/2016 | | | 636,070 |
| | | | | | |
| | | | | | 6,331,970 |
| | | | | | |
| | | Telecommunications — 0.0% | | | |
| | 10,000 | | Nextel Communications, Inc., Series D, 7.375%, 8/01/2015 | | | 6,600 |
| | 15,000 | | Nextel Communications, Inc., Series F, 5.950%, 3/15/2014 | | | 10,050 |
| | | | | | |
| | | | | | 16,650 |
| | | | | | |
See accompanying notes to financial statements.
20
LOOMIS SAYLES CORE PLUS BOND FUND — PORTFOLIOOF INVESTMENTS (continued)
Investments as of September 30, 2008
| | | | | | |
| | |
Principal
Amount (‡) | | Description | | Value (†) |
| | | | | | |
| | | Tobacco — 0.7% | | | |
| $ | 1,185,000 | | Reynolds American, Inc., 7.250%, 6/15/2037 | | $ | 1,133,995 |
| | | | | | |
| | | Treasuries — 11.6% | | | |
| | 2,141,000 | | U.S. Treasury Bond, 4.500%, 2/15/2036(b) | | | 2,197,535 |
| | 1,790,000 | | U.S. Treasury Bond, 4.750%, 2/15/2037 | | | 1,914,742 |
| | 1,090,000 | | U.S. Treasury Bond, 5.000%, 5/15/2037(b) | | | 1,212,540 |
| | 10,559,502 | | U.S. Treasury Inflation Indexed Bonds, 2.375%, 1/15/2025 | | | 10,231,165 |
| | 1,700,000 | | U.S. Treasury Note, 3.125%, 8/31/2013(b) | | | 1,713,015 |
| | 2,895,000 | | U.S. Treasury Note, 4.000%, 8/15/2018 | | | 2,936,164 |
| | | | | | |
| | | | | | 20,205,161 |
| | | | | | |
| | | Wireless — 2.1% | | | |
| | 1,385,000 | | SK Telecom Co., Ltd., 144A, 6.625%, 7/20/2027 | | | 1,250,654 |
| | 1,990,000 | | Sprint Capital Corp., 6.875%, 11/15/2028 | | | 1,333,300 |
| | 15,000 | | Sprint Capital Corp., 6.900%, 5/01/2019 | | | 11,625 |
| | 1,420,000 | | True Move Co. Ltd., 144A, 10.750%, 12/16/2013 | | | 965,600 |
| | | | | | |
| | | | | | 3,561,179 |
| | | | | | |
| | | Wirelines — 3.3% | | | |
| | 2,000,000 | | Embarq Corp., 7.995%, 6/01/2036 | | | 1,430,220 |
| | 935,000 | | Frontier Communications Corp., 7.875%, 1/15/2027 | | | 701,250 |
| | 210,000 | | Qwest Capital Funding, Inc., 6.500%, 11/15/2018 | | | 152,775 |
| | 460,000 | | Qwest Corp., 6.875%, 9/15/2033 | | | 309,350 |
| | 850,000 | | Qwest Corp., 7.250%, 9/15/2025 | | | 633,250 |
| | 255,000 | | Qwest Corp., 7.250%, 10/15/2035 | | | 181,050 |
| | 1,190,000 | | Qwest Corp., 7.500%, 6/15/2023 | | | 934,150 |
| | 1,700,000 | | Telecom Italia Capital SA, 7.721%, 6/04/2038 | | | 1,408,994 |
| | | | | | |
| | | | | | 5,751,039 |
| | | | | | |
| | | Total Bonds and Notes (Identified Cost $180,827,606) | | | 167,269,066 |
| | | | | | |
| | | | | | |
| Shares | | | | |
| | Preferred Stocks — 0.3% |
| | | Thrifts & Mortgage Finance — 0.3% | | | |
| | 256,000 | | Federal National Mortgage Association, 6.750%(f) | | | 460,800 |
| | 4,200 | | Federal National Mortgage Association, 8.250%(b)(f) | | | 9,156 |
| | | | | | |
| | | Total Preferred Stocks (Identified Cost $1,591,500) | | | 469,956 |
| | | | | | |
| | | | | | | |
Shares/
Principal
Amount (‡) | | Description | | Value (†) | |
| | | | | | | |
| | Short-Term Investments — 11.2% | | | | |
| | 10,994,292 | | State Street Navigator Securities Lending Prime Portfolio(e) | | $ | 10,994,292 | |
| $ | 8,429,740 | | Tri-Party Repurchase Agreement with Fixed Income Clearing Corporation, dated 9/30/2008 at 1.300% to be repurchased at $8,430,045 on 10/1/2008, collateralized by $8,790,000 Federal Home Loan Bank Discount Notes, Zero Coupon due 7/13/2009 valued at $8,603,213, including accrued interest (Note 2g of Notes to Financial Statements) | | | 8,429,740 | |
| | | | | | | |
| | | Total Short-Term Investments (Identified Cost $19,424,032) | | | 19,424,032 | |
| | | | | | | |
| | | | | | | |
| | | Total Investments — 107.9% (Identified Cost $201,843,138)(a) | | | 187,163,054 | |
| | | Other assets less liabilities — (7.9)% | | | (13,704,968 | ) |
| | | | | | | |
| | | Net Assets — 100% | | $ | 173,458,086 | |
| | | | | | | |
| | | | | | | |
| | (‡) | | Principal amount is in U.S. dollars unless otherwise noted. | | | | |
| | (†) | | See Note 2a of Notes to Financial Statements. | | | | |
| | (a) | | Federal Tax Information: At September 30, 2008, the net unrealized depreciation on investments based on a cost of $202,179,095 for federal income tax purposes was as follows: | | | | |
| | | Aggregate gross unrealized appreciation for all investments in which there is an excess of value over tax cost | | $ | 1,447,513 | |
| | | Aggregate gross unrealized depreciation for all investments in which there is an excess of tax cost over value | | | (16,463,554 | ) |
| | | | | | | |
| | | Net unrealized depreciation | | $ | (15,016,041 | ) |
| | | | | | | |
| | | | | | | |
| | (b) | | All or a portion of this security was on loan to brokers at September 30, 2008. | |
| | (c) | | Variable rate security. Rate as of September 30, 2008 is disclosed. | |
| | (d) | | The Fund’s investment in mortgage related securities of the Federal Home Loan Mortgage Corporation, Federal National Mortgage Association and Government National Mortgage Association are interests in separate pools of mortgages. All separate investments in securities of each issuer which have the same coupon rate have been aggregated for the purpose of presentation in the Portfolio of Investments. | |
| | (e) | | Represents investment of securities lending collateral. | | | | |
| | (f) | | Future dividend payments have been eliminated as the issuer has been placed in Conservatorship. | |
| | | | | | | |
| | 144A | | Securities exempt from registration under Rule 144A of the Securities Act of 1933. These securities may be resold in transactions exempt from registrations, normally to qualified institutional buyers. At the period end, the value of these securities amounted to $7,823,967 or 4.5% of net assets. | |
| | | | | | | |
| | ARM | | Adjustable Rate Mortgage | | | | |
| | EMTN | | Euro Medium Term Note | | | | |
| | FHLMC | | Federal Home Loan Mortgage Corporation | | | | |
| | FNMA | | Federal National Mortgage Association | | | | |
| | GMTN | | Global Medium Term Note | | | | |
| | GNMA | | Government National Mortgage Association | | | | |
| | MTN | | Medium Term Note | | | | |
| | | | | | | |
| | JPY | | Japanese Yen | | | | |
See accompanying notes to financial statements.
21
LOOMIS SAYLES CORE PLUS BOND FUND — PORTFOLIOOF INVESTMENTS (continued)
Investments as of September 30, 2008
Net Asset Summary at September 30, 2008 (Unaudited)
| | | |
| Mortgage Related | | 34.9 | % |
| Treasuries | | 11.6 | |
| Government Guaranteed | | 4.5 | |
| Mortgage Backed Securities | | 4.4 | |
| Brokerage | | 4.0 | |
| Technology | | 3.6 | |
| Wirelines | | 3.3 | |
| Non-Captive Diversified | | 3.2 | |
| Banking | | 2.7 | |
| Asset-Backed Securities | | 2.5 | |
| Media Cable | | 2.2 | |
| Sovereigns | | 2.1 | |
| Wireless | | 2.1 | |
| Other Investments, less than 2% each | | 15.6 | |
| Short-Term Investments | | 11.2 | |
| | | |
| Total Investments | | 107.9 | |
| Other assets less liabilities | | (7.9 | ) |
| | | |
| Net Assets | | 100.0 | % |
| | | |
See accompanying notes to financial statements.
22
LOOMIS SAYLES HIGH INCOME FUND — PORTFOLIOOF INVESTMENTS
Investments as of September 30, 2008
| | | | | | |
Principal
Amount (‡) | | Description | | Value (†) |
| | | | | | |
| | Bonds and Notes — 82.0% of Net Assets | | | |
| | | ABS Car Loan — 0.7% | | | |
| $ | 85,000 | | Capital One Auto Finance Trust, Series 2006-C, Class A4, 2.518%, 5/15/2013(b) | | $ | 70,919 |
| | 275,000 | | Capital One Auto Finance Trust, Series 2007-C, Class A3B, 2.998%, 4/16/2012(b) | | | 252,371 |
| | 100,000 | | Capital One Auto Finance Trust, Series 2007-C, Class A4, 5.230%, 7/15/2014 | | | 84,083 |
| | | | | | |
| | | | | | 407,373 |
| | | | | | |
| | | Aerospace & Defense — 0.4% | | | |
| | 250,000 | | BE Aerospace, Inc., 8.500%, 7/01/2018 | | | 242,500 |
| | | | | | |
| | | Airlines — 0.1% | | | |
| | 62,381 | | Continental Airlines, Inc., Series 1997-4, Class 4B, 6.900%, 7/02/2018 | | | 51,932 |
| | 27,077 | | Continental Airlines, Inc., Series 1999-1, Class C, 6.954%, 2/02/2011 | | | 25,317 |
| | | | | | |
| | | | | | 77,249 |
| | | | | | |
| | | Automotive — 2.9% | | | |
| | 420,000 | | Ford Motor Co., 6.375%, 2/01/2029 | | | 155,400 |
| | 65,000 | | Ford Motor Co., 6.625%, 2/15/2028 | | | 25,025 |
| | 1,220,000 | | Ford Motor Co., 6.625%, 10/01/2028 | | | 463,600 |
| | 210,000 | | Ford Motor Co., 7.450%, 7/16/2031 | | | 90,300 |
| | 40,000 | | Ford Motor Co., 7.500%, 8/01/2026 | | | 16,600 |
| | 550,000 | | Ford Motor Credit Co. LLC, 5.700%, 1/15/2010 | | | 421,210 |
| | 585,000 | | Goodyear Tire & Rubber Co., 7.000%, 3/15/2028 | | | 432,900 |
| | | | | | |
| | | | | | 1,605,035 |
| | | | | | |
| | | Banking — 1.8% | | | |
| | 250,000,000 | | Barclays Financial LLC, 144A, 4.060%, 9/16/2010 (KRW) | | | 210,779 |
| | 400,000,000 | | Barclays Financial LLC, 144A, 4.470%, 12/04/2011 (KRW) | | | 341,886 |
| | 1,436,358,000 | | JPMorgan Chase & Co., 144A, Zero Coupon, 3/28/2011 (IDR) | | | 113,203 |
| | 500,000 | | Kaupthing Bank Hf, Series D, 144A, 5.750%, 10/04/2011 | | | 320,000 |
| | | | | | |
| | | | | | 985,868 |
| | | | | | |
| | | Biotechnology — 0.8% | | | |
| | 660,000 | | Affymetrix, Inc., Convertible, 3.500%, 1/15/2038 | | | 462,000 |
| | | | | | |
| | | Brokerage — 1.2% | | | |
| | 340,000 | | Goldman Sachs Group LP, 5.000%, 10/01/2014 | | | 283,583 |
| | 175,000 | | Goldman Sachs Group, Inc. (The), 5.150%, 1/15/2014 | | | 143,725 |
| | 350,000 | | Morgan Stanley, 5.375%, 10/15/2015 | | | 216,928 |
| | | | | | |
| | | | | | 644,236 |
| | | | | | |
| | | | | | |
Principal
Amount (‡) | | Description | | Value (†) |
| | | | | | |
| | | Building Materials — 0.8% | | | |
| $ | 565,000 | | USG Corp., 6.300%, 11/15/2016 | | $ | 426,575 |
| | | | | | |
| | | Chemicals — 1.5% | | | |
| | 450,000 | | Borden, Inc., 7.875%, 2/15/2023 | | | 207,000 |
| | 550,000 | | Borden, Inc., 9.200%, 3/15/2021 | | | 275,000 |
| | 130,000 | | Georgia Gulf Corp., 10.750%, 10/15/2016(c) | | | 58,500 |
| | 380,000 | | Hercules, Inc., Subordinated Note, 6.500%, 6/30/2029(d) | | | 254,600 |
| | | | | | |
| | | | | | 795,100 |
| | | | | | |
| | | Construction Machinery — 1.3% | | | |
| | 960,000 | | United Rentals North America, Inc., 7.000%, 2/15/2014 | | | 672,000 |
| | 25,000 | | United Rentals North America, Inc., 7.750%, 11/15/2013(c) | | | 19,063 |
| | | | | | |
| | | | | | 691,063 |
| | | | | | |
| | | Electric — 3.4% | | | |
| | 375,000 | | Dynegy Holdings, Inc., 7.125%, 5/15/2018 | | | 283,125 |
| | 180,000 | | Dynegy Holdings, Inc., 7.625%, 10/15/2026 | | | 131,400 |
| | 165,000 | | Dynegy Holdings, Inc., 7.750%, 6/01/2019 | | | 132,000 |
| | 140,000 | | NGC Corp. Capital Trust I, Series B, 8.316%, 6/01/2027 | | | 104,300 |
| | 205,000 | | NRG Energy, Inc., 7.375%, 1/15/2017 | | | 186,550 |
| | 195,000 | | TXU Corp., 5.550%, 11/15/2014 | | | 145,520 |
| | 1,015,000 | | TXU Corp., Series Q, 6.500%, 11/15/2024 | | | 646,430 |
| | 370,000 | | TXU Corp., Series R, 6.550%, 11/15/2034 | | | 227,344 |
| | | | | | |
| | | | | | 1,856,669 |
| | | | | | |
| | | Food & Beverage — 1.6% | | | |
| | 400,000 | | Aramark Services, Inc., 5.000%, 6/01/2012 | | | 336,000 |
| | 365,000 | | Dean Foods Co., 7.000%, 6/01/2016(c) | | | 317,550 |
| | 230,000 | | Dole Food Co., Inc., 8.625%, 5/01/2009(c) | | | 219,650 |
| | | | | | |
| | | | | | 873,200 |
| | | | | | |
| | | Gaming — 0.5% | | | |
| | 45,000 | | Harrah’s Operating Co., Inc., 5.750%, 10/01/2017 | | | 11,700 |
| | 535,000 | | Harrah’s Operating Co., Inc., 144A, 10.750%, 2/01/2016 | | | 272,850 |
| | | | | | |
| | | | | | 284,550 |
| | | | | | |
| | | Government Guaranteed — 1.4% | | | |
| | 28,000,000 | | Kreditanstalt fuer Wiederaufbau, 1.850%, 9/20/2010 (JPY) | | | 267,709 |
| | 51,000,000 | | Oesterreichische Kontrollbank AG, 1.800%, 3/22/2010 (JPY) | | | 485,481 |
| | | | | | |
| | | | | | 753,190 |
| | | | | | |
See accompanying notes to financial statements.
23
LOOMIS SAYLES HIGH INCOME FUND — PORTFOLIOOF INVESTMENTS (continued)
Investments as of September 30, 2008
| | | | | | |
Principal
Amount (‡) | | Description | | Value (†) |
| | | | | | |
| | | Government Sponsored — 0.3% | | | |
| $ | 160,000 | | Federal Home Loan Mortgage Corp., 4.625%, 10/25/2012 | | $ | 164,468 |
| | | | | | |
| | | Healthcare — 5.3% | | | |
| | 425,000 | | Advanced Medical Optics, Inc., Convertible, 3.250%, 8/01/2026 | | | 277,312 |
| | 5,000 | | Boston Scientific Corp., 5.450%, 6/15/2014 | | | 4,675 |
| | 105,000 | | Boston Scientific Corp., 6.400%, 6/15/2016 | | | 99,750 |
| | 95,000 | | Boston Scientific Corp., 7.000%, 11/15/2035 | | | 84,550 |
| | 220,000 | | CHS/Community Health Systems, Inc., 8.875%, 7/15/2015 | | | 209,000 |
| | 150,000 | | HCA, Inc., 5.750%, 3/15/2014 | | | 117,000 |
| | 150,000 | | HCA, Inc., 6.250%, 2/15/2013 | | | 125,250 |
| | 25,000 | | HCA, Inc., 6.375%, 1/15/2015 | | | 19,688 |
| | 205,000 | | HCA, Inc., 6.500%, 2/15/2016 | | | 162,463 |
| | 15,000 | | HCA, Inc., 7.050%, 12/01/2027 | | | 10,129 |
| | 400,000 | | HCA, Inc., 7.190%, 11/15/2015 | | | 319,333 |
| | 220,000 | | HCA, Inc., 7.500%, 12/15/2023 | | | 161,161 |
| | 700,000 | | HCA, Inc., 7.500%, 11/06/2033 | | | 497,000 |
| | 445,000 | | HCA, Inc., 7.580%, 9/15/2025 | | | 327,845 |
| | 35,000 | | HCA, Inc., 7.690%, 6/15/2025 | | | 26,013 |
| | 40,000 | | HCA, Inc., 7.750%, 7/15/2036 | | | 28,396 |
| | 40,000 | | HCA, Inc., 8.360%, 4/15/2024 | | | 31,003 |
| | 40,000 | | Invitrogen Corp., Convertible, 1.500%, 2/15/2024 | | | 36,050 |
| | 245,000 | | Tenet Healthcare Corp., 6.875%, 11/15/2031 | | | 166,600 |
| | 190,000 | | Tenet Healthcare Corp., 7.375%, 2/01/2013(c) | | | 172,900 |
| | | | | | |
| | | | | | 2,876,118 |
| | | | | | |
| | | Home Construction — 5.6% | | | |
| | 375,000 | | Centex Corporation, 5.250%, 6/15/2015 | | | 275,625 |
| | 350,000 | | D.R. Horton, Inc., 5.250%, 2/15/2015 | | | 259,000 |
| | 15,000 | | D.R. Horton, Inc., 6.500%, 4/15/2016 | | | 11,400 |
| | 410,000 | | Desarrolladora Homex SAB de CV, 7.500%, 9/28/2015 | | | 360,800 |
| | 385,000 | | K. Hovnanian Enterprises, Inc., 6.250%, 1/15/2015(c) | | | 219,450 |
| | 365,000 | | K. Hovnanian Enterprises, Inc., Senior Note, 6.250%, 1/15/2016 | | | 209,875 |
| | 30,000 | | K. Hovnanian Enterprises, Inc., Guaranteed Note, 6.500%, 1/15/2014 | | | 17,700 |
| | | | | | |
Principal
Amount (‡) | | Description | | Value (†) |
| | | | | | |
| | | Home Construction — continued | | | |
| $ | 315,000 | | KB Home, 5.750%, 2/01/2014(c) | | $ | 253,575 |
| | 360,000 | | KB Home, Guaranteed Note, 5.875%, 1/15/2015 | | | 286,200 |
| | 590,000 | | KB Home, Guaranteed Note, 7.250%, 6/15/2018 | | | 483,800 |
| | 5,000 | | Lennar Corp., Series B, 5.125%, 10/01/2010 | | | 4,200 |
| | 580,000 | | Lennar Corp., Series B, Guaranteed Note, 5.600%, 5/31/2015 | | | 377,000 |
| | 155,000 | | Pulte Homes, Inc., 6.000%, 2/15/2035 | | | 110,825 |
| | 230,000 | | Pulte Homes, Inc., 6.375%, 5/15/2033 | | | 167,900 |
| | | | | | |
| | | | | | 3,037,350 |
| | | | | | |
| | | Independent Energy — 2.8% | | | |
| | 625,000 | | Chesapeake Energy Corp., 6.500%, 8/15/2017(c) | | | 546,875 |
| | 175,000 | | Chesapeake Energy Corp., 6.875%, 11/15/2020 | | | 149,625 |
| | 275,000 | | Hilcorp Energy I LP, 144A, 7.750%, 11/01/2015 | | | 236,500 |
| | 170,000 | | Pioneer Natural Resources Co., 6.875%, 5/01/2018 | | | 151,362 |
| | 485,000 | | Pioneer Natural Resources Co., 7.200%, 1/15/2028 | | | 417,554 |
| | | | | | |
| | | | | | 1,501,916 |
| | | | | | |
| | | Industrial Other — 0.1% | | | |
| | 140,000 | | Ranhill Labuan Ltd., 144A, 12.500%, 10/26/2011 | | | 67,200 |
| | | | | | |
| | | Media Cable — 1.5% | | | |
| | 655,000 | | CSC Holdings, Inc., Senior Note, 7.625%, 7/15/2018 | | | 569,850 |
| | 250,000 | | CSC Holdings, Inc., Senior Note, 7.875%, 2/15/2018 | | | 220,000 |
| | | | | | |
| | | | | | 789,850 |
| | | | | | |
| | | Media Non-Cable — 1.8% | | | |
| | 25,000 | | Clear Channel Communications, Inc., 4.900%, 5/15/2015 | | | 7,438 |
| | 50,000 | | Clear Channel Communications, Inc., 5.500%, 12/15/2016 | | | 14,500 |
| | 475,000 | | Clear Channel Communications, Inc., 6.875%, 6/15/2018 | | | 144,875 |
| | 465,000 | | Idearc, Inc., 8.000%, 11/15/2016 | | | 126,712 |
| | 175,000 | | Intelsat Corp., 6.875%, 1/15/2028 | | | 127,750 |
| | 85,000 | | R.H. Donnelley Corp., 6.875%, 1/15/2013 | | | 33,150 |
| | 25,000 | | R.H. Donnelley Corp., Series A-1, 6.875%, 1/15/2013(c) | | | 9,750 |
| | 160,000 | | R.H. Donnelley Corp., Series A-2, 6.875%, 1/15/2013(c) | | | 62,400 |
| | 615,000 | | R.H. Donnelley Corp., Series A-3, 8.875%, 1/15/2016(c) | | | 209,100 |
| | 155,000 | | R.H. Donnelley Corp., Series A-4, 8.875%, 10/15/2017(c) | | | 52,700 |
See accompanying notes to financial statements.
24
LOOMIS SAYLES HIGH INCOME FUND — PORTFOLIOOF INVESTMENTS (continued)
Investments as of September 30, 2008
| | | | | | |
Principal
Amount (‡) | | Description | | Value (†) |
| | | | | | |
| | | Media Non-Cable — continued | | | |
| $ | 605,000 | | Tribune Co., 5.250%, 8/15/2015(c) | | $ | 181,500 |
| | | | | | |
| | | | | | 969,875 |
| | | | | | |
| | | Metals & Mining — 0.5% | | | |
| | 285,000 | | Steel Dynamics, Inc., 7.375%, 11/01/2012 | | | 260,775 |
| | | | | | |
| | | Non-Captive Consumer — 1.3% | | | |
| | 90,000 | | SLM Corp., Series A, MTN, 4.000%, 1/15/2010 | | | 70,650 |
| | 20,000 | | SLM Corp., Series A, MTN, 5.000%, 10/01/2013 | | | 12,400 |
| | 10,000 | | SLM Corp., Series A, MTN, 5.000%, 6/15/2018 | | | 5,500 |
| | 5,000 | | SLM Corp., Series A, MTN, 5.625%, 8/01/2033 | | | 2,500 |
| | 735,000 | | SLM Corp., Series A, MTN, 6.500%, 6/15/2010 (NZD) | | | 408,215 |
| | 245,000 | | SLM Corp., Series A, MTN, 8.450%, 6/15/2018 | | | 166,600 |
| | 60,000 | | SLM Corp., MTN, 5.050%, 11/14/2014 | | | 36,600 |
| | | | | | |
| | | | | | 702,465 |
| | | | | | |
| | | Non-Captive Diversified — 4.0% | | | |
| | 95,000 | | CIT Group, Inc., 4.750%, 12/15/2010 | | | 61,869 |
| | 20,000 | | CIT Group, Inc., 5.400%, 2/13/2012 | | | 11,497 |
| | 65,000 | | CIT Group, Inc., 5.400%, 1/30/2016 | | | 31,460 |
| | 25,000 | | CIT Group, Inc., 5.650%, 2/13/2017 | | | 12,199 |
| | 280,000 | | CIT Group, Inc., 5.800%, 10/01/2036 | | | 128,065 |
| | 25,000 | | CIT Group, Inc., 5.850%, 9/15/2016 | | | 12,125 |
| | 145,000 | | CIT Group, Inc., GMTN, 5.000%, 2/13/2014 | | | 82,022 |
| | 65,000 | | CIT Group, Inc., GMTN, 5.000%, 2/01/2015 | | | 32,129 |
| | 105,000 | | CIT Group, Inc., MTN, 5.125%, 9/30/2014 | | | 51,781 |
| | 1,300,000 | | General Electric Capital Corp., Series A, MTN, 2.960%, 5/18/2012 (SGD) | | | 887,064 |
| | 25,000 | | GMAC LLC, 4.750%, 9/14/2009 (EUR) | | | 22,525 |
| | 630,000 | | GMAC LLC, 6.000%, 12/15/2011 | | | 280,123 |
| | 330,000 | | GMAC LLC, 6.625%, 5/15/2012 | | | 139,711 |
| | 40,000 | | GMAC LLC, 8.000%, 11/01/2031(c) | | | 15,091 |
| | 75,000 | | GMAC LLC, EMTN, 5.375%, 6/06/2011 (EUR) | | | 44,346 |
| | 195,000 | | GMAC LLC, EMTN, 5.750%, 9/27/2010 (EUR) | | | 123,534 |
| | 565,000 | | GMAC LLC, MTN, 6.750%, 12/01/2014 | | | 216,855 |
| | 80,000 | | iStar Financial, Inc., 5.850%, 3/15/2017 | | | 39,200 |
| | | | | | |
Principal
Amount (‡) | | Description | | Value (†) |
| | | | | | |
| | | Non-Captive Diversified — continued | | | |
| $ | 10,000 | | iStar Financial, Inc., 5.875%, 3/15/2016 | | $ | 4,900 |
| | 15,000 | | iStar Financial, Inc., Series B, 5.950%, 10/15/2013 | | | 7,800 |
| | | | | | |
| | | | | | 2,204,296 |
| | | | | | |
| | | Oil & Gas — 0.4% | | | |
| | 240,000 | | SandRidge Energy, Inc., 144A, 8.000%, 6/01/2018 | | | 206,400 |
| | | | | | |
| | | Packaging — 0.5% | | | |
| | 135,000 | | Owens-Illinois, Inc., Senior Note, 7.800%, 5/15/2018(c) | | | 130,950 |
| | 180,000 | | Stone Container Finance, 7.375%, 7/15/2014(c) | | | 138,600 |
| | | | | | |
| | | | | | 269,550 |
| | | | | | |
| | | Paper — 3.4% | | | |
| | 485,000 | | Bowater, Inc., 6.500%, 6/15/2013(c) | | | 186,725 |
| | 75,000 | | Georgia-Pacific Corp., 7.250%, 6/01/2028 | | | 59,250 |
| | 155,000 | | Georgia-Pacific Corp., 7.375%, 12/01/2025 | | | 125,162 |
| | 375,000 | | Georgia-Pacific Corp., 7.750%, 11/15/2029 | | | 309,375 |
| | 270,000 | | Georgia-Pacific Corp., 8.000%, 1/15/2024 | | | 237,600 |
| | 530,000 | | Georgia-Pacific Corp., 8.875%, 5/15/2031 | | | 461,100 |
| | 110,000 | | Jefferson Smurfit Corp., 7.500%, 6/01/2013(c) | | | 89,100 |
| | 485,000 | | Smurfit-Stone Container Enterprises, Inc., 8.000%, 3/15/2017(c) | | | 378,300 |
| | | | | | |
| | | | | | 1,846,612 |
| | | | | | |
| | | Pharmaceuticals — 6.2% | | | |
| | 640,000 | | Elan Finance PLC, 8.875%, 12/01/2013 | | | 537,600 |
| | 1,155,000 | | Elan Finance PLC, Senior Note, 7.750%, 11/15/2011 | | | 1,045,275 |
| | 127,000 | | EPIX Pharmaceuticals, Inc., Senior Note, Convertible, 3.000%, 6/15/2024 | | | 63,500 |
| | 540,000 | | Human Genome Sciences, Inc., Converitble, 2.250%, 8/15/2012 | | | 360,450 |
| | 245,000 | | Incyte Corp., Convertible, 3.500%, 2/15/2011 | | | 224,481 |
| | 96,000 | | Nektar Therapeutics, Convertible, 3.250%, 9/28/2012 | | | 48,360 |
| | 190,000 | | Valeant Pharmaceuticals International, Subordinated Note, Convertible, 3.000%, 8/16/2010 | | | 179,550 |
| | 505,000 | | Valeant Pharmaceuticals International, Subordinated Note, Convertible, 4.000%, 11/15/2013 | | | 472,806 |
| | 305,000 | | Vertex Pharmaceuticals, Inc., Convertible, 4.750%, 2/15/2013 | | | 460,169 |
| | | | | | |
| | | | | | 3,392,191 |
| | | | | | |
| | | Pipelines — 0.6% | | | |
| | 415,000 | | El Paso Corp., 6.950%, 6/01/2028 | | | 327,682 |
| | | | | | |
See accompanying notes to financial statements.
25
LOOMIS SAYLES HIGH INCOME FUND — PORTFOLIOOF INVESTMENTS (continued)
Investments as of September 30, 2008
| | | | | | |
Principal
Amount (‡) | | Description | | Value (†) |
| | | | | | |
| | | Property & Casualty Insurance — 0.0% | | | |
| $ | 30,000 | | MBIA Insurance Corp., (fixed rate to 1/15/2013, variable rate thereafter), 144A, 14.000%, 1/15/2033(c) | | $ | 15,900 |
| | | | | | |
| | | REITs — 0.9% | | | |
| | 600,000 | | Host Hotels & Resorts, Inc., Convertible, 144A, 2.625%, 4/15/2027 | | | 465,000 |
| | | | | | |
| | | Refining — 0.2% | | | |
| | 150,000 | | Petroplus Finance Ltd., 144A, 6.750%, 5/01/2014 | | | 126,750 |
| | | | | | |
| | | Retailers — 2.4% | | | |
| | 500,000 | | Blockbuster, Inc., 9.000%, 9/01/2012(c) | | | 357,500 |
| | 250,000 | | Dillard’s, Inc., 6.625%, 1/15/2018(c) | | | 155,000 |
| | 105,000 | | Dillard’s, Inc., 7.130%, 8/01/2018 | | | 66,675 |
| | 30,000 | | Macy’s Retail Holdings, Inc., 6.790%, 7/15/2027 | | | 23,653 |
| | 1,070,000 | | Toys R Us, Inc., 7.375%, 10/15/2018 | | | 695,500 |
| | 20,000 | | Toys R Us, Inc., 7.875%, 4/15/2013 | | | 15,600 |
| | | | | | |
| | | | | | 1,313,928 |
| | | | | | |
| | | Sovereigns — 3.6% | | | |
| | 44,200(††) | | Mexican Fixed Rate Bonds, Series M-20, 8.000%, 12/07/2023 (MXN) | | | 387,892 |
| | 148,500(††) | | Mexican Fixed Rate Bonds, Series MI-10, 9.000%, 12/20/2012 (MXN) | | | 1,389,693 |
| | 4,199,735 | | Republic of Uruguay, 4.250%, 4/05/2027 (UYU) | | | 181,794 |
| | | | | | |
| | | | | | 1,959,379 |
| | | | | | |
| | | Supermarkets — 2.1% | | | |
| | 190,000 | | Albertson’s, Inc., 7.750%, 6/15/2026 | | | 174,642 |
| | 750,000 | | Albertson’s, Inc., Senior Note, 7.450%, 8/01/2029 | | | 667,072 |
| | 130,000 | | Albertson’s, Inc., Senior Note, 8.000%, 5/01/2031 | | | 120,478 |
| | 245,000 | | Albertson’s, Inc., Series C, MTN, 6.625%, 6/01/2028 | | | 198,498 |
| | | | | | |
| | | | | | 1,160,690 |
| | | | | | |
| | | Supranational — 3.0% | | | |
| | 9,210,000,000 | | European Investment Bank, EMTN, 144A, Zero Coupon, 4/24/2013 (IDR)(e) | | | 583,267 |
| | 700,000 | | Inter-American Development Bank, 11.500%, 2/05/2009 (ISK) | | | 6,569 |
| | 1,900,000 | | Inter-American Development Bank, EMTN, Zero Coupon, 5/11/2009 (BRL) | | | 888,644 |
| | 13,400,000 | | International Bank for Reconstruction & Development, 9.500%, 5/27/2010 (ISK) | | | 126,039 |
| | 800,000 | | Nordic Investment Bank, EMTN, 11.250%, 4/16/2009 (ISK) | | | 7,571 |
| | | | | | |
| | | | | | 1,612,090 |
| | | | | | |
| | | Technology — 5.5% | | | |
| | 300,000 | | Affiliated Computer Services, Inc., 5.200%, 6/01/2015 | | | 242,250 |
| | | | | | |
Principal
Amount (‡) | | Description | | Value (†) |
| | | | | | |
| | | Technology — continued | | | |
| $ | 205,000 | | Amkor Technology, Inc., 7.750%, 5/15/2013 | | $ | 175,275 |
| | 325,000 | | Freescale Semiconductor, Inc., 10.125%, 12/15/2016(c) | | | 208,000 |
| | 345,000 | | JDS Uniphase Corp., Convertible, 1.000%, 5/15/2026 | | | 228,131 |
| | 330,000 | | Kulicke & Soffa Industries, Inc., Convertible, 0.875%, 6/01/2012 | | | 225,638 |
| | 35,000 | | Kulicke & Soffa Industries, Inc., Convertible, 1.000%, 6/30/2010 | | | 27,431 |
| | 1,040,000 | | Lucent Technologies, Inc., 6.450%, 3/15/2029 | | | 634,400 |
| | 175,000 | | Lucent Technologies, Inc., 6.500%, 1/15/2028 | | | 106,750 |
| | 243,000 | | Maxtor Corp., Subordinated Note, Convertible, 5.750%, 3/01/2012(d) | | | 223,560 |
| | 280,000 | | Nortel Networks Corp., Convertible, 2.125%, 4/15/2014 | | | 134,050 |
| | 580,000 | | Nortel Networks Ltd., 6.875%, 9/01/2023(c) | | | 232,000 |
| | 300,000 | | Nortel Networks Ltd., 10.125%, 7/15/2013 | | | 191,250 |
| | 340,000 | | Northern Telecom Capital Corp., 7.875%, 6/15/2026 | | | 149,600 |
| | 205,000 | | Seagate Technology HDD Holdings, 6.800%, 10/01/2016 | | | 179,375 |
| | 85,000 | | Unisys Corp., Senior Note, 8.000%, 10/15/2012 | | | 68,850 |
| | | | | | |
| | | | | | 3,026,560 |
| | | | | | |
| | | Telecommunications — 0.0% | | | |
| | 30,000 | | Nextel Communications, Inc., Series D, 7.375%, 8/01/2015 | | | 19,800 |
| | 5,000 | | Nextel Communications, Inc., Series F, 5.950%, 3/15/2014 $ | | | 3,350 |
| | | | | | |
| | | | | | 23,150 |
| | | | | | |
| | | Textile — 0.4% | | | |
| | 375,000 | | Jones Apparel Group, Inc., 6.125%, 11/15/2034 | | | 234,375 |
| | | | | | |
| | | Transportation Services — 0.9% | | | |
| | 275,000 | | APL Ltd., Senior Note, 8.000%, 1/15/2024(d) | | | 206,250 |
| | 300,000 | | Overseas Shipholding Group, Senior Note, 7.500%, 2/15/2024 | | | 265,500 |
| | | | | | |
| | | | | | 471,750 |
| | | | | | |
| | | Wireless — 1.7% | | | |
| | 5,000 | | ALLTEL Corp., 6.800%, 5/01/2029 | | | 4,537 |
| | 440,000 | | ALLTEL Corp., 7.875%, 7/01/2032 | | | 436,700 |
| | 230,000 | | NII Holdings, Inc., Convertible, 3.125%, 6/15/2012 | | | 170,200 |
| | 193,000 | | Sprint Capital Corp., 6.875%, 11/15/2028 | | | 129,310 |
| | 70,000 | | Sprint Capital Corp., 6.900%, 5/01/2019 | | | 54,250 |
| | 200,000 | | True Move Co. Ltd., 144A, 10.375%, 8/01/2014 | | | 133,460 |
| | | | | | |
| | | | | | 928,457 |
| | | | | | |
See accompanying notes to financial statements.
26
LOOMIS SAYLES HIGH INCOME FUND — PORTFOLIOOF INVESTMENTS (continued)
Investments as of September 30, 2008
| | | | | |
Principal
Amount (‡) | | Description | | Value (†) |
| | | | | |
| | Wirelines — 8.6% | | | |
| 255,000 | | Bell Canada, Series M-17, 6.100%, 3/16/2035 (CAD) | | $ | 174,411 |
| 5,000 | | Bell Canada, 144A, 6.550%, 5/01/2029 (CAD) | | | 3,572 |
| 65,000 | | Cincinnati Bell Telephone Co., 6.300%, 12/01/2028 | | | 46,150 |
| 250,000 | | Cincinnati Bell, Inc., 8.375%, 1/15/2014 | | | 217,500 |
| 410,000 | | Embarq Corp., 7.995%, 6/01/2036 | | | 293,195 |
| 255,000 | | Fairpoint Communications, Inc., 144A, 13.125%, 4/01/2018 | | | 232,050 |
| 95,000 | | Frontier Communications Corp., 7.000%, 11/01/2025 | | | 57,950 |
| 130,000 | | Frontier Communications Corp., 7.125%, 3/15/2019 | | | 103,350 |
| 400,000 | | Frontier Communications Corp., 7.875%, 1/15/2027 | | | 300,000 |
| 80,000 | | Hawaiian Telcom Communications, Inc., Series B, 12.500%, 5/01/2015(c) | | | 11,200 |
| 490,000 | | Level 3 Communications, Inc., Convertible, 2.875%, 7/15/2010 | | | 385,263 |
| 45,000 | | Level 3 Communications, Inc., Convertible, 3.500%, 6/15/2012 | | | 31,781 |
| 350,000 | | Level 3 Communications, Inc., Convertible, 6.000%, 9/15/2009 | | | 329,000 |
| 320,000 | | Level 3 Communications, Inc., Convertible, 6.000%, 3/15/2010 | | | 280,000 |
| 720,000 | | Level 3 Financing, Inc., 8.750%, 2/15/2017 | | | 522,000 |
| 125,000 | | Level 3 Financing, Inc., 9.250%, 11/01/2014 | | | 94,375 |
| 1,890,000 | | Qwest Capital Funding, Inc., 7.750%, 2/15/2031 | | | 1,379,700 |
| 375,000 | | Qwest Capital Funding, Inc., Guaranteed Note, 6.875%, 7/15/2028 | | | 260,625 |
| | | | | |
| | | | | 4,722,122 |
| | | | | |
| | Total Bonds and Notes (Identified Cost $53,056,015) | | | 44,781,507 |
| | | | | |
| Bank Loans — 0.6% | | | |
| | Consumer Products — 0.0% | | | |
| 24,936 | | Mega Bloks, Inc., Term Loan B, 8.750%, 7/26/2012(f) | | | 19,450 |
| | | | | |
| | Food & Beverage — 0.0% | | | |
| 1,306 | | Dole Food Co., Inc., LOC, 4.788%, 4/12/2013(f) | | | 1,145 |
| 876 | | Dole Food Co., Inc., Term Loan, 4.738%, 4/12/2013(f) | | | 769 |
| 4,624 | | Dole Food Co., Inc., Tranche C Term Loan, 4.795%, 4/12/2013(f) | | | 4,055 |
| | | | | |
| | | | | 5,969 |
| | | | | |
| | Media Non-Cable — 0.5% | | | |
| 114,519 | | Idearc, Inc., Term Loan B, 5.767%, 11/17/2014(f) | | | 68,282 |
| 224,012 | | Tribune Co., Tranche X, 5.541%, 6/04/2009(f) | | | 207,490 |
| | | | | |
| | | | | 275,772 |
| | | | | |
| | | | | | |
Principal
Amount (‡) | | Description | | Value (†) |
| | | | | | |
| | | Wireless — 0.1% | | | |
| $ | 35,000 | | Hawaiian Telcom Communications, Inc., Term Loan C, 6.262%, 6/01/2014(f) | | $ | 24,075 |
| | | | | | |
| | | Total Bank Loans (Identified Cost $361,233) | | | 325,266 |
| | | | | | |
| | | | | | |
| Shares | | | | |
| | Common Stocks — 1.4% | | | |
| | | Biotechnology — 0.5% | | | |
| | 8,147 | | Vertex Pharmaceuticals, Inc.(g) | | | 270,806 |
| | | | | | |
| | | Chemicals — 0.4% | | | |
| | 11,695 | | Hercules, Inc.(c) | | | 231,444 |
| | | | | | |
| | | Household Durables — 0.1% | | | |
| | 1,775 | | KB Home(c) | | | 34,932 |
| | | | | | |
| | | Pharmaceuticals — 0.4% | | | |
| | 6,875 | | Merck & Co., Inc. | | | 216,975 |
| | | | | | |
| | | Thrifts & Mortgage Finance — 0.0% | | | |
| | 5,500 | | Federal Home Loan Mortgage Corp.(c) | | | 9,405 |
| | | | | | |
| | | Total Common Stocks (Identified Cost $780,419) | | | 763,562 |
| | | | | | |
| | | | | | |
| Shares | | | | |
| | Preferred Stocks — 2.1% | | | |
| | | Automobiles — 0.1% | | | |
| | 5,816 | | General Motors Corp., Convertible, 6.250% | | | 46,528 |
| | | | | | |
| | | Banking — 0.1% | | | |
| | 3,732 | | Sovereign Capital Trust IV, Convertible, 4.375% | | | 85,650 |
| | | | | | |
| | | Electric Utilities — 0.4% | | | |
| | 6,475 | | AES Trust III, Convertible, 6.750% | | | 248,316 |
| | | | | | |
| | | Machinery — 0.1% | | | |
| | 2,550 | | United Rentals Trust I, Convertible, 6.500% | | | 56,100 |
| | | | | | |
| | | Oil, Gas & Consumable Fuels — 0.6% | | | |
| | 9,500 | | El Paso Energy Capital Trust I, Convertible, 4.750% | | | 316,469 |
| | | | | | |
| | | Technology — 0.7% | | | |
| | 799 | | Lucent Technologies Capital Trust I, Convertible, 7.750% | | | 371,255 |
| | | | | | |
| | | Thrifts & Mortgage Finance — 0.1% | | | |
| | 300 | | Federal Home Loan Mortgage Corp., 5.000%(g)(i) | | | 540 |
| | 7,900 | | Federal Home Loan Mortgage Corp., 5.570%(g)(i) | | | 7,821 |
| | 2,850 | | Federal Home Loan Mortgage Corp., 5.660%(g)(i) | | | 3,562 |
| | 1,000 | | Federal Home Loan Mortgage Corp., 5.700%(g)(i) | | | 1,870 |
| | 1,800 | | Federal Home Loan Mortgage Corp., 5.790%(g)(i) | | | 3,600 |
| | 650 | | Federal Home Loan Mortgage Corp., 5.810%(g)(i) | | | 1,138 |
| | 1,400 | | Federal Home Loan Mortgage Corp., 5.900%(g)(i) | | | 1,750 |
| | 350 | | Federal Home Loan Mortgage Corp., 6.000%(c)(g)(i) | | | 630 |
See accompanying notes to financial statements.
27
LOOMIS SAYLES HIGH INCOME FUND — PORTFOLIOOF INVESTMENTS (continued)
Investments as of September 30, 2008
| | | | | | | |
Shares | | Description | | Value (†) | |
| | | | | | | |
| | | Thrifts & Mortgage Finance — continued | | | | |
| | 600 | | Federal Home Loan Mortgage Corp., 6.420%(g)(i) | | $ | 1,080 | |
| | 1,350 | | Federal Home Loan Mortgage Corp., 6.550%(g)(i) | | | 1,458 | |
| | 7,400 | | Federal Home Loan Mortgage Corp.,
8.375%(g)(i) | | | 12,062 | |
| | 1,200 | | Federal National Mortgage Association, 4.750%(c)(i) | | | 3,720 | |
| | 200 | | Federal National Mortgage Association, 5.125%(i) | | | 700 | |
| | 400 | | Federal National Mortgage Association, 5.375%(i) | | | 1,320 | |
| | 350 | | Federal National Mortgage Association, 5.810%(i) | | | 1,260 | |
| | 550 | | Federal National Mortgage Association, 6.750%(i) | | | 990 | |
| | 10,250 | | Federal National Mortgage Association, 8.250%(c)(i) | | | 22,345 | |
| | | | | | | |
| | | | | | 65,846 | |
| | | | | | | |
| | | Total Preferred Stocks (Identified Cost $2,087,944) | | | 1,190,164 | |
| | | | | | | |
| | Closed-End Investment Companies — 0.1% | | | | |
| | 3,835 | | Morgan Stanley Emerging Markets Debt Fund, Inc. | | | 27,727 | |
| | 2,175 | | Western Asset High Income Opportunity Fund, Inc. | | | 9,440 | |
| | | | | | | |
| | | Total Closed-End Investment Companies
(Identified Cost $45,443) | | | 37,167 | |
| | | | | | | |
Shares/
Principal
Amount (‡) | | | | | |
| | Short-Term Investments — 19.1% | | | | |
| | 3,523,267 | | State Street Navigator Securities Lending Prime Portfolio(h) | | | 3,523,267 | |
| $ | 1,851 | | Repurchase Agreement with State Street Corp., dated 9/30/2008 at 1.300% to be repurchased at $1,851 on 10/01/2008, collateralized by $5,000 Federal Home Loan Bank, 5.300% due 10/03/2012 valued at $5,130 including accrued interest ( Note 2g of Notes to Financial Statements) | | | 1,851 | |
| | 6,915,794 | | Tri-Party Repurchase Agreement with Fixed Income Clearing Corporation, dated 9/30/2008 at 1.300% to be repurchased at $6,916,044 on 10/01/2008, collateralized by $6,935,000 Federal National Mortgage Association, 4.330% due 7/28/2011 valued at $7,056,363, including accrued interest (Note 2g of Notes to Financial Statements) | | | 6,915,794 | |
| | | | | | | |
| | | Total Short-Term Investments (Identified Cost $10,440,912) | | | 10,440,912 | |
| | | | | | | |
| | | | | | | |
| | | Total Investments — 105.3%
(Identified Cost $66,771,966)(a) | | | 57,538,578 | |
| | | Other assets less liabilities — (5.3)% | | | (2,917,458 | ) |
| | | | | | | |
| | | Net Assets — 100% | | $ | 54,621,120 | |
| | | | | | | |
| | | | | | | |
| | (‡) | | Principal amount is in U.S. dollars unless otherwise noted. | |
| | (†) | | See Note 2a of Notes to Financial Statements. | |
| | (††) | | Amount shown represents units. One unit represents a principal amount of 100. | |
| | | | | | |
| | | | | | |
| (a) | | Federal Tax Information: | | | | |
| | At September 30, 2008, the net unrealized depreciation on investments based on a cost of $66,813,988 for federal income tax purposes was as follows: | | | | |
| | Aggregate gross unrealized appreciation for all investments in which there is an excess of value over tax cost | | $ | 1,169,888 | |
| | Aggregate gross unrealized depreciation for all investments in which there is an excess of tax cost over value | | | (10,445,298 | ) |
| | | | | | |
| | Net unrealized depreciation | | $ | (9,275,410 | ) |
| | | | | | |
| | | | | | |
| (b) | | Variable rate security. Rate as of September 30, 2008 is disclosed. | |
| (c) | | All or a portion of this security was on loan to brokers at September 30, 2008. | |
| (d) | | Illiquid security. At September 30, 2008, the value of these securities amounted to $684,410 or 1.3% of net assets. | |
| (e) | | All or a portion of this security is held as collateral for open forward contracts. | |
| (f) | | Variable rate security. Rate shown represents the weighted average rate at September 30, 2008. | |
| (g) | | Non-income producing security. | | | | |
| (h) | | Represents investment of securities lending collateral. | | | | |
| (i) | | Future dividend payments have been eliminated as the issuer has been placed in Conservatorship. | |
| | | | | | |
| 144A | | Securities exempt from registration under Rule 144A of the Securities Act of 1933. These securities may be resold in transactions exempt from registrations, normally to qualified institutional buyers. At September 30, 2008, the value of these securities amounted to $3,328,817 or 6.1% of net assets. | |
| | | | | | |
| EMTN | | Euro Medium Term Note | | | | |
| GMTN | | Global Medium Term Note | | | | |
| LOC | | Letter of Credit | | | | |
| MTN | | Medium Term Note | | | | |
| REITs | | Real Estate Investment Trusts | | | | |
| | | | | | |
| BRL | | Brazilian Real | | | | |
| CAD | | Canadian Dollar | | | | |
| EUR | | Euro | | | | |
| IDR | | Indonesian Rupiah | | | | |
| ISK | | Icelandic Krona | | | | |
| JPY | | Japanese Yen | | | | |
| KRW | | South Korean Won | | | | |
| MXN | | Mexican Peso | | | | |
| NZD | | New Zealand Dollar | | | | |
| SGD | | Singapore Dollar | | | | |
| UYU | | Uruguayan Peso | | | | |
At September 30, 2008, the Fund had the following open forward foreign currency contracts:
| | | | | | | | | | | | | |
Contract to
Buy/Sell | | Delivery
Date | | Currency | | Units | | Value | | Unrealized
Appreciation
(Depreciation) | |
Buy | | 12/17/2008 | | Euro | | 45,000 | | $ | 63,556 | | $ | (79 | ) |
Sell | | 12/17/2008 | | Euro | | 180,000 | | | 254,223 | | | 1,714 | |
| | | | | | | | | | | | | |
Total | | | | | | | | | | | $ | 1,635 | |
| | | | | | | | | | | | | |
See accompanying notes to financial statements.
28
LOOMIS SAYLES HIGH INCOME FUND — PORTFOLIOOF INVESTMENTS (continued)
Investments as of September 30, 2008
Net Asset Summary at September 30, 2008 (Unaudited)
| | | |
| Wirelines | | 8.6 | % |
| Pharmaceuticals | | 6.6 | |
| Technology | | 6.2 | |
| Home Construction | | 5.6 | |
| Healthcare | | 5.3 | |
| Non-Captive Diversified | | 4.0 | |
| Sovereigns | | 3.6 | |
| Electric | | 3.4 | |
| Paper | | 3.4 | |
| Supranational | | 3.0 | |
| Automotive | | 2.9 | |
| Independent Energy | | 2.8 | |
| Retailers | | 2.4 | |
| Media Non-Cable | | 2.3 | |
| Supermarkets | | 2.1 | |
| Other Investments, less than 2% each | | 24.0 | |
| Short-Term Investments | | 19.1 | |
| | | |
| Total Investments | | 105.3 | |
| Other assets less liabilities (including open Forward Foreign Currency Contracts) | | (5.3 | ) |
| | | |
| Net Assets | | 100.0 | % |
| | | |
See accompanying notes to financial statements.
29
LOOMIS SAYLES INTERNATIONAL BOND FUND — PORTFOLIOOF INVESTMENTS
Investments as of September 30, 2008
| | | | | |
Principal
Amount (‡) | | Description | | Value (†) |
| | | | | |
| Bonds and Notes — 97.0% of Net Assets | | | |
| Non-Convertible Bonds — 97.0% | | | |
| | Australia — 0.4% | | | |
| 70,000 | | New South Wales Treasury Corp., 7.000%, 12/01/2010, (AUD) | | $ | 56,612 |
| | | | | |
| | Austria — 2.6% | | | |
| 34,000,000 | | Oesterreichische Kontrollbank AG, 1.800%, 3/22/2010, (JPY) | | | 323,654 |
| | | | | |
| | Belgium — 10.1% | | | |
| 110,000 | | Kingdom of Belgium, 3.750%, 3/28/2009, (EUR) | | | 154,653 |
| 740,000 | | Kingdom of Belgium, 5.500%, 9/28/2017, (EUR) | | | 1,114,571 |
| | | | | |
| | | | | 1,269,224 |
| | | | | |
| | Canada — 2.6% | | | |
| 40,000 | | Bell Canada, Series M-17, 6.100%, 3/16/2035, (CAD) | | | 27,359 |
| 50,000 | | Bombardier, Inc., 144A, 7.250%, 11/15/2016, (EUR) | | | 63,351 |
| 255,000 | | Canadian Government, 4.250%, 9/01/2009, (CAD) | | | 242,727 |
| | | | | |
| | | | | 333,437 |
| | | | | |
| | Cayman Islands — 0.4% | | | |
| 60,000 | | DASA Finance Corp., 144A,
8.750%, 5/29/2018 | | | 50,400 |
| | | | | |
| | France — 4.2% | | | |
| 45,000 | | Alcatel-Lucent, EMTN, 6.375%, 4/07/2014, (EUR) | | | 50,998 |
| 50,000 | | Credit Agricole SA,
5.971%, 2/01/2018, (EUR) | | | 68,414 |
| 35,000 | | France Telecom SA, EMTN, 3.625%, 10/14/2015, (EUR) | | | 42,030 |
| 40,000 | | Lafarge SA, EMTN, 4.750%, 3/23/2020, (EUR) | | | 42,583 |
| 50,000 | | Lafarge SA, EMTN, 5.375%, 6/26/2017, (EUR) | | | 58,717 |
| 20,000 | | PPR, EMTN,
4.000%, 1/29/2013, (EUR) | | | 25,678 |
| 50,000 | | Societe Generale, EMTN, 5.250%, 3/28/2013, (EUR) | | | 68,994 |
| 35,000 | | Veolia Environnement, EMTN, 5.125%, 5/24/2022, (EUR) | | | 43,181 |
| 10,000 | | Vivendi, 3.875%, 2/15/2012, (EUR) | | | 13,263 |
| 50,000 | | Vivendi, 4.500%, 10/03/2013, (EUR) | | | 63,619 |
| 50,000 | | Wendel, 4.875%, 5/26/2016, (EUR) | | | 50,021 |
| | | | | |
| | | | | 527,498 |
| | | | | |
| | Germany — 21.7% | | | |
| 50,000 | | Bertelsmann AG, 3.625%, 10/06/2015, (EUR) | | | 58,862 |
| 125,000 | | Hypothekenbank in Essen AG, 3.000%, 9/28/2009, (EUR) | | | 173,016 |
| 21,000,000 | | Kreditanstalt fuer Wiederaufbau, 1.350%, 1/20/2014, (JPY) | | | 198,073 |
| | | | | |
Principal
Amount (‡) | | Description | | Value (†) |
| | | | | |
| | Germany — continued | | | |
| 11,000,000 | | Kreditanstalt fuer Wiederaufbau, 1.750%, 3/23/2010, (JPY) | | $ | 104,745 |
| 10,000,000 | | Kreditanstalt fuer Wiederaufbau, 1.850%, 9/20/2010, (JPY) | | | 95,610 |
| 24,000,000 | | Kreditanstalt fuer Wiederaufbau, 2.050%, 2/16/2026, (JPY) | | | 219,582 |
| 185,000 | | Kreditanstalt fuer Wiederaufbau, 2.500%, 10/11/2010, (EUR)(b) | | | 252,544 |
| 5,000,000 | | Kreditanstalt fuer Wiederaufbau, 2.600%, 6/20/2037, (JPY) | | | 47,530 |
| 235,000 | | Muenchener Hypothekenbank eG, 5.000%, 1/16/2012, (EUR) | | | 333,358 |
| 660,000 | | Republic of Germany, 3.750%, 1/04/2017, (EUR)(b) | | | 913,520 |
| 265,000 | | Republic of Germany, 4.000%, 1/04/2037, (EUR) | | | 337,596 |
| | | | | |
| | | | | 2,734,436 |
| | | | | |
| | Ireland — 2.2% | | | |
| 30,000,000 | | Depfa ACS Bank, Series 686,
1.650%, 12/20/2016, (JPY) | | | 273,709 |
| | | | | |
| | Italy — 0.4% | | | |
| 50,000 | | Finmeccanica SpA, 4.875%, 3/24/2025, (EUR) | | | 56,615 |
| | | | | |
| | Japan — 5.5% | | | |
| 18,000,000 | | Development Bank of Japan, 1.750%, 6/21/2010, (JPY) | | | 171,507 |
| 15,000,000 | | Japan Finance Corp. for Municipal Enterprises, 1.350%, 11/26/2013, (JPY) | | | 142,660 |
| 20,000,000 | | Japan Finance Corp. for Municipal Enterprises, 1.900%, 6/22/2018, (JPY) | | | 192,790 |
| 21,299,200 | | Japan Government, 0.800%, 3/10/2016, (JPY) | | | 187,889 |
| | | | | |
| | | | | 694,846 |
| | | | | |
| | Mexico — 0.7% | | | |
| 10,000(††) | | Mexican Fixed Rate Bonds, Series M-20, 8.000%, 12/07/2023, (MXN) | | | 87,758 |
| | | | | |
| | Netherlands — 1.0% | | | |
| 50,000 | | Cemex Finance Europe BV, 4.750%, 3/05/2014, (EUR) | | | 54,028 |
| 50,000 | | Koninklijke (Royal) KPN NV, GMTN, 4.750%, 1/17/2017, (EUR) | | | 61,014 |
| 10,000 | | Wolters Kluwer NV, 5.125%, 1/27/2014, (EUR) | | | 13,239 |
| | | | | |
| | | | | 128,281 |
| | | | | |
| | Singapore — 1.0% | | | |
| 175,000 | | Government of Singapore, 3.625%, 7/01/2011, (SGD) | | | 127,789 |
| | | | | |
| | Spain — 2.7% | | | |
| 23,000,000 | | Instituto de Credito Oficial, EMTN, 0.800%, 9/28/2009, (JPY) | | | 215,993 |
| 100,000 | | Santander Issurance SA, EMTN, (fixed rate to 5/29/14,
variable rate thereafter), 4.750%, 5/29/2019, (EUR) | | | 122,037 |
| | | | | |
| | | | | 338,030 |
| | | | | |
See accompanying notes to financial statements.
30
LOOMIS SAYLES INTERNATIONAL BOND FUND — PORTFOLIO OF INVESTMENTS (continued)
Investments as of September 30, 2008
| | | | | |
Principal
Amount (‡) | | Description | | Value (†) |
| | | | | |
| | Supranational — 13.9% | | | |
| 87,100,000 | | European Investment Bank, 1.400%, 6/20/2017, (JPY) | | $ | 813,219 |
| 921,000,000 | | European Investment Bank, EMTN, 144A, Zero Coupon, 4/24/2013, (IDR) | | | 58,327 |
| 43,000,000 | | Inter-American Development Bank, 1.900%, 7/08/2009, (JPY) | | | 407,290 |
| 50,000,000 | | Nordic Investment Bank, 1.700%, 4/27/2017, (JPY)(b) | | | 478,530 |
| | | | | |
| | | | | 1,757,366 |
| | | | | |
| | Sweden — 1.0% | | | |
| 100,000 | | Telefonaktiebolaget LM Ericsson, EMTN, 5.375%, 6/27/2017, (EUR)(b) | | | 121,862 |
| | | | | |
| | Switzerland — 0.6% | | | |
| 50,000 | | Credit Suisse London, EMTN, 6.125%, 8/05/2013, (EUR) | | | 70,896 |
| | | | | |
| | United Arab Emirates — 0.6% | | | |
| 100,000 | | DP World Ltd., 144A, 6.850%, 7/02/2037 | | | 73,877 |
| | | | | |
| | United Kingdom — 10.6% | | | |
| 50,000 | | BAT International Finance PLC, EMTN, 5.375%, 6/29/2017, (EUR) | | | 63,356 |
| 50,000 | | BP Capital Markets PLC, EMTN, 5.750%, 2/26/2010, (GBP) | | | 89,406 |
| 50,000 | | BSKYB Finance UK PLC, EMTN, 5.750%, 10/20/2017, (GBP) | | | 78,790 |
| 100,000 | | Imperial Tobacco Finance PLC, EMTN, 4.375%, 11/22/2013, (EUR) | | | 122,987 |
| 65,000 | | Lloyds TSB Group PLC, 5.875%, 7/08/2014, (EUR) | | | 90,556 |
| 50,000 | | Network Rail MTN Finance PLC, EMTN, 4.875%, 3/06/2009, (GBP) | | | 89,027 |
| 100,000 | | Standard Chartered Bank, Series 17,
5.875%, 9/26/2017, (EUR) | | | 123,812 |
| 195,000 | | United Kingdom Treasury, 4.000%, 9/07/2016, (GBP) | | | 339,803 |
| 75,000 | | United Kingdom Treasury, 4.250%, 3/07/2036, (GBP) | | | 127,105 |
| 50,000 | | United Kingdom Treasury, 4.750%, 3/07/2020, (GBP) | | | 89,888 |
| 100,000 | | Vodafone Group PLC, EMTN, 5.375%, 6/06/2022, (EUR) | | | 126,871 |
| | | | | |
| | | | | 1,341,601 |
| | | | | |
| | United States — 14.8% | | | |
| 50,000 | | 3M Co., 5.000%, 7/14/2014, (EUR) | | | 68,203 |
| 25,000 | | Ahold Finance USA, Inc., EMTN, 6.500%, 3/14/2017, (GBP) | | | 42,163 |
| 60,000 | | Albertson’s, Inc., Senior Note, 8.000%, 5/01/2031(b) | | | 55,605 |
| 100,000 | | AT&T, Inc., EMTN, 6.125%, 4/02/2015, (EUR) | | | 137,374 |
| 50,000 | | Bristol-Myers Squibb Co., 4.625%, 11/15/2021, (EUR) | | | 60,166 |
| 50,000 | | Cargill, Inc., EMTN, 5.375%, 3/02/2037, (GBP) | | | 68,850 |
| | | | | | |
Principal
Amount (‡) | | Description | | Value (†) |
| | | | | | |
| | | United States — continued | | | |
| $ | 60,000 | | Chesapeake Energy Corp., 6.500%, 8/15/2017 | | $ | 52,500 |
| | 50,000 | | CIT Group, Inc., EMTN, 3.800%, 11/14/2012, (EUR) | | | 37,987 |
| | 50,000 | | CIT Group, Inc., GMTN, 4.250%, 9/22/2011, (EUR) | | | 42,043 |
| | 60,000 | | CSX Corp., 5.600%, 5/01/2017(b) | | | 52,259 |
| | 60,000 | | Frontier Communications Corp., 6.250%, 1/15/2013 | | | 56,175 |
| | 10,000,000 | | General Electric Capital Corp., GMTN, 1.450%, 11/10/2011, (JPY) | | | 85,334 |
| | 50,000 | | Goldman Sachs Group, Inc. (The), 6.875%, 1/18/2038, (GBP) | | | 69,148 |
| | 45,000 | | HCA, Inc., 8.360%, 4/15/2024 | | | 34,879 |
| | 60,000 | | Host Hotels & Resorts LP, 6.375%, 3/15/2015 | | | 48,750 |
| | 100,000 | | HSBC Bank USA, 144A,
Zero Coupon, 11/28/2011 | | | 65,600 |
| | 50,000 | | Kraft Foods, Inc., 6.250%, 3/20/2015, (EUR) | | | 68,405 |
| | 25,000 | | Lehman Brothers Holdings, Inc., EMTN, 5.000%, 1/26/2010, (GBP)(c) | | | 4,889 |
| | 75,000 | | Level 3 Financing, Inc., 8.750%, 2/15/2017 | | | 54,375 |
| | 100,000 | | Merrill Lynch & Co., Inc., EMTN, 4.625%, 9/14/2018, (EUR) | | | 77,107 |
| | 50,000 | | Morgan Stanley, 3.750%, 3/01/2013, (EUR) | | | 43,968 |
| | 25,000 | | Morgan Stanley, 5.375%, 11/14/2013, (GBP) | | | 29,919 |
| | 75,000 | | Motorola, Inc., 6.625%, 11/15/2037 | | | 54,671 |
| | 50,000 | | Owens Brockway Glass Container, Inc., 6.750%, 12/01/2014, (EUR) | | | 61,239 |
| | 100,000 | | Pfizer, Inc., 4.750%, 12/15/2014, (EUR) | | | 138,277 |
| | 50,000 | | Philip Morris International, Inc., GMTN, 5.875%, 9/04/2015, (EUR) | | | 68,665 |
| | 70,000 | | Qwest Corp., 6.875%, 9/15/2033 | | | 47,075 |
| | 70,000 | | SLM Corp., 4.500%, 7/26/2010 | | | 53,200 |
| | 100,000 | | Textron, Inc.,
3.875%, 3/11/2013, (EUR) | | | 126,007 |
| | 50,000 | | Wells Fargo & Co.,
4.625%, 11/02/2035, (GBP) | | | 65,623 |
| | | | | | |
| | | | | | 1,870,456 |
| | | | | | |
| | | Total Bonds and Notes (Identified Cost $13,244,011) | | | 12,238,347 |
| | | | | | |
| | Short-Term Investments — 1.6% | | | |
| | 208,000 | | Tri-Party Repurchase Agreement with Fixed Income Clearing Corporation, dated 9/30/2008 at 1.300% to be repurchased at $208,008 on 10/01/2008, collateralized by $210,000 Federal Home Loan Mortgage Corp., 5.400% due 6/04/2012 valued at $216,796 including accrued interest (Note 2g of Notes to Financial Statements) (Identified Cost $208,000) | | | 208,000 |
| | | | | | |
See accompanying notes to financial statements.
31
LOOMIS SAYLES INTERNATIONAL BOND FUND — PORTFOLIO OF INVESTMENTS (continued)
Investments as of September 30, 2008
| | | | | | |
| | | | | | |
| | Total Investments — 98.6%
(Identified Cost $13,452,011)(a) | | $ | 12,446,347 | |
| | Other assets less liabilities —1.4% | | | 171,000 | |
| | | | | | |
| | Net Assets — 100% | | $ | 12,617,347 | |
| | | | | | |
| | | | | | |
| (‡) | | Principal amount is in U.S. dollars unless otherwise noted. | | | | |
| (†) | | See Note 2a of Notes to Financial Statements. | | | | |
| (††) | | Amount shown represents units. One unit represents a principal amount of 100. | | | | |
| (a) | | Federal Tax Information: | | | | |
| | At September 30, 2008, the net unrealized depreciation on investments based on a cost of $13,469,839 for federal income tax purposes was as follows: | | | | |
| | Aggregate gross unrealized appreciation for all investments in which there is an excess of value over tax cost | | $ | 36,232 | |
| | Aggregate gross unrealized depreciation for all investments in which there is an excess of tax cost over value | | | (1,059,724 | ) |
| | | | | | |
| | Net unrealized depreciation | | $ | (1,023,492 | ) |
| | | | | | |
| | | | | | |
| (b) | | All or a portion of this security is held as collateral for open forward foreign currency contracts. | |
| (c) | | Issuer has filed for bankruptcy | | | | |
| | | | | | |
| 144A | | Securities exempt from registration under Rule 144A of the Securities Act of 1933. These securities may be resold in transactions exempt from registration, normally to qualified institutional buyers. At September 30, 2008, the value of these securities amounted to $311,555 or 2.5% of net assets. | |
| | | | | | |
| EMTN | | Euro Medium Term Note | | | | |
| GMTN | | Global Medium Term Note | | | | |
| | | | | | |
| AUD | | Australian Dollar | | | | |
| CAD | | Canadian Dollar | | | | |
| EUR | | Euro | | | | |
| GBP | | British Pound | | | | |
| IDR | | Indonesian Rupiah | | | | |
| JPY | | Japanese Yen | | | | |
| MXN | | Mexican Peso | | | | |
| SGD | | Singapore Dollar | | | | |
At September 30, 2008, the Fund had the following open forward foreign currency contracts:
| | | | | | | | | | | | | |
Contract to
Buy/Sell | | Delivery
Date | | Currency | | Units | | Value | | Unrealized
Appreciation
(Depreciation) | |
Sell | | 12/17/2008 | | Canadian Dollar | | 300,000 | | $ | 282,578 | | $ | (1,869 | ) |
Buy | | 6/15/2009 | | Chinese Yuan Renminbi | | 800,000 | | | 115,300 | | | (6,987 | ) |
Sell | | 6/15/2009 | | Chinese Yuan Renminbi | | 800,000 | | | 115,300 | | | 4,921 | |
Buy | | 12/17/2008 | | Euro | | 412,000 | | | 581,888 | | | (4,862 | ) |
Buy | | 12/17/2008 | | Euro | | 50,000 | | | 70,617 | | | 82 | |
Buy | | 12/17/2008 | | Icelandic Krona | | 5,500,000 | | | 51,333 | | | (8,024 | ) |
| | | | | | | | | | | | | |
Total | | | | | | | | | | | $ | (16,739 | ) |
| | | | | | | | | | | | | |
At September 30, 2008, the Fund had the following open forward cross currency contracts:
| | | | | | | | |
Settlement Date | | Deliver/Units
of Currency | | Receive/In Exchange For | | Net Unrealized
Depreciation | |
| 12/17/2008 | | Euro 64,000 | | Icelandic Krona 8,050,496 | | $ | (15,253 | ) |
| | | | | | | | |
Net Asset Summary at September 30, 2008 (Unaudited)
| | | |
| Sovereigns | | 31.9 | % |
| Banking | | 15.2 | |
| Supranational | | 13.9 | |
| Government Guaranteed | | 7.1 | |
| Telecommunications | | 3.7 | |
| Finance Other | | 2.2 | |
| Tobacco | | 2.0 | |
| Other Investments, less than 2% each | | 21.0 | |
| Short-Term Investments | | 1.6 | |
| | | |
| Total Investments | | 98.6 | |
| Other assets less liabilities (including open Forward Foreign Currency Contracts) | | 1.4 | |
| | | |
| Net Assets | | 100.0 | % |
| | | |
Currency Exposure at September 30, 2008 as a Percentage of Net Assets (Unaudited)
| | | |
| Euro | | 46.6 | % |
| Japanese Yen | | 31.4 | |
| British Pound | | 8.7 | |
| United States Dollar | | 7.2 | |
| Canadian Dollar | | 2.1 | |
| Other, less than 2% each | | 2.6 | |
| | | |
| Total Investments | | 98.6 | |
| Other assets less liabilities (including open Forward Foreign Currency Contracts) | | 1.4 | |
| | | |
| Net Assets | | 100.0 | % |
| | | |
See accompanying notes to financial statements.
32
LOOMIS SAYLES LIMITED TERM GOVERNMENTAND AGENCY FUND
PORTFOLIOOF INVESTMENTS
Investments as of September 30, 2008
| | | | | | |
Principal
Amount | | Description | | Value (†) |
| | | | | | |
| | Bonds and Notes — 86.9% of Net Assets | | | |
| | | ABS Credit Card — 2.7% | | | |
| $ | 1,150,000 | | Capital One Multi-Asset Execution Trust, Series 2008-A6, Class A6, 3.588%, 3/17/2014(b) | | $ | 1,126,957 |
| | 2,000,000 | | Citibank Credit Card Issuance Trust, Series 2008-A3, Class A3, 3.628%, 5/18/2011(b) | | | 1,996,602 |
| | 600,000 | | Discover Card Master Trust, Series 2008-A3, Class A3, 5.100%, 10/15/2013 | | | 586,031 |
| | | | | | |
| | | | | | 3,709,590 |
| | | | | | |
| | | Asset-Backed Securities — 3.5% | | | |
| | 404,108 | | Americredit Automobiles Receivables Trust, Series 2007-DF, Class A2A, 5.660%, 1/06/2011 | | | 403,619 |
| | 339,627 | | Americredit Prime Automobile, Series 2007-2M, Class A2B, 2.867%, 11/08/2010(b) | | | 335,994 |
| | 423,022 | | CNH Equipment Trust, Series 2007-B, Class A2A, 5.460%, 6/15/2010 | | | 424,265 |
| | 1,035,000 | | Countrywide Asset-Backed Certificates, Series 2004-S1, Class A3, 4.615%, 2/25/2035 | | | 743,234 |
| | 1,651,325 | | Countrywide Asset-Backed Certificates, Series 2006-S1, Class A2, 5.549%, 8/25/2021 | | | 1,500,449 |
| | 111,263 | | Residential Funding Mortgage Securities II, Series 2004-HI3, Class A4, 4.630%, 1/25/2020 | | | 108,178 |
| | 660,000 | | Residential Funding Mortgage Securities II, Series 2005-HI3, Class A4, 5.490%, 9/25/2035 | | | 619,973 |
| | 824,631 | | Residential Funding Mortgage Securities II, Series 2002-HI5, Class A7, 5.700%, 1/25/2028 | | | 785,409 |
| | | | | | |
| | | | | | 4,921,121 |
| | | | | | |
| | | Automotive — 1.8% | | | |
| | 380,000 | | Honda Auto Receivables Owner Trust, Series 2008-1, Class A2, 3.770%, 9/20/2010 | | | 375,665 |
| | 565,000 | | Merrill Auto Trust Securitization, Series 2008-1, Class 3A3, 5.500%, 3/15/2012 | | | 553,422 |
| | 425,000 | | Nissan Auto Receivables Owner Trust, Series 2008-B, Class A3, 4.460%, 4/16/2012 | | | 410,738 |
| | 1,088,566 | | USAA Auto Owner Trust, Series 2008-1, Class A2, 4.270%, 10/15/2010 | | | 1,088,155 |
| | | | | | |
| | | | | | 2,427,980 |
| | | | | | |
| | | Collateralized Mortgage Obligation — 0.1% | | | |
| | 146,512 | | Federal Home Loan Mortgage Corporation, Series 3145, Class KA, 5.000%, 8/15/2024 | | | 147,578 |
| | | | | | |
| | | Hybrid ARMs — 1.6% | | | |
| | 675,796 | | JPMorgan Mortgage Trust, Series 2006-A7, Class 1A3, 5.924%, 1/25/2037(b) | | | 659,024 |
| | 1,840,552 | | Morgan Stanley Mortgage Loan Trust, Series 2005-3AR, Class 5A, 5.588%, 7/25/2035(b) | | | 1,610,197 |
| | | | | | |
| | | | | | 2,269,221 |
| | | | | | |
| | | Mortgage Backed Securities — 2.0% | | | |
| | 1,400,000 | | Commercial Mortgage Pass Through Certificates, Series 2006-C7, Class A4, 5.768%, 6/10/2046(b) | | | 1,265,379 |
| | 1,560,000 | | GS Mortgage Securities Corp. II, Series 2006-GG8, Class A2, 5.479%, 11/10/2039 | | | 1,495,970 |
| | | | | | |
| | | | | | 2,761,349 |
| | | | | | |
| | | | | | |
Principal
Amount | | Description | | Value (†) |
| | | | | | |
| | | Mortgage Related — 70.6% | | | |
| $ | 3,000,000 | | Federal Home Loan Banks, 3.375%, 10/20/2010 | | $ | 3,002,334 |
| | 4,200,000 | | Federal Home Loan Bank, 3.625%, 11/14/2008 | | | 4,202,562 |
| | 4,500,000 | | Federal Home Loan Banks, 3.625%, 9/16/2011 | | | 4,500,842 |
| | 6,500,000 | | FHLMC, 3.875%, 6/29/2011 | | | 6,588,783 |
| | 1,600,000 | | FHLMC, 4.125%, 10/18/2010 | | | 1,631,459 |
| | 778,006 | | FHLMC, 4.500%, 5/01/2034 | | | 738,163 |
| | 8,209,184 | | FHLMC, 5.000%, with various maturities from 2019 to 2030(c) | | | 8,192,732 |
| | 5,100,000 | | FHLMC, 5.500%, 9/15/2011 | | | 5,396,269 |
| | 5,141,083 | | FHLMC, 6.000%, with various maturities from 2019 to 2021(c) | | | 5,236,648 |
| | 8,680,156 | | FHLMC, 6.500%, with various maturities from 2014 to 2034(c) | | | 8,960,702 |
| | 214,793 | | FHLMC, 7.000%, 2/01/2016 | | | 226,844 |
| | 28,844 | | FHLMC, 7.500%, with various maturities from 2012 to 2026(c) | | | 30,303 |
| | 15,066 | | FHLMC, 8.000%, 9/01/2015 | | | 16,076 |
| | 5,155 | | FHLMC, 10.000%, 7/01/2019 | | | 5,928 |
| | 179,116 | | FHLMC, 11.500%, with various maturities from 2015 to 2020(c) | | | 196,630 |
| | 11,652,716 | | FNMA, 4.000%, with various maturities from 2018 to 2019(c) | | | 11,236,661 |
| | 1,013,649 | | FNMA, 4.500%, 9/01/2019 | | | 995,574 |
| | 3,500,000 | | FNMA, 5.000%, 10/15/2011 | | | 3,657,059 |
| | 2,240,948 | | FNMA, 5.500%, with various maturities from 2017 to 2036(c) | | | 2,249,382 |
| | 17,819,422 | | FNMA, 6.000%, with various maturities from 2017 to 2034(c) | | | 18,169,758 |
| | 3,003,246 | | FNMA, 6.039%, 2/01/2037(b) | | | 3,023,646 |
| | 6,174,892 | | FNMA, 6.500%, with various maturities from 2017 to 2037(c) | | | 6,350,264 |
| | 600,000 | | FNMA, 6.625%, 9/15/2009 | | | 618,516 |
| | 278,771 | | FNMA, 7.000%, 12/01/2022 | | | 294,040 |
| | 455,678 | | FNMA, 7.500%, with various maturities from 2015 to 2032(c) | | | 487,927 |
| | 76,612 | | FNMA, 8.000%, with various maturities from 2015 to 2016(c) | | | 81,260 |
| | 113,673 | | GNMA, 6.000%, 12/15/2031 | | | 115,809 |
| | 424,455 | | GNMA, 6.500%, 5/15/2031 | | | 436,361 |
| | 323,657 | | GNMA, 7.000%, 10/15/2028 | | | 341,255 |
See accompanying notes to financial statements.
33
LOOMIS SAYLES LIMITED TERM GOVERNMENTAND AGENCY FUND
PORTFOLIOOF INVESTMENTS (continued)
Investments as of September 30, 2008
| | | | | | | |
Principal
Amount | | Description | | Value (†) | |
| | | | | | | |
| | | Mortgage Related — continued | | | | |
| $ | 2,012 | | GNMA, 9.000%, with various maturities from 2008 to 2009(c) | | $ | 2,035 | |
| | 1,965 | | GNMA, 9.500%, 8/15/2009 | | | 2,022 | |
| | 6,146 | | GNMA, 12.500%, with various maturities from 2014 to 2015(c) | | | 7,186 | |
| | 62,584 | | GNMA, 16.000%, with various maturities from 2011 to 2012(c) | | | 72,365 | |
| | 27,955 | | GNMA, 17.000%, with various maturities in 2011(c) | | | 32,352 | |
| | 985,000 | | Greenwich Capital Commercial Funding Corp., Series 2005-GG5, Class A2, 5.117%, 4/10/2037 | | | 964,720 | |
| | | | | | | |
| | | | | | 98,064,467 | |
| | | | | | | |
| | | Treasuries — 4.6% | | | | |
| | 4,360,000 | | U.S. Treasury Notes, 3.625%, 12/31/2012(d) | | | 4,511,240 | |
| | 1,740,000 | | U.S. Treasury Notes, 4.500%, 11/30/2011(d) | | | 1,849,157 | |
| | | | | | | |
| | | | | | 6,360,397 | |
| | | | | | | |
| | | Total Bonds and Notes (Identified Cost $121,986,345) | | | 120,661,703 | |
| | | | | | | |
Shares/
Principal
Amount | | | | | |
| | Short-Term Investments — 16.9% | | | | |
| | 1,085,429 | | State Street Navigator Securities Lending Prime Portfolio(e) | | | 1,085,429 | |
| $ | 3,700,000 | | Federal Home Loan Bank, Discount Notes,
2.380%, 3/4/2009(f) | | | 3,653,310 | |
| | 3,680,000 | | Federal Home Loan Mortgage Corp., Discount Notes,
2.380%, 3/9/2009(f) | | | 3,632,053 | |
| | 4,600,000 | | Federal National Mortgage Association, Discount Notes,
2.760%, 2/2/2009(f) | | | 4,553,259 | |
| | 10,608,327 | | Tri-Party Repurchase Agreement with Fixed Income Clearing Corporation, dated 9/30/2008 at 1.300% to be repurchased at $10,608,710 on 10/01/2008, collateralized by $10,715,000 Federal Home Loan Bank, 3.750% due 8/18/2009 valued at $10,822,150 including accrued interest (Note 2g of Notes to Financial Statements) | | | 10,608,327 | |
| | | | | | | |
| | | Total Short-Term Investments (Identified Cost $23,553,672) | | | 23,532,378 | |
| | | | | | | |
| | | | | | | |
| | | Total Investments — 103.8%
(Identified Cost $145,540,017)(a) | | | 144,194,081 | |
| | | Other assets less liabilities — (3.8)% | | | (5,326,798 | ) |
| | | | | | | |
| | | Net Assets — 100% | | $ | 138,867,283 | |
| | | | | | | |
| | | | | | | |
| | (†) | | See Note 2a of Notes to Financial Statements. | | | | |
| | (a) | | Federal Tax Information: | | | | |
| | | At September 30, 2008, the net unrealized depreciation on investments based on a cost of $145,617,308 for federal income tax purposes was as follows: | | | | |
| | | Aggregate gross unrealized appreciation for all investments in which there is an excess of value over tax cost | | $ | 214,844 | |
| | | Aggregate gross unrealized depreciation for all investments in which there is an excess of tax cost over value | | | (1,638,071 | ) |
| | | | | | | |
| | | Net unrealized depreciation | | $ | (1,423,227 | ) |
| | | | | | | |
| | | | |
| (b) | | Variable rate security. Rate as of September 30, 2008 is disclosed. | | |
| (c) | | The Fund’s investment in mortgage related securities of the Federal Home Loan Mortgage Corporation, Federal National Mortgage Association and Government National Mortgage Association are interests in separate pools of mortgages. All separate investments in securities of each issuer which have the same coupon rate have been aggregated for the purpose of presentation in the Schedule of Investments. | | |
| (d) | | All or a portion of this security was on loan to brokers at September 30, 2008. | | |
| (e) | | Represents investment of securities lending collateral. | | |
| (f) | | Rate represents discount rate at time of purchase. | | |
| | | | |
| ARM | | Adjustable Rate Mortgage | | |
| FHLMC | | Federal Home Loan Mortgage Corporation | | |
| FNMA | | Federal National Mortgage Association | | |
| GNMA | | Government National Mortgage Association | | |
Net Asset Summary at September 30, 2008 (Unaudited)
| | | |
| Mortgage Related | | 70.6 | % |
| Treasuries | | 4.6 | |
| Asset-Backed Securities | | 3.5 | |
| ABS Credit Card | | 2.7 | |
| Mortgage Backed Securities | | 2.0 | |
| Other Investments, less than 2% each | | 3.5 | |
| Short-Term Investments | | 16.9 | |
| | | |
| Total Investments | | 103.8 | |
| Other assets less liabilities | | (3.8 | ) |
| | | |
| Net Assets | | 100.0 | % |
| | | |
See accompanying notes to financial statements.
34
LOOMIS SAYLES STRATEGIC INCOME FUND — PORTFOLIOOF INVESTMENTS
Investments as of September 30, 2008
| | | | | | |
Principal
Amount (‡) | | Description | | Value (†) |
| | | | | | |
| | Bonds and Notes — 92.2% of Net Assets | | | |
| | Non-Convertible Bonds — 87.3% | | | |
| | | ABS Credit Card — 0.7% | | | |
| $ | 80,700,000 | | Citibank Credit Card Issuance Trust, Series 2008-C6, Class C6, 6.300%, 6/20/2014 | | $ | 70,122,191 |
| | | | | | |
| | | Aerospace & Defense — 0.1% | | | |
| | 1,380,000 | | Bombardier, Inc., 144A, 6.300%, 5/01/2014 | | | 1,283,400 |
| | 2,795,000 | | Bombardier, Inc., 7.350%, 12/22/2026, (CAD) | | | 2,332,515 |
| | 11,700,000 | | Bombardier, Inc., 144A, 7.450%, 5/01/2034 | | | 10,881,000 |
| | | | | | |
| | | | | | 14,496,915 |
| | | | | | |
| | | Airlines — 1.4% | | | |
| | 825,000 | | American Airlines, Inc., Series 1999-1, Class B, 7.324%, 4/15/2011 | | | 783,750 |
| | 673,443 | | American Airlines, Inc., Series 93A6, 8.040%, 9/16/2011 | | | 508,450 |
| | 16,802,000 | | Continental Airlines, Inc., Series B, 6.903%, 4/19/2022 | | | 11,929,420 |
| | 5,589,326 | | Continental Airlines, Inc., Series 1997-4, Class 4B, 6.900%, 7/02/2018 | | | 4,653,114 |
| | 5,653,378 | | Continental Airlines, Inc., Series 1998-1, Class 1B, 6.748%, 9/15/2018 | | | 4,522,702 |
| | 6,519,752 | | Continental Airlines, Inc., Series 1999-1, Class B, 6.795%, 2/02/2020 | | | 4,922,413 |
| | 1,748,369 | | Continental Airlines, Inc., Series 1999-1, Class C, 6.954%, 2/02/2011 | | | 1,634,725 |
| | 4,159,411 | | Continental Airlines, Inc., Series 1999-2, Class B, 7.566%, 9/15/2021 | | | 3,369,123 |
| | 7,452,827 | | Continental Airlines, Inc., Series 2000-2, Class B, 8.307%, 10/02/2019 | | | 5,924,997 |
| | 2,549,134 | | Continental Airlines, Inc., Series 2001-1, Class B, 7.373%, 6/15/2017 | | | 1,911,850 |
| | 235,419 | | Continental Airlines, Inc., Series 96-A, 6.940%, 4/15/2015 | | | 219,528 |
| | 5,442,198 | | Continental Airlines, Inc., Series 971A, 7.461%, 10/01/2016 | | | 4,734,712 |
| | 17,945,000 | | Continental Airlines, Inc., Series A, 5.983%, 4/19/2022 | | | 13,817,650 |
| | 934,936 | | Delta Air Lines, Inc., Series 2007-1, Class A, 6.821%, 2/10/2024 | | | 729,250 |
| | 9,589,511 | | Delta Air Lines, Inc., Series 2007-1, Class B, 8.021%, 2/10/2024 | | | 6,520,867 |
| | 32,444,801 | | Delta Air Lines, Inc., Series 2007-1, Class C, 8.954%, 8/10/2014 | | | 23,684,705 |
| | 26,990,000 | | Northwest Airlines, Inc., Series 07-1, Class B, 8.028%, 11/01/2017(b) | | | 16,733,800 |
| | 1,500,000 | | Qantas Airways Ltd., 144A, 5.125%, 6/20/2013 | | | 1,409,144 |
| | 32,710,000 | | Qantas Airways Ltd., 144A, 6.050%, 4/15/2016 | | | 29,944,729 |
| | 19,114,804 | | United Air Lines, Inc., Series 2007-1, Class A, 6.636%, 1/02/2024 | | | 14,144,955 |
| | | | | | |
| | | | | | 152,099,884 |
| | | | | | |
| | | Automotive — 1.9% | | | |
| | 1,853,000 | | Cummins, Inc., 6.750%, 2/15/2027 | | | 1,661,192 |
| | | | | | |
Principal
Amount (‡) | | Description | | Value (†) |
| | | | | | |
| | | Automotive — continued | | | |
| $ | 2,145,000 | | Cummins, Inc., 7.125%, 3/01/2028 | | $ | 2,052,699 |
| | 6,500,000 | | FCE Bank PLC, Series E, MTN, 7.125%, 1/16/2012, (EUR) | | | 6,130,970 |
| | 4,500,000 | | FCE Bank PLC, Series E, MTN, 7.125%, 1/15/2013, (EUR) | | | 4,117,816 |
| | 17,816,000 | | Ford Motor Co., 6.375%, 2/01/2029 | | | 6,591,920 |
| | 1,705,000 | | Ford Motor Co., 6.500%, 8/01/2018 | | | 699,050 |
| | 500,000 | | Ford Motor Co., 6.625%, 2/15/2028 | | | 192,500 |
| | 73,114,000 | | Ford Motor Co., 6.625%, 10/01/2028 | | | 27,783,320 |
| | 1,940,000 | | Ford Motor Co., 7.125%, 11/15/2025(b) | | | 766,300 |
| | 86,090,000 | | Ford Motor Co., 7.450%, 7/16/2031(b) | | | 37,018,700 |
| | 800,000 | | Ford Motor Co., 7.500%, 8/01/2026 | | | 332,000 |
| | 7,640,000 | | Ford Motor Credit Co. LLC, Series E, MTN, 4.875%, 1/15/2010, (EUR)(b) | | | 7,421,360 |
| | 46,872,000 | | Ford Motor Credit Co. LLC, 5.700%, 1/15/2010 | | | 35,896,265 |
| | 10,685,000 | | Ford Motor Credit Co. LLC, 7.000%, 10/01/2013 | | | 6,566,542 |
| | 15,465,000 | | Ford Motor Credit Co. LLC, 7.250%, 10/25/2011 | | | 9,834,085 |
| | 1,030,000 | | Ford Motor Credit Co. LLC, 7.875%, 6/15/2010 | | | 786,227 |
| | 14,595,000 | | Ford Motor Credit Co. LLC, 8.000%, 12/15/2016 | | | 9,228,097 |
| | 10,625,000 | | Ford Motor Credit Co. LLC, 8.625%, 11/01/2010 | | | 7,534,400 |
| | 1,645,000 | | Ford Motor Credit Co. LLC, 9.750%, 9/15/2010 | | | 1,179,602 |
| | 2,005,000 | | General Motors Corp., 7.250%, 7/03/2013, (EUR)(b) | | | 1,157,282 |
| | 7,365,000 | | General Motors Corp., 7.400%, 9/01/2025 | | | 2,651,400 |
| | 52,725,000 | | General Motors Corp., 8.250%, 7/15/2023 | | | 20,694,563 |
| | 2,530,000 | | General Motors Corp., 8.375%, 7/15/2033 | | | 1,012,000 |
| | 4,977,000 | | Goodyear Tire & Rubber Co., 7.000%, 3/15/2028 | | | 3,682,980 |
| | | | | | |
| | | | | | 194,991,270 |
| | | | | | |
| | | Banking — 5.0% | | | |
| | 22,125,000 | | BAC Capital Trust VI, 5.625%, 3/08/2035 | | | 16,890,203 |
| | 17,310,000,000 | | Barclays Financial LLC, 144A, 4.060%, 9/16/2010, (KRW) | | | 14,594,354 |
| | 56,650,000,000 | | Barclays Financial LLC, 144A, 4.470%, 12/04/2011, (KRW) | | | 48,419,686 |
| | 1,006,000,000 | | Barclays Financial LLC, 144A, 4.160%, 2/22/2010, (THB) | | | 29,377,815 |
| | 21,340,000,000 | | Barclays Financial LLC, 144A, 4.460%, 9/23/2010, (KRW) | | | 18,128,259 |
See accompanying notes to financial statements.
35
LOOMIS SAYLES STRATEGIC INCOME FUND — PORTFOLIOOF INVESTMENTS (continued)
Investments as of September 30, 2008
| | | | | |
Principal
Amount (‡) | | Description | | Value (†) |
| | | | | |
| | Banking — continued | | | |
| 135,000,000 | | Barclays Financial LLC, Series E, MTN, 144A, 4.100%, 3/22/2010, (THB) | | $ | 3,939,161 |
| 224,520,000,000 | | BNP Paribas SA, Series E, MTN, 144A, Zero Coupon, 6/13/2011, (IDR) | | | 17,187,804 |
| 18,650,000 | | Citibank NA, 144A, 15.000%, 7/02/2010, (BRL) | | | 9,995,279 |
| 119,806,078 | | HSBC Bank USA, 144A, Zero Coupon, 11/28/2011 | | | 78,592,787 |
| 9,090,000 | | ICICI Bank Ltd., (fixed rate to 4/30/2017, variable rate thereafter), 144A, 6.375%, 4/30/2022 | | | 6,274,191 |
| 599,726,100,000 | | JPMorgan Chase & Co., 144A, Zero Coupon, 3/28/2011, (IDR) | | | 47,265,794 |
| 229,157,783,660 | | JPMorgan Chase & Co., 144A, Zero Coupon, 4/12/2012, (IDR) | | | 15,739,713 |
| 109,312,000,000 | | JPMorgan Chase & Co., 144A, Zero Coupon, 3/28/2011, (IDR) | | | 8,603,538 |
| 92,000,000 | | JPMorgan Chase Bank, 144A, Zero Coupon, 5/17/2010, (BRL) | | | 38,891,116 |
| 76,496,404,750 | | JPMorgan Chase Bank, 144A, Zero Coupon, 10/21/2010, (IDR) | | | 6,381,731 |
| 2,500,000 | | Kaupthing Bank Hf, 144A, 3.491%, 1/15/2010(c) | | | 1,950,000 |
| 36,300,000 | | Kaupthing Bank Hf, Series D, 144A, 5.750%, 10/04/2011 | | | 23,232,000 |
| 9,300,000 | | Kaupthing Bank Hf, Series E, 144A, 6.125%, 10/04/2016 | | | 4,929,000 |
| 60,000,000 | | Kreditanstalt fuer Wiederaufbau, Series E, MTN, 10.750%, 2/01/2010, (ISK) | | | 572,551 |
| 3,283,000,000 | | Rabobank Nederland, 144A, 10.250%, 9/10/2009, (ISK) | | | 30,517,592 |
| 460,000,000 | | Rabobank Nederland, Series E, MTN, 12.500%, 2/17/2009, (ISK) | | | 4,287,482 |
| 9,984,000,000 | | Rabobank Nederland, 144A, 14.000%, 1/28/2009, (ISK) | | | 95,131,409 |
| | | | | |
| | | | | 520,901,465 |
| | | | | |
| | Brokerage — 0.6% | | | |
| 2,290,000 | | Bear Stearns Cos., Inc. (The), 4.650%, 7/02/2018 | | | 1,793,322 |
| 1,004,000 | | Bear Stearns Cos., Inc. (The), 5.300%, 10/30/2015 | | | 890,161 |
| 2,220,000 | | Bear Stearns Cos., Inc. (The), 6.400%, 10/02/2017 | | | 2,073,251 |
| 15,520,000 | | Bear Stearns Cos., Inc. (The), 7.250%, 2/01/2018 | | | 14,936,060 |
| 2,540,000 | | Goldman Sachs Group LP, 5.000%, 10/01/2014 | | | 2,118,530 |
| 1,285,000 | | Goldman Sachs Group, Inc. (The), 5.150%, 1/15/2014 | | | 1,055,349 |
| 91,745,000 | | Lehman Brothers Holdings, Inc., 6.875%, 7/17/2037(d) | | | 114,681 |
| 7,370,000 | | Lehman Brothers Holdings, Inc., MTN, (fixed rate to 5/03/2027, variable rate thereafter), 6.000%, 5/03/2032(d) | | | 9,213 |
| 51,500,000 | | Merrill Lynch & Co., Inc., 10.710%, 3/08/2017, (BRL)(b) | | | 19,215,408 |
| 3,450,000 | | Merrill Lynch & Co., Inc., EMTN, 4.625%, 9/14/2018, (EUR) | | | 2,660,179 |
| | | | | | |
Principal
Amount (‡) | | Description | | Value (†) |
| | | | | | |
| | | Brokerage — continued | | | |
| $ | 565,000 | | Morgan Stanley, 3.875%, 1/15/2009 | | $ | 519,810 |
| | 500,000 | | Morgan Stanley, 5.375%, 10/15/2015 | | | 309,898 |
| | 24,443,000 | | Morgan Stanley, Series F, MTN, 6.625%, 4/01/2018 | | | 16,176,157 |
| | 110,000 | | Morgan Stanley, MTN, 5.950%, 12/28/2017 | | | 68,909 |
| | 1,300,000 | | Morgan Stanley, MTN, 6.250%, 8/09/2026 | | | 794,715 |
| | 110,000 | | Morgan Stanley, Series F, MTN, 5.450%, 1/09/2017 | | | 68,234 |
| | 8,572,000 | | Morgan Stanley, Series F, MTN, 5.550%, 4/27/2017 | | | 5,314,040 |
| | | | | | |
| | | | | | 68,117,917 |
| | | | | | |
| | | Building Materials — 0.9% | | | |
| | 17,995,000 | | Owens Corning, Inc., 6.500%, 12/01/2016 | | | 15,924,010 |
| | 35,725,000 | | Owens Corning, Inc., 7.000%, 12/01/2036 | | | 28,718,470 |
| | 4,538,000 | | Ply Gem Industries, Inc., 9.000%, 2/15/2012(b) | | | 2,473,210 |
| | 43,962,000 | | USG Corp., 6.300%, 11/15/2016 | | | 33,191,310 |
| | 12,880,000 | | USG Corp., 8.000%, 1/15/2018 | | | 10,239,600 |
| | | | | | |
| | | | | | 90,546,600 |
| | | | | | |
| | | Chemicals — 0.5% | | | |
| | 23,584,000 | | Borden, Inc., 7.875%, 2/15/2023 | | | 10,848,640 |
| | 6,920,000 | | Borden, Inc., 8.375%, 4/15/2016 | | | 2,352,800 |
| | 8,757,000 | | Borden, Inc., 9.200%, 3/15/2021 | | | 4,378,500 |
| | 6,745,000 | | Georgia Gulf Corp., 10.750%, 10/15/2016(b) | | | 3,035,250 |
| | 14,550,000 | | Hercules, Inc., Subordinated Note, 6.500%, 6/30/2029(e) | | | 9,748,500 |
| | 1,650,000 | | Koppers Holdings, Inc., (Step to 9.875% on 11/15/2009), Zero Coupon, 11/15/2014(f) | | | 1,476,750 |
| | 5,350,000 | | Methanex Corp., Senior Note, 6.000%, 8/15/2015 | | | 4,706,074 |
| | 6,465,000 | | Mosaic Global Holdings, Inc., 7.300%, 1/15/2028 | | | 6,077,100 |
| | 5,820,000 | | Mosaic Global Holdings, Inc., 7.375%, 8/01/2018 | | | 5,779,103 |
| | | | | | |
| | | | | | 48,402,717 |
| | | | | | |
| | | Construction Machinery — 0.2% | | | |
| | 2,590,000 | | Great Lakes Dredge & Dock Corp., Senior Subordinated Note, 7.750%, 12/15/2013 | | | 2,369,850 |
| | 1,425,000 | | Joy Global, Inc., 6.625%, 11/15/2036 | | | 1,206,901 |
| | 23,319,000 | | United Rentals North America, Inc., 7.000%, 2/15/2014 | | | 16,323,300 |
| | 2,720,000 | | United Rentals North America, Inc., 7.750%, 11/15/2013(b) | | | 2,074,000 |
| | | | | | |
| | | | | | 21,974,051 |
| | | | | | |
See accompanying notes to financial statements.
36
LOOMIS SAYLES STRATEGIC INCOME FUND — PORTFOLIOOF INVESTMENTS (continued)
Investments as of September 30, 2008
| | | | | | |
Principal
Amount (‡) | | Description | | Value (†) |
| | | | | | |
| | | Consumer Cyclical Services — 0.8% | | | |
| $ | 101,985,000 | | Western Union Co., 6.200%, 11/17/2036 | | $ | 79,694,445 |
| | | | | | |
| | | Containers & Packaging — 0.0% | | | |
| | 1,750,000 | | Owens Brockway Glass Container, Inc., 6.750%, 12/01/2014, (EUR) | | | 2,143,376 |
| | | | | | |
| | | Electric — 4.7% | | | |
| | 5,565,000 | | AES Corp. (The), 8.375%, 3/01/2011, (GBP) | | | 9,779,960 |
| | 4,020,000 | | AES Corp. (The), Senior Note, 7.750%, 3/01/2014 | | | 3,738,600 |
| | 71,400,000 | | Bruce Mansfield Unit, 6.850%, 6/01/2034(e) | | | 71,200,080 |
| | 32,125,000 | | Cleveland Electric Illuminating Co., 5.950%, 12/15/2036 | | | 25,539,600 |
| | 8,180,000 | | Dominion Resources, Inc., Senior Note, Series B, 5.950%, 6/15/2035 | | | 6,767,232 |
| | 11,275,000 | | Dynegy Holdings, Inc., 7.125%, 5/15/2018 | | | 8,512,625 |
| | 1,000,000 | | Dynegy Holdings, Inc., 7.500%, 6/01/2015 | | | 845,000 |
| | 10,185,000 | | Dynegy Holdings, Inc., 7.625%, 10/15/2026 | | | 7,435,050 |
| | 500,000 | | Dynegy Holdings, Inc., 7.750%, 6/01/2019 | | | 400,000 |
| | 7,455,000 | | Dynegy Holdings, Inc., 8.375%, 5/01/2016 | | | 6,485,850 |
| | 95,200,000 | | Edison Mission Energy, 7.625%, 5/15/2027 | | | 77,112,000 |
| | 250,000 | | Empresa Nacional de Electricidad SA, (Endesa-Chile), 8.350%, 8/01/2013 | | | 266,993 |
| | 4,875,000 | | Empresa-Chile Overseas Co., 7.875%, 2/01/2027 | | | 5,105,539 |
| | 555,000 | | Enersis SA, Cayman Island, 7.400%, 12/01/2016 | | | 560,833 |
| | 5,310,000 | | ITC Holdings Corp., 144A, 6.375%, 9/30/2036 | | | 4,588,467 |
| | 1,000,000 | | MidAmerican Energy Holdings Co., 6.125%, 4/01/2036 | | | 841,080 |
| | 40,255,000 | | MidAmerican Energy Holdings Co., 6.500%, 9/15/2037 | | | 35,318,127 |
| | 31,735,000 | | NGC Corp. Capital Trust I, Series B, 8.316%, 6/01/2027 | | | 23,642,575 |
| | 48,500,000 | | Nisource Finance Corp., 6.400%, 3/15/2018 | | | 43,465,166 |
| | 2,500,000 | | NRG Energy, Inc., 7.250%, 2/01/2014 | | | 2,318,750 |
| | 5,000,000 | | NRG Energy, Inc., 7.375%, 2/01/2016 | | | 4,500,000 |
| | 1,566,625 | | Quezon Power (Philippines) Ltd., Senior Secured Note, 8.860%, 6/15/2017 | | | 1,558,792 |
| | 25,230,000 | | Reliant Energy, Inc., Senior Note, 7.875%, 6/15/2017(b) | | | 18,670,200 |
| | 1,050,000 | | SP PowerAssets Ltd., EMTN, 3.730%, 10/22/2010, (SGD) | | | 745,986 |
| | 8,785,000 | | Toledo Edison Co., 6.150%, 5/15/2037 | | | 7,152,413 |
| | 46,215,000 | | TXU Corp., Series P, 5.550%, 11/15/2014 | | | 34,488,267 |
| | | | | | |
Principal
Amount (‡) | | Description | | Value (†) |
| | | | | | |
| | | Electric — continued | | | |
| $ | 101,030,000 | | TXU Corp., Series Q, 6.500%, 11/15/2024 | | $ | 64,343,683 |
| | 6,245,000 | | TXU Corp., Series R, 6.550%, 11/15/2034 | | | 3,837,197 |
| | 7,300,000 | | White Pine Hydro LLC, 6.310%, 7/10/2017(e) | | | 7,007,584 |
| | 10,935,000 | | White Pine Hydro LLC, 6.960%, 7/10/2037(e) | | | 10,554,845 |
| | 4,000,000 | | White Pine Hydro LLC, 7.260%, 7/20/2015(e) | | | 3,855,500 |
| | | | | | |
| | | | | | 490,637,994 |
| | | | | | |
| | | Entertainment — 0.6% | | | |
| | 10,690,000 | | Six Flags, Inc., 9.625%, 6/01/2014(b) | | | 5,986,400 |
| | 2,785,000 | | Six Flags, Inc., 9.750%, 4/15/2013(b) | | | 1,615,300 |
| | 9,240,000 | | Time Warner, Inc., 6.500%, 11/15/2036 | | | 7,016,939 |
| | 11,145,000 | | Time Warner, Inc., 6.625%, 5/15/2029 | | | 8,901,735 |
| | 4,795,000 | | Time Warner, Inc., 6.950%, 1/15/2028 | | | 3,997,687 |
| | 3,150,000 | | Time Warner, Inc., 7.625%, 4/15/2031 | | | 2,735,334 |
| | 2,025,000 | | Time Warner, Inc., 7.700%, 5/01/2032 | | | 1,769,324 |
| | 32,790,000 | | Viacom, Inc., Class B, 6.875%, 4/30/2036 | | | 26,287,087 |
| | | | | | |
| | | | | | 58,309,806 |
| | | | | | |
| | | Food & Beverage — 1.2% | | | |
| | 2,085,000 | | Aramark Services, Inc., 5.000%, 6/01/2012 | | | 1,751,400 |
| | 23,710,000 | | Corn Products International, Inc., 6.625%, 4/15/2037 | | | 24,659,610 |
| | 21,290,000 | | Dean Foods Co., 7.000%, 6/01/2016(b) | | | 18,522,300 |
| | 1,935,000 | | Dole Food Co., Inc., 8.625%, 5/01/2009 | | | 1,847,925 |
| | 37,705,000 | | Kraft Foods, Inc., 6.500%, 8/11/2017 | | | 36,279,864 |
| | 30,680,000 | | Kraft Foods, Inc., 7.000%, 8/11/2037 | | | 28,704,300 |
| | 14,120,000 | | Sara Lee Corp., 6.125%, 11/01/2032 | | | 12,511,873 |
| | | | | | |
| | | | | | 124,277,272 |
| | | | | | |
| | | Government Guaranteed — 1.1% | | | |
| | 121,095,000 | | Canada Housing Trust, 4.100%, 12/15/2008, (CAD) | | | 114,204,219 |
| | | | | | |
| | | Government Owned — No Guarantee — 0.3% | | | |
| | 26,435,000 | | Abu Dhabi National Energy Co., 144A, 7.250%, 8/01/2018 | | | 25,771,772 |
| | 10,300,000 | | DP World Ltd., 144A, 6.850%, 7/02/2037 | | | 7,625,708 |
| | | | | | |
| | | | | | 33,397,480 |
| | | | | | |
| | | Government Sponsored — 0.8% | | | |
| | 23,725,000 | | Federal Home Loan Mortgage Corp., 4.625%, 10/25/2012(b) | | | 24,387,521 |
See accompanying notes to financial statements.
37
LOOMIS SAYLES STRATEGIC INCOME FUND — PORTFOLIOOF INVESTMENTS (continued)
Investments as of September 30, 2008
| | | | | |
Principal
Amount (‡) | | Description | | Value (†) |
| | | | | |
| | Government Sponsored — continued | | | |
| 35,900,000 | | Federal National Mortgage Association, 2.290%, 2/19/2009, (SGD) | | $ | 25,028,935 |
| 50,000,000 | | Queensland Treasury Corp., 144A, 7.125%, 9/18/2017, (NZD) | | | 35,113,116 |
| | | | | |
| | | | | 84,529,572 |
| | | | | |
| | Health Insurnace — 0.1% | | | |
| 15,325,000 | | CIGNA Corp., 6.150%, 11/15/2036 | | | 12,911,006 |
| | | | | |
| | Healthcare — 4.9% | | | |
| 2,765,000 | | Boston Scientific Corp., 5.450%, 6/15/2014 | | | 2,585,275 |
| 8,230,000 | | Boston Scientific Corp., 6.400%, 6/15/2016 | | | 7,818,500 |
| 16,510,000 | | Boston Scientific Corp., 7.000%, 11/15/2035 | | | 14,693,900 |
| 18,130,000 | | Covidien International Finance SA, 6.000%, 10/15/2017 | | | 17,912,313 |
| 18,265,000 | | Covidien International Finance SA, 6.550%, 10/15/2037 | | | 17,559,880 |
| 17,785,000 | | HCA, Inc., 5.750%, 3/15/2014 | | | 13,872,300 |
| 3,800,000 | | HCA, Inc., 6.250%, 2/15/2013 | | | 3,173,000 |
| 17,035,000 | | HCA, Inc., 6.375%, 1/15/2015 | | | 13,415,062 |
| 49,350,000 | | HCA, Inc., 6.500%, 2/15/2016 | | | 39,109,875 |
| 2,074,000 | | HCA, Inc., 6.750%, 7/15/2013 | | | 1,742,160 |
| 14,405,000 | | HCA, Inc., 7.050%, 12/01/2027 | | | 9,727,552 |
| 10,694,000 | | HCA, Inc., 7.190%, 11/15/2015 | | | 8,537,362 |
| 17,172,000 | | HCA, Inc., 7.500%, 12/15/2023 | | | 12,579,349 |
| 18,745,000 | | HCA, Inc., 7.500%, 11/06/2033 | | | 13,308,950 |
| 13,545,000 | | HCA, Inc., MTN, 7.580%, 9/15/2025 | | | 9,979,008 |
| 43,253,000 | | HCA, Inc., 7.690%, 6/15/2025 | | | 32,147,360 |
| 8,112,000 | | HCA, Inc., MTN, 7.750%, 7/15/2036 | | | 5,758,709 |
| 27,895,000 | | HCA, Inc., 8.360%, 4/15/2024 | | | 21,620,857 |
| 11,370,000 | | Hospira, Inc., 6.050%, 3/30/2017 | | | 10,840,658 |
| 176,070,000 | | Medco Health Solutions, Inc., 7.125%, 3/15/2018 | | | 178,412,259 |
| 3,260,000 | | Owens & Minor, Inc., 6.350%, 4/15/2016(e) | | | 3,174,363 |
| 1,900,000 | | Tenet Healthcare Corp., 6.500%, 6/01/2012 | | | 1,757,500 |
| 31,009,000 | | Tenet Healthcare Corp., 6.875%, 11/15/2031 | | | 21,086,120 |
| 1,570,000 | | Tenet Healthcare Corp., 7.375%, 2/01/2013 | | | 1,428,700 |
| | | | | | |
Principal
Amount (‡) | | Description | | Value (†) |
| | | | | | |
| | | Healthcare — continued | | | |
| $ | 4,480,000 | | Tenet Healthcare Corp., 9.250%, 2/01/2015(b) | | $ | 4,233,600 |
| | 50,000,000 | | WellPoint, Inc., 6.375%, 6/15/2037 | | | 42,778,650 |
| | | | | | |
| | | | | | 509,253,262 |
| | | | | | |
| | | Home Construction — 1.9% | | | |
| | 2,840,000 | | Centex Corp., 5.250%, 6/15/2015 | | | 2,087,400 |
| | 43,470,000 | | D.R. Horton, Inc., 5.250%, 2/15/2015 | | | 32,167,800 |
| | 4,335,000 | | D.R. Horton, Inc., 5.625%, 9/15/2014 | | | 3,294,600 |
| | 16,160,000 | | D.R. Horton, Inc., Guaranteed Note, 5.625%, 1/15/2016 | | | 11,958,400 |
| | 1,625,000 | | D.R. Horton, Inc., 6.500%, 4/15/2016 | | | 1,235,000 |
| | 11,265,000 | | Desarrolladora Homex SAB de CV, 7.500%, 9/28/2015(b) | | | 9,913,200 |
| | 4,830,000 | | K. Hovnanian Enterprises, Inc., Guaranteed Note, 6.250%, 1/15/2015 | | | 2,753,100 |
| | 16,075,000 | | K. Hovnanian Enterprises, Inc., Senior Note, 6.250%, 1/15/2016 | | | 9,243,125 |
| | 6,040,000 | | K. Hovnanian Enterprises, Inc., Guaranteed Note, 6.375%, 12/15/2014 | | | 3,503,200 |
| | 2,490,000 | | K. Hovnanian Enterprises, Inc., Guaranteed Note, 6.500%, 1/15/2014 | | | 1,469,100 |
| | 6,290,000 | | K. Hovnanian Enterprises, Inc., 7.500%, 5/15/2016(b) | | | 3,648,200 |
| | 1,935,000 | | K. Hovnanian Enterprises, Inc., 7.750%, 5/15/2013(b) | | | 1,093,275 |
| | 1,235,000 | | K. Hovnanian Enterprises, Inc., 8.875%, 4/01/2012(b) | | | 784,225 |
| | 1,685,000 | | KB Home, 5.750%, 2/01/2014(b) | | | 1,356,425 |
| | 8,340,000 | | KB Home, Guaranteed Note, 5.875%, 1/15/2015 | | | 6,630,300 |
| | 5,805,000 | | KB Home, Guaranteed Note, 6.250%, 6/15/2015(b) | | | 4,731,075 |
| | 11,315,000 | | KB Home, Guaranteed Note, 7.250%, 6/15/2018 | | | 9,278,300 |
| | 23,885,000 | | Lennar Corp., Series A, 6.500%, 4/15/2016 | | | 16,122,375 |
| | 3,495,000 | | Lennar Corp., 7.625%, 3/01/2009 | | | 3,372,675 |
| | 2,720,000 | | Lennar Corp., Series B, 5.125%, 10/01/2010 | | | 2,284,800 |
| | 16,755,000 | | Lennar Corp., Series B, 5.500%, 9/01/2014 | | | 10,890,750 |
| | 5,970,000 | | Lennar Corp.,Series B, Guaranteed Note, 5.600%, 5/31/2015 | | | 3,880,500 |
| | 4,240,000 | | Pulte Homes, Inc., 5.200%, 2/15/2015 | | | 3,392,000 |
| | 46,260,000 | | Pulte Homes, Inc., 6.000%, 2/15/2035 | | | 33,075,900 |
| | 13,190,000 | | Pulte Homes, Inc., 6.375%, 5/15/2033 | | | 9,628,700 |
| | 4,245,000 | | Toll Brothers Financial Corp., 5.150%, 5/15/2015 | | | 3,590,060 |
See accompanying notes to financial statements.
38
LOOMIS SAYLES STRATEGIC INCOME FUND — PORTFOLIOOF INVESTMENTS (continued)
Investments as of September 30, 2008
| | | | | | |
Principal
Amount (‡) | | Description | | Value (†) |
| | | | | | |
| | | Home Construction — continued | | | |
| $ | 5,245,000 | | Toll Corp., 8.250%, 12/01/2011 | | $ | 5,035,200 |
| | | | | | |
| | | | | | 196,419,685 |
| | | | | | |
| | | Independent Energy — 1.7% | | | |
| | 37,190,000 | | Anadarko Petroleum Corp., 5.950%, 9/15/2016 | | | 34,181,887 |
| | 45,910,000 | | Anadarko Petroleum Corp., 6.450%, 9/15/2036 | | | 35,995,644 |
| | 4,185,000 | | Chesapeake Energy Corp., 6.250%, 1/15/2017, (EUR) | | | 4,890,065 |
| | 21,390,000 | | Chesapeake Energy Corp., 6.500%, 8/15/2017 | | | 18,716,250 |
| | 22,690,000 | | Chesapeake Energy Corp., 6.875%, 11/15/2020 | | | 19,399,950 |
| | 15,054,000 | | Connacher Oil and Gas Ltd., 144A, 10.250%, 12/15/2015 | | | 14,451,840 |
| | 6,495,000 | | Hilcorp Energy I LP, 144A, 7.750%, 11/01/2015 | | | 5,585,700 |
| | 7,175,000 | | Pioneer Natural Resources Co., 5.875%, 7/15/2016 | | | 6,181,557 |
| | 1,760,000 | | Pioneer Natural Resources Co., 6.875%, 5/01/2018 | | | 1,567,039 |
| | 4,798,000 | | Pioneer Natural Resources Co., 7.200%, 1/15/2028 | | | 4,130,771 |
| | 9,170,000 | | Talisman Energy, Inc., 5.850%, 2/01/2037 | | | 6,883,809 |
| | 24,260,000 | | Talisman Energy, Inc., 6.250%, 2/01/2038 | | | 18,842,232 |
| | 8,885,000 | | XTO Energy, Inc., 6.750%, 8/01/2037 | | | 7,883,811 |
| | | | | | |
| | | | | | 178,710,555 |
| | | | | | |
| | | Industrial Other — 0.1% | | | |
| | 20,000,000 | | Ranhill Labuan Ltd., 144A, 12.500%, 10/26/2011 | | | 9,600,000 |
| | | | | | |
| | | Life Insurance — 0.0% | | | |
| | 8,000,000 | | ASIF Global Financing XXVII, 144A, 2.380%, 2/26/2009, (SGD) | | | 2,828,966 |
| | | | | | |
| | | Local Authorities — 1.6% | | | |
| | 79,205,000 | | Queensland Treasury Corp., Series 11G, 6.000%, 6/14/2011, (AUD) | | | 62,930,890 |
| | 131,890,000 | | Virginia Tobacco Settlement Financing Corp., Series A-1, 6.706%, 6/01/2046(e) | | | 102,142,210 |
| | | | | | |
| | | | | | 165,073,100 |
| | | | | | |
| | | Media Cable — 2.5% | | | |
| | 49,030,000 | | Comcast Corp., 5.650%, 6/15/2035 | | | 36,445,617 |
| | 33,675,000 | | Comcast Corp., 6.450%, 3/15/2037 | | | 27,161,009 |
| | 20,175,000 | | Comcast Corp., 6.500%, 11/15/2035 | | | 16,844,592 |
| | 166,000,000 | | Comcast Corp., 6.950%, 8/15/2037 | | | 141,590,198 |
| | 400,000 | | CSC Holdings, Inc., Senior Note, 7.875%, 2/15/2018 | | | 352,000 |
| | 250,000 | | CSC Holdings, Inc., Series B, Senior Note, 8.125%, 7/15/2009 | | | 247,500 |
| | | | | |
Principal
Amount (‡) | | Description | | Value (†) |
| | | | | |
| | Media Cable — continued | | | |
| 10,000,000 | | Shaw Communications, Inc., 5.700%, 3/02/2017, (CAD) | | $ | 8,412,591 |
| 20,000,000 | | Time Warner Cable, Inc., 6.750%, 7/01/2018 | | | 18,678,600 |
| 1,000,000 | | Virgin Media Finance PLC, 9.125%, 8/15/2016 | | | 837,500 |
| 5,070,000 | | Virgin Media Finance PLC, 9.750%, 4/15/2014, (GBP) | | | 6,940,550 |
| | | | | |
| | | | | 257,510,157 |
| | | | | |
| | Media Non-Cable — 0.9% | | | |
| 14,215,000 | | Clear Channel Communications, Inc., 4.900%, 5/15/2015 | | | 4,228,963 |
| 4,970,000 | | Clear Channel Communications, Inc., 5.500%, 9/15/2014 | | | 1,540,700 |
| 14,910,000 | | Clear Channel Communications, Inc., 5.500%, 12/15/2016(b) | | | 4,323,900 |
| 2,080,000 | | Clear Channel Communications, Inc., 5.750%, 1/15/2013 | | | 748,800 |
| 585,000 | | Clear Channel Communications, Inc., 6.875%, 6/15/2018 | | | 178,425 |
| 920,000 | | Idearc, Inc., 8.000%, 11/15/2016 | | | 250,700 |
| 225,000 | | Intelsat Corp., 6.875%, 1/15/2028 | | | 164,250 |
| 54,190,000 | | News America, Inc., 6.150%, 3/01/2037 | | | 44,182,570 |
| 11,140,000 | | News America, Inc., 6.200%, 12/15/2034 | | | 8,881,799 |
| 14,360,000 | | News America, Inc., 6.400%, 12/15/2035 | | | 12,062,845 |
| 4,335,000 | | R.H. Donnelley Corp., Series A-1, 6.875%, 1/15/2013(b) | | | 1,690,650 |
| 1,910,000 | | R.H. Donnelley Corp., Series A-2, 6.875%, 1/15/2013(b) | | | 744,900 |
| 470,000 | | R.H. Donnelley Corp., Series A-3, 8.875%, 1/15/2016 | | | 159,800 |
| 4,845,000 | | R.H. Donnelley Corp., Series A-4, 8.875%, 10/15/2017(b) | | | 1,647,300 |
| 36,385,000 | | Tribune Co., 5.250%, 8/15/2015(b) | | | 10,915,500 |
| | | | | |
| | | | | 91,721,102 |
| | | | | |
| | Metals & Mining — 0.3% | | | |
| 9,785,000 | | Algoma Acquistion Corp., 144A, 9.875%, 6/15/2015 | | | 8,818,731 |
| 2,450,000 | | OI European Group BV, 144A, 6.875%, 3/31/2017, (EUR) | | | 2,948,990 |
| 7,000,000 | | United States Steel Corp., 6.050%, 6/01/2017 | | | 6,082,657 |
| 5,850,000 | | United States Steel Corp., 6.650%, 6/01/2037 | | | 4,350,692 |
| 16,435,000 | | United States Steel Corp., 7.000%, 2/01/2018 | | | 14,836,860 |
| | | | | |
| | | | | 37,037,930 |
| | | | | |
| | Mortgage Related — 0.0% | | | |
| 2,664,000 | | Federal Home Loan Mortgage Corp., MTN, 5.000%, 12/14/2018(b) | | | 2,504,043 |
| | | | | |
See accompanying notes to financial statements.
39
LOOMIS SAYLES STRATEGIC INCOME FUND — PORTFOLIOOF INVESTMENTS (continued)
Investments as of September 30, 2008
| | | | | | |
Principal
Amount (‡) | | Description | | Value (†) |
| | | | | | |
| | | Non-Captive Consumer — 3.4% | | | |
| $ | 239,505,000 | | American General Finance Corp., 6.900%, 12/15/2017 | | $ | 111,056,552 |
| | 4,900,000 | | American General Finance Corp., MTN, 5.750%, 9/15/2016 | | | 2,240,304 |
| | 4,110,000 | | Countrywide Financial Corp., Series A, MTN, 3.333%, 12/19/2008(c) | | | 4,063,467 |
| | 11,799,000 | | Countrywide Home Loans, Inc., Series L, MTN, 4.000%, 3/22/2011 | | | 10,151,317 |
| | 1,575,000 | | Hexion US Finance Corp./Hexion Nova Scotia Finance ULC, 9.750%, 11/15/2014 | | | 1,244,250 |
| | 895,000 | | Residential Capital LLC, 8.125%, 11/21/2008(b) | | | 760,750 |
| | 4,170,000 | | Residential Capital LLC, 8.375%, 6/30/2010(b) | | | 959,100 |
| | 2,740,000 | | Residential Capital LLC, 8.500%, 6/01/2012 | | | 548,000 |
| | 121,645,000 | | Residential Capital LLC, 8.500%, 4/17/2013 | | | 24,329,000 |
| | 12,335,000 | | Residential Capital LLC, 8.875%, 6/30/2015(b) | | | 2,467,000 |
| | 45,208,000 | | Residential Capital LLC, 144A, 9.625%, 5/15/2015 | | | 10,849,920 |
| | 109,950(†††) | | SLM Corp., 6.000%, 12/15/2043 | | | 1,135,509 |
| | 4,700,000 | | SLM Corp., EMTN, Series 7, 4.750%, 3/17/2014, (EUR) | | | 3,639,164 |
| | 20,590,000 | | SLM Corp., MTN, 5.050%, 11/14/2014 | | | 12,559,900 |
| | 1,450,000 | | SLM Corp., MTN, 5.125%, 8/27/2012 | | | 942,500 |
| | 7,160,000 | | SLM Corp., Series A, MTN, 4.000%, 1/15/2010 | | | 5,620,600 |
| | 51,943,000 | | SLM Corp., Series A, MTN, 5.000%, 10/01/2013 | | | 32,204,660 |
| | 37,670,000 | | SLM Corp., Series A, MTN, 5.000%, 4/15/2015 | | | 22,602,000 |
| | 13,370,000 | | SLM Corp., Series A, MTN, 5.000%, 6/15/2018 | | | 7,353,500 |
| | 19,605,000 | | SLM Corp., Series A, MTN, 5.375%, 1/15/2013 | | | 12,841,275 |
| | 22,420,000 | | SLM Corp., Series A, MTN, 5.375%, 5/15/2014 | | | 13,900,400 |
| | 1,390,000 | | SLM Corp., Series A, MTN, 5.400%, 10/25/2011 | | | 973,000 |
| | 28,150,000 | | SLM Corp., Series A, MTN, 5.625%, 8/01/2033 | | | 14,075,000 |
| | 6,100,000 | | SLM Corp., Series A, MTN, 6.500%, 6/15/2010, (NZD) | | | 3,387,907 |
| | 88,180,000 | | SLM Corp., Series A, MTN, 8.450%, 6/15/2018 | | | 59,962,400 |
| | | | | | |
| | | | | | 359,867,475 |
| | | | | | |
| | | Non-Captive Diversified — 7.7% | | | |
| | 6,067,000 | | CIT Group Funding Co. of Canada, 5.200%, 6/01/2015 | | | 2,979,437 |
| | 15,060,000 | | CIT Group, Inc., EMTN, 3.800%, 11/14/2012, (EUR) | | | 11,441,693 |
| | 18,360,000 | | CIT Group, Inc., GMTN, 4.250%, 9/22/2011, (EUR) | | | 15,438,205 |
| | | | | |
Principal
Amount (‡) | | Description | | Value (†) |
| | | | | |
| | Non-Captive Diversified — continued | | | |
| 15,150,000 | | CIT Group, Inc., Series E, MTN, 4.650%, 9/19/2016, (EUR)(b) | | $ | 10,452,896 |
| 90,000 | | CIT Group, Inc., 4.750%, 12/15/2010 | | | 58,612 |
| 4,855,000 | | CIT Group, Inc., Series G, MTN, 5.000%, 5/13/2014, (EUR) | | | 3,496,221 |
| 1,525,000 | | CIT Group, Inc., 5.400%, 2/13/2012 | | | 876,683 |
| 1,205,000 | | CIT Group, Inc., 5.400%, 1/30/2016 | | | 583,221 |
| 20,350,000 | | CIT Group, Inc., Series E, Senior Note, MTN, 5.500%, 12/01/2014, (GBP) | | | 18,059,383 |
| 10,500,000 | | CIT Group, Inc., Series E, MTN, 5.500%, 12/20/2016, (GBP) | | | 9,310,437 |
| 2,000,000 | | CIT Group, Inc., 5.600%, 4/27/2011 | | | 1,288,060 |
| 2,395,000 | | CIT Group, Inc., 5.650%, 2/13/2017(b) | | | 1,168,683 |
| 11,845,000 | | CIT Group, Inc., 5.800%, 10/01/2036 | | | 5,417,595 |
| 20,000 | | CIT Group, Inc., 5.850%, 9/15/2016 | | | 9,700 |
| 246,450,000 | | CIT Group, Inc., 7.625%, 11/30/2012 | | | 156,339,501 |
| 3,090,000 | | CIT Group, Inc., Series A, MTN, 6.000%, 4/01/2036 | | | 1,266,900 |
| 60,000 | | CIT Group, Inc., GMTN, 4.250%, 2/01/2010 | | | 39,546 |
| 6,330,000 | | CIT Group, Inc., GMTN, 5.000%, 2/13/2014 | | | 3,580,685 |
| 1,125,000 | | CIT Group, Inc., GMTN, 5.000%, 2/01/2015 | | | 556,084 |
| 20,730,000 | | CIT Group, Inc., MTN, 4.250%, 3/17/2015, (EUR) | | | 14,304,858 |
| 10,140,000 | | CIT Group, Inc., MTN, 5.125%, 9/30/2014 | | | 5,000,612 |
| 65,300,000 | | General Electric Capital Corp., Series G, MTN, 2.960%, 5/18/2012, (SGD) | | | 44,557,882 |
| 243,057,000 | | General Electric Capital Corp., 6.500%, 9/28/2015, (NZD) | | | 144,897,905 |
| 30,350,000 | | General Electric Capital Corp., Series A, MTN, 6.625%, 2/04/2010, (NZD) | | | 19,475,013 |
| 3,100,000 | | General Electric Capital Corp., Series E, MTN, 6.125%, 5/17/2012, (GBP) | | | 5,067,288 |
| 79,035,000 | | General Electric Capital Corp., Series E, MTN, 6.750%, 9/26/2016, (NZD) | | | 47,038,273 |
| 115,000,000 | | General Electric Capital Corp., Series G, MTN, 3.485%, 3/08/2012, (SGD) | | | 80,005,616 |
| 335,000 | | GMAC Canada Ltd., Series E, MTN, 6.625%, 12/17/2010, (GBP) | | | 363,304 |
| 7,890,000 | | GMAC LLC, 4.750%, 9/14/2009, (EUR) | | | 7,108,829 |
| 48,715,000 | | GMAC LLC, EMTN, 5.375%, 6/06/2011, (EUR) | | | 28,804,017 |
| 3,835,000 | | GMAC LLC, EMTN, 5.750%, 9/27/2010, (EUR) | | | 2,429,511 |
| 54,470,000 | | GMAC LLC, 6.000%, 12/15/2011 | | | 24,219,486 |
See accompanying notes to financial statements.
40
LOOMIS SAYLES STRATEGIC INCOME FUND — PORTFOLIOOF INVESTMENTS (continued)
Investments as of September 30, 2008
| | | | | | |
Principal
Amount (‡) | | Description | | Value (†) |
| | | | | | |
| | | Non-Captive Diversified — continued | | | |
| $ | 24,015,000 | | GMAC LLC, 6.625%, 5/15/2012 | | $ | 10,167,183 |
| | 36,174,000 | | GMAC LLC, MTN, 6.750%, 12/01/2014 | | | 13,884,088 |
| | 6,585,000 | | GMAC LLC, 6.875%, 9/15/2011 | | | 2,938,141 |
| | 4,655,000 | | GMAC LLC, 6.875%, 8/28/2012 | | | 1,850,260 |
| | 12,165,000 | | GMAC LLC, 7.000%, 2/01/2012 | | | 4,958,576 |
| | 42,272,000 | | GMAC LLC, 8.000%, 11/01/2031 | | | 15,948,253 |
| | 34,782,000 | | iStar Financial, Inc., 5.150%, 3/01/2012 | | | 17,391,000 |
| | 5,255,000 | | iStar Financial, Inc., 5.375%, 4/15/2010 | | | 3,153,000 |
| | 3,010,000 | | iStar Financial, Inc., 5.500%, 6/15/2012 | | | 1,535,100 |
| | 19,110,000 | | iStar Financial, Inc., 5.650%, 9/15/2011 | | | 9,937,200 |
| | 1,530,000 | | iStar Financial, Inc., 5.700%, 3/01/2014 | | | 749,700 |
| | 4,040,000 | | iStar Financial, Inc., 5.800%, 3/15/2011 | | | 2,060,400 |
| | 4,815,000 | | iStar Financial, Inc., 5.850%, 3/15/2017 | | | 2,359,350 |
| | 8,815,000 | | iStar Financial, Inc., 5.875%, 3/15/2016 | | | 4,319,350 |
| | 4,300,000 | | iStar Financial, Inc., 6.050%, 4/15/2015 | | | 2,107,000 |
| | 35,130,000 | | iStar Financial, Inc., 8.625%, 6/01/2013 | | | 17,213,700 |
| | 1,780,000 | | iStar Financial, Inc., Series B, 5.125%, 4/01/2011 | | | 907,800 |
| | 44,610,000 | | iStar Financial, Inc., Series B, 5.950%, 10/15/2013 | | | 23,197,200 |
| | | | | | |
| | | | | | 800,313,437 |
| | | | | | |
| | | Oil Field Services — 0.3% | | | |
| | 22,930,000 | | North American Energy Partners, Inc., Senior Note, 8.750%, 12/01/2011 | | | 21,095,600 |
| | 11,855,000 | | Weatherford International Ltd., 6.500%, 8/01/2036 | | | 10,219,496 |
| | | | | | |
| | | | | | 31,315,096 |
| | | | | | |
| | | Packaging — 0.3% | | | |
| | 33,261,000 | | Owens-Illinois, Inc., Senior Note, 7.800%, 5/15/2018(b) | | | 32,263,170 |
| | | | | | |
| | | Paper — 2.7% | | | |
| | 250,000 | | Abitibi-Consolidated, Inc., 6.000%, 6/20/2013(b) | | | 66,250 |
| | 8,125,000 | | Abitibi-Consolidated, Inc., 7.400%, 4/01/2018 | | | 1,868,750 |
| | 12,310,000 | | Abitibi-Consolidated, Inc., 7.500%, 4/01/2028 | | | 2,831,300 |
| | 2,960,000 | | Abitibi-Consolidated, Inc., 8.500%, 8/01/2029 | | | 710,400 |
| | 39,846,000 | | Abitibi-Consolidated, Inc., 8.850%, 8/01/2030 | | | 9,563,040 |
| | | | | |
Principal
Amount (‡) | | Description | | Value (†) |
| | | | | |
| | Paper — continued | | | |
| 750,000 | | Avenor, Inc., 10.850%, 11/30/2014, (CAD) | | $ | 366,864 |
| 2,685,000 | | Bowater, Inc., 6.500%, 6/15/2013 | | | 1,033,725 |
| 7,955,000 | | Domtar Corp., 5.375%, 12/01/2013 | | | 6,721,975 |
| 11,720,000 | | Georgia-Pacific Corp., 7.250%, 6/01/2028 | | | 9,258,800 |
| 11,605,000 | | Georgia-Pacific Corp., 7.375%, 12/01/2025 | | | 9,371,038 |
| 120,000 | | Georgia-Pacific Corp., 7.700%, 6/15/2015 | | | 109,800 |
| 42,425,000 | | Georgia-Pacific Corp., 7.750%, 11/15/2029 | | | 35,000,625 |
| 15,555,000 | | Georgia-Pacific Corp., 8.000%, 1/15/2024 | | | 13,688,400 |
| 18,378,000 | | Georgia-Pacific Corp., 8.875%, 5/15/2031 | | | 15,988,860 |
| 149,788,000 | | International Paper Co., 7.950%, 6/15/2018 | | | 147,183,336 |
| 3,995,000 | | Jefferson Smurfit Corp., 7.500%, 6/01/2013 | | | 3,235,950 |
| 100,000 | | Smurfit-Stone Container Enterprises, Inc., 8.000%, 3/15/2017 | | | 78,000 |
| 14,140,000 | | Westvaco Corp., 7.950%, 2/15/2031 | | | 13,536,420 |
| 12,655,000 | | Westvaco Corp., 8.200%, 1/15/2030 | | | 11,878,046 |
| | | | | |
| | | | | 282,491,579 |
| | | | | |
| | Pharmaceuticals — 2.2% | | | |
| 159,095,000 | | Astrazeneca PLC, 6.450%, 9/15/2037 | | | 152,118,843 |
| 41,300,000 | | Elan Finance PLC, 8.875%, 12/01/2013 | | | 34,692,000 |
| 50,820,000 | | Elan Finance PLC, Senior Note, 7.750%, 11/15/2011 | | | 45,992,100 |
| | | | | |
| | | | | 232,802,943 |
| | | | | |
| | Pipelines — 2.2% | | | |
| 766,000 | | Colorado Interstate Gas Co., 5.950%, 3/15/2015 | | | 697,902 |
| 2,670,000 | | Colorado Interstate Gas Co., 6.800%, 11/15/2015 | | | 2,529,430 |
| 19,745,000 | | DCP Midstream LP, 144A, 6.450%, 11/03/2036 | | | 15,794,223 |
| 15,685,000 | | El Paso Corp., 6.950%, 6/01/2028 | | | 12,384,782 |
| 1,500,000 | | El Paso Corp., 7.420%, 2/15/2037 | | | 1,195,176 |
| 750,000 | | El Paso Corp., Senior Note, MTN, 7.800%, 8/01/2031 | | | 631,888 |
| 1,000,000 | | El Paso Energy Corp., MTN, 7.750%, 1/15/2032 | | | 836,953 |
| 5,255,000 | | Energy Transfer Partners LP, 6.125%, 2/15/2017 | | | 4,802,192 |
| 11,315,000 | | Energy Transfer Partners LP, 6.625%, 10/15/2036(b) | | | 9,640,719 |
See accompanying notes to financial statements.
41
LOOMIS SAYLES STRATEGIC INCOME FUND — PORTFOLIOOF INVESTMENTS (continued)
Investments as of September 30, 2008
| | | | | | |
Principal
Amount (‡) | | Description | | Value (†) |
| | | | | | |
| | | Pipelines — continued | | | |
| $ | 13,175,000 | | Enterprise Products Operating LP, 6.300%, 9/15/2017 | | $ | 12,286,834 |
| | 500,000 | | Kinder Morgan Energy Partners LP, 5.800%, 3/15/2035 | | | 372,376 |
| | 4,663,000 | | Kinder Morgan Finance Co. ULC, Guaranteed Note, 5.700%, 1/05/2016 | | | 4,010,180 |
| | 11,288,000 | | Kinder Morgan, Inc., Senior Note, 5.150%, 3/01/2015 | | | 9,566,580 |
| | 84,710,000 | | NGPL Pipeco LLC, 144A, 7.119%, 12/15/2017 | | | 80,400,718 |
| | 4,530,000 | | ONEOK Partners LP, 6.650%, 10/01/2036 | | | 3,964,443 |
| | 20,770,000 | | Plains All American Pipeline LP, 6.125%, 1/15/2017 | | | 18,873,533 |
| | 44,730,000 | | Plains All American Pipeline LP, 6.650%, 1/15/2037 | | | 36,639,461 |
| | 2,550,000 | | Southern Natural Gas Co., 7.350%, 2/15/2031 | | | 2,235,799 |
| | 7,872,000 | | Tennessee Gas Pipeline Co., 7.000%, 10/15/2028(b) | | | 6,745,926 |
| | 600,000 | | Williams Cos., Inc., 7.875%, 9/01/2021 | | | 600,000 |
| | 965,000 | | Williams Cos., Inc., Senior Note, 7.750%, 6/15/2031 | | | 901,860 |
| | 8,600,000 | | Williams Cos., Inc., Series A, 7.500%, 1/15/2031 | | | 7,825,828 |
| | | | | | |
| | | | | | 232,936,803 |
| | | | | | |
| | | Property & Casualty Insurance — 0.7% | | | |
| | 4,785,000 | | Allstate Corp., 5.950%, 4/01/2036 | | | 3,900,732 |
| | 2,660,000 | | Marsh & McLennan Cos., Inc., 5.375%, 7/15/2014 | | | 2,463,272 |
| | 11,710,000 | | Marsh & McLennan Cos., Inc., 5.750%, 9/15/2015 | | | 10,976,837 |
| | 9,075,000 | | Marsh & McLennan Cos., Inc., 5.875%, 8/01/2033(b) | | | 7,601,138 |
| | 6,910,000 | | MBIA Insurance Corp., (fixed rate to 1/15/2013, variable rate thereafter), 144A, 14.000%, 1/15/2033 | | | 3,662,300 |
| | 31,135,000 | | Travelers Cos., Inc. (The), MTN, 6.250%, 6/15/2037 | | | 26,992,052 |
| | 4,000,000 | | Travelers Cos., Inc. (The), 6.750%, 6/20/2036 | | | 3,697,404 |
| | 1,000,000 | | Travelers Property Casualty Corp., 6.375%, 3/15/2033 | | | 877,759 |
| | 11,205,000 | | Willis North America, Inc., 6.200%, 3/28/2017 | | | 9,742,277 |
| | | | | | |
| | | | | | 69,913,771 |
| | | | | | |
| | | Railroads — 0.5% | | | |
| | 2,700,000 | | Canadian Pacific Railway Co., 5.750%, 3/15/2033 | | | 2,095,184 |
| | 18,680,000 | | Canadian Pacific Railway Co., 5.950%, 5/15/2037 | | | 15,290,813 |
| | 37,345,000 | | CSX Corp., 6.000%, 10/01/2036(b) | | | 28,381,677 |
| | 5,000,000 | | CSX Corp., 6.250%, 3/15/2018 | | | 4,525,470 |
| | | | | | |
Principal
Amount (‡) | | Description | | Value (†) |
| | | | | | |
| | | Railroads — continued | | | |
| $ | 1,153,000 | | Missouri Pacific Railroad Co., 5.000%, 1/01/2045(e) | | $ | 691,800 |
| | | | | | |
| | | | | | 50,984,944 |
| | | | | | |
| | | REITs — 0.7% | | | |
| | 27,950,000 | | Camden Property Trust, 5.700%, 5/15/2017 | | | 24,707,185 |
| | 2,935,000 | | Colonial Realty LP, 6.050%, 9/01/2016 | | | 2,475,572 |
| | 4,030,000 | | Duke Realty LP, 5.950%, 2/15/2017 | | | 3,607,487 |
| | 3,300,000 | | ERP Operating LP, 5.125%, 3/15/2016 | | | 2,764,090 |
| | 45,430,000 | | Highwoods Properties, Inc., 5.850%, 3/15/2017 | | | 36,441,811 |
| | 1,880,000 | | Prologis, 5.625%, 11/15/2015 | | | 1,643,673 |
| | 1,535,000 | | Prologis, 5.750%, 4/01/2016(b) | | | 1,337,519 |
| | 2,435,000 | | Simon Property Group LP, 5.750%, 12/01/2015 | | | 2,301,262 |
| | | | | | |
| | | | | | 75,278,599 |
| | | | | | |
| | | Restaurants — 0.0% | | | |
| | 1,250,000 | | McDonald’s Corp., Series E, MTN, 3.628%, 10/10/2010, (SGD) | | | 890,240 |
| | | | | | |
| | | Retailers — 3.9% | | | |
| | 8,758,000 | | Dillard’s, Inc., 6.625%, 1/15/2018 | | | 5,429,960 |
| | 4,187,000 | | Dillard’s, Inc., 7.130%, 8/01/2018 | | | 2,658,745 |
| | 1,500,000 | | Dillard’s, Inc., 7.750%, 7/15/2026 | | | 855,000 |
| | 425,000 | | Dillard’s, Inc., 7.875%, 1/01/2023 | | | 255,000 |
| | 3,325,000 | | Dillard’s, Inc., Class A, 7.000%, 12/01/2028 | | | 1,695,750 |
| | 2,045,000 | | Home Depot, Inc., 5.400%, 3/01/2016 | | | 1,738,900 |
| | 123,559,000 | | Home Depot, Inc., 5.875%, 12/16/2036 | | | 86,858,641 |
| | 3,685,000 | | J.C. Penney Corp., Inc., 5.750%, 2/15/2018 | | | 3,095,842 |
| | 72,355,000 | | J.C. Penney Corp., Inc., Senior Note, 6.375%, 10/15/2036 | | | 55,033,502 |
| | 350,000 | | J.C. Penney Corp., Inc., 7.125%, 11/15/2023 | | | 319,075 |
| | 3,330,000 | | J.C. Penney Corp., Inc., 7.400%, 4/01/2037 | | �� | 2,786,154 |
| | 3,985,000 | | J.C. Penney Corp., Inc., 7.625%, 3/01/2097 | | | 3,090,766 |
| | 41,535,000 | | Lowe’s Cos., Inc., 6.650%, 9/15/2037 | | | 39,838,628 |
| | 17,705,000 | | Macy’s Retail Holdings, Inc., 6.375%, 3/15/2037 | | | 12,823,696 |
| | 8,855,000 | | Macy’s Retail Holdings, Inc., 6.790%, 7/15/2027 | | | 6,981,681 |
| | 5,785,000 | | Macy’s Retail Holdings, Inc., 6.900%, 4/01/2029 | | | 4,523,754 |
| | 6,365,000 | | Marks & Spencer PLC, 144A, 7.125%, 12/01/2037 | | | 4,879,842 |
See accompanying notes to financial statements.
42
LOOMIS SAYLES STRATEGIC INCOME FUND — PORTFOLIOOF INVESTMENTS (continued)
Investments as of September 30, 2008
| | | | | | |
Principal
Amount (‡) | | Description | | Value (†) |
| | | | | | |
| | | Retailers — continued | | | |
| $ | 7,793,000 | | Target Corp., 6.500%, 10/15/2037 | | $ | 7,158,697 |
| | 140,992,000 | | Target Corp., 7.000%, 1/15/2038 | | | 132,658,527 |
| | 32,675,000 | | Toys R Us, Inc., 7.375%, 10/15/2018 | | | 21,238,750 |
| | 8,355,000 | | Toys R Us, Inc., 7.875%, 4/15/2013(b) | | | 6,516,900 |
| | 10,270,000 | | Woolworth Corp., 8.500%, 1/15/2022 | | | 9,294,350 |
| | | | | | |
| | | | | | 409,732,160 |
| | | | | | |
| | | Sovereigns — 13.0% | | | |
| | 130,000,000 | | Canadian Government, 2.750%, 12/01/2010, (CAD) | | | 121,709,561 |
| | 28,000,000 | | Canadian Government, 3.750%, 6/01/2012, (CAD) | | | 26,858,689 |
| | 14,525,000 | | Canadian Government, 4.000%, 6/01/2016, (CAD) | | | 14,026,981 |
| | 436,930,000 | | Canadian Government, 4.250%, 12/01/2008, (CAD) | | | 412,198,346 |
| | 21,565,000 | | Canadian Government, 4.250%, 9/01/2009, (CAD) | | | 20,527,124 |
| | 62,140,000 | | Canadian Government, 5.250%, 6/01/2012, (CAD) | | | 62,633,383 |
| | 35,580,000 | | Canadian Government, 5.750%, 6/01/2033, (CAD)(b) | | | 41,075,551 |
| | 104,626,000,000 | | Indonesia Treasury Bond, Series FR43, 10.250%, 7/15/2022, (IDR) | | | 8,956,208 |
| | 10,000,000,000 | | Indonesia Treasury Bond, Series FR47, 10.000%, 2/15/2028, (IDR) | | | 808,287 |
| | 272,460,000,000 | | Indonesia Treasury Bond, Series ZCE, Zero Coupon, 11/20/2012, (IDR) | | | 17,436,024 |
| | 3,245,000(††) | | Mexican Fixed Rate Bonds, Series M-10, 8.000%, 12/17/2015, (MXN) | | | 29,009,615 |
| | 4,738,000(††) | | Mexican Fixed Rate Bonds, Series M-10, 9.000%, 12/20/2012, (MXN) | | | 44,339,171 |
| | 27,728,881(††) | | Mexican Fixed Rate Bonds, Series M-20, Series M-20, 8.000%, 12/07/2023, (MXN) | | | 243,344,289 |
| | 119,520,000 | | New South Wales Treasury Corp., Series 10RG, 7.000%, 12/01/2010, (AUD) | | | 96,660,568 |
| | 61,765,000 | | New South Wales Treasury Corp., Series 12RG, 6.000%, 5/01/2012, (AUD) | | | 48,975,367 |
| | 9,922,000 | | Republic of Brazil, 8.250%, 1/20/2034 | | | 11,236,665 |
| | 6,000,000 | | Republic of Brazil, 8.875%, 4/15/2024 | | | 7,170,000 |
| | 56,700,000 | | Republic of Brazil, 10.250%, 1/10/2028, (BRL) | | | 26,176,336 |
| | 140,235,000 | | Republic of Brazil, 12.500%, 1/05/2016, (BRL)(b) | | | 76,458,990 |
| | 107,840,000 | | Republic of Brazil, 12.500%, 1/05/2022, (BRL) | | | 58,088,181 |
| | | | | | |
| | | | | | 1,367,689,336 |
| | | | | | |
| | | Supermarkets — 0.9% | | | |
| | 19,060,000 | | Albertson’s, Inc., 7.750%, 6/15/2026 | | | 17,519,342 |
| | 72,866,000 | | Albertson’s, Inc., Senior Note, 7.450%, 8/01/2029 | | | 64,809,134 |
| | | | | | |
Principal
Amount (‡) | | Description | | Value (†) |
| | | | | | |
| | | Supermarkets — continued | | | |
| $ | 4,895,000 | | Albertson’s, Inc., Senior Note, 8.000%, 5/01/2031 | | $ | 4,536,461 |
| | 1,510,000 | | Albertson’s, Inc., Senior Note, 8.700%, 5/01/2030 | | | 1,495,617 |
| | 13,242,000 | | Albertson’s, Inc., Series C, MTN, 6.625%, 6/01/2028 | | | 10,728,615 |
| | | | | | |
| | | | | | 99,089,169 |
| | | | | | |
| | | Supranational — 2.7% | | | |
| | 175,000,000 | | Eurofima, EMTN, 11.000%, 2/05/2010, (ISK) | | | 1,657,244 |
| | 128,250,000 | | European Investment Bank, Senior Note, Zero Coupon, 3/10/2021, (AUD) | | | 47,552,011 |
| | 16,375,000 | | European Investment Bank, 11.250%, 2/14/2013, (BRL) | | | 8,594,960 |
| | 413,529,000,000 | | European Investment Bank, EMTN, 144A, Zero Coupon, 4/24/2013, (IDR) | | | 26,188,708 |
| | 134,330,000 | | European Investment Bank, EMTN, 144A, 4.600%, 1/30/2037, (CAD) | | | 114,941,293 |
| | 80,000,000 | | Inter-American Development Bank, EMTN, Zero Coupon, 5/11/2009, (BRL) | | | 37,416,575 |
| | 244,840,000,000 | | Inter-American Development Bank, Zero Coupon, 5/20/2013, (IDR) | | | 14,724,153 |
| | 24,450,000 | | Inter-American Development Bank, Series E, MTN, 6.000%, 12/15/2017, (NZD) | | | 15,810,002 |
| | 1,385,900,000 | | International Bank for Reconstruction & Development, 9.500%, 5/27/2010, (ISK) | | | 13,035,622 |
| | 62,300,000 | | Nordic Investment Bank, Series E, MTN, 11.250%, 4/16/2009, (ISK) | | | 589,568 |
| | | | | | |
| | | | | | 280,510,136 |
| | | | | | |
| | | Technology — 2.8% | | | |
| | 1,190,000 | | Affiliated Computer Services, Inc., 5.200%, 6/01/2015 | | | 960,925 |
| | 41,705,000 | | Agilent Technologies, Inc., 6.500%, 11/01/2017 | | | 38,018,987 |
| | 300,000 | | Alcatel-Lucent, EMTN, 6.375%, 4/07/2014, (EUR) | | | 339,984 |
| | 6,950,000 | | Amkor Technology, Inc., Senior Note, 7.125%, 3/15/2011 | | | 6,255,000 |
| | 10,070,000 | | Amkor Technology, Inc., 7.750%, 5/15/2013 | | | 8,609,850 |
| | 4,640,000 | | Arrow Electronics, Inc., 6.875%, 6/01/2018 | | | 4,548,295 |
| | 30,125,000 | | Avnet, Inc., 5.875%, 3/15/2014 | | | 29,328,585 |
| | 35,630,000 | | Avnet, Inc., 6.000%, 9/01/2015 | | | 34,326,441 |
| | 11,345,000 | | Avnet, Inc., 6.625%, 9/15/2016 | | | 11,048,964 |
| | 6,225,000 | | Corning, Inc., 5.900%, 3/15/2014 | | | 6,025,962 |
| | 6,220,000 | | Corning, Inc., 6.200%, 3/15/2016 | | | 6,005,535 |
| | 6,150,000 | | Corning, Inc., 6.850%, 3/01/2029(b) | | | 5,432,430 |
| | 4,725,000 | | Corning, Inc., 7.250%, 8/15/2036 | | | 4,188,566 |
| | 14,385,000 | | Equifax, Inc., 7.000%, 7/01/2037 | | | 12,132,582 |
See accompanying notes to financial statements.
43
LOOMIS SAYLES STRATEGIC INCOME FUND — PORTFOLIOOF INVESTMENTS (continued)
Investments as of September 30, 2008
| | | | | | |
Principal
Amount (‡) | | Description | | Value (†) |
| | | | | | |
| | | Technology — continued | | | |
| $ | 29,605,000 | | Freescale Semiconductor, Inc., 10.125%, 12/15/2016(b) | | $ | 18,947,200 |
| | 41,104,000 | | Lucent Technologies, Inc., 6.450%, 3/15/2029 | | | 25,073,440 |
| | 2,840,000 | | Lucent Technologies, Inc., 6.500%, 1/15/2028 | | | 1,732,400 |
| | 9,739,000 | | Motorola, Inc., 5.220%, 10/01/2097 | | | 5,439,543 |
| | 9,345,000 | | Motorola, Inc., 6.500%, 9/01/2025 | | | 7,169,148 |
| | 17,028,000 | | Motorola, Inc., 6.500%, 11/15/2028 | | | 12,724,990 |
| | 18,715,000 | | Motorola, Inc., 6.625%, 11/15/2037 | | | 13,642,206 |
| | 11,770,000 | | Nortel Networks Ltd., 6.875%, 9/01/2023 | | | 4,708,000 |
| | 25,890,000 | | Nortel Networks Ltd., 10.125%, 7/15/2013 | | | 16,504,875 |
| | 9,365,000 | | Northern Telecom Capital Corp., 7.875%, 6/15/2026 | | | 4,120,600 |
| | 300,000 | | Samsung Electronics Co. Ltd., 144A, 7.700%, 10/01/2027 | | | 317,384 |
| | 18,050,000 | | Xerox Capital Trust I, Guaranteed Note, 8.000%, 2/01/2027 | | | 16,413,425 |
| | 1,730,000 | | Xerox Corp., MTN, 7.200%, 4/01/2016(b) | | | 1,679,034 |
| | | | | | |
| | | | | | 295,694,351 |
| | | | | | |
| | | Textile — 0.0% | | | |
| | 7,515,000 | | Kellwood Co., 7.625%, 10/15/2017(e) | | | 4,133,250 |
| | | | | | |
| | | Tobacco — 0.6% | | | |
| | 52,930,000 | | Reynolds American, Inc., 6.750%, 6/15/2017 | | | 49,458,322 |
| | 13,400,000 | | Reynolds American, Inc., 7.250%, 6/15/2037 | | | 12,823,237 |
| | | | | | |
| | | | | | 62,281,559 |
| | | | | | |
| | | Transportation Services — 0.6% | | | |
| | 10,503,000 | | APL Ltd., Senior Note, 8.000%, 1/15/2024(e) | | | 7,877,250 |
| | 17,574,841 | | Atlas Air, Inc., Series 1998-1, Class 1B, 7.680%, 1/02/2014(i) | | | 17,574,841 |
| | 9,344,311 | | Atlas Air, Inc., Series 1999-1, Class A1, 7.200%, 7/02/2020 | | | 8,129,550 |
| | 320,321 | | Atlas Air, Inc., Series 1999-1, Class A2, 6.880%, 1/02/2011 | | | 288,289 |
| | 12,740,207 | | Atlas Air, Inc., Series 1999-1, Class B, 7.630%, 7/02/2016(i) | | | 12,485,403 |
| | 4,744,556 | | Atlas Air, Inc., Series 1999-1, Class C, 8.770%, 7/02/2012(i) | | | 4,364,992 |
| | 5,323,737 | | Atlas Air, Inc., Series 2000-1, Class B, 9.057%, 7/02/2017(i) | | | 5,536,686 |
| | 6,862,758 | | Atlas Air, Inc., Series C, 8.010%, 1/02/2010(i) | | | 5,352,951 |
| | | | | | |
| | | | | | 61,609,962 |
| | | | | | |
| | | Wireless — 1.8% | | | |
| | 8,524,000 | | ALLTEL Corp., 6.800%, 5/01/2029 | | | 7,735,530 |
| | | | | | |
Principal
Amount (‡) | | Description | | Value (†) |
| | | | | | |
| | | Wireless — continued | | | |
| $ | 58,210,000 | | ALLTEL Corp., Senior Note, 7.875%, 7/01/2032 | | $ | 57,773,425 |
| | 24,795,000 | | Nextel Communications, Inc., Series D, 7.375%, 8/01/2015 | | | 16,364,700 |
| | 12,171,000 | | Nextel Communications, Inc., Series E, 6.875%, 10/31/2013 | | | 8,276,280 |
| | 35,995,000 | | Nextel Communications, Inc., Series F, 5.950%, 3/15/2014 | | | 24,116,650 |
| | 2,525,000 | | Rogers Wireless, Inc., Senior Secured Note, 6.375%, 3/01/2014 | | | 2,414,864 |
| | 2,085,000 | | Rogers Wireless, Inc., 7.625%, 12/15/2011, (CAD)(b) | | | 2,080,866 |
| | 30,186,000 | | Sprint Capital Corp., 6.875%, 11/15/2028 | | | 20,224,620 |
| | 23,865,000 | | Sprint Capital Corp., 6.900%, 5/01/2019 | | | 18,495,375 |
| | 11,309,000 | | Sprint Nextel Corp., 6.000%, 12/01/2016 | | | 8,707,930 |
| | 28,355,000 | | True Move Co. Ltd., 144A, 10.750%, 12/16/2013 | | | 19,281,400 |
| | 1,605,000 | | Vodafone Group PLC, 6.150%, 2/27/2037 | | | 1,288,992 |
| | | | | | |
| | | | | | 186,760,632 |
| | | | | | |
| | | Wirelines — 5.5% | | | |
| | 10,245,000 | | AT&T Corp., 6.500%, 3/15/2029 | | | 8,576,909 |
| | 8,500,000 | | AT&T, Inc., 6.150%, 9/15/2034 | | | 7,088,660 |
| | 127,100,000 | | AT&T, Inc., 6.500%, 9/01/2037 | | | 108,121,428 |
| | 4,370,000 | | Bell Canada, 144A, 6.550%, 5/01/2029, (CAD) | | | 3,121,722 |
| | 5,925,000 | | Bell Canada, MTN, 5.000%, 2/15/2017, (CAD) | | | 4,397,277 |
| | 8,445,000 | | Bell Canada, MTN, 7.300%, 2/23/2032, (CAD) | | | 6,522,627 |
| | 33,640,000 | | Bell Canada, Series M-17, 6.100%, 3/16/2035, (CAD) | | | 23,008,590 |
| | 14,335,000 | | BellSouth Corp., 6.000%, 11/15/2034(b) | | | 11,611,350 |
| | 860,000 | | BellSouth Corp., 6.550%, 6/15/2034 | | | 737,304 |
| | 425,000 | | Cincinnati Bell, Inc., 8.375%, 1/15/2014(b) | | | 369,750 |
| | 5,330,000 | | Embarq Corp., 7.995%, 6/01/2036 | | | 3,811,536 |
| | 35,260,000 | | Frontier Communications Corp., 7.875%, 1/15/2027 | | | 26,445,000 |
| | 5,790,000 | | GTE Corp., 6.940%, 4/15/2028 | | | 4,912,890 |
| | 5,470,000 | | Hanarotelecom, Inc., 144A, 7.000%, 2/01/2012 | | | 5,251,200 |
| | 525,000 | | Hawaiian Telcom Communications, Inc., Series B, 12.500%, 5/01/2015 | | | 73,500 |
| | 1,800,000 | | Koninklijke (Royal) KPN NV, Series G, MTN, 4.000%, 6/22/2015, (EUR) | | | 2,191,236 |
| | 1,120,000 | | Koninklijke (Royal) KPN NV, Series E, MTN, 5.750%, 3/18/2016, (GBP) | | | 1,848,086 |
See accompanying notes to financial statements.
44
LOOMIS SAYLES STRATEGIC INCOME FUND — PORTFOLIOOF INVESTMENTS (continued)
Investments as of September 30, 2008
| | | | | | |
Principal
Amount (‡) | | Description | | Value (†) |
| | | | | | |
| | | Wirelines — continued | | | |
| $ | 8,098,000 | | Koninklijke (Royal) KPN NV, 8.375%, 10/01/2030 | | $ | 8,674,877 |
| | 32,435,000 | | Level 3 Financing, Inc., 8.750%, 2/15/2017(b) | | | 23,515,375 |
| | 13,010,000 | | Level 3 Financing, Inc., 9.250%, 11/01/2014 | | | 9,822,550 |
| | 3,346,000 | | New England Telephone & Telegraph Co., 7.875%, 11/15/2029 | | | 3,022,007 |
| | 32,155,000 | | Qwest Capital Funding, Inc., 7.750%, 2/15/2031 | | | 23,473,150 |
| | 16,335,000 | | Qwest Capital Funding, Inc., Guaranteed Note, 6.500%, 11/15/2018 | | | 11,883,712 |
| | 44,630,000 | | Qwest Capital Funding, Inc., Guaranteed Note, 6.875%, 7/15/2028(b) | | | 31,017,850 |
| | 10,675,000 | | Qwest Capital Funding, Inc., Guaranteed Note, 7.625%, 8/03/2021 | | | 8,113,000 |
| | 30,230,000 | | Qwest Corp., 6.875%, 9/15/2033 | | | 20,329,675 |
| | 1,290,000 | | Qwest Corp., 7.200%, 11/10/2026 | | | 948,150 |
| | 3,689,000 | | Qwest Corp., 7.250%, 9/15/2025 | | | 2,748,305 |
| | 2,598,000 | | Qwest Corp., 7.500%, 6/15/2023 | | | 2,039,430 |
| | 23,000,000 | | Telecom Italia Capital, 6.000%, 9/30/2034 | | | 16,114,260 |
| | 19,635,000 | | Telecom Italia Capital, 6.375%, 11/15/2033 | | | 14,309,988 |
| | 113,785,000 | | Telefonica Emisiones SAU, Guaranteed Note, 7.045%, 6/20/2036 | | | 102,912,843 |
| | 31,690,000 | | Telus Corp., 4.950%, 3/15/2017, (CAD) | | | 27,000,148 |
| | 51,815,000 | | Verizon Global Funding Corp., Senior Note, 5.850%, 9/15/2035 | | | 40,515,703 |
| | 6,230,000 | | Verizon Maryland, Inc., Series B, 5.125%, 6/15/2033 | | | 4,214,913 |
| | 12,050,000 | | Verizon New York, Inc., Series A, 7.375%, 4/01/2032 | | | 10,518,807 |
| | | | | | |
| | | | | | 579,263,808 |
| | | | | | |
| | | Total Non-Convertible Bonds (Identified Cost $10,926,735,122) | | | 9,148,239,400 |
| | | | | | |
| | Convertible Bonds — 4.0% |
| | | Healthcare — 0.3% | | | |
| | 26,280,000 | | Affymetrix, Inc., 3.500%, 1/15/2038 | | | 18,396,000 |
| | 12,005,000 | | Invitrogen Corp., 1.500%, 2/15/2024 | | | 10,819,506 |
| | | | | | |
| | | | | | 29,215,506 |
| | | | | | |
| | | Industrial Other — 0.3% | | | |
| | 30,860,000 | | Incyte Corp., 3.500%, 2/15/2011 | | | 28,275,475 |
| | | | | | |
| | | Media Non-Cable — 0.1% | | | |
| | 7,818,747 | | Liberty Media LLC, 3.500%, 1/15/2031 | | | 3,459,796 |
| | 7,716,000 | | Sinclair Broadcast Group, Inc., (Step to 2.000% on 1/15/2011), 4.875%, 7/15/2018(f) | | | 7,002,270 |
| | | | | | |
| | | | | | 10,462,066 |
| | | | | | |
| | | | | | |
Principal
Amount (‡) | | Description | | Value (†) |
| | | | | | |
| | | Non-Captive Consumer — 0.3% | | | |
| $ | 8,330,000 | | Countrywide Financial Corp., Zero Coupon, 4/15/2037(b)(c) | | $ | 8,163,400 |
| | 23,395,000 | | Countrywide Financial Corp., 0.554%, 5/15/2037(b)(c) | | | 21,289,450 |
| | | | | | |
| | | | | | 29,452,850 |
| | | | | | |
| | | Non-Captive Diversified — 0.2% | | | |
| | 44,035,000 | | iStar Financial, Inc., 3.291%, 10/01/2012(c) | | | 23,558,725 |
| | | | | | |
| | | Pharmaceuticals — 1.0% | | | |
| | 5,111,000 | | EPIX Pharmaceuticals, Inc., Senior Note, 3.000%, 6/15/2024 | | | 2,555,500 |
| | 36,525,000 | | Human Genome Sciences, Inc., 2.250%, 8/15/2012 | | | 24,380,438 |
| | 24,081,000 | | Nektar Therapeutics, 3.250%, 9/28/2012 | | | 12,130,804 |
| | 22,735,000 | | Valeant Pharmaceuticals International, Subordinated Note, 3.000%, 8/16/2010 | | | 21,484,575 |
| | 28,222,000 | | Valeant Pharmaceuticals International, Subordinated Note, 4.000%, 11/15/2013 | | | 26,422,847 |
| | 11,035,000 | | Vertex Pharmaceuticals, Inc., 4.750%, 2/15/2013 | | | 16,649,056 |
| | | | | | |
| | | | | | 103,623,220 |
| | | | | | |
| | | REITs — 0.2% | | | |
| | 22,413,000 | | Host Hotels & Resorts, Inc., 144A, 2.625%, 4/15/2027 | | | 17,370,075 |
| | | | | | |
| | | Technology — 0.4% | | | |
| | 12,755,000 | | Avnet, Inc., 2.000%, 3/15/2034 | | | 12,707,169 |
| | 6,670,000 | | Kulicke & Soffa Industries, Inc, 0.500%, 11/30/2008 | | | 6,453,225 |
| | 7,105,000 | | Kulicke & Soffa Industries, Inc., 0.875%, 6/01/2012 | | | 4,858,044 |
| | 3,880,000 | | Kulicke & Soffa Industries, Inc., 1.000%, 6/30/2010 | | | 3,040,950 |
| | 4,196,000 | | Maxtor Corp., Subordinated Note, 5.750%, 3/01/2012(e) | | | 3,860,320 |
| | 745,000 | | Nortel Networks Corp., 1.750%, 4/15/2012 | | | 379,950 |
| | 30,767,000 | | Nortel Networks Corp., 2.125%, 4/15/2014 | | | 14,729,701 |
| | 311,000 | | Richardson Electronics Ltd., 7.750%, 12/15/2011 | | | 233,250 |
| | | | | | |
| | | | | | 46,262,609 |
| | | | | | |
| | | Textile — 0.0% | | | |
| | 121,000 | | Dixie Group, Inc., Subordinated Note, 7.000%, 5/15/2012 | | | 107,690 |
| | | | | | |
| | | Transportation Services — 0.0% | | | |
| | 200,000 | | Builders Transport, Inc., Subordinated Note, 6.500%, 5/01/2011(g) | | | — |
| | 1,000,000 | | Builders Transport, Inc., Subordinated Note, 8.000%, 8/15/2005(g) | | | — |
| | 403,000 | | Preston Corp., Subordinated Note, 7.000%, 5/01/2011 | | | 358,670 |
| | | | | | |
| | | | | | 358,670 |
| | | | | | |
See accompanying notes to financial statements.
45
LOOMIS SAYLES STRATEGIC INCOME FUND — PORTFOLIOOF INVESTMENTS (continued)
Investments as of September 30, 2008
| | | | | | |
Principal
Amount (‡) | | Description | | Value (†) |
| | | | | | |
| | | Wireless — 0.1% | | | |
| $ | 625,000 | | Nextel Communications, Inc., Senior Note, 5.250%, 1/15/2010 | | $ | 585,937 |
| | 15,695,000 | | NII Holdings, Inc., 3.125%, 6/15/2012 | | | 11,614,300 |
| | | | | | |
| | | | | | 12,200,237 |
| | | | | | |
| | | Wirelines — 1.1% | | | |
| | 35,110,000 | | Level 3 Communications, Inc., 2.875%, 7/15/2010 | | | 27,605,237 |
| | 33,440,000 | | Level 3 Communications, Inc., 3.500%, 6/15/2012 | | | 23,617,000 |
| | 12,604,000 | | Level 3 Communications, Inc., 5.250%, 12/15/2011 | | | 10,414,055 |
| | 28,648,000 | | Level 3 Communications, Inc., 6.000%, 9/15/2009 | | | 26,929,120 |
| | 35,920,000 | | Level 3 Communications, Inc., 6.000%, 3/15/2010(b) | | | 31,430,000 |
| | | | | | |
| | | | | | 119,995,412 |
| | | | | | |
| | | Total Convertible Bonds (Identified Cost $487,679,466) | | | 420,882,535 |
| | | | | | |
| | Municipals — 0.9% | | | |
| | | Alabama — 0.0% | | | |
| | 3,270,000 | | Alabama Public School & College Authority ( Capital Improvement), 4.500%, 12/01/2026 | | | 2,851,767 |
| | | | | | |
| | | California — 0.4% | | | |
| | 3,435,000 | | San Diego Unified School District (Election 1998), Series F-1, (FSA insured), 4.500%, 7/01/2029 | | | 2,884,473 |
| | 1,530,000 | | San Jose California Redevelopment Agency Tax Allocation (Merged Area Redevelopment), Series C, (MBIA insured), 3.750%, 8/01/2028 | | | 1,125,636 |
| | 4,170,000 | | San Jose California Redevelopment Agency Tax Allocation (Merged Area), Series C, (MBIA insured), 3.750%, 8/01/2028 | | | 3,045,601 |
| | 5,175,000 | | State of California, (AMBAC insured), 4.500%, 8/01/2027 | | | 4,359,161 |
| | 14,415,000 | | State of California, 4.500%, 10/01/2029 | | | 11,959,405 |
| | 4,190,000 | | State of California, (AMBAC insured), 4.500%, 8/01/2030 | | | 3,460,814 |
| | 3,620,000 | | State of California, 4.500%, 8/01/2030 | | | 2,990,011 |
| | 2,680,000 | | State of California (Various Purpose), (MBIA insured), 3.250%, 12/01/2027 | | | 1,868,898 |
| | 12,645,000 | | State of California (Various Purpose), (AMBAC insured), 4.500%, 12/01/2033 | | | 10,157,729 |
| | 895,000 | | University of California Regents Medical Center, Series A, (MBIA insured), 4.750%, 5/15/2031 | | | 768,277 |
| | | | | | |
| | | | | | 42,620,005 |
| | | | | | |
| | | District of Columbia — 0.0% | | | |
| | 3,270,000 | | District of Columbia, Series A, (FGIC insured), 4.750%, 6/01/2036 | | | 2,673,389 |
| | | | | | |
| | | Florida — 0.1% | | | |
| | 3,270,000 | | Florida State Turnpike Authority (Department of Transportation), Series A, (MBIA insured), 3.500%, 7/01/2027 | | | 2,396,877 |
| | | | | | |
Principal
Amount (‡) | | Description | | Value (†) |
| | | | | | |
| | | Florida — continued | | | |
| $ | 5,185,000 | | Jacksonville Electric Authority, Florida Water & Sewer Systems Revenue, (MBIA insured), 4.750%, 10/01/2041 | | $ | 4,373,651 |
| | | | | | |
| | | | | | 6,770,528 |
| | | | | | |
| | | Illinois — 0.1% | | | |
| | 5,650,000 | | Chicago Board of Education, Series B, (FSA insured), 4.750%, 12/01/2031 | | | 5,008,442 |
| | 1,725,000 | | Chicago O’Hare International Airport, Series A, (FSA insured), 4.500%, 1/01/2038 | | | 1,404,685 |
| | | | | | |
| | | | | | 6,413,127 |
| | | | | | |
| | | Louisiana — 0.0% | | | |
| | 3,270,000 | | State of Louisiana, Series C, (FSA insured), 3.250%, 5/01/2026 | | | 2,333,243 |
| | | | | | |
| | | Massachusetts — 0.0% | | | |
| | 3,275,000 | | Massachusetts School Building Authority, Series A, (AMBAC insured), 4.750%, 8/15/2032 | | | 2,786,272 |
| | | | | | |
| | | Michigan — 0.1% | | | |
| | 1,975,000 | | Grosse Pointe Public School System, (FGIC insured), 3.000%, 5/01/2027 | | | 1,316,871 |
| | 13,095,000 | | Michigan Tobacco Settlement Finance Authority, Taxable Turbo Series A, 7.309%, 6/01/2034(e) | | | 11,277,414 |
| | | | | | |
| | | | | | 12,594,285 |
| | | | | | |
| | | Nebraska — 0.1% | | | |
| | 8,175,000 | | Omaha Public Power District, Series AA, (FGIC insured), 4.500%, 2/01/2034 | | | 6,657,720 |
| | | | | | |
| | | Texas — 0.1% | | | |
| | 9,320,000 | | County of Harris TX, Series B, 4.500%, 10/01/2031 | | | 8,025,918 |
| | | | | | |
| | | Wisconsin — 0.0% | | | |
| | 2,235,000 | | Green Bay Wisconsin Water System Revenue (FSA insured), 3.500%, 11/01/2026 | | | 1,673,591 |
| | 2,410,000 | | Green Bay Wisconsin Water System Revenue (FSA insured), 3.500%, 11/01/2029 | | | 1,735,706 |
| | 835,000 | | Wisconsin Housing & Economic Development Authority, Series E, 4.900%, 11/01/2035 | | | 731,560 |
| | | | | | |
| | | | | | 4,140,857 |
| | | | | | |
| | | Total Municipals (Identified Cost $107,486,155) | | | 97,867,111 |
| | | | | | |
| | | Total Bonds and Notes (Identified Cost $11,521,900,743) | | | 9,666,989,046 |
| | | | | | |
| | Bank Loans — 1.0% |
| | | Automotive — 0.5% | | | |
| | 115,596,181 | | Chrysler LLC, First Lien Term Loan, 6.490%, 8/03/2013(h) | | | 47,587,480 |
| | | | | | |
| | | Consumer Products — 0.0% | | | |
| | 5,984,576 | | Mega Bloks, Inc., Term Loan B, 8.750%, 7/26/2012(h) | | | 4,667,969 |
| | | | | | |
| | | Food & Beverage — 0.0% | | | |
| | 361,942 | | Dole Food Co., Inc., LOC, 4.788%, 4/12/2013(h) | | | 317,423 |
| | 534,224 | | Dole Food Co., Inc., Term Loan, 4.738%, 4/12/2013(h) | | | 468,514 |
| | 2,603,044 | | Dole Food Co., Inc., Tranche C Term Loan, 4.795%, 4/12/2013(h) | | | 2,282,869 |
| | | | | | |
| | | | | | 3,068,806 |
| | | | | | |
See accompanying notes to financial statements.
46
LOOMIS SAYLES STRATEGIC INCOME FUND — PORTFOLIOOF INVESTMENTS (continued)
Investments as of September 30, 2008
| | | | | | |
Principal
Amount (‡) | | Description | | Value (†) |
| | | | | | |
| | | Media Non-Cable — 0.2% | | | |
| $ | 31,106,781 | | Idearc, Inc., Term Loan B, 5.767%, 11/17/2014(h) | | $ | 18,547,418 |
| | 2,797,946 | | Tribune Co., Tranche X, 5.541%, 6/04/2009(h) | | | 2,591,597 |
| | | | | | |
| | | | | | 21,139,015 |
| | | | | | |
| | | Oil Field Services — 0.0% | | | |
| | 2,485,000 | | Dresser, Inc., Second Lien Term Loan, 8.557%, 5/04/2015(h) | | | 2,137,100 |
| | 1,230,373 | | Dresser, Inc., Term Loan B, 5.096%, 5/04/2014(h) | | | 1,110,412 |
| | | | | | |
| | | | | | 3,247,512 |
| | | | | | |
| | | Paper — 0.1% | | | |
| | 5,952,944 | | Georgia-Pacific Corp., First Lien Term Loan, 4.689%, 12/20/2012(h) | | | 5,191,801 |
| | 1,970,633 | | Georgia-Pacific Corp., Term Loan B2, 4.299%, 12/20/2012(h) | | | 1,793,552 |
| | | | | | |
| | | | | | 6,985,353 |
| | | | | | |
| | | Technology — 0.1% | | | |
| | 11,537,374 | | Nuance Communications, Inc., Incremental Term Loan, 5.960%, 3/31/2013(h) | | | 10,037,516 |
| | | | | | |
| | | Wirelines — 0.1% | | | |
| | 16,722,131 | | Hawaiian Telcom Communications, Inc., Term Loan C, 6.262%, 6/01/2014(h) | | | 11,502,485 |
| | | | | | |
| | | Total Bank Loans (Identified Cost $149,080,815) | | | 108,236,136 |
| | | | | | |
| | | | | | |
| Shares | | | | |
| | Common Stocks — 3.3% |
| | | Biotechnology — 0.1% | | | |
| | 359,449 | | Vertex Pharmaceuticals, Inc.(i) | | | 11,948,085 |
| | | | | | |
| | | Communications Equipment — 0.0% | | | |
| | 41,343 | | Corning, Inc. | | | 646,605 |
| | | | | | |
| | | Containers & Packaging — 0.1% | | | |
| | 460,656 | | Owens-Illinois, Inc.(i) | | | 13,543,286 |
| | | | | | |
| | | Electric Utilities — 0.1% | | | |
| | 282,500 | | Duke Energy Corp.(b) | | | 4,923,975 |
| | | | | | |
| | | Food Products — 0.4% | | | |
| | 2,309,175 | | ConAgra Foods, Inc.(b) | | | 44,936,545 |
| | | | | | |
| | | Household Durables — 0.2% | | | |
| | 477,725 | | KB Home(b) | | | 9,401,628 |
| | 549,450 | | Lennar Corp., Class A(b) | | | 8,346,145 |
| | | | | | |
| | | | | | 17,747,773 |
| | | | | | |
| | | Oil, Gas & Consumable Fuels — 0.3% | | | |
| | 846,398 | | Chesapeake Energy Corp.(b) | | | 30,351,832 |
| | 141,249 | | Spectra Energy Corp. | | | 3,361,726 |
| | | | | | |
| | | | | | 33,713,558 |
| | | | | | |
| | | Pharmaceuticals — 1.4% | | | |
| | 7,238,800 | | Bristol-Myers Squibb Co.(b) | | | 150,928,980 |
| | 2,288 | | Teva Pharmaceutical Industries Ltd., Sponsored ADR | | | 104,768 |
| | | | | | |
| | | | | | 151,033,748 |
| | | | | | |
| | | REITs — 0.6% | | | |
| | 223,187 | | Apartment Investment & Management Co., Class A(b) | | | 7,816,009 |
| | 889,730 | | Associated Estates Realty Corp.(b) | | | 11,593,182 |
| | 182,500 | | Developers Diversified Realty Corp.(b) | | | 5,783,425 |
| | | | | |
Shares | | Description | | Value (†) |
| | | | | |
| | REITs — continued | | | |
| 460,000 | | Equity Residential(b) | | $ | 20,428,600 |
| 117,700 | | Simon Property Group, Inc.(b) | | | 11,416,900 |
| | | | | |
| | | | | 57,038,116 |
| | | | | |
| | Thrifts & Mortgage Finance — 0.1% | | | |
| 4,794,025 | | Federal Home Loan Mortgage Corp.(b)(i)(j) | | | 8,197,783 |
| | | | | |
| | Total Common Stocks (Identified Cost $433,474,956) | | | 343,729,474 |
| | | | | |
| Preferred Stocks — 1.2% | | | |
| | Automotive — 0.2% | | | |
| 1,458,359 | | Ford Motor Co. Capital Trust II Convertible, 6.500%(b) | | | 22,458,729 |
| 79,502 | | General Motors Corp., Convertible, 6.250% | | | 636,016 |
| | | | | |
| | | | | 23,094,745 |
| | | | | |
| | Banking — 0.1% | | | |
| 11,795 | | Bank of America Corp. Convertible, 7.250% | | | 9,884,210 |
| | | | | |
| | Capital Markets — 0.0% | | | |
| 73,204 | | Lehman Brothers Holdings, Inc., 5.670%(d) | | | 5,124 |
| 77,610 | | Lehman Brothers Holdings, Inc., 5.940%(d) | | | 2,716 |
| 39,450 | | Lehman Brothers Holdings, Inc., 6.000%(d) | | | 6,312 |
| 340,116 | | Lehman Brothers Holdings, Inc., 6.500%(d) | | | 17,006 |
| 28,950 | | Lehman Brothers Holdings, Inc., 7.250%(d)(i) | | | 28,950 |
| 357,592 | | Lehman Brothers Holdings, Inc., 7.950%(b)(d) | | | 21,456 |
| 35,000 | | Merrill Lynch & Co., Inc., 6.375% | | | 479,150 |
| 81,975 | | Newell Financial Trust I Convertible, 5.250% | | | 3,161,161 |
| | | | | |
| | | | | 3,721,875 |
| | | | | |
| | Commercial Banks — 0.0% | | | |
| 5,933 | | Wachovia Corp., Convertible, 7.500% | | | 2,284,205 |
| | | | | |
| | Diversified Consumer Services — 0.0% | | | |
| 332,275 | | Six Flags, Inc., 7.250% | | | 1,857,417 |
| | | | | |
| | Diversified Financial Services — 0.1% | | | |
| 552,770 | | CIT Group, Inc., 6.350% | | | 4,283,967 |
| 5,000 | | CIT Group, Inc. Convertible, 8.750% | | | 164,650 |
| 129,508 | | Sovereign Capital Trust IV, Convertible, 4.375% | | | 2,972,209 |
| | | | | |
| | | | | 7,420,826 |
| | | | | |
| | Electric Utilities — 0.2% | | | |
| 370,577 | | AES Trust III Convertible, 6.750%(b) | | | 14,211,628 |
| 107,725 | | CMS Energy Trust I Convertible, 7.750% | | | 4,309,000 |
| 393 | | Entergy New Orleans, Inc., 4.750% | | | 29,991 |
| | | | | |
| | | | | 18,550,619 |
| | | | | |
See accompanying notes to financial statements.
47
LOOMIS SAYLES STRATEGIC INCOME FUND — PORTFOLIOOF INVESTMENTS (continued)
Investments as of September 30, 2008
| | | | | |
Shares | | Description | | Value (†) |
| | | | | |
| | Machinery — 0.0% | | | |
| 171,240 | | United Rentals Trust I Convertible, 6.500% | | $ | 3,767,280 |
| | | | | |
| | Oil, Gas & Consumable Fuels — 0.1% | | | |
| 52,020 | | Chesapeake Energy Corp. Convertible, 4.500%(b) | | | 5,175,990 |
| 158,777 | | El Paso Energy Capital Trust I, Convertible, 4.750% | | | 5,289,259 |
| | | | | |
| | | | | 10,465,249 |
| | | | | |
| | REITs — 0.0% | | | |
| 42,700 | | FelCor Lodging Trust, Inc., Convertible, 7.800% | | | 523,075 |
| | | | | |
| | Semiconductors & Semiconductor Equipment — 0.2% |
| 32,320 | | Lucent Technologies Capital Trust I Convertible, 7.750% | | | 15,017,488 |
| | | | | |
| | Thrifts & Mortgage Finance — 0.3% | | | |
| 389,800 | | Countrywide Capital IV, 6.750% | | | 3,469,220 |
| 75,100 | | Federal Home Loan Mortgage Corp., 5.000%(i)(j) | | | 135,180 |
| 1,741,500 | | Federal Home Loan Mortgage Corp., 5.570%(i)(j) | | | 1,724,085 |
| 444,350 | | Federal Home Loan Mortgage Corp., 5.660%(i)(j) | | | 555,437 |
| 120,695 | | Federal Home Loan Mortgage Corp., 5.700%(i)(j) | | | 225,700 |
| 283,000 | | Federal Home Loan Mortgage Corp., 5.790%(i)(j) | | | 566,000 |
| 81,450 | | Federal Home Loan Mortgage Corp., 5.810%(i)(j) | | | 142,538 |
| 219,750 | | Federal Home Loan Mortgage Corp., 5.900%(i)(j) | | | 274,687 |
| 96,600 | | Federal Home Loan Mortgage Corp., 6.000%(i)(j) | | | 173,880 |
| 89,300 | | Federal Home Loan Mortgage Corp., 6.420%(i)(j) | | | 160,740 |
| 392,116 | | Federal Home Loan Mortgage Corp., 6.550%(i)(j) | | | 423,485 |
| 3,856,103 | | Federal Home Loan Mortgage Corp., 8.375%(b)(i)(j) | | | 6,285,448 |
| 192,100 | | Federal National Mortgage Association, 4.750%(j) | | | 595,510 |
| 144,900 | | Federal National Mortgage Association, 5.125%(j) | | | 507,150 |
| 104,850 | | Federal National Mortgage Association, 5.375%(j) | | | 346,005 |
| 56,600 | | Federal National Mortgage Association, 5.810%(j) | | | 203,760 |
| 87,300 | | Federal National Mortgage Association, 6.750%(j) | | | 157,140 |
| 6,672,525 | | Federal National Mortgage Association, 8.250%(b)(j) | | | 14,546,104 |
| | | | | |
| | | | | 30,492,069 |
| | | | | |
| | Total Preferred Stocks (Identified Cost $490,665,546) | | | 127,079,058 |
| | | | | |
| Closed-End Investment Companies — 0.3% |
| 199,046 | | BlackRock Senior High Income Fund, Inc. | | | 652,871 |
| 1,033,275 | | Dreyfus High Yield Strategies | | | 3,079,160 |
| | | | | | | |
Shares | | Description | | Value (†) | |
| | | | | | | |
| | 177,910 | | DWS High Income Trust | | $ | 590,661 | |
| | 860,000 | | Highland Credit Strategies Fund(b) | | | 8,221,600 | |
| | 110,211 | | Morgan Stanley Emerging Markets Debt Fund, Inc. | | | 796,826 | |
| | 141,612 | | Van Kampen High Income Trust II | | | 324,291 | |
| | 2,055,800 | | Western Asset High Income Opportunity Fund, Inc. | | | 8,922,172 | |
| | 1,368,400 | | Western Asset Managed High Income Fund, Inc.(b) | | | 6,116,748 | |
| | | | | | | |
| | | Total Closed-End Investment Companies (Identified Cost $41,292,759) | | | 28,704,329 | |
| | | | | | | |
Shares/ Principal Amount (‡) | | | | | |
| | Short-Term Investments — 3.5% | |
| | 344,413,663 | | State Street Navigator Securities Lending Prime Portfolio(k) | | | 344,413,663 | |
| $ | 18,259,610 | | Repurchase Agreement with State Street Corp., dated 9/30/2008 at 1.300% to be repurchased at $18,260,269 on 10/01/2008, collateralized by $17,905,000 Federal National Mortgage Association, 4.850% due 12/3/2012 valued at $18,259,958 including accrued interest (Note 2g of Notes to Financial Statements) | | | 18,259,610 | |
| | 4,215,796 | | Tri-Party Repurchase Agreement with Fixed Income Clearing Corporation, dated 9/30/2008 at 1.300% to be repurchased at $4,215,948 on 10/01/2008, collateralized by $4,320,000 Federal Home Loan Bank Discount Notes, Zero Coupon due 11/21/2008 valued at $4,303,800 including accrued interest (Note 2g of Notes to Financial Statements) | | | 4,215,796 | |
| | | | | | | |
| | | Total Short-Term Investments (Identified Cost $366,889,069) | | | 366,889,069 | |
| | | | | | | |
| | | | | | | |
| | | Total Investments — 101.5% (Identified Cost $13,003,303,888)(a) | | | 10,641,627,112 | |
| | | Other assets less liabilities — (1.5)% | | | (161,547,934 | ) |
| | | | | | | |
| | | Net Assets — 100% | | $ | 10,480,079,178 | |
| | | | | | | |
| | | | | | | |
| | (‡) | | Principal amount is in U.S. dollars unless otherwise noted. | |
| | (†) | | See Note 2a of Notes to Financial Statements. | |
| | (††) | | Amount shown represents units, One unit represents a principal amount of 100. | |
| | (†††) | | Amount shown represents units. One unit represents a principal amount of 25. | |
| | (a) | | Federal Tax Information: | |
| | | At September 30, 2008, the net unrealized depreciation on investments based on a cost of $13,007,160,073 for federal income tax purposes was as follows: | |
| | | Aggregate gross unrealized appreciation for all investments in which there is an excess of value over tax cost | | $ | 169,608,961 | |
| | | Aggregate gross unrealized depreciation for all investments in which there is an excess of tax cost over value | | | (2,535,141,922 | ) |
| | | | | | | |
| | | Net unrealized depreciation | | $ | (2,365,532,961 | ) |
| | | | | | | |
| | | | | | | |
| | (b) | | All or a portion of this security was on loan to brokers at September 30, 2008. | |
| | (c) | | Variable rate security. Rate as of September 30, 2008 is disclosed. | |
| | (d) | | Issuer has filed for bankruptcy. | |
| | (e) | | Illiquid security. At September 30, 2008, the value of these securities amounted to $235,523,116 or 2.2% of net assets. | |
| | (f) | | Step Bond: Coupon rate is a fixed rate for an initial period then resets at a specified date and rate. | |
| | (g) | | Bankrupt issuer. Security remains in the Portfolio of Investments pending final resolution of bankruptcy proceedings. | |
| | (h) | | Variable rate security. Rate shown represents the weighted average rate at September 30, 2008. | |
| | (i) | | Non-income producing security. | |
See accompanying notes to financial statements.
48
LOOMIS SAYLES STRATEGIC INCOME FUND — PORTFOLIOOF INVESTMENTS (continued)
Investments as of September 30, 2008
| | | | |
| | | | |
| (j) | | Future dividend payments have been eliminated as the issuer has been placed in conservatorship. |
| (k) | | Represents investment of securities lending collateral. |
| | | | |
| 144A | | Securities exempt from registration under Rule 144A of the Securities Act of 1933. These securities may be resold in transactions exempt from registration, normally to qualified institutional buyers. At September 30, 2008, the value of these securities amounted to $962,061,577 or 9.2% of net assets. |
| | | | |
| ADR | | An American Depositary Receipt is a certificate issued by a custodian bank representing the right to receive securities of the foreign issuer described. The values of ADRs are significantly influenced by trading on exchanges not located in the United States. |
| | | | |
| AMBAC | | American Municipal Bond Assurance Corp. |
| EMTN | | Euro Medium Term Note |
| FGIC | | Financial Guaranty Insurance Company |
| FSA | | Financial Security Assurance, Inc. |
| GMTN | | Global Medium Term Note |
| LOC | | Letter of Credit |
| MBIA | | Municipal Bond Investors Assurance Corp. |
| MTN | | Medium Term Note |
| REITs | | Real Estate Investment Trusts |
| | | | |
| AUD | | Australian Dollar | | |
| BRL | | Brazilian Real | | |
| CAD | | Canadian Dollar | | |
| EUR | | Euro | | |
| GBP | | British Pound | | |
| IDR | | Indonesian Rupiah | | |
| ISK | | Icelandic Krona | | |
| KRW | | South Korean Won | | |
| MXN | | Mexican Peso | | |
| NZD | | New Zealand Dollar | | |
| SGD | | Singapore Dollar | | |
| THB | | Thai Baht | | |
Net Assets Summary at September 30, 2008 (Unaudited)
| | | |
| Sovereigns | | 13.0 | % |
| Non-Captive Diversified | | 7.9 | |
| Wirelines | | 6.7 | |
| Healthcare | | 5.2 | |
| Banking | | 5.1 | |
| Electric | | 4.7 | |
| Pharmaceuticals | | 4.6 | |
| Retailers | | 3.9 | |
| Non-Captive Consumer | | 3.7 | |
| Technology | | 3.3 | |
| Paper | | 2.8 | |
| Supranational | | 2.7 | |
| Automotive | | 2.6 | |
| Media Cable | | 2.5 | |
| Pipelines | | 2.2 | |
| Other Investments, less than 2% each | | 27.1 | |
| Short-Term Investments | | 3.5 | |
| | | |
| Total Investments | | 101.5 | |
| Other assets less liabilities | | (1.5 | ) |
| | | |
| Net Assets | | 100.0 | % |
| | | |
Currency Exposure at September 30, 2008 as a Percentage of Net Assets (Unaudited)
| | | |
| United States Dollar | | 74.1 | % |
| Canadian Dollar | | 9.6 | |
| Mexican Peso | | 3.0 | |
| Brazilian Real | | 2.6 | |
| New Zealand Dollar | | 2.5 | |
| Australian Dollar | | 2.4 | |
| Other, less than 2% each | | 7.3 | |
| | | |
| Total Investments | | 101.5 | |
| Other assets less liabilities | | (1.5 | ) |
| | | |
| Net Assets | | 100.0 | % |
| | | |
See accompanying notes to financial statements.
49
This Page Intentionally Left Blank
50
STATEMENTSOF ASSETSAND LIABILITIES
September 30, 2008
| | | | | | | | | | | | |
| | | Core Plus Bond Fund | | | High Income Fund | | | International
Bond Fund | |
| | | | | | | | | | | | |
ASSETS | | | | | | | | | | | | |
Investments at cost | | $ | 193,413,398 | | | $ | 59,854,321 | | | $ | 13,244,011 | |
Repurchase agreement(s) at cost | | | 8,429,740 | | | | 6,917,645 | | | | 208,000 | |
Net unrealized depreciation | | | (14,680,084 | ) | | | (9,233,388 | ) | | | (1,005,664 | ) |
| | | | | | | | | | | | |
Investments at value(a) | | | 187,163,054 | | | | 57,538,578 | | | | 12,446,347 | |
Cash | | | — | | | | — | | | | 651 | |
Foreign currency at value (identified cost $0, $16,194, $187,488, $0 and $8,244,915) | | | — | | | | 15,785 | | | | 184,387 | |
Due from custodian | | | — | | | | — | | | | — | |
Receivable for Fund shares sold | | | 774,250 | | | | 228,164 | | | | — | |
Receivable for securities sold | | | — | | | | 157,361 | | | | 96,092 | |
Receivable from investment advisor (Note 4) | | | — | | | | — | | | | 28,399 | |
Dividends and interest receivable | | | 2,079,854 | | | | 1,025,438 | | | | 181,785 | |
Unrealized appreciation on forward foreign currency contracts (Note 2) | | | — | | | | 1,714 | | | | 5,003 | |
Tax reclaims receivable | | | — | | | | — | | | | 22 | |
Securities lending income receivable | | | 13,607 | | | | 3,333 | | | | 74 | |
Other assets | | | — | | | | 13,297 | | | | — | |
| | | | | | | | | | | | |
TOTAL ASSETS | | | 190,030,765 | | | | 58,983,670 | | | | 12,942,760 | |
| | | | | | | | | | | | |
LIABILITIES | | | | | | | | | | | | |
Due to custodian | | | — | | | | 12,441 | | | | — | |
Collateral on securities loaned, at value (Note 2) | | | 10,994,292 | | | | 3,523,267 | | | | — | |
Payable for securities purchased | | | 4,104,517 | | | | 257,274 | | | | 214,367 | |
Payable for Fund shares redeemed | | | 1,040,432 | | | | 372,291 | | | | — | |
Unrealized depreciation on forward foreign currency contracts (Note 2) | | | — | | | | 79 | | | | 36,995 | |
Dividends payable | | | — | | | | — | | | | — | |
Management fees payable (Note 4) | | | 58,108 | | | | 44,332 | | | | 6,415 | |
Deferred Trustees’ fees (Note 4) | | | 243,759 | | | | 77,655 | | | | 7,384 | |
Administrative fees payable (Note 4) | | | 8,010 | | | | 2,668 | | | | 8,197 | |
Deferred foreign taxes payable | | | — | | | | — | | | | — | |
Other accounts payable and accrued expenses | | | 123,561 | | | | 72,543 | | | | 52,055 | |
| | | | | | | | | | | | |
TOTAL LIABILITIES | | | 16,572,679 | | | | 4,362,550 | | | | 325,413 | |
| | | | | | | | | | | | |
NET ASSETS | | $ | 173,458,086 | | | $ | 54,621,120 | | | $ | 12,617,347 | |
| | | | | | | | | | | | |
NET ASSETS CONSIST OF: | | | | | | | | | | | | |
Paid-in capital | | $ | 207,800,671 | | | $ | 134,116,688 | | | $ | 13,777,210 | |
Accumulated net investment income (loss) | | | 371,177 | | | | (14,090 | ) | | | (22,126 | ) |
Accumulated net realized gain (loss) on investments and foreign currency transactions | | | (20,033,749 | ) | | | (70,243,378 | ) | | | (85,005 | ) |
Net unrealized depreciation on investments and foreign currency translations | | | (14,680,013 | ) | | | (9,238,100 | ) | | | (1,052,732 | ) |
| | | | | | | | | | | | |
NET ASSETS | | $ | 173,458,086 | | | $ | 54,621,120 | | | $ | 12,617,347 | |
| | | | | | | | | | | | |
COMPUTATION OF NET ASSET VALUE AND OFFERING PRICE: | | | | | | | | | | | | |
Class A shares: | | | | | | | | | | | | |
Net assets | | $ | 115,872,889 | | | $ | 38,576,898 | | | $ | 1,953,302 | |
| | | | | | | | | | | | |
Shares of beneficial interest | | | 10,989,037 | | | | 9,095,405 | | | | 212,471 | |
| | | | | | | | | | | | |
Net asset value and redemption price per share | | $ | 10.54 | | | $ | 4.24 | | | $ | 9.19 | |
| | | | | | | | | | | | |
Offering price per share (100/[100-maximum sales charge] of net asset value) (Note 1) | | $ | 11.04 | | | $ | 4.44 | | | $ | 9.62 | |
| | | | | | | | | | | | |
Class B shares: (redemption price per share is equal to net asset value less any applicable contingent deferred sales charge) (Note 1) | | | | | | | | | | | | |
Net assets | | $ | 10,480,580 | | | $ | 2,266,793 | | | $ | — | |
| | | | | | | | | | | | |
Shares of beneficial interest | | | 991,297 | | | | 533,572 | | | | — | |
| | | | | | | | | | | | |
Net asset value and offering price per share | | $ | 10.57 | | | $ | 4.25 | | | $ | — | |
| | | | | | | | | | | | |
Class C shares: (redemption price per share is equal to net asset value less any applicable contingent deferred sales charge) (Note 1) | | | | | | | | | | | | |
Net assets | | $ | 26,698,090 | | | $ | 9,944,817 | | | $ | 683,049 | |
| | | | | | | | | | | | |
Shares of beneficial interest | | | 2,529,794 | | | | 2,343,061 | | | | 74,432 | |
| | | | | | | | | | | | |
Net asset value and offering price per share | | $ | 10.55 | | | $ | 4.24 | | | $ | 9.18 | |
| | | | | | | | | | | | |
Class Y shares: | | | | | | | | | | | | |
Net assets | | $ | 20,406,527 | | | $ | 3,832,612 | | | $ | 9,980,996 | |
| | | | | | | | | | | | |
Shares of beneficial interest | | | 1,925,979 | | | | 904,136 | | | | 1,087,530 | |
| | | | | | | | | | | | |
Net asset value, offering and redemption price per share | | $ | 10.60 | | | $ | 4.24 | | | $ | 9.18 | |
| | | | | | | | | | | | |
(a) Including securities on loan with market values of: | | $ | 10,552,377 | | | $ | 3,411,036 | | | $ | — | |
| | | | | | | | | | | | |
See accompanying notes to financial statements.
51
| | | | | | |
Limited Term Government
and Agency Fund | | | Strategic
Income Fund | |
| | | | | | |
| | | | | | |
| $ | 134,931,690 | | | $ | 12,980,828,482 | |
| | 10,608,327 | | | | 22,475,406 | |
| | (1,345,936 | ) | | | (2,361,676,776 | ) |
| | | | | | | |
| | 144,194,081 | | | | 10,641,627,112 | |
| | — | | | | 681,908 | |
| | — | | | | 8,181,252 | |
| | 4,528,528 | | | | — | |
| | 1,927,513 | | | | 36,105,148 | |
| | 7 | | | | 11,413,723 | |
| | 16,841 | | | | — | |
| | 734,135 | | | | 208,469,143 | |
| | — | | | | — | |
| | — | | | | 51,813 | |
| | 4,554 | | | | 296,774 | |
| | — | | | | — | |
| | | | | | | |
| | 151,405,659 | | | | 10,906,826,873 | |
| | | | | | | |
| | | | | | |
| | — | | | | — | |
| | 1,085,429 | | | | 344,413,663 | |
| | 10,612,635 | | | | 827,516 | |
| | 356,994 | | | | 72,579,119 | |
| | — | | | | — | |
| | 124,932 | | | | 541 | |
| | 42,046 | | | | 5,358,802 | |
| | 214,131 | | | | 435,142 | |
| | 5,314 | | | | 507,482 | |
| | — | | | | 9,517 | |
| | 96,895 | | | | 2,615,913 | |
| | | | | | | |
| | 12,538,376 | | | | 426,747,695 | |
| | | | | | | |
| $ | 138,867,283 | | | $ | 10,480,079,178 | |
| | | | | | | |
| | | | | | |
| $ | 153,210,988 | | | $ | 12,690,707,333 | |
| | (287,351 | ) | | | 97,385,788 | |
| | (12,710,418 | ) | | | 60,536,039 | |
| | (1,345,936 | ) | | | (2,368,549,982 | ) |
| | | | | | | |
| $ | 138,867,283 | | | $ | 10,480,079,178 | |
| | | | | | | |
| | | | | | |
| | | | | | |
| $ | 105,047,404 | | | $ | 5,551,066,145 | |
| | | | | | | |
| | 9,568,271 | | | | 458,811,440 | |
| | | | | | | |
| $ | 10.98 | | | $ | 12.10 | |
| | | | | | | |
| $ | 11.32 | | | $ | 12.67 | |
| | | | | | | |
| | | | | | |
| | | | | | |
| $ | 4,532,045 | | | $ | 161,751,069 | |
| | | | | | | |
| | 413,253 | | | | 13,301,916 | |
| | | | | | | |
| $ | 10.97 | | | $ | 12.16 | |
| | | | | | | |
| | | | | | |
| | | | | | |
| $ | 22,710,842 | | | $ | 3,984,203,644 | |
| | | | | | | |
| | 2,067,156 | | | | 327,825,681 | |
| | | | | | | |
| $ | 10.99 | | | $ | 12.15 | |
| | | | | | | |
| | | | | | |
| $ | 6,576,992 | | | $ | 783,058,320 | |
| | | | | | | |
| | 597,264 | | | | 64,759,861 | |
| | | | | | | |
| $ | 11.01 | | | $ | 12.09 | |
| | | | | | | |
| $ | 1,054,679 | | | $ | 334,019,744 | |
| | | | | | | |
52
STATEMENTSOF OPERATIONS
For the Year Ended September 30, 2008
| | | | | | | | | | | | |
| | | Core Plus Bond Fund | | | High Income Fund | | | International
Bond Fund (a) | |
| | | | | | | | | | | | |
INVESTMENT INCOME | | | | | | | | | | | | |
Dividends | | $ | 110,172 | | | $ | 111,528 | | | $ | — | |
Interest | | | 9,330,051 | | | | 3,601,097 | | | | 283,026 | |
Securities lending income (Note 2) | | | 216,727 | | | | 42,292 | | | | 481 | |
Less net foreign taxes withheld | | | — | | | | (508 | ) | | | — | |
| | | | | | | | | | | | |
| | | 9,656,950 | | | | 3,754,409 | | | | 283,507 | |
| | | | | | | | | | | | |
Expenses | | | | | | | | | | | | |
Management fees (Note 4) | | | 751,064 | | | | 275,813 | | | | 47,119 | |
Service fees - Class A (Note 4) | | | 286,509 | | | | 87,807 | | | | 1,596 | |
Service and distribution fees - Class B (Note 4) | | | 172,317 | | | | 32,609 | | | | — | |
Service and distribution fees - Class C (Note 4) | | | 168,355 | | | | 70,988 | | | | 2,445 | |
Trustees’ fees and expenses (Note 4) | | | 6,753 | | | | 11,229 | | | | 8,513 | |
Administrative fees (Note 4) | | | 85,963 | | | | 23,606 | | | | 55,898 | |
Custodian fees and expenses | | | 24,613 | | | | 21,776 | | | | 20,340 | |
Transfer agent fees and expenses - Class A (Note 4) | | | 184,001 | | | | 45,581 | | | | 617 | |
Transfer agent fees and expenses - Class B (Note 4) | | | 30,318 | | | | 4,596 | | | | — | |
Transfer agent fees and expenses - Class C (Note 4) | | | 26,909 | | | | 8,502 | | | | 192 | |
Transfer agent fees and expenses - Class Y (Note 4) | | | 22,003 | | | | 40 | | | | 353 | |
Audit and tax services fees | | | 47,662 | | | | 48,669 | | | | 41,057 | |
Legal fees | | | 4,453 | | | | 2,477 | | | | 196 | |
Shareholder reporting expenses | | | 53,060 | | | | 10,561 | | | | 1,584 | |
Registration fees | | | 64,225 | | | | 67,761 | | | | 19,062 | |
Miscellaneous expenses | | | 9,112 | | | | 8,040 | | | | 1,760 | |
| | | | | | | | | | | | |
Total expenses | | | 1,937,317 | | | | 720,055 | | | | 200,732 | |
Less fee reduction and/or expense reimbursement (Note 4) | | | (169,762 | ) | | | (114,938 | ) | | | (129,938 | ) |
| | | | | | | | | | | | |
Net expenses | | | 1,767,555 | | | | 605,117 | | | | 70,794 | |
| | | | | | | | | | | | |
Net investment income | | | 7,889,395 | | | | 3,149,292 | | | | 212,713 | |
| | | | | | | | | | | | |
NET REALIZED AND UNREALIZED GAIN (LOSS) ON INVESTMENTS
AND FOREIGN CURRENCY TRANSACTIONS | | | | | | | | | | | | |
Net realized gain (loss) on: | | | | | | | | | | | | |
Investments | | | 1,978,022 | | | | 532,025 | | | | (3,960 | ) |
Foreign currency transactions | | | 8,829 | | | | 23,220 | | | | (72,449 | ) |
Net change in unrealized appreciation (depreciation) on: | | | | | | | | | | | | |
Investments (including change in foreign capital gains tax accrual of $(9,517) for Strategic Income Fund) | | | (13,461,243 | ) | | | (10,375,382 | ) | | | (1,005,664 | ) |
Foreign currency translations | | | (8,003 | ) | | | (6,251 | ) | | | (47,068 | ) |
| | | | | | | | | | | | |
Net realized and unrealized gain (loss) on investments and foreign currency transactions | | | (11,482,395 | ) | | | (9,826,388 | ) | | | (1,129,141 | ) |
| | | | | | | | | | | | |
NET INCREASE (DECREASE) IN NET ASSETS RESULTING FROM OPERATIONS | | $ | (3,593,000 | ) | | $ | (6,677,096 | ) | | $ | (916,428 | ) |
| | | | | | | | | | | | |
| (a) | From commencement of operations on February 1, 2008 through September 30, 2008. |
See accompanying notes to financial statements.
53
| | | | | | |
Limited Term Government
and Agency Fund | | | Strategic
Income Fund | |
| | | | | | |
| | | | | | |
| $ | — | | | $ | 40,775,309 | |
| | 5,864,507 | | | | 855,653,561 | |
| | 73,330 | | | | 7,193,368 | |
| | — | | | | (601,699 | ) |
| | | | | | | |
| | 5,937,837 | | | | 903,020,539 | |
| | | | | | | |
| | | | | | |
| | 598,625 | | | | 66,716,160 | |
| | 253,877 | | | | 16,174,107 | |
| | 56,200 | | | | 2,096,544 | |
| | 73,146 | | | | 44,085,494 | |
| | 6,832 | | | | 174,974 | |
| | 61,737 | | | | 6,138,937 | |
| | 22,970 | | | | 635,535 | |
| | 126,964 | | | | 5,701,372 | |
| | 7,027 | | | | 186,124 | |
| | 9,139 | | | | 3,880,942 | |
| | 1,271 | | | | 710,244 | |
| | 46,237 | | | | 52,219 | |
| | 3,340 | | | | 336,368 | |
| | 23,472 | | | | 1,437,720 | |
| | 66,279 | | | | 354,191 | |
| | 6,911 | | | | 282,589 | |
| | | | | | | |
| | 1,364,027 | | | | 148,963,520 | |
| | (181,890 | ) | | | (235,580 | ) |
| | | | | | | |
| | 1,182,137 | | | | 148,727,940 | |
| | | | | | | |
| | 4,755,700 | | | | 754,292,599 | |
| | | | | | | |
| |
| | | | | | |
| | | | | | |
| | 498,940 | | | | 181,343,106 | |
| | — | | | | 2,347,155 | |
| | | | | | |
| | (407,128 | ) | | | (2,808,355,364 | ) |
| | — | | | | (8,943,388 | ) |
| | | | | | | |
| | 91,812 | | | | (2,633,608,491 | ) |
| | | | | | | |
| $ | 4,847,512 | | | $ | (1,879,315,892 | ) |
| | | | | | | |
54
STATEMENTSOF CHANGESIN NET ASSETS
| | | | | | | | | | | | | | | | | | | | |
| | | Core Plus Bond Fund | | | High Income Fund | | | International
Bond Fund | |
| | | Year Ended
September 30,
2008 | | | Year Ended
September 30,
2007 | | | Year Ended
September 30,
2008 | | | Year Ended
September 30,
2007 | | | Year Ended
September 30,
2008 (a) | |
| | | | | | | | | | | | | | | | | | | | |
FROM OPERATIONS: | | | | | | | | | | | | | | | | | | | | |
Net investment income | | $ | 7,889,395 | | | $ | 8,937,252 | | | $ | 3,149,292 | | | $ | 2,616,602 | | | $ | 212,713 | |
Net realized gain (loss) on investments and foreign currency transactions | | | 1,986,851 | | | | 3,057,453 | | | | 555,245 | | | | 2,071,153 | | | | (76,409 | ) |
Net change in unrealized appreciation (depreciation) on investments and foreign currency translations | | | (13,469,246 | ) | | | (455,077 | ) | | | (10,381,633 | ) | | | (1,570,220 | ) | | | (1,052,732 | ) |
| | | | | | | | | | | | | | | | | | | | |
Net increase (decrease) in net assets resulting from operations | | | (3,593,000 | ) | | | 11,539,628 | | | | (6,677,096 | ) | | | 3,117,535 | | | | (916,428 | ) |
| | | | | | | | | | | | | | | | | | | | |
FROM DISTRIBUTIONS TO SHAREHOLDERS: | | | | | | | | | | | | | | | | | | | | |
Net investment income | | | | | | | | | | | | | | | | | | | | |
Class A | | | (6,214,311 | ) | | | (4,791,156 | ) | | | (2,552,225 | ) | | | (2,276,050 | ) | | | (20,706 | ) |
Class B | | | (690,101 | ) | | | (4,164,404 | ) | | | (205,884 | ) | | | (385,580 | ) | | | — | |
Class C | | | (812,461 | ) | | | (393,045 | ) | | | (471,489 | ) | | | (290,234 | ) | | | (5,728 | ) |
Class Y | | | (1,030,857 | ) | | | (746,123 | ) | | | (54,867 | ) | | | — | | | | (217,001 | ) |
Net realized capital gain | | | | | | | | | | | | | | | | | | | | |
Class A | | | — | | | | — | | | | — | | | | — | | | | — | |
Class B | | | — | | | | — | | | | — | | | | — | | | | — | |
Class C | | | — | | | | — | | | | — | | | | — | | | | — | |
Class Y | | | — | | | | — | | | | — | | | | — | | | | — | |
| | | | | | | | | | | | | | | | | | | | |
Total distributions | | | (8,747,730 | ) | | | (10,094,728 | ) | | | (3,284,465 | ) | | | (2,951,864 | ) | | | (243,435 | ) |
| | | | | | | | | | | | | | | | | | | | |
NET INCREASE (DECREASE) IN NET ASSETS FROM CAPITAL SHARE TRANSACTIONS (NOTE 8) | | | (35,735,068 | ) | | | (150,880 | ) | | | 22,486,017 | | | | 2,103,465 | | | | 13,763,336 | |
| | | | | | | | | | | | | | | | | | | | |
Redemption fees | | | | | | | | | | | | | | | | | | | | |
Class A | | | 10,657 | | | | 4,164 | | | | 12,665 | | | | 1,239 | | | | 259 | |
Class B | | | 1,520 | | | | 3,852 | | | | 782 | | | | 221 | | | | — | |
Class C | | | 1,489 | | | | 451 | | | | 3,312 | | | | 191 | | | | 275 | |
Class Y | | | 1,652 | | | | 627 | | | | 1,025 | | | | — | | | | 13,340 | |
| | | | | | | | | | | | | | | | | | | | |
| | | 15,318 | | | | 9,094 | | | | 17,784 | | | | 1,651 | | | | 13,874 | |
| | | | | | | | | | | | | | | | | | | | |
Net increase (decrease) in net assets | | | (48,060,480 | ) | | | 1,303,114 | | | | 12,542,240 | | | | 2,270,787 | | | | 12,617,347 | |
| | | | | | | | | | | | | | | | | | | | |
NET ASSETS | | | | | | | | | | | | | | | | | | | | |
Beginning of the year | | | 221,518,566 | | | | 220,215,452 | | | | 42,078,880 | | | | 39,808,093 | | | | — | |
| | | | | | | | | | | | | | | | | | | | |
End of the year | | $ | 173,458,086 | | | $ | 221,518,566 | | | $ | 54,621,120 | | | $ | 42,078,880 | | | $ | 12,617,347 | |
| | | | | | | | | | | | | | | | | | | | |
ACCUMULATED NET INVESTMENT INCOME (LOSS) | | $ | 371,177 | | | $ | 286,929 | | | $ | (14,090 | ) | | $ | 44,230 | | | $ | (22,126 | ) |
| | | | | | | | | | | | | | | | | | | | |
| (a) | From commencement of operations on February 1, 2008 through September 30, 2008. |
See accompanying notes to financial statements.
55
| | | | | | | | | | | | | | |
Limited Term Government and
Agency Fund | | | Strategic Income Fund | |
Year Ended
September 30,
2008 | | | Year Ended
September 30,
2007 | | | Year Ended
September 30,
2008 | | | Year Ended
September 30,
2007 | |
| | | | | | | | | | | | | | |
| | | | | | | | | | | | | | |
| $ | 4,755,700 | | | $ | 5,111,524 | | | $ | 754,292,599 | | | $ | 404,960,779 | |
| | | | | | | | | | | | | | |
| | 498,940 | | | | 65,262 | | | | 183,690,261 | | | | 72,055,207 | |
| | | | | | | | | | | | | | |
| | (407,128 | ) | | | 261,814 | | | | (2,817,298,752 | ) | | | 228,448,541 | |
| | | | | | | | | | | | | | | |
| | 4,847,512 | | | | 5,438,600 | | | | (1,879,315,892 | ) | | | 705,464,527 | |
| | | | | | | | | | | | | | | |
| | | | | | | | | | | | | | |
| | | | | | | | | | | | | | |
| | (4,474,145 | ) | | | (4,778,111 | ) | | | (448,782,373 | ) | | | (239,664,878 | ) |
| | (205,652 | ) | | | (288,517 | ) | | | (12,700,249 | ) | | | (10,008,544 | ) |
| | (262,151 | ) | | | (166,306 | ) | | | (272,297,986 | ) | | | (137,066,220 | ) |
| | (244,165 | ) | | | (164,290 | ) | | | (61,058,261 | ) | | | (26,439,067 | ) |
| | | | | | | | | | | | | | |
| | — | | | | — | | | | (5,233,811 | ) | | | — | |
| | — | | | | — | | | | (183,665 | ) | | | — | |
| | — | | | | — | | | | (3,481,864 | ) | | | — | |
| | — | | | | — | | | | (634,289 | ) | | | — | |
| | | | | | | | | | | | | | | |
| | (5,186,113 | ) | | | (5,397,224 | ) | | | (804,372,498 | ) | | | (413,178,709 | ) |
| | | | | | | | | | | | | | | |
| | | | | | | | | | | | | | |
| | 14,420,990 | | | | (6,079,674 | ) | | | 2,697,961,138 | | | | 5,126,647,863 | |
| | | | | | | | | | | | | | | |
| | | | | | | | | | | | | | |
| | — | | | | — | | | | 209,238 | | | | 182,774 | |
| | — | | | | — | | | | 7,216 | | | | 8,908 | |
| | — | | | | — | | | | 140,777 | | | | 122,627 | |
| | — | | | | — | | | | 25,844 | | | | 19,120 | |
| | | | | | | | | | | | | | | |
| | — | | | | — | | | | 383,075 | | | | 333,429 | |
| | | | | | | | | | | | | | | |
| | 14,082,389 | | | | (6,038,298 | ) | | | 14,655,823 | | | | 5,419,267,110 | |
| | | | | | | | | | | | | | | |
| | | | | | | | | | | | | | |
| | 124,784,894 | | | | 130,823,192 | | | | 10,465,423,355 | | | | 5,046,156,245 | |
| | | | | | | | | | | | | | | |
| $ | 138,867,283 | | | $ | 124,784,894 | | | $ | 10,480,079,178 | | | $ | 10,465,423,355 | |
| | | | | | | | | | | | | | | |
| | | | | | | | | | | | | | |
| $ | (287,351 | ) | | $ | (130,422 | ) | | $ | 97,385,788 | | | $ | 26,601,961 | |
| | | | | | | | | | | | | | | |
56
FINANCIAL HIGHLIGHTS
For a share outstanding throughout each period.
| | | | | | | | | | | | | | | | | | | | | | | | | | |
| | | | | Income (Loss) from Investment Operations: | | | Less Distributions: | | | | |
| | | | | | | |
| | | Net asset
value,
beginning
of
the period | | Net
investment
income (c) | | Net realized
and unrealized
gain (loss) | | | Total from
investment
operations | | | Dividends
from
net investment
income | | | Total
distributions | | | Redemption
fees (d) | |
| | | | | | | | | | | | | | | | | | | | | | | | | | |
CORE PLUS BOND FUND | | | | | | | | | | | | | | | | | | | | | | | | | | |
Class A | | | | | | | | | | | | | | | | | | | | | | | | | | |
9/30/2008 | | $ | 11.31 | | $ | 0.55 | | $ | (0.71 | ) | | $ | (0.16 | ) | | $ | (0.61 | ) | | $ | (0.61 | ) | | $ | 0.00 | (h) |
9/30/2007 | | | 11.23 | | | 0.50 | | | 0.14 | | | | 0.64 | | | | (0.56 | ) | | | (0.56 | ) | | | 0.00 | |
9/30/2006 | | | 11.41 | | | 0.50 | | | (0.07 | ) | | | 0.43 | | | | (0.61 | ) | | | (0.61 | ) | | | 0.00 | |
9/30/2005 | | | 11.69 | | | 0.46 | | | (0.18 | ) | | | 0.28 | | | | (0.56 | ) | | | (0.56 | ) | | | 0.00 | |
9/30/2004 | | | 11.63 | | | 0.47 | | | 0.13 | | | | 0.60 | | | | (0.54 | ) | | | (0.54 | ) | | | 0.00 | |
Class B | | | | | | | | | | | | | | | | | | | | | | | | | | |
9/30/2008 | | | 11.31 | | | 0.44 | | | (0.67 | ) | | | (0.23 | ) | | | (0.51 | ) | | | (0.51 | ) | | | 0.00 | (h) |
9/30/2007 | | | 11.24 | | | 0.41 | | | 0.13 | | | | 0.54 | | | | (0.47 | ) | | | (0.47 | ) | | | 0.00 | |
9/30/2006 | | | 11.41 | | | 0.41 | | | (0.05 | ) | | | 0.36 | | | | (0.53 | ) | | | (0.53 | ) | | | 0.00 | |
9/30/2005 | | | 11.70 | | | 0.37 | | | (0.18 | ) | | | 0.19 | | | | (0.48 | ) | | | (0.48 | ) | | | 0.00 | |
9/30/2004 | | | 11.62 | | | 0.38 | | | 0.14 | | | | 0.52 | | | | (0.44 | ) | | | (0.44 | ) | | | 0.00 | |
Class C | | | | | | | | | | | | | | | | | | | | | | | | | | |
9/30/2008 | | | 11.32 | | | 0.47 | | | (0.71 | ) | | | (0.24 | ) | | | (0.53 | ) | | | (0.53 | ) | | | 0.00 | (h) |
9/30/2007 | | | 11.25 | | | 0.41 | | | 0.13 | | | | 0.54 | | | | (0.47 | ) | | | (0.47 | ) | | | 0.00 | |
9/30/2006 | | | 11.42 | | | 0.41 | | | (0.05 | ) | | | 0.36 | | | | (0.53 | ) | | | (0.53 | ) | | | 0.00 | |
9/30/2005 | | | 11.71 | | | 0.37 | | | (0.18 | ) | | | 0.19 | | | | (0.48 | ) | | | (0.48 | ) | | | 0.00 | |
9/30/2004 | | | 11.63 | | | 0.38 | | | 0.14 | | | | 0.52 | | | | (0.44 | ) | | | (0.44 | ) | | | 0.00 | |
Class Y | | | | | | | | | | | | | | | | | | | | | | | | | | |
9/30/2008 | | | 11.36 | | | 0.58 | | | (0.70 | ) | | | (0.12 | ) | | | (0.64 | ) | | | (0.64 | ) | | | 0.00 | (h) |
9/30/2007 | | | 11.29 | | | 0.54 | | | 0.13 | | | | 0.67 | | | | (0.60 | ) | | | (0.60 | ) | | | 0.00 | |
9/30/2006 | | | 11.46 | | | 0.51 | | | (0.04 | ) | | | 0.47 | | | | (0.64 | ) | | | (0.64 | ) | | | 0.00 | |
9/30/2005 | | | 11.74 | | | 0.49 | | | (0.18 | ) | | | 0.31 | | | | (0.59 | ) | | | (0.59 | ) | | | 0.00 | |
9/30/2004 | | | 11.69 | | | 0.50 | | | 0.13 | | | | 0.63 | | | | (0.58 | ) | | | (0.58 | ) | | | 0.00 | |
HIGH INCOME FUND | | | | | | | | | | | | | | | | | | | | | | | | | | |
Class A | | | | | | | | | | | | | | | | | | | | | | | | | | |
9/30/2008 | | $ | 5.12 | | $ | 0.34 | | $ | (0.87 | ) | | $ | (0.53 | ) | | $ | (0.35 | ) | | $ | (0.35 | ) | | $ | 0.00 | |
9/30/2007 | | | 5.09 | | | 0.33 | | | 0.08 | | | | 0.41 | | | | (0.38 | ) | | | (0.38 | ) | | | 0.00 | |
9/30/2006 | | | 4.98 | | | 0.34 | | | 0.11 | | | | 0.45 | | | | (0.34 | ) | | | (0.34 | ) | | | 0.00 | |
9/30/2005 | | | 4.82 | | | 0.33 | | | 0.16 | | | | 0.49 | | | | (0.33 | ) | | | (0.33 | ) | | | 0.00 | |
9/30/2004 | | | 4.65 | | | 0.33 | | | 0.17 | | | | 0.50 | | | | (0.33 | ) | | | (0.33 | ) | | | 0.00 | |
Class B | | | | | | | | | | | | | | | | | | | | | | | | | | |
9/30/2008 | | | 5.13 | | | 0.30 | | | (0.87 | ) | | | (0.57 | ) | | | (0.31 | ) | | | (0.31 | ) | | | 0.00 | |
9/30/2007 | | | 5.10 | | | 0.29 | | | 0.07 | | | | 0.36 | | | | (0.33 | ) | | | (0.33 | ) | | | 0.00 | |
9/30/2006 | | | 4.98 | | | 0.30 | | | 0.12 | | | | 0.42 | | | | (0.30 | ) | | | (0.30 | ) | | | 0.00 | |
9/30/2005 | | | 4.83 | | | 0.29 | | | 0.15 | | | | 0.44 | | | | (0.29 | ) | | | (0.29 | ) | | | 0.00 | |
9/30/2004 | | | 4.65 | | | 0.30 | | | 0.18 | | | | 0.48 | | | | (0.30 | ) | | | (0.30 | ) | | | 0.00 | |
| (a) | A sales charge for Class A and Class C (prior to February 1, 2004) shares and a contingent deferred sales charge for Class B and Class C shares are not reflected in total return calculations. Periods less than one year, if applicable, are not annualized. |
| (b) | Computed on an annualized basis for periods less than one year, if applicable. |
| (c) | Per share net investment income has been calculated using the average shares outstanding during the period. |
| (d) | Amount rounds to less than $0.01 per share, if applicable. |
See accompanying notes to financial statements.
57
| | | | | | | | | | | | | | | | | |
| | | | | | | | Ratios to Average Net Assets: | | |
| | | | | | |
Net asset
value,
end of
the period | | Total
return
(%) (a)(e) | | | Net assets,
end of
the period
(000’s) | | Net
expenses
(%) (b)(f) | | | Gross
expenses
(%) (b) | | | Net investment
income
(%) (b) | | Portfolio
turnover
rate (%) |
| | | | | | | | | | | | | | | | | |
| | | | | | | | | | | | | | | | | |
| | | | | | | | | | | | | | | | | |
| $ | 10.54 | | (1.6 | ) | | $ | 115,873 | | 0.93 | | | 1.04 | | | 4.86 | | 82 |
| | 11.31 | | 5.7 | | | | 105,780 | | 1.04 | | | 1.09 | | | 4.41 | | 69 |
| | 11.23 | | 4.0 | | | | 91,464 | | 1.05 | | | 1.08 | | | 4.46 | | 91 |
| | 11.41 | | 2.4 | | | | 105,111 | | 1.13 | | | 1.18 | | | 3.93 | | 64 |
| | 11.69 | | 5.3 | | | | 120,009 | | 1.19 | | | 1.22 | | | 4.05 | | 69 |
| | | | | | | | | | | | | | | | | |
| | 10.57 | | (2.2 | ) | | | 10,481 | | 1.70 | | | 1.80 | | | 3.92 | | 82 |
| | 11.31 | | 4.9 | | | | 87,101 | | 1.79 | | | 1.85 | | | 3.64 | | 69 |
| | 11.24 | | 3.3 | | | | 109,782 | | 1.80 | | | 1.83 | | | 3.72 | | 91 |
| | 11.41 | | 1.6 | | | | 132,221 | | 1.88 | | | 1.93 | | | 3.18 | | 64 |
| | 11.70 | | 4.6 | | | | 148,556 | | 1.94 | | | 1.97 | | | 3.29 | | 69 |
| | | | | | | | | | | | | | | | | |
| | 10.55 | | (2.3 | ) | | | 26,698 | | 1.68 | | | 1.79 | | | 4.17 | | 82 |
| | 11.32 | | 4.9 | | | | 12,690 | | 1.78 | | | 1.82 | | | 3.66 | | 69 |
| | 11.25 | | 3.3 | | | | 6,983 | | 1.80 | | | 1.82 | | | 3.63 | | 91 |
| | 11.42 | | 1.6 | | | | 6,065 | | 1.88 | | | 1.93 | | | 3.17 | | 64 |
| | 11.71 | | 4.6 | | | | 6,162 | | 1.94 | | | 1.98 | | | 3.30 | | 69 |
| | | | | | | | | | | | | | | | | |
| | 10.60 | | (1.4 | ) | | | 20,407 | | 0.68 | | | 0.75 | | | 5.14 | | 82 |
| | 11.36 | | 6.1 | | | | 15,946 | | 0.70 | | | 0.75 | | | 4.75 | | 69 |
| | 11.29 | | 4.3 | | | | 11,986 | | 0.80 | (g) | | 0.80 | (g) | | 4.58 | | 91 |
| | 11.46 | | 2.7 | | | | 9,060 | | 0.88 | | | 0.99 | | | 4.18 | | 64 |
| | 11.74 | | 5.5 | | | | 10,941 | | 0.94 | | | 0.98 | | | 4.30 | | 69 |
| | | | | | | | | | | | | | | | | |
| | | | | | | | | | | | | | | | | |
| $ | 4.24 | | (11.0 | ) | | $ | 38,577 | | 1.15 | | | 1.40 | | | 7.01 | | 27 |
| | 5.12 | | 8.1 | | | | 32,603 | | 1.18 | | | 1.43 | | | 6.40 | | 41 |
| | 5.09 | | 9.4 | | | | 29,069 | | 1.31 | | | 1.48 | | | 6.70 | | 41 |
| | 4.98 | | 10.3 | | | | 25,817 | | 1.58 | | | 1.72 | | | 6.60 | | 42 |
| | 4.82 | | 11.1 | | | | 24,641 | | 1.65 | | | 1.65 | | | 6.97 | | 51 |
| | | | | | | | | | | | | | | | | |
| | 4.25 | | (11.6 | ) | | | 2,267 | | 1.90 | | | 2.15 | | | 6.15 | | 27 |
| | 5.13 | | 7.2 | | | | 4,201 | | 1.94 | | | 2.18 | | | 5.63 | | 41 |
| | 5.10 | | 8.8 | | | | 7,283 | | 2.08 | | | 2.25 | | | 6.00 | | 41 |
| | 4.98 | | 9.3 | | | | 12,034 | | 2.33 | | | 2.47 | | | 5.85 | | 42 |
| | 4.83 | | 10.5 | | | | 17,967 | | 2.40 | | | 2.40 | | | 6.22 | | 51 |
| (e) | Had certain expenses not been reduced during the period, if applicable, total return would have been lower. |
| (f) | The investment adviser and/or administrator agreed to reimburse a portion of the Fund’s expenses and/or reduce its fee during the period. Without this reimbursement/fee reduction, if applicable, expenses would have been higher. |
| (g) | Includes expense recapture of 0.06%. |
| (h) | Effective June 2, 2008, redemption fees were eliminated. |
58
FINANCIAL HIGHLIGHTS (continued)
For a share outstanding throughout each period.
| | | | | | | | | | | | | | | | | | | | | | | | | | |
| | | | | Income (Loss) from Investment Operations: | | | Less Distributions: | | | | |
| | Net asset
value,
beginning
of
the period | | Net
investment
income (c) | | Net realized
and unrealized
gain (loss) | | | Total from
investment
operations | | | Dividends
from
net investment
income | | | Total
distributions | | | Redemption
fees (d) | |
| | | | | | | | | | | | | | | | | | | | | | | | | | |
HIGH INCOME FUND (continued) | | | | | | | | | | | | | | | | | | | | | | | | | | |
Class C | | | | | | | | | | | | | | | | | | | | | | | | | | |
9/30/2008 | | $ | 5.12 | | $ | 0.31 | | $ | (0.87 | ) | | $ | (0.56 | ) | | $ | (0.32 | ) | | $ | (0.32 | ) | | $ | 0.00 | |
9/30/2007 | | | 5.09 | | | 0.29 | | | 0.07 | | | | 0.36 | | | | (0.33 | ) | | | (0.33 | ) | | | 0.00 | |
9/30/2006 | | | 4.98 | | | 0.30 | | | 0.11 | | | | 0.41 | | | | (0.30 | ) | | | (0.30 | ) | | | 0.00 | |
9/30/2005 | | | 4.83 | | | 0.29 | | | 0.15 | | | | 0.44 | | | | (0.29 | ) | | | (0.29 | ) | | | 0.00 | |
9/30/2004 | | | 4.65 | | | 0.30 | | | 0.18 | | | | 0.48 | | | | (0.30 | ) | | | (0.30 | ) | | | 0.00 | |
Class Y | | | | | | | | | | | | | | | | | | | | | | | | | | |
9/30/2008(g) | | | 4.87 | | | 0.22 | | | (0.65 | ) | | | (0.43 | ) | | | (0.21 | ) | | | (0.21 | ) | | | 0.01 | |
INTERNATIONAL BOND FUND | | | | | | | | | | | | | | | | | | | | | | | | | | |
Class A | | | | | | | | | | | | | | | | | | | | | | | | | | |
9/30/2008(h) | | $ | 10.00 | | $ | 0.17 | | $ | (0.79 | ) | | $ | (0.62 | ) | | $ | (0.19 | ) | | $ | (0.19 | ) | | $ | 0.00 | (i) |
Class C | | | | | | | | | | | | | | | | | | | | | | | | | | |
9/30/2008(h) | | | 10.00 | | | 0.13 | | | (0.81 | ) | | | (0.68 | ) | | | (0.15 | ) | | | (0.15 | ) | | | 0.01 | (i) |
Class Y | | | | | | | | | | | | | | | | | | | | | | | | | | |
9/30/2008(h) | | | 10.00 | | | 0.18 | | | (0.81 | ) | | | (0.63 | ) | | | (0.20 | ) | | | (0.20 | ) | | | 0.01 | (i) |
| (a) | A sales charge for Class A and Class C (prior to February 1, 2004) shares and a contingent deferred sales charge for Class B and Class C shares are not reflected in total return calculations. Periods less than one year, if applicable, are not annualized. |
| (b) | Computed on an annualized basis for periods less than one year, if applicable. |
| (c) | Per share net investment income has been calculated using the average shares outstanding during the period. |
| (d) | Amount rounds to less than $0.01 per share, if applicable. |
See accompanying notes to financial statements.
59
| | | | | | | | | | | | | | | |
| | | | | | | | Ratios to Average Net Assets: | | |
| | | | | | |
Net asset
value,
end of
the period | | Total
return
(%) (a)(e) | | | Net assets,
end of
the period
(000’s) | | Net
expenses
(%) (b)(f) | | Gross
expenses
(%) (b) | | Net investment
income
(%) (b) | | Portfolio
turnover
rate (%) |
| | | | | | | | | | | | | | | |
| | | | | | | | | | | | | | | |
| | | | | | | | | | | | | | | |
| $ | 4.24 | | (11.6 | ) | | $ | 9,945 | | 1.90 | | 2.15 | | 6.32 | | 27 |
| | 5.12 | | 7.2 | | | | 5,275 | | 1.93 | | 2.17 | | 5.63 | | 41 |
| | 5.09 | | 8.6 | | | | 3,457 | | 2.07 | | 2.23 | | 5.96 | | 41 |
| | 4.98 | | 9.3 | | | | 3,554 | | 2.33 | | 2.47 | | 5.82 | | 42 |
| | 4.83 | | 10.5 | | | | 2,608 | | 2.40 | | 2.40 | | 6.22 | | 51 |
| | | | | | | | | | | | | | | |
| | 4.24 | | (9.1 | ) | | | 3,833 | | 0.90 | | 1.15 | | 8.03 | | 27 |
| | | | | | | | | | | | | | | |
| | | | | | | | | | | | | | | |
| $ | 9.19 | | (6.4 | ) | | $ | 1,953 | | 1.10 | | 2.95 | | 2.66 | | 60 |
| | | | | | | | | | | | | | | |
| | 9.18 | | (7.0 | ) | | | 683 | | 1.85 | | 3.70 | | 1.92 | | 60 |
| | | | | | | | | | | | | | | |
| | 9.18 | | (6.4 | ) | | | 9,981 | | 0.85 | | 2.48 | | 2.74 | | 60 |
| (e) | Had certain expenses not been reduced during the period, if applicable, total return would have been lower. |
| (f) | The investment adviser and/or administrator agreed to reimburse a portion of the Fund’s expenses and/or reduce its fee during the period. Without this reimbursement/fee reduction, if applicable, expenses would have been higher. |
| (g) | From commencement of class operations on February 29, 2008 through September 30, 2008. |
| (h) | For the period February 1, 2008 (inception) through September 30, 2008. |
| (i) | Effective June 2, 2008, redemption fees were eliminated. |
60
FINANCIAL HIGHLIGHTS (continued)
For a share outstanding throughout each period.
| | | | | | | | | | | | | | | | | | | | | |
| | | | | Income (Loss) from Investment Operations: | | Less Distributions: | |
| | | | | | |
| | | Net asset
value,
beginning
of
the period | | Net
investment
income (c) | | Net realized
and unrealized
gain (loss) | | | Total from
investment
operations | | Dividends
from
net investment
income | | | Total
distributions | |
| | | | | | | | | | | | | | | | | | | | | |
LIMITED TERM GOVERNMENT AND AGENCY FUND | | | | | | | | | | | | | | | | | | | | | |
Class A | | | | | | | | | | | | | | | | | | | | | |
9/30/2008 | | $ | 11.00 | | $ | 0.45 | | $ | 0.02 | | | $ | 0.47 | | $ | (0.49 | ) | | $ | (0.49 | ) |
9/30/2007 | | | 11.00 | | | 0.45 | | | 0.03 | | | | 0.48 | | | (0.48 | ) | | | (0.48 | ) |
9/30/2006 | | | 11.09 | | | 0.39 | | | (0.05 | ) | | | 0.34 | | | (0.43 | ) | | | (0.43 | ) |
9/30/2005 | | | 11.30 | | | 0.28 | | | (0.16 | ) | | | 0.12 | | | (0.33 | ) | | | (0.33 | ) |
9/30/2004 | | | 11.51 | | | 0.30 | | | (0.09 | ) | | | 0.21 | | | (0.42 | ) | | | (0.42 | ) |
Class B | | | | | | | | | | | | | | | | | | | | | |
9/30/2008 | | | 10.99 | | | 0.36 | | | 0.02 | | | | 0.38 | | | (0.40 | ) | | | (0.40 | ) |
9/30/2007 | | | 10.98 | | | 0.37 | | | 0.03 | | | | 0.40 | | | (0.39 | ) | | | (0.39 | ) |
9/30/2006 | | | 11.07 | | | 0.31 | | | (0.05 | ) | | | 0.26 | | | (0.35 | ) | | | (0.35 | ) |
9/30/2005 | | | 11.28 | | | 0.20 | | | (0.17 | ) | | | 0.03 | | | (0.24 | ) | | | (0.24 | ) |
9/30/2004 | | | 11.49 | | | 0.22 | | | (0.09 | ) | | | 0.13 | | | (0.34 | ) | | | (0.34 | ) |
Class C | | | | | | | | | | | | | | | | | | | | | |
9/30/2008 | | | 11.00 | | | 0.36 | | | 0.03 | | | | 0.39 | | | (0.40 | ) | | | (0.40 | ) |
9/30/2007 | | | 10.99 | | | 0.37 | | | 0.03 | | | | 0.40 | | | (0.39 | ) | | | (0.39 | ) |
9/30/2006 | | | 11.08 | | | 0.31 | | | (0.05 | ) | | | 0.26 | | | (0.35 | ) | | | (0.35 | ) |
9/30/2005 | | | 11.30 | | | 0.20 | | | (0.18 | ) | | | 0.02 | | | (0.24 | ) | | | (0.24 | ) |
9/30/2004 | | | 11.50 | | | 0.22 | | | (0.08 | ) | | | 0.14 | | | (0.34 | ) | | | (0.34 | ) |
Class Y | | | | | | | | | | | | | | | | | | | | | |
9/30/2008 | | | 11.03 | | | 0.47 | | | 0.02 | | | | 0.49 | | | (0.51 | ) | | | (0.51 | ) |
9/30/2007 | | | 11.03 | | | 0.49 | | | 0.03 | | | | 0.52 | | | (0.52 | ) | | | (0.52 | ) |
9/30/2006 | | | 11.13 | | | 0.43 | | | (0.06 | ) | | | 0.37 | | | (0.47 | ) | | | (0.47 | ) |
9/30/2005 | | | 11.34 | | | 0.31 | | | (0.17 | ) | | | 0.14 | | | (0.35 | ) | | | (0.35 | ) |
9/30/2004 | | | 11.55 | | | 0.32 | | | (0.09 | ) | | | 0.23 | | | (0.44 | ) | | | (0.44 | ) |
| (a) | A sales charge for Class A and Class C (prior to February 1, 2004) shares and a contingent deferred sales charge for Class B and Class C shares are not reflected in total return calculations. Periods less than one year, if applicable, are not annualized. |
| (b) | Computed on an annualized basis for periods less than one year, if applicable. |
| (c) | Per share net investment income has been calculated using the average shares outstanding during the period. |
See accompanying notes to financial statements.
61
| | | | | | | | | | | | | | | |
| | | | | | | Ratios to Average Net Assets: | | |
| | | | | | |
Net asset
value,
end of
the period | | Total
return
(%) (a)(d) | | Net assets,
end of
the period
(000’s) | | Net
expenses
(%) (b)(e) | | Gross
expenses
(%) (b) | | | Net investment
income
(%) (b) | | Portfolio
turnover
rate (%) |
| | | | | | | | | | | | | | | |
| | | | | | | | | | | | | | | |
| | | | | | | | | | | | | | | |
| $ | 10.98 | | 4.3 | | $ | 105,047 | | 0.92 | | 1.07 | | | 4.04 | | 52 |
| | 11.00 | | 4.5 | | | 108,536 | | 0.99 | | 1.10 | | | 4.13 | | 45 |
| | 11.00 | | 3.2 | | | 114,180 | | 1.04 | | 1.09 | | | 3.57 | | 50 |
| | 11.09 | | 1.1 | | | 141,417 | | 1.24 | | 1.24 | | | 2.50 | | 93 |
| | 11.30 | | 1.9 | | | 106,701 | | 1.32 | | 1.32 | | | 2.60 | | 80 |
| | | | | | | | | | | | | | | |
| | 10.97 | | 3.5 | | | 4,532 | | 1.67 | | 1.82 | | | 3.29 | | 52 |
| | 10.99 | | 3.7 | | | 6,787 | | 1.74 | | 1.85 | | | 3.37 | | 45 |
| | 10.98 | | 2.4 | | | 9,952 | | 1.79 | | 1.84 | | | 2.79 | | 50 |
| | 11.07 | | 0.3 | | | 15,114 | | 1.99 | | 1.99 | | | 1.75 | | 93 |
| | 11.28 | | 1.2 | | | 10,107 | | 2.00 | | 2.00 | | | 1.95 | | 80 |
| | | | | | | | | | | | | | | |
| | 10.99 | | 3.6 | | | 22,711 | | 1.66 | | 1.83 | | | 3.29 | | 52 |
| | 11.00 | | 3.6 | | | 5,261 | | 1.74 | | 1.85 | | | 3.38 | | 45 |
| | 10.99 | | 2.5 | | | 4,230 | | 1.79 | | 1.84 | | | 2.81 | | 50 |
| | 11.08 | | 0.2 | | | 5,715 | | 1.99 | | 1.99 | | | 1.75 | | 93 |
| | 11.30 | | 1.3 | | | 6,949 | | 2.00 | | 2.00 | | | 1.94 | | 80 |
| | | | | | | | | | | | | | | |
| | 11.01 | | 4.6 | | | 6,577 | | 0.67 | | 0.72 | | | 4.28 | | 52 |
| | 11.03 | | 4.8 | | | 4,201 | | 0.71 | | 0.75 | | | 4.43 | | 45 |
| | 11.03 | | 3.4 | | | 2,461 | | 0.74 | | 0.74 | | | 3.89 | | 50 |
| | 11.13 | | 1.2 | | | 2,533 | | 1.02 | | 1.59 | (f) | | 2.77 | | 93 |
| | 11.34 | | 2.1 | | | 4,233 | | 1.13 | | 1.13 | | | 2.82 | | 80 |
| (d) | Had certain expenses not been reduced during the period, if applicable, total return would have been lower. |
| (e) | The investment adviser and/or administrator agreed to reimburse a portion of the Fund’s expenses and/or reduce its fee during the period. Without this reimbursement/fee reduction, if applicable, expenses would have been higher. |
| (f) | Represents the total expenses prior to reduction of a portion of the class’s transfer agent expenses. |
62
FINANCIAL HIGHLIGHTS (continued)
For a share outstanding throughout each period.
| | | | | | | | | | | | | | | | | | | | | | | | | | | | | |
| | | | | Income (Loss) from Investment Operations: | | | Less Distributions: | | | |
| | | | | | | | |
| | | Net asset
value,
beginning
of
the period | | Net
investment
income (c) | | Net realized
and unrealized
gain (loss) | | | Total from
investment
operations | | | Dividends
from
net investment
income | | | Distributions
from net
realized
capital gains | | | Total
distributions | | | Redemption
fees (d)(g) |
| | | | | | | | | | | | | | | | | | | | | | | | | | | | | |
STRATEGIC INCOME FUND | | | | | | | | | | | | | | | | | | | | | | | | | | | | | |
Class A | | | | | | | | | | | | | | | | | | | | | | | | | | | | | |
9/30/2008 | | $ | 15.18 | | $ | 0.96 | | $ | (3.02 | ) | | $ | (2.06 | ) | | $ | (1.01 | ) | | $ | (0.01 | ) | | $ | (1.02 | ) | | $ | 0.00 |
9/30/2007 | | | 14.60 | | | 0.80 | | | 0.60 | | | | 1.40 | | | | (0.82 | ) | | | — | | | | (0.82 | ) | | | 0.00 |
9/30/2006 | | | 14.17 | | | 0.71 | | | 0.53 | | | | 1.24 | | | | (0.81 | ) | | | — | | | | (0.81 | ) | | | 0.00 |
9/30/2005 | | | 13.57 | | | 0.66 | | | 0.70 | | | | 1.36 | | | | (0.76 | ) | | | — | | | | (0.76 | ) | | | 0.00 |
9/30/2004 | | | 12.57 | | | 0.75 | | | 1.11 | | | | 1.86 | | | | (0.86 | ) | | | — | | | | (0.86 | ) | | | 0.00 |
Class B | | | | | | | | | | | | | | | | | | | | | | | | | | | | | |
9/30/2008 | | | 15.25 | | | 0.85 | | | (3.04 | ) | | | (2.19 | ) | | | (0.89 | ) | | | (0.01 | ) | | | (0.90 | ) | | | 0.00 |
9/30/2007 | | | 14.66 | | | 0.69 | | | 0.60 | | | | 1.29 | | | | (0.70 | ) | | | — | | | | (0.70 | ) | | | 0.00 |
9/30/2006 | | | 14.22 | | | 0.61 | | | 0.52 | | | | 1.13 | | | | (0.69 | ) | | | — | | | | (0.69 | ) | | | 0.00 |
9/30/2005 | | | 13.60 | | | 0.56 | | | 0.71 | | | | 1.27 | | | | (0.65 | ) | | | — | | | | (0.65 | ) | | | 0.00 |
9/30/2004 | | | 12.59 | | | 0.65 | | | 1.10 | | | | 1.75 | | | | (0.74 | ) | | | — | | | | (0.74 | ) | | | 0.00 |
Class C | | | | | | | | | | | | | | | | | | | | | | | | | | | | | |
9/30/2008 | | | 15.24 | | | 0.85 | | | (3.03 | ) | | | (2.18 | ) | | | (0.90 | ) | | | (0.01 | ) | | | (0.91 | ) | | | 0.00 |
9/30/2007 | | | 14.65 | | | 0.69 | | | 0.60 | | | | 1.29 | | | | (0.70 | ) | | | — | | | | (0.70 | ) | | | 0.00 |
9/30/2006 | | | 14.22 | | | 0.61 | | | 0.51 | | | | 1.12 | | | | (0.69 | ) | | | — | | | | (0.69 | ) | | | 0.00 |
9/30/2005 | | | 13.60 | | | 0.55 | | | 0.72 | | | | 1.27 | | | | (0.65 | ) | | | — | | | | (0.65 | ) | | | 0.00 |
9/30/2004 | | | 12.58 | | | 0.64 | | | 1.11 | | | | 1.75 | | | | (0.73 | ) | | | — | | | | (0.73 | ) | | | 0.00 |
Class Y | | | | | | | | | | | | | | | | | | | | | | | | | | | | | |
9/30/2008 | | | 15.17 | | | 1.00 | | | (3.03 | ) | | | (2.03 | ) | | | (1.04 | ) | | | (0.01 | ) | | | (1.05 | ) | | | 0.00 |
9/30/2007 | | | 14.59 | | | 0.85 | | | 0.59 | | | | 1.44 | | | | (0.86 | ) | | | — | | | | (0.86 | ) | | | 0.00 |
9/30/2006 | | | 14.17 | | | 0.76 | | | 0.51 | | | | 1.27 | | | | (0.85 | ) | | | — | | | | (0.85 | ) | | | 0.00 |
9/30/2005 | | | 13.57 | | | 0.70 | | | 0.70 | | | | 1.40 | | | | (0.80 | ) | | | — | | | | (0.80 | ) | | | 0.00 |
9/30/2004 | | | 12.58 | | | 0.78 | | | 1.11 | | | | 1.89 | | | | (0.90 | ) | | | — | | | | (0.90 | ) | | | 0.00 |
| (a) | A sales charge for Class A and Class C (prior to February 1, 2004) shares and a contingent deferred sales charge for Class B and Class C shares are not reflected in total return calculations. Periods less than one year, if applicable, are not annualized. |
| (b) | Computed on an annualized basis for periods less than one year, if applicable. |
| (c) | Per share net investment income has been calculated using the average shares outstanding during the period. |
See accompanying notes to financial statements.
63
| | | | | | | | | | | | | | | |
| | | | | | | | Ratios to Average Net Assets: | | |
| | | | | | |
Net asset
value,
end of
the period | | Total
return
(%) (a)(e) | | | Net assets,
end of
the period
(000’s) | | Net
expenses
(%) (b)(f) | | Gross
expenses
(%) (b) | | Net investment
income
(%) (b) | | Portfolio
turnover
rate (%) |
| | | | | | | | | | | | | | | |
| | | | | | | | | | | | | | | |
| | | | | | | | | | | | | | | |
| $ | 12.10 | | (14.5 | ) | | $ | 5,551,066 | | 0.97 | | 0.98 | | 6.59 | | 24 |
| | 15.18 | | 9.9 | | | | 5,749,315 | | 1.00 | | 1.00 | | 5.39 | | 22 |
| | 14.60 | | 9.0 | | | | 2,782,887 | | 1.05 | | 1.05 | | 5.01 | | 21 |
| | 14.17 | | 10.2 | | | | 977,198 | | 1.18 | | 1.18 | | 4.71 | | 14 |
| | 13.57 | | 15.2 | | | | 343,586 | | 1.23 | | 1.23 | | 5.66 | | 28 |
| | | | | | | | | | | | | | | |
| | 12.16 | | (15.2 | ) | | | 161,751 | | 1.72 | | 1.73 | | 5.78 | | 24 |
| | 15.25 | | 9.1 | | | | 233,418 | | 1.76 | | 1.76 | | 4.61 | | 22 |
| | 14.66 | | 8.2 | | | | 179,927 | | 1.79 | | 1.79 | | 4.26 | | 21 |
| | 14.22 | | 9.5 | | | | 144,081 | | 1.93 | | 1.93 | | 3.98 | | 14 |
| | 13.60 | | 14.3 | | | | 128,714 | | 1.98 | | 1.98 | | 4.91 | | 28 |
| | | | | | | | | | | | | | | |
| | 12.15 | | (15.2 | ) | | | 3,984,204 | | 1.72 | | 1.73 | | 5.85 | | 24 |
| | 15.24 | | 9.1 | | | | 3,843,823 | | 1.75 | | 1.75 | | 4.63 | | 22 |
| | 14.65 | | 8.1 | | | | 1,812,278 | | 1.79 | | 1.79 | | 4.24 | | 21 |
| | 14.22 | | 9.5 | | | | 765,200 | | 1.93 | | 1.93 | | 3.93 | | 14 |
| | 13.60 | | 14.3 | | | | 255,705 | | 1.98 | | 1.98 | | 4.87 | | 28 |
| | | | | | | | | | | | | | | |
| | 12.09 | | (14.3 | ) | | | 783,058 | | 0.72 | | 0.72 | | 6.88 | | 24 |
| | 15.17 | | 10.2 | | | | 638,868 | | 0.74 | | 0.74 | | 5.67 | | 22 |
| | 14.59 | | 9.3 | | | | 271,065 | | 0.78 | | 0.78 | | 5.30 | | 21 |
| | 14.17 | | 10.5 | | | | 50,369 | | 0.91 | | 0.91 | | 4.98 | | 14 |
| | 13.57 | | 15.5 | | | | 10,833 | | 1.00 | | 1.08 | | 5.93 | | 28 |
| (d) | Amount rounds to less than $0.01 per share, if applicable. |
| (e) | Had certain expenses not been reduced during the period, if applicable, total return would have been lower. |
| (f) | The investment adviser and/or administrator agreed to reimburse a portion of the Fund’s expenses and/or reduce its fee during the period. Without this reimbursement/fee reduction, if applicable, expenses would have been higher. |
| (g) | Effective June 2, 2008, redemption fees were eliminated. |
64
NOTESTO FINANCIAL STATEMENTS
September 30, 2008
1. Organization. Natixis Funds Trust I and Loomis Sayles Funds II (the “Trusts” and each a “Trust”) are each organized as a Massachusetts business trust. Each Trust is registered under the Investment Company Act of 1940, as amended (“1940 Act”), as an open-end management investment company. Each Declaration of Trust permits the Board of Trustees to authorize the issuance of an unlimited number of shares of the Trust in multiple series. Information presented in these financial statements pertains to certain fixed income funds of the Trusts; the financial statements for the other funds of the Trusts are presented in separate reports. The following funds (individually, a “Fund” and collectively, the “Funds”) are included in this report:
Natixis Funds Trust I:
Loomis Sayles Core Plus Bond Fund (the “Core Plus Bond Fund”)
Loomis Sayles Funds II:
Loomis Sayles High Income Fund (the “High Income Fund”)
Loomis Sayles International Bond Fund (the “International Bond Fund”)
Loomis Sayles Limited Term Government and Agency Fund (the “Limited Term Government and Agency Fund”)
Loomis Sayles Strategic Income Fund (the “Strategic Income Fund”)
International Bond Fund commenced operations on February 1, 2008.
Core Plus Bond Fund, High Income Fund, International Bond Fund, Limited Term Government and Agency Fund, and Strategic Income Fund each offer Class A, Class C and Class Y shares. Effective October 12, 2007, Class B shares are no longer offered. Existing Class B shareholders may continue to reinvest dividends into Class B shares and exchange their Class B shares for Class B shares of other Natixis Funds subject to existing exchange privileges as described in the Prospectus. On February 29, 2008, High Income Fund began offering Class Y Shares.
Class A shares of all Funds except Limited Term Government and Agency Fund are sold with a maximum front-end sales charge of 4.50%. Class A shares of Limited Term Government and Agency Fund are sold with a maximum front-end sales charge of 3.00%. Class B shares do not pay a front-end sales charge, but pay higher Rule 12b-1 fees than Class A shares for eight years (at which point they automatically convert to Class A shares), and are subject to a contingent deferred sales charge (“CDSC”) if those shares are redeemed within six years of purchase. Class C shares do not pay a front-end sales charge, do not convert to any other Class of shares and pay higher Rule 12b-1 fees than Class A shares and may be subject to a CDSC of 1.00% if those shares are redeemed within one year. Class Y shares do not pay a front-end sales charge, a CDSC or Rule 12b-1 fees. Class Y shares are generally intended for institutional investors with a minimum initial investment of $100,000, though some categories of investors are excepted from the minimum investment amount as outlined in the Fund’s Prospectus.
Most expenses of the Trusts can be directly attributed to a fund. Expenses which cannot be directly attributed to a fund are generally apportioned based on the relative net assets of each of the funds in the Trusts. Expenses of a fund are borne pro rata by the holders of each class of shares, except that each class bears expenses unique to that class (including the Rule 12b-1 service and distribution fees and transfer agent fees applicable to such class). In addition, each class votes as a class only with respect to its own Rule 12b-1 Plan. Shares of each class would receive their pro rata share of the net assets of a fund if the fund were liquidated. The Trustees approve separate dividends from net investment income on each class of shares.
2. Significant Accounting Policies. The following is a summary of significant accounting policies consistently followed by each Fund in the preparation of its financial statements. The Funds’ financial statements are prepared in accordance with accounting principles generally accepted in the United States of America which require the use of management estimates that affect the reported amounts and disclosures in the financial statements. Actual results could differ from those estimates.
a. Security Valuation. Debt securities (other than short-term obligations purchased with an original or remaining maturity of sixty days or less) are generally valued on the basis of evaluated bids furnished to the Funds by a pricing service recommended by the investment adviser and approved by the Board of Trustees, which service determines valuations for normal, institutional-size trading units of such securities using market information, transactions for comparable securities and various relationships between securities which are generally recognized by institutional traders. Equity securities, including closed-end investment companies and exchange-traded funds, for which market quotations are readily available are valued at market value, as reported by pricing services recommended by the investment adviser and approved by the Board of Trustees. Such pricing services generally use the security’s last sale price on the exchange or market where the security is primarily traded or, if there is no reported sale during the day, the closing bid price. Securities traded on the NASDAQ Global Select Market, NASDAQ Global Market and NASDAQ Capital Market are valued at the NASDAQ Official Closing Price (“NOCP”), or if lacking a NOCP, at the most recent bid quotation on the applicable NASDAQ market. Broker-dealer bid quotations may also be used to value debt and equity securities where a pricing service does not price a security or where a pricing service does not provide a reliable price for the security. In instances where broker-dealer bid quotations are not available, certain securities held by the Funds may be valued on the basis of a price provided by a principal market maker. Short-term obligations purchased with an original or remaining maturity of sixty days or less are valued at amortized cost, which approximates market value. Securities for which market quotations are not readily available are valued at fair value as determined in good faith by the Funds’ investment adviser using consistently applied procedures under the general supervision of the Board of Trustees. Investments in other open-end investment companies are valued at their net asset value each day.
Certain Funds may hold securities traded in foreign markets. Foreign securities are valued at the market price in the foreign market. However, if events occurring after the close of the foreign market (but before the close of regular trading on the New York Stock Exchange) are believed to materially affect the value of those securities, such securities
65
NOTESTO FINANCIAL STATEMENTS (continued)
September 30, 2008
are fair valued pursuant to procedures approved by the Board of Trustees. When fair valuing securities, the Funds may, among other things, use modeling tools or other processes that may take into account factors such as securities market activity and/or significant events that occur after the close of the foreign market and before the Funds calculate their net asset values.
b. Security Transactions and Related Investment Income. Security transactions are accounted for on trade date. Dividend income is recorded on ex-dividend date, or in the case of certain foreign securities, as soon as the Fund is notified, and interest income is recorded on an accrual basis. Interest income is increased by the accretion of discount and decreased by the amortization of premium. Periodic principal adjustments for inflation-protected securities are recorded to interest income. Distributions received from investments in securities that represent a return of capital or capital gain are recorded as a reduction of cost of investments or as a realized gain, respectively. The calendar year-end amounts of ordinary income, capital gains, and return of capital included in distributions received from the Funds’ investments in real estate investment trusts (“REITs”) are reported to the Funds after the end of the fiscal year; accordingly, the Funds estimate these amounts for accounting purposes until the characterization of REIT distributions is reported to the Funds after the end of the fiscal year. Estimates are based on the most recent REIT distribution information available. Investment income is recorded net of foreign taxes withheld when applicable. In determining net gain or loss on securities sold, the cost of securities has been determined on an identified cost basis. Investment income, non-class specific expenses and realized and unrealized gains and losses are allocated on a pro rata basis to each class based on the relative net assets of each class to the total net assets of the Fund.
c. Foreign Currency Translation. The books and records of the Funds are maintained in U.S. dollars. The value of securities, currencies and other assets and liabilities denominated in currencies other than U.S. dollars are translated into U.S. dollars based upon foreign exchange rates prevailing at the end of the period. Purchases and sales of investment securities, income and expenses are translated on the respective dates of such transactions.
Since the values of investment securities are presented at the foreign exchange rates prevailing at the end of the period, it is not practical to isolate that portion of the results of operations arising from changes in exchange rates from fluctuations which arise due to changes in market prices of the investment securities. Such changes are included with the net realized and unrealized gain or loss on investments.
Net realized foreign exchange gains or losses arise from sales of foreign currency, currency gains or losses realized between the trade and settlement dates on securities transactions, and the difference between the amounts of dividends, interest and foreign withholding taxes recorded on the Funds’ books and the U.S. dollar equivalent of the amounts actually received or paid. Net unrealized foreign exchange gains and losses arise from changes in the value of assets and liabilities, other than investment securities, at the end of the fiscal period, resulting from changes in exchange rates.
Each Fund may use foreign currency exchange contracts to facilitate transactions in foreign-denominated investments. Losses may arise from changes in the value of the foreign currency or if the counterparties do not perform under the contracts’ terms.
Each Fund may purchase investments of foreign issuers. Investing in securities of foreign issuers involves special risks and considerations not typically associated with investing in U.S. companies and securities of the U.S. government. These risks include revaluation of currencies and the risk of appropriation. Moreover, the markets for securities of many foreign issuers may be less liquid and the prices of such securities may be more volatile than those of comparable U.S. companies and the U.S. government.
d. Forward Foreign Currency Contracts. Each Fund may enter into forward foreign currency contracts. Contracts to buy generally are used to acquire exposure to foreign currencies, while contracts to sell generally are used to hedge a Fund’s investments against currency fluctuation. Also, a contract to buy or sell can offset a previous contract. These contracts involve market risk in excess of the unrealized gain or loss reflected in the Fund’s Statement of Assets and Liabilities. The U.S. dollar value of the currencies a Fund has committed to buy or sell represents the aggregate exposure to each currency the Fund has acquired or hedged through currency contracts outstanding at period end.
All contracts are “marked-to-market” daily utilizing interpolated prices determined from information provided by an independent pricing service and any gains or losses are recorded for financial statement purposes as unrealized until settlement date. Risks may arise upon entering into these contracts from the potential inability of counterparties to meet the terms of their contracts and from unanticipated movements in the value of a foreign currency relative to the U.S. dollar.
e. Federal and Foreign Income Taxes. Each Trust treats each Fund as a separate entity for federal income tax purposes. Each Fund intends to meet the requirements of the Internal Revenue Code applicable to regulated investment companies, and to distribute to its shareholders substantially all of its net investment income and any net realized capital gains at least annually. Management has performed an analysis of the Funds’ tax positions taken on federal and state tax returns that remain subject to examinations (tax years ended September 30, 2005-2008, where applicable) and has concluded that no provisions for income tax are required. Fund management is not aware of any events that are reasonably possible to occur in the next twelve months that would result in the amounts of any unrecognized tax benefits significantly increasing or decreasing for the Funds. However, management’s conclusions regarding tax positions taken may be subject to review and adjustment at a later date based on factors including, but not limited to, new tax laws and accounting regulations and interpretations thereof.
A Fund may be subject to foreign taxes on income and gains on investments that are accrued based upon the Fund’s understanding of the tax rules and regulations that exist in the countries in which the Fund invests. Foreign governments may also impose taxes or other payments on investments with respect to foreign securities. Such taxes are accrued as applicable.
66
NOTESTO FINANCIAL STATEMENTS (continued)
September 30, 2008
f. Dividends and Distributions to Shareholders. Dividends and distributions are recorded on ex-dividend date. The timing and characterization of certain income and capital gain distributions are determined annually in accordance with federal tax regulations, which may differ from accounting principles generally accepted in the United States of America. Permanent differences are primarily due to differing treatments for book and tax purposes for items such as foreign currency transactions, premium amortization, defaulted bond adjustments, paydown gains and losses, expired capital loss carryforwards and return of capital and capital gains distributions from REITS. Permanent book and tax basis differences relating to shareholder distributions will result in reclassifications to capital accounts. Temporary differences between book and tax distributable earnings are primarily due to deferred Trustees’ fees, wash sales, premium amortization accruals, forward contracts mark to market, dividends payable, securities lending collateral gain/loss adjustment, straddle loss deferrals, REIT basis adjustments, TIP discount accretion, defaulted bond interest, capital loss carryforwards and post-October capital loss deferrals. Distributions from net investment income and short-term capital gains are considered to be distributed from ordinary income for tax purposes.
The tax characterization of distributions is determined on an annual basis. The tax character of distributions paid to shareholders during the years ended September 30, 2008 and 2007 was as follows:
| | | | | | | | | |
| | | 2008 Distributions Paid From: |
Fund | | Ordinary Income | | Long-Term Capital Gains | | Total |
Core Plus Bond Fund | | $ | 8,747,730 | | $ | — | | $ | 8,747,730 |
High Income Fund | | | 3,284,465 | | | — | | | 3,284,465 |
International Bond Fund | | | 243,435 | | | — | | | 243,435 |
Limited Term Government and Agency Fund | | | 5,186,113 | | | — | | | 5,186,113 |
Strategic Income Fund | | | 794,838,869 | | | 9,533,629 | | | 804,372,498 |
| | | | | | | | | |
| | | 2007 Distributions Paid From: |
Fund | | Ordinary Income | | Long-Term Capital Gains | | Total |
Core Plus Bond Fund | | $ | 10,094,728 | | $ | — | | $ | 10,094,728 |
High Income Fund | | | 2,951,864 | | | — | | | 2,951,864 |
Limited Term Government and Agency Fund | | | 5,397,224 | | | — | | | 5,397,224 |
Strategic Income Fund | | | 413,178,709 | | | — | | | 413,178,709 |
Differences between these amounts and those reported in the Statements of Changes in Net Assets are primarily attributable to different book and tax treatment for short-term capital gains.
As of September 30, 2008, the components of distributable earnings on a tax basis were as follows:
| | | | | | | | | | | | | | | | | | | | |
| | | Core Plus Bond Fund | | | High Income
Fund | | | International Bond Fund | | | Limited Term
Government and Agency Fund | | | Strategic Income
Fund | |
Undistributed ordinary income | | $ | 614,936 | | | $ | 63,564 | | | $ | — | | | $ | 51,712 | | | $ | 115,263,518 | |
Undistributed long-term capital gains | | | — | | | | — | | | | — | | | | — | | | | 53,152,344 | |
| | | | | | | | | | | | | | | | | | | | |
Total undistributed earnings | | $ | 614,936 | | | $ | 63,564 | | | | | | | $ | 51,712 | | | $ | 168,415,862 | |
Capital Loss Carryforward: | | | | | | | | | | | | | | | | | | | | |
Expires September 30, 2009 | | | — | | | | (43,374,722 | ) | | | — | | | | (4,128,091 | ) | | | — | |
Expires September 30, 2010 | | | (19,514,453 | ) | | | (26,826,634 | ) | | | — | | | | (663,109 | ) | | | — | |
Expires September 30, 2011 | | | — | | | | — | | | | — | | | | (425,323 | ) | | | — | |
Expires September 30, 2012 | | | — | | | | — | | | | — | | | | (193,904 | ) | | | — | |
Expires September 30, 2013 | | | — | | | | — | | | | — | | | | — | | | | — | |
Expires September 30, 2014 | | | (181,728 | ) | | | — | | | | — | | | | (2,770,324 | ) | | | — | |
Expires September 30, 2015 | | | — | | | | — | | | | — | | | | (4,336,746 | ) | | | — | |
Expires September 30, 2016 | | | — | | | | — | | | | — | | | | (115,630 | ) | | | — | |
| | | | | | | | | | | | | | | | | | | | |
Total capital loss carryforward | | | (19,696,181 | ) | | | (70,201,356 | ) | | | — | | | | (12,633,127 | ) | | | — | |
Deferred net capital and currency losses
(post-October 2007) | | | — | | | | — | | | | (87,381 | ) | | | — | | | | — | |
Unrealized appreciation (depreciation) | | | (15,017,580 | ) | | | (9,280,122 | ) | | | (1,063,617 | ) | | | (1,423,227 | ) | | | (2,372,406,167 | ) |
| | | | | | | | | | | | | | | | | | | | |
Total accumulated earnings (losses) | | $ | (34,098,825 | ) | | $ | (79,417,914 | ) | | $ | (1,150,998 | ) | | $ | (14,004,642 | ) | | $ | (2,203,990,305 | ) |
| | | | | | | | | | | | | | | | | | | | |
Capital loss carryforward utilized in the current year | | $ | 916,394 | | | $ | 500,999 | | | $ | — | | | $ | — | | | $ | — | |
| | | | | | | | | | | | | | | | | | | | |
67
NOTESTO FINANCIAL STATEMENTS (continued)
September 30, 2008
The High Income Fund had carry forward losses expire in the current year for the amount of $10,600,869.
The Limited Term Government and Agency Fund had carry forward losses expire in the current year for the amount of $4,165,768.
g. Repurchase Agreements. Each Fund, through its custodian, receives delivery of the underlying securities collateralizing repurchase agreements. It is each Fund’s policy that the market value of the collateral be at least equal to 100% of the repurchase price, including interest. Certain repurchase agreements are tri-party arrangements whereby the collateral is held at the custodian bank in a segregated account for the benefit of the Fund and on behalf of the counterparty. It is each Fund’s policy, regarding tri-party arrangements, that the market value of the collateral be at least equal to 102% of the repurchase price, including interest. Repurchase agreements could involve certain risks in the event of default or insolvency of the counterparty including possible delays or restrictions upon a Fund’s ability to dispose of the underlying securities.
h. Securities Lending. The Funds have entered into an agreement with State Street Bank and Trust Company (“State Street Bank”), as agent of the Funds, to lend securities to certain designated borrowers. The loans are collateralized with cash or securities in an amount equal to at least 105% or 102% of the market value of the loaned international or domestic securities, respectively, when the loan is initiated. Thereafter, the value of the collateral must remain at least 102% of the market value of loaned securities for U.S. equities and U.S. corporate debt; at least 105% of the market value of loaned securities for non-U.S. equities; and at least 100% of the market value of loaned securities for U.S. government securities, sovereign debt issued by non-U.S. governments and non-U.S. corporate debt. In the event that the market value of the collateral falls below the required percentages described above, the borrower will deliver additional collateral on the next business day. As with other extensions of credit, the Funds may bear the risk of loss with respect to the investment of the collateral. The Funds invest cash collateral in short-term investments, a portion of the income from which is remitted to the borrowers and the remainder allocated between the Funds and State Street Bank as lending agent. The value of securities on loan to borrowers and the value of collateral held by the Funds with respect to such loans at September 30, 2008 were as follows:
| | | | | | |
Fund | | Value of
Securities on Loan | | Value of Collateral
Received |
Core Plus Bond Fund | | $ | 10,552,377 | | $ | 10,994,292 |
High Income Fund | | | 3,411,036 | | | 3,523,267 |
International Bond Fund | | | — | | | — |
Limited Term Government and Agency Fund | | | 1,054,679 | | | 1,085,429 |
Strategic Income Fund | | | 334,019,744 | | | 344,413,663 |
Subsequent to September 30, 2008, all securities on loan were called back.
i. Delayed Delivery Commitments. Each Fund may purchase or sell securities on a when-issued or forward commitment basis. Payment and delivery may take place a month or more after the date of the transaction. The price of the underlying securities and the date when the securities will be delivered and paid for are fixed at the time the transaction is negotiated. Losses may arise due to changes in the market value of the underlying securities or if the counterparty does not perform under the contract. Collateral consisting of liquid securities or cash and cash equivalents is maintained in an amount at least equal to these commitments with the custodian.
j. Indemnifications. Under the Trusts’ organizational documents, their officers and Trustees are indemnified against certain liabilities arising out of the performance of their duties to the Funds. Additionally, in the normal course of business, the Funds enter into contracts with service providers that contain general indemnification clauses. The Funds’ maximum exposure under these arrangements is unknown as this would involve future claims that may be made against the Funds that have not yet occurred. However, based on experience, the Funds expect the risk of loss to be remote.
k. New Accounting Pronouncements. In September 2006, Statement of Financial Accounting Standards No. 157, Fair Value Measurements (“FAS 157”), was issued and is effective for fiscal years beginning after November 15, 2007. FAS 157 defines fair value, establishes a framework for measuring fair value and expands disclosures about fair value measurements. Management has evaluated the impact the adoption of FAS 157 will have on the Funds’ financial statements and believes that such impact will be limited to expanded disclosure in the Funds’ financial statements regarding inputs used in determining the value of the Funds’ investments.
In March 2008, Statement of Financial Accounting Standards No. 161, Disclosures about Derivative Instruments and Hedging Activities (“FAS 161”), was issued and will be effective for fiscal years and interim periods beginning after November 15, 2008. FAS 161 requires enhanced disclosures about funds’ derivative and hedging activities. Management is currently evaluating the impact the adoption of FAS 161 will have on the Funds’ financial statement disclosures.
68
NOTESTO FINANCIAL STATEMENTS (continued)
September 30, 2008
3. Purchases and Sales of Securities. For the year ended September 30, 2008, purchases and sales of securities (excluding short-term investments and including paydowns) were as follows:
| | | | | | | | | | | | |
| | | U.S. Government and
Agency Securities | | Other Securities |
Fund | | Purchases | | Sales | | Purchases | | Sales |
Core Plus Bond Fund | | $ | 81,338,297 | | $ | 112,832,539 | | $ | 54,928,935 | | $ | 59,641,890 |
High Income Fund | | | 369,501 | | | 4,400,440 | | | 26,803,145 | | | 7,072,922 |
International Bond Fund | | | — | | | — | | | 20,188,493 | | | 6,899,715 |
Limited Term Government and Agency Fund | | | 63,171,203 | | | 44,200,040 | | | 8,616,640 | | | 10,401,511 |
Strategic Income Fund | | | 49,324,724 | | | 1,123,044,468 | | | 5,341,585,401 | | | 1,612,301,585 |
4. Management Fees and Other Transactions with Affiliates.
a. Management Fees. Loomis, Sayles & Company, L.P. (“Loomis Sayles”) serves as investment adviser to each Fund. Under the terms of the management agreements, each Fund pays a management fee at the following annual rates, calculated daily and payable monthly, based on each Fund’s average daily net assets:
| | | | | | | | | | |
| | | Percentage of Average Daily Net Assets |
Fund | | First
$100 million | | Next
$100 million | | Next
$1.8 billion | | Next
$13 billion | | Over
$15 billion |
Core Plus Bond Fund | | 0.2500% | | 0.1875% | | 0.1875% | | 0.1875% | | 0.1875% |
High Income Fund | | 0.6000% | | 0.6000% | | 0.6000% | | 0.6000% | | 0.6000% |
International Bond Fund | | 0.6000% | | 0.6000% | | 0.6000% | | 0.6000% | | 0.6000% |
Limited Term Government and Agency Fund | | 0.5000% | | 0.5000% | | 0.5000% | | 0.5000% | | 0.5000% |
Strategic Income Fund | | 0.6500% | | 0.6500% | | 0.6000% | | 0.5500% | | 0.5400% |
Prior to July 1, 2008, the management fees for the Strategic Income Fund were 0.65% for the first $200 million of average daily net assets of the Fund, 0.60% for the next $1.8 billion of such assets and 0.55% of such assets over $2 billion.
Natixis Asset Management Advisors, L.P. (“Natixis Advisors”), serves as the advisory administrator to Core Plus Bond Fund. Under the terms of the advisory administration agreements, the Fund pays an advisory administration fee at the following annual rates, calculated daily and payable monthly, based on its average daily net assets:
| | | | |
| | | Percentage of Average Daily Net Assets |
Fund | | First $100 million | | Over $100 million |
Core Plus Bond Fund | | 0.2500% | | 0.1875% |
Management and advisory administration fees are presented in the Statements of Operations as management fees.
Loomis Sayles has given binding undertakings to the Funds to reduce management fees and/or reimburse certain expenses associated with these Funds to limit their operating expenses. These undertakings are in effect until January 31, 2009 and will be reevaluated on an annual basis. For the period from February 1, 2008 to September 30, 2008, the expense limits as a percentage of average daily net assets under the expense limitation agreements were as follows:
| | | | | | | | | | | | |
| | | Expense Limit as a Percentage of
Average Daily Net Assets | |
Fund | | Class A | | | Class B | | | Class C | | | Class Y | |
Core Plus Bond Fund | | 0.90 | % | | 1.65 | % | | 1.65 | % | | 0.65 | % |
High Income Fund | | 1.15 | % | | 1.90 | % | | 1.90 | % | | 0.90 | % |
International Bond Fund | | 1.10 | % | | — | | | 1.85 | % | | 0.85 | % |
Limited Term Government and Agency Fund | | 0.90 | % | | 1.65 | % | | 1.65 | % | | 0.65 | % |
Strategic Income Fund | | 1.25 | % | | 2.00 | % | | 2.00 | % | | 1.00 | % |
69
NOTESTO FINANCIAL STATEMENTS (continued)
September 30, 2008
Prior to February 1, 2008, the expense limits as a percentage of average daily net assets were as follows:
| | | | | | | | | | | | |
Fund | | Class A | | | Class B | | | Class C | | | Class Y | |
Core Plus Bond Fund | | 1.00 | % | | 1.75 | % | | 1.75 | % | | 0.75 | % |
High Income Fund | | 1.15 | % | | 1.90 | % | | 1.90 | % | | — | |
Limited Term Government and Agency Fund | | 0.95 | % | | 1.70 | % | | 1.70 | % | | 0.70 | % |
Strategic Income Fund | | 1.25 | % | | 2.00 | % | | 2.00 | % | | 1.00 | % |
Loomis Sayles and Natixis Advisors have agreed to equally bear the fee reductions and/or expense reimbursements for the Core Plus Bond Fund.
For the year ended September 30, 2008, the management fees and reductions of management fees for each Fund were as follows:
| | | | | | | | | | | | | | | |
Fund | | Gross
Management
Fee | | Reduction of
Management
Fee | | Net
Management
Fee | | Percentage of
Average
Daily Net Assets | |
| | | | | Gross | | | Net | |
Core Plus Bond Fund | | $ | 375,532 | | $ | — | | $ | 375,532 | | 0.225 | % | | 0.225 | % |
High Income Fund | | | 275,813 | | | 66,570 | | | 209,243 | | 0.600 | % | | 0.452 | % |
International Bond Fund | | | 47,119 | | | 47,119 | | | — | | 0.600 | % | | — | |
Limited Term Government and Agency Fund | | | 598,625 | | | 43,471 | | | 555,154 | | 0.500 | % | | 0.464 | % |
Strategic Income Fund | | | 66,716,160 | | | — | | | 66,716,160 | | 0.560 | % | | 0.560 | % |
For the year ended September 30, 2008, the advisory administration fees and fee reductions for Core Plus Bond Fund were as follows:
| | | | | | | | | | | | |
Gross
Advisory
Administration
Fee | | Reduction of Advisory
Administration Fee | | Net Advisory
Administration Fee | | Percentage of
Average
Daily Net Assets | |
| | | | Gross | | | Net | |
| $375,532 | | $ | — | | $ | 375,532 | | 0.225 | % | | 0.225 | % |
For the year ended September 30, 2008, class specific expenses have been reimbursed as follows:
| | | |
Fund | | Reimbursement |
Core Plus Bond Fund | | $ | 166,466 |
High Income Fund | | | 47,505 |
International Bond Fund | | | 82,692 |
Limited Term Government and Agency Fund | | | 136,000 |
Loomis Sayles and Natixis Advisors shall be permitted to recover expenses it has borne under the expense limitation agreement (whether through reduction of its management fees or otherwise) on a class by class basis in later periods to the extent the expenses of a class fall below a class’ expense limits, provided, however, that a class is not obligated to pay such reduced fees/expenses more than one year after the end of the fiscal year in which the fee/expense was reduced. The amounts subject to possible reimbursement under the expense limitation agreements at September 30, 2008 were as follows:
| | | | | | | | | | | | | | | |
| | | Expenses Subject to Possible Reimbursement
until September 30, 2009 |
Fund | | Class A | | Class B | | Class C | | Class Y | | Total |
Core Plus Bond Fund | | $ | 119,781 | | $ | 16,829 | | $ | 18,008 | | $ | 11,848 | | $ | 166,466 |
High Income Fund | | | 87,268 | | | 7,993 | | | 17,578 | | | 1,236 | | | 114,075 |
International Bond | | | 11,799 | | | — | | | 4,529 | | | 113,483 | | | 129,811 |
Limited Term Government and Agency Fund | | | 156,243 | | | 8,567 | | | 11,794 | | | 2,867 | | | 179,471 |
Certain officers and directors of Loomis Sayles and Natixis Advisors are also Trustees of the Funds. Loomis Sayles and Natixis Advisors are both limited partnerships whose sole general partner is indirectly owned by Natixis Global Asset Management, L.P. (“Natixis US”), which is part of Natixis Global Asset Management, an international asset management group based in Paris, France.
b. Administrative Fees. Natixis Advisors provides certain administrative services for the Fund and subcontracts with State Street Bank to serve as sub-administrator. Natixis Advisors is a wholly-owned subsidiary of Natixis US. Pursuant to an agreement among Natixis Funds Trust I, Natixis Funds Trust II, Natixis Funds Trust III, Natixis Funds Trust IV,
70
NOTESTO FINANCIAL STATEMENTS (continued)
September 30, 2008
Natixis Cash Management Trust, Gateway Trust (“Natixis Funds Trusts”), Loomis Sayles Funds I, Loomis Sayles Funds II (“Loomis Sayles Funds Trusts”), Hansberger International Series and Natixis Advisors, each Fund pays Natixis Advisors monthly its pro rata portion of fees equal to an annual rate of 0.0575% of the first $15 billion of the average daily net assets of the Natixis Funds Trusts, Loomis Sayles Funds Trusts and the Hansberger International Series, 0.0500% of the next $15 billion, 0.0425% of the next $30 billion and 0.0375% of such assets in excess of $60 billion, subject to an annual aggregate minimum fee for the Natixis Funds Trusts , Loomis Sayles Funds Trusts and the Hansberger International Series of $10 million, which is reevaluated on an annual basis. New funds are subject to an annual fee of $75,000 plus $12,500 per class and an additional $75,000 if managed by multiple subadvisors in their first calendar year of operations.
Effective October 1, 2007, State Street Bank agreed to reduce the fees it receives from Natixis Advisors for serving as sub-administrator to the Funds. Also, effective October 1, 2007, Natixis Advisors gave a binding contractual undertaking to the Funds to waive the administrative fees paid by the Funds in an amount equal to the reduction in sub-administrative fees discussed above. The waiver was in effect through June 30, 2008.
Prior to July 1, 2008, the Funds paid Natixis Advisors monthly its pro rata portion of fees equal to an annual rate of 0.0675% of the first $5 billion of the average daily net assets of the Natixis Funds Trusts, Loomis Sayles Funds Trusts and the Hansberger International Series, 0.0625% of the next $5 billion, 0.0500% of the next $20 billion and 0.0450% of such assets in excess of $30 billion, subject to an annual aggregate minimum fee for the Natixis Funds Trusts, Loomis Sayles Funds Trusts and the Hansberger International Series of $5 million, which was reevaluated on an annual basis. New funds were subject to an annual fee of $50,000 plus $12,500 per class and an additional $50,000 if managed by multiple subadvisors in their first calendar year of operations.
For the year ended September 30, 2008, amounts paid to Natixis Advisors for administrative fees were as follows:
| | | | | | | | | |
Fund | | Gross Administrative Fees | | Waiver of
Administrative Fees | | Net
Administrative Fees |
Core Plus Bond Fund | | $ | 85,963 | | $ | 3,296 | | $ | 82,667 |
High Income Fund | | | 23,606 | | | 863 | | | 22,743 |
International Bond Fund | | | 55,898 | | | 127 | | | 55,771 |
Limited Term Government and Agency Fund | | | 61,737 | | | 2,419 | | | 59,318 |
Strategic Income Fund | | | 6,138,937 | | | 235,580 | | | 5,903,357 |
c. Service and Distribution Fees. Natixis Distributors, L.P. (“Natixis Distributors”), a wholly owned subsidiary of Natixis US, has entered into a distribution agreement with the Trusts. Pursuant to this agreement, Natixis Distributors serves as principal underwriter of each fund.
Pursuant to Rule 12b-1 under the 1940 Act, the Trusts have adopted a Service Plan relating to each Fund’s Class A shares (the “Class A Plans”) and a Distribution and Service Plan relating to each Fund’s Class B and Class C shares (the “Class B and Class C Plans”).
Under the Class A Plans, each Fund pays Natixis Distributors a monthly service fee at an annual rate not to exceed 0.25% of the average daily net assets attributable to the Fund’s Class A shares, as reimbursement for expenses incurred by Natixis Distributors in providing personal services to investors in Class A shares and/or the maintenance of shareholder accounts.
Under the Class B and Class C Plans, each Fund pays Natixis Distributors a monthly service fee at an annual rate not to exceed 0.25% of the average daily net assets attributable to the Fund’s Class B and Class C shares, as compensation for services provided and expenses incurred by Natixis Distributors in providing personal services to investors in Class B and Class C shares and/or the maintenance of shareholder accounts.
Also under the Class B and Class C Plans, each Fund pays Natixis Distributors a monthly distribution fee at the annual rate of 0.75% of the average daily net assets attributable to the Fund’s Class B and Class C shares, as compensation for services provided and expenses incurred by Natixis Distributors in connection with the marketing or sale of Class B and Class C shares.
For the year ended September 30, 2008, the Funds paid the following service and distribution fees:
| | | | | | | | | | | | | | | |
| | | Service Fee | | Distribution Fee |
Fund | | Class A | | Class B | | Class C | | Class B | | Class C |
Core Plus Bond Fund | | $ | 286,509 | | $ | 43,079 | | $ | 42,089 | | $ | 129,238 | | $ | 126,266 |
High Income Fund | | | 87,807 | | | 8,152 | | | 17,747 | | | 24,457 | | | 53,241 |
International Bond Fund | | | 1,596 | | | — | | | 611 | | | — | | | 1,834 |
Limited Term Government and Agency Fund | | | 253,877 | | | 14,050 | | | 18,287 | | | 42,150 | | | 54,859 |
Strategic Income Fund | | | 16,174,107 | | | 524,136 | | | 11,021,374 | | | 1,572,408 | | | 33,064,120 |
71
NOTESTO FINANCIAL STATEMENTS (continued)
September 30, 2008
d. Sub-Transfer Agent Fees and Expenses. Natixis Distributors has entered into agreements with financial intermediaries to provide certain recordkeeping, processing, shareholder communications and other services to customers of the intermediaries and has agreed to compensate the intermediaries for providing those services. Certain services would be provided by the Funds if the shares of those customers were registered directly with the Funds’ transfer agent. Accordingly, the Funds agreed to pay a portion of the intermediary fees attributable to shares of the Fund held by the intermediary (which generally are a percentage of the value of shares held) not exceeding what the Funds would have paid its transfer agent had each customer’s shares been registered directly with the transfer agent instead of held through the intermediary. Natixis Distributors pays the remainder of the fees. Listed below are the fees incurred by the Funds which are included in the transfer agent fees and expenses in the Statements of Operations.
| | | | | | | | | | | | |
| | | Sub-Transfer Agent Expense |
Fund | | Class A | | Class B | | Class C | | Class Y |
Core Plus Bond Fund | | $ | 73,883 | | $ | 10,543 | | $ | 10,396 | | $ | 21,440 |
High Income Fund | | | 12,194 | | | 1,236 | | | 2,369 | | | 5 |
International Bond Fund | | | 153 | | | — | | | 59 | | | 36 |
Limited Term Government and Agency Fund | | | 23,650 | | | 1,275 | | | 1,569 | | | 1,098 |
Strategic Income Fund | | | 3,867,184 | | | 129,909 | | | 2,647,064 | | | 637,999 |
e. Commissions. The Funds have been informed that commissions (including CDSC) on Fund shares paid to Natixis Distributors by investors in shares of the Funds during the year ended September 30, 2008 were as follows:
| | | |
Fund | | Commission |
Core Plus Bond Fund | | $ | 138,007 |
High Income Fund | | | 90,309 |
International Bond Fund | | | 24,695 |
Limited Term Government and Agency Fund | | | 68,043 |
Strategic Income Fund | | | 10,524,352 |
f. Trustees Fees and Expenses. The Funds do not pay any compensation directly to their officers or Trustees who are directors, officers or employees of Natixis Advisors, Natixis Distributors, Natixis US, or their affiliates. The Chairperson of the Board receives a retainer fee at the annual rate of $200,000. The Chairperson does not receive any meeting attendance fees for Board of Trustees meetings or committee meetings that she attends. Each Independent Trustee (other than the Chairperson) receives, in the aggregate, a retainer fee at the annual rate of $65,000. Each Independent Trustee also receives a meeting attendance fee of $7,500 for each meeting of the Board of Trustees that he or she attends in person and $3,750 for each meeting of the Board of Trustees that he or she attends telephonically. In addition, each committee chair receives an additional retainer fee at the annual rate of $10,000. Each Contract Review and Governance Committee member is compensated $5,000 for each Committee meeting that he or she attends in person and $2,500 for each meeting that he or she attends telephonically. Each Audit Committee member is compensated $6,250 for each Committee meeting that he or she attends in person and $3,125 for each meeting that he or she attends telephonically. These fees are allocated among the funds in the Natixis Funds Trusts, Loomis Sayles Funds Trusts and the Hansberger International Series based on a formula that takes into account, among other factors, the relative net assets of each Fund. Trustees are reimbursed for travel expenses in connection with attendance at meetings.
Prior to January 1, 2008, each Independent Trustee (other than the Chairperson) received, in the aggregate, a retainer fee at the annual rate of $55,000. Each Independent Trustee also received a meeting attendance fee of $6,000 for each meeting of the Board of Trustees that he or she attended in person and $3,000 for each meeting that he or she attended telephonically. In addition, each Contract Review and Governance Committee member received $4,000 for each committee meeting that he or she attended in person and $2,000 for each committee meeting that he or she attended telephonically. Each Audit Committee member received $5,000 for each committee meeting that he or she attended in person and $2,500 for each committee meeting that he or she attended telephonically. The Chairperson of the Board and committee chair retainers were $200,000 and $10,000, respectively.
A deferred compensation plan (the “Plan”) is available to the Trustees on a voluntary basis. Deferred amounts remain in the Funds until distributed in accordance with the provisions of the Plan. The value of a participating Trustee’s deferral account is based on theoretical investments of deferred amounts, on the normal payment dates, in certain funds of the Natixis Funds Trusts, Loomis Sayles Funds Trusts and Hansberger International Series as designated by the participating Trustees. Changes in the value of participants’ deferral accounts are allocated pro rata among the funds in the Natixis Funds Trusts, Loomis Sayles Funds Trusts, and Hansberger International Series, and are reflected as Trustees’ fees and expenses in the Statements of Operations. The portions of the accrued obligations allocated to the Funds under the Plan are reflected as Deferred Trustees’ fees in the Statements of Assets and Liabilities.
g. Redemption Fees. Shareholders of Class A shares of High Income Fund are charged a 2% redemption fee if they redeem, including redeeming by exchange within 60 days of acquisition (including acquisition by exchange). The redemption fee is intended to offset the cost to the Fund of short-term trading, such as portfolio transaction and market impact costs associated with redemption activity and administrative costs associated with processing redemptions. The redemption fee is deducted from the shareholder’s redemption or exchange proceeds and is paid to the Fund. The “first-in, first-out” method is used to determine the holding period of redeemed or exchanged shares, which
72
NOTESTO FINANCIAL STATEMENTS (continued)
September 30, 2008
means that if a shareholder acquired shares on different days, the shares acquired first will be redeemed or exchanged first for purposes of determining whether the redemption fee applies. A new holding period begins with each purchase or exchange. These fees are accounted for as an addition to paid-in capital and are presented on the Statements of Changes in Net Assets.
Effective June 2, 2008, the redemption fee imposed on Class A shares of Core Plus Bond Fund, International Bond Fund and Strategic Income Fund and shareholders of Class Y shares of Core Plus Bond Fund, International Bond Fund and Strategic Income Fund was eliminated. Prior to June 2, 2008, shareholders of Class A and Class Y shares of the Funds were charged a 2% redemption fee if they redeem, including redeeming by exchange, such shares within 60 days of their acquisition (including acquisition by exchange). The redemption fee was deducted from the shareholder’s redemption or exchange proceeds and was paid to the Funds. These fees were accounted for as an addition to paid-in capital and are presented on the Statements of Changes in Net Assets.
5. Line of Credit. Each Fund together with certain other funds of Natixis Funds Trusts, Loomis Sayles Funds Trusts and the Hansberger International Series, participates in a $200,000,000 committed line of credit provided by State Street Bank, with an individual limit of $125,000,000 for each fund that participates in the line of credit. Interest is charged to each participating fund based on its borrowings at a rate per annum equal to the Federal Funds rate plus 0.50%. In addition, a commitment fee of 0.09% per annum, payable at the end of each calendar quarter, is accrued and apportioned among the participating funds based on their average daily unused portion of the line of credit.
Prior to March 12, 2008, High Income Fund and Strategic Income Fund together with certain other funds of Natixis Funds Trusts and Loomis Sayles Funds Trusts and Hansberger International Series, participated in a $75,000,000 committed line of credit provided by State Street Bank.
For the year ended September 30, 2008, the Funds had no borrowings under these agreements.
6. Concentration of Risk. International Bond Fund is a non-diversified fund. Compared with diversified mutual funds, the International Bond Fund may invest a greater percentage of its assets in a particular country. Therefore, the International Bond Fund’s returns could be significantly affected by the performance of any one of the small number of countries in its portfolio.
7. Shareholders. At September 30, 2008, the Loomis Sayles Employees’ Profit Sharing Retirement Plan held 10,697 shares of beneficial interest of Limited Term Government and Agency Fund. At September 30, 2008, Natixis US owned shares equating to 74.23% of International Bond Fund’s net assets.
8. Capital Shares. Each Fund may issue an unlimited number of shares of beneficial interest, without par value. Transactions in capital shares were as follows:
| | | | | | | | | | | | | | |
| | Year Ended September 30, 2008 | | | Year Ended September 30, 2007 | |
Core Plus Bond Fund | | Shares | | | | Amount | | | Shares | | | | Amount | |
| | | | | | | | | | | | | | |
| Class A | | | | | | | | | | | | | | |
Issued from the sale of shares | | 3,961,377 | | | $ | 44,610,104 | | | 2,862,355 | | | $ | 32,253,428 | |
Issued in connection with the reinvestment of distributions | | 416,060 | | | | 4,674,418 | | | 327,958 | | | | 3,693,825 | |
Redeemed | | (2,742,021 | ) | | | (30,840,053 | ) | | (1,977,946 | ) | | | (22,285,053 | ) |
| | | | | | | | | | | | | | |
Net change | | 1,635,416 | | | $ | 18,444,469 | | | 1,212,367 | | | $ | 13,662,200 | |
| | | | | | | | | | | | | | |
| Class B | | | | | | | | | | | | | | |
Issued from the sale of shares | | 81,830 | | | $ | 928,726 | | | 2,199,092 | | | $ | 24,806,440 | |
Issued in connection with the reinvestment of distributions | | 43,582 | | | | 492,099 | | | 70,968 | | | | 800,778 | |
Redeemed | | (6,832,567 | ) | | | (77,200,182 | ) | | (4,340,292 | ) | | | (48,938,825 | ) |
| | | | | | | | | | | | | | |
Net change | | (6,707,155 | ) | | $ | (75,779,357 | ) | | (2,070,232 | ) | | $ | (23,331,607 | ) |
| | | | | | | | | | | | | | |
| Class C | | | | | | | | | | | | | | |
Issued from the sale of shares | | 1,866,796 | | | $ | 20,868,873 | | | 686,381 | | | $ | 7,745,373 | |
Issued in connection with the reinvestment of distributions | | 25,095 | | | | 281,730 | | | 13,038 | | | | 146,800 | |
Redeemed | | (483,069 | ) | | | (5,447,710 | ) | | (199,397 | ) | | | (2,240,505 | ) |
| | | | | | | | | | | | | | |
Net change | | 1,408,822 | | | $ | 15,702,893 | | | 500,022 | | | $ | 5,651,668 | |
| | | | | | | | | | | | | | |
| Class Y | | | | | | | | | | | | | | |
Issued from the sale of shares | | 1,132,575 | | | $ | 12,755,055 | | | 598,492 | | | $ | 6,770,657 | |
Issued in connection with the reinvestment of distributions | | 44,572 | | | | 502,262 | | | 36,251 | | | | 410,202 | |
Redeemed | | (654,873 | ) | | | (7,360,390 | ) | | (293,171 | ) | | | (3,314,000 | ) |
| | | | | | | | | | | | | | |
Net change | | 522,274 | | | $ | 5,896,927 | | | 341,572 | | | $ | 3,866,859 | |
| | | | | | | | | | | | | | |
Increase (decrease) from capital share transactions | | (3,140,643 | ) | | $ | (35,735,068 | ) | | (16,271 | ) | | $ | (150,880 | ) |
| | | | | | | | | | | | | | |
73
NOTESTO FINANCIAL STATEMENTS (continued)
September 30, 2008
8. Capital Shares (continued).
| | | | | | | | | | | | | | |
| | Year Ended September 30, 2008 | | | Year Ended September 30, 2007 | |
High Income Fund | | Shares | | | | Amount | | | Shares | | | | Amount | |
| | | | | | | | | | | | | | |
| Class A | | | | | | | | | | | | | | |
Issued from the sale of shares | | 4,904,752 | | | $ | 23,822,307 | | | 2,247,757 | | | $ | 11,689,925 | |
Issued in connection with the reinvestment of distributions | | 378,438 | | | | 1,831,932 | | | 295,946 | | | | 1,539,928 | |
Redeemed | | (2,555,411 | ) | | | (12,401,358 | ) | | (1,884,840 | ) | | | (9,783,658 | ) |
| | | | | | | | | | | | | | |
Net change | | 2,727,779 | | | $ | 13,252,881 | | | 658,863 | | | $ | 3,446,195 | |
| | | | | | | | | | | | | | |
| Class B | | | | | | | | | | | | | | |
Issued from the sale of shares | | 44,248 | | | $ | 206,339 | | | 106,656 | | | $ | 557,060 | |
Issued in connection with the reinvestment of distributions | | 26,234 | | | | 128,112 | | | 39,879 | | | | 208,208 | |
Redeemed | | (356,172 | ) | | | (1,746,563 | ) | | (756,563 | ) | | | (3,941,404 | ) |
| | | | | | | | | | | | | | |
Net change | | (285,690 | ) | | $ | (1,412,112 | ) | | (610,028 | ) | | $ | (3,176,136 | ) |
| | | | | | | | | | | | | | |
| Class C | | | | | | | | | | | | | | |
Issued from the sale of shares | | 1,607,159 | | | $ | 7,812,971 | | | 479,271 | | | $ | 2,499,368 | |
Issued in connection with the reinvestment of distributions | | 53,048 | | | | 255,350 | | | 30,663 | | | | 159,675 | |
Redeemed | | (346,620 | ) | | | (1,670,004 | ) | | (159,243 | ) | | | (825,637 | ) |
| | | | | | | | | | | | | | |
Net change | | 1,313,587 | | | $ | 6,398,317 | | | 350,691 | | | $ | 1,833,406 | |
| | | | | | | | | | | | | | |
| Class Y* | | | | | | | | | | | | | | |
Issued from the sale of shares | | 922,271 | | | $ | 4,329,547 | | | — | | | $ | — | |
Issued in connection with the reinvestment of distributions | | 9,401 | | | | 42,724 | | | — | | | | — | |
Redeemed | | (27,536 | ) | | | (125,340 | ) | | — | | | | — | |
| | | | | | | | | | | | | | |
Net change | | 904,136 | | | $ | 4,246,931 | | | — | | | $ | — | |
| | | | | | | | | | | | | | |
Increase (decrease) from capital share transactions | | 4,659,812 | | | $ | 22,486,017 | | | 399,526 | | | $ | 2,103,465 | |
| | | | | | | | | | | | | | |
* From commencement of operations on February 29, 2008 through September 30, 2008.
| | | | | | | | | | | | |
| | Period Ended September 30, 2008** | | | Year Ended September 30, 2007 |
International Bond Fund | | Shares | | | | Amount | | | Shares | | | Amount |
| | | | | | | | | | | | |
| Class A | | | | | | | | | | | | |
Issued from the sale of shares | | 327,200 | | | $ | 3,256,979 | | | — | | $ | — |
Issued in connection with the reinvestment of distributions | | 1,505 | | | | 14,727 | | | — | | | — |
Redeemed | | (116,234 | ) | | | (1,149,151 | ) | | — | | | — |
| | | | | | | | | | | | |
Net change | | 212,471 | | | $ | 2,122,555 | | | — | | $ | — |
| | | | | | | | | | | | |
| Class C | | | | | | | | | | | | |
Issued from the sale of shares | | 101,736 | | | $ | 1,017,705 | | | — | | $ | — |
Issued in connection with the reinvestment of distributions | | 284 | | | | 2,804 | | | — | | | — |
Redeemed | | (27,588 | ) | | | (272,845 | ) | | — | | | — |
| | | | | | | | | | | | |
Net change | | 74,432 | | | $ | 747,664 | | | — | | $ | — |
| | | | | | | | | | | | |
| Class Y | | | | | | | | | | | | |
Issued from the sale of shares | | 1,079,358 | | | $ | 10,809,876 | | | — | | $ | — |
Issued in connection with the reinvestment of distributions | | 21,719 | | | | 215,650 | | | — | | | — |
Redeemed | | (13,547 | ) | | | (132,409 | ) | | — | | | — |
| | | | | | | | | | | | |
Net change | | 1,087,530 | | | $ | 10,893,117 | | | — | | $ | — |
| | | | | | | | | | | | |
Increase (decrease) from capital share transactions | | 1,374,433 | | | $ | 13,763,336 | | | — | | $ | — |
| | | | | | | | | | | | |
** From commencement of operations on February 1, 2008 through September 30, 2008.
74
NOTESTO FINANCIAL STATEMENTS (continued)
September 30, 2008
8. Capital Shares (continued).
| | | | | | | | | | | | | | |
| | Year Ended September 30, 2008 | | | Year Ended September 30, 2007 | |
Limited Term Government and Agency Fund | | Shares | | | | Amount | | | Shares | | | | Amount | |
| | | | | | | | | | | | | | |
| Class A | | | | | | | | | | | | | | |
Issued from the sale of shares | | 2,035,015 | | | $ | 22,451,140 | | | 1,309,019 | | | $ | 14,378,605 | |
Issued in connection with the reinvestment of distributions | | 269,896 | | | | 2,982,151 | | | 292,426 | | | | 3,213,916 | |
Redeemed | | (2,604,784 | ) | | | (28,704,540 | ) | | (2,117,193 | ) | | | (23,272,778 | ) |
| | | | | | | | | | | | | | |
Net change | | (299,873 | ) | | $ | (3,271,249 | ) | | (515,748 | ) | | $ | (5,680,257 | ) |
| | | | | | | | | | | | | | |
| Class B | | | | | | | | | | | | | | |
Issued from the sale of shares | | 67,405 | | | $ | 747,264 | | | 52,757 | | | $ | 579,223 | |
Issued in connection with the reinvestment of distributions | | 16,247 | | | | 179,371 | | | 22,869 | | | | 251,120 | |
Redeemed | | (288,166 | ) | | | (3,175,026 | ) | | (364,484 | ) | | | (3,999,981 | ) |
| | | | | | | | | | | | | | |
Net change | | (204,514 | ) | | $ | (2,248,391 | ) | | (288,858 | ) | | $ | (3,169,638 | ) |
| | | | | | | | | | | | | | |
| Class C | | | | | | | | | | | | | | |
Issued from the sale of shares | | 1,833,502 | | | $ | 20,260,185 | | | 217,432 | | | $ | 2,387,379 | |
Issued in connection with the reinvestment of distributions | | 13,505 | | | | 149,095 | | | 9,729 | | | | 106,924 | |
Redeemed | | (257,963 | ) | | | (2,855,031 | ) | | (133,821 | ) | | | (1,470,673 | ) |
| | | | | | | | | | | | | | |
Net change | | 1,589,044 | | | $ | 17,554,249 | | | 93,340 | | | $ | 1,023,630 | |
| | | | | | | | | | | | | | |
| Class Y | | | | | | | | | | | | | | |
Issued from the sale of shares | | 367,309 | | | $ | 4,065,238 | | | 217,392 | | | $ | 2,396,763 | |
Issued in connection with the reinvestment of distributions | | 13,550 | | | | 150,194 | | | 12,038 | | | | 132,694 | |
Redeemed | | (164,425 | ) | | | (1,829,051 | ) | | (71,670 | ) | | | (782,866 | ) |
| | | | | | | | | | | | | | |
Net change | | 216,434 | | | $ | 2,386,381 | | | 157,760 | | | $ | 1,746,591 | |
| | | | | | | | | | | | | | |
Increase (decrease) from capital share transactions | | 1,301,091 | | | $ | 14,420,990 | | | (553,506 | ) | | $ | (6,079,674 | ) |
| | | | | | | | | | | | | | |
| | |
| | Year Ended September 30, 2008 | | | Year Ended September 30, 2007 | |
Strategic Income Fund | | Shares | | | | Amount | | | Shares | | | | Amount | |
| | | | | | | | | | | | | | |
| Class A | | | | | | | | | | | | | | |
Issued from the sale of shares | | 197,552,720 | | | $ | 2,901,194,415 | | | 227,999,564 | | | $ | 3,401,598,542 | |
Issued in connection with the reinvestment of distributions | | 22,956,546 | | | | 331,016,205 | | | 11,338,684 | | | | 169,415,802 | |
Redeemed | | (140,438,578 | ) | | | (1,990,731,186 | ) | | (51,264,181 | ) | | | (764,388,527 | ) |
| | | | | | | | | | | | | | |
Net change | | 80,070,688 | | | $ | 1,241,479,434 | | | 188,074,067 | | | $ | 2,806,625,817 | |
| | | | | | | | | | | | | | |
| Class B | | | | | | | | | | | | | | |
Issued from the sale of shares | | 410,099 | | | $ | 6,009,632 | | | 5,257,203 | | | $ | 78,803,755 | |
Issued in connection with the reinvestment of distributions | | 401,421 | | | | 5,839,477 | | | 304,859 | | | | 4,574,346 | |
Redeemed | | (2,816,244 | ) | | | (41,124,244 | ) | | (2,532,198 | ) | | | (37,899,012 | ) |
| | | | | | | | | | | | | | |
Net change | | (2,004,724 | ) | | $ | (29,275,135 | ) | | 3,029,864 | | | $ | 45,479,089 | |
| | | | | | | | | | | | | | |
| Class C | | | | | | | | | | | | | | |
Issued from the sale of shares | | 118,265,590 | | | $ | 1,746,293,697 | | | 144,314,933 | | | $ | 2,160,951,327 | |
Issued in connection with the reinvestment of distributions | | 7,195,646 | | | | 104,006,617 | | | 3,151,961 | | | | 47,297,035 | |
Redeemed | | (49,785,407 | ) | | | (709,035,285 | ) | | (19,028,982 | ) | | | (284,966,223 | ) |
| | | | | | | | | | | | | | |
Net change | | 75,675,829 | | | $ | 1,141,265,029 | | | 128,437,912 | | | $ | 1,923,282,139 | |
| | | | | | | | | | | | | | |
| Class Y | | | | | | | | | | | | | | |
Issued from the sale of shares | | 47,274,736 | | | $ | 690,204,820 | | | 29,854,706 | | | $ | 445,418,950 | |
Issued in connection with the reinvestment of distributions | | 1,084,519 | | | | 15,512,730 | | | 346,573 | | | | 5,174,756 | |
Redeemed | | (25,704,216 | ) | | | (361,225,740 | ) | | (6,672,173 | ) | | | (99,332,888 | ) |
| | | | | | | | | | | | | | |
Net change | | 22,655,039 | | | $ | 344,491,810 | | | 23,529,106 | | | $ | 351,260,818 | |
| | | | | | | | | | | | | | |
Increase (decrease) from capital share transactions | | 176,396,832 | | | $ | 2,697,961,138 | | | 343,070,949 | | | $ | 5,126,647,863 | |
| | | | | | | | | | | | | | |
75
REPORTOF INDEPENDENT REGISTERED PUBLIC ACCOUNTING FIRM
To the Trustees of Natixis Funds Trust I and Loomis Sayles Funds II and Shareholders of Loomis Sayles Core Plus Bond Fund, Loomis Sayles High Income Fund, Loomis Sayles International Bond Fund, Loomis Sayles Limited Term Government and Agency Fund, and Loomis Sayles Strategic Income Fund:
In our opinion, the accompanying statements of assets and liabilities, including the portfolios of investments, and the related statements of operations and of changes in net assets and the financial highlights present fairly, in all material respects, the financial position of Loomis Sayles Core Plus Bond Fund, a series of Natixis Funds Trust I, and Loomis Sayles High Income Fund, Loomis Sayles International Bond Fund, Loomis Sayles Limited Term Government and Agency Fund and Loomis Sayles Strategic Income Fund, each a series of Loomis Sayles Funds II (collectively, “the Funds”), at September 30, 2008, and the results of each of their operations, the changes in each of their net assets and the financial highlights for each of the periods indicated, in conformity with accounting principles generally accepted in the United States of America. These financial statements and financial highlights (hereafter referred to as “financial statements”) are the responsibility of the Funds’ management; our responsibility is to express an opinion on these financial statements based on our audits. We conducted our audits of these financial statements in accordance with the standards of the Public Company Accounting Oversight Board (United States). Those standards require that we plan and perform the audits to obtain reasonable assurance about whether the financial statements are free of material misstatement. An audit includes examining, on a test basis, evidence supporting the amounts and disclosures in the financial statements, assessing the accounting principles used and significant estimates made by management, and evaluating the overall financial statement presentation. We believe that our audits, which included confirmation of securities at September 30, 2008 by correspondence with the custodian and brokers, provide a reasonable basis for our opinion.
PricewaterhouseCoopers LLP
Boston, Massachusetts
November 21, 2008
76
2008 U.S. TAX DISTRIBUTION INFORMATIONTO SHAREHOLDERS (unaudited)
Corporate Dividends Received Deduction. For the fiscal year ended September 30, 2008, a percentage of dividends distributed by the Funds listed below qualify for the dividends received deduction for corporate shareholders. These percentages are as follows:
| | | |
Fund | | Qualifying
Percentage | |
High Income Fund | | 2.16 | % |
Strategic Income Fund | | 3.03 | % |
Capital Gains Distributions. Pursuant to Internal Revenue Section 852(b), the following Funds paid distributions, which have been designated as capital gains distributions for the fiscal year ended September 30, 2008.
| | | |
Fund | | Amount |
Strategic Income Fund | | $ | 9,533,629 |
Qualified Dividend Income. For the fiscal year ended September 30, 2008, the Funds below will designate up to the maximum amount allowable pursuant to the Internal Revenue Code as qualified dividend income eligible for reduced tax rates. These lower rates range from 5% to 15% depending on an individual’s tax bracket. If the Funds pay a distribution during calendar year 2008, complete information will be reported in conjunction with Form 1099-DIV.
| | |
Fund | | |
Core Plus Bond Fund | | |
High Income Fund | | |
Strategic Income Fund | | |
77
TRUSTEEAND OFFICER INFORMATION
The tables below provide certain information regarding the Trustees and officers of Natixis Funds Trust I and Loomis Sayles Funds II (the “Trusts”). Unless otherwise indicated, the address of all persons below is 399 Boylston Street, Boston, MA 02116. The Trusts’ Statements of Additional Information include additional information about the Trustees of the Trusts are available by calling Loomis Sayles at 800-314-2029.
| | | | | | |
Name and Year of Birth | | Position(s) Held with the Trusts, Length of Time Served and Term of Office* | | Principal Occupation(s) During Past 5 Years** | | Number of Portfolios in Fund Complex Overseen*** and Other Directorships Held |
| | | |
| INDEPENDENT TRUSTEES | | | | | | |
| | | |
Graham T. Allison, Jr. (1940) | | Trustee Since 1984 for Natixis Funds Trust I (including its predecessors) and since 2003 for Loomis Sayles Funds II Contract Review and Governance Committee Member | | Douglas Dillon Professor and Director of the Belfer Center for Science and International Affairs, John F. Kennedy School of Government, Harvard University | | 41 Director, Taubman Centers, Inc. (real estate investment trust) |
| | | |
Charles D. Baker (1956) | | Trustee Since 2005 Contract Review and Governance Committee Member | | President and Chief Executive Officer, Harvard Pilgrim Health Care (health plan) | | 41 None |
| | | |
Edward A. Benjamin (1938) | | Trustee Since 2003 for Natixis Funds Trust I and since 2002 for Loomis Sayles Funds II Chairman of the Contract Review and Governance Committee | | Retired | | 41 None |
| | | |
Daniel M. Cain (1945) | | Trustee Since 1996 for Natixis Funds Trust I and since 2003 for Loomis Sayles Funds II Chairman of the Audit Committee | | President and Chief Executive Officer, Cain Brothers & Company, Incorporated (investment banking) | | 41 Director, Sheridan Healthcare Inc. (physician practice management) |
| | | |
Kenneth A. Drucker (1945) | | Trustee Since 2008 Contract Review and Governance Committee Member | | Formerly, Treasurer, Sequa Corp. (manufacturing) | | 41 Director, M Fund, Inc. (registered investment company) |
| | | |
Jonathan P. Mason (1958) | | Trustee Since 2007 Audit Committee Member | | Chief Financial Officer, Cabot Corp. (specialty chemicals); formerly, Vice President and Treasurer, International Paper Company; formerly, Chief Financial Officer, Carter Holt Harvey (forest products) | | 41 None |
78
TRUSTEEAND OFFICER INFORMATION
| | | | | | |
Name and Year of Birth | | Position(s) Held with the Trusts, Length of Time Served and Term of Office* | | Principal Occupation(s) During Past 5 Years** | | Number of Portfolios in Fund Complex Overseen*** and Other Directorships Held |
| | | |
INDEPENDENT TRUSTEES
continued | | | | | | |
| | | |
Sandra O. Moose (1942) | | Chairperson of the Board of Trustees since November 2005 Trustee since 1982 for Natixis Funds Trust I (including its predecessors) and since 2003 for Loomis Sayles Funds II Ex officio member of the Audit Committee and Contract Review and Governance Committee | | President, Strategic Advisory Services (management consulting); formerly, Senior Vice President and Director, The Boston Consulting Group, Inc. (management consulting) | | 41 Director, Verizon Communications; Director, Rohm and Haas Company (specialty chemicals); Director, AES Corporation (international power company) |
| | | |
Cynthia L. Walker (1956) | | Trustee Since 2005 Audit Committee Member | | Deputy Dean for Finance and Administration, Yale University School of Medicine; formerly, Executive Dean for Administration, Harvard Medical School; and formerly, Dean for Finance & Chief Financial Officer, Harvard Medical School | | 41 None |
79
TRUSTEEAND OFFICER INFORMATION
| | | | | | |
Name and Year of Birth | | Position(s) Held with the Trusts, Length of Time Served and Term of Office* | | Principal Occupation(s) During Past 5 Years** | | Number of Portfolios in Fund Complex Overseen*** and Other Directorships Held |
|
| INTERESTED TRUSTEES |
| | | |
Robert J. Blanding1 (1947) 555 California Street San Francisco, CA 94104 | | Trustee Since 2003 for Natixis Funds Trust I Chief Executive Officer and Trustee for Loomis Sayles Funds II since 2002 | | President, Chairman, Director and Chief Executive Officer, Loomis, Sayles & Company, L.P. | | 41 None |
| | | |
John T. Hailer2 (1960) | | Trustee Since 2000 for Natixis Funds Trust I and since 2003 for Loomis Sayles Funds II | | President and Chief Executive Officer-U.S. and Asia, Natixis Global Asset Management, L.P.; formerly, President and Chief Executive Officer, Natixis Distribution Corporation, Natixis Asset Management Advisors, L.P., Natixis Distributors, L.P. and Natixis Global Associates, Inc. | | 41 None |
| * | Each Trustee serves until retirement, resignation or removal from the Board of Trustees. The current retirement age is 72. The position of Chairperson of the Board is appointed for a two-year term. Ms. Moose was appointed to serve an additional two-year term as the Chairperson of the Board of Trustees on September 14, 2007. |
| ** | Each person listed above, except as noted, holds the same position(s) with the Natixis Funds Trust I, Natixis Funds Trust II, Natixis Funds Trust III, Natixis Funds Trust IV, Gateway Trust and the Natixis Cash Management Trust (collectively, the “Natixis Funds Trusts”), Loomis Sayles Funds I and Loomis Sayles Funds II (collectively, the “Loomis Sayles Funds Trusts”), and Hansberger International Series. Previous positions during the past five years with Natixis Distributors, L.P. (the “Distributor”), Natixis Asset Management Advisors, L.P. (“Natixis Advisors”), or Loomis, Sayles & Company, L.P. are omitted if not materially different from a Trustee’s or officer’s current position with such entity. |
| *** | The Trustees of the Trusts serve as trustees of a fund complex that includes all series of the Natixis Funds Trusts, the Loomis Sayles Funds Trusts and Hansberger International Series (collectively, the “Fund Complex”). |
1 | Mr. Blanding is deemed an “interested person” of the Trusts because he holds the following positions with affiliated persons of the Trusts: President, Chairman, Director and Chief Executive Officer of Loomis, Sayles & Company, L.P. |
2 | Mr. Hailer is deemed an “interested person” of the Trusts because he holds the following positions with affiliated persons of the Trusts: President and Chief Executive Officer-U.S. and Asia, Natixis Global Asset Management, L.P. |
80
TRUSTEEAND OFFICER INFORMATION
| | | | | | |
Name and Year of Birth | | Position(s) Held with the Trusts | | Term of Office* and Length of Time Served | | Principal Occupation During Past 5 Years** |
|
| OFFICERS OF THE TRUST |
| | | |
Coleen Downs Dinneen (1960) | | Secretary, Clerk and Chief Legal Officer | | Since September 2004 | | Executive Vice President, General Counsel, Secretary and Clerk (formerly, Senior Vice President, Deputy General Counsel, Assistant Secretary and Assistant Clerk), Natixis Distribution Corporation, Natixis Asset Management Advisors, L.P. and Natixis Distributors, L.P. |
| | | |
Daniel J. Fuss (1933) One Financial Center Boston, MA 02111 | | Executive Vice President of Loomis Sayles Funds II | | Since June 2003 | | Vice Chairman and Director, Loomis, Sayles & Company, L.P. |
| | | |
David Giunta (1965) | | President and Chief Executive Officer of Natixis Funds Trust I and President of Loomis Sayles Funds II | | Since March 2008 | | President and Chief Executive Officer, Natixis Distribution Corporation, Natixis Asset Management Advisors, L.P. and Natixis Distributors, L.P.; formerly, President, Fidelity Charitable Gift Fund; and formerly, Senior Vice President, Fidelity Brokerage Company |
| | | |
Russell L. Kane (1969) | | Chief Compliance Officer, Assistant Secretary and Anti-Money Laundering Officer | | Chief Compliance Officer since May 2006; Assistant Secretary since June 2004; and Anti-Money Laundering Officer since April 2007 | | Chief Compliance Officer for Mutual Funds, Senior Vice President, Deputy General Counsel, Assistant Secretary and Assistant Clerk, Natixis Distribution Corporation, Natixis Asset Management Advisors, L.P. and Natixis Distributors, L.P.; and formerly, Senior Counsel, Columbia Management Group |
81
TRUSTEEAND OFFICER INFORMATION
| | | | | | |
Name and Year of Birth | | Position(s) Held
with the Trusts | | Term of Office* and Length of Time Served | | Principal Occupation
During Past 5 Years** |
|
OFFICERS OF THE TRUST continued |
| | | |
Michael C. Kardok (1959) | | Treasurer, Principal Financial and Accounting Officer | | Since October 2004 | | Senior Vice President, Natixis Asset Management Advisors, L.P. and Natixis Distributors, L.P.; and formerly, Senior Director, PFPC Inc. |
| | | |
Robert Krantz (1964) | | Executive Vice President | | Since September 2007 | | Executive Vice President, Natixis Asset Management Advisors, L.P. and Natixis Distributors, L.P. |
| * | Each officer of the Trusts serves for an indefinite term in accordance with the Trusts’ current By-laws until the date his or her successor is elected and qualified, or until he or she sooner dies, retires, is removed or becomes disqualified. |
| ** | Each person listed above, except as noted, holds the same position(s) with the Natixis Funds Trusts, Loomis Sayles Funds Trusts and Hansberger International Series. Mr. Fuss is not an officer of the Natixis Funds Trusts or the Hansberger International Series. Previous positions during the past five years with the Distributor, Natixis Advisors or Loomis Sayles are omitted if not materially different from a Trustee’s or officer’s current position with such entity. |
82
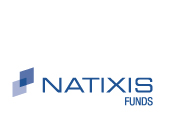
EQUITY FUNDS
ANNUAL REPORT
September 30, 2008
Loomis Sayles Global Markets Fund
Loomis Sayles Growth Fund
Loomis Sayles Research Fund
Loomis Sayles Value Fund


TABLE OF CONTENTS
Management Discussion and Performance page 1
Portfolio of Investments page 16
Financial Statements page 31
LOOMIS SAYLES GLOBAL MARKETS FUND
PORTFOLIO PROFILE
Objective:
Seeks high total return through a combination of capital appreciation and current income
Strategy:
Invests primarily in equity and fixed-income securities of U.S. and foreign issuers, including securities of issuers located in emerging markets
Fund Inception:
May 1, 1996
Managers:
Mark Baribeau, CFA
Dan Fuss, CFA, CIC
Warren Koontz, CFA, CIC
David Rolley, CFA
Loomis, Sayles & Company, L.P.
Symbols:
| | |
| Class A | | LGMAX |
| Class C | | LGMCX |
| Class Y | | LSWWX |
What You Should Know:
The fund can invest a significant percentage of assets in foreign securities and the value of the fund shares can be adversely affected by changes in currency exchange rates, political, and economic developments. In emerging markets these risks can be significant. The fund can invest a significant percentage of assets in debt securities that are rated below investment grade and the value of fund shares can be adversely affected by changes in economic conditions or other circumstances. In addition, the secondary market for these securities may lack liquidity. Fund shares should be viewed as a long-term investment.
Management Discussion
Negative news swept through the financial markets during the 12 months ended September 30, 2008, reaching a crescendo in the closing months, as investor fears accelerated and spread through global stock and bond markets.
Throughout the period, Loomis Sayles Global Markets Fund remained weighted toward stocks, which underperformed global bonds. The fund’s return was -21.87% for the fiscal year ended September 30, 2008, based on the net asset value of Class A shares and $0.53 in dividends and $0.44 in capital gains reinvested during the period. The fund outperformed its primary benchmark, the MSCI World Index (common stocks from developed countries around the world), which returned -25.62%. Its secondary benchmark, Citigroup World Government Bond Index (government bonds issued in the United States and other developed countries) returned 5.90%. The average return on Morningstar’s World Allocation category (primarily global equity funds) was -17.07% for the period.
WHICH WERE THE BEST AND WORST SECTORS?
Fiscal year 2008 included a market-wide sell-off that affected all sectors in both the equity and bond markets. While no sector posted positive returns on an absolute basis, the fund’s equity holdings in the financial sector held up relatively well. Some of our best-performing individual stocks were credit card processor MasterCard and financial giants JPMorgan Chase and Wells Fargo. After declining through mid July, JPMorgan and Wells Fargo emerged as survivors. McDonald’s also held up well on the strength of its pledge to raise its return to shareholders. The fund’s fixed-income performance was supported by our emphasis on high-quality issues and select local currency markets, including the Japanese yen and the U.S. dollar.
On a sector basis, information technology stocks underperformed, weighed down by concerns about a global economic slowdown. Specific equity holdings that hurt were Apple, Goldman Sachs and Google. Apple has been gaining market share, but investors remained concerned about its ability to grow in a slowing economy. Relative to its peers, Goldman held up well and was still profitable as of September 30, 2008, but it too succumbed to the negative pressures on financial companies. Shares of Google were down after the internet search company’s revenue and profits fell short of expectations. We sold Goldman stock, but some of its bonds remain in the portfolio. Bond holdings that detracted were mostly high-yield issues and those in the embattled financial sector.
WHAT WAS OUR STRATEGY THIS YEAR?
Our basic strategy has not changed. On the equity side, we are maintaining a global portfolio of what we believe to be the best value and growth prospects we could find. We focus on stock selection rather than country allocation. The same may be said of the fixed-income side, where we focus on individual issues and value. In our opinion, as measured by wider yield spreads, value is abundant in this market.
WHAT NOW?
Between the Federal Reserve and the Treasury, massive sums have been brought to bear in an effort to keep the financial system functioning. Continuing economic headwinds include a tight credit environment, possible recession and the loss of wealth from home and stock prices.
Our current forecast is for a slight decline in growth for the fourth quarter of 2008 and the first quarter of 2009. We see more consolidation, more regulation and tighter lending standards ahead. The U.S. economy is still at risk, but we believe things could start to look up by mid 2009. However, a recovery may take longer than we expect and it is unlikely to be robust. Some emerging economies may grow at a faster rate if they become less dependent on trade with the United States and other developed economies. We think a bottoming process may be underway now, as worldwide efforts to restore confidence, liquidity and credit to the global financial system take effect.
1
LOOMIS SAYLES GLOBAL MARKETS FUND
Investment Results through September 30, 2008
PERFORMANCE IN PERSPECTIVE
The charts comparing the fund’s performance to two indexes provide you with a general sense of how it performed. The fund’s total return for the period shown below appears with and without sales charges and includes fund expenses and fees. An index measures the performance of a theoretical portfolio. Unlike a fund, the index is unmanaged and does not have expenses that affect the results. It is not possible to invest directly in an index. Investors would incur transaction costs and other expenses if they purchased the securities necessary to match the index.
Growth of a $10,000 Investment in Class A Shares1,5
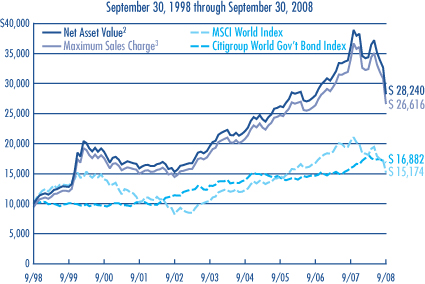
Average Annual Returns — September 30, 20085
| | | | | | | | | |
| | | | |
| | | 1 YEAR | | | 5 YEARS | | | 10 YEARS | |
CLASS A1 (Inception 2/1/06) | | | | | | | | | |
Net Asset Value2 | | -21.87 | % | | 7.65 | % | | 10.94 | % |
With Maximum Sales Charge3 | | -26.39 | | | 6.39 | | | 10.29 | |
| | | | |
CLASS C1 (Inception 2/1/06) | | | | | | | | | |
Net Asset Value2 | | -22.42 | | | 6.86 | | | 10.11 | |
With CDSC4 | | -23.15 | | | 6.86 | | | 10.11 | |
| | | | |
CLASS Y1 (Inception 5/1/96) | | | | | | | | | |
Net Asset Value2 | | -21.66 | | | 7.92 | | | 11.21 | |
| | | | |
| COMPARATIVE PERFORMANCE | | 1 YEAR | | | 5 YEARS | | | 10 YEARS | |
MSCI World Index | | -25.62 | % | | 7.86 | % | | 4.26 | % |
Citigroup World Government Bond Index | | 5.90 | | | 5.34 | | | 5.38 | |
Morningstar World Allocation Fund Avg. | | -17.07 | | | 8.44 | | | 7.43 | |
All returns represent past performance and do not guarantee future results. Periods of less than one year are not annualized. Share price and return will vary and you may have a gain or loss when you sell your shares. All results include reinvestment of dividends and capital gains. Current returns may be higher or lower than those shown. For performance current to the most recent month-end, visit www.funds.natixis.com.
Class Y shares, the successor to the fund’s Institutional Class, are available to certain investors, as described in the prospectus.
The table and graph do not reflect taxes shareholders might owe on any fund distributions or when they redeem their shares.
PORTFOLIO FACTS
| | | | |
| |
| | | % of Net Assets as of |
| FUND COMPOSITION | | 9/30/08 | | 9/30/07 |
Common Stocks | | 65.5 | | 66.6 |
Preferred Stocks | | 0.1 | | 0.0 |
Bonds & Notes | | 26.6 | | 27.2 |
Short-Term Investments and Other | | 7.8 | | 6.2 |
| |
| | | % of Net Assets as of |
| TEN LARGEST HOLDINGS | | 9/30/08 | | 9/30/07 |
JPMorgan Chase & Co. | | 2.7 | | — |
Monsanto Co. | | 2.3 | | 1.4 |
QUALCOMM, Inc. | | 2.3 | | — |
Wal-Mart Stores, Inc. | | 2.2 | | — |
Apple, Inc. | | 2.1 | | 2.1 |
Nintendo Co. Ltd. | | 2.0 | | 2.4 |
Visa, Inc., Class A | | 2.0 | | — |
McDonald’s Corp. | | 1.9 | | 1.3 |
Standard Chartered PLC | | 1.9 | | — |
Petroleo Brasileiro SA | | 1.8 | | — |
| |
| | | % of Net Assets as of |
| FIVE LARGEST INDUSTRIES | | 9/30/08 | | 9/30/07 |
Software | | 6.2 | | 3.5 |
Oil, Gas & Consumable Fuels | | 5.6 | | 1.4 |
Commercial Banks | | 4.7 | | 0.6 |
Computers & Peripherals | | 4.6 | | 3.2 |
Electrical Equipment | | 4.5 | | 2.3 |
Portfolio holdings and asset allocations will vary.
EXPENSE RATIOS AS STATED IN THE MOST RECENT PROSPECTUS
| | | | |
| Share Class | | Gross Expense Ratio6 | | Net Expense Ratio7 |
A | | 1.37% | | 1.25% |
C | | 2.11 | | 2.00 |
Y | | 1.02 | | 1.00 |
NOTES TO CHARTS
See page 9 for a description of the indexes.
1 | Returns shown in the chart include performance of the fund’s Institutional Class shares, which were redesignated as Class Y shares on 2/1/06. For periods prior to the inception of Class A and Class C shares (2/1/06), the prior Institutional Class performance has been restated to reflect the sales loads and expenses of Class A and Class C shares. The restatement of the fund’s performance to reflect Class A and Class C expenses is based on the net expenses of the Class after taking into account the fund’s then current expense cap arrangements. The growth of $10,000 chart compares the performance of Class A shares, at net asset value, to the performance of Class A shares including the maximum sales charge of 5.75%. This chart reflects the performance of Class A Shares rather than Class Y shares because Class A shares have the highest sales charge. Prior to 2/1/06, the fund was offered without a sales charge. |
2 | Does not include a sales charge. |
3 | Includes the maximum sales charge of 5.75%. |
4 | Performance for Class C shares assumes a 1% contingent deferred sales charge (“CDSC”) applied when you sell shares within one year of purchase. |
5 | Fund performance has been increased by expense reductions and reimbursements, if any, without which performance would have been lower. |
6 | Before reductions and reimbursements. |
7 | After reductions and reimbursements. Expense reductions are contractual and are set to expire 1/31/09. |
2
LOOMIS SAYLES GROWTH FUND
PORTFOLIO PROFILE
Objective:
Long-term growth of capital
Strategy:
Invests primarily in equity securities, including common stocks, convertible securities, and warrants; focuses on stocks of large-capitalization companies, but may invest in companies of any size
Fund Inception:
May 16, 1991
Managers:
Mark Baribeau, CFA
Pamela Czekanski, CFA
Richard Skaggs, CFA
Loomis, Sayles &
Company, L.P.
Symbols:
| | |
| Class A | | LGRRX |
| Class B | | LGRBX |
| Class C | | LGRCX |
| Class Y | | LSGRX |
What You Should Know:
Growth stocks are generally more sensitive to market movements because their stock prices are based on future expectations. Frequent portfolio turnover may result in increased tax liabilities that will reduce the fund’s overall return. The fund can invest a significant percentage of assets in foreign securities and the value of the fund shares can be adversely affected by changes in currency exchange rates, political, and economic developments. In emerging markets these risks can be significant. Fund shares should be viewed as a long-term investment.
Management Discussion
Growing fears that disturbances in the credit markets could undermine growth in the United States and international markets led to dramatic declines in stock prices during the 12 months ended September 30, 2008. Equity prices continued to be volatile through the end of the period, even as the U.S. Treasury Department and the Federal Reserve Board attempted to inject added liquidity into the financial markets and restore confidence in the economic outlook.
During this turbulent period, Class A shares of Loomis Sayles Growth Fund returned -28.67% at net asset value for the fiscal year ended September 30, 2008. For the same period, the Russell 1000 Growth Index posted a -20.88% return, while the average return on the funds in Morningstar’s Large Growth category was -23.22%.
WHAT WAS BEHIND THE FUND’S RESULTS?
Stock selections in the information technology and energy sectors were primarily responsible for the fund’s disappointing performance. An underweight relative to the benchmark in consumer staples also detracted, as this defensive sector generally held up better than others. However, good stock selection within the financial sector offset some of these negatives.
WHICH STOCKS HELPED AND WHICH HURT?
Top performers during this challenging period included credit card processor MasterCard, discount broker Charles Schwab and retail giant Wal-Mart Stores. MasterCard showed earnings strength throughout the year as debit card transactions began to grow worldwide. We also saw the company as an attractive way to invest in the financial sector without exposure to credit risk because MasterCard’s principal business is to process payments between merchants and banks. The share price of Charles Schwab rose during the period after the company reported strong asset flows, despite the heightened level of uncertainty in the financial markets. Wal-Mart’s stock price gained as the slowing economy encouraged consumers to shop at lower-priced retailers.
On an absolute basis and relative to the Russell 1000 Growth Index, the fund’s holdings in information technology and energy were a drag on performance. Some consumer discretionary holdings also hurt results. In technology, the most noteworthy underperformers were Apple and Cisco Systems. Apple’s stock fell as investors became worried about the company’s ability to sustain earnings during a slowdown in consumer spending. Slower spending by corporate customers affected Cisco, which forecasted lower-than-expected revenue growth for networking equipment. We sold Cisco, but we still like Apple. In the energy sector, the share prices of National Oilwell Varco, an oil field services company, Transocean, an offshore drilling specialist, and EOG Resources, a natural gas and oil-drilling corporation, all did well in the first part of the fiscal year but declined late in the period as energy prices retreated. We sold Varco. Among our consumer discretionary holdings, Internet search firm Google failed to meet earnings expectations late in the period, while online retailer Amazon.com’s share price fell amid growing doubts about consumer stocks generally. Both remain in the portfolio.
WHAT NOW?
Our current forecast is for a slight decline in growth for the fourth quarter of 2008 and the first quarter of 2009. Throughout this fiscal year, we maintained our emphasis on large-cap growth companies with strong fundamentals and product leadership in their competitive markets. However, we did make some changes in overall fund positioning, scaling back exposure to the global commodities market by reducing investments in materials and processing and in producer durables. At the same time, we deployed assets into sectors where we believed opportunities should present themselves when the economy begins to stabilize. We also moved from an underweight to an overweight position in the consumer discretionary group and increased our emphasis on financial services. We think some financial companies that have weathered this year’s storms may begin to do well next year.
3
LOOMIS SAYLES GROWTH FUND
Investment Results through September 30, 2008
PERFORMANCE IN PERSPECTIVE
The charts comparing the fund’s performance to an index provide you with a general sense of how it performed. The fund’s total return for the period shown below appears with and without sales charges and includes fund expenses and fees. An index measures the performance of a theoretical portfolio. Unlike a fund, the index is unmanaged and does not have expenses that affect the results. It is not possible to invest directly in an index. Investors would incur transaction costs and other expenses if they purchased the securities necessary to match the index.
Growth of a $10,000 Investment in Class A Shares1,5
Average Annual Returns — September 30, 20085
| | | | | | | | | |
| | | | |
| | | 1 YEAR | | | 5 YEARS | | | 10 YEARS | |
CLASS A1 (Inception 12/31/96) | | | | | | | | | |
Net Asset Value2 | | -28.67 | % | | 2.54 | % | | 1.23 | % |
With Maximum Sales Charge3 | | -32.80 | | | 1.33 | | | 0.63 | |
| | | | |
CLASS B1 (Inception 9/12/03) | | | | | | | | | |
Net Asset Value2 | | -29.16 | | | 1.75 | | | 0.46 | |
With CDSC4 | | -32.70 | | | 1.38 | | | 0.46 | |
| | | | |
CLASS C1 (Inception 9/12/03) | | | | | | | | | |
Net Asset Value2 | | -29.26 | | | 1.75 | | | 0.46 | |
With CDSC4 | | -29.97 | | | 1.75 | | | 0.46 | |
| | | | |
CLASS Y1 (Inception 5/16/91) | | | | | | | | | |
Net Asset Value2 | | -28.42 | | | 2.86 | | | 1.51 | |
| | | | |
| COMPARATIVE PERFORMANCE | | 1 YEAR | | | 5 YEARS | | | 10 YEARS | |
Russell 1000 Growth Index | | -20.88 | % | | 3.74 | % | | 0.59 | % |
Morningstar Large Growth Fund Avg. | | -23.22 | | | 3.96 | | | 2.35 | |
All returns represent past performance and do not guarantee future results. Periods of less than one year are not annualized. Share price and return will vary and you may have a gain or loss when you sell your shares. All results include reinvestment of dividends and capital gains. Current returns may be higher or lower than those shown. For performance current to the most recent month-end, visit www.funds.natixis.com.
Class Y shares, the successor to the fund’s Institutional Class, are available to certain investors, as described in the prospectus.
The table and graph do not reflect taxes shareholders might owe on any fund distributions or when they redeem their shares.
PORTFOLIO FACTS
| | | | |
| |
| | | % of Net Assets as of |
| FUND COMPOSITION | | 9/30/08 | | 9/30/07 |
Common Stocks | | 96.0 | | 99.2 |
Short-Term Investments and Other | | 4.0 | | 0.8 |
| |
| | | % of Net Assets as of |
| TEN LARGEST HOLDINGS | | 9/30/08 | | 9/30/07 |
QUALCOMM, Inc. | | 4.1 | | — |
Wal-Mart Stores, Inc. | | 4.0 | | — |
Monsanto Co. | | 3.9 | | 2.7 |
Apple, Inc. | | 3.5 | | 4.3 |
International Business Machines Corp. | | 3.5 | | — |
Charles Schwab Corp. (The) | | 3.2 | | — |
Google, Inc., Class A | | 3.2 | | 4.0 |
BlackRock, Inc. | | 3.0 | | — |
Oracle Corp. | | 2.9 | | 2.0 |
Visa, Inc., Class A | | 2.9 | | — |
| |
| | | % of Net Assets as of |
| FIVE LARGEST INDUSTRIES | | 9/30/08 | | 9/30/07 |
Computers & Peripherals | | 9.1 | | 11.8 |
Capital Markets | | 8.5 | | 4.8 |
Software | | 7.1 | | 5.9 |
Health Care Equipment & Supplies | | 7.0 | | 2.9 |
IT Services | | 6.0 | | 2.5 |
Portfolio holdings and asset allocations will vary.
EXPENSE RATIOS AS STATED IN THE MOST RECENT PROSPECTUS
| | | | |
| Share Class | | Gross Expense Ratio6 | | Net Expense Ratio7 |
A | | 1.14% | | 1.14% |
B | | 1.85 | | 1.85 |
C | | 1.88 | | 1.88 |
Y | | 0.67 | | 0.67 |
NOTES TO CHARTS
See page 9 for a description of the indexes.
1 | Returns shown in the chart include performance of the fund’s Retail Class shares, which were converted to Class A shares on 9/12/03. The prior Retail Class performance has been restated to reflect expenses and sales loads of Class A shares. For periods prior to the inception of Class B and Class C shares (9/12/03), performance is based on prior Institutional Class performance, restated to reflect the loads and expenses of Class B and Class C shares. The restatement of the fund’s performance to reflect Class A expenses is based on the net expenses of the Class after taking into effect the fund’s then current expense cap arrangements. Class Y performance includes performance of the prior Institutional Class, which was redesignated as Class Y shares on 9/12/03, Institutional Class performance has been restated to reflect the net expenses of Class Y after taking into effect the fund’s then current expense cap arrangements. The growth of $10,000 chart compares the performance of Class A shares, at net asset value, to the performance of Class A shares including the maximum sales charge of 5.75%. This chart reflects the performance of Class A Shares rather than Class Y shares because Class A shares have the highest sales charge. Prior to 9/12/03, the fund was offered without a sales charge. |
2 | Does not include a sales charge. |
3 | Includes maximum sales charge of 5.75%. |
4 | Performance for Class B shares assumes a maximum of 5% contingent deferred sales charge (“CDSC”) applied when you sell shares, which declines annually between years 1-6 according to the following schedule: 5, 4, 3, 3, 2, 1, 0%. Class C shares performance assumes a 1% CDSC applied when you sell shares within one year of purchase. |
5 | Fund performance has been increased by expense reductions and reimbursements, if any, without which performance would have been lower. |
6 | Before reductions and reimbursements. |
7 | After reductions and reimbursements. Expense reductions are contractual and are set to expire 1/31/09. |
4
LOOMIS SAYLES RESEARCH FUND
PORTFOLIO PROFILE
Objective:
Long-term growth of capital
Strategy:
Invests primarily in equity securities, including common stocks, convertible securities, and warrants; focuses on stocks of large-capitalization companies, but may invest in companies of any size
Fund Inception:
July 31, 2000
Managers:
Maureen G. Depp, CFA
Brian James, CFA
Loomis, Sayles & Company, L.P.
Symbols:
| | |
| Class A | | LSRRX |
| Class B | | LSCBX |
| Class C | | LSCCX |
| Class Y | | LISRX |
What You Should Know:
Growth stocks are generally more sensitive to market movements than value stocks. Small-cap stocks are generally more volatile than the market. The fund can invest a significant percentage of assets in foreign securities and the value of the fund shares can be adversely affected by changes in currency exchange rates, political, and economic developments. In emerging markets these risks can be significant. Fund shares should be viewed as a long-term investment.
Management Discussion
Against a backdrop of a widening credit crisis and weakening global economic growth, stock values fell significantly during the fiscal year ended September 30, 2008. Although Loomis Sayles Research Fund outperformed its benchmark and competitor peer group, the downdraft took its toll on the fund. For the 2008 fiscal year, Class A shares of the fund returned -20.40%, with $0.05 in dividends and $0.97 in capital gains reinvested during the period. The S&P 500 Index declined -21.98% for the period, while the average return on the funds in Morningstar’s Large Growth category was -23.22%.
WHAT WAS BEHIND THE FUND’S RESULTS?
The fund’s overall defensive posture, combined with its emphasis on high-quality financial stocks, helped give the fund an edge over its benchmark and Morningstar peer group. However, investments in more cyclical sectors, such as information technology, industrials and consumer discretionary groups, hurt results as the macroeconomic environment deteriorated during the period.
WHICH STOCKS WERE POSITIVE?
As increasingly cautious investors sought out more defensive areas, our selections in the consumer staples and utilities groups were positive. In the staples group, our emphasis on retailer Wal-Mart Stores and consumer products corporation Procter & Gamble were positive. Both companies benefited from opportunities to expand their profit margins, even as their costs rose. In addition to consumer staples, on a sector basis, utilities stocks did relatively well, due to their higher dividends and lower sensitivity to economic downturns.
Other top-performing fund holdings were Wells Fargo, Covidien and Hess Corp. In a difficult year for banks, Wells Fargo stood out for the quality of its loan portfolio, its relatively high capital ratios, durable deposit funding and the company’s unquestioned access to liquidity. Covidien, a global healthcare company, benefited when its turnaround efforts and investments in its product line led to accelerated sales growth. We sold our position in Hess after the share price of this energy corporation rose on news of key discoveries in oil fields off the coast of Brazil, in which it had interests. The sale proved timely, as we avoided the subsequent sell-off of energy stocks late in the period.
WHICH WERE NEGATIVE?
Our information technology and industrial holdings were hurt by the slowing economy. In technology, rising competitive pressures affected both Research In Motion, developer of the Blackberry wireless communications line, and Akamai Technologies, provider of online computer platforms. We sold both positions. Two factors undermined several of our industrial holdings. First, the delay in Boeing’s 787 aircraft program led to retreating stock valuations of several holdings, including Boeing, Precision Castparts and Rockwell Collins, despite their strong earnings outlooks. Second, the market tended to move away from industrial stocks with higher price/earnings multiples because the overall economy was weakening. This affected shares of companies such as Flowserve (which makes fluid motion and control products) and SPX Corp (which offers specialized engineering solutions for energy companies). We sold both positions.
In absolute terms, the fund’s worst performers were Apple, Cisco Systems and AT&T. Investors worried about Apple’s ability to sustain its growth, despite the company’s market share gains in personal computers and the successful introduction of a new iPhone. Cisco, meanwhile, anticipated slowing demand from corporate customers for its information networking equipment and we sold the position. AT&T faced an increasingly competitive market in wireless communications. We remain optimistic for Apple and AT&T.
WHAT NOW?
Rarely in history has this much uncertainty unsettled world financial markets. Rather than attempt to align this fund with unreliable forecasts of macroeconomic trends, our policy is to keep the fund’s overall sector weightings consistent with those of the benchmark S&P 500 Index. We rely on our research team’s efforts to develop investment ideas based on our bottom-up analysis of industries and competitive dynamics, using stock selection in an effort to neutralize some of the risks.
5
LOOMIS SAYLES RESEARCH FUND
Investment Results through September 30, 2008
PERFORMANCE IN PERSPECTIVE
The charts comparing the fund’s performance to an index provide you with a general sense of how it performed. The fund’s total return for the period shown below appears with and without sales charges and includes fund expenses and fees. An index measures the performance of a theoretical portfolio. Unlike a fund, the index is unmanaged and does not have expenses that affect the results. It is not possible to invest directly in an index. Investors would incur transaction costs and other expenses if they purchased the securities necessary to match the index.
Growth of a $10,000 Investment in Class A Shares1,6
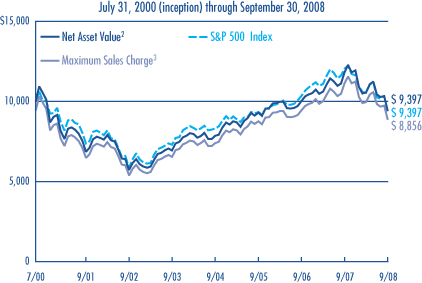
Average Annual Returns — September 30, 20086
| | | | | | | | | |
| | | | |
| | | 1 YEAR | | | 5 YEARS | | | SINCE FUND
INCEPTION | |
CLASS A1 (Inception 11/30/01) | | | | | | | | | |
Net Asset Value2 | | -20.40 | % | | 6.28 | % | | -0.76 | % |
With Maximum Sales Charge3 | | -25.01 | | | 5.03 | | | -1.47 | |
| | | | |
CLASS B1 (Inception 9/12/03) | | | | | | | | | |
Net Asset Value2 | | -21.01 | | | 5.51 | | | -1.55 | |
With CDSC4 | | -24.57 | | | 5.19 | | | -1.55 | |
| | | | |
CLASS C1 (Inception 9/12/03) | | | | | | | | | |
Net Asset Value2 | | -21.10 | | | 5.41 | | | -1.61 | |
With CDSC4 | | -21.81 | | | 5.41 | | | -1.61 | |
| | | | |
CLASS Y1 (Inception 7/31/00) | | | | | | | | | |
Net Asset Value2 | | -20.17 | | | 6.65 | | | -0.43 | |
| | | | |
| COMPARATIVE PERFORMANCE | | 1 YEAR | | | 5 YEARS | | | SINCE FUND
INCEPTION5 | |
S&P 500 Index | | -21.98 | % | | 5.17 | % | | -0.76 | % |
Morningstar Large Growth Fund Avg. | | -23.22 | | | 3.96 | | | -3.81 | |
All returns represent past performance and do not guarantee future results. Periods of less than one year are not annualized. Share price and return will vary and you may have a gain or loss when you sell your shares. All results include reinvestment of dividends and capital gains. Current returns may be higher or lower than those shown. For performance current to the most recent month-end, visit www.funds.natixis.com.
Class Y shares, the successor to the fund’s Institutional Class, are available to certain investors, as described in the prospectus.
The table and graph do not reflect taxes shareholders might owe on any fund distributions or when they redeem their shares.
PORTFOLIO FACTS
| | | | |
| |
| | | % of Net Assets as of |
| FUND COMPOSITION | | 9/30/08 | | 9/30/07 |
Common Stocks | | 100.0 | | 99.8 |
Short-Term Investments and Other | | — | | 0.2 |
| |
| | | % of Net Assets as of |
| TEN LARGEST HOLDINGS | | 9/30/08 | | 9/30/07 |
Wal-Mart Stores, Inc. | | 4.6 | | — |
Procter & Gamble Co. (The) | | 4.0 | | — |
ExxonMobil Corp. | | 3.9 | | 3.9 |
JPMorgan Chase & Co. | | 3.1 | | — |
QUALCOMM, Inc. | | 3.0 | | — |
Hewlett-Packard Co. | | 2.8 | | 1.5 |
Oracle Corp. | | 2.8 | | 1.7 |
Bank of America Corp. | | 2.6 | | 2.3 |
Apple, Inc. | | 2.6 | | 2.3 |
Kroger Co. (The) | | 2.5 | | — |
| |
| | | % of Net Assets as of |
| FIVE LARGEST INDUSTRIES | | 9/30/08 | | 9/30/07 |
Oil, Gas & Consumable Fuels | | 10.8 | | 7.0 |
Food & Staples Retailing | | 7.1 | | 2.2 |
Computers & Peripherals | | 6.4 | | 4.8 |
Diversified Financial Services | | 5.7 | | 3.3 |
Software | | 5.1 | | 4.6 |
Portfolio holdings and asset allocations will vary.
EXPENSE RATIOS AS STATED IN THE MOST RECENT PROSPECTUS
| | | | |
| Share Class | | Gross Expense Ratio7 | | Net Expense Ratio8 |
A | | 1.50% | | 1.25% |
B | | 2.31 | | 2.00 |
C | | 2.29 | | 2.00 |
Y | | 1.11 | | 0.85 |
NOTES TO CHARTS
See page 9 for a description of the indexes.
1 | Returns shown in the chart include performance of the fund’s Retail Class shares, which were converted to Class A shares on 9/12/03. The prior Retail Class performance has been restated to reflect expenses and sales loads of Class A shares. For periods before the inception of Retail Class shares (11/30/01), performance shown for Class A has been based on the performance of the fund’s Institutional Class shares, adjusted to reflect the higher expenses and sales load paid by Class A shares. For periods prior to the inception of Class B and Class C shares (9/12/03), performance is based on prior Institutional Class performance, restated to reflect the sales loads and expenses of Class B and Class C shares. The restatement of the fund’s performance to reflect Class A, Class B, and Class C expenses is based on the net expenses of the Class after taking into effect the fund’s then current expense cap arrangements. Class Y performance includes performance of the prior Institutional Class shares, which were redesignated as Class Y shares on 9/12/03. Institutional Class performance has been restated to reflect the net expenses of Class Y after taking into account the fund’s then current expense cap arrangements. The growth of $10,000 chart compares the performance of Class A shares, at net asset value, to the performance of Class A shares including the maximum sales charge of 5.75%. This chart reflects the performance of Class A shares rather than Class Y shares because Class A shares have the highest sales charge. Prior to 9/12/03, the fund was offered without a sales charge. |
2 | Does not include a sales charge. |
3 | Includes maximum sales charge of 5.75%. |
4 | Performance for Class B shares assumes a maximum of 5% contingent deferred sales charge (“CDSC”) applied when you sell shares, which declines annually between years 1-6 according to the following schedule: 5, 4, 3, 3, 2, 1, 0%. Class C shares performance assumes a 1% CDSC applied when you sell shares within one year of purchase. |
5 | The since-inception performance comparisons shown are calculated from 8/1/00. |
6 | Fund performance has been increased by expense reductions and reimbursements, if any, without which performance would have been lower. |
7 | Before reductions and reimbursements. |
8 | After reductions and reimbursements. Expense reductions are contractual and are set to expire 1/31/09. |
6
LOOMIS SAYLES VALUE FUND
PORTFOLIO PROFILE
Objective:
Long-term growth of capital and income
Strategy:
Invests primarily in equity securities, including common stocks, convertible securities, and warrants. The fund invests primarily in medium-sized and large-sized companies, but may invest in companies of any size
Fund Inception:
May 13, 1991
Managers:
Arthur Barry, CFA
James L. Carroll, CFA
Warren N. Koontz, CFA, CIC
Loomis, Sayles & Company, L.P.
Symbols:
| | |
| Class A | | LSVRX |
| Class B | | LSVBX |
| Class C | | LSCVX |
| Class Y | | LSGIX |
What You Should Know:
While the fund offers potential for long-term capital growth, it invests in value stocks, which can fall out of favor with investors and may underperform growth stocks during certain market conditions. The fund can invest a significant percentage of assets in foreign securities and the value of the fund shares can be adversely affected by changes in currency exchange rates, political, and economic developments. In emerging markets these risks can be significant. Fund shares should be viewed as a long-term investment.
Management Discussion
Stocks fell sharply during the fiscal year ended September 30, 2008, as the credit crisis that shook the nation’s financial system threatened to bring the economy to a standstill. As the period ended, aggressive government initiatives were underway aimed at restoring confidence, stabilizing markets and thawing frozen credit markets. Meanwhile, a global economic slowdown contributed to falling energy and commodity prices.
Good stock selection helped Loomis Sayles Value Fund comfortably outperform its benchmark and Morningstar peer group over the fund’s fiscal year. However, results in all cases were clearly negative, reflecting the extreme market weakness that has prevailed. For the fiscal year ended September 30, 2008, Class A shares of the fund returned -19.01% at net asset value, including reinvestment of $0.18 in dividends and $1.15 in capital gains. The fund’s benchmark, the Russell 1000 Value Index, returned -23.56% for the period, while the average return on the funds in Morningstar’s Large Value category was -23.87%.
WHICH SECTORS AND STOCKS DID WELL?
Shares of Tidewater rose significantly early in the year, as rising energy prices boosted demand for its specialized vessels that supply and service offshore drilling rigs. Results were favorable for the fund’s holdings in integrated oil companies. Hess Corp. was a strong performer, thanks to its participation in a major oil discovery in waters off Brazil that may greatly increase its reserves. We sold the position before oil prices started down. Covidien has also been a top performer this year. The company produces a wide range of healthcare products and the stock price rebounded based on new product announcements, accelerating sales and strong operating results. Investors flocked to Wal-Mart Stores, viewing the stock as a defensive safe haven in volatile times. Wal-Mart’s margins rose enough to offset some of the pressure resulting from rising costs.
WHICH STOCKS WERE NEGATIVE?
We generally avoided financial companies, especially stocks of firms at the center of the Wall Street crisis. Our underweight gave the fund an advantage relative to the benchmark, but financials were the period’s weakest sector. Insurer AIG was a major detractor as it was forced to accept a large cash infusion from the government in order to avoid systemic damage from its possible collapse. We sold the position. AT&T was another poor performer. The company was pressured by a highly competitive wireless market, cable-based phone services and subscriber losses tied to the slowing economy. Slack housing demand, costly energy in the first half of the year and mild weather took a toll on utility companies Exelon and PG&E, but both of these defensive positions remain in the portfolio.
WHAT NOW?
Our bottom-up investment research style is helping us identify several ideas that we believe look attractive in the beleaguered financial sector, although risk controls that are built into our process oblige us to wait and see how the government’s rescue plans play out. We are also easing back on energy exposure relative to the benchmark as oil and gas prices fall.
Falling equity prices appear to reflect investor expectations of a recession and lower corporate earnings. By the end of September 2008, valuations had become very low and concerns about looming recession seemed to have overpowered inflation concerns, at least for the time being. Steps taken by the U.S. government should remove the most toxic assets from the financial system, in our opinion, helping to build liquidity and restore confidence in equity and fixed-income markets. European authorities are also taking action and may eventually begin to consider more broad-based measures. While we do not anticipate an immediate or rapid recovery, it does seem possible that a bottoming process is underway.
7
LOOMIS SAYLES VALUE FUND
Investment Results through September 30, 2008
PERFORMANCE IN PERSPECTIVE
The charts comparing the fund’s performance to an index provide you with a general sense of how it performed. The fund’s total return for the period shown below appears with and without sales charges and includes fund expenses and fees. An index measures the performance of a theoretical portfolio. Unlike a fund, the index is unmanaged and does not have expenses that affect the results. It is not possible to invest directly in an index. Investors would incur transaction costs and other expenses if they purchased the securities necessary to match the index.
Growth of a $10,000 Investment in Class A Shares1,5
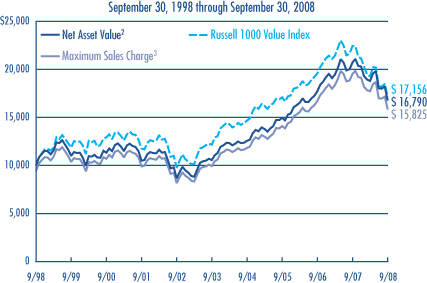
Average Annual Returns — September 30, 20085
| | | | | | | | | |
| | | | |
| | | 1 YEAR | | | 5 YEARS | | | 10 YEARS | |
CLASS A1 (Inception 6/30/06) | | | | | | | | | |
Net Asset Value2 | | -19.01 | % | | 9.71 | % | | 5.32 | % |
With Maximum Sales Charge3 | | -23.66 | | | 8.42 | | | 4.70 | |
| | | | |
CLASS B1 (Inception 6/1/07) | | | | | | | | | |
Net Asset Value2 | | -19.65 | | | 8.76 | | | 4.20 | |
With CDSC4 | | -23.44 | | | 8.47 | | | 4.20 | |
| | | | |
CLASS C1 (Inception 6/1/07) | | | | | | | | | |
Net Asset Value2 | | -19.62 | | | 8.76 | | | 4.21 | |
With CDSC4 | | -20.38 | | | 8.76 | | | 4.21 | |
| | | | |
CLASS Y1 (Inception 5/13/91) | | | | | | | | | |
Net Asset Value2 | | -18.67 | | | 10.04 | | | 5.66 | |
| | | | |
| COMPARATIVE PERFORMANCE | | 1 YEAR | | | 5 YEARS | | | 10 YEARS | |
Russell 1000 Value Index | | -23.56 | % | | 7.12 | % | | 5.55 | % |
Morningstar Large Value Fund Avg. | | -23.87 | | | 5.56 | | | 4.67 | |
All returns represent past performance and do not guarantee future results. Periods of less than one year are not annualized. Share price and return will vary and you may have a gain or loss when you sell your shares. All results include reinvestment of dividends and capital gains. Current returns may be higher or lower than those shown. For performance current to the most recent month-end, visit www.funds.natixis.com.
Class Y shares, the successor to the fund’s Institutional Class, are available to certain investors, as described in the prospectus.
The table and graph do not reflect taxes shareholders might owe on any fund distributions or when they redeem their shares.
PORTFOLIO FACTS
| | | | |
| |
| | | % of Net Assets as of |
| FUND COMPOSITION | | 9/30/08 | | 9/30/07 |
Common Stocks | | 97.3 | | 96.9 |
Short-Term Investments and Other | | 2.7 | | 3.1 |
| |
| | | % of Net Assets as of |
| TEN LARGEST HOLDINGS | | 9/30/08 | | 9/30/07 |
ExxonMobil Corp. | | 4.3 | | 3.9 |
AT&T, Inc. | | 4.0 | | 4.5 |
JPMorgan Chase & Co. | | 3.1 | | 2.4 |
Bank of America Corp. | | 2.4 | | 2.5 |
Total SA, Sponsored ADR | | 2.2 | | 2.0 |
General Electric Co. | | 2.2 | | — |
Berkshire Hathaway, Inc., Class B | | 2.2 | | 1.8 |
Schering-Plough Corp. | | 2.1 | | — |
PNC Financial Services Group, Inc. | | 2.0 | | — |
Allstate Corp. | | 2.0 | | 2.0 |
| |
| | | % of Net Assets as of |
| FIVE LARGEST INDUSTRIES | | 9/30/08 | | 9/30/07 |
Pharmaceuticals | | 9.8 | | 6.0 |
Diversified Financial Services | | 8.3 | | 7.3 |
Oil, Gas & Consumable Fuels | | 7.9 | | 10.4 |
Insurance | | 7.4 | | 7.6 |
Media | | 6.4 | | 6.1 |
Portfolio holdings and asset allocations will vary.
EXPENSE RATIOS AS STATED IN THE MOST RECENT PROSPECTUS
| | | | |
| Share Class | | Gross Expense Ratio6 | | Net Expense Ratio7 |
A | | 1.09% | | 1.09% |
B | | 1.89 | | 1.85 |
C | | 1.94 | | 1.85 |
Y | | 0.72 | | 0.72 |
NOTES TO CHARTS
See page 9 for a description of the indexes.
1 | Returns shown in the chart include performance of the fund’s Retail Class shares, which were redesignated to Class A shares on 6/1/07. Performance has been restated to reflect the current sales load of Class A shares. For periods before the inception of Retail Class shares (6/30/06), performance shown for Class A has been based on the performance of the fund’s Institutional Class shares, adjusted to reflect the higher fees and expenses paid by Class A shares. The restatement of the fund’s performance to reflect Class A expenses is based on the net expenses of the Class after taking into effect the fund’s then current expense cap arrangements. For periods prior to the inception of Class B and Class C shares (6/1/07), performance is based on prior Institutional Class performance, restated to reflect the sales loads and expenses of Class B and Class C shares, respectively. The growth of $10,000 chart compares the performance of Class A shares, at net asset value, to the performance of Class A shares including the maximum sales charge of 5.75%. This chart reflects the performance of Class A Shares rather than Class Y shares because Class A shares have the highest sales charge. Prior to 6/1/07, the fund was offered without a sales charge. |
2 | Does not include a sales charge. |
3 | Includes maximum sales charge of 5.75%. |
4 | Performance for Class B shares assumes a maximum of 5% contingent deferred sales charge (“CDSC”) applied when you sell shares, which declines annually between years 1-6 according to the following schedule: 5, 4, 3, 3, 2, 1, 0%. Class C shares performance assumes a 1% CDSC applied when you sell shares within one year of purchase. |
5 | Fund performance has been increased by expense reductions and reimbursements, if any, without which performance would have been lower. |
6 | Before reductions and reimbursements. |
7 | After reductions and reimbursements. Expense reductions are contractual and are set to expire 1/31/09. |
8
ADDITIONAL INFORMATION
The views expressed in this report reflect those of the portfolio managers as of the dates indicated. The managers’ views are subject to change at any time without notice based on changes in market or other conditions. References to specific securities or industries should not be regarded as investment advice. Because these funds are actively managed, there is no assurance that they will continue to invest in the securities or industries mentioned.
For more complete information on any Natixis Fund, contact your financial professional or call Natixis Funds and ask for a free prospectus, which contains more complete information including charges and other ongoing expenses. Investors should consider a fund’s objective, risks and expenses carefully before investing. This and other fund information can be found in the prospectus. Please read the prospectus carefully before investing.
INDEX/AVERAGE DESCRIPTIONS:
Citigroup World Government Bond Index (“Citigroup WGBI”) is an unmanaged index that measures the most significant and liquid government bond indices located around the world with a rating of at least investment grade.
Morgan Stanley Capital International World Index (“MSCI World”) is an unmanaged index that measures global developed market equity performance.
Russell 1000 Growth Index is an unmanaged index that measures the performance of those Russell 1000 companies with higher price-to-book ratios and higher forecasted growth values.
Russell 1000 Value Index is an unmanaged index that measures the performance of those Russell 1000 companies with lower price-to-book ratios and lower forecasted growth values.
Standard & Poor’s 500 Index (“S&P 500”) is an unmanaged index of U.S. common stock performance.
Morningstar Fund Averages are the average performance without sales charges of funds with similar investment objectives, as calculated by Morningstar, Inc.
PROXY VOTING INFORMATION
A description of the funds’ proxy voting policies and procedures is available without charge, upon request, by calling Natixis Funds at 800-225-5478; on the funds’ website at www.funds.natixis.com; and on the Securities and Exchange Commission’s website at www.sec.gov. Information regarding how the funds voted proxies relating to portfolio securities during the 12-month period ended June 30, 2008 is available from the funds’ website and the SEC’s website.
QUARTERLY PORTFOLIO SCHEDULES
The funds will file a complete schedule of portfolio holdings with the SEC for the first and third quarters of each fiscal year on Form N-Q. The funds’ Forms N-Q are available on the SEC’s website at www.sec.gov and may be reviewed and copied at the SEC’s Public Reference Room in Washington, DC. Information on the operation of the Public Reference Room may be obtained by calling
1-800-SEC-0330.
| | | | |
| NOT FDIC INSURED | | MAY LOSE VALUE | | NO BANK GUARANTEE |
9
UNDERSTANDING FUND EXPENSES
As a mutual fund shareholder, you incur different types of costs: transaction costs, including sales charges (loads) on purchases and contingent deferred sales charges on redemptions, certain exchange fees, and minimum account fee charges; and ongoing costs, including management fees, distribution and/or service fees (12b-1 fees), and other fund expenses. In addition, each fund assesses a minimum balance fee of $20 on an annual basis for accounts that fall below the required minimum to establish an account (certain exceptions may apply). These costs are described in more detail in the funds’ prospectus. The examples below are intended to help you understand the ongoing costs of investing in the funds and help you compare these with the ongoing costs of investing in other mutual funds.
The first line in the table for each class shows the actual amount of fund expenses you would have paid on a $1,000 investment in the fund from April 1, 2008 through September 30, 2008. It also shows how much a $1,000 investment would be worth at the close of the period, assuming actual fund returns and expenses. To estimate the expenses you paid over the period, simply divide your account value by $1,000 (for example $8,600 account value divided by $1,000 = 8.6) and multiply the result by the number in the Expenses Paid During the Period row as shown below for your class.
The second line in the table for each class provides information about hypothetical account values and hypothetical expenses based on the fund’s actual expense ratios and an assumed rate of return of 5% per year before expenses, which is not the fund’s actual return. The hypothetical account values and expenses may not be used to estimate the actual ending account balance or expenses you paid on your investment for the period. You may use this information to compare the ongoing costs of investing in the fund and other funds. To do so, compare this 5% hypothetical example with the 5% hypothetical examples that appear in the shareholder reports of the other funds.
Please note that the expenses shown reflect ongoing costs only, and do not include any transaction costs. Therefore, the second line in the table of each fund is useful in comparing ongoing costs only, and will not help you determine the relative costs of owning different funds. If transaction costs were included, total costs would be higher.
| | | | | | |
| LOOMIS SAYLES GLOBAL MARKETS FUND | | BEGINNING ACCOUNT VALUE 4/1/08 | | ENDING ACCOUNT VALUE 9/30/08 | | EXPENSES PAID DURING PERIOD* 4/1/08 – 9/30/08 |
CLASS A | | | | | | |
Actual | | $1,000.00 | | $821.60 | | $5.69 |
Hypothetical (5% return before expenses) | | $1,000.00 | | $1,018.75 | | $6.31 |
CLASS C | | | | | | |
Actual | | $1,000.00 | | $818.60 | | $9.09 |
Hypothetical (5% return before expenses) | | $1,000.00 | | $1,015.00 | | $10.08 |
CLASS Y | | | | | | |
Actual | | $1,000.00 | | $822.80 | | $4.47 |
Hypothetical (5% return before expenses) | | $1,000.00 | | $1,020.10 | | $4.95 |
| * | Expenses are equal to the Fund’s annualized expense ratio (after fee reduction/reimbursement): 1.25%, 2.00% and 0.98% for Class A, C and Y, respectively, multiplied by the average account value over the period, multiplied by the number of days in the most recent fiscal half-year, divided by 366 (to reflect the half-year period). |
10
UNDERSTANDING FUND EXPENSES
| | | | | | |
| LOOMIS SAYLES GROWTH FUND | | BEGINNING ACCOUNT VALUE 4/1/08 | | ENDING ACCOUNT VALUE 9/30/08 | | EXPENSES PAID DURING PERIOD* 4/1/08 – 9/30/08 |
CLASS A | | | | | | |
Actual | | $1,000.00 | | $814.30 | | $4.85 |
Hypothetical (5% return before expenses) | | $1,000.00 | | $1,019.65 | | $5.40 |
CLASS B | | | | | | |
Actual | | $1,000.00 | | $811.10 | | $7.97 |
Hypothetical (5% return before expenses) | | $1,000.00 | | $1,016.20 | | $8.87 |
CLASS C | | | | | �� | |
Actual | | $1,000.00 | | $811.10 | | $8.29 |
Hypothetical (5% return before expenses) | | $1,000.00 | | $1,015.85 | | $9.22 |
CLASS Y | | | | | | |
Actual | | $1,000.00 | | $814.90 | | $3.04 |
Hypothetical (5% return before expenses) | | $1,000.00 | | $1,021.65 | | $3.39 |
| * | Expenses are equal to the Fund’s annualized expense ratio (after fee reduction/reimbursement): 1.07%, 1.76%, 1.83% and 0.67% for Class A, B, C, and Y, respectively, multiplied by the average account value over the period, multiplied by the number of days in the most recent fiscal half-year, divided by 366 (to reflect the half-year period). |
| | | | | | |
| LOOMIS SAYLES RESEARCH FUND | | BEGINNING ACCOUNT VALUE 4/1/08 | | ENDING ACCOUNT VALUE 9/30/08 | | EXPENSES PAID DURING PERIOD*
4/1/08 – 9/30/08 |
CLASS A | | | | | | |
Actual | | $1,000.00 | | $890.30 | | $5.92 |
Hypothetical (5% return before expenses) | | $1,000.00 | | $1,018.80 | | $6.33 |
CLASS B | | | | | | |
Actual | | $1,000.00 | | $886.60 | | $9.43 |
Hypothetical (5% return before expenses) | | $1,000.00 | | $1,015.00 | | $10.08 |
CLASS C | | | | | | |
Actual | | $1,000.00 | | $887.10 | | $9.44 |
Hypothetical (5% return before expenses) | | $1,000.00 | | $1,015.00 | | $10.08 |
CLASS Y | | | | | | |
Actual | | $1,000.00 | | $891.00 | | $4.02 |
Hypothetical (5% return before expenses) | | $1,000.00 | | $1,020.75 | | $4.29 |
| * | Expenses are equal to the Fund’s annualized expense ratio (after fee reduction/reimbursement): 1.25%, 2.00%, 2.00% and 0.85%, for Class A, B, C, and Y, respectively, multiplied by the average account value over the period, multiplied by the number of days in the most recent fiscal half-year, divided by 366 (to reflect the half-year period). |
11
UNDERSTANDING FUND EXPENSES
| | | | | | |
| LOOMIS SAYLES VALUE FUND | | BEGINNING ACCOUNT VALUE 4/1/08 | | ENDING ACCOUNT VALUE 9/30/08 | | EXPENSES PAID DURING PERIOD* 4/1/08 – 9/30/08 |
CLASS A | | | | | | |
Actual | | $1,000.00 | | $892.40 | | $4.87 |
Hypothetical (5% return before expenses) | | $1,000.00 | | $1,019.85 | | $5.20 |
CLASS B | | | | | | |
Actual | | $1,000.00 | | $889.10 | | $8.41 |
Hypothetical (5% return before expenses) | | $1,000.00 | | $1,016.10 | | $8.97 |
CLASS C | | | | | | |
Actual | | $1,000.00 | | $889.00 | | $8.41 |
Hypothetical (5% return before expenses) | | $1,000.00 | | $1,016.10 | | $8.97 |
CLASS Y | | | | | | |
Actual | | $1,000.00 | | $894.20 | | $3.08 |
Hypothetical (5% return before expenses) | | $1,000.00 | | $1,021.75 | | $3.29 |
| * | Expenses are equal to the Fund’s annualized expense ratio (after fee reduction/reimbursement): 1.03%, 1.78%, 1.78% and 0.65% for Class A, B, C and Y, respectively, multiplied by the average account value over the period, multiplied by the number of days in the most recent fiscal half-year, divided by 366 (to reflect the half-year period). |
12
BOARD APPROVALOFTHE EXISTING ADVISORY AGREEMENT
The Board of Trustees, including the Independent Trustees, considers matters bearing on each Fund’s advisory agreement (collectively, the “Agreements”) at most of its meetings throughout the year. Each year, usually in the spring, the Contract Review and Governance Committee of the Board meets to review the Agreements to determine whether to recommend that the full Board approve the continuation of the Agreements, typically for an additional one-year period. After the Committee has made its recommendation, the full Board, including the Independent Trustees, determines whether to approve the continuation of the Agreements.
In connection with these meetings, the Trustees receive materials that the Funds’ investment adviser believes to be reasonably necessary for the Trustees to evaluate the Agreements. These materials generally include, among other items, (i) information on the investment performance of the Funds and the performance of peer groups of funds and the Funds’ performance benchmarks, (ii) information on the Funds’ advisory fees and other expenses, including information comparing the Funds’ expenses to those of peer groups of funds and information about any applicable expense caps and fee “breakpoints,” (iii) sales and redemption data in respect of the Funds, (iv) information about the profitability of the Agreements to the Funds’ advisers (the “Adviser”), and (v) information obtained through the completion of a questionnaire by the Adviser (the Trustees are consulted as to the information requested through that questionnaire). The Board of Trustees, including the Independent Trustees, also consider other matters such as (i) the Adviser’s financial results and financial condition, (ii) each Fund’s investment objective and strategies and the size, education and experience of the Adviser’s investment staff and its use of technology, external research and trading cost measurement tools, (iii) arrangements in respect of the distribution of the Funds’ shares and the related costs, (iv) the procedures employed to determine the value of the Funds’ assets, (v) the allocation of the Funds’ brokerage, if any, including allocations to brokers affiliated with the Adviser and the use of “soft” commission dollars to pay Fund expenses and to pay for research and other similar services, (vi) the resources devoted to, and the record of compliance with, the Funds’ investment policies and restrictions, policies on personal securities transactions and other compliance policies, and (vii) the general economic outlook with particular emphasis on the mutual fund industry. Throughout the process, the Trustees are afforded the opportunity to ask questions of and request additional materials from the Adviser.
In addition to the materials requested by the Trustees in connection with the annual consideration of the continuation of the Agreements, the Trustees receive materials in advance of each regular quarterly meeting of the Board of Trustees that provide detailed information about the Funds’ investment performance and the fees charged to the Funds for advisory and other services. This information generally includes, among other things, an internal performance rating for each Fund based on agreed-upon criteria, graphs showing performance and fee differentials against each Fund’s peer group, performance ratings provided by a third-party, total return information for various periods, and third-party performance rankings for various periods comparing a Fund against its peer group. The portfolio management team for each Fund makes periodic presentations to the Contract Review and Governance Committee and/or the full Board of Trustees, and Funds identified as presenting possible performance concerns may be subject to more frequent board presentations and reviews. In addition, each quarter the Trustees are provided with detailed statistical information about each Fund’s portfolio.
The Board of Trustees most recently approved the continuation of the Agreements at their meeting held in June 2008. The Agreements were continued for a one-year period for all Funds. In considering whether to approve the continuation of the Agreements, the Board of Trustees, including the Independent Trustees, did not identify any single factor as determinative. Matters considered by the Trustees, including the Independent Trustees, in connection with their approval of the Agreements included the following:
The nature, extent and quality of the services provided to the Funds under the Agreements. The Trustees considered the nature, extent and quality of the services provided by the Adviser and its affiliates to the Funds and the resources dedicated to the Funds by the Adviser and its affiliates, including recent or planned investments by the Adviser in additional personnel or other resources. They also took note of the competitive market for talented personnel, in particular, for personnel who have contributed to the generation of strong investment performance. They considered the need for the Advisers to offer competitive compensation in order to attract and retain capable personnel.
For each Fund, the Trustees also considered the benefits to shareholders of investing in a mutual fund that is part of a family of funds that offers shareholders the right to exchange shares of one type of fund for shares of another type of fund, and provides a variety of fund and shareholder services.
After reviewing these and related factors, the Trustees concluded, within the context of their overall conclusions regarding each of the Agreements, that the nature, extent and quality of services provided supported the renewal of the Agreements.
13
BOARD APPROVALOFTHE EXISTING ADVISORY AGREEMENT
Investment performance of the Funds and the Adviser. As noted above, the Trustees received information about the performance of the Funds over various time periods, including information which compared the performance of the Funds to the performance of peer groups of funds and the Funds’ respective performance benchmarks. In addition, the Trustees also reviewed data prepared by an independent third party which analyzed the performance of the Funds using a variety of performance metrics, including metrics which also measured the performance of the Funds on a risk adjusted basis.
With respect to each Fund, the Board concluded that the Fund’s performance or other relevant factors supported the renewal of the Agreement relating to that Fund. In the case of each Fund that had performance that lagged that of a relevant peer group for certain (although not necessarily all) periods, the Board concluded that other factors relevant to performance supported renewal of the Funds’ Agreements. These factors varied from Fund to Fund, but included one or more of the following: (1) that while relative performance may have lagged in certain periods, the Fund’s absolute and relative returns were strong in recent periods and (2) reductions in the Fund’s expense levels resulting from decreased expenses and/or increased assets were not yet fully reflected in the Fund’s performance results.
The Trustees also considered each Adviser’s performance and reputation generally, the Funds’ performance as a fund family generally (as noted by certain financial publications), and the historical responsiveness of the Advisers to Trustee concerns about performance and the willingness of the Advisers to take steps intended to improve performance.
After reviewing these and related factors, the Trustees concluded, within the context of their overall conclusions regarding each of the Agreements, that the performance of the Funds and the Advisers supported the renewal of the Agreements.
The costs of the services to be provided and profits to be realized by the Adviser and its affiliates from their respective relationships with the Funds. The Trustees considered the fees charged to the Funds for advisory services as well as the total expense levels of the Funds. This information included comparisons (provided both by management and also by an independent third party) of the Funds’ advisory fees and total expense levels to those of their peer groups and information about the advisory fees charged by the Advisers to comparable accounts. In considering the fees charged to comparable accounts, the Trustees considered, among other things, management’s representations about the differences between managing mutual funds as compared to other types of accounts, including the additional resources required to effectively manage mutual fund assets. In evaluating each Fund’s advisory fees, the Trustees also took into account the demands, complexity and quality of the investment management of such Fund. The Trustees considered that over the past several years, management had made recommendations regarding reductions in advisory fee rates, implementation of advisory fee breakpoints and the institution of advisory fee waivers and expense caps for various Funds in the Fund family. They noted that, as of December 31, 2007, all four of the Natixis Equity Funds included in this report have expense caps in place, and the Trustees considered the amounts waived or reimbursed by the Advisers under these caps. The Trustees noted that the Loomis Sayles Global Markets Fund had an advisory fee rate that was above the median of a peer group of Funds. The Trustees considered the circumstances that accounted for such relatively higher expenses. The Trustees noted that for the Loomis Sayles Global Markets Fund, the Fund’s total expense ratio was below the median even though the advisory fee was above the median.
The Trustees also considered the compensation directly or indirectly received by the Adviser and its affiliates from their relationships with the Funds. The Trustees reviewed information provided by management as to the profitability of the Adviser’s and their affiliates’ relationships with the Funds, and information about the allocation of expenses used to calculate profitability. They also reviewed information provided by management about the effect of distribution costs and Fund growth on Adviser profitability, including information regarding resources spent on distribution activities and the increase in net sales for the family of funds. When reviewing profitability, the Trustees also considered information about court cases in which adviser profitability was an issue, the performance of the relevant Funds, the expense levels of the Funds, and whether the Advisers had implemented breakpoints and/or expense caps with respect to such Funds.
After reviewing these and related factors, the Trustees concluded, within the context of their overall conclusions regarding each of the Agreements, that the advisory fees charged to each of the Funds were fair and reasonable, and that the costs of these services generally and the related profitability of the Adviser and its affiliates in respect of their relationships with the Funds supported the renewal of the Agreements.
Economies of Scale. The Trustees considered the existence of any economies of scale in the provision of services by the Advisers and whether those economies are shared with the Funds through breakpoints in their investment advisory fees or other means, such as
14
BOARD APPROVALOFTHE EXISTING ADVISORY AGREEMENT
expense waivers. The Trustees noted that each of the Funds was subject to an expense cap or waiver. The Trustees also considered management’s representation that for certain Funds, the Funds’ Adviser did not benefit from economies of scale in providing services to the Funds (because of the small size of the Fund or for other reasons). In considering these issues, the Trustees also took note of the costs of the services provided (both on an absolute and a relative basis) and the profitability to the Adviser and its affiliates of their relationships with the Funds, as discussed above.
After reviewing these and related factors, the Trustees considered, within the context of their overall conclusions regarding each of the Agreements, that the extent to which economies of scale were shared with the Funds supported the renewal of the Agreements.
The Trustees also considered other factors, which included but were not limited to the following:
| · | | whether each Fund has operated in accordance with its investment objective and the Fund’s record of compliance with its investment restrictions, and the compliance programs of the Funds and the Adviser. They also considered the compliance-related resources the Adviser and its affiliates were providing to the Funds. |
| · | | the nature, quality, cost and extent of administrative and shareholder services performed by the Adviser and its affiliates, both under the Agreements and under separate agreements covering administrative services. |
| · | | so-called “fallout benefits” to the Adviser, such as the engagement of affiliates of the Adviser to provide distribution, administrative and brokerage services to the Funds, and the benefits of research made available to the Adviser by reason of brokerage commissions generated by the Funds’ securities transactions. The Trustees considered the possible conflicts of interest associated with these fallout and other benefits, and the reporting, disclosure and other processes in place to disclose and monitor such possible conflicts of interest. |
Based on their evaluation of all factors that they deemed to be material, including those factors described above, and assisted by the advice of independent counsel, the Trustees, including the Independent Trustees, concluded that each of the existing advisory agreements should be continued through June 30, 2009.
15
LOOMIS SAYLES GLOBAL MARKETS FUND — PORTFOLIOOF INVESTMENTS
Investments as of September 30, 2008
| | | | | | |
Principal
Amount (‡) | | Description | | Value (†) |
| | | | | | |
| | Bonds and Notes — 26.6% of Net Assets | | | |
| | Non-Convertible Bonds — 25.6% | | | |
| | | Argentina — 0.1% | | | |
| $ | 55,000 | | Republic of Argentina,
3.127%, 8/03/2012(b) | | $ | 39,496 |
| | 570,000 | | Transportadora de Gas del Sur SA,
7.875%, 5/14/2017, 144A | | | 404,700 |
| | | | | | |
| | | | | | 444,196 |
| | | | | | |
| | | Austria — 0.1% | | | |
| | 30,000,000 | | Oesterreichische Kontrollbank AG,
1.800%, 3/22/2010, (JPY) | | | 285,577 |
| | 95,000 | | Sappi Papier Holding AG,
7.500%, 6/15/2032, 144A | | | 67,091 |
| | | | | | |
| | | | | | 352,668 |
| | | | | | |
| | | Bermuda — 0.1% | | | |
| | 385,000 | | Noble Group Ltd.,
8.500%, 5/30/2013, 144A | | | 317,625 |
| | | | | | |
| | | Brazil — 0.4% | | | |
| | 2,123,441 | | Brazil Notas do Tesouro Nacional, Series B,
6.000%, 8/15/2010, (BRL) | | | 1,053,241 |
| | 170,000 | | Marfrig Overseas Ltd.,
9.625%, 11/16/2016, 144A | | | 136,000 |
| | | | | | |
| | | | | | 1,189,241 |
| | | | | | |
| | | Canada — 0.1% | | | |
| | 100,000 | | Bombardier, Inc.,
7.250%, 11/15/2016, (EUR), 144A | | | 126,702 |
| | 25,000 | | Canadian Pacific Railway Ltd., MTN,
4.900%, 6/15/2010, (CAD), 144A | | | 23,346 |
| | 100,000 | | GMAC Canada Ltd., EMTN,
6.625%, 12/17/2010, (GBP) | | | 108,449 |
| | 50,000 | | Nortel Networks Ltd.,
6.875%, 9/01/2023 | | | 20,000 |
| | 180,000 | | Shaw Communications, Inc.,
6.150%, 5/09/2016, (CAD) | | | 159,105 |
| | | | | | |
| | | | | | 437,602 |
| | | | | | |
| | | Cayman Islands — 0.4% | | | |
| | 360,000 | | DASA Finance Corp.,
8.750%, 5/29/2018, 144A | | | 302,400 |
| | 370,000 | | Embraer Overseas Ltd.,
6.375%, 1/24/2017 | | | 342,250 |
| | 100,000 | | LPG International, Inc.,
7.250%, 12/20/2015 | | | 95,880 |
| | 175,000 | | Odebrecht Finance Ltd.,
7.500%, 10/18/2017, 144A | | | 159,250 |
| | 536,000 | | Vale Overseas Ltd.,
6.875%, 11/21/2036 | | | 477,097 |
| | | | | | |
| | | | | | 1,376,877 |
| | | | | | |
| | | Colombia — 0.2% | | | |
| | 40,000 | | Republic of Colombia,
8.125%, 5/21/2024 | | | 43,800 |
| | 45,000,000 | | Republic of Colombia,
9.850%, 6/28/2027, (COP) | | | 18,333 |
| | 94,000,000 | | Republic of Colombia,
11.750%, 3/01/2010, (COP) | | | 43,435 |
| | 1,361,000,000 | | Republic of Colombia,
12.000%, 10/22/2015, (COP) | | | 650,977 |
| | | | | | |
| | | | | | 756,545 |
| | | | | | |
| | | | | |
Principal
Amount (‡) | | Description | | Value (†) |
| | | | | |
| | France — 0.5% | | | |
| 180,000 | | Alcatel-Lucent, EMTN,
6.375%, 4/07/2014, (EUR) | | $ | 203,990 |
| 1,665,190,000 | | BNP Paribas SA, EMTN,
Zero Coupon, 6/13/2011, (IDR), 144A | | | 127,476 |
| 100,000 | | BNP Paribas, (fixed rate to 4/12/2016,
variable rate thereafter),
4.730%, 4/29/2049, (EUR) | | | 97,054 |
| 35,000 | | Lafarge SA, EMTN,
4.750%, 3/23/2020, (EUR) | | | 37,260 |
| 250,000 | | Lafarge SA, EMTN,
5.375%, 6/26/2017, (EUR) | | | 293,587 |
| 35,000 | | PPR SA, EMTN,
4.000%, 1/29/2013, (EUR) | | | 44,937 |
| 240,000 | | Veolia Environnement, EMTN,
4.000%, 2/12/2016, (EUR) | | | 299,211 |
| 25,000 | | Veolia Environnement, EMTN,
5.125%, 5/24/2022, (EUR) | | | 30,844 |
| 100,000 | | Wendel,
4.375%, 8/09/2017, (EUR) | | | 91,329 |
| 200,000 | | Wendel,
4.875%, 5/26/2016, (EUR) | | | 200,083 |
| | | | | |
| | | | | 1,425,771 |
| | | | | |
| | Germany — 0.7% | | | |
| 42,000,000 | | Kreditanstalt fuer Wiederaufbau,
1.350%, 1/20/2014, (JPY) | | | 396,146 |
| 30,000,000 | | Kreditanstalt fuer Wiederaufbau,
1.850%, 9/20/2010, (JPY) | | | 286,831 |
| 12,000,000 | | Kreditanstalt fuer Wiederaufbau,
2.050%, 2/16/2026, (JPY) | | | 109,791 |
| 1,025,000 | | Republic of Germany,
4.000%, 1/04/2037, (EUR)(c) | | | 1,305,795 |
| | | | | |
| | | | | 2,098,563 |
| | | | | |
| | Hong Kong — 0.1% | | | |
| 410,000 | | HKCG Finance Ltd.,
6.250%, 8/07/2018, 144A | | | 403,317 |
| | | | | |
| | India — 0.2% | | | |
| 500,000 | | Canara Bank Ltd., (fixed rate to 11/28/2016,
variable rate thereafter),
6.365%, 11/28/2021 | | | 401,241 |
| 100,000 | | ICICI Bank Ltd., (fixed rate to 4/30/2017,
variable rate thereafter),
6.375%, 4/30/2022, 144A | | | 69,023 |
| | | | | |
| | | | | 470,264 |
| | | | | |
| | Indonesia — 0.2% | | | |
| 405,000 | | Indonesia Government International Bond,
7.750%, 1/17/2038, 144A | | | 364,500 |
| 2,959,000,000 | | Indonesia Treasury Bond,
11.000%, 12/15/2012, (IDR) | | | 295,048 |
| | | | | |
| | | | | 659,548 |
| | | | | |
| | Ireland — 0.2% | | | |
| 100,000 | | Depfa ACS Bank, EMTN,
4.875%, 5/21/2019, (EUR) | | | 137,681 |
| 555,000 | | Elan Financial PLC,
7.750%, 11/15/2011 | | | 502,275 |
| | | | | |
| | | | | 639,956 |
| | | | | |
See accompanying notes to financial statements.
16
LOOMIS SAYLES GLOBAL MARKETS FUND — PORTFOLIOOF INVESTMENTS (continued)
Investments as of September 30, 2008
| | | | | |
Principal
Amount (‡) | | Description | | Value (†) |
| | | | | |
| | Italy — 0.1% | | | |
| 100,000 | �� | Finmeccanica SpA, EMTN,
4.875%, 3/24/2025, (EUR) | | $ | 113,229 |
| 100,000 | | Telecom Italia SpA, EMTN,
5.375%, 1/29/2019, (EUR) | | | 115,109 |
| | | | | |
| | | | | 228,338 |
| | | | | |
| | Japan — 0.5% | | | |
| 32,000,000 | | Japan Finance Corp. for Municipal Enterprises,
1.350%, 11/26/2013, (JPY) | | | 304,342 |
| 145,000,000 | | Japan Government,
0.900%, 9/15/2009, (JPY) | | | 1,366,330 |
| | | | | |
| | | | | 1,670,672 |
| | | | | |
| | Korea — 0.2% | | | |
| 460,000 | | Hanarotelecom, Inc.,
7.000%, 2/01/2012, 144A | | | 441,600 |
| 140,000 | | SK Telecom Co. Ltd.,
6.625%, 7/20/2027, 144A | | | 126,420 |
| | | | | |
| | | | | 568,020 |
| | | | | |
| | Luxembourg — 0.0% | | | |
| 10,000 | | Telecom Italia Capital,
6.000%, 9/30/2034 | | | 7,006 |
| 10,000 | | Telecom Italia Capital,
6.375%, 11/15/2033 | | | 7,288 |
| | | | | |
| | | | | 14,294 |
| | | | | |
| | Malaysia — 0.0% | | | |
| 200,000 | | Ranhill Labuan Ltd.,
12.500%, 10/26/2011, 144A | | | 96,000 |
| | | | | |
| | Mexico — 0.4% | | | |
| 340,000 | | Axtel SAB de CV,
7.625%, 2/01/2017, 144A | | | 302,328 |
| 295,000 | | Desarrolladora Homex SAB de CV,
7.500%, 9/28/2015 | | | 259,600 |
| 75,000(††) | | Mexican Fixed Rate Bonds, Series M-20,
8.000%, 12/07/2023, (MXN) | | | 658,188 |
| | | | | |
| | | | | 1,220,116 |
| | | | | |
| | Netherlands — 0.3% | | | |
| 50,000 | | Bite Finance International,
8.458%, 3/15/2014, (EUR), 144A(b) | | | 52,793 |
| 150,000 | | Cemex Finance Europe BV,
4.750%, 3/05/2014, (EUR) | | | 162,085 |
| 150,000 | | Koninklijke KPN NV, GMTN,
4.750%, 1/17/2017, (EUR) | | | 183,042 |
| 100,000 | | Majapahit Holding BV,
7.250%, 6/28/2017, 144A | | | 88,000 |
| 385,000 | | Netherlands Government Bond,
4.000%, 1/15/2037, (EUR) | | | 481,803 |
| 50,000 | | OI European Group BV,
6.875%, 3/31/2017, (EUR), 144A | | | 60,183 |
| | | | | |
| | | | | 1,027,906 |
| | | | | |
| | Poland — 0.2% | | | |
| 1,700,000 | | Poland Government Bond,
5.750%, 3/24/2010, (PLN) | | | 697,782 |
| | | | | |
| | Singapore — 0.2% | | | |
| 785,000 | | Government of Singapore,
4.625%, 7/01/2010, (SGD)(c) | | | 575,036 |
| | | | | |
| | | | | |
Principal
Amount (‡) | | Description | | Value (†) |
| | | | | |
| | South Africa — 0.3% | | | |
| 130,000 | | Edcon Proprietary Ltd.,
8.208%, 6/15/2014, (EUR), 144A(b) | | $ | 108,893 |
| 450,000 | | Edcon Proprietary Ltd.,
8.208%, 6/15/2014, (EUR)(b) | | | 376,939 |
| 285,000 | | Republic of South Africa, EMTN,
4.500%, 4/05/2016, (EUR) | | | 326,182 |
| | | | | |
| | | | | 812,014 |
| | | | | |
| | Spain — 0.1% | | | |
| 100,000 | | Santander Issuances SA Unipersonal, (fixed rate to 9/30/2014,
variable rate thereafter),
4.500%, 9/30/2019, (EUR) | | | 118,386 |
| 150,000 | | Santander Issuances SA Unipersonal, EMTN, (fixed rate to 5/29/2014, variable rate thereafter),
4.750%, 5/29/2019, (EUR) | | | 183,056 |
| | | | | |
| | | | | 301,442 |
| | | | | |
| | Supranational — 0.8% | | | |
| 190,000,000 | | Asia Development Bank,
2.350%, 6/21/2027, (JPY)(c) | | | 1,826,196 |
| 59,000,000 | | European Investment Bank,
1.250%, 9/20/2012, (JPY) | | | 558,104 |
| | | | | |
| | | | | 2,384,300 |
| | | | | |
| | Thailand — 0.1% | | | |
| 330,000 | | True Move Co. Ltd.,
10.375%, 8/01/2014 | | | 220,209 |
| 100,000 | | True Move Co. Ltd.,
10.375%, 8/01/2014, 144A | | | 66,730 |
| | | | | |
| | | | | 286,939 |
| | | | | |
| | United Arab Emirates — 0.3% | | | |
| 400,000 | | Abu Dhabi National Energy Co.,
7.250%, 8/01/2018, 144A | | | 389,964 |
| 500,000 | | DP World Ltd.,
6.850%, 7/02/2037, 144A | | | 370,180 |
| | | | | |
| | | | | 760,144 |
| | | | | |
| | United Kingdom — 0.3% | | | |
| 60,000 | | BSKYB Finance UK PLC,
5.750%, 10/20/2017, (GBP) | | | 94,548 |
| 100,000 | | Imperial Tobacco Finance PLC, EMTN,
4.375%, 11/22/2013, (EUR) | | | 122,987 |
| 1,229,424,500 | | JPMorgan Chase London,
Zero Coupon, 10/21/2010, (IDR), 144A | | | 102,565 |
| 165,000 | | Lloyds TSB Bank PLC, (fixed rate to 5/12/2017,
variable rate thereafter),
4.385%, 5/29/2049, (EUR) | | | 148,029 |
| 250,000 | | Standard Chartered Bank, EMTN,
5.875%, 9/26/2017, (EUR) | | | 309,530 |
| 65,000 | | United Kingdom Treasury,
5.250%, 6/07/2012, (GBP) | | | 119,813 |
| | | | | |
| | | | | 897,472 |
| | | | | |
| | United States — 18.0% | | | |
| 500,000 | | Albertson’s, Inc.,
7.450%, 8/01/2029 | | | 444,714 |
| 50,000 | | Albertson’s, Inc., Series C, MTN,
6.625%, 6/01/2028 | | | 40,510 |
| 15,000 | | Amkor Technology, Inc.,
7.750%, 5/15/2013 | | | 12,825 |
See accompanying notes to financial statements.
17
LOOMIS SAYLES GLOBAL MARKETS FUND — PORTFOLIOOF INVESTMENTS (continued)
Investments as of September 30, 2008
| | | | | | |
Principal
Amount (‡) | | Description | | Value (†) |
| | | | | | |
| | | United States — continued | | | |
| $ | 100,000 | | Anadarko Petroleum Corp.,
5.950%, 9/15/2016 | | $ | 91,911 |
| | 575,000 | | Anadarko Petroleum Corp.,
6.450%, 9/15/2036 | | | 450,828 |
| | 60,000 | | Arrow Electronics, Inc.,
6.875%, 7/01/2013 | | | 60,996 |
| | 100,000 | | ASIF Global Financing XXVII,
2.380%, 2/26/2009, (SGD), 144A | | | 35,362 |
| | 325,000 | | AT&T, Inc.,
6.500%, 9/01/2037(c) | | | 276,471 |
| | 42,865 | | Atlas Air, Inc., Series B,
7.680%, 1/02/2014(d) | | | 42,865 |
| | 145,000 | | Avnet, Inc.,
6.000%, 9/01/2015 | | | 139,695 |
| | 310,000 | | Borden, Inc.,
7.875%, 2/15/2023 | | | 142,600 |
| | 410,000 | | Borden, Inc.,
8.375%, 4/15/2016 | | | 139,400 |
| | 5,000 | | Boston Scientific Corp.,
5.450%, 6/15/2014 | | | 4,675 |
| | 30,000 | | Boston Scientific Corp.,
6.400%, 6/15/2016 | | | 28,500 |
| | 60,000 | | Boston Scientific Corp.,
7.000%, 11/15/2035 | | | 53,400 |
| | 50,000 | | Bristol-Myers Squibb Co.,
4.625%, 11/15/2021, (EUR) | | | 60,166 |
| | 250,000 | | Chesapeake Energy Corp.,
6.250%, 1/15/2017, (EUR) | | | 292,119 |
| | 15,000 | | Chesapeake Energy Corp.,
6.500%, 8/15/2017 | | | 13,125 |
| | 70,000 | | Chesapeake Energy Corp.,
6.875%, 1/15/2016 | | | 63,875 |
| | 75,000 | | Chesapeake Energy Corp.,
6.875%, 11/15/2020 | | | 64,125 |
| | 35,000 | | CIT Group, Inc.,
5.400%, 2/13/2012 | | | 20,121 |
| | 369,000 | | CIT Group, Inc.,
5.400%, 3/07/2013 | | | 205,657 |
| | 20,000 | | CIT Group, Inc.,
5.400%, 1/30/2016 | | | 9,680 |
| | 25,000 | | CIT Group, Inc.,
5.600%, 4/27/2011 | | | 16,101 |
| | 35,000 | | CIT Group, Inc.,
5.650%, 2/13/2017 | | | 17,079 |
| | 505,000 | | CIT Group, Inc.,
5.800%, 10/01/2036 | | | 230,974 |
| | 2,333,000 | | CIT Group, Inc., Series A, MTN,
7.625%, 11/30/2012(c) | | | 1,479,976 |
| | 270,000 | | CIT Group, Inc., EMTN,
3.800%, 11/14/2012, (EUR) | | | 205,130 |
| | 50,000 | | CIT Group, Inc., EMTN,
5.500%, 12/20/2016, (GBP) | | | 44,335 |
| | 150,000 | | CIT Group, Inc., GMTN,
4.250%, 9/22/2011, (EUR) | | | 126,129 |
| | 170,000 | | CIT Group, Inc., GMTN,
5.000%, 2/13/2014 | | | 96,164 |
| | 20,000 | | CIT Group, Inc., GMTN,
5.000%, 2/01/2015 | | | 9,886 |
| | 50,000 | | CIT Group, Inc., MTN,
4.250%, 3/17/2015, (EUR) | | | 34,503 |
| | | | | | |
Principal
Amount (‡) | | Description | | Value (†) |
| | | | | | |
| | | United States — continued | | | |
| $ | 90,000 | | CIT Group, Inc., MTN,
5.125%, 9/30/2014 | | $ | 44,384 |
| | 120,000 | | Citi Credit Card Issuance Trust, Series 2001-A4,
5.375%, 4/10/2013, (EUR) | | | 162,660 |
| | 5,000 | | Clear Channel Communications, Inc.,
4.900%, 5/15/2015 | | | 1,488 |
| | 820,000 | | Clear Channel Communications, Inc.,
5.500%, 12/15/2016 | | | 237,800 |
| | 75,000 | | Clear Channel Communications, Inc.,
5.750%, 1/15/2013 | | | 27,000 |
| | 25,000 | | Colonial Realty LP,
6.050%, 9/01/2016 | | | 21,087 |
| | 35,000 | | Comcast Corp.,
5.650%, 6/15/2035 | | | 26,017 |
| | 965,000 | | Comcast Corp.,
6.950%, 8/15/2037 | | | 823,100 |
| | 131,515 | | Continental Airlines, Inc., Series 1999-1C,
6.954%, 2/02/2011 | | | 122,966 |
| | 30,000 | | Countrywide Financial Corp., Series A, MTN,
3.333%, 12/19/2008(b) | | | 29,660 |
| | 90,000 | | Countrywide Home Loans, Inc., Series L, MTN,
4.000%, 3/22/2011 | | | 77,432 |
| | 190,000 | | CSX Corp.,
6.250%, 3/15/2018 | | | 171,968 |
| | 265,000 | | Cummins, Inc.,
5.650%, 3/01/2098 | | | 186,040 |
| | 160,000 | | Cummins, Inc.,
7.125%, 3/01/2028 | | | 153,115 |
| | 10,000 | | D.R. Horton, Inc.,
5.250%, 2/15/2015 | | | 7,400 |
| | 364,401 | | Delta Air Lines, Inc., Class B, Series 2007-1,
8.021%, 2/10/2024 | | | 247,793 |
| | 367,866 | | Delta Air Lines, Inc., Class C, Series 2007-1,
8.954%, 8/10/2014 | | | 268,542 |
| | 50,000 | | Dillard’s, Inc.,
6.625%, 1/15/2018 | | | 31,000 |
| | 50,000 | | Dillard’s, Inc.,
7.000%, 12/01/2028 | | | 25,500 |
| | 16,000 | | ESI Tractebel Acquisition Corp., Series B,
7.990%, 12/30/2011 | | | 16,160 |
| | 200,000 | | Federal National Mortgage Association,
2.290%, 2/19/2009, (SGD) | | | 139,437 |
| | 300,000 | | Florida Power & Light Co.,
4.950%, 6/01/2035 | | | 240,825 |
| | 150,000 | | Foot Locker, Inc.,
8.500%, 1/15/2022 | | | 135,750 |
| | 10,000 | | Ford Motor Co.,
6.625%, 2/15/2028 | | | 3,850 |
| | 1,750,000 | | Ford Motor Co.,
6.625%, 10/01/2028 | | | 665,000 |
| | 15,000 | | Ford Motor Co.,
7.125%, 11/15/2025 | | | 5,925 |
| | 595,000 | | Ford Motor Co.,
7.450%, 7/16/2031 | | | 255,850 |
| | 1,405,000 | | Ford Motor Credit Co. LLC,
5.700%, 1/15/2010 | | | 1,076,000 |
| | 2,250,000 | | Ford Motor Credit Co. LLC,
7.000%, 10/01/2013 | | | 1,382,753 |
| | 105,000 | | Ford Motor Credit Co. LLC,
8.000%, 12/15/2016 | | | 66,389 |
See accompanying notes to financial statements.
18
LOOMIS SAYLES GLOBAL MARKETS FUND — PORTFOLIOOF INVESTMENTS (continued)
Investments as of September 30, 2008
| | | | | | |
Principal
Amount (‡) | | Description | | Value (†) |
| | | | | | |
| | | United States — continued | | | |
| $ | 170,000 | | Ford Motor Credit Co. LLC,
8.625%, 11/01/2010 | | $ | 120,550 |
| | 390,000 | | Ford Motor Credit Co. LLC,
9.750%, 9/15/2010 | | | 279,662 |
| | 388,000 | | Freescale Semiconductor, Inc.,
10.125%, 12/15/2016(e) | | | 248,320 |
| | 8,000,000 | | General Electric Capital Corp., EMTN,
1.500%, 4/26/2012, (JPY) | | | 63,228 |
| | 13,000,000 | | General Electric Capital Corp., GMTN,
1.450%, 11/10/2011, (JPY) | | | 110,851 |
| | 45,000 | | General Motors Corp.,
7.400%, 9/01/2025 | | | 16,200 |
| | 710,000 | | General Motors Corp.,
8.250%, 7/15/2023 | | | 278,675 |
| | 3,015,000 | | General Motors Corp.,
8.375%, 7/15/2033 | | | 1,206,000 |
| | 120,000 | | Georgia Gulf Corp.,
10.750%, 10/15/2016(e) | | | 54,000 |
| | 3,375,000 | | Georgia-Pacific LLC,
7.250%, 6/01/2028 | | | 2,666,250 |
| | 35,000 | | Georgia-Pacific LLC,
7.750%, 11/15/2029 | | | 28,875 |
| | 525,000 | | Georgia-Pacific LLC,
8.000%, 1/15/2024 | | | 462,000 |
| | 505,000 | | Georgia-Pacific LLC,
8.875%, 5/15/2031 | | | 439,350 |
| | 455,000 | | GMAC LLC,
6.000%, 12/15/2011 | | | 202,311 |
| | 205,000 | | GMAC LLC,
6.625%, 5/15/2012 | | | 86,790 |
| | 420,000 | | GMAC LLC,
6.750%, 12/01/2014 | | | 161,202 |
| | 45,000 | | GMAC LLC,
6.875%, 9/15/2011 | | | 20,078 |
| | 95,000 | | GMAC LLC,
6.875%, 8/28/2012 | | | 37,760 |
| | 100,000 | | GMAC LLC,
7.000%, 2/01/2012 | | | 40,761 |
| | 100,000 | | GMAC LLC,
7.250%, 3/02/2011 | | | 47,298 |
| | 3,170,000 | | GMAC LLC,
8.000%, 11/01/2031 | | | 1,195,968 |
| | 1,190,000 | | Goldman Sachs Group LP,
5.000%, 10/01/2014 | | | 992,540 |
| | 150,000 | | Goldman Sachs Group, Inc. (The),
4.750%, 1/28/2014, (EUR) | | | 166,301 |
| | 605,000 | | Goldman Sachs Group, Inc. (The),
5.150%, 1/15/2014 | | | 496,876 |
| | 150,000 | | Goldman Sachs Group, Inc. (The),
5.314%, 5/23/2016, (EUR)(b) | | | 144,169 |
| | 400,000 | | Goldman Sachs Group, Inc. (The),
6.875%, 1/18/2038, (GBP) | | | 553,182 |
| | 165,000 | | Goodyear Tire & Rubber Co.,
7.000%, 3/15/2028 | | | 122,100 |
| | 25,000 | | GTE Corp.,
6.940%, 4/15/2028 | | | 21,213 |
| | 20,000 | | HCA, Inc.,
5.750%, 3/15/2014 | | | 15,600 |
| | 55,000 | | HCA, Inc.,
6.250%, 2/15/2013 | | | 45,925 |
| | | | | | |
Principal
Amount (‡) | | Description | | Value (†) |
| | | | | | |
| | | United States — continued | | | |
| $ | 90,000 | | HCA, Inc.,
6.375%, 1/15/2015 | | $ | 70,875 |
| | 15,000 | | HCA, Inc.,
6.500%, 2/15/2016 | | | 11,888 |
| | 40,000 | | HCA, Inc.,
6.750%, 7/15/2013 | | | 33,600 |
| | 225,000 | | HCA, Inc.,
7.050%, 12/01/2027 | | | 151,940 |
| | 245,000 | | HCA, Inc.,
7.190%, 11/15/2015 | | | 195,591 |
| | 90,000 | | HCA, Inc.,
7.500%, 12/15/2023 | | | 65,930 |
| | 250,000 | | HCA, Inc.,
7.500%, 11/06/2033 | | | 177,500 |
| | 1,295,000 | | HCA, Inc.,
7.690%, 6/15/2025 | | | 962,496 |
| | 395,000 | | HCA, Inc.,
8.360%, 4/15/2024 | | | 306,157 |
| | 110,000 | | HCA, Inc., MTN,
7.580%, 9/15/2025 | | | 81,040 |
| | 75,000 | | HCA, Inc., MTN,
7.750%, 7/15/2036 | | | 53,243 |
| | 395,000 | | Highwoods Properties, Inc.,
5.850%, 3/15/2017 | | | 316,850 |
| | 260,000 | | Hilcorp Energy I LP,
7.750%, 11/01/2015, 144A | | | 223,600 |
| | 25,000 | | Home Depot, Inc.,
5.400%, 3/01/2016 | | | 21,258 |
| | 1,285,000 | | Home Depot, Inc.,
5.875%, 12/16/2036 | | | 903,320 |
| | 250,000 | | iStar Financial, Inc.,
5.150%, 3/01/2012 | | | 125,000 |
| | 95,000 | | iStar Financial, Inc.,
5.500%, 6/15/2012 | | | 48,450 |
| | 105,000 | | iStar Financial, Inc.,
5.650%, 9/15/2011 | | | 54,600 |
| | 70,000 | | iStar Financial, Inc.,
5.850%, 3/15/2017 | | | 34,300 |
| | 300,000 | | iStar Financial, Inc.,
5.875%, 3/15/2016 | | | 147,000 |
| | 145,000 | | iStar Financial, Inc.,
6.050%, 4/15/2015 | | | 71,050 |
| | 985,000 | | iStar Financial, Inc.,
8.625%, 6/01/2013 | | | 482,650 |
| | 35,000 | | iStar Financial, Inc., Series B,
5.700%, 3/01/2014 | | | 17,150 |
| | 950,000 | | iStar Financial, Inc., Series B,
5.950%, 10/15/2013 | | | 494,000 |
| | 5,000 | | J.C. Penney Corp., Inc.,
5.750%, 2/15/2018 | | | 4,201 |
| | 125,000 | | J.C. Penney Corp., Inc.,
6.375%, 10/15/2036 | | | 95,075 |
| | 15,000 | | J.C. Penney Corp., Inc.,
7.125%, 11/15/2023 | | | 13,675 |
| | 5,000 | | J.C. Penney Corp., Inc.,
7.400%, 4/01/2037 | | | 4,183 |
| | 5,000 | | J.C. Penney Corp., Inc.,
7.625%, 3/01/2097 | | | 3,878 |
| | 260,000 | | K. Hovnanian Enterprises, Inc.,
6.250%, 1/15/2016 | | | 149,500 |
See accompanying notes to financial statements.
19
LOOMIS SAYLES GLOBAL MARKETS FUND — PORTFOLIOOF INVESTMENTS (continued)
Investments as of September 30, 2008
| | | | | | |
Principal
Amount (‡) | | Description | | Value (†) |
| | | | | | |
| | | United States — continued | | | |
| $ | 15,000 | | K. Hovnanian Enterprises, Inc.,
6.375%, 12/15/2014 | | $ | 8,700 |
| | 250,000 | | Kellwood Co.,
7.625%, 10/15/2017(f) | | | 137,500 |
| | 150,000 | | Kraft Foods, Inc.,
6.250%, 3/20/2015, (EUR) | | | 205,215 |
| | 1,800,000 | | Lehman Brothers Holdings, Inc.,
6.875%, 7/17/2037(g) | | | 2,250 |
| | 135,000 | | Lehman Brothers Holdings, Inc., (fixed rate to 5/03/2027, variable rate thereafter),
6.000%, 5/03/2032(g) | | | 169 |
| | 225,000 | | Lehman Brothers Holdings, Inc., EMTN,
5.000%, 1/26/2010, (GBP)(g) | | | 44,002 |
| | 30,000 | | Lennar Corp., Series B,
5.125%, 10/01/2010 | | | 25,200 |
| | 15,000 | | Lennar Corp., Series B,
5.500%, 9/01/2014 | | | 9,750 |
| | 1,090,000 | | Lennar Corp., Series B,
5.600%, 5/31/2015 | | | 708,500 |
| | 55,000 | | Lennar Corp., Series B,
6.500%, 4/15/2016 | | | 37,125 |
| | 15,000 | | Level 3 Financing, Inc.,
8.750%, 2/15/2017 | | | 10,875 |
| | 10,000 | | Level 3 Financing, Inc.,
9.250%, 11/01/2014 | | | 7,550 |
| | 155,000 | | Lucent Technologies, Inc.,
6.450%, 3/15/2029 | | | 94,550 |
| | 130,000 | | MBNA Credit Card Master Note Trust,
4.150%, 9/19/2012, (EUR) | | | 177,047 |
| | 500,000 | | Merrill Lynch & Co., Inc.,
10.710%, 3/08/2017, (BRL) | | | 186,557 |
| | 150,000 | | Merrill Lynch & Co., Inc., EMTN,
4.625%, 9/14/2018, (EUR) | | | 115,660 |
| | 90,000 | | MidAmerican Energy Holdings Co.,
6.500%, 9/15/2037 | | | 78,962 |
| | 1,805,000 | | Morgan Stanley,
3.875%, 1/15/2009 | | | 1,660,632 |
| | 230,000 | | Morgan Stanley,
5.375%, 11/14/2013, (GBP) | | | 275,252 |
| | 1,400,000 | | Morgan Stanley,
5.375%, 10/15/2015 | | | 867,713 |
| | 300,000 | | Morgan Stanley, EMTN,
5.450%, 1/09/2017 | | | 186,092 |
| | 300,000 | | Morgan Stanley, Series F, MTN,
5.950%, 12/28/2017 | | | 187,934 |
| | 300,000 | | Morgan Stanley, MTN,
6.250%, 8/09/2026 | | | 183,396 |
| | 100,000 | | Mosaic Global Holdings, Inc.,
7.375%, 8/01/2018 | | | 99,297 |
| | 80,000 | | News America, Inc.,
6.150%, 3/01/2037 | | | 65,226 |
| | 25,000 | | News America, Inc.,
6.400%, 12/15/2035 | | | 21,001 |
| | 855,000 | | Nextel Communications, Inc., Series D,
7.375%, 8/01/2015 | | | 564,300 |
| | 115,000 | | Nextel Communications, Inc., Series E,
6.875%, 10/31/2013 | | | 78,200 |
| | 185,000 | | Nextel Communications, Inc., Series F,
5.950%, 3/15/2014 | | | 123,950 |
| | | | | | |
Principal
Amount (‡) | | Description | | Value (†) |
| | | | | | |
| | | United States — continued | | | |
| $ | 250,000 | | NGC Corporation Capital Trust I, Series B,
8.316%, 6/01/2027 | | $ | 186,250 |
| | 170,000 | | Northern Telecom Capital Corp.,
7.875%, 6/15/2026 | | | 74,800 |
| | 1,000,000 | | NRG Energy, Inc.,
7.375%, 2/01/2016 | | | 900,000 |
| | 150,000 | | Owens Brockway Glass Container, Inc.,
6.750%, 12/01/2014, (EUR) | | | 183,718 |
| | 565,000 | | Owens Corning, Inc.,
6.500%, 12/01/2016 | | | 499,976 |
| | 535,000 | | Owens Corning, Inc.,
7.000%, 12/01/2036 | | | 430,074 |
| | 40,000 | | Owens-Illinois, Inc.,
7.800%, 5/15/2018 | | | 38,800 |
| | 950,000 | | Petrobras International Finance Co.,
5.875%, 3/01/2018 | | | 863,438 |
| | 200,000 | | Philip Morris International, Inc., GMTN,
5.875%, 9/04/2015, (EUR) | | | 274,660 |
| | 50,000 | | Pulte Homes, Inc.,
5.200%, 2/15/2015 | | | 40,000 |
| | 540,000 | | Pulte Homes, Inc.,
6.000%, 2/15/2035 | | | 386,100 |
| | 695,000 | | Pulte Homes, Inc.,
6.375%, 5/15/2033 | | | 507,350 |
| | 1,335,000 | | Qwest Capital Funding, Inc.,
6.500%, 11/15/2018 | | | 971,212 |
| | 670,000 | | Qwest Capital Funding, Inc.,
6.875%, 7/15/2028 | | | 465,650 |
| | 400,000 | | Qwest Capital Funding, Inc.,
7.625%, 8/03/2021 | | | 304,000 |
| | 60,000 | | Qwest Capital Funding, Inc.,
7.750%, 2/15/2031 | | | 43,800 |
| | 540,000 | | Qwest Corp.,
6.875%, 9/15/2033 | | | 363,150 |
| | 115,000 | | Qwest Corp.,
7.250%, 9/15/2025 | | | 85,675 |
| | 58,000 | | R.H. Donnelley Corp.,
6.875%, 1/15/2013 | | | 22,620 |
| | 50,000 | | R.H. Donnelley Corp., Series A-1,
6.875%, 1/15/2013 | | | 19,500 |
| | 60,000 | | R.H. Donnelley Corp., Series A-2,
6.875%, 1/15/2013 | | | 23,400 |
| | 18,000 | | R.H. Donnelley Corp., Series A-3,
8.875%, 1/15/2016 | | | 6,120 |
| | 735,000 | | R.H. Donnelley Corp., Series A-4,
8.875%, 10/15/2017 | | | 249,900 |
| | 155,000 | | RBS Capital Trust, (fixed rate to 1/12/2016, variable rate thereafter),
4.243%, 12/29/2049, (EUR) | | | 143,283 |
| | 5,000 | | Residential Capital LLC,
8.375%, 6/30/2010(e) | | | 1,150 |
| | 195,000 | | Residential Capital LLC,
8.500%, 6/01/2012 | | | 39,000 |
| | 345,000 | | Residential Capital LLC,
8.500%, 4/17/2013 | | | 69,000 |
| | 175,000 | | Residential Capital LLC,
8.875%, 6/30/2015 | | | 35,000 |
| | 80,000 | | Reynolds American, Inc.,
6.750%, 6/15/2017 | | | 74,753 |
See accompanying notes to financial statements.
20
LOOMIS SAYLES GLOBAL MARKETS FUND — PORTFOLIOOF INVESTMENTS (continued)
Investments as of September 30, 2008
| | | | | | |
Principal
Amount (‡) | | Description | | Value (†) |
| | | | | | |
| | | United States — continued | | | |
| $ | 20,000 | | Reynolds American, Inc.,
7.250%, 6/15/2037 | | $ | 19,139 |
| | 415,000 | | Six Flags, Inc.,
9.625%, 6/01/2014(e) | | | 232,400 |
| | 100,000 | | Six Flags, Inc.,
9.750%, 4/15/2013(e) | | | 58,000 |
| | 1,600(†††) | | SLM Corp.,
6.000%, 12/15/2043 | | | 16,524 |
| | 20,000 | | SLM Corp., Series A, MTN,
4.000%, 1/15/2010 | | | 15,700 |
| | 228,000 | | SLM Corp., Series A, MTN,
5.000%, 10/01/2013 | | | 141,360 |
| | 10,000 | | SLM Corp., Series A, MTN,
5.000%, 6/15/2018 | | | 5,500 |
| | 115,000 | | SLM Corp., Series A, MTN,
5.375%, 1/15/2013 | | | 75,325 |
| | 75,000 | | SLM Corp., Series A, MTN,
5.375%, 5/15/2014 | | | 46,500 |
| | 30,000 | | SLM Corp., Series A, MTN,
5.400%, 10/25/2011 | | | 21,000 |
| | 20,000 | | SLM Corp., Series A, MTN,
5.625%, 8/01/2033 | | | 10,000 |
| | 625,000 | | SLM Corp., Series A, MTN,
8.450%, 6/15/2018 | | | 425,000 |
| | 120,000 | | SLM Corp., MTN,
5.050%, 11/14/2014 | | | 73,200 |
| | 30,000 | | SLM Corp., MTN,
5.125%, 8/27/2012 | | | 19,500 |
| | 434,000 | | Sprint Capital Corp.,
6.875%, 11/15/2028 | | | 290,780 |
| | 420,000 | | Sprint Capital Corp.,
6.900%, 5/01/2019 | | | 325,500 |
| | 26,000 | | Sprint Nextel Corp.,
6.000%, 12/01/2016 | | | 20,020 |
| | 20,000 | | Tenet Healthcare Corp.,
6.500%, 6/01/2012 | | | 18,500 |
| | 265,000 | | Tenet Healthcare Corp.,
6.875%, 11/15/2031 | | | 180,200 |
| | 23,000 | | Tenet Healthcare Corp.,
7.375%, 2/01/2013 | | | 20,930 |
| | 750,000 | | Tennessee Gas Pipeline Co.,
7.000%, 10/15/2028(e) | | | 642,714 |
| | 250,000 | | Textron, Inc.,
3.875%, 3/11/2013, (EUR) | | | 315,017 |
| | 10,000 | | Time Warner, Inc.,
6.500%, 11/15/2036 | | | 7,594 |
| | 395,000 | | Time Warner, Inc.,
6.625%, 5/15/2029 | | | 315,494 |
| | 160,000 | | Time Warner, Inc.,
6.950%, 1/15/2028 | | | 133,395 |
| | 115,000 | | Time Warner, Inc.,
7.625%, 4/15/2031 | | | 99,861 |
| | 75,000 | | Time Warner, Inc.,
7.700%, 5/01/2032 | | | 65,531 |
| | 105,000 | | Toll Brothers Finance Corp.,
5.150%, 5/15/2015 | | | 88,800 |
| | 375,000 | | Toys R Us, Inc.,
7.375%, 10/15/2018 | | | 243,750 |
| | 200,000 | | Transcontinental Gas Pipe Line Corp.,
6.400%, 4/15/2016 | | | 191,652 |
| | | | | | |
Principal
Amount (‡) | | Description | | Value (†) |
| | | | | | |
| | | United States — continued | | | |
| $ | 3,150,000 | | TXU Corp., Series P,
5.550%, 11/15/2014 | | $ | 2,350,710 |
| | 2,570,000 | | TXU Corp., Series Q,
6.500%, 11/15/2024 | | | 1,636,774 |
| | 30,000 | | TXU Corp., Series R,
6.550%, 11/15/2034 | | | 18,433 |
| | 785,000 | | U.S. Treasury Notes,
2.625%, 5/31/2010(c)(e) | | | 793,770 |
| | 420,000 | | U.S. Treasury Notes,
3.500%, 2/15/2018(c)(e) | | | 411,862 |
| | 1,300,000 | | U.S. Treasury Notes,
4.000%, 8/15/2018(e) | | | 1,318,485 |
| | 1,760,000 | | United Rentals North America, Inc.,
7.000%, 2/15/2014 | | | 1,232,000 |
| | 1,400,000 | | United Rentals North America, Inc.,
7.750%, 11/15/2013(e) | | | 1,067,500 |
| | 770,000 | | United States Steel Corp.,
6.650%, 6/01/2037 | | | 572,655 |
| | 50,000 | | USG Corp.,
6.300%, 11/15/2016 | | | 37,750 |
| | 230,000 | | USG Corp.,
7.750%, 1/15/2018 | | | 182,850 |
| | 90,000 | | Verizon Communications,
5.850%, 9/15/2035 | | | 70,374 |
| | 535,000 | | Verizon Communications, Inc.,
6.400%, 2/15/2038 | | | 446,522 |
| | 5,000 | | Verizon Maryland, Inc.,
5.125%, 6/15/2033 | | | 3,383 |
| | 250,000 | | Verizon New York, Inc., Series B,
7.375%, 4/01/2032 | | | 218,232 |
| | 775,000 | | Viacom, Inc., Class B,
6.875%, 4/30/2036 | | | 621,302 |
| | 140,000 | | Virginia Tobacco Settlement Financing Corp., Series A-1,
6.706%, 6/01/2046(f) | | | 108,423 |
| | 185,000 | | Wells Fargo & Co.,
4.625%, 11/02/2035, (GBP) | | | 242,804 |
| | 100,000 | | Williams Cos., Inc.,
7.500%, 1/15/2031 | | | 90,998 |
| | 20,000 | | Xerox Corp., MTN,
7.200%, 4/01/2016 | | | 19,411 |
| | | | | | |
| | | | | | 56,278,931 |
| | | | | | |
| | | Uruguay — 0.5% | | | |
| | 35,482,670 | | Republic of Uruguay,
4.250%, 4/05/2027, (UYU) | | | 1,535,936 |
| | | | | | |
| | | Total Non-Convertible Bonds (Identified Cost $99,205,920) | | | 79,927,515 |
| | | | | | |
| | Convertible Bonds — 1.0% | | | |
| | | United States — 1.0% | | | |
| | 95,000 | | Builders Transportation, Inc.,
8.000%, 8/15/2005(h) | | | — |
| | 56,000 | | Countrywide Financial Corp., Series A,
Zero Coupon, 4/15/2037(b)(e) | | | 54,880 |
| | 178,000 | | Countrywide Financial Corp., Series B,
0.554%, 5/15/2037(b)(e) | | | 161,980 |
| | 430,000 | | iStar Financial, Inc.,
3.291%, 10/01/2012(b) | | | 230,050 |
| | 365,000 | | Kulicke & Soffa Industries, Inc.,
0.875%, 6/01/2012 | | | 249,569 |
See accompanying notes to financial statements.
21
LOOMIS SAYLES GLOBAL MARKETS FUND — PORTFOLIOOF INVESTMENTS (continued)
Investments as of September 30, 2008
| | | | | | |
Principal
Amount (‡) | | Description | | Value (†) |
| | | | | | |
| | | United States — continued | | | |
| $ | 140,000 | | Level 3 Communications, Inc.,
2.875%, 7/15/2010 | | $ | 110,075 |
| | 440,000 | | Level 3 Communications, Inc.,
3.500%, 6/15/2012 | | | 310,750 |
| | 185,000 | | Level 3 Communications, Inc.,
5.250%, 12/15/2011 | | | 152,856 |
| | 95,000 | | Level 3 Communications, Inc.,
6.000%, 9/15/2009 | | | 89,300 |
| | 145,000 | | Level 3 Communications, Inc.,
6.000%, 3/15/2010 | | | 126,875 |
| | 200,000 | | NII Holdings, Inc.,
3.125%, 6/15/2012 | | | 148,000 |
| | 500,000 | | Valeant Pharmaceuticals International,
3.000%, 8/16/2010 | | | 472,500 |
| | 80,000 | | Valeant Pharmaceuticals International,
4.000%, 11/15/2013 | | | 74,900 |
| | 583,000 | | Vertex Pharmaceuticals, Inc.,
4.750%, 2/15/2013 | | | 879,601 |
| | | | | | |
| | | Total Convertible Bonds (Identified Cost $3,169,967) | | | 3,061,336 |
| | | | | | |
| | | Total Bonds and Notes (Identified Cost $102,375,887) | | | 82,988,851 |
| | | | | | |
| | Bank Loans — 0.0% |
| | | United States — 0.0% | | | |
| | 1,958 | | Dole Food Co., Inc., LOC,
4.788%, 4/12/2013(i) | | | 1,717 |
| | 1,315 | | Dole Food Co., Inc., Term Loan,
4.738%, 4/12/2013(i) | | | 1,153 |
| | 6,952 | | Dole Food Co., Inc., Tranche C Term Loan,
4.795%, 4/12/2013(i) | | | 6,097 |
| | 56,380 | | Hawaiian Telecom Communications, Inc., Term Loan C,
6.262%, 6/01/2014(i) | | | 38,782 |
| | 164,266 | | Idearc, Inc., Term Loan B,
5.767%, 11/17/2014(i) | | | 97,943 |
| | 7,314 | | Tribune Co., Tranche X,
5.541%, 6/04/2009(i) | | | 6,775 |
| | | | | | |
| | | | | | 152,467 |
| | | | | | |
| | | Total Bank Loans (Identified Cost $190,768) | | | 152,467 |
| | | | | | |
| | | | | | |
| Shares | | | | |
| | Common Stocks — 65.5% |
| | | Brazil — 1.8% | | | |
| | 256,870 | | Petroleo Brasileiro SA | | | 5,699,223 |
| | | | | | |
| | | Canada — 0.0% | | | |
| | 3 | | Nortel Networks Corp.(d) | | | 7 |
| | | | | | |
| | | China — 0.7% | | | |
| | 1,224,500 | | Li Ning Co. Ltd. | | | 2,148,192 |
| | | | | | |
| | | Denmark — 1.4% | | | |
| | 83,578 | | Novo Nordisk A/S, Class B | | | 4,332,871 |
| | | | | | |
| | | Finland — 0.8% | | | |
| | 140,855 | | Nokia Oyj, Sponsored ADR | | | 2,626,946 |
| | | | | | |
| | | France — 1.8% | | | |
| | 30,287 | | Total SA | | | 1,839,932 |
| | 53,933 | | UBISOFT Entertainment(d) | | | 3,751,867 |
| | | | | | |
| | | | | | 5,591,799 |
| | | | | | |
| | | Germany — 1.4% | | | |
| | 45,233 | | Siemens AG (Registered) | | | 4,219,198 |
| | | | | | |
| | | | | |
Shares | | Description | | Value (†) |
| | | | | |
| | Japan — 2.8% | | | |
| 14,500 | | Nintendo Co. Ltd. | | $ | 6,150,519 |
| 417 | | Sumitomo Mitsui Financial Group, Inc.(e) | | | 2,614,448 |
| | | | | |
| | | | | 8,764,967 |
| | | | | |
| | Spain — 1.6% | | | |
| 142,002 | | Gamesa Corporation Tecnologica SA | | | 4,865,267 |
| | | | | |
| | Switzerland — 3.5% | | | |
| 251,558 | | ABB Ltd. (Registered)(d) | | | 4,894,867 |
| 55,951 | | Actelion Ltd. (Registered)(d)(e) | | | 2,883,072 |
| 61,131 | | Julius Baer Holding Ltd. (Registered) | | | 3,040,070 |
| | | | | |
| | | | | 10,818,009 |
| | | | | |
| | Turkey — 0.4% | | | |
| 43,884 | | BIM Birlesik Magazalar A/S | | | 1,361,304 |
| | | | | |
| | United Kingdom — 3.6% | | | |
| 431,190 | | Capita Group PLC | | | 5,366,442 |
| 235,429 | | Standard Chartered PLC | | | 5,792,858 |
| | | | | |
| | | | | 11,159,300 |
| | | | | |
| | United States — 45.7% | | | |
| 165,852 | | Activision Blizzard, Inc.(d) | | | 2,559,096 |
| 57,641 | | Apple, Inc.(d) | | | 6,551,476 |
| 89,642 | | AT&T, Inc. | | | 2,502,805 |
| 843 | | Berkshire Hathaway, Inc., Class B(d) | | | 3,704,985 |
| 28,788 | | BlackRock, Inc.(e) | | | 5,599,266 |
| 167,739 | | Charles Schwab Corp. (The) | | | 4,361,214 |
| 32,912 | | Costco Wholesale Corp. | | | 2,136,976 |
| 101,111 | | Covidien Ltd. | | | 5,435,727 |
| 25,522 | | ExxonMobil Corp. | | | 1,982,039 |
| 23,109 | | First Solar, Inc.(d) | | | 4,365,521 |
| 48,303 | | Flowserve Corp. | | | 4,287,857 |
| 56,541 | | Fluor Corp. | | | 3,149,334 |
| 45,241 | | Genzyme Corp.(d) | | | 3,659,544 |
| 50,020 | | Goodrich Corp. | | | 2,080,832 |
| 8,138 | | Google, Inc. Class A(d) | | | 3,259,432 |
| 93,888 | | Hewlett-Packard Co. | | | 4,341,381 |
| 28,701 | | International Business Machines Corp. | | | 3,356,869 |
| 6,420 | | Intuitive Surgical, Inc.(d) | | | 1,547,092 |
| 182,273 | | JPMorgan Chase & Co. | | | 8,512,149 |
| 151,239 | | Lowe’s Cos., Inc. | | | 3,582,852 |
| 23,338 | | MasterCard, Inc., Class A(e) | | | 4,138,528 |
| 100,615 | | McAfee, Inc.(d) | | | 3,416,885 |
| 97,235 | | McDonald’s Corp. | | | 5,999,399 |
| 72,120 | | Monsanto Co. | | | 7,138,438 |
| 184,378 | | News Corp., Class A | | | 2,210,692 |
| 172,102 | | Oracle Corp.(d) | | | 3,495,392 |
| 41,728 | | PNC Financial Services Group, Inc. | | | 3,117,082 |
| 163,787 | | QUALCOMM, Inc. | | | 7,037,927 |
| 130,113 | | Southwestern Energy Co.(d) | | | 3,973,651 |
| 48,116 | | Transocean, Inc.(d) | | | 5,285,061 |
| 99,818 | | Visa, Inc., Class A | | | 6,127,827 |
| 111,883 | | Wal-Mart Stores, Inc. | | | 6,700,673 |
| 87,026 | | Wells Fargo & Co. | | | 3,266,086 |
| 83,256 | | XTO Energy, Inc. | | | 3,873,069 |
| | | | | |
| | | | | 142,757,157 |
| | | | | |
| | Total Common Stocks (Identified Cost $234,779,715) | | | 204,344,240 |
| | | | | |
See accompanying notes to financial statements.
22
LOOMIS SAYLES GLOBAL MARKETS FUND — PORTFOLIOOF INVESTMENTS (continued)
Investments as of September 30, 2008
| | | | | | | |
Shares | | Description | | Value (†) | |
| | | | | | | |
| | Preferred Stocks — 0.1% | | | | |
| | | United States — 0.1% | | | | |
| | 12,940 | | Federal Home Loan Mortgage Corp.,
8.750%(d)(k) | | $ | 21,092 | |
| | 17,500 | | Federal National Mortgage Association, 8.250%(k) | | | 38,150 | |
| | 820 | | Lucent Technologies Capital Trust, 7.750% | | | 381,013 | |
| | | | | | | |
| | | | | | 440,255 | |
| | | | | | | |
| | | Total Preferred Stocks (Identified Cost $1,244,413) | | | 440,255 | |
| | | | | | | |
Principal
Amount (‡)/
Shares | | | | | |
| | Short-Term Investments — 12.3% | | | | |
| $ | 2,870 | | Repurchase Agreement with State Street Corp. dated 9/30/2008 at 1.300%, to be repurchased at $2,870 on 10/01/2008 collateralized by $5,000 Federal Home Loan Bank, 5.300% due 10/03/2012 valued at $5,130 including accrued interest (Note 2g of Notes to Financial Statements) | | | 2,870 | |
| | 16,569,651 | | State Street Navigator Securities Lending Prime Portfolio(j) | | | 16,569,651 | |
| | 21,784,000 | | Tri-Party Repurchase Agreement with Fixed Income Clearing Corporation, dated 9/30/08 at 1.300% to be repurchased at $21,784,787 on 10/01/08 collateralized by $22,505,000 Federal National Mortgage Association Discount Note, Zero Coupon due 2/23/2009 valued at $22,223,688 including accrued interest (Note 2g of Notes to Financial Statements) | | | 21,784,000 | |
| | | | | | | |
| | | Total Short-Term Investments (Identified Cost $38,356,521) | | | 38,356,521 | |
| | | | | | | |
| | | | | | | |
| | | Total Investments — 104.5%
(Identified Cost $376,947,304)(a) | | | 326,282,334 | |
| | | Other assets less liabilities — (4.5)% | | | (14,135,066 | ) |
| | | | | | | |
| | | Net Assets — 100.0% | | $ | 312,147,268 | |
| | | | | | | |
| | | | | | | |
| | (‡) | | Principal amount stated in U.S. dollars unless otherwise noted. | | | | |
| | (†) | | See Note 2a of Notes to Financial Statements. | | | | |
| | (††) | | Amount shown represents units. One unit represents a principal amount of 100. | |
| | (†††) | | Amount shown represents units. One unit represents a principal amount of 25. | |
| | (a) | | Federal Tax Information: At September 30, 2008, the net unrealized depreciation on investments based on a cost of $378,844,967 for federal income tax purposes was as follows: | | | | |
| | | Aggregate gross unrealized appreciation for all investments in which there is an excess of value over tax cost | | $ | 4,415,122 | |
| | | Aggregate gross unrealized depreciation for all investments in which there is an excess of tax cost over value | | | (56,977,755 | ) |
| | | | | | | |
| | | Net unrealized depreciation | | $ | (52,562,633 | ) |
| | | | | | | |
| | | | | | | |
| | (b) | | Variable rate security. Rate as of September 30, 2008 is disclosed. | | | | |
| | (c) | | All or a portion of this security is held as collateral for open forward contracts. | |
| | (d) | | Non-income producing security. | | | | |
| | (e) | | All or a portion of this security was on loan to brokers at September 30, 2008. | |
| | (f) | | Illiquid security. At September 30, 2008, the value of these securities amounted to $245,923 or 0.1% of net assets. | |
| | (g) | | Issuer has filed for bankruptcy. | | | | |
| | (h) | | Bankrupt issuer. Security remains in the Portfolio of Investments pending final resolution of bankruptcy proceedings. | |
| | | | |
| (i) | | Variable rate security. Rate shown represents the weighted average rate at September 30, 2008. |
| (j) | | Represents investment of securities lending collateral. | | |
| (k) | | Future dividend payments have been eliminated as the issuer has been placed in conservatorship. | | |
| | | | |
| 144A | | Securities exempt from registration under Rule 144A of the Securities Act of 1933. These securities may be resold in transactions exempt from registration, normally to qualified institutional buyers. At September 30, 2008, the total value of these securities amounted to $4,966,048 or 1.6% of net assets. |
| ADR | | An American Depositary Receipt is a certificate issued by a custodian bank representing the right to receive securities of the foreign issuer described. The values of ADRs are significantly influenced by trading on exchanges not located in the United States. |
| EMTN | | Euro Medium Term Note | | |
| GMTN | | Global Medium Term Note | | |
| LOC | | Letter of Credit | | |
| MTN | | Medium Term Note | | |
| | | | |
| BRL | | Brazilian Real | | |
| CAD | | Canadian Dollar | | |
| COP | | Colombian Peso | | |
| EUR | | Euro | | |
| GBP | | British Pound | | |
| IDR | | Indonesian Rupiah | | |
| JPY | | Japanese Yen | | |
| MXN | | Mexican Peso | | |
| PLN | | Polish Zloty | | |
| SGD | | Singapore Dollar | | |
| UYU | | Uruguayan Peso | | |
At September 30, 2008, the Fund had the following open forward foreign currency contracts:
| | | | | | | | | | | | | |
Contract to Buy/Sell | | Delivery
Date | | Currency | | Units | | Value | | Unrealized
Appreciation
(Depreciation) | |
Sell | | 12/17/2008 | | Canadian Dollar | | 225,000 | | $ | 211,934 | | $ | (1,402 | ) |
Buy | | 6/15/2009 | | Chinese Yuan Renminbi | | 5,300,000 | | | 763,861 | | | (46,288 | ) |
Sell | | 6/15/2009 | | Chinese Yuan Renminbi | | 5,300,000 | | | 763,861 | | | 32,600 | |
Sell | | 12/17/2008 | | Euro | | 1,230,000 | | | 1,737,190 | | | 14,896 | |
Sell | | 12/17/2008 | | Japanese Yen | | 57,000,000 | | | 541,867 | | | (13,510 | ) |
| | | | | | | | | | | | | |
Total | | | | | | | | | | | $ | (13,704 | ) |
| | | | | | | | | | | | | |
See accompanying notes to financial statements.
23
LOOMIS SAYLES GLOBAL MARKETS FUND — PORTFOLIOOF INVESTMENTS (continued)
Investments as of September 30, 2008
Net Asset Summary at September 30, 2008 (Unaudited)
| | | |
| Software | | 6.2 | % |
| Oil, Gas & Consumable Fuels | | 5.6 | |
| Commercial Banks | | 4.7 | |
| Computers & Peripherals | | 4.6 | |
| Electrical Equipment | | 4.5 | |
| Capital Markets | | 4.2 | |
| IT Services | | 3.3 | |
| Food & Staples Retailing | | 3.3 | |
| Communication Equipment | | 3.1 | |
| Diversified Financial Services | | 2.7 | |
| Chemicals | | 2.5 | |
| Sovereigns | | 2.3 | |
| Health Care Equipment & Supplies | | 2.2 | |
| Non-Captive Diversified | | 2.1 | |
| Biotechnology | | 2.1 | |
| Pharmaceuticals | | 2.0 | |
| Other Investments, less than 2% each | | 36.8 | |
| Short-Term Investments | | 12.3 | |
| | | |
| Total Investments | | 104.5 | |
| Other assets less liabilities (including open Forward Foreign Currency Contracts) | | (4.5 | ) |
| | | |
| Net Assets | | 100.0 | % |
| | | |
Currency Exposure at September 30, 2008 as a Percentage of Net Assets (Unaudited)
| | | |
| United States Dollar | | 78.8 | % |
| Euro | | 7.4 | |
| Japanese Yen | | 4.5 | |
| British Pound | | 4.0 | |
| Brazilian Real | | 2.2 | |
| Other Investments, less than 2% each | | 7.6 | |
| | | |
| Total Investments | | 104.5 | |
| Other assets less liabilities (including open Forward Foreign Currency Contracts) | | (4.5 | ) |
| | | |
| Net Assets | | 100.0 | % |
| | | |
See accompanying notes to financial statements.
24
LOOMIS SAYLES GROWTH FUND — PORTFOLIOOF INVESTMENTS
Investments as of September 30, 2008
| | | | | |
| Shares | | Description | | Value (†) |
| | | | | |
| Common Stocks — 96.0% of Net Assets | | | |
| | Beverages — 1.6% | | | |
| 59,131 | | PepsiCo, Inc. | | $ | 4,214,266 |
| | | | | |
| | Biotechnology — 4.4% | | | |
| 57,661 | | Celgene Corp.(c) | | | 3,648,788 |
| 49,654 | | Genzyme Corp.(c) | | | 4,016,512 |
| 90,667 | | Gilead Sciences, Inc.(c) | | | 4,132,602 |
| | | | | |
| | | | | 11,797,902 |
| | | | | |
| | Capital Markets — 8.5% | | | |
| 40,925 | | BlackRock, Inc.(b) | | | 7,959,912 |
| 333,891 | | Charles Schwab Corp. (The) | | | 8,681,166 |
| 115,055 | | T. Rowe Price Group, Inc. | | | 6,179,604 |
| | | | | |
| | | | | 22,820,682 |
| | | | | |
| | Chemicals — 3.9% | | | |
| 105,301 | | Monsanto Co. | | | 10,422,693 |
| | | | | |
| | Communications Equipment — 4.1% | | | |
| 259,101 | | QUALCOMM, Inc. | | | 11,133,570 |
| | | | | |
| | Computers & Peripherals — 9.1% | | | |
| 84,086 | | Apple, Inc.(c) | | | 9,557,215 |
| 120,318 | | Hewlett-Packard Co. | | | 5,563,504 |
| 80,561 | | International Business Machines Corp. | | | 9,422,414 |
| | | | | |
| | | | | 24,543,133 |
| | | | | |
| | Construction & Engineering — 1.5% | | | |
| 73,071 | | Fluor Corp. | | | 4,070,055 |
| | | | | |
| | Diversified Financial Services — 1.3% | | | |
| 77,823 | | JPMorgan Chase & Co. | | | 3,634,334 |
| | | | | |
| | Electrical Equipment — 2.4% | | | |
| 33,803 | | First Solar, Inc.(c) | | | 6,385,725 |
| | | | | |
| | Electronic Equipment & Instruments — 1.9% | | | |
| 128,038 | | Amphenol Corp., Class A | | | 5,139,445 |
| | | | | |
| | Energy Equipment & Services — 2.8% | | | |
| 67,521 | | Transocean, Inc.(c) | | | 7,416,507 |
| | | | | |
| | Food & Staples Retailing — 4.0% | | | |
| 180,480 | | Wal-Mart Stores, Inc. | | | 10,808,947 |
| | | | | |
| | Health Care Equipment & Supplies — 7.0% | | | |
| 105,422 | | Covidien Ltd. | | | 5,667,487 |
| 20,402 | | Intuitive Surgical, Inc.(c) | | | 4,916,474 |
| 89,019 | | Medtronic, Inc. | | | 4,459,852 |
| 87,992 | | St. Jude Medical, Inc.(c) | | | 3,826,772 |
| | | | | |
| | | | | 18,870,585 |
| | | | | |
| | Hotels, Restaurants & Leisure — 2.6% | | | |
| 115,690 | | McDonald’s Corp. | | | 7,138,073 |
| | | | | |
| | Internet & Catalog Retail — 3.5% | | | |
| 100,928 | | Amazon.com, Inc.(c) | | | 7,343,521 |
| 32,370 | | Priceline.com, Inc.(b)(c) | | | 2,215,079 |
| | | | | |
| | | | | 9,558,600 |
| | | | | |
| | Internet Software & Services — 3.2% | | | |
| 21,492 | | Google, Inc. Class A(c) | | | 8,607,976 |
| | | | | |
| | IT Services — 6.0% | | | |
| 24,581 | | MasterCard, Inc., Class A(b) | | | 4,358,949 |
| 127,858 | | Visa, Inc., Class A | | | 7,849,203 |
| 163,632 | | Western Union Co. | | | 4,036,801 |
| | | | | |
| | | | | 16,244,953 |
| | | | | |
| | | | | | | |
| Shares | | Description | | Value (†) | |
| | | | | | | |
| | | Life Sciences Tools & Services — 3.0% | | | | |
| | 38,340 | | Covance, Inc.(b)(c) | | $ | 3,389,639 | |
| | 114,033 | | Illumina, Inc.(c) | | | 4,621,758 | |
| | | | | | | |
| | | | | | 8,011,397 | |
| | | | | | | |
| | | Machinery — 2.5% | | | | |
| | 60,984 | | Cummins, Inc. | | | 2,666,221 | |
| | 47,116 | | Flowserve Corp. | | | 4,182,487 | |
| | | | | | | |
| | | | | | 6,848,708 | |
| | | | | | | |
| | | Multiline Retail — 1.2% | | | | |
| | 67,425 | | Kohl’s Corp.(c) | | | 3,106,944 | |
| | | | | | | |
| | | Oil, Gas & Consumable Fuels — 5.8% | | | | |
| | 28,505 | | EOG Resources, Inc. | | | 2,550,057 | |
| | 101,975 | | Petrohawk Energy Corp.(c) | | | 2,205,719 | |
| | 143,501 | | Southwestern Energy Co.(c) | | | 4,382,521 | |
| | 138,792 | | XTO Energy, Inc. | | | 6,456,604 | |
| | | | | | | |
| | | | | | 15,594,901 | |
| | | | | | | |
| | | Road & Rail — 2.3% | | | | |
| | 112,389 | | CSX Corp. | | | 6,133,068 | |
| | | | | | | |
| | | Semiconductors & Semiconductor Equipment — 2.4% | | | | |
| | 347,700 | | Intel Corp. | | | 6,512,421 | |
| | | | | | | |
| | | Software — 7.1% | | | | |
| | 319,472 | | Activision Blizzard, Inc.(c) | | | 4,929,453 | |
| | 99,508 | | McAfee, Inc.(c) | | | 3,379,292 | |
| | 389,375 | | Oracle Corp.(c) | | | 7,908,206 | |
| | 154,672 | | Symantec Corp.(c) | | | 3,028,478 | |
| | | | | | | |
| | | | | | 19,245,429 | |
| | | | | | | |
| | | Specialty Retail — 3.9% | | | | |
| | 57,403 | | GameStop Corp., Class A(c) | | | 1,963,757 | |
| | 193,632 | | Lowe’s Cos., Inc. | | | 4,587,142 | |
| | 120,514 | | Urban Outfitters, Inc.(b)(c) | | | 3,840,781 | |
| | | | | | | |
| | | | | | 10,391,680 | |
| | | | | | | |
| | | Total Common Stocks (Identified Cost $276,058,688) | | | 258,651,994 | |
| | | | | | | |
Shares/
Principal
Amount | | | | | |
| | Short-Term Investments — 7.7% | | | | |
| | 15,008,790 | | State Street Navigator Securities Lending Prime Portfolio(d) | | | 15,008,790 | |
| $ | 5,773,000 | | Tri-Party Repurchase Agreement with Fixed Income Clearing Corporation, dated 9/30/2008 at 1.300% to be repurchased at $5,773,208 on 10/1/2008 collateralized by $5,790,000 Federal National Mortgage Association, 4.330% due 7/28/2011 valued at $5,891,325 including accrued interest (Note 2g of Notes to Financial Statements) | | | 5,773,000 | |
| | | | | | | |
| | | Total Short-Term Investments (Identified Cost $20,781,790) | | | 20,781,790 | |
| | | | | | | |
| | | | | | | |
| | | Total Investments — 103.7%
(Identified Cost $296,840,478)(a) | | | 279,433,784 | |
| | | Other assets less liabilities — (3.7)% | | | (9,908,443 | ) |
| | | | | | | |
| | | Net Assets — 100.0% | | $ | 269,525,341 | |
| | | | | | | |
| | | | | | | |
| | (†) | | See Note 2a of Notes to Financial Statements. | | | | |
See accompanying notes to financial statements.
25
LOOMIS SAYLES GROWTH FUND — PORTFOLIOOF INVESTMENTS (continued)
Investments as of September 30, 2008
| | | | | | |
| (a) | | Federal Tax Information: At September 30, 2008, the net unrealized depreciation on investments based on a cost of $297,698,960 for federal income tax purposes was as follows: | | | | |
| | Aggregate gross unrealized appreciation for all investments in which there is an excess of value over tax cost | | $ | 7,052,321 | |
| | Aggregate gross unrealized depreciation for all investments in which there is an excess of tax cost over value | | | (25,317,497 | ) |
| | | | | | |
| | Net unrealized depreciation | | $ | (18,265,176 | ) |
| | | | | | |
| (b) | | All or a portion of this security was on loan to brokers at September 30, 2008. | | | | |
| (c) | | Non-income producing security. | | | | |
| (d) | | Represents investment of securities lending collateral. | | | | |
Net Asset Summary at September 30, 2008 (Unaudited)
| | | |
| Computers & Peripherals | | 9.1 | % |
| Capital Markets | | 8.5 | |
| Software | | 7.1 | |
| Health Care Equipment & Supplies | | 7.0 | |
| IT Services | | 6.0 | |
| Oil, Gas & Consumable Fuels | | 5.8 | |
| Biotechnology | | 4.4 | |
| Communications Equipment | | 4.1 | |
| Food & Staples Retailing | | 4.0 | |
| Chemicals | | 3.9 | |
| Specialty Retail | | 3.9 | |
| Internet & Catalog Retail | | 3.5 | |
| Internet Software & Services | | 3.2 | |
| Life Sciences Tools & Services | | 3.0 | |
| Energy Equipment & Services | | 2.8 | |
| Hotels, Restaurants & Leisure | | 2.6 | |
| Machinery | | 2.5 | |
| Semiconductors & Semiconductor Equipment | | 2.4 | |
| Electrical Equipment | | 2.4 | |
| Road & Rail | | 2.3 | |
| Other Investments, less than 2% each | | 7.5 | |
| Short-Term Investments | | 7.7 | |
| | | |
| Total Investments | | 103.7 | |
| Other assets less liabilities | | (3.7 | ) |
| | | |
| Net Assets | | 100.0 | % |
| | | |
See accompanying notes to financial statements.
26
LOOMIS SAYLES RESEARCH FUND — PORTFOLIOOF INVESTMENTS
Investments as of September 30, 2008
| | | | | |
| Shares | | Description | | Value (†) |
| | | | | |
| | | | | |
| Common Stocks — 100.0% of Net Assets | | | |
| | Aerospace & Defense — 3.9% | | | |
| 1,825 | | Boeing Co. | | $ | 104,664 |
| 2,334 | | General Dynamics Corp. | | | 171,829 |
| 3,527 | | Lockheed Martin Corp. | | | 386,806 |
| 1,688 | | Precision Castparts Corp.(b) | | | 132,981 |
| 3,916 | | Rockwell Collins, Inc. | | | 188,320 |
| | | | | |
| | | | | 984,600 |
| | | | | |
| | Biotechnology — 4.0% | | | |
| 4,489 | | Celgene Corp.(c) | | | 284,064 |
| 5,291 | | Genzyme Corp.(c) | | | 427,989 |
| 6,764 | | Gilead Sciences, Inc.(c) | | | 308,303 |
| | | | | |
| | | | | 1,020,356 |
| | | | | |
| | Capital Markets — 2.2% | | | |
| 1,693 | | Goldman Sachs Group, Inc. | | | 216,704 |
| 6,093 | | State Street Corp. | | | 346,570 |
| | | | | |
| | | | | 563,274 |
| | | | | |
| | Chemicals — 1.8% | | | |
| 2,701 | | Monsanto Co. | | | 267,345 |
| 2,680 | | Praxair, Inc. | | | 192,263 |
| | | | | |
| | | | | 459,608 |
| | | | | |
| | Commercial Banks — 4.1% | | | |
| 6,408 | | PNC Financial Services Group, Inc. | | | 478,677 |
| 14,696 | | Wells Fargo & Co.(b) | | | 551,541 |
| | | | | |
| | | | | 1,030,218 |
| | | | | |
| | Communications Equipment — 3.8% | | | |
| 4,124 | | Harris Corp. | | | 190,529 |
| 17,749 | | QUALCOMM, Inc. | | | 762,674 |
| | | | | |
| | | | | 953,203 |
| | | | | |
| | Computers & Peripherals — 6.4% | | | |
| 5,849 | | Apple, Inc.(c) | | | 664,797 |
| 14,330 | | Dell, Inc.(c) | | | 236,159 |
| 15,670 | | Hewlett-Packard Co. | | | 724,581 |
| | | | | |
| | | | | 1,625,537 |
| | | | | |
| | Containers & Packaging — 1.6% | | | |
| 5,798 | | Owens-Illinois, Inc.(c) | | | 170,461 |
| 9,335 | | Pactiv Corp.(b)(c) | | | 231,788 |
| | | | | |
| | | | | 402,249 |
| | | | | |
| | Diversified Financial Services — 5.7% | | | |
| 19,100 | | Bank of America Corp.(b) | | | 668,500 |
| 16,982 | | JPMorgan Chase & Co. | | | 793,059 |
| | | | | |
| | | | | 1,461,559 |
| | | | | |
| | Diversified Telecommunication Services — 2.0% | | | |
| 18,526 | | AT&T, Inc. | | | 517,246 |
| | | | | |
| | Electric Utilities — 2.9% | | | |
| 3,095 | | Exelon Corp. | | | 193,809 |
| 5,726 | | FirstEnergy Corp. | | | 383,585 |
| 3,134 | | FPL Group, Inc. | | | 157,640 |
| | | | | |
| | | | | 735,034 |
| | | | | |
| | Electrical Equipment — 0.9% | | | |
| 5,765 | | Emerson Electric Co. | | | 235,154 |
| | | | | |
| | Energy Equipment & Services — 2.2% | | | |
| 8,564 | | Halliburton Co. | | | 277,388 |
| 3,764 | | Schlumberger Ltd.(b) | | | 293,931 |
| | | | | |
| | | | | 571,319 |
| | | | | |
| | | | | |
| Shares | | Description | | Value (†) |
| | | | | |
| | Food & Staples Retailing — 7.1% | | | |
| 23,277 | | Kroger Co. (The) | | $ | 639,652 |
| 19,650 | | Wal-Mart Stores, Inc. | | | 1,176,838 |
| | | | | |
| | | | | 1,816,490 |
| | | | | |
| | Food Products — 1.2% | | | |
| 5,879 | | H.J. Heinz Co. | | | 293,774 |
| | | | | |
| | Health Care Equipment & Supplies — 3.3% | | | |
| 4,899 | | Baxter International, Inc. | | | 321,521 |
| 9,681 | | Covidien Ltd. | | | 520,451 |
| | | | | |
| | | | | 841,972 |
| | | | | |
| | Health Care Providers & Services — 1.3% | | | |
| 7,168 | | Medco Health Solutions, Inc.(c) | | | 322,560 |
| | | | | |
| | Hotels, Restaurants & Leisure — 1.2% | | | |
| 4,797 | | McDonald’s Corp. | | | 295,975 |
| | | | | |
| | Household Products — 4.0% | | | |
| 14,724 | | Procter & Gamble Co. (The) | | | 1,026,116 |
| | | | | |
| | Industrial Conglomerates — 0.9% | | | |
| 8,611 | | General Electric Co. | | | 219,581 |
| | | | | |
| | Insurance — 4.9% | | | |
| 8,612 | | Chubb Corp. (The)(b) | | | 472,799 |
| 11,388 | | Metlife, Inc.(b) | | | 637,728 |
| 3,243 | | Travelers Cos., Inc. (The) | | | 146,583 |
| | | | | |
| | | | | 1,257,110 |
| | | | | |
| | Machinery — 2.9% | | | |
| 2,189 | | Cummins, Inc. | | | 95,703 |
| 7,796 | | Danaher Corp. | | | 541,042 |
| 2,192 | | Deere & Co. | | | 108,504 |
| | | | | |
| | | | | 745,249 |
| | | | | |
| | Media — 2.3% | | | |
| 11,282 | | DIRECTV Group, Inc. (The)(b)(c) | | | 295,250 |
| 9,797 | | Walt Disney Co. (The)(b) | | | 300,670 |
| | | | | |
| | | | | 595,920 |
| | | | | |
| | Multi-Utilities & Unregulated Power — 0.6% | | | |
| 4,531 | | Public Service Enterprise Group, Inc. | | | 148,571 |
| | | | | |
| | Multiline Retail — 0.9% | | | |
| 6,491 | | Dollar Tree, Inc.(c) | | | 236,013 |
| | | | | |
| | Oil, Gas & Consumable Fuels — 10.8% | | | |
| 4,486 | | Chevron Corp. | | | 370,005 |
| 1,824 | | ConocoPhillips | | | 133,608 |
| 2,619 | | Devon Energy Corp. | | | 238,853 |
| 9,170 | | El Paso Corp.(b) | | | 117,009 |
| 12,665 | | ExxonMobil Corp. | | | 983,564 |
| 4,373 | | Marathon Oil Corp. | | | 174,352 |
| 5,944 | | Occidental Petroleum Corp. | | | 418,755 |
| 2,969 | | Petrohawk Energy Corp.(c) | | | 64,219 |
| 5,418 | | XTO Energy, Inc. | | | 252,045 |
| | | | | |
| | | | | 2,752,410 |
| | | | | |
| | Pharmaceuticals — 4.4% | | | |
| 14,372 | | Bristol-Myers Squibb Co. | | | 299,656 |
| 6,340 | | Johnson & Johnson(b) | | | 439,235 |
| 13,662 | | Schering-Plough Corp.(b) | | | 252,337 |
| 3,690 | | Wyeth | | | 136,309 |
| | | | | |
| | | | | 1,127,537 |
| | | | | |
| | Road & Rail — 2.4% | | | |
| 3,015 | | Burlington Northern Santa Fe Corp. | | | 278,677 |
See accompanying notes to financial statements.
27
LOOMIS SAYLES RESEARCH FUND — PORTFOLIOOF INVESTMENTS (continued)
Investments as of September 30, 2008
| | | | | | | |
| Shares | | Description | | Value (†) | |
| | | | | | | |
| | | | | | | |
| | | Road & Rail — continued | | | | |
| | 4,582 | | Union Pacific Corp. | | $ | 326,055 | |
| | | | | | | |
| | | | | | 604,732 | |
| | | | | | | |
| | | Software — 5.1% | | | | |
| | 20,662 | | Activision Blizzard, Inc.(c) | | | 318,815 | |
| | 7,746 | | McAfee, Inc.(c) | | | 263,054 | |
| | 34,806 | | Oracle Corp.(c) | | | 706,910 | |
| | | | | | | |
| | | | | | 1,288,779 | |
| | | | | | | |
| | | Specialty Retail — 3.1% | | | | |
| | 2,064 | | Autozone, Inc.(c) | | | 254,574 | |
| | 16,243 | | Gap, Inc. (The) | | | 288,801 | |
| | 7,582 | | Urban Outfitters, Inc.(b)(c) | | | 241,638 | |
| | | | | | | |
| | | | | | 785,013 | |
| | | | | | | |
| | | Textiles, Apparel & Luxury Goods — 1.1% | | | | |
| | 3,641 | | VF Corp.(b) | | | 281,486 | |
| | | | | | | |
| | | Wireless Telecommunication Services — 1.0% | | | | |
| | 6,973 | | American Tower Corp., Class A(c) | | | 250,819 | |
| | | | | | | |
| | | Total Common Stocks (Identified Cost $27,027,952) | | | 25,449,464 | |
| | | | | | | |
Shares/
Principal
Amount | | | | | |
| | Short-Term Investments — 6.7% | | | | |
| | 1,479,633 | | State Street Navigator Securities Lending Prime Portfolio(d) | | | 1,479,633 | |
| $ | 218,000 | | Tri-Party Repurchase Agreement with Fixed Income Clearing Corporation, dated 9/30/2008 at 1.300% to be repurchased at $218,008 on 10/1/2008 collateralized by $220,000 Federal National Mortgage Association, 4.330% due 7/28/2011 valued at $223,850 including accrued interest (Note 2g Notes to Financial Statements) | | | 218,000 | |
| | | | | | | |
| | | Total Short-Term Investments (Identified Cost $1,697,633) | | | 1,697,633 | |
| | | | | | | |
| | | | | | | |
| | | Total Investments — 106.7%
(Identified Cost $28,725,585)(a) | | | 27,147,097 | |
| | | Other assets less liabilities — (6.7)% | | | (1,697,364 | ) |
| | | | | | | |
| | | Net Assets — 100.0% | | $ | 25,449,733 | |
| | | | | | | |
| | | | | | | |
| | (†) | | See Note 2a of Notes to Financial Statements. | | | | |
| | (a) | | Federal Tax Information: At September 30, 2008, the net unrealized depreciation on investments based on a cost of $28,856,364 for federal income tax purposes was as follows: | | | | |
| | | Aggregate gross unrealized appreciation for all investments in which there is an excess of value over tax cost | | $ | 589,700 | |
| | | Aggregate gross unrealized depreciation for all investments in which there is an excess of tax cost over value | | | (2,298,967 | ) |
| | | | | | | |
| | | Net unrealized depreciation | | $ | (1,709,267 | ) |
| | | | | | | |
| | (b) | | All or a portion of this security was on loan to brokers at September 30, 2008. | |
| | (c) | | Non-income producing security. | | | | |
| | (d) | | Represents investment of securities lending collateral. | | | | |
Net Asset Summary at September 30, 2008 (Unaudited)
| | | |
| Oil, Gas & Consumable Fuels | | 10.8 | % |
| Food & Staples Retailing | | 7.1 | |
| Computers & Peripherals | | 6.4 | |
| Diversified Financial Services | | 5.7 | |
| Software | | 5.1 | |
| Insurance | | 4.9 | |
| Pharmaceuticals | | 4.4 | |
| Commercial Banks | | 4.1 | |
| Household Products | | 4.0 | |
| Biotechnology | | 4.0 | |
| Aerospace & Defense | | 3.9 | |
| Communications Equipment | | 3.8 | |
| Health Care Equipment & Supplies | | 3.3 | |
| Specialty Retail | | 3.1 | |
| Machinery | | 2.9 | |
| Electric Utilities | | 2.9 | |
| Road & Rail | | 2.4 | |
| Media | | 2.3 | |
| Energy Equipment & Services | | 2.2 | |
| Capital Markets | | 2.2 | |
| Diversified Telecommunication Services | | 2.0 | |
| Other Investments, less than 2% each | | 12.5 | |
| Short-Term Investments | | 6.7 | |
| | | |
| Total Investments | | 106.7 | |
| Other assets less liabilities | | (6.7 | ) |
| | | |
| Net Assets | | 100.0 | % |
| | | |
See accompanying notes to financial statements.
28
LOOMIS SAYLES VALUE FUND — PORTFOLIOOF INVESTMENTS
Investments as of September 30, 2008
| | | | | |
| Shares | | Description | | Value (†) |
| | | | | |
| Common Stocks — 97.3% of Net Assets |
| | Aerospace & Defense — 4.1% | | | |
| 99,154 | | Goodrich Corp. | | $ | 4,124,806 |
| 134,755 | | Northrop Grumman Corp. | | | 8,158,068 |
| 90,296 | | United Technologies Corp. | | | 5,423,178 |
| | | | | |
| | | | | 17,706,052 |
| | | | | |
| | Beverages — 2.9% | | | |
| 273,062 | | Dr Pepper Snapple Group, Inc.(b) | | | 7,230,682 |
| 110,000 | | Molson Coors Brewing Co., Class B | | | 5,142,500 |
| | | | | |
| | | | | 12,373,182 |
| | | | | |
| | Capital Markets — 3.0% | | | |
| 160,186 | | Ameriprise Financial, Inc. | | | 6,119,105 |
| 214,888 | | Bank of New York Mellon Corp. | | | 7,001,051 |
| | | | | |
| | | | | 13,120,156 |
| | | | | |
| | Chemicals — 2.8% | | | |
| 167,450 | | E.I. du Pont de Nemours & Co. | | | 6,748,235 |
| 72,915 | | Praxair, Inc. | | | 5,230,922 |
| | | | | |
| | | | | 11,979,157 |
| | | | | |
| | Commercial Banks — 3.7% | | | |
| 117,822 | | PNC Financial Services Group, Inc. | | | 8,801,304 |
| 202,866 | | U.S. Bancorp | | | 7,307,233 |
| | | | | |
| | | | | 16,108,537 |
| | | | | |
| | Communications Equipment — 1.2% | | | |
| 272,363 | | Nokia Oyj, Sponsored ADR | | | 5,079,570 |
| | | | | |
| | Computers & Peripherals — 3.7% | | | |
| 184,433 | | Hewlett-Packard Co. | | | 8,528,182 |
| 63,476 | | International Business Machines Corp. | | | 7,424,153 |
| | | | | |
| | | | | 15,952,335 |
| | | | | |
| | Construction & Engineering — 0.8% | | | |
| 98,889 | | Foster Wheeler Ltd.(b) | | | 3,570,882 |
| | | | | |
| | Consumer Finance — 0.7% | | | |
| 212,108 | | Discover Financial Services(c) | | | 2,931,333 |
| | | | | |
| | Containers & Packaging — 2.7% | | | |
| 190,147 | | Owens-Illinois, Inc.(b) | | | 5,590,322 |
| 249,024 | | Pactiv Corp.(b) | | | 6,183,266 |
| | | | | |
| | | | | 11,773,588 |
| | | | | |
| | Diversified Financial Services — 8.3% | | | |
| 301,097 | | Bank of America Corp. | | | 10,538,395 |
| 371,365 | | Citigroup, Inc. | | | 7,616,696 |
| 284,865 | | JPMorgan Chase & Co. | | | 13,303,195 |
| 90,199 | | Leucadia National Corp.(c) | | | 4,098,643 |
| | | | | |
| | | | | 35,556,929 |
| | | | | |
| | Diversified Telecommunication Services — 4.0% | | | |
| 609,784 | | AT&T, Inc. | | | 17,025,169 |
| | | | | |
| | Electric Utilities — 1.4% | | | |
| 96,950 | | Exelon Corp. | | | 6,071,009 |
| | | | | |
| | Electrical Equipment — 1.0% | | | |
| 216,586 | | ABB Ltd., Sponsored ADR | | | 4,201,768 |
| | | | | |
| | Energy Equipment & Services — 2.5% | | | |
| 162,935 | | Halliburton Co. | | | 5,277,465 |
| 100,275 | | Tidewater, Inc.(c) | | | 5,551,224 |
| | | | | |
| | | | | 10,828,689 |
| | | | | |
| | Food & Staples Retailing — 1.8% | | | |
| 128,924 | | Wal-Mart Stores, Inc. | | | 7,721,258 |
| | | | | |
| | | | | |
| Shares | | Description | | Value (†) |
| | | | | |
| | Food Products — 2.9% | | | |
| 314,417 | | ConAgra Foods, Inc. | | $ | 6,118,555 |
| 194,538 | | Kraft Foods, Inc., Class A | | | 6,371,119 |
| | | | | |
| | | | | 12,489,674 |
| | | | | |
| | Gas Utilities — 0.6% | | | |
| 75,129 | | Equitable Resources, Inc. | | | 2,755,732 |
| | | | | |
| | Health Care Equipment & Supplies — 1.5% | | | |
| 118,844 | | Covidien Ltd. | | | 6,389,053 |
| | | | | |
| | Health Care Providers & Services — 1.1% | | | |
| 194,632 | | UnitedHealth Group, Inc. | | | 4,941,706 |
| | | | | |
| | Hotels, Restaurants & Leisure — 1.7% | | | |
| 117,637 | | McDonald’s Corp. | | | 7,258,203 |
| | | | | |
| | Household Durables — 0.6% | | | |
| 186,718 | | Pulte Homes, Inc.(c) | | | 2,608,450 |
| | | | | |
| | Independent Power Producers & Energy Traders — 1.0% | | | |
| 169,450 | | NRG Energy, Inc.(b)(c) | | | 4,193,888 |
| | | | | |
| | Industrial Conglomerates — 3.6% | | | |
| 370,616 | | General Electric Co. | | | 9,450,708 |
| 63,945 | | Siemens AG, Sponsored ADR | | | 6,003,796 |
| | | | | |
| | | | | 15,454,504 |
| | | | | |
| | Insurance — 7.4% | | | |
| 189,579 | | Allstate Corp. | | | 8,743,383 |
| 2,129 | | Berkshire Hathaway, Inc., Class B(b) | | | 9,356,955 |
| 140,135 | | Metlife, Inc. | | | 7,847,560 |
| 84,015 | | Prudential Financial, Inc. | | | 6,049,080 |
| | | | | |
| | | | | 31,996,978 |
| | | | | |
| | IT Services — 0.5% | | | |
| 134,392 | | Broadridge Financial Solutions, Inc. | | | 2,068,293 |
| | | | | |
| | Media — 6.4% | | | |
| 268,409 | | Comcast Corp., Class A | | | 5,268,869 |
| 303,751 | | DIRECTV Group, Inc. (The)(b)(c) | | | 7,949,164 |
| 504,670 | | News Corp., Class A | | | 6,050,993 |
| 643,564 | | Time Warner, Inc. | | | 8,437,124 |
| | | | | |
| | | | | 27,706,150 |
| | | | | |
| | Multi-Utilities & Unregulated Power — 1.6% | | | |
| 179,440 | | PG&E Corp.(c) | | | 6,720,028 |
| | | | | |
| | Oil, Gas & Consumable Fuels — 7.9% | | | |
| 239,792 | | ExxonMobil Corp. | | | 18,622,247 |
| 157,559 | | Total SA, Sponsored ADR | | | 9,560,680 |
| 121,956 | | XTO Energy, Inc. | | | 5,673,393 |
| | | | | |
| | | | | 33,856,320 |
| | | | | |
| | Paper & Forest Products — 1.4% | | | |
| 98,466 | | Weyerhaeuser Co. | | | 5,965,070 |
| | | | | |
| | Personal Products — 1.2% | | | |
| 105,994 | | Estee Lauder Cos., Inc. (The), Class A(c) | | | 5,290,161 |
| | | | | |
| | Pharmaceuticals — 9.8% | | | |
| 343,859 | | Bristol-Myers Squibb Co. | | | 7,169,460 |
| 100,257 | | Johnson & Johnson | | | 6,945,805 |
| 125,141 | | Novartis AG, ADR | | | 6,612,450 |
| 343,300 | | Pfizer, Inc. | | | 6,330,452 |
| 500,148 | | Schering-Plough Corp. | | | 9,237,734 |
| 154,020 | | Wyeth | | | 5,689,499 |
| | | | | |
| | | | | 41,985,400 |
| | | | | |
See accompanying notes to financial statements.
29
LOOMIS SAYLES VALUE FUND — PORTFOLIOOF INVESTMENTS (continued)
Investments as of September 30, 2008
| | | | | | | |
| Shares | | Description | | Value (†) | |
| | | | | | | |
| | | Semiconductors & Semiconductor Equipment — 1.1% | | | | |
| | 301,731 | | Applied Materials, Inc. | | $ | 4,565,190 | |
| | | | | | | |
| | | Software — 1.4% | | | | |
| | 233,800 | | Microsoft Corp. | | | 6,240,122 | |
| | | | | | | |
| | | Specialty Retail — 1.0% | | | | |
| | 234,081 | | Gap, Inc. (The) | | | 4,161,960 | |
| | | | | | | |
| | | Total Common Stocks (Identified Cost $458,707,021) | | | 418,646,496 | |
| | | | | | | |
Shares/
Principal
Amount | | | | | |
| | Short-Term Investments — 8.0% | | | | |
| | 19,426,361 | | State Street Navigator Securities Lending Prime Portfolio(d) | | | 19,426,361 | |
| $ | 14,957,000 | | Tri-Party Repurchase Agreement with Fixed Income Clearing Corporation, dated 9/30/2008 at 1.300% to be repurchased at $14,957,540 on 10/01/2008 collateralized by $15,110,000 Federal Home Loan Bank, 3.750% due 8/18/2009 with a value of $15,261,100, including accrued interest (Note 2g of Notes to Financial Statements) | | | 14,957,000 | |
| | | | | | | |
| | | Total Short-Term Investments (Identified Cost $34,383,361) | | | 34,383,361 | |
| | | | | | | |
| | | Total Investments — 105.3%
(Identified Cost $493,090,382)(a) | | | 453,029,857 | |
| | | Other assets less liabilities — (5.3)% | | | (22,706,425 | ) |
| | | | | | | |
| | | Net Assets — 100.0% | | $ | 430,323,432 | |
| | | | | | | |
| | | | | | | |
| | (†) | | See Note 2a of Notes to Financial Statements. | | | | |
| | (a) | | Federal Tax Information: | | | | |
| | | At September 30, 2008, the net unrealized depreciation on investments based on a cost of $493,549,726 for federal income tax purposes was as follows: | | | | |
| | | Aggregate gross unrealized appreciation for all investments in which there is an excess of value over tax cost | | $ | 12,767,999 | |
| | | Aggregate gross unrealized depreciation for all investments in which there is an excess of tax cost over value | | | (53,287,868 | ) |
| | | | | | | |
| | | Net unrealized depreciation | | $ | (40,519,869 | ) |
| | | | | | | |
| | (b) | | Non-income producing security. | | | | |
| | (c) | | All or a portion of this security was on loan to brokers at September 30, 2008. | |
| | (d) | | Represents investment of securities lending collateral. | | | | |
| | | | | | | |
| | ADR | | An American Depositary Receipt is a certificate issued by a custodian bank representing the right to receive securities of the foreign issuer described. The values of ADRs are significantly influenced by trading on exchanges not located in the United States. | |
Net Asset Summary at September 30, 2008 (Unaudited)
| | | |
| Pharmaceuticals | | 9.8 | % |
| Diversified Financial Services | | 8.3 | |
| Oil, Gas & Consumable Fuels | | 7.9 | |
| Insurance | | 7.4 | |
| Media | | 6.4 | |
| Aerospace & Defense | | 4.1 | |
| Diversified Telecommunication Services | | 4.0 | |
| Commercial Banks | | 3.7 | |
| Computers & Peripherals | | 3.7 | |
| Industrial Conglomerates | | 3.6 | |
| Capital Markets | | 3.0 | |
| Food Products | | 2.9 | |
| Beverages | | 2.9 | |
| Chemicals | | 2.8 | |
| Containers & Packaging | | 2.7 | |
| Energy Equipment & Services | | 2.5 | |
| Other Investments, less than 2% each | | 21.6 | |
| Short-Term Investments | | 8.0 | |
| | | |
| Total Investments | | 105.3 | |
| Other assets less liabilities | | (5.3 | ) |
| | | |
| Net Assets | | 100.0 | % |
| | | |
See accompanying notes to financial statements.
30
STATEMENTSOF ASSETSAND LIABILITIES
September 30, 2008
| | | | | | | | | | | | | | | | |
| | | Global Markets Fund | | | Growth Fund | | | Research Fund | | | Value Fund | |
| | | | | | | | | | | | | | | | |
ASSETS | | | | | | | | | | | | | | | | |
Investments at cost | | $ | 376,947,304 | | | $ | 296,840,478 | | | $ | 28,725,585 | | | $ | 493,090,382 | |
Net unrealized depreciation | | | (50,664,970 | ) | | | (17,406,694 | ) | | | (1,578,488 | ) | | | (40,060,525 | ) |
| | | | | | | | | | | | | | | | |
Investments at value (a) | | | 326,282,334 | | | | 279,433,784 | | | | 27,147,097 | | | | 453,029,857 | |
Cash | | | 2,127,874 | | | | 970 | | | | 2,484 | | | | 865 | |
Foreign currency at value (identified cost $584,695) | | | 561,421 | | | | — | | | | — | | | | — | |
Receivable for Fund shares sold | | | 792,460 | | | | 281,188 | | | | 12,500 | | | | 462,161 | |
Receivable for securities sold | | | 2,460,420 | | | | 9,704,813 | | | | 743,308 | | | | 238,533 | |
Dividends and interest receivable | | | 2,420,284 | | | | 51,021 | | | | 17,245 | | | | 479,916 | |
Unrealized appreciation on forward foreign currency contracts (Note 2) | | | 47,496 | | | | — | | | | — | | | | — | |
Receivable from investment adviser (Note 4) | | | 3,761 | | | | — | | | | 8,350 | | | | — | |
Tax reclaims receivable | | | 3,174 | | | | — | | | | — | | | | 21,777 | |
Foreign taxes receivable (Note 2) | | | 3,389 | | | | — | | | | — | | | | — | |
Securities lending income receivable | | | 17,395 | | | | 7,890 | | | | 1,955 | | | | 7,999 | |
Other assets | | | 1,050 | | | | — | | | | — | | | | — | |
| | | | | | | | | | | | | | | | |
TOTAL ASSETS | | | 334,721,058 | | | | 289,479,666 | | | | 27,932,939 | | | | 454,241,108 | |
| | | | | | | | | | | | | | | | |
LIABILITIES | | | | | | | | | | | | | | | | |
Collateral on securities loaned, at value (Note 2) | | | 16,569,651 | | | | 15,008,790 | | | | 1,479,633 | | | | 19,426,361 | |
Payable for securities purchased | | | 4,022,564 | | | | 1,045,673 | | | | 791,620 | | | | 3,368,473 | |
Payable for Fund shares redeemed | | | 1,534,613 | | | | 3,483,414 | | | | 113,992 | | | | 563,840 | |
Unrealized depreciation on forward foreign currency contracts (Note 2) | | | 61,200 | | | | — | | | | — | | | | — | |
Management fees payable (Note 4) | | | 209,781 | | | | 122,547 | | | | 10,852 | | | | 170,979 | |
Administrative fees payable (Note 4) | | | 13,068 | | | | 11,450 | | | | 1,021 | | | | 16,121 | |
Deferred Trustees’ fees (Note 4) | | | 43,598 | | | | 81,652 | | | | 39,189 | | | | 242,405 | |
Service and distribution fees payable (Note 4) | | | 3,757 | | | | 1,995 | | | | 37 | | | | 1,105 | |
Other accounts payable and accrued expenses | | | 115,558 | | | | 198,804 | | | | 46,862 | | | | 128,392 | |
| | | | | | | | | | | | | | | | |
TOTAL LIABILITIES | | | 22,573,790 | | | | 19,954,325 | | | | 2,483,206 | | | | 23,917,676 | |
| | | | | | | | | | | | | | | | |
NET ASSETS | | $ | 312,147,268 | | | $ | 269,525,341 | | | $ | 25,449,733 | | | $ | 430,323,432 | |
| | | | | | | | | | | | | | | | |
NET ASSETS CONSIST OF : | | | | | | | | | | | | | | | | |
Paid-in capital | | $ | 391,974,180 | | | $ | 335,070,666 | | | $ | 28,245,949 | | | $ | 479,509,454 | |
Accumulated net investment income (loss) | | | 2,572,401 | | | | (81,654 | ) | | | 34,370 | | | | 3,386,746 | |
Accumulated net realized loss on investments and foreign currency transactions | | | (31,665,637 | ) | | | (48,056,977 | ) | | | (1,252,098 | ) | | | (12,512,243 | ) |
Net unrealized depreciation on investments and foreign currency translations | | | (50,733,676 | ) | | | (17,406,694 | ) | | | (1,578,488 | ) | | | (40,060,525 | ) |
| | | | | | | | | | | | | | | | |
NET ASSETS | | $ | 312,147,268 | | | $ | 269,525,341 | | | $ | 25,449,733 | | | $ | 430,323,432 | |
| | | | | | | | | | | | | | | | |
COMPUTATION OF NET ASSET VALUE AND OFFERING PRICE: | | | | | | | | | | | | | | | | |
Class A shares: | | | | | | | | | | | | | | | | |
Net assets | | $ | 67,647,094 | | | $ | 156,840,560 | | | $ | 735,658 | | | $ | 112,274,073 | |
| | | | | | | | | | | | | | | | |
Shares of beneficial interest | | | 5,805,184 | | | | 31,401,704 | | | | 105,434 | | | | 6,260,904 | |
| | | | | | | | | | | | | | | | |
Net asset value and redemption price per share | | $ | 11.65 | | | $ | 4.99 | | | $ | 6.98 | | | $ | 17.93 | |
| | | | | | | | | | | | | | | | |
Offering price per share (100/94.25 of net asset value) (Note 1) | | $ | 12.36 | | | $ | 5.29 | | | $ | 7.41 | | | $ | 19.02 | |
| | | | | | | | | | | | | | | | |
Class B shares: (redemption price per share is equal to net asset value less any applicable contingent deferred sales charge) (Note 1) | | | | | | | | | | | | | | | | |
Net assets | | $ | — | | | $ | 9,553,157 | | | $ | 226,903 | | | $ | 8,385,115 | |
| | | | | | | | | | | | | | | | |
Shares of beneficial interest | | | — | | | | 1,987,614 | | | | 33,382 | | | | 471,032 | |
| | | | | | | | | | | | | | | | |
Net asset value and offering price per share | | $ | — | | | $ | 4.81 | | | $ | 6.80 | | | $ | 17.80 | |
| | | | | | | | | | | | | | | | |
Class C shares: (redemption price per share is equal to net asset value less any applicable contingent deferred sales charge) (Note 1) | | | | | | | | | | | | | | | | |
Net assets | | $ | 124,178,055 | | | $ | 27,743,051 | | | $ | 949,089 | | | $ | 6,482,556 | |
| | | | | | | | | | | | | | | | |
Shares of beneficial interest | | | 10,789,339 | | | | 5,768,309 | | | | 140,343 | | | | 364,339 | |
| | | | | | | | | | | | | | | | |
Net asset value and offering price per share | | $ | 11.51 | | | $ | 4.81 | | | $ | 6.76 | | | $ | 17.79 | |
| | | | | | | | | | | | | | | | |
Class Y shares: | | | | | | | | | | | | | | | | |
Net assets | | $ | 120,322,119 | | | $ | 75,388,573 | | | $ | 23,538,083 | | | $ | 303,181,688 | |
| | | | | | | | | | | | | | | | |
Shares of beneficial interest | | | 10,283,009 | | | | 14,379,347 | | | | 3,346,719 | | | | 16,832,943 | |
| | | | | | | | | | | | | | | | |
Net asset value, offering and redemption price per share | | $ | 11.70 | | | $ | 5.24 | | | $ | 7.03 | | | $ | 18.01 | |
| | | | | | | | | | | | | | | | |
(a) Including securities on loan with market values of: | | $ | 16,148,838 | | | $ | 14,850,936 | | | $ | 1,522,253 | | | $ | 20,222,583 | |
| | | | | | | | | | | | | | | | |
See accompanying notes to financial statements.
31
STATEMENTSOF OPERATIONS
For the Year Ended September 30, 2008
| | | | | | | | | | | | | | | | |
| | | Global Markets Fund | | | Growth Fund | | | Research Fund | | | Value Fund | |
| | | | | | | | | | | | | | | | |
INVESTMENT INCOME | | | | | | | | | | | | | | | | |
Dividends | | $ | 2,922,897 | | | $ | 2,536,561 | | | $ | 423,054 | | | $ | 7,319,196 | |
Interest | | | 6,981,450 | | | | 109,474 | | | | 5,790 | | | | 173,433 | |
Securities lending income (Note 2) | | | 308,926 | | | | 281,364 | | | | 34,016 | | | | 143,263 | |
Less net foreign taxes withheld | | | (86,732 | ) | | | — | | | | (47 | ) | | | (67,440 | ) |
| | | | | | | | | | | | | | | | |
| | | 10,126,541 | | | | 2,927,399 | | | | 462,813 | | | | 7,568,452 | |
| | | | | | | | | | | | | | | | |
Expenses | | | | | | | | | | | | | | | | |
Management fees (Note 4) | | | 2,504,197 | | | | 1,890,998 | | | | 141,803 | | | | 1,676,827 | |
Service fees - Class A (Note 4) | | | 170,445 | | | | 523,839 | | | | 2,541 | | | | 270,245 | |
Service and distribution fees - Class B (Note 4) | | | — | | | | 195,501 | | | | 3,138 | | | | 105,766 | |
Service and distribution fees - Class C (Note 4) | | | 1,317,337 | | | | 372,703 | | | | 8,267 | | | | 51,951 | |
Trustees’ fees and expenses (Note 4) | | | 14,254 | | | | 13,343 | | | | 9,832 | | | | — | |
Administrative fees (Note 4) | | | 169,781 | | | | 193,081 | | | | 14,464 | | | | 170,186 | |
Custodian fees and expenses | | | 200,815 | | | | 28,951 | | | | 26,153 | | | | 25,482 | |
Transfer agent fees and expenses - Class A (Note 4) | | | 63,786 | | | | 481,784 | | | | 2,188 | | | | 191,261 | |
Transfer agent fees and expenses - Class B (Note 4) | | | — | | | | 44,232 | | | | 676 | | | | 19,102 | |
Transfer agent fees and expenses - Class C (Note 4) | | | 124,273 | | | | 85,755 | | | | 1,741 | | | | 9,045 | |
Transfer agent fees and expenses - Class Y (Note 4) | | | 71,061 | | | | 48,317 | | | | 15,613 | | | | 64,517 | |
Audit and tax services fees | | | 53,290 | | | | 40,275 | | | | 40,930 | | | | 33,804 | |
Legal fees | | | 8,581 | | | | 9,333 | | | | 714 | | | | 8,503 | |
Shareholder reporting expenses | | | 41,903 | | | | 81,407 | | | | 5,857 | | | | 51,765 | |
Registration fees | | | 88,775 | | | | 71,090 | | | | 61,043 | | | | 115,602 | |
Expense recapture - Class B (Note 4) | | | — | | | | — | | | | — | | | | 8 | |
Expense recapture - Class C (Note 4) | | | — | | | | — | | | | — | | | | 137 | |
Expense recapture - Class Y (Note 4) | | | 9,653 | | | | — | | | | — | | | | — | |
Miscellaneous expenses | | | 19,729 | | | | 21,795 | | | | 7,894 | | | | 12,326 | |
| | | | | | | | | | | | | | | | |
Total expenses | | | 4,857,880 | | | | 4,102,404 | | | | 342,854 | | | | 2,806,527 | |
Less fee reduction and/or expense reimbursement (Note 4) | | | (49,265 | ) | | | (7,845 | ) | | | (84,606 | ) | | | (6,545 | ) |
| | | | | | | | | | | | | | | | |
Net expenses | | | 4,808,615 | | | | 4,094,559 | | | | 258,248 | | | | 2,799,982 | |
| | | | | | | | | | | | | | | | |
Net investment income (loss) | | | 5,317,926 | | | | (1,167,160 | ) | | | 204,565 | | | | 4,768,470 | |
| | | | | | | | | | | | | | | | |
NET REALIZED AND UNREALIZED LOSS ON INVESTMENTS
AND FOREIGN CURRENCY TRANSACTIONS | | | | | | | | | | | | | | | | |
Net realized loss on: | | | | | | | | | | | | | | | | |
Investments (including foreign capital gains taxes paid of $18,501 for Global Markets Fund) | | | (25,421,837 | ) | | | (32,148,656 | ) | | | (1,114,622 | ) | | | (11,245,452 | ) |
Foreign currency transactions | | | (338,150 | ) | | | — | | | | — | | | | — | |
Net change in unrealized appreciation (depreciation) on: | | | | | | | | | | | | | | | | |
Investments (including change in foreign capital gains tax accrual of $74,768 for Global Markets Fund) | | | (77,726,127 | ) | | | (81,622,240 | ) | | | (5,382,213 | ) | | | (72,620,410 | ) |
Foreign currency translations | | | (8,556 | ) | | | — | | | | — | | | | — | |
| | | | | | | | | | | | | | | | |
Net realized and unrealized loss on investments and foreign currency transactions | | | (103,494,670 | ) | | | (113,770,896 | ) | | | (6,496,835 | ) | | | (83,865,862 | ) |
| | | | | | | | | | | | | | | | |
NET DECREASE IN NET ASSETS RESULTING FROM OPERATIONS | | $ | (98,176,744 | ) | | $ | (114,938,056 | ) | | $ | (6,292,270 | ) | | $ | (79,097,392 | ) |
| | | | | | | | | | | | | | | | |
See accompanying notes to financial statements.
32
STATEMENTSOF CHANGESIN NET ASSETS
| | | | | | | | | | | | | | | | |
| | | Global Markets Fund | | | Growth Fund | |
| | | Year Ended
September 30,
2008 | | | Year Ended
September 30,
2007 | | | Year Ended
September 30,
2008 | | | Year Ended
September 30,
2007 | |
| | | | | | | | | | | | | | | | |
FROM OPERATIONS: | | | | | | | | | | | | | | | | |
Net investment income (loss) | | $ | 5,317,926 | | | $ | 1,533,353 | | | $ | (1,167,160 | ) | | $ | (1,945,087 | ) |
Net realized gain (loss) on investments and foreign currency transactions | | | (25,759,987 | ) | | | 5,807,960 | | | | (32,148,656 | ) | | | 26,173,209 | |
Net change in net unrealized appreciation (depreciation) on investments and foreign currency translations | | | (77,734,683 | ) | | | 22,222,672 | | | | (81,622,240 | ) | | | 50,265,940 | |
| | | | | | | | | | | | | | | | |
Net increase (decrease) in net assets resulting from operations | | | (98,176,744 | ) | | | 29,563,985 | | | | (114,938,056 | ) | | | 74,494,062 | |
| | | | | | | | | | | | | | | | |
FROM DISTRIBUTIONS TO SHAREHOLDERS: | | | | | | | | | | | | | | | | |
Net investment income | | | | | | | | | | | | | | | | |
Class A | | | (1,576,341 | ) | | | (238,081 | ) | | | — | | | | — | |
Class B | | | — | | | | — | | | | — | | | | — | |
Class C | | | (2,867,382 | ) | | | (346,135 | ) | | | — | | | | — | |
Class Y | | | (3,658,690 | ) | | | (1,143,953 | ) | | | — | | | | — | |
Net realized capital gains | | | | | | | | | | | | | | | | |
Class A | | | (1,305,191 | ) | | | — | | | | — | | | | — | |
Class B | | | — | | | | — | | | | — | | | | — | |
Class C | | | (2,671,987 | ) | | | — | | | | — | | | | — | |
Class Y | | | (2,927,617 | ) | | | — | | | | — | | | | — | |
| | | | | | | | | | | | | | | | |
Total distributions | | | (15,007,208 | ) | | | (1,728,169 | ) | | | — | | | | — | |
| | | | | | | | | | | | | | | | |
NET INCREASE (DECREASE) IN NET ASSETS FROM CAPITAL SHARE TRANSACTIONS (NOTE 8) | | | 255,345,464 | | | | 52,772,239 | | | | (36,244,496 | ) | | | (76,568,270 | ) |
| | | | | | | | | | | | | | | | |
Redemption Fees | | | | | | | | | | | | | | | | |
Class A | | | 12,818 | | | | 743 | | | | — | | | | — | |
Class C | | | 21,877 | | | | 1,591 | | | | — | | | | — | |
Class Y | | | 21,783 | | | | 3,115 | | | | — | | | | — | |
| | | | | | | | | | | | | | | | |
Net increase (decrease) in net assets | | | 142,217,990 | | | | 80,613,504 | | | | (151,182,552 | ) | | | (2,074,208 | ) |
| | | | | | | | | | | | | | | | |
NET ASSETS | | | | | | | | | | | | | | | | |
Beginning of year | | | 169,929,278 | | | | 89,315,774 | | | | 420,707,893 | | | | 422,782,101 | |
| | | | | | | | | | | | | | | | |
End of year | | $ | 312,147,268 | | | $ | 169,929,278 | | | $ | 269,525,341 | | | $ | 420,707,893 | |
| | | | | | | | | | | | | | | | |
ACCUMULATED NET INVESTMENT INCOME (LOSS) | | $ | 2,572,401 | | | $ | 1,691,875 | | | $ | (81,654 | ) | | $ | (82,036 | ) |
| | | | | | | | | | | | | | | | |
See accompanying notes to financial statements.
33
| | | | | | | | | | | | | | |
| Research Fund | | | Value Fund | |
Year Ended
September 30,
2008 | | | Year Ended
September 30,
2007 | | | Year Ended
September 30,
2008 | | | Year Ended
September 30,
2007 | |
| | | | | | | | | | | | | | |
| | | | | | | | | | | | | | |
| $ | 204,565 | | | $ | 153,496 | | | $ | 4,768,470 | | | $ | 1,698,014 | |
| | (1,114,622 | ) | | | 3,421,566 | | | | (11,245,452 | ) | | | 9,941,092 | |
|
(5,382,213) |
| | | 1,282,288 | | | | (72,620,410 | ) | | | 8,063,036 | |
| | | | | | | | | | | | | | | |
| | (6,292,270 | ) | | | 4,857,350 | | | | (79,097,392 | ) | | | 19,702,142 | |
| | | | | | | | | | | | | | | |
| | | | | | | | | | | | | | |
| | | | | | | | | | | | | | |
| | (6,624 | ) | | | (9,859 | ) | | | (444,319 | ) | | | (33,688 | ) |
| | — | | | | (509 | ) | | | (25,511 | ) | | | — | |
| | — | | | | (2,662 | ) | | | (19,019 | ) | | | — | |
| | (277,956 | ) | | | (260,548 | ) | | | (1,991,889 | ) | | | (673,111 | ) |
| | | | | | | | | | | | | | |
| | (123,072 | ) | | | (161,282 | ) | | | (1,119,214 | ) | | | (226,188 | ) |
| | (37,858 | ) | | | (48,393 | ) | | | (44,036 | ) | | | — | |
| | (97,901 | ) | | | (147,505 | ) | | | (96,784 | ) | | | — | |
| | (2,801,426 | ) | | | (2,907,435 | ) | | | (8,863,000 | ) | | | (4,162,095 | ) |
| | | | | | | | | | | | | | | |
| | (3,344,837 | ) | | | (3,538,193 | ) | | | (12,603,772 | ) | | | (5,095,082 | ) |
| | | | | | | | | | | | | | | |
|
4,968,748 |
| | | 2,841,472 | | | | 321,024,510 | | | | 114,779,649 | |
| | | | | | | | | | | | | | | |
| | | | | | | | | | | | | | |
| | — | | | | — | | | | — | | | | — | |
| | — | | | | — | | | | — | | | | — | |
| | — | | | | — | | | | — | | | | — | |
| | | | | | | | | | | | | | | |
| | (4,668,359 | ) | | | 4,160,629 | | | | 229,323,346 | | | | 129,386,709 | |
| | | | | | | | | | | | | | | |
| | | | | | | | | | | | | | |
| | 30,118,092 | | | | 25,957,463 | | | | 201,000,086 | | | | 71,613,377 | |
| | | | | | | | | | | | | | | |
| $ | 25,449,733 | | | $ | 30,118,092 | | | $ | 430,323,432 | | | $ | 201,000,086 | |
| | | | | | | | | | | | | | | |
| $ | 34,370 | | | $ | 75,445 | | | $ | 3,386,746 | | | $ | 1,350,462 | |
| | | | | | | | | | | | | | | |
34
FINANCIAL HIGHLIGHTS
For a share outstanding throughout each period.
| | | | | | | | | | | | | | | | | | | | | | | | | | | | | |
| | | | | Income (Loss) from Investment Operations: | | | Less Distributions: | | | |
| | | | | | | | |
| | | Net asset
value,
beginning
of
the period | | Net
investment
income (c) | | Net realized
and unrealized
gain (loss) | | | Total from
investment
operations | | | Dividends
from
net investment
income | | | Distributions
from net
realized
capital gains | | | Total
distributions | | | Redemption
fees (d)(h) |
| | | | | | | | | | | | | | | | | | | | | | | | | | | | | |
GLOBAL MARKETS FUND | | | | | | | | | | | | | | | | | | | | | | | | | | | | | |
Class A | | | | | | | | | | | | | | | | | | | | | | | | | | | | | |
9/30/2008 | | $ | 15.83 | | $ | 0.25 | | $ | (3.46 | ) | | $ | (3.21 | ) | | $ | (0.53 | ) | | $ | (0.44 | ) | | $ | (0.97 | ) | | $ | 0.00 |
9/30/2007 | | | 12.49 | | | 0.20 | | | 3.39 | | | | 3.59 | | | | (0.25 | ) | | | — | | | | (0.25 | ) | | | 0.00 |
9/30/2006* | | | 12.71 | | | 0.12 | | | (0.34 | ) | | | (0.22 | ) | | | — | | | | — | | | | — | | | | — |
Class C | | | | | | | | | | | | | | | | | | | | | | | | | | | | | |
9/30/2008 | | | 15.70 | | | 0.15 | | | (3.43 | ) | | | (3.28 | ) | | | (0.47 | ) | | | (0.44 | ) | | | (0.91 | ) | | | 0.00 |
9/30/2007 | | | 12.43 | | | 0.10 | | | 3.36 | | | | 3.46 | | | | (0.19 | ) | | | — | | | | (0.19 | ) | | | 0.00 |
9/30/2006* | | | 12.71 | | | 0.06 | | | (0.34 | ) | | | (0.28 | ) | | | — | | | | — | | | | — | | | | — |
Class Y | | | | | | | | | | | | | | | | | | | | | | | | | | | | | |
9/30/2008 | | | 15.87 | | | 0.30 | | | (3.48 | ) | | | (3.18 | ) | | | (0.55 | ) | | | (0.44 | ) | | | (0.99 | ) | | | 0.00 |
9/30/2007 | | | 12.51 | | | 0.24 | | | 3.39 | | | | 3.63 | | | | (0.27 | ) | | | — | | | | (0.27 | ) | | | 0.00 |
9/30/2006** | | | 11.84 | | | 0.19 | | | 0.64 | | | | 0.83 | | | | (0.16 | ) | | | — | | | | (0.16 | ) | | | 0.00 |
9/30/2005 | | | 10.19 | | | 0.19 | | | 1.73 | | | | 1.92 | | | | (0.27 | ) | | | — | | | | (0.27 | ) | | | — |
9/30/2004 | | | 9.32 | | | 0.25 | | | 0.96 | | | | 1.21 | | | | (0.34 | ) | | | — | | | | (0.34 | ) | | | — |
| * | From commencement of Class operations on February 1, 2006 through September 30, 2006. |
| ** | Prior to the close of business on February 1, 2006, the Fund offered Institutional Class shares, which were redesignated as Class Y shares on that date. |
| (a) | Had certain expenses not been reduced during the period, if applicable, total returns would have been lower. |
| (b) | The investment adviser and/or administrator agreed to reimburse a portion of the Fund’s expenses and/or reduce its fees during the period. Without this reimbursement/fee reduction, if applicable, expenses would have been higher. |
| (c) | Per share net investment income has been calculated using the average shares outstanding during the period. |
See accompanying notes to financial statements.
35
| | | | | | | | | | | | | | | | | |
| | | | | | | | Ratios to Average Net Assets: | | |
| | | | | | |
Net asset
value,
end of
the period | | Total
return
(%) (a)(e) | | | Net assets,
end of
the period
(000’s) | | Net expenses
(%) (b)(f) | | | Gross
expenses
(%) (f) | | | Net investment
income
(%) (f) | | Portfolio
turnover
rate (%) |
| | | | | | | | | | | | | | | | | |
| | | | | | | | | | | | | | | | | |
| | | | | | | | | | | | | | | | | |
| $ | 11.65 | | (21.9 | ) | | $ | 67,647 | | 1.25 | | | 1.27 | | | 1.74 | | 133 |
| | 15.83 | | 29.1 | | | | 28,927 | | 1.25 | | | 1.37 | | | 1.44 | | 78 |
| | 12.49 | | (1.7 | ) | | | 10,438 | | 1.25 | | | 1.56 | | | 1.52 | | 103 |
| | | | | | | | | | | | | | | | | |
| | 11.51 | | (22.4 | ) | | | 124,178 | | 2.00 | | | 2.02 | | | 1.04 | | 133 |
| | 15.70 | | 28.0 | | | | 60,179 | | 2.00 | | | 2.11 | | | 0.69 | | 78 |
| | 12.43 | | (2.1 | ) | | | 20,228 | | 2.00 | | | 2.32 | | | 0.78 | | 103 |
| | | | | | | | | | | | | | | | | |
| | 11.70 | | (21.7 | ) | | | 120,322 | | 0.99 | (g) | | 0.99 | (g) | | 2.06 | | 133 |
| | 15.87 | | 29.4 | | | | 80,824 | | 1.00 | | | 1.02 | | | 1.70 | | 78 |
| | 12.51 | | 7.1 | | | | 58,650 | | 1.00 | | | 1.19 | | | 1.58 | | 103 |
| | 11.84 | | 19.1 | | | | 47,712 | | 1.00 | | | 1.46 | | | 1.72 | | 78 |
| | 10.19 | | 13.2 | | | | 17,274 | | 1.00 | | | 1.87 | | | 2.55 | | 69 |
| (d) | Amount rounds to less than $0.01 per share, if applicable. |
| (e) | A sales charge for Class A shares and a contingent deferred sales charge for Class C shares are not reflected in total return calculations. Periods less than one year, if applicable, are not annualized. |
| (f) | Computed on an annualized basis for periods less than one year, if applicable. |
| (g) | Includes expense recapture of less than 0.01%. |
| (h) | Effective June 2, 2008, redemption fees were eliminated. |
36
FINANCIAL HIGHLIGHTS (continued)
For a share outstanding throughout each period.
| | | | | | | | | | | | | | | | | | | | | | | | |
| | | | | Income (Loss) from Investment Operations: | | | Less Distributions: |
| | | | | | | |
| | | Net asset
value,
beginning
of
the period | | Net
investment
income
(loss) (c)(d) | | | Net realized
and unrealized
gain (loss) | | | Total from
investment
operations | | | Dividends
from
net investment
income | | Distributions
from net
realized
capital gains | | Total
distributions |
| | | | | | | | | | | | | | | | | | | | | | | | |
GROWTH FUND | | | | | | | | | | | | | | | | | | | | | | | | |
Class A | | | | | | | | | | | | | | | | | | | | | | | | |
9/30/2008 | | $ | 7.01 | | $ | (0.02 | ) | | $ | (2.00 | ) | | $ | (2.02 | ) | | $ | — | | $ | — | | $ | — |
9/30/2007 | | | 5.84 | | | (0.03 | ) | | | 1.20 | | | | 1.17 | | | | — | | | — | | | — |
9/30/2006 | | | 6.03 | | | (0.00 | ) | | | (0.19 | ) | | | (0.19 | ) | | | — | | | — | | | — |
9/30/2005 | | | 4.98 | | | (0.02 | ) | | | 1.07 | | | | 1.05 | | | | — | | | — | | | — |
9/30/2004 | | | 4.41 | | | (0.03 | ) | | | 0.60 | | | | 0.57 | | | | — | | | — | | | — |
Class B | | | | | | | | | | | | | | | | | | | | | | | | |
9/30/2008 | | | 6.79 | | | (0.07 | ) | | | (1.91 | ) | | | (1.98 | ) | | | — | | | — | | | — |
9/30/2007 | | | 5.70 | | | (0.07 | ) | | | 1.16 | | | | 1.09 | | | | — | | | — | | | — |
9/30/2006 | | | 5.94 | | | (0.05 | ) | | | (0.19 | ) | | | (0.24 | ) | | | — | | | — | | | — |
9/30/2005 | | | 4.94 | | | (0.06 | ) | | | 1.06 | | | | 1.00 | | | | — | | | — | | | — |
9/30/2004 | | | 4.41 | | | (0.07 | ) | | | 0.60 | | | | 0.53 | | | | — | | | — | | | — |
Class C | | | | | | | | | | | | | | | | | | | | | | | | |
9/30/2008 | | | 6.80 | | | (0.07 | ) | | | (1.92 | ) | | | (1.99 | ) | | | — | | | — | | | — |
9/30/2007 | | | 5.71 | | | (0.08 | ) | | | 1.17 | | | | 1.09 | | | | — | | | — | | | — |
9/30/2006 | | | 5.94 | | | (0.04 | ) | | | (0.19 | ) | | | (0.23 | ) | | | — | | | — | | | — |
9/30/2005 | | | 4.94 | | | (0.06 | ) | | | 1.06 | | | | 1.00 | | | | — | | | — | | | — |
9/30/2004 | | | 4.41 | | | (0.06 | ) | | | 0.59 | | | | 0.53 | | | | — | | | — | | | — |
Class Y | | | | | | | | | | | | | | | | | | | | | | | | |
9/30/2008 | | | 7.32 | | | 0.01 | | | | (2.09 | ) | | | (2.08 | ) | | | — | | | — | | | — |
9/30/2007 | | | 6.08 | | | (0.00 | ) | | | 1.24 | | | | 1.24 | | | | — | | | — | | | — |
9/30/2006 | | | 6.26 | | | 0.02 | | | | (0.20 | ) | | | (0.18 | ) | | | — | | | — | | | — |
9/30/2005 | | | 5.15 | | | (0.00 | ) | | | 1.11 | | | | 1.11 | | | | — | | | — | | | — |
9/30/2004 | | | 4.55 | | | (0.02 | ) | | | 0.62 | | | | 0.60 | | | | — | | | — | | | — |
| (a) | Had certain expenses not been reduced during the period, if applicable, total returns would have been lower. |
| (b) | The investment adviser and/or administrator agreed to reimburse a portion of the Fund’s expenses and/or reduce its fees during the period. Without this reimbursement/fee reduction, if applicable, expenses would have been higher. |
| (c) | Per share net investment income (loss) has been calculated using the average shares outstanding during the period. |
| (d) | Amount rounds to less than $0.01 per share, if applicable. |
See accompanying notes to financial statements.
37
| | | | | | | | | | | | | | | | | | |
| | | | | | | | Ratios to Average Net Assets: | | | |
| | | | | | |
Net asset
value,
end of
the period | | Total
return
(%) (a)(e) | | | Net assets,
end of
the period
(000’s) | | Net
expenses
(%) (b)(h) | | | Gross
expenses
(%) (h) | | | Net investment
income (loss)
(%) (h) | | | Portfolio
turnover
rate (%) |
| | | | | | | | | | | | | | | | | | |
| | | | | | | | | | | | | | | | | | |
| | | | | | | | | | | | | | | | | | |
| $ | 4.99 | | (28.7 | ) | | $ | 156,841 | | 1.10 | | | 1.10 | | | (0.33 | ) | | 179 |
| | 7.01 | | 20.0 | | | | 228,629 | | 1.14 | (g) | | 1.14 | (g) | | (0.49 | ) | | 134 |
| | 5.84 | | (3.2 | ) | | | 225,729 | | 1.10 | | | 1.17 | | | (0.03 | ) | | 174 |
| | 6.03 | | 21.1 | | | | 51,248 | | 1.10 | | | 1.60 | | | (0.38 | ) | | 164 |
| | 4.98 | | 12.9 | | | | 14,072 | | 1.10 | | | 1.70 | | | (0.58 | ) | | 171 |
| | | | | | | | | | | | | | | | | | |
| | 4.81 | | (29.2 | ) | | | 9,553 | | 1.85 | | | 1.85 | | | (1.05 | ) | | 179 |
| | 6.79 | | 19.1 | | | | 28,258 | | 1.85 | (g) | | 1.85 | (g) | | (1.20 | ) | | 134 |
| | 5.70 | | (4.0 | ) | | | 32,160 | | 1.95 | | | 2.11 | | | (0.85 | ) | | 174 |
| | 5.94 | | 20.2 | | | | 38,538 | | 1.85 | | | 2.33 | | | (1.14 | ) | | 164 |
| | 4.94 | | 12.0 | | | | 12,532 | | 1.85 | | | 2.45 | | | (1.33 | ) | | 171 |
| | | | | | | | | | | | | | | | | | |
| | 4.81 | | (29.3 | ) | | | 27,743 | | 1.85 | | | 1.85 | | | (1.08 | ) | | 179 |
| | 6.80 | | 19.1 | | | | 39,157 | | 1.88 | | | 1.88 | | | (1.23 | ) | | 134 |
| | 5.71 | | (3.9 | ) | | | 43,415 | | 1.85 | | | 1.95 | | | (0.76 | ) | | 174 |
| | 5.94 | | 20.2 | | | | 25,734 | | 1.85 | | | 2.35 | | | (1.10 | ) | | 164 |
| | 4.94 | | 12.0 | | | | 6,826 | | 1.85 | | | 2.45 | | | (1.30 | ) | | 171 |
| | | | | | | | | | | | | | | | | | |
| | 5.24 | | (28.4 | ) | | | 75,389 | | 0.66 | | | 0.66 | | | 0.11 | | | 179 |
| | 7.32 | | 20.4 | | | | 124,663 | | 0.67 | | | 0.67 | | | (0.02 | ) | | 134 |
| | 6.08 | | (2.9 | ) | | | 121,478 | | 0.80 | (f) | | 0.80 | (f) | | 0.31 | | | 174 |
| | 6.26 | | 21.6 | | | | 95,534 | | 0.85 | | | 0.97 | | | (0.05 | ) | | 164 |
| | 5.15 | | 13.2 | | | | 40,165 | | 0.85 | | | 1.04 | | | (0.32 | ) | | 171 |
| (e) | A sales charge for Class A shares and a contingent deferred sales charge for Class B and Class C shares are not reflected in total return calculations. Periods less than one year, if applicable, are not annualized. |
| (f) | Includes expense recapture of 0.07%. |
| (g) | Includes expense recapture of less than 0.01% and 0.08% for Class A and Class B, respectively. |
| (h) | Computed on an annualized basis for periods less than one year, if applicable. |
38
FINANCIAL HIGHLIGHTS (continued)
For a share outstanding throughout each period.
| | | | | | | | | | | | | | | | | | | | | | | | | | | |
| | | | | Income (Loss) from Investment Operations: | | | Less Distributions: | |
| | | | | | | |
| | | Net asset
value,
beginning
of
the period | | Net
investment
income
(loss) (c)(d) | | | Net realized
and unrealized
gain (loss) | | | Total from
investment
operations | | | Dividends
from
net investment
income (d) | | | Distributions
from net
realized
capital gains | | | Total
distributions (d) | |
| | | | | | | | | | | | | | | | | | | | | | | | | | | |
RESEARCH FUND | | | | | | | | | | | | | | | | | | | | | | | | | | | |
Class A | | | | | | | | | | | | | | | | | | | | | | | | | | | |
9/30/2008 | | $ | 9.77 | | $ | 0.03 | | | $ | (1.80 | ) | | $ | (1.77 | ) | | $ | (0.05 | ) | | $ | (0.97 | ) | | $ | (1.02 | ) |
9/30/2007 | | | 9.42 | | | 0.02 | | | | 1.53 | | | | 1.55 | | | | (0.07 | ) | | | (1.13 | ) | | | (1.20 | ) |
9/30/2006 | | | 9.22 | | | 0.05 | | | | 0.64 | | | | 0.69 | | | | (0.03 | ) | | | (0.46 | ) | | | (0.49 | ) |
9/30/2005 | | | 7.79 | | | 0.00 | | | | 1.43 | | | | 1.43 | | | | (0.00 | ) | | | — | | | | (0.00 | ) |
9/30/2004 | | | 6.90 | | | 0.01 | | | | 0.90 | | | | 0.91 | | | | (0.02 | ) | | | — | | | | (0.02 | ) |
Class B | | | | | | | | | | | | | | | | | | | | | | | | | | | |
9/30/2008 | | | 9.56 | | | (0.03 | ) | | | (1.76 | ) | | | (1.79 | ) | | | — | | | | (0.97 | ) | | | (0.97 | ) |
9/30/2007 | | | 9.25 | | | (0.05 | ) | | | 1.50 | | | | 1.45 | | | | (0.01 | ) | | | (1.13 | ) | | | (1.14 | ) |
9/30/2006 | | | 9.10 | | | (0.02 | ) | | | 0.63 | | | | 0.61 | | | | — | | | | (0.46 | ) | | | (0.46 | ) |
9/30/2005 | | | 7.73 | | | (0.06 | ) | | | 1.43 | | | | 1.37 | | | | (0.00 | ) | | | — | | | | (0.00 | ) |
9/30/2004 | | | 6.90 | | | (0.05 | ) | | | 0.90 | | | | 0.85 | | | | (0.02 | ) | | | — | | | | (0.02 | ) |
Class C | | | | | | | | | | | | | | | | | | | | | | | | | | | |
9/30/2008 | | | 9.52 | | | (0.03 | ) | | | (1.76 | ) | | | (1.79 | ) | | | — | | | | (0.97 | ) | | | (0.97 | ) |
9/30/2007 | | | 9.22 | | | (0.05 | ) | | | 1.50 | | | | 1.45 | | | | (0.02 | ) | | | (1.13 | ) | | | (1.15 | ) |
9/30/2006 | | | 9.08 | | | (0.02 | ) | | | 0.63 | | | | 0.61 | | | | (0.01 | ) | | | (0.46 | ) | | | (0.47 | ) |
9/30/2005 | | | 7.73 | | | (0.07 | ) | | | 1.42 | | | | 1.35 | | | | (0.00 | ) | | | — | | | | (0.00 | ) |
9/30/2004 | | | 6.90 | | | (0.05 | ) | | | 0.88 | | | | 0.83 | | | | — | | | | — | | | | — | |
Class Y | | | | | | | | | | | | | | | | | | | | | | | | | | | |
9/30/2008 | | | 9.85 | | | 0.07 | | | | (1.82 | ) | | | (1.75 | ) | | | (0.10 | ) | | | (0.97 | ) | | | (1.07 | ) |
9/30/2007 | | | 9.49 | | | 0.06 | | | | 1.53 | | | | 1.59 | | | | (0.10 | ) | | | (1.13 | ) | | | (1.23 | ) |
9/30/2006 | | | 9.27 | | | 0.09 | | | | 0.64 | | | | 0.73 | | | | (0.05 | ) | | | (0.46 | ) | | | (0.51 | ) |
9/30/2005 | | | 7.82 | | | 0.04 | | | | 1.44 | | | | 1.48 | | | | (0.03 | ) | | | — | | | | (0.03 | ) |
9/30/2004 | | | 6.92 | | | 0.03 | | | | 0.90 | | | | 0.93 | | | | (0.03 | ) | | | — | | | | (0.03 | ) |
| (a) | Had certain expenses not been reduced during the period, if applicable, total returns would have been lower. |
| (b) | The investment adviser and/or administrator agreed to reimburse a portion of the Fund’s expenses and/or reduce its fee during the period. Without this reimbursement/fee reduction, if applicable, expenses would have been higher. |
| (c) | Per share net investment income (loss) has been calculated using the average shares outstanding during the period. |
See accompanying notes to financial statements.
39
| | | | | | | | | | | | | | | | |
| | | | | | | | Ratios to Average Net Assets: | | | |
| | | | | | |
Net asset
value,
end of
the period | | Total
return
(%) (a)(e) | | | Net assets,
end of
the period
(000’s) | | Net
expenses
(%) (b)(f) | | Gross
expenses
(%) (f) | | Net investment
income (loss)
(%) (f) | | | Portfolio
turnover
rate (%) |
| | | | | | | | | | | | | | | | |
| | | | | | | | | | | | | | | | |
| | | | | | | | | | | | | | | | |
| $ | 6.98 | | (20.4 | ) | | $ | 736 | | 1.25 | | 1.55 | | 0.38 | | | 149 |
| | 9.77 | | 18.0 | | | | 1,198 | | 1.25 | | 1.50 | | 0.22 | | | 148 |
| | 9.42 | | 7.7 | | | | 1,331 | | 1.25 | | 1.68 | | 0.56 | | | 143 |
| | 9.22 | | 18.4 | | | | 344 | | 1.25 | | 34.73 | | 0.03 | | | 133 |
| | 7.79 | | 13.2 | | | | 106 | | 1.21 | | 39.85 | | 0.07 | | | 151 |
| | | | | | | | | | | | | | | | |
| | 6.80 | | (21.0 | ) | | | 227 | | 2.00 | | 2.30 | | (0.37 | ) | | 149 |
| | 9.56 | | 17.1 | | | | 356 | | 2.00 | | 2.31 | | (0.51 | ) | | 148 |
| | 9.25 | | 6.9 | | | | 331 | | 2.00 | | 2.33 | | (0.19 | ) | | 143 |
| | 9.10 | | 17.8 | | | | 210 | | 2.00 | | 41.40 | | (0.71 | ) | | 133 |
| | 7.73 | | 12.3 | | | | 57 | | 2.00 | | 40.60 | | (0.71 | ) | | 151 |
| | | | | | | | | | | | | | | | |
| | 6.76 | | (21.1 | ) | | | 949 | | 2.00 | | 2.30 | | (0.39 | ) | | 149 |
| | 9.52 | | 17.2 | | | | 1,164 | | 2.00 | | 2.29 | | (0.54 | ) | | 148 |
| | 9.22 | | 6.9 | | | | 1,198 | | 2.00 | | 2.37 | | (0.18 | ) | | 143 |
| | 9.08 | | 17.5 | | | | 140 | | 2.00 | | 37.60 | | (0.76 | ) | | 133 |
| | 7.73 | | 12.0 | | | | 3 | | 2.00 | | 40.60 | | (0.59 | ) | | 151 |
| | | | | | | | | | | | | | | | |
| | 7.03 | | (20.2 | ) | | | 23,538 | | 0.85 | | 1.15 | | 0.78 | | | 149 |
| | 9.85 | | 18.4 | | | | 27,400 | | 0.85 | | 1.11 | | 0.62 | | | 148 |
| | 9.49 | | 8.1 | | | | 23,096 | | 0.85 | | 1.26 | | 0.98 | | | 143 |
| | 9.27 | | 19.0 | | | | 24,651 | | 0.85 | | 1.31 | | 0.43 | | | 133 |
| | 7.82 | | 13.5 | | | | 21,721 | | 0.85 | | 1.50 | | 0.44 | | | 151 |
| (d) | Amount rounds to less than $0.01 per share, if applicable. |
| (e) | A sales charge for Class A shares and a contingent deferred sales charge for Class B and Class C shares are not reflected in total return calculations. Periods less than one year, if applicable, are not annualized. |
| (f) | Computed on an annualized basis for periods less than one year, if applicable. |
40
FINANCIAL HIGHLIGHTS (continued)
For a share outstanding throughout each period.
| | | | | | | | | | | | | | | | | | | | | | | | | | |
| | | | | Income (Loss) from Investment Operations: | | | Less Distributions: | |
| | | | | | | |
| | | Net asset
value,
beginning
of
the period | | Net
investment
income (c)(d) | | Net realized
and unrealized
gain (loss) | | | Total from
investment
operations | | | Dividends
from
net investment
income | | | Distributions
from net
realized
capital gains | | | Total
distributions | |
| | | | | | | | | | | | | | | | | | | | | | | | | | |
VALUE FUND | | | | | | | | | | | | | | | | | | | | | | | | | | |
Class A**** | | | | | | | | | | | | | | | | | | | | | | | | | | |
9/30/2008 | | $ | 23.46 | | $ | 0.25 | | $ | (4.45 | ) | | $ | (4.20 | ) | | $ | (0.18 | ) | | $ | (1.15 | ) | | $ | (1.33 | ) |
9/30/2007 | | | 21.04 | | | 0.19 | | | 3.27 | | | | 3.46 | | | | (0.13 | ) | | | (0.91 | ) | | | (1.04 | ) |
9/30/2006* | | | 19.69 | | | 0.02 | | | 1.33 | | | | 1.35 | | | | — | | | | — | | | | — | |
Class B | | | | | | | | | | | | | | | | | | | | | | | | | | |
9/30/2008 | | | 23.46 | | | 0.10 | | | (4.45 | ) | | | (4.35 | ) | | | (0.16 | ) | | | (1.15 | ) | | | (1.31 | ) |
9/30/2007** | | | 24.00 | | | 0.00 | | | (0.54 | ) | | | (0.54 | ) | | | — | | | | — | | | | — | |
Class C | | | | | | | | | | | | | | | | | | | | | | | | | | |
9/30/2008 | | | 23.46 | | | 0.09 | | | (4.43 | ) | | | (4.34 | ) | | | (0.18 | ) | | | (1.15 | ) | | | (1.33 | ) |
9/30/2007** | | | 24.00 | | | 0.01 | | | (0.55 | ) | | | (0.54 | ) | | | — | | | | — | | | | — | |
Class Y*** | | | | | | | | | | | | | | | | | | | | | | | | | | |
9/30/2008 | | | 23.54 | | | 0.32 | | | (4.45 | ) | | | (4.13 | ) | | | (0.25 | ) | | | (1.15 | ) | | | (1.40 | ) |
9/30/2007 | | | 21.05 | | | 0.27 | | | 3.27 | | | | 3.54 | | | | (0.14 | ) | | | (0.91 | ) | | | (1.05 | ) |
9/30/2006 | | | 18.72 | | | 0.22 | | | 3.17 | | | | 3.39 | | | | (0.27 | ) | | | (0.79 | ) | | | (1.06 | ) |
9/30/2005 | | | 15.95 | | | 0.20 | | | 2.83 | | | | 3.03 | | | | (0.26 | ) | | | — | | | | (0.26 | ) |
9/30/2004 | | | 13.52 | | | 0.21 | | | 2.39 | | | | 2.60 | | | | (0.17 | ) | | | — | | | | (0.17 | ) |
| * | From commencement of Class operations on June 30, 2006 through September 30, 2006. |
| ** | From commencement of Class operations on June 1, 2007 through September 30, 2007. |
| *** | Prior to the close of business on June 1, 2007, the Fund offered Institutional Class shares, which were redesignated as Class Y shares on that date. |
| **** | Prior to the close of business on June 1, 2007, the Fund offered Retail Class shares, which were redesignated as Class A shares on that date. |
| (a) | Had certain expenses not been reduced during the period, if applicable, total return would have been lower. |
| (b) | The investment adviser and/or administrator agreed to reimburse a portion of the Fund’s expenses and/or reduce its fees during the period. Without this reimbursement/fee reduction, if applicable, expenses would have been higher. |
| (c) | Per share net investment income has been calculated using the average shares outstanding during the period. |
See accompanying notes to financial statements.
41
| | | | | | | | | | | | | | | | | | |
| | | | | | Ratios to Average Net Assets: | | | |
| | | | | | |
Net asset
value, end
of the
period | | Total
return
(%) (a)(g) | | | Net assets,
end of
the period
(000’s) | | Net
expenses
(%) (b)(f) | | | Gross
expenses
(%) (f) | | | Net investment
income (loss)
(%) (f) | | Portfolio
turnover
rate (%) | |
| | | | | | | | | | | | | | | | | | |
| | | | | | | | | | | | | | | | | | |
| | | | | | | | | | | | | | | | | | |
| $ | 17.93 | | (19.0 | ) | | $ | 112,274 | | 1.05 | | | 1.05 | | | 1.24 | | 36 | (i) |
| | 23.46 | | 16.9 | | | | 17,500 | | 1.09 | (e) | | 1.09 | (e) | | 0.79 | | 41 | |
| | 21.04 | | 6.9 | | | | 466 | | 1.10 | | | 8.65 | | | 0.42 | | 36 | |
| | | | | | | | | | | | | | | | | | |
| | 17.80 | | (19.7 | ) | | | 8,385 | | 1.80 | (h) | | 1.80 | (h) | | 0.51 | | 36 | (i) |
| | 23.46 | | (2.3 | ) | | | 108 | | 1.85 | | | 1.89 | | | 0.03 | | 41 | |
| | | | | | | | | | | | | | | | | | |
| | 17.79 | | (19.6 | ) | | | 6,483 | | 1.80 | (h) | | 1.80 | (h) | | 0.46 | | 36 | (i) |
| | 23.46 | | (2.3 | ) | | | 1,390 | | 1.85 | | | 1.94 | | | 0.10 | | 41 | |
| | | | | | | | | | | | | | | | | | |
| | 18.01 | | (18.7 | ) | | | 303,182 | | 0.65 | | | 0.66 | | | 1.58 | | 36 | (i) |
| | 23.54 | | 17.3 | | | | 182,002 | | 0.72 | (e) | | 0.72 | (e) | | 1.19 | | 41 | |
| | 21.05 | | 18.9 | | | | 71,147 | | 0.85 | | | 0.91 | | | 1.13 | | 36 | |
| | 18.72 | | 19.2 | | | | 37,255 | | 0.85 | | | 0.92 | | | 1.13 | | 34 | |
| | 15.95 | | 19.4 | | | | 33,563 | | 0.85 | | | 0.93 | | | 1.38 | | 47 | |
| (d) | Amount rounds to less than $0.01 per share, if applicable. |
| (e) | Includes expense recapture of 0.02% and 0.01% for Class A and Class Y, respectively. |
| (f) | Computed on an annualized basis for periods less than one year, if applicable. |
| (g) | A sales charge for Class A shares and a contingent deferred sales charge for Class B and Class C shares are not reflected in total return calculations. Periods less than one year, if applicable, are not annualized. |
| (h) | Includes expense recapture of less than 0.01% for Class B and Class C, respectively. |
| (i) | Portfolio turnover excludes the impact of assets resulting from a merger with another fund. (See Note 9 of Notes to Financial Statements) |
42
NOTESTO FINANCIAL STATEMENTS
September 30, 2008
1. Organization. Loomis Sayles Funds II (the “Trust”) is organized as a Massachusetts business trust. The Trust is registered under the Investment Company Act of 1940, as amended (the “1940 Act”), as an open-end management investment company. The Declaration of Trust permits the Board of Trustees to authorize the issuance of an unlimited number of shares of the Trust in multiple series. Information presented in these financial statements pertains to certain equity funds of the Trust; the financial statements for the remaining equity funds and the fixed income funds of the Trust are presented in separate reports. The following funds (individually, a “Fund” and collectively, the “Funds”) are included in this report:
Loomis Sayles Global Markets Fund (the “Global Markets Fund”)
Loomis Sayles Growth Fund (the “Growth Fund”)
Loomis Sayles Research Fund (the “Research Fund”)
Loomis Sayles Value Fund (the “Value Fund”)
Each Fund offers Class A, Class C and Class Y shares. Effective October 12, 2007, Class B shares are no longer offered. Existing Class B shareholders may continue to reinvest dividends into Class B shares and exchange their Class B shares for Class B shares of other Natixis Funds subject to existing exchange privileges as described in the Prospectus.
Class A shares are sold with a maximum front-end sales charge of 5.75%. Class B shares do not pay a front-end sales charge, but pay higher Rule 12b-1 fees than Class A shares for eight years (at which point they automatically convert to Class A shares), and are subject to a contingent deferred sales charge (“CDSC”) if those shares are redeemed within six years of purchase. Class C shares do not pay a front-end sales charge, do not convert to any other class of shares and pay higher Rule 12b-1 fees than Class A shares and may be subject to a CDSC of 1.00% if those shares are redeemed within one year. Class Y shares do not pay a front-end sales charge, a CDSC or distribution fees. Class Y shares are generally intended for institutional investors with a minimum initial investment of $100,000, though some categories of investors are exempted from the minimum investment amount as outlined in the Funds’ Prospectus.
Most expenses of the Trust can be directly attributed to a fund. Expenses which can not be directly attributed to a fund are generally apportioned based on the relative net assets of each of the funds in the Trust. Expenses of a fund are borne pro rata by the holders of each class of shares, except that each class bears expenses unique to that class (including the Rule 12b-1 service and distribution fees and transfer agent fees applicable to such class). In addition, each class votes as a class only with respect to its own Rule 12b-1 Plan. Shares of each class would receive their pro rata share of the net assets of a fund if the fund were liquidated. The Trustees approve separate dividends from net investment income on each class of shares.
2. Significant Accounting Policies. The following is a summary of significant accounting policies consistently followed by each Fund in the preparation of its financial statements. The Funds’ financial statements are prepared in accordance with accounting principles generally accepted in the United States of America which require the use of management estimates that affect the reported amounts and disclosures in the financial statements. Actual results could differ from those estimates.
a. Security Valuation. Equity securities, including closed-end investment companies and exchange-traded funds, for which market quotations are readily available are valued at market value, as reported by pricing services recommended by the investment adviser and approved by the Board of Trustees. Such pricing services generally use the security’s last sale price on the exchange or market where the security is primarily traded or, if there is no reported sale during the day, the closing bid price. Securities traded on the NASDAQ Global Select Market, NASDAQ Global Market and NASDAQ Capital Market are valued at the NASDAQ Official Closing Price (“NOCP”), or if lacking a NOCP, at the most recent bid quotation on the applicable NASDAQ Market. Debt securities (other than short-term obligations purchased with an original or remaining maturity of sixty days or less) are generally valued on the basis of evaluated bids furnished to the Funds by a pricing service recommended by the investment adviser and approved by the Board of Trustees, which service determines valuations for normal, institutional-size trading units of such securities using market information, transactions for comparable securities and various relationships between securities which are generally recognized by institutional traders. Broker-dealer bid quotations may also be used to value debt and equity securities where a pricing service does not price a security or where a pricing service does not provide a reliable price for the security. In instances where broker-dealer bid quotations are not available, certain securities held by the Funds may be valued on the basis of a price provided by a principal market maker. Short-term obligations purchased with an original or remaining maturity of sixty days or less are valued at amortized cost, which approximates market value. Securities for which market quotations are not readily available are valued at fair value as determined in good faith by the Funds’ investment adviser using consistently applied procedures under the general supervision of the Board of Trustees. Investments in other open-end investment companies are valued at their net asset value each day.
The Funds may hold securities traded in foreign markets. Foreign securities are valued at the market price in the foreign market. However, if events occurring after the close of the foreign market (but before the close of regular trading on the New York Stock Exchange) are believed to materially affect the value of those securities, such securities are fair valued pursuant to procedures approved by the Board of Trustees. When fair valuing securities, the Funds may, among other things, use modeling tools or other processes that may take into account factors such as securities market activity and/or significant events that occur after the close of the foreign market and before the Funds calculate their net asset values. As of September 30, 2008, approximately 16% of the market value of the Global Markets Fund’s investments was fair valued pursuant to procedures approved by the Board of Trustees.
43
NOTESTO FINANCIAL STATEMENTS (continued)
September 30, 2008
b. Security Transactions and Related Investment Income. Security transactions are accounted for on trade date. Dividend income is recorded on ex-dividend date, or in the case of certain foreign securities, as soon as the Fund is notified, and interest income is recorded on an accrual basis. Interest income is increased by the accretion of discount and decreased by the amortization of premium. Periodic principal adjustments for inflation-protected securities are recorded to interest income. Distributions received from investments in securities that represent a return of capital or capital gain are recorded as a reduction of cost of investments or as a realized gain, respectively. The calendar year-end amounts of ordinary income, capital gains, and return of capital included in distributions received from the Funds’ investments in real estate investment trusts (“REITs”) are reported to the Funds after the end of the fiscal year; accordingly, the Funds estimate these amounts for accounting purposes until the characterization of REIT distributions is reported to the Funds after the end of the fiscal year. Estimates are based on the most recent REIT distribution information available. Investment income is recorded net of foreign taxes withheld when applicable. In determining net gain or loss on securities sold, the cost of securities has been determined on an identified cost basis. Investment income, non-class specific expenses and realized and unrealized gains and losses are allocated on a pro rata basis to each class based on the relative net assets of each class to the total net assets of the Fund.
c. Foreign Currency Translation. The books and records of the Funds are maintained in U.S. dollars. The value of securities, currencies and other assets and liabilities denominated in currencies other than U.S. dollars are translated into U.S. dollars based upon foreign exchange rates prevailing at the end of the period. Purchases and sales of investment securities, income and expenses are translated on the respective dates of such transactions.
Since the values of investment securities are presented at the foreign exchange rates prevailing at the end of the period, it is not practical to isolate that portion of the results of operations arising from changes in exchange rates from fluctuations which arise due to changes in market prices of the investment securities. Such changes are included with the net realized and unrealized gain or loss on investments.
Net realized foreign exchange gains or losses arise from sales of foreign currency, currency gains or losses realized between the trade and settlement dates on securities transactions and the difference between the amounts of dividends, interest and foreign withholding taxes recorded on the Funds’ books and the U.S. dollar equivalent of the amounts actually received or paid. Net unrealized foreign exchange gains and losses arise from changes in the value of assets and liabilities, other than investment securities, at the end of the fiscal period, resulting from changes in exchange rates.
Each Fund may use foreign currency exchange contracts to facilitate transactions in foreign-denominated investments. Losses may arise from changes in the value of the foreign currency or if the counterparties do not perform under the contracts’ terms.
Each Fund may purchase investments of foreign issuers. Investing in securities of foreign issuers involves special risks and considerations not typically associated with investing in U.S. companies and securities of the U.S. government. These risks include revaluation of currencies and the risk of appropriation. Moreover, the markets for securities of many foreign issuers may be less liquid and the prices of such securities may be more volatile than those of comparable U.S. companies and the U.S. government.
d. Forward Foreign Currency Contracts. Each Fund may enter into forward foreign currency contracts. Contracts to buy generally are used to acquire exposure to foreign currencies, while contracts to sell generally are used to hedge a Fund’s investments against currency fluctuation. Also, a contract to buy or sell can offset a previous contract. These contracts involve market risk in excess of the unrealized gain or loss reflected in the Fund’s Statement of Assets and Liabilities. The U.S. dollar value of the currencies a Fund has committed to buy or sell represents the aggregate exposure to each currency the Fund has acquired or hedged through currency contracts outstanding at period end.
All contracts are “marked-to-market” daily at the applicable exchange rates and any gains or losses are recorded for financial statement purposes as unrealized until settlement date. Risks may arise upon entering into these contracts from the potential inability of counterparties to meet the terms of their contracts and from unanticipated movements in the value of a foreign currency relative to the U.S. dollar.
e. Federal and Foreign Income Taxes. The Trust treats each Fund as a separate entity for federal income tax purposes. Each Fund intends to meet the requirements of the Internal Revenue Code applicable to regulated investment companies, and to distribute to its shareholders substantially all of its net investment income and any net realized capital gains at least annually. Management has performed an analysis of the Funds’ tax positions taken on federal and state tax returns that remain subject to examinations (tax years ended September 30, 2005-2008) and has concluded that no provisions for income tax are required. Fund management is not aware of any events that are reasonably possible to occur in the next twelve months that would result in the amounts of any unrecognized tax benefits significantly increasing or decreasing for the Funds. However, management’s conclusions regarding tax positions taken may be subject to review and adjustment at a later date based on factors including, but not limited to, new tax laws and accounting regulations and interpretations thereof.
A Fund may be subject to foreign taxes on income and gains on investments that are accrued based upon the Fund’s understanding of the tax rules and regulations that exist in the countries in which the Fund invests. Foreign governments may also impose taxes or other payments on investments with respect to foreign securities. Such taxes are accrued as applicable.
f. Dividends and Distributions to Shareholders. Dividends and distributions are recorded on ex-dividend date. The timing and characterization of certain income and capital gain distributions are determined annually in accordance with federal tax regulations, which may differ from accounting principles generally accepted in the United States of America. Permanent differences are primarily due to differing treatments for book and tax purposes for items such as net operating losses, distribution redesignations, capital gain taxes, paydown adjustments, capital loss carryforwards permanently lost due to a merger, wash sales and deferred trustee fees inherited in a merger, foreign currency transactions, gains realized from passive foreign investment companies (“PFICs”) and premium amortization accruals. Permanent book and tax basis differences relating to shareholder distributions will result in reclassifications to capital accounts. Temporary differences between book and tax distributable earnings are primarily due to deferred Trustees’ fees, forward contracts mark to market, securities lending collateral gain/loss adjustment, wash sales, unrealized gains on PFICs, premium amortization accruals and defaulted bond interest. Distributions from net investment income and short-term capital gains are considered to be distributed from ordinary income for tax purposes.
44
NOTESTO FINANCIAL STATEMENTS (continued)
September 30, 2008
The tax characterization of distributions is determined on an annual basis. The tax character of distributions paid to shareholders during the years ended September 30, 2008 and 2007 was as follows:
| | | | | | | | | | | | | | | | | | |
| | | 2008 Distributions Paid From: | | 2007 Distributions Paid From: |
Fund | | Ordinary Income | | Long-Term
Capital Gains | | Total | | Ordinary Income | | Long-Term
Capital Gains | | Total |
Global Markets Fund | | $ | 9,975,891 | | $ | 5,031,317 | | $ | 15,007,208 | | $ | 1,728,169 | | $ | — | | $ | 1,728,169 |
Growth Fund | | | — | | | — | | | — | | | — | | | — | | | — |
Research Fund | | | 1,651,307 | | | 1,693,530 | | | 3,344,837 | | | 1,006,557 | | | 2,531,636 | | | 3,538,193 |
Value Fund | | | 6,455,247 | | | 6,148,525 | | | 12,603,772 | | | 958,359 | | | 4,136,723 | | | 5,095,082 |
Differences between these amounts and those reported in the Statements of Changes in Net Assets are primarily attributable to different book and tax treatment for short-term capital gains.
As of September 30, 2008, the components of distributable earnings on a tax basis were as follows:
| | | | | | | | | | | | | | | | |
| | | Global
Markets Fund | | | Growth
Fund | | | Research
Fund | | | Value
Fund | |
Undistributed ordinary income | | $ | 2,733,999 | | | $ | — | | | $ | 73,559 | | | $ | 3,629,149 | |
Undistributed long-term capital gains | | | — | | | | — | | | | — | | | | — | |
| | | | | | | | | | | | | | | | |
Total undistributed earnings | | | 2,733,999 | | | | — | | | | 73,559 | | | | 3,629,149 | |
Capital loss carryforward: | | | | | | | | | | | | | | | | |
Expires September 30, 2010 | | | — | | | | (9,606,459 | )* | | | — | | | | — | |
Expires September 30, 2011 | | | — | | | | (6,192,314 | )* | | | — | | | | — | |
Expires September 30, 2016 | | | — | | | | (75,866 | ) | | | — | | | | — | |
| | | | | | | | | | | | | | | | |
Total capital loss carryforward | | | — | | | | (15,874,639 | ) | | | — | | | | — | |
Deferred net capital losses (post-October 2007) | | | (29,837,961 | ) | | | (31,323,857 | ) | | | (1,121,319 | ) | | | (12,052,896 | ) |
Unrealized appreciation (depreciation) | | | (52,631,354 | ) | | | (18,265,176 | ) | | | (1,709,267 | ) | | | (40,519,869 | ) |
| | | | | | | | | | | | | | | | |
Total accumulated earnings (losses) | | | (79,735,316 | ) | | | (65,463,672 | ) | | | (2,757,027 | ) | | | (48,943,616 | ) |
| | | | | | | | | | | | | | | | |
Capital loss carryforward utilized in the current year | | $ | — | | | $ | — | | | $ | — | | | $ | — | |
| | | | | | | | | | | | | | | | |
* A significant portion of the Loomis Sayles Growth Fund’s carryforward losses are a result of prior year mergers; therefore, utilization of these losses has been limited under section 382 of the Internal Revenue Code.
g. Repurchase Agreements. Each Fund, through its custodian, receives delivery of the underlying securities collateralizing repurchase agreements. It is each Fund’s policy that the market value of the collateral be at least equal to 100% of the repurchase price, including interest. Certain repurchase agreements are tri-party arrangements whereby the collateral is held at the custodian bank in a segregated account for the benefit of the Fund and on behalf of the counterparty. It is each Fund’s policy, regarding tri-party arrangements, that the market value of the collateral be at least equal to 102% of the repurchase price, including interest. Repurchase agreements could involve certain risks in the event of default or insolvency of the counterparty including possible delays or restrictions upon a Fund’s ability to dispose of the underlying securities.
h. Securities Lending. The Funds have entered into an agreement with State Street Bank and Trust Company (“State Street Bank”), as agent of the Funds, to lend securities to certain designated borrowers. The loans are collateralized with cash or securities in an amount equal to at least 105% or 102% of the market value of the loaned international or domestic securities, respectively, when the loan is initiated. Thereafter, the value of the collateral must remain at least 102% of the market value of loaned securities for U.S. equities and U.S. corporate debt; at least 105% of the market value of loaned securities for non-U.S. equities; and at least 100% of the market value of loaned securities for U.S. government securities, sovereign debt issued by non-U.S. governments and non-U.S. corporate debt. In the event that the market value of the collateral falls below the required percentages described above, the borrower will deliver additional collateral on the next business day. As with other extensions of credit, the Funds may bear the risk of loss with respect to the investment of the collateral. The Funds invest cash collateral in short-term investments, a portion of the income from which is remitted to the borrowers and the remainder allocated between the Funds and State Street Bank as lending agent. The value of securities on loan to borrowers and the value of collateral held by the Funds with respect to such loans at September 30, 2008 were as follows:
| | | | | | |
| | | Market Value of Securities on Loan | | Value of Collateral |
Global Markets Fund | | $ | 16,148,838 | | $ | 16,569,651 |
Growth Fund | | | 14,850,936 | | | 15,008,790 |
Research Fund | | | 1,522,253 | | | 1,479,633 |
Value Fund | | | 20,222,583 | | | 19,426,361 |
45
NOTESTO FINANCIAL STATEMENTS (continued)
September 30, 2008
Subsequent to September 30, 2008, all open securities lending transactions were closed.
i. Indemnifications. Under the Trust’s organizational documents, its officers and Trustees are indemnified against certain liability arising out of the performance of their duties to the Funds. Additionally, in the normal course of business, the Funds enter into contracts with service providers that contain general indemnification clauses. The Funds’ maximum exposure under these arrangements is unknown as this would involve future claims that may be made against the Funds that have not yet occurred. However, based on experience, the Funds expect the risk of loss to be remote.
j. New Accounting Pronouncements. In September 2006, Statement of Financial Accounting Standards No. 157, Fair Value Measurements (“FAS 157”), was issued and is effective for fiscal years beginning after November 15, 2007. FAS 157 defines fair value, establishes a framework for measuring fair value and expands disclosures about fair value measurements. Management has evaluated the impact the adoption of FAS 157 will have on the Funds’ financial statements and believes that such impact will be limited to expanded disclosure in the Funds’ financial statements regarding inputs used in determining the value of the Funds’ investments.
In March 2008, Statement of Financial Accounting Standards No. 161, Disclosures about Derivative Instruments and Hedging Activities (“FAS 161”), was issued and will be effective for fiscal years and interim periods beginning after November 15, 2008. FAS 161 requires enhanced disclosures about funds’ derivative and hedging activities. Management is currently evaluating the impact the adoption of FAS 161 will have on the Funds’ financial statement disclosures.
3. Purchases and Sales of Securities. For the year ended September 30, 2008, purchases and sales of securities (excluding short-term investments and U.S. government/agency securities and including paydowns) were as follows:
| | | | | | |
Fund | | Purchases | | Sales |
Global Markets Fund | | $ | 621,670,969 | | $ | 376,565,412 |
Growth Fund | | | 666,731,609 | | | 711,230,092 |
Research Fund | | | 44,096,629 | | | 42,199,464 |
Value Fund | | | 302,224,902 | | | 116,972,182 |
For the year ended September 30, 2008, purchases and sales of U.S. government/agency securities by the Global Markets Fund were $22,491,901 and $37,182,189, respectively. Purchases and sales of the Value Fund exclude the impact of assets resulting from a merger with another fund. (See Note 9).
4. Management Fees and Other Transactions with Affiliates.
a. Management Fees. Loomis, Sayles & Company, L.P. (“Loomis Sayles”) serves as investment adviser to each Fund. Under the terms of the management agreements, each Fund pays a management fee at the following annual rates, calculated daily and payable monthly, based on each Fund’s average daily net assets:
| | | |
Fund | | Percentage of
Average
Daily Net Assets | |
Global Markets Fund | | 0.75 | % |
Growth Fund | | 0.50 | % |
Research Fund | | 0.50 | % |
Value Fund | | 0.50 | % |
Loomis Sayles has given binding undertakings to the Funds to reduce management fees and/or reimburse certain expenses associated with the Funds to limit their operating expenses. These undertakings are in effect until January 31, 2009 and will be reevaluated on an annual basis. For the year ended September 30, 2008, the expense limits as a percentage of average daily net assets under the expense limitation agreements were as follows:
| | | | | | | | | | | | |
| | | Expense Limit as a Percentage of Average
Daily Net Assets | |
Fund | | Class A | | | Class B | | | Class C | | | Class Y | |
Global Markets Fund | | 1.25 | % | | N/A | | | 2.00 | % | | 1.00 | % |
Growth Fund | | 1.25 | % | | 2.00 | % | | 2.00 | % | | 0.85 | % |
Research Fund | | 1.25 | % | | 2.00 | % | | 2.00 | % | | 0.85 | % |
Value Fund | | 1.10 | % | | 1.85 | % | | 1.85 | % | | 0.85 | % |
46
NOTESTO FINANCIAL STATEMENTS (continued)
September 30, 2008
For the year ended September 30, 2008, the management fees and reductions of management fees for each Fund were as follows:
| | | | | | | | | | | | | | | |
| | | Gross Management | | Reduction of Management | | Net
Management | | Percentage of
Average
Daily Net Assets | |
Fund | | Fee | | Fee | | Fee | | Gross | | | Net | |
Global Markets Fund | | $ | 2,504,197 | | $ | — | | $ | 2,504,197 | | 0.75 | % | | 0.75 | % |
Growth Fund | | | 1,890,998 | | | — | | | 1,890,998 | | 0.50 | % | | 0.50 | % |
Research Fund | | | 141,803 | | | 67,138 | | | 74,665 | | 0.50 | % | | 0.26 | % |
Value Fund | | | 1,676,827 | | | — | | | 1,676,827 | | 0.50 | % | | 0.50 | % |
For the year ended September 30, 2008, class specific expenses have been reimbursed as follows:
| | | |
Fund | | Reimbursement |
Global Markets Fund | | $ | 42,849 |
Growth Fund | | | — |
Research Fund | | | 16,894 |
Value Fund | | | — |
Loomis Sayles shall be permitted to recover expenses it has borne under the expense limitation agreement (whether through reduction of its management fees or otherwise) on a class by class basis in later periods to the extent a class’ expenses fall below a class’ expense limits, provided, however, that a class is not obligated to pay such reduced fees/expenses more than one year after the end of the fiscal year in which the fee/expense was reduced. The amounts subject to possible reimbursement under the expense limitation agreements at September 30, 2008 were as follows:
| | | | | | | | | | | | | | | |
| | | Expenses Subject to Possible Reimbursement until
September 30, 2009 |
Fund | | Class A | | Class B | | Class C | | Class Y | | Total |
Global Markets Fund | | $ | 13,645 | | $ | — | | $ | 29,204 | | $ | — | | $ | 42,849 |
Growth Fund | | | — | | | — | | | — | | | — | | | — |
Research Fund | | | 2,990 | | | 927 | | | 2,471 | | | 77,644 | | | 84,032 |
Value Fund | | | — | | | — | | | — | | | — | | | — |
Certain officers and employees of Loomis Sayles are also officers or Trustees of the Trust. Loomis Sayles’ general partner is indirectly owned by Natixis Global Asset Management, L.P. (“Natixis US”), which is part of Natixis Global Asset Management, an international asset management group based in Paris, France.
b. Administrative Fees. Natixis Asset Management Advisors, L.P. (“Natixis Advisors”) provides certain administrative services for the Funds and subcontracts with State Street Bank to serve as sub-administrator. Natixis Advisors is a wholly-owned subsidiary of Natixis US. Pursuant to an agreement among Natixis Funds Trust I, Natixis Funds Trust II, Natixis Funds Trust III, Natixis Funds Trust IV, Natixis Cash Management Trust, Gateway Trust (“Natixis Funds Trusts”), Loomis Sayles Funds I, Loomis Sayles Funds II (“Loomis Sayles Funds Trusts”), Hansberger International Series and Natixis Advisors, each Fund pays Natixis Advisors monthly its pro rata portion of fees equal to an annual rate of 0.0575% of the first $15 billion of the average daily net assets of the Natixis Funds Trusts, Loomis Sayles Funds Trusts and the Hansberger International Series, 0.0500% of the next $15 billion, 0.0425% of the next $30 billion and 0.0375% of such assets in excess of $60 billion, subject to an annual aggregate minimum fee for the Natixis Funds Trusts , Loomis Sayles Funds Trusts and the Hansberger International Series of $10 million, which is reevaluated on an annual basis. New funds are subject to an annual fee of $75,000 plus $12,500 per class and an additional $75,000 if managed by multiple subadvisors in their first calendar year of operations.
Effective October 1, 2007, State Street Bank agreed to reduce the fees it receives from Natixis Advisors for serving as sub-administrator to the Funds. Also, effective October 1, 2007, Natixis Advisors gave a binding contractual undertaking to the Funds to waive the administrative fees paid by the Funds in an amount equal to the reduction in sub-administrative fees discussed above. The waiver was in effect through June 30, 2008.
Prior to July 1, 2008, the Funds paid Natixis Advisors monthly its pro rata portion of fees equal to an annual rate of 0.0675% of the first $5 billion of the average daily net assets of the Natixis Funds Trusts, Loomis Sayles Funds Trusts and the Hansberger International Series, 0.0625% of the next $5 billion, 0.0500% of the next $20 billion and 0.045% of such assets in excess of $30 billion, subject to an annual aggregate minimum fee for the Natixis Funds Trusts, Loomis Sayles Funds Trusts and the Hansberger International Series of $5 million, which was reevaluated on an annual basis. New funds were subject to an annual fee of $50,000 plus $12,500 per class and an additional $50,000 if managed by multiple subadvisors in their first calendar year of operations.
47
NOTESTO FINANCIAL STATEMENTS (continued)
September 30, 2008
For the year ended September 30, 2008, amounts paid to Natixis Advisors for administrative fees were as follows:
| | | | | | | | | |
Fund | | Gross Administrative Fees | | Waiver of
Administrative
Fees | | Net
Administrative
Fees |
Global Markets Fund | | $ | 169,781 | | $ | 6,416 | | $ | 163,365 |
Growth Fund | | | 193,081 | | | 7,845 | | | 185,236 |
Research Fund | | | 14,464 | | | 574 | | | 13,890 |
Value Fund | | | 170,186 | | | 6,545 | | | 163,641 |
c. Service and Distribution Fees. Natixis Distributors, L.P. (“Natixis Distributors”) a wholly owned subsidiary of Natixis US, has entered into a distribution agreement with the Trust. Pursuant to this agreement, Natixis Distributors serves as principal underwriter of the funds of the Trust.
Pursuant to Rule 12b-1 under the 1940 Act, the Trust has adopted a Service Plan relating to each Fund’s Class A shares (the “Class A Plans”); Distribution and Service Plan relating to the Growth Fund’s, Research Fund’s and Value Fund’s Class B shares (the “Class B Plans”), and a Distribution and Service Plan relating to each Fund’s Class C shares (the “Class C Plans”).
Under the Class A Plans, each Fund pays Natixis Distributors a monthly service fee at an annual rate not to exceed 0.25% of the average daily net assets attributable to the Fund’s Class A shares, as reimbursement for expenses incurred by Natixis Distributors in providing personal services to investors in Class A shares and/or the maintenance of shareholder accounts.
Under the Class B and Class C Plans, each applicable Fund pays Natixis Distributors a monthly service fee at an annual rate of 0.25% of the average daily net assets attributable to the Fund’s Class B and Class C shares, as compensation for services provided and expenses incurred by Natixis Distributors in providing personal services to investors in Class B and Class C shares and/or the maintenance of shareholder accounts.
Also under the Class B and Class C Plans, each applicable Fund pays Natixis Distributors a monthly distribution fee at an annual rate of 0.75% of the average daily net assets attributable to the Fund’s Class B and Class C shares, as compensation for services provided and expenses incurred by Natixis Distributors in connection with the marketing or sale of Class B and Class C shares.
For the year ended September 30, 2008, the Funds paid the following service and distribution fees:
| | | | | | | | | | | | | | | |
| | | Service Fee | | Distribution Fee |
Fund | | Class A | | Class B | | Class C | | Class B | | Class C |
| | | | | | | | | | | | | | | |
Global Markets Fund | | $ | 170,445 | | $ | — | | $ | 329,334 | | $ | — | | $ | 988,003 |
Growth Fund | | | 523,839 | | | 48,875 | | | 93,176 | | | 146,626 | | | 279,527 |
Research Fund | | | 2,541 | | | 784 | | | 2,067 | | | 2,354 | | | 6,200 |
Value Fund | | | 270,245 | | | 26,441 | | | 12,988 | | | 79,325 | | | 38,963 |
d. Sub-Transfer Agent Fees. Natixis Distributors has entered into agreements with financial intermediaries to provide certain recordkeeping, processing, shareholder communications and other services to customers of the intermediaries and has agreed to compensate the intermediaries for providing those services. Certain services would be provided by the Funds if the shares of those customers were registered directly with the Funds’ transfer agent. Accordingly, the Funds agreed to pay a portion of the intermediary fees attributable to shares of the Fund held by the intermediary (which generally is a percentage of the value of shares held) not exceeding what the Funds would have paid its transfer agent had each customer’s shares been registered directly with the transfer agent instead of held through the intermediary. Natixis Distributors pays the remainder of the fees. Listed below are the fees incurred by the Funds which are included in the transfer agent fees and expenses in the Statements of Operations.
| | | | | | | | | | | | |
| | | Sub-Transfer Agent Fees |
Fund | | Class A | | Class B | | Class C | | Class Y |
| | | | | | | | | | | | |
Global Markets Fund | | $ | 46,138 | | $ | — | | $ | 87,333 | | $ | 66,501 |
Growth Fund | | | 313,378 | | | 33,455 | | | 55,203 | | | 48,211 |
Research Fund | | | 854 | | | 263 | | | 682 | | | 15,246 |
Value Fund | | | 27,728 | | | 3,136 | | | 1,309 | | | 52,968 |
48
NOTESTO FINANCIAL STATEMENTS (continued)
September 30, 2008
e. Commissions. The Funds have been informed that commissions (including CDSCs) on Fund shares paid to Natixis Distributors by investors in shares of the Funds for the year ended September 30, 2008, were as follows:
| | | |
Fund | | Commissions |
Global Markets Fund | | $ | 819,051 |
Growth Fund | | | 184,395 |
Research Fund | | | 3,529 |
Value Fund | | | 89,669 |
f. Trustees Fees and Expenses. The Funds do not pay any compensation directly to their officers or Trustees who are directors, officers or employees of Natixis Advisors, Natixis Distributors, Natixis US, or their affiliates. The Chairperson of the Board receives a retainer fee at the annual rate of $200,000. The Chairperson does not receive any meeting attendance fees for Board of Trustees meetings or committee meetings that she attends. Each Independent Trustee (other than the Chairperson) receives, in the aggregate, a retainer fee at the annual rate of $65,000. Each Independent Trustee also receives a meeting attendance fee of $7,500 for each meeting of the Board of Trustees that he or she attends in person and $3,750 for each meeting of the Board of Trustees that he or she attends telephonically. In addition, each committee chair receives an additional retainer fee at the annual rate of $10,000. Each Contract Review and Governance Committee member is compensated $5,000 for each Committee meeting that he or she attends in person and $2,500 for each meeting that he or she attends telephonically. Each Audit Committee member is compensated $6,250 for each Committee meeting that he or she attends in person and $3,125 for each meeting that he or she attends telephonically. These fees are allocated among the funds in the Natixis Funds Trusts, Loomis Sayles Funds Trusts and the Hansberger International Series based on a formula that takes into account, among other factors, the relative net assets of each Fund. Trustees are reimbursed for travel expenses in connection with attendance at meetings.
Prior to January 1, 2008, each Independent Trustee (other than the Chairperson) received, in the aggregate, a retainer fee at the annual rate of $55,000. Each Independent Trustee also received a meeting attendance fee of $6,000 for each meeting of the Board of Trustees that he or she attended in person and $3,000 for each meeting that he or she attended telephonically. In addition, each Contract Review and Governance Committee member received $4,000 for each committee meeting that he or she attended in person and $2,000 for each committee meeting that he or she attended telephonically. Each Audit Committee member received $5,000 for each committee meeting that he or she attended in person and $2,500 for each committee meeting that he or she attended telephonically. The Chairperson of the Board and committee chair retainers were $200,000 and $10,000, respectively.
A deferred compensation plan (the “Plan”) is available to the Trustees on a voluntary basis. Deferred amounts remain in the Funds until distributed in accordance with the provisions of the Plan. The value of a participating Trustee’s deferral account is based on theoretical investments of deferred amounts, on the normal payment dates, in certain funds of the Natixis Funds Trusts, Loomis Sayles Funds Trusts and Hansberger International Series as designated by the participating Trustees. Changes in the value of participants’ deferral accounts are allocated pro rata among the funds in the Natixis Funds Trusts, Loomis Sayles Funds Trusts, and Hansberger International Series, and are reflected as Trustees’ fees and expenses in the Statements of Operations. The portions of the accrued obligations allocated to the Funds under the Plan are reflected as Deferred Trustees’ fees in the Statements of Assets and Liabilities.
For the year ended September 30, 2008, net depreciation in the value of participants’ deferral accounts has been reclassified as Miscellaneous expenses on the Statements of Operations, as follows:
| | | |
Fund | | Amount |
Value Fund | | $ | 3,442 |
g. Redemption Fees. Effective June 2, 2008, the redemption fee imposed on Class A and Class Y shares of Global Markets Fund was eliminated. Prior to June 2, 2008 shareholders of Class A and Class Y shares of the Fund were charged a 2% redemption fee if they redeemed, including redeeming by exchange, such shares within 60 days of their acquisition (including acquisition by exchange). The redemption fee was deducted from the shareholder’s redemption or exchange proceeds and was paid to the Fund. The fees were accounted for as an addition to paid-in capital and are presented on the Statement of Changes in Net Assets.
5. Line of Credit. Each Fund, together with certain other funds of Natixis Funds Trusts, Loomis Sayles Funds Trusts and the Hansberger International Series, participates in a $200,000,000 committed line of credit provided by State Street Bank, with an individual limit of $125,000,000 for each fund that participates in the line of credit. Interest is charged to each participating fund based on its borrowings at a rate per annum equal to the Federal Funds rate plus 0.50%. In addition, a commitment fee of 0.09% per annum, payable at the end of each calendar quarter, is accrued and apportioned among the participating funds based on their average daily unused portion of the line of credit.
Prior to March 12, 2008, each Fund, together with certain other funds of Natixis Funds Trusts, Loomis Sayles Funds Trusts and Hansberger International Series, participated in a $75,000,000 committed line of credit provided by State Street Bank.
For the year ended September 30, 2008, the Funds had no borrowings under these agreements.
49
NOTESTO FINANCIAL STATEMENTS (continued)
September 30, 2008
6. Brokerage Commission Recapture. Each Fund has entered into agreements with certain brokers whereby the brokers will rebate a portion of brokerage commissions. All amounts rebated by the brokers are returned to the Funds under such agreements and are included in realized gains in the Statements of Operations. For the year ended September 30, 2008, amounts rebated under these agreements were as follows:
| | | |
Fund | | Rebates |
Global Markets Fund | | $ | 56,996 |
Growth Fund | | | 170,370 |
Research Fund | | | 12,378 |
Value Fund | | | 28,307 |
7. Shareholders. At September 30, 2008, Loomis Sayles Funded Pension Plan and Loomis Sayles Employees’ Profit Sharing Retirement Plan held shares of beneficial interest in the Funds as follows:
| | | | |
Fund | | Pension Plan | | Profit Sharing
Retirement Plan |
Global Markets Fund | | 952,415 | | 443,907 |
Growth Fund | | 1,345,338 | | 2,048,218 |
Research Fund | | 1,109,386 | | 732,305 |
Value Fund | | 500,273 | | 661,146 |
At September 30, 2008, two shareholders individually owned more than 5% of the Research Fund’s total outstanding shares, representing, in aggregate, 28.18% of the Fund; and one shareholder individually owned more than 5% of the Global Markets Fund’s total outstanding shares, representing in aggregate, 6.93% of the Fund.
8. Capital Shares. Each Fund may issue an unlimited number of shares of beneficial interest, without par value. Transactions in capital shares were as follows:
| | | | | | | | | | | | | | |
| | Year Ended
September 30, 2008 | | | Year Ended
September 30, 2007 | |
| | | | | | | | | | | | | | |
Global Markets Fund | | Shares | | | | Amount | | | Shares | | | | Amount | |
| Class A | | | | | | | | | | | | | | |
Issued from the sale of shares | | 7,795,589 | | | $ | 116,072,629 | | | 1,323,460 | | | $ | 19,376,888 | |
Issued in connection with the reinvestment of distributions | | 131,139 | | | | 2,095,597 | | | 12,909 | | | | 170,145 | |
Redeemed | | (3,949,026 | ) | | | (54,699,917 | ) | | (344,626 | ) | | | (4,798,240 | ) |
| | | | | | | | | | | | | | |
Net change | | 3,977,702 | | | $ | 63,468,309 | | | 991,743 | | | $ | 14,748,793 | |
| | | | | | | | | | | | | | |
| Class C | | | | | | | | | | | | | | |
Issued from the sale of shares | | 9,661,731 | | | $ | 145,592,794 | | | 2,428,865 | | | $ | 34,758,519 | |
Issued in connection with the reinvestment of distributions | | 105,649 | | | | 1,677,700 | | | 6,914 | | | | 90,915 | |
Redeemed | | (2,810,388 | ) | | | (38,148,474 | ) | | (230,238 | ) | | | (3,164,913 | ) |
| | | | | | | | | | | | | | |
Net change | | 6,956,992 | | | $ | 109,122,020 | | | 2,205,541 | | | $ | 31,684,521 | |
| | | | | | | | | | | | | | |
| Class Y | | | | | | | | | | | | | | |
Issued from the sale of shares | | 8,797,937 | | | $ | 131,551,316 | | | 1,157,288 | | | $ | 16,511,186 | |
Issued in connection with the reinvestment of distributions | | 307,774 | | | | 4,927,469 | | | 78,467 | | | | 1,034,975 | |
Redeemed | | (3,916,604 | ) | | | (53,723,650 | ) | | (830,965 | ) | | | (11,207,236 | ) |
| | | | | | | | | | | | | | |
Net change | | 5,189,107 | | | $ | 82,755,135 | | | 404,790 | | | $ | 6,338,925 | |
| | | | | | | | | | | | | | |
Increase (decrease) from capital share transactions | | 16,123,801 | | | $ | 255,345,464 | | | 3,602,074 | | | $ | 52,772,239 | |
| | | | | | | | | | | | | | |
50
NOTESTO FINANCIAL STATEMENTS (continued)
September 30, 2008
8. Capital Shares (continued).
| | | | | | | | | | | | | | |
| | Year Ended September 30, 2008 | | | Year Ended September 30, 2007 | |
Growth Fund | | Shares | | | | Amount | | | Shares | | | | Amount | |
| | | | | | | | | | | | | | |
| Class A | | | | | | | | | | | | | | |
Issued from the sale of shares | | 7,680,209 | | | $ | 49,883,063 | | | 7,089,532 | | | $ | 44,698,435 | |
Issued in connection with the reinvestment of distributions | | — | | | | — | | | — | | | | — | |
Redeemed | | (8,908,360 | ) | | | (57,264,265 | ) | | (13,109,095 | ) | | | (81,970,028 | ) |
| | | | | | | | | | | | | | |
Net change | | (1,228,151 | ) | | $ | (7,381,202 | ) | | (6,019,563 | ) | | $ | (37,271,593 | ) |
| | | | | | | | | | | | | | |
| Class B | | | | | | | | | | | | | | |
Issued from the sale of shares | | 63,680 | | | $ | 406,401 | | | 225,868 | | | $ | 1,376,484 | |
Issued in connection with the reinvestment of distributions | | — | | | | — | | | — | | | | — | |
Redeemed | | (2,236,178 | ) | | | (13,949,200 | ) | | (1,705,839 | ) | | | (10,426,523 | ) |
| | | | | | | | | | | | | | |
Net change | | (2,172,498 | ) | | $ | (13,542,799 | ) | | (1,479,971 | ) | | $ | (9,050,039 | ) |
| | | | | | | | | | | | | | |
| Class C | | | | | | | | | | | | | | |
Issued from the sale of shares | | 1,220,476 | | | $ | 7,692,403 | | | 1,278,833 | | | $ | 7,816,200 | |
Issued in connection with the reinvestment of distributions | | — | | | | — | | | — | | | | — | |
Redeemed | | (1,212,293 | ) | | | (7,365,990 | ) | | (3,124,017 | ) | | | (19,027,646 | ) |
| | | | | | | | | | | | | | |
Net change | | 8,183 | | | $ | 326,413 | | | (1,845,184 | ) | | $ | (11,211,446 | ) |
| | | | | | | | | | | | | | |
| Class Y | | | | | | | | | | | | | | |
Issued from the sale of shares | | 4,435,371 | | | $ | 30,672,809 | | | 3,152,372 | | | $ | 20,891,933 | |
Issued in connection with the reinvestment of distributions | | — | | | | — | | | — | | | | — | |
Redeemed | | (7,080,124 | ) | | | (46,319,717 | ) | | (6,121,890 | ) | | | (39,927,125 | ) |
| | | | | | | | | | | | | | |
Net change | | (2,644,753 | ) | | $ | (15,646,908 | ) | | (2,969,518 | ) | | $ | (19,035,192 | ) |
| | | | | | | | | | | | | | |
Increase (decrease) from capital share transactions | | (6,037,219 | ) | | $ | (36,244,496 | ) | | (12,314,236 | ) | | $ | (76,568,270 | ) |
| | | | | | | | | | | | | | |
| | |
| | Year Ended September 30, 2008 | | | Year Ended September 30, 2007 | |
Research Fund | | Shares | | | | Amount | | | Shares | | | | Amount | |
| Class A | | | | | | | | | | | | | | |
Issued from the sale of shares | | 41,128 | | | $ | 353,240 | | | 119,265 | | | $ | 1,061,187 | |
Issued in connection with the reinvestment of distributions | | 5,586 | | | | 50,215 | | | 5,961 | | | | 51,978 | |
Redeemed | | (63,879 | ) | | | (518,171 | ) | | (143,887 | ) | | | (1,318,176 | ) |
| | | | | | | | | | | | | | |
Net change | | (17,165 | ) | | $ | (114,716 | ) | | (18,661 | ) | | $ | (205,011 | ) |
| | | | | | | | | | | | | | |
| Class B | | | | | | | | | | | | | | |
Issued from the sale of shares | | 4,050 | | | $ | 37,443 | | | 13,946 | | | $ | 127,879 | |
Issued in connection with the reinvestment of distributions | | 2,116 | | | | 18,641 | | | 3,004 | | | | 25,776 | |
Redeemed | | (10,015 | ) | | | (79,179 | ) | | (15,550 | ) | | | (137,306 | ) |
| | | | | | | | | | | | | | |
Net change | | (3,849 | ) | | $ | (23,095 | ) | | 1,400 | | | $ | 16,349 | |
| | | | | | | | | | | | | | |
| Class C | | | | | | | | | | | | | | |
Issued from the sale of shares | | 122,016 | | | $ | 929,529 | | | 58,235 | | | $ | 506,509 | |
Issued in connection with the reinvestment of distributions | | 625 | | | | 5,472 | | | 604 | | | | 5,155 | |
Redeemed | | (104,640 | ) | | | (837,295 | ) | | (66,416 | ) | | | (595,377 | ) |
| | | | | | | | | | | | | | |
Net change | | 18,001 | | | $ | 97,706 | | | (7,577 | ) | | $ | (83,713 | ) |
| | | | | | | | | | | | | | |
| Class Y | | | | | | | | | | | | | | |
Issued from the sale of shares | | 445,607 | | | $ | 3,756,330 | | | 390,426 | | | $ | 3,634,934 | |
Issued in connection with the reinvestment of distributions | | 340,294 | | | | 3,072,854 | | | 353,735 | | | | 3,098,721 | |
Redeemed | | (220,905 | ) | | | (1,820,331 | ) | | (396,917 | ) | | | (3,619,808 | ) |
| | | | | | | | | | | | | | |
Net change | | 564,996 | | | $ | 5,008,853 | | | 347,244 | | | $ | 3,113,847 | |
| | | | | | | | | | | | | | |
Increase (decrease) from capital share transactions | | 561,983 | | | $ | 4,968,748 | | | 322,406 | | | $ | 2,841,472 | |
| | | | | | | | | | | | | | |
51
NOTESTO FINANCIAL STATEMENTS (continued)
September 30, 2008
8. Capital Shares (continued).
| | | | | | | | | | | | | | |
| | Year Ended September 30, 2008 | | | Year Ended September 30, 2007 | |
Value Fund | | Shares | | | | Amount | | | Shares | | | | Amount | |
| | | | | | | | | | | | | | |
| Class A | | | | | | | | | | | | | | |
Issued from the sale of shares | | 2,540,370 | | | $ | 50,973,973 | | | 1,007,378 | | | $ | 22,480,490 | |
Issued in connection with the acquisition of assets from Natixis Value Fund (Note 9) | | 4,677,827 | | | | 105,017,209 | | | — | | | | — | |
Issued in connection with the reinvestment of distributions | | 66,481 | | | | 1,479,502 | | | 11,954 | | | | 259,876 | |
Redeemed | | (1,769,731 | ) | | $ | (35,781,927 | ) | | (295,544 | ) | | | (6,787,734 | ) |
| | | | | | | | | | | | | | |
Net change | | 5,514,947 | | | $ | 121,688,757 | | | 723,788 | | | $ | 15,952,632 | |
| | | | | | | | | | | | | | |
| Class B* | | | | | | | | | | | | | | |
Issued from the sale of shares | | 15,504 | | | $ | 318,803 | | | 4,592 | | | $ | 109,794 | |
Issued in connection with the acquisition of assets from Natixis Value Fund (Note 9) | | 653,035 | | | | 14,641,036 | | | — | | | | — | |
Issued in connection with the reinvestment of distributions | | 3,039 | | | | 67,865 | | | — | | | | — | |
Redeemed | | (205,132 | ) | | $ | (4,185,244 | ) | | (6 | ) | | | (133 | ) |
| | | | | | | | | | | | | | |
Net change | | 466,446 | | | $ | 10,842,460 | | | 4,586 | | | $ | 109,661 | |
| | | | | | | | | | | | | | |
| Class C* | | | | | | | | | | | | | | |
Issued from the sale of shares | | 237,371 | | | $ | 4,858,951 | | | 61,363 | | | $ | 1,408,850 | |
Issued in connection with the acquisition of assets from Natixis Value Fund (Note 9) | | 127,550 | | | | 2,857,122 | | | — | | | | — | |
Issued in connection with the reinvestment of distributions | | 1,900 | | | | 42,151 | | | — | | | | — | |
Redeemed | | (61,760 | ) | | $ | (1,258,832 | ) | | (2,085 | ) | | | (48,751 | ) |
| | | | | | | | | | | | | | |
Net change | | 305,061 | | | $ | 6,499,392 | | | 59,278 | | | $ | 1,360,099 | |
| | | | | | | | | | | | | | |
| Class Y | | | | | | | | | | | | | | |
Issued from the sale of shares | | 11,928,797 | | | $ | 239,360,963 | | | 6,373,521 | | | $ | 144,020,544 | |
Issued in connection with the reinvestment of distributions | | 436,948 | | | | 9,702,013 | | | 186,666 | | | | 4,059,991 | |
Redeemed | | (3,265,447 | ) | | | (67,069,075 | ) | | (2,207,571 | ) | | | (50,723,278 | ) |
| | | | | | | | | | | | | | |
Net change | | 9,100,298 | | | $ | 181,993,901 | | | 4,352,616 | | | $ | 97,357,257 | |
| | | | | | | | | | | | | | |
Increase (decrease) from capital share transactions | | 15,386,752 | | | $ | 321,024,510 | | | 5,140,268 | | | $ | 114,779,649 | |
| | | | | | | | | | | | | | |
* From commencement of Class operations on June 1, 2007 through September 30, 2007.
9. Acquisition of Assets. After the close of business on October 26, 2007, the Value Fund acquired all assets and liabilities of Natixis Value Fund, pursuant to a plan of reorganization approved by Natixis Value Fund shareholders on October 12, 2007. The acquisition was accomplished by a tax-free exchange of 4,677,827 Class A shares of the Value Fund for 14,004,395 shares of the Natixis Value Fund Class A, 653,035 Class B shares of the Value Fund for 2,297,374 shares of the Natixis Value Fund Class B; and 127,550 Class C shares of the Value Fund for 448,235 shares of the Natixis Value Fund Class C. Natixis Value Fund net assets at that date of $122,515,367, including $13,382,872 of net unrealized appreciation, were combined with those of the Value Fund. The aggregate net assets of the Value Fund immediately before the acquisition were $200,528,438. The combined net assets of the Value Fund immediately following the acquisition were $323,043,805.
52
REPORTOF INDEPENDENT REGISTERED PUBLIC ACCOUNTING FIRM
To the Trustees of Loomis Sayles Funds II and Shareholders of Loomis Sayles Global Markets Fund, Loomis Sayles Growth Fund, Loomis Sayles Research Fund, and Loomis Sayles Value Fund:
In our opinion, the accompanying statements of assets and liabilities, including the portfolios of investments, and the related statements of operations and of changes in net assets and the financial highlights present fairly, in all material respects, the financial position of the Loomis Sayles Global Markets Fund, Loomis Sayles Growth Fund, Loomis Sayles Research Fund and Loomis Sayles Value Fund, each a series of Loomis Sayles Funds II (collectively, “the Funds”), at September 30, 2008, and the results of each of their operations, the changes in each of their net assets and the financial highlights for each of the periods indicated, in conformity with accounting principles generally accepted in the United States of America. These financial statements and financial highlights (hereafter referred to as “financial statements”) are the responsibility of the Funds’ management; our responsibility is to express an opinion on these financial statements based on our audits. We conducted our audits of these financial statements in accordance with the standards of the Public Company Accounting Oversight Board (United States). Those standards require that we plan and perform the audits to obtain reasonable assurance about whether the financial statements are free of material misstatement. An audit includes examining, on a test basis, evidence supporting the amounts and disclosures in the financial statements, assessing the accounting principles used and significant estimates made by management, and evaluating the overall financial statement presentation. We believe that our audits, which included confirmation of securities at September 30, 2008 by correspondence with the custodian and brokers, provide a reasonable basis for our opinion.
PricewaterhouseCoopers LLP
Boston, Massachusetts
November 21, 2008
53
2008 U.S. TAX DISTRIBUTION INFORMATIONTO SHAREHOLDERS (unaudited)
Corporate Dividends Received Deduction. For the fiscal year ended September 30, 2008, a percentage of dividends distributed by the Funds listed below qualify for the dividends received deduction for corporate shareholders. These percentages are as follows:
| | | |
Fund | | Qualifying
Percentage | |
Global Markets | | 7.17 | % |
Research | | 24.17 | % |
Value | | 52.51 | % |
Capital Gains Distributions. Pursuant to Internal Revenue Section 852(b), the following Funds paid distributions, which have been designated as capital gains distributions for the fiscal year ended September 30, 2008.
| | | |
Fund | | Amount |
Global Markets | | $ | 5,031,317 |
Research | | | 1,693,530 |
Value | | | 6,148,525 |
Qualified Dividend Income. For the fiscal year ended September 30, 2008, the Funds below will designate up to the maximum amount allowable pursuant to the Internal Revenue Code as qualified dividend income eligible for reduced tax rates. These lower rates range from 5% to 15% depending on an individual’s tax bracket. If the Funds pay a distribution during calendar year 2008, complete information will be reported in conjunction with Form 1099-DIV.
|
Fund |
Global Markets |
Growth |
Research |
Value |
54
TRUSTEEAND OFFICER INFORMATION
The tables below provide certain information regarding the Trustees and officers of Loomis Sayles Funds II (the “Trust”). Unless otherwise indicated, the address of all persons below is 399 Boylston Street, Boston, MA 02116. The Trust’s Statements of Additional Information include additional information about the Trustees of the Trust and are available by calling Loomis Sayles at 800-343-2029.
| | | | | | |
Name and Year of Birth | | Position(s) Held with the
Trust, Length of Time
Served and Term of Office* | | Principal Occupation(s)
During Past 5 Years** | | Number of Portfolios in
Fund Complex Overseen*** and Other Directorships Held |
| | | |
| INDEPENDENT TRUSTEES | | | | | | |
| | | |
Graham T. Allison, Jr.
(1940) | | Trustee Since 2003 Contract Review and Governance Committee Member | | Douglas Dillon Professor and Director of the Belfer Center for Science and International Affairs, John F. Kennedy School of Government, Harvard University | | 41 Director, Taubman Centers, Inc. (real estate investment trust) |
| | | |
Charles D. Baker
(1956) | | Trustee Since 2005 Contract Review and Governance Committee Member | | President and Chief Executive Officer, Harvard Pilgrim Health Care (health plan) | | 41 None |
| | | |
Edward A. Benjamin
(1938) | | Trustee Since 2002 Chairman of the Contract Review and Governance Committee | | Retired | | 41 None |
| | | |
Daniel M. Cain (1945) | | Trustee Since 2003 Chairman of the Audit Committee | | President and Chief Executive Officer, Cain Brothers & Company, Incorporated (investment banking) | | 41 Director, Sheridan Healthcare Inc. (physician practice management) |
| | | |
Kenneth A. Drucker (1945) | | Trustee Since 2008 Contract Review and Governance Committee Member | | Formerly, Treasurer, Sequa Corp. (manufacturing) | | 41 Director, M Fund, Inc. (registered investment company) |
| | | |
Jonathan P. Mason (1958) | | Trustee Since 2007 Audit Committee Member | | Chief Financial Officer, Cabot Corp. (specialty chemicals); formerly, Vice President and Treasurer, International Paper Company; formerly, Chief Financial Officer, Carter Holt Harvey (forest products) | | 41 None |
| | | |
Sandra O. Moose (1942) | | Chairperson of the Board of Trustees since November 2005 Trustee since 2003 Ex officio member of the Audit Committee and Contract Review and Governance Committee | | President, Strategic Advisory Services (management consulting); formerly, Senior Vice President and Director, The Boston Consulting Group, Inc. (management consulting) | | 41 Director, Verizon Communications; Director, Rohm and Haas Company (specialty chemicals); Director, AES Corporation (international power company) |
55
TRUSTEEAND OFFICER INFORMATION
| | | | | | |
Name and Year of Birth | | Position(s) Held with the
Trust, Length of Time
Served and Term of Office* | | Principal Occupation(s)
During Past 5 Years** | | Number of Portfolios in
Fund Complex Overseen*** and Other Directorships Held |
| | | |
INDEPENDENT TRUSTEES
continued | | | | | | |
| | | |
Cynthia L. Walker (1956) | | Trustee Since 2005 Audit Committee Member | | Deputy Dean for Finance and Administration, Yale University School of Medicine; formerly, Executive Dean for Administration, Harvard Medical School; and formerly, Dean for Finance & Chief Financial Officer, Harvard Medical School | | 41 None |
| | | |
| INTERESTED TRUSTEES | | | | | | |
| | | |
Robert J. Blanding1 (1947) 555 California Street San Francisco, CA 94104 | | Chief Executive Officer and Trustee since 2002 | | President, Chairman, Director and Chief Executive Officer, Loomis, Sayles & Company, L.P. | | 41 None |
| | | |
John T. Hailer2 (1960) | | Trustee Since 2003 | | President and Chief Executive Officer-U.S. and Asia, Natixis Global Asset Management, L.P.; formerly, President and Chief Executive Officer, Natixis Distribution Corporation, Natixis Asset Management Advisors, L.P., Natixis Distributors, L.P. and Natixis Global Associates, Inc. | | 41 None |
| * | Each Trustee serves until retirement, resignation or removal from the Board of Trustees. The current retirement age is 72. The position of Chairperson of the Board is appointed for a two-year term. Ms. Moose was appointed to serve an additional two-year term as the Chairperson of the Board of Trustees on September 14, 2007. |
| ** | Each person listed above, except as noted, holds the same position(s) with the Natixis Funds Trust I, Natixis Funds Trust II, Natixis Funds Trust III, Natixis Funds Trust IV, Gateway Trust and the Natixis Cash Management Trust (collectively, the “Natixis Funds Trusts”), Loomis Sayles Funds I and Loomis Sayles Funds II (collectively, the “Loomis Sayles Funds Trusts”), and Hansberger International Series. Previous positions during the past five years with Natixis Distributors, L.P. (the “Distributor”), Natixis Asset Management Advisors, L.P. (“Natixis Advisors”), or Loomis, Sayles & Company, L.P. are omitted if not materially different from a Trustee’s or officer’s current position with such entity. |
| *** | The Trustees of the Trust serve as trustees of a fund complex that includes all series of the Natixis Funds Trusts, the Loomis Sayles Funds Trusts and Hansberger International Series (collectively, the “Fund Complex”). |
1 | Mr. Blanding is deemed an “interested person” of the Trust because he holds the following positions with affiliated persons of the Trust: President, Chairman, Director and Chief Executive Officer of Loomis, Sayles & Company, L.P. |
2 | Mr. Hailer is deemed an “interested person” of the Trust because he holds the following positions with affiliated persons of the Trust: President and Chief Executive Officer-U.S. and Asia, Natixis Global Asset Management, L.P. |
56
TRUSTEEAND OFFICER INFORMATION
| | | | | | |
Name and Year of Birth | | Position(s) Held with the Trust | | Term of Office* and
Length of Time Served | | Principal Occupation
During Past 5 Years** |
|
| OFFICERS OF THE TRUST |
| | | |
Coleen Downs Dinneen (1960) | | Secretary, Clerk and Chief Legal Officer | | Since September 2004 | | Executive Vice President, General Counsel, Secretary and Clerk (formerly, Senior Vice President, Deputy General Counsel, Assistant Secretary and Assistant Clerk), Natixis Distribution Corporation, Natixis Asset Management Advisors, L.P. and Natixis Distributors, L.P. |
| | | |
Daniel J. Fuss (1933) One Financial Center Boston, MA 02111 | | Executive Vice President | | Since June 2003 | | Vice Chairman and Director, Loomis, Sayles & Company, L.P. |
| | | |
David Giunta (1965) | | President | | Since March 2008 | | President and Chief Executive Officer, Natixis Distribution Corporation, Natixis Asset Management Advisors, L.P. and Natixis Distributors, L.P.; formerly, President, Fidelity Charitable Gift Fund; and formerly, Senior Vice President, Fidelity Brokerage Company |
| | | |
Russell L. Kane (1969) | | Chief Compliance Officer, Assistant Secretary and Anti-Money Laundering Officer | | Chief Compliance Officer since May 2006; Assistant Secretary since June 2004; and Anti-Money Laundering Officer since April 2007 | | Chief Compliance Officer for Mutual Funds, Senior Vice President, Deputy General Counsel, Assistant Secretary and Assistant Clerk, Natixis Distribution Corporation, Natixis Asset Management Advisors, L.P. and Natixis Distributors, L.P.; and formerly, Senior Counsel, Columbia Management Group |
57
TRUSTEEAND OFFICER INFORMATION
| | | | | | |
Name and Year of Birth | | Position(s) Held with the Trust | | Term of Office* and
Length of Time Served | | Principal Occupation
During Past 5 Years** |
| | | |
OFFICERS OF THE TRUST
continued | | | | | | |
| | | |
Michael C. Kardok (1959) | | Treasurer, Principal Financial and Accounting Officer | | Since October 2004 | | Senior Vice President, Natixis Asset Management Advisors, L.P. and Natixis Distributors, L.P.; and formerly, Senior Director, PFPC Inc. |
| | | |
Robert Krantz (1964) | | Executive Vice President | | Since September 2007 | | Executive Vice President, Natixis Asset Management Advisors, L.P. and Natixis Distributors, L.P. |
| * | Each officer of the Trust serves for an indefinite term in accordance with the Trust’s current By-laws until the date his or her successor is elected and qualified, or until he or she sooner dies, retires, is removed or becomes disqualified. |
| ** | Each person listed above, except as noted, holds the same position(s) with the Natixis Funds Trusts, Loomis Sayles Funds Trusts and Hansberger International Series. Mr. Fuss is not an officer of the Natixis Funds Trusts or the Hansberger International Series. Previous positions during the past five years with the Distributor, Natixis Advisors or Loomis Sayles are omitted if not materially different from a Trustee’s or officer’s current position with such entity. |
58

Loomis Sayles Mid Cap Growth Fund
Loomis Sayles Small Cap Growth Fund
Loomis Sayles Small Cap Value Fund
ANNUAL REPORT
SEPTEMBER 30, 2008
FUND AND MANAGER REVIEW
Loomis Sayles Mid Cap Growth Fund

Phil Fine, CFA
Manager since February 1999
FUND FACTS
Symbol | Institutional: LSAIX;
Retail: LAGRX
Objective | Long-term capital growth from investments in common stocks or similar securities
Strategy | Invests at least 80% of its net assets (plus any borrowings made for investment purposes) in common stocks or other equity securities (which may include securities offered in the secondary markets or in initial public offerings) of companies with market capitalizations that fall within the capitalization range of the Russell Midcap Growth Index, although the Fund may invest in companies of any size
Fund Inception Date | 12/31/96
Total Net Assets | $146.3 million
PORTFOLIO REVIEW
Strong stock selection and an overweight in the materials and processing sector, coupled with strong selection in the energy sector, were primarily responsible for the Fund’s outperformance relative to its Benchmark, the Russell Midcap Growth Index, for the fiscal year ended September 30, 2008.
Early in 2008, we trimmed the Fund’s exposure to late-cyclical (companies sensitive to the economy late in the cycle) energy, materials and industrial holdings in anticipation of an economic downturn. We also increased the Fund’s weightings in healthcare and consumer discretionary. This proved to be the wrong strategy, so in late March and early April we reversed course and added significantly to our energy and materials exposure, which proved successful. Our concerns about the sustainability of the commodities bubble caused us to partially offset that exposure with holdings in technology, financial companies (asset managers) and discount merchandisers. Late in the period, on signs of a global economic slowdown, we significantly reduced our exposure to late cyclicals and increased the Portfolio’s defensive characteristics by adding to consumer staples and healthcare.
For much of the year, rising demand in emerging markets and a weak US dollar drove commodity prices higher. We had some big winners in coal (Alpha Natural Resources), oil services (Cameron International) and exploration and production (Range Resources, Southwestern Energy). In the materials sector, our biggest winners were in metals (Cleveland-Cliffs) and fertilizer (CF Industries). All of these strong performers were sold except Range Resources.
No sector in the Fund or Benchmark generated positive absolute returns for the period. For the most part, the least negative sectors were the most defensive: healthcare and consumer staples. Technology and financial services represented the largest detractors to absolute performance. The technology sector experienced across-the-board weakness stemming from earnings disappointments and/
or lowered guidance, combined with compression in the P/E multiple among high P/E stocks. In financial services, we had minimal exposure to banks, but experienced losses in companies exposed to the capital markets.
OUTLOOK
The equity and credit markets are facing unprecedented challenges. The freezing of liquidity and credit quality and the failure or near-failure of several financial institutions in the United States and Europe created a crisis of confidence not seen in decades. The Federal Reserve Board, US Treasury, Congress and governments worldwide recognize what must be accomplished and are working to restore liquidity and confidence. Furthermore, large equity infusions from private investors are beginning to appear.
With the recent sell-off, the market may have discounted expectations for slower economic growth and lower earnings, and the ingredients for a market bottom seem to be falling into place. We believe negative news on consumer spending, home prices and unemployment is likely to continue, but the market is forward-looking and we think it will begin to discount a brighter future well before there are any concrete signs of improvement.
1
AVERAGE ANNUAL TOTAL RETURNS
Periods Ended September 30, 2008
| | | | | | | | | | |
| 1 Year | | | 5 Years | | | 10 Years | | | Since
Inception | |
| Loomis Sayles Mid Cap Growth: Institutional | |
| -21.12 | % | | 9.88 | % | | 8.64 | % | | 8.36 | % |
| Loomis Sayles Mid Cap Growth: Retail | |
| -21.27 | | | 9.61 | | | 8.35 | | | 8.08 | |
| Russell Midcap Growth Index(c) | |
| -24.65 | | | 6.53 | | | 5.51 | | | 5.86 | |
| Lipper Mid-Cap Growth Funds Index(c) | |
| -24.16 | | | 7.23 | | | 6.01 | | | 5.07 | |
| | | | | | | | |
| Gross expense ratio (before reductions and reimbursements)* |
| Institutional: 1.10% | | Retail: 1.43% | | |
| Net expense ratio (after reductions and reimbursements)* |
| Institutional: 1.00% | | Retail: 1.25% | | |
* As stated in the most recent prospectus
CUMULATIVE PERFORMANCE
Inception to September 30, 2008(a)(b)
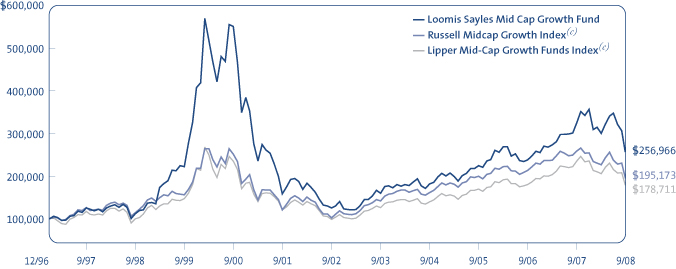
Data quoted reflects past performance and cannot guarantee future results. Average annual total returns assume reinvestment of dividends and capital gain distributions. Investment return and principal value will fluctuate so that shares, when redeemed, may be worth more or less than their original cost. For performance current to the most recent month end, please visit the Loomis Sayles website. Current performance may be higher or lower than quoted.
Returns do not reflect the taxes that a shareholder would pay on fund distributions or the redemption of shares. Periods of less than one year are not annualized. Performance data reflects certain fee reductions and reimbursements, if any, without which performance would be lower.
(a) Cumulative performance is shown for the Institutional Class of Shares. Performance of the Retail Class would be lower due to higher fees. (b) The mountain chart is based on the initial investment minimum of $100,000 for the Institutional Class. (c) See page 7 for a description of the Indices.
WHAT YOU SHOULD KNOW
Small- and mid-cap stocks may be more volatile than larger, more established companies. The secondary market for these stocks may be less liquid, which could adversely impact the Fund’s value. Growth funds involve increased risks, in part, because the value of the underlying securities is based on future expectations that may or may not be met.
The Fund can invest a significant percentage of assets in foreign securities and the value of the fund shares can be adversely affected by changes in currency exchange rates, political, and economic developments. In emerging markets these risks can be significant. The Fund is subject to currency risk, which is the risk that fluctuations in exchange rates between the US dollar and foreign currencies may cause the value of a Fund’s investments to decline. Fund shares should be viewed as a long-term investment.
2
FUND AND MANAGER REVIEW
Loomis Sayles Small Cap Growth Fund

Mark F. Burns, CFA
Manager since January 2005

John Slavik, CFA
Manager since April 2005
FUND FACTS
Symbol | Institutional: LSSIX;
Retail: LCGRX
Objective | Long-term capital growth from investments in common stocks or other equity securities
Strategy | Invests at least 80% of its net assets (plus any borrowings made for investment purposes) in equity securities of companies with market capitalizations that fall within the capitalization range of the Russell 2000 Index. Unlike the Index, the Fund may invest in companies of any size
Fund Inception Date | 12/31/96
Total Net Assets | $124.4 million
PORTFOLIO REVIEW
The Fund slightly underperformed its Benchmark, the Russell 2000 Growth Index, for the fiscal year ended September 30, 2008, primarily due to stock selection in the energy and financial services sectors. The stocks we selected in technology and utilities performed well for the Fund, but not enough to offset poor performance in energy and financial services.
In light of high market volatility, we sought to limit
the Fund’s risk by reducing exposure to the technology, financial services and consumer discretionary sectors. In technology, we trimmed semiconductors, an industry that was experiencing a cyclical slowdown. In financial services, we exited companies exposed to the ongoing credit crisis, and as economic growth prospects dwindled, we reduced the Fund’s consumer discretionary weighting.
On an absolute basis, technology was the largest detractor, followed by consumer discretionary, financial services and energy. Within the financial services sector, Aircastle, an airline leasing company, and National Financial Partners, a financial planning company, experienced earnings shortfalls and both were sold early in the period. The Fund’s position in eHealth declined even though the company’s results met expectations. Investors were hoping for better performance from this internet-based health insurance company. We sold the stock in July. In the energy sector, declining global commodity markets put pricing pressure on many companies, including Mitcham Industries, a seismic equipment leasing company, and Exterran Holdings, which provides oil and gas production and processing facilities worldwide. We sold the stock late in the period.
The only sector that made a positive contribution to absolute performance was consumer staples. Within the sector our selections included bakery company Flowers Foods, which was one of the top-performing stocks during the period, due to strong revenue and earnings growth and its sound expansion strategy. Our position in Petrohawk Energy Corp., an oil and gas exploration and production company, was the Fund’s best-performing stock. Shares spiked after reporting positive natural gas output from a new well and we sold the stock.
OUTLOOK
The equity and credit markets are facing unprecedented challenges. The freezing of liquidity and credit quality and the failure or near-failure of several financial institutions in the United States and Europe created a crisis of confidence not seen in decades. The Federal Reserve Board, US Treasury, Congress and governments worldwide recognize what must be accomplished and are working to restore liquidity and confidence. Furthermore, large equity infusions from private investors are beginning to appear.
3
With the recent sell-off, the market may have discounted expectations for slower economic growth and lower earnings, and the ingredients for a market bottom seem to be falling into place. We believe negative news on consumer spending, home prices and unemployment is likely to continue, but the market is forward-looking and we think it will begin to discount a brighter future well before there are any concrete signs of improvement.
AVERAGE ANNUAL TOTAL RETURNS
Periods ended September 30, 2008
| | | | | | | | | | |
| 1 Year | | | 5 Years | | | 10 Years | | | Since
Inception | |
| Loomis Sayles Small Cap Growth: Institutional | |
| -17.64 | % | | 8.76 | % | | 3.53 | % | | 3.32 | % |
| Loomis Sayles Small Cap Growth: Retail | |
| -17.86 | | | 8.47 | | | 3.27 | | | 3.06 | |
| Russell 2000 Growth Index(c) | |
| -17.07 | | | 6.64 | | | 4.67 | | | 3.27 | |
| Russell 2000 Index(c) | |
| -14.48 | | | 8.15 | | | 7.81 | | | 6.83 | |
| Lipper Small-Cap Growth Funds Index(c) | |
| -23.85 | | | 4.42 | | | 6.32 | | | 4.49 | |
| Gross expense ratio (before reductions and reimbursements)* | |
| Institutional: 1.23% | | | Retail: 1.50% | |
| Net expense ratio (after reductions and reimbursements)* | |
| Institutional: 1.00% | | | Retail: 1.25% | |
* As stated in the most recent prospectus
CUMULATIVE PERFORMANCE
Inception to September 30, 2008(a)(b)
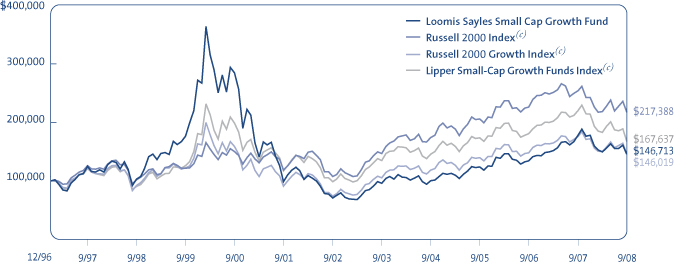
Data quoted reflects past performance and cannot guarantee future results. Average annual total returns assume reinvestment of dividends and capital gains distributions. Investment return and principal value will fluctuate so that shares, when redeemed, may be worth more or less than their original cost. For performance current to the most recent month end, please visit the Loomis Sayles website. Current performance may be higher or lower than quoted.
Returns do not reflect the taxes that a shareholder would pay on fund distributions or the redemption of shares. Periods of less than one year are not annualized. Performance data reflects certain fee reductions and reimbursements, if any, without which performance would be lower.
(a) Cumulative performance is shown for the Institutional Class of Shares. Performance of the Retail Class would be lower due to higher fees. (b) The mountain chart is based on the initial investment minimum of $100,000 for the Institutional Class. (c) See page 7 for a description of the Indices.
WHAT YOU SHOULD KNOW
Small- and mid-cap stocks may be more volatile than larger, more established companies. The secondary market for these stocks may be less liquid, which could adversely impact the Fund’s value. Growth funds involve increased risks, in part, because the value of the underlying securities is based on future expectations that may or may not be met.
The Fund can invest a significant percentage of assets in foreign securities and the value of the fund shares can be adversely affected by changes in currency exchange rates, political, and economic developments. In emerging markets these risks can be significant. The Fund is subject to currency risk, which is the risk that fluctuations in exchange rates between the US dollar and foreign currencies may cause the value of a Fund’s investments to decline. Fund shares should be viewed as a long-term investment.
4
FUND AND MANAGER REVIEW
Loomis Sayles Small Cap Value Fund

Joseph Gatz, CFA
Manager since January 2000

Daniel Thelen, CFA
Manager since April 2000
FUND FACTS
Symbol | Institutional: LSSCX;
Retail: LSCRX; Admin: LSVAX
Objective | Long-term capital growth from investments in common stocks or other equity securities
Strategy | Invests at least 80% of its net assets (plus any borrowings made for investment purposes) in equity securities of companies with market capitalizations that fall within the capitalization range of the Russell 2000 Index. Unlike the Index, the Fund may invest in companies of any size
Fund Inception Date | 5/13/91
Class Inception Date | Institutional: 5/13/91
Retail: 12/31/96
Admin: 1/2/98
Total Net Assets | $1,095.6 million
PORTFOLIO REVIEW
The Fund underperformed its Benchmark, the Russell 2000 Value Index, for the fiscal year ended September 30, 2008, primarily due to stock selection in the energy and financial services sectors.
Our weakest sector during the fiscal year was financial services, which represented the most heavily weighted sector within the Benchmark and which declined over 17% during the period. Weakness in financial services was driven by continued deterioration in credit trends within the banking industry and highly risk-averse behavior on the part of lenders, which resulted in a lack of liquidity throughout the credit markets. In addition, certain financial services holdings disappointed from a fundamental perspective. National Financial Partners, a distributor of financial services products to small- and medium-sized businesses and individuals, reported a shortfall to organic growth and was eliminated from the Portfolio in March 2008. Advanta Corp., a provider of credit cards and related products to small- and medium-sized businesses, sold off sharply on concerns over increasing losses as a result of deteriorating credit trends throughout the US economy. We shared those concerns and exited our position during the fourth quarter of 2007.
Consumer discretionary stocks were also weak during the period, as housing prices fell, employment trends worsened and food and gasoline prices moved higher. While our consumer stocks declined during the period, our strategy of seeking out company-specific catalysts resulted in favorable stock selection, which offset some of the impact of sector weakness. These negative trends were also partially offset by timely additions to “early-cycle” transportation stocks, such as Ryder System, Inc. and Hub Group, Inc. late in 2007, as well as an increase in the Fund’s healthcare weighting. Healthcare proved resilient from overall market weakness. The Fund’s two best- performing healthcare holdings were Perrigo Co., a manufacturer of store-brand, over-the-counter pharmaceuticals; and Atlanta-based Sciele Pharma, a branded pharmaceutical company that was acquired by a Japanese drug manufacturer at a substantial premium. The Fund’s top performers in consumer staples included Ralcorp Holdings, a private label cereal manufacturer; and Spartan Stores, a Midwestern grocery and food distribution chain.
As US and global economic growth prospects deteriorated throughout the period, we adopted a somewhat more defensive posture for the Fund, increasing its weighting in healthcare and reducing positions in producer durables and technology. We also increased the Fund’s weighting in consumer discretionary stocks; this sector has often been early in discounting economic recoveries.
OUTLOOK
In these volatile markets—with fundamental challenges in the banking industry, capital markets and the global economy—the importance of a steady, time-tested investment strategy has never been greater. While in recent months the markets have seemed to act irrationally at times, our team is committed to understanding risks and unearthing opportunities in the current market while balancing capital preservation and long term capital gain
5
prospects. Our approach continues to emphasize bottom-up stock selection to drive performance, as opposed to sector rotation or asset allocation. Our focus remains on what appear to be fundamentally sound, small companies with valuations that we believe do not reflect fair value of the enterprise. In selecting stocks for the Fund, we look for companies with strong market niches, solid cash flow, balance sheet support, attractive valuations and a catalyst for improvement. Although we think economic news is likely to remain difficult for some time, stock prices are a discounting mechanism, and at some point we believe they will begin to anticipate restoration of stability in the capital markets and a resumption of economic growth. In the meantime, we will rely on our strategy to guide us through and we look forward to better markets ahead.
AVERAGE ANNUAL TOTAL RETURNS
Periods ended September 30, 2008
| | | | | | | | |
| 1 Year | | | 5 Years | | | 10 Years | | Since
Inception(a)(b) |
| Loomis Sayles Small Cap Value: Institutional |
| -15.02 | % | | 10.07 | % | | 10.63% | | 13.05% |
| Loomis Sayles Small Cap Value: Retail(a) |
| -15.21 | | | 9.79 | | | 10.35 | | 12.85 |
| Loomis Sayles Small Cap Value: Admin(a) |
| -15.44 | | | 9.51 | | | 10.06 | | 12.50 |
| Russell 2000 Value Index(c) |
| -12.25 | | | 9.45 | | | 10.14 | | 12.50 |
Russell 2000 Index(c)
|
| -14.48 | | | 8.15 | | | 7.81 | | 9.77 |
| Lipper Small-Cap Core Funds Index(b)(c) |
| -17.21 | | | 7.94 | | | 8.85 | | N/A |
| | | | | | | | |
| Gross expense ratio (before reductions and reimbursements)* |
| Institutional: 0.89% | | Retail: 1.24% | | Admin: 1.57% |
| Net expense ratio (after reductions and reimbursements)* |
| Institutional: 0.89% | | Retail: 1.16% | | Admin: 1.41% |
* As stated in the most recent prospectus
CUMULATIVE PERFORMANCE
Inception to September 30, 2008(d)(e)
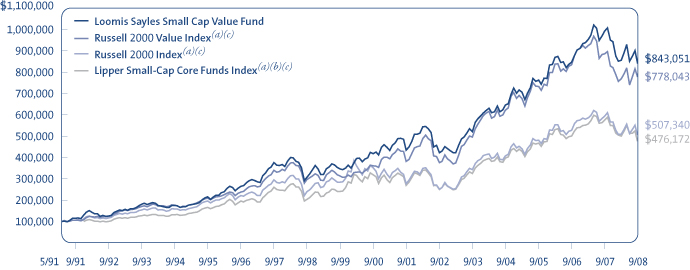
Data quoted reflects past performance and cannot guarantee future results. Average annual total returns assume reinvestment of dividends and capital gains distributions. Investment return and principal value will fluctuate so that shares, when redeemed, may be worth more or less than their original cost. For performance current to the most recent month end, please visit the Loomis Sayles website. Current performance may be higher or lower than quoted.
Returns do not reflect the taxes that a shareholder would pay on fund distributions or the redemption of shares. Periods of less than one year are not annualized. Performance data reflects certain fee reductions and reimbursements, if any, without which performance would be lower.
(a) Performance shown for periods prior to the inception date of the Retail Class (12/31/96) and Admin Class (1/02/98) represents the performance of the Institutional Class of shares during the periods shown, adjusted to reflect current levels of 12b-1 fees payable by the respective Classes. Since index performance data is not available coincident with the Fund’s inception date, the beginning value of the index is the value as of the month end closest to the Fund’s inception date. (b) The Lipper Small-Cap Core Funds Index performance data is not available prior to January 1, 1992. (c) See page 7 for a description of the Indices. (d) Cumulative performance is shown for the Institutional Class of Shares. Performance of the Retail and Admin Classes would be lower due to higher fees and expenses. (e) The mountain chart is based on the initial investment minimum of $100,000 for the Institutional Class.
WHAT YOU SHOULD KNOW
Value stocks may fall out of favor with investors and underperform the overall equity market during any given period. Small- and mid-cap stocks may be more volatile than larger, more established companies. The secondary market for these stocks may be less liquid, which could adversely impact the Fund’s value. Foreign investments involve special risks, including greater economic, political and currency fluctuation risks, which may be even greater in emerging markets. Foreign countries may have different accounting standards than US standards.
The Fund can invest a significant percentage of assets in foreign securities and the value of the fund shares can be adversely affected by changes in currency exchange rates, political, and economic developments. In emerging markets these risks can be significant. The Fund is subject to currency risk, which is the risk that fluctuations in exchange rates between the US dollar and foreign currencies may cause the value of a Fund’s investments to decline. Fund shares should be viewed as a long-term investment.
6
ADDITIONAL INFORMATION
Index Definitions
Indexes are unmanaged and do not have expenses that affect results, unlike mutual funds. Index returns are adjusted for the reinvestment of capital gain distributions and income dividends. It is not possible to invest directly in an index.
Lipper Mid-Cap Growth Funds Index is an equally weighted index of typically the 30 largest mutual funds within the mid-cap growth funds investment objective.
Lipper Small-Cap Core Funds Index is an equally weighted index of typically the 30 largest mutual funds within the small-cap core funds investment objective.
Lipper Small-Cap Growth Funds Index is an equally weighted index of typically the 30 largest mutual funds within the small-cap growth funds investment objective.
Source: Lipper, Inc.
Russell Midcap Growth Index is a market capitalization weighted index of medium capitalization stocks determined by Russell to be growth stocks as measured by their price-to-book ratios and forecasted growth values. The stocks are also members of the Russell 1000 Growth Index.
Russell 2000 Growth Index is an index comprised of those Russell 2000 companies with higher price-to-book ratios and higher forecasted growth values.
Russell 2000 Index is an index comprised of the 2,000 smallest companies in the Russell 3000 Index (a broad market index), representing approximately 8% of the Russell 3000 total market capitalization.
Russell 2000 Value Index is an index comprised of those Russell 2000 companies with lower price-to-book ratios and lower forecasted growth values.
After-Tax Returns
After-tax returns are calculated using the historical highest individual federal marginal income tax rates and do not reflect the impact of state and local taxes. Actual after-tax returns depend on an investor’s tax situation and may differ from those shown. After-tax returns shown are not relevant to investors who hold their shares through tax-deferred arrangements, such as 401(k) plans, qualified plans, education savings accounts or individual retirement accounts. Under certain circumstances, the addition of the tax benefits from capital losses resulting from redemptions may cause the return after taxes on distributions and sale of fund shares to be greater than the return after taxes on distributions or even the return before taxes.
Proxy Voting Information
A description of the Funds’ proxy voting policies and procedures is available without charge, upon request, (i) by calling Loomis Sayles at 800-633-3330; (ii) on the Funds’ website, www.loomissayles.com, and (iii) on the SEC’s website, www.sec.gov. Information about how the Funds voted proxies relating to portfolio securities during the 12 months ended June 30, 2008 is available on (i) the Funds’ website and (ii) the SEC’s website.
Quarterly Portfolio Schedules
The Funds file a complete schedule of portfolio holdings with the SEC for the first and third quarters of each fiscal year on Form N-Q. The Funds’ Forms N-Q are available on the SEC’s website at www.sec.gov and may be reviewed and copied at the SEC’s Public Reference Room in Washington, DC. Information on the operation of the Public Reference Room may be obtained by calling 800-SEC-0330.
UNDERSTANDING YOUR FUND’S EXPENSES
As a mutual fund shareholder you incur two types of costs: (1) transaction costs, including redemption fees and certain exchange fees; and (2) ongoing costs, including management fees, distribution and/or service fees (12b-1 fees), and other Fund expenses. These costs are described in more detail in the Funds’ prospectus. The examples below are intended to help you understand the ongoing costs of investing in the Funds and help you compare these with the ongoing costs of investing in other mutual funds.
The first line in the table of each Fund shows the actual amount of Fund expenses you would have paid on a $1,000 investment in the Fund from April 1, 2008 through September 30, 2008. It also shows how much a $1,000 investment would be worth at the close of the period, assuming actual fund returns and expenses. To estimate the expenses you paid over the period, simply divide your account value by $1,000 (for example $8,600 account value divided by $1,000 = 8.6) and multiply the result by the number in the Expenses Paid During the Period column as shown below for your class.
The second line in the table of each Fund provides information about hypothetical account values and hypothetical expenses based on the Fund’s actual expense ratios and an assumed rate of return of 5% per year before expenses, which is not the Fund’s actual return. The hypothetical account values and expenses may not be used to estimate the actual ending account balance or expenses you paid on your investment for the period. You may use this information to compare the ongoing costs of investing in the Funds and other funds. To do so, compare this 5% hypothetical example with the 5% hypothetical examples that appear in the shareholder reports of other funds.
7
Please note that the expenses shown reflect ongoing costs only, and do not include any transaction costs. Therefore, the second line in the table is useful in comparing ongoing costs only, and will not help you determine the relative costs of owning different funds. If transaction costs were included, total costs would be higher.
Loomis Sayles Mid Cap Growth Fund
| | | | | | |
| Institutional Class | | Beginning
Account Value
4/1/2008 | | Ending
Account Value
9/30/2008 | | Expenses Paid
During Period*
4/1/2008 – 9/30/2008 |
Actual | | $1,000.00 | | $ 855.00 | | $4.64 |
Hypothetical (5% return before expenses) | | $1,000.00 | | $1,020.00 | | $5.05 |
| | | |
Retail Class | | | | | | |
Actual | | $1,000.00 | | $ 854.40 | | $5.80 |
Hypothetical (5% return before expenses) | | $1,000.00 | | $1,018.75 | | $6.31 |
* Expenses are equal to the Fund’s annualized expense ratio (after fee reduction/reimbursement): 1.00% and 1.25% for the Institutional and Retail Class, respectively, multiplied by the average account value over the period, multiplied by the number of days in the most recent fiscal half-year, divided by 366 (to reflect the half-year period). |
Loomis Sayles Small Cap Growth Fund
| | | | | | |
| Institutional Class | | Beginning
Account Value
4/1/2008 | | Ending
Account Value
9/30/2008 | | Expenses Paid
During Period*
4/1/2008 – 9/30/2008 |
Actual | | $1,000.00 | | $ 977.60 | | $4.94 |
Hypothetical (5% return before expenses) | | $1,000.00 | | $1,020.00 | | $5.05 |
| | | |
Retail Class | | | | | | |
Actual | | $1,000.00 | | $ 976.20 | | $6.18 |
Hypothetical (5% return before expenses) | | $1,000.00 | | $1,018.75 | | $6.31 |
* Expenses are equal to the Fund’s annualized expense ratio (after advisory reduction/reimbursement): 1.00% and 1.25% for Institutional and Retail Class, respectively, multiplied by the average account value over the period, multiplied by the number of days in the most recent fiscal half-year, divided by 366 (to reflect the half-year period). |
Loomis Sayles Small Cap Value Fund
| | | | | | |
Institutional Class | | Beginning
Account Value
4/1/2008 | | Ending
Account Value
9/30/2008 | | Expenses Paid
During Period*
4/1/2008 – 9/30/2008 |
Actual | | $1,000.00 | | $ 985.20 | | $4.52 |
Hypothetical (5% return before expenses) | | $1,000.00 | | $1,020.45 | | $4.60 |
| | | |
Retail Class | | | | | | |
Actual | | $1,000.00 | | $ 984.20 | | $5.70 |
Hypothetical (5% return before expenses) | | $1,000.00 | | $1,019.25 | | $5.81 |
| | | |
Admin Class | | | | | | |
Actual | | $1,000.00 | | $ 983.00 | | $6.94 |
Hypothetical (5% return before expenses) | | $1,000.00 | | $1,018.00 | | $7.06 |
* Expenses are equal to the Fund’s annualized expense ratio (after fee reduction/reimbursement): 0.91%, 1.15% and 1.40% for Institutional, Retail and Admin Class, respectively, multiplied by the average account value over the period, multiplied by the number of days in the most recent fiscal half-year, divided by 366 (to reflect the half-year period). |
8
BOARD APPROVAL OF THE EXISTING ADVISORY AGREEMENTS
The Board of Trustees, including the Independent Trustees, considers matters bearing on each Fund’s advisory agreement (collectively, the “Agreements”) at most of its meetings throughout the year. Each year, usually in the spring, the Contract Review and Governance Committee of the Board meets to review the Agreements to determine whether to recommend that the full Board approve the continuation of the Agreements, typically for an additional one-year period. After the Committee has made its recommendation, the full Board, including the Independent Trustees, determines whether to approve the continuation of the Agreements.
In connection with these meetings, the Trustees receive materials that the Funds’ investment adviser believe to be reasonably necessary for the Trustees to evaluate the Agreements. These materials generally include, among other items, (i) information on the investment performance of the Funds and the performance of peer groups of funds and the Funds’ performance benchmarks, (ii) information on the Funds’ advisory fees, and other expenses, including information comparing the Funds’ expenses to those of peer groups of funds and information about any applicable expense caps and fee “breakpoints,” (iii) sales and redemption data in respect of the Funds, (iv) information about the profitability of the Agreements to the Funds’ adviser (the “Adviser”), and (v) information obtained through the completion of a questionnaire by the Adviser (the Trustees are consulted as to the information requested through that questionnaire). The Board of Trustees, including the Independent Trustees, also consider other matters such as (i) the Adviser’s financial results and financial condition, (ii) each Fund’s investment objective and strategies and the size, education and experience of the Adviser’s respective investment staffs and their use of technology, external research and trading cost measurement tools, (iii) arrangements in respect of the distribution of the Funds’ shares and the related costs, (iv) the procedures employed to determine the value of the Funds’ assets, (v) the allocation of the Funds’ brokerage, if any, including allocations to brokers affiliated with the Adviser and the use of “soft” commission dollars to pay Fund expenses and to pay for research and other similar services, (vi) the resources devoted to, and the record of compliance with, the Funds’ investment policies and restrictions, policies on personal securities transactions and other compliance policies, and (vii) the general economic outlook with particular emphasis on the mutual fund industry. Throughout the process, the Trustees are afforded the opportunity to ask questions of and request additional materials from the Adviser.
In addition to the materials requested by the Trustees in connection with the annual consideration of the continuation of the Agreements, the Trustees receive materials in advance of each regular quarterly meeting of the Board of Trustees that provide detailed information about the Funds’ investment performance and the fees charged to the Funds for advisory and other services. This information generally includes, among other things, an internal performance rating for each Fund based on agreed-upon criteria, graphs showing performance and fee differentials against each Fund’s peer group, performance ratings provided by a third-party, total return information for various periods, and third-party performance rankings for various periods comparing a Fund against its peer group. The portfolio management team for each Fund makes periodic presentations to the Contract Review and Governance Committee and/or the full Board of Trustees, and Funds identified as presenting possible performance concerns may be subject to more frequent board presentations and reviews. In addition, each quarter the Trustees are provided with detailed statistical information about each Fund’s portfolio.
The Board of Trustees most recently approved the continuation of the Agreements at their meeting held in June, 2008. The Agreements were continued for a one-year period for all Funds. In considering whether to approve the continuation of the Agreements, the Board of Trustees, including the Independent Trustees, did not identify any single factor as determinative. Matters considered by the Trustees, including the Independent Trustees, in connection with their approval of the Agreements included the following:
The nature, extent and quality of the services provided to the Funds under the Agreements. The Trustees considered the nature, extent and quality of the services provided by the Adviser and its affiliates to the Funds and the resources dedicated to the Funds by the Adviser and its affiliates, including recent or planned investments by certain of the Adviser in additional personnel or other resources. They also took note of the competitive market for talented personnel, in particular, for personnel who have contributed to the generation of strong investment performance. They considered the need for the Adviser to offer competitive compensation in order to attract and retain capable personnel. They also considered the administrative services provided by Natixis Advisors and its affiliates to the Funds.
For each Fund, the Trustees also considered the benefits to shareholders of investing in a mutual fund that is part of a family of funds that offers shareholders the right to exchange shares of one type of fund for shares of another type of fund, and provides a variety of fund and shareholder services.
After reviewing these and related factors, the Trustees concluded, within the context of their overall conclusions regarding each of the Agreements, that the nature, extent and quality of services provided supported the renewal of the Agreements.
Investment performance of the Funds and the Adviser. As noted above, the Trustees received information about the performance of the Funds over various time periods, including information which compared the performance of the Funds to the performance of peer groups of funds and the Funds’ respective performance benchmarks. In addition, the Trustees also reviewed data prepared by an independent third party which analyzed the performance of the Funds using a variety of performance metrics, including metrics which also measured the performance of the Funds on a risk adjusted basis.
9
With respect to each Fund, the Board concluded that the Fund’s performance or other relevant factors supported the renewal of the Agreement relating to that Fund. In the case of each Fund that had performance that lagged that of a relevant peer group for certain (although not necessarily all) periods, the Board concluded that other factors relevant to performance supported renewal of the Funds’ Agreements. These factors varied from Fund to Fund, including that reductions in the Funds’ expense levels resulting from decreased expenses and/or increased assets were not yet fully reflected in the Funds’ performance results.
The Trustees also considered the Adviser’s performance and reputation generally, the Funds’ performance as a fund family generally (as noted by certain financial publications), and the historical responsiveness of the Adviser to Trustee concerns about performance and the willingness of the Adviser to take steps intended to improve performance.
After reviewing these and related factors, the Trustees concluded, within the context of their overall conclusions regarding each of the Agreements, that the performance of the Funds and the Adviser supported the renewal of the Agreements.
The costs of the services to be provided and profits to be realized by the Adviser and its affiliates from their respective relationships with the Funds. The Trustees considered the fees charged to the Funds for advisory services as well as the total expense levels of the Funds. This information included comparisons (provided both by management and also by an independent third party) of the Funds’ advisory fees and total expense levels to those of their peer groups and information about the advisory fees charged by the Adviser to comparable accounts. In considering the fees charged to comparable accounts, the Trustees considered, among other things, management’s representations about the differences between managing mutual funds as compared to other types of accounts, including the additional resources required to effectively manage mutual fund assets. In evaluating each Funds advisory fees, the Trustees also took into account the demands, complexity and quality of the investment management of such Fund. The Trustees considered that over the past several years, management had made recommendations regarding reductions in advisory fee rates, implementation of advisory fee breakpoints and the institution of advisory fee waivers and expense caps. They noted that all of the Loomis Sayles Funds in this report have expense caps in place, and they considered the amounts waived or reimbursed by the Adviser under these caps.
The Trustees also considered the compensation directly or indirectly received by the Adviser and its affiliates from their relationships with the Funds. The Trustees reviewed information provided by management as to the profitability of the Adviser and its affiliates’ relationships with the Funds, and information about the allocation of expenses used to calculate profitability. They also reviewed information provided by management about the effect of distribution costs and Fund growth on Adviser profitability, including information regarding resources spent on distribution activities and the increase in net sales for the family of funds. When reviewing profitability, the Trustees also considered information about court cases in which adviser profitability was an issue, the performance of the relevant Funds, the expense levels of the Funds, and whether the Adviser had implemented breakpoints and/or expense caps with respect to such Funds.
After reviewing these and related factors, the Trustees concluded, within the context of their overall conclusions regarding each of the Agreements, that the advisory fees charged to each of the Funds were fair and reasonable, and that the costs of these services generally and the related profitability of the Adviser and its affiliates in respect of their relationships with the Funds supported the renewal of the Agreements.
Economies of Scale. The Trustees considered the existence of any economies of scale in the provision of services by the Adviser and whether those economies are shared with the Funds through breakpoints in their investment advisory fees or other means, such as expense waivers. The Trustees noted that each of the Funds was subject to expense caps. In considering these issues, the Trustees also took note of the costs of the services provided (both on an absolute and a relative basis) and the profitability to the Adviser and its affiliates of their relationships with the Funds, as discussed above.
After reviewing these and related factors, the Trustees considered, within the context of their overall conclusions regarding each of the Agreements, that the extent to which economies of scale were shared with the Funds supported the renewal of the Agreements.
The Trustees also considered other factors, which included but were not limited to the following:
| • | | whether each Fund has operated in accordance with its investment objective and the Fund’s record of compliance with its investment restrictions, and the compliance programs of the Funds and the Adviser. They also considered the compliance-related resources the Adviser and its affiliates were providing to the Funds. |
| • | | the nature, quality, cost and extent of administrative and shareholder services performed by the Adviser and its affiliates, both under the Agreements and under separate agreements covering administrative services. |
| • | | so-called “fallout benefits” to the Adviser, such as the engagement of affiliates of the Adviser to provide distribution, administrative and brokerage services to the Funds, and the benefits of research made available to the Adviser by reason of brokerage commissions generated by the Funds’ securities transactions. The Trustees also considered the fact that Natixis Advisors’ parent company benefits from the retention of affiliated Adviser. The Trustees considered the possible conflicts of interest associated with these fallout and other benefits, and the reporting, disclosure and other processes in place to disclose and monitor such possible conflicts of interest. |
Based on their evaluation of all factors that they deemed to be material, including those factors described above, and assisted by the advice of independent counsel, the Trustees, including the Independent Trustees, concluded that each of the existing advisory agreements should be continued through June 30, 2009.
10
PORTFOLIO OF INVESTMENTS – as of September 30, 2008
Loomis Sayles Mid Cap Growth Fund
| | | | | | | |
| | | | | Shares | | Value (†) |
| | | | | | | |
| | | |
| COMMON STOCKS – 93.6% of Net Assets | | | | | | | |
| | | |
| Biotechnology – 4.4% | | | | | | | |
Alexion Pharmaceuticals, Inc.(b)(c) | | | | 45,054 | | $ | 1,770,622 |
Myriad Genetics, Inc.(b)(c) | | | | 41,167 | | | 2,670,915 |
Onyx Pharmaceuticals, Inc.(b)(c) | | | | 54,868 | | | 1,985,124 |
| | | | | | | |
| | | | | | | 6,426,661 |
| | | | | | | |
| Capital Markets – 1.7% | | | | | | | |
T. Rowe Price Group, Inc.(b) | | | | 46,683 | | | 2,507,344 |
| | | | | | | |
| Commercial Banks – 2.0% | | | | | | | |
SVB Financial Group(c) | | | | 51,729 | | | 2,996,144 |
| | | | | | | |
| Commercial Services & Supplies – 5.3% | | | | | | | |
Stericycle, Inc.(c) | | | | 91,839 | | | 5,410,235 |
Waste Connections, Inc.(c) | | | | 67,930 | | | 2,329,999 |
| | | | | | | |
| | | | | | | 7,740,234 |
| | | | | | | |
| Communications Equipment – 1.4% | | | | | | | |
Juniper Networks, Inc.(b)(c) | | | | 98,016 | | | 2,065,197 |
| | | | | | | |
| Diversified Consumer Services – 1.6% | | | | | | | |
New Oriental Education & Technology Group, Inc., Sponsored ADR(c) | | | | 36,348 | | | 2,334,996 |
| | | | | | | |
| Diversified Financial Services – 1.6% | | | | | | | |
Nasdaq OMX Group, Inc. (The)(c) | | | | 74,728 | | | 2,284,435 |
| | | | | | | |
| Electrical Equipment – 1.0% | | | | | | | |
First Solar, Inc.(c) | | | | 7,532 | | | 1,422,870 |
| | | | | | | |
| Electronic Equipment & Instruments – 2.1% | | | | | | | |
Mettler-Toledo International, Inc.(c) | | | | 31,996 | | | 3,135,608 |
| | | | | | | |
| Energy Equipment & Services – 1.5% | | | | | | | |
Core Laboratories N.V.(b) | | | | 21,550 | | | 2,183,446 |
| | | | | | | |
| Food & Staples Retailing – 2.3% | | | | | | | |
BJ’s Wholesale Club, Inc.(b)(c) | | | | 85,505 | | | 3,322,724 |
| | | | | | | |
| Food Products – 1.6% | | | | | | | |
H.J. Heinz Co. | | | | 48,333 | | | 2,415,200 |
| | | | | | | |
| Health Care Equipment & Supplies – 11.9% | | | | | | | |
C.R. Bard, Inc.(b) | | | | 33,288 | | | 3,158,032 |
IDEXX Laboratories, Inc.(b)(c) | | | | 64,257 | | | 3,521,283 |
Intuitive Surgical, Inc.(c) | | | | 10,450 | | | 2,518,241 |
Masimo Corp.(b)(c) | | | | 45,413 | | | 1,689,364 |
NuVasive, Inc.(b)(c) | | | | 62,090 | | | 3,062,900 |
Varian Medical Systems, Inc.(c) | | | | 60,431 | | | 3,452,423 |
| | | | | | | |
| | | | | | | 17,402,243 |
| | | | | | | |
| Hotels, Restaurants & Leisure – 1.0% | | | | | | | |
Yum! Brands, Inc.(b) | | | | 44,822 | | | 1,461,645 |
| | | | | | | |
| Household Products – 1.9% | | | | | | | |
Church & Dwight Co., Inc. | | | | 44,503 | | | 2,763,191 |
| | | | | | | |
| Internet Software & Services – 2.2% | | | | | | | |
Equinix, Inc.(b)(c) | | | | 30,263 | | | 2,102,068 |
Websense, Inc.(c) | | | | 50,877 | | | 1,137,101 |
| | | | | | | |
| | | | | | | 3,239,169 |
| | | | | | | |
11
| | | | | | | |
| | | | | Shares | | Value (†) |
| | | | | | | |
| | | |
| COMMON STOCKS – continued | | | | | | | |
| | | |
| IT Services – 1.5% | | | | | | | |
MasterCard, Inc., Class A(b) | | | | 12,645 | | $ | 2,242,338 |
| | | | | | | |
| Life Sciences Tools & Services – 4.7% | | | | | | | |
Covance, Inc.(c) | | | | 25,555 | | | 2,259,317 |
Illumina, Inc.(c) | | | | 113,026 | | | 4,580,944 |
| | | | | | | |
| | | | | | | 6,840,261 |
| | | | | | | |
| Machinery – 1.9% | | | | | | | |
Wabtec Corp. | | | | 53,511 | | | 2,741,369 |
| | | | | | | |
| Multiline Retail – 3.0% | | | | | | | |
Dollar Tree, Inc.(c) | | | | 122,756 | | | 4,463,408 |
| | | | | | | |
| Oil, Gas & Consumable Fuels – 7.4% | | | | | | | |
Continental Resources, Inc.(b)(c) | | | | 61,970 | | | 2,431,083 |
Petrohawk Energy Corp.(c) | | | | 138,444 | | | 2,994,544 |
Range Resources Corp. | | | | 59,742 | | | 2,561,140 |
Whiting Petroleum Corp.(c) | | | | 39,271 | | | 2,798,451 |
| | | | | | | |
| | | | | | | 10,785,218 |
| | | | | | | |
| Personal Products – 3.5% | | | | | | | |
Alberto-Culver Co. | | | | 94,169 | | | 2,565,164 |
Avon Products, Inc. | | | | 60,962 | | | 2,534,190 |
| | | | | | | |
| | | | | | | 5,099,354 |
| | | | | | | |
| Road & Rail – 4.4% | | | | | | | |
J.B. Hunt Transport Services, Inc. | | | | 67,140 | | | 2,240,462 |
Kansas City Southern(b)(c) | | | | 94,065 | | | 4,172,723 |
| | | | | | | |
| | | | | | | 6,413,185 |
| | | | | | | |
| Software – 7.1% | | | | | | | |
Activision Blizzard, Inc.(c) | | | | 153,845 | | | 2,373,829 |
Ansys, Inc.(c) | | | | 42,013 | | | 1,591,032 |
Concur Technologies, Inc.(b)(c) | | | | 61,943 | | | 2,369,939 |
McAfee, Inc.(b)(c) | | | | 74,693 | | | 2,536,574 |
Solera Holdings, Inc.(c) | | | | 55,348 | | | 1,589,595 |
| | | | | | | |
| | | | | | | 10,460,969 |
| | | | | | | |
| Specialty Retail – 11.7% | | | | | | | |
Advance Auto Parts, Inc. | | | | 62,637 | | | 2,484,184 |
Aeropostale, Inc.(b)(c) | | | | 81,494 | | | 2,616,772 |
Buckle, Inc. (The)(b) | | | | 57,650 | | | 3,201,881 |
Guess?, Inc. | | | | 65,453 | | | 2,277,110 |
Ross Stores, Inc. | | | | 115,995 | | | 4,269,776 |
Urban Outfitters, Inc.(b)(c) | | | | 70,985 | | | 2,262,292 |
| | | | | | | |
| | | | | | | 17,112,015 |
| | | | | | | |
| Thrifts & Mortgage Finance – 1.5% | | | | | | | |
Hudson City Bancorp, Inc. | | | | 120,877 | | | 2,230,181 |
| | | | | | | |
| Trading Companies & Distributors – 1.7% | | | | | | | |
Fastenal Co.(b) | | | | 50,056 | | | 2,472,266 |
| | | | | | | |
| Wireless Telecommunication Services – 1.7% | | | | | | | |
American Tower Corp., Class A(c) | | | | 67,849 | | | 2,440,529 |
| | | | | | | |
| | | |
| TOTAL COMMON STOCKS | | | | | | | |
(Identified Cost $148,324,626) | | | | | | | 137,002,200 |
| | | | | | | |
12
PORTFOLIO OF INVESTMENTS – as of September 30, 2008
Loomis Sayles Mid Cap Growth Fund – continued
| | | | | | | | |
| | | | | Shares/
Principal Amount | | Value (†) |
| | | | | | | | |
| | | |
| SHORT-TERM INVESTMENTS – 21.8% | | | | | | | | |
State Street Navigator Securities Lending Prime Portfolio(d) | | | | | 22,705,247 | | $ | 22,705,247 |
| Tri-Party Repurchase Agreement with Fixed Income Clearing Corporation, dated 9/30/2008 at 1.300% to be repurchased at $9,112,329 on 10/01/2008 collateralized by $9,500,000 Federal Home Loan Bank Discount Notes, Zero Coupon due 7/13/2009 valued at $9,298,125, including accrued interest (Note 2g Notes to Financial Statements) | | | | $ | 9,112,000 | | | 9,112,000 |
| | | | | | | | |
| | | |
| TOTAL SHORT-TERM INVESTMENTS | | | | | | | | |
(Identified Cost $31,817,247) | | | | | | | | 31,817,247 |
| | | | | | | | |
| | | |
| TOTAL INVESTMENTS – 115.4% | | | | | | | | |
(Identified Cost $180,141,873)(a) | | | | | | | | 168,819,447 |
Other assets less liabilities—(15.4)% | | | | | | | | (22,516,104) |
| | | | | | | | |
| | | |
| NET ASSETS – 100.0% | | | | | | | $ | 146,303,343 |
| | | | | | | | |
| | | |
(†) See Note 2a of Notes to Financial Statements. | | | | | | | | |
(a) Federal Tax Information: | | | | | | | | |
At September 30, 2008, the net unrealized depreciation on investments based on a cost of $180,443,243 for federal income tax purposes was as follows: | | | |
Aggregate gross unrealized appreciation for all investments in which there is an excess of value over tax cost | | $ | 1,762,223 |
Aggregate gross unrealized depreciation for all investments in which there is an excess of tax cost over value | | | (13,386,019) |
| | | | | | | | |
Net unrealized depreciation | | | | | | | $ | (11,623,796) |
| | | | | | | | |
| (b) | All or a portion of this security was on loan to brokers at September 30, 2008. |
| (c) | Non-income producing security. |
| (d) | Represents investment of securities lending collateral. |
| ADR | An American Depositary Receipt is a certificate issued by a custodian bank representing the right to receive securities of the foreign issuer described. The values of ADRs are significantly influenced by trading on exchanges not located in the United States. |
NET ASSET SUMMARY AT SEPTEMBER 30, 2008 (Unaudited)
| | | |
Health Care Equipment & Supplies | | 11.9 | % |
Specialty Retail | | 11.7 | |
Oil, Gas & Consumable Fuels | | 7.4 | |
Software | | 7.1 | |
Commercial Services & Supplies | | 5.3 | |
Life Sciences Tools & Services | | 4.7 | |
Biotechnology | | 4.4 | |
Road & Rail | | 4.4 | |
Personal Products | | 3.5 | |
Multiline Retail | | 3.0 | |
Food & Staples Retailing | | 2.3 | |
Internet Software & Services | | 2.2 | |
Electronic Equipment & Instruments | | 2.1 | |
Commercial Banks | | 2.0 | |
Other Investments, less than 2% each | | 21.6 | |
Short-Term Investments | | 21.8 | |
| | | |
Total Investments | | 115.4 | |
Other assets less liabilities | | (15.4 | ) |
| | | |
Net Assets | | 100.0 | % |
| | | |
See accompanying notes to financial statements.
13
PORTFOLIO OF INVESTMENTS – as of September 30, 2008
Loomis Sayles Small Cap Growth Fund
| | | | | | | |
| | | | | Shares | | Value (†) |
| | | | | | | |
| | | |
| COMMON STOCKS – 97.8% of Net Assets | | | | | | | |
| | | |
| Aerospace & Defense – 3.1% | | | | | | | |
Curtiss-Wright Corp.(b) | | | | 29,192 | | $ | 1,326,776 |
Moog, Inc., Class A(b)(c) | | | | 24,085 | | | 1,032,765 |
Orbital Sciences Corp.(c) | | | | 59,926 | | | 1,436,426 |
| | | | | | | |
| | | | | | | 3,795,967 |
| | | | | | | |
| Biotechnology – 2.9% | | | | | | | |
BioMarin Pharmaceutical, Inc.(b)(c) | | | | 32,188 | | | 852,660 |
Isis Pharmaceuticals, Inc.(b)(c) | | | | 51,044 | | | 862,133 |
Rigel Pharmaceuticals, Inc.(b)(c) | | | | 41,462 | | | 968,138 |
United Therapeutics Corp.(b)(c) | | | | 8,992 | | | 945,689 |
| | | | | | | |
| | | | | | | 3,628,620 |
| | | | | | | |
| Capital Markets – 1.1% | | | | | | | |
Stifel Financial Corp.(b)(c) | | | | 27,832 | | | 1,388,817 |
| | | | | | | |
| Commercial Banks – 2.3% | | | | | | | |
PrivateBankcorp, Inc.(b) | | | | 25,892 | | | 1,078,661 |
Signature Bank(c) | | | | 24,523 | | | 855,362 |
Westamerica Bancorporation(b) | | | | 15,272 | | | 878,598 |
| | | | | | | |
| | | | | | | 2,812,621 |
| | | | | | | |
| Commercial Services & Supplies – 9.4% | | | | | | | |
Clean Harbors, Inc.(b)(c) | | | | 23,450 | | | 1,584,047 |
FTI Consulting, Inc.(c) | | | | 22,966 | | | 1,659,064 |
Geo Group, Inc. (The)(b)(c) | | | | 59,324 | | | 1,198,938 |
Hill International, Inc.(c) | | | | 87,150 | | | 1,207,028 |
ICF International, Inc.(b)(c) | | | | 85,065 | | | 1,680,034 |
Innerworkings, Inc.(b)(c) | | | | 100,054 | | | 1,109,599 |
Team, Inc.(b)(c) | | | | 41,082 | | | 1,483,882 |
Waste Connections, Inc.(b)(c) | | | | 52,371 | | | 1,796,325 |
| | | | | | | |
| | | | | | | 11,718,917 |
| | | | | | | |
| Communications Equipment – 2.9% | | | | | | | |
Brocade Communications Systems, Inc.(c) | | | | 124,997 | | | 727,482 |
DG FastChannel, Inc.(b)(c) | | | | 71,034 | | | 1,557,065 |
Foundry Networks, Inc.(c) | | | | 75,722 | | | 1,378,898 |
| | | | | | | |
| | | | | | | 3,663,445 |
| | | | | | | |
| Construction & Engineering – 1.9% | | | | | | | |
MasTec, Inc.(c) | | | | 66,152 | | | 879,160 |
Northwest Pipe Co.(b)(c) | | | | 34,867 | | | 1,520,899 |
| | | | | | | |
| | | | | | | 2,400,059 |
| | | | | | | |
| Diversified Consumer Services – 2.8% | | | | | | | |
American Public Education, Inc.(b)(c) | | | | 25,112 | | | 1,212,407 |
Capella Education Co.(b)(c) | | | | 19,845 | | | 850,557 |
DeVry, Inc. | | | | 28,257 | | | 1,399,852 |
| | | | | | | |
| | | | | | | 3,462,816 |
| | | | | | | |
| Diversified Financial Services – 0.6% | | | | | | | |
Heckmann Corp.(b)(c) | | | | 90,457 | | | 746,270 |
| | | | | | | |
| Diversified Telecommunication Services – 1.3% | | | | | | | |
NTELOS Holdings Corp. | | | | 58,662 | | | 1,577,421 |
| | | | | | | |
| Electric Utilities – 1.1% | | | | | | | |
ITC Holdings Corp. | | | | 27,151 | | | 1,405,607 |
| | | | | | | |
14
PORTFOLIO OF INVESTMENTS – as of September 30, 2008
Loomis Sayles Small Cap Growth Fund – continued
| | | | | | | |
| | | | | Shares | | Value (†) |
| | | | | | | |
| | | |
| COMMON STOCKS – continued | | | | | | | |
| | | |
| Electrical Equipment – 1.6% | | | | | | | |
Energy Conversion Devices, Inc.(c) | | | | 13,093 | | $ | 762,667 |
Woodward Governor Co.(b) | | | | 35,899 | | | 1,266,158 |
| | | | | | | |
| | | | | | | 2,028,825 |
| | | | | | | |
| Electronic Equipment & Instruments – 1.2% | | | | | | | |
IPG Photonics Corp.(b)(c) | | | | 78,253 | | | 1,526,716 |
| | | | | | | |
| Energy Equipment & Services – 3.4% | | | | | | | |
Hornbeck Offshore Services, Inc.(b)(c) | | | | 28,596 | | | 1,104,377 |
IHS, Inc., Class A(b)(c) | | | | 24,896 | | | 1,186,045 |
Mitcham Industries, Inc.(b)(c) | | | | 35,907 | | | 362,302 |
T-3 Energy Services, Inc.(c) | | | | 21,071 | | | 782,156 |
Tesco Corp.(b)(c) | | | | 39,251 | | | 821,916 |
| | | | | | | |
| | | | | | | 4,256,796 |
| | | | | | | |
| Food Products – 2.1% | | | | | | | |
Flowers Foods, Inc.(b) | | | | 47,230 | | | 1,386,673 |
Green Mountain Coffee Roasters, Inc.(b)(c) | | | | 29,861 | | | 1,174,732 |
| | | | | | | |
| | | | | | | 2,561,405 |
| | | | | | | |
| Health Care Equipment & Supplies – 6.7% | | | | | | | |
Insulet Corp.(b)(c) | | | | 60,793 | | | 846,238 |
Masimo Corp.(b)(c) | | | | 34,247 | | | 1,273,988 |
Natus Medical, Inc.(b)(c) | | | | 67,580 | | | 1,531,363 |
NuVasive, Inc.(b)(c) | | | | 22,592 | | | 1,114,463 |
Quidel Corp.(c) | | | | 63,682 | | | 1,045,022 |
RTI Biologics, Inc.(b)(c) | | | | 133,599 | | | 1,249,151 |
SonoSite, Inc.(c) | | | | 39,087 | | | 1,227,332 |
| | | | | | | |
| | | | | | | 8,287,557 |
| | | | | | | |
| Health Care Providers & Services – 7.7% | | | | | | | |
athenahealth, Inc.(c) | | | | 31,690 | | | 1,054,326 |
Bio-Reference Labs, Inc.(c) | | | | 47,342 | | | 1,368,184 |
CardioNet, Inc.(b)(c) | | | | 49,577 | | | 1,237,442 |
Catalyst Health Solutions, Inc.(c) | | | | 46,263 | | | 1,208,390 |
Gentiva Health Services, Inc.(c) | | | | 35,900 | | | 967,146 |
MWI Veterinary Supply, Inc.(b)(c) | | | | 35,180 | | | 1,382,222 |
Psychiatric Solutions, Inc.(b)(c) | | | | 28,788 | | | 1,092,505 |
Sun Healthcare Group, Inc.(c) | | | | 89,538 | | | 1,312,627 |
| | | | | | | |
| | | | | | | 9,622,842 |
| | | | | | | |
| Health Care Technology – 1.4% | | | | | | | |
Phase Forward, Inc.(b)(c) | | | | 81,879 | | | 1,712,090 |
| | | | | | | |
| Hotels, Restaurants & Leisure – 1.7% | | | | | | | |
Buffalo Wild Wings, Inc.(b)(c) | | | | 26,362 | | | 1,060,807 |
Panera Bread Co., Class A(b)(c) | | | | 19,753 | | | 1,005,428 |
| | | | | | | |
| | | | | | | 2,066,235 |
| | | | | | | |
| Insurance – 1.4% | | | | | | | |
AmTrust Financial Services, Inc.(b) | | | | 69,064 | | | 938,580 |
Arch Capital Group Ltd.(c) | | | | 11,714 | | | 855,473 |
| | | | | | | |
| | | | | | | 1,794,053 |
| | | | | | | |
| Internet Software & Services – 6.2% | | | | | | | |
Ariba, Inc.(b)(c) | | | | 141,661 | | | 2,001,670 |
Constant Contact, Inc.(b)(c) | | | | 70,291 | | | 1,199,867 |
SkillSoft PLC, ADR(c) | | | | 142,582 | | | 1,491,408 |
15
| | | | | | | |
| | | | | Shares | | Value (†) |
| | | | | | | |
| | | |
| COMMON STOCKS – continued | | | | | | | |
| | | |
| Internet Software & Services – continued | | | | | | | |
VistaPrint Ltd.(b)(c) | | | | 43,782 | | $ | 1,437,801 |
Vocus, Inc.(b)(c) | | | | 45,814 | | | 1,555,843 |
| | | | | | | |
| | | | | | | 7,686,589 |
| | | | | | | |
| IT Services – 0.8% | | | | | | | |
Syntel, Inc.(b) | | | | 42,244 | | | 1,034,978 |
| | | | | | | |
| Life Sciences Tools & Services – 3.3% | | | | | | | |
Icon PLC, Sponsored ADR(c) | | | | 35,804 | | | 1,369,503 |
Luminex Corp.(b)(c) | | | | 51,643 | | | 1,291,592 |
Parexel International Corp.(c) | | | | 50,329 | | | 1,442,429 |
| | | | | | | |
| | | | | | | 4,103,524 |
| | | | | | | |
| Machinery – 3.6% | | | | | | | |
Energy Recovery, Inc.(b)(c) | | | | 87,240 | | | 836,631 |
ESCO Technologies, Inc.(c) | | | | 15,845 | | | 763,254 |
Freightcar America, Inc.(b) | | | | 34,006 | | | 995,356 |
Kaydon Corp.(b) | | | | 24,666 | | | 1,111,450 |
Valmont Industries, Inc.(b) | | | | 9,128 | | | 754,794 |
| | | | | | | |
| | | | | | | 4,461,485 |
| | | | | | | |
| Media – 2.5% | | | | | | | |
Knology, Inc.(b)(c) | | | | 97,319 | | | 785,364 |
Morningstar, Inc.(b)(c) | | | | 21,559 | | | 1,195,878 |
RHI Entertainment, Inc.(c) | | | | 75,427 | | | 1,123,862 |
| | | | | | | |
| | | | | | | 3,105,104 |
| | | | | | | |
| Oil, Gas & Consumable Fuels – 4.2% | | | | | | | |
Arena Resources, Inc.(b)(c) | | | | 27,359 | | | 1,062,897 |
Comstock Resources, Inc.(c) | | | | 11,633 | | | 582,232 |
Foundation Coal Holdings, Inc. | | | | 22,281 | | | 792,758 |
Goodrich Petroleum Corp.(c) | | | | 21,730 | | | 947,211 |
Petroleum Development Corp.(b)(c) | | | | 19,088 | | | 846,934 |
Rex Energy Corp.(b)(c) | | | | 65,658 | | | 1,034,770 |
| | | | | | | |
| | | | | | | 5,266,802 |
| | | | | | | |
| Pharmaceuticals – 2.6% | | | | | | | |
Alpharma, Inc., Class A(b)(c) | | | | 19,081 | | | 703,898 |
Auxilium Pharmaceuticals, Inc.(c) | | | | 21,897 | | | 709,463 |
Eurand NV(b)(c) | | | | 51,836 | | | 941,342 |
Viropharma, Inc.(b)(c) | | | | 63,304 | | | 830,548 |
| | | | | | | |
| | | | | | | 3,185,251 |
| | | | | | | |
| REITs – 1.0% | | | | | | | |
BioMed Realty Trust, Inc. | | | | 45,409 | | | 1,201,068 |
| | | | | | | |
| Road & Rail – 0.9% | | | | | | | |
Kansas City Southern(b)(c) | | | | 24,446 | | | 1,084,425 |
| | | | | | | |
| Semiconductors & Semiconductor Equipment – 2.5% | | | | | | | |
Cavium Network, Inc.(b)(c) | | | | 64,411 | | | 906,907 |
Netlogic Microsystems, Inc.(b)(c) | | | | 43,302 | | | 1,309,452 |
Varian Semiconductor Equipment Associates, Inc.(b)(c) | | | | 36,434 | | | 915,222 |
| | | | | | | |
| | | | | | | 3,131,581 |
| | | | | | | |
| Software – 7.8% | | | | | | | |
Advent Software, Inc.(b)(c) | | | | 32,973 | | | 1,161,639 |
Blackbaud, Inc. | | | | 49,142 | | | 906,670 |
16
PORTFOLIO OF INVESTMENTS – as of September 30, 2008
Loomis Sayles Small Cap Growth Fund – continued
| | | | | | | | |
| | | | | Shares | | Value (†) |
| | | | | | | | |
| | | |
| COMMON STOCKS – continued | | | | | | | | |
| | | |
| Software – continued | | | | | | | | |
Blackboard, Inc.(c) | | | | | 40,021 | | $ | 1,612,446 |
Concur Technologies, Inc.(c) | | | | | 22,305 | | | 853,389 |
Informatica Corp.(c) | | | | | 91,111 | | | 1,183,532 |
NetScout Systems, Inc.(c) | | | | | 81,175 | | | 863,702 |
Solera Holdings, Inc.(b)(c) | | | | | 52,824 | | | 1,517,105 |
Tyler Technologies, Inc.(b)(c) | | | | | 108,887 | | | 1,651,816 |
| | | | | | | | |
| | | | | | | | 9,750,299 |
| | | | | | | | |
| Specialty Retail – 3.3% | | | | | | | | |
Aeropostale, Inc.(b)(c) | | | | | 39,091 | | | 1,255,212 |
Buckle, Inc. (The)(b) | | | | | 20,272 | | | 1,125,907 |
Gymboree Corp.(c) | | | | | 28,430 | | | 1,009,265 |
Ulta Salon, Cosmetics & Fragrance, Inc.(c) | | | | | 49,347 | | | 655,328 |
| | | | | | | | |
| | | | | | | | 4,045,712 |
| | | | | | | | |
| Textiles, Apparel & Luxury Goods – 0.9% | | | | | | | | |
True Religion Apparel, Inc.(b)(c) | | | | | 41,962 | | | 1,084,718 |
| | | | | | | | |
| Trading Companies & Distributors – 0.7% | | | | | | | | |
DXP Enterprises, Inc.(c) | | | | | 16,675 | | | 888,944 |
| | | | | | | | |
| Wireless Telecommunication Services – 0.9% | | | | | | | | |
SBA Communications Corp., Class A(c) | | | | | 43,635 | | | 1,128,837 |
| | | | | | | | |
| | | |
| TOTAL COMMON STOCKS | | | | | | | | |
(Identified Cost $124,156,478) | | | | | | | | 121,616,396 |
| | | | | | | | |
| | | | | Shares/
Principal Amount | | |
| | | | | | | | |
| | | |
| SHORT-TERM INVESTMENTS – 21.1% | | | | | | | | |
State Street Navigator Securities Lending Prime Portfolio(d) | | | | | 22,691,148 | | | 22,691,148 |
| Tri-Party Repurchase Agreement with Fixed Income Clearing Corporation, dated 9/30/08 at 1.300% to be repurchased at $3,593,130 on 10/01/08 collateralized by $3,605,000 Federal National Mortgage Association, 4.330% due 7/28/11 valued at $3,668,088 including accrued interest (Note 2g of Notes to Financial Statements) | | | | $ | 3,593,000 | | | 3,593,000 |
| | | | | | | | |
| | | |
| TOTAL SHORT-TERM INVESTMENTS | | | | | | | | |
(Identified Cost $26,284,148) | | | | | | | | 26,284,148 |
| | | | | | | | |
| | | |
| TOTAL INVESTMENTS – 118.9% | | | | | | | | |
(Identified Cost $150,440,626)(a) | | | | | | | | 147,900,544 |
Other assets less liabilities—(18.9)% | | | | | | | | (23,463,444) |
| | | | | | | | |
| | | |
| NET ASSETS – 100.0% | | | | | | | $ | 124,437,100 |
| | | | | | | | |
| | | |
(†) See Note 2a of Notes to Financial Statements. | | | | | | | | |
(a) Federal Tax Information: | | | | | | | | |
At September 30, 2008, the net unrealized depreciation on investments based on a cost of $150,467,126 for federal income tax purposes was as follows: | | | |
Aggregate gross unrealized appreciation for all investments in which there is an excess of value over tax cost | | $ | 7,763,399 |
Aggregate gross unrealized depreciation for all investments in which there is an excess of tax cost over value | | | (10,329,981) |
| | | | | | | | |
Net unrealized depreciation | | $ | (2,566,582) |
| | | | | | | | |
| (b) | All or a portion of this security was on loan to brokers at September 30, 2008. |
| (c) | Non-income producing security. |
| (d) | Represents investments of security lending collateral. |
17
| ADR | An American Depositary Receipt (ADR) is a certificate issued by a custodian bank representing the right to receive securities of the foreign issuer described. The values of ADRs are significantly influenced by trading on exchanges not located in the United States. |
| REITs | Real Estate Investment Trusts |
NET ASSET SUMMARY AT SEPTEMBER 30, 2008 (Unaudited)
| | | |
Commercial Services & Supplies | | 9.4 | % |
Software | | 7.8 | |
Health Care Providers & Services | | 7.7 | |
Health Care Equipment & Supplies | | 6.7 | |
Internet Software & Services | | 6.2 | |
Oil, Gas & Consumable Fuels | | 4.2 | |
Machinery | | 3.6 | |
Energy Equipment & Services | | 3.4 | |
Life Sciences Tools & Services | | 3.3 | |
Specialty Retail | | 3.3 | |
Aerospace & Defense | | 3.1 | |
Communications Equipment | | 2.9 | |
Biotechnology | | 2.9 | |
Diversified Consumer Services | | 2.8 | |
Pharmaceuticals | | 2.6 | |
Semiconductors & Semiconductor Equipment | | 2.5 | |
Media | | 2.5 | |
Commercial Banks | | 2.3 | |
Food Products | | 2.1 | |
Other Investments, less than 2% each | | 18.5 | |
Short-Term Investments | | 21.1 | |
| | | |
Total Investments | | 118.9 | |
Other assets less liabilities | | (18.9 | ) |
| | | |
Net Assets | | 100.0 | % |
| | | |
See accompanying notes to financial statements.
18
PORTFOLIO OF INVESTMENTS – as of September 30, 2008
Loomis Sayles Small Cap Value Fund
| | | | | | | |
| | | | | Shares | | Value (†) |
| | | | | | | |
| | | |
| COMMON STOCKS – 96.7% of Net Assets | | | | | | | |
| | | |
| Aerospace & Defense – 2.5% | | | | | | | |
Ducommun, Inc. | | | | 199,540 | | $ | 4,765,015 |
Moog, Inc., Class A(c) | | | | 214,056 | | | 9,178,721 |
Teledyne Technologies, Inc.(c) | | | | 230,897 | | | 13,198,073 |
| | | | | | | |
| | | | | | | 27,141,809 |
| | | | | | | |
| Air Freight & Logistics – 1.1% | | | | | | | |
Atlas Air Worldwide Holdings, Inc.(c) | | | | 132,540 | | | 5,342,687 |
Hub Group, Inc., Class A(c) | | | | 182,489 | | | 6,870,711 |
| | | | | | | |
| | | | | | | 12,213,398 |
| | | | | | | |
| Auto Components – 0.8% | | | | | | | |
Federal Mogul Corp.(b)(c) | | | | 239,496 | | | 3,005,675 |
Gentex Corp.(b) | | | | 235,448 | | | 3,366,906 |
Stoneridge, Inc.(b)(c) | | | | 207,161 | | | 2,330,561 |
| | | | | | | |
| | | | | | | 8,703,142 |
| | | | | | | |
| Building Products – 0.6% | | | | | | | |
Armstrong World Industries, Inc.(b) | | | | 220,314 | | | 6,367,075 |
| | | | | | | |
| Capital Markets – 1.9% | | | | | | | |
Investment Technology Group, Inc.(c) | | | | 188,844 | | | 5,746,523 |
JMP Group, Inc.(b) | | | | 161,713 | | | 840,908 |
Stifel Financial Corp.(b)(c) | | | | 282,127 | | | 14,078,137 |
| | | | | | | |
| | | | | | | 20,665,568 |
| | | | | | | |
| Chemicals – 2.6% | | | | | | | |
Cytec Industries, Inc. | | | | 112,465 | | | 4,376,013 |
Koppers Holdings, Inc. | | | | 119,827 | | | 4,482,728 |
LSB Industries, Inc.(c) | | | | 91,485 | | | 1,267,067 |
Minerals Technologies, Inc. | | | | 66,995 | | | 3,976,823 |
Solutia, Inc.(c) | | | | 597,275 | | | 8,361,850 |
Zep, Inc.(b) | | | | 314,590 | | | 5,549,368 |
| | | | | | | |
| | | | | | | 28,013,849 |
| | | | | | | |
| Commercial Banks – 7.9% | | | | | | | |
Bank of the Ozarks, Inc.(b) | | | | 383,177 | | | 10,345,779 |
Citizens Republic Bancorp, Inc.(b) | | | | 903,218 | | | 2,781,912 |
Comerica, Inc.(b) | | | | 163,603 | | | 5,364,542 |
CVB Financial Corp.(b) | | | | 428,949 | | | 5,962,391 |
Hancock Holding Co.(b) | | | | 171,626 | | | 8,752,926 |
IBERIABANK Corp.(b) | | | | 118,691 | | | 6,272,819 |
Old National Bancorp(b) | | | | 199,052 | | | 3,985,021 |
Pennsylvania Commerce Bancorp, Inc.(b)(c) | | | | 117,448 | | | 3,501,125 |
Prosperity Bancshares, Inc.(b) | | | | 277,785 | | | 9,441,912 |
Signature Bank(c) | | | | 281,675 | | | 9,824,824 |
Sterling Bancshares, Inc. | | | | 899,189 | | | 9,396,525 |
SVB Financial Group(c) | | | | 191,082 | | | 11,067,470 |
| | | | | | | |
| | | | | | | 86,697,246 |
| | | | | | | |
| Commercial Services & Supplies – 6.9% | | | | | | | |
ABM Industries, Inc. | | | | 391,160 | | | 8,542,934 |
American Ecology Corp. | | | | 244,373 | | | 6,761,801 |
Geo Group, Inc. (The)(b)(c) | | | | 373,256 | | | 7,543,504 |
McGrath Rentcorp | | | | 302,358 | | | 8,713,958 |
Rollins, Inc. | | | | 1,005,262 | | | 19,079,873 |
Standard Parking Corp.(b)(c) | | | | 584,334 | | | 12,983,901 |
19
| | | | | | | |
| | | | | Shares | | Value (†) |
| | | | | | | |
| | | |
| COMMON STOCKS – continued | | | | | | | |
| | | |
| Commercial Services & Supplies – continued | | | | | | | |
Waste Connections, Inc.(c) | | | | 342,932 | | $ | 11,762,568 |
| | | | | | | |
| | | | | | | 75,388,539 |
| | | | | | | |
| Communications Equipment – 2.5% | | | | | | | |
ADC Telecommunications, Inc.(b)(c) | | | | 437,163 | | | 3,694,027 |
ADTRAN, Inc.(b) | | | | 282,340 | | | 5,502,807 |
Anaren, Inc.(c) | | | | 169,861 | | | 1,724,089 |
CommScope, Inc.(b)(c) | | | | 289,303 | | | 10,021,456 |
Tekelec(b)(c) | | | | 459,368 | | | 6,426,558 |
| | | | | | | |
| | | | | | | 27,368,937 |
| | | | | | | |
| Computers & Peripherals – 1.0% | | | | | | | |
Intevac, Inc.(b)(c) | | | | 313,197 | | | 3,332,416 |
NCR Corp.(c) | | | | 130,848 | | | 2,885,198 |
Teradata Corp.(c) | | | | 251,165 | | | 4,897,718 |
| | | | | | | |
| | | | | | | 11,115,332 |
| | | | | | | |
| Construction & Engineering – 0.6% | | | | | | | |
Granite Construction, Inc.(b) | | | | 153,697 | | | 5,505,427 |
Layne Christensen Co.(c) | | | | 41,568 | | | 1,472,754 |
| | | | | | | |
| | | | | | | 6,978,181 |
| | | | | | | |
| Consumer Finance – 1.0% | | | | | | | |
Dollar Financial Corp.(b)(c) | | | | 438,239 | | | 6,744,498 |
World Acceptance Corp.(b)(c) | | | | 114,051 | | | 4,105,836 |
| | | | | | | |
| | | | | | | 10,850,334 |
| | | | | | | |
| Containers & Packaging – 1.6% | | | | | | | |
Greif, Inc., Class A | | | | 53,583 | | | 3,516,117 |
Myers Industries, Inc.(b) | | | | 538,926 | | | 6,795,857 |
Rock-Tenn Co., Class A | | | | 191,835 | | | 7,669,563 |
| | | | | | | |
| | | | | | | 17,981,537 |
| | | | | | | |
| Distributors – 0.1% | | | | | | | |
Core-Mark Holding Co., Inc.(b)(c) | | | | 61,813 | | | 1,544,707 |
| | | | | | | |
| Diversified Consumer Services – 0.4% | | | | | | | |
Hillenbrand, Inc. | | | | 221,283 | | | 4,461,065 |
| | | | | | | |
| Diversified Financial Services – 0.7% | | | | | | | |
PHH Corp.(c) | | | | 590,822 | | | 7,852,024 |
| | | | | | | |
| Electric Utilities – 2.5% | | | | | | | |
ALLETE, Inc.(b) | | | | 228,675 | | | 10,176,038 |
ITC Holdings Corp.(b) | | | | 147,590 | | | 7,640,734 |
Portland General Electric Co.(b) | | | | 425,252 | | | 10,061,462 |
| | | | | | | |
| | | | | | | 27,878,234 |
| | | | | | | |
| Electrical Equipment – 1.8% | | | | | | | |
Acuity Brands, Inc.(b) | | | | 118,589 | | | 4,952,277 |
General Cable Corp.(b)(c) | | | | 115,652 | | | 4,120,681 |
II-VI, Inc.(b)(c) | | | | 112,325 | | | 4,342,484 |
Polypore International, Inc.(b)(c) | | | | 313,468 | | | 6,742,697 |
| | | | | | | |
| | | | | | | 20,158,139 |
| | | | | | | |
| Electronic Equipment & Instruments – 2.5% | | | | | | | |
Anixter International, Inc.(b)(c) | | | | 46,485 | | | 2,766,322 |
Daktronics, Inc.(b) | | | | 226,280 | | | 3,769,825 |
20
PORTFOLIO OF INVESTMENTS – as of September 30, 2008
Loomis Sayles Small Cap Value Fund – continued
| | | | | | | |
| | | | | Shares | | Value (†) |
| | | | | | | |
| | | |
| COMMON STOCKS – continued | | | | | | | |
| | | |
| Electronic Equipment & Instruments – continued | | | | | | | |
Littelfuse, Inc.(c) | | | | 325,708 | | $ | 9,683,299 |
Scansource, Inc.(b)(c) | | | | 255,453 | | | 7,354,492 |
Vishay Intertechnology, Inc.(c) | | | | 509,093 | | | 3,370,196 |
| | | | | | | |
| | | | | | | 26,944,134 |
| | | | | | | |
| Energy Equipment & Services – 2.7% | | | | | | | |
Dresser-Rand Group, Inc.(c) | | | | 234,984 | | | 7,394,946 |
Hornbeck Offshore Services, Inc.(b)(c) | | | | 180,436 | | | 6,968,438 |
Newpark Resources(c) | | | | 443,003 | | | 3,233,922 |
Oceaneering International, Inc.(c) | | | | 158,835 | | | 8,469,082 |
Superior Well Services, Inc.(b)(c) | | | | 149,034 | | | 3,772,051 |
| | | | | | | |
| | | | | | | 29,838,439 |
| | | | | | | |
| Food & Staples Retailing – 1.0% | | | | | | | |
Spartan Stores, Inc. | | | | 439,868 | | | 10,943,916 |
| | | | | | | |
| Food Products – 1.3% | | | | | | | |
J & J Snack Foods Corp. | | | | 161,455 | | | 5,474,939 |
Ralcorp Holdings, Inc.(b)(c) | | | | 131,864 | | | 8,888,952 |
| | | | | | | |
| | | | | | | 14,363,891 |
| | | | | | | |
| Gas Utilities – 1.8% | | | | | | | |
Energen Corp. | | | | 66,378 | | | 3,005,596 |
ONEOK, Inc. | | | | 32,345 | | | 1,112,668 |
UGI Corp. | | | | 613,180 | | | 15,807,780 |
| | | | | | | |
| | | | | | | 19,926,044 |
| | | | | | | |
| Health Care Equipment & Supplies – 1.9% | | | | | | | |
Hill-Rom Holdings, Inc.(b) | | | | 234,856 | | | 7,118,485 |
Medical Action Industries, Inc.(b)(c) | | | | 261,297 | | | 3,430,830 |
West Pharmaceutical Services, Inc.(b) | | | | 200,228 | | | 9,775,131 |
| | | | | | | |
| | | | | | | 20,324,446 |
| | | | | | | |
| Health Care Providers & Services – 3.6% | | | | | | | |
Amedisys, Inc.(b)(c) | | | | 150,106 | | | 7,305,659 |
CorVel Corp.(c) | | | | 199,528 | | | 5,708,496 |
Healthspring, Inc.(c) | | | | 206,960 | | | 4,379,274 |
inVentiv Health, Inc.(b)(c) | | | | 231,633 | | | 4,090,639 |
MWI Veterinary Supply, Inc.(b)(c) | | | | 109,983 | | | 4,321,232 |
Pediatrix Medical Group, Inc.(c) | | | | 96,907 | | | 5,225,225 |
Skilled Healthcare Group, Inc., Class A(c) | | | | 538,628 | | | 8,558,799 |
| | | | | | | |
| | | | | | | 39,589,324 |
| | | | | | | |
| Hotels, Restaurants & Leisure – 1.9% | | | | | | | |
Bob Evans Farms, Inc.(b) | | | | 241,742 | | | 6,597,139 |
Cosi, Inc.(b)(c) | | | | 1,371,708 | | | 2,702,265 |
Dover Downs Gaming & Entertainment, Inc.(b) | | | | 301,983 | | | 2,349,428 |
Penn National Gaming, Inc.(c) | | | | 208,457 | | | 5,538,702 |
Wyndham Worldwide Corp. | | | | 226,044 | | | 3,551,151 |
| | | | | | | |
| | | | | | | 20,738,685 |
| | | | | | | |
| Industrial Conglomerates – 0.8% | | | | | | | |
Teleflex, Inc. | | | | 142,341 | | | 9,037,230 |
| | | | | | | |
| Insurance – 4.3% | | | | | | | |
American Equity Investment Life Holding Co.(b) | | | | 106,407 | | | 798,053 |
American Physicians Capital, Inc. | | | | 109,698 | | | 4,643,516 |
Delphi Financial Group, Inc., Class A | | | | 162,971 | | | 4,569,707 |
21
| | | | | | | |
| | | | | Shares | | Value (†) |
| | | | | | | |
| | | |
| COMMON STOCKS – continued | | | | | | | |
| | | |
| Insurance – continued | | | | | | | |
Employers Holdings, Inc. | | | | 289,738 | | $ | 5,035,646 |
Fidelity National Financial, Inc., Class A(b) | | | | 217,876 | | | 3,202,777 |
HCC Insurance Holdings, Inc. | | | | 274,796 | | | 7,419,492 |
Navigators Group, Inc.(c) | | | | 116,894 | | | 6,779,852 |
ProAssurance Corp.(c) | | | | 109,522 | | | 6,133,232 |
RLI Corp.(b) | | | | 136,845 | | | 8,496,706 |
| | | | | | | |
| | | | | | | 47,078,981 |
| | | | | | | |
| Internet & Catalog Retail – 0.6% | | | | | | | |
HSN, Inc.(c) | | | | 550,266 | | | 6,058,429 |
| | | | | | | |
| Internet Software & Services – 0.5% | | | | | | | |
United Online, Inc.(b) | | | | 525,530 | | | 4,945,237 |
| | | | | | | |
| IT Services – 4.5% | | | | | | | |
Alliance Data Systems Corp.(c) | | | | 170,986 | | | 10,837,093 |
Broadridge Financial Solutions, Inc. | | | | 657,472 | | | 10,118,494 |
Lender Processing Services, Inc. | | | | 262,910 | | | 8,024,013 |
Perot Systems Corp., Class A(c) | | | | 465,246 | | | 8,072,018 |
Wright Express Corp.(b)(c) | | | | 405,536 | | | 12,105,250 |
| | | | | | | |
| | | | | | | 49,156,868 |
| | | | | | | |
| Leisure Equipment & Products – 0.4% | | | | | | | |
Steinway Musical Instruments, Inc.(b)(c) | | | | 171,934 | | | 4,869,171 |
| | | | | | | |
| Life Sciences Tools & Services – 1.0% | | | | | | | |
PerkinElmer, Inc. | | | | 273,638 | | | 6,832,741 |
Varian, Inc.(c) | | | | 103,764 | | | 4,451,475 |
| | | | | | | |
| | | | | | | 11,284,216 |
| | | | | | | |
| Machinery – 3.2% | | | | | | | |
Actuant Corp., Class A(b) | | | | 294,943 | | | 7,444,361 |
Altra Holdings, Inc.(c) | | | | 319,028 | | | 4,708,853 |
CLARCOR, Inc.(b) | | | | 115,232 | | | 4,373,055 |
Commercial Vehicle Group, Inc.(b)(c) | | | | 29,381 | | | 208,899 |
John Bean Technologies Corp.(c) | | | | 444,933 | | | 5,632,852 |
RBC Bearings, Inc.(c) | | | | 194,903 | | | 6,566,282 |
Wabtec Corp. | | | | 111,584 | | | 5,716,448 |
| | | | | | | |
| | | | | | | 34,650,750 |
| | | | | | | |
| Media – 2.4% | | | | | | | |
A H Belo Corp., Class A(b) | | | | 233,331 | | | 1,203,988 |
Alloy, Inc.(c) | | | | 244,628 | | | 1,890,975 |
Interactive Data Corp. | | | | 387,591 | | | 9,775,045 |
John Wiley & Sons, Inc. Class A | | | | 325,934 | | | 13,184,030 |
| | | | | | | |
| | | | | | | 26,054,038 |
| | | | | | | |
| Metals & Mining – 0.9% | | | | | | | |
Haynes International, Inc.(b)(c) | | | | 82,724 | | | 3,873,965 |
Reliance Steel & Aluminum Co.(b) | | | | 146,038 | | | 5,545,063 |
| | | | | | | |
| | | | | | | 9,419,028 |
| | | | | | | |
| Multi-Utilities & Unregulated Power – 0.4% | | | | | | | |
NorthWestern Corp. | | | | 193,268 | | | 4,856,825 |
| | | | | | | |
| Multiline Retail – 0.6% | | | | | | | |
Dollar Tree, Inc.(c) | | | | 178,125 | | | 6,476,625 |
| | | | | | | |
22
PORTFOLIO OF INVESTMENTS – as of September 30, 2008
Loomis Sayles Small Cap Value Fund – continued
| | | | | | | |
| | | | | Shares | | Value (†) |
| | | | | | | |
| | | |
| COMMON STOCKS – continued | | | | | | | |
| | | |
| Oil, Gas & Consumable Fuels – 2.3% | | | | | | | |
Mariner Energy, Inc.(c) | | | | 353,552 | | $ | 7,247,816 |
Penn Virginia Corp. | | | | 197,229 | | | 10,539,918 |
St. Mary Land & Exploration Co. | | | | 116,800 | | | 4,163,920 |
Venoco, Inc.(b)(c) | | | | 224,274 | | | 2,915,562 |
| | | | | | | |
| | | | | | | 24,867,216 |
| | | | | | | |
| Personal Products – 0.8% | | | | | | | |
Alberto-Culver Co. | | | | 338,097 | | | 9,209,762 |
| | | | | | | |
| Pharmaceuticals – 2.0% | | | | | | | |
Endo Pharmaceuticals Holdings, Inc.(c) | | | | 285,227 | | | 5,704,540 |
Obagi Medical Products, Inc.(c) | | | | 458,289 | | | 4,573,724 |
Perrigo Co.(b) | | | | 312,305 | | | 12,011,251 |
| | | | | | | |
| | | | | | | 22,289,515 |
| | | | | | | |
| Professional Services – 0.0% | | | | | | | |
Duff & Phelps Corp., Class A(c) | | | | 21,896 | | | 460,473 |
| | | | | | | |
| Real Estate Management & Development – 0.6% | | | | | | | |
Forestar Real Estate Group, Inc.(b)(c) | | | | 451,535 | | | 6,660,141 |
| | | | | | | |
| REITs – 4.5% | | | | | | | |
American Campus Communities, Inc. | | | | 192,347 | | | 6,516,716 |
Capstead Mortgage Corp. | | | | 673,066 | | | 7,370,073 |
Digital Realty Trust, Inc.(b) | | | | 168,396 | | | 7,956,711 |
Health Care REIT, Inc. | | | | 222,382 | | | 11,837,394 |
Kite Realty Group Trust(b) | | | | 262,801 | | | 2,890,811 |
Potlatch Corp. | | | | 273,634 | | | 12,693,881 |
| | | | | | | |
| | | | | | | 49,265,586 |
| | | | | | | |
| Road & Rail – 2.2% | | | | | | | |
Con-way, Inc.(b) | | | | 167,355 | | | 7,382,029 |
Genesee & Wyoming, Inc., Class A(c) | | | | 207,868 | | | 7,799,207 |
Ryder System, Inc.(b) | | | | 135,440 | | | 8,397,280 |
| | | | | | | |
| | | | | | | 23,578,516 |
| | | | | | | |
| Semiconductors & Semiconductor Equipment – 2.3% | | | | | | | |
Cohu, Inc.(b) | | | | 230,704 | | | 3,649,737 |
Diodes, Inc.(b)(c) | | | | 248,509 | | | 4,584,991 |
ON Semiconductor Corp.(c) | | | | 772,119 | | | 5,219,525 |
Semtech Corp.(c) | | | | 216,006 | | | 3,015,444 |
Verigy Ltd.(c) | | | | 518,047 | | | 8,433,805 |
| | | | | | | |
| | | | | | | 24,903,502 |
| | | | | | | |
| Software – 2.7% | | | | | | | |
Mentor Graphics Corp.(b)(c) | | | | 517,448 | | | 5,873,035 |
Progress Software Corp.(c) | | | | 330,751 | | | 8,596,218 |
Quest Software, Inc.(c) | | | | 420,079 | | | 5,330,803 |
Radiant Systems, Inc.(c) | | | | 296,779 | | | 2,579,010 |
Sybase, Inc.(c) | | | | 240,639 | | | 7,368,366 |
| | | | | | | |
| | | | | | | 29,747,432 |
| | | | | | | |
| Specialty Retail – 2.7% | | | | | | | |
Genesco, Inc.(b)(c) | | | | 315,877 | | | 10,575,562 |
Jo-Ann Stores, Inc.(b)(c) | | | | 200,926 | | | 4,215,427 |
RadioShack Corp. | | | | 316,154 | | | 5,463,141 |
Sally Beauty Holdings, Inc.(b)(c) | | | | 1,121,911 | | | 9,648,435 |
| | | | | | | |
| | | | | | | 29,902,565 |
| | | | | | | |
23
| | | | | | | | |
| | | | | Shares | | Value (†) |
| | | | | | | | |
| | | |
| COMMON STOCKS – continued | | | | | | | | |
| | | |
| Textiles, Apparel & Luxury Goods – 2.0% | | | | | | | | |
Carter’s, Inc.(c) | | | | | 297,508 | | $ | 5,869,833 |
FGX International Holdings Ltd.(b)(c) | | | | | 275,446 | | | 3,049,187 |
Fossil, Inc.(b)(c) | | | | | 220,980 | | | 6,238,265 |
Hanesbrands, Inc.(b)(c) | | | | | 300,501 | | | 6,535,897 |
| | | | | | | | |
| | | | | | | | 21,693,182 |
| | | | | | | | |
| Thrifts & Mortgage Finance – 0.9% | | | | | | | | |
Beneficial Mutual Bancorp, Inc.(b)(c) | | | | | 480,075 | | | 6,072,949 |
Westfield Financial, Inc.(b) | | | | | 384,086 | | | 3,956,086 |
| | | | | | | | |
| | | | | | | | 10,029,035 |
| | | | | | | | |
| Water Utilities – 0.9% | | | | | | | | |
American States Water Co.(b) | | | | | 122,345 | | | 4,710,282 |
Middlesex Water Co.(b) | | | | | 270,987 | | | 4,734,143 |
| | | | | | | | |
| | | | | | | | 9,444,425 |
| | | | | | | | |
| | | |
| TOTAL COMMON STOCKS | | | | | | | | |
(Identified Cost $1,034,835,389) | | | | | | | | 1,059,986,743 |
| | | | | | | | |
| | | |
| EXCHANGE TRADED FUND – 1.0% | | | | | | | | |
| | | |
| Diversified Financial Services – 1.0% | | | | | | | | |
iShares Russell 2000 Value Index Fund(b) | | | | | | | | |
(Identified Cost $10,504,021) | | | | | 166,444 | | | 11,191,695 |
| | | | | | | | |
| | | |
| | | | | Shares/
Principal Amount | | |
| | | | | | | | |
| | | |
| SHORT-TERM INVESTMENTS – 22.9% | | | | | | | | |
| State Street Navigator Securities Lending Prime Portfolio(d) | | | | | 195,864,078 | | | 195,864,078 |
| Tri-Party Repurchase Agreement with Fixed Income Clearing Corporation, dated 9/30/2008 at 1.300% to be repurchased at $54,488,968 on 10/01/2008 collateralized by $54,625,000 Federal National Mortgage Association, 4.330% due 7/28/2011 with a value of $55,580,938 including accrued interest (Note 2g of Notes to Financial Statements) | | | | $ | 54,487,000 | | | 54,487,000 |
| | | | | | | | |
| | | |
| TOTAL SHORT-TERM INVESTMENTS | | | | | | | | |
(Identified Cost $250,351,078) | | | | | | | | 250,351,078 |
| | | | | | | | |
| | | |
| TOTAL INVESTMENTS – 120.6% | | | | | | | | |
(Identified Cost $1,295,690,488)(a) | | | | | | | | 1,321,529,516 |
Other assets less liabilities—(20.6)% | | | | | | | | (225,880,689) |
| | | | | | | | |
| | | |
| NET ASSETS – 100.0% | | | | | | | $ | 1,095,648,827 |
| | | | | | | | |
| | | |
(†) See Note 2a of Notes to Financial Statements. | | | | | | | | |
(a) Federal Tax Information: | | | | | | | | |
At September 30, 2008, the net unrealized appreciation on investments based on a cost of $1,297,881,270 for federal income tax purposes was as follows: | | | |
Aggregate gross unrealized appreciation for all investments in which there is an excess of value over tax cost | | $ | 107,220,862 |
Aggregate gross unrealized depreciation for all investments in which there is an excess of tax cost over value | | | (83,572,616) |
| | | | | | | | |
Net unrealized appreciation | | $ | 23,648,246 |
| | | | | | | | |
| (b) | All or a portion of this security was on loan to brokers at September 30, 2008. |
| (c) | Non-income producing security. |
24
PORTFOLIO OF INVESTMENTS – as of September 30, 2008
Loomis Sayles Small Cap Value Fund – continued
| (d) | Represents investment of securities lending collateral. |
| REITs | Real Estate Investment Trusts |
NET ASSET SUMMARY AT SEPTEMBER 30, 2008 (Unaudited)
| | | |
Commercial Banks | | 7.9 | % |
Commercial Services & Supplies | | 6.9 | |
REITs | | 4.5 | |
IT Services | | 4.5 | |
Insurance | | 4.3 | |
Health Care Providers & Services | | 3.6 | |
Machinery | | 3.2 | |
Specialty Retail | | 2.7 | |
Energy Equipment & Services | | 2.7 | |
Software | | 2.7 | |
Chemicals | | 2.6 | |
Electric Utilities | | 2.5 | |
Communications Equipment | | 2.5 | |
Aerospace & Defense | | 2.5 | |
Electronic Equipment & Instruments | | 2.5 | |
Media | | 2.4 | |
Semiconductors & Semiconductor Equipment | | 2.3 | |
Oil, Gas & Consumable Fuels | | 2.3 | |
Road & Rail | | 2.2 | |
Pharmaceuticals | | 2.0 | |
Textiles, Apparel & Luxury Goods | | 2.0 | |
Other Investments, less than 2% each | | 28.9 | |
Short-Term Investments | | 22.9 | |
| | | |
Total Investments | | 120.6 | |
Other assets less liabilities | | (20.6 | ) |
| | | |
Net Assets | | 100.0 | % |
| | | |
See accompanying notes to financial statements.
25
STATEMENTS OF ASSETS AND LIABILITIES
September 30, 2008
| | | | | | | | | | | | |
| | | Mid Cap
Growth Fund | | | Small Cap
Growth Fund | | | Small Cap
Value Fund | |
| | | | | | | | | | | | |
| | | | | | | | | | | | |
Assets | | | | | | | | | | | | |
Investments at cost | | $ | 180,141,873 | | | $ | 150,440,626 | | | $ | 1,295,690,488 | |
Net unrealized appreciation (depreciation) | | | (11,322,426 | ) | | | (2,540,082 | ) | | | 25,839,028 | |
| | | | | | | | | | | | |
Investments at value | | | 168,819,447 | | | | 147,900,544 | | | | 1,321,529,516 | |
Cash | | | 182 | | | | 2,296 | | | | 105,664 | |
Receivable for Fund shares sold | | | 466,881 | | | | 328,689 | | | | 6,670,686 | |
Receivable for securities sold | | | 3,200,961 | | | | 1,225,292 | | | | 13,521,237 | |
Dividends and interest receivable | | | 56,298 | | | | 34,679 | | | | 1,128,754 | |
Receivable from investment adviser (Note 4) | | | 32,715 | | | | 36,159 | | | | 101,061 | |
Securities lending income receivable | | | 15,033 | | | | 24,412 | | | | 98,283 | |
| | | | | | | | | | | | |
Total Assets | | | 172,591,517 | | | | 149,552,071 | | | | 1,343,155,201 | |
| | | | | | | | | | | | |
| | | |
| Liabilities | | | | | | | | | | | | |
Collateral on securities loaned, at value (Note 2) | | | 22,705,247 | | | | 22,691,148 | | | | 195,864,078 | |
Payable for securities purchased | | | 1,109,286 | | | | 1,795,490 | | | | 32,928,331 | |
Payable for Fund shares redeemed | | | 2,267,241 | | | | 435,529 | | | | 17,697,226 | |
Management fees payable (Note 4) | | | 111,530 | | | | 81,329 | | | | 714,720 | |
Administrative fees payable (Note 4) | | | 7,000 | | | | 5,103 | | | | 44,860 | |
Deferred Trustees’ fees (Note 4) | | | 42,576 | | | | 40,103 | | | | 113,489 | |
Service and distribution fees payable (Note 4) | | | 820 | | | | 536 | | | | 4,225 | |
Other accounts payable and accrued expenses | | | 44,474 | | | | 65,733 | | | | 139,445 | |
| | | | | | | | | | | | |
Total Liabilities | | | 26,288,174 | | | | 25,114,971 | | | | 247,506,374 | |
| | | | | | | | | | | | |
Net Assets | | $ | 146,303,343 | | | $ | 124,437,100 | | | $ | 1,095,648,827 | |
| | | | | | | | | | | | |
Net Assets consist of: | | | | | | | | | | | | |
Paid-in capital | | $ | 262,590,406 | | | $ | 332,005,808 | | | $ | 1,117,571,112 | |
Accumulated net investment income (loss) | | | (42,576 | ) | | | (40,103 | ) | | | 1,842,018 | |
Accumulated net realized loss on investments and foreign currency transactions | | | (104,922,061 | ) | | | (204,988,523 | ) | | | (49,603,331 | ) |
Net unrealized appreciation (depreciation) on investments and foreign currency translations | | | (11,322,426 | ) | | | (2,540,082 | ) | | | 25,839,028 | |
| | | | | | | | | | | | |
Net Assets | | $ | 146,303,343 | | | $ | 124,437,100 | | | $ | 1,095,648,827 | |
| | | | | | | | | | | | |
| | | |
| Net Asset Value and Offering Price | | | | | | | | | | | | |
Institutional Class | | | | | | | | | | | | |
Net assets | | $ | 25,779,418 | | | $ | 44,540,086 | | | $ | 553,268,333 | |
| | | | | | | | | | | | |
Shares of beneficial interest | | | 1,188,171 | | | | 3,407,805 | | | | 25,132,292 | |
| | | | | | | | | | | | |
Net asset value, offering and redemption price per share | | $ | 21.70 | | | $ | 13.07 | | | $ | 22.01 | |
| | | | | | | | | | | | |
Retail Class | | | | | | | | | | | | |
Net assets | | $ | 120,523,925 | | | $ | 79,897,014 | | | $ | 464,525,207 | |
| | | | | | | | | | | | |
Shares of beneficial interest | | | 5,706,725 | | | | 6,296,278 | | | | 21,318,846 | |
| | | | | | | | | | | | |
Net asset value, offering and redemption price per share | | $ | 21.12 | | | $ | 12.69 | | | $ | 21.79 | |
| | | | | | | | | | | | |
Admin Class | | | | | | | | | | | | |
Net assets | | $ | — | | | $ | — | | | $ | 77,855,287 | |
| | | | | | | | | | | | |
Shares of beneficial interest | | | — | | | | — | | | | 3,638,028 | |
| | | | | | | | | | | | |
Net asset value, offering and redemption price per share | | $ | — | | | $ | — | | | $ | 21.40 | |
| | | | | | | | | | | | |
Value of securities on loan (Note 2) | | $ | 22,615,127 | | | $ | 22,689,377 | | | $ | 197,462,353 | |
| | | | | | | | | | | | |
See accompanying notes to financial statements.
26
STATEMENTS OF OPERATIONS
For the Year Ended September 30, 2008
| | | | | | | | | | | | |
| | | Mid Cap
Growth Fund | | | Small Cap
Growth Fund | | | Small Cap
Value Fund | |
| | | | | | | | | | | | |
Investment Income | | | | | | | | | | | | |
Dividends | | $ | 469,227 | | | $ | 221,760 | | | $ | 12,128,483 | * |
Interest | | | 160,344 | | | | 102,730 | | | | 980,421 | |
Securities lending income (Note 2) | | | 186,710 | | | | 199,641 | | | | 1,537,445 | |
Less net foreign taxes withheld | | | (12,805 | ) | | | — | | | | — | |
| | | | | | | | | | | | |
| | | 803,476 | | | | 524,131 | | | | 14,646,349 | |
| | | | | | | | | | | | |
| | | |
| Expenses | | | | | | | | | | | | |
Management fees (Note 4) | | | 909,027 | | | | 726,130 | | | | 8,053,932 | |
Distribution fees—Retail Class (Note 4) | | | 228,997 | | | | 140,202 | | | | 1,174,810 | |
Service and distribution fees—Admin Class (Note 4) | | | — | | | | — | | | | 395,796 | |
Trustees’ fees and expenses (Note 4) | | | 11,123 | | | | 10,806 | | | | 22,232 | |
Administrative fees (Note 4) | | | 61,279 | | | | 49,032 | | | | 546,547 | |
Custodian fees and expenses | | | 27,288 | | | | 32,363 | | | | 45,613 | |
Transfer agent fees and expenses—Institutional Class (Note 4) | | | 13,414 | | | | 17,715 | | | | 258,415 | |
Transfer agent fees and expenses—Retail Class (Note 4) | | | 102,699 | | | | 114,743 | | | | 812,511 | |
Transfer agent fees and expenses—Admin Class (Note 4) | | | — | | | | — | | | | 266,375 | |
Audit and tax services fees | | | 39,275 | | | | 36,021 | | | | 40,169 | |
Registration fees | | | 87,242 | | | | 44,426 | | | | 109,444 | |
Shareholder reporting expenses | | | 15,619 | | | | 23,916 | | | | 188,329 | |
Legal fees | | | 2,797 | | | | 2,341 | | | | 27,455 | |
Expense recapture—Institutional Class (Note 4) | | | 835 | | | | — | | | | — | |
Miscellaneous expenses | | | 8,185 | | | | 7,606 | | | | 45,736 | |
| | | | | | | | | | | | |
Total expenses | | | 1,507,780 | | | | 1,205,301 | | | | 11,987,364 | |
Less fee reduction and/or expense reimbursement (Note 4) | | | (66,565 | ) | | | (96,890 | ) | | | (788,326 | ) |
| | | | | | | | | | | | |
Net expenses | | | 1,441,215 | | | | 1,108,411 | | | | 11,199,038 | |
| | | | | | | | | | | | |
Net investment income (loss) | | | (637,739 | ) | | | (584,280 | ) | | | 3,447,311 | |
| | | | | | | | | | | | |
| | | |
| Net Realized and Unrealized Gain (Loss) on Investments and Foreign Currency Transactions | | | | | | | | | | | | |
Net Realized Gain (Loss) on: | | | | | | | | | | | | |
Investments | | | (16,802,159 | ) | | | (6,171,517 | ) | | | (37,271,375 | ) |
Foreign currency transactions | | | 166 | | | | — | | | | — | |
Payments by affiliates (Note 4) | | | 1,112 | | | | — | | | | — | |
| | | |
| Net Change in Unrealized Appreciation (Depreciation) on: | | | | | | | | | | | | |
Investments | | | (24,348,722 | ) | | | (10,322,096 | ) | | | (141,209,963 | ) |
Foreign currency translations | | | (109 | ) | | | — | | | | — | |
| | | | | | | | | | | | |
Net realized and unrealized loss on investments and foreign currency transactions | | | (41,149,712 | ) | | | (16,493,613 | ) | | | (178,481,338 | ) |
| | | | | | | | | | | | |
| | | |
| Net Decrease in Net Assets Resulting from Operations | | $ | (41,787,451 | ) | | $ | (17,077,893 | ) | | $ | (175,034,027 | ) |
| | | | | | | | | | | | |
| * | Amount includes a special dividend of $926,046 in which the source of the dividend has not been determined by the issuer. |
See accompanying notes to financial statements.
27
STATEMENTS OF CHANGES IN NET ASSETS
Mid Cap Growth Fund
| | | | | | | | |
| | | Year Ended
September 30, 2008 | | | Year Ended
September 30, 2007 | |
From Operations: | | | | | | | | |
Net investment loss | | $ | (637,739 | ) | | $ | (288,083 | ) |
Net realized gain (loss) on investments and foreign currency transactions | | | (16,800,881 | ) | | | 7,015,246 | |
Net change in net unrealized appreciation (depreciation) on investments and foreign currency translations | | | (24,348,831 | ) | | | 8,067,259 | |
| | | | | | | | |
Increase (decrease) in net assets from operations | | | (41,787,451 | ) | | | 14,794,422 | |
| | | | | | | | |
From Distributions to Shareholders: | | | | | | | | |
Net Investment Income: | | | | | | | | |
Institutional Class | | | — | | | | — | |
Retail Class | | | — | | | | — | |
Capital Gains: | | | | | | | | |
Institutional Class | | | — | | | | — | |
Retail Class | | | — | | | | — | |
| | | | | | | | |
Total distributions | | | — | | | | — | |
| | | | | | | | |
Increase (Decrease) in Net Assets Derived from Capital Shares Transactions (Note 8) | | | 133,294,170 | | | | (4,132,735 | ) |
| | | | | | | | |
Total increase in net assets | | | 91,506,719 | | | | 10,661,687 | |
Net Assets | | | | | | | | |
Beginning of year | | | 54,796,624 | | | | 44,134,937 | |
| | | | | | | | |
End of year | | $ | 146,303,343 | | | $ | 54,796,624 | |
| | | | | | | | |
Accumulated Net Investment Loss | | $ | (42,576 | ) | | $ | (38,169 | ) |
| | | | | | | | |
Small Cap Growth Fund
| | | | | | | | |
| | | Year Ended
September 30, 2008 | | | Year Ended
September 30, 2007 | |
From Operations: | | | | | | | | |
Net investment loss | | $ | (584,280 | ) | | $ | (143,375 | ) |
Net realized gain (loss) on investments | | | (6,171,517 | ) | | | 3,362,779 | |
Net change in net unrealized appreciation (depreciation) on investments | | | (10,322,096 | ) | | | 5,500,407 | |
| | | | | | | | |
Increase (decrease) in net assets from operations | | | (17,077,893 | ) | | | 8,719,811 | |
| | | | | | | | |
From Distributions to Shareholders: | | | | | | | | |
Net Investment Income: | | | | | | | | |
Institutional Class | | | — | | | | — | |
Retail Class | | | — | | | | — | |
Capital Gains: | | | | | | | | |
Institutional Class | | | — | | | | — | |
Retail Class | | | — | | | | — | |
| | | | | | | | |
Total distributions | | | — | | | | — | |
| | | | | | | | |
Increase in Net Assets Derived from Capital Shares Transactions (Note 8) | | | 92,473,941 | | | | 16,896,224 | |
| | | | | | | | |
Redemption Fees | | | | | | | | |
Institutional Class | | | 11,629 | | | | 346 | |
Retail Class | | | 17,229 | | | | 186 | |
| | | | | | | | |
Total increase in net assets | | | 75,424,906 | | | | 25,616,567 | |
Net Assets | | | | | | | | |
Beginning of year | | | 49,012,194 | | | | 23,395,627 | |
| | | | | | | | |
End of year | | $ | 124,437,100 | | | $ | 49,012,194 | |
| | | | | | | | |
Accumulated Net Investment Loss | | $ | (40,103 | ) | | $ | (35,571 | ) |
| | | | | | | | |
See accompanying notes to financial statements.
28
STATEMENTS OF CHANGES IN NET ASSETS – continued
Small Cap Value Fund
| | | | | | | | |
| | | Year Ended
September 30, 2008 | | | Year Ended
September 30, 2007 | |
From Operations: | | | | | | | | |
Net investment income | | $ | 3,447,311 | | | $ | 2,636,586 | |
Net realized gain (loss) on investments | | | (37,271,375 | ) | | | 100,922,002 | |
Net change in net unrealized appreciation (depreciation) on investments | | | (141,209,963 | ) | | | 34,456,656 | |
| | | | | | | | |
Increase (decrease) in net assets from operations | | | (175,034,027 | ) | | | 138,015,244 | |
| | | | | | | | |
From Distributions to Shareholders: | | | | | | | | |
Net Investment Income: | | | | | | | | |
Institutional Class | | | (1,132,960 | ) | | | (2,801,001 | ) |
Retail Class | | | — | | | | (1,058,622 | ) |
Admin Class | | | — | | | | (101,702 | ) |
Capital Gains: | | | | | | | | |
Institutional Class | | | (51,944,175 | ) | | | (50,563,842 | ) |
Retail Class | | | (47,065,282 | ) | | | (32,749,822 | ) |
Admin Class | | | (8,031,853 | ) | | | (7,983,100 | ) |
| | | | | | | | |
Total distributions | | | (108,174,270 | ) | | | (95,258,089 | ) |
| | | | | | | | |
Increase in Net Assets Derived from Capital Shares Transactions (Note 8) | | | 302,201,210 | | | | 235,053,214 | |
| | | | | | | | |
Redemption Fees | | | | | | | | |
Institutional Class | | | 20,568 | | | | 16,563 | |
Retail Class | | | 18,348 | | | | 13,201 | |
Admin Class | | | 3,084 | | | | 2,493 | |
| | | | | | | | |
Total increase in net assets | | | 19,034,913 | | | | 277,842,626 | |
Net Assets | | | | | | | | |
Beginning of year | | | 1,076,613,914 | | | | 798,771,288 | |
| | | | | | | | |
End of year | | $ | 1,095,648,827 | | | $ | 1,076,613,914 | |
| | | | | | | | |
Accumulated Net Investment Income | | $ | 1,842,018 | | | $ | 334,317 | |
| | | | | | | | |
See accompanying notes to financial statements.
29
THIS PAGE INTENTIONALLY LEFT BLANK
30
FINANCIAL HIGHLIGHTS
For a share outstanding throughout each period.
| | | | | | | | | | | | | | | | | | | | | | | | |
| | | | | Income (Loss) from Investment
Operations: | | | | | Less Distributions: |
| | | Net asset
value,
beginning
of
the period | | Net
investment
(loss)(c) | | | Net realized
and unrealized
gain (loss) | | | Total from
investment
operations | | | | | Dividends
from
net investment
income | | | Distributions
from net
realized
capital gains |
| Mid Cap Growth Fund | | | | | | | | | | | | | | | | | | | | | |
| | | | | | |
| Institutional Class | | | | | | | | | | | | | | | | | | | | | |
9/30/2008 | | $ | 27.51 | | $ | (0.10 | ) | | $ | (5.71 | ) | | $ | (5.81 | ) | | | | $ | — | | | $ | — |
9/30/2007 | | | 20.13 | | | (0.11 | )(d) | | | 7.49 | | | | 7.38 | | | | | | — | | | | — |
9/30/2006 | | | 19.00 | | | (0.10 | ) | | | 1.23 | | | | 1.13 | | | | | | — | | | | — |
9/30/2005 | | | 15.50 | �� | | (0.10 | ) | | | 3.78 | | | | 3.68 | | | | | | (0.18 | ) | | | — |
9/30/2004 | | | 13.69 | | | (0.13 | ) | | | 1.94 | | | | 1.81 | | | | | | — | | | | — |
| | | | | | | |
| Retail Class | | | | | | | | | | | | | | | | | | | | | | | | |
9/30/2008 | | $ | 26.84 | | $ | (0.15 | ) | | $ | (5.57 | ) | | $ | (5.72 | ) | | | | $ | — | | | $ | — |
9/30/2007 | | | 19.69 | | | (0.16 | )(d) | | | 7.31 | | | | 7.15 | | | | | | — | | | | — |
9/30/2006 | | | 18.63 | | | (0.15 | ) | | | 1.21 | | | | 1.06 | | | | | | — | | | | — |
9/30/2005 | | | 15.20 | | | (0.14 | ) | | | 3.70 | | | | 3.56 | | | | | | (0.13 | ) | | | — |
9/30/2004 | | | 13.46 | | | (0.16 | ) | | | 1.90 | | | | 1.74 | | | | | | — | | | | — |
(a) Had certain expenses not been reduced during the period, if applicable, total returns would have been lower. Periods less than one year, if applicable, are not annualized.
(b) The investment adviser and/or administrator agreed to reimburse a portion of the Fund’s expenses and/or reduce its fee during the period. Without this reimbursement/fee reduction, if applicable, expenses would have been higher.
(c) Per share net investment loss has been calculated using the average shares outstanding during the period.
(d) Includes a non-recurring payment of $0.02 per share.
(e) Computed on an annualized basis for periods less than one year, if applicable.
(f) Includes expense recapture of less than 0.01%.
See accompanying notes to financial statements.
31
| | | | | | | | | | | | | | | | | | | | | | |
| | | | | |
Ratios to Average Net Assets: |
| | | | | | | |
Total
distributions | | | Net asset
value,
end of
the period | | Total
return (%)(a) | | | Net assets,
end of
the period
(000’s) | | Net
expenses (%)(b)(e) | | | Gross
expenses (%)(e) | | | Net investment
income (loss) (%)(e) | | | Portfolio
turnover
rate (%) |
| | | | | | | | | | | | | | | | | | | | | | |
| | | | | | | |
| | | | | | | | | | | | | | | | | | | | | | |
| $ | — | | | $ | 21.70 | | (21.1 | ) | | $ | 25,779 | | 1.00 | (f) | | 1.00 | (f) | | (0.36 | ) | | 299 |
| | — | | | | 27.51 | | 36.7 | | | | 24,143 | | 1.00 | | | 1.10 | | | (0.47 | ) | | 194 |
| | — | | | | 20.13 | | 6.0 | | | | 17,467 | | 1.00 | | | 1.12 | | | (0.49 | ) | | 211 |
| | (0.18 | ) | | | 19.00 | | 23.9 | | | | 26,159 | | 1.00 | | | 1.21 | | | (0.60 | ) | | 280 |
| | — | | | | 15.50 | | 13.2 | | | | 25,191 | | 1.00 | | | 1.17 | | | (0.84 | ) | | 284 |
| | | | | | | |
| | | | | | | | | | | | | | | | | | | | | | |
| $ | — | | | $ | 21.12 | | (21.3 | ) | | $ | 120,524 | | 1.25 | | | 1.32 | | | (0.58 | ) | | 299 |
| | — | | | | 26.84 | | 36.3 | | | | 30,654 | | 1.25 | | | 1.43 | | | (0.71 | ) | | 194 |
| | — | | | | 19.69 | | 5.7 | | | | 26,668 | | 1.25 | | | 1.52 | | | (0.72 | ) | | 211 |
| | (0.13 | ) | | | 18.63 | | 23.6 | | | | 25,802 | | 1.25 | | | 1.50 | | | (0.85 | ) | | 280 |
| | — | | | | 15.20 | | 12.9 | | | | 25,382 | | 1.25 | | | 1.42 | | | (1.10 | ) | | 284 |
See accompanying notes to financial statements.
32
FINANCIAL HIGHLIGHTS – continued
For a share outstanding throughout each period.
| | | | | | | | | | | | | | | | | | | | | | | | | | | | | |
| | | | | Income (Loss) from Investment
Operations: | | | | | Less Distributions: | |
| | | Net asset
value,
beginning
of
the period | | Net
investment
income
(loss)(c)(d) | | | Net realized
and unrealized
gain (loss) | | | Total from
investment
operations | | | | | Dividends
from
net investment
income | | | Distributions
from net
realized
capital gains | | | Total
distributions | |
| Small Cap Growth Fund | | | | | | | | | | | | | | | | | | | | | | | |
| | | | | | | |
| Institutional Class | | | | | | | | | | | | | | | | | | | | | | | | | | |
9/30/2008 | | $ | 15.87 | | $ | (0.07 | ) | | $ | (2.73 | ) | | $ | (2.80 | ) | | | | $ | — | | | $ | — | | | $ | — | |
9/30/2007 | | | 12.00 | | | (0.06 | )(f) | | | 3.93 | | | | 3.87 | | | | | | — | | | | — | | | | — | |
9/30/2006 | | | 11.08 | | | (0.08 | ) | | | 0.99 | | | | 0.91 | | | | | | — | | | | — | | | | — | |
9/30/2005 | | | 8.96 | | | (0.08 | ) | | | 2.20 | | | | 2.12 | | | | | | — | | | | — | | | | — | |
9/30/2004 | | | 8.59 | | | (0.09 | ) | | | 0.46 | | | | 0.37 | | | | | | — | | | | — | | | | — | |
| | | | | | | |
| Retail Class | | | | | | | | | | | | | | | | | | | | | | | | | | |
9/30/2008 | | $ | 15.45 | | $ | (0.10 | ) | | $ | (2.66 | ) | | $ | (2.76 | ) | | | | $ | — | | | $ | — | | | $ | — | |
9/30/2007 | | | 11.71 | | | (0.09 | )(f) | | | 3.83 | | | | 3.74 | | | | | | — | | | | — | | | | — | |
9/30/2006 | | | 10.84 | | | (0.11 | ) | | | 0.97 | | | | 0.86 | | | | | | — | | | | — | | | | — | |
9/30/2005 | | | 8.78 | | | (0.11 | ) | | | 2.17 | | | | 2.06 | | | | | | — | | | | — | | | | — | |
9/30/2004 | | | 8.45 | | | (0.11 | ) | | | 0.44 | | | | 0.33 | | | | | | — | | | | — | | | | — | |
| | | | | | |
| Small Cap Value Fund | | | | | | | | | | | | | | | | | | | | | | | |
| | | | | | | |
| Institutional Class | | | | | | | | | | | | | | | | | | | | | | | | | | |
9/30/2008 | | $ | 28.77 | | $ | 0.11 | (i) | | $ | (4.03 | ) | | $ | (3.92 | ) | | | | $ | (0.06 | ) | | $ | (2.78 | ) | | $ | (2.84 | ) |
9/30/2007 | | | 27.69 | | | 0.12 | (f)(g) | | | 4.29 | | | | 4.41 | | | | | | (0.17 | ) | | | (3.16 | ) | | | (3.33 | ) |
9/30/2006 | | | 27.43 | | | 0.13 | | | | 2.70 | | | | 2.83 | | | | | | (0.15 | ) | | | (2.42 | ) | | | (2.57 | ) |
9/30/2005 | | | 25.75 | | | 0.13 | | | | 4.22 | | | | 4.35 | | | | | | (0.02 | ) | | | (2.65 | ) | | | (2.67 | ) |
9/30/2004 | | | 21.34 | | | 0.04 | | | | 4.97 | | | | 5.01 | | | | | | (0.05 | ) | | | (0.55 | ) | | | (0.60 | ) |
| | | | | | | |
| Retail Class | | | | | | | | | | | | | | | | | | | | | | | | | | |
9/30/2008 | | $ | 28.52 | | $ | 0.05 | (i) | | $ | (4.00 | ) | | $ | (3.95 | ) | | | | $ | — | | | $ | (2.78 | ) | | $ | (2.78 | ) |
9/30/2007 | | | 27.46 | | | 0.04 | (f)(g) | | | 4.28 | | | | 4.32 | | | | | | (0.10 | ) | | | (3.16 | ) | | | (3.26 | ) |
9/30/2006 | | | 27.23 | | | 0.06 | | | | 2.67 | | | | 2.73 | | | | | | (0.08 | ) | | | (2.42 | ) | | | (2.50 | ) |
9/30/2005 | | | 25.62 | | | 0.06 | | | | 4.20 | | | | 4.26 | | | | | | — | | | | (2.65 | ) | | | (2.65 | ) |
9/30/2004 | | | 21.25 | | | (0.02 | ) | | | 4.95 | | | | 4.93 | | | | | | (0.01 | ) | | | (0.55 | ) | | | (0.56 | ) |
| | | | | | | |
| Admin Class | | | | | | | | | | | | | | | | | | | | | | | | | | |
9/30/2008 | | $ | 28.13 | | $ | (0.01 | )(i) | | $ | (3.94 | ) | | $ | (3.95 | ) | | | | $ | — | | | $ | (2.78 | ) | | $ | (2.78 | ) |
9/30/2007 | | | 27.14 | | | (0.03 | )(f)(g) | | | 4.22 | | | | 4.19 | | | | | | (0.04 | ) | | | (3.16 | ) | | | (3.20 | ) |
9/30/2006 | | | 26.94 | | | (0.01 | ) | | | 2.65 | | | | 2.64 | | | | | | (0.02 | ) | | | (2.42 | ) | | | (2.44 | ) |
9/30/2005 | | | 25.43 | | | (0.00 | ) | | | 4.16 | | | | 4.16 | | | | | | — | | | | (2.65 | ) | | | (2.65 | ) |
9/30/2004 | | | 21.13 | | | (0.08 | ) | | | 4.93 | | | | 4.85 | | | | | | — | | | | (0.55 | ) | | | (0.55 | ) |
(a) Had certain expenses not been reduced during the period, if applicable, total returns would have been lower. Periods less than one year, if applicable, are not annualized.
(b) The investment adviser and/or administrator agreed to reimburse a portion of the Fund’s expenses and/or reduce its fees during the period. Without this reimbursement/fee reduction, if applicable, expenses would have been higher.
(c) Per share net investment income (loss) has been calculated using the average shares outstanding during the period.
(d) Amount rounds to less than $0.01 per share, if applicable.
(e) Includes expense recapture of 0.02%.
(f) Includes a non-recurring payment of $0.01 per share and $0.00 per share for Small Cap Growth Fund and Small Cap Value Fund, respectively.
(g) Includes a non-recurring dividend of $0.05 per share.
(h) Computed on an annualized basis for periods less than one year, if applicable.
(i) Includes a special dividend of $0.02 per share in which the source of the dividend has not been determined by the issuer.
See accompanying notes to financial statements.
33
| | | | | | | | | | | | | | | | | | | | | |
| | | | | |
| | | | | | | | | | Ratios to Average Net Assets: | | | |
| | | | | | | |
Redemption
fees(d) | | Net asset
value,
end of
the period | | Total
return (%)(a) | | | Net assets,
end of
the period
(000’s) | | Net
expenses (%)(b)(h) | | | Gross
expenses (%)(h) | | | Net investment
income (loss) (%)(h) | | | Portfolio
turnover
rate (%) |
| | | | | | | | | | | | | | | | | | | | | |
| | | | | | | |
| | | | | | | | | | | | | | | | | | | | | |
| $ | 0.00 | | $ | 13.07 | | (17.6 | ) | | $ | 44,540 | | 1.00 | | | 1.01 | | | (0.47 | ) | | 92 |
| | 0.00 | | | 15.87 | | 32.3 | | | | 28,088 | | 1.00 | | | 1.23 | | | (0.47 | ) | | 83 |
| | 0.01 | | | 12.00 | | 8.3 | | | | 20,414 | | 1.00 | | | 1.38 | | | (0.69 | ) | | 100 |
| | 0.00 | | | 11.08 | | 23.7 | | | | 15,785 | | 1.00 | | | 1.70 | | | (0.85 | ) | | 227 |
| | 0.00 | | | 8.96 | | 4.3 | | | | 15,867 | | 1.00 | | | 1.31 | | | (0.95 | ) | | 217 |
| | | | | | | |
| | | | | | | | | | | | | | | | | | | | | |
| $ | 0.00 | | $ | 12.69 | | (17.9 | ) | | $ | 79,897 | | 1.25 | | | 1.42 | | | (0.70 | ) | | 92 |
| | 0.00 | | | 15.45 | | 31.9 | | | | 20,924 | | 1.25 | | | 1.50 | | | (0.66 | ) | | 83 |
| | 0.01 | | | 11.71 | | 8.0 | | | | 2,981 | | 1.25 | | | 1.92 | | | (0.94 | ) | | 100 |
| | 0.00 | | | 10.84 | | 23.5 | | | | 3,592 | | 1.25 | | | 1.87 | | | (1.14 | ) | | 227 |
| | 0.00 | | | 8.78 | | 3.9 | | | | 14,589 | | 1.25 | | | 1.52 | | | (1.19 | ) | | 217 |
| | | | | | | |
| | | | | | | | | | | | | | | | | | | | | |
| | | | | | | |
| | | | | | | | | | | | | | | | | | | | | |
| $ | 0.00 | | $ | 22.01 | | (15.0 | ) | | $ | 553,268 | | 0.89 | | | 0.89 | | | 0.47 | | | 61 |
| | 0.00 | | | 28.77 | | 17.0 | | | | 534,776 | | 0.89 | | | 0.89 | | | 0.43 | | | 57 |
| | 0.00 | | | 27.69 | | 11.2 | | | | 442,714 | | 0.89 | (e) | | 0.89 | (e) | | 0.47 | | | 62 |
| | 0.00 | | | 27.43 | | 18.0 | | | | 403,110 | | 0.90 | | | 0.93 | | | 0.48 | | | 59 |
| | 0.00 | | | 25.75 | | 23.8 | | | | 346,356 | | 0.90 | | | 0.93 | | | 0.16 | | | 70 |
| | | | | | | |
| | | | | | | | | | | | | | | | | | | | | |
| $ | 0.00 | | $ | 21.79 | | (15.2 | ) | | $ | 464,525 | | 1.15 | | | 1.27 | | | 0.21 | | | 61 |
| | 0.00 | | | 28.52 | | 16.7 | | | | 465,055 | | 1.15 | | | 1.24 | | | 0.15 | | | 57 |
| | 0.00 | | | 27.46 | | 10.9 | | | | 291,690 | | 1.15 | | | 1.20 | | | 0.21 | | | 62 |
| | 0.00 | | | 27.23 | | 17.7 | | | | 235,948 | | 1.15 | | | 1.20 | | | 0.24 | | | 59 |
| | 0.00 | | | 25.62 | | 23.5 | | | | 173,411 | | 1.15 | | | 1.18 | | | (0.08 | ) | | 70 |
| | | | | | | |
| | | | | | | | | | | | | | | | | | | | | |
| $ | 0.00 | | $ | 21.40 | | (15.4 | ) | | $ | 77,855 | | 1.40 | | | 1.68 | | | (0.04 | ) | | 61 |
| | 0.00 | | | 28.13 | | 16.4 | | | | 76,783 | | 1.40 | | | 1.56 | | | (0.10 | ) | | 57 |
| | 0.00 | | | 27.14 | | 10.6 | | | | 64,367 | | 1.40 | | | 1.46 | | | (0.04 | ) | | 62 |
| | 0.00 | | | 26.94 | | 17.4 | | | | 67,505 | | 1.40 | | | 1.43 | | | (0.01 | ) | | 59 |
| | 0.00 | | | 25.43 | | 23.3 | | | | 62,680 | | 1.40 | | | 1.43 | | | (0.33 | ) | | 70 |
See accompanying notes to financial statements.
34
NOTES TO FINANCIAL STATEMENTS
September 30, 2008
1. Organization. Loomis Sayles Funds I and Loomis Sayles Funds II (the “Trusts” and each a “Trust”) are each organized as a Massachusetts business trust. Each Trust is registered under the Investment Company Act of 1940, as amended (the “1940 Act”), as an open-end management investment company. Each Declaration of Trust permits the Board of Trustees to authorize the issuance of an unlimited number of shares of the Trusts in multiple series. Information presented in these financial statements pertains to certain equity funds of the Trusts; the financial statements for the remaining equity funds and the fixed income funds of the Trusts are presented in separate reports. The following funds (individually, a “Fund” and collectively, the “Funds”) are included in this report:
Loomis Sayles Funds I:
Loomis Sayles Small Cap Value Fund (the “Small Cap Value Fund”)
Loomis Sayles Funds II:
Loomis Sayles Mid Cap Growth Fund (the “Mid Cap Growth Fund”)
Loomis Sayles Small Cap Growth Fund (the “Small Cap Growth Fund”)
Each Fund offers Institutional Class Shares and Retail Class Shares. In addition, Small Cap Value Fund offers Admin Class Shares.
Most expenses of the Trusts can be directly attributed to a fund. Expenses which cannot be directly attributed to a fund are generally apportioned based on the relative net assets of each of the funds in the Trusts. Expenses of a fund are borne pro rata by the holders of each class of shares, except that each class bears expenses unique to that class (including the Rule 12b-1 service and distribution fees and transfer agent fees applicable to such class). In addition, each class votes as a class only with respect to its own Rule 12b-1 Plan. Shares of each class would receive their pro rata share of the net assets of a fund if the fund were liquidated. The Trustees approve separate dividends from net investment income on each class of shares.
2. Significant Accounting Policies. The following is a summary of significant accounting policies consistently followed by each Fund in the preparation of its financial statements. The Funds’ financial statements are prepared in accordance with accounting principles generally accepted in the United States of America which require the use of management estimates that affect the reported amounts and disclosures in the financial statements. Actual results could differ from those estimates.
a. Security Valuation. Equity securities, including closed-end investment companies and exchange-traded funds, for which market quotations are readily available are valued at market value, as reported by pricing services recommended by the investment adviser and approved by the Board of Trustees. Such pricing services generally use the security’s last sale price on the exchange or market where the security is primarily traded or, if there is no reported sale during the day, the closing bid price. Securities traded on the NASDAQ Global Select Market, NASDAQ Global Market and NASDAQ Capital Market are valued at the NASDAQ Official Closing Price (“NOCP”), or if lacking a NOCP, at the most recent bid quotation on the applicable NASDAQ Market. Debt securities (other than short-term obligations purchased with an original or remaining maturity of sixty days or less) are generally valued on the basis of evaluated bids furnished to the Funds by a pricing service recommended by the investment adviser and approved by the Board of Trustees, which service determines valuations for normal, institutional-size trading units of such securities using market information, transactions for comparable securities and various relationships between securities which are generally recognized by institutional traders. Broker-dealer bid quotations may also be used to value debt and equity securities where a pricing service does not price a security or where a pricing service does not provide a reliable price for the security. In instances where broker-dealer bid quotations are not available, certain securities held by the Funds may be valued on the basis of a price provided by a principal market maker. Short-term obligations purchased with an original or remaining maturity of sixty days or less are valued at amortized cost, which approximates market value. Securities for which market quotations are not readily available are valued at fair value as determined in good faith by the Funds’ investment adviser using consistently applied procedures under the general supervision of the Board of Trustees. Investments in other open-end investment companies are valued at their net asset value each day.
The Funds may hold securities traded in foreign markets. Foreign securities are valued at the market price in the foreign market. However, if events occurring after the close of the foreign market (but before the close of regular trading on the New York Stock Exchange) are believed to materially affect the value of those securities, such securities are fair valued pursuant to procedures approved by the Board of Trustees. When fair valuing securities, the Funds may, among other things, use modeling tools or other processes that may take into account factors such as securities market activity and/or significant events that occur after the close of the foreign market and before the Funds calculate their net asset values.
b. Security Transactions and Related Investment Income. Security transactions are accounted for on trade date. Dividend income is recorded on ex-dividend date, or in the case of certain foreign securities, as soon as the Fund is notified, and interest income is
35
recorded on an accrual basis. Interest income is increased by the accretion of discount and decreased by the amortization of premium. Distributions received from investments in securities that represent a return of capital or capital gain are recorded as a reduction of cost of investments or as a realized gain, respectively. The calendar year-end amounts of ordinary income, capital gains, and return of capital included in distributions received from the Funds’ investments in real estate investment trusts (“REITs”) are reported to the Funds after the end of the fiscal year; accordingly, the Funds estimate these amounts for accounting purposes until the characterization of REIT distributions is reported to the Funds after the end of the fiscal year. Estimates are based on the most recent REIT distribution information available. Investment income is recorded net of foreign taxes withheld when applicable. In determining net gain or loss on securities sold, the cost of securities has been determined on an identified cost basis. Investment income, non-class specific expenses and realized and unrealized gains and losses are allocated on a pro rata basis to each class based on the relative net assets of each class to the total net assets of the Fund.
c. Foreign Currency Translation. The books and records of the Funds are maintained in U.S. dollars. The value of securities, currencies and other assets and liabilities denominated in currencies other than U.S. dollars are translated into U.S. dollars based upon foreign exchange rates prevailing at the end of the period. Purchases and sales of investment securities, income and expenses are translated on the respective dates of such transactions.
Since the values of investment securities are presented at the foreign exchange rates prevailing at the end of the period, it is not practical to isolate that portion of the results of operations arising from changes in exchange rates from fluctuations which arise due to changes in market prices of the investment securities. Such changes are included with the net realized and unrealized gain or loss on investments.
Net realized foreign exchange gains or losses arise from sales of foreign currency, currency gains or losses realized between the trade and settlement dates on securities transactions and the difference between the amounts of dividends, interest and foreign withholding taxes recorded on the Funds’ books and the U.S. dollar equivalent of the amounts actually received or paid. Net unrealized foreign exchange gains and losses arise from changes in the value of assets and liabilities, other than investment securities, at the end of the fiscal period, resulting from changes in exchange rates.
Each Fund may use foreign currency exchange contracts to facilitate transactions in foreign-denominated investments. Losses may arise from changes in the value of the foreign currency or if the counterparties do not perform under the contracts’ terms.
Each Fund may purchase investments of foreign issuers. Investing in securities of foreign issuers involves special risks and considerations not typically associated with investing in U.S. companies and securities of the U.S. government. These risks include revaluation of currencies and the risk of appropriation. Moreover, the markets for securities of many foreign issuers may be less liquid and the price of such securities may be more volatile than those of comparable U.S. companies and the U.S. government.
d. Forward Foreign Currency Contracts. Each Fund may enter into forward foreign currency contracts. Contracts to buy generally are used to acquire exposure to foreign currencies, while contracts to sell generally are used to hedge a Fund’s investments against currency fluctuation. Also, a contract to buy or sell can offset a previous contract. These contracts involve market risk in excess of the unrealized gain or loss reflected in the Fund’s Statement of Assets and Liabilities. The U.S. dollar value of the currencies a Fund has committed to buy or sell represents the aggregate exposure to each currency the Fund has acquired or hedged through currency contracts outstanding at period end.
All contracts are “marked-to-market” daily at the applicable exchange rates and any gains or losses are recorded for financial statement purposes as unrealized until settlement date. Risks may arise upon entering into these contracts from the potential inability of counterparties to meet the terms of their contracts and from unanticipated movements in the value of a foreign currency relative to the U.S. dollar. At September 30, 2008, there were no open forward currency contracts.
e. Federal and Foreign Income Taxes. Each Trust treats each Fund as a separate entity for federal income tax purposes. Each Fund intends to meet the requirements of the Internal Revenue Code applicable to regulated investment companies, and to distribute to its shareholders substantially all of its net investment income and any net realized capital gains at least annually. Management has performed an analysis of the Funds’ tax positions taken on federal and state tax returns that remain subject to examinations (tax years ended September 30, 2005-2008) and has concluded that no provisions for income tax are required. Fund management is not aware of any events that are reasonably possible to occur in the next twelve months that would result in the amounts of any unrecognized tax benefits significantly increasing or decreasing for the Funds. However, management’s conclusions regarding tax positions taken may be subject to review and adjustment at a later date based on factors including, but not limited to, new tax laws and accounting regulations and interpretations thereof.
A Fund may be subject to foreign taxes on income and gains on investments that are accrued based upon the Fund’s understanding of the tax rules and regulations that exist in the countries in which the Fund invests. Foreign governments may also impose taxes or other payments on investments with respect to foreign securities. Such taxes are accrued as applicable.
36
NOTES TO FINANCIAL STATEMENTS – continued
September 30, 2008
f. Dividends and Distributions to Shareholders. Dividends and distributions are recorded on ex-dividend date. The timing and characterization of certain income and capital gain distributions are determined annually in accordance with federal tax regulations, which may differ from accounting principles generally accepted in the United States of America. Permanent differences are primarily due to differing treatments for book and tax purposes for items such as distributions from REITs, foreign currency transactions and net operating losses. Permanent book and tax basis differences relating to shareholder distributions will result in reclassifications to capital accounts. Temporary differences between book and tax distributable earnings are primarily due to securities lending collateral gain/loss adjustment, deferred Trustees’ fees, REIT basis adjustments and wash sales. Distributions from net investment income and short-term capital gains are considered to be distributed from ordinary income for tax purposes.
The tax characterization of distributions is determined on an annual basis. The tax character of distributions paid to shareholders during the years ended September 30, 2008 and 2007 was as follows:
| | | | | | | | | | | | | | | | | | |
| | | 2008 Distributions Paid From: | | 2007 Distributions Paid From: |
Fund | | Ordinary
Income | | Long-Term
Capital Gains | | Total | | Ordinary
Income | | Long-Term
Capital Gains | | Total |
Mid Cap Growth Fund | | $ | — | | $ | — | | $ | — | | $ | — | | $ | — | | $ | — |
Small Cap Growth Fund | | | — | | | — | | | — | | | — | | | — | | | — |
Small Cap Value Fund | | | 16,873,484 | | | 91,300,786 | | | 108,174,270 | | | 19,298,487 | | | 75,959,602 | | | 95,258,089 |
Differences between these amounts and those reported in the Statements of Changes in Net Assets are primarily attributable to different book and tax treatment for short-term capital gains.
As of September 30, 2008, the components of distributable earnings on a tax basis were as follows:
| | | | | | | | | | | | |
| | | Mid Cap
Growth Fund | | | Small Cap
Growth Fund | | | Small Cap
Value Fund | |
Undistributed ordinary income | | $ | — | | | $ | — | | | $ | 1,955,507 | |
Undistributed long-term capital gains | | | — | | | | — | | | | 331,178 | |
| | | | | | | | | | | | |
Total undistributed earnings | | | — | | | | — | | | | 2,286,685 | |
Capital Loss Carryforward: | | | | | | | | | | | | |
Expires September 30, 2010 | | | (65,130,772 | ) | | | (138,314,515 | ) | | | — | |
Expires September 30, 2011 | | | (21,142,388 | ) | | | (59,283,040 | ) | | | — | |
Total capital loss carryforward | | | (86,273,160 | ) | | | (197,597,555 | ) | | | — | |
Deferred net capital losses
(post-October 2007) | | | (18,347,531 | ) | | | (7,364,469 | ) | | | (47,743,728 | ) |
Unrealized appreciation
(depreciation) | | | (11,623,796 | ) | | | (2,566,582 | ) | | | 23,648,246 | |
| | | | | | | | | | | | |
Total accumulated earnings
(losses) | | $ | (116,244,487 | ) | | $ | (207,528,606 | ) | | $ | (21,808,797 | ) |
| | | | | | | | | | | | |
Capital loss carryforward
utilized in the current year | | $ | 1,847,474 | | | $ | 1,209,729 | | | $ | — | |
| | | | | | | | | | | | |
g. Repurchase Agreements. Each Fund, through its custodian, receives delivery of the underlying securities collateralizing repurchase agreements. It is each Fund’s policy that the market value of the collateral be at least equal to 102% of the repurchase price, including interest. The repurchase agreements are tri-party arrangements whereby the collateral is held at the custodian bank in a segregated account for the benefit of the Fund and on behalf of the counterparty. Repurchase agreements could involve certain risks in the event of default or insolvency of the counterparty including possible delays or restrictions upon a Fund’s ability to dispose of the underlying securities.
h. Securities Lending. The Funds have entered into an agreement with State Street Bank and Trust Company (“State Street Bank”), as agent of the Funds, to lend securities to certain designated borrowers. The loans are collateralized with cash or securities in an amount equal to at least 105% or 102% of the market value of the loaned international or domestic securities, respectively, when the loan is initiated. Thereafter, the value of the collateral must remain at least 102% of the market value of loaned securities for U.S. equities and U.S. corporate debt; at least 105% of the market value of loaned securities for non-U.S. equities; and at least 100% of the market value of loaned securities for U.S. government securities, sovereign debt issued by non-U.S. governments and non-U.S. corporate debt. In the event that the market value of the collateral falls below the required percentages described above, the borrower will deliver additional collateral on the next business day. As with other extensions of credit, the Funds may bear the risk of loss with respect to the investment of the collateral. The Funds invest cash collateral in short-term investments, a portion of the income from which is remitted to the borrowers and the remainder allocated between the Funds and State Street Bank as
37
lending agent. The value of securities on loan to borrowers and the value of collateral held by the Funds with respect to such loans at September 30, 2008 were as follows:
| | | | | | |
| | | Value of
Securities on Loan | | Value of
Collateral |
Mid Cap Growth Fund | | $ | 22,615,127 | | $ | 22,705,247 |
Small Cap Growth Fund | | | 22,689,377 | | | 22,691,148 |
Small Cap Value Fund | | | 197,462,353 | | | 195,864,078 |
Subsequent to September 30, 2008, all open securities lending transactions were closed.
i. Indemnifications. Under the Trusts’ organizational documents, their officers and Trustees are indemnified against certain liabilities arising out of the performance of their duties to the Funds. Additionally, in the normal course of business, the Funds enter into contracts with service providers that contain general indemnification clauses. The Funds’ maximum exposure under these arrangements is unknown as this would involve future claims that may be made against the Funds that have not yet occurred. However, based on experience, the Funds expect the risk of loss to be remote.
j. New Accounting Pronouncement. In September 2006, Statement of Financial Accounting Standards No. 157, Fair Value Measurements (“FAS 157”), was issued and is effective for fiscal years beginning after November 15, 2007. FAS 157 defines fair value, establishes a framework for measuring fair value and expands disclosures about fair value measurements. Management has evaluated the impact the adoption of FAS 157 will have on the Funds’ financial statements and believes that such impact will be limited to expanded disclosure in the Funds’ financial statements regarding inputs used in determining the value of the Funds’ investments.
In March 2008, Statement of Financial Accounting Standards No. 161, Disclosures about Derivative Instruments and Hedging Activities (“FAS 161”), was issued and will be effective for fiscal years and interim periods beginning after November 15, 2008. FAS 161 requires enhanced disclosures about funds’ derivative and hedging activities. Management is currently evaluating the impact the adoption of FAS 161 will have on the Funds’ financial statement disclosures.
3. Purchases and Sales of Securities. For the year ended September 30, 2008, purchases and sales of securities (excluding short-term investments) were as follows:
| | | | | | |
Fund | | Purchases | | Sales |
Mid Cap Growth Fund | | $ | 461,496,904 | | $ | 336,296,687 |
Small Cap Growth Fund | | | 175,639,765 | | | 84,821,824 |
Small Cap Value Fund | | | 860,871,284 | | | 625,425,569 |
4. Management Fees and Other Transactions with Affiliates.
a. Management Fees. Loomis, Sayles & Company, L.P. (“Loomis Sayles”) serves as investment adviser to each Fund. Under the terms of the management agreements, each Fund pays a management fee at the following annual rates, calculated daily and payable monthly, based on each Fund’s average daily net assets:
| | |
Fund | | Percentage of
Average Daily
Net Assets |
Mid Cap Growth Fund | | 0.75% |
Small Cap Growth Fund | | 0.75% |
Small Cap Value Fund | | 0.75% |
Loomis Sayles has given binding undertakings to the Funds to reduce management fees and/or reimburse certain expenses associated with the Funds to limit their operating expenses. These undertakings are in effect until January 31, 2009 and will be reevaluated on an annual basis. For the year ended September 30, 2008, the expense limits as a percentage of average daily net assets under the expense limitation agreements were as follows:
| | | | | | | | | |
| | | Expense Limit as a Percentage of
Average Daily Net Assets | |
Fund | | Institutional Class | | | Retail Class | | | Admin Class | |
Mid Cap Growth Fund | | 1.00 | % | | 1.25 | % | | — | |
Small Cap Growth Fund | | 1.00 | % | | 1.25 | % | | — | |
Small Cap Value Fund | | 0.90 | % | | 1.15 | % | | 1.40 | % |
38
NOTES TO FINANCIAL STATEMENTS – continued
September 30, 2008
For the year ended September 30, 2008, the management fees for each Fund were as follows:
| | | | | |
Fund | | Management
Fee | | Percentage of
Average Daily
Net Assets |
Mid Cap Growth Fund | | $ | 909,027 | | 0.75% |
Small Cap Growth Fund | | | 726,130 | | 0.75% |
Small Cap Value Fund | | | 8,053,932 | | 0.75% |
For the year ended September 30, 2008, class specific expenses have been reimbursed as follows:
| | | |
Fund | | Reimbursement |
Mid Cap Growth Fund | | $ | 64,519 |
Small Cap Growth Fund | | | 95,181 |
Small Cap Value Fund | | | 767,446 |
Loomis Sayles shall be permitted to recover expenses it has borne under the expense limitation agreement (whether through reduction of its management fees or otherwise) on a class by class basis in later periods to the extent the expenses of a class fall below a class’ expense limits, provided, however, that a class is not obligated to pay such reduced fees/expenses more than one year after the end of the fiscal year in which the fee/expense was reduced. The amounts subject to possible reimbursement under the expense limitation agreements at September 30, 2008 were as follows:
| | | | | | | | | | | | |
| | | Expenses Subject to Possible Reimbursement Until
September 30, 2009 |
Fund | | Institutional Class | | Retail Class | | Admin Class | | Total |
Mid Cap Growth Fund | | $ | — | | $ | 64,519 | | $ | — | | $ | 64,519 |
Small Cap Growth Fund | | | 2,492 | | | 92,689 | | | — | | | 95,181 |
Small Cap Value Fund | | | — | | | 546,480 | | | 220,966 | | | 767,446 |
Certain officers and employees of Loomis Sayles are also officers or Trustees of the Trust. Loomis Sayles’ general partner is indirectly owned by Natixis Global Asset Management, L.P. (“Natixis US”), which is part of Natixis Global Asset Management, an international asset management group based in Paris, France.
For the year ended September 30, 2008, Loomis Sayles reimbursed the Mid Cap Growth Fund $1,112 for losses incurred in connection with a trading error.
b. Administrative Fees. Natixis Asset Management Advisors, L.P. (“Natixis Advisors”) provides certain administrative services for the Funds and subcontracts with State Street Bank to serve as sub-administrator. Natixis Advisors is a wholly-owned subsidiary of Natixis US. Pursuant to an agreement among Natixis Funds Trust I, Natixis Funds Trust II, Natixis Funds Trust III, Natixis Funds Trust IV, Natixis Cash Management Trust, Gateway Trust (“Natixis Funds Trusts”), Loomis Sayles Funds I, Loomis Sayles Funds II (“Loomis Sayles Funds Trusts”), Hansberger International Series and Natixis Advisors, each Fund pays Natixis Advisors monthly its pro rata portion of fees equal to an annual rate of 0.0575% of the first $15 billion of the average daily net assets of the Natixis Funds Trusts, Loomis Sayles Funds Trusts and the Hansberger International Series, 0.0500% of the next $15 billion, 0.0425% of the next $30 billion and 0.0375% of such assets in excess of $60 billion, subject to an annual aggregate minimum fee for the Natixis Funds Trusts , Loomis Sayles Funds Trusts and the Hansberger International Series of $10 million, which is reevaluated on an annual basis. New funds are subject to an annual fee of $75,000 plus $12,500 per class and an additional $75,000 if managed by multiple subadvisors in their first calendar year of operations.
Effective October 1, 2007, State Street Bank agreed to reduce the fees it receives from Natixis Advisors for serving as sub-administrator to the Funds. Also, effective October 1, 2007, Natixis Advisors gave a binding contractual undertaking to the Funds to waive the administrative fees paid by the Funds in an amount equal to the reduction in sub-administrative fees discussed above. The waiver was in effect through June 30, 2008.
Prior to July 1, 2008, the Funds paid Natixis Advisors monthly its pro rata portion of fees equal to an annual rate of 0.0675% of the first $5 billion of the average daily net assets of the Natixis Funds Trusts, Loomis Sayles Funds Trusts and the Hansberger International Series, 0.0625% of the next $5 billion, 0.0500% of the next $20 billion and 0.045% of such assets in excess of $30 billion, subject to an annual aggregate minimum fee for the Natixis Funds Trusts, Loomis Sayles Funds Trusts and the Hansberger International Series of $5 million, which was reevaluated on an annual basis. New funds were subject to an annual fee of $50,000 plus $12,500 per class and an additional $50,000 if managed by multiple subadvisors in their first calendar year of operations.
39
For the year ended September 30, 2008, amounts paid to Natixis Advisors for administrative fees were as follows:
| | | | | | | | | |
Fund | | Gross
Administrative
Fees | | Waiver of
Administrative
Fees | | Net
Administrative
Fees |
Mid Cap Growth Fund | | $ | 61,279 | | $ | 2,046 | | $ | 59,233 |
Small Cap Growth Fund | | | 49,032 | | | 1,709 | | | 47,323 |
Small Cap Value Fund | | | 546,547 | | | 20,880 | | | 525,667 |
c. Service and Distribution Fees. Natixis Distributors, L.P. (“Natixis Distributors”), a wholly owned subsidiary of Natixis US, has entered into a distribution agreement with the Trust. Pursuant to this agreement, Natixis Distributors serves as principal underwriter of each Fund.
Pursuant to Rule 12b-1 under the 1940 Act, the Mid Cap Growth Fund, the Small Cap Growth Fund and the Small Cap Value Fund have adopted a Distribution Plan relating to their Retail Class shares (the “Retail Class Plans”) and the Small Cap Value Fund has adopted a separate Distribution Plan relating to its Admin Class shares (the “Admin Class Plan”).
Under the respective Retail Class and Admin Class Plans, each Fund pays Natixis Distributors a monthly distribution fee at an annual rate not to exceed 0.25% of the average daily net assets attributable to the Fund’s Retail Class and Admin Class Shares, as reimbursement for expenses incurred by Natixis Distributors in providing personal services to investors in Retail Class and Admin Class Shares and/or maintenance of shareholder accounts. In addition, the Admin Class shares of the Small Cap Value Fund may pay an administrative service fee, at an annual rate not to exceed 0.25% of the average daily net assets attributable to Admin Class shares, to securities dealers or financial intermediaries for providing personal service and account maintenance for their customers who hold such shares.
For the year ended September 30, 2008, the Funds paid the following service and distribution fees:
| | | | | | | | | |
| | | Service Fees | | Distribution Fees |
Fund | | Admin
Class | | Retail
Class | | Admin
Class |
Mid Cap Growth Fund | | $ | — | | $ | 228,997 | | $ | — |
Small Cap Growth Fund | | | — | | | 140,202 | | | — |
Small Cap Value Fund | | | 197,898 | | | 1,174,810 | | | 197,898 |
d. Sub-Transfer Agent Fees. Natixis Distributors has entered into agreements with financial intermediaries to provide certain recordkeeping, processing, shareholder communications and other services to customers of the intermediaries and has agreed to compensate the intermediaries for providing those services. Certain services would be provided by the Funds if the shares of those customers were registered directly with the Funds’ transfer agent. Accordingly, the Funds agreed to pay a portion of the intermediary fees attributable to shares of the Fund held by the intermediary (which generally is a percentage of the value of shares held) not exceeding what the Funds would have paid its transfer agent had each customer’s shares been registered directly with the transfer agent instead of held through the intermediary. Natixis Distributors pays the remainder of the fees. Listed below are the fees incurred by the Funds which are included in the transfer agent fees and expenses in the Statements of Operations.
| | | | | | | | | |
| | | Sub-Transfer Agent Fees |
Fund | | Institutional
Class | | Retail
Class | | Admin
Class |
Mid Cap Growth Fund | | $ | 10,845 | | $ | 100,391 | | $ | — |
Small Cap Growth Fund | | | 16,844 | | | 51,624 | | | — |
Small Cap Value Fund | | | 247,244 | | | 758,261 | | | 262,375 |
e. Trustees Fees and Expenses. The Funds do not pay any compensation directly to their officers or Trustees who are directors, officers or employees of Natixis Advisors, Natixis Distributors, Natixis US, or their affiliates. The Chairperson of the Board receives a retainer fee at the annual rate of $200,000. The Chairperson does not receive any meeting attendance fees for Board of Trustees meetings or committee meetings that she attends. Each Independent Trustee (other than the Chairperson) receives, in the aggregate, a retainer fee at the annual rate of $65,000. Each Independent Trustee also receives a meeting attendance fee of $7,500 for each meeting of the Board of Trustees that he or she attends in person and $3,750 for each meeting of the Board of Trustees that he or she attends telephonically. In addition, each committee chair receives an additional retainer fee at the annual rate of $10,000. Each Contract Review and Governance Committee member is compensated $5,000 for each Committee meeting that
40
NOTES TO FINANCIAL STATEMENTS – continued
September 30, 2008
he or she attends in person and $2,500 for each meeting that he or she attends telephonically. Each Audit Committee member is compensated $6,250 for each Committee meeting that he or she attends in person and $3,125 for each meeting that he or she attends telephonically. These fees are allocated among the funds in the Natixis Funds Trusts, Loomis Sayles Funds Trusts and the Hansberger International Series based on a formula that takes into account, among other factors, the relative net assets of each Fund. Trustees are reimbursed for travel expenses in connection with attendance at meetings.
Prior to January 1, 2008, each Independent Trustee (other than the Chairperson) received, in the aggregate, a retainer fee at the annual rate of $55,000. Each Independent Trustee also received a meeting attendance fee of $6,000 for each meeting of the Board of Trustees that he or she attended in person and $3,000 for each meeting that he or she attended telephonically. In addition, each Contract Review and Governance Committee member received $4,000 for each committee meeting that he or she attended in person and $2,000 for each committee meeting that he or she attended telephonically. Each Audit Committee member received $5,000 for each committee meeting that he or she attended in person and $2,500 for each committee meeting that he or she attended telephonically. The Chairperson of the Board and committee chair retainers were $200,000 and $10,000, respectively.
A deferred compensation plan (the “Plan”) is available to the Trustees on a voluntary basis. Deferred amounts remain in the Funds until distributed in accordance with the provisions of the Plan. The value of a participating Trustee’s deferral account is based on theoretical investments of deferred amounts, on the normal payment dates, in certain funds of the Natixis Funds Trusts, Loomis Sayles Funds Trusts and Hansberger International Series as designated by the participating Trustees. Changes in the value of participants’ deferral accounts are allocated pro rata among the funds in the Natixis Funds Trusts, Loomis Sayles Funds Trusts, and Hansberger International Series, and are reflected as Trustees’ fees and expenses in the Statements of Operations. The portions of the accrued obligations allocated to the Funds under the Plan are reflected as Deferred Trustees’ fees in the Statements of Assets and Liabilities.
f. Redemption Fees. Shareholders of Small Cap Growth Fund and Small Cap Value Fund are charged a 2% redemption fee if they redeem, including redeeming by exchange, any class of shares of such Funds within 60 days of their acquisition (including acquisition by exchange). The redemption fee is intended to offset the costs to the Funds of short-term trading, such as portfolio transaction and market impact costs associated with redemption activity and administrative costs associated with processing redemptions. The redemption fee is deducted from the shareholder’s redemption or exchange proceeds and is paid to the Fund.
The “first-in, first-out” method is used to determine the holding period of redeemed or exchanged shares, which means that if a shareholder acquired shares on different days, the shares acquired first will be redeemed or exchanged first for purposes of determining whether the redemption fee applies. A new holding period begins with each purchase or exchange. These fees are accounted for as an addition to paid-in capital and are presented in the Statements of Changes in Net Assets.
5. Line of Credit. Each Fund, together with certain other funds of Natixis Funds Trusts, Loomis Sayles Funds Trusts and the Hansberger International Series, participates in a $200,000,000 committed line of credit provided by State Street Bank, with an individual limit of $125,000,000 for each Fund that participates in the line of credit. Interest is charged to each participating fund based on its borrowings at a rate per annum equal to the Federal Funds rate plus 0.50%. In addition, a commitment fee of 0.09% per annum, payable at the end of each calendar quarter, is accrued and apportioned among the participating funds based on their average daily unused portion of the line of credit.
Prior to March 12, 2008, each Fund, together with certain other funds of Natixis Funds Trusts, Loomis Sayles Funds Trusts and Hansberger International Series, participated in a $75,000,000 committed line of credit provided by State Street Bank.
For the year ended September 30, 2008, the Funds had no borrowings under these agreements.
6. Brokerage Commission Recapture. Each Fund has entered into agreements with certain brokers whereby the brokers will rebate a portion of brokerage commissions. All amounts rebated by the brokers are returned to the Funds under such agreements and are included in realized gains in the Statements of Operations. For the year ended September 30, 2008, amounts rebated under these agreements were as follows:
| | | |
Fund | | Rebates |
Mid Cap Growth Fund | | $ | 27,162 |
Small Cap Growth Fund | | | 13,724 |
Small Cap Value Fund | | | 117,277 |
7. Shareholders. At September 30, 2008, the Loomis Sayles Funded Pension Plan and the Loomis Sayles Employees’ Profit Sharing Retirement Plan held Institutional Class shares of beneficial interest in the Funds as follows:
| | | | |
Fund | | Pension Plan | | Profit Sharing
Retirement Plan |
Mid Cap Growth Fund | | 320,493 | | 370,439 |
Small Cap Growth Fund | | 375,466 | | 383,591 |
Small Cap Value Fund | | 366,402 | | 733,101 |
41
8. Capital Shares. Each Fund may issue an unlimited number of shares of beneficial interest, without par value. Transactions in capital shares were as follows:
| | | | | | | | | | | | | | |
| | | Mid Cap Growth Fund | |
| | |
| | | Year Ended September 30, 2008 | | | Year Ended September 30, 2007 | |
| | | | |
| Institutional Class | | Shares | | | Amount | | | Shares | | | Amount | |
Issued from the sale of shares | | 835,746 | | | $ | 23,099,020 | | | 122,987 | | | $ | 2,932,877 | |
Issued in connection with the
reinvestment of distributions | | — | | | | — | | | — | | | | — | |
Redeemed | | (525,115 | ) | | | (13,663,476 | ) | | (113,087 | ) | | | (2,616,811 | ) |
| | | | | | | | | | | | | | |
Net change | | 310,631 | | | $ | 9,435,544 | | | 9,900 | | | $ | 316,066 | |
| | | | | | | | | | | | | | |
| | | | |
| Retail Class | | Shares | | | Amount | | | Shares | | | Amount | |
Issued from the sale of shares | | 7,376,061 | | | $ | 191,485,150 | | | 404,396 | | | $ | 9,618,611 | |
Issued in connection with the
reinvestment of distributions | | — | | | | — | | | — | | | | — | |
Redeemed | | (2,811,222 | ) | | | (67,626,524 | ) | | (616,665 | ) | | | (14,067,412 | ) |
| | | | | | | | | | | | | | |
Net change | | 4,564,839 | | | $ | 123,858,626 | | | (212,269 | ) | | $ | (4,448,801 | ) |
| | | | | | | | | | | | | | |
Increase (decrease) from capital
share transactions | | 4,875,470 | | | $ | 133,294,170 | | | (202,369 | ) | | $ | (4,132,735 | ) |
| | | | | | | | | | | | | | |
| |
| | | Small Cap Growth Fund | |
| | |
| | | Year Ended September 30, 2008 | | | Year Ended September 30, 2007 | |
| | | | |
| Institutional Class | | Shares | | | Amount | | | Shares | | | Amount | |
Issued from the sale of shares | | 2,094,507 | | | $ | 30,602,699 | | | 227,764 | | | $ | 3,236,460 | |
Issued in connection with the
reinvestment of distributions | | — | | | | — | | | — | | | | — | |
Redeemed | | (456,742 | ) | | | (6,441,388 | ) | | (158,397 | ) | | | (2,160,742 | ) |
| | | | | | | | | | | | | | |
Net change | | 1,637,765 | | | $ | 24,161,311 | | | 69,367 | | | $ | 1,075,718 | |
| | | | | | | | | | | | | | |
| | | | |
| Retail Class | | Shares | | | Amount | | | Shares | | | Amount | |
Issued from the sale of shares | | 6,898,095 | | | $ | 94,809,730 | | | 1,247,066 | | | $ | 17,800,763 | |
Issued in connection with the
reinvestment of distributions | | — | | | | — | | | — | | | | — | |
Redeemed | | (1,956,386 | ) | | | (26,497,100 | ) | | (147,091 | ) | | | (1,980,257 | ) |
| | | | | | | | | | | | | | |
Net change | | 4,941,709 | | | $ | 68,312,630 | | | 1,099,975 | | | $ | 15,820,506 | |
| | | | | | | | | | | | | | |
Increase (decrease) from capital
share transactions | | 6,579,474 | | | $ | 92,473,941 | | | 1,169,342 | | | $ | 16,896,224 | |
| | | | | | | | | | | | | | |
42
NOTES TO FINANCIAL STATEMENTS – continued
September 30, 2008
| | | | | | | | | | | | | | |
| | | Small Cap Value Fund | |
| | |
| | | Year Ended September 30, 2008 | | | Year Ended September 30, 2007 | |
| | | | |
| Institutional Class | | Shares | | | Amount | | | Shares | | | Amount | |
Issued from the sale of shares | | 9,681,674 | | | $ | 228,728,526 | | | 3,665,690 | | | $ | 103,476,796 | |
Issued in connection with the
reinvestment of distributions | | 1,942,239 | | | | 49,352,283 | | | 1,908,336 | | | | 50,494,585 | |
Redeemed | | (5,076,716 | ) | | | (120,789,687 | ) | | (2,978,936 | ) | | | (83,598,708 | ) |
| | | | | | | | | | | | | | |
Net change | | 6,547,197 | | | $ | 157,291,122 | | | 2,595,090 | | | $ | 70,372,673 | |
| | | | | | | | | | | | | | |
| | | | |
| Retail Class | | Shares | | | Amount | | | Shares | | | Amount | |
Issued from the sale of shares | | 10,268,147 | | | $ | 242,357,595 | | | 9,567,844 | | | $ | 267,672,472 | |
Issued in connection with the
reinvestment of distributions | | 1,850,508 | | | | 46,632,804 | | | 1,279,692 | | | | 33,617,503 | |
Redeemed | | (7,108,230 | ) | | | (166,486,060 | ) | | (5,159,588 | ) | | | (145,568,951 | ) |
| | | | | | | | | | | | | | |
Net change | | 5,010,425 | | | $ | 122,504,339 | | | 5,687,948 | | | $ | 155,721,024 | |
| | | | | | | | | | | | | | |
| | | | |
| Admin Class | | Shares | | | Amount | | | Shares | | | Amount | |
Issued from the sale of shares | | 2,168,929 | | | $ | 51,105,918 | | | 1,317,587 | | | $ | 35,992,658 | |
Issued in connection with the
reinvestment of distributions | | 271,955 | | | | 6,747,215 | | | 292,721 | | | | 7,599,049 | |
Redeemed | | (1,532,487 | ) | | | (35,447,384 | ) | | (1,252,476 | ) | | | (34,632,190 | ) |
| | | | | | | | | | | | | | |
Net change | | 908,397 | | | $ | 22,405,749 | | | 357,832 | | | $ | 8,959,517 | |
| | | | | | | | | | | | | | |
Increase (decrease) from capital
share transactions | | 12,466,019 | | | $ | 302,201,210 | | | 8,640,870 | | | $ | 235,053,214 | |
| | | | | | | | | | | | | | |
43
REPORT OF INDEPENDENT REGISTERED PUBLIC ACCOUNTING FIRM
To the Trustees of Loomis Sayles Funds I and Loomis Sayles Funds II and Shareholders of Loomis Sayles Small Cap Value Fund, Loomis Sayles Mid Cap Growth Fund, Loomis Sayles Small Cap Growth Fund:
In our opinion, the accompanying statements of assets and liabilities, including the portfolios of investments, and the related statements of operations and of changes in net assets and the financial highlights present fairly, in all material respects, the financial position of the Loomis Sayles Small Cap Value Fund, a series of Loomis Sayles Funds I and the Loomis Sayles Mid Cap Growth Fund and Loomis Sayles Small Cap Growth Fund, each a series of Loomis Sayles Funds II (collectively, “the Funds”), at September 30, 2008, and the results of each of their operations, the changes in each of their net assets and the financial highlights for each of the periods indicated, in conformity with accounting principles generally accepted in the United States of America. These financial statements and financial highlights (hereafter referred to as “financial statements”) are the responsibility of the Funds’ management; our responsibility is to express an opinion on these financial statements based on our audits. We conducted our audits of these financial statements in accordance with the standards of the Public Company Accounting Oversight Board (United States). Those standards require that we plan and perform the audits to obtain reasonable assurance about whether the financial statements are free of material misstatement. An audit includes examining, on a test basis, evidence supporting the amounts and disclosures in the financial statements, assessing the accounting principles used and significant estimates made by management, and evaluating the overall financial statement presentation. We believe that our audits, which included confirmation of securities at September 30, 2008 by correspondence with the custodian and brokers, provide a reasonable basis for our opinion.
PricewaterhouseCoopers LLP
Boston, Massachusetts
November 21, 2008
44
2008 U.S. TAX DISTRIBUTION INFORMATION TO SHAREHOLDERS (Unaudited)
Corporate Dividends Received Deduction. For the fiscal year ended September 30, 2008, a percentage of dividends distributed by the Funds listed below qualify for the dividends received deduction for corporate shareholders. These percentages are as follows:
| | |
Fund | | Qualifying Percentage |
Small Cap Value Fund | | 34.45% |
Capital Gains Distributions. Pursuant to Internal Revenue Section 852(b), the following Funds paid distributions, which have been designated as capital gains distributions for the fiscal year ended September 30, 2008.
| | | |
Fund | | Amount |
Small Cap Value Fund | | $ | 91,300,786 |
Qualified Dividend Income. For the fiscal year ended September 30, 2008, the Funds below will designate up to the maximum amount allowable pursuant to the Internal Revenue Code as qualified dividend income eligible for reduced tax rates. These lower rates range from 5% to 15% depending on an individual’s tax bracket. If the Funds pay a distribution during calendar year 2008, complete information will be reported in conjunction with Form 1099-DIV.
| | |
Fund | | |
Mid Cap Growth Fund | | |
Small Cap Growth Fund | | |
Small Cap Value Fund | | |
45
TRUSTEE AND OFFICER INFORMATION
The tables below provide certain information regarding the Trustees and officers of Loomis Sayles Funds I and Loomis Sayles Funds II (the “Trusts”). Unless otherwise indicated, the address of all persons below is 399 Boylston Street, Boston, MA 02116. The Trusts’ Statements of Additional Information include additional information about the Trustees of the Trusts and are available by calling Loomis Sayles at 800-343-2029.
| | | | | | |
| Name and Year of Birth | | Position(s)
Held with
the Trust, Length
of Time Served and
Term of Office* | | Principal Occupation(s) During Past 5 Years** | | Number of Portfolios in Fund
Complex Overseen*** and Other Directorships Held |
| |
Independent Trustees | | |
| Graham T. Allison, Jr. (1940) | | Trustee Since 2003 Contract Review and Governance Committee Member | | Douglas Dillon Professor and Director of the Belfer Center for Science and International Affairs, John F. Kennedy School of Government, Harvard University | | 41 Director, Taubman Centers, Inc. (real estate investment trust) |
| | | |
Charles D. Baker (1956) | | Trustee Since 2005 Contract Review and Governance Committee Member | | President and Chief Executive Officer, Harvard Pilgrim Health Care (health plan) | | 41 None |
| | | |
| Edward A. Benjamin (1938) | | Trustee Since 2002 Chairman of the Contract Review and Governance Committee | | Retired | | 41 None |
| | | |
Daniel M. Cain (1945) | | Trustee Since 2003 Chairman of the Audit Committee | | President and Chief Executive Officer, Cain Brothers & Company, Incorporated (investment banking) | | 41 Director, Sheridan Healthcare Inc. (physician practice management) |
| | | |
Kenneth A. Drucker (1945) | | Trustee Since 2008 Contract Review and Governance Committee Member | | Formerly, Treasurer, Sequa Corp. (manufacturing) | | 41 Director, M Fund, Inc. (registered investment company) |
| | | |
Jonathan P. Mason (1958) | | Trustee Since 2007 Audit Committee Member | | Chief Financial Officer, Cabot Corp. (specialty chemicals); formerly, Vice President and Treasurer, International Paper Company; formerly, Chief Financial Officer, Carter Holt Harvey (forest products) | | 41 None |
| | | |
Sandra O. Moose (1942) | | Chairperson of the Board of Trustees since November 2005 Trustee since 2003 Ex officio member of the Audit Committee and Contract Review and Governance Committee | | President, Strategic Advisory Services (management consulting); formerly, Senior Vice President and Director, The Boston Consulting Group, Inc. (management consulting) | | 41 Director, Verizon Communications; Director, Rohm and Haas Company (specialty chemicals); Director, AES Corporation (international power company) |
46
| | | | | | |
| Name and Year of Birth | | Position(s)
Held with
the Trust, Length
of Time Served and
Term of Office* | | Principal Occupation(s) During Past 5 Years** | | Number of Portfolios in Fund
Complex Overseen*** and Other Directorships Held |
| | | |
Cynthia L. Walker (1956) | | Trustee Since 2005 Audit Committee Member | | Deputy Dean for Finance and Administration, Yale University School of Medicine; formerly, Executive Dean for Administration, Harvard Medical School; and formerly, Dean for Finance & Chief Financial Officer, Harvard Medical School | | 41 None |
| |
Interested Trustees | | |
Robert J. Blanding1 (1947) 555 California Street San Francisco, CA 94104 | | President and Chief Executive Officer of Loomis Sayles Funds I and Chief Executive Officer of Loomis Sayles Funds II; Trustee since 2002 | | President, Chairman, Director and Chief Executive Officer, Loomis, Sayles & Company, L.P. | | 41 None |
| | | |
John T. Hailer2 (1960) | | Trustee Since 2003 | | President and Chief Executive Officer-U.S. and Asia, Natixis Global Asset Management, L.P.; formerly, President and Chief Executive Officer, Natixis Distribution Corporation, Natixis Asset Management Advisors, L.P., Natixis Distributors, L.P. and Natixis Global Associates, Inc. | | 41 None |
| * | Each Trustee serves until retirement, resignation or removal from the Board of Trustees. The current retirement age is 72. The position of Chairperson of the Board is appointed for a two-year term. Ms. Moose was appointed to serve an additional two-year term as the Chairperson of the Board of Trustees on September 14, 2007. |
| ** | Each person listed above, except as noted, holds the same position(s) with the Natixis Funds Trust I, Natixis Funds Trust II, Natixis Funds Trust III, Natixis Funds Trust IV, Gateway Trust and the Natixis Cash Management Trust (collectively, the “Natixis Funds Trusts”), Loomis Sayles Funds I and Loomis Sayles Funds II (collectively, the “Loomis Sayles Funds Trusts”), and Hansberger International Series. Previous positions during the past five years with Natixis Distributors, L.P. (the “Distributor”), Natixis Asset Management Advisors, L.P. (“Natixis Advisors”), or Loomis, Sayles & Company, L.P. are omitted if not materially different from a Trustee’s or officer’s current position with such entity. |
| *** | The Trustees of the Trust serve as trustees of a fund complex that includes all series of the Natixis Funds Trusts, the Loomis Sayles Funds Trusts and Hansberger International Series (collectively, the “Fund Complex”). |
| 1 | Mr. Blanding is deemed an “interested person” of the Trust because he holds the following positions with affiliated persons of the Trust: President, Chairman, Director and Chief Executive Officer of Loomis, Sayles & Company, L.P. |
| 2 | Mr. Hailer is deemed an “interested person” of the Trust because he holds the following positions with affiliated persons of the Trust: President and Chief Executive Officer-U.S. and Asia, Natixis Global Asset Management, L.P. |
47
| | | | | | |
| Name and Year of Birth | | Position(s) Held with the Trust | | Term of Office* and Length of Time Served | | Principal Occupation During Past 5 Years** |
| | |
Officers of the Trust | | | | |
Coleen Downs Dinneen (1960) | | Secretary, Clerk and Chief Legal Officer | | Since September 2004 | | Executive Vice President,
General Counsel, Secretary
and Clerk (formerly,
Senior Vice President,
Deputy General Counsel,
Assistant Secretary and
Assistant Clerk), Natixis
Distribution Corporation,
Natixis Asset Management
Advisors, L.P. and Natixis
Distributors, L.P. |
| | | |
Daniel J. Fuss (1933) One Financial Center Boston, MA 02111 | | Executive Vice President | | Since June 2003 | | Vice Chairman and
Director, Loomis, Sayles &
Company, L.P. |
| | | |
David Giunta (1965) | | President of Loomis, Sayles Funds II and Executive Vice President of Loomis, Sayles Funds I | | Since March 2008 | | President and Chief
Executive Officer, Natixis
Distribution Corporation,
Natixis Asset Management
Advisors, L.P. and Natixis
Distributors, L.P.;
formerly, President,
Fidelity Charitable Gift
Fund; and formerly, Senior
Vice President, Fidelity
Brokerage Company |
| | | |
Russell L. Kane (1969) | | Chief Compliance Officer, Assistant Secretary and Anti-Money Laundering Officer | | Chief Compliance Officer
since May 2006; Assistant
Secretary since June 2004;
and Anti-Money
Laundering Officer since
April 2007 | | Chief Compliance Officer
for Mutual Funds, Senior
Vice President, Deputy
General Counsel, Assistant
Secretary and Assistant
Clerk, Natixis Distribution
Corporation, Natixis Asset
Management Advisors,
L.P. and Natixis
Distributors, L.P.; and
formerly, Senior Counsel,
Columbia Management
Group |
| | | |
Michael C. Kardok (1959) | | Treasurer, Principal Financial and Accounting Officer | | Since October 2004 | | Senior Vice President,
Natixis Asset Management
Advisors, L.P. and Natixis
Distributors, L.P.; and
formerly, Senior Director,
PFPC Inc. |
| | | |
Robert Krantz (1964) | | Executive Vice President | | Since September 2007 | | Executive Vice President,
Natixis Asset Management
Advisors, L.P. and Natixis
Distributors, L.P. |
| * | Each officer of the Trust serves for an indefinite term in accordance with the Trust’s current By-laws until the date his or her successor is elected and qualified, or until he or she sooner dies, retires, is removed or becomes disqualified. |
| ** | Each person listed above, except as noted, holds the same position(s) with the Natixis Funds Trusts, Loomis Sayles Funds Trusts and Hansberger International Series. Mr. Fuss is not an officer of the Natixis Funds Trusts or the Hansberger International Series. Previous positions during the past five years with the Distributor, Natixis Advisors or Loomis Sayles are omitted if not materially different from a Trustee’s or officer’s current position with such entity. |
48

ANNUAL REPORT
September 30, 2008
Loomis Sayles Investment Grade Bond Fund


TABLE OF CONTENTS
Management Discussion and Performance page 1
Portfolio of Investments page 8
Financial Statements page 19
LOOMIS SAYLES INVESTMENT GRADE BOND FUND
PORTFOLIO PROFILE
Objective:
High total investment return through a combination of current income and capital appreciation
Strategy:
Invests primarily in investment-grade, fixed-income securities, although it may invest up to 10% of its assets in lower quality fixed-income securities. The fund may invest any portion of its assets in securities of Canadian issuers and up to 20% in other foreign securities, including emerging markets.
Fund Inception:
December 31, 1996
Managers:
Daniel Fuss, CFA, CIC
Steven Kaseta, CFA
Associate Managers:
Matthew J. Eagan, CFA
Kathleen Gaffney, CFA
Elaine Stokes
Loomis, Sayles & Company, L.P.
Symbols:
| | |
| Class A | | LIGRX |
| Class B | | LGBBX |
| Class C | | LGBCX |
| Class Y | | LSIIX |
| Class J | | LIGJX |
What You Should Know:
This fund invests in fixed-income securities that are subject to credit risk, interest rate risk and liquidity risk. It may also invest in mortgage-related securities that are subject to prepayment risk. The fund can invest a significant percentage of assets in foreign securities and the value of fund shares can be adversely affected by changes in currency exchange rates, political, and economic developments. In emerging markets these risks can be significant. The fund is subject to currency risk, which is the risk that fluctuations in exchange rates between the U.S. dollar and foreign currencies may cause the value of a fund’s investments to decline. Lower rated debt securities have speculative characteristics and may be subject to greater price volatility than higher rated investments. In addition, the secondary market for these securities may lack liquidity. Fund shares should be viewed as a long-term investment.
Management Discussion
Amid heightened turbulence in the capital markets, both investment-grade and high-yield corporate bonds were hit hard as risk-averse investors fled to higher-quality securities during the 12 months ended September 30, 2008. The spreading crisis in the financial markets increased fears of recession and suppressed investors’ appetite for any credit risk. Treasury prices climbed as growing demand pushed their yields down to historic lows, while the spread (or difference in yield) between Treasuries and corporate bonds widened significantly, leading to price erosion and poor performance for corporate bonds generally.
During this volatile period, Loomis Sayles Investment Grade Bond Fund’s Class A shares returned -5.12%, at net asset value. The fund’s results lagged the 2.41% return of its benchmark, Lehman U.S. Government/Credit Index, as well as the -2.45% average return on the funds in Morningstar’s Intermediate-Term Bond category. The fund’s 30-day SEC yield was 6.12% at September 30, 2008.
Our policy of focusing on value was not rewarded during this period. Our portfolio management team pursues a discipline of buying bonds that we believe are selling at a discount to their intrinsic value and that are backed by corporations that should be able to meet their debt obligations. Rather than focusing on short-term fluctuations, the team tries to maintain a longer-term view. Despite the extraordinary events of the past 12 months, we continue to have confidence in this strategy.
HOW DID THE FUND RESPOND?
During this period of heightened demand for quality and plunging Treasury yields, we maintained a longer duration than the benchmark, maximizing current income. However, the fund’s sensitivity to interest-rate changes was greater than that of the benchmark during the fiscal year, with an average effective duration of 5.73 years for the fund, compared to 5.12 years for the benchmark, as of September 30, 2008. The asset-backed securities (ABS) we selected also helped relative performance, even though securitized assets as a whole suffered. ABS are backed by loans on such tangible assets as automobiles and homes, and packaged (securitized) so they can be sold as a unit. Most ABS declined in price during the period as the value of the underlying assets fell.
Pivotal events during the fiscal year included bankruptcies, near-failures and takeovers of several revered financial institutions. In this environment, our emphasis on both investment-grade and high-yield corporate bonds hurt performance significantly as they declined in value while Treasury securities rose. In particular, our positions in telecommunications bonds, both investment-grade and high-yield, held back results, as did our investments in high-yield auto and auto-related securities. Our investments in bonds issued in commodity-exporting countries like Australia, Canada and New Zealand also detracted, as their currencies weakened against the U.S. dollar.
WHAT NOW?
While the current economic outlook is uncertain, we think it is important to maintain a long-term perspective. We believe investments in undervalued bonds can provide several potential advantages:
| • | reduced downside risk, as many corporate bonds have already fallen below our estimate of their true value; |
| • | increased current yield, as the income they provide is high in relation to their deflated prices; |
| • | greater potential for capital appreciation, as any recovery in the corporate debt market should lift the prices of most bonds backed by financially solid companies. |
In a period when almost every major sector of the bond market lost ground, we relied on our experience, discipline and the strategies we use to navigate volatile markets. The storm clouds have not yet passed. Prices may go lower still and the markets are illiquid. However, with yields as high as they are today, bondholders are earning generous income while they wait for prices to turn back up. There can be no assurances, but in time we believe these crises will fade, allowing bond prices to recover.
1
LOOMIS SAYLES INVESTMENT GRADE BOND FUND
Investment Results through September 30, 2008
PERFORMANCE IN PERSPECTIVE
The charts comparing the fund’s performance to an index provide you with a general sense of how it performed. The fund’s total return for the period shown below appears with and without sales charges and includes fund expenses and fees. An index measures the performance of a theoretical portfolio. Unlike a fund, the index is unmanaged and does not have expenses that affect the results. It is not possible to invest directly in an index. Investors would incur transaction costs and other expenses if they purchased the securities necessary to match the index.
Growth of a $10,000 Investment in Class A Shares1,4
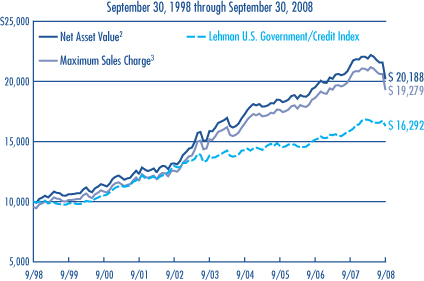
Average Annual Returns — September 30, 20084
| | | | | | | | | |
| | | | |
| | | 1 YEAR | | | 5 YEARS | | | 10 YEARS | |
CLASS A (Inception 12/31/96)1 | | | | | | | | | |
Net Asset Value2 | | -5.12 | % | | 4.91 | % | | 7.28 | % |
With Maximum Sales Charge3 | | -9.37 | | | 3.96 | | | 6.79 | |
| | | | |
CLASS B (Inception 9/12/03)1 | | | | | | | | | |
Net Asset Value2 | | -5.88 | | | 4.05 | | | 6.34 | |
With CDSC5 | | -10.38 | | | 3.74 | | | 6.34 | |
| | | | |
CLASS C (Inception 9/12/03)1 | | | | | | | | | |
Net Asset Value2 | | -5.84 | | | 4.09 | | | 6.36 | |
With CDSC5 | | -6.73 | | | 4.09 | | | 6.36 | |
| | | | |
CLASS Y (Inception 12/31/96)1 | | | | | | | | | |
Net Asset Value2 | | -4.79 | | | 5.25 | | | 7.57 | |
| | | | |
CLASS J (Inception 5/24/99) 1 | | | | | | | | | |
Net Asset Value2 | | -5.50 | | | 4.46 | | | 6.77 | |
With Sales Charge5 | | -8.77 | | | 3.71 | | | 6.40 | |
| | | | |
| COMPARATIVE PERFORMANCE | | 1 YEAR | | | 5 YEARS | | | 10 YEARS | |
Lehman U.S. Government/Credit Index | | 2.41 | % | | 3.34 | % | | 5.00 | % |
Morningstar Intermediate-Term Bond Fund Avg. | | -2.45 | | | 2.15 | | | 4.09 | |
| | | | | | | | | | |
See page 3 for a description of the index/average.
All returns represent past performance and do not guarantee future results. Share price and return will vary and you may have a gain or loss when you sell your shares. All results include reinvestment of any dividends and capital gains. Current returns may be higher or lower than those shown. For performance current to the most recent month-end, visit www.funds.natixis.com. Class Y, the successor to the fund’s Institutional Class, is only available to certain investors as described in the prospectus. Class J shares are not offered for sale in the United States and are not eligible for sale to U.S. investors.
PORTFOLIO FACTS
| | | | |
| | | % of Net Assets as of |
| Credit Quality | | 9/30/08 | | 9/30/07 |
Aaa | | 28.6 | | 40.4 |
Aa | | 4.5 | | 2.0 |
A | | 14.6 | | 7.6 |
Baa | | 41.3 | | 37.1 |
Ba | | 3.7 | | 3.9 |
B | | 1.0 | | 1.2 |
Caa | | 1.2 | | 1.8 |
Ca | | 0.1 | | — |
Not Rated* | | 3.0 | | 3.4 |
Short-term and other | | 2.0 | | 2.6 |
Credit quality is based on ratings from Moody’s Investors Service.
* Securities that are not rated by Moody’s may be rated by another rating agency or by Loomis Sayles. Portfolio characteristics will vary.
EXPENSE RATIOS AS STATED IN THE MOST RECENT PROSPECTUS
| | | | |
| Share Class | | Gross Expense Ratio6 | | Net Expense Ratio7 |
A | | 0.83% | | 0.83% |
B | | 1.71 | | 1.70 |
C | | 1.57 | | 1.57 |
Y | | 0.55 | | 0.55 |
J | | 1.28 | | 1.28 |
NOTES TO CHARTS
The table and graph do not reflect taxes shareholders might owe on any fund distributions or when they redeem their shares.
1 | Returns shown in the chart include performance of the fund’s Retail Class shares, which were converted to Class A shares on 9/12/03. The prior Retail Class performance has been restated to reflect the expenses and sales loads of Class A shares. Retail Class was closed on 12/18/00 and recommenced operations on 1/31/02; Institutional Class performance is shown for the intervening period, adjusted to reflect the expenses and sales loads paid by Class A shares. The restatement of the fund’s performance to reflect Class A expenses is based on the net expenses of the Class after taking into effect the fund’s then current expense cap arrangements. For periods prior to the inception of Class B and Class C shares (9/12/03), performance is based on prior Institutional Class performance, restated to reflect the sales loads and expenses of Class B and Class C shares. Institutional Class became Class Y on 9/12/03. Institutional Class performance has been restated to reflect the expenses of Class Y shares after taking into effect Class Y’s then current expense cap arrangements. For periods prior to the inception of Class J Shares (5/24/99), performance is based on prior Institutional Class performance, restated to reflect the sales loads and expenses of Class J shares. The growth of $10,000 chart compares the performance of Class A shares at net asset value, to the performance of Class A shares including the maximum sales charge of 4.50%. This chart reflects the performance of Class A shares rather than Class Y shares because Class A shares have the highest sales charge. Prior to 9/12/03, the fund (except Class J) was offered without a sales charge. |
2 | Does not include a sales charge. |
3 | Includes maximum sales charge of 4.50%. |
4 | Fund performance has been increased by expense reductions and reimbursements, if any, without which performance would have been lower. |
5 | Performance for Class B shares assumes a maximum 5% contingent deferred sales charge (“CDSC”) applied when you sell shares, which declines annually between years 1-6 according to the following schedule: 5, 4, 3, 3, 2, 1, 0%. Class C shares performance assumes a 1% CDSC applied when you sell shares within one year of purchase. Performance for Class J assumes a 3.50% sales charge. |
6 | Before reductions and reimbursements. |
7 | After reductions and reimbursements. Expense reductions are contractual and are set to expire on 1/31/09. |
2
ADDITIONAL INFORMATION
The views expressed in this report reflect those of the portfolio managers as of the dates indicated. The managers’ views are subject to change at any time without notice based on changes in market or other conditions. References to specific securities or industries should not be regarded as investment advice. Because the fund is actively managed, there is no assurance that it will continue to invest in the securities, countries or industries mentioned.
For more complete information on any Natixis Fund, contact your financial professional or call Natixis Funds and ask for a free prospectus, which contains more complete information including charges and other ongoing expenses. Investors should consider a fund’s objective, risks and expenses carefully before investing. This and other fund information can be found in the prospectus. Please read the prospectus carefully before investing.
INDEX/AVERAGE DESCRIPTIONS:
Lehman U.S. Government/Credit Index is an unmanaged index of publicly traded bonds, including U.S. government bonds, U.S. Treasury securities and corporate bonds.
Morningstar Intermediate-Term Bond Fund Average is the average performance without sales charges of funds with similar investment objectives, as calculated by Morningstar, Inc.
PROXY VOTING INFORMATION
A description of the fund’s proxy voting policies and procedures is available without charge, upon request, by calling Natixis Funds at 800-225-5478; on the fund’s website at www.funds.natixis.com; and on the Securities and Exchange Commission’s (SEC’s) website at www.sec.gov. Information regarding how the fund voted proxies relating to portfolio securities during the 12-month period ended June 30, 2008 is available from the fund’s website and the SEC’s website.
QUARTERLY PORTFOLIO SCHEDULES
The fund files a complete schedule of portfolio holdings with the SEC for the first and third quarters of each fiscal year on Form N-Q. The fund’s Forms N-Q are available on the SEC’s website at www.sec.gov and may be reviewed and copied at the SEC’s Public Reference Room in Washington, DC. Information on the operation of the Public Reference Room may be obtained by calling 1-800-SEC-0330.
| | | | |
| NOT FDIC INSURED | | MAY LOSE VALUE | | NO BANK GUARANTEE |
3
UNDERSTANDING YOUR FUND’S EXPENSES
As a mutual fund shareholder, you incur different types of costs: transaction costs, including sales charges (loads) on purchases and contingent deferred sales charges on redemptions; certain exchange fees; and minimum account fee charges; and ongoing costs, including management fees, distribution fees (12b-1 fees) and/or service fees, and other fund expenses. In addition, the fund assesses a minimum balance fee of $20 on an annual basis for accounts that fall below the required minimum to establish an account (certain exceptions may apply). These costs are described in more detail in the fund’s prospectus. The examples below are intended to help you understand the ongoing costs of investing in the fund and help you compare these with the ongoing costs of investing in other mutual funds.
The first line in the table for each Class shows the actual amount of fund expenses you would have paid on a $1,000 investment in the fund from April 1, 2008 through September 30, 2008. It also shows how much a $1,000 investment would be worth at the close of the period, assuming actual fund returns and expenses. To estimate the expenses you paid over the period, simply divide your account value by $1,000 (for example $8,600 account value divided by $1,000 = 8.6) and multiply the result by the number in the Expenses Paid During the Period row as shown below for your class.
The second line in the table for each Class provides information about hypothetical account values and hypothetical expenses based on the fund’s actual expense ratios and an assumed rate of return of 5% per year before expenses, which is not the fund’s actual return. The hypothetical account values and expenses may not be used to estimate the actual ending account balance or expenses you paid on your investment for the period. You may use this information to compare the ongoing costs of investing in the fund and other funds. To do so, compare this 5% hypothetical example with the 5% hypothetical examples that appear in the shareholder reports of the other funds.
Please note that the expenses shown reflect ongoing costs only, and do not include any transaction costs. Therefore, the second line in the table of the fund is useful in comparing ongoing costs only, and will not help you determine the relative costs of owning different funds. If transaction costs were included, total costs would be higher.
| | | | | | | | | |
LOOMIS SAYLES INVESTMENT GRADE BOND FUND | | BEGINNING ACCOUNT VALUE
4/1/2008 | | ENDING ACCOUNT VALUE
9/30/2008 | | EXPENSES PAID DURING PERIOD*
4/1/2008 - 9/30/2008 |
Class A | | | | | | | | | |
Actual | | $ | 1,000.00 | | $ | 921.60 | | $ | 3.94 |
Hypothetical (5% return before expenses) | | $ | 1,000.00 | | $ | 1,020.90 | | $ | 4.14 |
Class B | | | | | | | | | |
Actual | | $ | 1,000.00 | | $ | 918.20 | | $ | 7.86 |
Hypothetical (5% return before expenses) | | $ | 1,000.00 | | $ | 1,016.80 | | $ | 8.27 |
Class C | | | | | | | | | |
Actual | | $ | 1,000.00 | | $ | 917.80 | | $ | 7.53 |
Hypothetical (5% return before expenses) | | $ | 1,000.00 | | $ | 1,017.15 | | $ | 7.92 |
Class Y | | | | | | | | | |
Actual | | $ | 1,000.00 | | $ | 923.70 | | $ | 2.60 |
Hypothetical (5% return before expenses) | | $ | 1,000.00 | | $ | 1,022.30 | | $ | 2.73 |
Class J | | | | | | | | | |
Actual | | $ | 1,000.00 | | $ | 920.20 | | $ | 6.19 |
Hypothetical (5% return before expenses) | | $ | 1,000.00 | | $ | 1,018.55 | | $ | 6.51 |
| * | Expenses are equal to the Fund’s annualized expense ratio (after fee reduction/reimbursement): 0.82%, 1.64%, 1.57%, 0.54% and 1.29% for Class A, B, C, Y and J, respectively, multiplied by the average account value over the period, multiplied by the number of days in the most recent fiscal half-year, divided by 366 (to reflect the half-year period). |
4
BOARD APPROVALOFTHE EXISTING ADVISORY AGREEMENT
The Board of Trustees, including the Independent Trustees, considers matters bearing on the Fund’s advisory agreement (collectively, the “Agreement”) at most of its meetings throughout the year. Each year, usually in the spring, the Contract Review and Governance Committee of the Board meets to review the Agreement to determine whether to recommend that the full Board approve the continuation of the Agreement, typically for an additional one-year period. After the Committee has made its recommendation, the full Board, including the Independent Trustees, determines whether to approve the continuation of the Agreement.
In connection with these meetings, the Trustees receive materials that the Fund’s investment adviser believe to be reasonably necessary for the Trustees to evaluate the Agreement. These materials generally include, among other items, (i) information on the investment performance of the Fund and the performance of peer groups of funds and the Fund’s performance benchmarks, (ii) information on the Fund’s advisory fees and other expenses, including information comparing the Fund’s expenses to those of peer groups of funds and information about any applicable expense caps and fee “breakpoints,” (iii) sales and redemption data in respect of the Fund, (iv) information about the profitability of the Agreement to the Fund’s adviser (the “Adviser”), and (v) information obtained through the completion of a questionnaire by the Adviser (the Trustees are consulted as to the information requested through that questionnaire). The Board of Trustees, including the Independent Trustees, also consider other matters such as (i) the Adviser’s financial results and financial condition, (ii) the Fund’s investment objective and strategies and the size, education and experience of the Adviser’s investment staff and its use of technology, external research and trading cost measurement tools, (iii) arrangements in respect of the distribution of the Fund’s shares and the related costs, (iv) the procedures employed to determine the value of the Fund’s assets, (v) the allocation of the Fund’s brokerage, if any, including allocations to brokers affiliated with the Adviser and the use of “soft” commission dollars to pay Fund expenses and to pay for research and other similar services, (vi) the resources devoted to, and the record of compliance with, the Fund’s investment policies and restrictions, policies on personal securities transactions and other compliance policies, and (vii) the general economic outlook with particular emphasis on the mutual fund industry. Throughout the process, the Trustees are afforded the opportunity to ask questions of and request additional materials from the Adviser.
In addition to the materials requested by the Trustees in connection with the annual consideration of the continuation of the Agreement, the Trustees receive materials in advance of each regular quarterly meeting of the Board of Trustees that provide detailed information about the Fund’s investment performance and the fees charged to the Fund for advisory and other services. This information generally includes, among other things, an internal performance rating for the Fund based on agreed-upon criteria, graphs showing performance and fee differentials against the Fund’s peer group, performance ratings provided by a third-party, total return information for various periods, and third-party performance rankings for various periods comparing the Fund against its peer group. The portfolio management team of the Fund or other representatives of the Adviser make periodic presentations to the Contract Review and Governance Committee and/or the full Board of Trustees, and if the Fund is identified as presenting possible performance concerns it may be subject to more frequent board presentations and reviews. In addition, each quarter the Trustees are provided with detailed statistical information about the Fund’s portfolio.
The Board of Trustees most recently approved the continuation of the Agreement at their meeting held in June, 2008. The Agreement was continued for a one-year period for the Fund. In considering whether to approve the continuation of the Agreement, the Board of Trustees, including the Independent Trustees, did not identify any single factor as determinative. Matters considered by the Trustees, including the Independent Trustees, in connection with their approval of the Agreement included the following:
The nature, extent and quality of the services provided to the Fund under the Agreement. The Trustees considered the nature, extent and quality of the services provided by the Adviser and its affiliates to the Fund and the resources dedicated to the Fund by the Adviser and its affiliates, including recent or planned investments by the Adviser in additional personnel or other resources. They also took note of the competitive market for talented personnel, in particular, for personnel who have contributed to the generation of strong investment performance. They considered the need for the Adviser to offer competitive compensation in order to attract and retain capable personnel.
The Trustees also considered the benefits to shareholders of investing in a mutual fund that is part of a family of funds that offers shareholders the right to exchange shares of one type of fund for shares of another type of fund, and provides a variety of fund and shareholder services.
After reviewing these and related factors, the Trustees concluded, within the context of their overall conclusions regarding the Agreement, that the nature, extent and quality of services provided supported the renewal of the Agreement.
5
BOARD APPROVALOFTHE EXISTING ADVISORY AGREEMENT
Investment performance of the Fund and the Adviser. As noted above, the Trustees received information about the performance of the Fund over various time periods, including information which compared the performance of the Fund to the performance of peer groups of funds and the Fund’s performance benchmark. In addition, the Trustees also reviewed data prepared by an independent third party which analyzed the performance of the Fund using a variety of performance metrics, including metrics which also measured the performance of the Fund on a risk adjusted basis.
The Board concluded that the Fund’s performance and other relevant factors supported the renewal of the Agreement. The Trustees also considered the Adviser’s performance and reputation generally, the performance as a fund family generally (as noted by certain financial publications), and the historical responsiveness of the Adviser to Trustee concerns about performance and the willingness of the Adviser to take steps intended to improve performance.
After reviewing these and related factors, the Trustees concluded, within the context of their overall conclusions regarding the Agreement, that the performance of the Fund and the Adviser supported the renewal of the Agreement.
The costs of the services to be provided and profits to be realized by the Adviser and its affiliates from their respective relationships with the Fund. The Trustees considered the fees charged to the Fund for advisory services as well as the total expense level of the Fund. This information included comparisons (provided both by management and also by an independent third party) of the Fund’s advisory fees and total expense levels to those of their peer groups and information about the advisory fees charged by the Adviser to comparable accounts. In considering the fees charged to comparable accounts, the Trustees considered, among other things, management’s representations about the differences between managing mutual funds as compared to other types of accounts, including the additional resources required to effectively manage mutual fund assets. In evaluating the Fund’s advisory fees, the Trustees also took into account the demands, complexity and quality of the investment management of the Fund. The Trustees considered that over the past several years, management had made recommendations regarding reductions in advisory fee rates, implementation of advisory fee breakpoints and the institution of advisory fee waivers and expense caps. They noted that the Fund currently has an expense cap in place, and they considered the amounts waived or reimbursed by the Adviser under the cap.
The Trustees also considered the compensation directly or indirectly received by the Adviser and its affiliates from their relationships with the Fund. The Trustees reviewed information provided by management as to the profitability of the Adviser’s and its affiliates’ relationships with the Fund, and information about the allocation of expenses used to calculate profitability. They also reviewed information provided by management about the effect of distribution costs and Fund growth on Adviser profitability, including information regarding resources spent on distribution activities and the increase in net sales for the family of funds. When reviewing profitability, the Trustees also considered information about court cases in which adviser profitability was an issue, the performance of the Fund, the expense levels of the Fund, and whether the Adviser had implemented breakpoints and/or expense caps.
After reviewing these and related factors, the Trustees concluded, within the context of their overall conclusions regarding the Agreement, that the advisory fees charged to the Fund were fair and reasonable, and that the costs of these services generally and the related profitability of the Adviser and its affiliates in respect of their relationships with the Fund supported the renewal of the Agreement.
Economies of Scale. The Trustees considered the existence of any economies of scale in the provision of services by the Adviser and whether those economies are shared with the Fund through breakpoints in its investment advisory fees or other means, such as expense waivers. The Trustees noted that the Fund was subject to an expense cap. The Trustees also took note of the costs of the services provided (both on an absolute and a relative basis) and the profitability to the Adviser and its affiliates of their relationships with the Fund, as discussed above.
After reviewing these and related factors, the Trustees considered, within the context of their overall conclusions regarding the Agreement, that the extent to which economies of scale were shared with the Fund supported the renewal of the Agreement.
The Trustees also considered other factors, which included but were not limited to the following:
| · | whether the Fund has operated in accordance with its investment objective and the Fund’s record of compliance with its investment restrictions, and the compliance programs of the Fund and the Adviser. They also considered the compliance-related resources the Adviser and their affiliates were providing to the Fund. |
| · | the nature, quality, cost and extent of administrative and shareholder services performed by the Adviser and their affiliates, both under the Agreement and under a separate agreement covering administrative services. |
6
BOARD APPROVALOFTHE EXISTING ADVISORY AGREEMENT
| · | so-called “fallout benefits” to the Adviser, such as the engagement of affiliates of the Adviser to provide distribution, administrative and brokerage services to the Fund. The Trustees considered the possible conflicts of interest associated with these fallout and other benefits, and the reporting, disclosure and other processes in place to disclose and monitor such possible conflicts of interest. |
Based on their evaluation of all factors that they deemed to be material, including those factors described above, and assisted by the advice of independent counsel, the Trustees, including the Independent Trustees, concluded that the existing advisory agreement should be continued through June 30, 2009.
7
LOOMIS SAYLES INVESTMENT GRADE BOND FUND — PORTFOLIOOF INVESTMENTS
Investments as of September 30, 2008
| | | | | | |
Principal
Amount (‡) | | Description | | Value (†) |
| | | | | | |
| | Bonds and Notes — 87.7% of Net Assets | | | |
| | Non-Convertible Bonds — 86.3% | | | |
| | | ABS Car Loan — 1.9% | | | |
| $ | 60,855,000 | | ARG Funding Corp., Series 2005-2A, Class A5, 3.348%, 5/20/2011, 144A(b) | | $ | 55,913,099 |
| | 26,520,000 | | Capital One Auto Finance Trust, Series 2006-C, Class A4, 2.518%, 5/15/2013(b) | | | 22,126,694 |
| | 7,199,000 | | Merrill Auto Trust Securitization Asset, Series 2008-1, Class B, 6.750%, 4/15/2015 | | | 6,523,130 |
| | | | | | |
| | | | | | 84,562,923 |
| | | | | | |
| | | ABS Credit Card — 1.8% | | | |
| | 2,550,000 | | Capital One Multi-Asset Execution Trust, Series 2006-C2, Class C, 2.788%, 6/16/2014(b) | | | 2,151,475 |
| | 29,215,000 | | Chase Issuance Trust, Series 2007-B1, Class B1, 2.738%, 4/15/2019(b) | | | 20,626,520 |
| | 29,395,000 | | Citibank Credit Card Issuance Trust, Series 2008-C6, Class C6, 6.300%, 6/20/2014 | | | 25,542,030 |
| | 10,000,000 | | MBNA Credit Card Master Note Trust, Series 2002-C1, Class C1, 6.800%, 7/15/2014 | | | 8,991,570 |
| | 19,060,000 | | MBNA Credit Card Master Note Trust, Series 2005-B2, Class B, 2.668%, 12/17/2012(b) | | | 17,777,049 |
| | 5,000,000 | | World Financial Network Credit Card, Series 2008-B, Class M, 7.800%, 10/15/2013 | | | 4,969,019 |
| | | | | | |
| | | | | | 80,057,663 |
| | | | | | |
| | | Airlines — 1.8% | | | |
| | 710,099 | | Continental Airlines, Inc., Series 971A, 7.461%, 10/01/2016 | | | 617,786 |
| | 27,540,000 | | Continental Airlines, Inc., Series A, 5.983%, 4/19/2022 | | | 21,205,800 |
| | 9,948,000 | | Continental Airlines, Inc., Series B, 6.903%, 4/19/2022(c) | | | 7,063,080 |
| | 860,141 | | Delta Air Lines, Inc., Series 2007-1, Class A, 6.821%, 2/10/2024 | | | 670,910 |
| | 19,586,576 | | Delta Air Lines, Inc., Series 2007-1, Class B, 8.021%, 2/10/2024 | | | 13,318,871 |
| | 11,415,000 | | Northwest Airlines, Inc., Series 07-1, Class B, 8.028%, 11/01/2017 | | | 7,077,300 |
| | 8,115,000 | | Qantas Airways Ltd., 6.050%, 4/15/2016, 144A | | | 7,428,966 |
| | 30,028,035 | | United Air Lines, Inc., 6.636%, 1/02/2024 | | | 22,220,746 |
| | | | | | |
| | | | | | 79,603,459 |
| | | | | | |
| | | Asset-Backed Securities — 0.5% | | | |
| | 16,965,000 | | CIT Equipment Collateral, Series 2008-VT1, Class A3, 6.590%, 12/22/2014 | | | 16,436,211 |
| | 504,318 | | Community Program Loan Trust, Series 1987-A, Class A4, 4.500%, 10/01/2018 | | | 502,860 |
| | 1,700,000 | | Community Program Loan Trust, Series 1987-A, Class A5, 4.500%, 4/01/2029 | | | 1,509,940 |
| | | | | | |
| | | | | | 18,449,011 |
| | | | | | |
| | | Automotive — 0.8% | | | |
| | 10,665,000 | | Cummins, Inc., 5.650%, 3/01/2098 | | | 7,487,246 |
| | 3,389,000 | | Cummins, Inc., 6.750%, 2/15/2027 | | | 3,038,198 |
| | | | | | |
Principal
Amount (‡) | | Description | | Value (†) |
| | | | | | |
| | | Automotive — continued | | | |
| $ | 665,000 | | Cummins, Inc., 7.125%, 3/01/2028 | | $ | 636,384 |
| | 1,990,000 | | Ford Motor Co., 6.375%, 2/01/2029 | | | 736,300 |
| | 130,000 | | Ford Motor Co., 6.500%, 8/01/2018 | | | 53,300 |
| | 260,000 | | Ford Motor Co., 6.625%, 2/15/2028 | | | 100,100 |
| | 5,185,000 | | Ford Motor Co., 6.625%, 10/01/2028 | | | 1,970,300 |
| | 8,730,000 | | Ford Motor Co., 7.450%, 7/16/2031 | | | 3,753,900 |
| | 245,000 | | Ford Motor Co., 7.500%, 8/01/2026 | | | 101,675 |
| | 11,830,000 | | Ford Motor Credit Co. LLC, 5.700%, 1/15/2010 | | | 9,059,840 |
| | 345,000 | | Ford Motor Credit Co. LLC, 7.000%, 10/01/2013 | | | 212,022 |
| | 700,000 | | Ford Motor Credit Co. LLC, 7.375%, 10/28/2009 | | | 562,776 |
| | 1,540,000 | | Ford Motor Credit Co. LLC, 8.000%, 12/15/2016 | | | 973,708 |
| | 935,000 | | Ford Motor Credit Co. LLC, 8.625%, 11/01/2010 | | | 663,027 |
| | 2,135,000 | | Ford Motor Credit Co. LLC, 9.750%, 9/15/2010 | | | 1,530,972 |
| | 575,000 | | General Motors Corp., 7.400%, 9/01/2025 | | | 207,000 |
| | 8,985,000 | | General Motors Corp., 8.250%, 7/15/2023(c) | | | 3,526,613 |
| | 245,000 | | General Motors Corp., 8.375%, 7/15/2033(c) | | | 98,000 |
| | | | | | |
| | | | | | 34,711,361 |
| | | | | | |
| | | Banking — 2.1% | | | |
| | 2,595,000 | | BAC Capital Trust VI, 5.625%, 3/08/2035 | | | 1,981,021 |
| | 3,120,000,000 | | Barclays Financial LLC, 4.060%, 9/16/2010, (KRW), 144A | | | 2,630,525 |
| | 180,000,000 | | Barclays Financial LLC, 4.160%, 2/22/2010, (THB), 144A | | | 5,256,468 |
| | 3,500,000,000 | | Barclays Financial LLC, 4.460%, 9/23/2010, (KRW), 144A | | | 2,973,238 |
| | 52,000,000 | | Barclays Financial LLC, EMTN, 4.100%, 3/22/2010, (THB), 144A | | | 1,517,307 |
| | 16,371,250,000 | | BNP Paribas SA, EMTN, Zero Coupon, 6/13/2011, (IDR), 144A | | | 1,253,277 |
| | 9,860,000 | | Citibank NA, 15.000%, 7/02/2010, (BRL), 144A | | | 5,284,367 |
| | 700,000 | | ICICI Bank Ltd., (fixed rate to 4/30/2017, variable rate thereafter), 6.375%, 4/30/2022, 144A | | | 483,161 |
| | 18,000,000 | | JPMorgan Chase & Co., Zero Coupon, 5/17/2010, (BRL), 144A | | | 7,609,131 |
| | 22,683,264,000 | | JPMorgan Chase & Co., Zero Coupon, 3/28/2011, (IDR), 144A | | | 1,787,720 |
| | 17,920,000,000 | | JPMorgan Chase & Co., Zero Coupon, 3/28/2011, (IDR), 144A | | | 1,410,416 |
| | 68,827,366,920 | | JPMorgan Chase & Co., Zero Coupon, 4/12/2012, (IDR), 144A | | | 4,727,411 |
See accompanying notes to financial statements.
8
LOOMIS SAYLES INVESTMENT GRADE BOND FUND — PORTFOLIOOF INVESTMENTS (continued)
Investments as of September 30, 2008
| | | | | |
Principal
Amount (‡) | | Description | | Value (†) |
| | | | | |
| | Banking — continued | | | |
| 24,124,936,500 | | JPMorgan Chase London, EMTN, Zero Coupon, 10/21/2010, (IDR), 144A | | $ | 2,012,629 |
| 1,700,000 | | Kaupthing Bank, 3.491%, 1/15/2010, 144A(b) | | | 1,326,000 |
| 18,400,000 | | Kaupthing Bank, Series D, 5.750%, 10/04/2011, 144A | | | 11,776,000 |
| 2,700,000 | | Kaupthing Bank, Series E, 6.125%, 10/04/2016, 144A | | | 1,431,000 |
| 100,000 | | Keybank NA, 6.950%, 2/01/2028 | | | 52,467 |
| 30,000,000 | | Kreditanstalt fuer Wiederaufbau, EMTN, 10.750%, 2/01/2010, (ISK) | | | 286,276 |
| 13,950,000 | | PNC Bank NA, 6.875%, 4/01/2018 | | | 13,360,668 |
| 1,181,000,000 | | Rabobank Nederland, 10.250%, 9/10/2009, (ISK), 144A | | | 10,978,153 |
| 330,000,000 | | Rabobank Nederland, EMTN, 12.500%, 2/17/2009, (ISK) | | | 3,075,802 |
| 1,176,000,000 | | Rabobank Nederland, EMTN, 14.000%, 1/28/2009, (ISK), 144A | | | 11,205,382 |
| | | | | |
| | | | | 92,418,419 |
| | | | | |
| | Brokerage — 4.6% | | | |
| 2,220,000 | | Bear Stearns Cos., Inc. (The), 4.650%, 7/02/2018 | | | 1,738,504 |
| 975,000 | | Bear Stearns Cos., Inc. (The), 5.300%, 10/30/2015 | | | 864,450 |
| 2,150,000 | | Bear Stearns Cos., Inc. (The), 6.400%, 10/02/2017 | | | 2,007,878 |
| 15,000,000 | | Bear Stearns Cos., Inc. (The), 7.250%, 2/01/2018 | | | 14,435,625 |
| 13,400,000 | | Goldman Sachs Group LP, 5.000%, 10/01/2014 | | | 11,176,498 |
| 6,790,000 | | Goldman Sachs Group, Inc. (The), 5.150%, 1/15/2014 | | | 5,576,512 |
| 31,730,000 | | Lehman Brothers Holdings, Inc., 6.875%, 7/17/2037(c)(d) | | | 39,662 |
| 2,520,000 | | Lehman Brothers Holdings, Inc., (fixed rate to 5/03/2027, variable rate thereafter), MTN, 6.000%, 5/03/2032(d) | | | 3,150 |
| 109,500,000 | | Merrill Lynch & Co., Inc., 6.110%, 1/29/2037 | | | 76,016,652 |
| 10,000,000 | | Merrill Lynch & Co., Inc., 10.710%, 3/08/2017, (BRL) | | | 3,731,147 |
| 3,200,000 | | Merrill Lynch & Co., Inc., EMTN, 4.625%, 9/14/2018, (EUR) | | | 2,467,412 |
| 27,910,000 | | Morgan Stanley, 3.875%, 1/15/2009 | | | 25,677,702 |
| 12,975,000 | | Morgan Stanley, 4.000%, 1/15/2010 | | | 10,639,617 |
| 7,000,000 | | Morgan Stanley, 5.375%, 10/15/2015 | | | 4,338,565 |
| 10,000,000 | | Morgan Stanley, 5.750%, 4/01/2009, (EUR) | | | 12,389,769 |
| 1,510,000 | | Morgan Stanley, EMTN, 5.450%, 1/09/2017 | | | 936,664 |
| 4,200,000 | | Morgan Stanley, MTN, 6.250%, 8/09/2026 | | | 2,567,540 |
| 11,800,000 | | Morgan Stanley, Series F, MTN, 5.550%, 4/27/2017 | | | 7,315,174 |
| | | | | | |
Principal
Amount (‡) | | Description | | Value (†) |
| | | | | | |
| | | Brokerage — continued | | | |
| $ | 1,515,000 | | Morgan Stanley, Series F, MTN, 5.950%, 12/28/2017 | | $ | 949,066 |
| | 31,790,000 | | Morgan Stanley, Series F, MTN, 6.625%, 4/01/2018 | | | 21,038,336 |
| | | | | | |
| | | | | | 203,909,923 |
| | | | | | |
| | | Building Materials — 0.7% | | | |
| | 10,000,000 | | Masco Corp., 5.850%, 3/15/2017(c) | | | 8,439,790 |
| | 6,465,000 | | Owens Corning, Inc., 6.500%, 12/01/2016 | | | 5,720,963 |
| | 20,368,000 | | Owens Corning, Inc., 7.000%, 12/01/2036 | | | 16,373,346 |
| | 1,060,000 | | USG Corp., 6.300%, 11/15/2016 | | | 800,300 |
| | | | | | |
| | | | | | 31,334,399 |
| | | | | | |
| | | Chemicals — 2.0% | | | |
| | 22,665,000 | | Lubrizol Corp., 6.500%, 10/01/2034 | | | 20,373,070 |
| | 2,400,000 | | Methanex Corp., 6.000%, 8/15/2015 | | | 2,111,136 |
| | 68,560,000 | | PPG Industries, Inc., 6.650%, 3/15/2018 | | | 67,707,593 |
| | | | | | |
| | | | | | 90,191,799 |
| | | | | | |
| | | Construction Machinery — 0.2% | | | |
| | 6,935,000 | | Toro Co., 6.625%, 5/01/2037 | | | 7,307,659 |
| | | | | | |
| | | Consumer Cyclical Services — 0.3% | | | |
| | 19,330,000 | | Western Union Co., 6.200%, 11/17/2036 | | | 15,105,100 |
| | | | | | |
| | | Distributors — 1.4% | | | |
| | 61,345,000 | | Equitable Resources, Inc., 6.500%, 4/01/2018 | | | 58,528,651 |
| | 5,865,000 | | ONEOK, Inc., 6.000%, 6/15/2035 | | | 4,186,079 |
| | | | | | |
| | | | | | 62,714,730 |
| | | | | | |
| | | Electric — 5.7% | | | |
| | 40,400,000 | | AmerenEnergy Generating Co., Series H, 7.000%, 4/15/2018 | | | 37,675,343 |
| | 500,000 | | Baltimore Gas & Electric Co., 5.200%, 6/15/2033 | | | 340,262 |
| | 11,360,000 | | Bruce Mansfield Unit, 6.850%, 6/01/2034(e) | | | 11,328,192 |
| | 26,290,000 | | Cleveland Electric Illuminating Co. (The), 5.950%, 12/15/2036 | | | 20,900,734 |
| | 895,000 | | Commonwealth Edison Co., 4.700%, 4/15/2015 | | | 807,004 |
| | 1,700,000 | | Commonwealth Edison Co., 5.875%, 2/01/2033 | | | 1,393,201 |
| | 2,750,000 | | Constellation Energy Group, Inc., 4.550%, 6/15/2015 | | | 2,357,836 |
| | 960,000 | | Dominion Resources, Inc., 5.950%, 6/15/2035 | | | 794,198 |
| | 5,500,000 | | Empresa Nacional de Electricidad SA (Endesa-Chile), 7.875%, 2/01/2027 | | | 5,760,095 |
| | 1,000,000 | | Empresa Nacional de Electricidad SA (Endesa-Chile), 8.350%, 8/01/2013 | | | 1,067,974 |
See accompanying notes to financial statements.
9
LOOMIS SAYLES INVESTMENT GRADE BOND FUND — PORTFOLIOOF INVESTMENTS (continued)
Investments as of September 30, 2008
| | | | | | |
Principal
Amount (‡) | | Description | | Value (†) |
| | | | | | |
| | | Electric — continued | | | |
| $ | 47,570,000 | | Illinois Power Co., 6.250%, 4/01/2018 | | $ | 43,809,354 |
| | 1,905,000 | | ITC Holdings Corp., 5.875%, 9/30/2016, 144A | | | 1,794,912 |
| | 2,830,000 | | ITC Holdings Corp., 6.375%, 9/30/2036, 144A | | | 2,445,454 |
| | 10,070,960 | | Mackinaw Power LLC, 6.296%, 10/31/2023, 144A | | | 10,046,890 |
| | 1,500,000 | | MidAmerican Energy Holdings Co., 5.875%, 10/01/2012 | | | 1,486,830 |
| | 1,000,000 | | MidAmerican Energy Holdings Co., 6.125%, 4/01/2036 | | | 841,080 |
| | 7,185,000 | | MidAmerican Energy Holdings Co., 6.500%, 9/15/2037 | | | 6,303,832 |
| | 27,500,000 | | Nisource Finance Corp., 6.400%, 3/15/2018 | | | 24,645,197 |
| | 21,585,000 | | Nisource Finance Corp., 6.800%, 1/15/2019(c) | | | 19,606,540 |
| | 37,750 | | Quezon Power Philippines Co., 8.860%, 6/15/2017 | | | 37,561 |
| | 51,115,000 | | Southwestern Electric Power Co., 6.450%, 1/15/2019(c) | | | 48,091,037 |
| | 500,000 | | SP Powerassets Ltd., EMTN, 3.730%, 10/22/2010, (SGD) | | | 355,231 |
| | 8,025,000 | | Toledo Edison Co., 6.150%, 5/15/2037 | | | 6,533,650 |
| | 1,075,000 | | White Pine Hydro LLC, 6.310%, 7/10/2017(e) | | | 1,031,939 |
| | 1,600,000 | | White Pine Hydro LLC, 6.960%, 7/10/2037(e) | | | 1,544,376 |
| | | | | | |
| | | | | | 250,998,722 |
| | | | | | |
| | | Entertainment — 0.2% | | | |
| | 3,565,000 | | Time Warner, Inc., 6.500%, 11/15/2036 | | | 2,707,293 |
| | 1,805,000 | | Time Warner, Inc., 6.625%, 5/15/2029 | | | 1,441,690 |
| | 755,000 | | Time Warner, Inc., 6.950%, 1/15/2028 | | | 629,459 |
| | 505,000 | | Time Warner, Inc., 7.625%, 4/15/2031 | | | 438,522 |
| | 330,000 | | Time Warner, Inc., 7.700%, 5/01/2032 | | | 288,334 |
| | 3,590,000 | | Viacom, Inc., Class B, 6.875%, 4/30/2036 | | | 2,878,031 |
| | | | | | |
| | | | | | 8,383,329 |
| | | | | | |
| | | Food & Beverage — 1.4% | | | |
| | 6,845,000 | | Anheuser-Busch Cos., Inc., 5.950%, 1/15/2033 | | | 5,291,329 |
| | 8,760,000 | | Anheuser-Busch Cos., Inc., 6.450%, 9/01/2037 | | | 7,097,098 |
| | 2,500,000 | | Cargill, Inc., EMTN, 5.375%, 3/02/2037, (GBP) | | | 3,442,527 |
| | 1,525,000 | | Cia Brasileira de Bebidas, 8.750%, 9/15/2013 | | | 1,629,844 |
| | 6,080,000 | | Corn Products International, Inc., 6.625%, 4/15/2037 | | | 6,323,510 |
| | 9,925,000 | | Kraft Foods, Inc., 6.500%, 8/11/2017 | | | 9,549,865 |
| | | | | | |
Principal
Amount (‡) | | Description | | Value (†) |
| | | | | | |
| | | Food & Beverage — continued | | | |
| $ | 21,385,000 | | Kraft Foods, Inc., 6.500%, 11/01/2031 | | $ | 18,592,162 |
| | 8,080,000 | | Kraft Foods, Inc., 7.000%, 8/11/2037 | | | 7,559,672 |
| | | | | | |
| | | | | | 59,486,007 |
| | | | | | |
| | | Foreign Agency — 0.0% | | | |
| | 220,000 | | Alberta Municipal Funding Corp., 5.700%, 9/01/2011, (CAD) | | | 218,146 |
| | | | | | |
| | | Foreign Local Governments — 0.0% | | | |
| | 27,436 | | Province of Alberta, 5.930%, 9/16/2016, (CAD) | | | 27,928 |
| | 500,000 | | Province of Nova Scotia, 6.600%, 6/01/2027, (CAD) | | | 549,157 |
| | | | | | |
| | | | | | 577,085 |
| | | | | | |
| | | Government Guaranteed — 1.0% | | | |
| | 45,000,000 | | Canada Housing Trust, 4.100%, 12/15/2008, (CAD) | | | 42,439,324 |
| | | | | | |
| | | Government Owned-No Guarantee — 1.7% | | | |
| | 37,780,000 | | Abu Dhabi National Energy Co., 7.250%, 8/01/2018, 144A | | | 36,832,138 |
| | 51,020,000 | | DP World Ltd., 6.850%, 7/02/2037, 144A | | | 37,773,167 |
| | | | | | |
| | | | | | 74,605,305 |
| | | | | | |
| | | Government Sponsored — 0.2% | | | |
| | 15,000,000 | | Queensland Treasury Corp., 7.125%, 9/18/2017, (NZD), 144A | | | 10,533,935 |
| | | | | | |
| | | Health Insurance — 0.1% | | | |
| | 5,455,000 | | CIGNA Corp., 6.150%, 11/15/2036 | | | 4,595,728 |
| | | | | | |
| | | Healthcare — 3.4% | | | |
| | 7,535,000 | | Covidien International Finance SA, 6.000%, 10/15/2017 | | | 7,444,527 |
| | 7,590,000 | | Covidien International Finance SA, 6.550%, 10/15/2037 | | | 7,296,988 |
| | 9,310,000 | | HCA, Inc., 5.750%, 3/15/2014 | | | 7,261,800 |
| | 1,950,000 | | HCA, Inc., 6.250%, 2/15/2013 | | | 1,628,250 |
| | 3,250,000 | | HCA, Inc., 6.300%, 10/01/2012 | | | 2,803,125 |
| | 3,810,000 | | HCA, Inc., 6.375%, 1/15/2015 | | | 3,000,375 |
| | 4,015,000 | | HCA, Inc., 6.500%, 2/15/2016 | | | 3,181,888 |
| | 365,000 | | HCA, Inc., 6.750%, 7/15/2013 | | | 306,600 |
| | 3,000,000 | | HCA, Inc., 7.050%, 12/01/2027 | | | 2,025,870 |
| | 2,290,000 | | HCA, Inc., 7.190%, 11/15/2015 | | | 1,828,180 |
| | 2,155,000 | | HCA, Inc., 7.500%, 12/15/2023 | | | 1,578,645 |
| | 250,000 | | HCA, Inc., 7.500%, 11/06/2033 | | | 177,500 |
| | 3,890,000 | | HCA, Inc., 7.690%, 6/15/2025 | | | 2,891,204 |
See accompanying notes to financial statements.
10
LOOMIS SAYLES INVESTMENT GRADE BOND FUND — PORTFOLIOOF INVESTMENTS (continued)
Investments as of September 30, 2008
| | | | | | |
Principal
Amount (‡) | | Description | | Value (†) |
| | | | | | |
| | | Healthcare — continued | | | |
| $ | 4,255,000 | | HCA, Inc., 8.360%, 4/15/2024 | | $ | 3,297,965 |
| | 1,225,000 | | HCA, Inc., MTN, 7.580%, 9/15/2025 | | | 902,494 |
| | 1,640,000 | | HCA, Inc., MTN, 7.750%, 7/15/2036 | | | 1,164,236 |
| | 2,865,000 | | Hospira, Inc., 6.050%, 3/30/2017 | | | 2,731,617 |
| | 57,190,000 | | Medco Health Solutions, Inc., 7.125%, 3/15/2018 | | | 57,950,799 |
| | 530,000 | | Owens & Minor, Inc., 6.350%, 4/15/2016(e) | | | 516,077 |
| | 24,355,000 | | UnitedHealth Group, Inc., 5.800%, 3/15/2036 | | | 18,476,994 |
| | 565,000 | | UnitedHealth Group, Inc., 6.500%, 6/15/2037 | | | 469,041 |
| | 2,810,000 | | UnitedHealth Group, Inc., 6.625%, 11/15/2037 | | | 2,362,221 |
| | 27,070,000 | | WellPoint, Inc., 6.375%, 6/15/2037 | | | 23,160,361 |
| | | | | | |
| | | | | | 152,456,757 |
| | | | | | |
| | | Home Construction — 0.5% | | | |
| | 850,000 | | Centex Corp., 5.250%, 6/15/2015 | | | 624,750 |
| | 3,685,000 | | D.R. Horton, Inc., 5.250%, 2/15/2015 | | | 2,726,900 |
| | 2,050,000 | | Desarrolladora Homex SAB de CV, 7.500%, 9/28/2015 | | | 1,804,000 |
| | 2,605,000 | | Lennar Corp., Series B, 5.600%, 5/31/2015 | | | 1,693,250 |
| | 1,870,000 | | Lennar Corp., Series B, 6.500%, 4/15/2016 | | | 1,262,250 |
| | 2,945,000 | | Pulte Homes, Inc., 5.200%, 2/15/2015 | | | 2,356,000 |
| | 250,000 | | Pulte Homes, Inc., 5.250%, 1/15/2014 | | | 207,500 |
| | 9,400,000 | | Pulte Homes, Inc., 6.000%, 2/15/2035 | | | 6,721,000 |
| | 3,645,000 | | Pulte Homes, Inc., 6.375%, 5/15/2033 | | | 2,660,850 |
| | 3,605,000 | | Toll Brothers Finance Corp., 5.150%, 5/15/2015 | | | 3,048,803 |
| | | | | | |
| | | | | | 23,105,303 |
| | | | | | |
| | | Hybrid ARMS — 0.0% | | | |
| | 148,991 | | Wells Fargo Mortgage Backed Securities Trust, 6.030%, 9/25/2036(b) | | | 107,273 |
| | | | | | |
| | | Independent Energy — 1.9% | | | |
| | 4,020,000 | | Anadarko Petroleum Corp., 5.950%, 9/15/2016 | | | 3,694,842 |
| | 13,905,000 | | Anadarko Petroleum Corp., 6.450%, 9/15/2036 | | | 10,902,187 |
| | 10,875,000 | | Apache Corp., 6.000%, 1/15/2037 | | | 9,191,811 |
| | 1,190,000 | | Chesapeake Energy Corp., 6.250%, 1/15/2017, (EUR) | | | 1,390,484 |
| | 500,000 | | Devon Financing Corp. LLC, 7.875%, 9/30/2031 | | | 507,733 |
| | | | | | |
Principal
Amount (‡) | | Description | | Value (†) |
| | | | | | |
| | | Independent Energy — continued | | | |
| $ | 48,640,000 | | Questar Market Resources, Inc., 6.800%, 4/01/2018 | | $ | 49,043,615 |
| | 3,585,000 | | Talisman Energy, Inc., 5.850%, 2/01/2037 | | | 2,691,217 |
| | 3,515,000 | | Talisman Energy, Inc., 6.250%, 2/01/2038 | | | 2,730,027 |
| | 160,000 | | XTO Energy, Inc., 6.100%, 4/01/2036 | | | 132,482 |
| | 6,230,000 | | XTO Energy, Inc., 6.750%, 8/01/2037 | | | 5,527,985 |
| | | | | | |
| | | | | | 85,812,383 |
| | | | | | |
| | | Integrated Energy — 0.0% | | | |
| | 1,525,109 | | PF Export Receivables Master Trust, 6.436%, 6/01/2015, 144A | | | 1,570,862 |
| | | | | | |
| | | Life Insurance — 0.3% | | | |
| | 15,400,000 | | ASIF Global Financing XXVII, 2.380%, 2/26/2009, (SGD), 144A | | | 5,445,760 |
| | 9,260,000 | | Mutual of Omaha Insurance Co., 6.800%, 6/15/2036, 144A | | | 8,711,437 |
| | | | | | |
| | | | | | 14,157,197 |
| | | | | | |
| | | Local Authorities — 0.9% | | | |
| | 7,070,000 | | Manitoba (Province OF), GMTN, 6.375%, 9/01/2015, (NZD) | | | 4,630,852 |
| | 10,440,000 | | Quebec Province, Series QC, 6.750%, 11/09/2015, (NZD) | | | 7,009,106 |
| | 19,325,000 | | Queensland Treasury Corp., Series 11G, 6.000%, 6/14/2011, (AUD) | | | 15,354,326 |
| | 14,895,000 | | Virginia Tobacco Settlement Financing Corp., Series A-1, 6.706%, 6/01/2046(e) | | | 11,535,433 |
| | | | | | |
| | | | | | 38,529,717 |
| | | | | | |
| | | Media Cable — 2.7% | | | |
| | 16,501,000 | | Comcast Corp., 5.650%, 6/15/2035 | | | 12,265,738 |
| | 2,195,000 | | Comcast Corp., 6.450%, 3/15/2037 | | | 1,770,406 |
| | 4,610,000 | | Comcast Corp., 6.500%, 11/15/2035 | | | 3,848,999 |
| | 32,715,000 | | Comcast Corp., 6.950%, 8/15/2037 | | | 27,904,357 |
| | 3,750,000 | | Cox Communications, Inc., Class A, 6.750%, 3/15/2011 | | | 3,809,179 |
| | 75,000,000 | | Time Warner Cable, Inc., 6.750%, 7/01/2018 | | | 70,044,750 |
| | 350,000 | | Virgin Media Finance PLC, 9.750%, 4/15/2014, (GBP) | | | 479,131 |
| | | | | | |
| | | | | | 120,122,560 |
| | | | | | |
| | | Media Non-Cable — 0.5% | | | |
| | 2,500,000 | | Clear Channel Communications, Inc., 4.250%, 5/15/2009 | | | 2,350,000 |
| | 1,000,000 | | Clear Channel Communications, Inc., 5.750%, 1/15/2013 | | | 360,000 |
| | 7,700,000 | | News America, Inc., 6.150%, 3/01/2037 | | | 6,278,018 |
| | 4,095,000 | | News America, Inc., 6.200%, 12/15/2034 | | | 3,264,898 |
| | 9,760,000 | | News America, Inc., 6.400%, 12/15/2035 | | | 8,198,703 |
See accompanying notes to financial statements.
11
LOOMIS SAYLES INVESTMENT GRADE BOND FUND — PORTFOLIOOF INVESTMENTS (continued)
Investments as of September 30, 2008
| | | | | | |
Principal
Amount (‡) | | Description | | Value (†) |
| | | | | | |
| | | Media Non-Cable — continued | | | |
| $ | 1,005,000 | | R.H. Donnelley Corp., 6.875%, 1/15/2013 | | $ | 391,950 |
| | 1,665,000 | | R.H. Donnelley Corp., Series A-1, 6.875%, 1/15/2013(c) | | | 649,350 |
| | 1,950,000 | | R.H. Donnelley Corp., Series A-2, 6.875%, 1/15/2013 | | | 760,500 |
| | 1,760,000 | | R.H. Donnelley Corp., Series A-3, 8.875%, 1/15/2016(c) | | | 598,400 |
| | 555,000 | | R.H. Donnelley Corp., Series A-4, 8.875%, 10/15/2017(c) | | | 188,700 |
| | | | | | |
| | | | | | 23,040,519 |
| | | | | | |
| | | Metals & Mining — 1.1% | | | |
| | 12,775,000 | | Newmont Mining Corp., 5.875%, 4/01/2035 | | | 9,721,762 |
| | 1,500,000 | | Teck Cominco Ltd., 7.000%, 9/15/2012 | | | 1,518,105 |
| | 1,985,000 | | United States Steel Corp., 6.050%, 6/01/2017 | | | 1,724,868 |
| | 4,712,000 | | United States Steel Corp., 6.650%, 6/01/2037 | | | 3,504,352 |
| | 31,890,000 | | United States Steel Corp., 7.000%, 2/01/2018 | | | 28,789,016 |
| | 3,735,000 | | Vale Overseas Ltd., 6.875%, 11/21/2036 | | | 3,324,550 |
| | | | | | |
| | | | | | 48,582,653 |
| | | | | | |
| | | Mortgage Related — 0.2% | | | |
| | 3,000,000 | | Bank of America-First Union NB Commercial Mortgage, Series 2001-3, Class A2, 5.464%, 4/11/2037 | | | 2,935,756 |
| | 1,782,895 | | CS First Boston Mortgage Securities Corp., Series 2005-7, Class 3A1, 5.000%, 8/25/2020 | | | 1,591,792 |
| | 180,033 | | Federal Home Loan Mortgage Corp., 5.000%, 12/01/2031 | | | 176,183 |
| | 4,465,000 | | Federal Home Loan Mortgage Corp., MTN, 5.000%, 12/14/2018(c) | | | 4,196,903 |
| | 34,575 | | Federal National Mortgage Association, 6.000%, 7/01/2029 | | | 35,314 |
| | | | | | |
| | | | | | 8,935,948 |
| | | | | | |
| | | Non-Captive Consumer — 2.0% | | | |
| | 5,000,000 | | American General Finance Corp., Series I, MTN, 5.400%, 12/01/2015 | | | 2,468,315 |
| | 88,895,000 | | American General Finance Corp., Series J, MTN, 6.900%, 12/15/2017 | | | 41,219,901 |
| | 400,000 | | Countrywide Financial Corp., Series A, MTN, 3.333%, 12/19/2008(b)(c) | | | 395,471 |
| | 1,170,000 | | Countrywide Home Loans, Inc., Series L, MTN, 4.000%, 3/22/2011 | | | 1,006,614 |
| | 180,000 | | Residential Capital LLC, 8.125%, 11/21/2008(c) | | | 153,000 |
| | 840,000 | | Residential Capital LLC, 8.375%, 6/30/2010(c) | | | 193,200 |
| | 20,645,000 | | Residential Capital LLC, 8.500%, 4/17/2013(c) | | | 4,129,000 |
| | 385,000 | | Residential Capital LLC, 8.875%, 6/30/2015(c) | | | 77,000 |
| | 10,807,000 | | Residential Capital LLC, 9.625%, 5/15/2015, 144A | | | 2,593,680 |
| | | | | | |
Principal
Amount (‡) | | Description | | Value (†) |
| | | | | | |
| | | Non-Captive Consumer — continued | | | |
| $ | 63,775(†††) | | SLM Corp., 6.000%, 12/15/2043 | | $ | 658,636 |
| | 6,200,000 | | SLM Corp., EMTN, 4.750%, 3/17/2014, (EUR) | | | 4,800,599 |
| | 630,000 | | SLM Corp., MTN, 5.050%, 11/14/2014 | | | 384,300 |
| | 310,000 | | SLM Corp., MTN, 5.125%, 8/27/2012 | | | 201,500 |
| | 200,000 | | SLM Corp., Series A, MTN, 4.000%, 1/15/2010 | | | 157,000 |
| | 3,190,000 | | SLM Corp., Series A, MTN, 5.000%, 10/01/2013 | | | 1,977,800 |
| | 2,120,000 | | SLM Corp., Series A, MTN, 5.000%, 4/15/2015 | | | 1,272,000 |
| | 960,000 | | SLM Corp., Series A, MTN, 5.000%, 6/15/2018 | | | 528,000 |
| | 1,680,000 | | SLM Corp., Series A, MTN, 5.375%, 1/15/2013 | | | 1,100,400 |
| | 1,470,000 | | SLM Corp., Series A, MTN, 5.375%, 5/15/2014 | | | 911,400 |
| | 300,000 | | SLM Corp., Series A, MTN, 5.400%, 10/25/2011 | | | 210,000 |
| | 690,000 | | SLM Corp., Series A, MTN, 5.625%, 8/01/2033 | | | 345,000 |
| | 7,590,000 | | SLM Corp., Series A, MTN, 6.500%, 6/15/2010, (NZD) | | | 4,215,445 |
| | 31,335,000 | | SLM Corp., Series A, MTN, 8.450%, 6/15/2018 | | | 21,307,800 |
| | | | | | |
| | | | | | 90,306,061 |
| | | | | | |
| | | Non-Captive Diversified — 3.7% | | | |
| | 500,000 | | CIT Group, Inc., 5.400%, 2/13/2012 | | | 287,437 |
| | 7,550,000 | | CIT Group, Inc., 5.500%, 12/01/2014, (GBP) | | | 6,700,164 |
| | 1,750,000 | | CIT Group, Inc., EMTN, 3.800%, 11/14/2012, (EUR) | | | 1,329,546 |
| | 350,000 | | CIT Group, Inc., EMTN, 4.650%, 9/19/2016, (EUR) | | | 241,486 |
| | 2,050,000 | | CIT Group, Inc., EMTN, 5.000%, 5/13/2014, (EUR) | | | 1,476,262 |
| | 4,250,000 | | CIT Group, Inc., EMTN, 5.500%, 12/20/2016, (GBP) | | | 3,768,510 |
| | 5,450,000 | | CIT Group, Inc., GMTN, 4.250%, 9/22/2011, (EUR) | | | 4,582,692 |
| | 450,000 | | CIT Group, Inc., GMTN, 5.000%, 2/13/2014, (EUR) | | | 254,551 |
| | 1,450,000 | | CIT Group, Inc., MTN, 4.250%, 3/17/2015, (EUR) | | | 1,000,581 |
| | 780,000 | | CIT Group, Inc., MTN, 5.125%, 9/30/2014 | | | 384,662 |
| | 2,370,000 | | CIT Group, Inc., Series A, GMTN, 6.000%, 4/01/2036 | | | 971,700 |
| | 87,745,000 | | CIT Group, Inc., Series A, MTN, 7.625%, 11/30/2012 | | | 55,662,445 |
| | 4,200,000 | | General Electric Capital Corp., 6.625%, 2/04/2010, (NZD) | | | 2,695,060 |
| | 3,560,000 | | General Electric Capital Corp., GMTN, 7.625%, 12/10/2014, (NZD) | | | 2,318,987 |
See accompanying notes to financial statements.
12
LOOMIS SAYLES INVESTMENT GRADE BOND FUND — PORTFOLIOOF INVESTMENTS (continued)
Investments as of September 30, 2008
| | | | | |
Principal
Amount (‡) | | Description | | Value (†) |
| | | | | |
| | Non-Captive Diversified — continued | | | |
| 14,535,000 | | General Electric Capital Corp., Series A, EMTN, 6.750%, 9/26/2016, (NZD) | | $ | 8,650,614 |
| 6,200,000 | | General Electric Capital Corp., Series A, GMTN, 2.960%, 5/18/2012, (SGD) | | | 4,230,611 |
| 13,400,000 | | General Electric Capital Corp., Series A, GMTN, 3.485%, 3/08/2012, (SGD) | | | 9,322,394 |
| 22,137,000 | | General Electric Capital Corp., Series A, MTN, 6.500%, 9/28/2015, (NZD) | | | 13,196,925 |
| 2,805,000 | | GMAC LLC, EMTN, 4.750%, 9/14/2009, (EUR) | | | 2,527,283 |
| 1,345,000 | | GMAC LLC, 6.000%, 12/15/2011 | | | 598,039 |
| 1,310,000 | | GMAC LLC, 6.625%, 5/15/2012 | | | 554,612 |
| 1,670,000 | | GMAC LLC, 6.750%, 12/01/2014 | | | 640,969 |
| 1,500,000 | | GMAC LLC, 6.875%, 9/15/2011 | | | 669,281 |
| 400,000 | | GMAC LLC, 6.875%, 8/28/2012 | | | 158,991 |
| 1,210,000 | | GMAC LLC, 7.000%, 2/01/2012 | | | 493,208 |
| 2,335,000 | | GMAC LLC, 8.000%, 11/01/2031(c) | | | 880,942 |
| 5,045,000 | | GMAC LLC, EMTN, 5.375%, 6/06/2011, (EUR) | | | 2,982,988 |
| 380,000 | | GMAC LLC, EMTN, 5.750%, 9/27/2010, (EUR) | | | 240,734 |
| 1,965,000 | | International Lease Finance Corp., 5.000%, 4/15/2010 | | | 1,455,607 |
| 3,280,000 | | International Lease Finance Corp., 6.375%, 3/25/2013 | | | 2,071,356 |
| 16,000,000 | | International Lease Finance Corp., EMTN, 6.625%, 12/07/2009, (GBP) | | | 22,671,121 |
| 655,000 | | International Lease Finance Corp., Series R, MTN, 5.550%, 9/05/2012 | | | 481,684 |
| 5,225,000 | | iStar Financial, Inc., 5.150%, 3/01/2012 | | | 2,612,500 |
| 1,000,000 | | iStar Financial, Inc., 5.375%, 4/15/2010(c) | | | 600,000 |
| 330,000 | | iStar Financial, Inc., 5.500%, 6/15/2012 | | | 168,300 |
| 3,700,000 | | iStar Financial, Inc., 5.650%, 9/15/2011 | | | 1,924,000 |
| 765,000 | | iStar Financial, Inc., 5.800%, 3/15/2011 | | | 390,150 |
| 385,000 | | iStar Financial, Inc., 5.850%, 3/15/2017 | | | 188,650 |
| 1,605,000 | | iStar Financial, Inc., 5.875%, 3/15/2016 | | | 786,450 |
| 745,000 | | iStar Financial, Inc., 6.050%, 4/15/2015 | | | 365,050 |
| 535,000 | | iStar Financial, Inc., 8.625%, 6/01/2013 | | | 262,150 |
| 335,000 | | iStar Financial, Inc., Series B, 5.125%, 4/01/2011 | | | 170,850 |
| 254,000 | | iStar Financial, Inc., Series B, 5.700%, 3/01/2014 | | | 124,460 |
| | | | | | |
Principal
Amount (‡) | | Description | | Value (†) |
| | | | | | |
| | | Non-Captive Diversified — continued | | | |
| $ | 5,680,000 | | iStar Financial, Inc., Series B, 5.950%, 10/15/2013 | | $ | 2,953,600 |
| | | | | | |
| | | | | | 164,047,602 |
| | | | | | |
| | | Oil Field Services — 0.1% | | | |
| | 600,000 | | Transocean Sedco Forex, Inc., 7.375%, 4/15/2018 | | | 622,942 |
| | 3,840,000 | | Weatherford International Ltd., 6.500%, 8/01/2036 | | | 3,310,237 |
| | | | | | |
| | | | | | 3,933,179 |
| | | | | | |
| | | Paper — 2.6% | | | |
| | 1,395,000 | | Bowater, Inc., 6.500%, 6/15/2013 | | | 537,075 |
| | 575,000 | | Georgia-Pacific LLC, 7.250%, 6/01/2028 | | | 454,250 |
| | 2,460,000 | | Georgia-Pacific LLC, 7.375%, 12/01/2025 | | | 1,986,450 |
| | 285,000 | | Georgia-Pacific LLC, 7.750%, 11/15/2029 | | | 235,125 |
| | 1,340,000 | | Georgia-Pacific LLC, 8.000%, 1/15/2024 | | | 1,179,200 |
| | 2,280,000 | | Georgia-Pacific LLC, 8.875%, 5/15/2031 | | | 1,983,600 |
| | 750,000 | | International Paper Co., 4.000%, 4/01/2010 | | | 727,718 |
| | 300,000 | | International Paper Co., 5.250%, 4/01/2016 | | | 254,901 |
| | 989,000 | | International Paper Co., 5.500%, 1/15/2014 | | | 909,646 |
| | 87,495,000 | | International Paper Co., 7.950%, 6/15/2018 | | | 85,973,550 |
| | 22,860,000 | | Weyerhaeuser Co., 6.875%, 12/15/2033 | | | 19,863,557 |
| | | | | | |
| | | | | | 114,105,072 |
| | | | | | |
| | | Pharmaceuticals — 1.2% | | | |
| | 20,830,000 | | Astrazeneca PLC, 6.450%, 9/15/2037 | | | 19,916,625 |
| | 800,000 | | Elan Financial PLC, 7.750%, 11/15/2011 | | | 724,000 |
| | 2,280,000 | | Elan Financial PLC, 8.875%, 12/01/2013(c) | | | 1,915,200 |
| | 28,670,000 | | Johnson & Johnson, 5.950%, 8/15/2037 | | | 28,355,633 |
| | 500,000 | | Schering-Plough Corp., 5.550%, 12/01/2013 | | | 483,519 |
| | | | | | |
| | | | | | 51,394,977 |
| | | | | | |
| | | Pipelines — 5.1% | | | |
| | 1,174,000 | | Colorado Interstate Gas Co., 5.950%, 3/15/2015 | | | 1,069,630 |
| | 125,000 | | Colorado Interstate Gas Co., 6.800%, 11/15/2015 | | | 118,419 |
| | 2,010,000 | | DCP Midstream LP, 6.450%, 11/03/2036, 144A | | | 1,607,819 |
| | 2,470,000 | | El Paso Corp., 6.950%, 6/01/2028 | | | 1,950,297 |
| | 540,000 | | Energy Transfer Partners LP, 6.125%, 2/15/2017 | | | 493,470 |
| | 1,605,000 | | Energy Transfer Partners LP, 6.625%, 10/15/2036 | | | 1,367,508 |
See accompanying notes to financial statements.
13
LOOMIS SAYLES INVESTMENT GRADE BOND FUND — PORTFOLIOOF INVESTMENTS (continued)
Investments as of September 30, 2008
| | | | | | |
Principal
Amount (‡) | | Description | | Value (†) |
| | | | | | |
| | | Pipelines — continued | | | |
| $ | 9,455,000 | | Enterprise Products Operating LP, 6.300%, 9/15/2017 | | $ | 8,817,610 |
| | 4,390,000 | | Kinder Morgan Energy Partners LP, 5.800%, 3/15/2035 | | | 3,269,461 |
| | 82,600,000 | | Kinder Morgan Energy Partners LP, 5.950%, 2/15/2018(c) | | | 73,575,207 |
| | 310,000 | | Kinder Morgan Finance, 5.700%, 1/05/2016 | | | 266,600 |
| | 320,000 | | Kinder Morgan, Inc., Senior Note, 5.150%, 3/01/2015 | | | 271,200 |
| | 31,430,000 | | NGPL Pipeco LLC, 7.119%, 12/15/2017, 144A | | | 29,831,125 |
| | 4,665,000 | | ONEOK Partners LP, 6.650%, 10/01/2036 | | | 4,082,589 |
| | 10,115,000 | | Panhandle Eastern Pipeline Co., 6.200%, 11/01/2017 | | | 9,120,908 |
| | 48,630,000 | | Panhandle Eastern Pipeline Co., 7.000%, 6/15/2018 | | | 45,930,160 |
| | 2,130,000 | | Plains All American Pipeline LP, 6.125%, 1/15/2017 | | | 1,935,514 |
| | 16,025,000 | | Plains All American Pipeline LP, 6.500%, 5/01/2018, 144A | | | 14,456,120 |
| | 4,595,000 | | Plains All American Pipeline LP, 6.650%, 1/15/2037 | | | 3,763,879 |
| | 4,215,000 | | Southern Natural Gas Co., 5.900%, 4/01/2017, 144A | | | 3,730,246 |
| | 2,415,000 | | Tennessee Gas Pipeline Co., 7.000%, 10/15/2028 | | | 2,069,539 |
| | 20,000,000 | | Texas Eastern Transmission LP, 6.000%, 9/15/2017, 144A | | | 19,092,600 |
| | | | | | |
| | | | | | 226,819,901 |
| | | | | | |
| | | Property & Casualty Insurance — 1.0% | | | |
| | 3,460,000 | | Marsh & McLennan Cos., Inc., 5.375%, 7/15/2014 | | | 3,204,105 |
| | 12,652,000 | | Marsh & McLennan Cos., Inc., 5.750%, 9/15/2015 | | | 11,859,858 |
| | 10,125,000 | | Marsh & McLennan Cos., Inc., 5.875%, 8/01/2033 | | | 8,480,609 |
| | 965,000 | | MBIA Insurance Corp., (fixed rate to 1/15/2013, variable rate thereafter), 14.000%, 1/15/2033, 144A | | | 511,450 |
| | 15,875,000 | | Travelers Cos., Inc. (The), MTN, 6.250%, 6/15/2037 | | | 13,762,609 |
| | 2,830,000 | | Travelers Property Casualty Corp., 6.375%, 3/15/2033 | | | 2,484,058 |
| | 675,000 | | White Mountains RE Group, 6.375%, 3/20/2017, 144A | | | 596,139 |
| | 4,830,000 | | Willis North America, Inc., 6.200%, 3/28/2017 | | | 4,199,482 |
| | | | | | |
| | | | | | 45,098,310 |
| | | | | | |
| | | Railroads — 1.1% | | | |
| | 2,390,000 | | Canadian Pacific Railway Co., 5.750%, 3/15/2033(c) | | | 1,854,626 |
| | 15,830,000 | | Canadian Pacific Railway Co., 5.950%, 5/15/2037 | | | 12,957,900 |
| | 5,000,000 | | Canadian Pacific Railway Ltd., MTN, 4.900%, 6/15/2010, (CAD), 144A | | | 4,669,110 |
| | | | | | |
Principal
Amount (‡) | | Description | | Value (†) |
| | | | | | |
| | | Railroads — continued | | | |
| $ | 10,105,000 | | CSX Corp., 6.000%, 10/01/2036(c) | | $ | 7,679,658 |
| | 18,555,000 | | CSX Corp., 6.250%, 3/15/2018 | | | 16,794,019 |
| | 195,000 | | Missouri Pacific Railroad Co., 4.750%, 1/01/2020(e) | | | 148,200 |
| | 243,000 | | Missouri Pacific Railroad Co., 4.750%, 1/01/2030(e) | | | 160,380 |
| | 1,738,000 | | Missouri Pacific Railroad Co., 5.000%, 1/01/2045(e) | | | 1,042,800 |
| | 1,700,000 | | Union Pacific Corp., 5.375%, 6/01/2033 | | | 1,339,340 |
| | | | | | |
| | | | | | 46,646,033 |
| | | | | | |
| | | REITs — 1.4% | | | |
| | 12,015,000 | | Camden Property Trust, 5.700%, 5/15/2017 | | | 10,620,996 |
| | 4,000,000 | | Colonial Realty LP, 4.800%, 4/01/2011 | | | 3,799,996 |
| | 625,000 | | Colonial Realty LP, 5.500%, 10/01/2015 | | | 537,075 |
| | 525,000 | | Colonial Realty LP, 6.050%, 9/01/2016 | | | 442,820 |
| | 4,230,000 | | Duke Realty LP, 5.950%, 2/15/2017 | | | 3,786,518 |
| | 20,000,000 | | Duke Realty LP, 6.500%, 1/15/2018 | | | 18,096,160 |
| | 5,000,000 | | Equity One, Inc., 6.000%, 9/15/2017 | | | 4,007,610 |
| | 1,010,000 | | ERP Operating LP, 5.125%, 3/15/2016 | | | 845,979 |
| | 2,420,000 | | ERP Operating LP, 5.750%, 6/15/2017(c) | | | 2,038,005 |
| | 10,500,000 | | First Industrial LP, 5.950%, 5/15/2017 | | | 8,392,209 |
| | 3,500,000 | | Highwoods Properties, Inc., 5.850%, 3/15/2017 | | | 2,807,535 |
| | 2,195,000 | | Highwoods Properties, Inc., 7.500%, 4/15/2018 | | | 1,945,231 |
| | 575,000 | | Prologis, 5.625%, 11/15/2015 | | | 502,719 |
| | 470,000 | | Prologis, 5.750%, 4/01/2016(c) | | | 409,534 |
| | 7,075,000 | | Realty Income Corp., 6.750%, 8/15/2019 | | | 6,383,023 |
| | 745,000 | | Simon Property Group LP, 5.750%, 12/01/2015 | | | 704,082 |
| | | | | | |
| | | | | | 65,319,492 |
| | | | | | |
| | | Restaurants — 0.0% | | | |
| | 1,000,000 | | McDonald’s Corp., 3.628%, 10/10/2010, (SGD) | | | 712,192 |
| | | | | | |
| | | Retailers — 3.0% | | | |
| | 1,415,000 | | Home Depot, Inc., 5.400%, 3/01/2016 | | | 1,203,200 |
| | 32,022,000 | | Home Depot, Inc., 5.875%, 12/16/2036 | | | 22,510,602 |
| | 8,170,000 | | J.C. Penney Corp., Inc., 5.750%, 2/15/2018 | | | 6,863,780 |
| | 16,260,000 | | J.C. Penney Corp., Inc., 6.375%, 10/15/2036 | | | 12,367,421 |
See accompanying notes to financial statements.
14
LOOMIS SAYLES INVESTMENT GRADE BOND FUND — PORTFOLIOOF INVESTMENTS (continued)
Investments as of September 30, 2008
| | | | | | |
Principal
Amount (‡) | | Description | | Value (†) |
| | | | | | |
| | | Retailers — continued | | | |
| $ | 12,000 | | J.C. Penney Corp., Inc., 7.125%, 11/15/2023 | | $ | 10,940 |
| | 7,385,000 | | J.C. Penney Corp., Inc., 7.400%, 4/01/2037 | | | 6,178,904 |
| | 8,845,000 | | J.C. Penney Corp., Inc., 7.625%, 3/01/2097 | | | 6,860,182 |
| | 7,575,000 | | Lowes Cos., Inc., 6.650%, 9/15/2037 | | | 7,265,622 |
| | 17,730,000 | | Macy’s Retail Holdings, Inc., 6.375%, 3/15/2037 | | | 12,841,804 |
| | 6,715,000 | | Macy’s Retail Holdings, Inc., 6.790%, 7/15/2027 | | | 5,294,408 |
| | 6,730,000 | | Macy’s Retail Holdings, Inc., 6.900%, 4/01/2029 | | | 5,262,725 |
| | 8,240,000 | | Marks & Spencer PLC, 7.125%, 12/01/2037, 144A | | | 6,317,344 |
| | 2,078,000 | | Target Corp., 6.500%, 10/15/2037 | | | 1,908,863 |
| | 37,872,000 | | Target Corp., 7.000%, 1/15/2038 | | | 35,633,538 |
| | | | | | |
| | | | | | 130,519,333 |
| | | | | | |
| | | Sovereigns — 13.2% | | | |
| | 26,235,000 | | Canadian Government, 2.750%, 12/01/2010, (CAD) | | | 24,561,926 |
| | 133,990,000 | | Canadian Government, 3.750%, 6/01/2012, (CAD) | | | 128,528,420 |
| | 4,250,000 | | Canadian Government, 4.000%, 6/01/2016, (CAD) | | | 4,104,280 |
| | 5,600,000 | | Canadian Government, 4.250%, 12/01/2008, (CAD) | | | 5,283,022 |
| | 38,265,000 | | Canadian Government, 4.250%, 9/01/2009, (CAD) | | | 36,423,390 |
| | 275,170,000 | | Canadian Government, 5.250%, 6/01/2012, (CAD) | | | 277,354,812 |
| | 9,600,000 | | Canadian Government, 5.500%, 6/01/2010, (CAD) | | | 9,403,355 |
| | 3,430,000 | | Canadian Government, 5.750%, 6/01/2033, (CAD) | | | 3,959,785 |
| | 4,200,900(††) | | Mexican Fixed Rate Bonds, Series M-20, 8.000%, 12/07/2023, (MXN) | | | 36,866,436 |
| | 770,000(††) | | Mexican Fixed Rate Bonds, Series MI-10, 9.000%, 12/20/2012, (MXN) | | | 7,205,817 |
| | 29,165,000 | | New South Wales Treasury Corp., Series 10RG, 7.000%, 12/01/2010, (AUD) | | | 23,586,893 |
| | 15,145,000 | | New South Wales Treasury Corp., Series 12RG, 6.000%, 5/01/2012, (AUD) | | | 12,008,936 |
| | 325,000 | | Republic of Brazil, 8.875%, 4/15/2024 | | | 388,375 |
| | 24,705,000 | | Republic of Brazil, 10.250%, 1/10/2028, (BRL) | | | 11,405,404 |
| | 250,000 | | Republic of Brazil, 11.000%, 8/17/2040 | | | 313,750 |
| | 6,285,000 | | Republic of Brazil, 12.500%, 1/05/2022, (BRL) | | | 3,385,425 |
| | | | | | |
| | | | | | 584,780,026 |
| | | | | | |
| | | Supermarkets — 0.4% | | | |
| | 1,900,000 | | Albertson’s, Inc., 7.450%, 8/01/2029 | | | 1,689,915 |
| | | | | | |
Principal
Amount (‡) | | Description | | Value (†) |
| | | | | | |
| | | Supermarkets — continued | | | |
| $ | 1,000,000 | | Albertson’s, Inc., Series C, MTN, 6.625%, 6/01/2028 | | $ | 810,196 |
| | 3,340,000 | | Kroger Co., 6.400%, 8/15/2017 | | | 3,202,532 |
| | 11,100,000 | | Safeway, Inc., 6.350%, 8/15/2017 | | | 10,757,787 |
| | | | | | |
| | | | | | 16,460,430 |
| | | | | | |
| | | Supranational — 2.3% | | | |
| | 90,000,000 | | Eurofima, EMTN, 11.000%, 2/05/2010, (ISK) | | | 852,297 |
| | 15,500,000 | | European Investment Bank, 4.600%, 1/30/2037, (CAD), 144A | | | 13,262,786 |
| | 113,651,400,000 | | European Investment Bank, EMTN, Zero Coupon, 4/24/2013, (IDR), 144A | | | 7,197,520 |
| | 19,934,000 | | European Investment Bank, EMTN, 7.000%, 1/18/2012, (NZD) | | | 13,517,085 |
| | 22,000,000 | | Inter-American Development Bank, EMTN, Zero Coupon, 5/11/2009, (BRL) | | | 10,289,558 |
| | 331,380,000,000 | | Inter-American Development Bank, EMTN, Zero Coupon, 5/20/2013, (IDR) | | | 19,928,483 |
| | 418,960,000,000 | | Inter-American Development Bank, EMTN, Zero Coupon, 9/23/2013, (IDR) | | | 25,350,857 |
| | 13,265,000 | | Inter-American Development Bank, EMTN, 6.000%, 12/15/2017, (NZD) | | | 8,577,492 |
| | 429,100,000 | | International Bank for Reconstruction & Development, 9.500%, 5/27/2010, (ISK) | | | 4,036,067 |
| | 26,200,000 | | Nordic Investment Bank, EMTN, 11.250%, 4/16/2009, (ISK) | | | 247,940 |
| | | | | | |
| | | | | | 103,260,085 |
| | | | | | |
| | | Technology — 4.8% | | | |
| | 8,895,000 | | Agilent Technologies, Inc., 6.500%, 11/01/2017 | | | 8,108,833 |
| | 2,035,000 | | Arrow Electronics, Inc., 6.875%, 7/01/2013 | | | 2,068,765 |
| | 2,000,000 | | Arrow Electronics, Inc., 6.875%, 6/01/2018 | | | 1,960,472 |
| | 9,000,000 | | Avnet, Inc., 5.875%, 3/15/2014 | | | 8,762,067 |
| | 6,230,000 | | Avnet, Inc., 6.000%, 9/01/2015 | | | 6,002,069 |
| | 1,540,000 | | Avnet, Inc., 6.625%, 9/15/2016 | | | 1,499,815 |
| | 260,000 | | Corning, Inc., 6.850%, 3/01/2029 | | | 229,664 |
| | 6,650,000 | | Corning, Inc., 7.250%, 8/15/2036 | | | 5,895,019 |
| | 56,440,000 | | Dun & Bradstreet Corp., 6.000%, 4/01/2013 | | | 56,046,275 |
| | 8,915,000 | | Equifax, Inc., 7.000%, 7/01/2037 | | | 7,519,080 |
| | 1,660,000 | | Freescale Semiconductor, Inc., 10.125%, 12/15/2016(c) | | | 1,062,400 |
| | 2,965,000 | | Intuit, Inc., 5.750%, 3/15/2017 | | | 2,622,320 |
| | 55,000,000 | | KLA-Tencor Corp., 6.900%, 5/01/2018 | | | 51,139,000 |
| | 38,725,000 | | Koninklijke (Royal) Philips Electronics N.V., 6.875%, 3/11/2038 | | | 38,370,163 |
See accompanying notes to financial statements.
15
LOOMIS SAYLES INVESTMENT GRADE BOND FUND — PORTFOLIOOF INVESTMENTS (continued)
Investments as of September 30, 2008
| | | | | | |
Principal
Amount (‡) | | Description | | Value (†) |
| | | | | | |
| | | Technology — continued | | | |
| $ | 4,700,000 | | Lucent Technologies, Inc., 6.450%, 3/15/2029 | | $ | 2,867,000 |
| | 4,680,000 | | Motorola, Inc., 5.220%, 10/01/2097 | | | 2,613,930 |
| | 1,730,000 | | Motorola, Inc., 6.500%, 9/01/2025 | | | 1,327,194 |
| | 4,150,000 | | Motorola, Inc., 6.500%, 11/15/2028(c) | | | 3,101,287 |
| | 6,145,000 | | Motorola, Inc., 6.625%, 11/15/2037 | | | 4,479,367 |
| | 1,625,000 | | Motorola, Inc., 8.000%, 11/01/2011 | | | 1,634,636 |
| | 2,920,000 | | Samsung Electronics Co. Ltd., 7.700%, 10/01/2027, 144A | | | 3,089,208 |
| | | | | | |
| | | | | | 210,398,564 |
| | | | | | |
| | | Textile — 0.3% | | | |
| | 25,000 | | Kellwood Co., 7.625%, 10/15/2017(e) | | | 13,750 |
| | 15,228,000 | | VF Corp., 6.450%, 11/01/2037 | | | 12,800,352 |
| | | | | | |
| | | | | | 12,814,102 |
| | | | | | |
| | | Tobacco — 0.2% | | | |
| | 8,305,000 | | Reynolds American, Inc., 6.750%, 6/15/2017 | | | 7,760,275 |
| | 2,035,000 | | Reynolds American, Inc., 7.250%, 6/15/2037 | | | 1,947,410 |
| | | | | | |
| | | | | | 9,707,685 |
| | | | | | |
| | | Transportation Services — 0.7% | | | |
| | 8,620,000 | | Erac USA Finance Co., 6.375%, 10/15/2017, 144A | | | 6,851,400 |
| | 2,310,000 | | Erac USA Finance Co., 6.700%, 6/01/2034, 144A | | | 1,549,661 |
| | 32,261,000 | | Erac USA Finance Co., 7.000%, 10/15/2037, 144A | | | 22,721,842 |
| | | | | | |
| | | | | | 31,122,903 |
| | | | | | |
| | | Wireless — 0.9% | | | |
| | 1,000,000 | | America Movil SAB de CV, 4.125%, 3/01/2009 | | | 993,974 |
| | 7,240,000 | | Nextel Communications, Inc., Series D, 7.375%, 8/01/2015 | | | 4,778,400 |
| | 635,000 | | Nextel Communications, Inc., Series E, 6.875%, 10/31/2013 | | | 431,800 |
| | 14,820,000 | | Nextel Communications, Inc., Series F, 5.950%, 3/15/2014 | | | 9,929,400 |
| | 9,397,000 | | Sprint Capital Corp., 6.875%, 11/15/2028 | | | 6,295,990 |
| | 2,375,000 | | Sprint Capital Corp., 6.900%, 5/01/2019 | | | 1,840,625 |
| | 93,000 | | Sprint Nextel Corp., 6.000%, 12/01/2016 | | | 71,610 |
| | 5,345,000 | | Vodafone Group PLC, 5.000%, 9/15/2015 | | | 4,703,867 |
| | 12,805,000 | | Vodafone Group PLC, 6.150%, 2/27/2037 | | | 10,283,824 |
| | | | | | |
| | | | | | 39,329,490 |
| | | | | | |
| | | | | | |
Principal
Amount (‡) | | Description | | Value (†) |
| | | | | | |
| | | Wirelines — 2.4% | | | |
| $ | 19,610,000 | | AT&T Corp., 6.500%, 3/15/2029 | | $ | 16,417,100 |
| | 1,205,000 | | AT&T, Inc., 6.150%, 9/15/2034 | | | 1,004,922 |
| | 14,830,000 | | AT&T, Inc., 6.500%, 9/01/2037 | | | 12,615,584 |
| | 1,590,000 | | Bell Canada, MTN, 5.000%, 2/15/2017, (CAD) | | | 1,180,029 |
| | 415,000 | | Bell Canada, MTN, 7.300%, 2/23/2032, (CAD) | | | 320,532 |
| | 3,250,000 | | Bell Canada, Series M-17, 6.100%, 3/16/2035, (CAD) | | | 2,222,887 |
| | 6,415,000 | | BellSouth Corp., 6.000%, 11/15/2034 | | | 5,196,150 |
| | 1,710,000 | | BellSouth Corp., 6.550%, 6/15/2034(c) | | | 1,466,034 |
| | 350,000 | | GTE Corp., 6.940%, 4/15/2028 | | | 296,980 |
| | 1,625,000 | | Koninklijke (Royal) KPN NV, 8.375%, 10/01/2030 | | | 1,740,760 |
| | 65,000 | | Level 3 Financing, Inc., 8.750%, 2/15/2017 | | | 47,125 |
| | 560,000 | | Level 3 Financing, Inc., 9.250%, 11/01/2014 | | | 422,800 |
| | 620,000 | | New England Telephone & Telegraph, 7.875%, 11/15/2029 | | | 559,965 |
| | 1,735,000 | | Qwest Capital Funding, Inc., 6.500%, 11/15/2018 | | | 1,262,213 |
| | 2,955,000 | | Qwest Capital Funding, Inc., 6.875%, 7/15/2028 | | | 2,053,725 |
| | 4,465,000 | | Qwest Capital Funding, Inc., 7.625%, 8/03/2021 | | | 3,393,400 |
| | 970,000 | | Qwest Capital Funding, Inc., 7.750%, 2/15/2031 | | | 708,100 |
| | 340,000 | | Qwest Corp., 6.500%, 6/01/2017 | | | 272,000 |
| | 10,580,000 | | Qwest Corp., 6.875%, 9/15/2033 | | | 7,115,050 |
| | 890,000 | | Qwest Corp., 7.200%, 11/10/2026 | | | 654,150 |
| | 1,050,000 | | Qwest Corp., 7.250%, 9/15/2025 | | | 782,250 |
| | 4,295,000 | | Qwest Corp., 7.250%, 10/15/2035 | | | 3,049,450 |
| | 1,815,000 | | Qwest Corp., 7.500%, 6/15/2023 | | | 1,424,775 |
| | 2,905,000 | | Telecom Italia Capital, 6.000%, 9/30/2034 | | | 2,035,301 |
| | 2,850,000 | | Telecom Italia Capital, 6.375%, 11/15/2033 | | | 2,077,080 |
| | 10,520,000 | | Telefonica Emisiones SAU, 7.045%, 6/20/2036 | | | 9,514,814 |
| | 1,000,000 | | Telekom Malaysia Berhad, 7.875%, 8/01/2025, 144A | | | 1,096,242 |
| | 14,445,000 | | Telus Corp., 4.950%, 3/15/2017, (CAD) | | | 12,307,262 |
| | 7,175,000 | | Verizon Communications, 5.850%, 9/15/2035 | | | 5,610,348 |
| | 7,215,000 | | Verizon Communications, Inc., 6.400%, 2/15/2038 | | | 6,021,783 |
See accompanying notes to financial statements.
16
LOOMIS SAYLES INVESTMENT GRADE BOND FUND — PORTFOLIOOF INVESTMENTS (continued)
Investments as of September 30, 2008
| | | | | | |
Principal
Amount (‡) | | Description | | Value (†) |
| | | | | | |
| | | Wirelines — continued | | | |
| $ | 5,674,000 | | Verizon Maryland, Inc., 5.125%, 6/15/2033 | | $ | 3,838,750 |
| | 1,330,000 | | Verizon New York, Inc., Series B, 7.375%, 4/01/2032 | | | 1,160,997 |
| | | | | | |
| | | | | | 107,868,558 |
| | | | | | |
| | | Total Non-Convertible Bonds (Identified Cost $4,321,232,912) | | | 3,823,269,194 |
| | | | | | |
| | Convertible Bonds — 0.6% | | | |
| | | Media Non-Cable — 0.0% | | | |
| | 538,653 | | Liberty Media LLC, 3.500%, 1/15/2031 | | | 238,354 |
| | | | | | |
| | | Non-Captive Consumer — 0.1% | | | |
| | 810,000 | | Countrywide Financial Corp., Series A, Zero Coupon, 4/15/2037(b)(c) | | | 793,800 |
| | 2,260,000 | | Countrywide Financial Corp., Series B, 0.554%, 5/15/2037(b) | | | 2,056,600 |
| | | | | | |
| | | | | | 2,850,400 |
| | | | | | |
| | | Non-Captive Diversified — 0.1% | | | |
| | 9,920,000 | | iStar Financial, Inc., 3.291%, 10/01/2012(b) | | | 5,307,200 |
| | | | | | |
| | | Pharmaceuticals — 0.2% | | | |
| | 3,997,000 | | Vertex Pharmaceuticals, Inc., 4.750%, 2/15/2013 | | | 6,030,474 |
| | 360,000 | | Watson Pharmaceuticals, Inc., 1.750%, 3/15/2023 | | | 335,700 |
| | | | | | |
| | | | | | 6,366,174 |
| | | | | | |
| | | Technology — 0.0% | | | |
| | 710,000 | | Avnet, Inc., 2.000%, 3/15/2034 | | | 707,338 |
| | | | | | |
| | | Wireless — 0.1% | | | |
| | 5,200,000 | | NII Holdings, Inc., 3.125%, 6/15/2012 | | | 3,848,000 |
| | | | | | |
| | | Wirelines — 0.1% | | | |
| | 2,735,000 | | Level 3 Communications, Inc., 3.500%, 6/15/2012 | | | 1,931,594 |
| | 230,000 | | Level 3 Communications, Inc., 5.250%, 12/15/2011 | | | 190,037 |
| | 275,000 | | Level 3 Communications, Inc., 6.000%, 9/15/2009 | | | 258,500 |
| | 3,760,000 | | Level 3 Communications, Inc., 6.000%, 3/15/2010(c) | | | 3,290,000 |
| | | | | | |
| | | | | | 5,670,131 |
| | | | | | |
| | | Total Convertible Bonds (Identified Cost $29,120,737) | | | 24,987,597 |
| | | | | | |
| | Municipals — 0.8% | | | |
| | | Alabama — 0.0% | | | |
| | 1,025,000 | | Alabama Public School & College Authority (Capital Improvement), 4.500%, 12/01/2026 | | | 893,902 |
| | | | | | |
| | | California — 0.3% | | | |
| | 1,075,000 | | San Diego Unified School District (Election 1998), 4.500%, 7/01/2029, Series F-1, (FSA insured) | | | 902,710 |
| | 480,000 | | San Jose California Redevelopment Agency Tax Allocation (Merged Area Redevelopment), 3.750%, 8/01/2028, Series C, (Registered), (MBIA insured) | | | 353,141 |
| | | | | | |
Principal
Amount (‡) | | Description | | Value (†) |
| | | | | | |
| | | California — continued | | | |
| $ | 1,305,000 | | San Jose California Redevelopment Agency Tax Allocation (Merged Area Redevelopment), 3.750%, 8/01/2028, Series C, (MBIA insured) | | $ | 953,120 |
| | 1,620,000 | | State of California, 4.500%, 8/01/2027, (AMBAC insured) | | | 1,364,607 |
| | 4,515,000 | | State of California, 4.500%, 10/01/2029 | | | 3,745,870 |
| | 1,315,000 | | State of California, 4.500%, 8/01/2030, (AMBAC insured) | | | 1,086,150 |
| | 1,135,000 | | State of California, 4.500%, 8/01/2030 | | | 937,476 |
| | 840,000 | | State of California (Various Purpose), 3.250%, 12/01/2027, (MBIA insured) | | | 585,774 |
| | 3,965,000 | | State of California (Various Purpose), 4.500%, 12/01/2033, (AMBAC insured) | | | 3,185,084 |
| | 280,000 | | University of California Regents Medical Center, 4.750%, 5/15/2031, Series A, (MBIA insured) | | | 240,355 |
| | | | | | |
| | | | | | 13,354,287 |
| | | | | | |
| | | District of Columbia — 0.0% | | | |
| | 1,025,000 | | District of Columbia, 4.750%, 6/01/2036, Series A, (FGIC insured) | | | 837,989 |
| | | | | | |
| | | Florida — 0.1% | | | |
| | 1,025,000 | | Florida State Turnpike Authority (Department of Transportation), 3.500%, 7/01/2027, Series A, (MBIA insured) | | | 751,315 |
| | 1,625,000 | | Jacksonville Electric Authority, Florida Water & Sewer Systems Revenue, 4.750%, 10/01/2041, Series B, (MBIA insured) | | | 1,370,720 |
| | | | | | |
| | | | | | 2,122,035 |
| | | | | | |
| | | Illinois — 0.0% | | | |
| | 1,770,000 | | Chicago Board of Education, 4.750%, 12/01/2031, Series B, (FSA insured) | | | 1,569,017 |
| | 540,000 | | Chicago O’Hare International Airport, 4.500%, 1/01/2038, Series A, (FSA insured) | | | 439,727 |
| | | | | | |
| | | | | | 2,008,744 |
| | | | | | |
| | | Louisiana — 0.0% | | | |
| | 1,025,000 | | State of Louisiana, 3.250%, 5/01/2026, Series C, (FSA insured) | | | 731,368 |
| | | | | | |
| | | Massachusetts — 0.0% | | | |
| | 1,025,000 | | Massachusetts School Building Authority, 4.750%, 8/15/2032, Series A, (AMBAC insured) | | | 872,039 |
| | | | | | |
| | | Michigan — 0.1% | | | |
| | 620,000 | | Grosse Pointe Public School System, 3.000%, 5/01/2027, (FGIC insured) | | | 413,397 |
| | 2,665,000 | | Michigan Tobacco Settlement Finance Authority, 7.309%, 6/01/2034(e) | | | 2,295,098 |
| | | | | | |
| | | | | | 2,708,495 |
| | | | | | |
| | | Nebraska — 0.1% | | | |
| | 2,560,000 | | Omaha Public Power District, 4.500%, 2/01/2034, Series AA, (FGIC insured) | | | 2,084,864 |
| | | | | | |
| | | Ohio — 0.1% | | | |
| | 6,570,000 | | Buckeye Tobacco Settlement Financing Authority, Series A-2, 5.875%, 6/01/2047(e) | | | 4,967,183 |
| | | | | | |
| | | Texas — 0.1% | | | |
| | 2,920,000 | | Harris County, TX, 4.500%, 10/01/2031, Series B | | | 2,514,558 |
| | | | | | |
See accompanying notes to financial statements.
17
LOOMIS SAYLES INVESTMENT GRADE BOND FUND — PORTFOLIOOF INVESTMENTS (continued)
Investments as of September 30, 2008
| | | | | | | |
Principal
Amount (‡) | | Description | | Value (†) | |
| | | | | | | |
| | | Wisconsin — 0.0% | | | | |
| $ | 700,000 | | Green Bay Wisconsin Water System Revenue, 3.500%, 11/01/2026, (FSA insured) | | $ | 524,167 | |
| | 755,000 | | Green Bay Wisconsin Water System Revenue, 3.500%, 11/01/2029, (FSA insured) | | | 543,759 | |
| | 260,000 | | Wisconsin Housing & Economic Development Authority, 4.900%, 11/01/2035, Series E | | | 227,791 | |
| | | | | | | |
| | | | | | 1,295,717 | |
| | | | | | | |
| | | Total Municipals (Identified Cost $38,623,397) | | | 34,391,181 | |
| | | | | | | |
| | | Total Bonds and Notes (Identified Cost $4,388,977,046) | | | 3,882,647,972 | |
| | | | | | | |
Shares/
Principal
Amount (‡) | | | | | |
| | Short-Term Investments — 11.6% of Net Assets | | | | |
| | 32,831,158 | | State Street Navigator Securities Lending Prime Portfolio(f) | | | 32,831,158 | |
| $ | 481,184,000 | | Tri-Party Repurchase Agreement with Fixed Income Clearing Corporation,, dated 9/30/08 at 1.300% to be repurchased at $481,201,376 on 10/01/08 collateralized by $50,000,000 Federal Farm Credit Bank, 2.700% due 9/23/2009 valued at $50,062,500; $141,665,000 Federal Home Loan Bank, 3.750% due 8/18/2009 valued at $143,081,650; $58,000,000 Federal National Mortgage Association, 6.000% due 5/15/2011 valued at $63,220,000; $100,000,000 Federal National Mortgage Association, 4.467% due 3/05/2010 valued at $100,500,000; $50,000,000 Federal National Mortgage Association, 3.375% due 3/05/2010 valued at $50,125,000; $9,940,000 Federal National Mortgage Association, 4.330% due 7/28/2011 valued at $10,113,950; $73,705,000 Federal National Mortgage Association, 2.875% due 10/12/2010 valued at $73,705,000, including accrued interest (Note 2g of Notes to Financial Statements) | | | 481,184,000 | |
| | | | | | | |
| | | Total Short-Term Investments (Identified Cost $514,015,158) | | | 514,015,158 | |
| | | | | | | |
| | | | | | | |
| | | Total Investments — 99.3%
(Identified Cost $4,902,992,204)(a) | | | 4,396,663,130 | |
| | | Other assets less liabilities — 0.7% | | | 31,922,763 | |
| | | | | | | |
| | | Net Assets — 100.0% | | $ | 4,428,585,893 | |
| | | | | | | |
| | | | | | | |
| | (‡) | | Principal amount stated in U.S. dollars unless otherwise noted. | |
| | (†) | | See Note 2a of Notes to Financial Statements. | |
| | (††) | | Amount shown represents units. One unit represents a principal amount of 100. | |
| | (†††) | | Amount shown represents units. One unit represents a principal amount of 25. | |
| | (a) | | Federal Tax Information: At September 30, 2008, the net unrealized depreciation on investments based on a cost of $4,906,157,811 for federal income tax purposes was as follows: | |
| | | | | | | |
| | | Aggregate gross unrealized appreciation for all investments in which there is an excess of value over tax cost | | $ | 25,832,448 | |
| | | Aggregate gross unrealized depreciation for all investments in which there is an excess of tax cost over value | | | (535,327,129 | ) |
| | | | | | | |
| | | Net unrealized depreciation | | $ | (509,494,681 | ) |
| | | | | | | |
| | | | | | | |
| | (b) | | Variable rate security. Rate as of September 30, 2008 is disclosed. | |
| | (c) | | All or a portion of this security was on loan to brokers at September 30, 2008. | |
| | (d) | | Issuer has filed for bankruptcy. | |
| | (e) | | Illiquid security. At September 30, 2008, the value of these securities amounted to $34,583,428 or 0.8% of net assets. | |
| | | | |
| (f) | | Represents investment of securities lending collateral. |
| | | | |
| | | | |
| 144A | | Securities exempt from registration under Rule 144A of the Securities Act of 1933. These securities may be resold in transactions exempt from registration, normally to qualified institutional buyers. At September 30, 2008, the total value of these securities amounted to $391,333,097 or 8.8% of net assets. |
| | | | |
| ABS | | Asset-Backed Securities |
| AMBAC | | American Municipal Bond Assurance Corp. |
| EMTN | | Euro Medium Term Note |
| FGIC | | Financial Guaranty Insurance Company |
| FSA | | Financial Security Assurance, Inc. |
| GMTN | | Global Medium Term Note |
| MBIA | | Municipal Bond Investors Assurance Corp. |
| MTN | | Medium Term Note |
| REITs | | Real Estate Investment Trusts |
| | | | |
| AUD | | Australian Dollar |
| BRL | �� | Brazilian Real |
| CAD | | Canadian Dollar |
| EUR | | Euro |
| GBP | | British Pound |
| IDR | | Indonesian Rupiah |
| ISK | | Icelandic Krona |
| KRW | | South Korean Won |
| MXN | | Mexican Peso |
| NZD | | New Zealand Dollar |
| SGD | | Singapore Dollar |
| THB | | Thai Baht |
Net Asset Summary at September 30, 2008 (Unaudited)
| | | |
| Sovereigns | | 13.2 | % |
| Electric | | 5.7 | |
| Pipelines | | 5.1 | |
| Technology | | 4.8 | |
| Brokerage | | 4.6 | |
| Non-Captive Diversified | | 3.7 | |
| Healthcare | | 3.4 | |
| Retailers | | 3.0 | |
| Media Cable | | 2.7 | |
| Paper | | 2.6 | |
| Wirelines | | 2.5 | |
| Supranational | | 2.3 | |
| Banking | | 2.1 | |
| Non-Captive Consumer | | 2.1 | |
| Chemicals | | 2.0 | |
| Other Investments, less than 2% each | | 27.9 | |
| Short-Term Investments | | 11.6 | |
| | | |
| Total Investments | | 99.3 | |
| Other assets less liabilities | | 0.7 | |
| | | |
| Net Assets | | 100.0 | % |
| | | |
Currency Exposure at September 30, 2008 as a Percentage of Net Assets (Unaudited)
| | | |
| United States Dollar | | 77.2 | % |
| Canadian Dollar | | 12.8 | |
| Other, less than 2% each | | 9.3 | |
| | | |
| Total Investments | | 99.3 | |
| Other assets less liabilities | | 0.7 | |
| | | |
| Net Assets | | 100.0 | % |
| | | |
See accompanying notes to financial statements.
18
STATEMENTOF ASSETSAND LIABILITIES
September 30, 2008
| | | | |
ASSETS | | | | |
Investments at cost | | $ | 4,421,808,204 | |
Repurchase agreement at cost | | | 481,184,000 | |
Net unrealized depreciation | | | (506,329,074 | ) |
| | | | |
Investments at value (a) | | | 4,396,663,130 | |
Cash | | | 12,992,438 | |
Foreign currency at value (identified cost $514,131) | | | 512,183 | |
Receivable for Fund shares sold | | | 36,156,883 | |
Interest receivable | | | 74,701,462 | |
Tax reclaims receivable | | | 25,433 | |
Securities lending income receivable | | | 109,787 | |
| | | | |
TOTAL ASSETS | | | 4,521,161,316 | |
| | | | |
LIABILITIES | | | | |
Collateral on securities loaned, at value (Note 2) | | | 32,831,158 | |
Payable for securities purchased | | | 36,278,232 | |
Payable for Fund shares redeemed | | | 20,785,489 | |
Deferred foreign taxes payable | | | 3,651 | |
Management fees payable (Note 4) | | | 1,514,326 | |
Administrative fees payable (Note 4) | | | 178,050 | |
Deferred Trustees’ fees (Note 4) | | | 113,192 | |
Service and distribution fees payable (Note 4) | | | 53,964 | |
Other accounts payable and accrued expenses | | | 817,361 | |
| | | | |
TOTAL LIABILITIES | | | 92,575,423 | |
| | | | |
NET ASSETS | | $ | 4,428,585,893 | |
| | | | |
NET ASSETS CONSIST OF : | | | | |
Paid-in capital | | $ | 4,851,944,396 | |
Accumulated net investment income | | | 25,666,898 | |
Accumulated net realized gain on investments and foreign currency transactions | | | 58,767,284 | |
Net unrealized depreciation on investments and foreign currency translations | | | (507,792,685 | ) |
| | | | |
NET ASSETS | | $ | 4,428,585,893 | |
| | | | |
COMPUTATION OF NET ASSET VALUE AND OFFERING PRICE: | | | | |
Class A shares: | | | | |
Net assets | | $ | 1,867,334,826 | |
| | | | |
Shares of beneficial interest | | | 177,147,249 | |
| | | | |
Net asset value and redemption price per share | | $ | 10.54 | |
| | | | |
Offering price per share (100/95.5 of $10.54) (Note 1) | | $ | 11.04 | |
| | | | |
Class B shares: (redemption price per share is equal to net asset value less any applicable contingent deferred sales charge) (Note 1) | | | | |
Net assets | | $ | 16,008,660 | |
| | | | |
Shares of beneficial interest | | | 1,525,087 | |
| | | | |
Net asset value and offering price per share | | $ | 10.50 | |
| | | | |
Class C shares: (redemption price per share is equal to net asset value less any applicable contingent deferred sales charge) (Note 1) | | | | |
Net assets | | $ | 1,333,421,372 | |
| | | | |
Shares of beneficial interest | | | 127,296,937 | |
| | | | |
Net asset value and redemption price per share (Note 1) | | $ | 10.47 | |
| | | | |
Class Y shares: | | | | |
Net assets | | $ | 1,044,045,902 | |
| | | | |
Shares of beneficial interest | | | 98,986,599 | |
| | | | |
Net asset value, offering and redemption price per share | | $ | 10.55 | |
| | | | |
Class J shares: | | | | |
Net assets | | $ | 167,775,133 | |
| | | | |
Shares of beneficial interest | | | 15,936,030 | |
| | | | |
Net asset value and offering price per share | | $ | 10.53 | |
| | | | |
Offering price per share (100/96.50 of $10.53) (Note 1) | | $ | 10.91 | |
| | | | |
(a) Including securities on loan with market values of: | | $ | 31,782,345 | |
| | | | |
See accompanying notes to financial statements.
19
STATEMENTOF OPERATIONS
For the Year Ended September 30, 2008
| | | | |
INVESTMENT INCOME | | | | |
Interest | | $ | 220,390,705 | |
Securities lending income (Note 2) | | | 3,550,644 | |
| | | | |
| | | 223,941,349 | |
| | | | |
Expenses | | | | |
Management fees (Note 4) | | | 14,927,516 | |
Service fees - Class A (Note 4) | | | 3,942,434 | |
Service and distribution fees - Class B (Note 4) | | | 175,871 | |
Service and distribution fees - Class C (Note 4) | | | 11,032,445 | |
Service and distribution fees - Class J (Note 4) | | | 1,313,220 | |
Trustees’ fees and expenses (Note 4) | | | 63,070 | |
Administrative fees (Note 4) | | | 1,894,625 | |
Custodian fees and expenses | | | 166,219 | |
Transfer agent fees and expenses - Class A (Note 4) | | | 1,139,215 | |
Transfer agent fees and expenses - Class B (Note 4) | | | 12,250 | |
Transfer agent fees and expenses - Class C (Note 4) | | | 798,321 | |
Transfer agent fees and expenses - Class Y (Note 4) | | | 436,071 | |
Transfer agent fees and expenses - Class J (Note 4) | | | 8,347 | |
Audit and tax services fees | | | 50,583 | |
Legal fees - Class A | | | 41,374 | |
Legal fees - Class B | | | 500 | |
Legal fees - Class C | | | 29,288 | |
Legal fees - Class Y | | | 22,547 | |
Legal fees - Class J | | | 19,850 | |
Shareholder reporting expenses - Class A | | | 135,975 | |
Shareholder reporting expenses - Class B | | | 2,900 | |
Shareholder reporting expenses - Class C | | | 115,535 | |
Shareholder reporting expenses - Class Y | | | 54,706 | |
Shareholder reporting expenses - Class J | | | 96,964 | |
Registration fees - Class A | | | 173,516 | |
Registration fees - Class B | | | 17,019 | |
Registration fees - Class C | | | 78,770 | |
Registration fees - Class Y | | | 93,190 | |
Registration fees - Class J | | | 2,264 | |
Expense recapture - Class B (Note 4) | | | 830 | |
Miscellaneous expenses | | | 72,780 | |
| | | | |
Total expenses | | | 36,918,195 | |
Less administrative fee waiver (Note 4) | | | (69,053 | ) |
| | | | |
Net expenses | | | 36,849,142 | |
| | | | |
Net investment income | | | 187,092,207 | |
| | | | |
NET REALIZED AND UNREALIZED GAIN (LOSS) ON INVESTMENTS AND FOREIGN CURRENCY TRANSACTIONS | | | | |
Net realized gain on: | | | | |
Investments | | | 69,657,009 | |
Foreign currency transactions | | | 859,178 | |
Net change in unrealized appreciation (depreciation) on: | | | | |
Investments (net of change in foreign capital gains tax accrual of $3,651) | | | (566,916,599 | ) |
Foreign currency translations | | | (1,650,314 | ) |
| | | | |
Net realized and unrealized loss on investments and foreign currency transactions | | | (498,050,726 | ) |
| | | | |
NET DECREASE IN NET ASSETS RESULTING FROM OPERATIONS | | $ | (310,958,519 | ) |
| | | | |
See accompanying notes to financial statements.
20
STATEMENTOF CHANGESIN NET ASSETS
| | | | | | | | |
| | | Year Ended
September 30,
2008 | | | Year Ended
September 30,
2007 | |
| | | | | | | | |
FROM OPERATIONS: | | | | | | | | |
Net investment income | | $ | 187,092,207 | | | $ | 54,015,656 | |
Net realized gain on investments and foreign currency transactions | | | 70,516,187 | | | | 15,696,855 | |
Net change in unrealized appreciation (depreciation) on investments and foreign currency translations | | | (568,566,913 | ) | | | 35,540,172 | |
| | | | | | | | |
Net increase (decrease) in net assets resulting from operations | | | (310,958,519 | ) | | | 105,252,683 | |
| | | | | | | | |
FROM DISTRIBUTIONS TO SHAREHOLDERS: | | | | | | | | |
Net investment income | | | | | | | | |
Class A | | | (83,130,555 | ) | | | (20,224,906 | ) |
Class B | | | (806,347 | ) | | | (482,009 | ) |
Class C | | | (50,818,767 | ) | | | (12,175,921 | ) |
Class Y | | | (47,348,532 | ) | | | (11,008,683 | ) |
Class J | | | (8,734,457 | ) | | | (9,643,008 | ) |
| | | | | | | | |
Total distributions | | | (190,838,658 | ) | | | (53,534,527 | ) |
| | | | | | | | |
INCREASE IN NET ASSETS FROM CAPITAL SHARE TRANSACTIONS (NOTE 7) | | | 2,843,305,497 | | | | 1,503,474,421 | |
| | | | | | | | |
Net increase in net assets | | | 2,341,508,320 | | | | 1,555,192,577 | |
NET ASSETS | | | | | | | | |
Beginning of year | | | 2,087,077,573 | | | | 531,884,996 | |
| | | | | | | | |
End of year | | $ | 4,428,585,893 | | | $ | 2,087,077,573 | |
| | | | | | | | |
ACCUMULATED NET INVESTMENT INCOME | | $ | 25,666,898 | | | $ | 21,428,235 | |
| | | | | | | | |
See accompanying notes to financial statements.
21
This Page Intentionally Left Blank
22
FINANCIAL HIGHLIGHTS
For a share outstanding throughout each period.
| | | | | | | | | | | | | | | | | | | | | | | | | | |
| | | | | Income (Loss) from Investment Operations: | | | Less Distributions: | |
| | | | | | | |
| | | Net asset
value,
beginning
of
the period | | Net
investment
income (d) | | Net realized
and unrealized
gain (loss) | | | Total from
investment
operations | | | Dividends
from
net investment
income | | | Distributions
from net
realized
capital gains | | | Total
distributions | |
| | | | | | | | | | | | | | | | | | | | | | | | | | |
INVESTMENT GRADE BOND FUND | | | | | | | | | | | | | | | | | | | | |
Class A | | | | | | | | | | | | | | | | | | | | | | | | | | |
9/30/2008 | | $ | 11.73 | | $ | 0.60 | | $ | (1.15 | ) | | $ | (0.55 | ) | | $ | (0.64 | ) | | $ | – | | | $ | (0.64 | ) |
9/30/2007 | | | 11.35 | | | 0.58 | | | 0.42 | | | | 1.00 | | | | (0.62 | ) | | | – | | | | (0.62 | ) |
9/30/2006 | | | 11.71 | | | 0.51 | | | 0.10 | | | | 0.61 | | | | (0.75 | ) | | | (0.22 | ) | | | (0.97 | ) |
9/30/2005 | | | 11.84 | | | 0.49 | | | 0.29 | | | | 0.78 | | | | (0.74 | ) | | | (0.17 | ) | | | (0.91 | ) |
9/30/2004 | | | 11.54 | | | 0.52 | | | 0.45 | | | | 0.97 | | | | (0.60 | ) | | | (0.07 | ) | | | (0.67 | ) |
Class B | | | | | | | | | | | | | | | | | | | | | | | | | | |
9/30/2008 | | | 11.68 | | | 0.50 | | | (1.14 | ) | | | (0.64 | ) | | | (0.54 | ) | | | – | | | | (0.54 | ) |
9/30/2007 | | | 11.31 | | | 0.47 | | | 0.43 | | | | 0.90 | | | | (0.53 | ) | | | – | | | | (0.53 | ) |
9/30/2006 | | | 11.67 | | | 0.42 | | | 0.10 | | | | 0.52 | | | | (0.66 | ) | | | (0.22 | ) | | | (0.88 | ) |
9/30/2005 | | | 11.82 | | | 0.41 | | | 0.27 | | | | 0.68 | | | | (0.66 | ) | | | (0.17 | ) | | | (0.83 | ) |
9/30/2004 | | | 11.53 | | | 0.43 | | | 0.45 | | | | 0.88 | | | | (0.52 | ) | | | (0.07 | ) | | | (0.59 | ) |
Class C | | | | | | | | | | | | | | | | | | | | | | | | | | |
9/30/2008 | | | 11.66 | | | 0.51 | | | (1.15 | ) | | | (0.64 | ) | | | (0.55 | ) | | | – | | | | (0.55 | ) |
9/30/2007 | | | 11.30 | | | 0.49 | | | 0.42 | | | | 0.91 | | | | (0.55 | ) | | | – | | | | (0.55 | ) |
9/30/2006 | | | 11.66 | | | 0.42 | | | 0.11 | | | | 0.53 | | | | (0.67 | ) | | | (0.22 | ) | | | (0.89 | ) |
9/30/2005 | | | 11.81 | | | 0.40 | | | 0.28 | | | | 0.68 | | | | (0.66 | ) | | | (0.17 | ) | | | (0.83 | ) |
9/30/2004 | | | 11.53 | | | 0.43 | | | 0.45 | | | | 0.88 | | | | (0.53 | ) | | | (0.07 | ) | | | (0.60 | ) |
Class Y | | | | | | | | | | | | | | | | | | | | | | | | | | |
9/30/2008 | | | 11.73 | | | 0.64 | | | (1.15 | ) | | | (0.51 | ) | | | (0.67 | ) | | | – | | | | (0.67 | ) |
9/30/2007 | | | 11.36 | | | 0.61 | | | 0.41 | | | | 1.02 | | | | (0.65 | ) | | | – | | | | (0.65 | ) |
9/30/2006 | | | 11.71 | | | 0.55 | | | 0.11 | | | | 0.66 | | | | (0.79 | ) | | | (0.22 | ) | | | (1.01 | ) |
9/30/2005 | | | 11.85 | | | 0.54 | | | 0.28 | | | | 0.82 | | | | (0.79 | ) | | | (0.17 | ) | | | (0.96 | ) |
9/30/2004 | | | 11.54 | | | 0.57 | | | 0.45 | | | | 1.02 | | | | (0.64 | ) | | | (0.07 | ) | | | (0.71 | ) |
Class J | | | | | | | | | | | | | | | | | | | | | | | | | | |
9/30/2008 | | | 11.71 | | | 0.54 | | | (1.14 | ) | | | (0.60 | ) | | | (0.58 | ) | | | – | | | | (0.58 | ) |
9/30/2007 | | | 11.34 | | | 0.52 | | | 0.42 | | | | 0.94 | | | | (0.57 | ) | | | – | | | | (0.57 | ) |
9/30/2006 | | | 11.69 | | | 0.46 | | | 0.11 | | | | 0.57 | | | | (0.70 | ) | | | (0.22 | ) | | | (0.92 | ) |
9/30/2005 | | | 11.83 | | | 0.46 | | | 0.27 | | | | 0.73 | | | | (0.70 | ) | | | (0.17 | ) | | | (0.87 | ) |
9/30/2004 | | | 11.53 | | | 0.48 | | | 0.44 | | | | 0.92 | | | | (0.55 | ) | | | (0.07 | ) | | | (0.62 | ) |
| (a) | Had certain expenses not been reduced during the period, if applicable, total returns would have been lower. |
| (b) | The investment adviser and/or administrator agreed to reimburse a portion of the Fund’s expenses and/or reduce its fee during the period. Without this reimbursement/fee reduction, if applicable, expenses would have been higher. |
| (c) | Computed on an annualized basis for periods less than one year, if applicable. |
| (d) | Per share net investment income has been calculated using the average shares outstanding during the period. |
See accompanying notes to financial statements.
23
| | | | | | | | | | | | | | | | | |
| | | | | | | | Ratios to Average Net Assets: | | |
| | | | | | |
Net asset
value, end
of the period | | Total
return
(%) (a)(e) | | | Net assets,
end of
the period
(000's) | | Net
expenses
(%) (b)(c) | | | Gross
expenses
(%) (c) | | | Net investment
income
(%) (c) | | Portfolio
turnover
rate (%) |
| | | | | | | | | | | | | | | | | |
| | | | | | | | | | | | | | | | | |
| | | | | | | | | | | | | | | | | |
| $ | 10.54 | | (5.1 | ) | | $ | 1,867,335 | | 0.80 | | | 0.80 | | | 5.20 | | 35 |
| | 11.73 | | 9.1 | | | | 834,736 | | 0.83 | | | 0.83 | | | 5.05 | | 35 |
| | 11.35 | | 5.6 | | | | 152,054 | | 0.92 | (f) | | 0.92 | (f) | | 4.59 | | 35 |
| | 11.71 | | 6.8 | | | | 39,168 | | 0.95 | | | 1.14 | | | 4.21 | | 28 |
| | 11.84 | | 8.8 | | | | 9,506 | | 0.93 | | | 1.67 | | | 4.52 | | 29 |
| | | | | | | | | | | | | | | | | |
| | 10.50 | | (5.9 | ) | | | 16,009 | | 1.65 | (g) | | 1.65 | (g) | | 4.29 | | 35 |
| | 11.68 | | 8.2 | | | | 17,082 | | 1.70 | | | 1.71 | | | 4.16 | | 35 |
| | 11.31 | | 4.8 | | | | 5,525 | | 1.70 | | | 1.89 | | | 3.75 | | 35 |
| | 11.67 | | 5.9 | | | | 3,443 | | 1.70 | | | 2.18 | | | 3.47 | | 28 |
| | 11.82 | | 7.9 | | | | 1,797 | | 1.70 | | | 2.42 | | | 3.77 | | 29 |
| | | | | | | | | | | | | | | | | |
| | 10.47 | | (5.8 | ) | | | 1,333,421 | | 1.55 | | | 1.55 | | | 4.45 | | 35 |
| | 11.66 | | 8.3 | | | | 605,934 | | 1.57 | | | 1.57 | | | 4.30 | | 35 |
| | 11.30 | | 4.9 | | | | 82,863 | | 1.70 | (f) | | 1.70 | (f) | | 3.79 | | 35 |
| | 11.66 | | 5.9 | | | | 27,992 | | 1.70 | | | 1.97 | | | 3.45 | | 28 |
| | 11.81 | | 7.9 | | | | 9,191 | | 1.70 | | | 2.42 | | | 3.74 | | 29 |
| | | | | | | | | | | | | | | | | |
| | 10.55 | | (4.8 | ) | | | 1,044,046 | | 0.53 | | | 0.53 | | | 5.48 | | 35 |
| | 11.73 | | 9.3 | | | | 448,873 | | 0.55 | (g) | | 0.55 | (g) | | 5.33 | | 35 |
| | 11.36 | | 6.1 | | | | 76,548 | | 0.55 | | | 0.63 | | | 4.94 | | 35 |
| | 11.71 | | 7.1 | | | | 26,012 | | 0.55 | | | 0.82 | | | 4.61 | | 28 |
| | 11.85 | | 9.2 | | | | 12,543 | | 0.55 | | | 1.08 | | | 4.92 | | 29 |
| | | | | | | | | | | | | | | | | |
| | 10.53 | | (5.5 | ) | | | 167,775 | | 1.28 | | | 1.28 | | | 4.66 | | 35 |
| | 11.71 | | 8.5 | | | | 180,453 | | 1.28 | | | 1.28 | | | 4.57 | | 35 |
| | 11.34 | | 5.3 | | | | 214,894 | | 1.30 | (f) | | 1.30 | (f) | | 4.09 | | 35 |
| | 11.69 | | 6.4 | | | | 314,418 | | 1.30 | | | 1.35 | | | 3.89 | | 28 |
| | 11.83 | | 8.3 | | | | 342,871 | | 1.30 | | | 1.33 | | | 4.15 | | 29 |
| (e) | A sales charge for Class A, Class C (prior to February 1, 2004) and Class J and a contingent deferred sales charge for Class B and Class C shares are not reflected in total return calculations. Periods less than one year, if applicable, are not annualized. |
| (f) | Includes expense recapture of 0.06%, 0.09% and 0.03% for Class A, Class C and Class J, respectively. |
| (g) | Includes expense recapture of less than 0.01% for Class B and Class Y, respectively. |
24
NOTESTO FINANCIAL STATEMENTS
September 30, 2008
1. Organization. Loomis Sayles Funds II (the “Trust”) is organized as a Massachusetts business trust. The Trust is registered under the Investment Company Act of 1940, as amended (the “1940 Act”), as an open-end management investment company. The Declaration of Trust permits the Board of Trustees to authorize the issuance of an unlimited number of shares of the Trust in multiple series. Information presented in these financial statements pertains to Loomis Sayles Investment Grade Bond Fund (the “Fund” or the “Investment Grade Bond Fund”); the financial statements for the remaining fixed income funds and the equity funds of the Trust are presented in separate reports.
The Fund offers Class A, Class C, Class Y and Class J shares. Effective October 12, 2007, Class B shares are no longer offered. Existing Class B shareholders may continue to reinvest dividends into Class B shares and exchange their Class B shares for Class B shares of other Natixis Funds subject to existing exchange privileges as described in the Prospectus.
Class A shares are sold with a maximum front-end sales charge of 4.50%. Class B shares do not pay a front-end sales charge, but pay higher Rule 12b-1 fees than Class A shares for eight years (at which point they automatically convert to Class A shares) and are subject to a contingent deferred sales charge (“CDSC”) if those shares are redeemed within six years of purchase. Class C shares do not pay a front-end sales charge, do not convert to any other Class of shares, pay higher Rule 12b-1 fees than Class A shares and may be subject to a CDSC of 1.00% if those shares are redeemed within one year. Class Y shares do not pay a front-end sales charge, a CDSC or Rule 12b-1 fees. Class Y shares are generally intended for institutional investors with a minimum initial investment of $100,000, though some categories of investors are exempted from the minimum investment amount as outlined in the Fund's Prospectus. Class J shares are only offered to non-U.S. investors and are sold with a maximum front-end sales charge of 3.50%.
Most expenses of the Trust can be directly attributed to a fund. Expenses which can not be directly attributed to a fund are generally apportioned based on the relative net assets of each of the funds in the Trust. Expenses of the Fund are borne pro rata by the holders of each class of shares, except that each class bears expenses unique to that class (including the Rule 12b-1 service and distribution fees, registration, legal, shareholder reporting and transfer agent fees applicable to such class). In addition, each class votes as a class only with respect to its own Rule 12b-1 Plan. Shares of each class would receive their pro rata share of the net assets of the Fund if the Fund were liquidated. The Trustees approve separate dividends from net investment income on each class of shares.
2. Significant Accounting Policies. The following is a summary of significant accounting policies consistently followed by the Fund in the preparation of its financial statements. The Fund’s financial statements are prepared in accordance with accounting principles generally accepted in the United States of America which require the use of management estimates that affect the reported amounts and disclosures in the financial statements. Actual results could differ from those estimates.
a. Security Valuation. Debt securities (other than short-term obligations purchased with an original or remaining maturity of sixty days or less) are generally valued on the basis of evaluated bids furnished to the Fund by a pricing service recommended by the investment adviser and approved by the Board of Trustees, which service determines valuations for normal, institutional-size trading units of such securities using market information, transactions for comparable securities and various relationships between securities which are generally recognized by institutional traders. Equity securities, including closed-end investment companies and exchange-traded funds, for which market quotations are readily available, are valued at market value, as reported by pricing services recommended by the investment adviser and approved by the Board of Trustees. Such pricing services generally use the security's last sale price on the exchange or market where the security is primarily traded or, if there is no reported sale during the day, the closing bid price. Securities traded on the NASDAQ Global Select Market, NASDAQ Global Market and NASDAQ Capital Market are valued at the NASDAQ Official Closing Price ("NOCP"), or if lacking a NOCP, at the most recent bid quotation on the applicable NASDAQ Market. Broker-dealer bid quotations may also be used to value debt and equity securities where a pricing service does not price a security or where a pricing service does not provide a reliable price for the security. In instances where broker-dealer bid quotations are not available, certain securities held by the Fund may be valued on the basis of a price provided by a principal market maker. Short-term obligations purchased with an original or remaining maturity of sixty days or less are valued at amortized cost, which approximates market value. Securities for which market quotations are not readily available are valued at fair value as determined in good faith by the Fund's investment adviser using consistently applied procedures under the general supervision of the Board of Trustees. Investments in other open-end investment companies are valued at their net asset value each day.
The Fund may hold securities traded in foreign markets. Foreign securities are valued at the market price in the foreign market. However, if events occurring after the close of the foreign market (but before the close of regular trading on the New York Stock Exchange) are believed to materially affect the value of those securities, such securities are fair valued pursuant to procedures approved by the Board of Trustees. When fair valuing securities, the Fund may, among other things, use modeling tools or other processes that may take into account factors such as securities market activity and/or significant events that occur after the close of the foreign market and before the Fund calculates its net asset value.
b. Security Transactions and Related Investment Income. Security transactions are accounted for on trade date. Dividend income is recorded on ex-dividend date, or in the case of certain foreign securities, as soon as the Fund is notified, and interest income is recorded on an accrual basis. Interest income is increased by the accretion of discount and decreased by the amortization of premium. Periodic principal adjustments for inflation-protected securities are recorded to interest income. Distributions received from investments in securities that represent a return of capital gain are recorded as a reduction of cost of investments or as a realized gain, respectively. The calendar year- end amounts of ordinary income, capital gains, and return of capital included in distributions received from the Fund’s investment in real estate investment trusts (“REITs”) are reported to the Fund after the end of the fiscal year; accordingly, the Fund estimates these amounts for accounting purposes until the characterization of REIT distributions is reported to the Fund after the end of the fiscal year. Estimates are based on the most recent REIT distribution information available. Investment income is recorded net of foreign taxes withheld when applicable. In determining net gain or loss on securities sold, the cost of securities has been determined on an identified cost basis. Investment income, non-class specific expenses and realized and unrealized gains and losses are allocated on a pro rata basis to each class based on the relative net assets of each class to the total net assets of the Fund.
c. Foreign Currency Translation. The books and records of the Fund are maintained in U.S. dollars. The value of securities, currencies and other assets and liabilities denominated in currencies other than U.S. dollars are translated into U.S. dollars based upon foreign exchange rates prevailing at the end of the period. Purchases and sales of investment securities, income and expenses are translated on the respective dates of such transactions.
25
NOTESTO FINANCIAL STATEMENTS (continued)
September 30, 2008
Since the values of investment securities are presented at the foreign exchange rates prevailing at the end of the period, it is not practical to isolate that portion of the results of operations arising from changes in exchange rates from fluctuations which arise due to changes in market prices of the investment securities. Such changes are included with the net realized and unrealized gain or loss on investments.
Net realized foreign exchange gains or losses arise from sales of foreign currency, currency gains or losses realized between the trade and settlement dates on securities transactions and the difference between the amounts of dividends, interest and foreign withholding taxes recorded on the Fund’s books and the U.S. dollar equivalent of the amounts actually received or paid. Net unrealized foreign exchange gains and losses arise from changes in the value of assets and liabilities, other than investment securities, at the end of the fiscal period, resulting from changes in exchange rates.
The Fund may use foreign currency exchange contracts to facilitate transactions in foreign-denominated investments. Losses may arise from changes in the value of the foreign currency or if the counterparties do not perform under the contracts’ terms.
The Fund may purchase investments of foreign issuers. Investing in securities of foreign issuers involves special risks and considerations not typically associated with investing in U.S. companies and securities of the U.S. government. These risks include revaluation of currencies and the risk of appropriation. Moreover, the markets for securities of many foreign issuers may be less liquid and the prices of such securities may be more volatile than those of comparable U.S. companies and the U.S. government.
d. Forward Foreign Currency Contracts. The Fund may enter into forward foreign currency contracts. Contracts to buy generally are used to acquire exposure to foreign currencies, while contracts to sell generally are used to hedge the Fund’s investments against currency fluctuation. Also, a contract to buy or sell can offset a previous contract. These contracts involve market risk in excess of the unrealized gain or loss reflected in the Fund’s Statement of Assets and Liabilities. The U.S. dollar value of the currencies the Fund has committed to buy or sell represents the aggregate exposure to each currency the Fund has acquired or hedged through currency contracts outstanding at period end.
All contracts are “marked-to-market” daily utilizing interpolated prices determined from information provided by an independent pricing service and any gains or losses are recorded for financial statement purposes as unrealized until settlement date. Risks may arise upon entering into these contracts from the potential inability of counterparties to meet the terms of their contracts and from unanticipated movements in the value of a foreign currency relative to the U.S. dollar. At September 30, 2008, there were no open forward currency contracts.
e. Federal and Foreign Income Taxes. The Trust treats each Fund as a separate entity for federal income tax purposes. The Fund intends to meet the requirements of the Internal Revenue Code applicable to regulated investment companies, and to distribute to its shareholders substantially all of its net investment income and any net realized capital gains at least annually. Management has performed an analysis of the Fund’s tax positions taken on federal and state tax returns that remain subject to examinations (tax years ended September 30, 2005-2008) and has concluded that no provisions for income tax are required. Fund management is not aware of any events that are reasonably possible to occur in the next twelve months that would result in the amounts of any unrecognized tax benefits significantly increasing or decreasing for the Fund. However, management’s conclusions regarding tax positions taken may be subject to review and adjustment at a later date based on factors including, but not limited to, new tax laws and accounting regulations and interpretations thereof.
The Fund may be subject to foreign taxes on income and gains on investments that are accrued based upon the Fund’s understanding of the tax rules and regulations that exist in the countries in which the Fund invests. Foreign governments may also impose taxes or other payments on investments with respect to foreign securities. Such taxes are accrued as applicable.
f. Dividends and Distributions to Shareholders. Dividends and distributions are recorded on ex-dividend date. The timing and characterization of certain income and capital gain distributions are determined annually in accordance with federal tax regulations, which may differ from accounting principles generally accepted in the United States of America. Permanent differences are primarily due to differing treatments for book and tax purposes for items such as foreign currency transactions, paydown adjustments and premium amortization accruals. Permanent book and tax basis differences relating to shareholder distributions will result in reclassifications to capital accounts. Temporary differences between book and tax distributable earnings are primarily due to premium amortization accruals, deferred Trustees’ fees, forward contracts mark to market, defaulted bond accruals, securities lending collateral gain/loss adjustments and wash sales. Distributions from net investment income and short-term capital gains are considered to be distributed from ordinary income for tax purposes.
The tax characterization of distributions is determined on an annual basis. The tax character of distributions paid to shareholders during the years ended September 30, 2008 and 2007 was as follows:
| | | | | | | | | | | | | | |
| 2008 Distributions Paid From: | | 2007 Distributions Paid From: |
Ordinary Income | | Long-Term
Capital Gains | | Total | | Ordinary
Income | | Long-Term
Capital Gains | | Total |
| $190,838,658 | | $ | — | | $ | 190,838,658 | | $53,534,527 | | $ | — | | $ | 53,534,527 |
Differences between these amounts and those reported in the Statements of Changes in Net Assets are primarily attributable to different book and tax treatment for short-term capital gains.
26
NOTESTO FINANCIAL STATEMENTS (continued)
September 30, 2008
As of September 30, 2008, the components of distributable earnings on a tax basis were as follows:
| | | | |
Undistributed ordinary income | | $ | 78,451,895 | |
Undistributed capital gains | | | 9,171,073 | |
Unrealized depreciation | | | (510,465,780 | ) |
| | | | |
Total accumulated losses | | $ | (422,842,812 | ) |
| | | | |
The Fund utilized $1,968,385 of capital loss carryforward in the current year.
g. Repurchase Agreements. The Fund, through its custodian, receives delivery of the underlying securities collateralizing repurchase agreements. It is the Fund’s policy that the market value of the collateral be at least equal to 100% of the repurchase price, including interest. Certain repurchase agreements are tri-party arrangements whereby the collateral is held at the custodian bank in a segregated account for the benefit of the Fund and on behalf of the counterparty. It is the Fund’s policy, regarding tri-party arrangements, that the market value of the collateral be at least equal to 102% of the repurchase price, including interest. Repurchase agreements could involve certain risks in the event of default or insolvency of the counterparty including possible delays or restrictions upon a Fund’s ability to dispose of the underlying securities.
h. Securities Lending. The Fund has entered into an agreement with State Street Bank and Trust Company (“State Street Bank”), as agent of the Fund, to lend securities to certain designated borrowers. The loans are collateralized with cash or securities in an amount equal to at least 105% or 102% of the market value of the loaned international or domestic securities, respectively, when the loan is initiated. Thereafter, the value of the collateral must remain at least 102% of the market value of loaned securities for U.S. equities and U.S. corporate debt; at least 105% of the market value of loaned securities for non-U.S. equities; and at least 100% of the market value of loaned securities for U.S. government securities, sovereign debt issued by non-U.S. governments and non-U.S. corporate debt. In the event that the market value of the collateral falls below the required percentages described above, the borrower will deliver additional collateral on the next business day. As with other extensions of credit, the Fund may bear the risk of loss with respect to the investment of the collateral. The Fund invests cash collateral in short-term investments, a portion of the income from which is remitted to the borrowers and the remainder allocated between the Fund and State Street Bank as lending agent. The value of securities on loan to borrowers and the value of collateral held by the Fund with respect to such loans at September 30, 2008 were $31,782,345 and $32,831,158, respectively. Subsequent to September 30, 2008, all open securities lending transactions were closed.
i. Indemnifications. Under the Trust’s organizational documents, its officers and Trustees are indemnified against certain liabilities arising out of the performance of their duties to the Fund. Additionally, in the normal course of business, the Fund enters into contracts with service providers that contain general indemnification clauses. The Fund’s maximum exposure under these arrangements is unknown as this would involve future claims that may be made against the Fund that have not yet occurred. However, based on experience, the Fund expects the risk of loss to be remote.
j. New Accounting Pronouncements. In September 2006, Statement of Financial Accounting Standards No. 157, Fair Value Measurements (“FAS 157”), was issued and is effective for fiscal years beginning after November 15, 2007. FAS 157 defines fair value, establishes a framework for measuring fair value and expands disclosures about fair value measurements. Management has evaluated the impact the adoption of FAS 157 will have on the Fund's financial statements and believes that such impact will be limited to expanded disclosure in the Fund's financial statements regarding inputs used in determining the value of the Fund's investments.
In March 2008, Statement of Financial Accounting Standards No. 161, Disclosures about Derivative Instruments and Hedging Activities (“FAS 161”), was issued and will be effective for fiscal years and interim periods beginning after November 15, 2008. FAS 161 requires enhanced disclosures about a fund's derivative and hedging activities. Management is currently evaluating the impact the adoption of FAS 161 will have on the Fund's financial statement disclosures.
3. Purchases and Sales of Securities. For the year ended September 30, 2008, purchases and sales of securities (excluding short-term investments and U.S. government/agency securities and including paydowns) were $3,111,282,272 and $207,780,470, respectively. Purchases and sales of U.S. government/agency securities (excluding short-term investments and including paydowns) were $482,046,102 and $896,429,967, respectively.
4. Management Fees and Other Transactions with Affiliates.
a. Management Fees. Loomis, Sayles & Company, L.P. (“Loomis Sayles”) serves as investment adviser to the Fund. Under the terms of the management agreement, the Fund pays a management fee at the annual rate of 0.40% of average daily net assets, calculated daily and payable monthly.
27
NOTESTO FINANCIAL STATEMENTS (continued)
September 30, 2008
Loomis Sayles has given a binding undertaking to the Fund to reduce management fees and/or reimburse certain expenses associated with the Fund to limit its operating expenses. This undertaking is in effect until January 31, 2009 and will be reevaluated on an annual basis. For the year ended September 30, 2008, the expense limits as a percentage of average daily net assets under the expense limitation agreement were as follows:
| | | | | | | | |
Expense Limit as a Percentage of
Average Daily Net Assets |
Class A | | Class B | | Class C | | Class Y | | Class J |
0.95% | | 1.70% | | 1.70% | | 0.55% | | 1.30% |
For the year ended September 30, 2008, the management fees for the Fund were $14,927,516 (0.40% of average daily net assets).
Loomis Sayles shall be permitted to recover expenses it has borne under the expense limitation agreement (whether through reduction of the management fees or otherwise) on a class by class basis in later periods to the extent the expenses of a class fall below a class expense limits, provided, however, that a class is not obligated to pay such reduced fees/expenses more than one year after the end of the fiscal year in which the fee/expense was reduced. At September 30, 2008, no expenses were subject to recapture by Loomis Sayles.
Certain officers and employees of Loomis Sayles are also officers or Trustees of the Trust. Loomis Sayles’ general partner is indirectly owned by Natixis Global Asset Management, L.P. (“Natixis US”), which is part of Natixis Global Asset Management, an international asset management group based in Paris, France.
b. Administrative Fees. Natixis Asset Management Advisors, L.P. ("Natixis Advisors") provides certain administrative services for the Fund and subcontracts with State Street Bank to serve as sub-administrator. Natixis Advisors is a wholly-owned subsidiary of Natixis US. Pursuant to an agreement among Natixis Funds Trust I, Natixis Funds Trust II, Natixis Funds Trust III, Natixis Funds Trust IV, Natixis Cash Management Trust, Gateway Trust (“Natixis Funds Trusts”), Loomis Sayles Funds I, Loomis Sayles Funds II (“Loomis Sayles Funds Trusts”), Hansberger International Series and Natixis Advisors, each Fund pays Natixis Advisors monthly its pro rata portion of fees equal to an annual rate of 0.0575% of the first $15 billion of the average daily net assets of the Natixis Funds Trusts, Loomis Sayles Funds Trusts and the Hansberger International Series, 0.0500% of the next $15 billion, 0.0425% of the next $30 billion and 0.0375% of such assets in excess of $60 billion, subject to an annual aggregate minimum fee for the Natixis Funds Trusts , Loomis Sayles Funds Trusts and the Hansberger International Series of $10 million, which is reevaluated on an annual basis. New funds are subject to an annual fee of $75,000 plus $12,500 per class and an additional $75,000 if managed by multiple subadvisors in their first calendar year of operations.
Effective October 1, 2007, State Street Bank agreed to reduce the fees it receives from Natixis Advisors for serving as sub-administrator to the Fund. Also, effective October 1, 2007, Natixis Advisors gave a binding contractual undertaking to the Fund to waive the administrative fees paid by the Fund in an amount equal to the reduction in sub-administrative fees discussed above. The waiver was in effect through June 30, 2008.
Prior to July 1, 2008, the Fund paid Natixis Advisors monthly its pro rata portion of fees equal to an annual rate of 0.0675% of the first $5 billion of the average daily net assets of the Natixis Funds Trusts, Loomis Sayles Funds Trusts and the Hansberger International Series, 0.0625% of the next $5 billion, 0.0500% of the next $20 billion and 0.045% of such assets in excess of $30 billion, subject to an annual aggregate minimum fee for the Natixis Funds Trusts, Loomis Sayles Funds Trusts and the Hansberger International Series of $5 million, which was reevaluated on an annual basis. New funds were subject to an annual fee of $50,000 plus $12,500 per class and an additional $50,000 if managed by multiple subadvisors in their first calendar year of operations.
For the year ended September 30, 2008, the Fund paid the following administrative fees to Natixis Advisors:
| | | | | | |
Gross Administrative Fees | | Waiver of Administrative Fees | | Net Administrative Fees |
$1,894,625 | | $ | 69,053 | | $ | 1,825,572 |
c. Service and Distribution Fees. Natixis Distributors, L.P. (“Natixis Distributors”), a wholly-owned subsidiary of Natixis US, has entered into a distribution agreement with the Trust. Pursuant to this agreement, Natixis Distributors serves as principal underwriter of the Fund, except Class J shares of the Fund. The Fund has entered into a distribution agreement relating to Class J shares with Loomis Sayles Distributors, L.P. (“Loomis Sayles Distributors”), a wholly-owned subsidiary of Natixis US.
Pursuant to Rule 12b-1 under the 1940 Act, the Fund has adopted a Service Plan relating to the Fund’s Class A shares (the “Class A Plan”) and a Distribution and Service Plan relating to the Fund’s Class B and Class C shares (the “Class B and Class C Plans”).
Under the Class A Plan, the Fund pays Natixis Distributors a monthly service fee at an annual rate not to exceed 0.25% of the average daily net assets attributable to the Fund’s Class A shares, as reimbursement for expenses incurred by Natixis Distributors in providing personal services to investors in Class A shares and/or the maintenance of shareholder accounts.
28
NOTESTO FINANCIAL STATEMENTS (continued)
September 30, 2008
Under the Class B and Class C Plans, the Fund pays Natixis Distributors a monthly service fee at an annual rate of 0.25% of the average daily net assets attributable to the Fund’s Class B and Class C shares, as compensation for services provided and expenses incurred by Natixis Distributors in providing personal services to investors in Class B and Class C shares and/or the maintenance of shareholder accounts.
Also under the Class B and Class C Plans, the Fund pays Natixis Distributors a monthly distribution fee at an annual rate of 0.75% of the average daily net assets attributable to the Fund’s Class B and Class C shares, as compensation for services provided and expenses incurred by Natixis Distributors in connection with the marketing or sale of Class B and Class C shares.
Class J shares are subject to a monthly shareholder service fee at an annual rate of 0.25% and a monthly distribution fee, at an annual rate of 0.50% of the average daily net assets attributable to the Fund’s Class J shares, both payable to Loomis Sayles Distributors, pursuant to a shareholder service and distribution plan adopted under Rule 12b-1.
For the year ended September 30, 2008 the Fund paid the following service and distribution fees:
| | | | | | | | | | | | | | | | | | |
Service Fees | | Distribution Fees |
Class A | | Class B | | Class C | | Class J | | Class B | | Class C | | Class J |
$3,942,434 | | $ | 43,968 | | $ | 2,758,111 | | $ | 437,740 | | $ | 131,903 | | $ | 8,274,334 | | $ | 875,480 |
d. Sub-Transfer Agent Fee. Natixis Distributors has entered into agreements with financial intermediaries to provide certain recordkeeping, processing, shareholder communications and other services to customers of the intermediaries and has agreed to compensate the intermediaries for providing those services. Certain services would be provided by the Fund if the shares of those customers were registered directly with the Fund’s transfer agent. Accordingly, the Fund agreed to pay a portion of the intermediary fees attributable to shares of the Fund held by intermediaries (which generally are a percentage of the value of shares held) not exceeding what the Fund would have paid its transfer agent had each customer’s shares been registered directly with the transfer agent instead of held through the intermediary. Natixis Distributors pays the remainder of the fees. Listed below are the fees incurred by the Fund which are reflected in the transfer agent fees and expenses in the Statement of Operations.
| | | | | | | | | | | | |
Sub-Transfer Agent Fees |
Class A | | Class B | | Class C | | Class Y | | Class J |
$715,898 | | $ | 8,452 | | $ | 496,552 | | $ | 358,854 | | $ | — |
e. Commissions. The Fund has been informed that commissions (including CDSCs) on Fund shares paid to Natixis Distributors by investors in Class A, B and C shares of the Fund were $6,527,045 and commissions paid to Loomis Sayles Distributors by investors in Class J shares of the Fund were $162,325 for the year ended September 30, 2008.
f. Trustees Fees and Expenses. The Fund does not pay any compensation directly to its officers or Trustees who are directors, officers or employees of Natixis Advisors, Natixis Distributors, Natixis US, or their affiliates. The Chairperson of the Board receives a retainer fee at the annual rate of $200,000. The Chairperson does not receive any meeting attendance fees for Board of Trustees meetings or committee meetings that she attends. Each Independent Trustee (other than the Chairperson) receives, in the aggregate, a retainer fee at the annual rate of $65,000. Each Independent Trustee also receives a meeting attendance fee of $7,500 for each meeting of the Board of Trustees that he or she attends in person and $3,750 for each meeting of the Board of Trustees that he or she attends telephonically. In addition, each committee chair receives an additional retainer fee at the annual rate of $10,000. Each Contract Review and Governance Committee member is compensated $5,000 for each Committee meeting that he or she attends in person and $2,500 for each meeting that he or she attends telephonically. Each Audit Committee member is compensated $6,250 for each Committee meeting that he or she attends in person and $3,125 for each meeting that he or she attends telephonically. These fees are allocated among the funds in the Natixis Funds Trusts, Loomis Sayles Funds Trusts and the Hansberger International Series based on a formula that takes into account, among other factors, the relative net assets of each Fund. Trustees are reimbursed for travel expenses in connection with attendance at meetings.
Prior to January 1, 2008, each Independent Trustee (other than the Chairperson) received, in the aggregate, a retainer fee at the annual rate of $55,000. Each Independent Trustee also received a meeting attendance fee of $6,000 for each meeting of the Board of Trustees that he or she attended in person and $3,000 for each meeting that he or she attended telephonically. In addition, each Contract Review and Governance Committee member received $4,000 for each committee meeting that he or she attended in person and $2,000 for each committee meeting that he or she attended telephonically. Each Audit Committee member received $5,000 for each committee meeting that he or she attended in person and $2,500 for each committee meeting that he or she attended telephonically. The Chairperson of the Board and committee chair retainers were $200,000 and $10,000, respectively.
A deferred compensation plan (the “Plan”) is available to the Trustees on a voluntary basis. Deferred amounts remain in the Funds until distributed in accordance with the provisions of the Plan. The value of a participating Trustee’s deferral account is based on theoretical investments of deferred amounts, on the normal payment dates, in certain funds of the Natixis Funds Trusts, Loomis Sayles Funds Trusts and Hansberger International Series as designated by the participating Trustees. Changes in the value of participants’ deferral accounts are allocated pro rata among the funds in the Natixis Funds Trusts, Loomis Sayles Funds Trusts, and Hansberger International Series, and are reflected as Trustees’ fees and expenses in the Statements of Operations. The portions of the accrued obligations allocated to the Funds under the Plan are reflected as Deferred Trustees’ fees in the Statements of Assets and Liabilities.
5. Line of Credit. The Fund, together with certain other funds of Natixis Funds Trusts, Loomis Sayles Funds Trusts and the Hansberger International Series, participates in a $200,000,000 committed line of credit provided by State Street Bank, with an individual limit of $125,000,000 for each fund that participates in the line of credit. Interest is
29
NOTESTO FINANCIAL STATEMENTS (continued)
September 30, 2008
charged to each participating fund based on its borrowings at a rate per annum equal to the Federal Funds rate plus 0.50%. In addition, a commitment fee of 0.09% per annum, payable at the end of each calendar quarter, is accrued and apportioned among the participating funds based on their average daily unused portion of the line of credit.
Prior to March 12, 2008, the Fund, together with certain other funds of Natixis Funds Trusts, Loomis Sayles Funds Trusts and Hansberger International Series, participated in a $75,000,000 committed line of credit provided by State Street Bank.
For the year ended September 30, 2008, the Fund had no borrowings under these agreements.
6. Shareholders. At September 30, 2008, the Loomis Sayles Employees’ Profit Sharing Retirement Plan held 299,958 shares of beneficial interest of Class Y shares.
7. Capital Shares. The Fund may issue an unlimited number of shares of beneficial interest, without par value. Transactions in capital shares were as follows:
| | | | | | | | | | | | | | |
| | Year Ended
September 30, 2008 | | | Year Ended
September 30, 2007 | |
| | Shares | | | | Amount | | | Shares | | | | Amount | |
| | | | | | | | | | | | | | |
| Class A | | | | | | | | | | | | | | |
Issued from the sale of shares | | 141,854,364 | �� | | $ | 1,656,977,467 | | | 62,683,448 | | | $ | 718,750,421 | |
Issued in connection with the reinvestment of distributions | | 5,123,079 | | | | 59,622,406 | | | 1,215,478 | | | | 13,890,899 | |
Redeemed | | (41,000,347 | ) | | | (471,380,105 | ) | | (6,122,274 | ) | | | (70,007,079 | ) |
| | | | | | | | | | | | | | |
Net change | | 105,977,096 | | | $ | 1,245,219,768 | | | 57,776,652 | | | $ | 662,634,241 | |
| | | | | | | | | | | | | | |
| Class B | | | | | | | | | | | | | | |
Issued from the sale of shares | | 238,331 | | | $ | 2,759,530 | | | 1,066,683 | | | $ | 12,151,938 | |
Issued in connection with the reinvestment of distributions | | 32,911 | | | | 382,852 | | | 21,567 | | | | 245,601 | |
Redeemed | | (208,730 | ) | | | (2,405,675 | ) | | (114,073 | ) | | | (1,298,212 | ) |
| | | | | | | | | | | | | | |
Net change | | 62,512 | | | $ | 736,707 | | | 974,177 | | | $ | 11,099,327 | |
| | | | | | | | | | | | | | |
| Class C | | | | | | | | | | | | | | |
Issued from the sale of shares | | 86,193,536 | | | $ | 1,001,609,060 | | | 46,067,893 | | | $ | 525,272,541 | |
Issued in connection with the reinvestment of distributions | | 1,861,389 | | | | 21,543,304 | | | 406,871 | | | | 4,631,767 | |
Redeemed | | (12,717,963 | ) | | | (145,036,821 | ) | | (1,848,031 | ) | | | (21,049,506 | ) |
| | | | | | | | | | | | | | |
Net change | | 75,336,962 | | | $ | 878,115,543 | | | 44,626,733 | | | $ | 508,854,802 | |
| | | | | | | | | | | | | | |
| Class Y | | | | | | | | | | | | | | |
Issued from the sale of shares | | 84,132,384 | | | $ | 980,528,103 | | | 34,163,364 | | | $ | 391,585,504 | |
Issued in connection with the reinvestment of distributions | | 2,701,331 | | | | 31,421,337 | | | 578,308 | | | | 6,613,133 | |
Redeemed | | (26,105,415 | ) | | | (298,275,048 | ) | | (3,224,099 | ) | | | (36,901,729 | ) |
| | | | | | | | | | | | | | |
Net change | | 60,728,300 | | | $ | 713,674,392 | | | 31,517,573 | | | $ | 361,296,908 | |
| | | | | | | | | | | | | | |
| Class J | | | | | | | | | | | | | | |
Issued from the sale of shares | | 2,839,200 | | | $ | 32,261,445 | | | 550,000 | | | $ | 6,284,374 | |
Issued in connection with the reinvestment of distributions | | | | | | | | | — | | | | — | |
Redeemed | | (2,306,870 | ) | | | (26,702,358 | ) | | (4,100,330 | ) | | | (46,695,231 | ) |
| | | | | | | | | | | | | | |
Net change | | 532,330 | | | $ | 5,559,087 | | | (3,550,330 | ) | | $ | (40,410,857 | ) |
| | | | | | | | | | | | | | |
Increase (decrease) from capital share transactions | | 242,637,200 | | | $ | 2,843,305,497 | | | 131,344,805 | | | $ | 1,503,474,421 | |
| | | | | | | | | | | | | | |
30
REPORTOF INDEPENDENT REGISTERED PUBLIC ACCOUNTING FIRM
To the Trustees of Loomis Sayles Funds II and Shareholders of Loomis Sayles Investment Grade Bond Fund:
In our opinion, the accompanying statement of assets and liabilities, including the portfolio of investments, and the related statements of operations and of changes in net assets and the financial highlights present fairly, in all material respects, the financial position of the Loomis Sayles Investment Grade Bond Fund, a series of Loomis Sayles Funds II ("the Fund"), at September 30, 2008, and the results of its operations, the changes in its net assets and the financial highlights for each of the periods indicated, in conformity with accounting principles generally accepted in the United States of America. These financial statements and financial highlights (hereafter referred to as "financial statements") are the responsibility of the Fund's management; our responsibility is to express an opinion on these financial statements based on our audits. We conducted our audits of these financial statements in accordance with the standards of the Public Company Accounting Oversight Board (United States). Those standards require that we plan and perform the audits to obtain reasonable assurance about whether the financial statements are free of material misstatement. An audit includes examining, on a test basis, evidence supporting the amounts and disclosures in the financial statements, assessing the accounting principles used and significant estimates made by management, and evaluating the overall financial statement presentation. We believe that our audits, which included confirmation of securities at September 30, 2008 by correspondence with the custodian and brokers, provide a reasonable basis for our opinion.
PricewaterhouseCoopers LLP
Boston, Massachusetts
November 21, 2008
31
2008 U.S. TAX DISTRIBUTION INFORMATIONTO SHAREHOLDERS (unaudited)
Qualified Dividend Income. For the fiscal year ended September 30, 2008, the Investment Grade Bond Fund will designate up to the maximum amount allowable pursuant to the Internal Revenue Code as qualified dividend income eligible for reduced tax rates. These lower rates range from 5% to 15% depending on an individual’s tax bracket. If the Fund pays a distribution during calendar year 2008, complete information will be reported in conjunction with Form 1099-DIV.
Qualified Interest Income. For the fiscal year ending September 30, 2008, the Investment Grade Bond Fund will designate up to the maximum amount allowable pursuant to the Internal Revenue Code as qualified interest income eligible for reduced tax with holding rates for foreign shareholders. Complete information will be reported in conjunction with dividend information provided to foreign shareholders.
32
TRUSTEEAND OFFICER INFORMATION
The tables below provide certain information regarding the Trustees and officers of Loomis Sayles Funds II (the “Trust”). Unless otherwise indicated, the address of all persons below is 399 Boylston Street, Boston, MA 02116. The Trust’s Statement of Additional Information includes additional information about the Trustees of the Trust and is available by calling Loomis Sayles at 800-343-2029.
| | | | | | |
Name and Year of Birth | | Position(s) Held with the
Trust, Length of Time
Served and Term of Office* | | Principal Occupation(s)
During Past 5 Years** | | Number of Portfolios in Fund
Complex Overseen*** and Other Directorships Held |
| | | |
| INDEPENDENT TRUSTEES | | | | | | |
| | | |
Graham T. Allison, Jr.
(1940) | | Trustee Since 2003 Contract Review and Governance Committee Member | | Douglas Dillon Professor and Director of the Belfer Center for Science and International Affairs, John F. Kennedy School of Government, Harvard University | | 41; Director, Taubman Centers, Inc. (real estate investment trust) |
| | | |
Charles D. Baker (1956) | | Trustee Since 2005 Contract Review and Governance Committee Member | | President and Chief Executive Officer, Harvard Pilgrim Health Care (health plan) | | 41; None |
| | | |
Edward A. Benjamin
(1938) | | Trustee Since 2002 Chairman of the Contract Review and Governance Committee | | Retired | | 41; None |
| | | |
Daniel M. Cain (1945) | | Trustee Since 2003 Chairman of the Audit Committee | | President and Chief Executive Officer, Cain Brothers & Company, Incorporated (investment banking) | | 41; Director, Sheridan Healthcare Inc. (physician practice management) |
| | | |
Kenneth A. Drucker (1945) | | Trustee Since 2008 Contract Review and Governance Committee Member | | Formerly, Treasurer, Sequa Corp. (manufacturing) | | 41; Director, M Fund, Inc. (registered investment company) |
| | | |
Jonathan P. Mason (1958) | | Trustee Since 2007 Audit Committee Member | | Chief Financial Officer, Cabot Corp. (specialty chemicals); formerly, Vice President and Treasurer, International Paper Company; formerly, Chief Financial Officer, Carter Holt Harvey (forest products) | | 41; None |
| | | |
Sandra O. Moose (1942) | | Chairperson of the Board of Trustees since November 2005 Trustee Since 2003 Ex officio member of the Audit Committee and Contract Review and Governance Committee | | President, Strategic Advisory Services (management consulting); formerly, Senior Vice President and Director, The Boston Consulting Group, Inc. (management consulting) | | 41; Director, Verizon Communications; Director, Rohm and Haas Company (specialty chemicals); Director, AES Corporation (international power company) |
33
TRUSTEEAND OFFICER INFORMATION
| | | | | | |
Name and Year of Birth | | Position(s) Held with the
Trust, Length of Time
Served and Term of Office* | | Principal Occupation(s)
During Past 5 Years** | | Number of Portfolios in Fund
Complex Overseen*** and Other Directorships Held |
| | | |
INDEPENDENT TRUSTEES continued | | | | | | |
| | | |
Cynthia L. Walker
(1956) | | Trustee Since 2005 Audit Committee Member | | Deputy Dean for Finance and Administration, Yale University School of Medicine; formerly, Executive Dean for Administration, Harvard Medical School; and formerly, Dean for Finance & Chief Financial Officer, Harvard Medical School | | 41; None |
| | | |
| INTERESTED TRUSTEES | | | | | | |
| | | |
Robert J. Blanding1 (1947) 555 California Street San Francisco, CA 94104 | | Trustee Since 2002 Chief Executive Officer since 2002 | | President, Chairman, Director and Chief Executive Officer, Loomis, Sayles & Company, L.P. | | 41; None |
| | | |
John T. Hailer2 (1960) | | Trustee Since 2003 | | President and Chief Executive Officer-U.S. and Asia, Natixis Global Asset Management, L.P.; formerly, President and Chief Executive Officer, Natixis Distribution Corporation, Natixis Asset Management Advisors, L.P., Natixis Distributors, L.P. and Natixis Global Associates, Inc. | | 41; None |
| * | Each Trustee serves until retirement, resignation or removal from the Board of Trustees. The current retirement age is 72. The position of Chairperson of the Board is appointed for a two-year term. Ms. Moose was appointed to serve an additional two-year term as the Chairperson of the Board of Trustees on September 14, 2007. |
| ** | Each person listed above, except as noted, holds the same position(s) with the Natixis Funds Trust I, Natixis Funds Trust II, Natixis Funds Trust III, Natixis Funds Trust IV, Gateway Trust and the Natixis Cash Management Trust (collectively, the “Natixis Funds Trusts”), Loomis Sayles Funds I and Loomis Sayles Funds II (collectively, the “Loomis Sayles Funds Trusts”), and Hansberger International Series. Previous positions during the past five years with Natixis Distributors, L.P. (the “Distributor”), Natixis Asset Management Advisors, L.P. (“Natixis Advisors”), or Loomis, Sayles & Company, L.P. are omitted if not materially different from a Trustee’s or officer’s current position with such entity. |
| *** | The Trustees of the Trusts serve as trustees of a fund complex that includes all series of the Natixis Funds Trusts, the Loomis Sayles Funds Trusts and Hansberger International Series (collectively, the “Fund Complex”). |
1 | Mr. Blanding is deemed an “interested person” of the Trusts because he holds the following positions with affiliated persons of the Trusts: President, Chairman, Director and Chief Executive Officer of Loomis, Sayles & Company, L.P. |
2 | Mr. Hailer is deemed an “interested person” of the Trusts because he holds the following positions with affiliated persons of the Trusts: President and Chief Executive Officer-U.S. and Asia, Natixis Global Asset Management, L.P. |
34
TRUSTEEAND OFFICER INFORMATION
| | | | | | |
Name and Year of Birth | | Position(s) Held with the
Trust | | Term of Office* and
Length of Time Served | | Principal Occupation
During Past 5 Years** |
|
| OFFICERS OF THE TRUST |
| | | |
Coleen Downs Dinneen (1960) | | Secretary, Clerk and Chief Legal Officer | | Since September 2004 | | Executive Vice President, General Counsel, Secretary and Clerk (formerly, Senior Vice President, Deputy General Counsel, Assistant Secretary and Assistant Clerk), Natixis Distribution Corporation, Natixis Asset Management Advisors, L.P. and Natixis Distributors, L.P. |
| | | |
Daniel J. Fuss (1933) One Financial Center Boston, MA 02111 | | Executive Vice President | | Since June 2003 | | Vice Chairman and Director, Loomis, Sayles & Company, L.P. |
| | | |
David Giunta (1965) | | President | | Since March 2008 | | President and Chief Executive Officer, Natixis Distribution Corporation, Natixis Asset Management Advisors, L.P. and Natixis Distributors, L.P.; formerly, President, Fidelity Charitable Gift Fund; and formerly, Senior Vice President, Fidelity Brokerage Company |
| | | |
Russell L. Kane (1969) | | Chief Compliance Officer, Assistant Secretary and Anti-Money Laundering Officer | | Chief Compliance Officer since May 2006; Assistant Secretary since June 2004; and Anti-Money Laundering Officer since April 2007 | | Chief Compliance Officer for Mutual Funds, Senior Vice President, Deputy General Counsel, Assistant Secretary and Assistant Clerk, Natixis Distribution Corporation, Natixis Asset Management Advisors, L.P. and Natixis Distributors, L.P.; and formerly, Senior Counsel, Columbia Management Group |
| | | |
Michael C. Kardok (1959) | | Treasurer, Principal Financial and Accounting Officer | | Since October 2004 | | Senior Vice President, Natixis Asset Management Advisors, L.P. and Natixis Distributors, L.P.; and formerly, Senior Director, PFPC Inc. |
| | | |
Robert Krantz (1964) | | Executive Vice President | | Since September 2007 | | Executive Vice President, Natixis Asset Management Advisors, L.P. and Natixis Distributors, L.P. |
| * | Each officer of the Trusts serves for an indefinite term in accordance with the Trusts’ current By-laws until the date his or her successor is elected and qualified, or until he or she sooner dies, retires, is removed or becomes disqualified. |
| ** | Each person listed above, except as noted, holds the same position(s) with the Natixis Funds Trusts, Loomis Sayles Funds Trusts and Hansberger International Series. Mr. Fuss is not an officer of the Natixis Funds Trusts or the Hansberger International Series. Previous positions during the past five years with the Distributor, Natixis Advisors or Loomis Sayles are omitted if not materially different from a Trustee’s or officer’s current position with such entity. |
35
The Registrant has adopted a code of ethics that applies to the Registrant’s principal executive officer, principal financial officer and persons performing similar functions.
| Item 3. | Audit Committee Financial Expert. |
The Board of Trustees of the Registrant has established an audit committee. Ms. Cynthia L. Walker, Mr. Daniel M. Cain and Mr. Jonathan P. Mason are members of the audit committee and have been designated as “audit committee financial experts” by the Board of Trustees. Each of these individuals is also an Independent Trustee of the Registrant.
| Item 4. | Principal Accountant Fees and Services. |
Fees billed by the Principal Accountant for services rendered to the Registrant.
The table below sets forth fees billed by the principal accountant, PricewaterhouseCoopers LLP, for the past two fiscal years for professional services rendered in connection with a) the audit of the Registrant’s annual financial statements and services provided in connection with regulatory filings; b) audit-related services (including services that are reasonably related to the performance of the audit of the Registrant’s financial statements and but not reported under “Audit Fees”); c) tax compliance, tax advice and tax planning and d) all other fees billed for professional services rendered by the principal accountant to the Registrant, other than the services reported as a part of (a) through (c) of this Item.
| | | | | | | | | | | | | | | | | | | | | | | | |
| | | Audit fees | | Audit-related fees1 | | Tax fees2 | | All other fees3 |
| | | 2007 | | 2008 | | 2007 | | 2008 | | 2007 | | 2008 | | 2007 | | 2008 |
Loomis Sayles Funds II | | $ | 468,651 | | $ | 419,167 | | $ | 4,000 | | $ | 29,851 | | $ | 97,567 | | $ | 131,205 | | $ | — | | $ | 29,562 |
| | 1. | Audit-related fees consist of a) the performance of agreed-upon procedures related to the filing of Form 485b for the Loomis Sayles Value Fund (2007), b) the performance of agreed-upon procedures related to the Registrant’s deferred compensation plan, c) services related to the implementation of a new accounting standard, d) the performance of agreed-upon procedures related to a fund merger with the Loomis Sayles Value Fund and e) consulting services with respect to potential derivative investments for the Loomis Sayles Mid Cap Growth Fund. |
| | 2. | The tax fees consist of review of year-end shareholder reporting and a review of the Registrant’s tax returns (2007 and 2008) and consulting services with respect to potential derivative investments for the Loomis Sayles Mid Cap Growth Fund. |
| | 3. | All other fees consist of filing and translation services with respect to Japanese shareholders in Loomis Sayles Investment Grade Bond Fund. |
Aggregate fees billed to the Registrant for non-audit services during 2007 and 2008 were $101,567 and $190,618, respectively.
Fees billed by the Principal Accountant for services rendered to the Adviser and Control Affiliates.
The following table sets forth the non-audit services provided by the Registrant’s principal accountant to Loomis, Sayles & Company, L.P. and entities controlling, controlled by or under common control with Loomis, Sayles & Company, L.P. that provide ongoing services to the Registrant (“Control Affiliates”) for the last two fiscal years.
| | | | | | | | | | | | | | | | | | |
| | | Audit-related fees | | Tax fees | | All other fees |
| | | 2007 | | 2008 | | 2007 | | 2008 | | 2007 | | 2008 |
Control Affiliates | | $ | 12,000 | | $ | 12,000 | | $ | — | | $ | — | | $ | — | | $ | — |
Aggregate fees billed to Control Affiliates for non-audit services during 2007 and 2008 were $12,000 and $12,000, respectively.
None of the audit-related, tax and other services provided by the Registrant’s principal accountant were approved by the Audit Committee pursuant to paragraph (c)(7)(i)(C) of Rule 2-01 of Regulation S-X.
Audit Committee Pre Approval Policies.
Annually, the Registrant’s Audit Committee reviews the audit, audit-related, tax and other non-audit services together with the projected fees, for services proposed to be rendered to the Trust and/or other entities for which pre-approval is required during the upcoming year. Any subsequent revisions to already pre-approved services or fees (including fee increases) and requests for pre-approval of new services would be presented for consideration quarterly as needed.
If, in the opinion of management, a proposed engagement by the Registrant’s independent accountants needs to commence before the next regularly scheduled Audit Committee meeting, any member of the Audit Committee who is an independent Board member is authorized to pre-approve the engagement, but only for engagements to provide audit, audit related and tax services. This approval is subject to review of the full Audit Committee at its next quarterly meeting. All other engagements require the approval of all the members of the Audit Committee.
| Item 5. | Audit Committee of Listed Registrants. |
Not applicable.
| Item 6. | Schedule of Investments. |
Included as part of the Report to Shareholders filed as Item 1 herewith.
| Item 7. | Disclosure of Proxy Voting Policies and Procedures for Closed-End Management Investment Companies. |
Not applicable.
| Item 8. | Portfolio Managers of Closed-End Management Investment Companies |
Not applicable.
| Item 9. | Purchases of Equity Securities by Closed-End Management Investment Companies and Affiliated Purchasers. |
Not applicable.
| Item 10. | Submission of Matters to a Vote of Securities Holders. |
There were no material changes to the procedures by which shareholders may recommend nominees to the Registrant’s Board of Trustees.
| Item 11. | Controls and Procedures. |
The Registrant’s principal executive officer and principal financial officer have concluded that the Registrant’s disclosure controls and procedures are sufficient to ensure that information required to be disclosed by the Registrant in this Form N-CSR was recorded, processed, summarized and reported within the time periods specified in the Securities and Exchange Commission’s rules and forms, based upon such officers’ evaluation of these controls and procedures as of a date within 90 days of the filing date of the report.
There were no changes in the Registrant’s internal control over financial reporting that occurred during the Registrant’s last fiscal quarter of the period covered by the report that has materially affected, or is reasonably likely to materially affect, the Registrant’s internal control over financial reporting.
| | (a)(1) | Code of Ethics required by Item 2 hereof, filed herewith as exhibit (a)(1). |
| | (a)(2) | Certifications of Principal Executive Officer and Principal Financial Officer pursuant to Rule 30a-2(a) under the Investment Company Act of 1940 (17 CFR 270.30a-2(a)), filed herewith as Exhibits (a)(2)(1) and (a)(2)(2), respectively. |
| | (b) | Certification of Principal Executive Officer and Principal Financial Officer pursuant to Section 906 of Sarbanes-Oxley Act of 2002 are filed herewith as Exhibit (b). |
SIGNATURES
Pursuant to the requirements of the Securities Exchange Act of 1934 and the Investment Company Act of 1940, the Registrant has duly caused this report to be signed on its behalf by the undersigned, thereunto duly authorized.
| | |
Loomis Sayles Funds II |
| |
By: | | /s/ Robert J. Blanding |
| |
Name: | | Robert J. Blanding |
Title: | | Chief Executive Officer |
Date: | | November 19, 2008 |
Pursuant to the requirements of the Securities Exchange Act of 1934 and the Investment Company Act of 1940, this report has been signed by the following persons on behalf of the Registrant and in the capacities and on the dates indicated.
| | |
By: | | /s/ Robert J. Blanding |
| |
Name: | | Robert J. Blanding |
Title: | | Chief Executive Officer |
Date: | | November 19, 2008 |
| |
By: | | /s/ Michael C. Kardok |
| |
Name: | | Michael C. Kardok |
Title: | | Treasurer |
Date: | | November 19, 2008 |