UNITED STATES
SECURITIES AND EXCHANGE COMMISSION
Washington, D.C. 20549
FORM N-CSR
CERTIFIED SHAREHOLDER REPORT OF REGISTERED
MANAGEMENT INVESTMENT COMPANIES
Investment Company Act file number: 811-06241
Loomis Sayles Funds II
(Exact name of Registrant as specified in charter)
| | |
| 888 Boylston Street, Suite 800 Boston, Massachusetts | | 02199-8197 |
| (Address of principal executive offices) | | (Zip code) |
Russell L. Kane, Esq.
Natixis Distribution, L.P.
888 Boylston Street, Suite 800
Boston, Massachusetts 02199-8197
(Name and address of agent for service)
Registrant’s telephone number, including area code: (617) 449-2822
Date of fiscal year end: September 30
Date of reporting period: September 30, 2018
Item 1. Reports to Stockholders.
The Registrant’s annual report transmitted to shareholders pursuant to Rule 30e-1 under the Investment Company Act of 1940 is as follows:


Annual Report
September 30, 2018
Loomis Sayles Global Allocation Fund
Loomis Sayles Growth Fund
Table of Contents

LOOMIS SAYLES GLOBAL ALLOCATION FUND
| | |
| Managers | | Symbols |
| Daniel J. Fuss, CFA®, CIC | | Class A LGMAX |
| Eileen N. Riley, CFA® | | Class C LGMCX |
| David W. Rolley, CFA® | | Class N LGMNX |
| Lee M. Rosenbaum | | Class Y LSWWX |
| Loomis, Sayles & Company, L.P. | | |
Investment Goal
The Fund seeks high total investment return through a combination of capital appreciation and current income.
Market Conditions
Global equity markets experienced widely divergent results in the 12-month period ending September 30, 2018, reflecting the broad range of economic and political trends that influenced sentiment across the major regions.
In the United States, stocks surged and finished the period just short of an all-time high (as gauged by the S&P 500® Index). US equities were boosted by the persistent strength of the US economy and associated increases in consumer, business and investor confidence. The improvement in growth also fed through to corporate profits, leading to better-than-expected results and prompting analysts to ramp up their estimates for future earnings. These developments outweighed concerns related to trade policy and ongoing interest rate increases by the US Federal Reserve, resulting in robust, broad-based gains for US equities. Growth stocks, especially those in the technology sector, were particularly strong performers. Conversely, value stocks lagged considerably amid reduced investor demand for defensive, dividend-paying companies.
The story was somewhat different overseas. The developed foreign markets came under pressure from early February onward as economic growth failed to meet the optimistic expectations that existed late in 2017. In addition, European equities faced the headwinds of tighter central bank policy and populist political movements. Emerging market stocks also weakened, largely because of protectionism in the United States and economic turmoil in countries such as Argentina and Turkey. The downturn in most foreign currencies against the US dollar also weighed on non-US equities.
Corporate credit spreads (the difference in yield between credit and Treasury securities of similar maturity) generally narrowed in the fourth quarter of 2017 on the back of solid economic numbers, stronger oil prices and the US Republican Party’s tax plan. However, spreads generally widened from January through the rest of the period, despite healthy profits and positive cyclical dynamics. Rising trade tensions, emerging market volatility and political instability in the euro zone periphery lowered investor confidence and likely contributed to reduced global demand for credit in the latter half of the year.
1 |
US Treasury yields rose higher during the period and uncertainty outside of the United States resulted in a stronger US dollar and tighter global financial conditions, particularly in the second half of the period. Unsteady global risk appetite, tighter US monetary policy and capital inflows in the wake of rising volatility appear to have helped sustain the dollar rally.
Performance Results
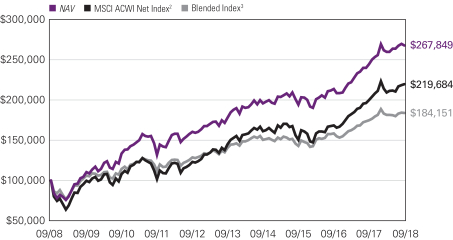
For the 12 months ended September 30, 2018, Class Y shares of the Loomis Sayles Global Allocation Fund returned 9.49% at net asset value. The Fund underperformed its benchmark, the MSCI ACWI (Net), which returned 9.77%.
Explanation of Fund Performance
In equities, the three largest detractors were Dufry, NVR, and Julius Baer. Shares of Dufry underperformed over the period. Concerns around slower organic sales growth as compared to recent trends and top line growth weighed on stock performance. Further, concerns around volatility in emerging market currencies and the impact on traveler purchasing power also contributed to the stock’s weakness. Dufry rates highly across our quality criteria; it operates in a largely oligopolistic market structure that is well-positioned to benefit from global airline passenger growth. Its long tenured management team has smartly allocated capital, significantly increasing the company’s scale via acquisitions over the last decade. Today it has a highly diversified business model, geographically as well as by store concepts, with a mix of general shops, proprietary concepts (e.g., Hudson News) and branded boutiques (e.g., Coach). As a store operator, it is capital-lite, operating under medium-term contracts. We expect intrinsic value growth to be driven by revenues — passenger growth, square footage increases, bolt-on acquisitions, and growing initiatives such as its loyalty program — and margin expansion as it continues to leverage its scale. Using normalized earnings, the stock is attractively valued on our discounted cash flow methodology.
Shares of NVR, one of the largest home builders in the US, underperformed over the period. While revenue and earnings per share growth were healthy, the company reported lower growth rates in orders, which contributed to weakness in the shares. We believe the company has a healthy backlog and our long-term investment thesis remains intact. The company rates highly across our quality criteria. By focusing on home building rather than land development, the company has a unique asset-lite business model. It leverages purchase agreements to acquire pre-sold finished lots which significantly reduces its capital requirements. This model allowed the company to remain cash flow positive during the 2008 housing crisis. Its scale supports strong relationships with land developers and subcontractors as well as creates purchasing power. The company has a solid management team — the strength of which is demonstrated by the company’s cash flow generation and return on invested capital metrics. The CEO has been in place since 2005 and was previously the CFO for 12 years. Management also has meaningful company ownership, aligning its interests with shareholders. We expect intrinsic value to be driven by revenue growth, margin expansion, and capital allocation. A continued modest recovery in housing
| 2
LOOMIS SAYLES GLOBAL ALLOCATION FUND
and favorable demographics provide further support to its business. Valuation is attractive based on our discounted cash flow methodology.
Shares of Julius Baer, a Swiss-based global wealth management company, have been weak over the period. Net interest income in the first half was disappointing, indicating that price competition for deposits may be heating up. Additionally, client transactions in Asia have been weak, reflecting client concerns around a potential trade war. Despite these short-term challenges, we are confident of the company’s quality and its strong organic growth potential, driven by continued inflows of new client assets and by bolt-on acquisitions.
Individual bond choices in the Communications sectors, in particular among select US cable and wireless companies failed to keep pace. Certain bonds held from the consumer Cyclical sectors, in particular among select automotive, retailers, and home construction, also detracted.
Allocation to emerging market currencies was negative as increased trade war rhetoric and heightened volatility dampened the risk appetite for emerging market assets. In particular, exposure to the Argentine peso, Brazilian real, South African rand, Mexican peso, and Indonesian rupiah detracted from results. Issuer selection among emerging market hard currency names, particularly those from Brazil and Argentina, detracted as emerging market assets were under pressure during the period and country vulnerabilities came into focus.
In equities, the top three individual contributors were Amazon, Sherwin-Williams, and UnitedHealth Group.
Amazon shares outperformed during the year as the company continues to deliver strong growth, led by Amazon Web Services, Subscription Services, and other revenues (primarily advertising). The composition of growth is becoming increasingly relevant for Amazon, as these segments will likely carry operating margins well above the company average. This mix effect, coupled with restrained growth in capital leases and headcount, has resulted in substantial profitability improvements in the last two quarters. We would also highlight Amazon’s planned acquisition of PillPack Pharmacy during the period — vaulting the e-Commerce giant into yet another attractive market. The company has a long history of identifying and disrupting large profit pools in established industries — either through organic or inorganic investment — and we believe that this acquisition could be a springboard for future expansion into the healthcare arena. While Amazon will bring immediate scale to the PillPack platform, the PillPack business could conversely help Amazon to grow its Prime membership base among older individuals, given that PillPack’s customer base skews to this demographic.
Sherwin-Williams performed well over the past year, demonstrating strong pricing power despite persistently rising raw material costs. Same store sales in the company’s core paint stores business steadily grew in the mid- to high single digits throughout the year and the company delivered solid gains in performance coatings. Performance also improved in the consumer brands segment, which struggled throughout 2017. Integration of the Valspar business continues apace, and the margin and revenue synergies from the acquisition are
3 |
becoming increasingly meaningful. We believe the company is likely to continue to reduce debt through year-end, with an eye towards more balanced capital allocation in 2019.
Shares of UnitedHealth Group (UNH) rose steadily over the 12-month period. The company has continued its pattern of positive long-term execution of its business model. As the largest Managed Care Organization (MCO) with ~45 million members, UNH benefits from scale advantages, specifically greater underwriting experience and the ability to leverage non-medical costs. Via its Optum businesses, the company has accumulated valuable medical trend data over decades, providing insights which it leverages for its own MCO as well as external clients. UNH rates highly across our quality dimensions; the company has consistently returned cash to shareholders via its growing dividend and share buybacks. It has a strong track record of acquisitions, including Surgical Care Affiliates, Advisory Board, and DaVita Medical Group. We expect intrinsic value growth to be driven by organic top-line growth and modest margin expansion, as well as by continued share repurchases. UNH will also be a beneficiary of lower US tax rates. Valuation is attractive based on our discounted cash flow methodology.
In fixed income, corporate credit allocation was a positive source of returns during the period. Particularly helpful to performance were allocations to the consumer (cyclical and non-cyclical), banking, technology, communications, and energy sectors.
Allocations to high yield corporate issuers also contributed to positive performance. US high yield holdings lifted results as they generally outpaced higher grade names and proved among the more resilient fixed income segments during the period, aided by pockets of strength and the benefit of higher income to offset the effects of rising yields.
Holdings within the insurance sector and issuers from the supermarkets and healthcare sectors were additive. Energy issuers, in particular, US Independent and Midstream, also added value during the period.
Limited exposure to poor performing peripheral Eurozone country government bonds such as those from Italy was also positive.
Outlook
Continued positive corporate earnings reports and global growth provide broad support for equities. However, we expect recent volatility to continue, particularly as trade tensions show little sign of easing. The longer uncertainty persists around trade, the greater the risk that global growth decelerates. Companies may delay capital expenditures and hiring or preemptively make decisions regarding their supply chains — leaving a less efficient global supply chain, thus raising the cost of doing business. We also anticipate continued negative news flow surrounding the technology sector (e.g., data privacy, market concentration) which may pressure stocks; however we expect companies to continue to show resiliency over the long term. Whether it’s search, e-commerce or social media, these services remain highly desired by consumers. As such, we anticipate their share of digital advertising dollars will continue to grow. While new regulations may increase operating costs, we remain confident that our holdings’ business models will prove resilient.
| 4
LOOMIS SAYLES GLOBAL ALLOCATION FUND
Renewed confidence in global growth, combined with credible monetary and fiscal policy measures, may help take pressure off emerging market and European risk assets. Disappointment, however, could prove disruptive.
Growth in China still looks set to slow moderately due to tighter financial regulations and environmental cleanup efforts. While we don’t expect a sharp rise in debt-financed fiscal initiatives by China as seen in the past, we do anticipate some modest easing of regulatory clamp-down efforts to help offset the growing downside risks to growth from US and Chinese tariffs.
Strong earnings have given global corporate credit investors confidence to stay the course, and we anticipate the vast majority of corporate industries will maintain stable credit fundamentals. A credit cycle is a cyclical pattern that follows credit availability, and corporate health behavior, such as accelerated mergers and acquisitions activity or an overly aggressive US Federal Reserve (Fed), could induce volatility. Euro investment grade credit should see stability, with reasonable valuations, healthy fundamentals and continued technical support from European Central Bank corporate buying. The UK remains hampered by the Brexit overhang, and we expect elements of contentious negotiations, both within the UK and with the EU, to be a market driver for the UK and possibly the broader European asset markets.
Valuations indicate the US dollar is expensive, but there appears to be no near-term cyclical catalyst to revert it toward fair value. Strong momentum in the US looks more likely to stick in the quarters ahead relative to the rest of the world. The Fed looks likely to stay on its current course, but we’re watching for more dovish signals that might suggest the rate hiking cycle is coming to an end sooner than anticipated. The Trump administration prefers a weaker dollar; a healthier growth and inflation trajectory in Europe and abroad may help in this regard, but only so long as China helps contain any renewed pressure on its currency.
To the extent that these events create shifts in sentiment and cause short-term volatility, they can also provide us with entry points to build long-term positions in high-quality companies and opportunities to trim or sell positions at what we consider attractive levels. Rather than try to predict macro events, we focus on companies with sustainable business models and a compelling valuation.
5 |
Hypothetical Growth of $100,000 Investment in Class Y Shares4
September 30, 2008 through September 30, 2018
See notes to chart on page 7.
Top Ten Holdings as of September 30, 2018
| | | | | | |
| Security Name | | % of
net assets | |
| 1 | | Sherwin-Williams Co. (The) | | | 3.15 | % |
| 2 | | Roper Technologies, Inc. | | | 3.04 | |
| 3 | | AIA Group Ltd. | | | 2.79 | |
| 4 | | Amazon.com, Inc. | | | 2.68 | |
| 5 | | Danaher Corp. | | | 2.62 | |
| 6 | | Alibaba Group Holding Ltd., Sponsored ADR | | | 2.43 | |
| 7 | | Marriott International, Inc., Class A | | | 2.28 | |
| 8 | | UnitedHealth Group, Inc. | | | 2.23 | |
| 9 | | Nestle S.A., (Registered) | | | 2.23 | |
| 10 | | Northrop Grumman Corp. | | | 2.15 | |
The portfolio is actively managed and holdings are subject to change. There is no guarantee the Fund continues to invest in the securities referenced. The holdings listed exclude any temporary cash investments.
| 6
LOOMIS SAYLES GLOBAL ALLOCATION FUND
Average Annual Total Returns — September 30, 20184
| | | | | | | | | | | | | | | | | | | | | | | | |
| | | | | | | | | | | | | | | Expense Ratios5 | |
| | | 1 Year | | | 5 Years | | | 10 Years | | | Life of
Class N | | | Gross | | | Net | |
| | | | | | | |
| Class Y (Inception 5/1/96) | | | | | | | | | | | | | | | | | | | | | | | | |
| NAV | | | 9.49 | % | | | 8.48 | % | | | 10.36 | % | | | — | % | | | 0.93 | % | | | 0.93 | % |
| | | | | | | |
| Class A (Inception 2/1/06) | | | | | | | | | | | | | | | | | | | | | | | | |
| NAV | | | 9.26 | | | | 8.23 | | | | 10.08 | | | | — | | | | 1.18 | | | | 1.18 | |
| With 5.75% Maximum Sales Charge | | | 2.97 | | | | 6.96 | | | | 9.43 | | | | — | | | | | | | | | |
| | | | | | | |
| Class C (Inception 2/1/06) | | | | | | | | | | | | | | | | | | | | | | | | |
| NAV | | | 8.46 | | | | 7.41 | | | | 9.26 | | | | — | | | | 1.93 | | | | 1.93 | |
| With CDSC1 | | | 7.46 | | | | 7.41 | | | | 9.26 | | | | — | | | | | | | | | |
| | | | | | | |
| Class N (Inception 2/1/17) | | | | | | | | | | | | | | | | | | | | | | | | |
| NAV | | | 9.60 | | | | — | | | | — | | | | 13.85 | | | | 0.87 | | | | 0.87 | |
| | | | | | | |
| Comparative Performance | | | | | | | | | | | | | | | | | | | | | | | | |
| MSCI ACWI (Net)2 | | | 9.77 | | | | 8.67 | | | | 8.19 | | | | 14.48 | | | | | | | | | |
| Blended Index3 | | | 5.28 | | | | 5.55 | | | | 6.30 | | | | 9.57 | | | | | | | | | |
Performance data shown represents past performance and is no guarantee of, and not necessarily indicative of, future results. Total return and value will vary, and you may have a gain or loss when shares are sold. Current performance may be lower or higher than quoted. For most recent month-end performance, visit im.natixis.com. Performance for other share classes will be greater or less than shown based on differences in fees and sales charges. You may not invest directly in an index. Performance for periods less than one year is cumulative, not annualized. Returns reflect changes in share price and reinvestment of dividends and capital gains, if any. The table(s) do not reflect taxes shareholders might owe on any fund distributions or when they redeem their shares.
| 1 | Performance for Class C shares assumes a 1% contingent deferred sales charge (“CDSC”) applied when you sell shares within one year of purchase. |
| 2 | The MSCI All Country World Index (Net) is a free float-adjusted market capitalization weighted index that is designed to measure the equity market performance of developed and emerging markets. |
| 3 | The Blended Index is an unmanaged, blended index composed of the following weights: 60% MSCI All Country World Index (Net) and 40% Bloomberg Barclays Global Aggregate Bond Index. The Bloomberg Barclays Global Aggregate Bond Index provides a broad-based measure of the global investment-grade fixed income markets. The three major components of this index are the U.S. Aggregate, the Pan-European Aggregate, and the Asian-Pacific Aggregate Indices. The index also includes Eurodollar and Euro-Yen corporate bonds, Canadian government, agency and corporate securities, and USD investment grade 144A securities. |
| 4 | Fund performance has been increased by fee waivers and/or expense reimbursements, if any, without which performance would have been lower. |
| 5 | Expense ratios are as shown in the Fund’s prospectus in effect as of the date of this report. The expense ratios for the current reporting period can be found in the Financial Highlights section of this report under Ratios to Average Net Assets. Net expenses reflect contractual expense caps set to expire on 1/31/19. When a Fund’s expenses are below the cap, gross and net expense ratios will be the same. See Note 6 of the Notes to Financial Statements for more information about the Fund’s expense caps. |
7 |
LOOMIS SAYLES GROWTH FUND
| | |
| Manager | | Symbols |
| Aziz V. Hamzaogullari, CFA® | | Class A LGRRX |
| Loomis, Sayles & Company, L.P. | | Class C LGRCX |
| | Class N LGRNX |
| | Class Y LSGRX |
Investment Goal
The Fund seeks long-term growth of capital.
Market Conditions
US equity markets surged during the 12-month period ending September 30, 2018, and finished just short of an all-time high (as gauged by the S&P 500® Index). US equities were boosted by the persistent strength of the US economy and associated increases in consumer, business and investor confidence. The improvement in growth also fed through to corporate profits, leading to better-than-expected results and prompting analysts to ramp up their estimates for future earnings. These developments outweighed concerns related to trade policy and ongoing interest rate increases by the US Federal Reserve, resulting in robust, broad-based gains for US equities. Growth stocks, especially those in the technology sector, were particularly strong performers. Conversely, value stocks lagged considerably amid reduced investor demand for defensive, dividend-paying companies.
Performance Results
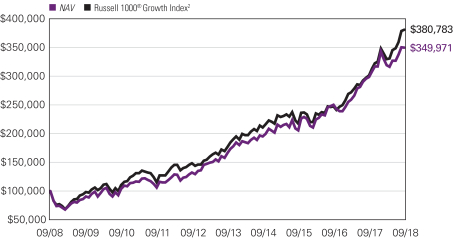
For the 12 months ended September 30, 2018, Class Y shares of Loomis Sayles Growth Fund returned 17.25% at net asset value. The Fund underperformed its benchmark, the Russell 1000® Growth Index, which returned 26.30%.
Explanation of Fund Performance
We are an active manager with a long-term, private equity approach to investing. Through our proprietary bottom-up research framework, we look to invest in those few high-quality businesses with sustainable competitive advantages and profitable growth when they trade at a significant discount to intrinsic value. Given the rare confluence of quality, growth, and valuation, we may study dozens of companies but may only invest in a select few businesses each year. We believe identifying those few businesses with these characteristics is an art, not a science. As a result of this rigorous approach, ours is a selective, high-conviction portfolio of typically 30–40 names.
The Fund’s positions in Schlumberger, Cerner, and Yum China detracted the most from performance. Stock selection in the information technology, healthcare, consumer staples, energy, financials and industrials sectors, along with our allocations in the consumer staples, consumer discretionary, energy, healthcare and financials sectors, detracted from relative performance.
| 8
LOOMIS SAYLES GROWTH FUND
Schlumberger is the world’s leading supplier of technology, equipment, integrated project management, and information solutions to the international oil and gas exploration and production industry. Over its 90-year history, Schlumberger has built a brand and reputation for delivering consistent service and product excellence across the spectrum of exploration, drilling, and production. Only a few companies can compete with the scope of Schlumberger’s integrated suite of products and services, and even fewer can compete with the scale and depth of its technology and service execution. The company reported global sales that rose 13% compared with the year-ago period, but stocks in the oil services sector came under pressure on short-term concerns around slowing activity in North America due to insufficient takeaway capacity in the Permian basin, as well as potential impacts on oil demand from trade disputes and emerging market weakness. In markets outside of North America, which have historically accounted for approximately 75% of revenue, the company continued to experience low demand growth for its services. Customer spending has lagged the rebound in oil prices as companies continue to repair their balance sheets following years of low prices. However, North America revenues grew over 50% during the period as the company redeployed idle capacity to accommodate growing drilling and well completion activity. While management has been prematurely optimistic about a recovery outside of the United States, based on contracts Schlumberger has already won, management indicated that international growth in 2019 would be in the double digits. Over a two-year period, which began in 2014 and saw industry spending fall by over 50%, Schlumberger gained share and maintained leading margins, while several competitors posted losses or very thin margins. Schlumberger was one of the few companies to generate positive free cash flow during the downturn, and continued to invest to strengthen its ability to offer integrated solutions to clients. Increasing consumption in emerging markets and the need to replace naturally depleting reservoirs creates long-term secular growth in the demand for oil and the need to extract hydrocarbons from harsher environments. Oilfield services like those Schlumberger provides are key to accessing difficult-to-reach resources. Thanks to its superior products and services and its competitive advantages, we believe Schlumberger is well positioned to weather the current environment and capitalize on the growth in oilfield services as market supply-demand normalizes.
Cerner is a leading supplier of healthcare information technology (HCIT) solutions. Connecting providers and patients at more than 27,000 facilities worldwide, Cerner offers mission-critical enterprise software for the clinical, financial, and operational needs of healthcare organizations of every size. Managed with long-term vision and a culture of research and development, Cerner is able to deliver innovative and relevant solutions for its clients, and its products are deeply embedded in client workflows. As a result, switching costs are high and client relationships can last for decades. Cerner reported financial results during the period that were fundamentally solid, but mixed from an expectations standpoint due in part to the timing of several large new contracts that were delayed but ultimately signed. The decision to purchase and integrate enterprise HCIT represents a critical decision for an organization which can last for over a decade. Given the size and scope of the contracts, the timing of new contracts can be difficult to predict. While volatile on a quarterly basis, new bookings rose approximately 15% over the prior-year period and included a large, ten-year contract with the Department of Veterans Affairs
9 |
(VA) that could have a value of up to $10 billion and provides Cerner with greater revenue visibility. Over 25% of new bookings were from outside the company’s installed base of users, representing clients that are new to the company. Revenues grew in the mid-single digits year over year, while operating margins declined, in part due to growth investments. We expect margins will begin to expand again next year. Well positioned to capitalize on the secular increase in spending on HCIT, we believe that Cerner can grow revenue in the high single digits over our investment horizon, with faster growth in earnings and cash flow as the company improves margins and benefits from lower capital intensity.
Yum China is the largest restaurant company in China, operating over 8,100 restaurants primarily under the KFC and Pizza Hut brands. With its iconic brands, large and complex supply-chain infrastructure, decades of experience as a restaurant operator in China, and real estate procurement expertise, we believe Yum China is well positioned to benefit from the secular growth of consumer spending on restaurants in China. The company, a Fund holding since the fourth quarter of 2016 when it was spun off from existing Fund holding Yum! Brands, was among the top detractors for the period. After multiple quarters of strong growth at the company’s larger, more profitable KFC segment, the company reported that KFC segment growth slowed in the most recent quarter, and it continues to experience challenges in its Pizza Hut business, which has been in the midst of a multi-year recovery. Shares reacted negatively in September following unconfirmed reports that the company rejected an unsolicited acquisition proposal from a private investor group for $46 per share. The company has not acknowledged the rumors. Despite underperformance in recent results, we believe management has proven adept at identifying business weaknesses, and devising and executing credible strategies for improvement. The slowdown in sales at KFC was the first since the segment began a strong recovery two years ago following food safety concerns and slowing consumer spending. Pizza Hut in 2017 recorded its first full year of positive same-store sales growth since 2013, but the turnaround remains in progress. The company continues to have success with its loyalty programs and delivery initiatives, with delivery sales growing faster than total sales for both brands. The company’s loyalty programs grew to over 180 million members from approximately 100 million one year ago. Overall, we believe the long-term secular growth driver remains intact as food options such as Pizza Hut and KFC become increasingly affordable to an emerging middle class with rising levels of disposable income. We expect this demand will drive unit growth in China for both restaurant brands, as per capita penetration is much lower than in developed countries. We believe the company’s long-term opportunity for increased sales due to unit growth and consumer recovery, and the resulting improvement in margins and free cash flow, are not reflected in current market expectations. We believe the shares of all three detractors are selling at a significant discount to our estimate of intrinsic value and offer compelling reward-to-risk opportunities. During the period, we added to our holdings in each company as near-term price weakness increased the attractiveness of the reward-to-risk opportunity.
The Fund’s positions in Amazon, Visa, and Cisco Systems contributed the most to performance. Stock selection in the consumer discretionary sector, along with our
| 10
LOOMIS SAYLES GROWTH FUND
allocations in the industrials and information technology (IT) sectors, contributed positively to relative performance.
Online retailer Amazon offers millions of products — sold by Amazon or by third parties — with the value proposition to consumers of selection, price, and convenience. Amazon’s enterprise IT business, Amazon Web Services (AWS), offers a suite of secure, on-demand cloud-computing services, with a value proposition to clients of speed, agility, and savings. In both of its core markets, Amazon possesses strong and sustainable competitive advantages that would be difficult to replicate. In e-commerce these include its brand, scale, network advantage, technology platform, and logistics and distribution systems. The AWS business benefits from its massive scale, which allows it to pass along cost savings while continuing to innovate. Amazon reported healthy fundamentals and strong growth in revenue during the period. With gross merchandise volume (GMV) growing, by our estimates, well above growth in the teens for US e-commerce and low single-digit growth in global retail sales, the company continued to take market share. AWS also posted impressive revenue growth, exceeding a $24 billion annual run rate, that was many multiples higher than our estimate of single-digit growth in overall enterprise IT spending. Under the thoughtful leadership of founder Jeff Bezos, Amazon continued rapid investment in key areas that capitalize on its strength, focusing on businesses with high, durable growth prospects and strong financial returns. With an increasing shift to higher-margin product categories such as third-party sales, AWS, and advertising, gross margins expanded during the period. Amazon is one of the best-positioned companies in e-commerce and enterprise IT — each addressing large, underpenetrated markets. The secular shift in consumer preference from traditional brick-and-mortar retail to online retail is the primary growth driver for Amazon, but both markets benefit from secular growth that is still in its early stages. We believe the current share price shows a lack of appreciation for Amazon’s significant long-term growth opportunities and the sustainability of its business model. We believe the shares are trading at a significant discount to our estimate of intrinsic value, offering a compelling reward-to-risk opportunity.
Visa is the largest payments technology company in the world, with a comprehensive offering of digital payment products including credit cards, debit cards — which Visa invented — and transaction security services known as tokenization. Visa has one of the world’s most recognized brands, which took decades and significant investment to build. Through its open-loop, multi-party system, Visa has built a massive global network, orchestrating transaction settlements between merchants, merchants’ banks, card-issuer banks and cardholders in more than 200 countries. A global network with 3.3 billion Visa-branded cards outstanding that are accepted by over 46 million merchants worldwide creates a powerful virtuous cycle, reinforcing Visa’s difficult-to-replicate competitive advantages. During the period, Visa reported revenue and earnings that were strong and above market expectations. Payment dollar volume growth in the low double digits benefited from stronger global growth, but was well above the growth in the approximately $45 trillion of global personal consumer expenditures, demonstrating the strength of the long-term secular shift from cash to electronic payments. We estimate Visa can generate
11 |
double-digit cash flow growth over our forecast period. As the company continues to scale its businesses in regions around the world, we expect it will be able to increase cash flow growth, expand margins, and improve its return on invested capital. We believe the shares are trading at a significant discount to our estimate of intrinsic value, offering a compelling reward-to-risk opportunity.
Cisco designs, manufactures, and markets internet networking equipment, primarily at the high end of the market. We believe Cisco’s scale, end-to-end architecture solutions, and large installed customer base uniquely position the company to benefit from exponential growth in internet traffic, which will require a corresponding exponential increase in bandwidth capacity. Cisco returned to positive year-over-year revenue growth and finished its 2018 fiscal year with record quarterly revenues and earnings per share (EPS). Cisco is transitioning its business to a software and product subscription model, where a portion of revenue that was previously recognized up front is now earned as recurring revenue over time, which creates a near-term revenue headwind. However, over the long run, we believe the subscription model contributes to a higher customer lifetime value and will improve the overall quality of the business by increasing the visibility of future revenue streams, lowering cyclicality, and raising profitability. New innovation is enabling Cisco to expand product recurring revenue beyond its smaller collaboration, wireless, and security businesses and into its core networking products. In its large campus switching business, where Cisco is the market leader, Cisco had previously been unable to drive growth because it lacked the innovation needed to spark an upgrade cycle. However, a unique automation feature in the company’s next-generation Catalyst 9000 series switching product reduces customer operating expenses — which represent the lion’s share of IT department operating budgets — and creates an economic incentive to upgrade. That product, announced in mid-2017, has become Cisco’s fastest-growing product innovation in history, with almost 10,000 new customers — most of which are opting for the highest-level subscription services. Another attraction of the subscription model is that it allows customers to more easily adopt future functionality and innovations, making it less likely that customers will base their decisions solely on the price of competing hardware options. Cisco expects to extend this model to other core products, which we believe will contribute to recurring revenue within the product segment growing from approximately 12% today to approximately 40% over our investment time horizon. Total recurring revenue accounted for approximately 32% of total company revenue, which we believe can exceed 50% over the next decade. Leading with its unique end-to-end architecture, including differentiated cloud-enabled hardware and software solutions, Cisco is well positioned to benefit from the ever increasing demand for internet bandwidth capability. We believe the shares are selling at a discount to our estimate of intrinsic value and offer an attractive reward-to-risk opportunity.
All aspects of our quality-growth-valuation investment thesis must be present simultaneously for us to make an investment. Often our research is completed well in advance of the opportunity to invest. We are patient investors and maintain coverage of high-quality businesses in order to take advantage of meaningful price dislocations if and when they occur. During the period, we initiated new positions in Starbucks and
| 12
LOOMIS SAYLES GROWTH FUND
Colgate-Palmolive. We added to our existing holdings in Oracle, Schlumberger, Regeneron Pharmaceuticals, Cerner, Procter & Gamble and Yum China. We trimmed our existing positions in Varian Medical Systems, Cisco, United Parcel Service, and American Express. We also trimmed our positions in Alibaba and Amazon as they approached our maximum allowable position size. We sold our position in Analog Devices as it approached our estimate of intrinsic value.
Outlook
Our investment process is characterized by bottom-up, fundamental research and a long-term investment time horizon. The nature of the process leads to a lower-turnover portfolio in which sector positioning is the result of stock selection. The Fund ended the year with overweight positions in the consumer staples, energy, financials, and healthcare sectors and underweight positions in the industrials, consumer discretionary and information technology sectors. We did not own positions in the real estate, materials, telecommunication services or utilities sectors.
Hypothetical Growth of $100,000 Investment in Class Y Shares3
September 30, 2008 through September 30, 2018
See notes to chart on page 15.
13 |
Top Ten Holdings as of September 30, 2018
| | | | | | |
| Security Name | | % of
net assets | |
| 1 | | Amazon.com, Inc. | | | 7.71 | % |
| 2 | | Visa, Inc., Class A | | | 5.97 | |
| 3 | | Oracle Corp. | | | 5.16 | |
| 4 | | Facebook, Inc., Class A | | | 4.93 | |
| 5 | | Alibaba Group Holding Ltd., Sponsored ADR | | | 4.65 | |
| 6 | | Autodesk, Inc. | | | 4.52 | |
| 7 | | Microsoft Corp. | | | 3.60 | |
| 8 | | Regeneron Pharmaceuticals, Inc. | | | 3.55 | |
| 9 | | Monster Beverage Corp. | | | 3.55 | |
| 10 | | QUALCOMM, Inc. | | | 3.35 | |
The portfolio is actively managed and holdings are subject to change. There is no guarantee the Fund continues to invest in the securities referenced. The holdings listed exclude any temporary cash investments.
| 14
LOOMIS SAYLES GROWTH FUND
Average Annual Total Returns — September 30, 20183
| | | | | | | | | | | | | | | | | | | | | | | | |
| | | | | | | | | | | | | | | Expense Ratios4 | |
| | | 1 Year | | | 5 Years | | | 10 Years | | | Life of
Class N | | | Gross | | | Net | |
| | | | | | | |
| Class Y (Inception 5/16/91) | | | | | | | | | | | | | | | | | | | | | | | | |
| NAV | | | 17.25 | % | | | 16.10 | % | | | 13.34 | % | | | — | % | | | 0.66 | % | | | 0.66 | % |
| | | | | | | |
| Class A (Inception 12/31/96) | | | | | | | | | | | | | | | | | | | | | | | | |
| NAV | | | 16.98 | | | | 15.82 | | | | 13.01 | | | | — | | | | 0.91 | | | | 0.91 | |
| With 5.75% Maximum Sales Charge | | | 10.23 | | | | 14.47 | | | | 12.34 | | | | — | | | | | | | | | |
| | | | | | | |
| Class C (Inception 9/12/03) | | | | | | | | | | | | | | | | | | | | | | | | |
| NAV | | | 16.09 | | | | 14.95 | | | | 12.18 | | | | — | | | | 1.66 | | | | 1.66 | |
| With CDSC1 | | | 15.09 | | | | 14.95 | | | | 12.18 | | | | — | | | | | | | | | |
| | | | | | | |
| Class N (Inception 2/1/13) | | | | | | | | | | | | | | | | | | | | | | | | |
| NAV | | | 17.40 | | | | 16.14 | | | | — | | | | 16.61 | | | | 0.58 | | | | 0.58 | |
| | | | | | | |
| Comparative Performance | | | | | | | | | | | | | | | | | | | | | | | | |
| Russell 1000® Growth Index2 | | | 26.30 | | | | 16.58 | | | | 14.31 | | | | 17.35 | | | | | | | | | |
Performance data shown represents past performance and is no guarantee of, and not necessarily indicative of, future results. Total return and value will vary, and you may have a gain or loss when shares are sold. Current performance may be lower or higher than quoted. For most recent month-end performance, visit im.natixis.com. Performance for other share classes will be greater or less than shown based on differences in fees and sales charges. You may not invest directly in an index. Performance for periods less than one year is cumulative, not annualized. Returns reflect changes in share price and reinvestment of dividends and capital gains, if any. The table(s) do not reflect taxes shareholders might owe on any fund distributions or when they redeem their shares.
| 1 | Performance for Class C shares assumes a 1% contingent deferred sales charge (“CDSC”) applied when you sell shares within one year of purchase. |
| 2 | Russell 1000® Growth Index is an unmanaged index that measures the performance of the large-cap growth segment of the U.S. equity universe. It includes those Russell 1000® companies with higher price-to-book ratios and higher forecasted growth values. |
| 3 | Fund performance has been increased by fee waivers and/or expense reimbursements, if any, without which performance would have been lower. |
| 4 | Expense ratios are as shown in the Fund’s prospectus in effect as of the date of this report. The expense ratios for the current reporting period can be found in the Financial Highlights section of this report under Ratios to Average Net Assets. Net expenses reflect contractual expense caps set to expire on 1/31/19. When a Fund’s expenses are below the cap, gross and net expense ratios will be the same. See Note 6 of the Notes to Financial Statements for more information about the Fund’s expense caps. |
15 |
ADDITIONAL INFORMATION
The views expressed in this report reflect those of the portfolio managers as of the dates indicated. The managers’ views are subject to change at any time without notice based on changes in market or other conditions. References to specific securities or industries should not be regarded as investment advice. Because the Funds are actively managed, there is no assurance that they will continue to invest in the securities or industries mentioned.
All investing involves risk, including the risk of loss. There is no assurance that any investment will meet its performance objectives or that losses will be avoided.
ADDITIONAL INDEX INFORMATION
This document may contain references to third party copyrights, indexes, and trademarks, each of which is the property of its respective owner. Such owner is not affiliated with Natixis Investment Managers or any of its related or affiliated companies (collectively “Natixis Affiliates”) and does not sponsor, endorse or participate in the provision of any Natixis Affiliates services, funds or other financial products.
The index information contained herein is derived from third parties and is provided on an “as is” basis. The user of this information assumes the entire risk of use of this information. Each of the third party entities involved in compiling, computing or creating index information disclaims all warranties (including, without limitation, any warranties of originality, accuracy, completeness, timeliness, non-infringement, merchantability and fitness for a particular purpose) with respect to such information.
PROXY VOTING INFORMATION
A description of the Natixis Funds proxy voting policies and procedures is available without charge, upon request, by calling Natixis Funds at 800-225-5478; on the Natixis Funds’ website at im.natixis.com; and on the Securities and Exchange Commission’s (“SEC’s”) website at www.sec.gov. Information regarding how the Natixis Funds voted proxies relating to portfolio securities during the most recent 12-month period ended June 30 is available from the Natixis Funds’ website and the SEC’s website.
QUARTERLY PORTFOLIO SCHEDULES
The Natixis Funds file complete schedules of portfolio holdings with the SEC for the first and third quarters of each fiscal year on Form N-Q. The Funds’ Forms N-Q are available on the SEC’s website at www.sec.gov and may be reviewed and copied at the SEC’s Public Reference Room in Washington, DC. Information on the operation of the Public Reference Room may be obtained by calling 800-SEC-0330.
| 16
UNDERSTANDING FUND EXPENSES
As a mutual fund shareholder, you incur different types of costs: transaction costs, including sales charges (loads) on purchases and contingent deferred sales charges on redemptions; and ongoing costs, including management fees, distribution and/or service fees (12b-1 fees), and other fund expenses. Certain exemptions may apply. These costs are described in more detail in the Funds’ prospectuses. The following examples are intended to help you understand the ongoing costs of investing in the Funds and help you compare these with the ongoing costs of investing in other mutual funds.
The first line in the table for each class of Fund shares shows the actual account values and actual fund expenses you would have paid on a $1,000 investment in the Fund from April 1, 2018 through September 30, 2018. To estimate the expenses you paid over the period, simply divide your account value by $1,000 (for example, $8,600 account value divided by $1,000 = 8.6) and multiply the result by the number in the Expenses Paid During Period row as shown below for your class.
The second line in the table for each class of Fund shares provides information about hypothetical account values and hypothetical expenses based on the Fund’s actual expense ratios and an assumed rate of return of 5% per year before expenses, which is not the Fund’s actual return. The hypothetical account values and expenses may not be used to estimate the actual ending account balance or expenses you paid on your investment for the period. You may use this information to compare the ongoing costs of investing in the Funds to other funds. To do so, compare this 5% hypothetical example with the 5% hypothetical examples that appear in the shareholder reports of the other funds.
Please note that the expenses shown reflect ongoing costs only, and do not include any transaction costs, such as sales charges. Therefore, the second line in the table of each fund is useful in comparing ongoing costs only, and will not help you determine the relative costs of owning different funds. If transaction costs were included, total costs would be higher.
17 |
| | | | | | | | | | | | |
LOOMIS SAYLES GLOBAL ALLOCATION
FUND | | BEGINNING
ACCOUNT VALUE
4/1/2018 | | | ENDING
ACCOUNT VALUE
9/30/2018 | | | EXPENSES PAID
DURING PERIOD*
4/1/2018 – 9/30/2018 | |
| Class A | | | | | | | | | | | | |
| Actual | | | $1,000.00 | | | | $1,029.40 | | | | $5.90 | |
| Hypothetical (5% return before expenses) | | | $1,000.00 | | | | $1,019.25 | | | | $5.87 | |
| Class C | | | | | | | | | | | | |
| Actual | | | $1,000.00 | | | | $1,025.70 | | | | $9.70 | |
| Hypothetical (5% return before expenses) | | | $1,000.00 | | | | $1,015.49 | | | | $9.65 | |
| Class N | | | | | | | | | | | | |
| Actual | | | $1,000.00 | | | | $1,031.00 | | | | $4.23 | |
| Hypothetical (5% return before expenses) | | | $1,000.00 | | | | $1,020.91 | | | | $4.20 | |
| Class Y | | | | | | | | | | | | |
| Actual | | | $1,000.00 | | | | $1,030.60 | | | | $4.63 | |
| Hypothetical (5% return before expenses) | | | $1,000.00 | | | | $1,020.51 | | | | $4.61 | |
| * | Expenses are equal to the Fund’s annualized expense ratio (after waiver/reimbursement): 1.16%, 1.91%, 0.83% and 0.91% for Class A, C, N and Y, respectively, multiplied by the average account value over the period, multiplied by the number of days in the most recent fiscal half-year (183), divided by 365 (to reflect the half-year period). |
| | | | | | | | | | | | |
| LOOMIS SAYLES GROWTH FUND | | BEGINNING
ACCOUNT VALUE
4/1/2018 | | | ENDING
ACCOUNT VALUE
9/30/2018 | | | EXPENSES PAID
DURING PERIOD*
4/1/2018 – 9/30/2018 | |
| Class A | | | | | | | | | | | | |
| Actual | | | $1,000.00 | | | | $1,095.60 | | | | $4.78 | |
| Hypothetical (5% return before expenses) | | | $1,000.00 | | | | $1,020.51 | | | | $4.61 | |
| Class C | | | | | | | | | | | | |
| Actual | | | $1,000.00 | | | | $1,091.40 | | | | $8.70 | |
| Hypothetical (5% return before expenses) | | | $1,000.00 | | | | $1,016.75 | | | | $8.39 | |
| Class N | | | | | | | | | | | | |
| Actual | | | $1,000.00 | | | | $1,098.00 | | | | $3.00 | |
| Hypothetical (5% return before expenses) | | | $1,000.00 | | | | $1,022.21 | | | | $2.89 | |
| Class Y | | | | | | | | | | | | |
| Actual | | | $1,000.00 | | | | $1,097.30 | | | | $3.47 | |
| Hypothetical (5% return before expenses) | | | $1,000.00 | | | | $1,021.76 | | | | $3.35 | |
| * | Expenses are equal to the Fund’s annualized expense ratio (after waiver/reimbursement): 0.91%, 1.66%, 0.57% and 0.66% for Class A, C, N and Y, respectively, multiplied by the average account value over the period, multiplied by the number of days in the most recent fiscal half-year (183), divided by 365 (to reflect the half-year period). |
| 18
BOARD APPROVAL OF THE EXISTING ADVISORY AGREEMENTS
The Board of Trustees of the Trust (the “Board”), including the Independent Trustees, considers matters bearing on each Fund’s advisory agreement (collectively, the “Agreements”) at most of its meetings throughout the year. Each year, usually in the spring, the Contract Review Committee of the Board meets to review the Agreements to determine whether to recommend that the full Board approve the continuation of the Agreements, typically for an additional one-year period. After the Contract Review Committee has made its recommendation, the full Board, including the Independent Trustees, determines whether to approve the continuation of the Agreements.
In connection with these meetings, the Trustees receive materials that the Funds’ investment adviser (the “Adviser”) believes to be reasonably necessary for the Trustees to evaluate the Agreements. These materials generally include, among other items, (i) information on the investment performance of the Funds and the performance of peer groups of funds and the Funds’ performance benchmarks, (ii) information on the Funds’ advisory fees and other expenses, including information comparing the Funds’ advisory fees to the fees charged to institutional accounts with similar strategies managed by the Adviser, if any, and to those of peer groups of funds and information about any applicable expense caps and/or fee “breakpoints,” (iii) sales and redemption data in respect of the Funds, (iv) information about the profitability of the Agreements to the Adviser and (v) information obtained through the completion by the Adviser of a questionnaire distributed on behalf of the Trustees. The Board, including the Independent Trustees, also considers other matters such as (i) the Adviser’s financial results and financial condition, (ii) each Fund’s investment objective and strategies and the size, education and experience of the Adviser’s investment staff and its use of technology, external research and trading cost measurement tools, (iii) arrangements in respect of the distribution of the Funds’ shares and the related costs, (iv) the allocation of the Funds’ brokerage, if any, including, to the extent applicable, the use of “soft” commission dollars to pay for research and other similar services, (v) the resources devoted to, and the record of compliance with, the Funds’ investment policies and restrictions, policies on personal securities transactions and other compliance policies, (vi) each Adviser’s policies and procedures relating to, among other things, compliance, trading and best execution, proxy voting and valuation, (vii) information about amounts invested by the Funds’ portfolio managers in the Funds or in similar accounts that they manage and (viii) the general economic outlook with particular emphasis on the mutual fund industry. Throughout the process, the Trustees are afforded the opportunity to ask questions of and request additional materials from the Adviser.
In addition to the materials requested by the Trustees in connection with their annual consideration of the continuation of the Agreements, the Trustees receive materials in advance of each regular quarterly meeting of the Board that provide detailed information about the Funds’ investment performance and the fees charged to the Funds for advisory and other services. This information generally includes, among other things, an internal performance rating for each Fund based on agreed-upon criteria, graphs showing each Fund’s performance and expense differentials against each Fund’s peer group/category of
19 |
funds, performance ratings provided by a third-party, total return information for various periods, and third-party performance rankings for various periods comparing a Fund against similarly categorized funds. The portfolio management team for each Fund or other representatives of the Adviser make periodic presentations to the Contract Review Committee and/or the full Board, and Funds identified as presenting possible performance concerns may be subject to more frequent Board or Committee presentations and reviews. In addition, each quarter the Trustees are provided with detailed statistical information about each Fund’s portfolio. The Trustees also receive periodic updates between meetings.
The Board most recently approved the continuation of the Agreements for a one-year period at its meeting held in June 2018. In considering whether to approve the continuation of the Agreements, the Board, including the Independent Trustees, did not identify any single factor as determinative. Individual Trustees may have evaluated the information presented differently from one another, giving different weights to various factors. Matters considered by the Trustees, including the Independent Trustees, in connection with their approval of the Agreements included, but were not limited to, the factors listed below.
The nature, extent and quality of the services provided to the Funds under the Agreements. The Trustees considered the nature, extent and quality of the services provided by the Adviser and its affiliates to the Funds and the resources dedicated to the Funds by the Adviser and its affiliates.
The Trustees considered not only the advisory services provided by the Adviser to the Funds, but also the monitoring and oversight services provided by Natixis Advisors, L.P. (“Natixis Advisors”). They also considered the administrative and shareholder services provided by Natixis Advisors and its affiliates to the Funds. For each Fund, the Trustees also considered the benefits to shareholders of investing in a mutual fund that is part of a family of funds that offers shareholders the right to exchange shares of one type of fund for shares of another type of fund, and provides a variety of fund and shareholder services.
After reviewing these and related factors, the Trustees concluded, within the context of their overall conclusions regarding each of the Agreements, that the nature, extent and quality of services provided supported the renewal of the Agreements.
Investment performance of the Funds and the Adviser. As noted above, the Trustees received information about the performance of the Funds over various time periods, including information that compared the performance of the Funds to the performance of peer groups and categories of funds and the Funds’ respective performance benchmarks. In addition, the Trustees reviewed data prepared by an independent third party that analyzed the performance of the Funds using a variety of performance metrics, including metrics that measured the performance of the Funds on a risk adjusted basis.
The Board noted that, through December 31, 2017, each Fund’s one-, three- and five-year performance, stated as percentile rankings within categories selected by the independent third-party data provider, was as follows (where the best performance would be in the first percentile of its category):
| | | | | | | | | | | | |
| | | One-Year | | | Three-Year | | | Five-Year | |
Loomis Sayles Global Allocation Fund | | | 2 | % | | | 1 | % | | | 6 | % |
Loomis Sayles Growth Fund | | | 24 | % | | | 3 | % | | | 5 | % |
| 20
The Trustees also considered the Adviser’s performance and reputation generally, the performance of the fund family generally, and the historical responsiveness of the Adviser to Trustee concerns about performance and the willingness of the Adviser to take steps intended to improve performance.
After reviewing these and related factors, the Trustees concluded, within the context of their overall conclusions regarding each of the Agreements, that the performance of the Funds and the Adviser and/or other relevant factors supported the renewal of the Agreements.
The costs of the services to be provided and profits to be realized by the Adviser and its affiliates from their respective relationships with the Funds. The Trustees considered the fees charged to the Funds for advisory and administrative services as well as the total expense levels of the Funds. This information included comparisons (provided both by management and by an independent third party) of the Funds’ advisory fees and total expense levels to those of their peer groups and information about the advisory fees charged by the Adviser to comparable accounts (such as institutional separate accounts), as well as information about differences in such fees and the reasons for any such differences. In considering the fees charged to comparable accounts, the Trustees considered, among other things, management’s representations about the differences between managing mutual funds as compared to other types of accounts, including the additional resources required to effectively manage mutual fund assets and the greater regulatory costs associated with the management of such assets. In evaluating each Fund’s advisory fee, the Trustees also took into account the demands, complexity and quality of the investment management of such Fund and the need for the Adviser to offer competitive compensation and the potential need to expend additional resources to the extent the Fund grows in size. The Trustees considered that over the past several years, management had made recommendations regarding reductions in advisory fee rates, implementation of advisory fee breakpoints and the institution of advisory fee waivers and expense caps for various funds in the fund family. They noted that all of the Funds included have expense caps in place, and the Trustees considered that the current expenses of each Fund were below its cap. The Trustees also noted that the total advisory fee rates for the Funds were at or below the medians of their respective peer group of funds.
The Trustees also considered the compensation directly or indirectly received by the Adviser and its affiliates from their relationships with the Funds. The Trustees reviewed information provided by management as to the profitability of the Adviser’s and its affiliates’ relationships with the Funds, and information about the allocation of expenses used to calculate profitability. They also reviewed information provided by management about the effect of distribution costs and changes in asset levels on Adviser profitability, including information regarding resources spent on distribution activities. When reviewing profitability, the Trustees also considered information about court cases in which adviser compensation or profitability were issues, the performance of the Funds, the expense levels of the Funds, whether the Adviser had implemented breakpoints and/or expense caps with respect to such Funds and the overall profit margin of Natixis Investment Managers compared to that of certain other investment managers for which such data was available.
After reviewing these and related factors, the Trustees concluded, within the context of their overall conclusions regarding each of the Agreements, that the advisory fee charged to
21 |
each of the Funds was fair and reasonable, and that the costs of these services generally and the related profitability of the Adviser and its affiliates in respect of their relationships with the Funds supported the renewal of the Agreements.
Economies of Scale. The Trustees considered the existence of any economies of scale in the provision of services by the Adviser and whether those economies are shared with the Funds through breakpoints in their investment advisory fees or other means, such as expense caps. The Trustees also discussed with management the factors considered with respect to the implementation of breakpoints in investment advisory fees or expense caps for certain funds. Management explained that a number of factors are taken into account in considering the possible implementation of breakpoints or an expense cap for a fund, including, among other things, factors such as a fund’s assets, the projected growth of a fund, projected profitability and a fund’s fees and performance. With respect to economies of scale, the Trustees noted that the Loomis Sayles Global Allocation Fund had breakpoints in its advisory fee and that all of the Funds were subject to an expense cap. In considering these issues, the Trustees also took note of the costs of the services provided (both on an absolute and on a relative basis) and the profitability to the Adviser and its affiliates of their relationships with the Funds, as discussed above.
After reviewing these and related factors, the Trustees concluded, within the context of their overall conclusions regarding each of the Agreements, that the extent to which economies of scale were shared with the Funds supported the renewal of the Agreements.
The Trustees also considered other factors, which included but were not limited to the following:
| · | | The effect of recent market and economic events on the performance, asset levels and expense ratios of each Fund. |
| · | | Whether each Fund has operated in accordance with its investment objective and the Fund’s record of compliance with its investment restrictions, and the compliance programs of the Funds and the Adviser. They also considered the compliance-related resources the Adviser and its affiliates were providing to the Funds. |
| · | | So-called “fallout benefits” to the Adviser, such as the engagement of affiliates of the Adviser to provide distribution and administrative services to the Funds, and the benefits of research made available to the Adviser by reason of brokerage commissions (if any) generated by the Funds’ securities transactions. The Trustees also considered the benefits to the parent company of Natixis Advisors from the retention of the Adviser. The Trustees considered the possible conflicts of interest associated with these fallout and other benefits, and the reporting, disclosure and other processes in place to disclose and monitor such possible conflicts of interest. |
| · | | The Trustees’ review and discussion of the Funds’ advisory arrangements in prior years, and management’s record of responding to Trustee concerns raised during the year and in prior years. |
Based on their evaluation of all factors that they deemed to be material, including those factors described above, and assisted by the advice of independent counsel, the Trustees, including the Independent Trustees, concluded that each of the existing Agreements should be continued through June 30, 2019.
| 22
Portfolio of Investments – as of September 30, 2018
Loomis Sayles Global Allocation Fund
| | | | | | | | |
Shares | | | Description | | Value (†) | |
| | Common Stocks — 66.2% of Net Assets | | | | |
| | | | Canada — 1.6% | | | | |
| | 609,200 | | | CGI Group, Inc., Class A(a) | | $ | 39,278,579 | |
| | | | | | | | |
| | | | China — 2.4% | | | | |
| | 359,704 | | | Alibaba Group Holding Ltd., Sponsored ADR(a) | | | 59,264,831 | |
| | | | | | | | |
| | | | France — 1.6% | | | | |
| | 284,260 | | | Thales S.A. | | | 40,387,889 | |
| | | | | | | | |
| | | | Hong Kong — 2.8% | | | | |
| | 7,638,800 | | | AIA Group Ltd. | | | 68,114,525 | |
| | | | | | | | |
| | | | India — 0.7% | | | | |
| | 634,450 | | | HDFC Bank Ltd. | | | 17,524,813 | |
| | | | | | | | |
| | | | Japan — 1.1% | | | | |
| | 519,987 | | | Nomura Research Institute Ltd. | | | 26,258,307 | |
| | | | | | | | |
| | | | Sweden — 2.0% | | | | |
| | 1,085,734 | | | Assa Abloy AB | | | 21,762,323 | |
| | 932,874 | | | Atlas Copco AB, Class A | | | 26,827,751 | |
| | | | | | | | |
| | | | | | | 48,590,074 | |
| | | | | | | | |
| | | | Switzerland — 6.5% | | | | |
| | 238,849 | | | Dufry AG, (Registered) | | | 26,986,029 | |
| | 26,470 | | | Geberit AG, (Registered) | | | 12,285,830 | |
| | 481,683 | | | Julius Baer Group Ltd. | | | 24,072,640 | |
| | 654,593 | | | Nestle S.A., (Registered) | | | 54,486,063 | |
| | 249,570 | | | Temenos AG, (Registered) | | | 40,648,074 | |
| | | | | | | | |
| | | | | | | 158,478,636 | |
| | | | | | | | |
| | | | United Kingdom — 4.6% | | | | |
| | 1,320,288 | | | Halma PLC | | | 24,856,883 | |
| | 11,482,864 | | | Legal & General Group PLC | | | 39,200,122 | |
| | 496,011 | | | London Stock Exchange Group PLC | | | 29,639,992 | |
| | 192,434 | | | Reckitt Benckiser Group PLC | | | 17,578,845 | |
| | | | | | | | |
| | | | | | | 111,275,842 | |
| | | | | | | | |
| | | | United States — 42.9% | | | | |
| | 217,171 | | | Accenture PLC, Class A | | | 36,962,504 | |
| | 21,729 | | | Alphabet, Inc., Class C(a) | | | 25,932,910 | |
| | 42,205 | | | Alphabet, Inc., Class A(a) | | | 50,944,811 | |
| | 32,661 | | | Amazon.com, Inc.(a) | | | 65,419,983 | |
| | 4,058 | | | Arconic, Inc. | | | 89,317 | |
| | 9,032 | | | Booking Holdings, Inc.(a) | | | 17,919,488 | |
| | 595,150 | | | CBRE Group, Inc., Class A(a) | | | 26,246,115 | |
| | 490 | | | Cincinnati Bell, Inc.(a) | | | 7,816 | |
| | 590,116 | | | Danaher Corp. | | | 64,122,005 | |
| | 670 | | | Dex Media, Inc.(a)(b) | | | 7,035 | |
| | 207,954 | | | EOG Resources, Inc. | | | 26,528,692 | |
| | 222,799 | | | Facebook, Inc., Class A(a) | | | 36,641,524 | |
| | 174,352 | | | Goldman Sachs Group, Inc. (The) | | | 39,096,692 | |
| | 543,099 | | | Intercontinental Exchange, Inc. | | | 40,672,684 | |
See accompanying notes to financial statements.
23 |
Portfolio of Investments – as of September 30, 2018
Loomis Sayles Global Allocation Fund – (continued)
| | | | | | | | |
Shares | | | Description | | Value (†) | |
| | | | United States — continued | | | | |
| | 292,063 | | | LyondellBasell Industries NV, Class A | | $ | 29,939,378 | |
| | 221,239 | | | M&T Bank Corp. | | | 36,402,665 | |
| | 422,846 | | | Marriott International, Inc., Class A | | | 55,828,357 | |
| | 300,905 | | | McCormick & Co., Inc. | | | 39,644,234 | |
| | 53,766 | | | Mettler-Toledo International, Inc.(a) | | | 32,742,419 | |
| | 165,443 | | | Northrop Grumman Corp. | | | 52,506,645 | |
| | 7,626 | | | NVR, Inc.(a) | | | 18,842,321 | |
| | 157,681 | | | Parker Hannifin Corp. | | | 29,002,266 | |
| | 250,529 | | | Roper Technologies, Inc. | | | 74,209,195 | |
| | 197,860 | | | S&P Global, Inc. | | | 38,659,865 | |
| | 169,319 | | | Sherwin-Williams Co. (The) | | | 77,075,702 | |
| | 368,575 | | | Texas Instruments, Inc. | | | 39,544,412 | |
| | 160,120 | | | Travelers Cos., Inc. (The) | | | 20,769,165 | |
| | 74,657 | | | Tyler Technologies, Inc.(a) | | | 18,295,444 | |
| | 205,236 | | | UnitedHealth Group, Inc. | | | 54,600,985 | |
| | | | | | | | |
| | | | | | | 1,048,654,629 | |
| | | | | | | | |
| | | | Total Common Stocks
(Identified Cost $1,190,734,121) | | | 1,617,828,125 | |
| | | | | | | | |
| | | | | | | | |
Principal
Amount (‡) | | | | | | |
| | Bonds and Notes — 23.7% | |
| | Non-Convertible Bonds — 23.2% | |
| | | | Argentina — 0.2% | |
| $ | 775,000 | | | Provincia de Buenos Aires, 9.125%, 3/16/2024, 144A | | | 718,750 | |
| | 535,000 | | | Republic of Argentina, 6.875%, 4/22/2021 | | | 510,925 | |
| | 2,460,000 | | | Republic of Argentina, 7.125%, 6/28/2117 | | | 1,912,650 | |
| | 1,390,000 | | | Republic of Argentina, 7.625%, 4/22/2046 | | | 1,127,304 | |
| | 355,000 | | | YPF S.A., 8.750%, 4/04/2024, 144A | | | 353,935 | |
| | 17,745,000 | | | YPF S.A., 16.500%, 5/09/2022, 144A, (ARS) | | | 268,023 | |
| | | | | | | | |
| | | | | | | 4,891,587 | |
| | | | | | | | |
| | | | Australia — 0.2% | |
| | 1,675,000 | | | Australia Government Bond, Series 133, 5.500%, 4/21/2023, (AUD)(c) | | | 1,380,488 | |
| | 1,150,000 | | | Commonwealth Bank of Australia, 2.250%, 3/10/2020, 144A(c) | | | 1,135,284 | |
| | 670,000 | | | GAIF Bond Issuer Pty Ltd., 3.400%, 9/30/2026, 144A(c) | | | 621,385 | |
| | 110,000 | | | Incitec Pivot Finance LLC, 6.000%, 12/10/2019, 144A | | | 112,826 | |
| | 935,000 | | | National Australia Bank, 2.500%, 1/12/2021(c) | | | 916,010 | |
| | 95,000 | | | Sydney Airport Finance Co. Pty Ltd., 3.375%, 4/30/2025, 144A | | | 90,429 | |
| | | | | | | | |
| | | | | | | 4,256,422 | |
| | | | | | | | |
| | | | Belgium — 0.1% | |
| | 1,040,000 | | | Anheuser-Busch InBev Finance, Inc., 3.650%, 2/01/2026 | | | 1,010,564 | |
| | 440,000 | | | Solvay Finance (America) LLC, 3.400%, 12/03/2020, 144A | | | 439,547 | |
| | | | | | | | |
| | | | | | | 1,450,111 | |
| | | | | | | | |
| | | | Brazil — 0.6% | |
| | 800,000 | | | Braskem Finance Ltd., 5.750%, 4/15/2021, 144A | | | 821,400 | |
| | 8,500(††) | | | Brazil Notas do Tesouro Nacional, Series F, 10.000%, 1/01/2025, (BRL) | | | 1,984,195 | |
See accompanying notes to financial statements.
| 24
Portfolio of Investments – as of September 30, 2018
Loomis Sayles Global Allocation Fund – (continued)
| | | | | | | | |
Principal
Amount (‡) | | | Description | | Value (†) | |
| | | | Brazil — continued | |
| | 2,250(††) | | | Brazil Notas do Tesouro Nacional, Series F, 10.000%, 1/01/2019, (BRL) | | $ | 561,347 | |
| | 8,815(††) | | | Brazil Notas do Tesouro Nacional, Series F, 10.000%, 1/01/2021, (BRL) | | | 2,205,319 | |
| | 2,300(††) | | | Brazil Notas do Tesouro Nacional, Series F, 10.000%, 1/01/2027, (BRL) | | | 523,123 | |
| | 1,085,000 | | | Brazilian Government International Bond, 4.625%, 1/13/2028 | | | 993,328 | |
| | 1,000,000 | | | CIMPOR Financial Operations BV, 5.750%, 7/17/2024, 144A | | | 705,010 | |
| | 400,000 | | | Cosan Luxembourg S.A., 5.000%, 3/14/2023, 144A | | | 382,000 | |
| | 1,100,000 | | | Embraer Netherlands Finance BV, 5.050%, 6/15/2025(c) | | | 1,104,136 | |
| | 1,045,000 | | | Klabin Finance S.A., 5.250%, 7/16/2024 | | | 1,010,933 | |
| | 1,140,000 | | | Petrobras Global Finance BV, 4.375%, 5/20/2023 | | | 1,082,772 | |
| | 2,685,000 | | | Petrobras Global Finance BV, 5.999%, 1/27/2028 | | | 2,476,913 | |
| | 300,000 | | | Petrobras Global Finance BV, 6.875%, 1/20/2040 | | | 278,775 | |
| | 575,000 | | | Raizen Fuels Finance S.A., 5.300%, 1/20/2027, 144A | | | 540,500 | |
| | 500,000 | | | Tupy Overseas S.A., 6.625%, 7/17/2024, 144A | | | 506,255 | |
| | | | | | | | |
| | | | | | | 15,176,006 | |
| | | | | | | | |
| | | | Canada — 2.7% | |
| | 447,260 | | | Air Canada Pass Through Trust, Series 2015-2, Class A, 4.125%, 6/15/2029, 144A(c) | | | 444,106 | |
| | 895,000 | | | Air Canada Pass Through Trust, Series 2017-1, Class AA, 3.300%, 7/15/2031, 144A(c) | | | 850,966 | |
| | 1,010,000 | | | Antares Holdings LP, 6.000%, 8/15/2023, 144A | | | 1,013,975 | |
| | 815,000 | | | Bank of Montreal, 1.750%, 6/15/2021, 144A(c) | | | 783,525 | |
| | 3,000,000 | | | BMW Canada Auto Trust, Series 2017-1A, Class A2, 1.677%, 5/20/2020, 144A, (CAD)(c) | | | 2,313,971 | |
| | 12,965,000 | | | Canadian Government Bond, 0.500%, 3/01/2022, (CAD)(c) | | | 9,455,371 | |
| | 25,500,000 | | | Canadian Government Bond, 0.750%, 3/01/2021, (CAD)(c) | | | 19,056,544 | |
| | 15,925,000 | | | Canadian Government International Bond, 1.750%, 9/01/2019, (CAD)(c) | | | 12,297,875 | |
| | 970,000 | | | Canadian Imperial Bank of Commerce, 1.600%, 9/06/2019(c) | | | 958,977 | |
| | 800,000 | | | CPPIB Capital, Inc., 0.375%, 6/20/2024, 144A, (EUR)(c) | | | 924,698 | |
| | 430,000 | | | Enbridge, Inc., 2.900%, 7/15/2022 | | | 417,079 | |
| | 905,000 | | | Export Development Canada, 1.800%, 9/01/2022, (CAD)(c) | | | 681,758 | |
| | 1,335,000 | | | Institutional Mortgage Securities Canada, Inc., Series 2014-5A, Class A2, 2.616%, 7/12/2047, 144A, (CAD)(c) | | | 1,023,733 | |
| | 6,165,000 | | | Province of Ontario Canada, 1.250%, 6/17/2019(c) | | | 6,100,238 | |
| | 7,200,000 | | | Province of Ontario Canada, 1.875%, 5/21/2020(c) | | | 7,068,096 | |
| | 1,690,000 | | | Tornoto-Dominion Bank (The), Series GMTN, 3.500%, 7/19/2023(c) | | | 1,686,868 | |
| | | | | | | | |
| | | | | | | 65,077,780 | |
| | | | | | | | |
| | | | Chile — 0.5% | |
| | 815,000,000 | | | Bonos de la Tesoreria de la Republica de Chile, 4.500%, 3/01/2026, (CLP)(c) | | | 1,239,513 | |
| | 1,250,000 | | | Corp. Nacional del Cobre de Chile, 3.625%, 8/01/2027, 144A(c) | | | 1,195,288 | |
| | 1,700,000 | | | Corp. Nacional del Cobre de Chile, 4.500%, 9/16/2025(c) | | | 1,725,755 | |
| | 1,160,000 | | | Corp. Nacional del Cobre de Chile, 4.500%, 9/16/2025, 144A(c) | | | 1,177,574 | |
| | 525,000 | | | Enel Chile S.A., 4.875%, 6/12/2028 | | | 529,673 | |
| | 250,000 | | | Engie Energia Chile S.A., 5.625%, 1/15/2021, 144A | | | 259,166 | |
| | 800,000 | | | Inversiones CMPC S.A., 4.375%, 5/15/2023, 144A(c) | | | 799,906 | |
| | 240,000 | | | Latam Airlines Group S.A., 7.250%, 6/09/2020, 144A | | | 245,119 | |
See accompanying notes to financial statements.
25 |
Portfolio of Investments – as of September 30, 2018
Loomis Sayles Global Allocation Fund – (continued)
| | | | | | | | |
Principal
Amount (‡) | | | Description | | Value (†) | |
| | | | Chile — continued | |
| $ | 748,651 | | | Latam Airlines Pass Through Trust, Series 2015-1, Class A, 4.200%, 8/15/2029 | | $ | 720,576 | |
| | 473,492 | | | Latam Airlines Pass Through Trust, Series 2015-1, Class B, 4.500%, 8/15/2025 | | | 458,104 | |
| | 950,000 | | | Latam Finance Ltd., 6.875%, 4/11/2024, 144A | | | 922,688 | |
| | 935,000 | | | Republic of Chile, 3.240%, 2/06/2028(c) | | | 895,730 | |
| | 1,120,000 | | | Transelec S.A., 4.250%, 1/14/2025, 144A(c) | | | 1,108,800 | |
| | | | | | | | |
| | | | | | | 11,277,892 | |
| | | | | | | | |
| | | | China — 0.3% | |
| | 920,000 | | | Alibaba Group Holding Ltd., 3.400%, 12/06/2027(c) | | | 857,527 | |
| | 795,000 | | | Baidu, Inc., 3.875%, 9/29/2023 | | | 787,360 | |
| | 400,000 | | | China Resources Gas Group Ltd., 4.500%, 4/05/2022, 144A(c) | | | 403,925 | |
| | 835,000 | | | Country Garden Holdings Co. Ltd., 7.500%, 3/09/2020 | | | 850,141 | |
| | 905,000 | | | Industrial & Commercial Bank of China Ltd., 2.957%, 11/08/2022(c) | | | 872,076 | |
| | 890,000 | | | Longfor Group Holdings Ltd., 3.900%, 4/16/2023 | | | 843,285 | |
| | 985,000 | | | Sinopec Group Overseas Development 2017 Ltd., 2.375%, 4/12/2020, 144A(c) | | | 968,777 | |
| | 500,000 | | | Tencent Holdings Ltd., 2.985%, 1/19/2023, 144A(c) | | | 484,271 | |
| | 1,820,000 | | | Three Gorges Finance I Cayman Islands Ltd., 3.150%, 6/02/2026(c) | | | 1,697,641 | |
| | 900,000 | | | Yingde Gases Investment Ltd., 6.250%, 1/19/2023 | | | 868,730 | |
| | | | | | | | |
| | | | | | | 8,633,733 | |
| | | | | | | | |
| | | | Colombia — 0.2% | |
| | 435,000,000 | | | Emgesa S.A. E.S.P., 8.750%, 1/25/2021, (COP) | | | 153,721 | |
| | 830,000,000 | | | Emgesa S.A. E.S.P., 8.750%, 1/25/2021, 144A, (COP) | | | 293,307 | |
| | 2,140,000,000 | | | Empresas Publicas de Medellin E.S.P., 8.375%, 2/01/2021, 144A, (COP)(c) | | | 726,788 | |
| | 575,000 | | | Republic of Colombia, 3.875%, 4/25/2027 | | | 557,750 | |
| | 200,000,000 | | | Republic of Colombia, 7.750%, 4/14/2021, (COP) | | | 70,717 | |
| | 6,150,000,000 | | | Titulos De Tesoreria, Series B, 7.500%, 8/26/2026, (COP)(c) | | | 2,176,045 | |
| | | | | | | | |
| | | | | | | 3,978,328 | |
| | | | | | | | |
| | | | Denmark — 0.0% | |
| | 670,000 | | | Danske Bank AS, 3.875%, 9/12/2023, 144A | | | 656,221 | |
| | | | | | | | |
| | | | Dominican Republic — 0.1% | |
| | 1,410,000 | | | Dominican Republic, 5.500%, 1/27/2025, 144A | | | 1,415,287 | |
| | 590,000 | | | Dominican Republic, 5.950%, 1/25/2027, 144A | | | 602,355 | |
| | 995,000 | | | Dominican Republic, 6.000%, 7/19/2028, 144A | | | 1,014,462 | |
| | 425,000 | | | Dominican Republic, 8.625%, 4/20/2027, 144A | | | 483,438 | |
| | | | | | | | |
| | | | | | | 3,515,542 | |
| | | | | | | | |
| | | | France — 0.5% | |
| | 970,000 | | | Air Liquide Finance S.A., 1.375%, 9/27/2019, 144A(c) | | | 955,673 | |
| | 200,000 | | | AXA S.A., 7.125%, 12/15/2020, (GBP) | | | 289,966 | |
| | 205,000 | | | BNP Paribas S.A., 4.375%, 5/12/2026, 144A | | | 199,618 | |
| | 1,415,000 | | | Caisse d’Amortissement de la Dette Sociale, 1.875%, 2/12/2022(c) | | | 1,357,049 | |
| | 250,000 | | | Credit Agricole S.A., 4.125%, 1/10/2027, 144A | | | 241,899 | |
| | 390,000 | | | Credit Agricole S.A., (fixed rate to 6/23/2026, variable rate thereafter), 7.500%, (GBP)(d) | | | 560,424 | |
See accompanying notes to financial statements.
| 26
Portfolio of Investments – as of September 30, 2018
Loomis Sayles Global Allocation Fund – (continued)
| | | | | | | | |
Principal
Amount (‡) | | | Description | | Value (†) | |
| | | | France — continued | |
| $ | 735,000 | | | Danone S.A., 1.691%, 10/30/2019, 144A(c) | | $ | 724,176 | |
| | 500,000 | | | Dexia Credit Local S.A., 2.250%, 2/18/2020, 144A(c) | | | 494,662 | |
| | 1,215,000 | | | Electricite de France S.A., 4.500%, 9/21/2028, 144A | | | 1,196,856 | |
| | 1,100,000 | | | Electricite de France SA, (fixed rate to 1/29/2026, variable rate thereafter), 6.000%, (GBP)(d) | | | 1,462,415 | |
| | 1,730,000 | | | French Republic Government Bond OAT, 4.250%, 10/25/2023, (EUR)(c) | | | 2,436,634 | |
| | 1,015,000 | | | Societe Generale S.A., 4.750%, 11/24/2025, 144A(c) | | | 1,006,077 | |
| | 475,000 | | | Societe Generale S.A., (fixed rate to 4/07/2021, variable rate thereafter), 6.750%, (EUR)(d) | | | 594,251 | |
| | | | | | | | |
| | | | | | | 11,519,700 | |
| | | | | | | | |
| | | | Germany — 0.2% | |
| | 500,000 | | | Allianz SE, (fixed rate to 7/07/2025, variable rate thereafter), 2.241%, 7/07/2045, (EUR)(c) | | | 580,351 | |
| | 865,000 | | | Bayer U.S. Finance II LLC, 4.250%, 12/15/2025, 144A | | | 859,684 | |
| | 285,000 | | | Bayer U.S. Finance II LLC, 4.375%, 12/15/2028, 144A | | | 279,228 | |
| | 235,000 | | | Commerzbank AG, EMTN, 4.000%, 3/23/2026, (EUR) | | | 293,930 | |
| | 675,000 | | | Daimler Finance North America LLC, 1.750%, 10/30/2019, 144A(c) | | | 665,208 | |
| | 100,000 | | | Deutsche Bank AG, EMTN, 4.500%, 5/19/2026, (EUR) | | | 124,482 | |
| | 380,000 | | | Deutsche Telekom International Finance BV, 2.820%, 1/19/2022, 144A | | | 371,001 | |
| | 1,150,000 | | | Deutsche Telekom International Finance BV, 4.375%, 6/21/2028, 144A | | | 1,146,462 | |
| | | | | | | | |
| | | | | | | 4,320,346 | |
| | | | | | | | |
| | | | Hong Kong — 0.1% | |
| | 355,000 | | | AIA Group Ltd., 3.200%, 3/11/2025, 144A(c) | | | 337,501 | |
| | 1,135,000 | | | AIA Group Ltd., 3.900%, 4/06/2028, 144A | | | 1,112,746 | |
| | | | | | | | |
| | | | | | | 1,450,247 | |
| | | | | | | | |
| | | | India — 0.1% | |
| | 650,000 | | | Greenko Dutch BV, 5.250%, 7/24/2024, 144A | | | 605,742 | |
| | 1,630,000 | | | ICICI Bank Ltd., 3.800%, 12/14/2027 | | | 1,464,584 | |
| | | | | | | | |
| | | | | | | 2,070,326 | |
| | | | | | | | |
| | | | Indonesia — 0.4% | |
| | 875,000 | | | Chandra Asri Petrochemical Tbk PT, 4.950%, 11/08/2024 | | | 764,522 | |
| | 35,310,000,000 | | | Indonesia Government International Bond, 8.250%, 7/15/2021, (IDR) | | | 2,397,367 | |
| | 300,000 | | | Indonesia Government International Bond, 4.125%, 1/15/2025, 144A | | | 295,071 | |
| | 735,000 | | | Indonesia Government International Bond, 4.750%, 1/08/2026 | | | 745,065 | |
| | 34,000,000,000 | | | Indonesia Government International Bond, 7.000%, 5/15/2022, (IDR) | | | 2,228,195 | |
| | 3,500,000,000 | | | Indonesia Government International Bond, 9.500%, 7/15/2023, (IDR) | | | 245,236 | |
| | 781,000,000 | | | Indonesia Government International Bond, 11.500%, 9/15/2019, (IDR) | | | 54,294 | |
| | 14,000,000,000 | | | Indonesia Treasury Bond, 8.375%, 3/15/2024, (IDR)(c) | | | 946,079 | |
| | 795,000 | | | Perusahaan Listrik Negara PT, 5.250%, 10/24/2042, 144A | | | 745,153 | |
| | 1,475,000 | | | Perusahaan Listrik Negara PT, MTN, 4.125%, 5/15/2027 | | | 1,381,716 | |
| | 545,000 | | | Republic of Indonesia, 2.875%, 7/08/2021, 144A, (EUR) | | | 668,398 | |
| | 525,000 | | | Republic of Indonesia, 4.750%, 1/08/2026, 144A | | | 533,033 | |
| | | | | | | | |
| | | | | | | 11,004,129 | |
| | | | | | | | |
See accompanying notes to financial statements.
27 |
Portfolio of Investments – as of September 30, 2018
Loomis Sayles Global Allocation Fund – (continued)
| | | | | | | | |
Principal
Amount (‡) | | | Description | | Value (†) | |
| | | | Ireland — 0.1% | |
| $ | 475,000 | | | AerCap Ireland Capital DAC/AerCap Global Aviation Trust, 4.500%, 5/15/2021 | | $ | 482,371 | |
| | 1,250,000 | | | Bank of Ireland Group PLC, 4.500%, 11/25/2023, 144A | | | 1,247,885 | |
| | | | | | | | |
| | | | | | | 1,730,256 | |
| | | | | | | | |
| | | | Israel — 0.1% | |
| | 510,000 | | | Teva Pharmaceutical Finance Co. LLC, 6.150%, 2/01/2036 | | | 511,801 | |
| | 780,000 | | | Teva Pharmaceutical Finance Netherlands II B.V., 0.375%, 7/25/2020, (EUR) | | | 890,006 | |
| | | | | | | | |
| | | | | | | 1,401,807 | |
| | | | | | | | |
| | | | Italy — 0.6% | |
| | 500,000 | | | Assicurazioni Generali S.p.A., EMTN, 4.125%, 5/04/2026, (EUR) | | | 598,057 | |
| | 665,000 | | | Enel Finance International NV, 1.375%, 6/01/2026, (EUR) | | | 751,761 | |
| | 1,250,000 | | | Enel Finance International NV, 2.875%, 5/25/2022, 144A | | | 1,188,918 | |
| | 210,000 | | | Enel Finance International NV, EMTN, 1.125%, 9/16/2026, (EUR) | | | 230,792 | |
| | 425,000 | | | Intesa Sanpaolo SpA, 5.710%, 1/15/2026, 144A | | | 386,618 | |
| | 530,000 | | | Intesa Sanpaolo SpA, EMTN, 3.928%, 9/15/2026, (EUR) | | | 615,673 | |
| | 3,305,000 | | | Italy Buoni Poliennali Del Tesoro, 2.000%, 2/01/2028, (EUR) | | | 3,539,461 | |
| | 4,255,000 | | | Italy Buoni Poliennali Del Tesoro, 5.000%, 3/01/2022, (EUR) | | | 5,433,388 | |
| | 1,775,000 | | | Telecom Italia Capital S.A., 6.000%, 9/30/2034 | | | 1,690,688 | |
| | 430,000 | | | UniCredit SpA, (fixed rate to 6/19/2027, variable rate thereafter), 5.861%, 6/19/2032, 144A | | | 384,377 | |
| | | | | | | | |
| | | | | | | 14,819,733 | |
| | | | | | | | |
| | | | Japan — 0.0% | |
| | 1,165,000 | | | Nomura Holdings, Inc., GMTN, 2.750%, 3/19/2019(c) | | | 1,165,444 | |
| | | | | | | | |
| | | | Korea — 0.4% | |
| | 765,000 | | | Export-Import Bank of Korea, 3.000%, 11/01/2022(c) | | | 744,817 | |
| | 125,000,000 | | | Export-Import Bank of Korea, MTN, 6.750%, 8/09/2022, (INR)(c) | | | 1,647,463 | |
| | 1,100,000 | | | Hyundai Capital Services, Inc., 3.750%, 3/05/2023, 144A | | | 1,086,165 | |
| | 1,575,000 | | | Kia Motors Corp., 3.000%, 4/25/2023, 144A | | | 1,498,936 | |
| | 630,000 | | | Korea Development Bank (The), MTN, 4.500%, 11/22/2019, (AUD)(c) | | | 463,194 | |
| | 910,000 | | | Korea Gas Corp., 2.750%, 7/20/2022, 144A(c) | | | 877,295 | |
| | 670,000 | | | KT Corp., 2.500%, 7/18/2026, 144A(c) | | | 595,763 | |
| | 1,125,000 | | | Minera y Metalurgica del Boleo S.A. de CV, 2.875%, 5/07/2019, 144A(c) | | | 1,121,348 | |
| | 1,440,000,000 | | | Republic of Korea, Series 2209, 2.000%, 9/10/2022, (KRW)(c) | | | 1,291,366 | |
| | 770,000 | | | Shinhan Bank Co. Ltd., 3.875%, 3/24/2026, 144A(c) | | | 729,839 | |
| | 140,000 | | | SK Telecom Co. Ltd., 6.625%, 7/20/2027, 144A(c) | | | 164,220 | |
| | 200,000 | | | Woori Bank, 5.875%, 4/13/2021, 144A(c) | | | 208,384 | |
| | | | | | | | |
| | | | | | | 10,428,790 | |
| | | | | | | | |
| | | | Mexico — 0.4% | |
| | 620,000 | | | Alfa SAB de CV, 6.875%, 3/25/2044 | | | 638,600 | |
| | 770,000 | | | America Movil SAB de CV, 2.125%, 3/10/2028, (EUR)(c) | | | 919,948 | |
| | 10,000,000 | | | America Movil SAB de CV, 6.450%, 12/05/2022, (MXN)(c) | | | 489,799 | |
| | 675,000 | | | Banco Nacional de Comercio Exterior SNC, (fixed rate to 8/11/2021, variable rate thereafter), 3.800%, 8/11/2026, 144A | | | 658,132 | |
| | 1,150,000 | | | Cemex Finance LLC, 6.000%, 4/01/2024, 144A | | | 1,184,534 | |
See accompanying notes to financial statements.
| 28
Portfolio of Investments – as of September 30, 2018
Loomis Sayles Global Allocation Fund – (continued)
| | | | | | | | |
Principal
Amount (‡) | | | Description | | Value (†) | |
| | | | Mexico — continued | |
| | 1,055,000 | | | Cemex SAB de CV, 2.750%, 12/05/2024, 144A, (EUR) | | $ | 1,221,650 | |
| | 800,000 | | | Gruma SAB de CV, 4.875%, 12/01/2024(c) | | | 819,080 | |
| | 10,000,000 | | | Grupo Televisa SAB, EMTN, 7.250%, 5/14/2043, (MXN)(c) | | | 378,465 | |
| | 142,000(†††) | | | Mexican Fixed Rate Bonds, Series M, 5.750%, 3/05/2026, (MXN) | | | 669,253 | |
| | 190,229(†††) | | | Mexican Fixed Rate Bonds, Series M, 6.500%, 6/10/2021, (MXN)(c) | | | 985,483 | |
| | 196,000 | | | Mexico Government International Bond, 4.000%, 3/15/2115, (EUR)(c) | | | 209,342 | |
| | 1,020,000 | | | Mexico Government International Bond, 4.125%, 1/21/2026(c) | | | 1,010,871 | |
| | 100,000 | | | Sigma Alimentos S.A. de CV, 2.625%, 2/07/2024, 144A, (EUR) | | | 120,670 | |
| | 835,000 | | | Sigma Alimentos, S.A. de C.V, 4.125%, 5/02/2026 | | | 801,183 | |
| | 1,010,000 | | | Unifin Financiera SAB de CV SOFOM ENR, 7.250%, 9/27/2023 | | | 997,385 | |
| | | | | | | | |
| | | | | | | 11,104,395 | |
| | | | | | | | |
| | | | Netherlands — 0.1% | |
| | 870,000 | | | Cooperatieve Rabobank UA, 4.375%, 8/04/2025(c) | | | 860,343 | |
| | 675,000 | | | ING Bank NV, 1.650%, 8/15/2019, 144A(c) | | | 667,593 | |
| | 1,105,000 | | | Ziggo BV, 5.500%, 1/15/2027, 144A | | | 1,036,766 | |
| | | | | | | | |
| | | | | | | 2,564,702 | |
| | | | | | | | |
| | | | Norway — 0.2% | | | | |
| | 17,000,000 | | | City of Oslo, Norway, 3.550%, 2/12/2021, (NOK)(c) | | | 2,177,554 | |
| | 550,000 | | | Kommunalbanken AS, 1.750%, 9/15/2020, 144A(c) | | | 537,378 | |
| | 13,760,000 | | | Norway Government Bond, 4.500%, 5/22/2019, 144A, (NOK)(c) | | | 1,730,259 | |
| | 3,815,000 | | | Norway Government Bond, Series 475, 2.000%, 5/24/2023, 144A, (NOK)(c) | | | 478,407 | |
| | | | | | | | |
| | | | | | | 4,923,598 | |
| | | | | | | | |
| | | | Panama — 0.0% | | | | |
| | 680,000 | | | Banco Latinoamericano de Comercio Exterior S.A., 3.250%, 5/07/2020, 144A(c) | | | 674,166 | |
| | | | | | | | |
| | | | Paraguay — 0.1% | | | | |
| | 800,000 | | | Republic of Paraguay, 5.000%, 4/15/2026, 144A | | | 811,000 | |
| | 572,000 | | | Telefonica Celular del Paraguay S.A., 6.750%, 12/13/2022 | | | 583,806 | |
| | | | | | | | |
| | | | | | | 1,394,806 | |
| | | | | | | | |
| | | | Peru — 0.1% | | | | |
| | 580,000 | | | Southern Copper Corp., 3.875%, 4/23/2025(c) | | | 564,203 | |
| | 1,050,000 | | | Transportadora de Gas del Peru S.A., 4.250%, 4/30/2028, 144A(c) | | | 1,030,313 | |
| | 1,050,000 | | | Union Andina de Cementos SAA, 5.875%, 10/30/2021, 144A | | | 1,074,937 | |
| | | | | | | | |
| | | | | | | 2,669,453 | |
| | | | | | | | |
| | | | Poland — 0.1% | | | | |
| | 5,380,000 | | | Republic of Poland Government Bond, Series 0726, 2.500%, 7/25/2026, (PLN)(c) | | | 1,396,512 | |
| | | | | | | | |
| | | | Portugal — 0.0% | | | | |
| | 400,000 | | | EDP Finance BV, 4.125%, 1/15/2020, 144A | | | 402,032 | |
| | | | | | | | |
| | | | Senegal — 0.0% | | | | |
| | 625,000 | | | Republic of Senegal, 4.750%, 3/13/2028, 144A, (EUR) | | | 700,694 | |
| | | | | | | | |
| | | | Singapore — 0.2% | | | | |
| | 785,000 | | | BOC Aviation Ltd., 2.750%, 9/18/2022, 144A | | | 745,066 | |
| | 495,000 | | | BOC Aviation Ltd., 3.000%, 3/30/2020(c) | | | 489,765 | |
See accompanying notes to financial statements.
29 |
Portfolio of Investments – as of September 30, 2018
Loomis Sayles Global Allocation Fund – (continued)
| | | | | | | | |
Principal
Amount (‡) | | | Description | | Value (†) | |
| | | | Singapore — (continued) | |
| $ | 345,000 | | | DBS Group Holdings Ltd., (fixed rate to 12/11/2023, variable rate thereafter), 4.520%, 12/11/2028, 144A | | $ | 349,192 | |
| | 3,215,000 | | | United Overseas Bank Ltd., 3.200%, 4/23/2021, 144A(c) | | | 3,193,877 | |
| | | | | | | | |
| | | | | | | 4,777,900 | |
| | | | | | | | |
| | | | South Africa — 0.3% | | | | |
| | 930,000 | | | MTN (Mauritius) Investments Ltd., 4.755%, 11/11/2024, 144A | | | 841,120 | |
| | 500,000 | | | Myriad International Holdings BV, 6.000%, 7/18/2020, 144A | | | 519,135 | |
| | 113,940,000 | | | South Africa Government International Bond, Series R213, 7.000%, 2/28/2031, (ZAR)(c) | | | 6,606,163 | |
| | | | | | | | |
| | | | | | | 7,966,418 | |
| | | | | | | | |
| | | | Spain — 0.3% | | | | |
| | 400,000 | | | Banco Santander S.A., 3.125%, 2/23/2023 | | | 379,625 | |
| | 700,000 | | | Gas Natural Fenosa Finance BV, EMTN, 1.500%, 1/29/2028, (EUR) | | | 794,597 | |
| | 100,000 | | | Iberdrola International BV, EMTN, 0.375%, 9/15/2025, (EUR) | | | 110,374 | |
| | 725,000 | | | Spain Government International Bond, 0.750%, 7/30/2021, (EUR)(c) | | | 858,597 | |
| | 430,000 | | | Spain Government International Bond, 1.600%, 4/30/2025, 144A, (EUR)(c) | | | 521,677 | |
| | 760,000 | | | Spain Government International Bond, 4.300%, 10/31/2019, 144A, (EUR)(c) | | | 926,342 | |
| | 2,565,000 | | | Spain Government International Bond, 4.400%, 10/31/2023, 144A, (EUR)(c) | | | 3,541,731 | |
| | | | | | | | |
| | | | | | | 7,132,943 | |
| | | | | | | | |
| | | | Supranationals — 0.1% | | | | |
| | 1,115,000 | | | Corporacion Andina de Fomento, 4.375%, 6/15/2022(c) | | | 1,144,035 | |
| | 1,140,000 | | | International Bank for Reconstruction & Development, 2.500%, 3/12/2020, (AUD)(c) | | | 827,386 | |
| | 70,000,000 | | | International Finance Corp., Series GDIF, MTN, 7.800%, 6/03/2019, (INR)(c) | | | 963,816 | |
| | | | | | | | |
| | | | | | | 2,935,237 | |
| | | | | | | | |
| | | | Sweden — 0.0% | | | | |
| | 2,450,000 | | | Sweden Government Bond, 5.000%, 12/01/2020, (SEK)(c) | | | 308,432 | |
| | | | | | | | |
| | | | Switzerland — 0.1% | | | | |
| | 1,075,000 | | | Glencore Finance Canada Ltd., 5.550%, 10/25/2042, 144A(c) | | | 1,060,498 | |
| | 900,000 | | | Syngenta Finance NV, EMTN, 1.250%, 9/10/2027, (EUR) | | | 913,625 | |
| | | | | | | | |
| | | | | | | 1,974,123 | |
| | | | | | | | |
| | | | Thailand — 0.2% | | | | |
| | 1,570,000 | | | Kasikornbank PCL, EMTN, 3.256%, 7/12/2023 | | | 1,513,522 | |
| | 1,010,000 | | | Siam Commercial Bank PCL, 3.500%, 4/07/2019, 144A(c) | | | 1,009,805 | |
| | 85,000,000 | | | Thailand Government Bond, 2.125%, 12/17/2026, (THB) | | | 2,524,482 | |
| | 950,000 | | | Thaioil Treasury Center Co. Ltd., 3.625%, 1/23/2023, 144A | | | 927,076 | |
| | | | | | | | |
| | | | | | | 5,974,885 | |
| | | | | | | | |
| | | | Trinidad — 0.0% | | | | |
| | 415,000 | | | Trinidad Generation UnLtd., 5.250%, 11/04/2027, 144A | | | 402,031 | |
| | | | | | | | |
| | | | Turkey — 0.1% | | | | |
| | 1,775,000 | | | Turkey Government International Bond, 6.125%, 10/24/2028 | | | 1,602,186 | |
| | | | | | | | |
See accompanying notes to financial statements.
| 30
Portfolio of Investments – as of September 30, 2018
Loomis Sayles Global Allocation Fund – (continued)
| | | | | | | | |
Principal
Amount (‡) | | | Description | | Value (†) | |
| | | | United Arab Emirates — 0.2% | | | | |
| $ | 1,610,000 | | | Abu Dhabi Crude Oil Pipeline LLC, 3.650%, 11/02/2029(c) | | $ | 1,525,861 | |
| | 1,275,000 | | | DP World Crescent Ltd., 4.848%, 9/26/2028, 144A | | | 1,257,482 | |
| | 850,000 | | | DP World Ltd., 3.250%, 5/18/2020, 144A(c) | | | 843,540 | |
| | 200,000 | | | DP World Ltd., MTN, 3.250%, 5/18/2020 | | | 198,480 | |
| | | | | | | | |
| | | | | | | 3,825,363 | |
| | | | | | | | |
| | | | United Kingdom — 0.4% | | | | |
| | 95,000 | | | Avon Products, Inc., 8.950%, 3/15/2043 | | | 85,025 | |
| | 585,000 | | | BP Capital Markets PLC, 3.216%, 11/28/2023(c) | | | 573,932 | |
| | 445,000 | | | FCE Bank PLC, EMTN, 1.615%, 5/11/2023, (EUR) | | | 517,421 | |
| | 300,000 | | | HSBC Holdings PLC, 4.375%, 11/23/2026(c) | | | 294,855 | |
| | 565,000 | | | HSBC Holdings PLC, (fixed rate to 6/01/2021, variable rate thereafter), 6.875%(d) | | | 584,775 | |
| | 295,000 | | | HSBC Holdings PLC, EMTN, 5.750%, 12/20/2027, (GBP)(c) | | | 451,247 | |
| | 150,000 | | | Imperial Brands Finance PLC, EMTN, 6.250%, 12/04/2018, (GBP) | | | 197,168 | |
| | 635,000 | | | Lloyds Banking Group PLC, 4.050%, 8/16/2023 | | | 630,817 | |
| | 400,000 | | | Lloyds Banking Group PLC, 4.500%, 11/04/2024(c) | | | 392,911 | |
| | 1,020,000 | | | Lloyds Banking Group PLC, (fixed rate to 6/27/2024, variable rate thereafter), 7.500%(d) | | | 1,051,875 | |
| | 1,130,000 | | | Royal Bank of Scotland Group PLC, 6.000%, 12/19/2023(c) | | | 1,175,561 | |
| | 950,000 | | | Royal Bank of Scotland Group PLC, (fixed rate to 8/10/2020, variable rate thereafter), 7.500%(d) | | | 971,099 | |
| | 350,000 | | | Santander UK Group Holdings PLC, 4.750%, 9/15/2025, 144A(c) | | | 341,151 | |
| | 250,000 | | | Standard Chartered PLC, EMTN, 3.125%, 11/19/2024, (EUR) | | | 308,679 | |
| | 500,000 | | | United Kingdom Gilt, 1.750%, 7/22/2019, (GBP) | | | 656,653 | |
| | 130,000 | | | Virgin Media Finance PLC, 4.500%, 1/15/2025, 144A, (EUR) | | | 154,321 | |
| | 115,000 | | | Virgin Media Secured Finance PLC, 4.875%, 1/15/2027, (GBP) | | | 147,334 | |
| | 1,660,000 | | | Vodafone Group PLC, 4.375%, 5/30/2028 | | | 1,635,477 | |
| | | | | | | | |
| | | | | | | 10,170,301 | |
| | | | | | | | |
| | | | United States — 12.9% | | | | |
| | 15,000 | | | 21st Century Fox America, Inc., 6.400%, 12/15/2035 | | | 19,117 | |
| | 9,890,000 | | | AbbVie, Inc., 2.500%, 5/14/2020 | | | 9,779,161 | |
| | 1,745,000 | | | AES Corp. (The), 4.875%, 5/15/2023 | | | 1,760,269 | |
| | 480,000 | | | Allison Transmission, Inc., 4.750%, 10/01/2027, 144A | | | 453,000 | |
| | 8,000,000 | | | Ally Financial, Inc., 4.125%, 2/13/2022 | | | 7,990,000 | |
| | 745,000 | | | Ally Financial, Inc., 5.125%, 9/30/2024 | | | 767,350 | |
| | 129,000 | | | Ally Financial, Inc., 8.000%, 12/31/2018 | | | 130,290 | |
| | 1,728,000 | | | Ally Financial, Inc., 8.000%, 11/01/2031 | | | 2,093,040 | |
| | 149,955 | | | American Airlines Pass Through Certificates, Series 2013-1, Class A, 4.000%, 1/15/2027 | | | 149,129 | |
| | 2,140,427 | | | American Airlines Pass Through Certificates, Series 2016-1, Class B, 5.250%, 7/15/2025 | | | 2,206,099 | |
| | 1,672,664 | | | American Airlines Pass Through Certificates, Series 2016-3, Class B, 3.750%, 4/15/2027 | | | 1,614,756 | |
| | 630,000 | | | American Airlines Pass Through Certificates, Series 2017-2, Class B, 3.700%, 4/15/2027 | | | 607,760 | |
| | 487,013 | | | American Airlines Pass Through Certificates, Series 2017-1B, Class B, 4.950%, 8/15/2026 | | | 490,519 | |
See accompanying notes to financial statements.
31 |
Portfolio of Investments – as of September 30, 2018
Loomis Sayles Global Allocation Fund – (continued)
| | | | | | | | |
Principal
Amount (‡) | | | Description | | Value (†) | |
| | | | United States — continued | | | | |
| $ | 6,190,000 | | | Anadarko Petroleum Corp., 3.450%, 7/15/2024 | | $ | 5,958,593 | |
| | 300,000 | | | Anadarko Petroleum Corp., 4.500%, 7/15/2044 | | | 274,779 | |
| | 400,000 | | | Antero Resources Corp., 5.125%, 12/01/2022 | | | 406,200 | |
| | 175,000 | | | Antero Resources Corp., 5.375%, 11/01/2021 | | | 177,240 | |
| | 3,060,000 | | | Antero Resources Corp., 5.625%, 6/01/2023 | | | 3,132,675 | |
| | 260,000 | | | Aptiv PLC, 1.600%, 9/15/2028, (EUR) | | | 287,372 | |
| | 1,510,000 | | | AT&T, Inc., 3.400%, 5/15/2025 | | | 1,437,624 | |
| | 3,960,000 | | | AT&T, Inc., 4.300%, 2/15/2030, 144A | | | 3,808,321 | |
| | 925,000 | | | Aviation Capital Group LLC, 6.750%, 4/06/2021, 144A | | | 989,072 | |
| | 200,000 | | | Bank of America Corp., 5.490%, 3/15/2019 | | | 202,468 | |
| | 2,700,000 | | | Bank of America Corp., 6.110%, 1/29/2037 | | | 3,105,134 | |
| | 115,000 | | | Bank of America Corp., MTN, 4.250%, 10/22/2026 | | | 113,682 | |
| | 3,000 | | | Beazer Homes USA, Inc., 7.250%, 2/01/2023 | | | 2,955 | |
| | 71,000 | | | California Resources Corp., 5.500%, 9/15/2021 | | | 65,398 | |
| | 10,000 | | | California Resources Corp., 6.000%, 11/15/2024 | | | 8,500 | |
| | 1,870,000 | | | California Resources Corp., 8.000%, 12/15/2022, 144A | | | 1,785,850 | |
| | 60,000 | | | CenturyLink, Inc., 5.625%, 4/01/2025 | | | 58,668 | |
| | 55,000 | | | CenturyLink, Inc., Series G, 6.875%, 1/15/2028 | | | 52,806 | |
| | 370,000 | | | CenturyLink, Inc., Series P, 7.600%, 9/15/2039 | | | 330,225 | |
| | 880,000 | | | CenturyLink, Inc., Series S, 6.450%, 6/15/2021 | | | 913,000 | |
| | 34,000 | | | Chemours Co. (The), 6.625%, 5/15/2023 | | | 35,516 | |
| | 3,210,000 | | | Chesapeake Energy Corp., 4.875%, 4/15/2022 | | | 3,117,712 | |
| | 315,000 | | | Chesapeake Energy Corp., 5.750%, 3/15/2023 | | | 306,731 | |
| | 495,000 | | | Chesapeake Energy Corp., 6.125%, 2/15/2021 | | | 507,375 | |
| | 190,000 | | | Chesapeake Energy Corp., 6.625%, 8/15/2020 | | | 198,550 | |
| | 95,000 | | | Chesapeake Energy Corp., 6.875%, 11/15/2020 | | | 99,513 | |
| | 3,232,000 | | | Chesapeake Energy Corp., 8.000%, 12/15/2022, 144A | | | 3,377,440 | |
| | 4,700,000 | | | Chesapeake Energy Corp., 8.000%, 6/15/2027 | | | 4,794,000 | |
| | 780,000 | | | Chevron Corp., 2.419%, 11/17/2020(c) | | | 770,654 | |
| | 1,635,000 | | | Cimarex Energy Co., 4.375%, 6/01/2024 | | | 1,649,139 | |
| | 525,000 | | | Cincinnati Bell, Inc., 7.000%, 7/15/2024, 144A | | | 481,687 | |
| | 450,000 | | | Cincinnati Bell, Inc., 8.000%, 10/15/2025, 144A | | | 419,625 | |
| | 500,000 | | | Citizens Financial Group, Inc., 4.300%, 12/03/2025 | | | 493,016 | |
| | 2,913,000 | | | Clear Channel Worldwide Holdings, Inc., Series B, 7.625%, 3/15/2020 | | | 2,920,282 | |
| | 390,000 | | | Consolidated Communications, Inc., 6.500%, 10/01/2022 | | | 368,550 | |
| | 265,000 | | | Constellation Brands, Inc., 4.750%, 11/15/2024 | | | 274,370 | |
| | 485,000 | | | Continental Resources, Inc., 3.800%, 6/01/2024 | | | 475,621 | |
| | 640,000 | | | Continental Resources, Inc., 4.500%, 4/15/2023 | | | 651,265 | |
| | 92,000 | | | Continental Resources, Inc., 5.000%, 9/15/2022 | | | 93,334 | |
| | 375,000 | | | Cox Communications, Inc., 4.800%, 2/01/2035, 144A | | | 350,004 | |
| | 395,000 | | | CSC Holdings LLC, 5.375%, 2/01/2028, 144A | | | 376,238 | |
| | 155,000 | | | Cummins, Inc., 5.650%, 3/01/2098 | | | 165,222 | |
| | 475,000 | | | Dell International LLC/EMC Corp., 6.020%, 6/15/2026, 144A | | | 507,695 | |
| | 113,552 | | | Delta Air Lines Pass Through Trust, Series 2007-1, Class B, 8.021%, 2/10/2024(e) | | | 124,748 | |
| | 1,200,000 | | | Devon Energy Corp., 3.250%, 5/15/2022 | | | 1,178,914 | |
| | 50,000 | | | Dillard’s, Inc., 7.000%, 12/01/2028 | | | 52,439 | |
See accompanying notes to financial statements.
| 32
Portfolio of Investments – as of September 30, 2018
Loomis Sayles Global Allocation Fund – (continued)
| | | | | | | | |
Principal
Amount (‡) | | | Description | | Value (†) | |
| | | | United States — continued | | | | |
| $ | 8,000 | | | Dillard’s, Inc., 7.750%, 7/15/2026 | | $ | 8,832 | |
| | 1,680,000 | | | DISH DBS Corp., 5.000%, 3/15/2023 | | | 1,524,600 | |
| | 1,495,000 | | | DISH DBS Corp., 5.875%, 11/15/2024 | | | 1,339,894 | |
| | 310,000 | | | DR Horton, Inc., 4.375%, 9/15/2022 | | | 314,199 | |
| | 340,000 | | | Enable Midstream Partners LP, 5.000%, 5/15/2044 | | | 306,051 | |
| | 235,000 | | | Enbridge Energy Partners LP, 7.375%, 10/15/2045 | | | 310,573 | |
| | 1,075,000 | | | Energy Transfer Partners LP/Regency Energy Finance Corp., 5.000%, 10/01/2022 | | | 1,113,352 | |
| | 600,000 | | | EnLink Midstream Partners LP, 4.150%, 6/01/2025 | | | 568,928 | |
| | 1,310,000 | | | Federal National Mortgage Association, Series 2017-M14, Class A2, 2.974%, 11/25/2027(c)(f) | | | 1,236,399 | |
| | 410,000 | | | FedEx Corp., 1.000%, 1/11/2023, (EUR) | | | 485,056 | |
| | 80,000 | | | Foot Locker, Inc., 8.500%, 1/15/2022 | | | 90,200 | |
| | 40,000 | | | Ford Motor Co., 4.346%, 12/08/2026 | | | 37,646 | |
| | 685,000 | | | Ford Motor Co., 5.291%, 12/08/2046 | | | 610,101 | |
| | 25,000 | | | Ford Motor Co., 6.375%, 2/01/2029 | | | 25,856 | |
| | 50,000 | | | Ford Motor Co., 6.625%, 2/15/2028 | | | 52,787 | |
| | 2,105,000 | | | Ford Motor Co., 6.625%, 10/01/2028 | | | 2,221,116 | |
| | 5,000 | | | Ford Motor Co., 7.500%, 8/01/2026 | | | 5,673 | |
| | 5,000,000 | | | Ford Motor Credit Co. LLC, 2.459%, 3/27/2020 | | | 4,916,013 | |
| | 770,000 | | | Ford Motor Credit Co. LLC, 3.470%, 4/05/2021 | | | 760,600 | |
| | 1,600,000 | | | Ford Motor Credit Co. LLC, 3.588%, 6/02/2020, (AUD)(c) | | | 1,166,495 | |
| | 865,000 | | | Frontier Communications Corp., 6.875%, 1/15/2025 | | | 525,773 | |
| | 560,000 | | | Frontier Communications Corp., 11.000%, 9/15/2025 | | | 436,638 | |
| | 131,000 | | | Gates Global LLC/Gates Global Co., 6.000%, 7/15/2022, 144A | | | 131,819 | |
| | 50,000 | | | General Electric Co., GMTN, 3.100%, 1/09/2023 | | | 48,966 | |
| | 740,000 | | | General Electric Co., Series D, (fixed rate to 1/21/2021, variable rate thereafter), 5.000%(c)(d) | | | 720,945 | |
| | 310,000 | | | General Motors Co., 5.200%, 4/01/2045 | | | 281,620 | |
| | 240,000 | | | General Motors Financial Co., Inc., 3.450%, 4/10/2022 | | | 236,043 | |
| | 925,000 | | | General Motors Financial Co., Inc., 5.250%, 3/01/2026 | | | 947,862 | |
| | 100,000 | | | General Motors Financial Co., Inc., EMTN, 0.955%, 9/07/2023, (EUR) | | | 113,703 | |
| | 3,435,000 | | | Georgia-Pacific LLC, 7.250%, 6/01/2028 | | | 4,285,082 | |
| | 105,000 | | | Georgia-Pacific LLC, 7.375%, 12/01/2025 | | | 125,439 | |
| | 180,000 | | | Georgia-Pacific LLC, 7.750%, 11/15/2029 | | | 236,616 | |
| | 315,000 | | | Georgia-Pacific LLC, 8.875%, 5/15/2031 | | | 457,956 | |
| | 905,000 | | | Global Atlantic Fin Co., 8.625%, 4/15/2021, 144A | | | 1,000,821 | |
| | 2,295,000 | | | Goldman Sachs Group, Inc. (The), 6.750%, 10/01/2037 | | | 2,760,782 | |
| | 1,935,000 | | | Goodyear Tire & Rubber Co. (The), 4.875%, 3/15/2027 | | | 1,777,781 | |
| | 165,000 | | | Goodyear Tire & Rubber Co. (The), 7.000%, 3/15/2028 | | | 171,600 | |
| | 4,627 | | | GS Mortgage Securities Trust, Series 2007-GG10, Class AM, 5.977%, 8/10/2045(f) | | | 4,688 | |
| | 1,000,000 | | | HCA Healthcare, Inc., 6.250%, 2/15/2021 | | | 1,042,500 | |
| | 20,000 | | | HCA, Inc., 4.750%, 5/01/2023 | | | 20,350 | |
| | 6,670,000 | | | HCA, Inc., 5.375%, 9/01/2026 | | | 6,736,700 | |
| | 225,000 | | | HCA, Inc., 7.050%, 12/01/2027 | | | 241,313 | |
| | 820,000 | | | HCA, Inc., 7.500%, 11/06/2033 | | | 888,782 | |
See accompanying notes to financial statements.
33 |
Portfolio of Investments – as of September 30, 2018
Loomis Sayles Global Allocation Fund – (continued)
| | | | | | | | |
Principal
Amount (‡) | | | Description | | Value (†) | |
| | | | United States — continued | | | | |
| $ | 395,000 | | | HCA, Inc., 8.360%, 4/15/2024 | | $ | 449,312 | |
| | 195,000 | | | HCA, Inc., MTN, 7.580%, 9/15/2025 | | | 216,938 | |
| | 75,000 | | | HCA, Inc., MTN, 7.750%, 7/15/2036 | | | 81,750 | |
| | 855,000 | | | Hecla Mining Co., 6.875%, 5/01/2021 | | | 857,137 | |
| | 490,000 | | | Hewlett Packard Enterprise Co., 6.350%, 10/15/2045 | | | 503,539 | |
| | 310,000 | | | Hexion, Inc., 7.875%, 2/15/2023(g)(h) | | | 248,000 | |
| | 485,000 | | | Huntington Ingalls Industries, Inc., 5.000%, 11/15/2025, 144A | | | 502,363 | |
| | 1,585,000 | | | Hyundai Capital America, 2.750%, 9/27/2026, 144A(c) | | | 1,387,794 | |
| | 450,000 | | | International Lease Finance Corp., 4.625%, 4/15/2021 | | | 459,116 | |
| | 1,250,000 | | | International Lease Finance Corp., 6.250%, 5/15/2019 | | | 1,274,313 | |
| | 745,000 | | | INVISTA Finance LLC, 4.250%, 10/15/2019, 144A | | | 744,069 | |
| | 2,233,000 | | | iStar, Inc., 5.000%, 7/01/2019 | | | 2,236,740 | |
| | 48,000 | | | J.C. Penney Corp., Inc., 6.375%, 10/15/2036 | | | 19,200 | |
| | 5,000 | | | J.C. Penney Corp., Inc., 7.625%, 3/01/2097 | | | 1,900 | |
| | 1,070,000 | | | Jefferies Group LLC, 6.250%, 1/15/2036 | | | 1,082,282 | |
| | 7,760,000 | | | Jeld-Wen, Inc., 4.625%, 12/15/2025, 144A | | | 7,158,600 | |
| | 15,000 | | | K. Hovnanian Enterprises, Inc., 5.000%, 11/01/2021 | | | 13,401 | |
| | 1,665,000 | | | KB Home, 8.000%, 3/15/2020 | | | 1,760,904 | |
| | 330,000 | | | Level 3 Financing, Inc., 5.125%, 5/01/2023 | | | 331,650 | |
| | 760,000 | | | Level 3 Financing, Inc., 5.375%, 5/01/2025 | | | 758,092 | |
| | 140,000 | | | Level 3 Parent LLC, 5.750%, 12/01/2022 | | | 141,603 | |
| | 20,000 | | | Macy’s Retail Holdings, Inc., 4.500%, 12/15/2034 | | | 16,437 | |
| | 44,000 | | | Masco Corp., 6.500%, 8/15/2032 | | | 48,225 | |
| | 403,000 | | | Masco Corp., 7.750%, 8/01/2029 | | | 478,027 | |
| | 254,000 | | | Micron Technology, Inc., 5.500%, 2/01/2025 | | | 262,666 | |
| | 1,430,000 | | | Midas Intermediate Holdco II LLC/Midas Intermediate Holdco II Finance, Inc., 7.875%, 10/01/2022, 144A | | | 1,265,550 | |
| | 220,000 | | | Morgan Stanley, 2.500%, 1/24/2019 | | | 219,875 | |
| | 450,000 | | | Morgan Stanley, 3.950%, 4/23/2027 | | | 431,916 | |
| | 725,000 | | | Morgan Stanley, 5.750%, 1/25/2021 | | | 762,059 | |
| | 3,150,000 | | | Morgan Stanley, MTN, 4.100%, 5/22/2023 | | | 3,169,500 | |
| | 600,000 | | | Morgan Stanley, MTN, 6.250%, 8/09/2026 | | | 674,482 | |
| | 25,000 | | | MPLX LP, 4.500%, 7/15/2023 | | | 25,632 | |
| | 95,000 | | | MPLX LP, 4.875%, 6/01/2025 | | | 98,110 | |
| | 3,890,000 | | | Nationstar Mortgage Holdings, Inc., 9.125%, 7/15/2026, 144A | | | 4,074,775 | |
| | 3,000,000 | | | Navient Corp., 5.000%, 10/26/2020 | | | 3,036,930 | |
| | 95,000 | | | Navient Corp., 5.875%, 10/25/2024 | | | 93,100 | |
| | 1,600(††††) | | | Navient Corp., 6.000%, 12/15/2043 | | | 35,577 | |
| | 935,000 | | | Navient Corp., 6.750%, 6/15/2026 | | | 923,312 | |
| | 750,000 | | | Navient Corp., MTN, 6.125%, 3/25/2024 | | | 750,000 | |
| | 915,000 | | | Navient LLC, 5.500%, 1/25/2023 | | | 912,712 | |
| | 60,000 | | | Navient LLC, MTN, 5.500%, 1/15/2019 | | | 60,300 | |
| | 415,000 | | | Navient LLC, MTN, 7.250%, 1/25/2022 | | | 437,825 | |
| | 3,418,000 | | | Navient LLC, Series A, MTN, 5.625%, 8/01/2033 | | | 2,862,575 | |
| | 4,583,000 | | | New Albertsons LP, 7.450%, 8/01/2029 | | | 3,780,975 | |
| | 525,000 | | | New Albertsons LP, 7.750%, 6/15/2026 | | | 457,926 | |
| | 5,540,000 | | | New Albertsons LP, 8.000%, 5/01/2031 | | | 4,709,000 | |
See accompanying notes to financial statements.
| 34
Portfolio of Investments – as of September 30, 2018
Loomis Sayles Global Allocation Fund – (continued)
| | | | | | | | |
Principal
Amount (‡) | | | Description | | Value (†) | |
| | | | United States — continued | | | | |
| $ | 2,150,000 | | | New Albertsons LP, 8.700%, 5/01/2030 | | $ | 1,897,375 | |
| | 1,309,000 | | | New Albertsons LP, Series C, MTN, 6.625%, 6/01/2028 | | | 991,567 | |
| | 365,000 | | | Newell Brands, Inc., 4.000%, 12/01/2024 | | | 352,831 | |
| | 65,000 | | | Newfield Exploration Co., 5.625%, 7/01/2024 | | | 68,494 | |
| | 900,000 | | | NGL Energy Partners LP/NGL Energy Finance Corp., 6.125%, 3/01/2025 | | | 843,750 | |
| | 55,000 | | | NGL Energy Partners LP/NGL Energy Finance Corp., 6.875%, 10/15/2021 | | | 56,029 | |
| | 405,000 | | | NGL Energy Partners LP/NGL Energy Finance Corp., 7.500%, 11/01/2023 | | | 405,000 | |
| | 20,000 | | | NGPL PipeCo LLC, 7.768%, 12/15/2037, 144A | | | 24,500 | |
| | 540,000 | | | Nissan Motor Acceptance Corp., 2.000%, 3/08/2019, 144A(c) | | | 538,234 | |
| | 1,765,000 | | | Nissan Motor Acceptance Corp., 3.650%, 9/21/2021, 144A | | | 1,769,462 | |
| �� | 120,000 | | | Oasis Petroleum, Inc., 6.875%, 1/15/2023 | | | 122,100 | |
| | 2,275,000 | | | Oceaneering International, Inc., 4.650%, 11/15/2024 | | | 2,206,659 | |
| | 420,000 | | | Old Republic International Corp., 4.875%, 10/01/2024 | | | 432,106 | |
| | 3,693,000 | | | ONEOK Partners LP, 4.900%, 3/15/2025 | | | 3,833,169 | |
| | 25,000 | | | ONEOK Partners LP, 6.200%, 9/15/2043 | | | 28,019 | |
| | 55,000 | | | Outfront Media Capital LLC/Outfront Media Capital Corp., 5.250%, 2/15/2022 | | | 55,688 | |
| | 140,000 | | | Outfront Media Capital LLC/Outfront Media Capital Corp., 5.875%, 3/15/2025 | | | 141,400 | |
| | 310,000 | | | Owens Corning, 7.000%, 12/01/2036 | | | 353,192 | |
| | 2,965,000 | | | Owens-Brockway Glass Container, Inc., 5.375%, 1/15/2025, 144A | | | 2,935,350 | |
| | 585,000 | | | Prologis LP, 2.250%, 6/30/2029, (GBP) | | | 714,117 | |
| | 540,000 | | | PulteGroup, Inc., 6.000%, 2/15/2035 | | | 508,950 | |
| | 785,000 | | | PulteGroup, Inc., 6.375%, 5/15/2033 | | | 753,686 | |
| | 220,000 | | | PulteGroup, Inc., 7.875%, 6/15/2032 | | | 236,775 | |
| | 285,000 | | | QEP Resources, Inc., 5.250%, 5/01/2023 | | | 277,519 | |
| | 210,000 | | | QEP Resources, Inc., 5.375%, 10/01/2022 | | | 210,788 | |
| | 135,000 | | | Quicken Loans, Inc., 5.250%, 1/15/2028, 144A | | | 125,381 | |
| | 120,000 | | | Quicken Loans, Inc., 5.750%, 5/01/2025, 144A | | | 119,850 | |
| | 1,335,000 | | | Qwest Capital Funding, Inc., 6.500%, 11/15/2018 | | | 1,339,272 | |
| | 650,000 | | | Qwest Capital Funding, Inc., 6.875%, 7/15/2028 | | | 602,745 | |
| | 400,000 | | | Qwest Capital Funding, Inc., 7.625%, 8/03/2021 | | | 413,496 | |
| | 45,000 | | | Qwest Capital Funding, Inc., 7.750%, 2/15/2031 | | | 41,794 | |
| | 476,000 | | | Qwest Corp., 6.875%, 9/15/2033 | | | 473,358 | |
| | 115,000 | | | Qwest Corp., 7.250%, 9/15/2025 | | | 124,067 | |
| | 540,000 | | | Radian Group, Inc., 4.500%, 10/01/2024 | | | 530,550 | |
| | 230,000 | | | Range Resources Corp., 4.875%, 5/15/2025 | | | 217,638 | |
| | 850,000 | | | Range Resources Corp., 5.000%, 8/15/2022 | | | 840,437 | |
| | 220,000 | | | Range Resources Corp., 5.000%, 3/15/2023 | | | 215,600 | |
| | 970,000 | | | Santander Holdings USA, Inc., 2.650%, 4/17/2020(c) | | | 957,526 | |
| | 25,000 | | | Sealed Air Corp., 4.875%, 12/01/2022, 144A | | | 25,250 | |
| | 640,000 | | | Sealed Air Corp., 5.500%, 9/15/2025, 144A | | | 649,600 | |
| | 420,000 | | | ServiceMaster Co. LLC (The), 7.450%, 8/15/2027 | | | 441,525 | |
| | 140,000 | | | Silgan Holdings, Inc., 3.250%, 3/15/2025, (EUR) | | | 167,601 | |
| | 2,495,000 | | | Springleaf Finance Corp., 5.250%, 12/15/2019 | | | 2,529,306 | |
| | 1,170,000 | | | Springleaf Finance Corp., 5.625%, 3/15/2023 | | | 1,165,612 | |
| | 860,000 | | | Springleaf Finance Corp., 6.875%, 3/15/2025 | | | 857,850 | |
See accompanying notes to financial statements.
35 |
Portfolio of Investments – as of September 30, 2018
Loomis Sayles Global Allocation Fund – (continued)
| | | | | | | | |
Principal
Amount (‡) | | | Description | | Value (†) | |
| | | | United States — continued | | | | |
| $ | 2,310,000 | | | Springleaf Finance Corp., 7.125%, 3/15/2026 | | $ | 2,298,450 | |
| | 330,000 | | | Springleaf Finance Corp., 7.750%, 10/01/2021 | | | 355,981 | |
| | 130,000 | | | Springleaf Finance Corp., 8.250%, 10/01/2023 | | | 143,325 | |
| | 2,349,000 | | | Sprint Capital Corp., 6.875%, 11/15/2028 | | | 2,360,745 | |
| | 2,240,000 | | | Sprint Capital Corp., 8.750%, 3/15/2032 | | | 2,520,000 | |
| | 1,720,000 | | | Sprint Communications, Inc., 6.000%, 11/15/2022 | | | 1,754,400 | |
| | 120,000 | | | Sprint Corp., 7.125%, 6/15/2024 | | | 124,500 | |
| | 2,840,000 | | | Sprint Corp., 7.875%, 9/15/2023 | | | 3,063,650 | |
| | 1,365,000 | | | Targa Resources Partners LP/Targa Resources Partners Finance Corp., 6.750%, 3/15/2024 | | | 1,440,075 | |
| | 840,000 | | | Tenet Healthcare Corp., 5.125%, 5/01/2025 | | | 827,400 | |
| | 100,000 | | | Tenet Healthcare Corp., 6.750%, 6/15/2023 | | | 99,625 | |
| | 1,405,000 | | | Tenet Healthcare Corp., 6.875%, 11/15/2031 | | | 1,257,756 | |
| | 820,000 | | | Textron, Inc., 5.950%, 9/21/2021 | | | 864,095 | |
| | 90,000 | | | Time Warner Cable LLC, 4.500%, 9/15/2042 | | | 76,805 | |
| | 85,000 | | | Time Warner Cable LLC, 5.500%, 9/01/2041 | | | 81,870 | |
| | 1,680,000 | | | Transcontinental Gas Pipe Line Co. LLC, 7.850%, 2/01/2026 | | | 2,046,395 | |
| | 171,000 | | | TransDigm, Inc., 6.500%, 7/15/2024 | | | 175,190 | |
| | 185,000 | | | TransDigm, Inc., 6.500%, 5/15/2025 | | | 188,469 | |
| | 6,665,000 | | | TRI Pointe Group, Inc., 4.875%, 7/01/2021 | | | 6,665,000 | |
| | 90,000 | | | TRI Pointe Group, Inc./TRI Pointe Homes, Inc., 4.375%, 6/15/2019 | | | 90,450 | |
| | 5,000 | | | TRI Pointe Group, Inc./TRI Pointe Homes, Inc., 5.875%, 6/15/2024 | | | 4,963 | |
| | 656,000 | | | TRU Taj LLC/TRU Taj Finance, Inc., 11.000%, 1/22/2019, 144A | | | 671,875 | |
| | 9,434,874 | | | U.S. Treasury Inflation Indexed Note, 0.125%, 4/15/2022(c)(i) | | | 9,166,324 | |
| | 4,069,290 | | | U.S. Treasury Inflation Indexed Note, 0.375%, 7/15/2027(c)(i) | | | 3,887,444 | |
| | 2,655,000 | | | U.S. Treasury Note, 0.875%, 6/15/2019(c) | | | 2,624,509 | |
| | 4,615,000 | | | U.S. Treasury Note, 1.375%, 4/30/2020(c) | | | 4,514,948 | |
| | 18,115,000 | | | U.S. Treasury Note, 1.500%, 11/30/2019(c) | | | 17,866,626 | |
| | 3,460,000 | | | U.S. Treasury Note, 1.750%, 11/30/2021(c) | | | 3,340,252 | |
| | 8,530,000 | | | U.S. Treasury Note, 2.500%, 6/30/2020(c) | | | 8,486,017 | |
| | 6,555,000 | | | U.S. Treasury Note, 2.750%, 5/31/2023(c) | | | 6,500,972 | |
| | 15,150,000 | | | U.S. Treasury Note, 2.750%, 2/28/2025(c) | | | 14,930,443 | |
| | 6,605,000 | | | U.S. Treasury Note, 2.875%, 5/15/2028(c) | | | 6,505,409 | |
| | 406,800 | | | United Airlines Pass Through Trust, Series 2016-2, Class B, 3.650%, 4/07/2027 | | | 390,031 | |
| | 2,940,000 | | | United Rentals North America, Inc., 5.500%, 7/15/2025 | | | 2,998,800 | |
| | 2,635,000 | | | United Rentals North America, Inc., 5.750%, 11/15/2024 | | | 2,710,888 | |
| | 1,940,000 | | | United States Steel Corp., 6.650%, 6/01/2037 | | | 1,733,875 | |
| | 690,000 | | | United States Steel Corp., 7.375%, 4/01/2020 | | | 721,912 | |
| | 96,787 | | | US Airways Pass Through Trust, Series 2012-1A, Class A, 5.900%, 4/01/2026 | | | 103,562 | |
| | 50,057 | | | US Airways Pass Through Trust, Series 2012-1B, Class B, 8.000%, 4/01/2021 | | | 52,185 | |
| | 363,393 | | | US Airways Pass Through Trust, Series 2012-2A, Class A, 4.625%, 12/03/2026 | | | 371,501 | |
| | 25,000 | | | Viacom, Inc., 4.375%, 3/15/2043 | | | 21,818 | |
| | 395,000 | | | Viacom, Inc., 5.250%, 4/01/2044 | | | 384,735 | |
See accompanying notes to financial statements.
| 36
Portfolio of Investments – as of September 30, 2018
Loomis Sayles Global Allocation Fund – (continued)
| | | | | | | | |
Principal
Amount (‡) | | | Description | | Value (†) | |
| | | | United States — continued | | | | |
| $ | 145,000 | | | Viacom, Inc., 5.850%, 9/01/2043 | | $ | 153,407 | |
| | 1,150,000 | | | Walmart, Inc., 3.700%, 6/26/2028 | | | 1,150,310 | |
| | 60,000 | | | Weyerhaeuser Co., 6.950%, 10/01/2027 | | | 70,353 | |
| | 315,000 | | | Weyerhaeuser Co., 7.375%, 3/15/2032 | | | 398,402 | |
| | 525,000 | | | Whiting Petroleum Corp., 5.750%, 3/15/2021 | | | 538,125 | |
| | 195,000 | | | Whiting Petroleum Corp., 6.250%, 4/01/2023 | | | 201,854 | |
| | 3,052,000 | | | Windstream Services LLC/Windstream Finance Corp., 9.000%, 6/30/2025, 144A | | | 2,357,670 | |
| | 65,000 | | | Windstream Services LLC/Windstream Finance Corp., 10.500%, 6/30/2024, 144A | | | 55,250 | |
| | | | | | | | |
| | | | | | | 316,008,890 | |
| | | | | | | | |
| | | | Uruguay — 0.0% | | | | |
| | 17,410,000 | | | Republic of Uruguay, 9.875%, 6/20/2022, 144A, (UYU) | | | 519,291 | |
| | | | | | | | |
| | | | Total Non-Convertible Bonds
(Identified Cost $568,318,213) | | | 568,252,758 | |
| | | | | | | | |
| | | | | | | | |
| | Convertible Bonds — 0.5% | |
| | | | United States — 0.5% | | | | |
| | 1,450,000 | | | Booking Holdings, Inc., 0.900%, 9/15/2021 | | | 1,720,350 | |
| | 105,000 | | | CalAmp Corp., 1.625%, 5/15/2020 | | | 110,215 | |
| | 60,000 | | | Chesapeake Energy Corp., 5.500%, 9/15/2026 | | | 59,265 | |
| | 545,000 | | | DISH Network Corp., 2.375%, 3/15/2024 | | | 483,052 | |
| | 2,290,000 | | | DISH Network Corp., 3.375%, 8/15/2026 | | | 2,184,124 | |
| | 290,000 | | | Evolent Health, Inc., 2.000%, 12/01/2021 | | | 389,562 | |
| | 1,855,000 | | | iStar, Inc., 3.125%, 9/15/2022, 144A | | | 1,803,312 | |
| | 855,000 | | | KB Home, 1.375%, 2/01/2019 | | | 867,679 | |
| | 2,020,000 | | | Nuance Communications, Inc., 1.000%, 12/15/2035 | | | 1,906,536 | |
| | 240,000 | | | Nuance Communications, Inc., 1.250%, 4/01/2025 | | | 247,867 | |
| | 10,000 | | | Nuance Communications, Inc., 1.500%, 11/01/2035 | | | 10,132 | |
| | 1,660,000 | | | Rovi Corp., 0.500%, 3/01/2020 | | | 1,565,563 | |
| | 40,000 | | | RPM International, Inc., 2.250%, 12/15/2020 | | | 49,248 | |
| | 380,000 | | | SM Energy Co., 1.500%, 7/01/2021 | | | 415,945 | |
| | 250,000 | | | Western Digital Corp., 1.500%, 2/01/2024, 144A | | | 231,343 | |
| | | | | | | | |
| | | | Total Convertible Bonds
(Identified Cost $11,603,824) | | | 12,044,193 | |
| | | | | | | | |
| | | | | | | | |
| | Municipals — 0.0% | | | | |
| | | | United States — 0.0% | | | | |
| | 155,000 | | | State of Illinois, 5.100%, 6/01/2033 | | | 148,761 | |
| | 130,000 | | | Virginia Tobacco Settlement Financing Corp., Series A-1, 6.706%, 6/01/2046 | | | 128,869 | |
| | | | | | | | |
| | | | Total Municipals
(Identified Cost $253,900) | | | 277,630 | |
| | | | | | | | |
| | | | | | | | |
| | | | Total Bonds and Notes
(Identified Cost $580,175,937) | | | 580,574,581 | |
| | | | | | | | |
See accompanying notes to financial statements.
37 |
Portfolio of Investments – as of September 30, 2018
Loomis Sayles Global Allocation Fund – (continued)
| | | | | | | | |
Shares | | | Description | | Value (†) | |
| | Preferred Stocks — 0.1% | |
| | | | United States — 0.1% | |
| | 460 | | | Chesapeake Energy Corp., 5.000% | | $ | 28,350 | |
| | 40 | | | Chesapeake Energy Corp., 5.750% | | | 23,953 | |
| | 736 | | | Chesapeake Energy Corp., 5.750% | | | 463,010 | |
| | 84 | | | Chesapeake Energy Corp., Series A, 5.750% 144A | | | 50,302 | |
| | 38,269 | | | El Paso Energy Capital Trust I, 4.750% | | | 1,798,260 | |
| | | | | | | | |
| | | | Total Preferred Stocks
(Identified Cost $2,255,025) | | | 2,363,875 | |
| | | | | | | | |
| | | | | | | | |
Principal
Amount (‡) | | | | | | |
| | Short-Term Investments — 8.8% | |
| $ | 69,586,967 | | | Tri-Party Repurchase Agreement with Fixed Income Clearing Corporation, dated 9/28/2018 at 1.300% to be repurchased at $69,594,506 on 10/01/2018 collateralized by $8,815,000 Federal Home Loan Mortgage Corp., 3.750% due 3/27/2019 valued at $8,872,597; $62,535,000 U.S. Treasury Bond, 3.125% due 8/15/2044 valued at $62,109,262 including accrued interest (Note 2 of Notes to Financial Statements) | | | 69,586,967 | |
| | 20,000,000 | | | U.S. Treasury Bills, 1.995%-2.008%, 11/08/2018(j)(k) | | | 19,956,300 | |
| | 15,470,000 | | | U.S. Treasury Bills, 2.030%-2.047%, 11/15/2018(j)(k) | | | 15,429,754 | |
| | 55,000,000 | | | U.S. Treasury Bills, 2.060%, 11/29/2018(j) | | | 54,808,680 | |
| | 8,925,000 | | | U.S. Treasury Bills, 2.075%, 10/18/2018(j) | | | 8,916,286 | |
| | 10,000,000 | | | U.S. Treasury Bills, 2.118%, 12/20/2018(j) | | | 9,952,695 | |
| | 1,075,000 | | | U.S. Treasury Bills, 2.140%, 12/27/2018(j) | | | 1,069,408 | |
| | 35,000,000 | | | U.S. Treasury Bills, 2.160%-2.200%, 04/25/2019(j)(k) | | | 34,530,849 | |
| | | | | | | | |
| | | | Total Short-Term Investments
(Identified Cost $214,294,492) | | | 214,250,939 | |
| | | | | | | | |
| | | | | | | | |
| | | | Total Investments — 98.8%
(Identified Cost $1,987,459,575) | | | 2,415,017,520 | |
| | | | Other assets less liabilities — 1.2% | | | 28,664,152 | |
| | | | | | | | |
| | | | Net Assets — 100.0% | | $ | 2,443,681,672 | |
| | | | | | | | |
| | | | | | | | |
| | (‡) | | | Principal Amount stated in U.S. dollars unless otherwise noted. | |
| | (†) | | | See Note 2 of Notes to Financial Statements. | |
| | (††) | | | Amount shown represents units. One unit represents a principal amount of 1,000. | |
| | (†††) | | | Amount shown represents units. One unit represents a principal amount of 100. | |
| | (††††) | | | Amount shown represents units. One unit represents a principal amount of 25. | |
| | (a) | | | Non-income producing security. | |
| | (b) | | | Securities subject to restriction on resale. At September 30, 2018, the restricted securities held by the Fund are as follows: | |
| | | | | | | | | | | | | | |
| | | | | | | | | | | | | | |
| | | Acquisition
Date | | | Acquisition
Cost | | Value | | | % of
Net Assets | |
| Dex Media, Inc. | | | August 12, 2016 | | | $3,266 | | $ | 7,035 | | | | Less than 0.1% | |
See accompanying notes to financial statements.
| 38
Portfolio of Investments – as of September 30, 2018
Loomis Sayles Global Allocation Fund – (continued)
| | | | |
| | (c) | | | Security (or a portion thereof) has been designated to cover the Fund’s obligations under open derivative contracts. |
| | (d) | | | Perpetual bond with no specified maturity date. |
| | (e) | | | Level 3 security. Value has been determined using significant unobservable inputs. See Note 3 of Notes to Financial Statements. |
| | (f) | | | Variable rate security. The interest rate adjusts periodically based on; (i) changes in current interest rates and/or prepayments on underlying pools of assets, if applicable, (ii) reference to a base lending rate plus or minus a margin, and/or (iii) reference to a base lending rate adjusted by a multiplier and/or subject to certain floors or caps. Rate as of September 30, 2018 is disclosed. |
| | (g) | | | Illiquid security. (Unaudited) |
| | (h) | | | Securities classified as fair valued pursuant to the Fund’s pricing policies and procedures. At September 30, 2018, the value of these securities amounted to $248,000 or less than 0.1% of net assets. See Note 2 of Notes to Financial Statements. |
| | (i) | | | Treasury Inflation Protected Security (TIPS). |
| | (j) | | | Interest rate represents discount rate at time of purchase; not a coupon rate. |
| | (k) | | | The Fund’s investment in U.S. Government/Agency securities is comprised of various lots with differing discount rates. These separate investments, which have the same maturity date, have been aggregated for the purpose of presentation in the Portfolio of Investments. |
| | | | |
| | 144A | | | All or a portion of these securities are exempt from registration under Rule 144A of the Securities Act of 1933. These securities may be resold in transactions exempt from registration, normally to qualified institutional buyers. At September 30, 2018, the value of Rule 144A holdings amounted to $118,389,594 or 4.8% of net assets. |
| | ADR | | | An American Depositary Receipt is a certificate issued by a custodian bank representing the right to receive securities of the foreign issuer described. The values of ADRs may be significantly influenced by trading on exchanges not located in the United States. |
| | EMTN | | | Euro Medium Term Note |
| | GMTN | | | Global Medium Term Note |
| | MTN | | | Medium Term Note |
| | | | |
| | ARS | | | Argentine Peso |
| | AUD | | | Australian Dollar |
| | BRL | | | Brazilian Real |
| | CAD | | | Canadian Dollar |
| | CLP | | | Chilean Peso |
| | COP | | | Colombian Peso |
| | EUR | | | Euro |
| | GBP | | | British Pound |
| | IDR | | | Indonesian Rupiah |
| | INR | | | Indian Rupee |
| | JPY | | | Japanese Yen |
| | KRW | | | South Korean Won |
| | MXN | | | Mexican Peso |
| | NOK | | | Norwegian Krone |
| | PLN | | | Polish Zloty |
| | SEK | | | Swedish Krona |
| | THB | | | Thai Baht |
| | UYU | | | Uruguayan Peso |
| | ZAR | | | South African Rand |
See accompanying notes to financial statements.
39 |
Portfolio of Investments – as of September 30, 2018
Loomis Sayles Global Allocation Fund – (continued)
At September 30, 2018, the Fund had the following open forward foreign currency contracts:
| | | | | | | | | | | | | | | | | | | | | | | | | | |
| Counterparty | | Delivery
Date | | | Currency
Bought/
Sold (B/S) | | Units
of
Currency | | | In Exchange
for
| | | Notional
Value | | | Unrealized
Appreciation
(Depreciation) | |
| Bank of America, N.A. | | | 10/09/2018 | | | ARS | | | S | | | | 22,765,000 | | | $ | 748,848 | | | $ | 546,117 | | | $ | 202,731 | |
| Bank of America, N.A. | | | 12/04/2018 | | | BRL | | | B | | | | 7,285,000 | | | | 1,748,806 | | | | 1,794,847 | | | | 46,041 | |
| Bank of America, N.A. | | | 12/04/2018 | | | BRL | | | S | | | | 18,850,000 | | | | 4,519,192 | | | | 4,644,183 | | | | (124,991 | ) |
| Credit Suisse International | | | 12/19/2018 | | | CAD | | | B | | | | 4,605,000 | | | | 3,541,218 | | | | 3,571,209 | | | | 29,991 | |
| Credit Suisse International | | | 12/19/2018 | | | CAD | | | S | | | | 52,245,000 | | | | 40,232,408 | | | | 40,516,353 | | | | (283,945 | ) |
| Credit Suisse International | | | 12/19/2018 | | | COP | | | S | | | | 2,593,255,000 | | | | 834,193 | | | | 873,911 | | | | (39,718 | ) |
| Credit Suisse International | | | 12/19/2018 | | | GBP | | | B | | | | 5,230,000 | | | | 6,842,984 | | | | 6,842,369 | | | | (615 | ) |
| Credit Suisse International | | | 12/19/2018 | | | IDR | | | B | | | | 52,301,300,000 | | | | 3,458,067 | | | | 3,475,223 | | | | 17,156 | |
| Credit Suisse International | | | 12/19/2018 | | | IDR | | | S | | | | 100,991,415,000 | | | | 6,616,747 | | | | 6,710,497 | | | | (93,750 | ) |
| Credit Suisse International | | | 12/19/2018 | | | JPY | | | B | | | | 7,275,500,000 | | | | 65,761,882 | | | | 64,430,428 | | | | (1,331,454 | ) |
| Goldman Sachs & Co. | | | 12/19/2018 | | | MXN | | | B | | | | 66,055,000 | | | | 3,421,556 | | | | 3,487,390 | | | | 65,834 | |
| HSBC Bank USA | | | 12/19/2018 | | | AUD | | | B | | | | 905,000 | | | | 642,668 | | | | 654,567 | | | | 11,899 | |
| Morgan Stanley Capital Services, Inc. | | | 12/19/2018 | | | EUR | | | B | | | | 49,825,000 | | | | 58,224,000 | | | | 58,228,497 | | | | 4,497 | |
| UBS AG | | | 12/19/2018 | | | NOK | | | S | | | | 4,200,000 | | | | 502,086 | | | | 517,779 | | | | (15,693 | ) |
| UBS AG | | | 12/19/2018 | | | SEK | | | B | | | | 7,350,000 | | | | 817,713 | | | | 832,673 | | | | 14,960 | |
| UBS AG | | | 12/19/2018 | | | THB | | | S | | | | 83,000,000 | | | | 2,539,003 | | | | 2,572,883 | | | | (33,880 | ) |
| UBS AG | | | 12/19/2018 | | | ZAR | | | B | | | | 26,115,000 | | | | 1,757,698 | | | | 1,827,786 | | | | 70,088 | |
| UBS AG | | | 12/19/2018 | | | ZAR | | | S | | | | 42,125,000 | | | | 2,816,078 | | | | 2,948,325 | | | | (132,247 | ) |
| | | | | | | | | | | | | | | | | | | | | | | | | | |
| Total | | | $ | (1,593,096 | ) |
| | | | | | | | | | | | | | | | | | | | | | | | | | |
At September 30, 2018, the Fund had the following open forward cross currency contracts:
| | | | | | | | | | | | | | | | | | | | | | | | | | |
| Counterparty | | Settlement Date | | | Deliver/Units
of Currency | | | Receive/Units
of Currency | | | Notional
Value | | | Unrealized
Appreciation
(Depreciation) | |
| Credit Suisse International | | | 12/19/2018 | | | NOK | | | 14,180,000 | | | | EUR | | | | 1,443,139 | | | $ | 1,686,540 | | | $ | (61,581 | ) |
| | | | | | | | | | | | | | | | | | | | | | | | | | |
See accompanying notes to financial statements.
| 40
Portfolio of Investments – as of September 30, 2018
Loomis Sayles Global Allocation Fund – (continued)
Industry Summary at September 30, 2018
| | | | |
Treasuries | | | 7.4 | % |
Capital Markets | | | 7.1 | |
Internet & Direct Marketing Retail | | | 5.8 | |
Insurance | | | 5.3 | |
Interactive Media & Services | | | 4.7 | |
Chemicals | | | 4.4 | |
IT Services | | | 4.2 | |
Aerospace & Defense | | | 3.8 | |
Food Products | | | 3.8 | |
Industrial Conglomerates | | | 3.0 | |
Health Care Equipment & Supplies | | | 2.6 | |
Software | | | 2.4 | |
Machinery | | | 2.3 | |
Hotels, Restaurants & Leisure | | | 2.3 | |
Health Care Providers & Services | | | 2.2 | |
Banks | | | 2.2 | |
Other Investments, less than 2% each | | | 26.5 | |
Short-Term Investments | | | 8.8 | |
| | | | |
Total Investments | | | 98.8 | |
Other assets less liabilities (including forward foreign currency contracts) | | | 1.2 | |
| | | | |
Net Assets | | | 100.0 | % |
| | | | |
Currency Exposure Summary at September 30, 2018
| | | | |
United States Dollar | | | 73.0 | % |
Swiss Franc | | | 6.5 | |
British Pound | | | 4.7 | |
Canadian Dollar | | | 3.5 | |
Hong Kong Dollar | | | 2.8 | |
Euro | | | 2.6 | |
Swedish Krona | | | 2.0 | |
Other, less than 2% each | | | 3.7 | |
| | | | |
Total Investments | | | 98.8 | |
Other assets less liabilities (including forward foreign currency contracts) | | | 1.2 | |
| | | | |
Net Assets | | | 100.0 | % |
| | | | |
See accompanying notes to financial statements.
41 |
Portfolio of Investments – as of September 30, 2018
Loomis Sayles Growth Fund
| | | | | | | | |
| Shares | | | Description | | Value (†) | |
| | Common Stocks — 98.4% of Net Assets | | | | |
| | | | Air Freight & Logistics — 4.1% | | | | |
| | 3,620,357 | | | Expeditors International of Washington, Inc. | | $ | 266,204,850 | |
| | 836,386 | | | United Parcel Service, Inc., Class B | | | 97,648,066 | |
| | | | | | | | |
| | | | | | | 363,852,916 | |
| | | | | | | | |
| | | | Beverages — 6.1% | | | | |
| | 4,822,051 | | | Coca-Cola Co. (The) | | | 222,730,536 | |
| | 5,378,625 | | | Monster Beverage Corp.(a) | | | 313,466,265 | |
| | | | | | | | |
| | | | | | | 536,196,801 | |
| | | | | | | | |
| | | | Biotechnology — 5.5% | | | | |
| | 835,189 | | | Amgen, Inc. | | | 173,126,328 | |
| | 775,954 | | | Regeneron Pharmaceuticals, Inc.(a) | | | 313,516,454 | |
| | | | | | | | |
| | | | | | | 486,642,782 | |
| | | | | | | | |
| | | | Capital Markets — 4.4% | | | | |
| | 720,212 | | | FactSet Research Systems, Inc. | | | 161,118,626 | |
| | 3,746,716 | | | SEI Investments Co. | | | 228,924,348 | |
| | | | | | | | |
| | | | | | | 390,042,974 | |
| | | | | | | | |
| | | | Communications Equipment — 3.0% | | | | |
| | 5,401,854 | | | Cisco Systems, Inc. | | | 262,800,197 | |
| | | | | | | | |
| | | | Consumer Finance — 1.2% | | | | |
| | 984,244 | | | American Express Co. | | | 104,812,144 | |
| | | | | | | | |
| | | | Energy Equipment & Services — 2.5% | | | | |
| | 3,675,383 | | | Schlumberger Ltd. | | | 223,904,332 | |
| | | | | | | | |
| | | | Food Products — 2.9% | | | | |
| | 16,488,325 | | | Danone S.A., Sponsored ADR | | | 254,991,946 | |
| | | | | | | | |
| | | | Health Care Equipment & Supplies — 1.6% | | | | |
| | 1,301,597 | | | Varian Medical Systems, Inc.(a) | | | 145,687,752 | |
| | | | | | | | |
| | | | Health Care Technology — 2.2% | | | | |
| | 3,047,927 | | | Cerner Corp.(a) | | | 196,316,978 | |
| | | | | | | | |
| | | | Hotels, Restaurants & Leisure — 5.7% | | | | |
| | 4,038,599 | | | Starbucks Corp. | | | 229,553,967 | |
| | 3,179,037 | | | Yum China Holdings, Inc. | | | 111,615,989 | |
| | 1,766,803 | | | Yum! Brands, Inc. | | | 160,620,061 | |
| | | | | | | | |
| | | | | | | 501,790,017 | |
| | | | | | | | |
| | | | Household Products — 4.6% | | | | |
| | 2,613,864 | | | Colgate-Palmolive Co. | | | 174,998,195 | |
| | 2,760,214 | | | Procter & Gamble Co. (The) | | | 229,732,611 | |
| | | | | | | | |
| | | | | | | 404,730,806 | |
| | | | | | | | |
| | | | Interactive Media & Services — 10.2% | | | | |
| | 194,559 | | | Alphabet, Inc., Class A(a) | | | 234,848,278 | |
| | 194,290 | | | Alphabet, Inc., Class C(a) | | | 231,879,286 | |
| | 2,648,309 | | | Facebook, Inc., Class A(a) | | | 435,540,898 | |
| | | | | | | | |
| | | | | | | 902,268,462 | |
| | | | | | | | |
See accompanying notes to financial statements.
| 42
Portfolio of Investments – as of September 30, 2018
Loomis Sayles Growth Fund – (continued)
| | | | | | | | |
| Shares | | | Description | | Value (†) | |
| | | | Internet & Direct Marketing Retail — 12.4% | | | | |
| | 2,494,077 | | | Alibaba Group Holding Ltd., Sponsored ADR(a) | | $ | 410,924,127 | |
| | 340,000 | | | Amazon.com, Inc.(a) | | | 681,020,000 | |
| | | | | | | | |
| | | | | | | 1,091,944,127 | |
| | | | | | | | |
| | | | IT Services — 7.0% | | | | |
| | 621,048 | | | Automatic Data Processing, Inc. | | | 93,567,092 | |
| | 3,514,774 | | | Visa, Inc., Class A | | | 527,532,429 | |
| | | | | | | | |
| | | | | | | 621,099,521 | |
| | | | | | | | |
| | | | Machinery — 2.7% | | | | |
| | 1,560,189 | | | Deere & Co. | | | 234,543,212 | |
| | | | | | | | |
| | | | Pharmaceuticals — 5.7% | | | | |
| | 1,454,810 | | | Merck & Co., Inc. | | | 103,204,222 | |
| | 1,765,158 | | | Novartis AG, Sponsored ADR | | | 152,086,013 | |
| | 5,198,936 | | | Novo Nordisk AS, Sponsored ADR | | | 245,077,843 | |
| | | | | | | | |
| | | | | | | 500,368,078 | |
| | | | | | | | |
| | | | Semiconductors & Semiconductor Equipment — 3.3% | | | | |
| | 4,114,537 | | | QUALCOMM, Inc. | | | 296,370,100 | |
| | | | | | | | |
| | | | Software — 13.3% | | | | |
| | 2,561,037 | | | Autodesk, Inc.(a) | | | 399,803,486 | |
| | 2,778,159 | | | Microsoft Corp. | | | 317,738,045 | |
| | 8,849,897 | | | Oracle Corp. | | | 456,300,689 | |
| | | | | | | | |
| | | | | | | 1,173,842,220 | |
| | | | | | | | |
| | | | Total Common Stocks
(Identified Cost $6,304,109,536) | | �� | 8,692,205,365 | |
| | | | | | | | |
| | | | | | | | |
Principal
Amount | | | | | | |
| | Short-Term Investments — 1.4% | | | | |
| $ | 129,834,440 | | | Tri-Party Repurchase Agreement with Fixed Income Clearing Corporation, dated 9/28/2018 at 1.300% to be repurchased at $129,848,505 on 10/01/2018 collateralized by $133,340,000 U.S. Treasury Bond, 3.125% due 8/15/2044 valued at $132,432,221 including accrued interest (Note 2 of Notes to Financial Statements) (Identified Cost $129,834,440) | | | 129,834,440 | |
| | | | | | | | |
| | | | | | | | |
| | | | Total Investments — 99.8%
(Identified Cost $6,433,943,976) | | | 8,822,039,805 | |
| | | | Other assets less liabilities — 0.2% | | | 14,138,815 | |
| | | | | | | | |
| | | | Net Assets — 100.0% | | $ | 8,836,178,620 | |
| | | | | | | | |
| | | | | | | | |
| | (†) | | | See Note 2 of Notes to Financial Statements. | |
| | (a) | | | Non-income producing security. | |
| | | | | | | | |
| | ADR | | | An American Depositary Receipt is a certificate issued by a custodian bank representing the right to receive securities of the foreign issuer described. The values of ADRs may be significantly influenced by trading on exchanges not located in the United States. | |
See accompanying notes to financial statements.
43 |
Portfolio of Investments – as of September 30, 2018
Loomis Sayles Growth Fund – (continued)
Industry Summary at September 30, 2018
| | | | |
Software | | | 13.3 | % |
Internet & Direct Marketing Retail | | | 12.4 | |
Interactive Media & Services | | | 10.2 | |
IT Services | | | 7.0 | |
Beverages | | | 6.1 | |
Hotels, Restaurants & Leisure | | | 5.7 | |
Pharmaceuticals | | | 5.7 | |
Biotechnology | | | 5.5 | |
Household Products | | | 4.6 | |
Capital Markets | | | 4.4 | |
Air Freight & Logistics | | | 4.1 | |
Semiconductors & Semiconductor Equipment | | | 3.3 | |
Communications Equipment | | | 3.0 | |
Food Products | | | 2.9 | |
Machinery | | | 2.7 | |
Energy Equipment & Services | | | 2.5 | |
Health Care Technology | | | 2.2 | |
Other Investments, less than 2% each | | | 2.8 | |
Short-Term Investments | | | 1.4 | |
| | | | |
Total Investments | | | 99.8 | |
Other assets less liabilities | | | 0.2 | |
| | | | |
Net Assets | | | 100.0 | % |
| | | | |
See accompanying notes to financial statements.
| 44
Statements of Assets and Liabilities
September 30, 2018
| | | | | | | | |
| | | Global Allocation
Fund | | | Growth Fund | |
ASSETS | | | | | | | | |
Investments at cost | | $ | 1,987,459,575 | | | $ | 6,433,943,976 | |
Net unrealized appreciation | | | 427,557,945 | | | | 2,388,095,829 | |
| | | | | | | | |
Investments at value | | | 2,415,017,520 | | | | 8,822,039,805 | |
Due from brokers (Note 2) | | | 1,070,000 | | | | — | |
Foreign currency at value (identified cost $8,591,827 and $0, respectively) | | | 8,496,638 | | | | — | |
Receivable for Fund shares sold | | | 8,332,013 | | | | 15,816,390 | |
Receivable for securities sold | | | 10,030,041 | | | | — | |
Collateral received for open forward foreign currency contracts (Note 4) | | | 610,000 | | | | — | |
Dividends and interest receivable | | | 7,088,817 | | | | 5,935,719 | |
Unrealized appreciation on forward foreign currency contracts (Note 2) | | | 463,197 | | | | — | |
Tax reclaims receivable | | | 650,865 | | | | 3,880,910 | |
Prepaid expenses (Note 8) | | | 2,118 | | | | 8,251 | |
| | | | | | | | |
TOTAL ASSETS | | | 2,451,761,209 | | | | 8,847,681,075 | |
| | | | | | | | |
LIABILITIES | | | | | | | | |
Payable for securities purchased | | | 1,530,404 | | | | — | |
Payable for Fund shares redeemed | | | 1,406,184 | | | | 6,818,085 | |
Unrealized depreciation on forward foreign currency contracts (Note 2) | | | 2,117,874 | | | | — | |
Foreign taxes payable (Note 2) | | | 831 | | | | — | |
Due to brokers (Note 2) | | | 610,000 | | | | — | |
Management fees payable (Note 6) | | | 1,485,120 | | | | 3,603,635 | |
Deferred Trustees’ fees (Note 6) | | | 186,609 | | | | 303,332 | |
Administrative fees payable (Note 6) | | | 86,301 | | | | 312,650 | |
Payable to distributor (Note 6d) | | | 43,216 | | | | 79,497 | |
Other accounts payable and accrued expenses | | | 612,998 | | | | 385,256 | |
| | | | | | | | |
TOTAL LIABILITIES | | | 8,079,537 | | | | 11,502,455 | |
| | | | | | | | |
NET ASSETS | | $ | 2,443,681,672 | | | $ | 8,836,178,620 | |
| | | | | | | | |
NET ASSETS CONSIST OF: | | | | | | | | |
Paid-in capital | | $ | 1,932,322,057 | | | $ | 6,112,654,110 | |
Accumulated earnings | | | 511,359,615 | | | | 2,723,524,510 | |
| | | | | | | | |
NET ASSETS | | $ | 2,443,681,672 | | | $ | 8,836,178,620 | |
| | | | | | | | |
See accompanying notes to financial statements.
45 |
Statements of Assets and Liabilities (continued)
September 30, 2018
| | | | | | | | |
| | | Global Allocation
Fund | | | Growth Fund | |
COMPUTATION OF NET ASSET VALUE AND OFFERING PRICE: | | | | | | | | |
Class A shares: | | | | | | | | |
Net assets | | $ | 401,035,799 | | | $ | 1,083,361,687 | |
| | | | | | | | |
Shares of beneficial interest | | | 17,362,620 | | | | 67,487,441 | |
| | | | | | | | |
Net asset value and redemption price per share | | $ | 23.10 | | | $ | 16.05 | |
| | | | | | | | |
Offering price per share (100/94.25 of net asset value) (Note 1) | | $ | 24.51 | | | $ | 17.03 | |
| | | | | | | | |
Class C shares: (redemption price per share is equal to net asset value less any applicable contingent deferred sales charge) (Note 1) | | | | | | | | |
Net assets | | $ | 412,610,176 | | | $ | 130,133,034 | |
| | | | | | | | |
Shares of beneficial interest | | | 18,116,511 | | | | 8,862,438 | |
| | | | | | | | |
Net asset value and offering price per share | | $ | 22.78 | | | $ | 14.68 | |
| | | | | | | | |
Class N shares: | | | | | | | | |
Net assets | | $ | 80,346,328 | | | $ | 1,001,687,563 | |
| | | | | | | | |
Shares of beneficial interest | | | 3,455,458 | | | | 58,424,350 | |
| | | | | | | | |
Net asset value, offering and redemption price per share | | $ | 23.25 | | | $ | 17.15 | |
| | | | | | | | |
Class Y shares: | | | | | | | | |
Net assets | | $ | 1,549,689,369 | | | $ | 6,620,996,336 | |
| | | | | | | | |
Shares of beneficial interest | | | 66,642,864 | | | | 386,202,855 | |
| | | | | | | | |
Net asset value, offering and redemption price per share | | $ | 23.25 | | | $ | 17.14 | |
| | | | | | | | |
See accompanying notes to financial statements.
| 46
Statements of Operations
For the Year Ended September 30, 2018
| | | | | | | | |
| | | Global Allocation
Fund | | | Growth Fund | |
INVESTMENT INCOME | | | | | | | | |
Dividends | | $ | 19,035,949 | | | $ | 101,439,418 | |
Non-cash dividends (Note 2b) | | | — | | | | 6,153,115 | |
Interest | | | 27,732,812 | | | | 1,007,782 | |
Less net foreign taxes withheld | | | (658,305 | ) | | | (2,845,183 | ) |
| | | | | | | | |
| | | 46,110,456 | | | | 105,755,132 | |
| | | | | | | | |
Expenses | | | | | | | | |
Management fees (Note 6) | | | 15,669,842 | | | | 40,912,661 | |
Service and distribution fees (Note 6) | | | 4,682,654 | | | | 3,998,693 | |
Administrative fees (Note 6) | | | 920,112 | | | | 3,599,450 | |
Trustees’ fees and expenses (Note 6) | | | 84,322 | | | | 246,949 | |
Transfer agent fees and expenses (Notes 6 and 7) | | | 1,653,427 | | | | 6,475,850 | |
Audit and tax services fees | | | 56,526 | | | | 41,976 | |
Custodian fees and expenses | | | 249,415 | | | | 267,879 | |
Legal fees | | | 41,638 | | | | 175,122 | |
Registration fees | | | 162,909 | | | | 314,934 | |
Shareholder reporting expenses | | | 147,423 | | | | 725,787 | |
Miscellaneous expenses (Note 8) | | | 96,227 | | | | 211,146 | |
| | | | | | | | |
Total expenses | | | 23,764,495 | | | | 56,970,447 | |
Less waiver and/or expense reimbursement (Note 6) | | | (478 | ) | | | (29,092 | ) |
| | | | | | | | |
Net expenses | | | 23,764,017 | | | | 56,941,355 | |
| | | | | | | | |
Net investment income | | | 22,346,439 | | | | 48,813,777 | |
| | | | | | | | |
NET REALIZED AND UNREALIZED GAIN (LOSS) ON INVESTMENTS, FORWARD FOREIGN CURRENCY CONTRACTS AND FOREIGN CURRENCY TRANSACTIONS | | | | | | | | |
Net realized gain (loss) on: | | | | | | | | |
Investments | | | 77,877,116 | | | | 330,004,291 | |
Forward foreign currency contracts (Note 2d) | | | (230,410 | ) | | | — | |
Foreign currency transactions (Note 2c) | | | (624,490 | ) | | | — | |
Net change in unrealized appreciation (depreciation) on: | | | | | | | | |
Investments | | | 74,564,259 | | | | 902,573,085 | |
Forward foreign currency contracts (Note 2d) | | | (1,452,384 | ) | | | — | |
Foreign currency translations (Note 2c) | | | (77,945 | ) | | | — | |
| | | | | | | | |
Net realized and unrealized gain on investments, forward foreign currency contracts and foreign currency transactions | | | 150,056,146 | | | | 1,232,577,376 | |
| | | | | | | | |
NET INCREASE IN NET ASSETS RESULTING FROM OPERATIONS | | $ | 172,402,585 | | | $ | 1,281,391,153 | |
| | | | | | | | |
See accompanying notes to financial statements.
47 |
Statements of Changes in Net Assets
| | | | | | | | |
| | | Global Allocation Fund | |
| | | Year Ended
September 30,
2018 | | | Year Ended
September 30,
2017 | |
FROM OPERATIONS: | |
Net investment income | | $ | 22,346,439 | | | $ | 24,109,319 | |
Net realized gain on investments, forward foreign currency contracts and foreign currency transactions | | | 77,022,216 | | | | 12,813,326 | |
Net change in unrealized appreciation (depreciation) on investments, forward foreign currency contracts and foreign currency translations | | | 73,033,930 | | | | 173,627,998 | |
| | | | | | | | |
Net increase in net assets resulting from operations | | | 172,402,585 | | | | 210,550,643 | |
| | | | | | | | |
FROM DISTRIBUTIONS TO SHAREHOLDERS: | |
Class A | | | (7,114,532 | ) | | | (3,289,853 | )(a) |
Class C | | | (4,826,992 | ) | | | (1,771,656 | )(a) |
Class N | | | (1,642,868 | ) | | | — | |
Class Y | | | (26,544,930 | ) | | | (12,428,003 | )(a) |
| | | | | | | | |
Total distributions | | | (40,129,322 | ) | | | (17,489,512 | ) |
| | | | | | | | |
NET INCREASE IN NET ASSETS FROM CAPITAL SHARE TRANSACTIONS (NOTE 12) | | | 525,543,091 | | | | 53,800,129 | |
| | | | | | | | |
Net increase in net assets | | | 657,816,354 | | | | 246,861,260 | |
NET ASSETS | |
Beginning of the year | | | 1,785,865,318 | | | | 1,539,004,058 | |
| | | | | | | | |
End of the year | | $ | 2,443,681,672 | | | $ | 1,785,865,318 | |
| | | | | | | | |
| | (a) | See Note 2g of Notes to Financial Statements. |
See accompanying notes to financial statements.
| 48
Statements of Changes in Net Assets (continued)
| | | | | | | | |
| | | Growth Fund | |
| | | Year Ended
September 30,
2018 | | | Year Ended
September 30,
2017 | |
FROM OPERATIONS: | |
Net investment income | | $ | 48,813,777 | | | $ | 35,730,679 | |
Net realized gain on investments | | | 330,004,291 | | | | 111,820,263 | |
Net change in unrealized appreciation (depreciation) on investments | | | 902,573,085 | | | | 937,804,825 | |
| | | | | | | | |
Net increase in net assets resulting from operations | | | 1,281,391,153 | | | | 1,085,355,767 | |
| | | | | | | | |
FROM DISTRIBUTIONS TO SHAREHOLDERS: | |
Class A | | | (23,626,171 | ) | | | (9,966,200 | )(a) |
Class C | | | (2,938,721 | ) | | | (1,227,895 | )(a) |
Class N | | | (9,153,975 | ) | | | (1,680,867 | )(a) |
Class Y | | | (147,324,401 | ) | | | (55,511,360 | )(a) |
| | | | | | | | |
Total distributions | | | (183,043,268 | ) | | | (68,386,322 | ) |
| | | | | | | | |
NET INCREASE IN NET ASSETS FROM CAPITAL SHARE TRANSACTIONS (NOTE 12) | | | 530,718,841 | | | | 1,795,629,622 | |
| | | | | | | | |
Net increase in net assets | | | 1,629,066,726 | | | | 2,812,599,067 | |
NET ASSETS | |
Beginning of the year | | | 7,207,111,894 | | | | 4,394,512,827 | |
| | | | | | | | |
End of the year | | $ | 8,836,178,620 | | | $ | 7,207,111,894 | |
| | | | | | | | |
| | (a) | See Note 2g of Notes to Financial Statements. |
See accompanying notes to financial statements.
49 |
Financial Highlights
For a share outstanding throughout each period.
| | | | | | | | | | | | | | | | | | | | |
| | | Global Allocation Fund—Class A | |
| | | Year Ended
September 30,
2018
| | | Year Ended
September 30,
2017
| | | Year Ended
September 30,
2016
| | | Year Ended
September 30,
2015
| | | Year Ended
September 30,
2014
| |
Net asset value, beginning of the period | | $ | 21.60 | | | $ | 19.17 | | | $ | 18.45 | | | $ | 19.77 | | | $ | 18.57 | |
| | | | | | | | | | | | | | | | | | | | |
INCOME (LOSS) FROM INVESTMENT OPERATIONS: | | | | | | | | | | | | | | | | | | | | |
Net investment income(a) | | | 0.23 | | | | 0.31 | | | | 0.24 | | | | 0.21 | | | | 0.28 | |
Net realized and unrealized gain (loss) | | | 1.75 | | | | 2.36 | | | | 1.47 | | | | (0.37 | ) | | | 1.49 | |
| | | | | | | | | | | | | | | | | | | | |
Total from Investment Operations | | | 1.98 | | | | 2.67 | | | | 1.71 | | | | (0.16 | ) | | | 1.77 | |
| | | | | | | | | | | | | | | | | | | | |
LESS DISTRIBUTIONS FROM: | | | | | | | | | | | | | | | | | | | | |
Net investment income | | | (0.19 | ) | | | (0.24 | ) | | | (0.15 | ) | | | (0.20 | ) | | | (0.33 | ) |
Net realized capital gains | | | (0.29 | ) | | | — | | | | (0.84 | ) | | | (0.96 | ) | | | (0.24 | ) |
| | | | | | | | | | | | | | | | | | | | |
Total Distributions | | | (0.48 | ) | | | (0.24 | ) | | | (0.99 | ) | | | (1.16 | ) | | | (0.57 | ) |
| | | | | | | | | | | | | | | | | | | | |
Net asset value, end of the period | | $ | 23.10 | | | $ | 21.60 | | | $ | 19.17 | | | $ | 18.45 | | | $ | 19.77 | |
| | | | | | | | | | | | | | | | | | | | |
Total return(b) | | | 9.26 | % | | | 14.10 | % | | | 9.64 | % | | | (0.91 | )% | | | 9.62 | % |
RATIOS TO AVERAGE NET ASSETS: | | | | | | | | | | | | | | | | | | | | |
Net assets, end of the period (000’s) | | $ | 401,036 | | | $ | 305,275 | | | $ | 280,263 | | | $ | 246,371 | | | $ | 237,167 | |
Net expenses | | | 1.16 | % | | | 1.18 | % | | | 1.17 | % | | | 1.18 | % | | | 1.17 | % |
Gross expenses | | | 1.16 | % | | | 1.18 | % | | | 1.17 | % | | | 1.18 | % | | | 1.17 | % |
Net investment income | | | 1.03 | % | | | 1.57 | % | | | 1.32 | % | | | 1.06 | % | | | 1.46 | % |
Portfolio turnover rate | | | 22 | % | | | 35 | % | | | 43 | % | | | 48 | % | | | 49 | % |
| (a) | Per share net investment income has been calculated using the average shares outstanding during the period. |
| (b) | A sales charge for Class A shares is not reflected in total return calculations. |
See accompanying notes to financial statements.
| 50
Financial Highlights (continued)
For a share outstanding throughout each period.
| | | | | | | | | | | | | | | | | | | | |
| | | Global Allocation Fund—Class C | |
| | | Year Ended
September 30,
2018
| | | Year Ended
September 30,
2017
| | | Year Ended
September 30,
2016
| | | Year Ended
September 30,
2015
| | | Year Ended
September 30,
2014
| |
Net asset value, beginning of the period | | $ | 21.29 | | | $ | 18.89 | | | $ | 18.19 | | | $ | 19.51 | | | $ | 18.36 | |
| | | | | | | | | | | | | | | | | | | | |
INCOME (LOSS) FROM INVESTMENT OPERATIONS: | | | | | | | | | | | | | | | | | | | | |
Net investment income(a) | | | 0.06 | | | | 0.16 | | | | 0.10 | | | | 0.06 | | | | 0.14 | |
Net realized and unrealized gain (loss) | | | 1.73 | | | | 2.33 | | | | 1.46 | | | | (0.36 | ) | | | 1.45 | |
| | | | | | | | | | | | | | | | | | | | |
Total from Investment Operations | | | 1.79 | | | | 2.49 | | | | 1.56 | | | | (0.30 | ) | | | 1.59 | |
| | | | | | | | | | | | | | | | | | | | |
LESS DISTRIBUTIONS FROM: | | | | | | | | | | | | | | | | | | | | |
Net investment income | | | (0.01 | ) | | | (0.09 | ) | | | (0.02 | ) | | | (0.06 | ) | | | (0.20 | ) |
Net realized capital gains | | | (0.29 | ) | | | — | | | | (0.84 | ) | | | (0.96 | ) | | | (0.24 | ) |
| | | | | | | | | | | | | | | | | | | | |
Total Distributions | | | (0.30 | ) | | | (0.09 | ) | | | (0.86 | ) | | | (1.02 | ) | | | (0.44 | ) |
| | | | | | | | | | | | | | | | | | | | |
Net asset value, end of the period | | $ | 22.78 | | | $ | 21.29 | | | $ | 18.89 | | | $ | 18.19 | | | $ | 19.51 | |
| | | | | | | | | | | | | | | | | | | | |
Total return(b) | | | 8.46 | % | | | 13.22 | % | | | 8.88 | % | | | (1.66 | )% | | | 8.72 | % |
RATIOS TO AVERAGE NET ASSETS: | | | | | | | | | | | | | | | | | | | | |
Net assets, end of the period (000’s) | | $ | 412,610 | | | $ | 354,017 | | | $ | 423,350 | | | $ | 393,416 | | | $ | 377,001 | |
Net expenses | | | 1.91 | % | | | 1.93 | % | | | 1.92 | % | | | 1.93 | % | | | 1.92 | % |
Gross expenses | | | 1.91 | % | | | 1.93 | % | | | 1.92 | % | | | 1.93 | % | | | 1.92 | % |
Net investment income | | | 0.29 | % | | | 0.84 | % | | | 0.57 | % | | | 0.31 | % | | | 0.71 | % |
Portfolio turnover rate | | | 22 | % | | | 35 | % | | | 43 | % | | | 48 | % | | | 49 | % |
| (a) | Per share net investment income has been calculated using the average shares outstanding during the period. |
| (b) | A contingent deferred sales charge for Class C shares is not reflected in total return calculations. |
See accompanying notes to financial statements.
51 |
Financial Highlights (continued)
For a share outstanding throughout each period.
| | | | | | | | |
| | | Global Allocation Fund—Class N | |
| | | Year Ended
September 30,
2018
| | | Period Ended
September 30,
2017*
| |
Net asset value, beginning of the period | | $ | 21.73 | | | $ | 19.20 | |
| | | | | | | | |
INCOME (LOSS) FROM INVESTMENT OPERATIONS: | | | | | | | | |
Net investment income(a) | | | 0.31 | | | | 0.20 | |
Net realized and unrealized gain (loss) | | | 1.75 | | | | 2.33 | |
| | | | | | | | |
Total from Investment Operations | | | 2.06 | | | | 2.53 | |
| | | | | | | | |
LESS DISTRIBUTIONS FROM: | | | | | | | | |
Net investment income | | | (0.25 | ) | | | — | |
Net realized capital gains | | | (0.29 | ) | | | — | |
| | | | | | | | |
Total Distributions | | | (0.54 | ) | | | — | |
| | | | | | | | |
Net asset value, end of the period | | $ | 23.25 | | | $ | 21.73 | |
| | | | | | | | |
Total return | | | 9.60 | % | | | 13.18 | %(b) |
RATIOS TO AVERAGE NET ASSETS: | | | | | | | | |
Net assets, end of the period (000’s) | | $ | 80,346 | | | $ | 59,512 | |
Net expenses | | | 0.83 | % | | | 0.87 | %(c) |
Gross expenses | | | 0.83 | % | | | 0.87 | %(c) |
Net investment income | | | 1.36 | % | | | 1.48 | %(c) |
Portfolio turnover rate | | | 22 | % | | | 35 | %(d) |
| * | From commencement of Class operations on February 1, 2017 through September 30, 2017. |
| (a) | Per share net investment income has been calculated using the average shares outstanding during the period. |
| (b) | Periods less than one year are not annualized. |
| (c) | Computed on an annualized basis for periods less than one year. |
| (d) | Represents the Fund’s portfolio turnover rate for the year ended September 30, 2017. |
See accompanying notes to financial statements.
| 52
Financial Highlights (continued)
For a share outstanding throughout each period.
| | | | | | | | | | | | | | | | | | | | |
| | | Global Allocation Fund—Class Y | |
| | | Year Ended
September 30,
2018
| | | Year Ended
September 30,
2017
| | | Year Ended
September 30,
2016
| | | Year Ended
September 30,
2015
| | | Year Ended
September 30,
2014
| |
Net asset value, beginning of the period | | $ | 21.74 | | | $ | 19.29 | | | $ | 18.55 | | | $ | 19.89 | | | $ | 18.68 | |
| | | | | | | | | | | | | | | | | | | | |
INCOME (LOSS) FROM INVESTMENT OPERATIONS: | | | | | | | | | | | | | | | | | | | | |
Net investment income(a) | | | 0.29 | | | | 0.36 | | | | 0.29 | | | | 0.25 | | | | 0.33 | |
Net realized and unrealized gain (loss) | | | 1.75 | | | | 2.37 | | | | 1.49 | | | | (0.37 | ) | | | 1.49 | |
| | | | | | | | | | | | | | | | | | | | |
Total from Investment Operations | | | 2.04 | | | | 2.73 | | | | 1.78 | | | | (0.12 | ) | | | 1.82 | |
| | | | | | | | | | | | | | | | | | | | |
LESS DISTRIBUTIONS FROM: | | | | | | | | | | | | | | | | | | | | |
Net investment income | | | (0.24 | ) | | | (0.28 | ) | | | (0.20 | ) | | | (0.26 | ) | | | (0.37 | ) |
Net realized capital gains | | | (0.29 | ) | | | — | | | | (0.84 | ) | | | (0.96 | ) | | | (0.24 | ) |
| | | | | | | | | | | | | | | | | | | | |
Total Distributions | | | (0.53 | ) | | | (0.28 | ) | | | (1.04 | ) | | | (1.22 | ) | | | (0.61 | ) |
| | | | | | | | | | | | | | | | | | | | |
Net asset value, end of the period | | $ | 23.25 | | | $ | 21.74 | | | $ | 19.29 | | | $ | 18.55 | | | $ | 19.89 | |
| | | | | | | | | | | | | | | | | | | | |
Total return | | | 9.49 | % | | | 14.42 | % | | | 9.97 | % | | | (0.72 | )% | | | 9.87 | % |
RATIOS TO AVERAGE NET ASSETS: | | | | | | | | | | | | | | | | | | | | |
Net assets, end of the period (000’s) | | $ | 1,549,689 | | | $ | 1,067,062 | | | $ | 835,391 | | | $ | 604,609 | | | $ | 633,057 | |
Net expenses | | | 0.91 | % | | | 0.93 | % | | | 0.92 | % | | | 0.93 | % | | | 0.92 | % |
Gross expenses | | | 0.91 | % | | | 0.93 | % | | | 0.92 | % | | | 0.93 | % | | | 0.92 | % |
Net investment income | | | 1.29 | % | | | 1.79 | % | | | 1.58 | % | | | 1.30 | % | | | 1.69 | % |
Portfolio turnover rate | | | 22 | % | | | 35 | % | | | 43 | % | | | 48 | % | | | 49 | % |
| (a) | Per share net investment income has been calculated using the average shares outstanding during the period. |
See accompanying notes to financial statements.
53 |
Financial Highlights (continued)
For a share outstanding throughout each period.
| | | | | | | | | | | | | | | | | | | | |
| | | Growth Fund—Class A | |
| | | Year Ended
September 30,
2018
| | | Year Ended
September 30,
2017
| | | Year Ended
September 30,
2016
| | | Year Ended
September 30,
2015
| | | Year Ended
September 30,
2014
| |
Net asset value, beginning of the period | | $ | 14.04 | | | $ | 11.96 | | | $ | 9.90 | | | $ | 9.45 | | | $ | 8.07 | |
| | | | | | | | | | | | | | | | | | | | |
INCOME (LOSS) FROM INVESTMENT OPERATIONS: | | | | | | | | | | | | | | | | | | | | |
Net investment income(a) | | | 0.06 | | | | 0.06 | | | | 0.06 | | | | 0.05 | | | | 0.05 | |
Net realized and unrealized gain (loss) | | | 2.29 | | | | 2.18 | | | | 2.05 | | | | 0.45 | | | | 1.34 | |
| | | | | | | | | | | | | | | | | | | | |
Total from Investment Operations | | | 2.35 | | | | 2.24 | | | | 2.11 | | | | 0.50 | | | | 1.39 | |
| | | | | | | | | | | | | | | | | | | | |
LESS DISTRIBUTIONS FROM: | | | | | | | | | | | | | | | | | | | | |
Net investment income | | | (0.05 | ) | | | (0.05 | ) | | | (0.05 | ) | | | (0.05 | ) | | | (0.01 | ) |
Net realized capital gains | | | (0.29 | ) | | | (0.11 | ) | | | — | | | | — | | | | — | |
| | | | | | | | | | | | | | | | | | | | |
Total Distributions | | | (0.34 | ) | | | (0.16 | ) | | | (0.05 | ) | | | (0.05 | ) | | | (0.01 | ) |
| | | | | | | | | | | | | | | | | | | | |
Net asset value, end of the period | | $ | 16.05 | | | $ | 14.04 | | | $ | 11.96 | | | $ | 9.90 | | | $ | 9.45 | |
| | | | | | | | | | | | | | | | | | | | |
Total return(b) | | | 16.98 | % | | | 18.99 | % | | | 21.32 | % | | | 5.30 | % | | | 17.23 | % |
RATIOS TO AVERAGE NET ASSETS: | | | | | | | | | | | | | | | | | | | | |
Net assets, end of the period (000’s) | | $ | 1,083,362 | | | $ | 983,047 | | | $ | 729,989 | | | $ | 122,203 | | | $ | 63,682 | |
Net expenses | | | 0.90 | % | | | 0.91 | % | | | 0.92 | % | | | 0.92 | % | | | 0.94 | % |
Gross expenses | | | 0.90 | % | | | 0.91 | % | | | 0.92 | % | | | 0.92 | % | | | 0.94 | % |
Net investment income | | | 0.39 | % | | | 0.45 | % | | | 0.58 | % | | | 0.45 | % | | | 0.55 | % |
Portfolio turnover rate | | | 11 | % | | | 8 | % | | | 11 | % | | | 27 | %(c) | | | 14 | % |
| (a) | Per share net investment income has been calculated using the average shares outstanding during the period. |
| (b) | A sales charge for Class A shares is not reflected in total return calculations. |
| (c) | Portfolio turnover would have been 6% if excluding the transfer in-kind amounts that occurred during the period. |
See accompanying notes to financial statements.
| 54
Financial Highlights (continued)
For a share outstanding throughout each period.
| | | | | | | | | | | | | | | | | | | | |
| | | Growth Fund—Class C | |
| | | Year Ended
September 30,
2018
| | | Year Ended
September 30,
2017
| | | Year Ended
September 30,
2016
| | | Year Ended
September 30,
2015
| | | Year Ended
September 30,
2014
| |
Net asset value, beginning of the period | | $ | 12.92 | | | $ | 11.06 | | | $ | 9.18 | | | $ | 8.79 | | | $ | 7.55 | |
| | | | | | | | | | | | | | | | | | | | |
INCOME (LOSS) FROM INVESTMENT OPERATIONS: | | | | | | | | | | | | | | | | | | | | |
Net investment loss(a) | | | (0.05 | ) | | | (0.03 | ) | | | (0.02 | ) | | | (0.03 | ) | | | (0.02 | ) |
Net realized and unrealized gain (loss) | | | 2.10 | | | | 2.00 | | | | 1.90 | | | | 0.42 | | | | 1.26 | |
| | | | | | | | | | | | | | | | | | | | |
Total from Investment Operations | | | 2.05 | | | | 1.97 | | | | 1.88 | | | | 0.39 | | | | 1.24 | |
| | | | | | | | | | | | | | | | | | | | |
LESS DISTRIBUTIONS FROM: | | | | | | | | | | | | | | | | | | | | |
Net realized capital gains | | | (0.29 | ) | | | (0.11 | ) | | | — | | | | — | | | | — | |
| | | | | | | | | | | | | | | | | | | | |
Total Distributions | | | (0.29 | ) | | | (0.11 | ) | | | — | | | | — | | | | — | |
| | | | | | | | | | | | | | | | | | | | |
Net asset value, end of the period | | $ | 14.68 | | | $ | 12.92 | | | $ | 11.06 | | | $ | 9.18 | | | $ | 8.79 | |
| | | | | | | | | | | | | | | | | | | | |
Total return(b) | | | 16.09 | % | | | 18.03 | % | | | 20.48 | % | | | 4.44 | % | | | 16.42 | % |
RATIOS TO AVERAGE NET ASSETS: | | | | | | | | | | | | | | | | | | | | |
Net assets, end of the period (000’s) | | $ | 130,133 | | | $ | 133,329 | | | $ | 109,798 | | | $ | 41,421 | | | $ | 29,837 | |
Net expenses | | | 1.65 | % | | | 1.66 | % | | | 1.66 | % | | | 1.67 | % | | | 1.69 | % |
Gross expenses | | | 1.65 | % | | | 1.66 | % | | | 1.66 | % | | | 1.67 | % | | | 1.69 | % |
Net investment loss | | | (0.36 | )% | | | (0.29 | )% | | | (0.16 | )% | | | (0.29 | )% | | | (0.20 | )% |
Portfolio turnover rate | | | 11 | % | | | 8 | % | | | 11 | % | | | 27 | %(c) | | | 14 | % |
| (a) | Per share net investment loss has been calculated using the average shares outstanding during the period. |
| (b) | A contingent deferred sales charge for Class C shares is not reflected in total return calculations. |
| (c) | Portfolio turnover would have been 6% if excluding the transfer in-kind amounts that occurred during the period. |
See accompanying notes to financial statements.
55 |
Financial Highlights (continued)
For a share outstanding throughout each period.
| | | | | | | | | | | | | | | | | | | | |
| | | Growth Fund—Class N | |
| | | Year Ended
September 30,
2018
| | | Year Ended
September 30,
2017
| | | Year Ended
September 30,
2016
| | | Year Ended
September 30,
2015
| | | Year Ended
September 30,
2014
| |
Net asset value, beginning of the period | | $ | 14.97 | | | $ | 12.73 | | | $ | 10.52 | | | $ | 10.01 | | | $ | 8.56 | |
| | | | | | | | | | | | | | | | | | | | |
INCOME (LOSS) FROM INVESTMENT OPERATIONS: | | | | | | | | | | | | | | | | | | | | |
Net investment income(a) | | | 0.12 | | | | 0.11 | | | | 0.10 | | | | 0.08 | | | | 0.05 | |
Net realized and unrealized gain (loss) | | | 2.44 | | | | 2.32 | | | | 2.18 | | | | 0.49 | | | | 1.42 | |
| | | | | | | | | | | | | | | | | | | | |
Total from Investment Operations | | | 2.56 | | | | 2.43 | | | | 2.28 | | | | 0.57 | | | | 1.47 | |
| | | | | | | | | | | | | | | | | | | | |
LESS DISTRIBUTIONS FROM: | | | | | | | | | | | | | | | | | | | | |
Net investment income | | | (0.09 | ) | | | (0.08 | ) | | | (0.07 | ) | | | (0.06 | ) | | | (0.02 | ) |
Net realized capital gains | | | (0.29 | ) | | | (0.11 | ) | | | — | | | | — | | | | — | |
| | | | | | | | | | | | | | | | | | | | |
Total Distributions | | | (0.38 | ) | | | (0.19 | ) | | | (0.07 | ) | | | (0.06 | ) | | | (0.02 | ) |
| | | | | | | | | | | | | | | | | | | | |
Net asset value, end of the period | | $ | 17.15 | | | $ | 14.97 | | | $ | 12.73 | | | $ | 10.52 | | | $ | 10.01 | |
| | | | | | | | | | | | | | | | | | | | |
Total return | | | 17.40 | %(b) | | | 19.39 | %(b) | | | 21.75 | % | | | 5.65 | %(b) | | | 17.21 | %(b) |
RATIOS TO AVERAGE NET ASSETS: | | | | | | | | | | | | | | | | | | | | |
Net assets, end of the period (000’s) | | $ | 1,001,688 | | | $ | 341,160 | | | $ | 60,765 | | | $ | 1 | | | $ | 1 | |
Net expenses | | | 0.57 | %(c) | | | 0.57 | %(c) | | | 0.58 | % | | | 0.55 | %(c) | | | 0.95 | %(c) |
Gross expenses | | | 0.58 | % | | | 0.58 | % | | | 0.58 | % | | | 9.82 | % | | | 3.45 | % |
Net investment income | | | 0.73 | % | | | 0.80 | % | | | 0.82 | % | | | 0.71 | % | | | 0.52 | % |
Portfolio turnover rate | | | 11 | % | | | 8 | % | | | 11 | % | | | 27 | %(d) | | | 14 | % |
| (a) | Per share net investment income has been calculated using the average shares outstanding during the period. |
| (b) | Had certain expenses not been waived/reimbursed during the period, total returns would have been lower. |
| (c) | The investment adviser agreed to waive its fees and/or reimburse a portion of the Fund’s expenses during the period. Without this waiver/reimbursement, expenses would have been higher. |
| (d) | Portfolio turnover would have been 6% if excluding the transfer in-kind amounts that occurred during the period. |
See accompanying notes to financial statements.
| 56
Financial Highlights (continued)
For a share outstanding throughout each period.
| | | | | | | | | | | | | | | | | | | | |
| | | Growth Fund—Class Y | |
| | | Year Ended
September 30,
2018
| | | Year Ended
September 30,
2017
| | | Year Ended
September 30,
2016
| | | Year Ended
September 30,
2015
| | | Year Ended
September 30,
2014
| |
Net asset value, beginning of the period | | $ | 14.97 | | | $ | 12.73 | | | $ | 10.53 | | | $ | 10.04 | | | $ | 8.57 | |
| | | | | | | | | | | | | | | | | | | | |
INCOME (LOSS) FROM INVESTMENT OPERATIONS: | | | | | | | | | | | | | | | | | | | | |
Net investment income(a) | | | 0.10 | | | | 0.09 | | | | 0.10 | | | | 0.07 | | | | 0.08 | |
Net realized and unrealized gain (loss) | | | 2.44 | | | | 2.33 | | | | 2.16 | | | | 0.49 | | | | 1.42 | |
| | | | | | | | | | | | | | | | | | | | |
Total from Investment Operations | | | 2.54 | | | | 2.42 | | | | 2.26 | | | | 0.56 | | | | 1.50 | |
| | | | | | | | | | | | | | | | | | | | |
LESS DISTRIBUTIONS FROM: | | | | | | | | | | | | | | | | | | | | |
Net investment income | | | (0.08 | ) | | | (0.07 | ) | | | (0.06 | ) | | | (0.07 | ) | | | (0.03 | ) |
Net realized capital gains | | | (0.29 | ) | | | (0.11 | ) | | | — | | | | — | | | | — | |
| | | | | | | | | | | | | | | | | | | | |
Total Distributions | | | (0.37 | ) | | | (0.18 | ) | | | (0.06 | ) | | | (0.07 | ) | | | (0.03 | ) |
| | | | | | | | | | | | | | | | | | | | |
Net asset value, end of the period | | $ | 17.14 | | | $ | 14.97 | | | $ | 12.73 | | | $ | 10.53 | | | $ | 10.04 | |
| | | | | | | | | | | | | | | | | | | | |
Total return | | | 17.25 | % | | | 19.31 | % | | | 21.55 | % | | | 5.59 | % | | | 17.51 | % |
RATIOS TO AVERAGE NET ASSETS: | | | | | | | | | | | | | | | | | | | | |
Net assets, end of the period (000’s) | | $ | 6,620,996 | | | $ | 5,749,576 | | | $ | 3,493,961 | | | $ | 1,174,150 | | | $ | 1,004,157 | |
Net expenses | | | 0.65 | % | | | 0.66 | % | | | 0.66 | % | | | 0.67 | % | | | 0.69 | % |
Gross expenses | | | 0.65 | % | | | 0.66 | % | | | 0.66 | % | | | 0.67 | % | | | 0.69 | % |
Net investment income | | | 0.64 | % | | | 0.69 | % | | | 0.82 | % | | | 0.69 | % | | | 0.79 | % |
Portfolio turnover rate | | | 11 | % | | | 8 | % | | | 11 | % | | | 27 | %(b) | | | 14 | % |
| (a) | Per share net investment income has been calculated using the average shares outstanding during the period. |
| (b) | Portfolio turnover would have been 6% if excluding the transfer in-kind amounts that occurred during the period. |
See accompanying notes to financial statements.
57 |
Notes to Financial Statements
September 30, 2018
1. Organization. Loomis Sayles Funds II (the “Trust”) is organized as a Massachusetts business trust. The Trust is registered under the Investment Company Act of 1940, as amended (the “1940 Act”), as an open-end management investment company. The Declaration of Trust permits the Board of Trustees to authorize the issuance of an unlimited number of shares of the Trust in multiple series. The financial statements for certain funds of the Trust are presented in separate reports. The following funds (individually, a “Fund” and collectively, the “Funds”) are included in this report:
Loomis Sayles Global Allocation Fund (the “Global Allocation Fund”)
Loomis Sayles Growth Fund (the “Growth Fund”)
Each Fund is a diversified investment company.
Global Allocation Fund offers Class A, Class C, Class N and Class Y shares. Growth Fund was closed to new investors effective April 28, 2017. Growth Fund continues to offer Class A, Class C, Class N, and Class Y shares to existing shareholders and clients of registered investment advisers and registered representatives trading through intermediary programs/platforms on which the Fund is already available.
Class A shares are sold with a maximum front-end sales charge of 5.75%. Class C shares do not pay a front-end sales charge, pay higher Rule 12b-1 fees than Class A shares for ten years (at which point they automatically convert to Class A shares) and may be subject to a contingent deferred sales charge (“CDSC”) of 1.00% if those shares are redeemed within one year of acquisition, except for reinvested distributions. Class N and Class Y shares do not pay a front-end sales charge, a CDSC or Rule 12b-1 fees. Class N shares are offered with an initial minimum investment of $1,000,000. Class Y shares are offered with an initial minimum investment of $100,000. Certain categories of investors are exempted from the minimum investment amounts as outlined in the relevant Funds’ prospectus.
Most expenses can be directly attributed to a Fund. Expenses which cannot be directly attributed to a Fund are generally apportioned based on the relative net assets of each of the funds in Natixis Funds Trust I, Natixis Funds Trust II, Natixis Funds Trust IV, Gateway Trust (“Natixis Funds Trusts”), Loomis Sayles Funds I and Loomis Sayles Funds II (“Loomis Sayles Funds Trusts”), and Natixis ETF Trust. Expenses of a Fund are borne pro rata by the holders of each class of shares, except that each class bears expenses unique to that class (such as the Rule 12b-1 fees applicable to Class A and Class C), and transfer agent fees are borne collectively for Class A, Class C, Class Y and individually for Class N. In addition, each class votes as a class only with respect to its own Rule 12b-1 Plan. Shares of each class would receive their pro rata share of the net assets of a Fund if the Fund were liquidated. The Trustees approve separate distributions from net investment income on each class of shares.
| 58
Notes to Financial Statements (continued)
September 30, 2018
2. Significant Accounting Policies. The following is a summary of significant accounting policies consistently followed by each Fund in the preparation of its financial statements. The Funds’ financial statements follow the accounting and reporting guidelines provided for investment companies and are prepared in accordance with accounting principles generally accepted in the United States of America which require the use of management estimates that affect the reported amounts and disclosures in the financial statements. Actual results could differ from those estimates. Management has evaluated the events and transactions subsequent to year-end through the date the financial statements were issued and has determined that there were no material events that would require disclosure in the Funds’ financial statements.
a. Valuation. Fund securities and other investments are valued at market value based on market quotations obtained or determined by independent pricing services recommended by the adviser and approved by the Board of Trustees. Fund securities and other investments for which market quotations are not readily available are valued at fair value as determined in good faith by the adviser pursuant to procedures approved by the Board of Trustees, as described below. Market value is determined as follows:
Listed equity securities (including shares of closed-end investment companies and exchange-traded funds) are valued at the last sale price quoted on the exchange where they are traded most extensively or, if there is no reported sale during the day, the closing bid quotation as reported by an independent pricing service. Securities traded on the NASDAQ Global Select Market, NASDAQ Global Market and NASDAQ Capital Market are valued at the NASDAQ Official Closing Price (“NOCP”), or if lacking an NOCP, at the most recent bid quotations on the applicable NASDAQ Market. Unlisted equity securities (except unlisted preferred equity securities) are valued at the last sale price quoted in the market where they are traded most extensively or, if there is no reported sale during the day, the closing bid quotation as reported by an independent pricing service. If there is no last sale price or closing bid quotation available, unlisted equity securities will be valued using evaluated bids furnished by an independent pricing service, if available. In some foreign markets, an official close price and a last sale price may be available from the foreign exchange or market. In those cases, the official close price is used. Debt securities and unlisted preferred equity securities are valued based on evaluated bids furnished to the Funds by an independent pricing service or bid prices obtained from broker-dealers. Senior loans are valued at bid prices supplied by an independent pricing service, if available. Broker-dealer bid prices may be used to value debt and unlisted equity securities and senior loans where an independent pricing service is unable to price a security or where an independent pricing service does not provide a reliable price for the security. Forward foreign currency contracts are valued utilizing interpolated rates determined based on information provided by an independent pricing service.
59 |
Notes to Financial Statements (continued)
September 30, 2018
Fund securities and other investments for which market quotations are not readily available are valued at fair value as determined in good faith by the adviser pursuant to procedures approved by the Board of Trustees. The Funds may also value securities and other investments at fair value in other circumstances such as when extraordinary events occur after the close of a foreign market but prior to the close of the New York Stock Exchange. This may include situations relating to a single issuer (such as a declaration of bankruptcy or a delisting of the issuer’s security from the primary market on which it has traded) as well as events affecting the securities markets in general (such as market disruptions or closings and significant fluctuations in U.S. and/or foreign markets). When fair valuing its securities or other investments, the Funds may, among other things, use modeling tools or other processes that may take into account factors such as securities or other market activity and/or significant events that occur after the close of the foreign market and before the time the Fund’s net asset value (“NAV”) is calculated. Fair value pricing may require subjective determinations about the value of a security, and fair values used to determine a Fund’s NAV may differ from quoted or published prices, or from prices that are used by others, for the same securities. In addition, the use of fair value pricing may not always result in adjustments to the prices of securities held by a Fund.
Illiquid securities for which market quotations are readily available and have been evaluated by the adviser are considered and classified as fair valued securities pursuant to the Fund’s pricing policies and procedures.
As of September 30, 2018, securities held by Global Allocation Fund were fair valued as follows:
| | | | | | | | | | | | |
Equity
securities1 | | Percentage
of Net
Assets | | | Securities
classified as
fair valued | | | Percentage
of Net
Assets | |
$470,630,086 | | | 19.3 | % | | $ | 248,000 | | | | Less than 0.1 | % |
| 1 | Certain foreign equity securities were fair valued pursuant to procedures approved by the Board of Trustees as events occurring after the close of the foreign market were believed to materially affect the value of those securities. |
b. Investment Transactions and Related Investment Income. Investment transactions are accounted for on a trade date plus one day basis for daily NAV calculation. However, for financial reporting purposes, investment transactions are reported on trade date. Dividend income is recorded on ex-dividend date, or in the case of certain foreign securities, as soon as a Fund is notified, and interest income is recorded on an accrual basis. Dividends reinvested are reflected as non-cash dividends on the Statements of Operations. Interest income is increased by the accretion of discount and decreased by the amortization of premium, if applicable. In determining net gain or loss on securities sold, the cost of securities has been determined on an identified cost
| 60
Notes to Financial Statements (continued)
September 30, 2018
basis. Investment income, non-class specific expenses and realized and unrealized gains and losses are allocated on a pro rata basis to each class based on the relative net assets of each class to the total net assets of the Fund.
c. Foreign Currency Translation. The books and records of the Funds are maintained in U.S. dollars. The values of securities, currencies and other assets and liabilities denominated in currencies other than U.S. dollars are translated into U.S. dollars based upon foreign exchange rates prevailing at the end of the period. Purchases and sales of investment securities, income and expenses are translated into U.S. dollars on the respective dates of such transactions.
Net realized foreign exchange gains or losses arise from sales of foreign currency, changes in exchange rates between the trade and settlement dates on securities transactions and the difference between the amounts of dividends, interest and foreign withholding taxes recorded on the Funds’ books and the U.S. dollar equivalent of the amounts actually received or paid. Net unrealized foreign exchange gains or losses arise from changes in the value of assets and liabilities, other than investment securities, as of the end of the fiscal period, resulting from changes in exchange rates. Net realized foreign exchange gains or losses and the net change in unrealized foreign exchange gains or losses are disclosed in the Statements of Operations. For federal income tax purposes, net realized foreign exchange gains or losses are characterized as ordinary income and may, if the Fund has net losses, reduce the amount of income available to be distributed by the Fund.
The values of investment securities are presented at the foreign exchange rates prevailing at the end of the period for financial reporting purposes. Net realized and unrealized gains or losses on investments reported in the Statements of Operations reflect gains or losses resulting from changes in exchange rates and fluctuations which arise due to changes in market prices of investment securities. For federal income tax purposes, a portion of the net realized gain or loss on investments arising from changes in exchange rates, which is reflected in the Statements of Operations, may be characterized as ordinary income and may, if the Funds have net losses, reduce the amount of income available to be distributed by the Funds.
During the year ended September 30, 2018, the amount of income available to be distributed by the Global Allocation Fund has been reduced by $4,511,893.
The Funds may use foreign currency exchange contracts to facilitate transactions in foreign-denominated investments. Losses may arise from changes in the value of the foreign currency or if the counterparties do not perform under the contracts’ terms.
d. Forward Foreign Currency Contracts. The Funds may enter into forward foreign currency contracts, including forward foreign cross currency contracts to acquire exposure to foreign currencies or to hedge the Funds’ investments against currency fluctuation. A contract can also be used to offset a previous contract. These contracts
61 |
Notes to Financial Statements (continued)
September 30, 2018
involve market risk in excess of the unrealized gain or loss reflected in the Funds’ Statements of Assets and Liabilities. The U.S. dollar value of the currencies a Fund has committed to buy or sell represents the aggregate exposure to each currency the Fund has acquired or hedged through currency contracts outstanding at period end. Gains or losses are recorded for financial statement purposes as unrealized until settlement date. Contracts are traded over-the-counter directly with a counterparty. Risks may arise upon entering into these contracts from the potential inability of counterparties to meet the terms of their contracts and from unanticipated movements in the value of a foreign currency relative to the U.S. dollar. Certain contracts may require the movement of cash and/or securities as collateral for the Funds’ or counterparty’s net obligations under the contracts.
e. Due to/from Brokers. Transactions and positions in certain forward foreign currency contracts are maintained and cleared by registered U.S. broker/dealers pursuant to customer agreements between a Fund and the various broker/dealers. The due to brokers balance in the Statement of Assets and Liabilities for Global Allocation Fund represents cash received as collateral for forward foreign currency contracts. The due from brokers balance in the Statement of Assets and Liabilities for Global Allocation Fund represents cash pledged as collateral for forward foreign currency contracts. In certain circumstances the Fund’s use of cash held at brokers is restricted by regulation or broker mandated limits.
f. When-Issued and Delayed Delivery Transactions. The Funds may enter into when-issued or delayed delivery transactions. When-issued refers to transactions made conditionally because a security, although authorized, has not been issued. Delayed delivery refers to transactions for which delivery or payment will occur at a later date, beyond the normal settlement period. The price of when-issued and delayed delivery securities and the date when the securities will be delivered and paid for are fixed at the time the transaction is negotiated. The security and the obligation to pay for it are recorded by the Funds at the time the commitment is entered into. The value of the security may vary with market fluctuations during the time before the Funds take delivery of the security. No interest accrues to the Funds until the transaction settles.
Delayed delivery transactions include those designated as To Be Announced (“TBAs”) in the Portfolios of Investments. For TBAs, the actual security that will be delivered to fulfill the transaction is not designated at the time of the trade. The security is “to be announced” 48 hours prior to the established trade settlement date. Certain transactions require the Funds or counterparty to post cash and/or securities as collateral for the net mark-to-market exposure to the other party. The Funds cover their net obligations under outstanding delayed delivery commitments by segregating or earmarking cash or securities at the custodian.
Purchases of when-issued or delayed delivery securities may have a similar effect on the Funds’ NAV as if the Funds’ had created a degree of leverage in the portfolio. Risks
| 62
Notes to Financial Statements (continued)
September 30, 2018
may arise upon entering into such transactions from the potential inability of counterparties to meet their obligations under the transactions. Additionally, losses may arise due to changes in the value of the underlying securities.
There were no when-issued or delayed delivery securities held by the Funds as of September 30, 2018.
g. New Disclosure Requirements. In accordance with new reporting requirements pursuant to Regulation S-X of the Securities and Exchange Commission, presentation of certain amounts on the Statements of Changes in Net Assets, for the year ended September 30, 2017, have been conformed to meet the new disclosure requirements. These adjustments include Distributions to Shareholders; where the prior disclosure separately stated distributions from net investment income and distributions from net realized capital gains for each share class of the Fund, they are now combined into a single line item for each respective share class. In addition, disclosure of Undistributed Net Investment Income has been removed from the Statements of Changes in Net Assets.
The following is a summary of the previously disclosed amounts, as reported at September 30, 2017:
| | | | |
| Global Allocation Fund | | | |
FROM DISTRIBUTIONS TO SHAREHOLDERS: | | | | |
Net investment income | | | | |
Class A | | $ | (3,289,853 | ) |
Class C | | | (1,771,656 | ) |
Class Y | | | (12,428,003 | ) |
| | | | |
Total distributions | | $ | (17,489,512 | ) |
| | | | |
UNDISTRIBUTED NET INVESTMENT INCOME | | $ | 10,545,895 | |
| | | | |
| |
| Growth Fund | | | |
FROM DISTRIBUTIONS TO SHAREHOLDERS: | | | | |
Net investment income | | | | |
Class A | | $ | (2,941,318 | ) |
Class N | | | (688,493 | ) |
Class Y | | | (21,181,423 | ) |
Net realized capital gains | | | | |
Class A | | | (7,024,882 | ) |
Class C | | | (1,227,895 | ) |
Class N | | | (992,374 | ) |
Class Y | | | (34,329,937 | ) |
| | | | |
Total distributions | | $ | (68,386,322 | ) |
| | | | |
UNDISTRIBUTED NET INVESTMENT INCOME | | $ | 28,890,806 | |
| | | | |
h. Federal and Foreign Income Taxes. The Trust treats each Fund as a separate entity for federal income tax purposes. Each Fund intends to meet the requirements of the Internal Revenue Code of 1986, as amended, applicable to regulated investment
63 |
Notes to Financial Statements (continued)
September 30, 2018
companies, and to distribute to its shareholders substantially all of its net investment income and any net realized capital gains at least annually. Management has performed an analysis of each Fund’s tax positions for the open tax years as of September 30, 2018 and has concluded that no provisions for income tax are required. The Funds’ federal tax returns for the prior three fiscal years remain subject to examination by the Internal Revenue Service. Management is not aware of any events that are reasonably possible to occur in the next twelve months that would result in the amounts of any unrecognized tax benefits significantly increasing or decreasing for the Funds. However, management’s conclusions regarding tax positions taken may be subject to review and adjustment at a later date based on factors including, but not limited to, new tax laws and accounting regulations and interpretations thereof.
A Fund may be subject to foreign withholding taxes on investment income and taxes on capital gains on investments that are accrued and paid based upon the Fund’s understanding of the tax rules and regulations that exist in the countries in which the Fund invests. Foreign withholding taxes on dividend and interest income are reflected on the Statements of Operations as a reduction of investment income, net of amounts eligible to be reclaimed. Dividends and interest receivable on the Statements of Assets and Liabilities are net of foreign withholding taxes. Foreign withholding taxes where reclaims have been or will be filed are reflected on the Statements of Assets and Liabilities as tax reclaims receivable. Capital gains taxes paid are included in net realized gain (loss) on investments in the Statements of Operations. Accrued but unpaid capital gains taxes are reflected as foreign taxes payable on the Statements of Assets and Liabilities, if applicable, and reduce unrealized gains on investments. In the event that realized gains on investments are subsequently offset by realized losses, taxes paid on realized gains may be returned to a Fund. Such amounts, if applicable, are reflected as foreign tax rebates receivable on the Statements of Assets and Liabilities and are recorded as a realized gain when received.
i. Dividends and Distributions to Shareholders. Dividends and distributions are recorded on ex-dividend date. The timing and characterization of certain income and capital gain distributions are determined in accordance with federal tax regulations, which may differ from accounting principles generally accepted in the United States of America. Permanent differences are primarily due to differing treatments for book and tax purposes of items such as foreign currency gains and losses, paydown gains and losses, contingent payment debt instruments, convertible bonds, and premium amortization. Permanent book and tax basis differences relating to shareholder distributions will result in reclassifications to capital accounts reported on the Statements of Assets and Liabilities. Temporary differences between book and tax distributable earnings are primarily due to deferred Trustees’ fees, forward foreign currency contract mark-to-market, wash sales, premium amortization, contingent payment debt instruments, trust preferred securities, convertible bonds and return of capital distributions received. Amounts of income and capital gain available to be
| 64
Notes to Financial Statements (continued)
September 30, 2018
distributed on a tax basis are determined annually, and at other times during the Funds’ fiscal year as may be necessary to avoid knowingly declaring and paying a return of capital distribution. Distributions from net investment income and net realized short-term capital gains are reported as distributed from ordinary income for tax purposes.
The tax characterization of distributions is determined on an annual basis. The tax character of distributions paid to shareholders during the years ended September 30, 2018 and 2017 were as follows:
| | | | | | | | | | | | | | | | | | | | | | | | |
| | | 2018 Distributions Paid From: | | | 2017 Distributions Paid From: | |
Fund | | Ordinary
Income | | | Long-Term
Capital
Gains | | | Total | | | Ordinary
Income | | | Long-Term
Capital
Gains | | | Total | |
Global Allocation Fund | | $ | 15,533,777 | | | $ | 24,595,545 | | | $ | 40,129,322 | | | $ | 17,489,512 | | | $ | — | | | $ | 17,489,512 | |
Growth Fund | | | 38,048,905 | | | | 144,994,363 | | | | 183,043,268 | | | | 37,517,315 | | | | 30,869,007 | | | | 68,386,322 | |
For the year ended September 30, 2017 differences between amounts previously reported and now disclosed in Note 2g of the Notes to Financial Statements are primarily attributable to different book and tax treatment for short-term capital gains.
Distributions paid to shareholders from net investment income and net realized capital gains, based on accounting principles generally accepted in the United States of America, are consolidated and reported on the Statements of Changes in Net Assets as Distributions to Shareholders. Distributions paid to shareholders from net investment income and net realized capital gains expressed in per-share amounts, based on accounting principles generally accepted in the United States of America, are separately stated and reported within the Financial Highlights.
As of September 30, 2018, the components of distributable earnings on a tax basis were as follows:
| | | | | | | | |
| | | Global
Allocation
Fund | | | Growth
Fund | |
Undistributed ordinary income | | $ | 14,665,257 | | | $ | 33,931,827 | |
Undistributed long-term capital gains | | | 71,351,617 | | | | 312,860,361 | |
| | | | | | | | |
Total undistributed earnings | | | 86,016,874 | | | | 346,792,188 | |
| | | | | | | | |
Unrealized appreciation | | | 425,529,351 | | | | 2,377,035,654 | |
| | | | | | | | |
Total accumulated earnings | | $ | 511,546,225 | | | $ | 2,723,827,842 | |
| | | | | | | | |
65 |
Notes to Financial Statements (continued)
September 30, 2018
As of September 30, 2018, unrealized appreciation (depreciation) as a component of distributable earnings was as follows:
| | | | | | | | |
| | | Global
Allocation
Fund | | | Growth
Fund | |
Unrealized appreciation (depreciation) | | | | | | | | |
Investments | | $ | 432,961,062 | | | $ | 2,377,035,654 | |
Foreign currency translations | | | (7,431,711 | ) | | | — | |
| | | | | | | | |
Total unrealized appreciation | | $ | 425,529,351 | | | $ | 2,377,035,654 | |
| | | | | | | | |
As of September 30, 2018, the cost of investments (including derivatives, if applicable) and unrealized appreciation (depreciation) on a federal tax basis were as follows:
| | | | | | | | |
| | | Global
Allocation
Fund | | | Growth
Fund | |
Federal tax cost | | $ | 1,989,471,226 | | | $ | 6,445,004,151 | |
| | | | | | | | |
Gross tax appreciation | | $ | 458,142,747 | | | $ | 2,424,426,221 | |
Gross tax depreciation | | | (32,504,196 | ) | | | (47,390,567 | ) |
| | | | | | | | |
Net tax appreciation | | $ | 425,638,551 | | | $ | 2,377,035,654 | |
| | | | | | | | |
Differences between these amounts and those reported in the components of distributable earnings are primarily attributable to foreign currency translation and capital gains taxes.
j. Repurchase Agreements. Each Fund may enter into repurchase agreements, under the terms of a Master Repurchase Agreement, under which each Fund acquires securities as collateral and agrees to resell the securities at an agreed upon time and at an agreed upon price. It is each Fund’s policy that the market value of the collateral for repurchase agreements be at least equal to 102% of the repurchase price, including interest. Certain repurchase agreements are tri-party arrangements whereby the collateral is held in a segregated account for the benefit of the Fund and on behalf of the counterparty. Repurchase agreements could involve certain risks in the event of default or insolvency of the counterparty, including possible delays or restrictions upon a Fund’s ability to dispose of the underlying securities. As of September 30, 2018, each Fund, as applicable, had investments in repurchase agreements for which the value of the related collateral exceeded the value of the repurchase agreement. The gross value of repurchase agreements is included in the Statements of Assets and Liabilities for financial reporting purposes.
k. Securities Lending. The Funds have entered into an agreement with State Street Bank and Trust Company (“State Street Bank”), as agent of the Funds, to lend
| 66
Notes to Financial Statements (continued)
September 30, 2018
securities to certain designated borrowers. The loans are collateralized with cash or securities in an amount equal to at least 105% or 102% of the market value (including accrued interest) of the loaned international or domestic securities, respectively, when the loan is initiated. Thereafter, the value of the collateral must remain at least 102% of the market value (including accrued interest) of loaned securities for U.S. equities and U.S. corporate debt; at least 105% of the market value (including accrued interest) of loaned securities for non-U.S. equities; and at least 100% of the market value (including accrued interest) of loaned securities for U.S. Government securities, sovereign debt issued by non-U.S. Governments and non-U.S. corporate debt. In the event that the market value of the collateral falls below the required percentages described above, the borrower will deliver additional collateral on the next business day. As with other extensions of credit, the Funds may bear the risk of loss with respect to the investment of the collateral. The Funds invest cash collateral in short-term investments, a portion of the income from which is remitted to the borrowers and the remainder allocated between the Funds and State Street Bank as lending agent.
For the year ended September 30, 2018, neither Fund had loaned securities under this agreement.
l. Indemnifications. Under the Trust’s organizational documents, its officers and Trustees are indemnified against certain liabilities arising out of the performance of their duties to the Funds. Additionally, in the normal course of business, the Funds enter into contracts with service providers that contain general indemnification clauses. The Funds’ maximum exposure under these arrangements is unknown as this would involve future claims that may be made against the Funds that have not yet occurred. However, based on experience, the Funds expect the risk of loss to be remote.
3. Fair Value Measurements. In accordance with accounting standards related to fair value measurements and disclosures, the Funds have categorized the inputs utilized in determining the value of each Fund’s assets or liabilities. These inputs are summarized in the three broad levels listed below:
| | • | | Level 1 – quoted prices in active markets for identical assets or liabilities; |
| | • | | Level 2 – prices determined using other significant inputs that are observable either directly, or indirectly through corroboration with observable market data (which could include quoted prices for similar assets or liabilities, interest rates, credit risk, etc.); and |
| | • | | Level 3 – prices determined using significant unobservable inputs when quoted prices or observable inputs are unavailable such as when there is little or no market activity for an asset or liability (unobservable inputs reflect each Fund’s own assumptions in determining the fair value of assets or liabilities and would be based on the best information available). |
67 |
Notes to Financial Statements (continued)
September 30, 2018
The inputs or methodology used for valuing securities are not necessarily an indication of the risk associated with investing in those securities.
The Funds’ pricing policies and procedures are recommended by the adviser and approved by the Board of Trustees. Debt securities are valued based on evaluated bids furnished to the Funds by an independent pricing service. Broker-dealer bid prices may be used if an independent pricing service either is unable to price a security or does not provide a reliable price for a security. Broker-dealer bid prices for which the Funds do not have knowledge of the inputs used by the broker-dealer are categorized in Level 3. All security prices, including those obtained from an independent pricing service and broker-dealer bid prices, are reviewed on a daily basis by the adviser, subject to oversight by Fund management and the Board of Trustees. If the adviser, in good faith, believes that the price provided by an independent pricing service is unreliable, broker-dealer bid prices may be used until the price provided by the independent pricing service is considered to be reliable. Reliability of all security prices, including those obtained from an independent pricing service and broker-dealer bid prices, is tested in a variety of ways, including comparison to recent transaction prices and daily fluctuations, amongst other validation procedures in place. Securities for which market quotations are not readily available are valued at fair value as determined in good faith by the Funds’ adviser pursuant to procedures approved by the Board of Trustees. Fair valued securities may be categorized in Level 3.
The following is a summary of the inputs used to value the Funds’ investments as of September 30, 2018, at value:
Global Allocation Fund
Asset Valuation Inputs
| | | | | | | | | | | | | | | | |
Description | | Level 1 | | | Level 2 | | | Level 3 | | | Total | |
Common Stocks | | | | | | | | | | | | | | | | |
France | | $ | — | | | $ | 40,387,889 | | | $ | — | | | $ | 40,387,889 | |
Hong Kong | | | — | | | | 68,114,525 | | | | — | | | | 68,114,525 | |
India | | | — | | | | 17,524,813 | | | | — | | | | 17,524,813 | |
Japan | | | — | | | | 26,258,307 | | | | — | | | | 26,258,307 | |
Sweden | | | — | | | | 48,590,074 | | | | — | | | | 48,590,074 | |
Switzerland | | | — | | | | 158,478,636 | | | | — | | | | 158,478,636 | |
United Kingdom | | | — | | | | 111,275,842 | | | | — | | | | 111,275,842 | |
United States | | | 1,048,647,594 | | | | 7,035 | | | | — | | | | 1,048,654,629 | |
All Other Common Stocks(a) | | | 98,543,410 | | | | — | | | | — | | | | 98,543,410 | |
| | | | | | | | | | | | | | | | |
Total Common Stocks | | | 1,147,191,004 | | | | 470,637,121 | | | | — | | | | 1,617,828,125 | |
| | | | | | | | | | | | | | | | |
| 68
Notes to Financial Statements (continued)
September 30, 2018
Global Allocation Fund (continued)
Asset Valuation Inputs (continued)
| | | | | | | | | | | | | | | | |
Description | | Level 1 | | | Level 2 | | | Level 3 | | | Total | |
Bonds and Notes | | | | | | | | | | | | | | | | |
Non-Convertible Bonds | | | | | | | | | | | | | | | | |
United States | | $ | 35,577 | | | $ | 315,848,565 | | | $ | 124,748 | (b) | | $ | 316,008,890 | |
All Other Non-Convertible Bonds(a) | | | — | | | | 252,243,868 | | | | — | | | | 252,243,868 | |
| | | | | | | | | | | | | | | | |
Total Non-Convertible Bonds | | | 35,577 | | | | 568,092,433 | | | | 124,748 | | | | 568,252,758 | |
| | | | | | | | | | | | | | | | |
Convertible Bonds(a) | | | — | | | | 12,044,193 | | | | — | | | | 12,044,193 | |
Municipals(a) | | | — | | | | 277,630 | | | | — | | | | 277,630 | |
| | | | | | | | | | | | | | | | |
Total Bonds and Notes | | | 35,577 | | | | 580,414,256 | | | | 124,748 | | | | 580,574,581 | |
| | | | | | | | | | | | | | | | |
Preferred Stocks(a) | | | 1,798,260 | | | | 565,615 | | | | — | | | | 2,363,875 | |
Short-Term Investments | | | — | | | | 214,250,939 | | | | — | | | | 214,250,939 | |
| | | | | | | | | | | | | | | | |
Total Investments | | | 1,149,024,841 | | | | 1,265,867,931 | | | | 124,748 | | | | 2,415,017,520 | |
| | | | | | | | | | | | | | | | |
Forward Foreign Currency Contracts (unrealized appreciation) | | | — | | | | 463,197 | | | | — | | | | 463,197 | |
| | | | | | | | | | | | | | | | |
Total | | $ | 1,149,024,841 | | | $ | 1,266,331,128 | | | $ | 124,748 | | | $ | 2,415,480,717 | |
| | | | | | | | | | | | | | | | |
Liability Valuation Inputs
| | | | | | | | | | | | | | | | |
Description | | Level 1 | | | Level 2 | | | Level 3 | | | Total | |
Forward Foreign Currency Contracts (unrealized depreciation) | | $ | — | | | $ | (2,117,874 | ) | | $ | — | | | $ | (2,117,874 | ) |
| | | | | | | | | | | | | | | | |
| (a) | Details of the major categories of the Fund’s investments are reflected within the Portfolio of Investments. |
| (b) | Valued using broker-dealer bid prices. |
Growth Fund
Asset Valuation Inputs
| | | | | | | | | | | | | | | | |
Description | | Level 1 | | | Level 2 | | | Level 3 | | | Total | |
Common Stocks(a) | | $ | 8,692,205,365 | | | $ | — | | | $ | — | | | $ | 8,692,205,365 | |
Short-Term Investments | | | — | | | | 129,834,440 | | | | — | | | | 129,834,440 | |
| | | | | | | | | | | | | | | | |
Total | | $ | 8,692,205,365 | | | $ | 129,834,440 | | | $ | — | | | $ | 8,822,039,805 | |
| | | | | | | | | | | | | | | | |
| (a) | Details of the major categories of the Fund’s investments are reflected within the Portfolio of Investments. |
69 |
Notes to Financial Statements (continued)
September 30, 2018
For the year ended September 30, 2018, there were no transfers among Levels 1, 2 and 3.
The following is a reconciliation of Level 3 investments for which significant unobservable inputs were used to determine fair value as of September 30, 2017 and/or September 30, 2018:
Global Allocation Fund
Asset Valuation Inputs
| | | | | | | | | | | | | | | | | | | | |
Investments in Securities | | Balance as of
September 30,
2017 | | | Accrued
Discounts
(Premiums) | | | Realized
Gain (Loss) | | | Change in
Unrealized
Appreciation
(Depreciation) | | | Purchases | |
Common Stocks | | | | | | | | | | | | | | | | | | | | |
United States | | $ | 3,886 | | | $ | — | | | $ | — | | | $ | — | | | $ | — | |
Bonds and Notes | | | | | | | | | | | | | | | | | | | | |
Non-Convertible Bonds | | | | | | | | | | | | | | | | | | | | |
United States | | | 1,075,475 | | | | — | | | | (132 | ) | | | (7,526 | ) | | | — | |
| | | | | | | | | | | | | | | | | | | | |
Total | | $ | 1,079,361 | | | $ | — | | | $ | (132 | ) | | $ | (7,526 | ) | | $ | — | |
| | | | | | | | | | | | | | | | | | | | |
| | | | | |
Investments in Securities | | Sales | | | Transfers
into Level 3 | | | Transfers
out of
Level 3 | | | Balance as of
September 30,
2018 | | | Change in
Unrealized
Appreciation
(Depreciation)
from
Investments
Still Held at
September 30,
2018 | |
Common Stocks | | | | | | | | | | | | | | | | | | | | |
United States | | $ | — | | | $ | — | | | $ | (3,886 | ) | | $ | — | | | $ | — | |
Bonds and Notes | | | | | | | | | | | | | | | | | | | | |
Non-Convertible Bonds | | | | | | | | | | | | | | | | | | | | |
United States | | | (21,120 | ) | | | 153,526 | | | | (1,075,475 | ) | | | 124,748 | | | | (7,526 | ) |
| | | | | | | | | | | | | | | | | | | | |
Total | | $ | (21,120 | ) | | $ | 153,526 | | | $ | (1,079,361 | ) | | $ | 124,748 | | | $ | (7,526 | ) |
| | | | | | | | | | | | | | | | | | | | |
A common stock valued at $3,886 was transferred from Level 3 to Level 2 during the period ended September 30, 2018. At September 30, 2017, this security was valued at fair value as determined in good faith by the Fund’s advisor using broker-dealer bid prices for which the inputs are unobservable to the Fund. At September 30, 2018, this security was valued on the basis of closing bid quotations furnished to the Fund by an independent pricing service in accordance with the Fund’s valuation policies.
| 70
Notes to Financial Statements (continued)
September 30, 2018
A debt security valued at $153,526 was transferred from Level 2 to Level 3 during the period ended September 30, 2018. At September 30, 2017, this security was valued on the basis of evaluated bids furnished to the Fund by an independent pricing service in accordance with the Fund’s valuation policies. At September 30, 2018, this security was valued using broker-dealer bid prices based on inputs unobservable to the Fund as an independent pricing service did not provide a reliable price for the security.
A debt security valued at $158,100 was transferred from Level 3 to Level 2 during the period ended September 30, 2018. At September 30, 2017, this security was valued at fair value as determined in good faith by the Fund’s investment adviser as an independent pricing service did not provide a reliable price for the security. At September 30, 2018, this security was valued on the basis of evaluated bids furnished to the Fund by an independent pricing service in accordance with the Fund’s valuation policies.
A debt security valued at $917,375 was transferred from Level 3 to Level 2 during the period ended September 30, 2018. At September 30, 2017, this security was valued using broker-dealer bid prices based on inputs unobservable to the Fund as an independent pricing service was unable to price the security. At September 30, 2018, this security was valued on the basis of evaluated bids furnished to the Fund by an independent pricing service in accordance with the Fund’s valuation policies.
All transfers are recognized at the beginning of the reporting period.
4. Derivatives. Derivative instruments are defined as financial instruments whose value and performance are based on the value and performance of an underlying asset, reference rate or index. Derivative instruments that Global Allocation Fund used during the period include forward foreign currency contracts.
Global Allocation Fund is subject to the risk that changes in foreign currency exchange rates will have an unfavorable effect on the value of Fund assets denominated in foreign currencies. The Fund may enter into forward foreign currency contracts for hedging purposes to protect the value of the Fund’s holdings of foreign securities. The Fund may also use forward foreign currency contracts to gain exposure to foreign currencies, regardless of whether securities denominated in such currencies are held in the Fund. During the year ended September 30, 2018, the Fund engaged in forward foreign currency transactions for hedging purposes and to gain exposure to foreign currencies.
71 |
Notes to Financial Statements (continued)
September 30, 2018
The following is a summary of derivative instruments for Global Allocation Fund as of September 30, 2018, as reflected within the Statements of Assets and Liabilities
| | | | |
Assets | | Unrealized
appreciation on
forward foreign
currency contracts | |
Over-the-counter asset derivatives | | | | |
Foreign exchange contracts | | $ | 463,197 | |
| | |
Liabilities | | Unrealized
depreciation on
forward foreign
currency contracts |
Over-the-counter liability derivatives |
Foreign exchange contracts | | $(2,117,874) |
Transactions in derivative instruments for Global Allocation Fund during the year ended September 30, 2018 as reflected within the Statements of Operations were as follows:
| | | | |
Net Realized Gain (Loss) on: | | Forward foreign
currency contracts | |
Foreign exchange contracts | | $ | (230,410 | ) |
| | | | |
Net Change in Unrealized Appreciation
(Depreciation) on: | | Forward foreign
currency contracts | |
Foreign exchange contracts | | $ | (1,452,384 | ) |
As the Fund values its derivatives at fair value and recognizes changes in fair value through the Statement of Operations, it does not qualify for hedge accounting under authoritative guidance for derivative instruments. The Fund’s investments in derivatives may represent an economic hedge; however, they are considered to be non-hedge transactions for the purpose of these disclosures.
The volume of forward foreign currency contract activity, as a percentage of net assets, for Global Allocation Fund, based on gross month-end notional amounts outstanding during the period, including long and short positions at absolute value, was as follows for the year ended September 30, 2018:
| | | | |
Global Allocation Fund | | Forwards | |
Average Notional Amount Outstanding | | | 7.57 | % |
Highest Notional Amount Outstanding | | | 9.08 | % |
Lowest Notional Amount Outstanding | | | 6.66 | % |
Notional Amount Outstanding as of September 30, 2018 | | | 8.51 | % |
| 72
Notes to Financial Statements (continued)
September 30, 2018
Notional amounts outstanding at the end of the prior period are included in the average notional amount outstanding.
Unrealized gain and/or loss on open forwards is recorded in the Statements of Assets and Liabilities. The aggregate notional values of forward contracts are not recorded in the Statements of Assets and Liabilities, and therefore are not included in the Fund’s net assets.
Global Allocation Fund enters into over-the-counter derivatives, including forward foreign currency contracts, pursuant to International Swaps and Derivatives Association, Inc. (“ISDA”) agreements negotiated between the Fund and its counterparties. ISDA agreements typically contain, among other things, terms for the posting of collateral and master netting provisions in the event of a default or other termination event. Collateral is posted by the Fund or the counterparty to the extent of the net mark-to-market exposure to the other party of all open contracts under the agreement, subject to minimum transfer requirements. Master netting provisions allow the Fund and the counterparty, in the event of a default or other termination event, to offset amounts owed by each related to derivative contracts, including any posted collateral, to one net amount payable by either the Fund or the counterparty. The Fund’s ISDA agreements typically contain provisions that allow a counterparty to terminate open contracts early if the NAV of a Fund declines beyond a certain threshold. For financial reporting purposes, the Fund does not offset derivative assets and liabilities, and any related collateral received or pledged, on the Statements of Assets and Liabilities.
As of September 30, 2018, gross amounts of over-the-counter derivative assets and liabilities not offset in the Statements of Assets and Liabilities and the related net amounts after taking into account master netting arrangements, by counterparty, are as follows:
Global Allocation Fund
| | | | | | | | | | | | | | | | | | | | |
Counterparty | | Gross Amounts of
Assets | | | Offset
Amount | | | Net
Asset
Balance | | | Collateral
(Received)/
Pledged | | | Net
Amount | |
Bank of America, N.A. | | $ | 248,772 | | | $ | (124,991 | ) | | $ | 123,781 | | | $ | (123,781 | ) | | $ | — | |
Credit Suisse International | | | 47,147 | | | | (47,147 | ) | | | — | | | | — | | | | — | |
Goldman Sachs & Co. | | | 65,834 | | | | — | | | | 65,834 | | | | — | | | | 65,834 | |
HSBC Bank USA | | | 11,899 | | | | — | | | | 11,899 | | | | — | | | | 11,899 | |
Morgan Stanley Capital Services, Inc. | | | 4,497 | | | | — | | | | 4,497 | | | | (4,497 | ) | | | — | |
UBS AG | | | 85,048 | | | | (85,048 | ) | | | — | | | | — | | | | — | |
| | | | | | | | | | | | | | | | | | | | |
| | $ | 463,197 | | | $ | (257,186 | ) | | $ | 206,011 | | | $ | (128,278 | ) | | $ | 77,733 | |
| | | | | | | | | | | | | | | | | | | | |
73 |
Notes to Financial Statements (continued)
September 30, 2018
Global Allocation Fund (continued)
| | | | | | | | | | | | | | | | | | | | |
Counterparty | | Gross Amounts of
Assets | | | Offset
Amount | | | Net
Liability
Balance | | | Collateral
(Received)/
Pledged | | | Net
Amount | |
Bank of America, N.A. | | $ | (124,991 | ) | | $ | 124,991 | | | $ | — | | | $ | — | | | $ | — | |
Credit Suisse International | | | (1,811,063 | ) | | | 47,147 | | | | (1,763,916 | ) | | | 1,070,000 | | | | (693,916 | ) |
UBS AG | | | (181,820 | ) | | | 85,048 | | | | (96,772 | ) | | | — | | | | (96,772 | ) |
| | | | | | | | | | | | | | | | | | | | |
| | $ | (2,117,874 | ) | | $ | 257,186 | | | $ | (1,860,688 | ) | | $ | 1,070,000 | | | $ | (790,688 | ) |
| | | | | | | | | | | | | | | | | | | | |
The actual collateral received or pledged, if any, may exceed the amounts shown in the table due to overcollateralization. Timing differences may exist between when contracts under the ISDA agreements are marked-to-market and when collateral moves. The ISDA agreements include tri-party control agreements under which collateral is held for the benefit of the secured party at a third party custodian, State Street Bank.
Counterparty risk is managed based on policies and procedures established by the Fund’s adviser. Such policies and procedures may include, but are not limited to, minimum counterparty credit rating requirements, monitoring of counterparty credit default swap spreads and posting of collateral. A Fund’s risk of loss from counterparty credit risk on over-the-counter derivatives is generally limited to the Fund’s aggregated unrealized gains and the amount of any collateral pledged to the counterparty, which may be offset by any collateral posted to the Fund by the counterparty. ISDA master agreements can help to manage counterparty risk by specifying collateral posting arrangements at pre-arranged exposure levels. Under these ISDA agreements, collateral is routinely transferred if the total net exposure in respect of certain transactions, net of existing collateral already in place, exceeds a specified amount (typically $250,000, depending on the counterparty). With exchange-traded derivatives, there is minimal counterparty credit risk to the Fund because the exchange’s clearing house, as counterparty to these instruments, stands between the buyer and the seller of the contract. Credit risk still exists in exchange-traded derivatives with respect to initial and variation margin that is held in a broker’s customer accounts. While brokers are required to segregate customer margin from their own assets, in the event that a broker becomes insolvent or goes into bankruptcy and at that time there is a shortfall in the aggregate amount of margin held by the broker for all its clients, U.S. bankruptcy laws will typically allocate that shortfall on a pro rata basis across all of the broker’s customers, potentially resulting in losses to the Fund. Based on balances reflected on each Fund’s Statement of Assets and Liabilities, the following table shows (i) the maximum amount of loss due to credit risk that, based on the gross fair value of the financial instrument, the Fund would incur if parties (including OTC derivative counterparties and brokers holding margin for exchange-traded derivatives) to the
| 74
Notes to Financial Statements (continued)
September 30, 2018
relevant financial instruments failed completely to perform according to the terms of the contracts and the collateral or other security, if any, for the amount due proved to be of no value to the Fund, and (ii) the amount of loss that the Fund would incur after taking into account master netting provisions pursuant to ISDA agreements, as of September 30, 2018:
| | | | | | | | |
Fund | | Maximum Amount of Loss - Gross | | | Maximum Amount of Loss - Net | |
Global Allocation Fund | | $ | 1,533,197 | | | $ | 77,733 | |
Net loss amount reflects cash received as collateral for Global Allocation Fund of $610,000.
5. Purchases and Sales of Securities. For the year ended September 30, 2018, purchases and sales of securities (excluding short-term investments and U.S. Government/Agency securities and including paydowns) were as follows:
| | | | | | | | |
Fund | | Purchases | | | Sales | |
Global Allocation Fund | | $ | 659,469,104 | | | $ | 358,710,754 | |
Growth Fund | | | 1,344,874,832 | | | | 892,934,941 | |
For the year ended September 30, 2018, purchases and sales of U.S. Government/Agency securities by the Global Allocation Fund were $115,817,515 and $75,987,821, respectively.
6. Management Fees and Other Transactions with Affiliates.
a. Management Fees. Loomis, Sayles & Company, L.P. (“Loomis Sayles”) serves as investment adviser to each Fund. Separate management agreements for each Fund in effect for the year ended September 30, 2018, provided for fees at the following annual percentage rates of each Fund’s average daily net assets:
| | | | | | | | |
| | | Percentage of
Average
Daily Net Assets | |
Fund | | First $2 billion | | | Over $2 billion | |
Global Allocation Fund | | | 0.75 | % | | | 0.73 | % |
Growth Fund | | | 0.50 | % | | | 0.50 | % |
Loomis Sayles has given binding undertakings to the Funds to waive management fees and/or reimburse certain expenses to limit the Funds’ operating expenses, exclusive of acquired fund fees and expenses, brokerage expenses, interest expense, taxes, organizational and extraordinary expenses such as litigation and indemnification expenses. These undertakings are in effect until January 31, 2019, may be terminated before then only with the consent of the Funds’ Board of Trustees and are reevaluated
75 |
Notes to Financial Statements (continued)
September 30, 2018
on an annual basis. Management fees payable, as reflected on the Statements of Assets and Liabilities, is net of waivers and/or expense reimbursements, if any, pursuant to these undertakings. Waivers/reimbursements that exceed management fees payable are reflected on the Statements of Assets and Liabilities as receivable from investment adviser.
For the year ended September 30, 2018 the expense limits as a percentage of average daily net assets under the expense limitation agreements were as follows:
| | | | | | | | | | | | | | | | |
| | | Expense Limit as a Percentage of Average
Daily Net Assets | |
Fund | | Class A | | | Class C | | | Class N | | | Class Y | |
Global Allocation Fund | | | 1.25 | % | | | 2.00 | % | | | 0.95 | % | | | 1.00 | % |
Growth Fund | | | 1.25 | % | | | 2.00 | % | | | 0.95 | % | | | 1.00 | % |
Loomis Sayles shall be permitted to recover expenses borne under the expense limitation agreements (whether through waiver of management fees or otherwise) on a class by class basis in later periods to the extent the annual operating expenses of a class fall below a class’ expense limits, provided, however, that a class is not obligated to pay such waived/reimbursed fees or expenses more than one year after the end of the fiscal year in which the fees or expenses were waived/reimbursed.
For the year ended September 30, 2018, the management fees for each Fund were as follows:
| | | | | | | | |
Fund | | Gross
Management
Fees | | | Percentage of
Average
Daily Net Assets | |
Global Allocation Fund | | $ | 15,669,842 | | | | 0.75 | % |
Growth Fund | | | 40,912,661 | | | | 0.50 | % |
No expenses were recovered for either Fund during the year ended September 30, 2018 under the terms of the expense limitation agreements.
Certain officers and employees of Loomis Sayles are also officers or Trustees of the Trust. Loomis Sayles’ general partner is indirectly owned by Natixis Investment Managers, L.P. (“Natixis”), which is part of Natixis Investment Managers, an international asset management group based in Paris, France.
b. Service and Distribution Fees. Natixis Distribution, L.P. (“Natixis Distribution”), which is a wholly-owned subsidiary of Natixis, has entered into a distribution agreement with the Trust. Pursuant to this agreement, Natixis Distribution serves as principal underwriter of the Funds of the Trust.
Pursuant to Rule 12b-1 under the 1940 Act, the Trust has adopted a Service Plan relating to each Fund’s Class A shares (the “Class A Plans”), a Distribution and Service Plan relating to each Fund’s Class C shares (the “Class C Plans”).
| 76
Notes to Financial Statements (continued)
September 30, 2018
Under the Class A Plans, each Fund pays Natixis Distribution a monthly service fee at an annual rate not to exceed 0.25% of the average daily net assets attributable to the Fund’s Class A shares, as reimbursement for expenses incurred by Natixis Distribution in providing personal services to investors in Class A shares and/or the maintenance of shareholder accounts.
Under the Class C Plans, each Fund pays Natixis Distribution a monthly service fee at an annual rate not to exceed 0.25% of the average daily net assets attributable to the Fund’s Class C shares, as compensation for services provided by Natixis Distribution in providing personal services to investors in Class C shares and/or the maintenance of shareholder accounts.
Also under the Class C Plans, each Fund pays Natixis Distribution a monthly distribution fee at an annual rate of 0.75% of the average daily net assets attributable to the Funds’ Class C shares, as compensation for services provided by Natixis Distribution in connection with the marketing or sale of Class C shares.
For the year ended September 30, 2018, the service and distribution fees for each Fund were as follows:
| | | | | | | | | | | | |
| | | Service Fees | | | Distribution
Fees | |
Fund | | Class A | | | Class C | | | Class C | |
Global Allocation Fund | | $ | 888,699 | | | $ | 948,489 | | | $ | 2,845,466 | |
Growth Fund | | | 2,648,173 | | | | 337,629 | | | | 1,012,891 | |
c. Administrative Fees. Natixis Advisors, L.P. (“Natixis Advisors”) provides certain administrative services for the Funds and contracts with State Street Bank to serve as sub-administrator. Pursuant to an agreement among Natixis Funds Trusts, Loomis Sayles Funds Trusts, Natixis ETF Trust and Natixis Advisors, each Fund pays Natixis Advisors monthly its pro rata portion of fees equal to an annual rate of 0.0575% of the first $15 billion of the average daily net assets of the Natixis Funds Trusts, Loomis Sayles Funds Trusts and Natixis ETF Trust, 0.0500% of the next $15 billion, 0.0400% of the next $30 billion, 0.0275% of the next $30 billion and 0.0225% of such assets in excess of $90 billion, subject to an annual aggregate minimum fee for the Natixis Funds Trusts, Loomis Sayles Funds Trusts and Natixis ETF Trust of $10 million, which is reevaluated on an annual basis.
Prior to July 1, 2018, each Fund paid Natixis Advisors monthly its pro rata portion of fees equal to an annual rate of 0.0575% of the first $15 billion of the average daily net assets of the Natixis Funds Trusts, Loomis Sayles Funds Trusts and Natixis ETF Trust, 0.0500% of the next $15 billion, 0.0400% of the next $30 billion, 0.0350% of the next $30 billion and 0.0325% of such assets in excess of $90 billion, subject to an annual aggregate minimum fee for the Natixis Funds Trusts, Loomis Sayles Funds Trusts and Natixis ETF Trust of $10 million, which was reevaluated on an annual basis.
77 |
Notes to Financial Statements (continued)
September 30, 2018
For the year ended September 30, 2018, the administrative fees for each Fund were as follows:
| | | | |
Fund | | Administrative
Fees | |
Global Allocation Fund | | $ | 920,112 | |
Growth Fund | | | 3,599,450 | |
d. Sub-Transfer Agent Fees. Natixis Distribution has entered into agreements, which include servicing agreements, with financial intermediaries that provide recordkeeping, processing, shareholder communications and other services to customers of the intermediaries that hold positions in the Funds and has agreed to compensate the intermediaries for providing those services. Intermediaries transact with the Funds primarily through the use of omnibus accounts on behalf of their customers who hold positions in the Funds. These services would have been provided by the Funds’ transfer agent and other service providers if the shareholders’ accounts were maintained directly at the Funds’ transfer agent. Accordingly, the Funds have agreed to reimburse Natixis Distribution for all or a portion of the servicing fees paid to these intermediaries. The reimbursement amounts (sub-transfer agent fees) paid to Natixis Distribution are subject to a current per-account equivalent fee limit approved by the Funds’ Board of Trustees, which is based on fees for similar services paid to the Funds’ transfer agent and other service providers. Class N shares do not bear such expenses.
For the year ended September 30, 2018, the sub-transfer agent fees (which are reflected in transfer agent fees and expenses in the Statements of Operations) for each Fund were as follows:
| | | | |
Fund | | Sub-Transfer
Agent Fees | |
Global Allocation Fund | | $ | 1,576,887 | |
Growth Fund | | | 6,067,378 | |
As of September 30, 2018, the Funds owe Natixis Distribution the following reimbursements for sub-transfer agent fees (which are reflected in the Statements of Assets and Liabilities as payable to distributor):
| | | | |
Fund | | Reimbursements of
Sub-Transfer
Agent Fees | |
Global Allocation Fund | | $ | 43,216 | |
Growth Fund | | | 79,497 | |
Sub-transfer agent fees attributable to Class A, Class C and Class Y are allocated on a pro rata basis to each class based on the relative net assets of each class to the total net assets of those classes.
| 78
Notes to Financial Statements (continued)
September 30, 2018
e. Commissions. Commissions (including CDSCs) on Fund shares retained by Natixis Distribution during the year ended September 30, 2018, were as follows:
| | | | |
Fund | | Commissions | |
Global Allocation Fund | | $ | 125,405 | |
Growth Fund | | | 75,263 | |
f. Trustees Fees and Expenses. The Trust does not pay any compensation directly to its officers or Trustees who are directors, officers or employees of Natixis Advisors, Natixis Distribution, Natixis US or their affiliates. The Chairperson of the Board of Trustees receives a retainer fee at the annual rate of $340,000. The Chairperson does not receive any meeting attendance fees for Board of Trustees meetings or committee meetings that he attends. Each Independent Trustee (other than the Chairperson) receives, in the aggregate, a retainer fee at the annual rate of $170,000. Each Independent Trustee also receives a meeting attendance fee of $10,000 for each meeting of the Board of Trustees that he or she attends in person and $5,000 for each meeting of the Board of Trustees that he or she attends telephonically. In addition, the chairperson of the Contract Review Committee and the chairperson of the Audit Committee each receive an additional retainer fee at the annual rate of $20,000. The chairperson of the Governance Committee receives an additional retainer fee at the annual rate of $12,000. Each Contract Review Committee member is compensated $6,000 for each Committee meeting that he or she attends in person and $3,000 for each meeting that he or she attends telephonically. Each Audit Committee member is compensated $6,000 for each Committee meeting that he or she attends in person and $3,000 for each meeting that he or she attends telephonically. These fees are allocated among the funds in the Natixis Funds Trusts, Loomis Sayles Funds Trusts and Natixis ETF Trust based on a formula that takes into account, among other factors, the relative net assets of each fund. Trustees are reimbursed for travel expenses in connection with attendance at meetings.
Prior to January 1, 2018, the Chairperson of the Board received a retainer fee at the annual rate of $325,000 and each Independent Trustee (other than the Chairperson) received, in the aggregate, a retainer fee at the annual rate of $155,000, the chairperson of the Contract Review Committee and Audit Committee each received an additional retainer fee at the annual rate of $17,500 and the chairperson of the Governance Committee received an additional retainer fee at the annual rate of $10,000. All other Trustee fees remained unchanged.
A deferred compensation plan (the “Plan”) is available to the Trustees on a voluntary basis. Deferred amounts remain in the Funds until distributed in accordance with the provisions of the Plan. The value of a participating Trustee’s deferral account is based on theoretical investments of deferred amounts, on the normal payment dates, in certain funds of the Natixis Funds Trusts, Loomis Sayles Funds Trusts and Natixis ETF Trust as designated by the participating Trustees. Changes in the value of participants’ deferral accounts are allocated pro rata among the funds in the Natixis Funds Trusts,
79 |
Notes to Financial Statements (continued)
September 30, 2018
Loomis Sayles Funds Trusts and Natixis ETF Trust, and are normally reflected as Trustees’ fees and expenses in the Statements of Operations. The portions of the accrued obligations allocated to the Funds under the Plan are reflected as Deferred Trustees’ fees in the Statements of Assets and Liabilities.
g. Affiliated Ownership. As of September 30, 2018, Loomis Sayles Funded Pension Plan and Trust (“Pension Plan”) and Loomis Sayles Employees’ Profit Sharing Retirement Plan (“Retirement Plan”) held shares of the Funds representing the following percentages of the Funds’ net assets:
| | | | | | | | | | | | |
Fund | | Pension
Plan | | | Retirement
Plan | | | Total Affiliated
Ownership | |
Global Allocation Fund | | | — | | | | 0.80 | % | | | 0.80 | % |
Growth Fund | | | 0.21 | % | | | 0.64 | % | | | 0.85 | % |
Investment activities of affiliated shareholders could have material impacts on the Funds.
h. Reimbursement of Transfer Agent Fees and Expenses. Natixis Advisors has given a binding contractual undertaking to the Global Allocation Fund to reimburse any and all transfer agency expenses for the Fund’s Class N shares. This undertaking is in effect through January 31, 2019.
Natixis Advisors has given a binding contractual undertaking to the Growth Fund to reimburse any and all transfer agency expenses attributable to accounts admitted to Class N via a provision that allows Natixis Distribution, at its sole discretion, to waive the investment minimum for certain accounts, as described in the Fund’s prospectus. This undertaking is in effect through June 30, 2019. Prior to February 1, 2018, Natixis Advisors had given a binding contractual undertaking to the Fund to reimburse any and all transfer agency expenses for the Fund’s Class N shares.
Expenses reimbursed pursuant to these undertakings are not subject to recovery under the expense limitation agreement described above.
For the year ended September 30, 2018, Natixis Advisors reimbursed the Funds for transfer agency expenses as follows:
| | | | |
Fund | | Reimbursement of Transfer Agency Expenses | |
| | | Class N | |
Global Allocation Fund | | $ | 478 | |
Growth Fund | | | 29,092 | |
7. Class-Specific Transfer Agent Fees and Expenses. Transfer agent fees and expenses attributable to Class A, Class C and Class Y are allocated on a pro rata basis to each class based on the relative net assets of each class to the total net assets of those classes. Transfer agent fees and expenses attributable to Class N are allocated to Class N.
| 80
Notes to Financial Statements (continued)
September 30, 2018
For the year ended September 30, 2018 the Funds incurred the following class-specific transfer agent fees and expenses (including sub-transfer agent fees, where applicable):
| | | | | | | | | | | | | | | | |
| | | Transfer Agent Fees and Expenses | |
Fund | | Class A | | | Class C | | | Class N | | | Class Y | |
Global Allocation Fund | | $ | 290,463 | | | $ | 310,328 | | | $ | 478 | | | $ | 1,052,158 | |
Growth Fund | | | 905,599 | | | | 115,568 | | | | 30,440 | | | | 5,424,243 | |
8. Line of Credit. Effective April 12, 2018, each Fund, together with certain other funds of Natixis Funds Trusts, Loomis Sayles Funds Trusts and Natixis ETF Trust, entered into a $400,000,000 committed unsecured line of credit provided by State Street Bank. Any one Fund may borrow up to $350,000,000 under the line of credit agreement (as long as all borrowings by all Funds in the aggregate do not exceed the $400,000,000 limit at any time), subject to each Fund’s investment restrictions and its contractual obligations under the line of credit. Interest is charged to the Funds based upon the terms set forth in the agreement. In addition, a commitment fee of 0.15% per annum, payable at the end of each calendar quarter, is accrued and apportioned among the participating funds based on their average daily unused portion of the line of credit. The Funds paid an arrangement fee, an upfront fee, and other fees in connection with the new line of credit agreement, which are being amortized over a period of 364 days and are reflected as miscellaneous expenses on the Statements of Operations. The unamortized balance is reflected as prepaid expenses on the Statements of Assets and Liabilities.
Prior to April 12, 2018, each Fund, together with certain other funds of Natixis Funds Trusts and Loomis Sayles Funds Trusts, entered into a 364-day, $400,000,000 syndicated, committed, unsecured line of credit with Citibank, N.A. to be used for temporary or emergency purposes only. Any one Fund was able borrow up to the full $400,000,000 under the line of credit (as long as all borrowings by all Funds in the aggregate did not exceed the $400,000,000 limit at any time), subject to each Fund’s investment restrictions and its contractual obligations under the line of credit. Interest was charged to the Funds at a rate equal to the greater of the eurodollar or the federal funds rate plus 1.00%. In addition, a commitment fee of 0.15% per annum, payable on the last business day of each month, was accrued and apportioned among the participating funds based on their average daily unused portion of the line of credit.
For the year ended September 30, 2018, neither Fund had borrowings under this agreement.
9. Brokerage Commission Recapture. Each Fund had entered into agreements with certain brokers whereby the brokers will rebate a portion of brokerage commissions. All amounts rebated by the brokers are returned to the Funds under such agreements and are
81 |
Notes to Financial Statements (continued)
September 30, 2018
included in realized gains on investments on the Statements of Operations. For the year ended September 30, 2018, amounts rebated under these agreements were as follows:
| | | | |
Fund | | Rebates | |
Global Allocation Fund | | $ | 19,202 | |
Growth Fund | | | 42,577 | |
Effective March 9, 2018, the brokerage commission recapture program was terminated.
10. Concentration of Risk. Each Fund’s investments in foreign securities are subject to foreign currency fluctuations, higher volatility than U.S. securities, varying degrees of regulation and limited liquidity. Greater political, economic, credit and information risks are also associated with foreign securities.
11. Concentration of Ownership. From time to time, a Fund may have a concentration of one or more accounts constituting a significant percentage of shares outstanding. Investment activities by holders of such accounts could have material impacts on the Funds. As of September 30, 2018, based on management’s evaluation of the shareholder account base, the Funds had accounts representing controlling ownership of more than 5% of the Funds’ total outstanding shares. The number of such accounts, based on accounts that represent more than 5% of an individual class of shares, and the aggregate percentage of net assets represented by such holdings were as follows:
| | | | | | | | |
| | | Number of 5%
Non- Affiliated
Account Holders | | | Percentage of
Non- Affiliated
Ownership | |
Growth Fund | | | 6 | | | | 57.34 | % |
Omnibus shareholder accounts for which Natixis Advisors understands that the intermediary has discretion over the underlying shareholder accounts or investment models where a shareholder account may be invested for a non-discretionary customer are included in the table above. For other omnibus accounts, the Funds do not have information on the individual shareholder accounts underlying the omnibus accounts; therefore, there could be other 5% shareholders in addition to those disclosed in the table above.
| 82
Notes to Financial Statements (continued)
September 30, 2018
12. Capital Shares. Each Fund may issue an unlimited number of shares of beneficial interest, without par value. Transactions in capital shares were as follows:
| | | | | | | | | | | | | | | | |
| |
| Year Ended
September 30, 2018 |
| |
| Year Ended
September 30, 2017(a) |
|
Global Allocation Fund | | | Shares | | | | Amount | | | | Shares | | | | Amount | |
| Class A | |
Issued from the sale of shares | | | 8,103,965 | | | $ | 184,844,305 | | | | 4,990,165 | | | $ | 100,716,829 | |
Issued in connection with the reinvestment of distributions | | | 259,737 | | | | 5,734,993 | | | | 140,170 | | | | 2,609,969 | |
Redeemed | | | (5,133,874 | ) | | | (116,824,548 | ) | | | (5,616,924 | ) | | | (111,165,803 | ) |
| | | | | | | | | | | | | | | | |
Net change | | | 3,229,828 | | | $ | 73,754,750 | | | | (486,589 | ) | | $ | (7,839,005 | ) |
| | | | | | | | | | | | | | | | |
| Class C | |
Issued from the sale of shares | | | 6,101,385 | | | $
| 137,2
96,960 |
| | | 1,966,061 | | | $ | 38,867,350 | |
Issued in connection with the reinvestment of distributions | | | 149,300 | | | | 3,268,181 | | | | 55,158 | | | | 1,018,222 | |
Redeemed | | | (4,761,750 | ) | | | (107,144,492 | ) | | | (7,808,773 | ) | | | (152,602,063 | ) |
| | | | | | | | | | | | | | | | |
Net change | | | 1,488,935 | | | $ | 33,420,649 | | | | (5,787,554 | ) | | $ | (112,716,491 | ) |
| | | | | | | | | | | | | | | | |
| Class N | | | | | | | | | | | | | | | | |
Issued from the sale of shares | | | 880,524 | | | $ | 20,044,847 | | | | 2,739,038 | | | $ | 58,209,318 | |
Issued in connection with the reinvestment of distributions | | | 70,593 | | | | 1,565,047 | | | | — | | | | — | |
Redeemed | | | (234,590 | ) | | | (5,402,022 | ) | | | (107 | ) | | | (2,286 | ) |
| | | | | | | | | | | | | | | | |
Net change | | | 716,527 | | | $ | 16,207,872 | | | | 2,738,931 | | | $ | 58,207,032 | |
| | | | | | | | | | | | | | | | |
| |
| Year Ended
September 30, 2018 |
| |
| Year Ended
September 30, 2017(a) |
|
Global Allocation Fund | | | Shares | | | | Amount | | | | Shares | | | | Amount | |
| Class Y | | | | | | | | | | | | | | | | |
Issued from the sale of shares | | | 26,704,228 | | | $ | 611,912,156 | | | | 19,036,860 | | | $ | 382,730,980 | |
Issued in connection with the reinvestment of distributions | | | 905,490 | | | | 20,083,757 | | | | 520,438 | | | | 9,732,190 | |
Redeemed | | | (10,059,816 | ) | | | (229,836,093 | ) | | | (13,769,090 | ) | | | (276,314,577 | ) |
| | | | | | | | | | | | | | | | |
Net change | | | 17,549,902 | | | $ | 402,159,820 | | | | 5,788,208 | | | $ | 116,148,593 | |
| | | | | | | | | | | | | | | | |
Increase (decrease) from capital share transactions | | | 22,985,192 | | | $ | 525,543,091 | | | | 2,252,996 | | | $ | 53,800,129 | |
| | | | | | | | | | | | | | | | |
| (a) | From commencement of operations on February 1, 2017 through September 30, 2017 for Class N shares. |
83 |
Notes to Financial Statements (continued)
September 30, 2018
12. Capital Shares (continued).
| | | | | | | | | | | | | | | | |
| |
| Year Ended
September 30, 2018 |
| |
| Year Ended
September 30, 2017 |
|
Growth Fund | | | Shares | | | | Amount | | | | Shares | | | | Amount | |
| Class A | |
Issued from the sale of shares | | | 9,892,333 | | | $ | 148,235,534 | | | | 23,963,667 | | | $ | 290,490,483 | |
Issued in connection with the reinvestment of distributions | | | 1,464,494 | | | | 21,381,619 | | | | 786,586 | | | | 8,974,953 | |
Redeemed | | | (13,865,728 | ) | | | (209,484,702 | ) | | | (15,774,109 | ) | | | (197,838,024 | ) |
| | | | | | | | | | | | | | | | |
Net change | | | (2,508,901 | ) | | $ | (39,867,549 | ) | | | 8,976,144 | | | $ | 101,627,412 | |
| | | | | | | | | | | | | | | | |
| Class C | |
Issued from the sale of shares | | | 1,122,136 | | | $ | 15,439,085 | | | | 3,905,114 | | | $ | 42,699,406 | |
Issued in connection with the reinvestment of distributions | | | 148,410 | | | | 1,993,145 | | | | 68,093 | | | | 719,057 | |
Redeemed | | | (2,724,624 | ) | | | (37,772,137 | ) | | | (3,588,005 | ) | | | (41,290,336 | ) |
| | | | | | | | | | | | | | | | |
Net change | | | (1,454,078 | ) | | $ | (20,339,907 | ) | | | 385,202 | | | $ | 2,128,127 | |
| | | | | | | | | | | | | | | | |
| Class N | |
Issued from the sale of shares | | | 43,285,115 | | | $ | 684,373,304 | | | | 19,181,068 | | | $ | 266,844,514 | |
Issued in connection with the reinvestment of distributions | | | 380,354 | | | | 5,914,498 | | | | 138,457 | | | | 1,680,867 | |
Redeemed | | | (8,026,613 | ) | | | (130,323,337 | ) | | | (1,306,361 | ) | | | (17,394,963 | ) |
| | | | | | | | | | | | | | | | |
Net change | | | 35,638,856 | | | $ | 559,964,465 | | | | 18,013,164 | | | $ | 251,130,418 | |
| | | | | | | | | | | | | | | | |
| Class Y | |
Issued from the sale of shares | | | 134,173,905 | | | $ | 2,158,881,553 | | | | 245,187,409 | | | $ | 3,227,208,558 | |
Issued in connection with the reinvestment of distributions | | | 7,592,419 | | | | 118,138,051 | | | | 2,860,266 | | | | 34,723,626 | |
Redeemed | | | (139,565,871 | ) | | | (2,246,057,772 | ) | | | (138,438,910 | ) | | | (1,821,188,519 | ) |
| | | | | | | | | | | | | | | | |
Net change | | | 2,200,453 | | | $ | 30,961,832 | | | | 109,608,765 | | | $ | 1,440,743,665 | |
| | | | | | | | | | | | | | | | |
Increase (decrease) from capital share transactions | | | 33,876,330 | | | $ | 530,718,841 | | | | 136,983,275 | | | $ | 1,795,629,622 | |
| | | | | | | | | | | | | | | | |
| 84
Report of Independent Registered Public Accounting Firm
To the Board of Trustees of Loomis Sayles Funds II and Shareholders of Loomis Sayles Global Allocation Fund and Loomis Sayles Growth Fund:
Opinions on the Financial Statements
We have audited the accompanying statements of assets and liabilities, including the portfolio of investments, of Loomis Sayles Global Allocation Fund and Loomis Sayles Growth Fund (two of the funds constituting Loomis Sayles Funds II, hereafter collectively referred to as the “Funds”) as of September 30, 2018, the related statements of operations for the year ended September 30, 2018, the statements of changes in net assets for each of the two years in the period ended September 30, 2018, including the related notes, and the financial highlights for each of the periods indicated therein (collectively referred to as the “financial statements”). In our opinion, the financial statements present fairly, in all material respects, the financial position of each of the Funds as of September 30, 2018, the results of each of their operations for the year then ended, the changes in each of their net assets for each of the two years in the period ended September 30, 2018 and each of the financial highlights for each of the periods indicated therein in conformity with accounting principles generally accepted in the United States of America.
Basis for Opinions
These financial statements are the responsibility of the Funds’ management. Our responsibility is to express an opinion on the Funds’ financial statements based on our audits. We are a public accounting firm registered with the Public Company Accounting Oversight Board (United States) (“PCAOB”) and are required to be independent with respect to the Funds in accordance with the U.S. federal securities laws and the applicable rules and regulations of the Securities and Exchange Commission and the PCAOB.
We conducted our audits of these financial statements in accordance with the standards of the PCAOB. Those standards require that we plan and perform the audit to obtain reasonable assurance about whether the financial statements are free of material misstatement, whether due to error or fraud.
Our audits included performing procedures to assess the risks of material misstatement of the financial statements, whether due to error or fraud, and performing procedures that respond to those risks. Such procedures included examining, on a test basis, evidence regarding the amounts and disclosures in the financial statements. Our audits also included evaluating the accounting principles used and significant estimates made by management, as well as evaluating the overall presentation of the financial statements. Our procedures included confirmation of securities owned as of
85 |
Report of Independent Registered Public Accounting Firm
September 30, 2018 by correspondence with the custodian, and brokers; when replies were not received from brokers, we performed other auditing procedures. We believe that our audits provide a reasonable basis for our opinions.
PricewaterhouseCoopers LLP
Boston, Massachusetts
November 20, 2018
We have served as the auditor of one or more investment companies in the Natixis Investment Company Complex since at least 1995. We have not determined the specific year we began serving as auditor.
| 86
2018 U.S. Tax Distribution Information to Shareholders (Unaudited)
Corporate Dividends Received Deduction. For the fiscal year ended September 30, 2018, a percentage of dividends distributed by the Funds listed below qualify for the dividends received deduction for corporate shareholders. These percentages are as follows:
| | | | |
Fund | | Qualifying
Percentage | |
Global Allocation | | | 52.71 | % |
Growth | | | 100.00 | % |
Capital Gains Distributions. Pursuant to Internal Revenue Section 852(b), the following Funds paid distributions, which have been designated as capital gains distributions for the fiscal year ended September 30, 2018, unless subsequently determined to be different.
| | | | |
Fund | | Amount | |
Global Allocation | | $ | 24,595,545 | |
Growth | | | 144,994,363 | |
Qualified Dividend Income. For the fiscal year ended September 30, 2018, the Funds below will designate up to the maximum amount allowable pursuant to the Internal Revenue Code as qualified dividend income eligible for reduced tax rates. These lower rates range from 0% to 20% depending on an individual’s tax bracket. If the Funds pay a distribution during calendar year 2018, complete information will be reported in conjunction with Form 1099-DIV.
| | | | |
Fund | | | |
Global Allocation | | | | |
Growth | | | | |
87 |
Trustee and Officer Information
The tables below provide certain information regarding the trustees and officers of Loomis Sayles Funds II (the “Trust”). Unless otherwise indicated, the address of all persons below is 888 Boylston Street, Suite 800, Boston, MA 02199-8197. The Funds’ Statement of Additional Information includes additional information about the trustees of the Trust and is available by calling Natixis Funds at 800-225-5478.
| | | | | | | | |
Name and Year of
Birth | | Position(s) Held
with the Trust,
Length of Time
Served and Term
of Office1 | | Principal
Occupation(s)
During Past
5 Years | | Number of
Portfolios in
Fund Complex
Overseen2 and Other
Directorships Held
During Past
5 Years | | Experience,
Qualifications,
Attributes, Skills
for Board
Membership |
| | | |
| INDEPENDENT TRUSTEES | | | | | | |
| | | | |
Kenneth A. Drucker
(1945) | | Chairperson of the Board of Trustees since January 2017 Trustee since 2008 Ex Officio member of Audit Committee, Contract Review Committee and Governance Committee | | Retired | | 51 None | | Significant experience on the Board and on the boards of other business organizations (including at investment companies); executive experience (including as treasurer of an aerospace, automotive, and metal manufacturing corporation) |
| | | | |
Edmond J. English
(1953) | | Trustee since 2013 Audit Committee Member and Governance Committee Member | | Executive Chairman; formerly, Chief Executive Officer of Bob’s Discount Furniture (retail) | | 51 Director, Burlington Stores, Inc. (retail) | | Significant experience on the Board and significant experience on the boards of other business organizations (including retail companies and a bank); executive experience (including at a retail company) |
| 88
Trustee and Officer Information
| | | | | | | | |
Name and Year of
Birth | | Position(s) Held
with the Trust,
Length of Time
Served and Term
of Office1 | | Principal
Occupation(s)
During Past
5 Years | | Number of
Portfolios in
Fund Complex
Overseen2 and Other
Directorships Held
During Past
5 Years | | Experience,
Qualifications,
Attributes, Skills
for Board
Membership |
| | | |
INDEPENDENT TRUSTEES continued | | | | | | |
| | | | |
Richard A. Goglia
(1951) | | Trustee since 2015 Audit Committee Member | | Retired; formerly Vice President and Treasurer of Raytheon Company (defense) | | 51 None | | Experience on the Board and executive experience (including his role as vice president and treasurer of a defense company and experience at a financial services company) |
| | | | |
| Wendell J. Knox (1948) | | Trustee since 2009 Contract Review Committee Member and Governance Committee Member | | Director of Abt Associates Inc. (research and consulting) | | 51 Director, Eastern Bank (bank); Director, The Hanover Insurance Group (property and casualty insurance) | | Significant experience on the Board and on the boards of other business organizations (including at a bank and at a property and casualty insurance firm); executive experience (including roles as president and chief executive officer of a research and consulting company) |
89 |
Trustee and Officer Information
| | | | | | | | |
Name and Year of
Birth | | Position(s) Held
with the Trust,
Length of Time
Served and Term
of Office1 | | Principal
Occupation(s)
During Past
5 Years | | Number of
Portfolios in
Fund Complex
Overseen2 and Other
Directorships Held
During Past
5 Years | | Experience,
Qualifications,
Attributes, Skills
for Board
Membership |
| | | |
INDEPENDENT TRUSTEES continued | | | | | | |
| | | | |
| Martin T. Meehan (1956) | | Trustee since 2012 Audit Committee Member | | President, University of Massachusetts; formerly, Chancellor and faculty member, University of Massachusetts Lowell | | 51 None | | Significant experience on the Board and on the boards of other business organizations; experience as President of the University of Massachusetts; government experience (including as a member of the U.S. House of Representatives); academic experience |
| | | | |
Maureen B. Mitchell (1951) | | Trustee since 2017 Contract Review Committee Member | | Retired; formerly President, Global Sales and Marketing, GE Asset Management, Inc. (financial services) | | 51 Director, Sterling Bancorp (Bank) | | Experience on the Board and on the boards of other business organizations; financial services industry and executive experience (including role as president of global sales and marketing at a financial services company) |
| 90
Trustee and Officer Information
| | | | | | | | |
Name and Year of
Birth | | Position(s) Held
with the Trust,
Length of Time
Served and Term
of Office1 | | Principal
Occupation(s)
During Past
5 Years | | Number of
Portfolios in
Fund Complex
Overseen2 and Other
Directorships Held
During Past
5 Years | | Experience,
Qualifications,
Attributes, Skills
for Board
Membership |
| | | |
INDEPENDENT TRUSTEES continued | | | | | | |
| | | | |
| James P. Palermo (1955) | | Trustee since 2016 Contract Review Committee Member | | Founding Partner, Breton Capital Management, LLC (private equity); Partner, STEP Partners, LLC (private equity); formerly, Chief Executive Officer of Global Client Management of The Bank of New York Mellon Corporation | | 51 Director,
FutureFuel Corp. (Chemicals and Biofuels) | | Experience on the Board and on the boards of other business organizations; financial services industry and executive experience (including roles as chief executive officer of client management and asset servicing for a banking and financial services company) |
| | | | |
Erik R. Sirri (1958) | | Trustee since 2009 Chairperson of the Audit Committee | | Professor of Finance at Babson College | | 51 None | | Significant experience on the Board; experience as Director of the Division of Trading and Markets at the Securities and Exchange Commission; academic experience; training as an economist |
91 |
Trustee and Officer Information
| | | | | | | | |
Name and Year of
Birth | | Position(s) Held
with the Trust,
Length of Time
Served and Term
of Office1 | | Principal
Occupation(s)
During Past
5 Years | | Number of
Portfolios in
Fund Complex
Overseen2 and Other
Directorships Held
During Past
5 Years | | Experience,
Qualifications,
Attributes, Skills
for Board
Membership |
| | | |
INDEPENDENT TRUSTEES continued | | | | | | |
| | | | |
Peter J. Smail (1952) | | Trustee since 2009 Chairperson of the Contract Review Committee and Governance Committee Member | | Retired | | 51 None | | Significant experience on the Board; mutual fund industry and executive experience (including roles as president and chief executive officer for an investment adviser) |
| | | | |
Cynthia L. Walker (1956) | | Trustee since 2005 Chairperson of the Governance Committee and Audit Committee Member | | Deputy Dean for Finance and Administration, Yale University School of Medicine | | 51 None | | Significant experience on the Board; executive experience in a variety of academic organizations (including roles as dean for finance and administration) |
| | | |
| INTERESTED TRUSTEES | | | | | | |
| | | | |
Kevin P. Charleston3 (1965) One Financial Center Boston, MA 02111 | | Trustee since 2015 | | President, Chief Executive Officer and Chairman of the Board of Directors; formerly, Chief Financial Officer, Loomis, Sayles & Company, L.P. | | 51 None | | Experience on the Board; continuing service as President, Chief Executive Officer and Chairman of the Board of Directors of Loomis, Sayles & Company, L.P. |
| 92
Trustee and Officer Information
| | | | | | | | |
Name and Year of
Birth | | Position(s) Held
with the Trust,
Length of Time
Served and Term
of Office1 | | Principal
Occupation(s)
During Past
5 Years | | Number of
Portfolios in
Fund Complex
Overseen2 and Other
Directorships Held
During Past
5 Years | | Experience,
Qualifications,
Attributes, Skills
for Board
Membership |
| | | |
INTERESTED TRUSTEES continued | | | | | | |
| | | | |
| David L. Giunta4 (1965) | | Trustee since 2011 President of Loomis Sayles Funds II since 2008; Chief Executive Officer of Loomis Sayles Funds II since 2015 | | President and Chief Executive Officer, Natixis Advisors, L.P., Natixis Distribution, L.P., Natixis Distribution Corporation and Chairman of the Board of Natixis Distribution Corporation | | 51 None | | Significant experience on the Board; experience as President and Chief Executive Officer, Natixis Advisors, L.P., Natixis Distribution, L.P., Natixis Distribution Corporation and Chairman of the Board of Natixis Distribution Corporation |
| 1 | Each trustee serves until retirement, resignation or removal from the Board. The current retirement age is 75. The position of Chairperson of the Board is appointed for a three-year term. |
| 2 | The trustees of the Trust serve as trustees of a fund complex that includes all series of the Natixis Funds Trust I, Natixis Funds Trust II, Natixis Funds Trust IV, Gateway Trust, Loomis Sayles Funds I, Loomis Sayles Funds II and Natixis ETF Trust (collectively, the “Fund Complex”). |
| 3 | Mr. Charleston is deemed an “interested person” of the Trust because he holds the following positions with an affiliated person of the Trust: President, Chief Executive Officer and Chairman of the Board of Directors of Loomis, Sayles & Company, L.P. |
| 4 | Mr. Giunta is deemed an “interested person” of the Trust because he holds the following positions with an affiliated person of the Trust: President and Chief Executive Officer, Natixis Advisors, L.P., Natixis Distribution, L.P., Natixis Distribution Corporation and Chairman of the Board of Natixis Distribution Corporation. |
93 |
Trustee and Officer Information
| | | | | | |
Name and Year of Birth | | Position(s) Held
with the Trust | | Term of Office1 and
Length of Time Served | | Principal Occupation(s)
During Past 5 Years2 |
| |
| OFFICERS OF THE TRUST | | |
| | | |
Daniel J. Fuss (1933) One Financial Center Boston, MA 02111 | | Executive Vice President | | Since June 2003 | | Vice Chairman and Director, Loomis, Sayles & Company, L.P. |
| | | |
Russell L. Kane (1969) | | Secretary, Clerk and Chief Legal Officer | | Since July 2016 | | Executive Vice President, General Counsel, Secretary and Clerk, Natixis Distribution Corporation, Natixis Advisors, L.P. and Natixis Distribution, L.P.; formerly, Chief Compliance Officer for Mutual Funds, Senior Vice President, Deputy General Counsel, Assistant Secretary and Assistant Clerk, Natixis Distribution Corporation, Natixis Advisors, L.P. and Natixis Distribution, L.P. |
| | | |
Michael C. Kardok (1959) | | Treasurer, Principal Financial and Accounting Officer | | Since October 2004 | | Senior Vice President, Natixis Advisors, L.P. and Natixis Distribution, L.P. |
| | | |
Rosa Licea-Mailloux (1976) | | Chief Compliance Officer, Assistant Secretary and Anti-Money Laundering Officer | | Since July 2016 | | Senior Vice President, Deputy General Counsel, Assistant Secretary and Assistant Clerk, Natixis Distribution Corporation, Natixis Advisors, L.P. and Natixis Distribution, L.P.; formerly, Associate General Counsel, Natixis Distribution, L.P. |
| 1 | Each officer of the Trust serves for an indefinite term in accordance with the Trust’s current by-laws until the date his or her successor is elected and qualified, or until he or she sooner dies, retires, is removed or becomes disqualified. |
| 2 | Each person listed above, except as noted, holds the same position(s) with the Fund Complex. Previous positions during the past five years with Natixis Distribution, L.P., Natixis Advisors, L.P. or Loomis, Sayles & Company, L.P. are omitted, if not materially different from an officer’s current position with such entity. |
| 94

Loomis Sayles Small Cap Growth Fund
Loomis Sayles Small Cap Value Fund
Loomis Sayles Small/Mid Cap Growth Fund
Annual Report
September 30, 2018
LOOMIS SAYLES SMALL CAP GROWTH FUND
| | | | |
| Managers | | Symbols | | |
| Mark F. Burns, CFA® | | Institutional Class | | LSSIX |
| John J. Slavik, CFA® | | Retail Class | | LCGRX |
| | Class N | | LSSNX |
Investment Objective
The Fund’s investment objective is long-term capital growth from investments in common stocks or other equity securities.
Market Conditions
The domestic equity markets were strong during the period. In the small- and mid-cap segments of the market, growth-oriented stocks outperformed value stocks.
In particular, factors that typically favor growth managers were in favor during the period, and companies with the strongest sales growth outperformed slower-growing companies. Given the dominance of growth stocks, sectors such as information technology and healthcare, which are more growth-oriented areas, outperformed. More broadly, large-cap stocks outperformed small- and mid-cap stocks, as measured by the Russell indices.
Performance Results
For the 12-month period ending September 30, 2018, the Institutional Class shares of the Loomis Sayles Small Cap Growth Fund returned 29.77% at net asset value. The Fund outperformed its benchmark, the Russell 2000® Growth Index, which returned 21.06%.
Explanation of Fund Performance
The Fund’s relative outperformance was driven primarily by stock selection in the healthcare, consumer discretionary, materials and information technology sectors.
The Fund’s top individual contributors to performance were Teledoc Health Inc., Inogen Inc. and RingCentral Inc. Teledoc is a leading company in the telemedicine market, providing patients with rapid access to healthcare via phone and video. The company reported very strong results with robust revenue growth driven by increasing subscriptions and total patient visits. Inogen manufactures and markets portable oxygen concentrators for patients on oxygen therapy. Results in the most recent quarter beat expectations as all segments of the business performed well, and sales were very strong in the United States and Europe. RingCentral is a provider of cloud-based business communications solutions. The secular shift from on-premises to cloud-based communications tools has been a tailwind, and the company has executed well in taking advantage of that shift. Core subscription growth was robust during the period, and the company continued to expand its share of the enterprise market.
1 |
Dermira Inc., WageWorks, Inc. and Mercury Systems Inc. were the individual largest detractors from performance during the period. Biotechnology company Dermira declined during the time period after announcing that two clinical trials had failed to meet their primary endpoints and that as a result, the company would abandon pursuit of the treatments. The resulting drop in the stock triggered our stop-loss, and Dermira was sold from the portfolio. Benefits administrator WageWorks declined after delaying a key company filing. Defense electronics contractor Mercury Systems declined during the quarter due to ongoing federal budget delays. The stock’s decline triggered our stop-loss, and it was sold from the portfolio.
Outlook
Over time, the market has followed the trajectory of earnings, with some volatility when the market overcorrects in both directions. Given the length of the expansion and bull market since 2009, and despite the fact that there was a notable pause in 2016, market participants have worried that the equity markets have overshot to the upside and are overdue for a correction. Based on recent favorable earnings growth and macroeconomic readings on the US economy, as well as the current outlook for the coming year, the overall market doesn’t appear to be particularly overvalued.
With these cornerstones in place, we feel that the market can continue to rise at a similar pace to earnings growth for the foreseeable future. However, higher interest rates, trade tensions, political instability, and sluggish international economic growth are all potential threats to the current positive market environment.
We see no reason to alter our philosophy and process of bottom-up investing in quality secular growth companies and using risk management tools to help control the volatility of the portfolio.
| 2
LOOMIS SAYLES SMALL CAP GROWTH FUND
Hypothetical Growth of $100,000 Investment in Institutional Class Shares
September 30, 2008 through September 30, 20182
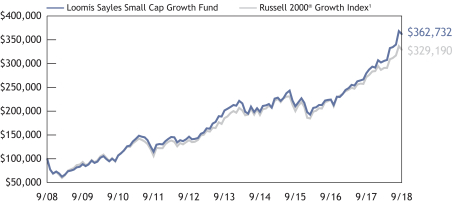
Top Ten Holdings as of September 30, 2018
| | | | | | |
| | | Security Name | | % of
net assets | |
| 1 | | PRA Health Sciences, Inc. | | | 1.55 | % |
| 2 | | Insulet Corp. | | | 1.43 | |
| 3 | | HealthEquity, Inc. | | | 1.43 | |
| 4 | | Grand Canyon Education, Inc. | | | 1.42 | |
| 5 | | Teladoc Health, Inc. | | | 1.42 | |
| 6 | | Q2 Holdings, Inc. | | | 1.40 | |
| 7 | | RealPage, Inc. | | | 1.39 | |
| 8 | | Proto Labs, Inc. | | | 1.37 | |
| 9 | | Novocure Ltd. | | | 1.33 | |
| 10 | | Planet Fitness, Inc., Class A | | | 1.32 | |
The portfolio is actively managed and holdings are subject to change. There is no guarantee the Fund continues to invest in the securities referenced. The holdings listed exclude any temporary cash investments.
3 |
Average Annual Total Returns — September 30, 20182
| | | | | | | | | | | | | | | | | | | | | | | | |
| | | | | | | | | | | | | | | Expense Ratios3 | |
| | | 1 year | | | 5 years | | | 10 years | | | Life of
Class N | | | Gross | | | Net | |
| | | | | | | |
Institutional Class
(Inception 12/31/96) | | | 29.77 | % | | | 12.47 | % | | | 13.75 | % | | | — | % | | | 0.95 | % | | | 0.95 | % |
| | | | | | | |
Retail Class
(Inception 12/31/96) | | | 29.45 | | | | 12.19 | | | | 13.45 | | | | — | | | | 1.20 | | | | 1.20 | |
| | | | | | | |
Class N
(Inception 2/1/13) | | | 29.93 | | | | 12.59 | | | | — | | | | 16.37 | | | | 0.82 | | | | 0.82 | |
| | | | | | | |
| Comparative Performance | | | | | | | | | | | | | | | | | | | | | | | | |
| Russell 2000® Growth Index1 | | | 21.06 | | | | 12.14 | | | | 12.65 | | | | 14.81 | | | | | | | | | |
Performance data shown represents past performance and is no guarantee of, and not necessarily indicative of, future results. Total return and value will vary, and you may have a gain or loss when shares are sold. Current performance may be lower or higher than quoted. For most recent month-end performance, visit loomissayles.com. Performance for other share classes will be greater or less than shown based on differences in fees and sales charges. You may not invest directly in an index. Performance for periods less than one year is cumulative, not annualized. Returns reflect changes in share price and reinvestment of dividends and capital gains, if any. The table(s) do not reflect taxes shareholders might owe on any fund distributions or when they redeem their shares.
| 1 | | Russell 2000® Growth Index is an unmanaged index that measures the performance of the small-cap growth segment of the U.S. equity universe. It includes those Russell 2000® companies with higher price-to-book ratios and higher forecasted growth values. |
| 2 | | Fund performance has been increased by fee waivers and/or expense reimbursements, if any, without which performance would have been lower. |
| 3 | | Expense ratios are as shown in the Fund’s prospectus in effect as of the date of this report. The expense ratios for the current reporting period can be found in the Financial Highlights section of this report under Ratios to Average Net Assets. Net expenses reflect contractual expense caps set to expire on 01/31/19. When a Fund’s expenses are below the cap, gross and net expense ratios will be the same. See Note 5 of the Notes to Financial Statements for more information about the Fund’s expense caps. |
| 4
LOOMIS SAYLES SMALL CAP VALUE FUND
| | | | |
| Managers | | Symbols | | |
| Joseph R. Gatz, CFA® | | Institutional Class | | LSSCX |
| Jeffrey Schwartz, CFA® | | Retail Class | | LSCRX |
| | Admin Class | | LSVAX |
| | Class N | | LSCNX |
Investment Objective
The Fund’s investment objective is long-term capital growth from investments in common stocks or other equity securities.
Market Conditions
Domestic equity markets continued to move higher, aided by modest economic expansion in addition to a corporate tax rate cut which significantly boosted corporate earnings. Throughout most of the period, growth stocks significantly outperformed value stocks. Investors showed a preference for companies that achieved faster revenue growth and stronger earnings, while valuations had little influence on stock performance.
During the second quarter of 2018, political rhetoric regarding international trade and import tariffs resulted in lowered global growth expectations and a stronger US dollar. Investors repositioned their portfolios toward a more domestic focus, selling large-cap equities and buying small-cap equities, mostly using index funds and ETFs. The result was a shift in small-cap leadership into the stocks with the smallest market caps, and lower quality companies with little or no earnings were the strongest performers.
The Federal Reserve raised interest rates multiple times during the period and moved from an accommodative monetary policy to a more normalized posture. Interest-sensitive sectors such as REITs and utilities lagged the performance of the overall market.
Performance Results
For the 12 months ended September 30, 2018, Institutional Class shares of Loomis Sayles Small Cap Value Fund returned 6.21% at net asset value. The Fund underperformed its benchmark, the Russell 2000® Value Index, which returned 9.33%.
Explanation of Fund Performance
The Fund’s underperformance was primarily due to stock selection despite making favorable sector allocations. The Fund performed well versus the benchmark for the majority of the period. However, the Fund handily underperformed late in the period, when investors using passive strategies invested heavily in small-cap equities in a macro-driven market rotation. This produced outsized returns for smaller, less liquid stocks, including many companies with low or depressed earnings. The Fund had very little exposure to stocks with those characteristics, detracting from relative performance and more than offsetting the outperformance of the Fund during the remainder of the period.
5 |
Weak stock selection within the energy and consumer discretionary sectors detracted from returns versus the benchmark, as did an overweight position to the information technology sector. Our oilfield services holdings within energy failed to keep pace with a steady improvement in oil prices, as competitive dynamics within the industry weighed on performance. Among consumer discretionary stocks, a handful of company-specific disappointments detracted from performance, as did the Fund’s lack of exposure to the fundamentally challenged retail, restaurant, textile and apparel industries, all of which rallied sharply during the spring of 2018.
Specific holdings that were the biggest detractors from the Fund’s performance were RPC, Inc., Horizon Global Corporation and Houghton Mifflin Harcourt. RPC is a provider of pressure pumping and other oilfield services. The stock underperformed as investors became concerned about industry capacity growth and management’s preference for shorter-term contracts, which negatively impacted revenue in a declining price environment.
Horizon Global manufactures towing and trailering accessories for the automotive market. Revenue during the period was negatively impacted by retailers decreasing inventory, and profitability was hurt by rising materials costs. This resulted in a decline in cash flow that Horizon Global had originally planned to use to pay down debt.
Houghton Mifflin operates as a global education and learning company. The company lost market share in a declining education book market during 2017, and that caused significant underperformance in the stock during the second half of 2017 and early 2018.
Sector allocation versus the benchmark was positive in both the real estate and industrials sectors, while strong stock selection in the information technology and industrials sectors also added to relative performance. Leading contributors among technology stocks were data services stocks with steady growth as well as internet and media-related holdings. Among industrials, top performers were steady growth, less economically cyclical professional services holdings.
Among individual names, Insperity, Inc., WEX Inc. and Mellanox Technologies, Ltd. had the largest positive stock contribution to the Fund’s performance. Insperity is a provider of human resource services including payroll, benefits administration, workers’ compensation and recruiting to small and medium-sized businesses. The company extended its streak to five consecutive quarters of materially exceeding consensus earnings estimates, reflecting favorable employment trends, strong customer retention, improved sales productivity and excellent cost management.
WEX Inc. is a leading outsourced service provider of business-to-business payment solutions for the truck fleet, corporate, and health & employee benefit industries. WEX exhibited strong performance during the period largely due to growth in transactions, new business opportunities and higher fuel prices. Recently acquired high-profile customers
| 6
LOOMIS SAYLES SMALL CAP VALUE FUND
included Verizon, Shell, and Chevron, as well as some government fleet contracts. While there are some initial costs associated with new business, the wins provided evidence of future revenue and earnings growth.
Mellanox Technologies is the leading provider of interconnect products used in high performance computing. As artificial intelligence and flash memory continued their growth, data centers have required higher performance interconnects, and Mellanox is well positioned to benefit from this trend. In addition, profitability has increased faster than sales due to a renewed focus on lowering operating costs.
Outlook
The Small Cap Value fund seeks potential investments in smaller companies where the stock price and valuation do not accurately reflect our assessment of the underlying value of the corporate enterprise due to one of these market inefficiencies: a misunderstood franchise, an underfollowed stock or a company in the midst of a special situation.
We look for trustworthy and capable management teams whose interests are aligned with shareholders, as well as fundamentally sound business models with sustainable and understandable advantages that could lead to growth in value over time.
We apply these principles consistently regardless of the market environment. With a margin of safety and a proper time horizon, our goal is to achieve an attractive total return for our investors, while managing to an appropriate level of risk.
7 |
Hypothetical Growth of $100,000 Investment in Institutional Class Shares
September 30, 2008 through September 30, 20183
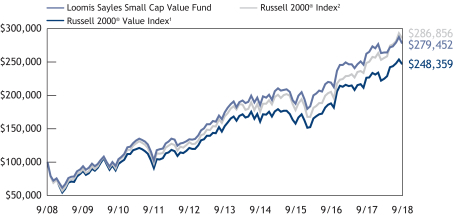
See notes to chart on page 9.
Top Ten Holdings as of September 30, 2018
| | | | | | |
| | | Security Name | | % of
net assets | |
| 1 | | Littelfuse, Inc. | | | 1.51 | % |
| 2 | | KAR Auction Services, Inc. | | | 1.30 | |
| 3 | | Popular, Inc. | | | 1.21 | |
| 4 | | ALLETE, Inc. | | | 1.17 | |
| 5 | | WEX, Inc. | | | 1.13 | |
| 6 | | Viad Corp. | | | 1.12 | |
| 7 | | Euronet Worldwide, Inc. | | | 1.12 | |
| 8 | | Wintrust Financial Corp. | | | 1.12 | |
| 9 | | Employers Holdings, Inc. | | | 1.11 | |
| 10 | | Churchill Downs, Inc. | | | 1.08 | |
The portfolio is actively managed and holdings are subject to change. There is no guarantee the Fund continues to invest in the securities referenced. The holdings listed exclude any temporary cash investments.
| 8
LOOMIS SAYLES SMALL CAP VALUE FUND
Average Annual Total Returns — September 30, 20183
| | | | | | | | | | | | | | | | | | | | | | | | |
| | | | | | | | | | | | | | | Expense Ratios4 | |
| | | 1 year | | | 5 years | | | 10 years | | | Life of Class N | | | Gross | | | Net | |
| | | | | | | |
| Institutional Class (Inception 5/13/91) | | | 6.21 | % | | | 9.78 | % | | | 10.82 | % | | | — | % | | | 0.98 | % | | | 0.95 | % |
| | | | | | | |
Retail Class
(Inception 12/31/96) | | | 5.95 | | | | 9.51 | | | | 10.54 | | | | — | | | | 1.23 | | | | 1.20 | |
| | | | | | | |
Admin Class
(Inception 1/2/98) | | | 5.68 | | | | 9.24 | | | | 10.27 | | | | — | | | | 1.48 | | | | 1.45 | |
| | | | | | | |
Class N
(Inception 2/1/13) | | | 6.28 | | | | 9.86 | | | | — | | | | 11.67 | | | | 0.88 | | | | 0.88 | |
| | | | | | | |
| Comparative Performance | | | | | | | | | | | | | | | | | | | | | | | | |
| Russell 2000® Value Index1 | | | 9.33 | | | | 9.91 | | | | 9.52 | | | | 11.43 | | | | | | | | | |
| Russell 2000® Index2 | | | 15.24 | | | | 11.07 | | | | 11.11 | | | | 13.15 | | | | | | | | | |
Performance data shown represents past performance and is no guarantee of, and not necessarily indicative of, future results. Total return and value will vary, and you may have a gain or loss when shares are sold. Current performance may be lower or higher than quoted. For most recent month-end performance, visit loomissayles.com. Performance for other share classes will be greater or less than shown based on differences in fees and sales charges. You may not invest directly in an index. Performance for periods less than one year is cumulative, not annualized. Returns reflect changes in share price and reinvestment of dividends and capital gains, if any. The table(s) do not reflect taxes shareholders might owe on any fund distributions or when they redeem their shares.
| 1 | | Russell 2000® Value Index is an unmanaged index that measures the performance of the small-cap value segment of the U.S. equity universe. It includes those Russell 2000® companies with lower price-to-book ratios and lower forecasted growth values. |
| 2 | | Russell 2000® Index is an unmanaged index that measures the performance of the small-cap segment of the U.S. equity universe. |
| 3 | | Fund performance has been increased by fee waivers and/or expense reimbursements, if any, without which performance would have been lower. |
| 4 | | Expense ratios are as shown in the Fund’s prospectus in effect as of the date of this report. The expense ratios for the current reporting period can be found in the Financial Highlights section of this report under Ratios to Average Net Assets. Net expenses reflect contractual expense caps set to expire on 01/31/19. When a Fund’s expenses are below the cap, gross and net expense ratios will be the same. See Note 5 of the Notes to Financial Statements for more information about the Fund’s expense caps. |
9 |
LOOMIS SAYLES SMALL/MID CAP GROWTH FUND
| | | | |
| Managers | | Symbols | | |
| Mark F. Burns, CFA® | | Institutional Class | | LSMIX |
| John J. Slavik, CFA® | | | | |
Investment Objective
The Fund’s investment objective is long-term capital growth from investments in common stocks or other equity securities.
Market Conditions
The domestic equity markets were strong during the period. In the small- and mid-cap segments of the market, growth-oriented stocks outperformed value stocks.
In particular, factors that typically favor growth managers were in favor during the period, and companies with the strongest sales growth outperformed slower-growing companies. Given the dominance of growth stocks, sectors such as information technology and healthcare, which are more growth-oriented areas, outperformed. More broadly, large-cap stocks outperformed small- and mid-cap stocks, as measured by the Russell indices.
Performance Results
For the 12-month period ending September 30, 2018, the Institutional Class shares of Loomis Sayles Small/Mid Cap Growth Fund returned 25.83% at net asset value. The Fund outperformed its benchmark, the Russell 2500™ Growth Index, which returned 23.13%.
Explanation of Performance
The Fund’s relative outperformance was driven primarily by stock selection, with particular strength in the healthcare and materials sectors. An underweight to the real estate sector also contributed to performance. However, stock selection in the financials and industrials sectors detracted from relative performance.
At an individual stock level, the Fund’s top contributors to performance were Planet Fitness Inc., WellCare Health Plans, Inc. and HubSpot Inc.
Fitness and exercise club operator Planet Fitness executed well and reported strong growth over the course of the period. Revenues increased, driven largely by the company’s franchise business. Margins expanded, and the company also increased its store base. WellCare Health Plans is a managed care company focused on government memberships with the majority of its business Medicaid. Earnings were strong in the most recent quarter, with improved performance across products and a favorable lower tax rate. Inbound marketing software platform Hubspot was the top performer for the quarter. The company announced new products and reported exceptionally strong results as sales grew, driven by subscription revenues.
| 10
LOOMIS SAYLES SMALL/MID CAP GROWTH FUND
Mercury Systems Inc., Healthcare Services Group Inc. and Advanced Energy Industries Inc. were the largest individual stock detractors from performance during the period. Defense electronics contractor Mercury Systems declined during the quarter due to ongoing federal budget delays. The stock fell significantly enough to trigger our stop-loss and was sold from the portfolio. Healthcare Services Group provides janitorial and other facility-related services to the healthcare industry, particularly nursing homes. The company reported very strong results late in the period, citing unprecedented demand, but a downgrade from a sell-side stock analyst resulted in the stock falling. Investors also reacted negatively when a significant customer filed for bankruptcy, leading to questions about the overall health of the industry. Semiconductor capital equipment company Advanced Energy Industries was down during the time period. The stock was a very strong performer early in the period, as were most in the semiconductor space. However, the semiconductor industry sold off toward the end of 2017, and Advanced Energy fell in sympathy.
Outlook
Over time, the market has followed the trajectory of earnings, with some volatility when the market overcorrects in both directions. Given the length of the expansion and bull market since 2009, and despite the fact that there was a notable pause in 2016, market participants have worried that the equity markets have overshot to the upside and are overdue for a correction. Based on recent favorable earnings growth and macroeconomic readings on the US economy, as well as the current outlook for the coming year, the overall market doesn’t appear to be particularly overvalued.
With these cornerstones in place, we feel that the market can continue to rise at a similar pace to earnings growth for the foreseeable future. However, higher interest rates, trade tensions, political instability, and sluggish international economic growth are all potential threats to the current positive market environment.
We see no reason to alter our philosophy and process of bottom-up investing in quality secular growth companies and using risk management tools to help control the volatility of the portfolio.
11 |
Hypothetical Growth of $1,000,000 Investment in Institutional Class Shares2
June 30, 2015 (inception) through September 30, 2018
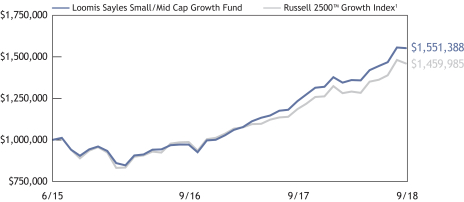
See notes to chart on page 13.
Top Ten Holdings as of September 30, 2018
| | | | | | |
| | | Security Name | | % of
net assets | |
| 1 | | PTC, Inc. | | | 2.04 | % |
| 2 | | WellCare Health Plans, Inc. | | | 1.81 | |
| 3 | | ICON PLC | | | 1.76 | |
| 4 | | CoStar Group, Inc. | | | 1.71 | |
| 5 | | Grand Canyon Education, Inc. | | | 1.71 | |
| 6 | | HEICO Corp. | | | 1.67 | |
| 7 | | Guidewire Software, Inc. | | | 1.66 | |
| 8 | | Ingevity Corp. | | | 1.65 | |
| 9 | | HubSpot, Inc. | | | 1.63 | |
| 10 | | HealthEquity, Inc. | | | 1.58 | |
The portfolio is actively managed and holdings are subject to change. There is no guarantee the Fund continues to invest in the securities referenced. The holdings listed exclude any temporary cash investments.
| 12
LOOMIS SAYLES SMALL/MID CAP GROWTH FUND
Average Annual Total Returns — September 30, 20182
| | | | | | | | | | | | | | | | |
| | | | | | | | | Expense Ratios3 | |
| | | 1 year | | | Life of
Fund | | | Gross | | | Net | |
| | | | | |
| Institutional Class (Inception 6/30/15) | | | 25.83 | % | | | 14.47 | % | | | 1.57 | % | | | 0.85 | % |
| | | | | |
| Comparative Performance | | | | | | | | | | | | | | | | |
| Russell 2500TM Growth Index1 | | | 23.13 | | | | 12.34 | | | | | | | | | |
Performance data shown represents past performance and is no guarantee of, and not necessarily indicative of, future results. Total return and value will vary, and you may have a gain or loss when shares are sold. Current performance may be lower or higher than quoted. For most recent month-end performance, visit loomissayles.com. Performance for other share classes will be greater or less than shown based on differences in fees and sales charges. You may not invest directly in an index. Performance for periods less than one year is cumulative, not annualized. Returns reflect changes in share price and reinvestment of dividends and capital gains, if any. The table(s) do not reflect taxes shareholders might owe on any fund distributions or when they redeem their shares.
| 1 | | The Russell 2500TM Growth Index measures the performance of the small-to-mid-cap growth segment of the US equity universe. It includes those Russell 2500™ Index companies with higher price-to-book ratios and higher forecasted growth values. The Russell 2500™ Growth Index is constructed to provide a comprehensive and unbiased barometer of the small-to-mid-cap growth market. The Index is completely reconstituted annually to ensure larger stocks do not distort the performance and characteristics of the true small-to-mid-cap opportunity set and that the represented companies continue to reflect growth characteristics. Indices are unmanaged. |
| 2 | | Fund performance has been increased by fee waivers and/or expense reimbursements, if any, without which performance would have been lower. |
| 3 | | Expense ratios are as shown in the Fund’s prospectus in effect as of the date of this report. The expense ratios for the current reporting period can be found in the Financial Highlights section of this report under Ratios to Average Net Assets. Net expenses reflect contractual expense caps set to expire on 01/31/19. When a Fund’s expenses are below the cap, gross and net expense ratios will be the same. See Note 5 of the Notes to Financial Statements for more information about the Fund’s expense caps. |
13 |
ADDITIONAL INFORMATION
The views expressed in this report reflect those of the portfolio managers as of the dates indicated. The managers’ views are subject to change at any time without notice based on changes in market or other conditions. References to specific securities or industries should not be regarded as investment advice. Because the Fund is actively managed, there is no assurance that they will continue to invest in the securities or industries mentioned.
All investing involves risk, including the risk of loss. There is no assurance that any investment will meet its performance objectives or that losses will be avoided.
Additional Index Information
This document may contain references to third party copyrights, indexes, and trademarks, each of which is the property of its respective owner. Such owner is not affiliated with Natixis Investment Managers or any of its related or affiliated companies (collectively “Natixis Affiliates”) and does not sponsor, endorse or participate in the provision of any Natixis Affiliates services, funds or other financial products.
The index information contained herein is derived from third parties and is provided on an “as is” basis. The user of this information assumes the entire risk of use of this information. Each of the third party entities involved in compiling, computing or creating index information disclaims all warranties (including, without limitation, any warranties of originality, accuracy, completeness, timeliness, non-infringement, merchantability and fitness for a particular purpose) with respect to such information.
Proxy Voting Information
A description of the Funds’ proxy voting policies and procedures is available without charge upon request, by calling Loomis Sayles at 800-633-3330; on the Funds’ website, at www.loomissayles.com, and on the Securities and Exchange Commission’s (SEC’s) website at www.sec.gov. Information about how the Funds voted proxies relating to portfolio securities during the most recent 12-month period ended June 30 is available on the Funds’ website and the SEC’s website.
Quarterly Portfolio Schedules
The Funds file a complete schedule of portfolio holdings with the SEC for the first and third quarters of each fiscal year on Form N-Q. The Funds’ Forms N-Q are available on the SEC’s website at www.sec.gov and may be reviewed and copied at the SEC’s Public Reference Room in Washington, DC. Information on the operation of the Public Reference Room may be obtained by calling 800-SEC-0330.
UNDERSTANDING YOUR FUND’S EXPENSES
As a mutual fund shareholder you incur two types of costs: (1) transaction costs and (2) ongoing costs, including management fees, distribution and/or service fees (12b-1 fees), and other fund expenses. Certain exemptions may apply. These costs are described in more detail in the Funds’ prospectus. The following examples are intended to help you understand the ongoing costs of investing in the Funds and help you compare these with the ongoing costs of investing in other mutual funds.
| 14
The first line in the table of each Fund shows the actual amount of Fund expenses you would have paid on a $1,000 investment in the Fund from April 1, 2018 through September 30, 2018. To estimate the expenses you paid over the period, simply divide your account value by $1,000 (for example $8,600 account value divided by $1,000 = 8.6) and multiply the result by the number in the Expenses Paid During Period column as shown below for your class.
The second line in the table of each Fund provides information about hypothetical account values and hypothetical expenses based on the Fund’s actual expense ratios and an assumed rate of return of 5% per year before expenses, which is not the Fund’s actual return. The hypothetical account values and expenses may not be used to estimate the actual ending account balance or expenses you paid on your investment for the period. You may use this information to compare the ongoing costs of investing in the Funds to other funds. To do so, compare this 5% hypothetical example with the 5% hypothetical examples that appear in the shareholder reports of other funds.
Please note that the expenses shown reflect ongoing costs only, and do not include any transaction costs. Therefore, the second line in the table is useful in comparing ongoing costs only, and will not help you determine the relative costs of owning different funds. If transaction costs were included, total costs would be higher.
Loomis Sayles Small Cap Growth Fund
| | | | | | | | | | | | |
| Institutional Class | | Beginning
Account Value
4/1/2018 | | | Ending
Account Value
9/30/2018 | | | Expenses Paid
During Period*
4/1/2018 – 9/30/2018 | |
Actual | | | $1,000.00 | | | | $1,185.60 | | | | $5.15 | |
Hypothetical (5% return before expenses) | | | $1,000.00 | | | | $1,020.36 | | | | $4.76 | |
| | | |
Retail Class | | | | | | | | | |
Actual | | | $1,000.00 | | | | $1,184.00 | | | | $6.52 | |
Hypothetical (5% return before expenses) | | | $1,000.00 | | | | $1,019.10 | | | | $6.02 | |
| | | |
Class N | | | | | | | | | |
Actual | | | $1,000.00 | | | | $1,186.40 | | | | $4.49 | |
Hypothetical (5% return before expenses) | | | $1,000.00 | | | | $1,020.96 | | | | $4.15 | |
* Expenses are equal to the Fund’s annualized expense ratio: 0.94%, 1.19% and 0.82% for Institutional Class, Retail Class and Class N, respectively, multiplied by the average account value over the period, multiplied by the number of days in the most recent fiscal half-year (183), divided by 365 (to reflect the half-year period). | |
15 |
Loomis Sayles Small Cap Value Fund
| | | | | | | | | | | | |
Institutional Class | | Beginning
Account Value
4/1/2018 | | | Ending
Account Value
9/30/2018 | | | Expenses Paid
During Period*
4/1/2018 – 9/30/2018 | |
Actual | | | $1,000.00 | | | | $1,055.00 | | | | $4.64 | |
Hypothetical (5% return before expenses) | | | $1,000.00 | | | | $1,020.56 | | | | $4.56 | |
| | | |
Retail Class | | | | | | | | | |
Actual | | | $1,000.00 | | | | $1,053.80 | | | | $5.92 | |
Hypothetical (5% return before expenses) | | | $1,000.00 | | | | $1,019.30 | | | | $5.82 | |
| | | |
Admin Class | | | | | | | | | |
Actual | | | $1,000.00 | | | | $1,052.50 | | | | $7.20 | |
Hypothetical (5% return before expenses) | | | $1,000.00 | | | | $1,018.05 | | | | $7.08 | |
| | | |
Class N | | | | | | | | | |
Actual | | | $1,000.00 | | | | $1,055.60 | | | | $4.23 | |
Hypothetical (5% return before expenses) | | | $1,000.00 | | | | $1,020.96 | | | | $4.15 | |
* Expenses are equal to the Fund’s annualized expense ratio (after waiver/reimbursement): 0.90%, 1.15%, 1.40% and 0.82% for Institutional Class, Retail Class, Admin Class and Class N, respectively, multiplied by the average account value over the period, multiplied by the number of days in the most recent fiscal half-year (183), divided by 365 (to reflect the half-year period). | |
Loomis Sayles Small/Mid Cap Growth Fund
| | | | | | | | | | | | |
Institutional Class | | Beginning
Account Value
4/1/2018 | | | Ending
Account Value
9/30/2018 | | | Expenses Paid
During Period*
4/1/2018 – 9/30/2018 | |
Actual | | | $1,000.00 | | | | $1,141.50 | | | | $4.56 | |
Hypothetical (5% return before expenses) | | | $1,000.00 | | | | $1,020.81 | | | | $4.31 | |
* Expenses are equal to the Fund’s annualized expense ratio (after waiver/reimbursement) of 0.85%, multiplied by the average account value over the period, multiplied by the number of days in the most recent fiscal half-year (183), divided by 365 (to reflect the half-year period). | |
| 16
BOARD APPROVAL OF THE EXISTING ADVISORY AGREEMENTS
The Board of Trustees of the Trusts (the “Board”), including the Independent Trustees, considers matters bearing on each Fund’s advisory agreement (collectively, the “Agreements”) at most of its meetings throughout the year. Each year, usually in the spring, the Contract Review Committee of the Board meets to review the Agreements to determine whether to recommend that the full Board approve the continuation of the Agreements, typically for an additional one-year period. After the Contract Review Committee has made its recommendation, the full Board, including the Independent Trustees, determines whether to approve the continuation of the Agreements.
In connection with these meetings, the Trustees receive materials that the Funds’ investment adviser (the “Adviser”) believes to be reasonably necessary for the Trustees to evaluate the Agreements. These materials generally include, among other items, (i) information on the investment performance of the Funds and the performance of peer groups of funds and the Funds’ performance benchmarks, (ii) information on the Funds’ advisory fees and other expenses, including information comparing the Funds’ advisory fees to the fees charged to institutional accounts with similar strategies managed by the Adviser, if any, and to those of peer groups of funds and information about any applicable expense caps and/or fee “breakpoints,” (iii) sales and redemption data in respect of the Funds, (iv) information about the profitability of the Agreements to the Adviser and (v) information obtained through the completion by the Adviser of a questionnaire distributed on behalf of the Trustees. The Board, including the Independent Trustees, also considers other matters such as (i) the Adviser’s financial results and financial condition, (ii) each Fund’s investment objective and strategies and the size, education and experience of the Adviser’s investment staff and its use of technology, external research and trading cost measurement tools, (iii) arrangements in respect of the distribution of the Funds’ shares and the related costs, (iv) the allocation of the Funds’ brokerage, if any, including, to the extent applicable, the use of “soft” commission dollars to pay for research and other similar services, (v) the resources devoted to, and the record of compliance with, the Funds’ investment policies and restrictions, policies on personal securities transactions and other compliance policies, (vi) each Adviser’s policies and procedures relating to, among other things, compliance, trading and best execution, proxy voting and valuation, (vii) information about amounts invested by the Funds’ portfolio managers in the Funds or in similar accounts that they manage and (viii) the general economic outlook with particular emphasis on the mutual fund industry. Throughout the process, the Trustees are afforded the opportunity to ask questions of and request additional materials from the Adviser.
In addition to the materials requested by the Trustees in connection with their annual consideration of the continuation of the Agreements, the Trustees receive materials in advance of each regular quarterly meeting of the Board that provide detailed information about the Funds’ investment performance and the fees charged to the Funds for advisory and other services. This information generally includes, among other things, an internal performance rating for each Fund based on agreed-upon criteria, graphs showing each
17 |
Fund’s performance and expense differentials against each Fund’s peer group/category, performance ratings provided by a third-party, total return information for various periods, and third-party performance rankings for various periods comparing a Fund against similarly categorized funds. The portfolio management team for each Fund or other representatives of the Adviser make periodic presentations to the Contract Review Committee and/or the full Board, and Funds identified as presenting possible performance concerns may be subject to more frequent Board or Committee presentations and reviews. In addition, each quarter the Trustees are provided with detailed statistical information about each Fund’s portfolio. The Trustees also receive periodic updates between meetings.
The Board most recently approved the continuation of the Agreements for a one-year period at its meeting held in June 2018. In considering whether to approve the continuation of the Agreements, the Board, including the Independent Trustees, did not identify any single factor as determinative. Individual Trustees may have evaluated the information presented differently from one another, giving different weights to various factors. Matters considered by the Trustees, including the Independent Trustees, in connection with their approval of the Agreements included, but were not limited to, the factors listed below.
The nature, extent and quality of the services provided to the Funds under the Agreements. The Trustees considered the nature, extent and quality of the services provided by the Adviser and its affiliates to the Funds and the resources dedicated to the Funds by the Adviser and its affiliates.
The Trustees considered not only the advisory services provided by the Adviser to the Funds, but also the monitoring and oversight services provided by Natixis Advisors, L.P. (“Natixis Advisors”). They also considered the administrative and shareholder services provided by Natixis Advisors and its affiliates to the Funds.
For each Fund, the Trustees also considered the benefits to shareholders of investing in a mutual fund that is part of a family of funds that offers shareholders the right to exchange shares of one type of fund for shares of another type of fund, and provides a variety of fund and shareholder services.
After reviewing these and related factors, the Trustees concluded, within the context of their overall conclusions regarding each of the Agreements, that the nature, extent and quality of services provided supported the renewal of the Agreements.
Investment performance of the Funds and the Adviser. As noted above, the Trustees received information about the performance of the Funds over various time periods, including information that compared the performance of the Funds to the performance of peer groups and categories of funds and the Funds’ respective performance benchmarks. In addition, the Trustees reviewed data prepared by an independent third party that analyzed the performance of the Funds using a variety of performance metrics, including metrics that measured the performance of the Funds on a risk adjusted basis.
The Board noted that, through December 31, 2017, each Fund’s one-, three- and five-year performance, as applicable, stated as percentile rankings within categories selected by the
| 18
independent third-party data provider was as follows (where the best performance would be in the first percentile of its category):
| | | | | | | | | | | | |
| | | One-Year | | | Three-Year | | | Five-Year | |
Loomis Sayles Small Cap Growth Fund | | | 23% | | | | 40% | | | | 31% | |
Loomis Sayles Small Cap Value Fund | | | 70% | | | | 35% | | | | 43% | |
Loomis Sayles Small/Mid Cap Growth Fund | | | 10% | | | | N/A | | | | N/A | |
In the case of each Fund that had performance that lagged that of a relevant category median as determined by the independent third party for certain (although not necessarily all) periods, the Board concluded that other factors relevant to performance supported renewal of the Agreements. These factors included: (1) that the underperformance was attributable, to a significant extent, to investment decisions (such as security selection or sector allocation) by the Adviser that were reasonable and consistent with the Fund’s investment objective and policies; (2) that the Fund’s performance, although lagging in certain periods, was stronger over the long term relative to its category; and (3) that the Fund’s net expense ratio was below the median for a peer group of funds.
The Trustees also considered the Adviser’s performance and reputation generally, the performance of the fund family generally, and the historical responsiveness of the Adviser to Trustee concerns about performance and the willingness of the Adviser to take steps intended to improve performance.
After reviewing these and related factors, the Trustees concluded, within the context of their overall conclusions regarding each of the Agreements, that the performance of the Funds and the Adviser and/or other relevant factors supported the renewal of the Agreements.
The costs of the services to be provided and profits to be realized by the Adviser and its affiliates from their respective relationships with the Funds. The Trustees considered the fees charged to the Funds for advisory and administrative services as well as the total expense levels of the Funds. This information included comparisons (provided both by management and by an independent third party) of the Funds’ advisory fees and total expense levels to those of their peer groups and information about the advisory fees charged by the Adviser to comparable accounts (such as institutional separate accounts), as well as information about differences in such fees and the reasons for any such differences. In considering the fees charged to comparable accounts, the Trustees considered, among other things, management’s representations about the differences between managing mutual funds as compared to other types of accounts, including the additional resources required to effectively manage mutual fund assets and the greater regulatory costs associated with the management of such assets. In evaluating each Fund’s advisory fee, the Trustees also took into account the demands, complexity and quality of the investment management of such Fund and the need for the Adviser to offer competitive compensation and the potential need to expend additional resources to the extent the Fund grows in size. The Trustees considered that over the past several years, management had made recommendations regarding reductions in advisory fee rates, implementation of advisory fee breakpoints and the institution of advisory fee waivers and expense caps for various funds in the fund
19 |
family. They noted that all of the Funds have expense caps in place, and they considered the amounts waived or reimbursed by the Adviser for certain Funds under their caps. The Trustees also considered that Loomis Sayles Small Cap Growth Fund’s current expenses are below its cap. The Trustees noted that the Funds had total advisory fee rates that were below the medians of their respective peer groups of funds.
The Trustees also considered the compensation directly or indirectly received by the Adviser and its affiliates from their relationships with the Funds. The Trustees reviewed information provided by management as to the profitability of the Adviser’s and its affiliates’ relationships with the Funds, and information about the allocation of expenses used to calculate profitability. They also reviewed information provided by management about the effect of distribution costs and changes in asset levels on Adviser profitability, including information regarding resources spent on distribution activities. When reviewing profitability, the Trustees also considered information about court cases in which adviser compensation or profitability were issues, the performance of the Funds, the expense levels of the Funds, whether the Adviser had implemented breakpoints and/or expense caps with respect to such Funds and the overall profit margin of Natixis Investment Managers compared to that of certain other investment managers for which such data was available.
After reviewing these and related factors, the Trustees concluded, within the context of their overall conclusions regarding each of the Agreements, that the advisory fee charged to each of the Funds was fair and reasonable, and that the costs of these services generally and the related profitability of the Adviser and its affiliates in respect of their relationships with the Funds supported the renewal of the Agreements.
Economies of Scale. The Trustees considered the existence of any economies of scale in the provision of services by the Adviser and whether those economies are shared with the Funds through breakpoints in their investment advisory fees or other means, such as expense caps. The Trustees also discussed with management the factors considered with respect to the implementation of breakpoints in investment advisory fees or expense caps for certain funds. Management explained that a number of factors are taken into account in considering the possible implementation of breakpoints or an expense cap for a fund, including, among other things, factors such as a fund’s assets, the projected growth of a fund, projected profitability and a fund’s fees and performance. With respect to economies of scale, the Trustees noted that although none of the Funds’ management fees were subject to breakpoints, each of the Funds was subject to an expense cap. In considering these issues, the Trustees also took note of the costs of the services provided (both on an absolute and on a relative basis) and the profitability to the Adviser and its affiliates of their relationships with the Funds, as discussed above.
After reviewing these and related factors, the Trustees concluded, within the context of their overall conclusions regarding each of the Agreements, that the extent to which economies of scale were shared with the Funds supported the renewal of the Agreements.
| 20
The Trustees also considered other factors, which included but were not limited to the following:
| • | | The effect of recent market and economic events on the performance, asset levels and expense ratios of each Fund. |
| • | | Whether each Fund has operated in accordance with its investment objective and the Fund’s record of compliance with its investment restrictions, and the compliance programs of the Funds and the Adviser. They also considered the compliance-related resources the Adviser and its affiliates were providing to the Funds. |
| • | | So-called “fallout benefits” to the Adviser, such as the engagement of affiliates of the Adviser to provide distribution and administrative services to the Funds, and the benefits of research made available to the Adviser by reason of brokerage commissions (if any) generated by the Funds’ securities transactions. The Trustees also considered the benefits to the parent company of Natixis Advisors from the retention of the Adviser. The Trustees considered the possible conflicts of interest associated with these fallout and other benefits, and the reporting, disclosure and other processes in place to disclose and monitor such possible conflicts of interest. |
| • | | The Trustees’ review and discussion of the Funds’ advisory arrangements in prior years, and management’s record of responding to Trustee concerns raised during the year and in prior years. |
Based on their evaluation of all factors that they deemed to be material, including those factors described above, and assisted by the advice of independent counsel, the Trustees, including the Independent Trustees, concluded that each of the existing Agreements should be continued through June 30, 2019.
21 |
Portfolio of Investments – as of September 30, 2018
Loomis Sayles Small Cap Growth Fund
| | | | | | | | |
Shares | | | Description | | Value (†) | |
|
| | Common Stocks – 96.0% of Net Assets | |
| |
| | | | Aerospace & Defense – 3.4% | |
| | 236,528 | | | AAR Corp. | | $ | 11,327,326 | |
| | 299,398 | | | Astronics Corp.(a) | | | 13,023,813 | |
| | 244,303 | | | Hexcel Corp. | | | 16,380,516 | |
| | 212,083 | | | KLX, Inc.(a) | | | 13,314,571 | |
| | | | | | | | |
| | | | | | | 54,046,226 | |
| | | | | | | | |
| | | | Banks – 3.6% | |
| | 221,278 | | | Chemical Financial Corp. | | | 11,816,245 | |
| | 245,125 | | | Pacific Premier Bancorp, Inc.(a) | | | 9,118,650 | |
| | 200,570 | | | Pinnacle Financial Partners, Inc. | | | 12,064,285 | |
| | 324,142 | | | Renasant Corp. | | | 13,357,892 | |
| | 159,604 | | | UMB Financial Corp. | | | 11,315,924 | |
| | | | | | | | |
| | | | | | | 57,672,996 | |
| | | | | | | | |
| | | | Beverages – 0.8% | |
| | 159,978 | | | MGP Ingredients, Inc. | | | 12,635,062 | |
| | | | | | | | |
| | | | Biotechnology – 4.7% | |
| | 140,093 | | | Agios Pharmaceuticals, Inc.(a) | | | 10,803,972 | |
| | 276,074 | | | Aimmune Therapeutics, Inc.(a) | | | 7,531,299 | |
| | 117,591 | | | Argenx SE, ADR(a) | | | 8,918,101 | |
| | 277,121 | | | Genomic Health, Inc.(a) | | | 19,459,437 | |
| | 185,619 | | | Global Blood Therapeutics, Inc.(a) | | | 7,053,522 | |
| | 609,861 | | | Ironwood Pharmaceuticals, Inc.(a) | | | 11,258,034 | |
| | 244,826 | | | Xencor, Inc.(a) | | | 9,540,869 | |
| | | | | | | | |
| | | | | | | 74,565,234 | |
| | | | | | | | |
| | | | Building Products – 1.9% | |
| | 187,339 | | | Patrick Industries, Inc.(a) | | | 11,090,469 | |
| | 252,302 | | | Trex Co., Inc.(a) | | | 19,422,208 | |
| | | | | | | | |
| | | | | | | 30,512,677 | |
| | | | | | | | |
| | | | Capital Markets – 1.5% | |
| | 291,250 | | | Artisan Partners Asset Management, Inc., Class A | | | 9,436,500 | |
| | 76,101 | | | MarketAxess Holdings, Inc. | | | 13,583,268 | |
| | | | | | | | |
| | | | | | | 23,019,768 | |
| | | | | | | | |
| | | | Chemicals – 1.2% | |
| | 193,693 | | | Ingevity Corp.(a) | | | 19,733,443 | |
| | | | | | | | |
| | | | Construction & Engineering – 1.7% | |
| | 527,405 | | | Primoris Services Corp. | | | 13,090,192 | |
| | 794,882 | | | Willscot Corp.(a) | | | 13,632,226 | |
| | | | | | | | |
| | | | | | | 26,722,418 | |
| | | | | | | | |
| | | | Consumer Finance – 1.2% | |
| | 214,699 | | | Green Dot Corp., Class A(a) | | | 19,069,565 | |
| | | | | | | | |
See accompanying notes to financial statements.
| 22
Portfolio of Investments – as of September 30, 2018
Loomis Sayles Small Cap Growth Fund – continued
| | | | | | | | |
Shares | | | Description | | Value (†) | |
|
| | Common Stocks – continued | |
| |
| | | | Distributors – 1.2% | |
| | 117,815 | | | Pool Corp. | | $ | 19,660,967 | |
| | | | | | | | |
| | | | Diversified Consumer Services – 4.3% | |
| | 119,684 | | | Bright Horizons Family Solutions, Inc.(a) | | | 14,103,563 | |
| | 507,445 | | | Chegg, Inc.(a) | | | 14,426,661 | |
| | 199,300 | | | Grand Canyon Education, Inc.(a) | | | 22,481,040 | |
| | 1,097,047 | | | Laureate Education, Inc., Class A(a) | | | 16,938,406 | |
| | | | | | | | |
| | | | | | | 67,949,670 | |
| | | | | | | | |
| | | | Diversified Telecommunication Services – 1.0% | |
| | 293,193 | | | Cogent Communications Holdings, Inc. | | | 16,360,169 | |
| | | | | | | | |
| | | | Electrical Equipment – 1.2% | |
| | 329,973 | | | Generac Holdings, Inc.(a) | | | 18,613,777 | |
| | | | | | | | |
| | | | Energy Equipment & Services – 1.8% | |
| | 437,772 | | | Cactus, Inc., Class A(a) | | | 16,757,912 | |
| | 177,396 | | | Dril-Quip, Inc.(a) | | | 9,268,941 | |
| | 84,773 | | | KLX Energy Services Holdings, Inc.(a) | | | 2,713,584 | |
| | | | | | | | |
| | | | | | | 28,740,437 | |
| | | | | | | | |
| | | | Entertainment – 0.5% | |
| | 316,346 | | | IMAX Corp.(a) | | | 8,161,727 | |
| | | | | | | | |
| | | | Food & Staples Retailing – 0.5% | |
| | 211,900 | | | Chefs’ Warehouse, Inc. (The)(a) | | | 7,702,565 | |
| | | | | | | | |
| | | | Food Products – 0.7% | |
| | 293,791 | | | Freshpet, Inc.(a) | | | 10,782,130 | |
| | | | | | | | |
| | | | Health Care Equipment & Supplies – 10.1% | |
| | 521,947 | | | AtriCure, Inc.(a) | | | 18,283,803 | |
| | 59,505 | | | Inogen, Inc.(a) | | | 14,526,361 | |
| | 214,027 | | | Insulet Corp.(a) | | | 22,676,161 | |
| | 191,749 | | | iRhythm Technologies, Inc.(a) | | | 18,150,960 | |
| | 211,186 | | | Merit Medical Systems, Inc.(a) | | | 12,977,380 | |
| | 86,343 | | | Neogen Corp.(a) | | | 6,176,115 | |
| | 401,665 | | | Novocure Ltd.(a) | | | 21,047,246 | |
| | 116,993 | | | Penumbra, Inc.(a) | | | 17,513,852 | |
| | 156,165 | | | Tactile Systems Technology, Inc.(a) | | | 11,095,523 | |
| | 595,956 | | | Wright Medical Group NV(a) | | | 17,294,643 | |
| | | | | | | | |
| | | | | | | 159,742,044 | |
| | | | | | | | |
| | | | Health Care Providers & Services – 4.8% | |
| | 115,423 | | | Amedisys, Inc.(a) | | | 14,423,258 | |
| | 281,830 | | | AMN Healthcare Services, Inc.(a) | | | 15,416,101 | |
| | 206,177 | | | BioTelemetry, Inc.(a) | | | 13,288,108 | |
| | 239,518 | | | HealthEquity, Inc.(a) | | | 22,612,894 | |
See accompanying notes to financial statements.
23 |
Portfolio of Investments – as of September 30, 2018
Loomis Sayles Small Cap Growth Fund – continued
| | | | | | | | |
Shares | | | Description | | Value (†) | |
|
| | Common Stocks – continued | |
| |
| | | | Health Care Providers & Services – continued | |
| | 295,660 | | | Tivity Health, Inc.(a) | | $ | 9,505,469 | |
| | | | | | | | |
| | | | | | | 75,245,830 | |
| | | | | | | | |
| | | | Health Care Technology – 3.6% | |
| | 256,638 | | | Medidata Solutions, Inc.(a) | | | 18,814,131 | |
| | 259,254 | | | Teladoc Health, Inc.(a) | | | 22,386,583 | |
| | 431,941 | | | Vocera Communications, Inc.(a) | | | 15,800,402 | |
| | | | | | | | |
| | | | | | | 57,001,116 | |
| | | | | | | | |
| | | | Hotels, Restaurants & Leisure – 2.6% | |
| | 385,517 | | | Planet Fitness, Inc., Class A(a) | | | 20,829,483 | |
| | 291,773 | | | Wingstop, Inc. | | | 19,919,343 | |
| | | | | | | | |
| | | | | | | 40,748,826 | |
| | | | | | | | |
| | | | Insurance – 2.0% | |
| | 275,401 | | | Kinsale Capital Group, Inc. | | | 17,587,108 | |
| | 395,460 | | | Trupanion, Inc.(a) | | | 14,129,786 | |
| | | | | | | | |
| | | | | | | 31,716,894 | |
| | | | | | | | |
| | | | IT Services – 4.9% | |
| | 119,236 | | | Euronet Worldwide, Inc.(a) | | | 11,949,832 | |
| | 312,408 | | | Evo Payments, Inc., Class A(a) | | | 7,466,551 | |
| | 305,005 | | | InterXion Holding NV(a) | | | 20,526,836 | |
| | 334,608 | | | Virtusa Corp.(a) | | | 17,971,796 | |
| | 389,180 | | | WNS Holdings Ltd., ADR(a) | | | 19,750,885 | |
| | | | | | | | |
| | | | | | | 77,665,900 | |
| | | | | | | | |
| | | | Leisure Products – 0.4% | |
| | 123,638 | | | Malibu Boats, Inc., Class A(a) | | | 6,765,471 | |
| | | | | | | | |
| | | | Life Sciences Tools & Services – 1.6% | |
| | 222,399 | | | PRA Health Sciences, Inc.(a) | | | 24,506,146 | |
| | | | | | | | |
| | | | Machinery – 5.0% | |
| | 227,707 | | | Albany International Corp., Class A | | | 18,102,706 | |
| | 690,971 | | | Harsco Corp.(a) | | | 19,727,222 | |
| | 133,813 | | | Proto Labs, Inc.(a) | | | 21,644,253 | |
| | 125,291 | | | RBC Bearings, Inc.(a) | | | 18,838,755 | |
| | | | | | | | |
| | | | | | | 78,312,936 | |
| | | | | | | | |
| | | | Multiline Retail – 1.3% | |
| | 213,429 | | | Ollie’s Bargain Outlet Holdings, Inc.(a) | | | 20,510,527 | |
| | | | | | | | |
| | | | Oil, Gas & Consumable Fuels – 0.7% | |
| | 231,370 | | | PDC Energy, Inc.(a) | | | 11,327,875 | |
| | | | | | | | |
| | | | Pharmaceuticals – 1.9% | |
| | 212,531 | | | Aerie Pharmaceuticals, Inc.(a) | | | 13,081,283 | |
See accompanying notes to financial statements.
| 24
Portfolio of Investments – as of September 30, 2018
Loomis Sayles Small Cap Growth Fund – continued
| | | | | | | | |
Shares | | | Description | | Value (†) | |
|
| | Common Stocks – continued | |
| |
| | | | Pharmaceuticals – continued | |
| | 328,179 | | | Supernus Pharmaceuticals, Inc.(a) | | $ | 16,523,813 | |
| | | | | | | | |
| | | | | | | 29,605,096 | |
| | | | | | | | |
| | | | Semiconductors & Semiconductor Equipment – 2.6% | |
| | 128,431 | | | MKS Instruments, Inc. | | | 10,293,744 | |
| | 130,673 | | | Monolithic Power Systems, Inc. | | | 16,403,382 | |
| | 165,286 | | | Silicon Laboratories, Inc.(a) | | | 15,173,255 | |
| | | | | | | | |
| | | | | | | 41,870,381 | |
| | | | | | | | |
| | | | Software – 14.5% | |
| | 173,434 | | | 2U, Inc.(a) | | | 13,040,503 | |
| | 148,764 | | | Blackbaud, Inc. | | | 15,096,571 | |
| | 305,154 | | | Envestnet, Inc.(a) | | | 18,599,136 | |
| | 462,441 | | | Five9, Inc.(a) | | | 20,204,047 | |
| | 198,702 | | | Guidewire Software, Inc.(a) | | | 20,070,889 | |
| | 114,601 | | | HubSpot, Inc.(a) | | | 17,299,021 | |
| | 482,252 | | | Mimecast Ltd.(a) | | | 20,196,714 | |
| | 364,885 | | | Q2 Holdings, Inc.(a) | | | 22,093,787 | |
| | 496,007 | | | Rapid7, Inc.(a) | | | 18,312,578 | |
| | 334,608 | | | RealPage, Inc.(a) | | | 22,050,667 | |
| | 214,326 | | | RingCentral, Inc., Class A(a) | | | 19,943,034 | |
| | 216,419 | | | Talend S.A., ADR(a) | | | 15,093,061 | |
| | 105,406 | | | Varonis Systems, Inc.(a) | | | 7,720,990 | |
| | | | | | | | |
| | | | | | | 229,720,998 | |
| | | | | | | | |
| | | | Specialty Retail – 2.2% | |
| | 468,796 | | | At Home Group, Inc.(a) | | | 14,781,138 | |
| | 425,960 | | | National Vision Holdings, Inc.(a) | | | 19,227,834 | |
| | | | | | | | |
| | | | | | | 34,008,972 | |
| | | | | | | | |
| | | | Textiles, Apparel & Luxury Goods – 4.2% | |
| | 196,833 | | | Columbia Sportswear Co. | | | 18,319,247 | |
| | 682,748 | | | Crocs, Inc.(a) | | | 14,535,705 | |
| | 385,218 | | | G-III Apparel Group Ltd.(a) | | | 18,563,655 | |
| | 276,523 | | | Steven Madden Ltd. | | | 14,628,067 | |
| | | | | | | | |
| | | | | | | 66,046,674 | |
| | | | | | | | |
| | | | Thrifts & Mortgage Finance – 0.6% | |
| | 196,758 | | | Essent Group Ltd.(a) | | | 8,706,542 | |
| | | | | | | | |
| | | | Trading Companies & Distributors – 1.8% | |
| | 507,220 | | | BMC Stock Holdings, Inc.(a) | | | 9,459,653 | |
| | 246,770 | | | SiteOne Landscape Supply, Inc.(a) | | | 18,591,652 | |
| | | | | | | | |
| | | | | | | 28,051,305 | |
| | | | | | | | |
| | |
| | | | Total Common Stocks
(Identified Cost $976,295,315) | | | 1,517,502,364 | |
| | | | | | | | |
See accompanying notes to financial statements.
25 |
Portfolio of Investments – as of September 30, 2018
Loomis Sayles Small Cap Growth Fund – continued
| | | | | | | | |
Principal
Amount | | | Description | | Value (†) | |
|
| | Short-Term Investments – 4.1% | |
| $ | 65,314,588 | | | Tri-Party Repurchase Agreement with Fixed Income Clearing Corporation, dated 9/28/2018 at 1.300% to be repurchased at $65,321,664 on 10/01/2018 collateralized by $67,080,000 U.S. Treasury Bond, 3.125% due 8/15/2044 valued at $66,623,319 including accrued interest (Note 2 of Notes to Financial Statements) (Identified Cost $65,314,588) | | $ | 65,314,588 | |
| | | | | | | | |
| | | | Total Investments – 100.1%
(Identified Cost $1,041,609,903) | | | 1,582,816,952 | |
| | | | Other assets less liabilities—(0.1)% | | | (1,753,311 | ) |
| | | | | | | | |
| | | | Net Assets – 100.0% | | $ | 1,581,063,641 | |
| | | | | | | | |
| | |
| | (†) | | | See Note 2 of Notes to Financial Statements. | | | | |
| | (a) | | | Non-income producing security. | | | | |
| |
| | ADR | | | An American Depositary Receipt is a certificate issued by a custodian bank representing the right to receive securities of the foreign issuer described. The values of ADRs may be significantly influenced by trading on exchanges not located in the United States. | |
Industry Summary at September 30, 2018
| | | | |
Software | | | 14.5 | % |
Health Care Equipment & Supplies | | | 10.1 | |
Machinery | | | 5.0 | |
IT Services | | | 4.9 | |
Health Care Providers & Services | | | 4.8 | |
Biotechnology | | | 4.7 | |
Diversified Consumer Services | | | 4.3 | |
Textiles, Apparel & Luxury Goods | | | 4.2 | |
Banks | | | 3.6 | |
Health Care Technology | | | 3.6 | |
Aerospace & Defense | | | 3.4 | |
Semiconductors & Semiconductor Equipment | | | 2.6 | |
Hotels, Restaurants & Leisure | | | 2.6 | |
Specialty Retail | | | 2.2 | |
Insurance | | | 2.0 | |
Other Investments, less than 2% each | | | 23.5 | |
Short-Term Investments | | | 4.1 | |
| | | | |
Total Investments | | | 100.1 | |
Other assets less liabilities | | | (0.1 | ) |
| | | | |
Net Assets | | | 100.0 | % |
| | | | |
See accompanying notes to financial statements.
| 26
Portfolio of Investments – as of September 30, 2018
Loomis Sayles Small Cap Value Fund
| | | | | | | | |
| Shares | | | Description | | Value (†) | |
|
| | Common Stocks – 99.1% of Net Assets | |
| |
| | | | Aerospace & Defense – 1.7% | |
| | 255,946 | | | Aerojet Rocketdyne Holdings, Inc.(a) | | $ | 8,699,605 | |
| | 123,267 | | | BWX Technologies, Inc. | | | 7,709,118 | |
| | | | | | | | |
| | | | | | | 16,408,723 | |
| | | | | | | | |
| | | | Auto Components – 2.0% | |
| | 227,260 | | | Cooper Tire & Rubber Co. | | | 6,431,458 | |
| | 95,349 | | | Fox Factory Holding Corp.(a) | | | 6,679,198 | |
| | 75,759 | | | LCI Industries | | | 6,272,845 | |
| | | | | | | | |
| | | | | | | 19,383,501 | |
| | | | | | | | |
| | | | Banks – 16.7% | |
| | 246,943 | | | BancorpSouth Bank | | | 8,075,036 | |
| | 101,926 | | | Bank OZK | | | 3,869,111 | |
| | 187,369 | | | Bryn Mawr Bank Corp. | | | 8,787,606 | |
| | 93,559 | | | Carolina Financial Corp. | | | 3,529,046 | |
| | 230,414 | | | Cathay General Bancorp | | | 9,548,356 | |
| | 295,898 | | | CenterState Bank Corp. | | | 8,299,939 | |
| | 176,008 | | | Chemical Financial Corp. | | | 9,398,827 | |
| | 362,569 | | | CVB Financial Corp. | | | 8,092,540 | |
| | 286,314 | | | First Financial Bancorp | | | 8,503,526 | |
| | 113,874 | | | First Financial Bankshares, Inc. | | | 6,729,953 | |
| | 364,502 | | | Home BancShares, Inc. | | | 7,982,594 | |
| | 111,663 | | | IBERIABANK Corp. | | | 9,083,785 | |
| | 168,893 | | | PacWest Bancorp | | | 8,047,751 | |
| | 120,553 | | | Pinnacle Financial Partners, Inc. | | | 7,251,263 | |
| | 230,444 | | | Popular, Inc. | | | 11,810,255 | |
| | 140,579 | | | Prosperity Bancshares, Inc. | | | 9,749,154 | |
| | 53,627 | | | Signature Bank | | | 6,158,525 | |
| | 91,385 | | | Texas Capital Bancshares, Inc.(a) | | | 7,552,970 | |
| | 250,033 | | | Triumph Bancorp, Inc.(a) | | | 9,551,261 | |
| | 127,878 | | | Wintrust Financial Corp. | | | 10,861,957 | |
| | | | | | | | |
| | | | | | | 162,883,455 | |
| | | | | | | | |
| | | | Beverages – 0.8% | |
| | 498,104 | | | Cott Corp. | | | 8,044,380 | |
| | | | | | | | |
| | | | Building Products – 1.4% | |
| | 120,321 | | | Armstrong World Industries, Inc.(a) | | | 8,374,342 | |
| | 77,074 | | | Masonite International Corp.(a) | | | 4,940,443 | |
| | | | | | | | |
| | | | | | | 13,314,785 | |
| | | | | | | | |
| | | | Capital Markets – 1.4% | |
| | 324,184 | | | Donnelley Financial Solutions, Inc.(a) | | | 5,809,377 | |
| | 147,790 | | | Stifel Financial Corp. | | | 7,575,716 | |
| | | | | | | | |
| | | | | | | 13,385,093 | |
| | | | | | | | |
See accompanying notes to financial statements.
27 |
Portfolio of Investments – as of September 30, 2018
Loomis Sayles Small Cap Value Fund – continued
| | | | | | | | |
| Shares | | | Description | | Value (†) | |
|
| | Common Stocks – continued | |
| |
| | | | Chemicals – 4.3% | |
| | 269,946 | | | AdvanSix, Inc.(a) | | $ | 9,164,667 | |
| | 70,384 | | | Ashland Global Holdings, Inc. | | | 5,902,402 | |
| | 93,480 | | | Cabot Corp. | | | 5,863,066 | |
| | 87,316 | | | Ingevity Corp.(a) | | | 8,895,754 | |
| | 89,569 | | | Minerals Technologies, Inc. | | | 6,054,864 | |
| | 83,057 | | | WR Grace & Co. | | | 5,935,253 | |
| | | | | | | | |
| | | | | | | 41,816,006 | |
| | | | | | | | |
| | | | Commercial Services & Supplies – 3.8% | |
| | 107,350 | | | Clean Harbors, Inc.(a) | | | 7,684,113 | |
| | 211,905 | | | KAR Auction Services, Inc. | | | 12,648,610 | |
| | 232,661 | | | Kimball International, Inc. | | �� | 3,897,072 | |
| | 190,190 | | | LSC Communications, Inc. | | | 2,103,501 | |
| | 183,580 | | | Viad Corp. | | | 10,877,115 | |
| | | | | | | | |
| | | | | | | 37,210,411 | |
| | | | | | | | |
| | | | Communications Equipment – 1.0% | |
| | 279,340 | | | Digi International, Inc.(a) | | | 3,757,123 | |
| | 518,099 | | | Viavi Solutions, Inc.(a) | | | 5,875,243 | |
| | | | | | | | |
| | | | | | | 9,632,366 | |
| | | | | | | | |
| | | | Construction & Engineering – 0.3% | |
| | 77,601 | | | MYR Group, Inc.(a) | | | 2,532,897 | |
| | | | | | | | |
| | | | Construction Materials – 0.2% | |
| | 43,734 | | | U.S. Concrete, Inc.(a) | | | 2,005,204 | |
| | | | | | | | |
| | | | Consumer Finance – 0.7% | |
| | 195,823 | | | PRA Group, Inc.(a) | | | 7,049,628 | |
| | | | | | | | |
| | | | Distributors – 0.2% | |
| | 53,467 | | | Core-Mark Holding Co., Inc. | | | 1,815,739 | |
| | | | | | | | |
| | | | Diversified Consumer Services – 1.1% | |
| | 74,038 | | | Adtalem Global Education, Inc.(a) | | | 3,568,632 | |
| | 121,764 | | | ServiceMaster Global Holdings, Inc.(a) | | | 7,553,021 | |
| | | | | | | | |
| | | | | | | 11,121,653 | |
| | | | | | | | |
| | | | Diversified Financial Services – 0.4% | |
| | 190,922 | | | Cannae Holdings, Inc.(a) | | | 3,999,816 | |
| | | | | | | | |
| | | | Electric Utilities – 1.2% | |
| | 152,301 | | | ALLETE, Inc. | | | 11,424,098 | |
| | | | | | | | |
| | | | Electrical Equipment – 0.7% | |
| | 228,520 | | | TPI Composites, Inc.(a) | | | 6,524,246 | |
| | | | | | | | |
| | | | Electronic Equipment, Instruments & Components – 4.5% | |
| | 97,683 | | | Belden, Inc. | | | 6,975,543 | |
See accompanying notes to financial statements.
| 28
Portfolio of Investments – as of September 30, 2018
Loomis Sayles Small Cap Value Fund – continued
| | | | | | | | |
| Shares | | | Description | | Value (†) | |
|
| | Common Stocks – continued | |
| |
| | | | Electronic Equipment, Instruments & Components – continued | |
| | 105,632 | | | II-VI, Inc.(a) | | $ | 4,996,393 | |
| | 84,684 | | | Kimball Electronics, Inc.(a) | | | 1,664,041 | |
| | 74,058 | | | Littelfuse, Inc. | | | 14,655,338 | |
| | 131,419 | | | Methode Electronics, Inc. | | | 4,757,368 | |
| | 46,883 | | | Rogers Corp.(a) | | | 6,906,803 | |
| | 181,363 | | | Vishay Intertechnology, Inc. | | | 3,690,737 | |
| | | | | | | | |
| | | | | | | 43,646,223 | |
| | | | | | | | |
| | | | Energy Equipment & Services – 2.8% | |
| | 177,468 | | | Apergy Corp.(a) | | | 7,730,506 | |
| | 280,567 | | | C&J Energy Services, Inc.(a) | | | 5,835,794 | |
| | 62,228 | | | KLX Energy Services Holdings, Inc.(a) | | | 1,991,918 | |
| | 94,020 | | | Natural Gas Services Group, Inc.(a) | | | 1,983,822 | |
| | 151,990 | | | Oil States International, Inc.(a) | | | 5,046,068 | |
| | 230,629 | | | U.S. Silica Holdings, Inc. | | | 4,342,744 | |
| | | | | | | | |
| | | | | | | 26,930,852 | |
| | | | | | | | |
| | | | Food Products – 3.1% | |
| | 161,073 | | | Darling Ingredients, Inc.(a) | | | 3,111,930 | |
| | 50,327 | | | J&J Snack Foods Corp. | | | 7,593,841 | |
| | 422,096 | | | Nomad Foods Ltd.(a) | | | 8,551,665 | |
| | 76,267 | | | Post Holdings, Inc.(a) | | | 7,477,217 | |
| | 523,103 | | | SunOpta, Inc.(a) | | | 3,844,807 | |
| | | | | | | | |
| | | | | | | 30,579,460 | |
| | | | | | | | |
| | | | Health Care Equipment & Supplies – 2.4% | |
| | 145,580 | | | Avanos Medical, Inc.(a) | | | 9,972,230 | |
| | 100,331 | | | Quidel Corp.(a) | | | 6,538,571 | |
| | 247,116 | | | Varex Imaging Corp.(a) | | | 7,082,345 | |
| | | | | | | | |
| | | | | | | 23,593,146 | |
| | | | | | | | |
| | | | Health Care Providers & Services – 0.7% | |
| | 126,877 | | | AMN Healthcare Services, Inc.(a) | | | 6,940,172 | |
| | | | | | | | |
| | | | Hotels, Restaurants & Leisure – 2.2% | |
| | 38,038 | | | Churchill Downs, Inc. | | | 10,563,153 | |
| | 17,148 | | | Cracker Barrel Old Country Store, Inc. | | | 2,522,985 | |
| | 79,269 | | | Marriott Vacations Worldwide Corp. | | | 8,858,311 | |
| | | | | | | | |
| | | | | | | 21,944,449 | |
| | | | | | | | |
| | | | Household Durables – 0.7% | |
| | 54,501 | | | Helen of Troy Ltd.(a) | | | 7,134,181 | |
| | | | | | | | |
| | | | Household Products – 0.6% | |
| | 73,890 | | | Spectrum Brands Holdings, Inc. | | | 5,521,061 | |
| | | | | | | | |
See accompanying notes to financial statements.
29 |
Portfolio of Investments – as of September 30, 2018
Loomis Sayles Small Cap Value Fund – continued
| | | | | | | | |
| Shares | | | Description | | Value (†) | |
|
| | Common Stocks – continued | |
| |
| | | | Independent Power & Renewable Electricity Producers – 0.7% | |
| | 135,835 | | | NextEra Energy Partners LP | | $ | 6,587,997 | |
| | | | | | | | |
| | | | Industrial Conglomerates – 0.9% | |
| | 188,386 | | | Raven Industries, Inc. | | | 8,618,659 | |
| | | | | | | | |
| | | | Insurance – 3.7% | |
| | 238,505 | | | Employers Holdings, Inc. | | | 10,804,276 | |
| | 135,491 | | | First American Financial Corp. | | | 6,989,981 | |
| | 127,922 | | | ProAssurance Corp. | | | 6,005,938 | |
| | 64,717 | | | Reinsurance Group of America, Inc. | | | 9,355,490 | |
| | 58,123 | | | Stewart Information Services Corp. | | | 2,616,116 | |
| | | | | | | | |
| | | | | | | 35,771,801 | |
| | | | | | | | |
| | | | Interactive Media & Services – 0.4% | |
| | 19,703 | | | IAC/InterActiveCorp(a) | | | 4,270,034 | |
| | | | | | | | |
| | | | IT Services – 4.9% | |
| | 383,813 | | | Conduent, Inc.(a) | | | 8,643,469 | |
| | 93,053 | | | CSG Systems International, Inc. | | | 3,735,147 | |
| | 108,400 | | | Euronet Worldwide, Inc.(a) | | | 10,863,848 | |
| | 143,583 | | | Genpact Ltd. | | | 4,395,076 | |
| | 340,535 | | | Perspecta, Inc. | | | 8,758,560 | |
| | 54,566 | | | WEX, Inc.(a) | | | 10,954,670 | |
| | | | | | | | |
| | | | | | | 47,350,770 | |
| | | | | | | | |
| | | | Life Sciences Tools & Services – 0.9% | |
| | 133,497 | | | Cambrex Corp.(a) | | | 9,131,195 | |
| | | | | | | | |
| | | | Machinery – 6.3% | |
| | 44,493 | | | Alamo Group, Inc. | | | 4,076,004 | |
| | 32,612 | | | Albany International Corp., Class A | | | 2,592,654 | |
| | 117,459 | | | Altra Industrial Motion Corp. | | | 4,851,057 | |
| | 199,235 | | | Columbus McKinnon Corp. | | | 7,877,752 | |
| | 96,109 | | | EnPro Industries, Inc. | | | 7,009,229 | |
| | 201,567 | | | Evoqua Water Technologies Corp.(a) | | | 3,583,861 | |
| | 63,972 | | | John Bean Technologies Corp. | | | 7,631,860 | |
| | 26,099 | | | Kadant, Inc. | | | 2,814,777 | |
| | 36,547 | | | RBC Bearings, Inc.(a) | | | 5,495,207 | |
| | 81,278 | | | Standex International Corp. | | | 8,473,231 | |
| | 63,315 | | | WABCO Holdings, Inc.(a) | | | 7,467,371 | |
| | | | | | | | |
| | | | | | | 61,873,003 | |
| | | | | | | | |
| | | | Marine – 0.5% | |
| | 55,258 | | | Kirby Corp.(a) | | | 4,544,970 | |
| | | | | | | | |
| | | | Media – 2.8% | |
| | 128,493 | | | Emerald Expositions Events, Inc. | | | 2,117,565 | |
| | 169,129 | | | GCI Liberty, Inc., Class A(a) | | | 8,625,579 | |
See accompanying notes to financial statements.
| 30
Portfolio of Investments – as of September 30, 2018
Loomis Sayles Small Cap Value Fund – continued
| | | | | | | | |
| Shares | | | Description | | Value (†) | |
|
| | Common Stocks – continued | |
| |
| | | | Media – continued | |
| | 592,370 | | | Gray Television, Inc.(a) | | $ | 10,366,475 | |
| | 97,470 | | | John Wiley & Sons, Inc., Class A | | | 5,906,682 | |
| | | | | | | | |
| | | | | | | 27,016,301 | |
| | | | | | | | |
| | | | Metals & Mining – 0.4% | |
| | 507,316 | | | Ferroglobe R&W Trust(a)(b)(c)(d) | | | — | |
| | 111,780 | | | Haynes International, Inc. | | | 3,968,190 | |
| | | | | | | | |
| | | | | | | 3,968,190 | |
| | | | | | | | |
| | | | Multi-Utilities – 0.8% | |
| | 134,804 | | | NorthWestern Corp. | | | 7,907,603 | |
| | | | | | | | |
| | | | Multiline Retail – 0.5% | |
| | 118,938 | | | Big Lots, Inc. | | | 4,970,419 | |
| | | | | | | | |
| | | | Oil, Gas & Consumable Fuels – 1.5% | |
| | 4,866 | | | Arch Coal, Inc., Class A | | | 435,020 | |
| | 332,301 | | | Gulfport Energy Corp.(a) | | | 3,459,253 | |
| | 468,167 | | | QEP Resources, Inc.(a) | | | 5,299,651 | |
| | 623,853 | | | SRC Energy, Inc.(a) | | | 5,546,053 | |
| | | | | | | | |
| | | | | | | 14,739,977 | |
| | | | | | | | |
| | | | Pharmaceuticals – 1.5% | |
| | 171,718 | | | Catalent, Inc.(a) | | | 7,821,755 | |
| | 182,636 | | | Prestige Consumer Healthcare, Inc.(a) | | | 6,920,078 | |
| | | | | | | | |
| | | | | | | 14,741,833 | |
| | | | | | | | |
| | | | Professional Services – 1.7% | |
| | 69,320 | | | Insperity, Inc. | | | 8,176,294 | |
| | 175,860 | | | Korn/Ferry International | | | 8,659,346 | |
| | | | | | | | |
| | | | | | | 16,835,640 | |
| | | | | | | | |
| | | | REITs – Apartments – 0.5% | |
| | 123,273 | | | American Campus Communities, Inc. | | | 5,073,917 | |
| | | | | | | | |
| | | | REITs – Diversified – 1.0% | |
| | 150,675 | | | CorePoint Lodging, Inc. | | | 2,930,629 | |
| | 103,633 | | | CyrusOne, Inc. | | | 6,570,332 | |
| | | | | | | | |
| | | | | | | 9,500,961 | |
| | | | | | | | |
| | | | REITs – Health Care – 0.4% | |
| | 168,558 | | | Sabra Health Care REIT, Inc. | | | 3,897,061 | |
| | | | | | | | |
| | | | REITs – Hotels – 0.5% | |
| | 197,797 | | | Hersha Hospitality Trust | | | 4,484,058 | |
| | | | | | | | |
| | | | REITs – Mortgage – 0.7% | |
| | 571,570 | | | iStar, Inc. | | | 6,384,437 | |
| | | | | | | | |
See accompanying notes to financial statements.
31 |
Portfolio of Investments – as of September 30, 2018
Loomis Sayles Small Cap Value Fund – continued
| | | | | | | | |
| Shares | | | Description | | Value (†) | |
|
| | Common Stocks – continued | |
| |
| | | | REITs – Office Property – 0.7% | |
| | 190,298 | | | JBG SMITH Properties | | $ | 7,008,675 | |
| | | | | | | | |
| | | | REITs – Shopping Centers – 1.1% | |
| | 556,780 | | | Retail Opportunity Investments Corp. | | | 10,395,083 | |
| | | | | | | | |
| | | | REITs – Single Tenant – 0.5% | |
| | 107,615 | | | National Retail Properties, Inc. | | | 4,823,304 | |
| | | | | | | | |
| | | | REITs – Storage – 0.9% | |
| | 312,934 | | | CubeSmart | | | 8,928,007 | |
| | | | | | | | |
| | | | REITs – Warehouse/Industrials – 0.7% | |
| | 208,288 | | | Rexford Industrial Realty, Inc. | | | 6,656,884 | |
| | | | | | | | |
| | | | Road & Rail – 1.6% | |
| | 80,814 | | | Genesee & Wyoming, Inc., Class A(a) | | | 7,353,266 | |
| | 50,832 | | | Old Dominion Freight Line, Inc. | | | 8,197,168 | |
| | | | | | | | |
| | | | | | | 15,550,434 | |
| | | | | | | | |
| | | | Semiconductors & Semiconductor Equipment – 2.7% | |
| | 100,058 | | | Advanced Energy Industries, Inc.(a) | | | 5,167,996 | |
| | 129,077 | | | Mellanox Technologies Ltd.(a) | | | 9,480,705 | |
| | 99,552 | | | Semtech Corp.(a) | | | 5,535,091 | |
| | 255,451 | | | Ultra Clean Holdings, Inc.(a) | | | 3,205,910 | |
| | 94,179 | | | Versum Materials, Inc. | | | 3,391,386 | |
| | | | | | | | |
| | | | | | | 26,781,088 | |
| | | | | | | | |
| | | | Software – 2.2% | |
| | 115,902 | | | CommVault Systems, Inc.(a) | | | 8,113,140 | |
| | 35,528 | | | LogMeIn, Inc. | | | 3,165,545 | |
| | 321,372 | | | TiVo Corp. | | | 4,001,081 | |
| | 116,593 | | | Verint Systems, Inc.(a) | | | 5,841,309 | |
| | | | | | | | |
| | | | | | | 21,121,075 | |
| | | | | | | | |
| | | | Specialty Retail – 1.2% | |
| | 112,222 | | | Aaron’s, Inc. | | | 6,111,610 | |
| | 53,284 | | | Genesco, Inc.(a) | | | 2,509,677 | |
| | 152,895 | | | Sally Beauty Holdings, Inc.(a) | | | 2,811,739 | |
| | | | | | | | |
| | | | | | | 11,433,026 | |
| | | | | | | | |
| | | | Technology Hardware, Storage & Peripherals – 0.3% | |
| | 143,486 | | | Cray, Inc.(a) | | | 3,084,949 | |
| | | | | | | | |
| | | | Thrifts & Mortgage Finance – 1.7% | |
| | 64,242 | | | Federal Agricultural Mortgage Corp., Class C | | | 4,636,988 | |
| | 65,990 | | | Meta Financial Group, Inc. | | | 5,454,073 | |
See accompanying notes to financial statements.
| 32
Portfolio of Investments – as of September 30, 2018
Loomis Sayles Small Cap Value Fund – continued
| | | | | | | | |
| Shares | | | Description | | Value (†) | |
|
| | Common Stocks – continued | |
| |
| | | | Thrifts & Mortgage Finance – continued | |
| | 251,288 | | | OceanFirst Financial Corp. | | $ | 6,840,059 | |
| | | | | | | | |
| | | | | | | 16,931,120 | |
| | | | | | | | |
| | | | Total Common Stocks
(Identified Cost $651,374,613) | | | 965,224,016 | |
| | | | | | | | |
|
| | Closed-End Investment Companies – 0.3% | |
| | 212,488 | | | Hercules Capital, Inc.
(Identified Cost $2,911,138) | | | 2,796,342 | |
| | | | | | | | |
| | |
| Principal
Amount |
| | | | | | |
|
| | Short-Term Investments – 0.7% | |
| $ | 6,856,247 | | | Tri-Party Repurchase Agreement with Fixed Income Clearing Corporation, dated 9/28/2018 at 1.300% to be repurchased at $6,856,990 on 10/01/2018 collateralized by $7,045,000 U.S. Treasury Bond, 3.125% due 8/15/2044 valued at $6,997,038 including accrued interest (Note 2 of Notes to Financial Statements) (Identified Cost $6,856,247) | | | 6,856,247 | |
| | | | | | | | |
| | | | Total Investments – 100.1%
(Identified Cost $661,141,998) | | | 974,876,605 | |
| | | | Other assets less liabilities—(0.1)% | | | (1,192,106 | ) |
| | | | | | | | |
| | | | Net Assets – 100.0% | | $ | 973,684,499 | |
| | | | | | | | |
| |
| | (†) | | | See Note 2 of Notes to Financial Statements. | |
| | (a) | | | Non-income producing security. | |
| | (b) | | | Illiquid security. (Unaudited) | |
| | (c) | | | Security classified as fair valued pursuant to the Fund’s pricing policies and procedures. At September 30, 2018, the value of this security amounted to $0. See Note 2 of Notes to Financial Statements. | |
| | (d) | | | Security subject to restrictions on resale. This security was acquired on November 29, 2016 at a cost of $0. At September 30, 2018, the value of this security amounted to $0. | |
| |
| | REITs | | | Real Estate Investment Trusts | |
See accompanying notes to financial statements.
33 |
Portfolio of Investments – as of September 30, 2018
Loomis Sayles Small Cap Value Fund – continued
Industry Summary at September 30, 2018
| | | | |
Banks | | | 16.7 | % |
Machinery | | | 6.3 | |
IT Services | | | 4.9 | |
Electronic Equipment, Instruments & Components | | | 4.5 | |
Chemicals | | | 4.3 | |
Commercial Services & Supplies | | | 3.8 | |
Insurance | | | 3.7 | |
Food Products | | | 3.1 | |
Media | | | 2.8 | |
Energy Equipment & Services | | | 2.8 | |
Semiconductors & Semiconductor Equipment | | | 2.7 | |
Health Care Equipment & Supplies | | | 2.4 | |
Hotels, Restaurants & Leisure | | | 2.2 | |
Software | | | 2.2 | |
Auto Components | | | 2.0 | |
Other Investments, less than 2% each | | | 35.0 | |
Short-Term Investments | | | 0.7 | |
| | | | |
Total Investments | | | 100.1 | |
Other assets less liabilities | | | (0.1 | ) |
| | | | |
Net Assets | | | 100.0 | % |
| | | | |
See accompanying notes to financial statements.
| 34
Portfolio of Investments – as of September 30, 2018
Loomis Sayles Small/Mid Cap Growth Fund
| | | | | | | | |
| Shares | | | Description | | Value (†) | |
|
| | Common Stocks – 97.5% of Net Assets | |
| |
| | | | Aerospace & Defense – 3.9% | |
| | 2,519 | | | BWX Technologies, Inc. | | $ | 157,538 | |
| | 3,147 | | | HEICO Corp. | | | 291,444 | |
| | 3,403 | | | Hexcel Corp. | | | 228,171 | |
| | | | | | | | |
| | | | | | | 677,153 | |
| | | | | | | | |
| | | | Air Freight & Logistics – 1.4% | |
| | 2,227 | | | XPO Logistics, Inc.(a) | | | 254,257 | |
| | | | | | | | |
| | | | Banks – 3.6% | |
| | 3,816 | | | Columbia Banking System, Inc. | | | 147,946 | |
| | 6,375 | | | Home BancShares, Inc. | | | 139,613 | |
| | 2,119 | | | UMB Financial Corp. | | | 150,237 | |
| | 3,447 | | | Western Alliance Bancorp(a) | | | 196,100 | |
| | | | | | �� | | |
| | | | | | | 633,896 | |
| | | | | | | | |
| | | | Biotechnology – 4.5% | |
| | 933 | | | Argenx SE, ADR(a) | | | 70,759 | |
| | 1,870 | | | Ascendis Pharma AS, ADR(a) | | | 132,508 | |
| | 1,791 | | | Blueprint Medicines Corp.(a) | | | 139,805 | |
| | 9,726 | | | Ironwood Pharmaceuticals, Inc.(a) | | | 179,542 | |
| | 2,144 | | | Neurocrine Biosciences, Inc.(a) | | | 263,605 | |
| | | | | | | | |
| | | | | | | 786,219 | |
| | | | | | | | |
| | | | Capital Markets – 2.9% | |
| | 986 | | | MarketAxess Holdings, Inc. | | | 175,991 | |
| | 938 | | | Morningstar, Inc. | | | 118,094 | |
| | 1,171 | | | MSCI, Inc. | | | 207,747 | |
| | | | | | | | |
| | | | | | | 501,832 | |
| | | | | | | | |
| | | | Chemicals – 1.6% | |
| | 2,832 | | | Ingevity Corp.(a) | | | 288,524 | |
| | | | | | | | |
| | | | Commercial Services & Supplies – 2.7% | |
| | 4,283 | | | KAR Auction Services, Inc. | | | 255,652 | |
| | 5,870 | | | Ritchie Bros. Auctioneers, Inc. | | | 212,083 | |
| | | | | | | | |
| | | | | | | 467,735 | |
| | | | | | | | |
| | | | Communications Equipment – 0.8% | |
| | 4,264 | | | Ciena Corp.(a) | | | 133,207 | |
| | | | | | | | |
| | | | Construction & Engineering – 1.3% | |
| | 12,810 | | | Willscot Corp.(a) | | | 219,692 | |
| | | | | | | | |
| | | | Consumer Finance – 0.5% | |
| | 7,890 | | | SLM Corp.(a) | | | 87,974 | |
| | | | | | | | |
| | | | Diversified Consumer Services – 2.9% | |
| | 1,771 | | | Bright Horizons Family Solutions, Inc.(a) | | | 208,695 | |
See accompanying notes to financial statements.
35 |
Portfolio of Investments – as of September 30, 2018
Loomis Sayles Small/Mid Cap Growth Fund – continued
| | | | | | | | |
| Shares | | | Description | | Value (†) | |
|
| | Common Stocks – continued | |
| |
| | | | Diversified Consumer Services – continued | |
| | 2,655 | | | Grand Canyon Education, Inc.(a) | | $ | 299,484 | |
| | | | | | | | |
| | | | | | | 508,179 | |
| | | | | | | | |
| | | | Diversified Telecommunication Services – 1.4% | |
| | 4,276 | | | Cogent Communications Holdings, Inc. | | | 238,601 | |
| | | | | | | | |
| | | | Electrical Equipment – 2.2% | |
| | 4,185 | | | Generac Holdings, Inc.(a) | | | 236,076 | |
| | 2,899 | | | Sensata Technologies Holding PLC(a) | | | 143,645 | |
| | | | | | | | |
| | | | | | | 379,721 | |
| | | | | | | | |
| | | | Electronic Equipment, Instruments & Components – 4.1% | |
| | 4,056 | | | FLIR Systems, Inc. | | | 249,322 | |
| | 4,679 | | | National Instruments Corp. | | | 226,136 | |
| | 5,776 | | | Trimble, Inc.(a) | | | 251,025 | |
| | | | | | | | |
| | | | | | | 726,483 | |
| | | | | | | | |
| | | | Energy Equipment & Services – 2.5% | |
| | 3,961 | | | Cactus, Inc., Class A(a) | | | 151,627 | |
| | 2,643 | | | Dril-Quip, Inc.(a) | | | 138,097 | |
| | 4,211 | | | Oil States International, Inc.(a) | | | 139,805 | |
| | | | | | | | |
| | | | | | | 429,529 | |
| | | | | | | | |
| | | | Entertainment – 1.5% | |
| | 4,870 | | | Live Nation Entertainment, Inc.(a) | | | 265,269 | |
| | | | | | | | |
| | | | Food & Staples Retailing – 1.0% | |
| | 6,494 | | | Sprouts Farmers Market, Inc.(a) | | | 178,001 | |
| | | | | | | | |
| | | | Food Products – 0.7% | |
| | 6,430 | | | Nomad Foods Ltd.(a) | | | 130,272 | |
| | | | | | | | |
| | | | Health Care Equipment & Supplies – 4.8% | |
| | 3,150 | | | Merit Medical Systems, Inc.(a) | | | 193,568 | |
| | 1,581 | | | Penumbra, Inc.(a) | | | 236,676 | |
| | 1,321 | | | West Pharmaceutical Services, Inc. | | | 163,104 | |
| | 8,272 | | | Wright Medical Group NV(a) | | | 240,053 | |
| | | | | | | | |
| | | | | | | 833,401 | |
| | | | | | | | |
| | | | Health Care Providers & Services – 4.2% | |
| | 2,933 | | | HealthEquity, Inc.(a) | | | 276,905 | |
| | 1,448 | | | LHC Group, Inc.(a) | | | 149,129 | |
| | 986 | | | WellCare Health Plans, Inc.(a) | | | 316,003 | |
| | | | | | | | |
| | | | | | | 742,037 | |
| | | | | | | | |
| | | | Health Care Technology – 2.8% | |
| | 2,890 | | | Medidata Solutions, Inc.(a) | | | 211,866 | |
| | 2,512 | | | Veeva Systems, Inc., Class A(a) | | | 273,481 | |
| | | | | | | | |
| | | | | | | 485,347 | |
| | | | | | | | |
See accompanying notes to financial statements.
| 36
Portfolio of Investments – as of September 30, 2018
Loomis Sayles Small/Mid Cap Growth Fund – continued
| | | | | | | | |
| Shares | | | Description | | Value (†) | |
|
| | Common Stocks – continued | |
| |
| | | | Hotels, Restaurants & Leisure – 4.3% | |
| | 4,816 | | | Planet Fitness, Inc., Class A(a) | | $ | 260,209 | |
| | 3,382 | | | Texas Roadhouse, Inc. | | | 234,339 | |
| | 951 | | | Vail Resorts, Inc. | | | 260,973 | |
| | | | | | | | |
| | | | | | | 755,521 | |
| | | | | | | | |
| | | | Insurance – 1.2% | |
| | 2,709 | | | Kemper Corp. | | | 217,939 | |
| | | | | | | | |
| | | | IT Services – 5.4% | |
| | 4,318 | | | Black Knight, Inc.(a) | | | 224,320 | |
| | 1,636 | | | Broadridge Financial Solutions, Inc. | | | 215,870 | |
| | 1,771 | | | EPAM Systems, Inc.(a) | | | 243,867 | |
| | 1,322 | | | WEX, Inc.(a) | | | 265,405 | |
| | | | | | | | |
| | | | | | | 949,462 | |
| | | | | | | | |
| | | | Life Sciences Tools & Services – 1.8% | |
| | 2,007 | | | ICON PLC(a) | | | 308,576 | |
| | | | | | | | |
| | | | Machinery – 4.0% | |
| | 3,875 | | | Altra Industrial Motion Corp. | | | 160,037 | |
| | 6,440 | | | Gardner Denver Holdings, Inc.(a) | | | 182,510 | |
| | 3,765 | | | Sun Hydraulics Corp. | | | 206,247 | |
| | 1,362 | | | WABCO Holdings, Inc.(a) | | | 160,634 | |
| | | | | | | | |
| | | | | | | 709,428 | |
| | | | | | | | |
| | | | Oil, Gas & Consumable Fuels – 1.1% | |
| | 1,406 | | | Diamondback Energy, Inc. | | | 190,077 | |
| | | | | | | | |
| | | | Pharmaceuticals – 0.8% | |
| | 2,854 | | | Zogenix, Inc.(a) | | | 141,558 | |
| | | | | | | | |
| | | | Professional Services – 3.1% | |
| | 712 | | | CoStar Group, Inc.(a) | | | 299,638 | |
| | 3,229 | | | TransUnion | | | 237,590 | |
| | | | | | | | |
| | | | | | | 537,228 | |
| | | | | | | | |
| | | | Real Estate Management & Development – 1.2% | |
| | 2,407 | | | First Service Corp. | | | 203,777 | |
| | | | | | | | |
| | | | Semiconductors & Semiconductor Equipment – 2.7% | |
| | 2,113 | | | Advanced Energy Industries, Inc.(a) | | | 109,136 | |
| | 3,054 | | | Semtech Corp.(a) | | | 169,802 | |
| | 2,052 | | | Silicon Laboratories, Inc.(a) | | | 188,374 | |
| | | | | | | | |
| | | | | | | 467,312 | |
| | | | | | | | |
| | | | Software – 14.2% | |
| | 2,048 | | | Blackbaud, Inc. | | | 207,831 | |
| | 2,868 | | | Guidewire Software, Inc.(a) | | | 289,697 | |
| | 1,887 | | | HubSpot, Inc.(a) | | | 284,843 | |
See accompanying notes to financial statements.
37 |
Portfolio of Investments – as of September 30, 2018
Loomis Sayles Small/Mid Cap Growth Fund – continued
| | | | | | | | |
| Shares | | | Description | | Value (†) | |
|
| | Common Stocks – continued | |
| |
| | | | Software – continued | |
| | 2,558 | | | j2 Global, Inc. | | $ | 211,930 | |
| | 2,760 | | | Paylocity Holding Corp.(a) | | | 221,683 | |
| | 3,358 | | | PTC, Inc.(a) | | | 356,586 | |
| | 3,570 | | | Talend S.A., ADR(a) | | | 248,972 | |
| | 921 | | | Tyler Technologies, Inc.(a) | | | 225,700 | |
| | 756 | | | Ultimate Software Group, Inc. (The)(a) | | | 243,576 | |
| | 2,693 | | | Zendesk, Inc.(a) | | | 191,203 | |
| | | | | | | | |
| | | | | | | 2,482,021 | |
| | | | | | | | |
| | | | Specialty Retail – 1.1% | |
| | 6,339 | | | At Home Group, Inc.(a) | | | 199,869 | |
| | | | | | | | |
| | | | Textiles, Apparel & Luxury Goods – 3.4% | |
| | 1,489 | | | Carter’s, Inc. | | | 146,815 | |
| | 2,317 | | | Columbia Sportswear Co. | | | 215,643 | |
| | 4,888 | | | G-III Apparel Group Ltd.(a) | | | 235,553 | |
| | | | | | | | |
| | | | | | | 598,011 | |
| | | | | | | | |
| | | | Trading Companies & Distributors – 1.9% | |
| | 8,202 | | | BMC Stock Holdings, Inc.(a) | | | 152,967 | |
| | 2,330 | | | SiteOne Landscape Supply, Inc.(a) | | | 175,542 | |
| | | | | | | | |
| | | | | | | 328,509 | |
| | | | | | | | |
| | |
| | | | Total Common Stocks
(Identified Cost $14,605,942) | | | 17,056,617 | |
| | | | | | | | |
| | |
| Principal
Amount |
| | | | | | |
|
| | Short-Term Investments – 4.6% | |
| $ | 807,593 | | | Tri-Party Repurchase Agreement with Fixed Income Clearing Corporation, dated 9/28/2018 at 1.300%, to be repurchased at $807,681 on 10/01/2018 collateralized by $835,000 Federal Home Loan Mortgage Corp., 1.250% due 10/02/2019 valued at $828,460 including accrued interest (Note 2 of Notes to Financial Statements) (Identified Cost $807,593) | | | 807,593 | |
| | | | | | | | |
| | |
| | | | Total Investments – 102.1%
(Identified Cost $15,413,535) | | | 17,864,210 | |
| | | | Other assets less liabilities—(2.1)% | | | (364,008 | ) |
| | | | | | | | |
| | | | Net Assets – 100.0% | | $ | 17,500,202 | |
| | | | | | | | |
| |
| | (†) | | | See Note 2 of Notes to Financial Statements. | |
| | (a) | | | Non-income producing security. | |
| |
| | ADR | | | An American Depositary Receipt is a certificate issued by a custodian bank representing the right to receive securities of the foreign issuer described. The values of ADRs may be significantly influenced by trading on exchanges not located in the United States. | |
| | SLM | | | Sallie Mae | |
See accompanying notes to financial statements.
| 38
Portfolio of Investments – as of September 30, 2018
Loomis Sayles Small/Mid Cap Growth Fund – continued
Industry Summary at September 30, 2018
| | | | |
Software | | | 14.2 | % |
IT Services | | | 5.4 | |
Health Care Equipment & Supplies | | | 4.8 | |
Biotechnology | | | 4.5 | |
Hotels, Restaurants & Leisure | | | 4.3 | |
Health Care Providers & Services | | | 4.2 | |
Electronic Equipment, Instruments & Components | | | 4.1 | |
Machinery | | | 4.0 | |
Aerospace & Defense | | | 3.9 | |
Banks | | | 3.6 | |
Textiles, Apparel & Luxury Goods | | | 3.4 | |
Professional Services | | | 3.1 | |
Diversified Consumer Services | | | 2.9 | |
Capital Markets | | | 2.9 | |
Health Care Technology | | | 2.8 | |
Commercial Services & Supplies | | | 2.7 | |
Semiconductors & Semiconductor Equipment | | | 2.7 | |
Energy Equipment & Services | | | 2.5 | |
Electrical Equipment | | | 2.2 | |
Other Investments, less than 2% each | | | 19.3 | |
Short-Term Investments | | | 4.6 | |
| | | | |
Total Investments | | | 102.1 | |
Other assets less liabilities | | | (2.1 | ) |
| | | | |
Net Assets | | | 100.0 | % |
| | | | |
See accompanying notes to financial statements.
39 |
Statements of Assets and Liabilities
September 30, 2018
| | | | | | | | | | | | |
| | | Small Cap
Growth Fund | | | Small Cap
Value Fund | | | Small/Mid Cap
Growth Fund | |
ASSETS | | | | | | | | | | | | |
Investments at cost | | $ | 1,041,609,903 | | | $ | 661,141,998 | | | $ | 15,413,535 | |
Net unrealized appreciation | | | 541,207,049 | | | | 313,734,607 | | | | 2,450,675 | |
| | | | | | | | | | | | |
Investments at value | | | 1,582,816,952 | | | | 974,876,605 | | | | 17,864,210 | |
Cash | | | 312,566 | | | | — | | | | — | |
Receivable for Fund shares sold | | | 2,471,505 | | | | 471,869 | | | | — | |
Receivable for securities sold | | | — | | | | 2,764,507 | | | | — | |
Dividends and interest receivable | | | 162,275 | | | | 777,425 | | | | 3,855 | |
Prepaid expenses (Note 7) | | | 1,325 | | | | 1,003 | | | | 11 | |
| | | | | | | | | | | | |
TOTAL ASSETS | | | 1,585,764,623 | | | | 978,891,409 | | | | 17,868,076 | |
| | | | | | | | | | | | |
LIABILITIES | | | | | | | | | | | | |
Payable for securities purchased | | | 2,422,947 | | | | 3,610,774 | | | | 259,842 | |
Payable for Fund shares redeemed | | | 971,642 | | | | 634,375 | | | | 36,891 | |
Management fees payable (Note 5) | | | 978,856 | | | | 602,778 | | | | 1,805 | |
Deferred Trustees’ fees (Note 5) | | | 164,348 | | | | 227,098 | | | | 19,751 | |
Administrative fees payable (Note 5) | | | 56,619 | | | | 35,874 | | | | 608 | |
Payable to distributor (Note 5d) | | | 13,202 | | | | 9,225 | | | | 4 | |
Other accounts payable and accrued expenses | | | 93,368 | | | | 86,786 | | | | 48,973 | |
| | | | | | | | | | | | |
TOTAL LIABILITIES | | | 4,700,982 | | | | 5,206,910 | | | | 367,874 | |
| | | | | | | | | | | | |
NET ASSETS | | $ | 1,581,063,641 | | | $ | 973,684,499 | | | $ | 17,500,202 | |
| | | | | | | | | | | | |
NET ASSETS CONSIST OF: | | | | | | | | | | | | |
Paid-in capital | | $ | 920,641,911 | | | $ | 553,853,198 | | | $ | 10,456,036 | |
Accumulated earnings | | | 660,421,730 | | | | 419,831,301 | | | | 7,044,166 | |
| | | | | | | | | | | | |
NET ASSETS | | $ | 1,581,063,641 | | | $ | 973,684,499 | | | $ | 17,500,202 | |
| | | | | | | | | | | | |
| | | |
COMPUTATION OF NET ASSET VALUE AND OFFERING PRICE: | | | | | | | | | | | | |
Institutional Class: | | | | | | | | | | | | |
Net assets | | $ | 926,914,438 | | | $ | 587,197,927 | | | $ | 17,500,202 | |
| | | | | | | | | | | | |
Shares of beneficial interest | | | 29,379,668 | | | | 16,648,221 | | | | 1,129,883 | |
| | | | | | | | | | | | |
Net asset value, offering and redemption price per share | | $ | 31.55 | | | $ | 35.27 | | | $ | 15.49 | |
| | | | | | | | | | | | |
Retail Class: | | | | | | | | | | | | |
Net assets | | $ | 136,414,867 | | | $ | 208,310,491 | | | $ | — | |
| | | | | | | | | | | | |
Shares of beneficial interest | | | 4,689,129 | | | | 6,009,819 | | | | — | |
| | | | | | | | | | | | |
Net asset value, offering and redemption price per share | | $ | 29.09 | | | $ | 34.66 | | | $ | — | |
| | | | | | | | | | | | |
Admin Class shares: | | | | | | | | | | | | |
Net assets | | $ | — | | | $ | 24,529,757 | | | $ | — | |
| | | | | | | | | | | | |
Shares of beneficial interest | | | — | | | | 737,821 | | | | — | |
| | | | | | | | | | | | |
Net asset value, offering and redemption price per share | | $ | — | | | $ | 33.25 | | | $ | — | |
| | | | | | | | | | | | |
Class N shares: | | | | | | | | | | | | |
Net assets | | $ | 517,734,336 | | | $ | 153,646,324 | | | $ | — | |
| | | | | | | | | | | | |
Shares of beneficial interest | | | 16,302,647 | | | | 4,351,905 | | | | — | |
| | | | | | | | | | | | |
Net asset value, offering and redemption price per share | | $ | 31.76 | | | $ | 35.31 | | | $ | — | |
| | | | | | | | | | | | |
See accompanying notes to financial statements.
| 40
Statements of Operations
For the Year Ended September 30, 2018
| | | | | | | | | | | | |
| | | Small Cap
Growth Fund | | | Small Cap
Value Fund | | | Small/Mid Cap
Growth Fund | |
INVESTMENT INCOME | | | | | | | | | | | | |
Dividends | | $ | 4,608,765 | | | $ | 11,834,071 | | | $ | 83,731 | |
Interest | | | 447,940 | | | | 144,466 | | | | 5,973 | |
Less net foreign taxes withheld | | | — | | | | (41,511 | ) | | | (792 | ) |
| | | | | | | | | | | | |
| | | 5,056,705 | | | | 11,937,026 | | | | 88,912 | |
| | | | | | | | | | | | |
Expenses | | | | | | | | | | | | |
Management fees (Note 5) | | | 10,158,265 | | | | 7,700,146 | | | | 132,762 | |
Service and distribution fees (Note 5) | | | 293,140 | | | | 718,104 | | | | — | |
Administrative fees (Note 5) | | | 595,459 | | | | 451,857 | | | | 7,796 | |
Trustees’ fees and expenses (Note 5) | | | 64,117 | | | | 60,413 | | | | 17,074 | |
Transfer agent fees and expenses (Notes 5 and 6) | | | 1,131,161 | | | | 806,991 | | | | 2,320 | |
Audit and tax services fees | | | 40,857 | | | | 41,832 | | | | 41,086 | |
Custodian fees and expenses | | | 64,247 | | | | 30,201 | | | | 10,686 | |
Legal fees | | | 26,381 | | | | 20,618 | | | | 398 | |
Registration fees | | | 88,665 | | | | 76,849 | | | | 24,941 | |
Shareholder reporting expenses | | | 82,009 | | | | 105,681 | | | | 4,482 | |
Miscellaneous expenses (Note 7) | | | 42,388 | | | | 39,442 | | | | 11,606 | |
| | | | | | | | | | | | |
Total expenses | | | 12,586,689 | | | | 10,052,134 | | | | 253,151 | |
Less waiver and/or expense reimbursement (Note 5) | | | — | | | | (195,729 | ) | | | (102,676 | ) |
| | | | | | | | | | | | |
Net expenses | | | 12,586,689 | | | | 9,856,405 | | | | 150,475 | |
| | | | | | | | | | | | |
Net investment income (loss) | | | (7,529,984 | ) | | | 2,080,621 | | | | (61,563 | ) |
| | | | | | | | | | | | |
| | | |
NET REALIZED AND UNREALIZED GAIN (LOSS) ON INVESTMENTS | | | | | | | | | | | | |
Net realized gain on: | | | | | | | | | | | | |
Investments | | | 143,506,294 | | | | 118,702,551 | | | | 5,067,741 | |
Net change in unrealized appreciation (depreciation) on: | | | | | | | | | | | | |
Investments | | | 216,618,091 | | | | (58,719,669 | ) | | | (965,346 | ) |
| | | | | | | | | | | | |
Net realized and unrealized gain on investments | | | 360,124,385 | | | | 59,982,882 | | | | 4,102,395 | |
| | | | | | | | | | | | |
| | | |
NET INCREASE IN NET ASSETS RESULTING FROM OPERATIONS | | $ | 352,594,401 | | | $ | 62,063,503 | | | $ | 4,040,832 | |
| | | | | | | | | | | | |
See accompanying notes to financial statements.
41 |
Statements of Changes in Net Assets
| | | | | | | | | | | | | | | | |
| | | Small Cap Growth Fund | | | Small Cap Value Fund | |
| | | Year Ended
September 30,
2018 | | | Year Ended
September 30,
2017 | | | Year Ended
September 30,
2018 | | | Year Ended
September 30,
2017 | |
FROM OPERATIONS: | | | | | | | | | | | | | | | | |
Net investment income (loss) | | $ | (7,529,984 | ) | | $ | (5,572,322 | ) | | $ | 2,080,621 | | | $ | 3,245,976 | |
Net realized gain on investments | | | 143,506,294 | | | | 135,932,255 | | | | 118,702,551 | | | | 115,058,075 | |
Net change in unrealized appreciation (depreciation) on investments | | | 216,618,091 | | | | 112,076,460 | | | | (58,719,669 | ) | | | 73,375,443 | |
| | | | | | | | | | | | | | | | |
Net increase in net assets resulting from operations | | | 352,594,401 | | | | 242,436,393 | | | | 62,063,503 | | | | 191,679,494 | |
| | | | | | | | | | | | | | | | |
FROM DISTRIBUTIONS TO SHAREHOLDERS: | | | | | | | | | | | | | | | | |
Institutional Class | | | (93,157,470 | ) | | | — | | | | (73,726,264 | ) | | | (55,422,671 | )(a) |
Retail Class | | | (13,096,336 | ) | | | — | | | | (27,201,028 | ) | | | (21,255,031 | )(a) |
Admin Class | | | — | | | | — | | | | (3,453,473 | ) | | | (3,598,566 | )(a) |
Class N | | | (35,428,773 | ) | | | — | | | | (16,470,360 | ) | | | (7,013,982 | )(a) |
| | | | | | | | | | | | | | | | |
Total distributions | | | (141,682,579 | ) | | | — | | | | (120,851,125 | ) | | | (87,290,250 | ) |
| | | | | | | | | | | | | | | | |
NET INCREASE (DECREASE) IN NET ASSETS FROM CAPITAL SHARE TRANSACTIONS (NOTE 9) | | | 159,153,016 | | | | (159,223,554 | ) | | | (50,857,393 | ) | | | (55,801,811 | ) |
| | | | | | | | | | | | | | | | |
Net increase (decrease) in net assets | | | 370,064,838 | | | | 83,212,839 | | | | (109,645,015 | ) | | | 48,587,433 | |
NET ASSETS | | | | | | | | | | | | | | | | |
Beginning of the year | | | 1,210,998,803 | | | | 1,127,785,964 | | | | 1,083,329,514 | | | | 1,034,742,081 | |
| | | | | | | | | | | | | | | | |
End of the year | | $ | 1,581,063,641 | | | $ | 1,210,998,803 | | | $ | 973,684,499 | | | $ | 1,083,329,514 | |
| | | | | | | | | | | | | | | | |
| (a) | See Note 2d of Notes to Financial Statements. |
See accompanying notes to financial statements.
| 42
Statements of Changes in Net Assets – continued
| | | | | | | | |
| | | Small/Mid Cap Growth Fund | |
| | | Year Ended
September 30,
2018 | | | Year Ended
September 30,
2017 | |
FROM OPERATIONS: | | | | | | | | |
Net investment income (loss) | | $ | (61,563 | ) | | $ | 1,597 | |
Net realized gain on investments | | | 5,067,741 | | | | 678,497 | |
Net change in unrealized appreciation (depreciation) on investments | | | (965,346 | ) | | | 2,355,415 | |
| | | | | | | | |
Net increase in net assets resulting from operations | | | 4,040,832 | | | | 3,035,509 | |
| | | | | | | | |
FROM DISTRIBUTIONS TO SHAREHOLDERS: | | | | | | | | |
Institutional Class | | | — | | | | (22,881 | )(a) |
| | | | | | | | |
NET DECREASE IN NET ASSETS FROM CAPITAL SHARE TRANSACTIONS (NOTE 9) | | | (1,132,819 | ) | | | (394,862 | ) |
| | | | | | | | |
Net increase in net assets | | | 2,908,013 | | | | 2,617,766 | |
NET ASSETS | | | | | | | | |
Beginning of the year | | | 14,592,189 | | | | 11,974,423 | |
| | | | | | | | |
End of the year | | $ | 17,500,202 | | | $ | 14,592,189 | |
| | | | | | | | |
| (a) | See Note 2d of Notes to Financial Statements. |
See accompanying notes to financial statements.
43 |
Financial Highlights
For a share outstanding throughout each period.
| | | | | | | | | | | | | | | | | | | | | | | | |
| | | Small Cap Growth Fund—Institutional Class | | | | |
| | | Year Ended
September 30,
2018 | | | Year Ended
September 30,
2017 | | | Year Ended
September 30,
2016 | | | Year Ended
September 30,
2015 | | | Year Ended
September 30,
2014 | | | | |
Net asset value, beginning of the period | | $ | 27.37 | | | $ | 22.03 | | | $ | 22.22 | | | $ | 24.27 | | | $ | 26.35 | | | | | |
| | | | |
INCOME (LOSS) FROM INVESTMENT OPERATIONS: | | | | | | | | | | | | | | | | | | | | | | | | |
Net investment loss(a) | | | (0.16 | ) | | | (0.12 | ) | | | (0.09 | ) | | | (0.14 | ) | | | (0.16 | )(b) | | | | |
Net realized and unrealized gain (loss) | | | 7.54 | | | | 5.46 | | | | 1.59 | | | | 1.63 | | | | (0.09 | ) | | | | |
| | | | |
Total from Investment Operations | | | 7.38 | | | | 5.34 | | | | 1.50 | | | | 1.49 | | | | (0.25 | ) | | | | |
| | | | |
LESS DISTRIBUTIONS FROM: | | | | | | | | | | | | | | | | | | | | | | | | |
Net realized capital gains | | | (3.20 | ) | | | — | | | | (1.69 | ) | | | (3.54 | ) | | | (1.83 | ) | | | | |
| | | | |
Net asset value, end of the period | | $ | 31.55 | | | $ | 27.37 | | | $ | 22.03 | | | $ | 22.22 | | | $ | 24.27 | | | | | |
| | | | |
Total return | | | 29.77 | % | | | 24.24 | % | | | 6.92 | % | | | 5.78 | % | | | (1.31 | )%(b) | | | | |
RATIOS TO AVERAGE NET ASSETS: | | | | | | | | | | | | | | | | | | | | | | | | |
Net assets, end of the period (000’s) | | $ | 926,914 | | | $ | 824,103 | | | $ | 812,383 | | | $ | 800,883 | | | $ | 852,131 | | | | | |
Net expenses | | | 0.94 | % | | | 0.95 | % | | | 0.95 | % | | | 0.94 | % | | | 0.94 | % | | | | |
Gross expenses | | | 0.94 | % | | | 0.95 | % | | | 0.95 | % | | | 0.94 | % | | | 0.94 | % | | | | |
Net investment loss | | | (0.58 | )% | | | (0.49 | )% | | | (0.41 | )% | | | (0.57 | )% | | | (0.63 | )%(b) | | | | |
Portfolio turnover rate | | | 41 | % | | | 45 | % | | | 56 | % | | | 78 | % | | | 63 | % | | | | |
| (a) | Per share net investment loss has been calculated using the average shares outstanding during the period. |
| (b) | Includes a non-recurring dividend. Without this dividend, net investment loss per share would have been $(0.17), total return would have been (1.35)% and the ratio of net investment loss to average net assets would have been (0.66)%. |
See accompanying notes to financial statements.
| 44
Financial Highlights – continued
For a share outstanding throughout each period.
| | | | | | | | | | | | | | | | | | | | | | | | |
| | | Small Cap Growth Fund—Retail Class | | | | |
| | | Year Ended
September 30,
2018 | | | Year Ended
September 30,
2017 | | | Year Ended
September 30,
2016 | | | Year Ended
September 30,
2015 | | | Year Ended
September 30,
2014 | | | | |
Net asset value, beginning of the period | | $ | 25.53 | | | $ | 20.61 | | | $ | 20.93 | | | $ | 23.10 | | | $ | 25.23 | | | | | |
| | | | |
INCOME (LOSS) FROM INVESTMENT OPERATIONS: | | | | | | | | | | | | | | | | | | | | | | | | |
Net investment loss(a) | | | (0.22 | ) | | | (0.16 | ) | | | (0.13 | ) | | | (0.19 | ) | | | (0.22 | )(b) | | | | |
Net realized and unrealized gain (loss) | | | 6.98 | | | | 5.08 | | | | 1.50 | | | | 1.56 | | | | (0.08 | ) | | | | |
| | | | |
Total from Investment Operations | | | 6.76 | | | | 4.92 | | | | 1.37 | | | | 1.37 | | | | (0.30 | ) | | | | |
| | | | |
LESS DISTRIBUTIONS FROM: | | | | | | | | | | | | | | | | | | | | | | | | |
Net realized capital gains | | | (3.20 | ) | | | — | | | | (1.69 | ) | | | (3.54 | ) | | | (1.83 | ) | | | | |
| | | | |
Net asset value, end of the period | | $ | 29.09 | | | $ | 25.53 | | | $ | 20.61 | | | $ | 20.93 | | | $ | 23.10 | | | | | |
| | | | |
Total return | | | 29.45 | % | | | 23.93 | % | | | 6.61 | % | | | 5.58 | % | | | (1.58 | )%(b) | | | | |
RATIOS TO AVERAGE NET ASSETS: | | | | | | | | | | | | | | | | | | | | | | | | |
Net assets, end of the period (000’s) | | $ | 136,415 | | | $ | 107,387 | | | $ | 118,670 | | | $ | 162,906 | | | $ | 175,393 | | | | | |
Net expenses | | | 1.19 | % | | | 1.20 | % | | | 1.20 | % | | | 1.19 | % | | | 1.21 | % | | | | |
Gross expenses | | | 1.19 | % | | | 1.20 | % | | | 1.20 | % | | | 1.19 | % | | | 1.21 | % | | | | |
Net investment loss | | | (0.82 | )% | | | (0.73 | )% | | | (0.66 | )% | | | (0.82 | )% | | | (0.90 | )%(b) | | | | |
Portfolio turnover rate | | | 41 | % | | | 45 | % | | | 56 | % | | | 78 | % | | | 63 | % | | | | |
| (a) | Per share net investment loss has been calculated using the average shares outstanding during the period. |
| (b) | Includes a non-recurring dividend. Without this dividend, net investment loss per share would have been $(0.23), total return would have been (1.58)% and the ratio of net investment loss to average net assets would have been (0.93)%. |
See accompanying notes to financial statements.
45 |
Financial Highlights – continued
For a share outstanding throughout each period.
| | | | | | | | | | | | | | | | | | | | | | | | |
| | | Small Cap Growth Fund—Class N | | | | |
| | | Year Ended
September 30,
2018 | | | Year Ended
September 30,
2017 | | | Year Ended
September 30,
2016 | | | Year Ended
September 30,
2015 | | | Year Ended
September 30,
2014 | | | | |
Net asset value, beginning of the period | | $ | 27.50 | | | $ | 22.11 | | | $ | 22.27 | | | $ | 24.29 | | | $ | 26.36 | | | | | |
| | | | |
INCOME (LOSS) FROM INVESTMENT OPERATIONS: | | | | | | | | | | | | | | | | | | | | | | | | |
Net investment loss(a) | | | (0.12 | ) | | | (0.09 | ) | | | (0.06 | ) | | | (0.12 | ) | | | (0.14 | )(b) | | | | |
Net realized and unrealized gain (loss) | | | 7.58 | | | | 5.48 | | | | 1.59 | | | | 1.64 | | | | (0.10 | ) | | | | |
| | | | |
Total from Investment Operations | | | 7.46 | | | | 5.39 | | | | 1.53 | | | | 1.52 | | | | (0.24 | ) | | | | |
| | | | |
LESS DISTRIBUTIONS FROM: | | | | | | | | | | | | | | | | | | | | | | | | |
Net realized capital gains | | | (3.20 | ) | | | — | | | | (1.69 | ) | | | (3.54 | ) | | | (1.83 | ) | | | | |
| | | | |
Net asset value, end of the period | | $ | 31.76 | | | $ | 27.50 | | | $ | 22.11 | | | $ | 22.27 | | | $ | 24.29 | | | | | |
| | | | |
Total return | | | 29.93 | % | | | 24.38 | % | | | 7.05 | % | | | 5.92 | % | | | (1.27 | )%(b) | | | | |
RATIOS TO AVERAGE NET ASSETS: | | | | | | | | | | | | | | | | | | | | | | | | |
Net assets, end of the period (000’s) | | $ | 517,734 | | | $ | 279,508 | | | $ | 196,733 | | | $ | 162,591 | | | $ | 15,080 | | | | | |
Net expenses | | | 0.82 | % | | | 0.82 | % | | | 0.83 | % | | | 0.83 | % | | | 0.83 | % | | | | |
Gross expenses | | | 0.82 | % | | | 0.82 | % | | | 0.83 | % | | | 0.83 | % | | | 0.83 | % | | | | |
Net investment loss | | | (0.43 | )% | | | (0.39 | )% | | | (0.29 | )% | | | (0.51 | )% | | | (0.53 | )%(b) | | | | |
Portfolio turnover rate | | | 41 | % | | | 45 | % | | | 56 | % | | | 78 | % | | | 63 | % | | | | |
| (a) | Per share net investment loss has been calculated using the average shares outstanding during the period. |
| (b) | Includes a non-recurring dividend. Without this dividend, net investment loss per share would have been $(0.14), total return would have been (1.31)% and the ratio of net investment loss to average net assets would have been (0.56)%. |
See accompanying notes to financial statements.
| 46
Financial Highlights – continued
For a share outstanding throughout each period.
| | | | | | | | | | | | | | | | | | | | | | | | |
| | | Small Cap Value Fund—Institutional Class | | | | |
| | | Year Ended
September 30,
2018 | | | Year Ended
September 30,
2017 | | | Year Ended
September 30,
2016 | | | Year Ended
September 30,
2015 | | | Year Ended
September 30,
2014 | | | | |
Net asset value, beginning of the period | | $ | 37.37 | | | $ | 33.78 | | | $ | 32.19 | | | $ | 36.40 | | | $ | 37.42 | | | | | |
| | | | |
INCOME (LOSS) FROM INVESTMENT OPERATIONS: | | | | | | | | | | | | | | | | | | | | | | | | |
Net investment income(a) | | | 0.09 | | | | 0.13 | | | | 0.17 | | | | 0.27 | | | | 0.20 | | | | | |
Net realized and unrealized gain (loss) | | | 2.11 | | | | 6.36 | | | | 4.82 | | | | 0.49 | | | | 2.18 | | | | | |
| | | | |
Total from Investment Operations | | | 2.20 | | | | 6.49 | | | | 4.99 | | | | 0.76 | | | | 2.38 | | | | | |
| | | | |
LESS DISTRIBUTIONS FROM: | | | | | | | | | | | | | | | | | | | | | | | | |
Net investment income | | | (0.05 | ) | | | (0.14 | ) | | | (0.22 | ) | | | (0.22 | ) | | | (0.10 | ) | | | | |
Net realized capital gains | | | (4.25 | ) | | | (2.76 | ) | | | (3.18 | ) | | | (4.75 | ) | | | (3.30 | ) | | | | |
| | | | |
Total Distributions | | | (4.30 | ) | | | (2.90 | ) | | | (3.40 | ) | | | (4.97 | ) | | | (3.40 | ) | | | | |
| | | | |
Net asset value, end of the period | | $ | 35.27 | | | $ | 37.37 | | | $ | 33.78 | | | $ | 32.19 | | | $ | 36.40 | | | | | |
| | | | |
Total return(b) | | | 6.21 | % | | | 19.68 | % | | | 16.75 | % | | | 1.20 | % | | | 6.17 | % | | | | |
RATIOS TO AVERAGE NET ASSETS: | | | | | | | | | | | | | | | | | | | | | | | | |
Net assets, end of the period (000’s) | | $ | 587,198 | | | $ | 665,229 | | | $ | 654,501 | | | $ | 666,107 | | | $ | 730,901 | | | | | |
Net expenses(c) | | | 0.90 | % | | | 0.90 | % | | | 0.90 | % | | | 0.90 | % | | | 0.90 | % | | | | |
Gross expenses | | | 0.92 | % | | | 0.93 | % | | | 0.93 | % | | | 0.92 | % | | | 0.91 | % | | | | |
Net investment income | | | 0.26 | % | | | 0.37 | % | | | 0.52 | % | | | 0.75 | % | | | 0.53 | % | | | | |
Portfolio turnover rate | | | 19 | % | | | 25 | % | | | 22 | % | | | 22 | % | | | 23 | % | | | | |
| (a) | Per share net investment income has been calculated using the average shares outstanding during the period. |
| (b) | Had certain expenses not been waived/reimbursed during the period, total returns would have been lower. |
| (c) | The investment adviser agreed to waive its fees and/or reimburse a portion of the Fund’s expenses during the period. Without this waiver/reimbursement, expenses would have been higher. |
See accompanying notes to financial statements.
47 |
Financial Highlights – continued
For a share outstanding throughout each period.
| | | | | | | | | | | | | | | | | | | | | | | | |
| | | Small Cap Value Fund—Retail Class | | | | |
| | | Year Ended
September 30,
2018 | | | Year Ended
September 30,
2017 | | | Year Ended
September 30,
2016 | | | Year Ended
September 30,
2015 | | | Year Ended
September 30,
2014 | | | | |
Net asset value, beginning of the period | | $ | 36.83 | | | $ | 33.33 | | | $ | 31.78 | | | $ | 35.98 | | | $ | 37.03 | | | | | |
| | | | |
INCOME (LOSS) FROM INVESTMENT OPERATIONS: | | | | | | | | | | | | | | | | | | | | | | | | |
Net investment income(a) | | | 0.00 | (b) | | | 0.04 | | | | 0.08 | | | | 0.18 | | | | 0.10 | | | | | |
Net realized and unrealized gain (loss) | | | 2.08 | | | | 6.27 | | | | 4.77 | | | | 0.48 | | | | 2.16 | | | | | |
| | | | |
Total from Investment Operations | | | 2.08 | | | | 6.31 | | | | 4.85 | | | | 0.66 | | | | 2.26 | | | | | |
| | | | |
LESS DISTRIBUTIONS FROM: | | | | | | | | | | | | | | | | | | | | | | | | |
Net investment income | | | — | | | | (0.05 | ) | | | (0.12 | ) | | | (0.11 | ) | | | (0.01 | ) | | | | |
Net realized capital gains | | | (4.25 | ) | | | (2.76 | ) | | | (3.18 | ) | | | (4.75 | ) | | | (3.30 | ) | | | | |
| | | | |
Total Distributions | | | (4.25 | ) | | | (2.81 | ) | | | (3.30 | ) | | | (4.86 | ) | | | (3.31 | ) | | | | |
| | | | |
Net asset value, end of the period | | $ | 34.66 | | | $ | 36.83 | | | $ | 33.33 | | | $ | 31.78 | | | $ | 35.98 | | | | | |
| | | | |
Total return(c) | | | 5.95 | % | | | 19.38 | % | | | 16.47 | % | | | 0.94 | % | | | 5.90 | % | | | | |
RATIOS TO AVERAGE NET ASSETS: | | | | | | | | | | | | | | | | | | | | | | | | |
Net assets, end of the period (000’s) | | $ | 208,310 | | | $ | 251,405 | | | $ | 267,936 | | | $ | 306,360 | | | $ | 358,698 | | | | | |
Net expenses(d) | | | 1.15 | % | | | 1.15 | % | | | 1.15 | % | | | 1.15 | % | | | 1.15 | % | | | | |
Gross expenses | | | 1.17 | % | | | 1.18 | % | | | 1.18 | % | | | 1.17 | % | | | 1.20 | % | | | | |
Net investment income | | | 0.01 | % | | | 0.12 | % | | | 0.27 | % | | | 0.50 | % | | | 0.28 | % | | | | |
Portfolio turnover rate | | | 19 | % | | | 25 | % | | | 22 | % | | | 22 | % | | | 23 | % | | | | |
| (a) | Per share net investment income has been calculated using the average shares outstanding during the period. |
| (b) | Amount rounds to less than $0.01 per share. |
| (c) | Had certain expenses not been waived/reimbursed during the period, total returns would have been lower. |
| (d) | The investment adviser agreed to waive its fees and/or reimburse a portion of the Fund’s expenses during the period. Without this waiver/reimbursement, expenses would have been higher. |
See accompanying notes to financial statements.
| 48
Financial Highlights – continued
For a share outstanding throughout each period.
| | | | | | | | | | | | | | | | | | | | | | | | |
| | | Small Cap Value Fund—Admin Class | | | | |
| | | Year Ended
September 30,
2018 | | | Year Ended
September 30,
2017 | | | Year Ended
September 30,
2016 | | | Year Ended
September 30,
2015 | | | Year Ended
September 30,
2014 | | | | |
Net asset value, beginning of the period | | $ | 35.58 | | | $ | 32.31 | | | $ | 30.88 | | | $ | 35.06 | | | $ | 36.24 | | | | | |
| | | | |
INCOME (LOSS) FROM INVESTMENT OPERATIONS: | | | | | | | | | | | | | | | | | | | | | | | | |
Net investment income (loss)(a) | | | (0.08 | ) | | | (0.04 | ) | | | 0.01 | | | | 0.09 | | | | 0.01 | | | | | |
Net realized and unrealized gain (loss) | | | 2.00 | | | | 6.07 | | | | 4.62 | | | | 0.48 | | | | 2.11 | | | | | |
| | | | |
Total from Investment Operations | | | 1.92 | | | | 6.03 | | | | 4.63 | | | | 0.57 | | | | 2.12 | | | | | |
| | | | |
LESS DISTRIBUTIONS FROM: | | | | | | | | | | | | | | | | | | | | | | | | |
Net investment income | | | — | | | | — | | | | (0.02 | ) | | | (0.00 | )(b) | | | — | | | | | |
Net realized capital gains | | | (4.25 | ) | | | (2.76 | ) | | | (3.18 | ) | | | (4.75 | ) | | | (3.30 | ) | | | | |
| | | | |
Total Distributions | | | (4.25 | ) | | | (2.76 | ) | | | (3.20 | ) | | | (4.75 | ) | | | (3.30 | ) | | | | |
| | | | |
Net asset value, end of the period | | $ | 33.25 | | | $ | 35.58 | | | $ | 32.31 | | | $ | 30.88 | | | $ | 35.06 | | | | | |
| | | | |
Total return(c) | | | 5.68 | % | | | 19.10 | % | | | 16.19 | % | | | 0.71 | % | | | 5.63 | % | | | | |
RATIOS TO AVERAGE NET ASSETS: | | | | | | | | | | | | | | | | | | | | | | | | |
Net assets, end of the period (000’s) | | $ | 24,530 | | | $ | 30,533 | | | $ | 43,973 | | | $ | 45,762 | | | $ | 61,791 | | | | | |
Net expenses(d) | | | 1.40 | % | | | 1.40 | % | | | 1.39 | %(e) | | | 1.38 | %(f) | | | 1.40 | % | | | | |
Gross expenses | | | 1.42 | % | | | 1.43 | % | | | 1.42 | %(e) | | | 1.40 | %(f) | | | 1.51 | % | | | | |
Net investment income (loss) | | | (0.24 | )% | | | (0.11 | )% | | | 0.03 | % | | | 0.28 | % | | | 0.02 | % | | | | |
Portfolio turnover rate | | | 19 | % | | | 25 | % | | | 22 | % | | | 22 | % | | | 23 | % | | | | |
| (a) | Per share net investment income (loss) has been calculated using the average shares outstanding during the period. |
| (b) | Amount rounds to less than $0.01 per share. |
| (c) | Had certain expenses not been waived/reimbursed during the period, total returns would have been lower. |
| (d) | The investment adviser agreed to waive its fees and/or reimburse a portion of the Fund’s expenses during the period. Without this waiver/reimbursement, expenses would have been higher. |
| (e) | Includes refund of prior year service fee of 0.01%. |
| (f) | Includes refund of prior year service fee of 0.02%. |
See accompanying notes to financial statements.
49 |
Financial Highlights – continued
For a share outstanding throughout each period.
| | | | | | | | | | | | | | | | | | | | | | | | |
| | | Small Cap Value Fund—Class N | | | | |
| | | Year Ended
September 30,
2018 | | | Year Ended
September 30,
2017 | | | Year Ended
September 30,
2016 | | | Year Ended
September 30,
2015 | | | Year Ended
September 30,
2014 | | | | |
Net asset value, beginning of the period | | $ | 37.41 | | | $ | 33.81 | | | $ | 32.22 | | | $ | 36.44 | | | $ | 37.44 | | | | | |
| | | | |
INCOME (LOSS) FROM INVESTMENT OPERATIONS: | | | | | | | | | | | | | | | | | | | | | | | | |
Net investment income(a) | | | 0.12 | | | | 0.15 | | | | 0.19 | | | | 0.27 | | | | 0.23 | | | | | |
Net realized and unrealized gain (loss) | | | 2.11 | | | | 6.37 | | | | 4.83 | | | | 0.50 | | | | 2.18 | | | | | |
| | | | |
Total from Investment Operations | | | 2.23 | | | | 6.52 | | | | 5.02 | | | | 0.77 | | | | 2.41 | | | | | |
| | | | |
LESS DISTRIBUTIONS FROM: | | | | | | | | | | | | | | | | | | | | | | | | |
Net investment income | | | (0.08 | ) | | | (0.16 | ) | | | (0.25 | ) | | | (0.24 | ) | | | (0.11 | ) | | | | |
Net realized capital gains | | | (4.25 | ) | | | (2.76 | ) | | | (3.18 | ) | | | (4.75 | ) | | | (3.30 | ) | | | | |
| | | | |
Total Distributions | | | (4.33 | ) | | | (2.92 | ) | | | (3.43 | ) | | | (4.99 | ) | | | (3.41 | ) | | | | |
| | | | |
Net asset value, end of the period | | $ | 35.31 | | | $ | 37.41 | | | $ | 33.81 | | | $ | 32.22 | | | $ | 36.44 | | | | | |
| | | | |
Total return | | | 6.28 | % | | | 19.78 | % | | | 16.84 | % | | | 1.25 | % | | | 6.25 | %(b) | | | | |
RATIOS TO AVERAGE NET ASSETS: | | | | | | | | | | | | | | | | | | | | | | | | |
Net assets, end of the period (000’s) | | $ | 153,646 | | | $ | 136,162 | | | $ | 68,332 | | | $ | 38,555 | | | $ | 2,568 | | | | | |
Net expenses | | | 0.83 | % | | | 0.83 | % | | | 0.83 | % | | | 0.83 | %(c) | | | 0.85 | %(d) | | | | |
Gross expenses | | | 0.83 | % | | | 0.83 | % | | | 0.83 | % | | | 0.83 | %(c) | | | 0.89 | % | | | | |
Net investment income | | | 0.33 | % | | | 0.44 | % | | | 0.61 | % | | | 0.76 | % | | | 0.60 | % | | | | |
Portfolio turnover rate | | | 19 | % | | | 25 | % | | | 22 | % | | | 22 | % | | | 23 | % | | | | |
| (a) | Per share net investment income has been calculated using the average shares outstanding during the period. |
| (b) | Had certain expenses not been waived/reimbursed during the period, total returns would have been lower. |
| (c) | Includes fee/expense recovery of less than 0.01%. |
| (d) | The investment adviser agreed to waive its fees and/or reimburse a portion of the Fund’s expenses during the period. Without this waiver/reimbursement, expenses would have been higher. |
See accompanying notes to financial statements.
| 50
Financial Highlights – continued
For a share outstanding throughout each period.
| | | | | | | | | | | | | | | | | | | | |
| | | Small/Mid Cap Growth Fund—Institutional Class | |
| | | Year Ended
September 30,
2018 | | | Year Ended
September 30,
2017 | | | Year Ended
September 30,
2016 | | | Period Ended
September 30,
2015* | | | | |
Net asset value, beginning of the period | | $ | 12.31 | | | $ | 9.73 | | | $ | 9.05 | | | $ | 10.00 | | | | | |
| | | | |
INCOME (LOSS) FROM INVESTMENT OPERATIONS: | | | | | | | | | | | | | | | | | | | | |
Net investment income (loss)(a) | | | (0.05 | ) | | | 0.00 | (b) | | | (0.02 | ) | | | (0.01 | ) | | | | |
Net realized and unrealized gain (loss) | | | 3.23 | | | | 2.60 | | | | 0.70 | | | | (0.94 | ) | | | | |
| | | | |
Total from Investment Operations | | | 3.18 | | | | 2.60 | | | | 0.68 | | | | (0.95 | ) | | | | |
| | | | |
LESS DISTRIBUTIONS FROM: | | | | | | | | | | | | | | | | | | | | |
Net investment income | | | — | | | | (0.02 | ) | | | — | | | | — | | | | | |
| | | | |
Net asset value, end of the period | | $ | 15.49 | | | $ | 12.31 | | | $ | 9.73 | | | $ | 9.05 | | | | | |
| | | | |
Total return(c) | | | 25.83 | % | | | 26.74 | % | | | 7.51 | % | | | (9.50 | )%(d) | | | | |
RATIOS TO AVERAGE NET ASSETS: | | | | | | | | | | | | | | | | | | | | |
Net assets, end of the period (000’s) | | $ | 17,500 | | | $ | 14,592 | | | $ | 11,974 | | | $ | 9,242 | | | | | |
Net expenses(e) | | | 0.85 | % | | | 0.85 | % | | | 0.85 | % | | | 0.85 | %(f) | | | | |
Gross expenses | | | 1.43 | % | | | 1.57 | % | | | 1.75 | % | | | 2.65 | %(f) | | | | |
Net investment income (loss) | | | (0.35 | )% | | | 0.01 | % | | | (0.22 | )% | | | (0.53 | )%(f) | | | | |
Portfolio turnover rate | | | 102 | %(g) | | | 49 | % | | | 53 | % | | | 14 | % | | | | |
| * | From commencement of operations on June 30, 2015 through September 30, 2015. |
| (a) | Per share net investment income (loss) has been calculated using the average shares outstanding during the period. |
| (b) | Amount rounds to less than $0.01. |
| (c) | Had certain expenses not been waived/reimbursed during the period, total returns would have been lower. |
| (d) | Periods less than one year are not annualized. |
| (e) | The investment adviser agreed to waive its fees and/or reimburse a portion of the Fund’s expenses during the period. Without this waiver/reimbursement, expenses would have been higher. |
| (f) | Computed on an annualized basis for periods less than one year. |
| (g) | The variation in the Fund’s turnover rate from 2017 to 2018 was primarily due to significant shareholder flows. |
See accompanying notes to financial statements.
51 |
Notes to Financial Statements
September 30, 2018
1. Organization. Loomis Sayles Funds I and Loomis Sayles Funds II (the “Trusts” and each a “Trust”) are each organized as a Massachusetts business trust. Each Trust is registered under the Investment Company Act of 1940, as amended (the “1940 Act”), as an open-end management investment company. Each Declaration of Trust permits the Board of Trustees to authorize the issuance of an unlimited number of shares of the Trust in multiple series. The financial statements for certain funds of the Trusts are presented in separate reports. The following funds (individually, a “Fund” and collectively, the “Funds”) are included in this report:
Loomis Sayles Funds I:
Loomis Sayles Small Cap Value Fund (the “Small Cap Value Fund”)
Loomis Sayles Funds II:
Loomis Sayles Small Cap Growth Fund (the “Small Cap Growth Fund”)
Loomis Sayles Small/Mid Cap Growth Fund (the “Small/Mid Cap Growth Fund”)
Each Fund is a diversified investment company.
Small Cap Growth Fund and Small Cap Value Fund were closed to new investors effective September 14, 2012 and September 15, 2008, respectively. Subsequent to year-end on October 1, 2018, Small Cap Growth Fund re-opened to new investors. Effective November 27, 2017, Small Cap Value Fund re-opened to new investors. Small Cap Growth Fund offers Institutional Class, Retail Class and Class N shares. Small Cap Value Fund offers Institutional Class, Retail Class, Admin Class and Class N shares. Small/Mid Cap Growth Fund offers Institutional Class shares.
Each share class is sold without a sales charge. Retail Class and Admin Class shares pay a Rule 12b-1 fee. Class N shares are offered with an initial minimum investment of $1,000,000. Institutional Class shares are intended for institutional investors with a minimum initial investment of $100,000 for Small Cap Growth Fund and Small Cap Value Fund and $1,000,000 for Small/Mid Cap Growth Fund. Certain categories of investors are exempted from the minimum investment amount for Class N and Institutional Class as outlined in the relevant Fund’s prospectus. Admin Class shares are offered exclusively through intermediaries.
Most expenses can be directly attributed to a Fund. Expenses which cannot be directly attributed to a Fund are generally apportioned based on the relative net assets of each of the funds in Natixis Funds Trust I, Natixis Funds Trust II, Natixis Funds Trust IV and Gateway Trust (“Natixis Funds Trusts”), Loomis Sayles Funds I and Loomis Sayles Funds II (“Loomis Sayles Funds Trusts”), and Natixis ETF Trust. Expenses of a Fund are borne pro rata by the holders of each class of shares, except that each class bears expenses unique to that class (such as the Rule 12b-1 fees applicable to Retail Class and Admin Class), and transfer agent fees are borne collectively for Institutional Class, Retail Class and Admin Class, and individually for Class N. In addition, each class votes as a class only with respect to its own Rule 12b-1 Plan. Shares of each class would receive their pro rata share
| 52
Notes to Financial Statements – continued
September 30, 2018
of the net assets of a Fund if the Fund were liquidated. The Trustees approve separate distributions from net investment income on each class of shares.
2. Significant Accounting Policies. The following is a summary of significant accounting policies consistently followed by each Fund in the preparation of its financial statements. The Funds’ financial statements follow the accounting and reporting guidelines provided for investment companies and are prepared in accordance with accounting principles generally accepted in the United States of America which require the use of management estimates that affect the reported amounts and disclosures in the financial statements. Actual results could differ from those estimates. Management has evaluated the events and transactions subsequent to year-end through the date the financial statements were issued and has determined that there were no material events that would require disclosure in the Funds’ financial statements.
a. Valuation. Fund securities and other investments are valued at market value based on market quotations obtained or determined by independent pricing services recommended by the adviser and approved by the Board of Trustees. Fund securities and other investments for which market quotations are not readily available are valued at fair value as determined in good faith by the adviser pursuant to procedures approved by the Board of Trustees, as described below. Market value is determined as follows:
Listed equity securities (including shares of closed-end investment companies and exchange-traded funds) are valued at the last sale price quoted on the exchange where they are traded most extensively or, if there is no reported sale during the day, the closing bid quotation as reported by an independent pricing service. Securities traded on the NASDAQ Global Select Market, NASDAQ Global Market and NASDAQ Capital Market are valued at the NASDAQ Official Closing Price (“NOCP”), or if lacking an NOCP, at the most recent bid quotations on the applicable NASDAQ Market. Unlisted equity securities (except unlisted preferred equity securities) are valued at the last sale price quoted in the market where they are traded most extensively or, if there is no reported sale during the day, the closing bid quotation as reported by an independent pricing service. If there is no last sale price or closing bid quotation available, unlisted equity securities will be valued using evaluated bids furnished by an independent pricing service, if available. In some foreign markets, an official close price and a last sale price may be available from the foreign exchange or market. In those cases, the official close price is used. Debt securities and unlisted preferred equity securities are valued based on evaluated bids furnished to the Fund by an independent pricing service or bid prices obtained from broker-dealers. Broker-dealer bid prices may be used to value debt and unlisted equity securities where an independent pricing service is unable to price a security or where an independent pricing service does not provide a reliable price for the security.
Fund securities and other investments for which market quotations are not readily available are valued at fair value as determined in good faith by the adviser pursuant to procedures approved by the Board of Trustees. The Funds may also value securities and
53 |
Notes to Financial Statements – continued
September 30, 2018
other investments at fair value in other circumstances such as when extraordinary events occur after the close of a foreign market but prior to the close of the New York Stock Exchange. This may include situations relating to a single issuer (such as a declaration of bankruptcy or a delisting of the issuer’s security from the primary market on which it has traded) as well as events affecting the securities markets in general (such as market disruptions or closings and significant fluctuations in U.S. and/or foreign markets). When fair valuing its securities or other investments, the Funds may, among other things, use modeling tools or other processes that may take into account factors such as securities or other market activity and/or significant events that occur after the close of the foreign market and before the time the Fund’s net asset value (“NAV”) is calculated. Fair value pricing may require subjective determinations about the value of a security, and fair values used to determine a Fund’s NAV may differ from quoted or published prices, or from prices that are used by others, for the same securities. In addition, the use of fair value pricing may not always result in adjustments to the prices of securities held by a Fund.
Illiquid securities for which market quotations are readily available and have been evaluated by the adviser are considered and classified as fair valued securities pursuant to the Funds’ pricing policies and procedures.
b. Investment Transactions and Related Investment Income. Investment transactions are accounted for on a trade date plus one day basis for daily NAV calculation. However, for financial reporting purposes, investment transactions are reported on trade date. Dividend income is recorded on ex-dividend date, or in the case of certain foreign securities, as soon as a Fund is notified, and interest income is recorded on an accrual basis. Interest income is increased by the accretion of discount and decreased by the amortization of premium, if applicable. Distributions received from investments in securities that represent a return of capital or capital gain are recorded as a reduction of cost of investments or as a realized gain, respectively. The calendar year-end amounts of ordinary income, capital gains and return of capital included in distributions received from the Funds’ investments in real estate investment trusts (“REITs”) are reported to the Funds after the end of the fiscal year; accordingly, the Funds estimate these amounts for accounting purposes until the characterization of REIT distributions is reported to the Funds after the end of the fiscal year. Estimates are based on the most recent REIT distribution information available. In determining net gain or loss on securities sold, the cost of securities has been determined on an identified cost basis. Investment income, non-class specific expenses and realized and unrealized gains and losses are allocated on a pro rata basis to each class based on the relative net assets of each class to the total net assets of the Fund.
c. Foreign Currency Translation. The books and records of the Funds are maintained in U.S. dollars. The values of securities, currencies and other assets and liabilities denominated in currencies other than U.S. dollars are translated into U.S. dollars based upon foreign exchange rates prevailing at the end of the period. Purchases and sales of investment securities, income and expenses are translated into U.S. dollars on the respective dates of such transactions.
| 54
Notes to Financial Statements – continued
September 30, 2018
Net realized foreign exchange gains or losses arise from sales of foreign currency, changes in exchange rates between the trade and settlement dates on securities transactions and the difference between the amounts of dividends, interest and foreign withholding taxes recorded on the Fund’s books and the U.S. dollar equivalent of the amounts actually received or paid. Net unrealized foreign exchange gains or losses arise from changes in the value of assets and liabilities, other than investment securities, as of the end of the fiscal period, resulting from changes in exchange rates.
The values of investment securities are presented at the foreign exchange rates prevailing at the end of the period for financial reporting purposes. Net realized and unrealized gains or losses on investments reported in the Statements of Operations reflect gains or losses resulting from changes in exchange rates and fluctuations which arise due to changes in market prices of investment securities.
The Funds may use foreign currency exchange contracts to facilitate transactions in foreign-denominated investments. Losses may arise from changes in the value of the foreign currency or if the counterparties do not perform under the contracts’ terms.
d. New Disclosure Requirements. In accordance with new reporting requirements pursuant to Regulation S-X of the Securities and Exchange Commission, presentation of certain amounts on the Statements of Changes in Net Assets, for the year ended September 30, 2017, have been conformed to meet the new disclosure requirements. These adjustments include Distributions to Shareholders; where the prior disclosure separately stated distributions from net investment income and distributions from net realized capital gains for each share class of the Fund, they are now combined into a single line item for each respective share class. In addition, disclosure of Distributions in Excess of Net Investment Income and Accumulated Net Investment Loss, where applicable, has been removed from the Statements of Changes in Net Assets.
The following is a summary of the previously disclosed amounts, as reported at September 30, 2017:
Small Cap Growth Fund
| | | | |
| ACCUMULATED NET INVESTMENT LOSS | | $ | (5,263,019 | ) |
| | | | |
Small Cap Value Fund
| | | | |
| FROM DISTRIBUTIONS TO SHAREHOLDERS: | | | | |
Net investment income | | | | |
Institutional Class | | $ | (2,669,796 | ) |
Retail Class | | | (383,151 | ) |
Class N | | | (394,109 | ) |
55 |
Notes to Financial Statements – continued
September 30, 2018
| | | | |
Net realized capital gains | | | | |
Institutional Class | | $ | (52,752,875 | ) |
Retail Class | | | (20,871,880 | ) |
Admin Class | | | (3,598,566 | ) |
Class N | | | (6,619,873 | ) |
| | | | |
Total distributions | | $ | (87,290,250 | ) |
| | | | |
| DISTRIBUTIONS IN EXCESS OF NET INVESTMENT INCOME | | $ | (210,306 | ) |
| | | | |
Small/Mid Cap Growth Fund
| | | | |
| FROM DISTRIBUTIONS TO SHAREHOLDERS: | | | | |
Net investment income | | | | |
Institutional Class | | $ | (22,881 | ) |
| | | | |
| DISTRIBUTIONS IN EXCESS OF NET INVESTMENT INCOME | | $ | (61,727 | ) |
| | | | |
e. Federal and Foreign Income Taxes. The Trusts treat each Fund as a separate entity for federal income tax purposes. Each Fund intends to meet the requirements of the Internal Revenue Code of 1986, as amended, applicable to regulated investment companies, and to distribute to its shareholders substantially all of its net investment income and any net realized capital gains at least annually. Management has performed an analysis of each Fund’s tax positions for the open tax years as of September 30, 2018 and has concluded that no provisions for income tax are required. The Funds’ federal tax returns for the prior three fiscal years, where applicable, remain subject to examination by the Internal Revenue Service. Management is not aware of any events that are reasonably possible to occur in the next twelve months that would result in the amounts of any unrecognized tax benefits significantly increasing or decreasing for the Funds. However, management’s conclusions regarding tax positions taken may be subject to review and adjustment at a later date based on factors including, but not limited to, new tax laws and accounting regulations and interpretations thereof.
A Fund may be subject to foreign withholding taxes on investment income and taxes on capital gains on investments that are accrued and paid based upon the Fund’s understanding of the tax rules and regulations that exist in the countries in which the Fund invests. Foreign withholding taxes on dividend and interest income are reflected on the Statements of Operations as a reduction of investment income, net of amounts eligible to be reclaimed. Dividends and interest receivable on the Statements of Assets and Liabilities are net of foreign withholding taxes. Foreign withholding taxes where reclaims have been or will be filed are reflected on the Statements of Assets and Liabilities as tax reclaims receivable. Capital gains taxes paid are included in net realized gain (loss) on investments in the Statements of Operations. Accrued but unpaid capital gains taxes are reflected as foreign taxes payable on the Statements of Assets and Liabilities, if applicable, and reduce unrealized gains on investments. In the event that realized gains on investments are subsequently offset by realized losses, taxes paid on realized gains may be returned to a
| 56
Notes to Financial Statements – continued
September 30, 2018
Fund. Such amounts, if applicable, are reflected as foreign tax rebates receivable on the Statements of Assets and Liabilities and are recorded as a realized gain when received.
f. Dividends and Distributions to Shareholders. Dividends and distributions are recorded on ex-dividend date. The timing and characterization of certain income and capital gain distributions are determined in accordance with federal tax regulations, which may differ from accounting principles generally accepted in the United States of America. Permanent differences are primarily due to differing treatments for book and tax purposes of items such as return of capital distributions received, distribution re-designations, and net operating losses. Permanent book and tax basis differences relating to shareholder distributions will result in reclassifications to capital accounts reported on the Statements of Assets and Liabilities. Temporary differences between book and tax distributable earnings are primarily due to return of capital distributions received, deferred Trustees’ fees and wash sales. Amounts of income and capital gain available to be distributed on a tax basis are determined annually, and at other times during the Funds’ fiscal year as may be necessary to avoid knowingly declaring and paying a return of capital distribution. Distributions from net investment income and net realized short-term capital gains are reported as distributed from ordinary income for tax purposes.
The tax characterization of distributions is determined on an annual basis. The tax character of distributions paid to shareholders during the years ended September 30, 2018 and 2017 were as follows:
| | | | | | | | | | | | | | | | | | | | | | | | |
| | | 2018 Distributions Paid From: | | | 2017 Distributions Paid From: | |
Fund | | Ordinary
Income | | | Long-Term
Capital Gains | | | Total | | | Ordinary
Income | | | Long-Term
Capital Gains | | | Total | |
Small Cap Growth Fund | | $ | — | | | $ | 141,682,579 | | | $ | 141,682,579 | | | $ | — | | | $ | — | | | $ | — | |
Small Cap Value Fund | | | 1,359,796 | | | | 119,491,329 | | | | 120,851,125 | | | | 3,961,114 | | | | 83,329,136 | | | | 87,290,250 | |
Small/Mid Cap Growth Fund | | | — | | | | — | | | | — | | | | 22,881 | | | | — | | | | 22,881 | |
For the year ended September 30, 2017 differences between amounts previously reported and now disclosed in Note 2d of the Notes to Financial Statements are primarily attributable to different book and tax treatment for short-term capital gains.
Distributions paid to shareholders from net investment income and net realized capital gains, based on accounting principles generally accepted in the United States of America, are consolidated and reported on the Statements of Changes in Net Assets as Distributions to Shareholders. Distributions paid to shareholders from net investment income and net realized capital gains expressed in per-share amounts, based on accounting principles generally accepted in the United States of America, are separately stated and reported within the Financial Highlights.
57 |
Notes to Financial Statements – continued
September 30, 2018
As of September 30, 2018, the components of distributable earnings on a tax basis were as follows:
| | | | | | | | | | | | |
| | | Small Cap
Growth Fund | | | Small Cap
Value Fund | | | Small/Mid
Cap Growth
Fund | |
Undistributed ordinary income | | $ | — | | | $ | 909,338 | | | $ | — | |
Undistributed long-term capital gains | | | 118,993,134 | | | | 105,323,288 | | | | 4,717,064 | |
| | | | | | | | | | | | |
Total undistributed earnings | | | 118,993,134 | | | | 106,232,626 | | | | 4,717,064 | |
| | | | | | | | | | | | |
Late-year ordinary and post-October capital loss deferrals* | | | (202,395 | ) | | | — | | | | (46,179 | ) |
| | | | | | | | | | | | |
Unrealized appreciation | | | 541,795,339 | | | | 313,825,773 | | | | 2,393,032 | |
| | | | | | | | | | | | |
Total accumulated earnings | | $ | 660,586,078 | | | $ | 420,058,399 | | | $ | 7,063,917 | |
| | | | | | | | | | | | |
Capital loss carryforward utilized in the current year | | $ | — | | | $ | — | | | $ | 407,754 | |
| | | | | | | | | | | | |
* Under current tax law, net operating losses, capital losses, foreign currency losses, and losses on passive foreign investment companies and contingent payment debt instruments after October 31 or December 31, as applicable, may be deferred and treated as occurring on the first day of the following taxable year. Small Cap Growth Fund and Small/Mid Cap Growth Fund are deferring net operating losses.
As of September 30, 2018, the cost of investments and unrealized appreciation (depreciation) on a federal tax basis were as follows:
| | | | | | | | | | | | |
| | | Small Cap
Growth Fund | | | Small Cap
Value Fund | | | Small/Mid
Cap Growth
Fund | |
Federal tax cost | | $ | 1,041,021,613 | | | $ | 661,050,832 | | | $ | 15,471,178 | |
| | | | | | | | | | | | |
Gross tax appreciation | | $ | 552,711,139 | | | $ | 346,019,934 | | | $ | 2,616,209 | |
Gross tax depreciation | | | (10,915,800 | ) | | | (32,194,161 | ) | | | (223,177 | ) |
| | | | | | | | | | | | |
Net tax appreciation | | $ | 541,795,339 | | | $ | 313,825,773 | | | $ | 2,393,032 | |
| | | | | | | | | | | | |
g. Repurchase Agreements. Each Fund may enter into repurchase agreements, under the terms of a Master Repurchase Agreement, under which each Fund acquires securities as collateral and agrees to resell the securities at an agreed upon time and at an agreed upon price. It is each Fund’s policy that the market value of the collateral for repurchase agreements be at least equal to 102% of the repurchase price, including interest. Certain repurchase agreements are tri-party arrangements whereby the collateral is held in a segregated account for the benefit of the Fund and on behalf of the counterparty. Repurchase agreements could involve certain risks in the event of default or insolvency of the counterparty, including possible delays or restrictions upon a Fund’s ability to dispose of the underlying securities. As of September 30, 2018, each Fund, as applicable, had investments in repurchase agreements for which the value of the related collateral exceeded the value of the repurchase agreement. The gross value of repurchase agreements is included in the Statements of Assets and Liabilities for financial reporting purposes.
| 58
Notes to Financial Statements – continued
September 30, 2018
h. Securities Lending. The Funds have entered into an agreement with State Street Bank and Trust Company (“State Street Bank”), as agent of the Funds, to lend securities to certain designated borrowers. The loans are collateralized with cash or securities in an amount equal to at least 105% or 102% of the market value (including accrued interest) of the loaned international or domestic securities, respectively, when the loan is initiated. Thereafter, the value of the collateral must remain at least 102% of the market value (including accrued interest) of loaned securities for U.S. equities and U.S. corporate debt; at least 105% of the market value (including accrued interest) of loaned securities for non-U.S. equities; and at least 100% of the market value (including accrued interest) of loaned securities for U.S. Government securities, sovereign debt issued by non-U.S. Governments and non-U.S. corporate debt. In the event that the market value of the collateral falls below the required percentages described above, the borrower will deliver additional collateral on the next business day. As with other extensions of credit, the Funds may bear the risk of loss with respect to the investment of the collateral. The Funds invest cash collateral in short-term investments, a portion of the income from which is remitted to the borrowers and the remainder allocated between the Funds and State Street Bank as lending agent.
For the year ended September 30, 2018, none of the Funds had loaned securities under this agreement.
i. Indemnifications. Under the Trusts’ organizational documents, their officers and Trustees are indemnified against certain liabilities arising out of the performance of their duties to the Funds. Additionally, in the normal course of business, the Funds enter into contracts with service providers that contain general indemnification clauses. The Funds’ maximum exposure under these arrangements is unknown as this would involve future claims that may be made against the Funds that have not yet occurred. However, based on experience, the Funds expect the risk of loss to be remote.
3. Fair Value Measurements. In accordance with accounting standards related to fair value measurements and disclosures, the Funds have categorized the inputs utilized in determining the value of each Fund’s assets or liabilities. These inputs are summarized in the three broad levels listed below:
| | • | | Level 1—quoted prices in active markets for identical assets or liabilities; |
| | • | | Level 2—prices determined using other significant inputs that are observable either directly, or indirectly through corroboration with observable market data (which could include quoted prices for similar assets or liabilities, interest rates, credit risk, etc.); and |
| | • | | Level 3—prices determined using significant unobservable inputs when quoted prices or observable inputs are unavailable such as when there is little or no market activity for an asset or liability (unobservable inputs reflect each Fund’s own assumptions in determining the fair value of assets or liabilities and would be based on the best information available). |
59 |
Notes to Financial Statements – continued
September 30, 2018
The inputs or methodology used for valuing securities are not necessarily an indication of the risk associated with investing in those securities.
The following is a summary of the inputs used to value the Funds’ investments as of September 30, 2018, at value:
Small Cap Growth Fund
Asset Valuation Inputs
| | | | | | | | | | | | | | | | |
Description | | Level 1 | | | Level 2 | | | Level 3 | | | Total | |
Common Stocks(a) | | $ | 1,517,502,364 | | | $ | — | | | $ | — | | | $ | 1,517,502,364 | |
Short-Term Investments | | | — | | | | 65,314,588 | | | | — | | | | 65,314,588 | |
| | | | | | | | | | | | | | | | |
Total | | $ | 1,517,502,364 | | | $ | 65,314,588 | | | $ | — | | | $ | 1,582,816,952 | |
| | | | | | | | | | | | | | | | |
(a) Details of the major categories of the Fund’s investments are reflected within the Portfolio of Investments.
For the year ended September 30, 2018, there were no transfers among Levels 1, 2 and 3.
Small Cap Value Fund
Asset Valuation Inputs
| | | | | | | | | | | | | | | | |
Description | | Level 1 | | | Level 2 | | | Level 3 | | | Total | |
Common Stocks(a) | | $ | 965,224,016 | | | $ | — | | | $ | — | | | $ | 965,224,016 | |
Closed-End Investment Companies | | | 2,796,342 | | | | — | | | | — | | | | 2,796,342 | |
Short-Term Investments | | | — | | | | 6,856,247 | | | | — | | | | 6,856,247 | |
| | | | | | | | | | | | | | | | |
Total | | $ | 968,020,358 | | | $ | 6,856,247 | | | $ | — | | | $ | 974,876,605 | |
| | | | | | | | | | | | | | | | |
(a) Details of the major categories of the Fund’s investments are reflected within the Portfolio of Investments.
For the year ended September 30, 2018, there were no transfers among Levels 1, 2 and 3.
Small/Mid Cap Growth Fund
Asset Valuation Inputs
| | | | | | | | | | | | | | | | |
Description | | Level 1 | | | Level 2 | | | Level 3 | | | Total | |
Common Stocks(a) | | $ | 17,056,617 | | | $ | — | | | $ | — | | | $ | 17,056,617 | |
Short-Term Investments | | | — | | | | 807,593 | | | | — | | | | 807,593 | |
| | | | | | | | | | | | | | | | |
Total | | $ | 17,056,617 | | | $ | 807,593 | | | $ | — | | | $ | 17,864,210 | |
| | | | | | | | | | | | | | | | |
(a) Details of the major categories of the Fund’s investments are reflected within the Portfolio of Investments.
For the year ended September 30, 2018, there were no transfers among Levels 1, 2 and 3.
| 60
Notes to Financial Statements – continued
September 30, 2018
4. Purchases and Sales of Securities. For the year ended September 30, 2018, purchases and sales of securities (excluding short-term investments) were as follows:
| | | | | | | | |
Fund | | Purchases | | | Sales | |
Small Cap Growth Fund | | $ | 532,560,398 | | | $ | 527,252,099 | |
Small Cap Value Fund | | | 195,188,871 | | | | 345,164,307 | |
Small/Mid Cap Growth Fund | | | 16,863,529 | | | | 18,071,069 | |
5. Management Fees and Other Transactions with Affiliates.
a. Management Fees. Loomis, Sayles & Company, L.P. (“Loomis Sayles”) serves as investment adviser to each Fund. Under the terms of the management agreements, each Fund pays a management fee at the following annual rates, calculated daily and payable monthly, based on each Fund’s average daily net assets:
| | | | | | | | |
Fund | | Percentage of
Average Daily Net Assets | | | | |
Small Cap Growth Fund | | | 0.75% | | | | | |
Small Cap Value Fund | | | 0.75% | | | | | |
Small/Mid Cap Growth Fund | | | 0.75% | | | | | |
Loomis Sayles has given binding undertakings to the Funds to waive management fees and/or reimburse certain expenses to limit the Funds’ operating expenses, exclusive of acquired fund fees and expenses, brokerage expenses, interest expense, taxes, organizational and extraordinary expenses such as litigation and indemnification expenses. These undertakings are in effect until January 31, 2019, may be terminated before then only with the consent of the Funds’ Board of Trustees and are reevaluated on an annual basis. Management fees payable, as reflected on the Statements of Assets and Liabilities, is net of waivers and/or expense reimbursements, if any, pursuant to these undertakings. Waivers/ reimbursements that exceed management fees payable are reflected on the Statements of Assets and Liabilities as receivable from investment adviser.
For the year ended September 30, 2018, the expense limits as a percentage of average daily net assets under the expense limitation agreements were as follows:
| | | | | | | | | | | | | | | | |
| | | Expense Limit as a Percentage of
Average Daily Net Assets | |
Fund | | Institutional Class | | | Retail Class | | | Admin Class | | | Class N | |
Small Cap Growth Fund | | | 1.00% | | | | 1.25% | | | | — | | | | 0.95% | |
Small Cap Value Fund | | | 0.90% | | | | 1.15% | | | | 1.40% | | | | 0.85% | |
Small/Mid Cap Growth Fund | | | 0.85% | | | | — | | | | — | | | | — | |
Loomis Sayles shall be permitted to recover expenses borne under the expense limitation agreements (whether through waiver of management fees or otherwise) on a class by class basis in later periods to the extent the annual operating expenses of a class fall below a class’ expense limits, provided, however, that a class is not obligated to pay such waived/reimbursed
61 |
Notes to Financial Statements – continued
September 30, 2018
fees or expenses more than one year after the end of the fiscal year in which the fees or expenses were waived/reimbursed.
For the year ended September 30, 2018, the management fees for each Fund were as follows:
| | | | | | | | | | | | | | | | | | | | |
| | | Gross
Management
Fees | | | Contractual
Waivers of
Management
Fees1 | | | Net
Management
Fees | | | Percentage of
Average Daily Net Assets | |
Fund | | Gross | | | Net | |
Small Cap Growth Fund | | $ | 10,158,265 | | | $ | — | | | $ | 10,158,265 | | | | 0.75% | | | | 0.75% | |
Small Cap Value Fund | | | 7,700,146 | | | | — | | | | 7,700,146 | | | | 0.75% | | | | 0.75% | |
Small/Mid Cap Growth Fund | | | 132,762 | | | | 102,676 | | | | 30,086 | | | | 0.75% | | | | 0.17% | |
For the year ended September 30, 2018, class-specific expenses have been reimbursed as follows:
| | | | | | | | | | | | | | | | | | | | |
| | | Reimbursement1 | |
Fund | | Institutional
Class | | | Retail
Class | | | Admin
Class | | | Class N | | | Total | |
Small Cap Value Fund | | $ | 137,802 | | | $ | 51,701 | | | $ | 6,226 | | | $ | — | | | $ | 195,729 | |
1 Waiver/expense reimbursements are subject to possible recovery until September 30, 2019.
Certain officers and employees of Loomis Sayles are also officers or Trustees of the Trusts. Loomis Sayles’ general partner is indirectly owned by Natixis Investment Managers, L.P. (“Natixis”), which is part of Natixis Investment Managers, an international asset management group based in Paris, France.
b. Service and Distribution Fees. Natixis Distribution, L.P. (“Natixis Distribution”), which is a wholly-owned subsidiary of Natixis, has entered into a distribution agreement with the Trusts. Pursuant to this agreement, Natixis Distribution serves as principal underwriter of the Funds of the Trusts.
Pursuant to Rule 12b-1 under the 1940 Act, Small Cap Growth Fund and Small Cap Value Fund have adopted a Distribution Plan relating to each Fund’s Retail Class shares (the “Retail Class Plans”) and Small Cap Value Fund has adopted a Distribution Plan relating to its Admin Class shares (the “Admin Class Plan”).
Under the Retail Class Plans, each Fund pays Natixis Distribution a monthly distribution fee at an annual rate not to exceed 0.25% of the average daily net assets attributable to the Fund’s Retail Class shares, as compensation for services provided by Natixis Distribution in connection with the marketing or sale of Retail Class shares or for payments made by Natixis Distribution to securities dealers or other financial intermediaries as commissions, asset-based sales charges or other compensation with respect to the sale of Retail Class shares, or for providing personal services to investors and/or the maintenance of shareholder accounts.
| 62
Notes to Financial Statements – continued
September 30, 2018
Under the Admin Class Plan, Small Cap Value Fund pays Natixis Distribution a monthly distribution fee at an annual rate not to exceed 0.25% of the average daily net assets attributable to the Fund’s Admin Class shares, as compensation for services provided by Natixis Distribution in connection with the marketing or sale of Admin Class shares or for payments made by Natixis Distribution to securities dealers or other financial intermediaries as commissions, asset-based sales charges or other compensation with respect to the sale of Admin Class shares, or for providing personal services to investors and/or the maintenance of shareholder accounts.
In addition, the Admin Class shares of Small Cap Value Fund may pay Natixis Distribution an administrative service fee, at an annual rate not to exceed 0.25% of the average daily net assets attributable to Admin Class shares. These fees are subsequently paid to securities dealers or financial intermediaries for providing personal services and/or account maintenance for their customers who hold such shares.
For the year ended September 30, 2018, the service and distribution fees for each Fund were as follows:
| | | | | | | | | | | | |
| | | Service Fees | | | Distribution Fees | |
Fund | | Admin Class | | | Retail Class | | | Admin Class | |
Small Cap Growth Fund | | $ | — | | | $ | 293,140 | | | $ | — | |
Small Cap Value Fund | | | 69,659 | | | | 578,786 | | | | 69,659 | |
c. Administrative Fees. Natixis Advisors, L.P. (“Natixis Advisors”) provides certain administrative services for the Funds and contracts with State Street Bank to serve as sub-administrator. Natixis Advisors is a wholly-owned subsidiary of Natixis. Pursuant to an agreement among Natixis Funds Trusts, Loomis Sayles Funds Trusts, Natixis ETF Trust and Natixis Advisors, each Fund pays Natixis Advisors monthly its pro rata portion of fees equal to an annual rate of 0.0575% of the first $15 billion of the average daily net assets of the Natixis Funds Trusts, Loomis Sayles Funds Trusts and Natixis ETF Trust, 0.0500% of the next $15 billion, 0.0400% of the next $30 billion, 0.0275% of the next $30 billion and 0.0225% of such assets in excess of $90 billion, subject to an annual aggregate minimum fee for the Natixis Funds Trusts, Loomis Sayles Funds Trusts and Natixis ETF Trust of $10 million, which is reevaluated on an annual basis.
Prior to July 1, 2018, each Fund paid Natixis Advisors monthly its pro rata portion of fees equal to an annual rate of 0.0575% of the first $15 billion of the average daily net assets of the Natixis Funds Trusts, Loomis Sayles Funds Trusts and Natixis ETF Trust, 0.0500% of the next $15 billion, 0.0400% of the next $30 billion, 0.0350% of the next $30 billion and 0.0325% of such assets in excess of $90 billion, subject to an annual aggregate minimum fee for the Natixis Funds Trusts, Loomis Sayles Funds Trusts and Natixis ETF Trust of $10 million, which was reevaluated on an annual basis.
63 |
Notes to Financial Statements – continued
September 30, 2018
For the year ended September 30, 2018, the administrative fees for each Fund were as follows:
| | | | |
Fund | | Administrative
Fees | |
Small Cap Growth Fund | | $ | 595,459 | |
Small Cap Value Fund | | | 451,857 | |
Small/Mid Cap Growth Fund | | | 7,796 | |
d. Sub-Transfer Agent Fees. Natixis Distribution has entered into agreements, which include servicing agreements, with financial intermediaries that provide recordkeeping, processing, shareholder communications and other services to customers of the intermediaries that hold positions in the Funds and has agreed to compensate the intermediaries for providing those services. Intermediaries transact with the Funds primarily through the use of omnibus accounts on behalf of their customers who hold positions in the Funds. These services would have been provided by the Funds’ transfer agent and other service providers if the shareholders’ accounts were maintained directly at the Funds’ transfer agent. Accordingly, the Funds have agreed to reimburse Natixis Distribution for all or a portion of the servicing fees paid to these intermediaries. The reimbursement amounts (sub-transfer agent fees) paid to Natixis Distribution are subject to a current per-account equivalent fee limit approved by the Funds’ Board of Trustees, which is based on fees for similar services paid to the Funds’ transfer agent and other service providers. Class N shares do not bear such expenses.
For the year ended September 30, 2018, the sub-transfer agent fees (which are reflected in transfer agent fees and expenses in the Statements of Operations) for each Fund were as follows:
| | | | |
Fund | | Sub-Transfer
Agent Fees | |
Small Cap Growth Fund | | $ | 1,110,908 | |
Small Cap Value Fund | | | 775,208 | |
Small/Mid Cap Growth Fund | | | 309 | |
As of September 30, 2018, the Funds owe Natixis Distribution the following reimbursements for sub-transfer agent fees (which are reflected in the Statements of Assets and Liabilities as payable to distributor):
| | | | |
Fund | | Reimbursements of
Sub-Transfer
Agent Fees | |
Small Cap Growth Fund | | $ | 13,202 | |
Small Cap Value Fund | | | 9,225 | |
Small/Mid Cap Growth Fund | | | 4 | |
Sub-transfer agent fees attributable to Institutional Class, Retail Class and Admin Class are allocated on a pro rata basis to each class based on the relative net assets of each class to the total net assets of those classes.
| 64
Notes to Financial Statements – continued
September 30, 2018
e. Trustees Fees and Expenses. The Trusts do not pay any compensation directly to their officers or Trustees who are directors, officers or employees of Natixis Advisors, Natixis Distribution, Natixis or their affiliates. The Chairperson of the Board of Trustees receives a retainer fee at the annual rate of $340,000. The Chairperson does not receive any meeting attendance fees for Board of Trustees meetings or committee meetings that he attends. Each Independent Trustee (other than the Chairperson) receives, in the aggregate, a retainer fee at the annual rate of $170,000. Each Independent Trustee also receives a meeting attendance fee of $10,000 for each meeting of the Board of Trustees that he or she attends in person and $5,000 for each meeting of the Board of Trustees that he or she attends telephonically. In addition, the chairperson of the Contract Review Committee and the chairperson of the Audit Committee each receive an additional retainer fee at the annual rate of $20,000. The chairperson of the Governance Committee receives an additional retainer fee at the annual rate of $12,000. Each Contract Review Committee member is compensated $6,000 for each Committee meeting that he or she attends in person and $3,000 for each meeting that he or she attends telephonically. Each Audit Committee member is compensated $6,000 for each Committee meeting that he or she attends in person and $3,000 for each meeting that he or she attends telephonically. These fees are allocated among the funds in the Natixis Funds Trusts, Loomis Sayles Funds Trusts and Natixis ETF Trust based on a formula that takes into account, among other factors, the relative net assets of each fund. Trustees are reimbursed for travel expenses in connection with attendance at meetings.
Prior to January 1, 2018, the Chairperson of the Board received a retainer fee at the annual rate of $325,000 and each Independent Trustee (other than the Chairperson) received, in the aggregate, a retainer fee at the annual rate of $155,000, the chairperson of the Contract Review Committee and Audit Committee each received an additional retainer fee at the annual rate of $17,500 and the chairperson of the Governance Committee received an additional retainer fee at the annual rate of $10,000. All other Trustee fees remained unchanged.
A deferred compensation plan (the “Plan”) is available to the Trustees on a voluntary basis. Deferred amounts remain in the Funds until distributed in accordance with the provisions of the Plan. The value of a participating Trustee’s deferral account is based on theoretical investments of deferred amounts, on the normal payment dates, in certain funds of the Natixis Funds Trusts, Loomis Sayles Funds Trusts and Natixis ETF Trust as designated by the participating Trustees. Changes in the value of participants’ deferral accounts are allocated pro rata among the funds in the Natixis Funds Trusts, Loomis Sayles Funds Trusts and Natixis ETF Trust, and are normally reflected as Trustees’ fees and expenses in the Statements of Operations. The portions of the accrued obligations allocated to the Funds under the Plan are reflected as Deferred Trustees’ fees in the Statements of Assets and Liabilities.
65 |
Notes to Financial Statements – continued
September 30, 2018
f. Affiliated Ownership. As of September 30, 2018, Loomis Sayles Funded Pension Plan and Trust (“Pension Plan”) and Loomis Sayles Employees’ Profit Sharing Retirement Plan (“Retirement Plan”) held shares of the Funds representing the following percentages of the Funds’ net assets:
| | | | | | | | | | | | |
Fund | | Pension
Plan | | | Retirement
Plan | | | Total
Affiliated
Ownership | |
Small Cap Growth Fund | | | 0.24% | | | | 1.49% | | | | 1.73% | |
Small Cap Value Fund | | | 0.33% | | | | 3.28% | | | | 3.61% | |
Small/Mid Cap Growth Fund | | | — | | | | 30.63% | | | | 30.63% | |
Investment activities of affiliated shareholders could have material impacts on the Funds.
6. Class-Specific Transfer Agent Fees and Expenses. Transfer agent fees and expenses attributable to Institutional Class, Retail Class and Admin Class are allocated on a pro rata basis to each class based on the relative net assets of each class to the total net assets of those classes. Transfer agent fees and expenses attributable to Class N are allocated to Class N.
For the year ended September 30, 2018, the Funds incurred the following class-specific transfer agent fees and expenses (including sub-transfer agent fees, where applicable):
| | | | | | | | | | | | | | | | |
| | | Transfer Agent Fees and Expenses | |
Fund | | Institutional
Class | | | Retail
Class | | | Admin
Class | | | Class N | |
Small Cap Growth Fund | | $ | 991,671 | | | $ | 138,178 | | | $ | — | | | $ | 1,312 | |
Small Cap Value Fund | | | 567,658 | | | | 213,065 | | | | 25,647 | | | | 621 | |
Small/Mid Cap Growth Fund | | | 2,320 | | | | — | | | | — | | | | — | |
7. Line of Credit. Effective April 12, 2018, each Fund, together with certain other funds of Natixis Funds Trusts, Loomis Sayles Funds Trusts and Natixis ETF Trust, entered into a $400,000,000 committed unsecured line of credit provided by State Street Bank. Any one Fund may borrow up to $350,000,000 under the line of credit agreement (as long as all borrowings by all Funds in the aggregate do not exceed the $400,000,000 limit at any time), subject to each Fund’s investment restrictions and its contractual obligations under the line of credit. Interest is charged to the Funds based upon the terms set forth in the agreement. In addition, a commitment fee of 0.15% per annum, payable at the end of each calendar quarter, is accrued and apportioned among the participating funds based on their average daily unused portion of the line of credit. The Funds paid an arrangement fee, an upfront fee, and other fees in connection with the new line of credit agreement, which are being amortized over a period of 364 days and are reflected as miscellaneous expenses on the Statements of Operations. The unamortized balance is reflected as prepaid expenses on the Statements of Assets and Liabilities.
Prior to April 12, 2018, each Fund, together with certain other funds of Natixis Funds Trusts and Loomis Sayles Funds Trusts, entered into a 364-day, $400,000,000 syndicated,
| 66
Notes to Financial Statements – continued
September 30, 2018
committed, unsecured line of credit with Citibank, N.A. to be used for temporary or emergency purposes only. Any one Fund was able borrow up to the full $400,000,000 under the line of credit (as long as all borrowings by all Funds in the aggregate did not exceed the $400,000,000 limit at any time), subject to each Fund’s investment restrictions and its contractual obligations under the line of credit. Interest was charged to the Funds at a rate equal to the greater of the eurodollar or the federal funds rate plus 1.00%. In addition, a commitment fee of 0.15% per annum, payable on the last business day of each month, was accrued and apportioned among the participating funds based on their average daily unused portion of the line of credit.
For the year ended September 30, 2018, none of the Funds had borrowings under this agreement.
8. Brokerage Commission Recapture. Each Fund had entered into agreements with certain brokers whereby the brokers will rebate a portion of brokerage commissions. All amounts rebated by the brokers are returned to the Funds under such agreements and are included in realized gains on investments in the Statements of Operations. For the year ended September 30, 2018, amounts rebated under these agreements were as follows:
| | | | |
Fund | | Rebates | |
Small Cap Growth Fund | | $ | 16,641 | |
Small Cap Value Fund | | | 17,330 | |
Small/Mid Cap Growth Fund | | | 216 | |
Effective March 9, 2018, the brokerage commission recapture program was terminated.
67 |
Notes to Financial Statements – continued
September 30, 2018
9. Capital Shares. Each Fund may issue an unlimited number of shares of beneficial interest, without par value. Transactions in capital shares were as follows:
| | | | | | | | | | | | | | | | |
| | | Small Cap Growth Fund | |
| | | Year Ended
September 30, 2018 | | | Year Ended
September 30, 2017 | |
| Institutional Class | | Shares | | | Amount | | | Shares | | | Amount | |
Issued from the sale of shares | | | 5,754,255 | | | $ | 164,470,396 | | | | 4,034,738 | | | $ | 97,151,691 | |
Issued in connection with the reinvestment of distributions | | | 3,526,960 | | | | 89,866,953 | | | | — | | | | — | |
Redeemed | | | (10,014,456 | ) | | | (275,865,186 | ) | | | (10,793,297 | ) | | | (256,866,078 | ) |
| | | | | | | | | | | | | | | | |
Net change | | | (733,241 | ) | | $ | (21,527,837 | ) | | | (6,758,559 | ) | | $ | (159,714,387 | ) |
| | | | | | | | | | | | | | | | |
| Retail Class | | | | | | | | | | | | |
Issued from the sale of shares | | | 1,440,364 | | | $ | 38,533,569 | | | | 692,134 | | | $ | 15,704,343 | |
Issued in connection with the reinvestment of distributions | | | 555,428 | | | | 13,074,766 | | | | — | | | | — | |
Redeemed | | | (1,512,825 | ) | | | (39,740,093 | ) | | | (2,244,929 | ) | | | (49,573,803 | ) |
| | | | | | | | | | | | | | | | |
Net change | | | 482,967 | | | $ | 11,868,242 | | | | (1,552,795 | ) | | $ | (33,869,460 | ) |
| | | | | | | | | | | | | | | | |
| Class N | | | | | | | | | | | | |
Issued from the sale of shares | | | 6,071,292 | | | $ | 171,038,280 | | | | 3,855,688 | | | $ | 94,799,081 | |
Issued in connection with the reinvestment of distributions | | | 1,378,059 | | | | 35,305,861 | | | | — | | | | — | |
Redeemed | | | (1,311,117 | ) | | | (37,531,530 | ) | | | (2,588,567 | ) | | | (60,438,788 | ) |
| | | | | | | | | | | | | | | | |
Net change | | | 6,138,234 | | | $ | 168,812,611 | | | | 1,267,121 | | | $ | 34,360,293 | |
| | | | | | | | | | | | | | | | |
Increase (decrease) from capital share transactions | | | 5,887,960 | | | $ | 159,153,016 | | | | (7,044,233 | ) | | $ | (159,223,554 | ) |
| | | | | | | | | | | | | | | | |
| 68
Notes to Financial Statements – continued
September 30, 2018
9. Capital Shares – continued.
| | | | | | | | | | | | | | | | |
| | | Small Cap Value Fund | |
| | | Year Ended
September 30, 2018 | | | Year Ended
September 30, 2017 | |
| Institutional Class | | Shares | | | Amount | | | Shares | | | Amount | |
Issued from the sale of shares | | | 2,693,880 | | | $ | 94,890,273 | | | | 3,564,958 | | | $ | 126,242,963 | |
Issued in connection with the reinvestment of distributions | | | 2,049,039 | | | | 70,363,994 | | | | 1,505,162 | | | | 53,252,622 | |
Redeemed | | | (5,895,445 | ) | | | (207,624,212 | ) | | | (6,645,676 | ) | | | (233,677,752 | ) |
| | | | | | | | | | | | | | | | |
Net change | | | (1,152,526 | ) | | $ | (42,369,945 | ) | | | (1,575,556 | ) | | $ | (54,182,167 | ) |
| | | | | | | | | | | | | | | | |
| Retail Class | |
Issued from the sale of shares | | | 283,804 | | | $ | 9,876,474 | | | | 616,632 | | | $ | 21,554,720 | |
Issued in connection with the reinvestment of distributions | | | 802,859 | | | | 27,144,677 | | | | 607,283 | | | | 21,218,469 | |
Redeemed | | | (1,902,508 | ) | | | (66,646,118 | ) | | | (2,437,522 | ) | | | (85,099,728 | ) |
| | | | | | | | | | | | | | | | |
Net change | | | (815,845 | ) | | $ | (29,624,967 | ) | | | (1,213,607 | ) | | $ | (42,326,539 | ) |
| | | | | | | | | | | | | | | | |
| Admin Class | |
Issued from the sale of shares | | | 189,958 | | | $ | 6,328,263 | | | | 220,759 | | | $ | 7,434,300 | |
Issued in connection with the reinvestment of distributions | | | 78,301 | | | | 2,544,008 | | | | 80,992 | | | | 2,738,330 | |
Redeemed | | | (388,643 | ) | | | (12,936,046 | ) | | | (804,540 | ) | | | (27,089,959 | ) |
| | | | | | | | | | | | | | | | |
Net change | | | (120,384 | ) | | $ | (4,063,775 | ) | | | (502,789 | ) | | $ | (16,917,329 | ) |
| | | | | | | | | | | | | | | | |
| Class N | |
Issued from the sale of shares | | | 829,306 | | | $ | 29,863,505 | | | | 1,948,540 | | | $ | 69,188,229 | |
Issued in connection with the reinvestment of distributions | | | 479,347 | | | | 16,470,360 | | | | 198,135 | | | | 7,013,982 | |
Redeemed | | | (596,844 | ) | | | (21,132,571 | ) | | | (527,853 | ) | | | (18,577,987 | ) |
| | | | | | | | | | | | | | | | |
Net change | | | 711,809 | | | $ | 25,201,294 | | | | 1,618,822 | | | $ | 57,624,224 | |
| | | | | | | | | | | | | | | | |
Increase (decrease) from capital share transactions | | | (1,376,946 | ) | | $ | (50,857,393 | ) | | | (1,673,130 | ) | | $ | (55,801,811 | ) |
| | | | | | | | | | | | | | | | |
| | | | | | | | | | | | | | | | |
| | | Small/Mid Cap Growth Fund | |
| | | Year Ended
September 30, 2018 | | | Year Ended
September 30, 2017 | |
| Institutional Class | | Shares | | | Amount | | | Shares | | | Amount | |
Issued from the sale of shares | | | 925,420 | | | $ | 12,965,329 | | | | 183,187 | | | $ | 1,981,855 | |
Issued in connection with the reinvestment of distributions | | | — | | | | — | | | | 2,259 | | | | 22,881 | |
Redeemed | | | (981,019 | ) | | | (14,098,148 | ) | | | (230,300 | ) | | | (2,399,598 | ) |
| | | | | | | | | | | | | | | | |
Increase (decrease) from capital share transactions | | | (55,599 | ) | | $ | (1,132,819 | ) | | | (44,854 | ) | | $ | (394,862 | ) |
| | | | | | | | | | | | | | | | |
69 |
Report of Independent Registered Public Accounting Firm
To the Board of Trustees of Loomis Sayles Funds I and Loomis Sayles Funds II and Shareholders of Loomis Sayles Small Cap Value Fund, Loomis Sayles Small Cap Growth Fund and Loomis Sayles Small/Mid Cap Growth Fund:
Opinions on the Financial Statements
We have audited the accompanying statements of assets and liabilities, including the portfolio of investments, of Loomis Sayles Small Cap Value Fund (one of the funds constituting Loomis Sayles Funds I), and Loomis Sayles Small Cap Growth Fund and Loomis Sayles Small/Mid Cap Growth Fund (two of the funds constituting Loomis Sayles Funds II) (hereafter collectively referred to as the “Funds”) as of September 30, 2018, the related statements of operations for the year ended September 30, 2018, the statements of changes in net assets for each of the two years in the period ended September 30, 2018, including the related notes, and the financial highlights for each of the periods indicated therein (collectively referred to as the “financial statements”). In our opinion, the financial statements present fairly, in all material respects, the financial position of each of the Funds as of September 30, 2018, the results of each of their operations for the year then ended, the changes in each of their net assets for each of the two years in the period ended September 30, 2018 and each of the financial highlights for each of the periods indicated therein in conformity with accounting principles generally accepted in the United States of America.
Basis for Opinions
These financial statements are the responsibility of the Funds’ management. Our responsibility is to express an opinion on the Funds’ financial statements based on our audits. We are a public accounting firm registered with the Public Company Accounting Oversight Board (United States) (“PCAOB”) and are required to be independent with respect to the Funds in accordance with the U.S. federal securities laws and the applicable rules and regulations of the Securities and Exchange Commission and the PCAOB.
We conducted our audits of these financial statements in accordance with the standards of the PCAOB. Those standards require that we plan and perform the audit to obtain reasonable assurance about whether the financial statements are free of material misstatement, whether due to error or fraud.
Our audits included performing procedures to assess the risks of material misstatement of the financial statements, whether due to error or fraud, and performing procedures that respond to those risks. Such procedures included examining, on a test basis, evidence regarding the amounts and disclosures in the financial statements. Our audits also included evaluating the accounting principles used and significant estimates made by management, as well as evaluating the overall presentation of the financial statements. Our procedures included confirmation of securities owned as of September 30, 2018 by
| 70
Report of Independent Registered Public Accounting Firm
correspondence with the custodian, and brokers; when replies were not received from brokers, we performed other auditing procedures. We believe that our audits provide a reasonable basis for our opinions.
PricewaterhouseCoopers LLP
Boston, Massachusetts
November 20, 2018
We have served as the auditor of one or more investment companies in the Natixis Investment Company Complex since at least 1995. We have not determined the specific year we began serving as auditor.
71 |
2018 U.S. Tax Distribution Information to Shareholders (Unaudited)
Corporate Dividends Received Deduction. For the fiscal year ended September 30, 2018, a percentage of dividends distributed by the Fund listed below qualifies for the dividends received deduction for corporate shareholders. This percentage is as follows:
| | | | |
Fund | | Qualifying Percentage | |
Small Cap Value | | | 100.00% | |
Capital Gains Distributions. Pursuant to Internal Revenue Section 852(b), the following Funds paid distributions, which have been designated as capital gains distributions for the fiscal year ended September 30, 2018, unless subsequently determined to be different.
| | | | |
Fund | | Amount | |
Small Cap Growth | | $ | 141,682,579 | |
Small Cap Value | | | 119,491,329 | |
Qualified Dividend Income. For the fiscal year ended September 30, 2018, the Fund below will designate up to the maximum amount allowable pursuant to the Internal Revenue Code as qualified dividend income eligible for reduced tax rates. These lower rates range from 0% to 20% depending on an individual’s tax bracket. If the Fund pays a distribution during calendar year 2018, complete information will be reported in conjunction with Form 1099-DIV.
| 72
Trustee and Officer Information
The tables below provide certain information regarding the trustees and officers of Loomis Sayles Funds I and Loomis Sayles Funds II (the “Trusts”). Unless otherwise indicated, the address of all persons below is 888 Boylston Street, Suite 800, Boston, MA 02199-8197. The Funds’ Statement of Additional Information includes additional information about the trustees of the Trusts and is available by calling Loomis Sayles Funds at 800-633-3330.
| | | | | | | | |
| Name and Year of Birth | | Position(s) Held
with the Trusts,
Length of Time
Served and Term of Office1 | | Principal
Occupation(s)
During Past 5 Years | | Number of
Portfolios in
Fund Complex
Overseen2 and
Other
Directorships Held
During Past 5 Years | | Experience,
Qualifications,
Attributes, Skills
for Board
Membership |
|
| INDEPENDENT TRUSTEES |
| | | | |
Kenneth A. Drucker (1945) | | Chairperson of the Board of Trustees since January 2017 Trustee since 2008 Ex Officio member of Audit Committee, Contract Review Committee and Governance Committee | | Retired | | 51 None | | Significant experience on the Board and on the boards of other business organizations (including at investment companies); executive experience (including as treasurer of an aerospace, automotive, and metal manufacturing corporation) |
| | | | |
Edmond J. English (1953) | | Trustee since 2013 Audit Committee Member and Governance Committee Member | | Executive Chairman; formerly, Chief Executive Officer of Bob’s Discount Furniture (retail) | | 51 Director, Burlington Stores, Inc. (retail) | | Significant experience on the Board and significant experience on the boards of other business organizations (including retail companies and a bank); executive experience (including at a retail company) |
| | | | |
Richard A. Goglia (1951) | | Trustee since 2015 Audit Committee Member | | Retired; formerly Vice President and Treasurer of Raytheon Company (defense) | | 51 None | | Experience on the Board and executive experience (including his role as vice president and treasurer of a defense company and experience at a financial services company) |
73 |
Trustee and Officer Information – continued
| | | | | | | | |
| Name and Year of Birth | | Position(s) Held
with the Trusts,
Length of Time
Served and Term of Office1 | | Principal
Occupation(s)
During Past 5 Years | | Number of
Portfolios in
Fund Complex
Overseen2 and
Other
Directorships Held
During Past 5 Years | | Experience,
Qualifications,
Attributes, Skills
for Board
Membership |
|
| INDEPENDENT TRUSTEES – continued |
| | | | |
Wendell J. Knox (1948) | | Trustee since 2009 Contract Review Committee Member and Governance Committee Member | | Director of Abt Associates Inc. (research and consulting) | | 51 Director, Eastern Bank (bank); Director, The Hanover Insurance Group (property and casualty insurance) | | Significant experience on the Board and on the boards of other business organizations (including at a bank and at a property and casualty insurance firm); executive experience (including roles as president and chief executive officer of a research and consulting company) |
| | | | |
Martin T. Meehan (1956) | | Trustee since 2012 Audit Committee Member | | President, University of Massachusetts; formerly, Chancellor and faculty member, University of Massachusetts Lowell | | 51 None | | Significant experience on the Board and on the boards of other business organizations; experience as President of the University of Massachusetts; government experience (including as a member of the U.S. House of Representatives); academic experience |
| | | | |
Maureen B. Mitchell (1951) | | Trustee since 2017 Contract Review Committee Member | | Retired; formerly President, Global Sales and Marketing, GE Asset Management, Inc. (financial services) | | 51 Director, Sterling Bancorp (Bank) | | Experience on the Board and on the boards of other business organizations;; financial services industry and executive experience (including role as president of global sales and marketing at a financial services company) |
| 74
Trustee and Officer Information – continued
| | | | | | | | |
| Name and Year of Birth | | Position(s) Held
with the Trusts,
Length of Time
Served and Term of Office1 | | Principal
Occupation(s)
During Past 5 Years | | Number of
Portfolios in
Fund Complex
Overseen2 and
Other
Directorships Held
During Past 5 Years | | Experience,
Qualifications,
Attributes, Skills
for Board
Membership |
|
| INDEPENDENT TRUSTEES – continued |
| | | | |
James P. Palermo (1955) | | Trustee since 2016 Contract Review Committee Member | | Founding Partner, Breton Capital Management, LLC (private equity); Partner, STEP Partners, LLC (private equity); formerly, Chief Executive Officer of Global Client Management of The Bank of New York Mellon Corporation | | 51 Director, FutureFuel Corp. (Chemicals and Biofuels) | | Experience on the Board and on the boards of other business organizations; financial services industry and executive experience (including roles as chief executive officer of client management and asset servicing for a banking and financial services company) |
| | | | |
Erik R. Sirri (1958) | | Trustee since 2009 Chairperson of the Audit Committee | | Professor of Finance at Babson College | | 51 None | | Significant experience on the Board; experience as Director of the Division of Trading and Markets at the Securities and Exchange Commission; academic experience; training as an economist |
| | | | |
Peter J. Smail (1952) | | Trustee since 2009 Chairperson of the Contract Review Committee and Governance Committee Member | | Retired | | 51 None | | Significant experience on the Board; mutual fund industry and executive experience (including roles as president and chief executive officer for an investment adviser) |
| | | | |
Cynthia L. Walker (1956) | | Trustee since 2005 Chairperson of the Governance Committee and Audit Committee Member | | Deputy Dean for Finance and Administration, Yale University School of Medicine | | 51 None | | Significant experience on the Board; executive experience in a variety of academic organizations (including roles as dean for finance and administration) |
75 |
Trustee and Officer Information – continued
| | | | | | | | |
| Name and Year of Birth | | Position(s) Held
with the Trusts,
Length of Time
Served and Term of Office1 | | Principal
Occupation(s)
During Past 5 Years | | Number of
Portfolios in
Fund Complex
Overseen2 and
Other
Directorships Held
During Past 5 Years | | Experience,
Qualifications,
Attributes, Skills
for Board
Membership |
|
| INTERESTED TRUSTEES |
| | | | |
Kevin P. Charleston3 (1965) One Financial Center Boston, MA 02111 | | Trustee since 2015 President and Chief Executive Officer of Loomis Sayles Funds I since 2015 | | President, Chief Executive Officer and Chairman of the Board of Directors; formerly, Chief Financial Officer, Loomis, Sayles & Company, L.P. | | 51 None | | Experience on the Board; continuing service as President, Chief Executive Officer and Chairman of the Board of Directors of Loomis, Sayles & Company, L.P. |
| | | | |
David L. Giunta4
(1965) | | Trustee since 2011 President of Loomis Sayles Funds II and Executive Vice President of Loomis Sayles Funds I since 2008; Chief Executive Officer of Loomis Sayles Funds II since 2015 | | President and Chief Executive Officer, Natixis Advisors, L.P., Natixis Distribution, L.P., Natixis Distribution Corporation and Chairman of the Board of Natixis Distribution Corporation | | 51 None | | Significant experience on the Board; experience as President and Chief Executive Officer, Natixis Advisors, L.P., Natixis Distribution, L.P., Natixis Distribution Corporation and Chairman of the Board of Natixis Distribution Corporation |
| 1 | Each trustee serves until retirement, resignation or removal from the Board. The current retirement age is 75. The position of Chairperson of the Board is appointed for a three-year term. |
| 2 | The trustees of the Trusts serve as trustees of a fund complex that includes all series of the Natixis Funds Trust I, Natixis Funds Trust II, Natixis Funds Trust IV, Gateway Trust, Loomis Sayles Funds I and Loomis Sayles Funds II and Natixis ETF Trust (collectively, the “Fund Complex”). |
| 3 | Mr. Charleston is deemed an “interested person” of the Trusts because he holds the following positions with an affiliated person of the Trusts: President, Chief Executive Officer and Chairman of the Board of Directors of Loomis, Sayles & Company, L.P. |
| 4 | Mr. Giunta is deemed an “interested person” of the Trusts because he holds the following positions with an affiliated person of the Trusts: President and Chief Executive Officer, Natixis Advisors, L.P., Natixis Distribution, L.P., Natixis Distribution Corporation and Chairman of the Board of Natixis Distribution Corporation. |
| 76
Trustee and Officer Information – continued
| | | | | | |
| Name and Year of Birth | | Position(s) Held with
the Trusts | | Term of Office1 and
Length of Time Served | | Principal Occupation(s)
During Past 5 Years2 |
|
| OFFICERS OF THE TRUSTS |
| | | |
Daniel J. Fuss (1933) One Financial Center Boston, MA 02111 | | Executive Vice President | | Since 2003 | | Vice Chairman and Director, Loomis, Sayles & Company, L.P. |
| | | |
Russell L. Kane (1969) | | Secretary, Clerk and Chief Legal Officer | | Since 2016 | | Executive Vice President, General Counsel, Secretary and Clerk, Natixis Distribution Corporation, Natixis Advisors, L.P. and Natixis Distribution, L.P.; formerly, Chief Compliance Officer for Mutual Funds, Senior Vice President, Deputy General Counsel, Assistant Secretary and Assistant Clerk, Natixis Distribution Corporation, Natixis Advisors, L.P. and Natixis Distribution, L.P. |
| | | |
Michael C. Kardok (1959) | | Treasurer, Principal Financial and Accounting Officer | | Since 2004 | | Senior Vice President, Natixis Advisors, L.P. and Natixis Distribution, L.P. |
| | | |
Rosa Licea-Mailloux (1976) | | Chief Compliance Officer, Assistant Secretary and Anti-Money Laundering Officer | | Since 2016 | | Senior Vice President, Deputy General Counsel, Assistant Secretary and Assistant Clerk, Natixis Distribution Corporation, Natixis Advisors, L.P. and Natixis Distribution, L.P.; formerly, Associate General Counsel, Natixis Distribution, L.P. |
| 1 | Each officer of the Trusts serves for an indefinite term in accordance with the Trusts’ current by-laws until the date his or her successor is elected and qualified, or until he or she sooner dies, retires, is removed or becomes disqualified. |
| 2 | Each person listed above, except as noted, holds the same position(s) with the Fund Complex. Previous positions during the past five years with Natixis Distribution, L.P., Natixis Advisors, L.P. or Loomis, Sayles & Company, L.P. are omitted, if not materially different from an officer’s current position with such entity. |
77 |


Annual Report
September 30, 2018
Loomis Sayles High Income Fund
Loomis Sayles Intermediate Duration Bond Fund
Loomis Sayles Limited Term Government and Agency Fund
Table of Contents

LOOMIS SAYLES HIGH INCOME FUND
| | |
| Managers | | Symbols |
| Matthew J. Eagan, CFA® | | Class A NEFHX |
| Elaine M. Stokes | | Class C NEHCX |
| Loomis, Sayles & Company, L.P. | | Class N LSHNX |
| | Class Y NEHYX |
Investment Goal
The Fund seeks high current income plus the opportunity for capital appreciation to produce a high total return.
Market Conditions
Healthy economic indicators, including strong gross domestic product growth and low unemployment, characterized the 12 months ending September 30, 2018. Inflation was generally stable, trending close to the Federal Reserve’s (Fed’s) 2% target rate. Bolstered by these factors, the Fed met expectations and undertook a steady pace of rate increases. This contributed to US interest rates remaining well ahead of those of other developed economies, where monetary policies were more accommodative. Against this backdrop, ongoing US trade negotiations, particularly with China, and other geopolitical issues represented a developing risk.
US interest rates moved higher during the period, especially along the shorter end of the yield curve (a curve that shows the relationship among bond yields across the maturity spectrum). US Treasuries with maturities along the short end of the curve showed more modest losses than those with longer maturities, where declines were fairly steep.
Investment grade corporate bonds posted negative returns, though they outperformed Treasuries of similar duration (price sensitivity to interest rate changes). Spreads (the difference in yield between non-Treasury and Treasury securities of similar maturity) generally widened, and the sector’s relatively longer duration weighed on returns as yields rose.
High yield corporate bonds posted positive returns, supported by investor demand for income and relatively shorter duration. Notably, gains in the CCC-rated tier of the market made it the top-performing quality tier by a significant margin.
Despite some upward movement in yields, several developed economy government bond markets remained at a disadvantage relative to the US from an income-generating perspective. The US dollar posted strong performance relative to other developed and emerging market currencies, particularly in the latter half of the period. US dollar strength eroded returns for emerging market debt investors.
Performance Results
For the 12 months ended September 30, 2018, Class Y shares of the Loomis Sayles High Income Fund returned 1.68% at net asset value. The Fund underperformed its benchmark, the Bloomberg Barclays U.S. Corporate High-Yield Bond Index, which returned 3.05%.
1 |
Explanation of Fund Performance
The Fund’s allocation to emerging market credit acted as a constraint versus the benchmark. An allocation to non-US-dollar-denominated issues had the largest negative impact on relative performance, with holdings denominated in the Argentine peso and Mexican peso being the worst performers within the sector.
The Fund’s allocation to convertible securities contributed positively to performance relative to the benchmark, with holdings of consumer non-cyclical names in particular bolstering return. In addition, allocations to equity and securitized markets both had a positive impact on relative return. Contributions within securitized markets were led by exposure to asset-backed securities and non-agency mortgage-backed securities.
Outlook
Our key investment themes are centered on our outlook for steady growth and inflation conditions. While ongoing trade negotiations raise uncertainty about global growth and pose a risk to our outlook, indicators in the United States, including manufacturing activity, business and consumer sentiment, spending, and employment, remain positive for the US economy. This leads us to expect modest improvement in US GDP growth over the next year and relatively stable inflation. Treasury yields have been increasing, and we expect this trend to continue at a modest pace. For this reason, we think it is important to maintain less interest rate sensitivity in the portfolio.
Lower inventories and strong demand have pushed oil prices higher over the past year and raised expectations for higher inflation. We expect inflation to increase at a steady pace that keeps the Fed on its gradual track toward normalizing monetary policy.
We have shifted to a more defensive profile within the portfolio and are holding higher reserves in the form of cash and short-maturity US Treasury debt to maintain flexibility. However, we have maintained our exposure to investment grade and high yield corporate bonds. We believe the environment for risk assets should remain favorable and there is further upside in the credit sectors given the outlook for continued profit growth, earnings growth and the low probability of defaults or economic recession. As we remain in an extended late expansion phase of the credit cycle,1 we continue to be highly selective with a keen focus on undervalued issues that have solid fundamentals.
We continue to expect low default rates and low default losses from the high yield market over the next 12 to 18 months. Leverage is elevated, but interest coverage ratios (the ability to pay interest on outstanding debt) remain strong. At present, we expect technical factors to support high yield as coupon income is reinvested. We are concerned about the potential effects of a trade war on risk appetite. However, the high yield sector is typically less sensitive to trade issues; it tends to have fewer multinational and more smaller-capitalization companies than the investment grade sector.
We believe convertible bonds are still attractive in this late-cycle environment. We are very price sensitive in this sector, but believe it remains supported by strong corporate earnings and a positive US economic backdrop.
| 2
LOOMIS SAYLES HIGH INCOME FUND
We believe the portfolio is well-positioned, with broad diversification, a lower risk profile and substantial liquidity built into its holdings. We are closely monitoring risk factors that may introduce market volatility and intend to use any dislocation as a buying opportunity in areas with supportive fundamentals.
Effective November 1, 2018, the Fund’s principal investment strategies will be amended and the Fund’s fiscal year-end will change from September 30 to December 31. The Fund will no longer invest in non-US dollar denominated bonds or equity securities, among other changes. These changes are intended to eliminate the volatility associated with currency and equity allocations and address the variability of the Fund’s monthly ordinary income distributions. Additionally, Brian Kennedy and Todd Vandam will be added to the team to serve alongside Elaine Stokes and Matt Eagan, who have co-managed the Fund for over a decade.
| 1 | A credit cycle is a cyclical pattern that follows credit availability and corporate health. |
Hypothetical Growth of $100,000 Investment in Class Y Shares3
September 30, 2008 through September 30, 2018
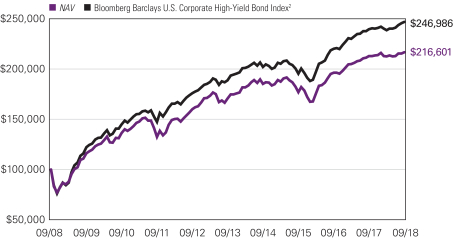
3 |
Average Annual Total Returns — September 30, 20183
| | | | | | | | | | | | | | | | | | | | | | | | |
| | | | | | | | | | | | | | | Expense Ratios4 | |
| | | 1 Year | | | 5 Years | | | 10 Years | | | Life of
Class N | | | Gross | | | Net | |
| | | | | | | |
| Class Y (Inception 2/29/08) | | | | | | | | | | | | | | | | | | | | | | | | |
| NAV | | | 1.68 | % | | | 4.90 | % | | | 8.03 | % | | | — | % | | | 0.90 | % | | | 0.80 | % |
| | | | | | | |
| Class A (Inception 2/22/84) | | | | | | | | | | | | | | | | | | | | | | | | |
| NAV | | | 1.41 | | | | 4.62 | | | | 7.77 | | | | — | | | | 1.15 | | | | 1.05 | |
| With 4.25% Maximum Sales Charge | | | -2.82 | | | | 3.73 | | | | 7.30 | | | | — | | | | | | | | | |
| | | | | | | |
| Class C (Inception 3/2/98) | | | | | | | | | | | | | | | | | | | | | | | | |
| NAV | | | 0.86 | | | | 3.87 | | | | 7.00 | | | | — | | | | 1.90 | | | | 1.80 | |
| With CDSC1 | | | -0.11 | | | | 3.87 | | | | 7.00 | | | | — | | | | | | | | | |
| | | | | | | |
| Class N (Inception 11/30/16) | | | | | | | | | | | | | | | | | | | | | | | | |
| NAV | | | 1.96 | | | | — | | | | — | | | | 5.93 | | | | 31.73 | | | | 0.75 | |
| | | | | | | |
| Comparative Performance | | | | | | | | | | | | | | | | | | | | | | | | |
| Bloomberg Barclays U.S. Corporate High-Yield Bond Index2 | | | 3.05 | | | | 5.54 | | | | 9.46 | | | | 6.54 | | | | | | | | | |
Performance data shown represents past performance and is no guarantee of, and not necessarily indicative of, future results. Total return and value will vary, and you may have a gain or loss when shares are sold. Current performance may be lower or higher than quoted. For most recent month-end performance, visit im.natixis.com. Performance for other share classes will be greater or less than shown based on differences in fees and sales charges. You may not invest directly in an index. Performance for periods less than one year is cumulative, not annualized. Returns reflect changes in share price and reinvestment of dividends and capital gains, if any. The table(s) do not reflect taxes shareholders might owe on any fund distributions or when they redeem their shares.
| 1 | Class C shares performance assumes a 1% CDSC applied when you sell shares within one year of purchase. |
| 2 | The Bloomberg Barclays U.S. Corporate High-Yield Bond Index measures the market of USD-denominated, non-investment grade, fixed-rate, taxable corporate bonds. Securities are classified as high yield if the middle rating of Moody’s, Fitch, and S&P is Ba1/BB /BB or below, excluding emerging market debt. The Bloomberg Barclays U.S. Corporate High-Yield Bond Index was created in 1986, with history backfilled to July 1, 1983, and rolls up into the Bloomberg Barclays U.S. Universal and Global High-Yield Indices. |
| 3 | Fund performance has been increased by fee waivers and/or expense reimbursements, if any, without which performance would have been lower. |
| 4 | Expense ratios are as shown in the Fund’s prospectus in effect as of the date of this report. The expense ratios for the current reporting period can be found in the Financial Highlights section of this report under Ratios to Average Net Assets. Net expenses reflect contractual expense caps set to expire on 1/31/19. When a Fund’s expenses are below the cap, gross and net expense ratios will be the same. See Note 6 of the Notes to Financial Statements for more information about the Fund’s expense caps. |
| 4
LOOMIS SAYLES INTERMEDIATE DURATION BOND FUND
| | |
| Managers | | Symbols |
| Christopher T. Harms | | Class A LSDRX |
| Clifton V. Rowe, CFA® | | Class C LSCDX |
| Kurt L. Wagner, CFA®, CIC | | Class Y LSDIX |
Investment Goal
The Fund’s investment objective is above-average total return through a combination of current income and capital appreciation.
Market Conditions
Healthy economic indicators, including strong gross domestic product growth, low unemployment and a favorable inflation rate, characterized the 12 months ending September 30, 2018. Bolstered by these factors, the Federal Reserve (Fed) met expectations and undertook a steady pace of rate increases. This contributed to US interest rates remaining well ahead of those of other developed economies, where monetary policies were more accommodative. Against this backdrop, ongoing US trade negotiations, particularly with China, and other geopolitical issues represented a developing risk.
US interest rates moved higher during the period, especially along the shorter end of the yield curve (a curve that shows the relationship among bond yields across the maturity spectrum). US Treasuries with maturities along the short end of the curve showed more modest losses than those with longer maturities, where declines were fairly steep.
Investment grade corporate bonds posted negative returns, though they outperformed Treasuries of similar duration (price sensitivity to interest rate changes). Spreads (the difference in yield between non-Treasuries and Treasury securities of similar maturity) generally widened, and the sector’s relatively longer duration weighed on returns as yields rose.
Securitized assets outperformed duration-matched Treasuries, though the rise in the short end of the US yield curve limited total returns. Within the sector, the best performers were commercial mortgage-backed securities (CMBS) and residential mortgage-backed securities (RMBS), followed by asset-backed securities (ABS).
Performance Results
For the 12 months ended September 30, 2018, Class Y shares of the Loomis Sayles Intermediate Duration Bond Fund returned -0.60% at net asset value. The Fund held up better than its benchmark, the Bloomberg Barclays U.S. Intermediate Government/Credit Bond Index, which returned -0.96%.
Explanation of Fund Performance
The Fund’s positioning was tilted toward risk assets during the period, as securities with additional compensation above risk-free rates fared well. The largest contributors to performance included an underweight to US Treasuries, as well as exposures to corporate
5 |
bonds and securitized assets such as ABS and CMBS. Within the corporate bond sector, the Fund benefited from exposures to the banking, consumer non-cyclical and technology industries.
Exposures that detracted from performance included an underweight to the government-related segment, a relative underweight in the energy industry and adverse security selection within consumer cyclicals. As a note — roughly one-third of the impact of Treasuries came from futures positions, with the remaining impact coming from cash securities.
Outlook
We believe that the Fed will tighten monetary conditions in a gradual and measured way as aggregate demand remains healthy, with another hike likely coming in December 2018.
Corporate fundamentals continue to indicate the United States is in the late expansion phase of the credit cycle,1 with slowing margin growth, increased mergers and acquisitions and rising leverage. Our view is that the cycle will continue to evolve slowly. Asset classes like corporate credit are supported by US tax reform and fiscal stimulus from the Trump administration. Corporate credit remains in demand due to a need for yield, fundamentals like improving corporate earnings, and technical factors such as lower bond supply. We continue to favor corporate credit over risk-free assets. We believe the primary risks to the credit markets include the pace of global growth, the timing of Fed tightening, increasing concerns about a protracted trade war and a significant uptick in inflation.
We remain underweight government bonds, given low yields, and continue to favor sectors offering higher yield potential than Treasuries.
We continue to be modestly overweight credit. We are focused on security selection opportunities, buying new issues with concessions and secondary bonds that can potentially offer favorable risk/return profiles. We believe valuations in CMBS are fair. We remain overweight to the sector, particularly senior parts of the capital stack.
We think valuations in mortgage-backed securities (MBS) have improved and are becoming more interesting. We are focused on securities with limited prepayment risk. The high-quality ABS sector remains attractive relative to government bonds. Specifically, we believe auto loans and credit card receivables remain attractive.
We have been maintaining a higher yield and exposure to more credit-sensitive sectors relative to the benchmark. We continue to monitor our portfolio and diversify our holdings with an eye toward minimizing undue exposure to macro and/or issuer events. We believe high yield issuers will continue to experience low default rates, and we are maintaining holdings in selected names that appear to offer value.
| 1 | A credit cycle is a cyclical pattern that follows credit availability and corporate health. |
| 6
LOOMIS SAYLES INTERMEDIATE DURATION BOND FUND
Hypothetical Growth of $100,000 Investment in Class Y Shares1,4,5
September 30, 2008 through September 30, 2018
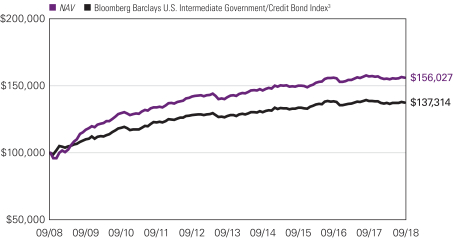
7 |
Average Annual Total Returns — September 30, 20184,5
| | | | | | | | | | | | | | | | | | | | |
| | | | | |
| | | | | | | | | | | | Expense Ratios6 | |
| | | 1 Year | | | 5 Years | | | 10 Years | | | Gross | | | Net | |
| | | | | | |
| Class Y (Inception 1/28/98)1 | | | | | | | | | | | | | | | | | | | | |
| NAV | | | -0.60 | % | | | 1.99 | % | | | 4.55 | % | | | 0.47 | % | | | 0.40 | % |
| | | | | | |
| Class A (Inception 5/28/10)1 | | | | | | | | | | | | | | | | | | | | |
| NAV | | | -0.85 | | | | 1.71 | | | | 4.29 | | | | 0.72 | | | | 0.65 | |
| With 4.25% Maximum Sales Charge | | | -5.10 | | | | 0.83 | | | | 3.84 | | | | | | | | | |
| | | | | | |
| Class C (Inception 8/31/16)1 | | | | | | | | | | | | | | | | | | | | |
| NAV | | | -1.71 | | | | 0.92 | | | | 3.40 | | | | 1.48 | | | | 1.40 | |
| With CDSC2 | | | -2.68 | | | | 0.92 | | | | 3.40 | | | | | | | | | |
| | | | | | |
| Comparative Performance | | | | | | | | | | | | | | | | | | | | |
Bloomberg Barclays U.S. Intermediate Government/Credit Bond Index3 | | | -0.96 | | | | 1.52 | | | | 3.22 | | | | | | | | | |
Performance data shown represents past performance and is no guarantee of, and not necessarily indicative of, future results. Total return and value will vary, and you may have a gain or loss when shares are sold. Current performance may be lower or higher than quoted. For most recent month-end performance, visit im.natixis.com. Performance for other share classes will be greater or less than shown based on differences in fees and sales charges. You may not invest directly in an index. Performance for periods less than one year is cumulative, not annualized. Returns reflect changes in share price and reinvestment of dividends and capital gains, if any. The table(s) do not reflect taxes shareholders might owe on any fund distributions or when they redeem their shares.
| 1 | Effective August 31, 2016, the Fund’s Retail Class shares and Institutional Class shares were redesignated as Class A shares and Class Y shares, respectively. Accordingly, the returns shown in the table for Class A shares prior to August 31, 2016 are those of Retail Class shares, restated to reflect the sales loads of Class A shares, and the returns in the table for Class Y shares prior to August 31, 2016 are those of Institutional Class shares. Prior to the inception of Retail Class shares (May 28, 2010), performance is that of Institutional Class shares, restated to reflect the higher net expenses and sales loads of Class A shares. Prior to the inception of Class C shares (August 31, 2016), performance is that of Retail Class shares, restated to reflect the higher net expenses and sales loads of Class C shares. |
| 2 | Class C shares performance assumes a 1% CDSC applied when you sell shares within one year of purchase. |
| 3 | The Bloomberg Barclays U.S. Intermediate Government/Credit Bond Index includes securities in the intermediate maturity range with in the Government and Credit Indices. The Government Index includes treasuries (i.e., public obligations of the U.S. Treasury that have remaining maturities of more than one year) and agencies (i.e., publicly issued debt of U.S. Government agencies, quasi-federal corporations, and corporate or foreign debt guaranteed by the U.S. Government). The Credit Index includes publicly issued U.S. corporate and foreign debentures and secured notes that meet specified maturity, liquidity, and quality requirements. |
| 4 | The Fund revised its investment strategy on May 28, 2010; performance may have been different had the current investment strategy been in place for all periods shown. |
| 5 | Fund performance has been increased by fee waivers and/or expense reimbursements, if any, without which performance would have been lower. |
| 6 | Expense ratios are as shown in the Fund’s prospectus in effect as of the date of this report. The expense ratios for the current reporting period can be found in the Financial Highlights section of this report under Ratios to Average Net Assets. Net expenses reflect contractual expense caps set to expire on 1/31/19. When a Fund’s expenses are below the cap, gross and net expense ratios will be the same. See Note 6 of the Notes to Financial Statements for more information about the Fund’s expense caps. |
| 8
LOOMIS SAYLES LIMITED TERM GOVERNMENT AND AGENCY FUND
| | |
| Managers | | Symbols |
| Christopher T. Harms | | Class A NEFLX |
| Clifton V. Rowe, CFA® | | Class C NECLX |
| Kurt L. Wagner, CFA®, CIC | | Class N LGANX |
| Loomis, Sayles & Company, L.P. | | Class Y NELYX |
Investment Goal
The Fund seeks a high current return consistent with preservation of capital.
Market Conditions
Healthy economic indicators, including strong gross domestic product growth, low unemployment and a favorable inflation rate, characterized the 12 months ending September 30, 2018. Bolstered by these factors, the Federal Reserve (Fed) met expectations and undertook a steady pace of rate increases. This contributed to US interest rates remaining well ahead of those of other developed economies, where monetary policies were more accommodative. Against this backdrop, ongoing US trade negotiations, particularly with China, and other geopolitical issues represented a developing risk.
US interest rates moved higher during the period, especially along the shorter end of the yield curve (a curve that shows the relationship among bond yields across the maturity spectrum). Treasuries with maturities along the short end of the curve showed more modest losses than those with longer maturities, where declines were fairly steep.
Securitized assets outperformed duration-matched Treasuries (duration refers to a security’s price sensitivity to interest rate changes), though the rise in the short end of the US yield curve limited total returns. Within the sector, the best performers were commercial mortgage-backed securities (CMBS) and residential mortgage-backed securities (RMBS), followed by asset-backed securities (ABS).
Performance Results
For the 12 months ended September 30, 2018, Class Y shares of the Loomis Sayles Limited Term Government and Agency Fund returned 0.09% at net asset value. The Fund held up better than its benchmark, the Bloomberg Barclays U.S. 1-5 Year Government Bond Index, which returned -0.61%.
Explanation of Fund Performance
Security selection and yield curve positioning were the main drivers of the Fund’s outperformance relative to the benchmark for the 12-month period. A position in agency collateralized mortgage obligations (CMOs) aided relative performance, as these securities strongly outperformed Treasuries of comparable duration over the period. Security selection within agency pass-through mortgage-backed securities (MBS) and agency CMBS also contributed positively to performance.
9 |
Among detractors, the Fund’s holdings in agency debentures (bonds issued by federal agencies or government-sponsored enterprises to finance their activities) had a slight negative impact on relative performance. Security selection within US Treasuries also weighed slightly on return.
Outlook
Agency MBS spreads (the difference in yield between agency MBS and Treasuries of similar maturity) are narrow relative to history. Mortgages issued in recent years are relatively high quality compared with those issued in prior years. Therefore, we favor an underweight to recently issued 30-year MBS and prefer sectors less likely to face refinancing and extension risk, such as low loan balance mortgages and home equity conversion mortgages.
Within the commercial real estate sector, top-tier assets and markets have generally recovered and are at or above prior peak levels. We believe investment grade CMBS remain attractive.
We believe ABS currently offer an attractive combination of strong credit quality and enhanced yield. We favor higher-yielding securities and bonds of less frequent issuers. Our analysis indicates the credit risk of these securities is inefficiently priced and they offer potentially attractive opportunities for additional yield.
Hypothetical Growth of $100,000 Investment in Class Y Shares3
September 30, 2008 through September 30, 2018
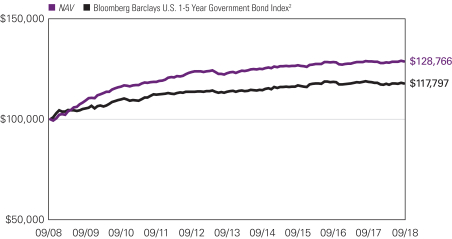
See notes to chart on page 11.
| 10
LOOMIS SAYLES LIMITED TERM GOVERNMENT AND AGENCY FUND
Average Annual Total Returns — September 30, 20183
| | | | | | | | | | | | | | | | | | | | | | | | |
| | | | | | | | | | | | | | | Expense Ratios4 | |
| | | 1 Year | | | 5 Years | | | 10 Years | | | Life of
Class N | | | Gross | | | Net | |
| | | | | | | |
| Class Y (Inception 3/31/94) | | | | | | | | | | | | | | | | | | | | | | | | |
| NAV | | | 0.09 | % | | | 0.94 | % | | | 2.56 | % | | | — | % | | | 0.55 | % | | | 0.55 | % |
| | | | | | | |
| Class A (Inception 1/3/89) | | | | | | | | | | | | | | | | | | | | | | | | |
| NAV | | | -0.17 | | | | 0.68 | | | | 2.29 | | | | — | | | | 0.80 | | | | 0.80 | |
| With 2.25% Maximum Sales Charge | | | -2.41 | | | | 0.22 | | | | 2.06 | | | | — | | | | | | | | | |
| | | | | | | |
| Class C (Inception 12/30/94) | | | | | | | | | | | | | | | | | | | | | | | | |
| NAV | | | -0.91 | | | | -0.07 | | | | 1.53 | | | | — | | | | 1.55 | | | | 1.55 | |
| With CDSC1 | | | -1.89 | | | | -0.07 | | | | 1.53 | | | | — | | | | | | | | | |
| | | | | | | |
| Class N (Inception 2/1/17) | | | | | | | | | | | | | | | | | | | | | | | | |
| NAV | | | 0.09 | | | | — | | | | — | | | | 0.73 | | | | 0.50 | | | | 0.47 | |
| | | | | | | |
| Comparative Performance | | | | | | | | | | | | | | | | | | | | | | | | |
Bloomberg Barclays U.S. 1-5 Year Government Bond Index2 | | | -0.61 | | | | 0.71 | | | | 1.65 | | | | 0.20 | | | | | | | | | |
Performance data shown represents past performance and is no guarantee of, and not necessarily indicative of, future results. Total return and value will vary, and you may have a gain or loss when shares are sold. Current performance may be lower or higher than quoted. For most recent month-end performance, visit im.natixis.com. Performance for other share classes will be greater or less than shown based on differences in fees and sales charges. You may not invest directly in an index. Performance for periods less than one year is cumulative, not annualized. Returns reflect changes in share price and reinvestment of dividends and capital gains, if any. The table(s) do not reflect taxes shareholders might owe on any fund distributions or when they redeem their shares.
| 1 | Class C shares performance assumes a 1% CDSC applied when you sell shares within one year of purchase. |
| 2 | The Bloomberg Barclays U.S. 1-5 Year Government Bond Index is a subindex of the Bloomberg Barclays U.S. Government Index, which is composed of the Bloomberg Barclays U.S. Treasury and U.S. Agency Indices. The Bloomberg Barclays U.S. Government Index includes Treasuries (public obligations of the U.S. Treasury that have remaining maturities of more than one year) and U.S. agency debentures (publicly issued debt of U.S. government agencies, quasi-federal corporations, and corporate or foreign debt guaranteed by the U.S. government). The Bloomberg Barclays U.S. Government Index is a component of the Bloomberg Barclays U.S. Government/Credit Index and the Bloomberg Barclays U.S. Aggregate Index. |
| 3 | Fund performance has been increased by fee waivers and/or expense reimbursements, if any, without which performance would have been lower. |
| 4 | Expense ratios are as shown in the Fund’s prospectus in effect as of the date of this report. The expense ratios for the current reporting period can be found in the Financial Highlights section of this report under Ratios to Average Net Assets. Net expenses reflect contractual expense caps set to expire on 1/31/19. When a Fund’s expenses are below the cap, gross and net expense ratios will be the same. See Note 6 of the Notes to Financial Statements for more information about the Fund’s expense caps. |
11 |
ADDITIONAL INFORMATION
The views expressed in this report reflect those of the portfolio managers as of the dates indicated. The managers’ views are subject to change at any time without notice based on changes in market or other conditions. References to specific securities or industries should not be regarded as investment advice. Because the Funds are actively managed, there is no assurance that they will continue to invest in the securities or industries mentioned.
All investing involves risk, including the risk of loss. There is no assurance that any investment will meet its performance objectives or that losses will be avoided.
ADDITIONAL INDEX INFORMATION
This document may contain references to third party copyrights, indexes, and trademarks, each of which is the property of its respective owner. Such owner is not affiliated with Natixis Investment Managers or any of its related or affiliated companies (collectively “Natixis Affiliates”) and does not sponsor, endorse or participate in the provision of any Natixis Affiliates services, funds or other financial products.
The index information contained herein is derived from third parties and is provided on an “as is” basis. The user of this information assumes the entire risk of use of this information. Each of the third party entities involved in compiling, computing or creating index information disclaims all warranties (including, without limitation, any warranties of originality, accuracy, completeness, timeliness, non-infringement, merchantability and fitness for a particular purpose) with respect to such information.
PROXY VOTING INFORMATION
A description of the Natixis Funds’ proxy voting policies and procedures is available without charge, upon request, by calling Natixis Funds at 800-225-5478; on the Natixis Funds’ website at im.natixis.com; and on the Securities and Exchange Commission’s (“SEC’s”) website at www.sec.gov. Information regarding how the funds voted proxies relating to portfolio securities the most recent 12-month period ended June 30 is available from the Natixis Funds’ website and the SEC’s website.
QUARTERLY PORTFOLIO SCHEDULES
The Natixis Funds file complete schedules of portfolio holdings with the SEC for the first and third quarters of each fiscal year on Form N-Q. The Funds’ Forms N-Q are available on the SEC’s website at www.sec.gov and may be reviewed and copied at the SEC’s Public Reference Room in Washington, DC. Information on the operation of the Public Reference Room may be obtained by calling 800-SEC-0330.
| 12
UNDERSTANDING FUND EXPENSES
As a mutual fund shareholder, you incur different costs: transaction costs, including sales charges (loads) on purchases and contingent deferred sales charges on redemptions, and ongoing costs, including management fees, distribution and/or service fees (12b-1 fees), and other fund expenses. Certain exemptions may apply. These costs are described in more detail in the Funds’ prospectuses. The following examples are intended to help you understand the ongoing costs of investing in the Funds and help you compare these with the ongoing costs of investing in other mutual funds.
The first line in the table of each class of Fund shares shows the actual account values and actual Fund expenses you would have paid on a $1,000 investment in the Fund from April 1, 2018 through September 30, 2018. To estimate the expenses you paid over the period, simply divide your account value by $1,000 (for example $8,600 account value divided by $1,000 = 8.6) and multiply the result by the number in the Expenses Paid During Period column as shown below for your class.
The second line in the table of each class of Fund shares provides information about hypothetical account values and hypothetical expenses based on the Fund’s actual expense ratios and an assumed rate of return of 5% per year before expenses, which is not the Fund’s actual return. The hypothetical account values and expenses may not be used to estimate the actual ending account balance or expenses you paid on your investment for the period. You may use this information to compare the ongoing costs of investing in the Fund to other funds. To do so, compare this 5% hypothetical example with the 5% hypothetical examples that appear in the shareholder reports of the other funds.
Please note that the expenses shown reflect ongoing costs only, and do not include any transaction costs, such as sales charges. Therefore, the second line in the table of each fund is useful in comparing ongoing costs only, and will not help you determine the relative costs of owning different funds. If transaction costs were included, total costs would be higher.
13 |
| | | | | | | | | | | | |
| LOOMIS SAYLES HIGH INCOME FUND | | BEGINNING
ACCOUNT VALUE
4/1/2018 | | | ENDING
ACCOUNT VALUE
9/30/2018 | | | EXPENSES PAID
DURING PERIOD*
4/1/2018 – 9/30/2018 | |
| Class A | | | | | | | | | | | | |
| Actual | | | $1,000.00 | | | | $1,016.90 | | | | $5.31 | |
| Hypothetical (5% return before expenses) | | | $1,000.00 | | | | $1,019.80 | | | | $5.32 | |
| Class C | | | | | | | | | | | | |
| Actual | | | $1,000.00 | | | | $1,015.30 | | | | $9.09 | |
| Hypothetical (5% return before expenses) | | | $1,000.00 | | | | $1,016.04 | | | | $9.10 | |
| Class N | | | | | | | | | | | | |
| Actual | | | $1,000.00 | | | | $1,018.60 | | | | $3.80 | |
| Hypothetical (5% return before expenses) | | | $1,000.00 | | | | $1,021.31 | | | | $3.80 | |
| Class Y | | | | | | | | | | | | |
| Actual | | | $1,000.00 | | | | $1,018.30 | | | | $4.05 | |
| Hypothetical (5% return before expenses) | | | $1,000.00 | | | | $1,021.06 | | | | $4.05 | |
| * | Expenses are equal to the Fund’s annualized expense ratio (after waiver/reimbursement): 1.05%, 1.80%, 0.75% and 0.80% for Class A, C, N and Y, respectively, multiplied by the average account value over the period, multiplied by the number of days in the most recent fiscal half-year (183), divided by 365 (to reflect the half-year period). |
| | | | | | | | | | | | |
LOOMIS SAYLES INTERMEDIATE
DURATION BOND FUND | | BEGINNING
ACCOUNT VALUE
4/1/2018 | | | ENDING
ACCOUNT VALUE
9/30/2018 | | | EXPENSES PAID
DURING PERIOD*
4/1/2018 – 9/30/2018 | |
| Class A | | | | | | | | | | | | |
| Actual | | | $1,000.00 | | | | $1,002.40 | | | | $3.26 | |
| Hypothetical (5% return before expenses) | | | $1,000.00 | | | | $1,021.81 | | | | $3.29 | |
| Class C | | | | | | | | | | | | |
| Actual | | | $1,000.00 | | | | $998.50 | | | | $7.01 | |
| Hypothetical (5% return before expenses) | | | $1,000.00 | | | | $1,018.05 | | | | $7.08 | |
| Class Y | | | | | | | | | | | | |
| Actual | | | $1,000.00 | | | | $1,004.60 | | | | $2.01 | |
| Hypothetical (5% return before expenses) | | | $1,000.00 | | | | $1,023.06 | | | | $2.03 | |
| * | Expenses are equal to the Fund’s annualized expense ratio (after waiver/reimbursement): 0.65%, 1.40% and 0.40% for Class A, C and Y, respectively, multiplied by the average account value over the period, multiplied by the number of days in the most recent fiscal half-year (183), divided by 365 (to reflect the half-year period). |
| 14
| | | | | | | | | | | | |
LOOMIS SAYLES LIMITED TERM
GOVERNMENT AND AGENCY FUND | | BEGINNING
ACCOUNT VALUE
4/1/2018 | | | ENDING
ACCOUNT VALUE
9/30/2018 | | | EXPENSES PAID
DURING PERIOD*
4/1/2018 – 9/30/2018 | |
| Class A | | | | | | | | | | | | |
| Actual | | | $1,000.00 | | | | $1,002.20 | | | | $4.02 | |
| Hypothetical (5% return before expenses) | | | $1,000.00 | | | | $1,021.06 | | | | $4.05 | |
| Class C | | | | | | | | | | | | |
| Actual | | | $1,000.00 | | | | $998.40 | | | | $7.77 | |
| Hypothetical (5% return before expenses) | | | $1,000.00 | | | | $1,017.30 | | | | $7.84 | |
| Class N | | | | | | | | | | | | |
| Actual | | | $1,000.00 | | | | $1,003.00 | | | | $2.31 | |
| Hypothetical (5% return before expenses) | | | $1,000.00 | | | | $1,022.76 | | | | $2.33 | |
| Class Y | | | | | | | | | | | | |
| Actual | | | $1,000.00 | | | | $1,003.50 | | | | $2.76 | |
| Hypothetical (5% return before expenses) | | | $1,000.00 | | | | $1,022.31 | | | | $2.79 | |
| * | Expenses are equal to the Fund’s annualized expense ratio (after waiver/reimbursement): 0.80%, 1.55%, 0.46% and 0.55% for Class A, C, N and Y, respectively, multiplied by the average account value over the period, multiplied by the number of days in the most recent fiscal half-year (183), divided by 365 (to reflect the half-year period). |
15 |
BOARD APPROVAL OF THE EXISTING ADVISORY AGREEMENTS
The Board of Trustees of the Trusts (the “Board”), including the Independent Trustees, considers matters bearing on each Fund’s advisory agreement (collectively, the “Agreements”) at most of its meetings throughout the year. Each year, usually in the spring, the Contract Review Committee of the Board meets to review the Agreements to determine whether to recommend that the full Board approve the continuation of the Agreements, typically for an additional one-year period. After the Contract Review Committee has made its recommendation, the full Board, including the Independent Trustees, determines whether to approve the continuation of the Agreements.
In connection with these meetings, the Trustees receive materials that the Funds’ investment adviser (the “Adviser”) believes to be reasonably necessary for the Trustees to evaluate the Agreements. These materials generally include, among other items, (i) information on the investment performance of the Funds and the performance of peer groups of funds and the Funds’ performance benchmarks, (ii) information on the Funds’ advisory fees and other expenses, including information comparing the Funds’ advisory fees to the fees charged to institutional accounts with similar strategies managed by the Adviser, if any, and to those of peer groups of funds and information about any applicable expense caps and/or fee “breakpoints,” (iii) sales and redemption data in respect of the Funds, (iv) information about the profitability of the Agreements to the Adviser and (v) information obtained through the completion by the Adviser of a questionnaire distributed on behalf of the Trustees. The Board, including the Independent Trustees, also considers other matters such as (i) the Adviser’s financial results and financial condition, (ii) each Fund’s investment objective and strategies and the size, education and experience of the Adviser’s investment staff and its use of technology, external research and trading cost measurement tools, (iii) arrangements in respect of the distribution of the Funds’ shares and the related costs, (iv) the allocation of the Funds’ brokerage, if any, including, to the extent applicable, the use of “soft” commission dollars to pay for research and other similar services, (v) the resources devoted to, and the record of compliance with, the Funds’ investment policies and restrictions, policies on personal securities transactions and other compliance policies, (vi) each Adviser’s policies and procedures relating to, among other things, compliance, trading and best execution, proxy voting and valuation, (vii) information about amounts invested by the Funds’ portfolio managers in the Funds or in similar accounts that they manage and (viii) the general economic outlook with particular emphasis on the mutual fund industry. Throughout the process, the Trustees are afforded the opportunity to ask questions of and request additional materials from the Adviser.
In addition to the materials requested by the Trustees in connection with their annual consideration of the continuation of the Agreements, the Trustees receive materials in advance of each regular quarterly meeting of the Board that provide detailed information about the Funds’ investment performance and the fees charged to the Funds for advisory and other services. This information generally includes, among other things, an internal performance rating for each Fund based on agreed-upon criteria, graphs showing each Fund’s performance and expense differentials against each Fund’s peer group/category of
| 16
funds, performance ratings provided by a third-party, total return information for various periods, and third-party performance rankings for various periods comparing a Fund against similarly categorized funds. The portfolio management team for each Fund or other representatives of the Adviser make periodic presentations to the Contract Review Committee and/or the full Board, and Funds identified as presenting possible performance concerns may be subject to more frequent Board or Committee presentations and reviews. In addition, each quarter the Trustees are provided with detailed statistical information about each Fund’s portfolio. The Trustees also receive periodic updates between meetings.
The Board most recently approved the continuation of the Agreements for a one-year period at its meeting held in June 2018. In considering whether to approve the continuation of the Agreements, the Board, including the Independent Trustees, did not identify any single factor as determinative. Individual Trustees may have evaluated the information presented differently from one another, giving different weights to various factors. Matters considered by the Trustees, including the Independent Trustees, in connection with their approval of the Agreements included, but were not limited to, the factors listed below.
The nature, extent and quality of the services provided to the Funds under the Agreements. The Trustees considered the nature, extent and quality of the services provided by the Adviser and its affiliates to the Funds and the resources dedicated to the Funds by the Adviser and its affiliates.
The Trustees considered not only the advisory services provided by the Adviser to the Funds, but also the monitoring and oversight services provided by Natixis Advisors, L.P. (“Natixis Advisors”). They also considered the administrative and shareholder services provided by Natixis Advisors and its affiliates to the Funds.
For each Fund, the Trustees also considered the benefits to shareholders of investing in a mutual fund that is part of a family of funds that offers shareholders the right to exchange shares of one type of fund for shares of another type of fund, and provides a variety of fund and shareholder services.
After reviewing these and related factors, the Trustees concluded, within the context of their overall conclusions regarding each of the Agreements, that the nature, extent and quality of services provided supported the renewal of the Agreements.
Investment performance of the Funds and the Adviser. As noted above, the Trustees received information about the performance of the Funds over various time periods, including information that compared the performance of the Funds to the performance of peer groups and categories of funds and the Funds’ respective performance benchmarks. In addition, the Trustees reviewed data prepared by an independent third party that analyzed the performance of the Funds using a variety of performance metrics, including metrics that measured the performance of the Funds on a risk adjusted basis.
17 |
The Board noted that through December 31, 2017, each Fund’s one-, three- and five-year performance, stated as percentile rankings within categories selected by the independent third-party data provider was as follows (where the best performance would be in the first percentile of its category):
| | | | | | | | | | | | |
| | | One-Year | | | Three-Year | | | Five-Year | |
Loomis Sayles High Income Fund | | | 29 | % | | | 60 | % | | | 50 | % |
Loomis Sayles Intermediate Duration Bond Fund | | | 92 | % | | | 79 | % | | | 79 | % |
Loomis Sayles Limited Term Government and Agency Fund | | | 15 | % | | | 20 | % | | | 17 | % |
In the case of each Fund that had performance that lagged that of a relevant category group median as determined by the independent third-party for certain (although not necessarily all) periods, the Board concluded that other factors relevant to performance supported renewal of the Agreements, including: (1) that the underperformance was attributable, to a significant extent, to investment decisions (such as security selection or sector allocation) by the Adviser that were reasonable and consistent with the Fund’s investment objective and policies; and (2) that the Fund’s more recent performance, although lagging in certain periods, had shown improvement relative to its category; and (3) the Fund had outperformed its relevant performance benchmark.
The Trustees also considered the Adviser’s performance and reputation generally, the performance of the fund family generally, and the historical responsiveness of the Adviser to Trustee concerns about performance and the willingness of the Adviser to take steps intended to improve performance.
After reviewing these and related factors, the Trustees concluded, within the context of their overall conclusions regarding each of the Agreements, that the performance of the Funds and the Adviser and/or other relevant factors supported the renewal of the Agreements.
The costs of the services to be provided and profits to be realized by the Adviser and its affiliates from their respective relationships with the Funds. The Trustees considered the fees charged to the Funds for advisory and administrative services as well as the total expense levels of the Funds. This information included comparisons (provided both by management and by an independent third party) of the Funds’ advisory fees and total expense levels to those of their peer groups and information about the advisory fees charged by the Adviser to comparable accounts (such as institutional separate accounts), as well as information about differences in such fees and the reasons for any such differences. In considering the fees charged to comparable accounts, the Trustees considered, among other things, management’s representations about the differences between managing mutual funds as compared to other types of accounts, including the additional resources required to effectively manage mutual fund assets and the greater regulatory costs associated with the management of such assets. In evaluating each Fund’s advisory fee, the Trustees also took into account the demands, complexity and quality of the investment management of such Fund, as well as the need for the Adviser to offer competitive compensation and the potential need to expend additional resources to the extent the Fund grows in size. The Trustees considered that over the past several years, management had made recommendations regarding reductions in advisory fee rates, implementation of advisory
| 18
fee breakpoints and the institution of advisory fee waivers and expense caps for various funds in the fund family. They noted that all of the Funds have expense caps in place, and they considered the amounts waived or reimbursed by the Adviser for certain Funds under their caps. The Trustees considered that the current expenses of the Loomis Sayles Limited Term Government and Agency Fund are at its cap. The Trustees noted that the total advisory fee rates for the Funds were at or below the medians of their respective peer group of funds.
The Trustees also considered the compensation directly or indirectly received by the Adviser and its affiliates from their relationships with the Funds. The Trustees reviewed information provided by management as to the profitability of the Adviser’s and its affiliates’ relationships with the Funds, and information about the allocation of expenses used to calculate profitability. They also reviewed information provided by management about the effect of distribution costs and changes in asset levels on Adviser profitability, including information regarding resources spent on distribution activities. When reviewing profitability, the Trustees also considered information about court cases in which adviser compensation or profitability were issues, the performance of the Funds, the expense levels of the Funds, whether the Adviser had implemented breakpoints and/or expense caps with respect to such Funds and the overall profit margin of Natixis Investment Managers compared to that of certain other investment managers for which such data was available.
After reviewing these and related factors, the Trustees concluded, within the context of their overall conclusions regarding each of the Agreements, that the advisory fee charged to each of the Funds was fair and reasonable, and that the costs of these services generally and the related profitability of the Adviser and its affiliates in respect of their relationships with the Funds supported the renewal of the Agreements.
Economies of Scale. The Trustees considered the existence of any economies of scale in the provision of services by the Adviser and whether those economies are shared with the Funds through breakpoints in their investment advisory fees or other means, such as expense caps. The Trustees also discussed with management the factors considered with respect to the implementation of breakpoints in investment advisory fees or expense caps for certain funds. Management explained that a number of factors are taken into account in considering the possible implementation of breakpoints or an expense cap for a fund, including, among other things, factors such as a fund’s assets, the projected growth of a fund, projected profitability and a fund’s fees and performance. With respect to economies of scale, the Trustees noted that the Loomis Sayles Limited Term Government and Agency Fund had breakpoints in its advisory fee and that all of the Funds were subject to an expense cap. The Trustees also considered management’s proposal to reduce the Loomis Sayles High Income Fund’s expense cap last year. In considering these issues, the Trustees also took note of the costs of the services provided (both on an absolute and on a relative basis) and the profitability to the Adviser and its affiliates of their relationships with the Funds, as discussed above.
After reviewing these and related factors, the Trustees concluded, within the context of their overall conclusions regarding each of the Agreements, that the extent to which economies of scale were shared with the Funds supported the renewal of the Agreements.
19 |
The Trustees also considered other factors, which included but were not limited to the following:
| · | | The effect of recent market and economic events on the performance, asset levels and expense ratios of each Fund. |
| · | | Whether each Fund has operated in accordance with its investment objective and the Fund’s record of compliance with its investment restrictions, and the compliance programs of the Funds and the Adviser. They also considered the compliance-related resources the Adviser and its affiliates were providing to the Funds. |
| · | | So-called “fallout benefits” to the Adviser, such as the engagement of affiliates of the Adviser to provide distribution and administrative services to the Funds, and the benefits of research made available to the Adviser by reason of brokerage commissions (if any) generated by the Funds’ securities transactions. The Trustees also considered the benefits to the parent company of Natixis Advisors from the retention of the Adviser. The Trustees considered the possible conflicts of interest associated with these fallout and other benefits, and the reporting, disclosure and other processes in place to disclose and monitor such possible conflicts of interest. |
| · | | The Trustees’ review and discussion of the Funds’ advisory arrangements in prior years, and management’s record of responding to Trustee concerns raised during the year and in prior years. |
Based on their evaluation of all factors that they deemed to be material, including those factors described above, and assisted by the advice of independent counsel, the Trustees, including the Independent Trustees, concluded that each of the existing Agreements, should be continued through June 30, 2019.
| 20
Portfolio of Investments – as of September 30, 2018
Loomis Sayles High Income Fund
| | | | | | | | |
Principal
Amount (‡) | | | Description | | Value (†) | |
| | Bonds and Notes — 92.9% of Net Assets | |
| | Non-Convertible Bonds — 83.1% | |
| | | | ABS Home Equity — 1.3% | | | | |
| $ | 85,161 | | | Banc of America Alternative Loan Trust, Series 2003-8, Class 1CB1, 5.500%, 10/25/2033 | | $ | 86,781 | |
| | 95,513 | | | Banc of America Funding Trust, Series 2005-7, Class 3A1, 5.750%, 11/25/2035 | | | 100,259 | |
| | 62,004 | | | Banc of America Funding Trust, Series 2007-4, Class 5A1, 5.500%, 11/25/2034 | | | 62,210 | |
| | 760 | | | Countrywide Home Loan Mortgage Pass Through Trust, Series 2005-HYB7, Class 2A,
4.182%, 11/20/2035(a)(b)(c) | | | 683 | |
| | 192,046 | | | DSLA Mortgage Loan Trust, Series 2005-AR5, Class 2A1A, 1-month LIBOR + 0.330%, 2.498%, 9/19/2045(d) | | | 162,395 | |
| | 305,000 | | | Freddie Mac Structured Agency Credit Risk Debt Notes, Series 2015-DNA1, Class M3, 1-month LIBOR + 3.300%, 5.516%, 10/25/2027(d)(e) | | | 341,448 | |
| | 101,627 | | | GMAC Mortgage Corp. Loan Trust, Series 2005-AR4, Class 3A1, 4.309%, 7/19/2035(b) | | | 98,796 | |
| | 150,000 | | | Home Partners of America Trust, Series 2016-2, Class E, 1-month LIBOR + 3.780%,
5.938%, 10/17/2033, 144A(d) | | | 150,209 | |
| | 155,000 | | | Home Partners of America Trust, Series 2016-2, Class F, 1-month LIBOR + 4.700%,
6.858%, 10/17/2033, 144A(d) | | | 155,427 | |
| | 228,531 | | | MASTR Adjustable Rate Mortgages Trust, Series 2005-2, Class 3A1, 3.927%, 3/25/2035(b) | | | 225,035 | |
| | 232,502 | | | MASTR Adjustable Rate Mortgages Trust, Series 2005-2, Class 4A1, 3.523%, 3/25/2035(b) | | | 212,811 | |
| | 100,000 | | | RCO Mortgage LLC, Series 2017-1, Class A2, 5.125%, 8/25/2022, 144A(b) | | | 100,038 | |
| | 470,000 | | | VOLT LVI LLC, Series 2017-NPL3, Class A2, 5.875%, 3/25/2047, 144A(b) | | | 469,714 | |
| | | | | | | | |
| | | | | | | 2,165,806 | |
| | | | | | | | |
| | | | ABS Other — 0.3% | |
| | 190,892 | | | AIM Aviation Finance Ltd., Series 2015-1A, Class B1, 5.072%, 2/15/2040, 144A(b) | | | 188,725 | |
| | 238,655 | | | Wave LLC, Series 2017-1A, Class B, 5.682%, 11/15/2042, 144A | | | 241,179 | |
| | | | | | | | |
| | | | | | | 429,904 | |
| | | | | | | | |
| | | | Aerospace & Defense — 1.3% | |
| | 95,000 | | | Engility Corp., 8.875%, 9/01/2024 | | | 103,313 | |
| | 638,000 | | | Leonardo U.S. Holdings, Inc., 6.250%, 1/15/2040, 144A | | | 665,951 | |
| | 383,000 | | | Leonardo U.S. Holdings, Inc., 7.375%, 7/15/2039, 144A | | | 444,280 | |
| | 200,000 | | | TransDigm UK Holdings PLC, 6.875%, 5/15/2026, 144A | | | 205,250 | |
| | 845,000 | | | TransDigm, Inc., 6.500%, 7/15/2024 | | | 865,702 | |
| | | | | | | | |
| | | | | | | 2,284,496 | |
| | | | | | | | |
| | | | Airlines — 0.3% | |
| | 535,000 | | | Latam Finance Ltd., 6.875%, 4/11/2024, 144A | | | 519,619 | |
| | 32,352 | | | Virgin Australia Pass Through Certificates, Series 2013-1B, 6.000%, 4/23/2022, 144A | | | 32,820 | |
| | 21,674 | | | Virgin Australia Pass Through Certificates, Series 2013-1C, 7.125%, 10/23/2018, 144A | | | 21,573 | |
| | | | | | | | |
| | | | | | | 574,012 | |
| | | | | | | | |
See accompanying notes to financial statements.
21 |
Portfolio of Investments – as of September 30, 2018
Loomis Sayles High Income Fund – (continued)
| | | | | | | | |
Principal
Amount (‡) | | | Description | | Value (†) | |
| | | | Automotive — 1.2% | |
| $ | 195,000 | | | Allison Transmission, Inc., 5.000%, 10/01/2024, 144A | | $ | 194,025 | |
| | 285,000 | | | Dana Financing Luxembourg S.a.r.l., 5.750%, 4/15/2025, 144A | | | 279,927 | |
| | 115,000 | | | Goodyear Tire & Rubber Co. (The), 5.000%, 5/31/2026 | | | 108,129 | |
| | 240,000 | | | Goodyear Tire & Rubber Co. (The), 5.125%, 11/15/2023 | | | 240,000 | |
| | 880,000 | | | IHO Verwaltungs GmbH, PIK, 4.500%, 9/15/2023, 144A(f) | | | 851,497 | |
| | 420,000 | | | Midas Intermediate Holdco II LLC/Midas Intermediate Holdco II Finance, Inc., 7.875%, 10/01/2022, 144A | | | 371,700 | |
| | | | | | | | |
| | | | | | | 2,045,278 | |
| | | | | | | | |
| | | | Banking — 5.3% | |
| | 860,000 | | | Ally Financial, Inc., 4.125%, 2/13/2022 | | | 858,925 | |
| | 2,070,000 | | | Ally Financial, Inc., 4.625%, 3/30/2025 | | | 2,054,475 | |
| | 485,000 | | | Ally Financial, Inc., 5.750%, 11/20/2025 | | | 500,762 | |
| | 6,605,000 | | | Banco Hipotecario S.A., Argentina Deposit Rates Badlar Private Banks + 2.500%,
36.333%, 1/12/2020, 144A, (ARS)(d) | | | 136,027 | |
| | 6,270,000 | | | Banco Hipotecario S.A., Argentina Deposit Rates Badlar Private Banks + 4.000%,
46.750%, 11/07/2022, 144A, (ARS)(d) | | | 112,665 | |
| | 8,775,000 | | | Banco Macro S.A., 17.500%, 5/08/2022, 144A, (ARS) | | | 119,278 | |
| | 7,075,000 | | | Banco Supervielle S.A., Argentina Deposit Rates Badlar Private Banks + 4.500%,
39.125%, 8/09/2020, 144A, (ARS)(d) | | | 153,171 | |
| | 850,000 | | | Barclays PLC, 5.200%, 5/12/2026(e) | | | 835,177 | |
| | 1,195,000 | | | Commerzbank AG, 8.125%, 9/19/2023, 144A | | | 1,362,769 | |
| | 800,000 | | | Deutsche Bank AG, (fixed rate to 12/01/2027, variable rate thereafter), 4.875%, 12/01/2032 | | | 710,840 | |
| | 470,000 | | | Intesa Sanpaolo SpA, 5.017%, 6/26/2024, 144A | | | 424,121 | |
| | 495,000 | | | Intesa Sanpaolo SpA, 5.710%, 1/15/2026, 144A | | | 450,296 | |
| | 1,200,000 | | | Royal Bank of Scotland Group PLC, 6.125%, 12/15/2022 | | | 1,254,714 | |
| | | | | | | | |
| | | | | | | 8,973,220 | |
| | | | | | | | |
| | | | Brokerage — 0.3% | |
| | 535,000 | | | Jefferies Finance LLC/JFIN Co-Issuer Corp., 6.875%, 4/15/2022, 144A | | | 537,675 | |
| | | | | | | | |
| | | | Building Materials — 1.7% | |
| | 610,000 | | | Beacon Roofing Supply, Inc., 4.875%, 11/01/2025, 144A | | | 561,962 | |
| | 230,000 | | | Cemex SAB de CV, 5.700%, 1/11/2025, 144A | | | 234,025 | |
| | 350,000 | | | Cemex SAB de CV, 7.750%, 4/16/2026, 144A | | | 381,500 | |
| | 420,000 | | | James Hardie International Finance Ltd., 4.750%, 1/15/2025, 144A | | | 406,434 | |
| | 445,000 | | | James Hardie International Finance Ltd., 5.000%, 1/15/2028, 144A | | | 419,969 | |
| | 130,000 | | | Jeld-Wen, Inc., 4.625%, 12/15/2025, 144A | | | 119,925 | |
| | 160,000 | | | Jeld-Wen, Inc., 4.875%, 12/15/2027, 144A | | | 145,800 | |
| | 50,000 | | | Masco Corp., 6.500%, 8/15/2032 | | | 54,801 | |
| | 535,000 | | | U.S. Concrete, Inc., 6.375%, 6/01/2024 | | | 541,259 | |
| | | | | | | | |
| | | | | | | 2,865,675 | |
| | | | | | | | |
| | | | Cable Satellite — 7.0% | |
| | 795,000 | | | Altice Financing S.A., 6.625%, 2/15/2023, 144A | | | 800,962 | |
| | 475,000 | | | CCO Holdings LLC/CCO Holdings Capital Corp., 5.125%, 2/15/2023 | | | 476,781 | |
| | 625,000 | | | CCO Holdings LLC/CCO Holdings Capital Corp., 5.125%, 5/01/2023, 144A | | | 625,969 | |
| | 15,000 | | | CCO Holdings LLC/CCO Holdings Capital Corp., 5.750%, 1/15/2024 | | | 15,244 | |
See accompanying notes to financial statements.
| 22
Portfolio of Investments – as of September 30, 2018
Loomis Sayles High Income Fund – (continued)
| | | | | | | | |
Principal
Amount (‡) | | | Description | | Value (†) | |
| | | | Cable Satellite — continued | |
| $ | 865,000 | | | CCO Holdings LLC/CCO Holdings Capital Corp., 5.750%, 2/15/2026, 144A | | $ | 867,162 | |
| | 1,360,000 | | | CSC Holdings LLC, 5.500%, 4/15/2027, 144A | | | 1,319,200 | |
| | 75,000 | | | CSC Holdings LLC, 6.750%, 11/15/2021 | | | 79,031 | |
| | 355,000 | | | Sirius XM Radio, Inc., 5.000%, 8/01/2027, 144A | | | 341,585 | |
| | 800,000 | | | Telenet Finance Luxembourg Notes S.a.r.l., 5.500%, 3/01/2028, 144A | | | 756,512 | |
| | 1,485,000 | | | Unitymedia GmbH, 6.125%, 1/15/2025, 144A | | | 1,559,250 | |
| | 265,000 | | | Virgin Media Finance PLC, 6.000%, 10/15/2024, 144A | | | 265,180 | |
| | 309,000 | | | Virgin Media Finance PLC, 6.375%, 4/15/2023, 144A | | | 316,339 | |
| | 725,000 | | | Virgin Media Secured Finance PLC, 5.250%, 1/15/2021 | | | 744,031 | |
| | 375,000 | | | Virgin Media Secured Finance PLC, 5.500%, 1/15/2025, 144A | | | 375,000 | |
| | 3,575,000 | | | Ziggo BV, 5.500%, 1/15/2027, 144A | | | 3,354,244 | |
| | | | | | | | |
| | | | | | | 11,896,490 | |
| | | | | | | | |
| | | | Chemicals — 1.0% | |
| | 1,510,000 | | | Hercules LLC, 6.500%, 6/30/2029 | | | 1,525,100 | |
| | 245,000 | | | SASOL Financing USA LLC, 5.875%, 3/27/2024 | | | 249,636 | |
| | | | | | | | |
| | | | | | | 1,774,736 | |
| | | | | | | | |
| | | | Construction Machinery — 1.1% | |
| | 225,000 | | | Ashtead Capital, Inc., 4.125%, 8/15/2025, 144A | | | 213,750 | |
| | 245,000 | | | United Rentals North America, Inc., 4.625%, 7/15/2023 | | | 246,838 | |
| | 615,000 | | | United Rentals North America, Inc., 4.625%, 10/15/2025 | | | 596,550 | |
| | 15,000 | | | United Rentals North America, Inc., 5.500%, 5/15/2027 | | | 14,831 | |
| | 800,000 | | | United Rentals North America, Inc., 5.750%, 11/15/2024 | | | 823,040 | |
| | | | | | | | |
| | | | | | | 1,895,009 | |
| | | | | | | | |
| | | | Consumer Cyclical Services — 0.4% | |
| | 235,000 | | | IHS Markit Ltd., 4.000%, 3/01/2026, 144A | | | 224,866 | |
| | 350,000 | | | ServiceMaster Co. LLC (The), 7.450%, 8/15/2027 | | | 367,937 | |
| | | | | | | | |
| | | | | | | 592,803 | |
| | | | | | | | |
| | | | Consumer Products — 0.4% | |
| | 790,000 | | | Coty, Inc., 6.500%, 4/15/2026, 144A | | | 736,181 | |
| | | | | | | | |
| | | | Electric — 1.9% | |
| | 125,000 | | | AES Corp., 5.125%, 9/01/2027 | | | 126,250 | |
| | 850,000 | | | AES Corp. (The), 4.875%, 5/15/2023 | | | 857,437 | |
| | 479,000 | | | AES Corp. (The), 5.500%, 4/15/2025 | | | 490,582 | |
| | 150,000 | | | AES Corp. (The), 6.000%, 5/15/2026 | | | 158,063 | |
| | 1,502,000 | | | Enel SpA, (fixed rate to 9/24/2023, variable rate thereafter), 8.750%, 9/24/2073, 144A | | | 1,659,710 | |
| | | | | | | | |
| | | | | | | 3,292,042 | |
| | | | | | | | |
| | | | Environmental — 0.1% | |
| | 100,000 | | | GFL Environmental, Inc., 5.625%, 5/01/2022, 144A | | | 96,750 | |
| | | | | | | | |
| | | | Finance Companies — 3.6% | |
| | 1,055,000 | | | Aircastle Ltd., 4.125%, 5/01/2024 | | | 1,037,680 | |
| | 515,000 | | | Aircastle Ltd., 5.500%, 2/15/2022 | | | 535,300 | |
| | 120,000 | | | CIT Group, Inc., 4.125%, 3/09/2021 | | | 120,000 | |
| | 715,000 | | | CIT Group, Inc., 5.000%, 8/01/2023 | | | 729,371 | |
See accompanying notes to financial statements.
23 |
Portfolio of Investments – as of September 30, 2018
Loomis Sayles High Income Fund – (continued)
| | | | | | | | |
Principal
Amount (‡) | | | Description | | Value (†) | |
| | | | Finance Companies — continued | |
| $ | 120,000 | | | iStar, Inc., 4.625%, 9/15/2020 | | $ | 119,700 | |
| | 326,000 | | | iStar, Inc., 5.000%, 7/01/2019 | | | 326,546 | |
| | 395,000 | | | iStar, Inc., 5.250%, 9/15/2022 | | | 389,075 | |
| | 720,000 | | | Ladder Capital Finance Holdings LLLP/Ladder Capital Finance Corp., 5.250%, 10/01/2025, 144A | | | 676,800 | |
| | 255,000 | | | Ladder Capital Finance Holdings LLLP/Ladder Capital Finance Corp., 5.875%, 8/01/2021, 144A | | | 258,506 | |
| | 315,000 | | | Provident Funding Associates LP/PFG Finance Corp., 6.375%, 6/15/2025, 144A | | | 315,000 | |
| | 620,000 | | | Quicken Loans, Inc., 5.250%, 1/15/2028, 144A | | | 575,825 | |
| | 710,000 | | | Quicken Loans, Inc., 5.750%, 5/01/2025, 144A | | | 709,113 | |
| | 405,000 | | | Unifin Financiera SAB de CV SOFOM ENR, 7.250%, 9/27/2023, 144A | | | 400,205 | |
| | | | | | | | |
| | | | | | | 6,193,121 | |
| | | | | | | | |
| | | | Financial Other — 0.5% | |
| | 180,000 | | | Icahn Enterprises LP/Icahn Enterprises Finance Corp., 5.875%, 2/01/2022 | | | 182,250 | |
| | 565,000 | | | Icahn Enterprises LP/Icahn Enterprises Finance Corp., 6.000%, 8/01/2020 | | | 575,266 | |
| | 105,000 | | | Icahn Enterprises LP/Icahn Enterprises Finance Corp., 6.250%, 2/01/2022 | | | 107,625 | |
| | | | | | | | |
| | | | | | | 865,141 | |
| | | | | | | | |
| | | | Food & Beverage — 2.4% | |
| | 405,000 | | | BRF GmbH, 4.350%, 9/29/2026, 144A | | | 344,999 | |
| | 410,000 | | | BRF S.A., 4.750%, 5/22/2024, 144A | | | 373,100 | |
| | 840,000 | | | Cosan Luxembourg S.A., 7.000%, 1/20/2027, 144A | | | 824,233 | |
| | 330,000 | | | JBS USA LUX S.A./JBS USA Finance, Inc., 5.750%, 6/15/2025, 144A | | | 321,338 | |
| | 255,000 | | | JBS USA LUX S.A./JBS USA Finance, Inc., 7.250%, 6/01/2021, 144A | | | 258,825 | |
| | 385,000 | | | Marfrig Holdings Europe BV, Class B, 8.000%, 6/08/2023, 144A | | | 386,451 | |
| | 280,000 | | | Pilgrim’s Pride Corp., 5.750%, 3/15/2025, 144A | | | 269,500 | |
| | 540,000 | | | Pilgrim’s Pride Corp., 5.875%, 9/30/2027, 144A | | | 510,300 | |
| | 830,000 | | | Post Holdings, Inc., 5.750%, 3/01/2027, 144A | | | 813,400 | |
| | | | | | | | |
| | | | | | | 4,102,146 | |
| | | | | | | | |
| | | | Gaming — 1.6% | |
| | 175,000 | | | Boyd Gaming Corp., 6.375%, 4/01/2026 | | | 180,031 | |
| | 375,000 | | | GLP Capital LP/GLP Financing II, Inc., 5.375%, 4/15/2026 | | | 380,816 | |
| | 700,000 | | | International Game Technology PLC, 6.250%, 2/15/2022, 144A | | | 725,375 | |
| | 210,000 | | | MGM Growth Properties Operating Partnership LP / MGP Finance Co-Issuer, Inc., 4.500%, 1/15/2028 | | | 192,171 | |
| | 725,000 | | | MGM Resorts International, 6.000%, 3/15/2023 | | | 749,469 | |
| | 380,000 | | | MGM Resorts International, 7.750%, 3/15/2022 | | | 416,100 | |
| | | | | | | | |
| | | | | | | 2,643,962 | |
| | | | | | | | |
| | | | Government Owned – No Guarantee — 1.8% | |
| | 695,000 | | | Petrobras Global Finance BV, 5.625%, 5/20/2043 | | | 562,950 | |
| | 515,000 | | | Petrobras Global Finance BV, 5.750%, 2/01/2029 | | | 459,818 | |
| | 139,131(††) | | | Petroleos Mexicanos, 7.190%, 9/12/2024, 144A, (MXN)(e) | | | 641,457 | |
| | 121,278(††) | | | Petroleos Mexicanos, 7.470%, 11/12/2026, (MXN)(e) | | | 536,049 | |
| | 710,000 | | | YPF S.A., 6.950%, 7/21/2027, 144A | | | 621,037 | |
See accompanying notes to financial statements.
| 24
Portfolio of Investments – as of September 30, 2018
Loomis Sayles High Income Fund – (continued)
| | | | | | | | |
Principal
Amount (‡) | | | Description | | Value (†) | |
| | | | Government Owned – No Guarantee — continued | |
| $ | 510,000 | | | YPF S.A., Argentina Deposit Rates Badlar Private Banks + 4.000%, 36.750%, 7/07/2020, 144A(d) | | $ | 203,318 | |
| | | | | | | | |
| | | | | | | 3,024,629 | |
| | | | | | | | |
| | | | Health Insurance — 0.2% | |
| | 365,000 | | | Centene Corp., 6.125%, 2/15/2024 | | | 383,250 | |
| | | | | | | | |
| | | | Healthcare — 4.5% | |
| | 105,000 | | | HCA Healthcare, Inc., 6.250%, 2/15/2021 | | | 109,463 | |
| | 25,000 | | | HCA, Inc., 5.250%, 4/15/2025 | | | 25,781 | |
| | 260,000 | | | HCA, Inc., 5.375%, 2/01/2025 | | | 265,200 | |
| | 170,000 | | | HCA, Inc., 7.050%, 12/01/2027 | | | 182,325 | |
| | 655,000 | | | HCA, Inc., 7.500%, 12/15/2023 | | | 720,500 | |
| | 145,000 | | | HCA, Inc., 7.500%, 11/06/2033 | | | 157,163 | |
| | 590,000 | | | HCA, Inc., 7.690%, 6/15/2025 | | | 659,325 | |
| | 480,000 | | | HCA, Inc., 8.360%, 4/15/2024 | | | 546,000 | |
| | 820,000 | | | HCA, Inc., MTN, 7.580%, 9/15/2025 | | | 912,250 | |
| | 515,000 | | | HCA, Inc., MTN, 7.750%, 7/15/2036 | | | 561,350 | |
| | 275,000 | | | Hologic, Inc., 4.375%, 10/15/2025, 144A | | | 263,483 | |
| | 315,000 | | | Hologic, Inc., 4.625%, 2/01/2028, 144A | | | 296,494 | |
| | 200,000 | | | IQVIA, Inc., 5.000%, 10/15/2026, 144A | | | 196,500 | |
| | 800,000 | | | Polaris Intermediate Corp., PIK, 8.500%, 12/01/2022, 144A(f) | | | 826,592 | |
| | 390,000 | | | Tenet Healthcare Corp., 5.125%, 5/01/2025 | | | 384,150 | |
| | 180,000 | | | Tenet Healthcare Corp., 6.875%, 11/15/2031 | | | 161,136 | |
| | 830,000 | | | Tenet Healthcare Corp., 7.500%, 1/01/2022, 144A | | | 866,312 | |
| | 430,000 | | | Wright Medical Group, Inc., 1.625%, 6/15/2023, 144A | | | 454,456 | |
| | | | | | | | |
| | | | | | | 7,588,480 | |
| | | | | | | | |
| | | | Home Construction — 2.2% | |
| | 1,200,000 | | | Corporacion GEO SAB de CV, 8.875%, 3/27/2022, 144A(a)(c)(g)(h) | | | 12 | |
| | 750,000 | | | K. Hovnanian Enterprises, Inc., 5.000%, 11/01/2021 | | | 670,027 | |
| | 305,000 | | | Lennar Corp., 4.125%, 1/15/2022 | | | 301,950 | |
| | 800,000 | | | Lennar Corp., 4.750%, 5/30/2025 | | | 780,000 | |
| | 1,130,000 | | | PulteGroup, Inc., 5.500%, 3/01/2026 | | | 1,124,350 | |
| | 915,000 | | | TRI Pointe Group, Inc./TRI Pointe Homes, Inc., 4.375%, 6/15/2019 | | | 919,575 | |
| | | | | | | | |
| | | | | | | 3,795,914 | |
| | | | | | | | |
| | | | Independent Energy — 9.0% | |
| | 460,000 | | | Aker BP ASA, 5.875%, 3/31/2025, 144A | | | 474,950 | |
| | 335,000 | | | Aker BP ASA, 6.000%, 7/01/2022, 144A | | | 345,469 | |
| | 202,000 | | | Ascent Resources Utica Holdings LLC/ARU Finance Corp., 10.000%, 4/01/2022, 144A | | | 227,250 | |
| | 685,000 | | | Baytex Energy Corp., 5.625%, 6/01/2024, 144A | | | 654,175 | |
| | 240,000 | | | Bruin E&P Partners LLC, 8.875%, 8/01/2023, 144A | | | 247,200 | |
| | 90,000 | | | California Resources Corp., 5.500%, 9/15/2021 | | | 82,899 | |
| | 41,000 | | | California Resources Corp., 6.000%, 11/15/2024 | | | 34,850 | |
| | 460,000 | | | California Resources Corp., 8.000%, 12/15/2022, 144A | | | 439,300 | |
| | 140,000 | | | Callon Petroleum Co., 6.125%, 10/01/2024 | | | 142,450 | |
| | 153,000 | | | Chesapeake Energy Corp., 4.875%, 4/15/2022 | | | 148,601 | |
See accompanying notes to financial statements.
25 |
Portfolio of Investments – as of September 30, 2018
Loomis Sayles High Income Fund – (continued)
| | | | | | | | |
Principal
Amount (‡) | | | Description | | Value (†) | |
| | | | Independent Energy — continued | |
| $ | 8,000 | | | Chesapeake Energy Corp., 5.750%, 3/15/2023 | | $ | 7,790 | |
| | 13,000 | | | Chesapeake Energy Corp., 6.125%, 2/15/2021 | | | 13,325 | |
| | 34,000 | | | Chesapeake Energy Corp., 6.625%, 8/15/2020 | | | 35,530 | |
| | 795,000 | | | CNX Resources Corp., 5.875%, 4/15/2022 | | | 795,238 | |
| | 645,000 | | | Continental Resources, Inc., 3.800%, 6/01/2024 | | | 632,527 | |
| | 235,000 | | | Continental Resources, Inc., 4.500%, 4/15/2023 | | | 239,136 | |
| | 376,000 | | | Continental Resources, Inc., 5.000%, 9/15/2022 | | | 381,452 | |
| | 690,000 | | | Eclipse Resources Corp., 8.875%, 7/15/2023 | | | 702,075 | |
| | 595,000 | | | Gulfport Energy Corp., 6.375%, 5/15/2025 | | | 583,100 | |
| | 265,000 | | | Gulfport Energy Corp., 6.375%, 1/15/2026 | | | 257,713 | |
| | 202,000 | | | Halcon Resources Corp., 6.750%, 2/15/2025 | | | 193,920 | |
| | 605,000 | | | Matador Resources Co., 5.875%, 9/15/2026, 144A | | | 612,562 | |
| | 410,000 | | | MEG Energy Corp., 6.375%, 1/30/2023, 144A | | | 373,100 | |
| | 1,250,000 | | | MEG Energy Corp., 6.500%, 1/15/2025, 144A | | | 1,237,500 | |
| | 585,000 | | | MEG Energy Corp., 7.000%, 3/31/2024, 144A | | | 533,812 | |
| | 185,000 | | | Newfield Exploration Co., 5.625%, 7/01/2024 | | | 194,944 | |
| | 592,000 | | | Oasis Petroleum, Inc., 6.875%, 3/15/2022 | | | 602,348 | |
| | 210,000 | | | PDC Energy, Inc., 5.750%, 5/15/2026 | | | 199,500 | |
| | 205,000 | | | PDC Energy, Inc., 6.125%, 9/15/2024 | | | 201,669 | |
| | 1,150,000 | | | Rex Energy Corp., 8.000%, 10/01/2020(g) | | | 310,500 | |
| | 330,000 | | | Sanchez Energy Corp., 6.125%, 1/15/2023 | | | 188,100 | |
| | 755,000 | | | Sanchez Energy Corp., 7.250%, 2/15/2023, 144A | | | 743,675 | |
| | 685,000 | | | Seven Generations Energy Ltd., 5.375%, 9/30/2025, 144A | | | 666,162 | |
| | 175,000 | | | Seven Generations Energy Ltd., 6.875%, 6/30/2023, 144A | | | 181,125 | |
| | 920,000 | | | SM Energy Co., 5.000%, 1/15/2024 | | | 895,850 | |
| | 27,000 | | | SM Energy Co., 6.125%, 11/15/2022 | | | 27,810 | |
| | 45,000 | | | SM Energy Co., 6.625%, 1/15/2027 | | | 46,519 | |
| | 190,000 | | | SM Energy Co., 6.750%, 9/15/2026 | | | 197,363 | |
| | 395,000 | | | Southwestern Energy Co., 6.200%, 1/23/2025 | | | 392,037 | |
| | 285,000 | | | Southwestern Energy Co., 7.500%, 4/01/2026 | | | 298,538 | |
| | 405,000 | | | Whiting Petroleum Corp., 5.750%, 3/15/2021 | | | 415,125 | |
| | 50,000 | | | Whiting Petroleum Corp., 6.250%, 4/01/2023 | | | 51,758 | |
| | 355,000 | | | Whiting Petroleum Corp., 6.625%, 1/15/2026 | | | 369,200 | |
| | | | | | | | |
| | | | | | | 15,378,147 | |
| | | | | | | | |
| | | | Integrated Energy — 0.2% | |
| | 200,000 | | | Geopark Ltd., 6.500%, 9/21/2024, 144A | | | 201,408 | |
| | 200,000 | | | Hunt Oil Co. of Peru LLC Sucursal Del Peru, 6.375%, 6/01/2028, 144A | | | 205,760 | |
| | | | | | | | |
| | | | | | | 407,168 | |
| | | | | | | | |
| | | | Life Insurance — 0.2% | |
| | 340,000 | | | CNO Financial Group, Inc., 5.250%, 5/30/2025 | | | 347,650 | |
| | | | | | | | |
| | | | Local Authorities — 0.5% | |
| | 325,000 | | | Provincia de Buenos Aires, 6.500%, 2/15/2023, 144A | | | 284,297 | |
| | 270,000 | | | Provincia de Buenos Aires, 7.875%, 6/15/2027, 144A | | | 224,508 | |
| | 16,365,000 | | | Provincia de Buenos Aires, Argentina Deposit Rates Badlar Private Banks + 3.750%, 41.144%, 4/12/2025, (ARS)(d) | | | 349,519 | |
See accompanying notes to financial statements.
| 26
Portfolio of Investments – as of September 30, 2018
Loomis Sayles High Income Fund – (continued)
| | | | | | | | |
Principal
Amount (‡) | | | Description | | Value (†) | |
| | | | Local Authorities — continued | |
| | 2,390,000 | | | Provincia de Buenos Aires, Argentina Deposit Rates Badlar Private Banks + 3.830%, 45.780%, 5/31/2022, (ARS)(d) | | $ | 53,932 | |
| | | | | | | | |
| | | | | | | 912,256 | |
| | | | | | | | |
| | | | Lodging — 1.2% | |
| | 150,000 | | | Hilton Domestic Operating Co., Inc., 4.250%, 9/01/2024 | | | 145,170 | |
| | 755,000 | | | Hilton Worldwide Finance LLC/Hilton Worldwide Finance Corp., 4.625%, 4/01/2025 | | | 735,181 | |
| | 365,000 | | | Marriott Ownership Resorts, Inc., 6.500%, 9/15/2026, 144A | | | 374,636 | |
| | 820,000 | | | Wyndham Destinations, Inc., 5.625%, 3/01/2021 | | | 836,400 | |
| | | | | | | | |
| | | | | | | 2,091,387 | |
| | | | | | | | |
| | | | Media Entertainment — 3.2% | |
| | 890,000 | | | AMC Networks, Inc., 4.750%, 8/01/2025 | | | 851,063 | |
| | 1,155,000 | | | Clear Channel Worldwide Holdings, Inc., Series B, 6.500%, 11/15/2022 | | | 1,175,212 | |
| | 1,305,000 | | | Clear Channel Worldwide Holdings, Inc., Series B, 7.625%, 3/15/2020 | | | 1,308,262 | |
| | 1,115,000 | | | iHeartCommunications, Inc., 9.000%, 12/15/2019(g) | | | 839,038 | |
| | 395,000 | | | Meredith Corp., 6.875%, 2/01/2026, 144A | | | 404,875 | |
| | 890,000 | | | Netflix, Inc., 4.875%, 4/15/2028, 144A | | | 836,600 | |
| | | | | | | | |
| | | | | | | 5,415,050 | |
| | | | | | | | |
| | | | Metals & Mining — 1.5% | |
| | 190,000 | | | Commercial Metals Co., 4.875%, 5/15/2023 | | | 188,404 | |
| | 400,000 | | | First Quantum Minerals Ltd., 6.500%, 3/01/2024, 144A | | | 366,000 | |
| | 625,000 | | | First Quantum Minerals Ltd., 7.000%, 2/15/2021, 144A | | | 617,969 | |
| | 670,000 | | | First Quantum Minerals Ltd., 7.250%, 5/15/2022, 144A | | | 655,763 | |
| | 850,000 | | | Gerdau Trade, Inc., 4.875%, 10/24/2027, 144A | | | 789,284 | |
| | | | | | | | |
| | | | | | | 2,617,420 | |
| | | | | | | | |
| | | | Midstream — 3.9% | |
| | 820,000 | | | DCP Midstream Operating LP, 4.750%, 9/30/2021, 144A | | | 832,300 | |
| | 1,265,000 | | | Hess Infrastructure Partners LP/Hess Infrastructure Partners Finance Corp., 5.625%, 2/15/2026, 144A | | | 1,277,650 | |
| | 570,000 | | | NGL Energy Partners LP/NGL Energy Finance Corp., 5.125%, 7/15/2019 | | | 572,844 | |
| | 200,000 | | | NGL Energy Partners LP/NGL Energy Finance Corp., 6.125%, 3/01/2025 | | | 187,500 | |
| | 135,000 | | | NGL Energy Partners LP/NGL Energy Finance Corp., 6.875%, 10/15/2021 | | | 137,525 | |
| | 405,000 | | | NGL Energy Partners LP/NGL Energy Finance Corp., 7.500%, 11/01/2023 | | | 405,000 | |
| | 165,000 | | | NGPL PipeCo LLC, 4.375%, 8/15/2022, 144A | | | 166,237 | |
| | 700,000 | | | NGPL PipeCo LLC, 4.875%, 8/15/2027, 144A | | | 696,500 | |
| | 385,000 | | | SemGroup Corp./Rose Rock Finance Corp., 5.625%, 7/15/2022 | | | 382,112 | |
| | 935,000 | | | Summit Midstream Holdings LLC/Summit Midstream Finance Corp., 5.500%, 8/15/2022 | | | 931,494 | |
| | 95,000 | | | Targa Resources Partners LP/Targa Resources Partners Finance Corp., 4.250%, 11/15/2023 | | | 92,744 | |
| | 640,000 | | | Targa Resources Partners LP/Targa Resources Partners Finance Corp., 5.250%, 5/01/2023 | | | 647,200 | |
| | 305,000 | | | Transportadora de Gas del Sur S.A., 6.750%, 5/02/2025, 144A | | | 292,779 | |
| | | | | | | | |
| | | | | | | 6,621,885 | |
| | | | | | | | |
See accompanying notes to financial statements.
27 |
Portfolio of Investments – as of September 30, 2018
Loomis Sayles High Income Fund – (continued)
| | | | | | | | |
Principal
Amount (‡) | | | Description | | Value (†) | |
| | | | Non-Agency Commercial Mortgage-Backed Securities — 0.9% | |
| $ | 100,000 | | | CG-CCRE Commercial Mortgage Trust, Series 2014-FL2, Class COL1, 1-month LIBOR + 3.500%, 5.658%, 11/15/2031, 144A(d)(h)(i) | | $ | 95,584 | |
| | 225,000 | | | CG-CCRE Commercial Mortgage Trust, Series 2014-FL2, Class COL2, 1-month LIBOR + 4.500%, 6.658%, 11/15/2031, 144A(d)(h)(i) | | | 210,428 | |
| | 1,020,000 | | | Credit Suisse Mortgage Trust, Series 2014-USA, Class E, 4.373%, 9/15/2037, 144A | | | 913,181 | |
| | 111,701 | | | GS Mortgage Securities Trust, Series 2007-GG10, Class AM, 5.977%, 8/10/2045(b) | | | 113,174 | |
| | 18,435 | | | JPMorgan Chase Commercial Mortgage Securities Trust, Series 2007-LDPX, Class AM, 5.464%, 1/15/2049(b) | | | 18,468 | |
| | 125,000 | | | WFRBS Commercial Mortgage Trust, Series 2012-C7, Class E, 4.977%, 6/15/2045, 144A(b) | | | 102,994 | |
| | | | | | | | |
| | | | | | | 1,453,829 | |
| | | | | | | | |
| | | | Oil Field Services — 1.5% | |
| | 430,000 | | | Ensco PLC, 5.750%, 10/01/2044 | | | 321,425 | |
| | 160,000 | | | Noble Holding International Ltd., 5.250%, 3/15/2042 | | | 115,500 | |
| | 160,000 | | | Noble Holding International Ltd., 6.050%, 3/01/2041 | | | 122,600 | |
| | 420,000 | | | Noble Holding International Ltd., 7.750%, 1/15/2024 | | | 416,850 | |
| | 530,000 | | | Noble Holding International Ltd., 7.875%, 2/01/2026, 144A | | | 549,875 | |
| | 405,000 | | | Shelf Drilling Holdings Ltd., 8.250%, 2/15/2025, 144A | | | 417,656 | |
| | 175,000 | | | Transocean Guardian Ltd., 5.875%, 1/15/2024, 144A | | | 176,531 | |
| | 238,000 | | | Transocean Proteus Ltd., 6.250%, 12/01/2024, 144A | | | 242,165 | |
| | 175,000 | | | Transocean, Inc., 7.500%, 1/15/2026, 144A | | | 180,688 | |
| | | | | | | | |
| | | | | | | 2,543,290 | |
| | | | | | | | |
| | | | Packaging — 1.0% | |
| | 200,000 | | | ARD Finance S.A., PIK, 7.125%, 9/15/2023(f) | | | 201,500 | |
| | 395,000 | | | Ardagh Packaging Finance PLC/Ardagh MP Holdings USA, Inc., 4.625%, 5/15/2023, 144A | | | 391,050 | |
| | 200,000 | | | Ardagh Packaging Finance PLC/Ardagh MP Holdings USA, Inc., 7.250%, 5/15/2024, 144A | | | 209,250 | |
| | 610,000 | | | Berry Global, Inc., 4.500%, 2/15/2026, 144A | | | 579,500 | |
| | 350,000 | | | Crown Americas LLC/Crown Americas Capital Corp., 4.750%, 2/01/2026, 144A | | | 334,250 | |
| | | | | | | | |
| | | | | | | 1,715,550 | |
| | | | | | | | |
| | | | Paper — 0.2% | |
| | 440,000 | | | Klabin Finance S.A., 4.875%, 9/19/2027, 144A | | | 391,600 | |
| | | | | | | | |
| | | | Pharmaceuticals — 1.6% | |
| | 265,000 | | | Bausch Health Cos., Inc., 5.500%, 3/01/2023, 144A | | | 255,063 | |
| | 85,000 | | | Bausch Health Cos., Inc., 5.625%, 12/01/2021, 144A | | | 84,681 | |
| | 990,000 | | | Bausch Health Cos., Inc., 5.875%, 5/15/2023, 144A | | | 965,250 | |
| | 280,000 | | | Catalent Pharma Solutions, Inc., 4.875%, 1/15/2026, 144A | | | 269,500 | |
| | 865,000 | | | Teva Pharmaceutical Finance Co. BV, 2.950%, 12/18/2022 | | | 803,234 | |
| | 380,000 | | | Teva Pharmaceutical Finance Netherlands III BV, 4.100%, 10/01/2046 | | | 277,038 | |
| | | | | | | | |
| | | | | | | 2,654,766 | |
| | | | | | | | |
See accompanying notes to financial statements.
| 28
Portfolio of Investments – as of September 30, 2018
Loomis Sayles High Income Fund – (continued)
| | | | | | | | |
Principal
Amount (‡) | | | Description | | Value (†) | |
| | | | Property & Casualty Insurance — 1.0% | |
| | 435,000 | | | Ardonagh Midco 3 PLC, 8.375%, 7/15/2023, 144A, (GBP) | | $ | 550,117 | |
| | 1,110,000 | | | Ardonagh Midco 3 PLC, 8.625%, 7/15/2023, 144A | | | 1,096,303 | |
| | | | | | | | |
| | | | | | | 1,646,420 | |
| | | | | | | | |
| | | | Refining — 0.4% | |
| | 635,000 | | | Parkland Fuel Corp., 6.000%, 4/01/2026, 144A | | | 636,588 | |
| | | | | | | | |
| | | | Restaurants — 0.5% | |
| | 890,000 | | | 1011778 B.C. ULC/New Red Finance, Inc., 5.000%, 10/15/2025, 144A | | | 852,184 | |
| | | | | | | | |
| | | | Retailers — 1.5% | |
| | 430,000 | | | Asbury Automotive Group, Inc., 6.000%, 12/15/2024 | | | 434,300 | |
| | 40,000 | | | Dillard’s, Inc., 7.000%, 12/01/2028 | | | 41,951 | |
| | 435,000 | | | Dillard’s, Inc., 7.750%, 7/15/2026 | | | 480,227 | |
| | 205,000 | | | Dillard’s, Inc., 7.750%, 5/15/2027 | | | 224,938 | |
| | 820,000 | | | Group 1 Automotive, Inc., 5.000%, 6/01/2022 | | | 815,900 | |
| | 475,000 | | | L Brands, Inc., 6.750%, 7/01/2036 | | | 391,875 | |
| | 180,000 | | | L Brands, Inc., 6.875%, 11/01/2035 | | | 152,100 | |
| | | | | | | | |
| | | | | | | 2,541,291 | |
| | | | | | | | |
| | | | Sovereigns — 0.2% | |
| | 10,810,000 | | | Argentina Politica Monetaria, Argentina Central Bank 7-day Repo Reference Rate, 43.077%, 6/21/2020, (ARS)(d) | | | 312,695 | |
| | | | | | | | |
| | | | Supermarkets — 0.6% | |
| | 335,000 | | | Albertson’s Cos. LLC/Safeway, Inc./New Albertson’s, Inc./Albertson’s LLC, 5.750%, 3/15/2025 | | | 301,500 | |
| | 935,000 | | | New Albertsons LP, Series C, MTN, 6.625%, 6/01/2028 | | | 708,263 | |
| | | | | | | | |
| | | | | | | 1,009,763 | |
| | | | | | | | |
| | | | Technology — 4.4% | |
| | 416,000 | | | Blackboard, Inc., 9.750%, 10/15/2021, 144A | | | 327,600 | |
| | 170,000 | | | Camelot Finance S.A., 7.875%, 10/15/2024, 144A | | | 169,453 | |
| | 60,000 | | | CommScope Technologies LLC, 6.000%, 6/15/2025, 144A | | | 61,800 | |
| | 1,205,000 | | | Dell International LLC/EMC Corp., 6.020%, 6/15/2026, 144A | | | 1,287,943 | |
| | 410,000 | | | Equinix, Inc., 5.375%, 4/01/2023 | | | 419,738 | |
| | 430,000 | | | First Data Corp., 5.000%, 1/15/2024, 144A | | | 432,688 | |
| | 420,000 | | | First Data Corp., 5.375%, 8/15/2023, 144A | | | 426,405 | |
| | 800,000 | | | First Data Corp., 7.000%, 12/01/2023, 144A | | | 833,000 | |
| | 95,000 | | | Micron Technology, Inc., 5.500%, 2/01/2025 | | | 98,241 | |
| | 850,000 | | | NXP BV / NXP Funding LLC, 3.875%, 9/01/2022, 144A | | | 841,500 | |
| | 515,000 | | | Open Text Corp., 5.625%, 1/15/2023, 144A | | | 522,725 | |
| | 190,000 | | | Open Text Corp., 5.875%, 6/01/2026, 144A | | | 195,581 | |
| | 275,000 | | | Sabre GLBL, Inc., 5.250%, 11/15/2023, 144A | | | 275,000 | |
| | 405,000 | | | Sabre GLBL, Inc., 5.375%, 4/15/2023, 144A | | | 407,503 | |
| | 435,000 | | | Veritas U.S., Inc./Veritas Bermuda Ltd., 10.500%, 2/01/2024, 144A | | | 398,025 | |
| | 900,000 | | | Western Digital Corp., 4.750%, 2/15/2026 | | | 870,367 | |
| | | | | | | | |
| | | | | | | 7,567,569 | |
| | | | | | | | |
| | | | Transportation Services — 0.1% | |
| | 275,000 | | | APL Ltd., 8.000%, 1/15/2024(h)(i) | | | 247,500 | |
| | | | | | | | |
See accompanying notes to financial statements.
29 |
Portfolio of Investments – as of September 30, 2018
Loomis Sayles High Income Fund – (continued)
| | | | | | | | |
Principal
Amount (‡) | | | Description | | Value (†) | |
| | | | Treasuries — 5.0% | |
| | 29,260,000 | | | South Africa Government International Bond, 8.750%, 1/31/2044, (ZAR) | | $ | 1,842,785 | |
| | 6,755,000 | | | U.S. Treasury Note, 2.625%, 7/31/2020(e) | | | 6,732,835 | |
| | | | | | | | |
| | | | | | | 8,575,620 | |
| | | | | | | | |
| | | | Wireless — 3.0% | |
| | 200,000 | | | Millicom International Cellular S.A., 5.125%, 1/15/2028, 144A | | | 184,000 | |
| | 105,000 | | | Nokia Oyj, 3.375%, 6/12/2022 | | | 102,915 | |
| | 865,000 | | | Nokia Oyj, 4.375%, 6/12/2027 | | | 832,562 | |
| | 786,000 | | | Sprint Capital Corp., 6.875%, 11/15/2028 | | | 789,930 | |
| | 1,420,000 | | | Sprint Corp., 7.250%, 9/15/2021 | | | 1,501,650 | |
| | 315,000 | | | T-Mobile USA, Inc., 4.500%, 2/01/2026 | | | 300,627 | |
| | 895,000 | | | T-Mobile USA, Inc., 4.750%, 2/01/2028 | | | 842,419 | |
| | 530,000 | | | T-Mobile USA, Inc., 6.000%, 4/15/2024 | | | 549,212 | |
| | | | | | | | |
| | | | | | | 5,103,315 | |
| | | | | | | | |
| | | | Wirelines — 1.1% | |
| | 130,000 | | | Cincinnati Bell Telephone Co. LLC, 6.300%, 12/01/2028 | | | 121,550 | |
| | 1,060,000 | | | Frontier Communications Corp., 8.500%, 4/01/2026, 144A | | | 1,001,700 | |
| | 405,000 | | | Frontier Communications Corp., 9.000%, 8/15/2031 | | | 257,175 | |
| | 120,000 | | | Telecom Italia Capital S.A., 7.200%, 7/18/2036 | | | 124,500 | |
| | 505,000 | | | Windstream Services LLC/Windstream Finance Corp., 10.500%, 6/30/2024, 144A | | | 429,250 | |
| | | | | | | | |
| | | | | | | 1,934,175 | |
| | | | | | | | |
| | | | Total Non-Convertible Bonds
(Identified Cost $144,831,371) | | | 141,733,838 | |
| | | | | | | | |
| | | | | | | | |
| | Convertible Bonds — 9.8% | |
| | | | Automotive — 0.1% | |
| | 110,000 | | | Meritor, Inc., 3.250%, 10/15/2037 | | | 104,977 | |
| | | | | | | | |
| | | | Cable Satellite — 1.2% | |
| | 1,455,000 | | | DISH Network Corp., 2.375%, 3/15/2024 | | | 1,289,616 | |
| | 825,000 | | | DISH Network Corp., 3.375%, 8/15/2026 | | | 786,857 | |
| | | | | | | | |
| | | | | | | 2,076,473 | |
| | | | | | | | |
| | | | Consumer Cyclical Services — 0.5% | |
| | 910,000 | | | Macquarie Infrastructure Corp., 2.000%, 10/01/2023 | | | 817,795 | |
| | | | | | | | |
| | | | Diversified Operations — 0.1% | |
| | 160,000 | | | RWT Holdings, Inc., 5.625%, 11/15/2019 | | | 161,478 | |
| | | | | | | | |
| | | | Healthcare — 0.4% | |
| | 325,000 | | | Evolent Health, Inc., 2.000%, 12/01/2021 | | | 436,578 | |
| | 125,000 | | | Insulet Corp., 1.375%, 11/15/2024, 144A | | | 158,032 | |
| | | | | | | | |
| | | | | | | 594,610 | |
| | | | | | | | |
| | | | Independent Energy — 0.7% | |
| | 840,000 | | | Chesapeake Energy Corp., 5.500%, 9/15/2026 | | | 829,707 | |
| | 275,000 | | | PDC Energy, Inc., 1.125%, 9/15/2021 | | | 266,148 | |
| | 170,000 | | | Whiting Petroleum Corp., 1.250%, 4/01/2020 | | | 163,039 | |
| | | | | | | | |
| | | | | | | 1,258,894 | |
| | | | | | | | |
See accompanying notes to financial statements.
| 30
Portfolio of Investments – as of September 30, 2018
Loomis Sayles High Income Fund – (continued)
| | | | | | | | |
Principal
Amount (‡) | | | Description | | Value (†) | |
| | | | Industrial Other — 0.2% | |
| $ | 340,000 | | | Tutor Perini Corp., 2.875%, 6/15/2021 | | $ | 346,800 | |
| | | | | | | | |
| | | | Leisure — 0.1% | |
| | 185,000 | | | Rovi Corp., 0.500%, 3/01/2020 | | | 174,475 | |
| | | | | | | | |
| | | | Midstream — 0.0% | |
| | 60,000 | | | SM Energy Co., 1.500%, 7/01/2021 | | | 65,676 | |
| | | | | | | | |
| | | | Oil Field Services — 0.4% | |
| | 860,000 | | | Nabors Industries, Inc., 0.750%, 1/15/2024 | | | 672,735 | |
| | | | | | | | |
| | | | Pharmaceuticals — 3.2% | |
| | 1,805,000 | | | BioMarin Pharmaceutical, Inc., 0.599%, 8/01/2024 | | | 1,923,682 | |
| | 435,000 | | | BioMarin Pharmaceutical, Inc., 1.500%, 10/15/2020 | | | 521,827 | |
| | 115,000 | | | Dermira, Inc., 3.000%, 5/15/2022 | | | 95,432 | |
| | 410,000 | | | Flexion Therapeutics, Inc., 3.375%, 5/01/2024 | | | 413,991 | |
| | 465,000 | | | Horizon Pharma Investment Ltd., 2.500%, 3/15/2022 | | | 467,745 | |
| | 855,000 | | | Intercept Pharmaceuticals, Inc., 3.250%, 7/01/2023 | | | 864,084 | |
| | 840,000 | | | Ionis Pharmaceuticals, Inc., 1.000%, 11/15/2021 | | | 882,000 | |
| | 125,000 | | | Neurocrine Biosciences, Inc., 2.250%, 5/15/2024 | | | 213,073 | |
| | | | | | | | |
| | | | | | | 5,381,834 | |
| | | | | | | | |
| | | | Railroads — 0.3% | |
| | 395,000 | | | Greenbrier Cos., Inc. (The), 2.875%, 2/01/2024 | | | 467,104 | |
| | | | | | | | |
| | | | REITs – Mortgage — 0.2% | |
| | 435,000 | | | iStar, Inc., 3.125%, 9/15/2022, 144A | | | 422,879 | |
| | | | | | | | |
| | | | Technology — 2.2% | |
| | 455,000 | | | Avaya Holdings Corp., 2.250%, 6/15/2023, 144A | | | 461,752 | |
| | 1,370,000 | | | Finisar Corp., 0.500%, 12/15/2036 | | | 1,254,979 | |
| | 100,000 | | | MagnaChip Semiconductor S.A., 5.000%, 3/01/2021 | | | 139,312 | |
| | 1,105,000 | | | Nuance Communications, Inc., 1.000%, 12/15/2035 | | | 1,042,932 | |
| | 315,000 | | | Nuance Communications, Inc., 1.250%, 4/01/2025 | | | 325,326 | |
| | 450,000 | | | Verint Systems, Inc., 1.500%, 6/01/2021 | | | 463,467 | |
| | | | | | | | |
| | | | | | | 3,687,768 | |
| | | | | | | | |
| | | | Wirelines — 0.2% | |
| | 350,000 | | | GCI Liberty, Inc., 1.750%, 9/30/2046, 144A | | | 384,667 | |
| | | | | | | | |
| | | | Total Convertible Bonds
(Identified Cost $16,406,766) | | | 16,618,165 | |
| | | | | | | | |
| | | | | | | | |
| | | | Total Bonds and Notes
(Identified Cost $161,238,137) | | | 158,352,003 | |
| | | | | | | | |
| | | | | | | | |
| | Loan Participations — 0.3% | |
| | | | ABS Other — 0.3% | |
| | 431,418 | | | Harbour Aircraft Investments Ltd., Series 2017-1, Class C, 8.000%, 11/15/2037(a)(c)
(Identified Cost $430,422) | | | 437,015 | |
| | | | | | | | |
| | | | | | | | |
See accompanying notes to financial statements.
31 |
Portfolio of Investments – as of September 30, 2018
Loomis Sayles High Income Fund – (continued)
| | | | | | | | |
Principal
Amount (‡) | | | Description | | Value (†) | |
| | Senior Loans — 1.1% | |
| | | | Retailers — 0.2% | |
| $ | 462,250 | | | J.C. Penney Corp., Inc., 2016 Term Loan B, 6/23/2023(j) | | $ | 423,883 | |
| | | | | | | | |
| | | | Supermarkets — 0.3% | |
| | 428,881 | | | Albertsons LLC, USD 2017 Term Loan B4, 1-month LIBOR + 2.750%, 4.992%, 8/25/2021(d) | | | 429,237 | |
| | | | | | | | |
| | | | Transportation Services — 0.6% | |
| | 1,039,617 | | | Uber Technologies, 2018 Term Loan, 1-month LIBOR + 4.000%, 6.120%, 4/04/2025(d) | | | 1,045,138 | |
| | | | | | | | |
| | | | Total Senior Loans
(Identified Cost $1,890,987) | | | 1,898,258 | |
| | | | | | | | |
| | | | | | | | |
| Shares | | | | | | |
| | Preferred Stocks — 1.4% | |
| | Convertible Preferred Stocks — 1.4% | |
| | | | Food & Beverage — 1.0% | |
| | 14,765 | | | Bunge Ltd., 4.875% | | | 1,588,714 | |
| | | | | | | | |
| | | | Midstream — 0.4% | |
| | 20 | | | Chesapeake Energy Corp., 5.750%, 144A | | | 12,582 | |
| | 137 | | | Chesapeake Energy Corp., 5.750% | | | 82,039 | |
| | 988 | | | Chesapeake Energy Corp., 5.750% | | | 621,541 | |
| | | | | | | | |
| | | | | | | 716,162 | |
| | | | | | | | |
| | | | Total Convertible Preferred Stocks
(Identified Cost $2,234,677) | | | 2,304,876 | |
| | | | | | | | |
| | | | | | | | |
| | Non-Convertible Preferred Stocks — 0.0% | |
| | | | Finance Companies — 0.0% | |
| | 550 | | | iStar, Inc., Series G, 7.650%
(Identified Cost $10,956) | | | 13,370 | |
| | | | | | | | |
| | | | Total Preferred Stocks
(Identified Cost $2,245,633) | | | 2,318,246 | |
| | | | | | | | |
| | | | | | | | |
| | Common Stocks — 1.2% | |
| | | | Media — 0.0% | |
| | 4,113 | | | Dex Media, Inc.(k)(l) | | | 43,187 | |
| | | | | | | | |
| | | | Oil, Gas & Consumable Fuels — 0.9% | |
| | 8,864 | | | Bonanza Creek Energy, Inc.(l) | | | 263,970 | |
| | 16,530 | | | Frontera Energy Corp.(l) | | | 233,684 | |
| | 12,992 | | | Halcon Resources Corp.(l) | | | 58,074 | |
| | 14,882 | | | Kinder Morgan, Inc. | | | 263,858 | |
| | 3,405 | | | Paragon Offshore Ltd., Litigation Units, Class A(k)(l) | | | 2,751 | |
| | 5,106 | | | Paragon Offshore Ltd., Litigation Units, Class B(k)(l) | | | 197,857 | |
| | 1,725 | | | Rex Energy Corp.(l) | �� | | 113 | |
| | 9,390 | | | Whiting Petroleum Corp.(l) | | | 498,046 | |
| | | | | | | | |
| | | | | | | 1,518,353 | |
| | | | | | | | |
See accompanying notes to financial statements.
| 32
Portfolio of Investments – as of September 30, 2018
Loomis Sayles High Income Fund – (continued)
| | | | | | | | |
| Shares | | | Description | | Value (†) | |
| | | | Pharmaceuticals — 0.3% | |
| | 1,189 | | | Allergan PLC | | $ | 226,481 | |
| | 5,539 | | | Bristol-Myers Squibb Co. | | | 343,861 | |
| | | | | | | | |
| | | | | | | 570,342 | |
| | | | | | | | |
| | | | Total Common Stocks
(Identified Cost $5,359,849) | | | 2,131,882 | |
| | | | | | | | |
| | | | | | | | |
| | Warrants — 0.0% | |
| | 3,528 | | | Halcon Resources Corp., Expiration on 9/9/2020 at $14.04(l)
(Identified Cost $0) | | | 353 | |
| | | | | | | | |
| | | | | | | | |
| | Other Investments — 0.5% | |
| | | | Aircraft ABS — 0.5% | |
| | 8,415 | | | Aergen LLC(a)(c)(h)(k) | | | 8 | |
| | 100 | | | ECAF I Blocker Ltd.(a)(c)(h)(k) | | | 896,875 | |
| | | | | | | | |
| | | | Total Aircraft ABS
(Identified Cost $1,000,000) | | | 896,883 | |
| | | | | | | | |
| | | | | | | | |
Principal
Amount (‡) | | | | | | |
| | Short-Term Investments — 0.9% | |
| $ | 1,484,006 | | | Tri-Party Repurchase Agreement with Fixed Income Clearing Corporation, dated 9/28/2018 at 1.300% to be repurchased at $1,484,167 on 10/01/2018 collateralized by $950,000 U.S. Treasury Bond, 3.125% due 8/15/2044 valued at $943,532; $590,000 U.S. Treasury Note, 2.000% due 10/31/2022 valued at $573,404 including accrued interest (Note 2 of Notes to Financial Statements) (Identified Cost $1,484,006) | | | 1,484,006 | |
| | | | | | | | |
| | | | | | | | |
| | | | Total Investments — 98.3%
(Identified Cost $173,649,034) | | | 167,518,646 | |
| | | | Other assets less liabilities — 1.7% | | | 2,940,852 | |
| | | | | | | | |
| | | | Net Assets — 100.0% | | $ | 170,459,498 | |
| | | | | | | | |
| | | | | |
| | (‡) | | | Principal Amount stated in U.S. dollars unless otherwise noted. | |
| | (†) | | | See Note 2 of Notes to Financial Statements. | |
| | (††) | | | Amount shown represents units. One unit represents a principal amount of 100. | |
| | (a) | | | Level 3 security. Value has been determined using significant unobservable inputs. See Note 3 of Notes to Financial Statements. | |
| | (b) | | | Variable rate security. The interest rate adjusts periodically based on; (i) changes in current interest rates and/or prepayments on underlying pools of assets, if applicable, (ii) reference to a base lending rate plus or minus a margin, and/or (iii) reference to a base lending rate adjusted by a multiplier and/or subject to certain floors or caps. Rate as of September 30, 2018 is disclosed. | |
See accompanying notes to financial statements.
33 |
Portfolio of Investments – as of September 30, 2018
Loomis Sayles High Income Fund – (continued)
| | | | | | |
| | | | |
| | (c) | | | Fair valued by the Fund’s adviser. At September 30, 2018, the value of these securities amounted to $1,334,593 or 0.8% of net assets. See Note 2 of Notes to Financial Statements. |
| | (d) | | | Variable rate security. Rate as of September 30, 2018 is disclosed. |
| | (e) | | | Security (or a portion thereof) has been designated to cover the Fund’s obligations under open derivative contracts. |
| | (f) | | | Payment-in-kind security for which the issuer has the option at each interest payment date of making interest payments in cash or additional principal. For the period ended September 30, 2018, interest payments were made in cash. |
| | (g) | | | The issuer is in default with respect to interest and/or principal payments. Income is not being accrued. |
| | (h) | | | Illiquid security. (Unaudited) |
| | (i) | | | Securities classified as fair valued pursuant to the Fund’s pricing policies and procedures. At September 30, 2018, the value of these securities amounted to $553,512 or 0.3% of net assets. See Note 2 of Notes to Financial Statements. |
| | (j) | | | Position is unsettled. Contract rate was not determined at September 30, 2018 and does not take effect until settlement date. Maturity date is not finalized until settlement date. |
| | (k) | | | Securities subject to restriction on resale. At September 30, 2018, the restricted securities held by the Fund are as follows: |
| | | | | | | | | | | | | | | | |
| | | | | | | | | | | | | | | | |
| | | Acquisition
Date | | | Acquisition
Cost | | | Value | | | % of
Net Assets | |
| Aergen LLC | | | March 06, 2017 | | | $ | 841,500 | | | $ | 8 | | | | Less than 0.1 | % |
| Dex Media, Inc. | | | August 12, 2016 | | | | 20,040 | | | | 43,187 | | | | Less than 0.1 | % |
| ECAF I Blocker Ltd. | | | December 20, 2016 | | | | 1,000,000 | | | | 896,875 | | | | 0.5 | % |
| Paragon Offshore Ltd., Litigation Units, Class A | | | July 18, 2017 | | | | 25,887 | | | | 2,751 | | | | Less than 0.1 | % |
| Paragon Offshore Ltd., Litigation Units, Class B | | | July 18, 2017 | | | | 517,958 | | | | 197,857 | | | | 0.1 | % |
| | | | | | | | | | | | | | | | |
| | | | | | |
| | (l) | | | Non-income producing security. |
| | | | |
| | 144A | | | All or a portion of these securities are exempt from registration under Rule 144A of the Securities Act of 1933. These securities may be resold in transactions exempt from registration, normally to qualified institutional buyers. At September 30, 2018, the value of Rule 144A holdings amounted to $69,804,211 or 41.0% of net assets. |
| | ABS | | | Asset-Backed Securities |
| | LIBOR | | | London Interbank Offered Rate |
| | MTN | | | Medium Term Note |
| | PIK | | | Payment-in-Kind |
| | REITs | | | Real Estate Investment Trusts |
| | | | |
| | ARS | | | Argentine Peso |
| | GBP | | | British Pound |
| | MXN | | | Mexican Peso |
| | ZAR | | | South African Rand |
See accompanying notes to financial statements.
| 34
Portfolio of Investments – as of September 30, 2018
Loomis Sayles High Income Fund – (continued)
At September 30, 2018, the Fund had the following open forward foreign currency contracts:
| | | | | | | | | | | | | | | | | | | | | | | | | | |
| Counterparty | | Delivery
Date | | | Currency
Bought/
Sold (B/S) | | | Units
of
Currency | | | In Exchange for | | | Notional
Value | | | Unrealized
Appreciation
(Depreciation) | |
| HSBC Bank USA | | | 11/02/2018 | | | GBP | | | S | | | | 340,000 | | | $ | 447,366 | | | $ | 443,765 | | | $ | 3,601 | |
| Goldman Sachs & Co. | | | 11/16/2018 | | | MXN | | | B | | | | 14,645,000 | | | | 764,372 | | | | 777,100 | | | | 12,728 | |
| Goldman Sachs & Co. | | | 11/16/2018 | | | MXN | | | S | | | | 33,505,000 | | | | 1,719,881 | | | | 1,777,858 | | | | (57,977 | ) |
| Bank of America, N.A. | | | 11/02/2018 | | | ZAR | | | S | | | | 25,220,000 | | | | 1,902,463 | | | | 1,776,131 | | | | 126,332 | |
| | | | | | | | | | | | | | | | | | | | | | | | | | |
| Total | | | | | | | | | | | | | | | | | | | | | | | | $ | 84,684 | |
| | | | | | | | | | | | | | | | | | | | | | | | | | |
Industry Summary at September 30, 2018
| | | | |
Independent Energy | | | 9.7 | % |
Cable Satellite | | | 8.2 | |
Technology | | | 6.6 | |
Banking | | | 5.3 | |
Pharmaceuticals | | | 5.1 | |
Treasuries | | | 5.0 | |
Healthcare | | | 4.9 | |
Midstream | | | 4.3 | |
Finance Companies | | | 3.6 | |
Food & Beverage | | | 3.4 | |
Media Entertainment | | | 3.2 | |
Wireless | | | 3.0 | |
Home Construction | | | 2.2 | |
Other Investments, less than 2% each | | | 32.9 | |
Short-Term Investments | | | 0.9 | |
| | | | |
Total Investments | | | 98.3 | |
Other assets less liabilities (including forward foreign currency contracts) | | | 1.7 | |
| | | | |
Net Assets | | | 100.0 | % |
| | | | |
Currency Exposure Summary at September 30, 2018
| | | | |
United States Dollar | | | 95.3 | % |
Other, less than 2% each | | | 3.0 | |
| | | | |
Total Investments | | | 98.3 | |
Other assets less liabilities (including forward foreign currency contracts) | | | 1.7 | |
| | | | |
Net Assets | | | 100.0 | % |
| | | | |
See accompanying notes to financial statements.
35 |
Portfolio of Investments – as of September 30, 2018
Loomis Sayles Intermediate Duration Bond Fund
| | | | | | | | |
Principal
Amount | | | Description | | Value (†) | |
| | Bonds and Notes — 98.1% of Net Assets | |
| | | | ABS Car Loan — 11.0% | |
| $ | 116,052 | | | ACC Trust, Series 2018-1, Class A, 3.700%, 12/21/2020, 144A | | $ | 115,997 | |
| | 152,000 | | | AmeriCredit Automobile Receivables Trust, Series 2016-1, Class C, 2.890%, 1/10/2022 | | | 151,824 | |
| | 72,000 | | | AmeriCredit Automobile Receivables Trust, Series 2016-2, Class C, 2.870%, 11/08/2021 | | | 71,841 | |
| | 160,000 | | | AmeriCredit Automobile Receivables Trust, Series 2016-3, Class C, 2.240%, 4/08/2022 | | | 157,709 | |
| | 555,000 | | | Americredit Automobile Receivables Trust, Series 2016-4, Class B, 1.830%, 12/08/2021(a) | | | 547,858 | |
| | 110,000 | | | AmeriCredit Automobile Receivables Trust, Series 2017-1, Class B, 2.300%, 2/18/2022 | | | 108,867 | |
| | 300,000 | | | AmeriCredit Automobile Receivables Trust, Series 2017-2, Class B, 2.400%, 5/18/2022 | | | 296,351 | |
| | 170,000 | | | AmeriCredit Automobile Receivables Trust, Series 2017-3, Class B, 2.240%, 6/19/2023 | | | 166,945 | |
| | 210,000 | | | Avis Budget Rental Car Funding AESOP LLC, Series 2014-1A, Class A, 2.460%, 7/20/2020, 144A | | | 209,448 | |
| | 360,000 | | | Avis Budget Rental Car Funding AESOP LLC, Series 2016-1A, Class A, 2.990%, 6/20/2022, 144A(a) | | | 355,320 | |
| | 365,000 | | | Avis Budget Rental Car Funding AESOP LLC, Series 2017-1A, Class A, 3.070%, 9/20/2023, 144A(a) | | | 355,696 | |
| | 285,000 | | | Bank of the West Auto Trust, Series 2017-1, Class A3, 2.110%, 1/15/2023, 144A | | | 280,042 | |
| | 520,000 | | | California Republic Auto Recievables Trust, Series 2017-1, Class A4, 2.280%, 6/15/2022(a) | | | 513,907 | |
| | 175,000 | | | Capital Auto Receivables Asset Trust, Series 2017-1, Class A3, 2.020%, 8/20/2021, 144A | | | 173,505 | |
| | 1,000,000 | | | CarMax Auto Owner Trust, Series 2017-2, Class A3, 1.930%, 3/15/2022(a) | | | 987,881 | |
| | 239,290 | | | Chrysler Capital Auto Receivables Trust, Series 2016-BA, Class A3, 1.640%, 7/15/2021, 144A | | | 238,022 | |
| | 69,601 | | | CIG Auto Receivables Trust, Series 2017-1A, Class A, 2.710%, 5/15/2023, 144A | | | 69,126 | |
| | 194,309 | | | CPS Auto Receivables Trust, Series 2015-A, Class B, 2.790%, 2/16/2021, 144A | | | 194,334 | |
| | 125,000 | | | CPS Auto Receivables Trust, Series 2017-C, Class B, 2.300%, 7/15/2021, 144A | | | 124,261 | |
| | 800,000 | | | Credit Acceptance Auto Loan Trust, Series 2016-2A, Class B, 3.180%, 5/15/2024, 144A | | | 800,168 | |
| | 275,000 | | | Credit Acceptance Auto Loan Trust, Series 2016-3A, Class A, 2.150%, 4/15/2024, 144A | | | 273,773 | |
| | 214,868 | | | Drive Auto Receivables Trust, Series 2016-BA, Class C, 3.190%, 7/15/2022, 144A | | | 215,151 | |
| | 23,148 | | | Drive Auto Receivables Trust, Series 2016-CA, Class B, 2.370%, 11/16/2020, 144A | | | 23,142 | |
| | 185,000 | | | Drive Auto Receivables Trust, Series 2017-3, Class C, 2.800%, 7/15/2022 | | | 184,506 | |
| | 230,000 | | | Drive Auto Receivables Trust, Series 2017-AA, Class C, 2.980%, 1/18/2022, 144A | | | 229,791 | |
| | 273,838 | | | Drive Auto Receivables Trust, Series 2017-BA, Class C, 2.610%, 8/16/2021, 144A | | | 273,544 | |
| | 60,000 | | | DT Auto Owner Trust, Series 18-2A, Class C, 3.670%, 3/15/2024, 144A | | | 60,018 | |
| | 88,374 | | | DT Auto Owner Trust, Series 2015-2A, Class D, 4.250%, 2/15/2022, 144A | | | 88,885 | |
| | 327,093 | | | DT Auto Owner Trust, Series 2015-3A, Class D, 4.530%, 10/17/2022, 144A | | | 329,729 | |
| | 255,000 | | | DT Auto Owner Trust, Series 2016-2A, Class D, 5.430%, 11/15/2022, 144A | | | 259,009 | |
See accompanying notes to financial statements.
| 36
Portfolio of Investments – as of September 30, 2018
Loomis Sayles Intermediate Duration Bond Fund – (continued)
| | | | | | | | |
Principal
Amount | | | Description | | Value (†) | |
| | | | ABS Car Loan — continued | |
| $ | 354,772 | | | DT Auto Owner Trust, Series 2016-4A, Class C, 2.740%, 10/17/2022, 144A(a) | | $ | 354,739 | |
| | 90,000 | | | DT Auto Owner Trust, Series 2017-1A, Class C, 2.700%, 11/15/2022, 144A | | | 89,832 | |
| | 350,000 | | | DT Auto Owner Trust, Series 2017-3A, Class B, 2.400%, 5/17/2021, 144A | | | 349,047 | |
| | 300,000 | | | Exeter Automobile Receivables Trust, Series 2017-2A, Class B, 2.820%, 5/16/2022, 144A | | | 298,344 | |
| | 190,000 | | | Exeter Automobile Receivables Trust, Series 2018-1A, Class B, 2.750%, 4/15/2022, 144A | | | 188,799 | |
| | 400,000 | | | Exeter Automobile Receivables Trust, Series 2018-2A, Class B, 3.270%, 5/16/2022, 144A | | | 398,963 | |
| | 260,000 | | | First Investors Auto Owner Trust, Series 2017-1A, Class A2, 2.200%, 3/15/2022, 144A | | | 258,032 | |
| | 315,000 | | | First Investors Auto Owner Trust, Series 2017-2A, Class A2, 2.270%, 7/15/2022, 144A | | | 311,683 | |
| | 290,000 | | | Flagship Credit Auto Trust, Series 2015-2, Class B, 3.080%, 12/15/2021, 144A | | | 290,011 | |
| | 195,000 | | | Flagship Credit Auto Trust, Series 2016-2, Class B, 3.840%, 9/15/2022, 144A | | | 196,056 | |
| | 135,000 | | | Flagship Credit Auto Trust, Series 2016-3, Class B, 2.430%, 6/15/2021, 144A | | | 134,371 | |
| | 160,000 | | | Flagship Credit Auto Trust, Series 2016-4, Class B, 2.410%, 10/15/2021, 144A | | | 159,066 | |
| | 230,000 | | | Ford Credit Auto Owner Trust, Series 2014-2, Class A, 2.310%, 4/15/2026, 144A | | | 228,519 | |
| | 705,000 | | | Ford Credit Auto Owner Trust, Series 2016-2, Class A, 2.030%, 12/15/2027, 144A(a) | | | 681,871 | |
| | 595,000 | | | Ford Credit Auto Owner Trust, Series 2018-1, Class A, 3.190%, 7/15/2031, 144A(a) | | | 580,074 | |
| | 115,000 | | | Ford Credit Auto Owner Trust/Ford Credit, Series 2014-1, Class A, 2.260%, 11/15/2025, 144A | | | 114,624 | |
| | 113,416 | | | GM Financial Automobile Leasing Trust, Series 2016-2, Class A3, 1.620%, 9/20/2019 | | | 113,273 | |
| | 275,000 | | | GM Financial Consumer Automobile, Series 2017-1A, Class A3, 1.780%, 10/18/2021, 144A | | | 271,980 | |
| | 500,000 | | | GM Financial Consumer Automobile Receivables Trust, Series 2017-3A, Class A3, 1.970%, 5/16/2022, 144A(a) | | | 492,125 | |
| | 120,000 | | | NextGear Floorplan Master Owner Trust, Series 2016-2A, Class A2, 2.190%, 9/15/2021, 144A | | | 119,010 | |
| | 510,000 | | | NextGear Floorplan Master Owner Trust, Series 2017-1A, Class A2, 2.540%, 4/18/2022, 144A(a) | | | 504,696 | |
| | 150,000 | | | NextGear Floorplan Master Owner Trust, Series 2017-2A, Class A2, 2.560%, 10/17/2022, 144A | | | 147,879 | |
| | 125,000 | | | NextGear Floorplan Master Owner Trust, Series 2018-1A, Class A2, 3.220%, 2/15/2023, 144A | | | 124,196 | |
| | 505,000 | | | Prestige Auto Receivables Trust, Series 2016-2A, Class A3, 1.760%, 1/15/2021, 144A(a) | | | 503,663 | |
| | 188,000 | | | Santander Drive Auto Receivables Trust, Series 2016-2, Class C, 2.660%, 11/15/2021 | | | 187,534 | |
| | 165,000 | | | Santander Drive Auto Receivables Trust, Series 2017-1, Class B, 2.100%, 6/15/2021 | | | 164,541 | |
| | 265,000 | | | Santander Drive Auto Receivables Trust, Series 2017-2, Class B, 2.210%, 10/15/2021 | | | 264,195 | |
| | 370,000 | | | Santander Drive Auto Receivables Trust, Series 2018-1, Class B, 2.630%, 7/15/2022 | | | 367,791 | |
See accompanying notes to financial statements.
37 |
Portfolio of Investments – as of September 30, 2018
Loomis Sayles Intermediate Duration Bond Fund – (continued)
| | | | | | | | |
Principal
Amount | | | Description | | Value (†) | |
| | | | ABS Car Loan — continued | |
| $ | 180,000 | | | Santander Drive Auto Receivables Trust, Series 2018-2, Class B, 3.030%, 9/15/2022 | | $ | 179,220 | |
| | 541,960 | | | Westlake Automobile Receivables Trust, Series 2016-3A, Class B, 2.070%, 12/15/2021, 144A(a) | | | 541,422 | |
| | 295,000 | | | Westlake Automobile Receivables Trust, Series 2017-1A, Class B, 2.300%, 10/17/2022, 144A | | | 294,387 | |
| | 135,000 | | | Westlake Automobile Receivables Trust, Series 2018-1A, Class B, 2.670%, 5/17/2021, 144A | | | 134,271 | |
| | 1,330,000 | | | World Omni Auto Receivables Trust, Series 2017-A, Class A3, 1.930%, 9/15/2022(a) | | | 1,314,725 | |
| | 110,000 | | | World Omni Auto Receivables Trust, Series 2017-B, Class A3, 1.950%, 2/15/2023 | | | 107,806 | |
| | | | | | | | |
| | | | | | | 18,323,395 | |
| | | | | | | | |
| | | | ABS Credit Card — 1.9% | |
| | 415,000 | | | Barclays Dryrock Issuance Trust, Series 2014-3, Class A, 2.410%, 7/15/2022(a) | | | 413,294 | |
| | 805,000 | �� | | Capital One Multi-Asset Execution Trust, Series 2017-A4, Class A4, 1.990%, 7/17/2023(a) | | | 788,493 | |
| | 260,000 | | | Citibank Credit Card Issuance Trust, Series 2014-A1, Class A1, 2.880%, 1/23/2023 | | | 258,647 | |
| | 470,000 | | | Synchrony Credit Card Master Note Trust, Series 2016-3, Class A, 1.580%, 9/15/2022(a) | | | 464,101 | |
| | 555,000 | | | World Financial Network Credit Card Master Trust, Series 2016-C, Class A, 1.720%, 8/15/2023(a) | | | 547,885 | |
| | 730,000 | | | World Financial Network Credit Card Master Trust, Series 2017-A, Class A, 2.120%, 3/15/2024(a) | | | 717,413 | |
| | | | | | | | |
| | | | | | | 3,189,833 | |
| | | | | | | | |
| | | | ABS Home Equity — 0.9% | |
| | 325,973 | | | Bayview Opportunity Master Fund IVa Trust, Series 2016-SPL1, Class A, 4.000%, 4/28/2055, 144A | | | 327,019 | |
| | 214,585 | | | Colony American Finance Ltd., Series 2015-1, Class A, 2.896%, 10/15/2047, 144A | | | 213,268 | |
| | 187,899 | | | CoreVest American Finance Trust, Series 2017-1, Class A, 2.968%, 10/15/2049, 144A | | | 183,318 | |
| | 15,606 | | | Countrywide Alternative Loan Trust, Series 2006-J5, Class 4A1, 5.061%, 7/25/2021(b)(c)(d) | | | 14,830 | |
| | 9,012 | | | Countrywide Asset-Backed Certificates, Series 2004-S1, Class A3, 5.115%, 2/25/2035(c) | | | 9,056 | |
| | 438,901 | | | Freddie Mac Structured Agency Credit Risk Debt Notes, Series 2015-DNA1, Class M2, 1-month LIBOR + 1.850%, 4.066%, 10/25/2027(a)(e) | | | 446,724 | |
| | 130,374 | | | Mill City Mortgage Trust, Series 2016-1, Class A1, 2.500%, 4/25/2057, 144A(c) | | | 127,304 | |
| | 115,632 | | | Towd Point Mortgage Trust, Series 2015-2, Class 1A12, 2.750%, 11/25/2060, 144A(c) | | | 113,911 | |
| | 49,588 | | | Wells Fargo Mortgage Backed Securities Trust, Series 2005-AR10, Class 2A4, 4.213%, 5/01/2035(c) | | | 51,016 | |
| | | | | | | | |
| | | | | | | 1,486,446 | |
| | | | | | | | |
| | | | ABS Other — 3.4% | |
| | 332,078 | | | Diamond Resorts Owner Trust, Series 2018-1, Class A, 3.700%, 1/21/2031, 144A | | | 330,393 | |
| | 270,000 | | | John Deere Owner Trust, Series 2017-B, Class A3, 1.820%, 10/15/2021 | | | 266,300 | |
See accompanying notes to financial statements.
| 38
Portfolio of Investments – as of September 30, 2018
Loomis Sayles Intermediate Duration Bond Fund – (continued)
| | | | | | | | |
Principal
Amount | | | Description | | Value (†) | |
| | | | ABS Other — continued | |
| $ | 520,000 | | | Mariner Finance Issuance Trust, Series 2017-BA, Class A, 2.920%, 12/20/2029, 144A | | $ | 512,315 | |
| | 356,122 | | | Merlin Aviation Holdings DAC, Series 2016-1, Class A, 4.500%, 12/15/2032, 144A(c) | | | 358,687 | |
| | 139,044 | | | OneMain Financial Issuance Trust, Series 2015-1A, Class A, 3.190%, 3/18/2026, 144A | | | 139,219 | |
| | 350,000 | | | OneMain Financial Issuance Trust, Series 2016-1A, Class A, 3.660%, 2/20/2029, 144A | | | 351,071 | |
| | 555,000 | | | OneMain Financial Issuance Trust, Series 2018-1A, Class A, 3.300%, 3/14/2029, 144A(a) | | | 550,751 | |
| | 320,083 | | | S-Jets Ltd., Series 2017-1, Class A, 3.967%, 8/15/2042, 144A | | | 318,092 | |
| | 570,000 | | | SCF Equipment Trust LLC, Series 2018-1A, Class A2, 3.630%, 10/20/2024, 144A(a) | | | 569,042 | |
| | 100,069 | | | Sierra Receivables Funding Co. LLC, Series 2017-1A, Class A, 2.910%, 3/20/2034, 144A | | | 98,777 | |
| | 255,000 | | | SoFi Consumer Loan Program Trust, Series 2018-1A, Class A2, 3.140%, 2/25/2027, 144A | | | 252,736 | |
| | 730,000 | | | SoFi Consumer Loan Program Trust, Series 2018-2, Class A2, 3.350%, 4/26/2027, 144A | | | 728,575 | |
| | 148,958 | | | TAL Advantage V LLC, Series 2014-1A, Class A, 3.510%, 2/22/2039, 144A | | | 147,013 | |
| | 67,222 | | | TAL Advantage V LLC, Series 2014-2A, Class A2, 3.330%, 5/20/2039, 144A | | | 66,777 | |
| | 154,167 | | | TAL Advantage V LLC, Series 2014-3A, Class A, 3.270%, 11/21/2039, 144A | | | 150,765 | |
| | 795,000 | | | Verizon Owner Trust, Series 2017-1A, Class A, 2.060%, 9/20/2021, 144A(a) | | | 787,784 | |
| | | | | | | | |
| | | | | | | 5,628,297 | |
| | | | | | | | |
| | | | ABS Student Loan — 0.8% | |
| | 135,347 | | | Earnest Student Loan Program LLC, Series 2017-A, Class A2, 2.650%, 1/25/2041, 144A | | | 132,463 | |
| | 375,000 | | | Massachusetts Educational Financing Authority, Series 2018-A, Class A, 3.850%, 5/25/2033 | | | 371,696 | |
| | 213,079 | | | North Carolina State Education Assistance Authority, Series 2011-2, Class A2, 3-month LIBOR + 0.800%, 3.135%, 7/25/2025(e) | | | 213,648 | |
| | 58,964 | | | SoFi Professional Loan Program LLC, Series 2015-A, Class A2, 2.420%, 3/25/2030, 144A | | | 58,111 | |
| | 268,342 | | | SoFi Professional Loan Program LLC, Series 2016-B, Class A2B, 2.740%, 10/25/2032, 144A | | | 266,026 | |
| | 180,000 | | | SoFi Professional Loan Program LLC, Series 2017-E, Class A2B, 2.720%, 11/26/2040, 144A | | | 173,803 | |
| | 163,988 | | | South Carolina Student Loan Corp., Series 2010-1, Class A2, 3-month LIBOR + 1.000%, 3.335%, 7/25/2025(e) | | | 164,688 | |
| | | | | | | | |
| | | | | | | 1,380,435 | |
| | | | | | | | |
| | | | ABS Whole Business — 0.4% | |
| | 605,000 | | | Planet Fitness Master Issuer LLC, Series 2018-1A, Class A2II, 4.666%, 9/05/2048, 144A | | | 598,841 | |
| | | | | | | | |
| | | | Aerospace & Defense — 0.6% | |
| | 460,000 | | | General Dynamics Corp., 3.000%, 5/11/2021 | | | 457,540 | |
| | 450,000 | | | Rolls-Royce PLC, 2.375%, 10/14/2020, 144A | | | 439,686 | |
| | 105,000 | | | Spirit AeroSystems, Inc., 4.600%, 6/15/2028 | | | 104,127 | |
| | | | | | | | |
| | | | | | | 1,001,353 | |
| | | | | | | | |
See accompanying notes to financial statements.
39 |
Portfolio of Investments – as of September 30, 2018
Loomis Sayles Intermediate Duration Bond Fund – (continued)
| | | | | | | | |
Principal
Amount | | | Description | | Value (†) | |
| | | | Agency Commercial Mortgage-Backed Securities — 1.7% | |
| $ | 648,018 | | | FHLMC Multifamily Structured Pass Through Certificates, Series K013, Class A2, 3.974%, 1/25/2021(a)(c) | | $ | 658,883 | |
| | 509,476 | | | FHLMC Multifamily Structured Pass Through Certificates, Series K029, Class A2, 3.320%, 2/25/2023(a)(c) | | | 511,816 | |
| | 701,647 | | | FHLMC Multifamily Structured Pass Through Certificates, Series K042, Class A2, 2.670%, 12/25/2024(a) | | | 677,081 | |
| | 970,707 | | | FHLMC Multifamily Structured Pass Through Certificates, Series K711, Class A2, 1.730%, 7/25/2019(a) | | | 963,307 | |
| | 87,208 | | | FHLMC Multifamily Structured Pass Through Certificates, Series KP03, Class A2, 1.780%, 7/25/2019 | | | 86,560 | |
| | | | | | | | |
| | | | | | | 2,897,647 | |
| | | | | | | | |
| | | | Airlines — 0.2% | |
| | 46,170 | | | Delta Air Lines Pass Through Trust, Series 2009-1, Class A, 7.750%, 6/17/2021 | | | 48,150 | |
| | 360,000 | | | Southwest Airlines Co., 3.450%, 11/16/2027 | | | 340,237 | |
| | | | | | | | |
| | | | | | | 388,387 | |
| | | | | | | | |
| | | | Automotive — 5.1% | |
| | 425,000 | | | American Honda Finance Corp., MTN, 2.000%, 2/14/2020 | | | 419,377 | |
| | 45,000 | | | Aptiv PLC, 3.150%, 11/19/2020 | | | 44,592 | |
| | 290,000 | | | BMW U.S. Capital LLC, 1.850%, 9/15/2021, 144A | | | 276,948 | |
| | 890,000 | | | Daimler Finance North America LLC, 3.350%, 2/22/2023, 144A | | | 875,495 | |
| | 1,560,000 | | | Ford Motor Credit Co. LLC, 2.979%, 8/03/2022 | | | 1,479,514 | |
| | 860,000 | | | General Motors Co., 5.000%, 10/01/2028 | | | 849,313 | |
| | 595,000 | | | General Motors Financial Co., Inc., 4.150%, 6/19/2023 | | | 592,621 | |
| | 670,000 | | | Harley-Davidson Financial Services, Inc., 3.350%, 2/15/2023, 144A | | | 650,443 | |
| | 730,000 | | | Hyundai Capital America, 2.750%, 9/18/2020, 144A | | | 715,743 | |
| | 175,000 | | | Hyundai Capital America, 3.450%, 3/12/2021, 144A | | | 173,026 | |
| | 855,000 | | | Nissan Motor Acceptance Corp., 2.150%, 7/13/2020, 144A | | | 836,239 | |
| | 885,000 | | | Nissan Motor Acceptance Corp., 3.450%, 3/15/2023, 144A | | | 870,652 | |
| | 150,000 | | | PACCAR Financial Corp., MTN, 1.200%, 8/12/2019 | | | 147,824 | |
| | 660,000 | | | Toyota Motor Credit Corp., MTN, 2.150%, 9/08/2022 | | | 629,425 | |
| | | | | | | | |
| | | | | | | 8,561,212 | |
| | | | | | | | |
| | | | Banking — 22.3% | |
| | 530,000 | | | ABN AMRO Bank NV, 1.800%, 9/20/2019, 144A | | | 524,133 | |
| | 315,000 | | | American Express Co., 2.200%, 10/30/2020 | | | 308,354 | |
| | 495,000 | | | American Express Co., 3.700%, 8/03/2023 | | | 492,500 | |
| | 915,000 | | | ANZ New Zealand (Int’l) Ltd., 2.200%, 7/17/2020, 144A | | | 896,601 | |
| | 605,000 | | | Bank of Ireland Group PLC, 4.500%, 11/25/2023, 144A | | | 603,976 | |
| | 1,080,000 | | | Bank of New York Mellon Corp. (The), (fixed rate to 5/16/2022, variable rate thereafter), MTN, 2.661%, 5/16/2023 | | | 1,045,175 | |
| | 740,000 | | | Bank of Nova Scotia, 2.150%, 7/14/2020 | | | 727,626 | |
| | 450,000 | | | Banque Federative du Credit Mutuel S.A., 2.200%, 7/20/2020, 144A | | | 441,083 | |
| | 460,000 | | | Banque Federative du Credit Mutuel S.A., 2.700%, 7/20/2022, 144A | | | 442,731 | |
| | 605,000 | | | Banque Federative du Credit Mutuel S.A., 3.750%, 7/20/2023, 144A | | | 601,397 | |
| | 880,000 | | | Barclays PLC, (fixed rate to 5/16/2023, variable rate thereafter), 4.338%, 5/16/2024 | | | 869,344 | |
| | 625,000 | | | BB&T Corp., MTN, 2.150%, 2/01/2021 | | | 610,010 | |
See accompanying notes to financial statements.
| 40
Portfolio of Investments – as of September 30, 2018
Loomis Sayles Intermediate Duration Bond Fund – (continued)
| | | | | | | | |
Principal
Amount | | | Description | | Value (†) | |
| | | | Banking — continued | |
| $ | 305,000 | | | BB&T Corp., MTN, 3.700%, 6/05/2025 | | $ | 303,925 | |
| | 270,000 | | | BNP Paribas S.A., 3.375%, 1/09/2025, 144A | | | 255,597 | |
| | 350,000 | | | BNP Paribas S.A., 3.500%, 3/01/2023, 144A | | | 341,386 | |
| | 490,000 | | | BNZ International Funding Ltd., 2.400%, 2/21/2020, 144A | | | 484,142 | |
| | 720,000 | | | Canadian Imperial Bank of Commerce, 3.500%, 9/13/2023 | | | 715,510 | |
| | 655,000 | | | Capital One Financial Corp., 3.300%, 10/30/2024 | | | 623,564 | |
| | 215,000 | | | Citigroup, Inc., 2.900%, 12/08/2021 | | | 210,542 | |
| | 750,000 | | | Citigroup, Inc., (fixed rate to 1/24/2022, variable rate thereafter), 3.142%, 1/24/2023 | | | 735,568 | |
| | 310,000 | | | Citizens Bank NA, 2.250%, 3/02/2020 | | | 305,829 | |
| | 430,000 | | | Citizens Bank NA, MTN, 2.500%, 3/14/2019 | | | 429,634 | |
| | 250,000 | | | Comerica Bank, 2.500%, 6/02/2020 | | | 246,570 | |
| | 565,000 | | | Comerica, Inc., 3.700%, 7/31/2023 | | | 562,242 | |
| | 410,000 | | | Cooperatieve Rabobank U.A. (NY), 2.750%, 1/10/2023 | | | 394,092 | |
| | 675,000 | | | Credit Agricole S.A., 3.750%, 4/24/2023, 144A | | | 662,421 | |
| | 730,000 | | | Danske Bank AS, 3.875%, 9/12/2023, 144A | | | 714,987 | |
| | 290,000 | | | Deutsche Bank AG, 4.100%, 1/13/2026 | | | 274,742 | |
| | 480,000 | | | Deutsche Bank AG (NY), 3.150%, 1/22/2021 | | | 469,058 | |
| | 100,000 | | | Deutshe Bank AG, 3.300%, 11/16/2022 | | | 95,065 | |
| | 605,000 | | | Discover Bank, 4.650%, 9/13/2028 | | | 605,021 | |
| | 780,000 | | | Fifth Third Bank, 1.625%, 9/27/2019 | | | 770,427 | |
| | 395,000 | | | Fifth Third Bank, 3.950%, 7/28/2025 | | | 394,524 | |
| | 830,000 | | | Goldman Sachs Group, Inc. (The), (fixed rate to 10/31/2021, variable rate thereafter), 2.876%, 10/31/2022 | | | 809,406 | |
| | 305,000 | | | HSBC Holdings PLC, 3-month LIBOR + 1.000%, 3.322%, 5/18/2024(e) | | | 304,459 | |
| | 860,000 | | | HSBC Holdings PLC, (fixed rate to 9/12/2025, variable rate thereafter), 4.292%, 9/12/2026 | | | 851,550 | |
| | 185,000 | | | HSBC USA, Inc., 2.375%, 11/13/2019 | | | 183,775 | |
| | 335,000 | | | ING Groep NV, 4.550%, 10/02/2028 | | | 333,413 | |
| | 850,000 | | | JPMorgan Chase & Co., (fixed rate to 6/18/2021, variable rate thereafter), 3.514%, 6/18/2022 | | | 850,883 | |
| | 585,000 | | | JPMorgan Chase Bank NA, 1.650%, 9/23/2019 | | | 578,401 | |
| | 555,000 | | | Key Bank NA, 1.600%, 8/22/2019 | | | 549,042 | |
| | 150,000 | | | KeyCorp, MTN, 4.100%, 4/30/2028 | | | 149,186 | |
| | 495,000 | | | Lloyds Banking Group PLC, 4.050%, 8/16/2023 | | | 491,739 | |
| | 855,000 | | | Mitsubishi UFJ Financial Group, Inc., 3.761%, 7/26/2023 | | | 850,601 | |
| | 280,000 | | | Mitsubishi UFJ Financial Group, Inc., 3.961%, 3/02/2028 | | | 275,489 | |
| | 430,000 | | | Mizuho Financial Group, Inc., (fixed rate to 9/11/2028, variable rate thereafter), 4.254%, 9/11/2029 | | | 428,484 | |
| | 855,000 | | | Morgan Stanley, Series 3NC2, 3-month LIBOR + 0.800%, 3.119%, 2/14/2020(e) | | | 857,017 | |
| | 885,000 | | | National Bank of Canada, 2.200%, 11/02/2020 | | | 864,176 | |
| | 620,000 | | | Nationwide Building Society, (fixed rate to 3/08/2023, variable rate thereafter), 3.766%, 3/08/2024, 144A | | | 604,929 | |
| | 620,000 | | | Nationwide Building Society, (fixed rate to 8/01/2023, variable rate thereafter), 4.363%, 8/01/2024, 144A | | | 616,756 | |
| | 540,000 | | | Nordea Bank AB, 1.625%, 9/30/2019, 144A | | | 532,721 | |
| | 845,000 | | | Nordea Bank AB, 2.125%, 5/29/2020, 144A | | | 829,621 | |
See accompanying notes to financial statements.
41 |
Portfolio of Investments – as of September 30, 2018
Loomis Sayles Intermediate Duration Bond Fund – (continued)
| | | | | | | | |
Principal
Amount | | | Description | | Value (†) | |
| | | | Banking — continued | |
| $ | 315,000 | | | Northern Trust Corp., (fixed rate to 5/08/2027, variable rate thereafter), 3.375%, 5/08/2032 | | $ | 293,615 | |
| | 400,000 | | | PNC Bank NA, 4.050%, 7/26/2028 | | | 400,314 | |
| | 530,000 | | | Royal Bank of Canada, 2.150%, 10/26/2020 | | | 519,394 | |
| | 605,000 | | | Royal Bank of Scotland Group PLC, (fixed rate to 1/27/2029, variable rate thereafter), 5.076%, 1/27/2030 | | | 603,932 | |
| | 425,000 | | | Santander Holdings USA, Inc., 3.700%, 3/28/2022 | | | 419,774 | |
| | 350,000 | | | Santander UK PLC, 2.125%, 11/03/2020 | | | 340,533 | |
| | 505,000 | | | Santander UK PLC, 2.500%, 1/05/2021 | | | 494,213 | |
| | 305,000 | | | State Street Corp., (fixed rate to 5/15/2022, variable rate thereafter), 2.653%, 5/15/2023 | | | 295,339 | |
| | 235,000 | | | Sumitomo Mitsui Financial Group, Inc., 2.784%, 7/12/2022 | | | 227,485 | |
| | 365,000 | | | SunTrust Banks, Inc., 4.000%, 5/01/2025 | | | 365,911 | |
| | 890,000 | | | Synchrony Bank, 3.650%, 5/24/2021 | | | 882,607 | |
| | 150,000 | | | Synchrony Financial, 3.700%, 8/04/2026 | | | 135,481 | |
| | 90,000 | | | Synchrony Financial, 3.950%, 12/01/2027 | | | 81,531 | |
| | 75,000 | | | Synchrony Financial, 4.250%, 8/15/2024 | | | 72,460 | |
| | 855,000 | | | Toronto Dominion Bank (The), Series MTN, 3.250%, 6/11/2021 | | | 854,723 | |
| | 840,000 | | | U.S. Bank NA, 2.000%, 1/24/2020 | | | 829,561 | |
| | 920,000 | | | UBS AG, 2.200%, 6/08/2020, 144A | | | 903,311 | |
| | 455,000 | | | UniCredit SpA, 3.750%, 4/12/2022, 144A | | | 436,398 | |
| | 855,000 | | | Wells Fargo & Co., MTN, 2.625%, 7/22/2022 | | | 825,803 | |
| | 195,000 | | | Westpac Banking Corp., 2.800%, 1/11/2022 | | | 190,612 | |
| | 25,000 | | | Westpac Banking Corp., 3.650%, 5/15/2023 | | | 25,020 | |
| | | | | | | | |
| | | | | | | 37,317,441 | |
| | | | | | | | |
| | | | Brokerage — 0.2% | |
| | 335,000 | | | Cboe Global Markets, Inc., 1.950%, 6/28/2019 | | | 332,940 | |
| | | | | | | | |
| | | | Building Materials — 0.8% | |
| | 107,000 | | | Fortune Brands Home & Security, Inc., 3.000%, 6/15/2020 | | | 106,086 | |
| | 595,000 | | | Fortune Brands Home & Security, Inc., 4.000%, 9/21/2023 | | | 596,876 | |
| | 600,000 | | | Martin Marietta Materials, Inc., 3-month LIBOR + 0.650%, 2.960%, 5/22/2020(e) | | | 602,004 | |
| | 40,000 | | | Masco Corp., 3.500%, 4/01/2021 | | | 39,979 | |
| | 4,000 | | | Masco Corp., 7.125%, 3/15/2020 | | | 4,201 | |
| | | | | | | | |
| | | | | | | 1,349,146 | |
| | | | | | | | |
| | | | Cable Satellite — 0.4% | |
| | 300,000 | | | Charter Communications Operating LLC/Charter Communications Operating Capital Corp., 4.908%, 7/23/2025 | | | 304,628 | |
| | 320,000 | | | Cox Communications, Inc., 3.150%, 8/15/2024, 144A | | | 302,830 | |
| | | | | | | | |
| | | | | | | 607,458 | |
| | | | | | | | |
| | | | Chemicals — 0.3% | |
| | 9,000 | | | Eastman Chemical Co., 4.500%, 1/15/2021 | | | 9,167 | |
| | 385,000 | | | EI du Pont de Nemours & Co., 2.200%, 5/01/2020 | | | 379,946 | |
| | 45,000 | | | Methanex Corp., 3.250%, 12/15/2019 | | | 44,824 | |
| | | | | | | | |
| | | | | | | 433,937 | |
| | | | | | | | |
See accompanying notes to financial statements.
| 42
Portfolio of Investments – as of September 30, 2018
Loomis Sayles Intermediate Duration Bond Fund – (continued)
| | | | | | | | |
Principal
Amount | | | Description | | Value (†) | |
| | | | Collateralized Mortgage Obligations — 1.5% | |
| $ | 190,073 | | | Government National Mortgage Association, Series 2014-H14, Class FA, 1-month LIBOR + 0.500%, 2.600%, 7/20/2064(e) | | $ | 190,846 | |
| | 132,410 | | | Government National Mortgage Association, Series 2014-H15, Class FA, 1-month LIBOR + 0.500%, 2.580%, 7/20/2064(e) | | | 133,046 | |
| | 158,587 | | | Government National Mortgage Association, Series 2015-H09, Class HA, 1.750%, 3/20/2065 | | | 157,160 | |
| | 443,563 | | | Government National Mortgage Association, Series 2015-H10, Class JA, 2.250%, 4/20/2065(a) | | | 422,073 | |
| | 537,559 | | | Government National Mortgage Association, Series 2016-H06, Class FC, 1-month LIBOR + 0.920%, 3.000%, 2/20/2066(a)(e) | | | 548,202 | |
| | 984,402 | | | Government National Mortgage Association, Series 2016-H10, Class FJ, 1-month LIBOR + 0.600%, 2.680%, 4/20/2066(a)(e) | | | 985,519 | |
| | | | | | | | |
| | | | | | | 2,436,846 | |
| | | | | | | | |
| | | | Construction Machinery — 0.6% | |
| | 215,000 | | | Caterpillar Financial Services Corp., MTN, 2.550%, 11/29/2022 | | | 208,645 | |
| | 300,000 | | | Caterpillar Financial Services Corp., MTN, 3.150%, 9/07/2021 | | | 299,647 | |
| | 350,000 | | | John Deere Capital Corp., MTN, 1.950%, 6/22/2020 | | | 343,788 | |
| | 174,000 | | | John Deere Capital Corp., Series 0014, MTN, 2.450%, 9/11/2020 | | | 171,802 | |
| | | | | | | | |
| | | | | | | 1,023,882 | |
| | | | | | | | |
| | | | Consumer Cyclical Services — 1.1% | |
| | 225,000 | | | Alibaba Group Holding Ltd., 2.500%, 11/28/2019 | | | 223,829 | |
| | 375,000 | | | Amazon.com, Inc., 5.200%, 12/03/2025 | | | 411,807 | |
| | 470,000 | | | Expedia Group, Inc., 3.800%, 2/15/2028 | | | 433,202 | |
| | 735,000 | | | Western Union Co. (The), 4.250%, 6/09/2023 | | | 732,864 | |
| | | | | | | | |
| | | | | | | 1,801,702 | |
| | | | | | | | |
| | | | Diversified Manufacturing — 1.6% | |
| | 455,000 | | | Kennametal, Inc., 4.625%, 6/15/2028 | | | 445,704 | |
| | 490,000 | | | Roper Technologies, Inc., 3.650%, 9/15/2023 | | | 486,694 | |
| | 265,000 | | | Timken Co. (The), 4.500%, 12/15/2028 | | | 260,259 | |
| | 860,000 | | | United Technologies Corp., 3.650%, 8/16/2023 | | | 856,181 | |
| | 175,000 | | | Wabtec Corp., 3-month LIBOR + 1.050%, 3.382%, 9/15/2021(e) | | | 175,357 | |
| | 485,000 | | | Wabtec Corp., 4.700%, 9/15/2028 | | | 477,315 | |
| | | | | | | | |
| | | | | | | 2,701,510 | |
| | | | | | | | |
| | | | Electric — 5.4% | |
| | 510,000 | | | Alliant Energy Finance LLC, 4.250%, 6/15/2028, 144A | | | 506,387 | |
| | 160,000 | | | American Electric Power Co., Inc., 3.200%, 11/13/2027 | | | 149,891 | |
| | 120,000 | | | Consolidated Edison Co. of New York, Inc., Series B, 2.900%, 12/01/2026 | | | 111,578 | |
| | 1,035,000 | | | Consolidated Edison, Inc., Series A, 2.000%, 3/15/2020 | | | 1,017,675 | |
| | 905,000 | | | Duke Energy Carolinas LLC, 3.050%, 3/15/2023 | | | 890,610 | |
| | 480,000 | | | Enel Finance International NV, 4.625%, 9/14/2025, 144A | | | 469,775 | |
| | 410,000 | | | Entergy Texas, Inc., 3.450%, 12/01/2027 | | | 389,731 | |
| | 451,000 | | | Exelon Corp., 2.450%, 4/15/2021 | | | 438,302 | |
| | 179,000 | | | Exelon Generation Co. LLC, 2.950%, 1/15/2020 | | | 178,504 | |
| | 116,000 | | | Exelon Generation Co. LLC, 4.250%, 6/15/2022 | | | 117,727 | |
| | 395,000 | | | Fortis, Inc., 2.100%, 10/04/2021 | | | 377,348 | |
See accompanying notes to financial statements.
43 |
Portfolio of Investments – as of September 30, 2018
Loomis Sayles Intermediate Duration Bond Fund – (continued)
| | | | | | | | |
Principal
Amount | | | Description | | Value (†) | |
| | | | Electric — continued | |
| $ | 595,000 | | | Interstate Power & Light Co., 4.100%, 9/26/2028 | | $ | 598,471 | |
| | 188,000 | | | National Rural Utilities Cooperative Finance Corp., (fixed rate to 4/30/2023, variable rate thereafter), 4.750%, 4/30/2043 | | | 189,319 | |
| | 690,000 | | | National Rural Utilities Cooperative Finance Corp., MTN, 1.500%, 11/01/2019 | | | 678,805 | |
| | 195,000 | | | Oklahoma Gas & Electric Co., 3.800%, 8/15/2028 | | | 191,737 | |
| | 290,000 | | | Pacific Gas & Electric Co., 3.500%, 6/15/2025 | | | 276,690 | |
| | 905,000 | | | PNM Resources, Inc., 3.250%, 3/09/2021 | | | 896,596 | |
| | 530,000 | | | PSEG Power LLC, 3.850%, 6/01/2023 | | | 528,031 | |
| | 273,000 | | | Southern Co. (The), 2.750%, 6/15/2020 | | | 270,338 | |
| | 720,000 | | | Southern Power Co., Series E, 2.500%, 12/15/2021 | | | 696,939 | |
| | | | | | | | |
| | | | | | | 8,974,454 | |
| | | | | | | | |
| | | | Finance Companies — 1.3% | |
| | 315,000 | | | Air Lease Corp., 3.625%, 12/01/2027 | | | 289,403 | |
| | 675,000 | | | Air Lease Corp., 3.875%, 7/03/2023 | | | 668,907 | |
| | 345,000 | | | Aircastle Ltd., 4.400%, 9/25/2023 | | | 345,046 | |
| | 665,000 | | | Ares Capital Corp., 3.625%, 1/19/2022 | | | 650,201 | |
| | 305,000 | | | Aviation Capital Group LLC, 3.875%, 5/01/2023, 144A | | | 301,795 | |
| | | | | | | | |
| | | | | | | 2,255,352 | |
| | | | | | | | |
| | | | Financial Other — 0.4% | |
| | 410,000 | | | Mitsubishi UFJ Lease & Finance Co. Ltd., 2.652%, 9/19/2022, 144A | | | 390,769 | |
| | 370,000 | | | ORIX Corp., 3.250%, 12/04/2024 | | | 352,257 | |
| | | | | | | | |
| | | | | | | 743,026 | |
| | | | | | | | |
| | | | Food & Beverage — 3.1% | |
| | 625,000 | | | Bacardi Ltd., 4.700%, 5/15/2028, 144A | | | 620,475 | |
| | 245,000 | | | Brown-Forman Corp., 3.500%, 4/15/2025 | | | 242,526 | |
| | 855,000 | | | Bunge Ltd. Finance Corp., 4.350%, 3/15/2024 | | | 846,489 | |
| | 885,000 | | | General Mills, Inc., 2.600%, 10/12/2022 | | | 848,519 | |
| | 275,000 | | | Kellogg Co., 4.300%, 5/15/2028 | | | 273,114 | |
| | 855,000 | | | Kraft Heinz Foods Co., 4.000%, 6/15/2023 | | | 857,436 | |
| | 845,000 | | | Molson Coors Brewing Co., 2.250%, 3/15/2020 | | | 832,658 | |
| | 140,000 | | | Smithfield Foods, Inc., 3.350%, 2/01/2022, 144A | | | 135,340 | |
| | 320,000 | | | Sysco Corp., 3.550%, 3/15/2025 | | | 313,079 | |
| | 210,000 | | | Tyson Foods, Inc., 3.900%, 9/28/2023 | | | 210,826 | |
| | | | | | | | |
| | | | | | | 5,180,462 | |
| | | | | | | | |
| | | | Government Owned – No Guarantee — 1.7% | |
| | 865,000 | | | Electricite de France S.A., 4.500%, 9/21/2028, 144A | | | 852,083 | |
| | 445,000 | | | Petroleos Mexicanos, 6.375%, 2/04/2021 | | | 466,587 | |
| | 155,000 | | | Petroleos Mexicanos, 6.875%, 8/04/2026 | | | 163,510 | |
| | 780,000 | | | Sinopec Group Overseas Development 2016 Ltd., 1.750%, 9/29/2019, 144A | | | 769,330 | |
| | 320,000 | | | Syngenta Finance N.V., 5.182%, 4/24/2028, 144A | | | 306,149 | |
| | 255,000 | | | Temasek Financial I Ltd., 3.625%, 8/01/2028, 144A | | | 253,645 | |
| | | | | | | | |
| | | | | | | 2,811,304 | |
| | | | | | | | |
See accompanying notes to financial statements.
| 44
Portfolio of Investments – as of September 30, 2018
Loomis Sayles Intermediate Duration Bond Fund – (continued)
| | | | | | | | |
Principal
Amount | | | Description | | Value (†) | |
| | | | Health Insurance — 0.7% | |
| $ | 860,000 | | | Halfmoon Parent, Inc., 3.750%, 7/15/2023, 144A | | $ | 857,369 | |
| | 310,000 | | | Humana, Inc., 2.500%, 12/15/2020 | | | 304,285 | |
| | | | | | | | |
| | | | | | | 1,161,654 | |
| | | | | | | | |
| | | | Healthcare — 1.5% | |
| | 750,000 | | | Becton, Dickinson and Co., 2.133%, 6/06/2019 | | | 745,550 | |
| | 640,000 | | | Cardinal Health, Inc., 1.948%, 6/14/2019 | | | 636,405 | |
| | 595,000 | | | CVS Health Corp., 4.300%, 3/25/2028 | | | 590,335 | |
| | 45,000 | | | Express Scripts Holding Co., 3.000%, 7/15/2023 | | | 43,331 | |
| | 65,000 | | | Express Scripts Holding Co., 4.750%, 11/15/2021 | | | 67,088 | |
| | 183,000 | | | Life Technologies Corp., 6.000%, 3/01/2020 | | | 189,509 | |
| | 175,000 | | | McKesson Corp., 3.950%, 2/16/2028 | | | 168,981 | |
| | 94,000 | | | Quest Diagnostics, Inc., 4.750%, 1/30/2020 | | | 95,985 | |
| | | | | | | | |
| | | | | | | 2,537,184 | |
| | | | | | | | |
| | | | Hybrid ARMs — 0.1% | |
| | 47,392 | | | FHLMC, 1-year CMT + 2.251%, 4.113%, 1/01/2035(e) | | | 49,815 | |
| | 122,648 | | | FHLMC, 1-year CMT + 2.500%, 4.195%, 5/01/2036(e) | | | 130,061 | |
| | | | | | | | |
| | | | | | | 179,876 | |
| | | | | | | | |
| | | | Independent Energy — 0.4% | |
| | 300,000 | | | Apache Corp., 4.375%, 10/15/2028 | | | 294,231 | |
| | 179,000 | | | Encana Corp., 6.500%, 5/15/2019 | | | 182,877 | |
| | 220,000 | | | EQT Corp., 3.900%, 10/01/2027 | | | 206,143 | |
| | | | | | | | |
| | | | | | | 683,251 | |
| | | | | | | | |
| | | | Industrial Other — 0.3% | |
| | 490,000 | | | Fluor Corp., 4.250%, 9/15/2028 | | | 479,853 | |
| | | | | | | | |
| | | | Integrated Energy — 0.1% | |
| | 220,000 | | | BP Capital Markets America, Inc., 3.937%, 9/21/2028 | | | 221,397 | |
| | | | | | | | |
| | | | Life Insurance — 2.1% | |
| | 85,000 | | | AIG Global Funding, 2.150%, 7/02/2020, 144A | | | 83,356 | |
| | 380,000 | | | Athene Global Funding, 2.750%, 4/20/2020, 144A | | | 375,248 | |
| | 540,000 | | | Athene Holding Ltd., 4.125%, 1/12/2028 | | | 504,521 | |
| | 330,000 | | | Brighthouse Financial, Inc., Series WI, 3.700%, 6/22/2027 | | | 292,954 | |
| | 830,000 | | | Jackson National Life Global Funding, 2.200%, 1/30/2020, 144A | | | 819,983 | |
| | 310,000 | | | Jackson National Life Global Funding, 3.875%, 6/11/2025, 144A | | | 308,020 | |
| | 740,000 | | | Reliance Standard Life Global Funding, 3.850%, 9/19/2023, 144A | | | 737,865 | |
| | 344,000 | | | Reliance Standard Life Global Funding II, 2.150%, 10/15/2018, 144A | | | 343,949 | |
| | 63,000 | | | Unum Group, 5.625%, 9/15/2020 | | | 65,575 | |
| | | | | | | | |
| | | | | | | 3,531,471 | |
| | | | | | | | |
| | | | Lodging — 0.1% | |
| | 245,000 | | | Hyatt Hotels Corp., 4.375%, 9/15/2028 | | | 240,891 | |
| | | | | | | | |
| | | | Media Entertainment — 0.4% | |
| | 95,000 | | | Activision Blizzard, Inc., 2.300%, 9/15/2021 | | | 92,208 | |
| | 425,000 | | | CBS Corp., 2.900%, 6/01/2023, 144A | | | 404,266 | |
See accompanying notes to financial statements.
45 |
Portfolio of Investments – as of September 30, 2018
Loomis Sayles Intermediate Duration Bond Fund – (continued)
| | | | | | | | |
Principal
Amount | | | Description | | Value (†) | |
| | | | Media Entertainment — continued | |
| $ | 130,000 | | | Interpublic Group of Cos., Inc. (The), 3.500%, 10/01/2020 | | $ | 130,012 | |
| | 112,000 | | | S&P Global, Inc, 3.300%, 8/14/2020 | | | 112,023 | |
| | | | | | | | |
| | | | | | | 738,509 | |
| | | | | | | | |
| | | | Midstream — 0.5% | |
| | 185,000 | | | Buckeye Partners LP, 3.950%, 12/01/2026 | | | 170,568 | |
| | 155,000 | | | Enbridge, Inc., 3.500%, 6/10/2024 | | | 151,024 | |
| | 60,000 | | | Energy Transfer Partners LP, 4.900%, 2/01/2024 | | | 61,841 | |
| | 255,000 | | | Kinder Morgan Energy Partners LP, 4.150%, 2/01/2024 | | | 255,750 | |
| | 85,000 | | | Kinder Morgan, Inc., 4.300%, 3/01/2028 | | | 84,277 | |
| | 160,000 | | | Plains All American Pipeline LP/PAA Finance Corp., 3.850%, 10/15/2023 | | | 157,560 | |
| | | | | | | | |
| | | | | | | 881,020 | |
| | | | | | | | |
| | | | Mortgage Related — 3.8% | |
| | 3,470 | | | FHLMC, 3.000%, 10/01/2026 | | | 3,445 | |
| | 345 | | | FHLMC, 6.500%, 1/01/2024 | | | 381 | |
| | 66 | | | FHLMC, 8.000%, 7/01/2025 | | | 71 | |
| | 114 | | | FNMA, 6.000%, 9/01/2021 | | | 115 | |
| | 203,438 | | | GNMA, 4.254%, 2/20/2063(c) | | | 206,511 | |
| | 378,726 | | | GNMA, 4.297%, 2/20/2063(a)(c) | | | 383,263 | |
| | 236,775 | | | GNMA, 4.411%, 10/20/2066(c) | | | 247,118 | |
| | 60,292 | | | GNMA, 4.412%, 6/20/2066(c) | | | 62,605 | |
| | 144,629 | | | GNMA, 4.415%, 10/20/2062(c) | | | 146,467 | |
| | 107,761 | | | GNMA, 4.428%, 9/20/2066(c) | | | 112,247 | |
| | 133,536 | | | GNMA, 4.453%, 5/20/2062(c) | | | 134,800 | |
| | 62,339 | | | GNMA, 4.457%, 11/20/2066(c) | | | 64,839 | |
| | 65,712 | | | GNMA, 4.463%, 8/20/2066(c) | | | 68,455 | |
| | 188,485 | | | GNMA, 4.501%, 4/20/2063(c) | | | 191,275 | |
| | 346,760 | | | GNMA, 4.512%, 4/20/2063(a)(c) | | | 352,330 | |
| | 115,395 | | | GNMA, 4.516%, 11/20/2066(c) | | | 120,669 | |
| | 142,101 | | | GNMA, 4.517%, 5/20/2062(c) | | | 143,708 | |
| | 1,212,731 | | | GNMA, 4.523%, with various maturities from 2066 to 2067(a)(c)(f) | | | 1,273,853 | |
| | 189,288 | | | GNMA, 4.533%, 9/20/2066(c) | | | 198,499 | |
| | 93,938 | | | GNMA, 4.547%, 10/20/2066(c) | | | 98,695 | |
| | 233,189 | | | GNMA, 4.558%, 11/20/2064(c) | | | 236,135 | |
| | 471,098 | | | GNMA, 4.559%, 7/20/2067(a)(c) | | | 496,685 | |
| | 166,335 | | | GNMA, 4.564%, 3/20/2063(c) | | | 168,989 | |
| | 189,810 | | | GNMA, 4.584%, 2/20/2063(c) | | | 192,537 | |
| | 865,709 | | | GNMA, 4.593%, 1/20/2067(a)(c) | | | 913,885 | |
| | 89,625 | | | GNMA, 4.637%, 7/20/2062(c) | | | 90,535 | |
| | 29,071 | | | GNMA, 4.685%, 8/20/2061(c) | | | 29,134 | |
| | 449,261 | | | GNMA, 4.688%, 5/20/2064(a)(c) | | | 469,929 | |
| | 1,114 | | | GNMA, 6.500%, 12/15/2023 | | | 1,223 | |
| | 109 | | | GNMA, 8.500%, 9/15/2022 | | | 109 | |
| | 93 | | | GNMA, 9.500%, 1/15/2019 | | | 93 | |
| | | | | | | | |
| | | | | | | 6,408,600 | |
| | | | | | | | |
See accompanying notes to financial statements.
| 46
Portfolio of Investments – as of September 30, 2018
Loomis Sayles Intermediate Duration Bond Fund – (continued)
| | | | | | | | |
Principal
Amount | | | Description | | Value (†) | |
| | | | Natural Gas — 0.6% | |
| $ | 965,000 | | | Sempra Energy, 1.625%, 10/07/2019 | | $ | 951,025 | |
| | | | | | | | |
| | | | Non-Agency Commercial Mortgage-Backed Securities — 7.4% | |
| | 565,000 | | | Barclays Commercial Mortgage Securities Trust, Series 2017-C1, Class A2, 3.189%, 2/15/2050(a) | | | 560,617 | |
| | 491,600 | | | CFCRE Commercial Mortgage Trust, Series 2016-C3, Class A3, 3.865%, 1/10/2048(a) | | | 492,481 | |
| | 361,996 | | | CFCRE Commercial Mortgage Trust, Series 2016-C4, Class A4, 3.283%, 5/10/2058 | | | 350,135 | |
| | 992,138 | | | Citigroup Commercial Mortgage Trust, Series 2016-GC37, Class A4, 3.314%, 4/10/2049(a) | | | 964,199 | |
| | 263,676 | | | Commercial Mortgage Pass Through Certificates, Series 2013-CR8, Class A5, 3.612%, 6/10/2046(c) | | | 265,275 | |
| | 535,000 | | | Commercial Mortgage Pass Through Certificates, Series 2012-LTRT, Class A2, 3.400%, 10/05/2030, 144A(a) | | | 514,544 | |
| | 71,633 | | | Commercial Mortgage Pass Through Certificates, Series 2014-CR14, Class A2, 3.147%, 2/10/2047 | | | 71,633 | |
| | 178,799 | | | Commercial Mortgage Pass Through Certificates, Series 2014-CR15, Class A2, 2.928%, 2/10/2047 | | | 178,776 | |
| | 205,578 | | | Commercial Mortgage Pass Through Certificates, Series 2014-CR16, Class ASB, 3.653%, 4/10/2047 | | | 206,835 | |
| | 478,193 | | | Commercial Mortgage Pass Through Certificates, Series 2014-LC17, Class A3, 3.723%, 10/10/2047(a) | | | 481,216 | |
| | 730,000 | | | Commercial Mortgage Pass Through Certificates, Series 2014-TWC, Class A, 1-month LIBOR + 0.850%, 2.983%, 2/13/2032, 144A(a)(e) | | | 730,684 | |
| | 280,000 | | | Commercial Mortgage Pass Through Certificates, Series 2014-UBS3, Class A4, 3.819%, 6/10/2047 | | | 283,098 | |
| | 520,299 | | | Commercial Mortgage Pass Through Certificates, Series 2016-DC2, Class A5, 3.765%, 2/10/2049(a) | | | 520,221 | |
| | 280,000 | | | Commercial Mortgage Trust, Series 2015-DC1, Class A5, 3.350%, 2/10/2048 | | | 274,682 | |
| | 640,000 | | | Credit Suisse Mortgage Capital Certificates, Series 2014-USA, Class A2, 3.953%, 9/15/2037, 144A(a) | | | 637,734 | |
| | 84,913 | | | CSAIL Commercial Mortgage Trust, Series 2015-C4, Class ASB, 3.617%, 11/15/2048 | | | 85,039 | |
| | 340,000 | | | GS Mortgage Securities Corp. Trust, Series 2013-PEMB, Class A, 3.668%, 3/05/2033, 144A(c) | | | 326,425 | |
| | 330,000 | | | GS Mortgage Securities Trust, Series 2014-GC18, Class A4, 4.074%, 1/10/2047 | | | 338,358 | |
| | 22,302 | | | GS Mortgage Securities Trust, Series 2014-GC20, Class A3, 3.680%, 4/10/2047 | | | 22,341 | |
| | 180,000 | | | Hudsons Bay Simon JV Trust, Series 2015-HB10, Class A10, 4.155%, 8/05/2034, 144A | | | 176,297 | |
| | 355,000 | | | Hudsons Bay Simon JV Trust, Series 2015-HB7, Class A7, 3.914%, 8/05/2034, 144A | | | 348,770 | |
| | 120,665 | | | JPMorgan Chase Commercial Mortgage Securities Trust, Series 2014-C19, Class ASB, 3.584%, 4/15/2047 | | | 121,461 | |
| | 217,607 | | | JPMorgan Chase Commercial Mortgage Securities Trust, Series 2017-JP5, Class A1, 2.086%, 3/15/2050 | | | 213,536 | |
| | 240,000 | | | Morgan Stanley Bank of America Merrill Lynch Trust, Series 2013-C10, Class A4, 4.219%, 7/15/2046(c) | | | 245,802 | |
See accompanying notes to financial statements.
47 |
Portfolio of Investments – as of September 30, 2018
Loomis Sayles Intermediate Duration Bond Fund – (continued)
| | | | | | | | |
Principal
Amount | | | Description | | Value (†) | |
| | | | Non-Agency Commercial Mortgage-Backed Securities — continued | |
| $ | 263,676 | | | Morgan Stanley Bank of America Merrill Lynch Trust, Series 2014-C14, Class A3, 3.669%, 2/15/2047 | | $ | 265,167 | |
| | 129,604 | | | Morgan Stanley Bank of America Merrill Lynch Trust, Series 2015-C22, Class A4, 3.306%, 4/15/2048 | | | 126,745 | |
| | 200,987 | | | Starwood Retail Property Trust, Inc., Series 2014-STAR, Class A, 1-month LIBOR + 1.220%, 3.378%, 11/15/2027, 144A(e) | | | 201,061 | |
| | 505,000 | | | UBS-Barclays Commercial Mortgage Trust, Series 2012-TFT, Class A, 2.892%, 6/05/2030, 144A(a) | | | 495,045 | |
| | 565,000 | | | UBS-Barclays Commercial Mortgage Trust, Series 2013-C6, Class A4, 3.244%, 4/10/2046(a) | | | 559,381 | |
| | 201,109 | | | Wells Fargo Commercial Mortgage Trust, Series 2016-C33, Class A4, 3.426%, 3/15/2059 | | | 196,472 | |
| | 1,295,000 | | | Wells Fargo Commercial Mortgage Trust, Series 2017-RC1, Class A2, 3.118%, 1/15/2060(a) | | | 1,279,971 | |
| | 18,497 | | | WFCG Commercial Mortgage Trust, Series 2015-BXRP, Class A, 1-month LIBOR + 1.122%, 3.280%, 11/15/2029, 144A(e) | | | 18,549 | |
| | 178,764 | | | WFRBS Commercial Mortgage Trust, Series 2014-C19, Class A3, 3.660%, 3/15/2047 | | | 179,795 | |
| | 325,000 | | | WFRBS Commercial Mortgage Trust, Series 2014-C19, Class A5, 4.101%, 3/15/2047 | | | 333,084 | |
| | 348,589 | | | WFRBS Commercial Mortgage Trust, Series 2014-C20, Class ASB, 3.638%, 5/15/2047(a) | | | 350,752 | |
| | | | | | | | |
| | | | | | | 12,416,181 | |
| | | | | | | | |
| | | | Oil Field Services — 0.4% | |
| | 770,000 | | | Baker Hughes a GE Co. LLC / Baker Hughes Co-Obligor, Inc., 2.773%, 12/15/2022 | | | 746,024 | |
| | | | | | | | |
| | | | Paper — 0.4% | |
| | 625,000 | | | WestRock Co., 3.750%, 3/15/2025, 144A | | | 614,209 | |
| | | | | | | | |
| | | | Pharmaceuticals — 1.5% | |
| | 600,000 | | | AbbVie, Inc., 4.250%, 11/14/2028 | | | 593,216 | |
| | 22,000 | | | Amgen, Inc., 2.200%, 5/22/2019 | | | 21,920 | |
| | 235,000 | | | Bayer U.S. Finance II LLC, 3.375%, 7/15/2024, 144A | | | 223,750 | |
| | 860,000 | | | Pfizer, Inc., 3.200%, 9/15/2023 | | | 852,729 | |
| | 775,000 | | | Shire Acquisitions Investments Ireland DAC, 1.900%, 9/23/2019 | | | 766,714 | |
| | | | | | | | |
| | | | | | | 2,458,329 | |
| | | | | | | | |
| | | | Property & Casualty Insurance — 0.3% | |
| | 435,000 | | | American Financial Group, Inc., 3.500%, 8/15/2026 | | | 404,937 | |
| | 180,000 | | | Assurant, Inc., 4.200%, 9/27/2023 | | | 178,997 | |
| | | | | | | | |
| | | | | | | 583,934 | |
| | | | | | | | |
| | | | Railroads — 0.3% | |
| | 206,000 | | | CSX Corp., 3.700%, 10/30/2020 | | | 208,040 | |
| | 215,000 | | | Union Pacific Corp., 3.646%, 2/15/2024 | | | 214,378 | |
| | | | | | | | |
| | | | | | | 422,418 | |
| | | | | | | | |
See accompanying notes to financial statements.
| 48
Portfolio of Investments – as of September 30, 2018
Loomis Sayles Intermediate Duration Bond Fund – (continued)
| | | | | | | | |
Principal
Amount | | | Description | | Value (†) | |
| | | | REITs – Health Care — 0.4% | |
| $ | 31,000 | | | Healthcare Realty Trust, Inc., 3.750%, 4/15/2023 | | $ | 30,321 | |
| | 405,000 | | | Omega Healthcare Investors, Inc., 4.500%, 1/15/2025 | | | 397,192 | |
| | 225,000 | | | Omega Healthcare Investors, Inc., 4.500%, 4/01/2027 | | | 215,349 | |
| | | | | | | | |
| | | | | | | 642,862 | |
| | | | | | | | |
| | | | REITs – Shopping Centers — 0.2% | |
| | 355,000 | | | Brixmor Operating Partnership LP, 3.650%, 6/15/2024 | | | 341,225 | |
| | | | | | | | |
| | | | REITs – Single Tenant — 0.2% | |
| | 290,000 | | | Select Income REIT, 4.250%, 5/15/2024 | | | 277,428 | |
| | | | | | | | |
| | | | Restaurants — 1.0% | |
| | 1,030,000 | | | McDonald’s Corp., MTN, 2.625%, 1/15/2022 | | | 1,002,120 | |
| | 695,000 | | | McDonald’s Corp., MTN, 3.350%, 4/01/2023 | | | 689,094 | |
| | | | | | | | |
| | | | | | | 1,691,214 | |
| | | | | | | | |
| | | | Retailers — 1.3% | |
| | 465,000 | | | AutoNation, Inc., 3.500%, 11/15/2024 | | | 440,589 | |
| | 415,000 | | | Best Buy Co., Inc., 4.450%, 10/01/2028 | | | 413,199 | |
| | 470,000 | | | Ralph Lauren Corp., 3.750%, 9/15/2025 | | | 464,793 | |
| | 850,000 | | | Seven & i Holdings Co. Ltd., 3.350%, 9/17/2021, 144A | | | 850,655 | |
| | | | | | | | |
| | | | | | | 2,169,236 | |
| | | | | | | | |
| | | | Technology — 2.6% | |
| | 460,000 | | | Fiserv, Inc., 3.800%, 10/01/2023 | | | 459,886 | |
| | 450,000 | | | Genpact Luxembourg S.a.r.l., 3.700%, 4/01/2022 | | | 439,403 | |
| | 610,000 | | | Hewlett Packard Enterprise Co., 2.100%, 10/04/2019, 144A | | | 604,056 | |
| | 120,000 | | | Hewlett Packard Enterprise Co., 4.900%, 10/15/2025 | | | 123,353 | |
| | 89,000 | | | Jabil, Inc., 5.625%, 12/15/2020 | | | 92,382 | |
| | 175,000 | | | Marvell Technology Group Ltd., 4.200%, 6/22/2023 | | | 174,142 | |
| | 140,000 | | | Microchip Technology, Inc., 3.922%, 6/01/2021, 144A | | | 139,180 | |
| | 885,000 | | | NetApp, Inc., 2.000%, 9/27/2019 | | | 877,109 | |
| | 215,000 | | | Pitney Bowes, Inc., 4.375%, 5/15/2022 | | | 199,144 | |
| | 425,000 | | | Pitney Bowes, Inc., 4.700%, 4/01/2023 | | | 388,752 | |
| | 205,000 | | | Seagate Hdd Cayman, 4.875%, 3/01/2024 | | | 202,054 | |
| | 90,000 | | | Trimble, Inc., 4.150%, 6/15/2023 | | | 90,053 | |
| | 630,000 | | | Xerox Corp., 3.625%, 3/15/2023 | | | 600,819 | |
| | | | | | | | |
| | | | | | | 4,390,333 | |
| | | | | | | | |
| | | | Transportation Services — 1.0% | |
| | 140,000 | | | CH Robinson Worldwide, Inc., 4.200%, 4/15/2028 | | | 137,867 | |
| | 570,000 | | | Penske Truck Leasing Co. LP/PTL Finance Corp., 4.125%, 8/01/2023, 144A | | | 569,061 | |
| | 510,000 | | | Ryder System, Inc., MTN, 3.750%, 6/09/2023 | | | 508,835 | |
| | 430,000 | | | TTX Co., 2.600%, 6/15/2020, 144A | | | 423,663 | |
| | | | | | | | |
| | | | | | | 1,639,426 | |
| | | | | | | | |
| | | | Treasuries — 2.2% | |
| | 1,670,000 | | | U.S. Treasury Note, 1.125%, 1/15/2019 | | | 1,664,550 | |
| | 2,000,000 | | | U.S. Treasury Note, 2.875%, 5/15/2028 | | | 1,969,844 | |
| | | | | | | | |
| | | | | | | 3,634,394 | |
| | | | | | | | |
See accompanying notes to financial statements.
49 |
Portfolio of Investments – as of September 30, 2018
Loomis Sayles Intermediate Duration Bond Fund – (continued)
| | | | | | | | |
Principal
Amount | | | Description | | Value (†) | |
| | | | Wireless — 0.5% | |
| $ | 200,000 | | | SK Telecom Co. Ltd., 3.750%, 4/16/2023, 144A | | $ | 198,058 | |
| | 140,000 | | | Vodafone Group PLC, 4.125%, 5/30/2025 | | | 138,917 | |
| | 435,000 | | | Vodafone Group PLC, 4.375%, 5/30/2028 | | | 428,574 | |
| | | | | | | | |
| | | | | | | 765,549 | |
| | | | | | | | |
| | | | Wirelines — 1.1% | |
| | 660,000 | | | AT&T, Inc., 3-month LIBOR + 1.180%, 3.514%, 6/12/2024(e) | | | 662,970 | |
| | 400,000 | | | Deutsche Telekom International Finance BV, 1.500%, 9/19/2019, 144A | | | 393,608 | |
| | 870,000 | | | Verizon Communications, Inc., 3.376%, 2/15/2025 | | | 844,489 | |
| | | | | | | | |
| | | | | | | 1,901,067 | |
| | | | | | | | |
| | | | Total Bonds and Notes
(Identified Cost $167,034,249) | | | 164,133,866 | |
| | | | | | | | |
| | | | | | | | |
| | Short-Term Investments — 1.6% | |
| | 2,700,638 | | | Tri-Party Repurchase Agreement with Fixed Income Clearing Corporation, dated 9/28/2018 at 1.300% to be repurchased at $2,700,931 on 10/01/2018 collateralized by $2,740,000 Federal Home Loan Mortgage Corp., 3.750% due 3/27/2019 valued at $2,757,903 including accrued interest (Note 2 of Notes to Financial Statements) (Identified Cost $2,700,638) | | | 2,700,638 | |
| | | | | | | | |
| | | | | | | | |
| | | | Total Investments — 99.7%
(Identified Cost $169,734,887) | | | 166,834,504 | |
| | | | Other assets less liabilities — 0.3% | | | 436,470 | |
| | | | | | | | |
| | | | Net Assets — 100.0% | | $ | 167,270,974 | |
| | | | | | | | |
| | | | | | | | |
| | (†) | | | See Note 2 of Notes to Financial Statements. | |
| | (a) | | | Security (or a portion thereof) has been designated to cover the Fund’s obligations under open derivative contracts. | |
| | (b) | | | Level 3 security. Value has been determined using significant unobservable inputs. See Note 3 of Notes to Financial Statements. | |
| | (c) | | | Variable rate security. The interest rate adjusts periodically based on; (i) changes in current interest rates and/or prepayments on underlying pools of assets, if applicable, (ii) reference to a base lending rate plus or minus a margin, and/or (iii) reference to a base lending rate adjusted by a multiplier and/or subject to certain floors or caps. Rate as of September 30, 2018 is disclosed. | |
| | (d) | | | Fair valued by the Fund’s adviser. At September 30, 2018, the value of this security amounted to $14,830 or less than 0.1% of net assets. See Note 2 of Notes to Financial Statements. | |
| | (e) | | | Variable rate security. Rate as of September 30, 2018 is disclosed. | |
| | (f) | | | The Fund’s investment in mortgage related securities of Federal Home Loan Mortgage Corporation and Government National Mortgage Association are interests in separate pools of mortgages. All separate investments in securities of each issuer which have the same coupon rate have been aggregated for the purpose of presentation in the Portfolio of Investments. | |
| | | | | |
See accompanying notes to financial statements.
| 50
Portfolio of Investments – as of September 30, 2018
Loomis Sayles Intermediate Duration Bond Fund – (continued)
| | | | | | | | |
| | | | | |
| | 144A | | | All or a portion of these securities are exempt from registration under Rule 144A of the Securities Act of 1933. These securities may be resold in transactions exempt from registration, normally to qualified institutional buyers. At September 30, 2018, the value of Rule 144A holdings amounted to $51,027,087 or 30.5% of net assets. | |
| | ABS | | | Asset-Backed Securities | | | | |
| | ARMs | | | Adjustable Rate Mortgages | | | | |
| | CMT | | | Constant Maturity Treasury | | | | |
| | FHLMC | | | Federal Home Loan Mortgage Corp. | | | | |
| | FNMA | | | Federal National Mortgage Association | | | | |
| | GNMA | | | Government National Mortgage Association | | | | |
| | LIBOR | | | London Interbank Offered Rate | | | | |
| | MTN | | | Medium Term Note | | | | |
| | REITs | | | Real Estate Investment Trusts | | | | |
At September 30, 2018, open long futures contracts were as follows:
| | | | | | | | | | | | | | | | | | |
| Financial Futures | | Expiration
Date | | | Contracts | | Notional
Amount | | | Value | | | Unrealized
Appreciation
(Depreciation) | |
| 5 Year U.S. Treasury Note | | | 12/31/2018 | | | 184 | | $ | 20,820,399 | | | $ | 20,695,687 | | | $ | (124,712 | ) |
| | | | | | | | | | | | | | | | | | |
Industry Summary at September 30, 2018
| | | | |
Banking | | | 22.3 | % |
ABS Car Loan | | | 11.0 | |
Non-Agency Commercial Mortgage-Backed Securities | | | 7.4 | |
Electric | | | 5.4 | |
Automotive | | | 5.1 | |
Mortgage Related | | | 3.8 | |
ABS Other | | | 3.4 | |
Food & Beverage | | | 3.1 | |
Technology | | | 2.6 | |
Treasuries | | | 2.2 | |
Life Insurance | | | 2.1 | |
Other Investments, less than 2% each | | | 29.7 | |
Short-Term Investments | | | 1.6 | |
| | | | |
Total Investments | | | 99.7 | |
Other assets less liabilities (including futures contracts) | | | 0.3 | |
| | | | |
Net Assets | | | 100.0 | % |
| | | | |
See accompanying notes to financial statements.
51 |
Portfolio of Investments – as of September 30, 2018
Loomis Sayles Limited Term Government and Agency Fund
| | | | | | | | |
Principal
Amount | | | Description | | Value (†) | |
| | Bonds and Notes — 94.4% of Net Assets | |
| | | | ABS Car Loan — 1.4% | |
| $ | 1,550,000 | | | Avis Budget Rental Car Funding AESOP LLC, Series 2016-1A, Class A, 2.990%, 6/20/2022, 144A | | $ | 1,529,848 | |
| | 1,042,181 | | | Credit Acceptance Auto Loan Trust, Series 2016-2A, Class A, 2.420%, 11/15/2023, 144A | | | 1,041,135 | |
| | 2,875,000 | | | Credit Acceptance Auto Loan Trust, Series 2016-3A, Class A, 2.150%, 4/15/2024, 144A | | | 2,862,168 | |
| | 1,614,064 | | | Flagship Credit Auto Trust, Series 2016-4, Class A2, 1.960%, 2/16/2021, 144A | | | 1,611,278 | |
| | 725,000 | | | NextGear Floorplan Master Owner Trust, Series 2016-1A, Class A2, 2.740%, 4/15/2021, 144A | | | 724,337 | |
| | 1,495,000 | | | NextGear Floorplan Master Owner Trust, Series 2017-1A, Class A2, 2.540%, 4/18/2022, 144A | | | 1,479,451 | |
| | 685,000 | | | NextGear Floorplan Master Owner Trust, Series 2017-2A, Class A2, 2.560%, 10/17/2022, 144A | | | 675,315 | |
| | | | | | | | |
| | | | | | | 9,923,532 | |
| | | | | | | | |
| | | | ABS Home Equity — 0.3% | |
| | 1,089,815 | | | CoreVest American Finance Trust, Series 2017-1, Class A, 2.968%, 10/15/2049, 144A | | | 1,063,246 | |
| | 1,056,875 | | | Towd Point Mortgage Trust, Series 2015-2, Class 1A12, 2.750%, 11/25/2060, 144A(a) | | | 1,041,144 | |
| | | | | | | | |
| | | | | | | 2,104,390 | |
| | | | | | | | |
| | | | ABS Other — 0.3% | |
| | 1,250,177 | | | Diamond Resorts Owner Trust, Series 2018-1, Class A, 3.700%, 1/21/2031, 144A | | | 1,243,831 | |
| | 825,000 | | | Navistar Financial Dealer Note Master Owner Trust II, Series 2018-1, Class A, 1-month LIBOR + 0.630%, 2.798%, 9/25/2023, 144A(b) | | | 825,647 | |
| | | | | | | | |
| | | | | | | 2,069,478 | |
| | | | | | | | |
| | | | ABS Student Loan — 0.0% | |
| | 157,733 | | | SoFi Professional Loan Program LLC, Series 2016-D, Class A1, 1-month LIBOR + 0.950%, 3.166%, 1/25/2039, 144A(b) | | | 158,610 | |
| | | | | | | | |
| | | | Agency Commercial Mortgage-Backed Securities — 16.4% | |
| | 2,691,243 | | | Federal National Mortgage Association, Series 2015-M17, Class FA, 1-month LIBOR + 0.930%, 2.999%, 11/25/2022(b) | | | 2,716,164 | |
| | 980,253 | | | Federal National Mortgage Association, Series 2016-M3, Class ASQ2, 2.263%, 2/25/2023 | | | 948,678 | |
| | 13,445,000 | | | FHLMC Multifamily Structured Pass Through Certificates, Series KJ20, Class A2, 3.799%, 12/25/2025 | | | 13,692,692 | |
| | 6,000,000 | | | FHLMC Multifamily Structured Pass Through Certificates, Series K006, Class A2, 4.251%, 1/25/2020 | | | 6,077,512 | |
| | 4,274,389 | | | FHLMC Multifamily Structured Pass Through Certificates, Series K014, Class A2, 3.871%, 4/25/2021 | | | 4,339,753 | |
| | 4,000,000 | | | FHLMC Multifamily Structured Pass Through Certificates, Series K015, Class A2, 3.230%, 7/25/2021 | | | 4,010,228 | |
| | 6,625,000 | | | FHLMC Multifamily Structured Pass Through Certificates, Series K017, Class A2, 2.873%, 12/25/2021 | | | 6,577,039 | |
See accompanying notes to financial statements.
| 52
Portfolio of Investments – as of September 30, 2018
Loomis Sayles Limited Term Government and Agency Fund – (continued)
| | | | | | | | |
Principal
Amount | | | Description | | Value (†) | |
| | | | Agency Commercial Mortgage-Backed Securities — continued | |
| $ | 2,580,000 | | | FHLMC Multifamily Structured Pass Through Certificates, Series K064, Class A2, 3.224%, 3/25/2027 | | $ | 2,525,245 | |
| | 840,424 | | | FHLMC Multifamily Structured Pass Through Certificates, Series K706, Class A2, 2.323%, 10/25/2018 | | | 839,015 | |
| | 6,401,116 | | | FHLMC Multifamily Structured Pass Through Certificates, Series K708, Class A2, 2.130%, 1/25/2019 | | | 6,385,178 | |
| | 32,886,853 | | | FHLMC Multifamily Structured Pass Through Certificates, Series K711, Class A2, 1.730%, 7/25/2019 | | | 32,636,160 | |
| | 2,598,396 | | | FHLMC Multifamily Structured Pass Through Certificates, Series K725, Class A1, 2.666%, 5/25/2023 | | | 2,557,424 | |
| | 5,170,000 | | | FHLMC Multifamily Structured Pass Through Certificates, Series K732, Class A2, 3.700%, 5/25/2025 | | | 5,268,084 | |
| | 4,100,025 | | | FHLMC Multifamily Structured Pass Through Certificates, Series KBAM, Class A, 1-month LIBOR + 0.700%, 2.814%, 9/25/2022(b) | | | 4,113,537 | |
| | 443,460 | | | FHLMC Multifamily Structured Pass Through Certificates, Series KF06, Class A, 1-month LIBOR + 0.330%, 2.444%, 11/25/2021(b) | | | 443,595 | |
| | 3,859,531 | | | FHLMC Multifamily Structured Pass Through Certificates, Series KF14, Class A, 1-month LIBOR + 0.650%, 2.764%, 1/25/2023(b) | | | 3,869,381 | |
| | 1,934,172 | | | FHLMC Multifamily Structured Pass Through Certificates, Series KI01, Class A, 1-month LIBOR + 0.160%, 2.274%, 9/25/2022(b) | | | 1,934,430 | |
| | 3,807,253 | | | FHLMC Multifamily Structured Pass Through Certificates, Series KI01, Class A, 1-month LIBOR + 0.200%, 2.314%, 2/25/2023(b) | | | 3,807,252 | |
| | 845,757 | | | FHLMC Multifamily Structured Pass Through Certificates, Series KJ04, Class A1, 1.376%, 10/25/2020 | | | 842,046 | |
| | 10,261,000 | | | FHLMC Multifamily Structured Pass Through Certificates, Series KJ21, Class A2, 3.700%, 9/25/2026 | | | 10,343,052 | |
| | 3,777,702 | | | FHLMC Multifamily Structured Pass Through Certificates, Series KP03, Class A2, 1.780%, 7/25/2019 | | | 3,749,616 | |
| | 173,393 | | | Government National Mortgage Association, Series 2003-72, Class Z, 5.269%, 11/16/2045(a) | | | 178,618 | |
| | 153,282 | | | Government National Mortgage Association, Series 2003-88, Class Z, 4.766%, 3/16/2046(a) | | | 155,273 | |
| | | | | | | | |
| | | | | | | 118,009,972 | |
| | | | | | | | |
| | | | Collateralized Mortgage Obligations — 14.5% | |
| | 54,741 | | | Federal Home Loan Mortgage Corp., REMIC, Series 1500, Class FD, 7-year Treasury - 0.200%,
2.580%, 5/15/2023(b)(c)(d) | | | 53,126 | |
| | 37,079 | | | Federal Home Loan Mortgage Corp., REMIC, Series 1552, Class I, 10-year Treasury - 0.650%,
2.180%, 8/15/2023(b)(c)(d) | | | 36,612 | |
| | 152,501 | | | Federal Home Loan Mortgage Corp., REMIC, Series 2131, Class ZB, 6.000%, 3/15/2029 | | | 158,137 | |
| | 110,897 | | | Federal Home Loan Mortgage Corp., REMIC, Series 2874, Class BC, 5.000%, 10/15/2019 | | | 111,239 | |
| | 319,274 | | | Federal Home Loan Mortgage Corp., REMIC, Series 2931, Class DE, 4.000%, 2/15/2020 | | | 320,760 | |
| | 1,190,158 | | | Federal Home Loan Mortgage Corp., REMIC, Series 2978, Class JG, 5.500%, 5/15/2035 | | | 1,280,907 | |
See accompanying notes to financial statements.
53 |
Portfolio of Investments – as of September 30, 2018
Loomis Sayles Limited Term Government and Agency Fund – (continued)
| | | | | | | | |
Principal
Amount | | | Description | | Value (†) | |
| | | | Collateralized Mortgage Obligations — continued | |
| $ | 1,802,667 | | | Federal Home Loan Mortgage Corp., REMIC, Series 3036, Class NE, 5.000%, 9/15/2035 | | $ | 1,897,334 | |
| | 1,298,299 | | | Federal Home Loan Mortgage Corp., REMIC, Series 3412, Class AY, 5.500%, 2/15/2038 | | | 1,399,240 | |
| | 1,359,825 | | | Federal Home Loan Mortgage Corp., REMIC, Series 3561, Class W, 2.789%, 6/15/2048(a)(e) | | | 1,244,348 | |
| | 1,544,238 | | | Federal Home Loan Mortgage Corp., REMIC, Series 3620, Class AT, 4.184%, 12/15/2036(a)(e) | | | 1,639,034 | |
| | 732,179 | | | Federal Home Loan Mortgage Corp., REMIC, Series 4212, Class FW, 1-month LIBOR + 2.100%, 4.258%, 6/15/2043(b) | | | 693,188 | |
| | 1,306,169 | | | Federal National Mortgage Association, REMIC, Series 2003-48, Class GH, 5.500%, 6/25/2033 | | | 1,400,212 | |
| | 29,494 | | | Federal National Mortgage Association, REMIC, Series 1992-162, Class FB, 7-year Treasury - 0.050%, 2.880%, 9/25/2022(b)(c)(d) | | | 29,199 | |
| | 36,432 | | | Federal National Mortgage Association, REMIC, Series 1994-42, Class FD, 10-year Treasury - 0.500%, 2.330%, 4/25/2024(b)(c)(d) | | | 36,040 | |
| | 9,375 | | | Federal National Mortgage Association, REMIC, Series 2002-W10, Class A7, 4.361%, 8/25/2042(a)(c)(d) | | | 9,459 | |
| | 584,322 | | | Federal National Mortgage Association, REMIC, Series 2005-100, Class BQ, 5.500%, 11/25/2025 | | | 609,284 | |
| | 629,148 | | | Federal National Mortgage Association, REMIC, Series 2007-73, Class A1, 1-month LIBOR + 0.060%, 2.276%, 7/25/2037(b) | | | 618,242 | |
| | 1,383,458 | | | Federal National Mortgage Association, REMIC, Series 2008-86, Class LA, 3.445%, 8/25/2038(a) | | | 1,374,886 | |
| | 5,412,360 | | | Federal National Mortgage Association, REMIC, Series 2013-67, Class NF, 1-month LIBOR + 1.000%, 3.216%, 7/25/2043(b) | | | 5,286,047 | |
| | 17,591 | | | Federal National Mortgage Association, REMIC, Series G93-19, Class FD, 10-year Treasury - 0.650%, 2.320%, 4/25/2023(b)(c)(d) | | | 17,411 | |
| | 9,238 | | | FHLMC Structured Pass Through Securities, Series T-60, Class 2A1, 4.005%, 3/25/2044(a)(c)(d) | | | 9,471 | |
| | 622,472 | | | FHLMC Structured Pass Through Securities, Series T-62, Class 1A1, 12-month MTA + 1.200%, 3.045%, 10/25/2044(b) | | | 619,694 | |
| | 1,151,050 | | | Government National Mortgage Association, Series 2010-H20, Class AF, 1-month LIBOR + 0.330%, 2.410%, 10/20/2060(b) | | | 1,149,266 | |
| | 1,084,884 | | | Government National Mortgage Association, Series 2010-H24, Class FA, 1-month LIBOR + 0.350%, 2.430%, 10/20/2060(b) | | | 1,083,744 | |
| | 896,546 | | | Government National Mortgage Association, Series 2011-H06, Class FA, 1-month LIBOR + 0.450%,
2.530%, 2/20/2061(b) | | | 897,959 | |
| | 2,903,317 | | | Government National Mortgage Association, Series 2011-H23, Class HA, 3.000%, 12/20/2061 | | | 2,898,849 | |
| | 1,255,017 | | | Government National Mortgage Association, Series 2012-124, Class HT, 7.258%, 7/20/2032(a) | | | 1,298,034 | |
| | 408,021 | | | Government National Mortgage Association, Series 2012-H15, Class FA, 1-month LIBOR + 0.450%,
2.530%, 5/20/2062(b) | | | 408,432 | |
| | 1,014,420 | | | Government National Mortgage Association, Series 2012-H18, Class NA, 1-month LIBOR + 0.520%,
2.600%, 8/20/2062(b) | | | 1,018,116 | |
| | 2,122,601 | | | Government National Mortgage Association, Series 2012-H29, Class HF, 1-month LIBOR + 0.500%, 2.580%, 10/20/2062(b) | | | 2,120,794 | |
See accompanying notes to financial statements.
| 54
Portfolio of Investments – as of September 30, 2018
Loomis Sayles Limited Term Government and Agency Fund – (continued)
| | | | | | | | |
Principal
Amount | | | Description | | Value (†) | |
| | | | Collateralized Mortgage Obligations — continued | |
| $ | 1,354,995 | | | Government National Mortgage Association, Series 2013-H02, Class GF, 1-month LIBOR + 0.500%, 2.580%, 12/20/2062(b) | | $ | 1,355,557 | |
| | 4,028,850 | | | Government National Mortgage Association, Series 2013-H08, Class FA, 1-month LIBOR + 0.350%,
2.430%, 3/20/2063(b) | | | 4,024,852 | |
| | 2,762,373 | | | Government National Mortgage Association, Series 2013-H10, Class FA, 1-month LIBOR + 0.400%,
2.480%, 3/20/2063(b) | | | 2,762,861 | |
| | 9,776,213 | | | Government National Mortgage Association, Series 2013-H22, Class FT, 1-year CMT + 0.650%,
3.070%, 4/20/2063(b) | | | 9,823,106 | |
| | 5,722,005 | | | Government National Mortgage Association, Series 2014-H14, Class FA, 1-month LIBOR + 0.500%,
2.600%, 7/20/2064(b) | | | 5,745,263 | |
| | 3,934,955 | | | Government National Mortgage Association, Series 2014-H15, Class FA, 1-month LIBOR + 0.500%,
2.580%, 7/20/2064(b) | | | 3,953,863 | |
| | 3,443,438 | | | Government National Mortgage Association, Series 2015-H04, Class FL, 1-month LIBOR + 0.470%,
2.550%, 2/20/2065(b) | | | 3,453,396 | |
| | 174,910 | | | Government National Mortgage Association, Series 2015-H05, Class FA, 1-month LIBOR + 0.300%,
2.380%, 4/20/2061(b) | | | 174,738 | |
| | 4,236,713 | | | Government National Mortgage Association, Series 2015-H09, Class HA, 1.750%, 3/20/2065 | | | 4,198,583 | |
| | 7,496,780 | | | Government National Mortgage Association, Series 2015-H10, Class JA, 2.250%, 4/20/2065 | | | 7,133,562 | |
| | 590,543 | | | Government National Mortgage Association, Series 2015-H11, Class FA, 1-month LIBOR + 0.250%,
2.330%, 4/20/2065(b) | | | 589,987 | |
| | 5,230,210 | | | Government National Mortgage Association, Series 2015-H12, Class FL, 1-month LIBOR + 0.230%,
2.310%, 5/20/2065(b) | | | 5,210,304 | |
| | 2,726,157 | | | Government National Mortgage Association, Series 2015-H19, Class FH, 1-month LIBOR + 0.300%,
2.380%, 7/20/2065(b) | | | 2,727,311 | |
| | 524,413 | | | Government National Mortgage Association, Series 2015-H29, Class FA, 1-month LIBOR + 0.700%,
2.780%, 10/20/2065(b) | | | 525,265 | |
| | 282,335 | | | Government National Mortgage Association, Series 2015-H30, Class FA, 1-month LIBOR + 0.680%,
2.760%, 8/20/2061(b) | | | 282,744 | |
| | 5,889,434 | | | Government National Mortgage Association, Series 2016-H06, Class FC, 1-month LIBOR + 0.920%,
3.000%, 2/20/2066(b) | | | 6,006,044 | |
| | 3,670,402 | | | Government National Mortgage Association, Series 2016-H10, Class FJ, 1-month LIBOR + 0.600%,
2.680%, 4/20/2066(b) | | | 3,674,569 | |
| | 5,806,427 | | | Government National Mortgage Association, Series 2016-H19, Class FJ, 1-month LIBOR + 0.400%,
2.480%, 9/20/2063(b) | | | 5,805,046 | |
| | 5,966,716 | | | Government National Mortgage Association, Series 2017-H24, Class FJ, 1-month LIBOR + 0.250%,
2.330%, 10/20/2067(b) | | | 5,957,248 | |
| | 234,266 | | | NCUA Guaranteed Notes, Series 2010-A1, Class A, 1-month LIBOR + 0.350%, 2.483%, 12/07/2020(b) | | | 234,543 | |
| | 460,921 | | | NCUA Guaranteed Notes, Series 2010-R1, Class 1A, 1-month LIBOR + 0.450%, 2.530%, 10/07/2020(b) | | | 462,346 | |
| | 977,075 | | | NCUA Guaranteed Notes, Series 2010-R3, Class 1A, 1-month LIBOR + 0.560%, 2.681%, 12/08/2020(b) | | | 979,608 | |
| | 64,838 | | | NCUA Guaranteed Notes, Series 2010-R3, Class 2A, 1-month LIBOR + 0.560%, 2.681%, 12/08/2020(b) | | | 65,158 | |
| | | | | | | | |
| | | | | | | 104,865,018 | |
| | | | | | | | |
See accompanying notes to financial statements.
55 |
Portfolio of Investments – as of September 30, 2018
Loomis Sayles Limited Term Government and Agency Fund – (continued)
| | | | | | | | |
Principal
Amount | | | Description | | Value (†) | |
| | | | Hybrid ARMs — 9.0% | |
| $ | 272,059 | | | FHLMC, 12-month LIBOR + 1.718%, 3.549%, 4/01/2037(b) | | $ | 283,134 | |
| | 1,098,780 | | | FHLMC, 1-year CMT + 2.286%, 3.560%, 2/01/2036(b) | | | 1,159,290 | |
| | 92,743 | | | FHLMC, 12-month LIBOR + 1.725%, 3.698%, 12/01/2037(b) | | | 95,839 | |
| | 183,082 | | | FHLMC, 1-year CMT + 2.214%, 3.791%, 9/01/2038(b) | | | 191,296 | |
| | 570,243 | | | FHLMC, 1-year CMT + 2.165%, 3.796%, 4/01/2036(b) | | | 586,135 | |
| | 2,170,158 | | | FHLMC, 1-year CMT + 2.266%, 3.820%, 2/01/2036(b) | | | 2,285,603 | |
| | 1,537,014 | | | FHLMC, 12-month LIBOR + 1.819%, 3.825%, 4/01/2037(b) | | | 1,611,954 | |
| | 499,431 | | | FHLMC, 6-month LIBOR + 1.666%, 3.888%, 6/01/2037(b) | | | 508,523 | |
| | 660,196 | | | FHLMC, 1-year CMT + 2.106%, 3.892%, 9/01/2038(b) | | | 693,374 | |
| | 3,338,936 | | | FHLMC, 1-year CMT + 2.252%, 3.970%, 3/01/2037(b) | | | 3,509,375 | |
| | 328,478 | | | FHLMC, 1-year CMT + 2.250%, 3.976%, 2/01/2035(b) | | | 345,542 | |
| | 794,812 | | | FHLMC, 1-year CMT + 2.245%, 3.978%, 3/01/2036(b) | | | 836,671 | |
| | 371,301 | | | FHLMC, 12-month LIBOR + 1.841%, 4.051%, 11/01/2038(b) | | | 390,139 | |
| | 342,486 | | | FHLMC, 12-month LIBOR + 1.912%, 4.056%, 12/01/2034(b) | | | 360,992 | |
| | 217,825 | | | FHLMC, 12-month LIBOR + 2.180%, 4.084%, 3/01/2037(b) | | | 230,180 | |
| | 424,083 | | | FHLMC, 12-month LIBOR + 1.846%, 4.086%, 3/01/2038(b) | | | 445,553 | |
| | 291,189 | | | FHLMC, 12-month LIBOR + 1.610%, 4.112%, 11/01/2038(b) | | | 303,982 | |
| | 834,603 | | | FHLMC, 1-year CMT + 2.249%, 4.243%, 9/01/2038(b) | | | 877,570 | |
| | 1,961,478 | | | FHLMC, 12-month LIBOR + 1.896%, 4.271%, 9/01/2041(b) | | | 2,057,834 | |
| | 1,568,215 | | | FHLMC, 12-month LIBOR + 1.767%, 4.365%, 9/01/2035(b) | | | 1,646,615 | |
| | 1,450,581 | | | FHLMC, 1-year CMT + 2.220%, 4.441%, 7/01/2033(b) | | | 1,523,054 | |
| | 417,835 | | | FNMA, 12-month LIBOR + 1.659%, 3.509%, 10/01/2033(b) | | | 435,923 | |
| | 2,663,106 | | | FNMA, 12-month LIBOR + 1.800%, 3.550%, 10/01/2041(b) | | | 2,796,928 | |
| | 724,686 | | | FNMA, 12-month LIBOR + 1.800%, 3.550%, 12/01/2041(b) | | | 759,585 | |
| | 810,334 | | | FNMA, 1-year CMT + 2.185%, 3.599%, 1/01/2036(b) | | | 854,774 | |
| | 320,475 | | | FNMA, 12-month LIBOR + 1.740%, 3.611%, 11/01/2035(b) | | | 335,467 | |
| | 84,661 | | | FNMA, 12-month LIBOR + 1.820%, 3.625%, 1/01/2037(b) | | | 89,017 | |
| | 503,616 | | | FNMA, 12-month LIBOR + 1.765%, 3.692%, 2/01/2037(b) | | | 527,535 | |
| | 2,870,187 | | | FNMA, 1-year CMT + 2.217%, 3.763%, 4/01/2034(b) | | | 3,023,516 | |
| | 726,305 | | | FNMA, 12-month LIBOR + 1.629%, 3.776%, 4/01/2037(b) | | | 758,011 | |
| | 628,776 | | | FNMA, 1-year CMT + 2.489%, 3.860%, 5/01/2035(b) | | | 667,687 | |
| | 582,699 | | | FNMA, 1-year CMT + 2.287%, 3.884%, 10/01/2033(b) | | | 608,995 | |
| | 1,983,763 | | | FNMA, 12-month LIBOR + 1.789%, 3.888%, 3/01/2037(b) | | | 2,083,346 | |
| | 2,059,682 | | | FNMA, 12-month LIBOR + 1.569%, 3.890%, 4/01/2037(b) | | | 2,147,235 | |
| | 454,991 | | | FNMA, 1-year CMT + 2.185%, 3.895%, 12/01/2034(b) | | | 472,444 | |
| | 1,676,165 | | | FNMA, 12-month LIBOR + 1.605%, 3.901%, 7/01/2035(b) | | | 1,744,312 | |
| | 461,333 | | | FNMA, 1-year CMT + 2.127%, 3.917%, 9/01/2034(b) | | | 483,708 | |
| | 1,157,801 | | | FNMA, 12-month LIBOR + 1.820%, 3.917%, 2/01/2047(b) | | | 1,226,503 | |
| | 1,019,384 | | | FNMA, 6-month LIBOR + 1.543%, 3.946%, 7/01/2035(b) | | | 1,053,746 | |
| | 1,611,923 | | | FNMA, 12-month LIBOR + 1.728%, 3.966%, 9/01/2037(b) | | | 1,690,014 | |
| | 105,636 | | | FNMA, 6-month LIBOR + 1.522%, 4.022%, 2/01/2037(b) | | | 109,232 | |
| | 231,210 | | | FNMA, 12-month LIBOR + 1.800%, 4.045%, 3/01/2034(b) | | | 242,839 | |
| | 877,404 | | | FNMA, 1-year CMT + 2.234%, 4.067%, 4/01/2034(b) | | | 922,084 | |
| | 271,219 | | | FNMA, 1-year CMT + 2.207%, 4.082%, 4/01/2033(b) | | | 281,764 | |
| | 421,269 | | | FNMA, 12-month LIBOR + 1.679%, 4.093%, 11/01/2036(b) | | | 440,879 | |
| | 293,339 | | | FNMA, 1-year CMT + 2.500%, 4.118%, 8/01/2036(b) | | | 311,122 | |
| | 3,868,530 | | | FNMA, 1-year CMT + 2.191%, 4.119%, 10/01/2034(b) | | | 4,068,217 | |
See accompanying notes to financial statements.
| 56
Portfolio of Investments – as of September 30, 2018
Loomis Sayles Limited Term Government and Agency Fund – (continued)
| | | | | | | | |
Principal
Amount | | | Description | | Value (†) | |
| | | | Hybrid ARMs — continued | |
| $ | 1,787,503 | | | FNMA, 1-year CMT + 2.184%, 4.164%, 11/01/2033(b) | | $ | 1,875,696 | |
| | 2,662,986 | | | FNMA, 1-year CMT + 2.177%, 4.167%, 12/01/2040(b) | | | 2,797,585 | |
| | 829,137 | | | FNMA, 1-year CMT + 2.182%, 4.202%, 6/01/2036(b) | | | 871,899 | |
| | 2,381,670 | | | FNMA, 12-month LIBOR + 1.575%, 4.295%, 9/01/2037(b) | | | 2,484,446 | |
| | 204,976 | | | FNMA, 12-month LIBOR + 1.576%, 4.326%, 8/01/2035(b) | | | 214,796 | |
| | 1,417,795 | | | FNMA, 12-month LIBOR + 1.615%, 4.340%, 7/01/2038(b) | | | 1,475,813 | |
| | 441,200 | | | FNMA, 1-year CMT + 2.145%, 4.358%, 9/01/2036(b) | | | 463,989 | |
| | 289,518 | | | FNMA, 12-month LIBOR + 1.802%, 4.364%, 7/01/2041(b) | | | 303,454 | |
| | 1,457,334 | | | FNMA, 1-year CMT + 2.272%, 4.384%, 6/01/2037(b) | | | 1,526,785 | |
| | 628,513 | | | FNMA, 1-year CMT +2.287%, 4.392%, 6/01/2033(b) | | | 657,523 | |
| | 380,093 | | | FNMA, 12-month LIBOR + 1.657%, 4.407%, 8/01/2038(b) | | | 392,522 | |
| | 700,931 | | | FNMA, 12-month LIBOR + 1.712%, 4.462%, 8/01/2034(b) | | | 733,471 | |
| | 723,049 | | | FNMA, 1-year CMT + 2.223%, 4.473%, 8/01/2035(b) | | | 761,149 | |
| | 123,854 | | | FNMA, 1-year CMT + 2.439%, 4.641%, 8/01/2033(b) | | | 130,221 | |
| | 1,554,118 | | | FNMA, 6-month LIBOR + 2.252%, 4.668%, 7/01/2037(b) | | | 1,646,684 | |
| | 534,942 | | | FNMA, 12-month LIBOR + 2.473%, 5.098%, 6/01/2035(b) | | | 570,434 | |
| | | | | | | | |
| | | | | | | 64,984,005 | |
| | | | | | | | |
| | | | Mortgage Related — 10.3% | |
| | 70,860 | | | FHLMC, 3.000%, 10/01/2026 | | | 70,339 | |
| | 518,706 | | | FHLMC, 4.000%, with various maturities from 2024 to 2042(f) | | | 529,009 | |
| | 282,002 | | | FHLMC, 4.500%, with various maturities from 2025 to 2034(f) | | | 290,172 | |
| | 121,273 | | | FHLMC, 5.500%, 10/01/2023 | | | 124,808 | |
| | 104,488 | | | FHLMC, COFI + 1.250%, 5.769%, 6/01/2020(b) | | | 105,715 | |
| | 152,126 | | | FHLMC, COFI + 1.250%, 5.887%, 8/01/2020(b) | | | 154,143 | |
| | 105,327 | | | FHLMC, COFI + 1.250%, 5.922%, 10/01/2020(b) | | | 107,006 | |
| | 149,129 | | | FHLMC, COFI + 1.250%, 5.953%, 11/01/2020(b) | | | 151,329 | |
| | 4,754 | | | FHLMC, 6.000%, 11/01/2019 | | | 4,788 | |
| | 259,019 | | | FHLMC, 6.500%, 12/01/2034 | | | 288,520 | |
| | 241 | | | FHLMC, 7.500%, 6/01/2026 | | | 256 | |
| | 145,104 | | | FNMA, 3.000%, 3/01/2042 | | | 140,094 | |
| | 1,472,760 | | | FNMA, 5.000%, with various maturities from 2037 to 2038(f) | | | 1,563,433 | |
| | 699,418 | | | FNMA, 5.500%, with various maturities from 2023 to 2033(f) | | | 728,887 | |
| | 775,487 | | | FNMA, 6.000%, with various maturities from 2021 to 2022(f) | | | 800,639 | |
| | 187,538 | | | FNMA, 6.500%, with various maturities from 2032 to 2037(f) | | | 205,777 | |
| | 302 | | | FNMA, 7.000%, 12/01/2022 | | | 302 | |
| | 73,558 | | | FNMA, 7.500%, with various maturities from 2030 to 2032(f) | | | 78,668 | |
| | 3,325,573 | | | GNMA, 1-month LIBOR + 2.528%, 3.834%, 2/20/2061(b) | | | 3,465,775 | |
| | 2,618,729 | | | GNMA, 1-month LIBOR + 1.928%, 3.980%, 2/20/2063(b) | | | 2,732,171 | |
| | 3,544,458 | | | GNMA, 1-month LIBOR + 2.158%, 4.249%, 3/20/2063(b) | | | 3,694,341 | |
| | 938,422 | | | GNMA, 1-month LIBOR + 2.527%, 4.358%, 6/20/2065(b) | | | 999,511 | |
| | 866,159 | | | GNMA, 1-month LIBOR + 2.226%, 4.361%, 5/20/2065(b) | | | 918,017 | |
| | 1,523,154 | | | GNMA, 4.422%, 3/20/2063(a) | | | 1,546,708 | |
| | 3,627,474 | | | GNMA, 4.424%, with various maturities from 2062 to 2063(a)(f) | | | 3,664,482 | |
| | 2,972,633 | | | GNMA, 4.437%, 6/20/2063(a) | | | 3,025,614 | |
| | 1,845,836 | | | GNMA, 4.448%, 12/20/2061(a) | | | 1,859,091 | |
| | 1,881,072 | | | GNMA, 1-month LIBOR + 2.415%, 4.457%, 2/20/2063(b) | | | 1,970,955 | |
| | 6,965,011 | | | GNMA, 4.481%, 12/20/2061(a) | | | 6,999,329 | |
See accompanying notes to financial statements.
57 |
Portfolio of Investments – as of September 30, 2018
Loomis Sayles Limited Term Government and Agency Fund – (continued)
| | | | | | | | |
Principal
Amount | | | Description | | Value (†) | |
| | | | Mortgage Related — continued | |
| $ | 3,625,053 | | | GNMA, 4.493%, 10/20/2065(a) | | $ | 3,781,166 | |
| | 1,068,129 | | | GNMA, 4.520%, 3/20/2062(a) | | | 1,077,658 | |
| | 5,181,120 | | | GNMA, 4.524%, 12/20/2062(a) | | | 5,252,729 | |
| | 2,246,875 | | | GNMA, 4.529%, 6/20/2062(a) | | | 2,269,815 | |
| | 326,054 | | | GNMA, 4.534%, 8/20/2061(a) | | | 328,585 | |
| | 1,141,490 | | | GNMA, 4.567%, 4/20/2063(a) | | | 1,158,809 | |
| | 524,454 | | | GNMA, 4.579%, 7/20/2063(a) | | | 543,284 | |
| | 7,704,629 | | | GNMA, 4.581%, 11/20/2062(a) | | | 7,804,043 | |
| | 1,914,930 | | | GNMA, 4.604%, 2/20/2066(a) | | | 1,995,409 | |
| | 1,851,141 | | | GNMA, 4.624%, 3/20/2064(a) | | | 1,928,499 | |
| | 829,314 | | | GNMA, 4.626%, 3/20/2062(a) | | | 835,459 | |
| | 401,950 | | | GNMA, 4.652%, 1/20/2064(a) | | | 419,444 | |
| | 2,953,744 | | | GNMA, 4.667%, 2/20/2062(a) | | | 2,977,187 | |
| | 1,944,416 | | | GNMA, 4.675%, 11/20/2063(a) | | | 2,029,132 | |
| | 1,244,074 | | | GNMA, 4.683%, 2/20/2062(a) | | | 1,253,258 | |
| | 1,030,121 | | | GNMA, 4.685%, 8/20/2061(a) | | | 1,032,356 | |
| | 1,479,170 | | | GNMA, 4.688%, 5/20/2064(a) | | | 1,547,219 | |
| | 1,178,076 | | | GNMA, 4.700%, with various maturities in 2061(a)(f) | | | 1,181,049 | |
| | 47,864 | | | GNMA, 4.701%, 3/20/2061(a) | | | 48,622 | |
| | 514,045 | | | GNMA, 4.718%, 8/20/2062(a) | | | 519,168 | |
| | 201,676 | | | GNMA, 5.024%, 4/20/2061(a) | | | 204,551 | |
| | 12,751 | | | GNMA, 6.000%, 12/15/2031 | | | 13,914 | |
| | 54,949 | | | GNMA, 6.500%, 5/15/2031 | | | 60,945 | |
| | 64,181 | | | GNMA, 7.000%, 10/15/2028 | | | 69,380 | |
| | | | | | | | |
| | | | | | | 74,551,560 | |
| | | | | | | | |
| | | | Non-Agency Commercial Mortgage-Backed Securities — 2.1% | |
| | 1,310,000 | | | Commercial Mortgage Pass Through Certificates, Series 2012-LTRT, Class A2, 3.400%, 10/05/2030, 144A | | | 1,259,912 | |
| | 1,488,000 | | | Commercial Mortgage Pass Through Certificates, Series 2014-UBS2, Class A5, 3.961%, 3/10/2047 | | | 1,512,482 | |
| | 4,282,000 | | | Commercial Mortgage Pass Through Certificates, Series 2016-DC2, Class ASB, 3.550%, 2/10/2049 | | | 4,300,496 | |
| | 1,398,894 | | | DBUBS Mortgage Trust, Series 2011-LC2A, Class A4, 4.537%, 7/10/2044, 144A | | | 1,435,186 | |
| | 2,600,000 | | | Hudsons Bay Simon JV Trust, Series 2015-HB7, Class A7, 3.914%, 8/05/2034, 144A | | | 2,554,370 | |
| | 1,040,000 | | | Morgan Stanley Bank of America Merrill Lynch Trust, Series 2013-C8, Class A4, 3.134%, 12/15/2048 | | | 1,026,378 | |
| | 3,380,238 | | | Starwood Retail Property Trust, Inc., Series 2014-STAR, Class A, 1-month LIBOR + 1.220%, 3.378%, 11/15/2027,
144A(b) | | | 3,381,482 | |
| | | | | | | | |
| | | | | | | 15,470,306 | |
| | | | | | | | |
| | | | Sovereigns — 0.3% | |
| | 1,955,000 | | | U.S. Department of Housing and Urban Development, 1.880%, 8/01/2019 | | | 1,942,996 | |
| | | | | | | | |
| | | | Treasuries — 39.8% | |
| | 3,255,000 | | | U.S. Treasury Bond, 3.000%, 8/15/2048 | | | 3,132,556 | |
| | 21,165,000 | | | U.S. Treasury Note, 0.875%, 7/31/2019 | | | 20,867,367 | |
| | 7,000,000 | | | U.S. Treasury Note, 1.125%, 2/28/2021 | | | 6,718,086 | |
See accompanying notes to financial statements.
| 58
Portfolio of Investments – as of September 30, 2018
Loomis Sayles Limited Term Government and Agency Fund – (continued)
| | | | | | | | |
Principal
Amount | | | Description | | Value (†) | |
| | | | Treasuries — continued | |
| $ | 20,395,000 | | | U.S. Treasury Note, 1.125%, 6/30/2021 | | $ | 19,456,511 | |
| | 5,000,000 | | | U.S. Treasury Note, 1.125%, 7/31/2021 | | | 4,762,305 | |
| | 40,920,000 | | | U.S. Treasury Note, 1.125%, 8/31/2021 | | | 38,915,559 | |
| | 20,945,000 | | | U.S. Treasury Note, 1.250%, 7/31/2023 | | | 19,352,035 | |
| | 4,500,000 | | | U.S. Treasury Note, 1.375%, 12/15/2019 | | | 4,429,336 | |
| | 8,220,000 | | | U.S. Treasury Note, 1.375%, 10/31/2020 | | | 7,978,216 | |
| | 19,360,000 | | | U.S. Treasury Note, 1.375%, 1/31/2021 | | | 18,714,919 | |
| | 5,000,000 | | | U.S. Treasury Note, 1.500%, 10/31/2019 | | | 4,936,914 | |
| | 6,600,000 | | | U.S. Treasury Note, 1.500%, 7/15/2020 | | | 6,449,953 | |
| | 12,955,000 | | | U.S. Treasury Note, 1.750%, 10/31/2020 | | | 12,671,103 | |
| | 7,550,000 | | | U.S. Treasury Note, 1.750%, 11/15/2020 | | | 7,381,010 | |
| | 15,000,000 | | | U.S. Treasury Note, 1.750%, 12/31/2020 | | | 14,643,750 | |
| | 8,460,000 | | | U.S. Treasury Note, 1.750%, 6/30/2022 | | | 8,111,355 | |
| | 12,605,000 | | | U.S. Treasury Note, 1.750%, 9/30/2022 | | | 12,045,161 | |
| | 7,895,000 | | | U.S. Treasury Note, 1.875%, 4/30/2022 | | | 7,617,750 | |
| | 17,015,000 | | | U.S. Treasury Note, 2.000%, 12/31/2021 | | | 16,541,106 | |
| | 2,855,000 | | | U.S. Treasury Note, 2.000%, 11/15/2026 | | | 2,641,321 | |
| | 13,945,000 | | | U.S. Treasury Note, 2.125%, 9/30/2021 | | | 13,639,953 | |
| | 13,805,000 | | | U.S. Treasury Note, 2.250%, 1/31/2024 | | | 13,315,893 | |
| | 1,780,000 | | | U.S. Treasury Note, 2.250%, 11/15/2027 | | | 1,666,108 | |
| | 13,415,000 | | | U.S. Treasury Note, 2.875%, 9/30/2023 | | | 13,368,362 | |
| | 7,925,000 | | | U.S. Treasury Note, 3.000%, 9/30/2025 | | | 7,916,023 | |
| | | | | | | | |
| | | | | | | 287,272,652 | |
| | | | | | | | |
| | | | Total Bonds and Notes
(Identified Cost $696,677,050) | | | 681,352,519 | |
| | | | | | | | |
| | | | | | | | |
| | Short-Term Investments — 6.4% | |
| | 19,625,000 | | | Federal Home Loan Bank Discount Notes 1.865% - 1.880%, 10/01/2018(g)(h) | | | 19,625,000 | |
| | 4,265,000 | | | Federal Home Loan Bank Discount Notes 1.950% - 1.965%, 10/04/2018(g)(h) | | | 4,264,249 | |
| | 8,501,689 | | | Tri-Party Repurchase Agreement with Fixed Income Clearing Corporation, dated 9/28/2018 at 1.300% to be repurchased at $8,502,610 on 10/01/2018 collateralized by $8,735,000 U.S. Treasury Bond, 3.125% due 8/15/2044 valued at $8,675,532 including accrued interest (Note 2 of Notes to Financial Statements) | | | 8,501,689 | |
| | 1,545,000 | | | U.S. Treasury Bills, 1.973%, 10/04/2018(g) | | | 1,544,740 | |
| | 1,260,000 | | | U.S. Treasury Bills, 2.073% - 2.090%, 12/27/2018(g)(h) | | | 1,253,446 | |
| | 11,075,000 | | | U.S. Treasury Bills, 2.337% - 2.338%, 4/25/2019(g)(h) | | | 10,926,547 | |
| | | | | | | | |
| | | | Total Short-Term Investments
(Identified Cost $46,116,292) | | | 46,115,671 | |
| | | | | | | | |
| | | | | | | | |
| | | | Total Investments — 100.8%
(Identified Cost $742,793,342) | | | 727,468,190 | |
| | | | Other assets less liabilities — (0.8)% | | | (5,628,820 | ) |
| | | | | | | | |
| | | | Net Assets — 100.0% | | $ | 721,839,370 | |
| | | | | | | | |
See accompanying notes to financial statements.
59 |
Portfolio of Investments – as of September 30, 2018
Loomis Sayles Limited Term Government and Agency Fund – (continued)
| | | | | | |
| | | | |
| | (†) | | | See Note 2 of Notes to Financial Statements. |
| | (a) | | | Variable rate security. The interest rate adjusts periodically based on; (i) changes in current interest rates and/or prepayments on underlying pools of assets, if applicable, (ii) reference to a base lending rate plus or minus a margin, and/or (iii) reference to a base lending rate adjusted by a multiplier and/or subject to certain floors or caps. Rate as of September 30, 2018 is disclosed. |
| | (b) | | | Variable rate security. Rate as of September 30, 2018 is disclosed. |
| | (c) | | | Level 3 security. Value has been determined using significant unobservable inputs. See Note 3 of Notes to Financial Statements. |
| | (d) | | | Fair valued by the Fund’s adviser. At September 30, 2018, the value of these securities amounted to $191,318 or less than 0.1% of net assets. See Note 2 of Notes to Financial Statements. |
| | (e) | | | Security represents right to receive monthly interest payments on an underlying pool of mortgages. Principal shown is the outstanding par amount of the pool held as of the end of the period. |
| | (f) | | | The Fund’s investment in mortgage related securities of Federal Home Loan Mortgage Corporation, Federal National Mortgage Association and Government National Mortgage Association are interests in separate pools of mortgages. All separate investments in securities of each issuer which have the same coupon rate have been aggregated for the purpose of presentation in the Portfolio of Investments. |
| | (g) | | | Interest rate represents discount rate at time of purchase; not a coupon rate. |
| | (h) | | | The Fund’s investment in U.S. Government/Agency securities is comprised of various lots with differing discount rates. These separate investments, which have the same maturity date, have been aggregated for the purpose of presentation in the Portfolio of Investments. |
| | | | |
| | 144A | | | All or a portion of these securities are exempt from registration under Rule 144A of the Securities Act of 1933. These securities may be resold in transactions exempt from registration, normally to qualified institutional buyers. At September 30, 2018, the value of Rule 144A holdings amounted to $22,886,960 or 3.2% of net assets. |
| | ABS | | | Asset-Backed Securities |
| | ARMs | | | Adjustable Rate Mortgages |
| | CMT | | | Constant Maturity Treasury |
| | COFI | | | Cost Of Funds Index |
| | FHLMC | | | Federal Home Loan Mortgage Corp. |
| | FNMA | | | Federal National Mortgage Association |
| | GNMA | | | Government National Mortgage Association |
| | LIBOR | | | London Interbank Offered Rate |
| | MTA | | | Monthly Treasury Average Interest |
| | REMIC | | | Real Estate Mortgage Investment Conduit |
See accompanying notes to financial statements.
| 60
Portfolio of Investments – as of September 30, 2018
Loomis Sayles Limited Term Government and Agency Fund – (continued)
Industry Summary at September 30, 2018
| | | | |
Treasuries | | | 39.8 | % |
Agency Commercial Mortgage-Backed Securities | | | 16.4 | |
Collateralized Mortgage Obligations | | | 14.5 | |
Mortgage Related | | | 10.3 | |
Hybrid ARMs | | | 9.0 | |
Non-Agency Commercial Mortgage-Backed Securities | | | 2.1 | |
Other Investments, less than 2% each | | | 2.3 | |
Short-Term Investments | | | 6.4 | |
| | | | |
Total Investments | | | 100.8 | |
Other assets less liabilities | | | (0.8 | ) |
| | | | |
Net Assets | | | 100.0 | % |
| | | | |
See accompanying notes to financial statements.
61 |
This Page Intentionally Left Blank
| 62
Statements of Assets and Liabilities
September 30, 2018
| | | | | | | | | | | | |
| | | High Income
Fund | | | Intermediate
Duration Bond
Fund | | | Limited Term
Government
and Agency
Fund | |
ASSETS | | | | | | | | | | | | |
Investments at cost | | $ | 173,649,034 | | | $ | 169,734,887 | | | $ | 742,793,342 | |
Net unrealized depreciation | | | (6,130,388 | ) | | | (2,900,383 | ) | | | (15,325,152 | ) |
| | | | | | | | | | | | |
Investments at value | | | 167,518,646 | | | | 166,834,504 | | | | 727,468,190 | |
Cash | | | 25,918 | | | | — | | | | 9,373 | |
Due from brokers (Note 2) | | | — | | | | 135,000 | | | | — | |
Foreign currency at value (identified cost $148,420, $0 and $0, respectively) | | | 110,773 | | | | — | | | | — | |
Receivable for Fund shares sold | | | 149,523 | | | | 207,578 | | | | 688,006 | |
Receivable for securities sold | | | 1,169,826 | | | | 199,725 | | | | 39,273,842 | |
Collateral received for forward foreign currency contracts (Notes 2 and 4) | | | 270,000 | | | | — | | | | — | |
Dividends and interest receivable | | | 2,299,898 | | | | 857,444 | | | | 2,546,032 | |
Unrealized appreciation on forward foreign currency contracts (Note 2) | | | 142,661 | | | | — | | | | — | |
Tax reclaims receivable | | | 2,151 | | | | 173 | | | | — | |
Receivable for variation margin on futures contracts (Note 2) | | | — | | | | 10,018 | | | | — | |
Receivable from distributor (Note 6d) | | | 3,341 | | | | — | | | | — | |
Prepaid expenses (Note 8) | | | 175 | | | | 178 | | | | 705 | |
| | | | | | | | | | | | |
TOTAL ASSETS | | | 171,692,912 | | | | 168,244,620 | | | | 769,986,148 | |
| | | | | | | | | | | | |
LIABILITIES | | | | | | | | | | | | |
Payable for securities purchased | | | 533,890 | | | | 705,306 | | | | 45,215,832 | |
Payable for Fund shares redeemed | | | 62,739 | | | | 61,180 | | | | 1,954,620 | |
Unrealized depreciation on forward foreign currency contracts (Note 2) | | | 57,977 | | | | — | | | | — | |
Due to brokers (Note 2) | | | 270,000 | | | | — | | | | — | |
Distributions payable | | | — | | | | — | | | | 271,646 | |
Management fees payable (Note 6) | | | 67,153 | | | | 27,644 | | | | 213,778 | |
Deferred Trustees’ fees (Note 6) | | | 155,399 | | | | 109,688 | | | | 309,083 | |
Administrative fees payable (Note 6) | | | 6,102 | | | | 5,976 | | | | 25,856 | |
Payable to distributor (Note 6d) | | | — | | | | 1,142 | | | | 11,397 | |
Other accounts payable and accrued expenses | | | 80,154 | | | | 62,710 | | | | 144,566 | |
| | | | | | | | | | | | |
TOTAL LIABILITIES | | | 1,233,414 | | | | 973,646 | | | | 48,146,778 | |
| | | | | | | | | | | | |
NET ASSETS | | $ | 170,459,498 | | | $ | 167,270,974 | | | $ | 721,839,370 | |
| | | | | | | | | | | | |
NET ASSETS CONSIST OF: | | | | | | | | | | | | |
Paid-in capital | | $ | 175,916,232 | | | $ | 174,404,022 | | | $ | 766,892,846 | |
Accumulated loss | | | (5,456,734 | ) | | | (7,133,048 | ) | | | (45,053,476 | ) |
| | | | | | | | | | | | |
NET ASSETS | | $ | 170,459,498 | | | $ | 167,270,974 | | | $ | 721,839,370 | |
| | | | | | | | | | | | |
See accompanying notes to financial statements.
63 |
Statements of Assets and Liabilities (continued)
September 30, 2018
| | | | | | | | | | | | |
| | | High Income
Fund | | | Intermediate
Duration Bond
Fund | | | Limited Term
Government
and Agency
Fund | |
COMPUTATION OF NET ASSET VALUE AND OFFERING PRICE: | | | | | | | | | | | | |
Class A shares: | | | | | | | | | | | | |
Net assets | | $ | 26,174,654 | | | $ | 19,149,064 | | | $ | 328,474,720 | |
| | | | | | | | | | | | |
Shares of beneficial interest | | | 6,154,187 | | | | 1,920,371 | | | | 29,612,020 | |
| | | | | | | | | | | | |
Net asset value and redemption price per share | | $ | 4.25 | | | $ | 9.97 | | | $ | 11.09 | |
| | | | | | | | | | | | |
Offering price per share (100/[100-maximum sales charge] of net asset value) (Note 1) | | $ | 4.44 | | | $ | 10.41 | | | $ | 11.35 | |
| | | | | | | | | | | | |
Class C shares: (redemption price per share is equal to net asset value less any applicable contingent deferred sales charge) (Note 1) | | | | | | | | | | | | |
Net assets | | $ | 6,248,273 | | | $ | 2,425 | | | $ | 23,341,410 | |
| | | | | | | | | | | | |
Shares of beneficial interest | | | 1,464,488 | | | | 243 | | | | 2,102,519 | |
| | | | | | | | | | | | |
Net asset value and offering price per share | | $ | 4.27 | | | $ | 10.00 | * | | $ | 11.10 | |
| | | | | | | | | | | | |
Class N shares: | | | | | | | | | | | | |
Net assets | | $ | 10,337,807 | | | $ | — | | | $ | 3,176,310 | |
| | | | | | | | | | | | |
Shares of beneficial interest | | | 2,434,256 | | | | — | | | | 285,529 | |
| | | | | | | | | | | | |
Net asset value, offering and redemption price per share | | $ | 4.25 | | | $ | — | | | $ | 11.12 | |
| | | | | | | | | | | | |
Class Y shares: | | | | | | | | | | | | |
Net assets | | $ | 127,698,764 | | | $ | 148,119,485 | | | $ | 366,846,930 | |
| | | | | | | | | | | | |
Shares of beneficial interest | | | 30,107,457 | | | | 14,859,825 | | | | 32,964,191 | |
| | | | | | | | | | | | |
Net asset value, offering and redemption price per share | | $ | 4.24 | | | $ | 9.97 | | | $ | 11.13 | |
| | | | | | | | | | | | |
| * | Net asset value calculations have been determined utilizing fractional share and penny amounts. |
See accompanying notes to financial statements.
| 64
Statements of Operations
For the Year Ended September 30, 2018
| | | | | | | | | | | | |
| | | High Income
Fund | | | Intermediate
Duration Bond
Fund | | | Limited Term
Government
and Agency
Fund | |
INVESTMENT INCOME | | | | | | | | | | | | |
Interest | | $ | 9,812,890 | | | $ | 5,010,754 | | | $ | 12,894,253 | |
Dividends | | | 215,042 | | | | — | | | | — | |
Less net foreign taxes withheld | | | (1,444 | ) | | | (197 | ) | | | — | |
| | | | | | | | | | | | |
| | | 10,026,488 | | | | 5,010,557 | | | | 12,894,253 | |
| | | | | | | | | | | | |
Expenses | | | | | | | | | | | | |
Management fees (Note 6) | | | 1,042,957 | | | | 442,379 | | | | 2,613,773 | |
Service and distribution fees (Note 6) | | | 163,550 | | | | 71,992 | | | | 1,134,287 | |
Administrative fees (Note 6) | | | 76,503 | | | | 77,895 | | | | 312,980 | |
Trustees’ fees and expenses (Note 6) | | | 33,532 | | | | 29,012 | | | | 61,368 | |
Transfer agent fees and expenses (Notes 6 and 7) | | | 205,041 | | | | 97,272 | | | | 626,776 | |
Audit and tax services fees | | | 52,781 | | | | 52,781 | | | | 56,890 | |
Custodian fees and expenses | | | 24,257 | | | | 19,866 | | | | 40,614 | |
Legal fees | | | 3,583 | | | | 3,753 | | | | 13,843 | |
Registration fees | | | 77,187 | | | | 37,477 | | | | 69,490 | |
Shareholder reporting expenses | | | 44,024 | | | | 24,789 | | | | 95,216 | |
Miscellaneous expenses (Note 8) | | | 17,988 | | | | 16,947 | | | | 30,764 | |
| | | | | | | | | | | | |
Total expenses | | | 1,741,403 | | | | 874,163 | | | | 5,056,001 | |
Less waiver and/or expense reimbursement (Note 6) | | | (190,287 | ) | | | (94,365 | ) | | | (12,855 | ) |
| | | | | | | | | | | | |
Net expenses | | | 1,551,116 | | | | 779,798 | | | | 5,043,146 | |
| | | | | | | | | | | | |
Net investment income | | | 8,475,372 | | | | 4,230,759 | | | | 7,851,107 | |
| | | | | | | | | | | | |
NET REALIZED AND UNREALIZED GAIN (LOSS) ON INVESTMENTS, FUTURES CONTRACTS, FORWARD FOREIGN CURRENCY CONTRACTS AND FOREIGN CURRENCY TRANSACTIONS | | | | | | | | | | | | |
Net realized gain (loss) on: | | | | | | | | | | | | |
Investments | | | 1,405,486 | | | | (2,376,601 | ) | | | (1,854,197 | ) |
Futures contracts | | | — | | | | (359,501 | ) | | | — | |
Forward foreign currency contracts (Note 2d) | | | (165,859 | ) | | | — | | | | — | |
Foreign currency transactions (Note 2c) | | | (34,283 | ) | | | — | | | | — | |
Net change in unrealized appreciation (depreciation) on: | | | | | | | | | | | | |
Investments | | | (7,071,893 | ) | | | (2,815,863 | ) | | | (6,897,838 | ) |
Futures contracts | | | — | | | | (21,437 | ) | | | — | |
Forward foreign currency contracts (Note 2d) | | | 84,684 | | | | — | | | | — | |
Foreign currency translations (Note 2c) | | | (42,550 | ) | | | — | | | | — | |
| | | | | | | | | | | | |
Net realized and unrealized loss on investments, futures contracts, forward foreign currency contracts and foreign currency transactions | | | (5,824,415 | ) | | | (5,573,402 | ) | | | (8,752,035 | ) |
| | | | | | | | | | | | |
NET INCREASE (DECREASE) IN NET ASSETS RESULTING FROM OPERATIONS | | $ | 2,650,957 | | | $ | (1,342,643 | ) | | $ | (900,928 | ) |
| | | | | | | | | | | | |
See accompanying notes to financial statements.
65 |
Statements of Changes in Net Assets
| | | | | | | | | | | | | | | | |
| | | High Income Fund | | | Intermediate Duration
Bond Fund | |
| | | Year Ended
September 30,
2018 | | | Year Ended
September 30,
2017 | | | Year Ended
September 30,
2018 | | | Year Ended
September 30,
2017 | |
FROM OPERATIONS: | | | | | | | | | | | | | | | | |
Net investment income | | $ | 8,475,372 | | | $ | 8,976,856 | | | $ | 4,230,759 | | | $ | 3,346,060 | |
Net realized gain (loss) on investments, futures contracts, forward foreign currency contracts and foreign currency transactions | | | 1,205,344 | | | | 838,850 | | | | (2,736,102 | ) | | | (364,816 | ) |
Net change in unrealized appreciation (depreciation) on investments, futures contracts, forward foreign currency contracts and foreign currency translations | | | (7,029,759 | ) | | | 3,999,707 | | | | (2,837,300 | ) | | | (1,513,370 | ) |
| | | | | | | | | | | | | | | | |
Net increase (decrease) in net assets resulting from operations | | | 2,650,957 | | | | 13,815,413 | | | | (1,342,643 | ) | | | 1,467,874 | |
| | | | | | | | | | | | | | | | |
FROM DISTRIBUTIONS TO SHAREHOLDERS: | | | | | | | | | | | | | | | | |
Class A | | | (1,227,019 | ) | | | (1,577,362 | )(a) | | | (457,955 | ) | | | (537,098 | )(a) |
Class C | | | (311,547 | ) | | | (453,429 | )(a) | | | (30,450 | ) | | | (59,316 | )(a) |
Class N | | | (259,688 | ) | | | (41 | )(a) | | | — | | | | — | |
Class Y | | | (5,752,686 | ) | | | (6,175,066 | )(a) | | | (3,945,026 | ) | | | (4,415,692 | )(a) |
| | | | | | | | | | | | | | | | |
Total distributions | | | (7,550,940 | ) | | | (8,205,898 | ) | | | (4,433,431 | ) | | | (5,012,106 | ) |
| | | | | | | | | | | | | | | | |
NET INCREASE (DECREASE) IN NET ASSETS FROM CAPITAL SHARE TRANSACTIONS (NOTE 11) | | | (3,848,432 | ) | | | (2,678,063 | ) | | | (6,673,219 | ) | | | 21,450,975 | |
| | | | | | | | | | | | | | | | |
Net increase (decrease) in net assets | | | (8,748,415 | ) | | | 2,931,452 | | | | (12,449,293 | ) | | | 17,906,743 | |
NET ASSETS | | | | | | | | | | | | | | | | |
Beginning of the year | | | 179,207,913 | | | | 176,276,461 | | | | 179,720,267 | | | | 161,813,524 | |
| | | | | | | | | | | | | | | | |
End of the year | | $ | 170,459,498 | | | $ | 179,207,913 | | | $ | 167,270,974 | | | $ | 179,720,267 | |
| | | | | | | | | | | | | | | | |
| (a) | See Note 2h in Notes to Financial Statements. |
See accompanying notes to financial statements.
| 66
Statements of Changes in Net Assets (continued)
| | | | | | | | |
| | | Limited Term Government and
Agency Fund | |
| | | Year Ended
September 30,
2018 | | | Year Ended
September 30,
2017 | |
FROM OPERATIONS: | | | | | | | | |
Net investment income | | $ | 7,851,107 | | | $ | 5,954,599 | |
Net realized loss on investments | | | (1,854,197 | ) | | | (1,193,894 | ) |
Net change in unrealized appreciation (depreciation) on investments | | | (6,897,838 | ) | | | (5,444,007 | ) |
| | | | | | | | |
Net decrease in net assets resulting from operations | | | (900,928 | ) | | | (683,302 | ) |
| | | | | | | | |
FROM DISTRIBUTIONS TO SHAREHOLDERS: | | | | | | | | |
Class A | | | (6,062,622 | ) | | | (6,178,474 | )(a) |
Class C | | | (373,941 | ) | | | (492,969 | )(a) |
Class N | | | (53,072 | ) | | | (19,353 | )(a) |
Class Y | | | (7,556,453 | ) | | | (6,976,388 | )(a) |
| | | | | | | | |
Total distributions | | | (14,046,088 | ) | | | (13,667,184 | ) |
| | | | | | | | |
NET DECREASE IN NET ASSETS FROM CAPITAL SHARE TRANSACTIONS (NOTE 11) | | | (4,981,212 | ) | | | (171,478,152 | ) |
| | | | | | | | |
Net decrease in net assets | | | (19,928,228 | ) | | | (185,828,638 | ) |
NET ASSETS | | | | | | | | |
Beginning of the year | | | 741,767,598 | | | | 927,596,236 | |
| | | | | | | | |
End of the year | | $ | 721,839,370 | | | $ | 741,767,598 | |
| | | | | | | | |
| (a) | See Note 2h in Notes to Financial Statements. |
See accompanying notes to financial statements.
67 |
Financial Highlights
For a share outstanding throughout each period.
| | | | | | | | | | | | | | | | | | | | |
| | | High Income Fund—Class A | |
| | | Year Ended
September 30,
2018 | | | Year Ended
September 30,
2017 | | | Year Ended
September 30,
2016 | | | Year Ended
September 30,
2015 | | | Year Ended
September 30,
2014 | |
Net asset value, beginning of the period | | $ | 4.37 | | | $ | 4.23 | | | $ | 3.99 | | | $ | 4.49 | | | $ | 4.59 | |
| | | | | | | | | | | | | | | | | | | | |
INCOME (LOSS) FROM INVESTMENT OPERATIONS: | | | | | | | | | | | | | | | | | | | | |
Net investment income(a) | | | 0.20 | | | | 0.22 | | | | 0.20 | | | | 0.19 | | | | 0.21 | |
Net realized and unrealized gain (loss) | | | (0.14 | ) | | | 0.12 | | | | 0.21 | | | | (0.39 | ) | | | 0.17 | |
| | | | | | | | | | | | | | | | | | | | |
Total from Investment Operations | | | 0.06 | | | | 0.34 | | | | 0.41 | | | | (0.20 | ) | | | 0.38 | |
| | | | | | | | | | | | | | | | | | | | |
LESS DISTRIBUTIONS FROM: | | | | | | | | | | | | | | | | | | | | |
Net investment income | | | (0.18 | ) | | | (0.20 | ) | | | (0.16 | ) | | | (0.19 | ) | | | (0.22 | ) |
Net realized capital gains | | | — | | | | — | | | | (0.01 | ) | | | (0.11 | ) | | | (0.26 | ) |
| | | | | | | | | | | | | | | | | | | | |
Total Distributions | | | (0.18 | ) | | | (0.20 | ) | | | (0.17 | ) | | | (0.30 | ) | | | (0.48 | ) |
| | | | | | | | | | | | | | | | | | | | |
Net asset value, end of the period | | $ | 4.25 | | | $ | 4.37 | | | $ | 4.23 | | | $ | 3.99 | | | $ | 4.49 | |
| | | | | | | | | | | | | | | | | | | | |
Total return(b) | | | 1.41 | %(c) | | | 8.17 | %(c) | | | 10.66 | %(c) | | | (4.78 | )%(c) | | | 8.42 | % |
RATIOS TO AVERAGE NET ASSETS: | | | | | | | | | | | | | | | | | | | | |
Net assets, end of the period (000’s) | | $ | 26,175 | | | $ | 34,039 | | | $ | 34,820 | | | $ | 37,870 | | | $ | 42,630 | |
Net expenses | | | 1.05 | %(d) | | | 1.09 | %(d)(e) | | | 1.10 | %(d) | | | 1.11 | %(d)(f) | | | 1.14 | % |
Gross expenses | | | 1.16 | % | | | 1.15 | % | | | 1.14 | % | | | 1.13 | % | | | 1.14 | % |
Net investment income | | | 4.73 | % | | | 5.03 | % | | | 5.16 | % | | | 4.41 | % | | | 4.57 | % |
Portfolio turnover rate | | | 55 | % | | | 46 | % | | | 38 | % | | | 69 | % | | | 59 | % |
| (a) | Per share net investment income has been calculated using the average shares outstanding during the period. |
| (b) | A sales charge for Class A shares is not reflected in total return calculations. |
| (c) | Had certain expenses not been waived/reimbursed during the period, total returns would have been lower. |
| (d) | The investment adviser agreed to waive its fees and/or reimburse a portion of the Fund’s expenses during the period. Without this waiver/reimbursement, expenses would have been higher. |
| (e) | Effective July 1, 2017, the expense limit decreased to 1.05%. |
| (f) | Effective July 1, 2015, the expense limit decreased to 1.10%. |
See accompanying notes to financial statements.
| 68
Financial Highlights (continued)
For a share outstanding throughout each period.
| | | | | | | | | | | | | | | | | | | | |
| | | High Income Fund—Class C | |
| | | Year Ended
September 30,
2018 | | | Year Ended
September 30,
2017 | | | Year Ended
September 30,
2016 | | | Year Ended
September 30,
2015 | | | Year Ended
September 30,
2014 | |
Net asset value, beginning of the period | | $ | 4.38 | | | $ | 4.24 | | | $ | 4.00 | | | $ | 4.50 | | | $ | 4.61 | |
| | | | | | | | | | | | | | | | | | | | |
INCOME (LOSS) FROM INVESTMENT OPERATIONS: | | | | | | | | | | | | | | | | | | | | |
Net investment income(a) | | | 0.17 | | | | 0.18 | | | | 0.18 | | | | 0.16 | | | | 0.18 | |
Net realized and unrealized gain (loss) | | | (0.13 | ) | | | 0.12 | | | | 0.20 | | | | (0.39 | ) | | | 0.16 | |
| | | | | | | | | | | | | | | | | | | | |
Total from Investment Operations | | | 0.04 | | | | 0.30 | | | | 0.38 | | | | (0.23 | ) | | | 0.34 | |
| | | | | | | | | | | | | | | | | | | | |
LESS DISTRIBUTIONS FROM: | | | | | | | | | | | | | | | | | | | | |
Net investment income | | | (0.15 | ) | | | (0.16 | ) | | | (0.13 | ) | | | (0.16 | ) | | | (0.19 | ) |
Net realized capital gains | | | — | | | | — | | | | (0.01 | ) | | | (0.11 | ) | | | (0.26 | ) |
| | | | | | | | | | | | | | | | | | | | |
Total Distributions | | | (0.15 | ) | | | (0.16 | ) | | | (0.14 | ) | | | (0.27 | ) | | | (0.45 | ) |
| | | | | | | | | | | | | | | | | | | | |
Net asset value, end of the period | | $ | 4.27 | | | $ | 4.38 | | | $ | 4.24 | | | $ | 4.00 | | | $ | 4.50 | |
| | | | | | | | | | | | | | | | | | | | |
Total return(b) | | | 0.86 | %(c) | | | 7.33 | %(c) | | | 9.81 | %(c) | | | (5.48 | )%(c) | | | 7.60 | % |
RATIOS TO AVERAGE NET ASSETS: | | | | | | | | | | | | | | | | | | | | |
Net assets, end of the period (000’s) | | $ | 6,248 | | | $ | 11,227 | | | $ | 12,288 | | | $ | 12,609 | | | $ | 14,555 | |
Net expenses | | | 1.80 | %(d) | | | 1.84 | %(d)(e) | | | 1.85 | %(d) | | | 1.86 | %(d)(f) | | | 1.89 | % |
Gross expenses | | | 1.91 | % | | | 1.90 | % | | | 1.89 | % | | | 1.88 | % | | | 1.89 | % |
Net investment income | | | 3.99 | % | | | 4.29 | % | | | 4.43 | % | | | 3.68 | % | | | 3.84 | % |
Portfolio turnover rate | | | 55 | % | | | 46 | % | | | 38 | % | | | 69 | % | | | 59 | % |
| (a) | Per share net investment income has been calculated using the average shares outstanding during the period. |
| (b) | A contingent deferred sales charge for Class C shares is not reflected in total return calculations. |
| (c) | Had certain expenses not been waived/reimbursed during the period, total returns would have been lower. |
| (d) | The investment adviser agreed to waive its fees and/or reimburse a portion of the Fund’s expenses during the period. Without this waiver/reimbursement, expenses would have been higher. |
| (e) | Effective July 1, 2017, the expense limit decreased to 1.80%. |
| (f) | Effective July 1, 2015, the expense limit decreased to 1.85%. |
See accompanying notes to financial statements.
69 |
Financial Highlights (continued)
For a share outstanding throughout each period.
| | | | | | | | |
| | | High Income Fund—Class N | |
| | | Year Ended
September 30,
2018 | | | Period Ended
September 30,
2017* | |
Net asset value, beginning of the period | | $ | 4.36 | | | $ | 4.16 | |
| | | | | | | | |
INCOME (LOSS) FROM INVESTMENT OPERATIONS: | | | | | | | | |
Net investment income(a) | | | 0.20 | | | | 0.19 | |
Net realized and unrealized gain (loss) | | | (0.12 | ) | | | 0.18 | |
| | | | | | | | |
Total from Investment Operations | | | 0.08 | | | | 0.37 | |
| | | | | | | | |
LESS DISTRIBUTIONS FROM: | | | | | | | | |
Net investment income | | | (0.19 | ) | | | (0.17 | ) |
| | | | | | | | |
Net asset value, end of the period | | $ | 4.25 | | | $ | 4.36 | |
| | | | | | | | |
Total return(b) | | | 1.96 | % | | | 8.99 | %(c) |
RATIOS TO AVERAGE NET ASSETS: | | | | | | | | |
Net assets, end of the period (000’s) | | $ | 10,338 | | | $ | 1 | |
Net expenses(d) | | | 0.75 | % | | | 0.75 | %(e)(f) |
Gross expenses | | | 0.79 | % | | | 31.73 | %(e) |
Net investment income | | | 4.65 | % | | | 5.19 | %(e) |
Portfolio turnover rate | | | 55 | % | | | 46 | %(g) |
| * | From commencement of Class operations on November 30, 2016 through September 30, 2017. |
| (a) | Per share net investment income has been calculated using the average shares outstanding during the period. |
| (b) | Had certain expenses not been waived/reimbursed during the period, total returns would have been lower. |
| (c) | Periods less than one year are not annualized. |
| (d) | The investment adviser agreed to waive its fees and/or reimburse a portion of the Fund’s expenses during the period. Without this waiver/reimbursement, expenses would have been higher. |
| (e) | Computed on an annualized basis for periods less than one year. |
| (f) | Effective July 1, 2017, the expense limit decreased to 0.75%. |
| (g) | Represents the Fund’s portfolio turnover rate for the year ended September 30, 2017. |
See accompanying notes to financial statements.
| 70
Financial Highlights (continued)
For a share outstanding throughout each period.
| | | | | | | | | | | | | | | | | | | | |
| | | High Income Fund—Class Y | |
| | | Year Ended
September 30,
2018 | | | Year Ended
September 30,
2017 | | | Year Ended
September 30,
2016 | | | Year Ended
September 30,
2015 | | | Year Ended
September 30,
2014 | |
Net asset value, beginning of the period | | $ | 4.36 | | | $ | 4.22 | | | $ | 3.98 | | | $ | 4.48 | | | $ | 4.59 | |
| | | | | | | | | | | | | | | | | | | | |
INCOME (LOSS) FROM INVESTMENT OPERATIONS: | | | | | | | | | | | | | | | | | | | | |
Net investment income(a) | | | 0.21 | | | | 0.23 | | | | 0.21 | | | | 0.20 | | | | 0.22 | |
Net realized and unrealized gain (loss) | | | (0.14 | ) | | | 0.12 | | | | 0.21 | | | | (0.39 | ) | | | 0.16 | |
| | | | | | | | | | | | | | | | | | | | |
Total from Investment Operations | | | 0.07 | | | | 0.35 | | | | 0.42 | | | | (0.19 | ) | | | 0.38 | |
| | | | | | | | | | | | | | | | | | | | |
LESS DISTRIBUTIONS FROM: | | | | | | | | | | | | | | | | | | | | |
Net investment income | | | (0.19 | ) | | | (0.21 | ) | | | (0.17 | ) | | | (0.20 | ) | | | (0.23 | ) |
Net realized capital gains | | | — | | | | — | | | | (0.01 | ) | | | (0.11 | ) | | | (0.26 | ) |
| | | | | | | | | | | | | | | | | | | | |
Total Distributions | | | (0.19 | ) | | | (0.21 | ) | | | (0.18 | ) | | | (0.31 | ) | | | (0.49 | ) |
| | | | | | | | | | | | | | | | | | | | |
Net asset value, end of the period | | $ | 4.24 | | | $ | 4.36 | | | $ | 4.22 | | | $ | 3.98 | | | $ | 4.48 | |
| | | | | | | | | | | | | | | | | | | | |
Total return | | | 1.68 | %(b) | | | 8.47 | %(b) | | | 10.98 | %(b) | | | (4.54 | )%(b) | | | 8.72 | % |
RATIOS TO AVERAGE NET ASSETS: | | | | | | | | | | | | | | | | | | | | |
Net assets, end of the period (000’s) | | $ | 127,699 | | | $ | 133,940 | | | $ | 129,169 | | | $ | 116,837 | | | $ | 125,185 | |
Net expenses | | | 0.80 | %(c) | | | 0.84 | %(c)(d) | | | 0.85 | %(c) | | | 0.86 | %(c)(e) | | | 0.89 | % |
Gross expenses | | | 0.91 | % | | | 0.90 | % | | | 0.89 | % | | | 0.88 | % | | | 0.89 | % |
Net investment income | | | 4.98 | % | | | 5.28 | % | | | 5.43 | % | | | 4.67 | % | | | 4.83 | % |
Portfolio turnover rate | | | 55 | % | | | 46 | % | | | 38 | % | | | 69 | % | | | 59 | % |
| (a) | Per share net investment income has been calculated using the average shares outstanding during the period. |
| (b) | Had certain expenses not been waived/reimbursed during the period, total returns would have been lower. |
| (c) | The investment adviser agreed to waive its fees and/or reimburse a portion of the Fund’s expenses during the period. Without this waiver/reimbursement, expenses would have been higher. |
| (d) | Effective July 1, 2017, the expense limit decreased to 0.80%. |
| (e) | Effective July 1, 2015, the expense limit decreased to 0.85%. |
See accompanying notes to financial statements.
71 |
Financial Highlights (continued)
For a share outstanding throughout each period.
| | | | | | | | | | | | | | | | | | | | |
| | | Intermediate Duration Bond Fund—Class A* | |
| | | Year Ended
September 30,
2018 | | | Year Ended
September 30,
2017 | | | Year Ended
September 30,
2016 | | | Year Ended
September 30,
2015 | | | Year Ended
September 30,
2014 | |
Net asset value, beginning of the period | | $ | 10.29 | | | $ | 10.52 | | | $ | 10.39 | | | $ | 10.39 | | | $ | 10.34 | |
| | | | | | | | | | | | | | | | | | | | |
INCOME (LOSS) FROM INVESTMENT OPERATIONS: | | | | | | | | | | | | | | | | | | | | |
Net investment income(a) | | | 0.22 | | | | 0.17 | | | | 0.20 | | | | 0.20 | | | | 0.22 | |
Net realized and unrealized gain (loss) | | | (0.31 | ) | | | (0.12 | ) | | | 0.17 | | | | 0.03 | | | | 0.11 | |
| | | | | | | | | | | | | | | | | | | | |
Total from Investment Operations | | | (0.09 | ) | | | 0.05 | | | | 0.37 | | | | 0.23 | | | | 0.33 | |
| | | | | | | | | | | | | | | | | | | | |
LESS DISTRIBUTIONS FROM: | | | | | | | | | | | | | | | | | | | | |
Net investment income | | | (0.23 | ) | | | (0.20 | ) | | | (0.21 | ) | | | (0.22 | ) | | | (0.25 | ) |
Net realized capital gains | | | — | | | | (0.08 | ) | | | (0.03 | ) | | | (0.01 | ) | | | (0.03 | ) |
| | | | | | | | | | | | | | | | | | | | |
Total Distributions | | | (0.23 | ) | | | (0.28 | ) | | | (0.24 | ) | | | (0.23 | ) | | | (0.28 | ) |
| | | | | | | | | | | | | | | | | | | | |
Net asset value, end of the period | | $ | 9.97 | | | $ | 10.29 | | | $ | 10.52 | | | $ | 10.39 | | | $ | 10.39 | |
| | | | | | | | | | | | | | | | | | | | |
Total return(b)(c) | | | (0.85 | )% | | | 0.44 | % | | | 3.64 | % | | | 2.17 | % | | | 3.24 | % |
RATIOS TO AVERAGE NET ASSETS: | | | | | | | | | | | | | | | | | | | | |
Net assets, end of the period (000’s) | | $ | 19,149 | | | $ | 21,828 | | | $ | 19,327 | | | $ | 18,425 | | | $ | 5,931 | |
Net expenses(d) | | | 0.65 | % | | | 0.65 | % | | | 0.65 | % | | | 0.65 | % | | | 0.65 | % |
Gross expenses | | | 0.70 | % | | | 0.72 | % | | | 0.72 | % | | | 0.71 | % | | | 0.85 | % |
Net investment income | | | 2.17 | % | | | 1.69 | % | | | 1.89 | % | | | 1.93 | % | | | 2.07 | % |
Portfolio turnover rate | | | 152 | % | | | 216 | % | | | 151 | % | | | 151 | % | | | 134 | % |
| * | Effective August 31, 2016, Retail Class shares were redesignated as Class A shares. |
| (a) | Per share net investment income has been calculated using the average shares outstanding during the period. |
| (b) | A sales charge for Class A shares is not reflected in total return calculations. |
| (c) | Had certain expenses not been waived/reimbursed during the period, total returns would have been lower. |
| (d) | The investment adviser agreed to waive its fees and/or reimburse a portion of the Fund’s expenses during the period. Without this waiver/reimbursement, expenses would have been higher. |
See accompanying notes to financial statements.
| 72
Financial Highlights (continued)
For a share outstanding throughout each period.
| | | | | | | | | | | | |
| | | Intermediate Duration Bond Fund—Class C | |
| | | Year Ended
September 30,
2018 | | | Year Ended
September 30,
2017 | | | Period Ended
September 30,
2016* | |
Net asset value, beginning of the period | | $ | 10.30 | | | $ | 10.53 | | | $ | 10.53 | |
| | | | | | | | | | | | |
INCOME (LOSS) FROM INVESTMENT OPERATIONS: | | | | | | | | | | | | |
Net investment income(a) | | | 0.13 | | | | 0.10 | | | | 0.01 | |
Net realized and unrealized gain (loss) | | | (0.31 | ) | | | (0.13 | ) | | | 0.00 | (b) |
| | | | | | | | | | | | |
Total from Investment Operations | | | (0.18 | ) | | | (0.03 | ) | | | 0.01 | |
| | | | | | | | | | | | |
LESS DISTRIBUTIONS FROM: | | | | | | | | | | | | |
Net investment income | | | (0.12 | ) | | | (0.12 | ) | | | (0.01 | ) |
Net realized capital gains | | | — | | | | (0.08 | ) | | | — | |
| | | | | | | | | | | | |
Total Distributions | | | (0.12 | ) | | | (0.20 | ) | | | (0.01 | ) |
| | | | | | | | | | | | |
Net asset value, end of the period | | $ | 10.00 | | | $ | 10.30 | | | $ | 10.53 | |
| | | | | | | | | | | | |
Total return(c)(d) | | | (1.71 | )% | | | (0.29 | )% | | | 0.08 | %(e) |
RATIOS TO AVERAGE NET ASSETS: | | | | | | | | | | | | |
Net assets, end of the period (000’s) | | $ | 2 | | | $ | 3,225 | | | $ | 3,088 | |
Net expenses(f) | | | 1.40 | % | | | 1.40 | % | | | 1.40 | %(g) |
Gross expenses | | | 1.45 | % | | | 1.48 | % | | | 1.56 | %(g) |
Net investment income | | | 1.31 | % | | | 0.95 | % | | | 0.86 | %(g) |
Portfolio turnover rate | | | 152 | % | | | 216 | % | | | 151 | % |
| * | From commencement of Class operations on August 31, 2016 through September 30, 2016. |
| (a) | Per share net investment income has been calculated using the average shares outstanding during the period. |
| (b) | Amount rounds to less than $0.01 per share. |
| (c) | A contingent deferred sales charge for Class C shares is not reflected in total return calculations. |
| (d) | Had certain expenses not been waived/reimbursed during the period, total returns would have been lower. |
| (e) | Periods less than one year are not annualized. |
| (f) | The investment adviser agreed to waive its fees and/or reimburse a portion of the Fund’s expenses during the period. Without this waiver/reimbursement, expenses would have been higher. |
| (g) | Computed on an annualized basis for periods less than one year. |
See accompanying notes to financial statements.
73 |
Financial Highlights (continued)
For a share outstanding throughout each period.
| | | | | | | | | | | | | | | | | | | | |
| | | Intermediate Duration Bond Fund—Class Y* | |
| | | Year Ended
September 30,
2018 | | | Year Ended
September 30,
2017 | | | Year Ended
September 30,
2016 | | | Year Ended
September 30,
2015 | | | Year Ended
September 30,
2014 | |
Net asset value, beginning of the period | | $ | 10.29 | | | $ | 10.52 | | | $ | 10.39 | | | $ | 10.39 | | | $ | 10.33 | |
| | | | | | | | | | | | | | | | | | | | |
INCOME (LOSS) FROM INVESTMENT OPERATIONS: | | | | | | | | | | | | | | | | | | | | |
Net investment income(a) | | | 0.25 | | | | 0.20 | | | | 0.22 | | | | 0.22 | | | | 0.24 | |
Net realized and unrealized gain (loss) | | | (0.31 | ) | | | (0.13 | ) | | | 0.18 | | | | 0.04 | | | | 0.12 | |
| | | | | | | | | | | | | | | | | | | | |
Total from Investment Operations | | | (0.06 | ) | | | 0.07 | | | | 0.40 | | | | 0.26 | | | | 0.36 | |
| | | | | | | | | | | | | | | | | | | | |
LESS DISTRIBUTIONS FROM: | | | | | | | | | | | | | | | | | | | | |
Net investment income | | | (0.26 | ) | | | (0.22 | ) | | | (0.24 | ) | | | (0.25 | ) | | | (0.27 | ) |
Net realized capital gains | | | — | | | | (0.08 | ) | | | (0.03 | ) | | | (0.01 | ) | | | (0.03 | ) |
| | | | | | | | | | | | | | | | | | | | |
Total Distributions | | | (0.26 | ) | | | (0.30 | ) | | | (0.27 | ) | | | (0.26 | ) | | | (0.30 | ) |
| | | | | | | | | | | | | | | | | | | | |
Net asset value, end of the period | | $ | 9.97 | | | $ | 10.29 | | | $ | 10.52 | | | $ | 10.39 | | | $ | 10.39 | |
| | | | | | | | | | | | | | | | | | | | |
Total return(b) | | | (0.60 | )% | | | 0.69 | % | | | 3.90 | % | | | 2.42 | % | | | 3.60 | % |
RATIOS TO AVERAGE NET ASSETS: | | | | | | | | | | | | | | | | | | | | |
Net assets, end of the period (000’s) | | $ | 148,119 | | | $ | 154,668 | | | $ | 139,398 | | | $ | 88,592 | | | $ | 66,759 | |
Net expenses(c) | | | 0.40 | % | | | 0.40 | % | | | 0.40 | % | | | 0.40 | % | | | 0.40 | % |
Gross expenses | | | 0.45 | % | | | 0.47 | % | | | 0.47 | % | | | 0.47 | % | | | 0.57 | % |
Net investment income | | | 2.43 | % | | | 1.93 | % | | | 2.11 | % | | | 2.15 | % | | | 2.31 | % |
Portfolio turnover rate | | | 152 | % | | | 216 | % | | | 151 | % | | | 151 | % | | | 134 | % |
| * | Effective August 31, 2016, Institutional Class shares were redesignated as Class Y shares. |
| (a) | Per share net investment income has been calculated using the average shares outstanding during the period. |
| (b) | Had certain expenses not been waived/reimbursed during the period, total returns would have been lower. |
| (c) | The investment adviser agreed to waive its fees and/or reimburse a portion of the Fund’s expenses during the period. Without this waiver/reimbursement, expenses would have been higher. |
See accompanying notes to financial statements.
| 74
Financial Highlights (continued)
For a share outstanding throughout each period.
| | | | | | | | | | | | | | | | | | | | |
| | | Limited Term Government and Agency Fund— Class A | |
| | | Year Ended
September 30,
2018 | | | Year Ended
September 30,
2017 | | | Year Ended
September 30,
2016 | | | Year Ended
September 30,
2015 | | | Year Ended
September 30,
2014 | |
Net asset value, beginning of the period | | $ | 11.32 | | | $ | 11.51 | | | $ | 11.57 | | | $ | 11.61 | | | $ | 11.68 | |
| | | | | | | | | | | | | | | | | | | | |
INCOME (LOSS) FROM INVESTMENT OPERATIONS: | | | | | | | | | | | | | | | | | | | | |
Net investment income(a) | | | 0.11 | | | | 0.08 | | | | 0.11 | | | | 0.14 | | | | 0.16 | |
Net realized and unrealized gain (loss) | | | (0.13 | ) | | | (0.09 | ) | | | 0.00 | (b) | | | 0.01 | (c) | | | 0.01 | |
| | | | | | | | | | | | | | | | | | | | |
Total from Investment Operations | | | (0.02 | ) | | | (0.01 | ) | | | 0.11 | | | | 0.15 | | | | 0.17 | |
| | | | | | | | | | | | | | | | | | | | |
LESS DISTRIBUTIONS FROM: | | | | | | | | | | | | | | | | | | | | |
Net investment income | | | (0.21 | ) | | | (0.18 | ) | | | (0.17 | ) | | | (0.19 | ) | | | (0.24 | ) |
| | | | | | | | | | | | | | | | | | | | |
Net asset value, end of the period | | $ | 11.09 | | | $ | 11.32 | | | $ | 11.51 | | | $ | 11.57 | | | $ | 11.61 | |
| | | | | | | | | | | | | | | | | | | | |
Total return(d) | | | (0.17 | )% | | | (0.04 | )% | | | 0.93 | % | | | 1.26 | % | | | 1.44 | % |
RATIOS TO AVERAGE NET ASSETS: | | | | | | | | | | | | | | | | | | | | |
Net assets, end of the period (000’s) | | $ | 328,475 | | | $ | 336,227 | | | $ | 442,671 | | | $ | 346,317 | | | $ | 314,360 | |
Net expenses | | | 0.80 | % | | | 0.80 | % | | | 0.77 | % | | | 0.77 | % | | | 0.80 | %(e) |
Gross expenses | | | 0.80 | % | | | 0.80 | % | | | 0.77 | % | | | 0.77 | % | | | 0.80 | %(e) |
Net investment income | | | 1.02 | % | | | 0.67 | % | | | 0.96 | % | | | 1.21 | % | | | 1.35 | % |
Portfolio turnover rate | | | 157 | % | | | 126 | % | | | 109 | %(f) | | | 48 | % | | | 24 | % |
| (a) | Per share net investment income has been calculated using the average shares outstanding during the period. |
| (b) | Amount rounds to less than $0.01 per share. |
| (c) | The amount shown for a share outstanding does not correspond with the aggregate realized and unrealized gain (loss) on investments for the period due to the timing of sales and redemptions of fund shares in relation to fluctuating market values of investments of the Fund. |
| (d) | A sales charge for Class A shares is not reflected in total return calculations. |
| (e) | Includes fee/expense recovery of less than 0.01%. |
| (f) | The variation in the Fund’s turnover rate from 2015 to 2016 was primarily due to fluctuation in the level of fund assets due to shareholder flows. |
See accompanying notes to financial statements.
75 |
Financial Highlights (continued)
For a share outstanding throughout each period.
| | | | | | | | | | | | | | | | | | | | |
| | | Limited Term Government and Agency Fund—Class C | |
| | | Year Ended
September 30,
2018 | | | Year Ended
September 30,
2017 | | | Year Ended
September 30,
2016 | | | Year Ended
September 30,
2015 | | | Year Ended
September 30,
2014 | |
Net asset value, beginning of the period | | $ | 11.33 | | | $ | 11.52 | | | $ | 11.58 | | | $ | 11.62 | | | $ | 11.69 | |
| | | | | | | | | | | | | | | | | | | | |
INCOME (LOSS) FROM INVESTMENT OPERATIONS: | | | | | | | | | | | | | | | | | | | | |
Net investment income (loss)(a) | | | 0.03 | | | | (0.01 | ) | | | 0.02 | | | | 0.05 | | | | 0.07 | |
Net realized and unrealized gain (loss) | | | (0.13 | ) | | | (0.08 | ) | | | 0.00 | (b) | | | 0.01 | (c) | | | 0.01 | |
| | | | | | | | | | | | | | | | | | | | |
Total from Investment Operations | | | (0.10 | ) | | | (0.09 | ) | | | 0.02 | | | | 0.06 | | | | 0.08 | |
| | | | | | | | | | | | | | | | | | | | |
LESS DISTRIBUTIONS FROM: | | | | | | | | | | | | | | | | | | | | |
Net investment income | | | (0.13 | ) | | | (0.10 | ) | | | (0.08 | ) | | | (0.10 | ) | | | (0.15 | ) |
| | | | | | | | | | | | | | | | | | | | |
Net asset value, end of the period | | $ | 11.10 | | | $ | 11.33 | | | $ | 11.52 | | | $ | 11.58 | | | $ | 11.62 | |
| | | | | | | | | | | | | | | | | | | | |
Total return(d) | | | (0.91 | )% | | | (0.79 | )% | | | 0.18 | % | | | 0.51 | % | | | 0.69 | % |
RATIOS TO AVERAGE NET ASSETS: | | | | | | | | | | | | | | | | | | | | |
Net assets, end of the period (000’s) | | $ | 23,341 | | | $ | 43,319 | | | $ | 73,027 | | | $ | 63,167 | | | $ | 56,936 | |
Net expenses | | | 1.55 | % | | | 1.55 | % | | | 1.52 | % | | | 1.53 | % | | | 1.55 | %(e) |
Gross expenses | | | 1.55 | % | | | 1.55 | % | | | 1.52 | % | | | 1.53 | % | | | 1.55 | %(e) |
Net investment income (loss) | | | 0.24 | % | | | (0.09 | )% | | | 0.21 | % | | | 0.47 | % | | | 0.61 | % |
Portfolio turnover rate | | | 157 | % | | | 126 | % | | | 109 | %(f) | | | 48 | % | | | 24 | % |
| (a) | Per share net investment income (loss) has been calculated using the average shares outstanding during the period. |
| (b) | Amount rounds to less than $0.01 per share. |
| (c) | The amount shown for a share outstanding does not correspond with the aggregate realized and unrealized gain (loss) on investments for the period due to the timing of sales and redemptions of fund shares in relation to fluctuating market values of investments of the Fund. |
| (d) | A contingent deferred sales charge for Class C shares is not reflected in total return calculations. |
| (e) | Includes fee/expense recovery of less than 0.01%. |
| (f) | The variation in the Fund’s turnover rate from 2015 to 2016 was primarily due to fluctuation in the level of fund assets due to shareholder flows. |
See accompanying notes to financial statements.
| 76
Financial Highlights (continued)
For a share outstanding throughout each period.
| | | | | | | | |
| | | Limited Term Government and
Agency Fund—Class N | |
| | | Year Ended
September 30,
2018 | | | Period Ended
September 30,
2017* | |
Net asset value, beginning of the period | | $ | 11.36 | | | $ | 11.39 | |
| | | | | | | | |
INCOME (LOSS) FROM INVESTMENT OPERATIONS: | | | | | | | | |
Net investment income(a) | | | 0.15 | | | | 0.05 | |
Net realized and unrealized gain (loss) | | | (0.14 | ) | | | 0.08 | (b) |
| | | | | | | | |
Total from Investment Operations | | | 0.01 | | | | 0.13 | |
| | | | | | | | |
LESS DISTRIBUTIONS FROM: | | | | | | | | |
Net investment income | | | (0.25 | ) | | | (0.16 | ) |
| | | | | | | | |
Net asset value, end of the period | | $ | 11.12 | | | $ | 11.36 | |
| | | | | | | | |
Total return(c) | | | 0.09 | % | | | 1.12 | %(d) |
RATIOS TO AVERAGE NET ASSETS: | | | | | | | | |
Net assets, end of the period (000’s) | | $ | 3,176 | | | $ | 1,900 | |
Net expenses(e) | | | 0.46 | % | | | 0.47 | %(f) |
Gross expenses | | | 0.48 | % | | | 0.50 | %(f) |
Net investment income | | | 1.37 | % | | | 0.64 | %(f) |
Portfolio turnover rate | | | 157 | % | | | 126 | %(g) |
| * | From commencement of Class operations on February 1, 2017 through September 30, 2017. |
| (a) | Per share net investment income has been calculated using the average shares outstanding during the period. |
| (b) | The amount shown for a share outstanding does not correspond with the aggregate realized and unrealized gain (loss) on investments for the period due to the timing of sales and redemptions of fund shares in relation to fluctuating market values of investments of the Fund. |
| (c) | Had certain expenses not been waived/reimbursed during the period, total returns would have been lower. |
| (d) | Periods less than one year are not annualized. |
| (e) | The investment adviser agreed to waive its fees and/or reimburse a portion of the Fund’s expenses during the period. Without this waiver/reimbursement, expenses would have been higher. |
| (f) | Computed on an annualized basis for periods less than one year. |
| (g) | Represents the Fund’s portfolio turnover rate for the year ended September 30, 2017. |
See accompanying notes to financial statements.
77 |
Financial Highlights (continued)
For a share outstanding throughout each period.
| | | | | | | | | | | | | | | | | | | | |
| | | Limited Term Government and Agency Fund—Class Y | |
| | | Year Ended
September 30,
2018 | | | Year Ended
September 30,
2017 | | | Year Ended
September 30,
2016 | | | Year Ended
September 30,
2015 | | | Year Ended
September 30,
2014 | |
Net asset value, beginning of the period | | $ | 11.36 | | | $ | 11.55 | | | $ | 11.61 | | | $ | 11.65 | | | $ | 11.72 | |
| | | | | | | | | | | | | | | | | | | | |
INCOME (LOSS) FROM INVESTMENT OPERATIONS: | | | | | | | | | | | | | | | | | | | | |
Net investment income(a) | | | 0.14 | | | | 0.11 | | | | 0.14 | | | | 0.17 | | | | 0.18 | |
Net realized and unrealized gain (loss) | | | (0.13 | ) | | | (0.09 | ) | | | 0.00 | (b) | | | 0.01 | (c) | | | 0.02 | |
| | | | | | | | | | | | | | | | | | | | |
Total from Investment Operations | | | 0.01 | | | | 0.02 | | | | 0.14 | | | | 0.18 | | | | 0.20 | |
| | | | | | | | | | | | | | | | | | | | |
LESS DISTRIBUTIONS FROM: | | | | | | | | | | | | | | | | | | | | |
Net investment income | | | (0.24 | ) | | | (0.21 | ) | | | (0.20 | ) | | | (0.22 | ) | | | (0.27 | ) |
| | | | | | | | | | | | | | | | | | | | |
Net asset value, end of the period | | $ | 11.13 | | | $ | 11.36 | | | $ | 11.55 | | | $ | 11.61 | | | $ | 11.65 | |
| | | | | | | | | | | | | | | | | | | | |
Total return | | | 0.09 | % | | | 0.22 | % | | | 1.19 | % | | | 1.51 | % | | | 1.70 | % |
RATIOS TO AVERAGE NET ASSETS: | | | | | | | | | | | | | | | | | | | | |
Net assets, end of the period (000’s) | | $ | 366,847 | | | $ | 360,322 | | | $ | 411,898 | | | $ | 431,727 | | | $ | 330,224 | |
Net expenses | | | 0.55 | % | | | 0.55 | % | | | 0.52 | % | | | 0.52 | % | | | 0.55 | %(d) |
Gross expenses | | | 0.55 | % | | | 0.55 | % | | | 0.52 | % | | | 0.52 | % | | | 0.55 | %(d) |
Net investment income | | | 1.26 | % | | | 0.92 | % | | | 1.20 | % | | | 1.45 | % | | | 1.58 | % |
Portfolio turnover rate | | | 157 | % | | | 126 | % | | | 109 | %(e) | | | 48 | % | | | 24 | % |
| (a) | Per share net investment income has been calculated using the average shares outstanding during the period. |
| (b) | Amount rounds to less than $0.01 per share. |
| (c) | The amount shown for a share outstanding does not correspond with the aggregate realized and unrealized gain (loss) on investments for the period due to the timing of sales and redemptions of fund shares in relation to fluctuating market values of investments of the Fund. |
| (d) | Includes fee/expense recovery of less than 0.01%. |
| (e) | The variation in the Fund’s turnover rate from 2015 to 2016 was primarily due to fluctuation in the level of fund assets due to shareholder flows. |
See accompanying notes to financial statements.
| 78
Notes to Financial Statements
September 30, 2018
1. Organization. Loomis Sayles Funds I and Loomis Sayles Funds II (the “Trusts” and each a “Trust”) are each organized as a Massachusetts business trust. Each Trust is registered under the Investment Company Act of 1940, as amended (the “1940 Act”), as an open-end management investment company. Each Declaration of Trust permits the Board of Trustees to authorize the issuance of an unlimited number of shares of the Trust in multiple series. The financial statements for certain funds of the Trusts are presented in separate reports. The following funds (individually, a “Fund” and collectively, the “Funds”) are included in this report:
Loomis Sayles Funds I:
Loomis Sayles Intermediate Duration Bond Fund (the “Intermediate Duration Bond Fund”)
Loomis Sayles Funds II:
Loomis Sayles High Income Fund (the “High Income Fund”)
Loomis Sayles Limited Term Government and Agency Fund (the “Limited Term Government and Agency Fund”)
Each Fund is a diversified investment company.
The Funds each offer Class A, Class C and Class Y shares. In addition, High Income Fund and Limited Term Government and Agency Fund began offering Class N shares effective November 30, 2016 and February 1, 2017, respectively.
Class A shares of Intermediate Duration Bond Fund and High Income Fund are sold with a maximum front-end sales charge of 4.25%. Class A shares of Limited Term Government and Agency Fund are sold with a maximum front-end sales charge of 2.25%. Class C shares do not pay a front-end sales charge, pay higher Rule 12b-1 fees than Class A shares for 10 years (at which point they automatically convert to Class A shares) and may be subject to a contingent deferred sales charge (“CDSC”) of 1.00% if those shares are redeemed within one year of acquisition, except for reinvested distributions. Class N and Class Y shares do not pay a front-end sales charge, a CDSC or Rule 12b-1 fees. Class N shares are offered with an initial minimum investment of $1,000,000. Class Y shares are offered with an initial minimum investment of $100,000. Certain categories of investors are exempted from the minimum investment amounts for Class N and Class Y as outlined in the relevant Funds’ prospectus.
Most expenses can be directly attributed to a Fund. Expenses which cannot be directly attributed to a Fund are generally apportioned based on the relative net assets of each of the funds in Natixis Funds Trust I, Natixis Funds Trust II, Natixis Funds Trust IV and Gateway Trust (“Natixis Funds Trusts”), Loomis Sayles Funds I and Loomis Sayles Funds II (“Loomis Sayles Funds Trusts”), and Natixis ETF Trust. Expenses of a Fund are borne pro rata by the holders of each class of shares, except that each class bears expenses unique to that class (such as the Rule 12b-1 fees applicable to Class A and Class C) and transfer agent fees for High Income Fund and Limited Term Government and Agency Fund are borne collectively for Class A, Class C and Class Y, and
79 |
Notes to Financial Statements (continued)
September 30, 2018
individually for Class N. In addition, each class votes as a class only with respect to its own Rule 12b-1 Plan. Shares of each class would receive their pro rata share of the net assets of a Fund if the Fund were liquidated. The Trustees approve separate distributions from net investment income on each class of shares.
2. Significant Accounting Policies. The following is a summary of significant accounting policies consistently followed by each Fund in the preparation of its financial statements. The Funds’ financial statements follow the accounting and reporting guidelines provided for investment companies and are prepared in accordance with accounting principles generally accepted in the United States of America which require the use of management estimates that affect the reported amounts and disclosures in the financial statements. Actual results could differ from those estimates. Management has evaluated the events and transactions subsequent to year-end through the date the financial statements were issued and has determined that there were no material events that would require disclosure in the Funds’ financial statements.
a. Valuation. Fund securities and other investments are valued at market value based on market quotations obtained or determined by independent pricing services recommended by the adviser and approved by the Board of Trustees. Fund securities and other investments for which market quotations are not readily available are valued at fair value as determined in good faith by the adviser pursuant to procedures approved by the Board of Trustees, as described below. Market value is determined as follows:
Debt securities and unlisted preferred equity securities are valued based on evaluated bids furnished to the Fund by an independent pricing service or bid prices obtained from broker-dealers. Senior loans are valued at bid prices supplied by an independent pricing service, if available. Listed equity securities (including shares of closed-end investment companies and exchange-traded funds) are valued at the last sale price quoted on the exchange where they are traded most extensively or, if there is no reported sale during the day, the closing bid quotation as reported by an independent pricing service. Securities traded on the NASDAQ Global Select Market, NASDAQ Global Market and NASDAQ Capital Market are valued at the NASDAQ Official Closing Price (“NOCP”), or if lacking an NOCP, at the most recent bid quotations on the applicable NASDAQ Market. Unlisted equity securities (except unlisted preferred equity securities) are valued at the last sale price quoted in the market where they are traded most extensively or, if there is no reported sale during the day, the closing bid quotation as reported by an independent pricing service. If there is no last sale price or closing bid quotation available, unlisted equity securities will be valued using evaluated bids furnished by an independent pricing service, if available. In some foreign markets, an official close price and a last sale price may be available from the foreign exchange or market. In those cases, the official close price is used. Broker-dealer bid prices may
| 80
Notes to Financial Statements (continued)
September 30, 2018
be used to value debt and unlisted equity securities and senior loans where an independent pricing service is unable to price a security or where an independent pricing service does not provide a reliable price for the security. Forward foreign currency contracts are valued utilizing interpolated rates determined based on information provided by an independent pricing service. Futures contracts are valued at the most recent settlement price on the exchange on which the adviser believes that, over time, they are traded most extensively. Centrally cleared credit default swap agreements are valued at settlement prices of the clearing house on which the contracts were traded or prices obtained from broker-dealers. Bilateral credit default swaps are valued based on mid prices (between the bid price and the ask price) supplied by an independent pricing service.
Fund securities and other investments for which market quotations are not readily available are valued at fair value as determined in good faith by the adviser pursuant to procedures approved by the Board of Trustees. The Funds may also value securities and other investments at fair value in other circumstances such as when extraordinary events occur after the close of a foreign market but prior to the close of the New York Stock Exchange. This may include situations relating to a single issuer (such as a declaration of bankruptcy or a delisting of the issuer’s security from the primary market on which it has traded) as well as events affecting the securities markets in general (such as market disruptions or closings and significant fluctuations in U.S. and/or foreign markets). When fair valuing its securities or other investments, the Funds may, among other things, use modeling tools or other processes that may take into account factors such as securities or other market activity and/or significant events that occur after the close of the foreign market and before the time the Fund’s net asset value (“NAV”) is calculated. Fair value pricing may require subjective determinations about the value of a security, and fair values used to determine a Fund’s NAV may differ from quoted or published prices, or from prices that are used by others, for the same securities. In addition, the use of fair value pricing may not always result in adjustments to the prices of securities held by a Fund.
Illiquid securities for which market quotations are readily available and have been evaluated by the adviser are considered and classified as fair valued securities pursuant to the Funds’ pricing policies and procedures.
81 |
Notes to Financial Statements (continued)
September 30, 2018
As of September 30, 2018, securities held by the Funds were fair valued as follows:
| | | | | | | | | | | | | | | | |
Fund | | Securities
classified as
fair valued | | | Percentage of
Net Assets | | | Securities fair
valued by the
Fund’s adviser | | | Percentage of
Net Assets | |
High Income Fund | | $ | 553,512 | | | | 0.3 | % | | $ | 1,334,593 | | | | 0.8 | % |
Intermediate Duration Bond Fund | | | — | | | | — | | | | 14,830 | | | | Less than 0.1 | % |
Limited Term Government and Agency Fund | | | — | | | | — | | | | 191,318 | | | | Less than 0.1 | % |
b. Investment Transactions and Related Investment Income. Investment transactions are accounted for on a trade date plus one day basis for daily NAV calculation. However, for financial reporting purposes, investment transactions are reported on trade date. Dividend income is recorded on ex-dividend date, or in the case of certain foreign securities, as soon as a Fund is notified, and interest income is recorded on an accrual basis. Interest income is increased by the accretion of discount and decreased by the amortization of premium, if applicable. Periodic principal adjustments for inflation-protected securities are recorded to interest income. Negative principal adjustments (in the event of deflation) are recorded as reductions of interest income to the extent of interest income earned, not to exceed the amount of positive principal adjustments on a cumulative basis. In determining net gain or loss on securities sold, the cost of securities has been determined on an identified cost basis. Investment income, non-class specific expenses and realized and unrealized gains and losses are allocated on a pro rata basis to each class based on the relative net assets of each class to the total net assets of the Fund.
c. Foreign Currency Translation. The books and records of the Funds are maintained in U.S. dollars. The values of securities, currencies and other assets and liabilities denominated in currencies other than U.S. dollars are translated into U.S. dollars based upon foreign exchange rates prevailing at the end of the period. Purchases and sales of investment securities, income and expenses are translated into U.S. dollars on the respective dates of such transactions.
Net realized foreign exchange gains or losses arise from sales of foreign currency, changes in exchange rates between the trade and settlement dates on securities transactions and the difference between the amounts of dividends, interest and foreign withholding taxes recorded on the Fund’s books and the U.S. dollar equivalent of the amounts actually received or paid. Net unrealized foreign exchange gains or losses arise from changes in the value of assets and liabilities, other than investment securities, as of the end of the fiscal period, resulting from changes in exchange rates. Net realized foreign exchange gains or losses and the net change in unrealized foreign exchange gains or losses are disclosed in the Statements of Operations. For federal
| 82
Notes to Financial Statements (continued)
September 30, 2018
income tax purposes, net realized foreign exchange gains or losses are characterized as ordinary income and may, if the funds have net losses, reduce the amount of income available to be distributed by the Funds.
The values of investment securities are presented at the foreign exchange rates prevailing at the end of the period for financial reporting purposes. Net realized and unrealized gains or losses on investments reported in the Statements of Operations reflect gains or losses resulting from changes in exchange rates and fluctuations which arise due to changes in market prices of investment securities. For federal income tax purposes, a portion of the net realized gain or loss on investments arising from changes in exchange rates, which is reflected in the Statements of Operations, may be characterized as ordinary income and may, if the Funds have net losses, reduce the amount of income available to be distributed by the Funds.
During the year ended September 30, 2018, the amount of income available to be distributed by High Income Fund has been reduced by $1,175,480, as a result of losses arising from changes in exchange rates.
The Funds may use foreign currency exchange contracts to facilitate transactions in foreign-denominated investments. Losses may arise from changes in the value of the foreign currency or if the counterparties do not perform under the contracts’ terms.
d. Forward Foreign Currency Contracts. The Funds may enter into forward foreign currency contracts, including forward foreign cross currency contracts to acquire exposure to foreign currencies or to hedge the Funds’ investments against currency fluctuation. A contract can also be used to offset a previous contract. These contracts involve market risk in excess of the unrealized gain or loss reflected in the Funds’ Statements of Assets and Liabilities. The U.S. dollar value of the currencies a Fund has committed to buy or sell represents the aggregate exposure to each currency a Fund has acquired or hedged through currency contracts outstanding at period end. Gains or losses are recorded for financial statement purposes as unrealized until settlement date. Contracts are traded over-the-counter directly with a counterparty. Risks may arise upon entering into these contracts from the potential inability of counterparties to meet the terms of their contracts and from unanticipated movements in the value of a foreign currency relative to the U.S. dollar. Certain contracts may require the movement of cash and/or securities as collateral for the Funds’ or counterparty’s net obligations under the contracts.
e. Futures Contracts. The Funds may enter into futures contracts. Futures contracts are agreements between two parties to buy and sell a particular instrument or index for a specified price on a specified future date.
When a Fund enters into a futures contract, it is required to deposit with (or for the benefit of) its broker an amount of cash or short-term high-quality securities as “initial margin.” As the value of the contract changes, the value of the futures contract
83 |
Notes to Financial Statements (continued)
September 30, 2018
position increases or declines. Subsequent payments, known as “variation margin,” are made or received by a Fund, depending on the price fluctuations in the fair value of the contract and the value of cash or securities on deposit with the broker. The aggregate principal amounts of the contracts are not recorded in the financial statements. Fluctuations in the value of the contracts are recorded in the Statements of Assets and Liabilities as an asset (liability) and in the Statements of Operations as unrealized appreciation (depreciation) until the contracts are closed, when they are recorded as realized gains (losses). Realized gain or loss on a futures position is equal to the difference between the value of the contract at the time it was opened and the value at the time it was closed, minus brokerage commissions. When a Fund enters into a futures contract certain risks may arise, such as illiquidity in the futures market, which may limit a Fund’s ability to close out a futures contract prior to settlement date, and unanticipated movements in the value of securities or interest rates.
Futures contracts are exchange-traded. Exchange-traded futures contracts are standardized and are settled through a clearing house with fulfillment supported by the credit of the exchange. Therefore, counterparty credit risks to the Funds are reduced; however, in the event that a counterparty enters into bankruptcy, a Fund’s claim against initial/variation margin on deposit with the counterparty may be subject to terms of a final settlement in bankruptcy court.
f. Swap Agreements. The Funds may enter into credit default swaps. A credit default swap is an agreement between two parties (the “protection buyer” and “protection seller”) to exchange the credit risk of an issuer (“reference obligation”) for a specified time period. The reference obligation may be one or more debt securities or an index of such securities. The Funds may be either the protection buyer or the protection seller. As a protection buyer, the Funds have the ability to hedge the downside risk of an issuer or group of issuers. As a protection seller, the Funds have the ability to gain exposure to an issuer or group of issuers whose bonds are unavailable or in short supply in the cash bond market, as well as realize additional income in the form of fees paid by the protection buyer. The protection buyer is obligated to pay the protection seller a stream of payments (“fees”) over the term of the contract, provided that no credit event, such as a default or a downgrade in credit rating, occurs on the reference obligation. The Funds may also pay or receive upfront premiums. If a credit event occurs, the protection seller must pay the protection buyer the difference between the agreed upon notional value and market value of the reference obligation. Market value in this case is determined by a facilitated auction whereby a minimum number of allowable broker bids, together with a specified valuation method, are used to calculate the value. The maximum potential amount of undiscounted future payments that a Fund as the protection seller could be required to make under a credit default swap agreement would be an amount equal to the notional amount of the agreement.
The notional amounts of swap agreements are not recorded in the financial statements. Swap agreements are valued daily and fluctuations in the value are
| 84
Notes to Financial Statements (continued)
September 30, 2018
recorded in the Statements of Operations as change in unrealized appreciation (depreciation) on swap agreements. Fees are accrued in accordance with the terms of the agreement and are recorded in the Statements of Assets and Liabilities as fees receivable or payable. When received or paid, fees are recorded in the Statements of Operations as realized gain or loss. Upfront premiums paid or received by the Funds are recorded on the Statements of Assets and Liabilities as an asset or liability, respectively, and are amortized or accreted over the term of the agreement and recorded as realized gain or loss. Payments made or received by the Funds as a result of a credit event or termination of the agreement are recorded as realized gain or loss.
Swap agreements are privately negotiated in the over-the-counter (“OTC”) market and may be entered into as a bilateral contract or centrally cleared (“centrally cleared swaps”). Bilateral swap agreements are traded between counterparties and, as such, are subject to the risk that a party to the agreement will not be able to meet its obligations. In a centrally cleared swap, immediately following execution of the swap agreement, the swap agreement is novated to a central counterparty (the “CCP”) and the Fund faces the CCP through a broker. Upon entering into a centrally cleared swap, the Fund is required to deposit initial margin with the broker in the form of cash or securities in an amount that varies depending on the size and risk profile of the particular swap. Subsequent payments, known as “variation margin,” are made or received by the Fund based on the daily change in the value of the centrally cleared swap agreement. For centrally cleared swaps, the Fund’s counterparty credit risk is reduced as the CCP stands between the Fund and the counterparty. The Funds cover their net obligations under outstanding swap agreements by segregating or earmarking cash or securities.
No swap agreements were held by the Funds during the year ended September 30, 2018.
g. When-Issued and Delayed Delivery Transactions. The Funds may enter into when-issued or delayed delivery transactions. When-issued refers to transactions made conditionally because a security, although authorized, has not been issued. Delayed delivery refers to transactions for which delivery or payment will occur at a later date, beyond the normal settlement period. The price of when-issued and delayed delivery securities and the date when the securities will be delivered and paid for are fixed at the time the transaction is negotiated. The security and the obligation to pay for it are recorded by the Funds at the time the commitment is entered into. The value of the security may vary with market fluctuations during the time before the Funds take delivery of the security. No interest accrues to the Funds until the transaction settles.
Delayed delivery transactions include those designated as To Be Announced (“TBAs”) in the Portfolios of Investments. For TBAs, the actual security that will be delivered to fulfill the transaction is not designated at the time of the trade. The security is “to be announced” 48 hours prior to the established trade settlement date. Certain
85 |
Notes to Financial Statements (continued)
September 30, 2018
transactions require the Funds or counterparty to post cash and/or securities as collateral for the net mark-to-market exposure to the other party. The Funds cover their net obligations under outstanding delayed delivery commitments by segregating or earmarking cash or securities at the custodian.
Purchases of when-issued or delayed delivery securities may have a similar effect on the Funds’ NAV as if the Funds’ had created a degree of leverage in the portfolio. Risks may arise upon entering into such transactions from the potential inability of counterparties to meet their obligations under the transactions. Additionally, losses may arise due to changes in the value of the underlying securities.
There were no when-issued or delayed delivery securities held by the Funds as of September 30, 2018.
h. New Disclosure Requirements. In accordance with new reporting requirements pursuant to Regulation S-X of the Securities and Exchange Commission, presentation of certain amounts on the Statements of Changes in Net Assets, for the year ended September 30, 2017, have been conformed to meet the new disclosure requirements. These adjustments include Distributions to Shareholders; where the prior disclosure separately stated distributions from net investment income and distributions from net realized capital gains for each share class of the Fund, they are now combined into a single line item for each respective share class. In addition, disclosure of Distributions in Excess of Net Investment Income and Undistributed Net Investment Income, where applicable, has been removed from the Statements of Changes in Net Assets.
The following is a summary of the previously disclosed amounts, as reported at September 30, 2017:
| | | | |
| High Income Fund | | | |
FROM DISTRIBUTIONS TO SHAREHOLDERS: | | | | |
Net investment income | | | | |
Class A | | $ | (1,577,362 | ) |
Class C | | | (453,429 | ) |
Class N | | | (41 | ) |
Class Y | | | (6,175,066 | ) |
| | | | |
Total distributions | | $ | (8,205,898 | ) |
| | | | |
DISTRIBUTIONS IN EXCESS OF NET INVESTMENT INCOME | | $ | (357,359 | ) |
| | | | |
| 86
Notes to Financial Statements (continued)
September 30, 2018
| | | | |
| Intermediate Duration Bond Fund | | | |
FROM DISTRIBUTIONS TO SHAREHOLDERS: | | | | |
Net investment income | | | | |
Class A | | $ | (390,277 | ) |
Class C | | | (36,839 | ) |
Class Y | | | (3,322,106 | ) |
Net realized capital gains | | | | |
Class A | | | (146,821 | ) |
Class C | | | (22,477 | ) |
Class Y | | | (1,093,586 | ) |
| | | | |
Total distributions | | $ | (5,012,106 | ) |
| | | | |
DISTRIBUTIONS IN EXCESS OF NET INVESTMENT INCOME | | $ | (24,507 | ) |
| | | | |
| |
| Limited Term Government and Agency Fund | | | |
FROM DISTRIBUTIONS TO SHAREHOLDERS: | | | | |
Net investment income | | | | |
Class A | | $ | (6,178,474 | ) |
Class C | | | (492,969 | ) |
Class N | | | (19,353 | ) |
Class Y | | | (6,976,388 | ) |
| | | | |
Total distributions | | $ | (13,667,184 | ) |
| | | | |
UNDISTRIBUTED NET INVESTMENT INCOME | | $ | 367,737 | |
| | | | |
i. Federal and Foreign Income Taxes. The Trusts treat each Fund as a separate entity for federal income tax purposes. Each Fund intends to meet the requirements of the Internal Revenue Code of 1986, as amended, applicable to regulated investment companies, and to distribute to its shareholders substantially all of its net investment income and any net realized capital gains at least annually. Management has performed an analysis of each Fund’s tax positions for the open tax years as of September 30, 2018 and has concluded that no provisions for income tax are required. The Funds’ federal tax returns for the prior three fiscal years remain subject to examination by the Internal Revenue Service. Management is not aware of any events that are reasonably possible to occur in the next twelve months that would result in the amounts of any unrecognized tax benefits significantly increasing or decreasing for the Funds. However, management’s conclusions regarding tax positions taken may be subject to review and adjustment at a later date based on factors including, but not limited to, new tax laws and accounting regulations and interpretations thereof.
A Fund may be subject to foreign withholding taxes on investment income and taxes on capital gains on investments that are accrued and paid based upon the Fund’s understanding of the tax rules and regulations that exist in the countries in which the Fund invests. Foreign withholding taxes on dividend and interest income are reflected on the Statements of Operations as a reduction of investment income, net of amounts eligible to be reclaimed. Dividends and interest receivable on the Statements of Assets and Liabilities are net of foreign withholding taxes. Foreign withholding taxes where
87 |
Notes to Financial Statements (continued)
September 30, 2018
reclaims have been or will be filed are reflected on the Statements of Assets and Liabilities as tax reclaims receivable. Capital gains taxes paid are included in net realized gain (loss) on investments in the Statements of Operations. Accrued but unpaid capital gains taxes are reflected as foreign taxes payable on the Statements of Assets and Liabilities, if applicable, and reduce unrealized gains on investments. In the event that realized gains on investments are subsequently offset by realized losses, taxes paid on realized gains may be returned to a Fund. Such amounts, if applicable, are reflected as foreign tax rebates receivable on the Statements of Assets and Liabilities and are recorded as a realized gain when received.
j. Dividends and Distributions to Shareholders. Dividends and distributions are recorded on ex-dividend date. The timing and characterization of certain income and capital gain distributions are determined in accordance with federal tax regulations, which may differ from accounting principles generally accepted in the United States of America. Permanent differences are primarily due to differing treatments for book and tax purposes of items such as foreign currency gains and losses, premium amortization, capital gain distributions received, paydown gains and losses, contingent payment debt instruments, convertible bonds and passive foreign investment company adjustments. Permanent book and tax basis differences relating to shareholder distributions will result in reclassifications to capital accounts. Temporary differences between book and tax distributable earnings are primarily due to deferred Trustees’ fees, wash sales, premium amortization, futures contract mark-to-market, corporate actions, contingent payment debt instruments, convertible bonds, defaulted and/or non-income producing securities, forward foreign currency contract mark-to-market, passive foreign investment company adjustments and return of capital distributions received. Amounts of income and capital gain available to be distributed on a tax basis are determined annually, and at other times during the Funds’ fiscal year as may be necessary to avoid knowingly declaring and paying a return of capital distribution. Distributions from net investment income and net realized short-term capital gains are reported as distributed from ordinary income for tax purposes.
The tax characterization of distributions is determined on an annual basis. The tax character of distributions paid to shareholders during the years ended September 30, 2018 and 2017 were as follows:
| | | | | | | | | | | | |
| | | 2018 Distributions Paid From: | |
Fund | | Ordinary
Income | | | Long-Term
Capital Gains | | | Total | |
High Income Fund | | $ | 7,550,940 | | | $ | — | | | $ | 7,550,940 | |
Intermediate Duration Bond Fund | | | 4,433,431 | | | | — | | | | 4,433,431 | |
Limited Term Government and Agency Fund | | | 14,046,088 | | | | — | | | | 14,046,088 | |
| 88
Notes to Financial Statements (continued)
September 30, 2018
| | | | | | | | | | | | |
| | | 2017 Distributions Paid From: | |
Fund | | Ordinary
Income | | | Long-Term
Capital Gains | | | Total | |
High Income Fund | | $ | 8,205,898 | | | $ | — | | | $ | 8,205,898 | |
Intermediate Duration Bond Fund | | | 4,972,573 | | | | 39,533 | | | | 5,012,106 | |
Limited Term Government and Agency Fund | | | 13,667,184 | | | | — | | | | 13,667,184 | |
For the year ended September 30, 2017 differences between amounts previously reported and now disclosed in Note 2h of the Notes to Financial Statements are primarily attributable to different book and tax treatment for short-term capital gains.
Distributions paid to shareholders from net investment income and net realized capital gains, based on accounting principles generally accepted in the United States of America, are consolidated and reported on the Statements of Changes in Net Assets as Distributions to Shareholders. Distributions paid to shareholders from net investment income and net realized capital gains expressed in per-share amounts, based on accounting principles generally accepted in the United States of America, are separately stated and reported within the Financial Highlights.
As of September 30, 2018, the components of distributable earnings on a tax basis were as follows:
| | | | | | | | | | | | |
| | | High Income
Fund | | | Intermediate
Duration
Bond Fund | | | Limited Term
Government
and Agency
Fund | |
Undistributed ordinary income | | $ | 1,078,412 | | | $ | 52,463 | | | $ | 538,665 | |
Undistributed long-term capital gains | | | 469,476 | | | | — | | | | — | |
| | | | | | | | | | | | |
Total undistributed earnings | | | 1,547,888 | | | | 52,463 | | | | 538,665 | |
| | | | | | | | | | | | |
Capital loss carryforward: | | | | | | | | | | | | |
Short-term: | | | | | | | | | | | | |
No expiration date | | | — | | | | (3,060,576 | ) | | | (2,596,770 | ) |
Long-term: | | | | | | | | | | | | |
No expiration date | | | — | | | | (1,011,526 | ) | | | (26,585,289 | ) |
| | | | | | | | | | | | |
Total capital loss carryforward | | | — | | | | (4,072,102 | ) | | | (29,182,059 | ) |
| | | | | | | | | | | | |
Unrealized depreciation | | | (6,689,347 | ) | | | (3,003,720 | ) | | | (15,829,352 | ) |
| | | | | | | | | | | | |
Total accumulated losses | | $ | (5,141,459 | ) | | $ | (7,023,359 | ) | | $ | (44,472,746 | ) |
| | | | | | | | | | | | |
Capital loss carryforward utilized in the current year | | $ | 989,819 | | | $ | — | | | $ | — | |
| | | | | | | | | | | | |
89 |
Notes to Financial Statements (continued)
September 30, 2018
As of September 30, 2018, unrealized depreciation as a component of distributable earnings was as follows:
| | | | | | | | | | | | |
| | | High Income
Fund | | | Intermediate
Duration
Bond Fund | | | Limited Term
Government
and Agency
Fund | |
Unrealized depreciation | | | | | | | | | | | | |
Investments | | $ | (4,535,979 | ) | | $ | (3,003,720 | ) | | $ | (15,829,352 | ) |
Foreign currency translations | | | (2,153,368 | ) | | | — | | | | — | |
| | | | | | | | | | | | |
Total unrealized depreciation | | $ | (6,689,347 | ) | | $ | (3,003,720 | ) | | $ | (15,829,352 | ) |
| | | | | | | | | | | | |
As of September 30, 2018, the tax cost of investments (including derivatives, if applicable) and unrealized appreciation (depreciation) on a federal tax basis were as follows:
| | | | | | | | | | | | |
| | | High Income
Fund | | | Intermediate
Duration
Bond Fund | | | Limited Term
Government
and Agency
Fund | |
Federal tax cost | | $ | 174,165,501 | | | $ | 169,838,224 | | | $ | 743,297,542 | |
| | | | | | | | | | | | |
Gross tax appreciation | | $ | 4,788,983 | | | $ | 256,574 | | | $ | 1,842,467 | |
Gross tax depreciation | | | (11,435,839 | ) | | | (3,260,294 | ) | | | (17,671,819 | ) |
| | | | | | | | | | | | |
Net tax depreciation | | $ | (6,646,856 | ) | | $ | (3,003,720 | ) | | $ | (15,829,352 | ) |
| | | | | | | | | | | | |
Differences between these amounts and those reported in the components of distributable earnings are primarily attributable to unrealized foreign exchange gains or losses.
k. Loan Participations. High Income Fund may invest in loans to corporate, governmental or other borrowers. The Funds’ investments in loans may be in the form of participations in loans or assignments of all or a portion of loans. A loan is often administered by a bank or other financial institution that acts as agent for all holders. The agent administers the terms of the loan, as specified in the loan agreement. When investing in a loan participation, (i) a Fund has the right to receive payments of principal, interest and any fees to which it is entitled only from the party from whom the Fund has purchased the participation and only upon receipt by that party of payments from the borrower and (ii) a Fund generally has no right to enforce compliance by the borrower with the terms of the loan agreement or to vote on matters arising under the loan agreement. Thus, a Fund may be subject to credit risk both of the party from whom it purchased the loan participation and the borrower and the Fund may have minimal control over the terms of any loan modification. When a Fund purchases assignments from lenders, it acquires direct rights against the borrower on the loan. Loan
| 90
Notes to Financial Statements (continued)
September 30, 2018
agreements and participations outstanding at the end of the period, if any, are listed in each applicable Fund’s Schedule of Investments.
l. Repurchase Agreements. Each Fund may enter into repurchase agreements, under the terms of a Master Repurchase Agreement, under which each Fund acquires securities as collateral and agrees to resell the securities at an agreed upon time and at an agreed upon price. It is each Fund’s policy that the market value of the collateral for repurchase agreements be at least equal to 102% of the repurchase price, including interest. Certain repurchase agreements are tri-party arrangements whereby the collateral is held in a segregated account for the benefit of the Fund and on behalf of the counterparty. Repurchase agreements could involve certain risks in the event of default or insolvency of the counterparty, including possible delays or restrictions upon a Fund’s ability to dispose of the underlying securities. As of September 30, 2018, each Fund, as applicable, had investments in repurchase agreements for which the value of the related collateral exceeded the value of the repurchase agreement. The gross value of repurchase agreements is included in the Statements of Assets and Liabilities for financial reporting purposes.
m. Due to/from Brokers. Transactions and positions in certain futures and forward foreign currency contracts are maintained and cleared by registered U.S. broker/dealers pursuant to customer agreements between the Funds and the various broker/dealers. The due to broker balance in the Statements of Assets and Liabilities for High Income Fund represents cash received as collateral for forward foreign currency contracts. The due from broker balance in the Statements of Assets and Liabilities for Intermediate Duration Bond Fund represents cash pledged as initial margin for futures contracts. In certain circumstances the Fund’s use of cash held at brokers is restricted by regulation or broker mandated limits.
n. Securities Lending. The Funds have entered into an agreement with State Street Bank and Trust Company (“State Street Bank”), as agent of the Funds, to lend securities to certain designated borrowers. The loans are collateralized with cash or securities in an amount equal to at least 105% or 102% of the market value (including accrued interest) of the loaned international or domestic securities, respectively, when the loan is initiated. Thereafter, the value of the collateral must remain at least 102% of the market value (including accrued interest) of loaned securities for U.S. equities and U.S. corporate debt; at least 105% of the market value (including accrued interest) of loaned securities for non-U.S. equities; and at least 100% of the market value (including accrued interest) of loaned securities for U.S. Government securities, sovereign debt issued by non-U.S. Governments and non-U.S. corporate debt. In the event that the market value of the collateral falls below the required percentages described above, the borrower will deliver additional collateral on the next business day. As with other extensions of credit, the Funds may bear the risk of loss with respect to the investment of the collateral. The Funds invest cash collateral in short-term investments, a portion
91 |
Notes to Financial Statements (continued)
September 30, 2018
of the income from which is remitted to the borrowers and the remainder allocated between the Funds and State Street Bank as lending agent.
For the year ended September 30, 2018, none of the Funds had loaned securities under this agreement.
o. Indemnifications. Under the Trusts’ organizational documents, their officers and Trustees are indemnified against certain liabilities arising out of the performance of their duties to the Funds. Additionally, in the normal course of business, the Funds enter into contracts with service providers that contain general indemnification clauses. The Funds’ maximum exposure under these arrangements is unknown as this would involve future claims that may be made against the Funds that have not yet occurred. However, based on experience, the Funds expect the risk of loss to be remote.
3. Fair Value Measurements. In accordance with accounting standards related to fair value measurements and disclosures, the Funds have categorized the inputs utilized in determining the value of each Fund’s assets or liabilities. These inputs are summarized in the three broad levels listed below:
| | • | | Level 1 – quoted prices in active markets for identical assets or liabilities; |
| | • | | Level 2 – prices determined using other significant inputs that are observable either directly, or indirectly through corroboration with observable market data (which could include quoted prices for similar assets or liabilities, interest rates, credit risk, etc.); and |
| | • | | Level 3 – prices determined using significant unobservable inputs when quoted prices or observable inputs are unavailable such as when there is little or no market activity for an asset or liability (unobservable inputs reflect each Fund’s own assumptions in determining the fair value of assets or liabilities and would be based on the best information available). |
The inputs or methodology used for valuing securities are not necessarily an indication of the risk associated with investing in those securities.
The Funds’ pricing policies and procedures are recommended by the adviser and approved by the Board of Trustees. Debt securities are valued based on evaluated bids furnished to the Funds by an independent pricing service. Broker-dealer bid prices may be used if an independent pricing service either is unable to price a security or does not provide a reliable price for a security. Broker-dealer bid prices for which the Funds do not have knowledge of the inputs used by the broker-dealer are categorized in Level 3. All security prices, including those obtained from an independent pricing service and broker-dealer bid prices, are reviewed on a daily basis by the adviser, subject to oversight by Fund management and the Board of Trustees. If the adviser, in good faith, believes that the price provided by an independent pricing service is unreliable, broker-dealer bid prices may be used until the price provided by the
| 92
Notes to Financial Statements (continued)
September 30, 2018
independent pricing service is considered to be reliable. Reliability of all security prices, including those obtained from an independent pricing service and broker-dealer bid prices, is tested in a variety of ways, including comparison to recent transaction prices and daily fluctuations, amongst other validation procedures in place. Securities for which market quotations are not readily available are valued at fair value as determined in good faith by the Funds’ adviser pursuant to procedures approved by the Board of Trustees. Fair valued securities may be categorized in Level 3.
The following is a summary of the inputs used to value the Funds’ investments as of September 30, 2018, at value:
High Income Fund
Asset Valuation Inputs
| | | | | | | | | | | | | | | | |
Description | | Level 1 | | | Level 2 | | | Level 3 | | | Total | |
Bonds and Notes | | | | | | | | | | | | | | | | |
Non-Convertible Bonds | | | | | | | | | | | | | | | | |
ABS Home Equity | | $ | — | | | $ | 2,165,123 | | | $ | 683 | (b) | | $ | 2,165,806 | |
Home Construction | | | — | | | | 3,795,902 | | | | 12 | (b) | | | 3,795,914 | |
All Other Non-Convertible Bonds(a) | | | — | | | | 135,772,118 | | | | — | | | | 135,772,118 | |
| | | | | | | | | | | | | | | | |
Total Non-Convertible Bonds | | | — | | | | 141,733,143 | | | | 695 | | | | 141,733,838 | |
| | | | | | | | | | | | | | | | |
Convertible Bonds(a) | | | — | | | | 16,618,165 | | | | — | | | | 16,618,165 | |
| | | | | | | | | | | | | | | | |
Total Bonds and Notes | | | — | | | | 158,351,308 | | | | 695 | | | | 158,352,003 | |
| | | | | | | | | | | | | | | | |
Loan Participations(a) | | | — | | | | — | | | | 437,015 | (c) | | | 437,015 | |
Senior Loans(a) | | | — | | | | 1,898,258 | | | | — | | | | 1,898,258 | |
Preferred Stocks | | | | | | | | | | | | | | | | |
Convertible Preferred Stocks(a) | | | — | | | | 2,304,876 | | | | — | | | | 2,304,876 | |
Non-Convertible Preferred Stocks(a) | | | 13,370 | | | | — | | | | — | | | | 13,370 | |
| | | | | | | | | | | | | | | | |
Total Preferred Stocks | | | 13,370 | | | | 2,304,876 | | | | — | | | | 2,318,246 | |
| | | | | | | | | | | | | | | | |
Other Investments(a) | | | — | | | | — | | | | 896,883 | (d) | | | 896,883 | |
Common Stocks | | | | | | | | | | | | | | | | |
Media | | | — | | | | 43,187 | | | | — | | | | 43,187 | |
Oil, Gas & Consumable Fuels | | | 1,317,745 | | | | 200,608 | | | | — | | | | 1,518,353 | |
Pharmaceuticals | | | 570,342 | | | | — | | | | — | | | | 570,342 | |
| | | | | | | | | | | | | | | | |
Total Common Stocks | | | 1,888,087 | | | | 243,795 | | | | — | | | | 2,131,882 | |
| | | | | | | | | | | | | | | | |
Warrants | | | 353 | | | | — | | | | — | | | | 353 | |
Short-Term Investments | | | — | | | | 1,484,006 | | | | — | | | | 1,484,006 | |
Forward Foreign Currency Contracts (unrealized appreciation) | | | — | | | | 142,661 | | | | — | | | | 142,661 | |
| | | | | | | | | | | | | | | | |
Total | | $ | 1,901,810 | | | $ | 164,424,904 | | | $ | 1,334,593 | | | $ | 167,661,307 | |
| | | | | | | | | | | | | | | | |
93 |
Notes to Financial Statements (continued)
September 30, 2018
High Income Fund (continued)
Liability Valuation Inputs
��
| | | | | | | | | | | | | | | | |
Description | | Level 1 | | | Level 2 | | | Level 3 | | | Total | |
Forward Foreign Currency Contracts (unrealized depreciation) | | $ | — | | | $ | (57,977 | ) | | $ | — | | | $ | (57,977 | ) |
| | | | | | | | | | | | | | | | |
| (a) | Details of the major categories of the Fund’s investments are reflected within the Portfolio of Investments. |
| (b) | Fair valued by the Fund’s adviser. |
| (c) | Fair valued by the Fund’s adviser using broker-dealer bid prices for which the inputs are unobservable to the Fund. |
| (d) | Fair valued by the Fund’s adviser ($8) or fair valued by the Fund’s adviser using broker-dealer bid prices for which the inputs are unobservable to the Fund ($896,875). |
Intermediate Duration Bond Fund
Asset Valuation Inputs
| | | | | | | | | | | | | | | | |
Description | | Level 1 | | | Level 2 | | | Level 3 | | | Total | |
Bonds and Notes | | | | | | | | | | | | | | | | |
ABS Home Equity | | $ | — | | | $ | 1,471,616 | | | $ | 14,830 | (b) | | $ | 1,486,446 | |
All Other Bonds and Notes(a) | | | — | | | | 162,647,420 | | | | — | | | | 162,647,420 | |
| | | | | | | | | | | | | | | | |
Total Bonds and Notes | | | — | | | | 164,119,036 | | | | 14,830 | | | | 164,133,866 | |
| | | | | | | | | | | | | | | | |
Short-Term Investments | | | — | | | | 2,700,638 | | | | — | | | | 2,700,638 | |
| | | | | | | | | | | | | | | | |
Total | | $ | — | | | $ | 166,819,674 | | | $ | 14,830 | | | $ | 166,834,504 | |
| | | | | | | | | | | | | | | | |
Liability Valuation Inputs
| | | | | | | | | | | | | | | | |
Description | | Level 1 | | | Level 2 | | | Level 3 | | | Total | |
Futures Contracts (unrealized depreciation) | | $ | (124,712 | ) | | $ | — | | | $ | — | | | $ | (124,712 | ) |
| | | | | | | | | | | | | | | | |
| (a) | Details of the major categories of the Fund’s investments are reflected within the Portfolio of Investments. |
| (b) | Fair valued by the Fund’s adviser. |
| 94
Notes to Financial Statements (continued)
September 30, 2018
Limited Term Government and Agency Fund
Asset Valuation Inputs
| | | | | | | | | | | | | | | | |
Description | | Level 1 | | | Level 2 | | | Level 3 | | | Total | |
Bonds and Notes | | | | | | | | | | | | | | | | |
Collateralized Mortgage Obligations | | $ | — | | | $ | 104,673,700 | | | $ | 191,318 | (b) | | $ | 104,865,018 | |
All Other Bonds and Notes(a) | | | — | | | | 576,487,501 | | | | — | | | | 576,487,501 | |
| | | | | | | | | | | | | | | | |
Total Bonds and Notes | | | — | | | | 681,161,201 | | | | 191,318 | | | | 681,352,519 | |
| | | | | | | | | | | | | | | | |
Short-Term Investments | | | — | | | | 46,115,671 | | | | — | | | | 46,115,671 | |
| | | | | | | | | | | | | | | | |
Total | | $ | — | | | $ | 727,276,872 | | | $ | 191,318 | | | $ | 727,468,190 | |
| | | | | | | | | | | | | | | | |
| (a) | Details of the major categories of the Fund’s investments are reflected within the Portfolio of Investments. |
| (b) | Fair valued by the Fund’s adviser. |
For the year ended September 30, 2018, there were no transfers among Levels 1, 2 and 3.
The following is a reconciliation of Level 3 investments for which significant unobservable inputs were used to determine fair value as of September 30, 2017 and/or September 30, 2018:
High Income Fund
Asset Valuation Inputs
| | | | | | | | | | | | | | | | | | | | |
Investments in Securities | | Balance as of
September 30,
2017 | | | Accrued
Discounts
(Premiums) | | | Realized
Gain
(Loss) | | | Change in
Unrealized
Appreciation
(Depreciation) | | | Purchases | |
Bonds and Notes | | | | | | | | | | | | | | | | | | | | |
Non-Convertible Bonds | | | | | | | | | | | | | | | | | | | | |
ABS Home Equity | | $ | — | | | $ | — | | | $ | 2,071 | | | $ | 291 | | | $ | — | |
Home Construction | | | 12 | | | | 25,661 | | | | — | | | | (25,661 | ) | | | — | |
Non-Agency Commercial Mortgage-Backed Securities | | | 939,675 | | | | — | | | | — | | | | (4,675 | ) | | | — | |
Loan Participations | | | | | | | | | | | | | | | | | | | | |
ABS Other | | | — | | | | 27 | | | | 158 | | | | 6,593 | | | | 497,937 | |
Other Investments | | | | | | | | | | | | | | | | | | | | |
Aircraft ABS | | | 1,853,562 | | | | — | | | | — | | | | (956,679 | ) | | | — | |
Common Stocks | | | | | | | | | | | | | | | | | | | | |
Media | | | 23,855 | | | | — | | | | — | | | | — | | | | — | |
Oil, Gas & Consumable Fuels | | | 154,523 | | | | — | | | | (498,121 | ) | | | 592,218 | | | | — | |
Warrants | | | — | (a) | | | — | | | | — | | | | — | | | | — | |
| | | | | | | | | | | | | | | | | | | | |
Total | | $ | 2,971,627 | | | $ | 25,688 | | | $ | (495,892 | ) | | $ | (387,913 | ) | | $ | 497,937 | |
| | | | | | | | | | | | | | | | | | | | |
95 |
Notes to Financial Statements (continued)
September 30, 2018
High Income Fund (continued)
Asset Valuation Inputs (continued)
| | | | | | | | | | | | | | | | | | | | |
Investments in Securities | | Sales | | | Transfers
into Level 3 | | | Transfers
out of
Level 3 | | | Balance as of
September 30,
2018 | | | Change in
Unrealized
Appreciation
(Depreciation)
from
Investments
Still Held at
September 30,
2018 | |
Bonds and Notes | | | | | | | | | | | | | | | | | | | | |
Non-Convertible Bonds | | | | | | | | | | | | | | | | | | | | |
ABS Home Equity | | $ | (28,719 | ) | | $ | 27,040 | | | $ | — | | | $ | 683 | | | $ | 291 | |
Home Construction | | | — | | | | — | | | | — | | | | 12 | | | | (25,661 | ) |
Non-Agency Commercial Mortgage-Backed Securities | | | (935,000 | ) | | | — | | | | — | | | | — | | | | — | |
Loan Participations | | | | | | | | | | | | | | | | | | | | |
ABS Other | | | (67,700 | ) | | | — | | | | — | | | | 437,015 | | | | 6,593 | |
Other Investments | | | | | | | | | | | | | | | | | | | | |
Aircraft ABS | | | — | | | | — | | | | — | | | | 896,883 | | | | (956,679 | ) |
Common Stocks | | | | | | | | | | | | | | | | | | | | |
Media | | | — | | | | — | | | | (23,855 | ) | | | — | | | | — | |
Oil, Gas & Consumable Fuels | | | (149,396 | ) | | | — | | | | (99,224 | ) | | | — | | | | — | |
Warrants | | | — | | | | — | | | | — | | | | — | | | | — | |
| | | | | | | | | | | | | | | | | | | | |
Total | | $ | (1,180,815 | ) | | $ | 27,040 | | | $ | (123,079 | ) | | $ | 1,334,593 | | | $ | (975,456 | ) |
| | | | | | | | | | | | | | | | | | | | |
| (a) | Includes a security fair valued at zero using Level 3 inputs that expired as worthless during period. |
A debt security valued at $27,040 was transferred from Level 2 to Level 3 during the period ended September 30, 2018. At September 30, 2017, this security was valued on the basis of evaluated bids furnished to the Fund by an independent pricing service in accordance with the Fund’s valuation policies. At September 30, 2018, this security was valued at fair value as determined in good faith by the Fund’s adviser as an independent pricing service did not provide a reliable price for the security.
Common stocks valued at $123,079 were transferred from Level 3 to Level 2 during the period ended September 30, 2018. At September 30, 2017, these securities were valued at fair value as determined in good faith by the Fund’s adviser using broker-dealer bid prices for which the inputs are unobservable to the Fund. At September 30, 2018, these
| 96
Notes to Financial Statements (continued)
September 30, 2018
securities were valued on the basis of closing bid quotations furnished to the Fund by an independent pricing service in accordance with the Fund’s valuation policies.
All transfers are recognized as of the beginning of the reporting period.
Intermediate Duration Bond Fund
Asset Valuation Inputs
| | | | | | | | | | | | | | | | | | | | |
Investments in Securities | | Balance as of
September 30,
2017 | | | Accrued
Discounts
(Premiums) | | | Realized
Gain
(Loss) | | | Change in
Unrealized
Appreciation
(Depreciation) | | | Purchases | |
Bonds and Notes | | | | | | | | | | | | | | | | | | | | |
ABS Home Equity | | $ | — | | | $ | — | | | $ | (15 | ) | | $ | (222 | ) | | $ | — | |
| | | | | | | | | | | | | | | | | | | | |
| | | | | |
Investments in Securities | | Sales | | | Transfers
into Level 3 | | | Transfers
out of
Level 3 | | | Balance as of
September 30,
2018 | | | Change in
Unrealized
Appreciation
(Depreciation)
from
Investments
Still Held at
September 30,
2018 | |
Bonds and Notes | | | | | | | | | | | | | | | | | | | | |
ABS Home Equity | | $ | (3,542 | ) | | $ | 18,609 | | | $ | — | | | $ | 14,830 | | | $ | (222 | ) |
| | | | | | | | | | | | | | | | | | | | |
A debt security valued at $18,609 was transferred from Level 2 to Level 3 during the period ended September 30, 2018. At September 30, 2017, this security was valued on the basis of evaluated bids furnished to the Fund by an independent pricing service in accordance with the Fund’s valuation policies. At September 30, 2018, this security was valued at fair value as determined in good faith by the Fund’s adviser as an independent pricing service did not provide a reliable price for the security.
All transfers are recognized as of the beginning of the reporting period.
97 |
Notes to Financial Statements (continued)
September 30, 2018
Limited Term Government and Agency Fund
Asset Valuation Inputs
| | | | | | | | | | | | | | | | | | | | |
Investments in Securities | | Balance as of
September 30,
2017 | | | Accrued
Discounts
(Premiums) | | | Realized
Gain
(Loss) | | | Change in
Unrealized
Appreciation
(Depreciation) | | | Purchases | |
Bonds and Notes | | | | | | | | | | | | | | | | | | | | |
Collateralized Mortgage Obligations | | $ | 274,554 | | | $ | — | | | $ | (148 | ) | | $ | 850 | | | $ | — | |
| | | | | | | | | | | | | | | | | | | | |
| | | | | |
Investments in Securities | | Sales | | | Transfers
into Level 3 | | | Transfers
out of
Level 3 | | | Balance as of
September 30,
2018 | | | Change in
Unrealized
Appreciation
(Depreciation)
from
Investments
Still Held at
September 30,
2018 | |
Bonds and Notes | | | | | | | | | | | | | | | | | | | | |
Collateralized Mortgage Obligations | | $ | (83,938 | ) | | $ | — | | | $ | — | | | $ | 191,318 | | | $ | (506 | ) |
| | | | | | | | | | | | | | | | | | | | |
4. Derivatives. Derivative instruments are defined as financial instruments whose value and performance are based on the value and performance of an underlying asset, reference rate or index. Derivative instruments that High Income Fund and Intermediate Duration Bond Fund used during the period include forward foreign currency contracts and futures contracts, respectively.
High Income Fund is subject to the risk that changes in foreign currency exchange rates will have an unfavorable effect on the value of Fund assets denominated in foreign currencies. The Fund may enter into forward foreign currency contracts for hedging purposes to protect the value of the Fund’s holdings of foreign securities. The Fund may also use forward foreign currency contracts to gain exposure to foreign currencies, regardless of whether securities denominated in such currencies are held in the Fund. During the year ended September 30, 2018, High Income Fund engaged in forward foreign currency transactions for hedging purposes.
Intermediate Duration Bond Fund is subject to the risk that changes in interest rates will affect the value of the Fund’s investments in fixed-income securities. A Fund will be subject to increased interest rate risk to the extent that it invests in fixed-income securities with longer maturities or durations, as compared to investing in fixed-income securities with shorter maturities or durations. The Fund may use futures contracts to
| 98
Notes to Financial Statements (continued)
September 30, 2018
hedge against changes in interest rates and to manage its duration in order to control interest rate risk without having to buy or sell portfolio securities. During the year ended September 30, 2018, Intermediate Duration Bond Fund used futures contracts for hedging purposes and to manage duration.
The following is a summary of derivative instruments for High Income Fund as of September 30, 2018, as reflected within the Statements of Assets and Liabilities:
| | | | |
Assets | | Unrealized
appreciation on
forward foreign
currency contracts | |
Over-the-counter asset derivatives Foreign exchange contracts | | $ | 142,661 | |
| |
Liabilities | | Unrealized
depreciation on
forward foreign
currency contracts | |
Over-the-counter liability derivatives Foreign exchange contracts | | $ | (57,977 | ) |
Transactions in derivative instruments for High Income Fund during the year ended September 30, 2018, as reflected within the Statements of Operations, were as follows:
| | | | |
Net Realized Gain (Loss) on: | | Forward foreign
currency contracts | |
Foreign exchange contracts | | $ | (165,859 | ) |
| |
Net Change in Unrealized
Appreciation (Depreciation) on: | | Forward foreign
currency contracts | |
Foreign exchange contracts | | $ | 84,684 | |
The following is a summary of derivative instruments for Intermediate Duration Bond Fund as of September 30, 2018, as reflected within the Statements of Assets and Liabilities:
| | | | |
Liabilities | | Unrealized
depreciation on
futures contracts | |
Exchange-traded liability derivatives Interest rate contracts | | $ | (124,712 | ) |
99 |
Notes to Financial Statements (continued)
September 30, 2018
Transactions in derivative instruments for Intermediate Duration Bond Fund during the year ended September 30, 2018, as reflected within the Statements of Operations, were as follows:
| | | | |
Net Realized Gain (Loss) on: | | Futures
contracts | |
Interest rate contracts | | $ | (359,501 | ) |
| |
Net Change in Unrealized
Appreciation (Depreciation) on: | | Futures
contracts | |
Interest rate contracts | | $ | (21,437 | ) |
As the Funds value their derivatives at fair value and recognize changes in fair value through the Statements of Operations, they do not qualify for hedge accounting under authoritative guidance for derivative instruments. The Funds’ investments in derivatives may represent an economic hedge; however, they are considered to be non-hedge transactions for the purpose of these disclosures.
The volume of forward foreign currency contract and futures contract activity, as a percentage of net assets, based on gross month-end notional amounts outstanding during the period, including long and short positions at absolute value, was as follows for the year ended September 30, 2018:
| | | | |
High Income Fund | | Forwards | |
Average Notional Amount Outstanding | | | 1.87 | % |
Highest Notional Amount Outstanding | | | 4.31 | % |
Lowest Notional Amount Outstanding | | | 0.95 | % |
Notional Amount Outstanding as of September 30, 2018 | | | 2.80 | % |
| |
Intermediate Duration Bond Fund | | Futures | |
Average Notional Amount Outstanding | | | 6.88 | % |
Highest Notional Amount Outstanding | | | 12.47 | % |
Lowest Notional Amount Outstanding | | | 4.93 | % |
Notional Amount Outstanding as of September 30, 2018 | | | 12.37 | % |
Notional amounts outstanding at the end of the prior period are included in the average notional amount outstanding.
Unrealized gain and/or loss on open forwards and futures is recorded in the Statements of Assets and Liabilities. The aggregate notional values of forward and futures contracts are not recorded in the Statements of Assets and Liabilities, and therefore are not included in the Funds’ net assets.
Over-the-counter derivatives, including forward foreign currency contracts, are entered into pursuant to International Swaps and Derivatives Association, Inc. (“ISDA”) agreements negotiated between the Funds and their counterparties. ISDA
| 100
Notes to Financial Statements (continued)
September 30, 2018
agreements typically contain, among other things, terms for the posting of collateral and master netting provisions in the event of a default or other termination event. Collateral is posted by a Fund or the counterparty to the extent of the net mark-to-market exposure to the other party of all open contracts under the agreement, subject to minimum transfer requirements. Master netting provisions allow the Funds and the counterparty, in the event of a default or other termination event, to offset amounts owed by each related to derivative contracts, including any posted collateral, to one net amount payable by either the Funds or the counterparty. The Funds’ ISDA agreements typically contain provisions that allow a counterparty to terminate open contracts early if the NAV of a Fund declines beyond a certain threshold. For financial reporting purposes, the Funds do not offset derivative assets and liabilities, and any related collateral received or pledged, on the Statements of Assets and Liabilities.
As of September 30, 2018, gross amounts of over-the-counter derivative assets and liabilities not offset in the Statements of Assets and Liabilities and the related net amounts after taking into account master netting arrangements, by counterparty, are as follows:
High Income Fund
| | | | | | | | | | | | | | | | | | | | |
Counterparty | | Gross Amounts
of Assets | | | Offset
Amount | | | Net Asset
Balance | | | Collateral
(Received)/
Pledged | | | Net
Amount | |
Bank of America, N.A. | | $ | 126,332 | | | $ | — | | | $ | 126,332 | | | $ | (126,332 | ) | | $ | — | |
Goldman Sachs & Co. | | | 12,728 | | | | (12,728 | ) | | | — | | | | — | | | | — | |
HSBC Bank USA | | | 3,601 | | | | — | | | | 3,601 | | | | — | | | | 3,601 | |
| | | | | | | | | | | | | | | | | | | | |
| | $ | 142,661 | | | $ | (12,728 | ) | | $ | 129,933 | | | $ | (126,332 | ) | | $ | 3,601 | |
| | | | | | | | | | | | | | | | | | | | |
| | | | | |
Counterparty | | Gross Amounts
of Liabilities | | | Offset
Amount | | | Net Liability
Balance | | | Collateral
(Received)/
Pledged | | | Net
Amount | |
Goldman Sachs & Co. | | $ | (57,977 | ) | | $ | 12,728 | | | $ | (45,249 | ) | | $ | — | | | $ | (45,249 | ) |
| | | | | | | | | | | | | | | | | | | | |
The actual collateral received or pledged, if any, may exceed the amounts shown in the table due to overcollateralization. Timing differences may exist between when contracts under the ISDA agreements are marked-to-market and when collateral moves. The ISDA agreements include tri-party control agreements under which collateral is held for the benefit of the secured party at a third party custodian, State Street Bank.
101 |
Notes to Financial Statements (continued)
September 30, 2018
Counterparty risk is managed based on policies and procedures established by each Fund’s adviser. Such policies and procedures may include, but are not limited to, minimum counterparty credit rating requirements, monitoring of counterparty credit default swap spreads and posting of collateral. A Fund’s risk of loss from counterparty credit risk on over-the-counter derivatives is generally limited to the Fund’s aggregated unrealized gains and the amount of any collateral pledged to the counterparty, which may be offset by any collateral posted to the Fund by the counterparty. ISDA master agreements can help to manage counterparty risk by specifying collateral posting arrangements at pre-arranged exposure levels. Under these ISDA agreements, collateral is routinely transferred if the total net exposure in respect of certain transactions, net of existing collateral already in place, exceeds a specified amount (typically $250,000, depending on the counterparty). With exchange-traded derivatives, there is minimal counterparty credit risk to the Fund because the exchange’s clearing house, as counterparty to these instruments, stands between the buyer and the seller of the contract. Credit risk still exists in exchange-traded derivatives with respect to initial and variation margin that is held in a broker’s customer accounts. While brokers are required to segregate customer margin from their own assets, in the event that a broker becomes insolvent or goes into bankruptcy and at that time there is a shortfall in the aggregate amount of margin held by the broker for all its clients, U.S. bankruptcy laws will typically allocate that shortfall on a pro rata basis across all of the broker’s customers, potentially resulting in losses to the Fund. Based on balances reflected on each Fund’s Statement of Assets and Liabilities, the following table shows (i) the maximum amount of loss due to credit risk that, based on the gross fair value of the financial instrument, the Fund would incur if parties (including OTC derivative counterparties and brokers holding margin for exchange-traded derivatives) to the relevant financial instruments failed completely to perform according to the terms of the contracts and the collateral or other security, if any, for the amount due proved to be of no value to the Fund, and (ii) the amount of loss that the Fund would incur after taking into account master netting provisions pursuant to ISDA agreements, as of September 30, 2018:
| | | | | | | | |
Fund | | Maximum Amount
of Loss - Gross | | | Maximum Amount
of Loss - Net | |
High Income Fund | | $ | 142,661 | | | $ | 3,601 | |
Intermediate Duration Bond Fund | | | 145,018 | | | | 145,018 | |
Net loss amount reflects cash received as collateral for High Income Fund of $270,000.
| 102
Notes to Financial Statements (continued)
September 30, 2018
5. Purchases and Sales of Securities. For the year ended September 30, 2018, purchases and sales of securities (excluding short-term investments and including paydowns) were as follows:
| | | | | | | | | | | | | | | | |
| | | U.S. Government/
Agency Securities | | | Other Securities | |
Fund | | Purchases | | | Sales | | | Purchases | | | Sales | |
High Income Fund | | $ | 15,060,563 | | | $ | 8,296,030 | | | $ | 76,837,448 | | | $ | 81,495,859 | |
Intermediate Duration Bond Fund | | | 91,116,861 | | | | 116,365,077 | | | | 176,274,235 | | | | 160,832,425 | |
Limited Term Government and Agency Fund | | | 986,892,701 | | | | 942,154,700 | | | | 53,253,728 | | | | 104,790,844 | |
6. Management Fees and Other Transactions with Affiliates.
a. Management Fees. Loomis, Sayles & Company, L.P. (“Loomis Sayles”) serves as investment adviser to each Fund. Under the terms of the management agreements, each Fund pays a management fee at the following annual rates, calculated daily and payable monthly, based on each Fund’s average daily net assets:
| | | | | | | | | | | | |
| | | Percentage of Average
Daily Net Assets | |
Fund | | First $500 million | | | Next $1.5 billion | | | Over
$2 billion | |
High Income Fund | | | 0.6000 | % | | | 0.6000 | % | | | 0.6000 | % |
Intermediate Duration Bond Fund | | | 0.2500 | % | | | 0.2500 | % | | | 0.2500 | % |
Limited Term Government and Agency Fund | | | 0.3750 | % | | | 0.3500 | % | | | 0.3000 | % |
Loomis Sayles has given binding undertakings to the Funds to waive management fees and/or reimburse certain expenses to limit the Funds’ operating expenses, exclusive of acquired fund fees and expenses, brokerage expenses, interest expense, taxes, organizational and extraordinary expenses such as litigation and indemnification expenses. These undertakings are in effect until January 31, 2019, may be terminated before then only with the consent of the Funds’ Board of Trustees, and are reevaluated on an annual basis. Management fees payable, as reflected on the Statements of Assets and Liabilities, is net of waivers and/or expense reimbursements, if any, pursuant to these undertakings. Waivers/reimbursements that exceed management fees payable are reflected on the Statements of Assets and Liabilities as receivable from investment adviser.
103 |
Notes to Financial Statements (continued)
September 30, 2018
For the year ended September 30, 2018 the expense limits as a percentage of average daily net assets under the expense limitation agreements were as follows:
| | | | | | | | | | | | | | | | |
| | | Expense Limit as a Percentage of
Average Daily Net Assets | |
Fund | | Class A | | | Class C | | | Class N | | | Class Y | |
High Income Fund | | | 1.05 | % | | | 1.80 | % | | | 0.75 | % | | | 0.80 | % |
Intermediate Duration Bond Fund | | | 0.65 | % | | | 1.40 | % | | | — | | | | 0.40 | % |
Limited Term Government and Agency Fund | | | 0.80 | % | | | 1.55 | % | | | 0.50 | % | | | 0.55 | % |
Loomis Sayles shall be permitted to recover expenses borne under the expense limitation agreements (whether through waiver of management fees or otherwise) on a class by class basis in later periods to the extent the annual operating expenses of a class fall below a class’ expense limits, provided, however, that a class is not obligated to pay such waived/reimbursed fees or expenses more than one year after the end of the fiscal year in which the fees or expenses were waived/reimbursed.
For the year ended September 30, 2018, the management fees and waivers of management fees for each Fund were as follows:
| | | | | | | | | | | | | | | | | | | | |
Fund | | Gross
Management
Fees | | | Contractual
Waivers of
Management
Fees1 | | | Net
Management
Fees | | | Percentage of
Average
Daily Net Assets | |
| | Gross | | | Net | |
High Income Fund | | $ | 1,042,957 | | | $ | 190,092 | | | $ | 852,865 | | | | 0.60 | % | | | 0.49 | % |
Intermediate Duration Bond Fund | | | 442,379 | | | | 94,365 | | | | 348,014 | | | | 0.25 | % | | | 0.20 | % |
Limited Term Government and Agency Fund | | | 2,613,773 | | | | — | | | | 2,613,773 | | | | 0.37 | % | | | 0.37 | % |
For the year ended September 30, 2018, class-specific expenses have been reimbursed as follows:
| | | | | | | | | | | | | | | | | | | | |
| | | Reimbursement1 | |
Fund | | Class A | | | Class C | | | Class N | | | Class Y | | | Total | |
Limited Term Government and Agency Fund | | $ | 6,432 | | | $ | 478 | | | $ | — | | | $ | 5,647 | | | $ | 12,557 | |
| 1 | Waiver/expense reimbursements are subject to possible recovery until September 30, 2019. |
No expenses were recovered for any of the Funds during the year ended September 30, 2018 under the terms of the expense limitation agreements.
Certain officers and employees of Loomis Sayles are also officers or Trustees of the Trust. Loomis Sayles’ general partner is indirectly owned by Natixis Investment Managers, L.P. (“Natixis”), which is part of Natixis Investment Managers, an international asset management group based in Paris, France.
| 104
Notes to Financial Statements (continued)
September 30, 2018
b. Service and Distribution Fees. Natixis Distribution, L.P. (“Natixis Distribution), which is a wholly-owned subsidiary of Natixis, has entered into a distribution agreement with the Trusts. Pursuant to this agreement, Natixis Distribution serves as principal underwriter of the Funds of the Trusts.
Pursuant to Rule 12b-1 under the 1940 Act, the Trusts have adopted a Service Plan relating to each Fund’s Class A shares (the “Class A Plans”) and a Distribution and Service Plan relating to each Fund’s Class B and Class C shares (the “Class C Plans”).
Under the Class A Plans, each Fund pays Natixis Distribution a monthly service fee at an annual rate not to exceed 0.25% of the average daily net assets attributable to the Fund’s Class A shares, as reimbursement for expenses incurred by Natixis Distribution in providing personal services to investors in Class A shares and/or the maintenance of shareholder accounts.
Under the Class C Plans, each Fund pays Natixis Distribution a monthly service fee at an annual rate not to exceed 0.25% of the average daily net assets attributable to the Fund’s Class C shares, as compensation for services provided by Natixis Distribution in providing personal services to investors in Class C shares and/or the maintenance of shareholder accounts.
Also under the Class C Plans, each Fund pays Natixis Distribution a monthly distribution fee at the annual rate of 0.75% of the average daily net assets attributable to the Fund’s Class C shares, as compensation for services provided by Natixis Distribution in connection with the marketing or sale of Class C shares.
For the year ended September 30, 2018, the service and distribution fees for each Fund were as follows:
| | | | | | | | | | | | |
| | | Service Fees | | | Distribution Fees | |
Fund | | Class A | | | Class C | | | Class C | |
High Income Fund | | $ | 73,200 | | | $ | 22,588 | | | $ | 67,762 | |
Intermediate Duration Bond Fund | | | 50,567 | | | | 5,356 | | | | 16,069 | |
Limited Term Government and Agency Fund | | | 803,275 | | | | 82,753 | | | | 248,259 | |
c. Administrative Fees. Natixis Advisors, L.P. (“Natixis Advisors”) provides certain administrative services for the Funds and contracts with State Street Bank to serve as sub-administrator. Natixis Advisors is a wholly-owned subsidiary of Natixis. Pursuant to an agreement among Natixis Funds Trusts, Loomis Sayles Funds Trusts, Natixis ETF Trust and Natixis Advisors, each Fund pays Natixis Advisors monthly its pro rata portion of fees equal to an annual rate of 0.0575% of the first $15 billion of the average daily net assets of the Natixis Funds Trusts, Loomis Sayles Funds Trusts and Natixis ETF Trust, 0.0500% of the next $15 billion, 0.0400% of the next $30 billion, 0.0275% of the next $30 billion and 0.0225% of such assets in excess of $90 billion, subject to an annual aggregate minimum fee for the Natixis Funds Trusts, Loomis Sayles Funds Trusts and Natixis ETF Trust of $10 million, which is reevaluated on an annual basis.
105 |
Notes to Financial Statements (continued)
September 30, 2018
Prior to July 1, 2018, each Fund paid Natixis Advisors monthly its pro rata portion of fees equal to an annual rate of 0.0575% of the first $15 billion of the average daily net assets of the Natixis Funds Trusts, Loomis Sayles Funds Trusts and Natixis ETF Trust, 0.0500% of the next $15 billion, 0.0400% of the next $30 billion, 0.0350% of the next $30 billion and 0.0325% of such assets in excess of $90 billion, subject to an annual aggregate minimum fee for the Natixis Funds Trusts, Loomis Sayles Funds Trusts and Natixis ETF Trust of $10 million, which was reevaluated on an annual basis.
For the year ended September 30, 2018, the administrative fees for each Fund were as follows:
| | | | |
Fund | | Administrative
Fees | |
High Income Fund | | $ | 76,503 | |
Intermediate Duration Bond Fund | | | 77,895 | |
Limited Term Government and Agency Fund | | | 312,980 | |
d. Sub-Transfer Agent Fees. Natixis Distribution has entered into agreements, which include servicing agreements, with financial intermediaries that provide recordkeeping, processing, shareholder communications and other services to customers of the intermediaries that hold positions in the Funds and has agreed to compensate the intermediaries for providing those services. Intermediaries transact with the Funds primarily through the use of omnibus accounts on behalf of their customers who hold positions in the Funds. These services would have been provided by the Funds’ transfer agent and other service providers if the shareholders’ accounts were maintained directly at the Funds’ transfer agent. Accordingly, the Funds have agreed to reimburse Natixis Distribution for all or a portion of the servicing fees paid to these intermediaries. The reimbursement amounts (sub-transfer agent fees) paid to Natixis Distribution are subject to a current per-account equivalent fee limit approved by the Funds’ Board of Trustees, which is based on fees for similar services paid to the Funds’ transfer agent and other service providers. Class N shares do not bear such expenses.
For the year ended September 30, 2018, the sub-transfer agent fees (which are reflected in transfer agent fees and expenses in the Statements of Operations) for each Fund were as follows:
| | | | |
Fund | | Sub-Transfer
Agent Fees | |
High Income Fund | | $ | 180,154 | |
Intermediate Duration Bond Fund | | | 90,313 | |
Limited Term Government and Agency Fund | | | 346,984 | |
| 106
Notes to Financial Statements (continued)
September 30, 2018
As of September 30, 2018, the Funds owe Natixis Distribution the following reimbursements for sub-transfer agent fees (which are reflected in the Statements of Assets and Liabilities as payable to distributor):
| | | | |
Fund | | Reimbursements
of Sub-Transfer
Agent Fees | |
Intermediate Duration Bond Fund | | $ | 1,142 | |
Limited Term Government and Agency Fund | | | 11,397 | |
As of September 30, 2018, Natixis Distribution owes the High Income Fund $3,341 for overpayments of sub-transfer agent fees (which are reflected in the Statements of Assets and Liabilities as receivable from distributor).
Sub-transfer agent fees attributable to Class A, Class C and Class Y are allocated on a pro rata basis to each class based on the relative net assets of each class to the total net assets of those classes.
e. Commissions. Commissions (including CDSCs) on Fund shares retained by Natixis Distribution during the year ended September 30, 2018 were as follows:
| | | | |
Fund | | Commissions | |
High Income Fund | | $ | 2,275 | |
Intermediate Duration Bond Fund | | | 88 | |
Limited Term Government and Agency Fund | | | 20,543 | |
f. Trustees Fees and Expenses. The Trusts do not pay any compensation directly to their officers or Trustees who are directors, officers or employees of Natixis Advisors, Natixis Distribution, Natixis or their affiliates. The Chairperson of the Board of Trustees receives a retainer fee at the annual rate of $340,000. The Chairperson does not receive any meeting attendance fees for Board of Trustees meetings or committee meetings that he attends. Each Independent Trustee (other than the Chairperson) receives, in the aggregate, a retainer fee at the annual rate of $170,000. Each Independent Trustee also receives a meeting attendance fee of $10,000 for each meeting of the Board of Trustees that he or she attends in person and $5,000 for each meeting of the Board of Trustees that he or she attends telephonically. In addition, the chairperson of the Contract Review Committee and the chairperson of the Audit Committee each receive an additional retainer fee at the annual rate of $20,000. The chairperson of the Governance Committee receives an additional retainer fee at the annual rate of $12,000. Each Contract Review Committee member is compensated $6,000 for each Committee meeting that he or she attends in person and $3,000 for each meeting that he or she attends telephonically. Each Audit Committee member is compensated $6,000 for each Committee meeting that he or she attends in person and $3,000 for each meeting that he or she attends telephonically. These fees are allocated among the funds in the Natixis Funds Trusts, Loomis Sayles Funds Trusts and Natixis ETF Trust based on a formula that
107 |
Notes to Financial Statements (continued)
September 30, 2018
takes into account, among other factors, the relative net assets of each fund. Trustees are reimbursed for travel expenses in connection with attendance at meetings.
Prior to January 1, 2018, the Chairperson of the Board received a retainer fee at the annual rate of $325,000 and each Independent Trustee (other than the Chairperson) received, in the aggregate, a retainer fee at the annual rate of $155,000, the chairperson of the Contract Review Committee and Audit Committee each received an additional retainer fee at the annual rate of $17,500 and the chairperson of the Governance Committee received an additional retainer fee at the annual rate of $10,000. All other Trustee fees remained unchanged.
A deferred compensation plan (the “Plan”) is available to the Trustees on a voluntary basis. Deferred amounts remain in the Funds until distributed in accordance with the provisions of the Plan. The value of a participating Trustee’s deferral account is based on theoretical investments of deferred amounts, on the normal payment dates, in certain funds of the Natixis Funds Trusts, Loomis Sayles Funds Trusts and Natixis ETF Trust as designated by the participating Trustees. Changes in the value of participants’ deferral accounts are allocated pro rata among the funds in the Natixis Funds Trusts, Loomis Sayles Funds Trusts and Natixis ETF Trust, and are normally reflected as Trustees’ fees and expenses in the Statements of Operations. The portions of the accrued obligations allocated to the Funds under the Plan are reflected as Deferred Trustees’ fees in the Statements of Assets and Liabilities.
g. Affiliated Ownership. As of September 30, 2018, the percentage of each Fund’s net assets owned by affiliates is as follows:
| | |
Intermediate Duration Bond Fund | | Percentage of
Net Assets |
Loomis Sayles Employees’ Profit Sharing Retirement Plan | | 1.16% |
Natixis Advisors | | less than 0.01% |
| |
Limited Term Government and Agency Fund | | Percentage of
Net Assets |
Loomis Sayles Employees’ Profit Sharing Retirement Plan | | 0.23% |
Natixis Sustainable Future 2015 Fund | | 0.08% |
Natixis Sustainable Future 2020 Fund | | 0.07% |
Natixis Sustainable Future 2025 Fund | | 0.05% |
Natixis Sustainable Future 2030 Fund | | 0.03% |
Natixis Sustainable Future 2035 Fund | | 0.02% |
Natixis Sustainable Future 2040 Fund | | 0.01% |
Natixis Sustainable Future 2045 Fund | | 0.01% |
Natixis Sustainable Future 2050 Fund | | less than 0.01% |
Natixis Sustainable Future 2055 Fund | | less than 0.01% |
Natixis Sustainable Future 2060 Fund | | less than 0.01% |
| 108
Notes to Financial Statements (continued)
September 30, 2018
Investment activities of affiliated shareholders could have material impacts on the Funds.
h. Reimbursement of Transfer Agent Fees and Expenses. Natixis Advisors has given a binding contractual undertaking to the High Income Fund and Limited Term Government and Agency Fund to reimburse any and all transfer agency expenses for the Funds’ Class N shares. This undertaking is in effect through January 31, 2019 and is not subject to recovery under the expense limitation agreement described above.
For the year ended September 30, 2018, Natixis Advisors reimbursed the Funds for transfer agency expenses as follows:
| | | | |
| | | Reimbursement of
Transfer Agency
Expenses | |
Fund | | Class N | |
High Income Fund | | $ | 195 | |
Limited Term Government and Agency Fund | | | 298 | |
i. Payment by Affiliates. For the year ended September 30, 2018, Loomis Sayles reimbursed Intermediate Duration Bond Fund $452, High Income Fund $4,468 and Limited Term Government and Agency Fund $9,370 in connection with trading errors.
7. Class-Specific Transfer Agent Fees and Expenses. Transfer agent fees and expenses attributable to Class A, Class C, and Class Y are allocated on a pro rata basis to each class based on the relative net assets of each class to the total net assets of those classes. Transfer agent fees and expenses attributable to Class N are allocated to Class N.
Intermediate Duration Bond Fund allocates transfer agent fees and expenses on a pro rata basis based on the relative net assets of each class to the total net assets of those classes.
For the year ended September 30, 2018, the Funds incurred the following class-specific transfer agent fees and expenses (including sub-transfer agent fees, where applicable):
| | | | | | | | | | | | | | | | |
| | | Transfer Agent Fees and Expenses | |
Fund | | Class A | | | Class C | | | Class N | | | Class Y | |
High Income Fund | | $ | 35,697 | | | $ | 10,941 | | | $ | 195 | | | $ | 158,208 | |
Limited Term Government and Agency Fund | | | 284,075 | | | | 29,226 | | | | 298 | | | | 313,177 | |
8. Line of Credit. Effective April 12, 2018, each Fund, together with certain other funds of Natixis Funds Trusts, Loomis Sayles Funds Trusts and Natixis ETF Trust, entered into a $400,000,000 committed unsecured line of credit provided by State Street Bank and Trust. Any one Fund may borrow up to $350,000,000 under the line of credit agreement (as long as all borrowings by all Funds in the aggregate do not exceed the $400,000,000
109 |
Notes to Financial Statements (continued)
September 30, 2018
limit at any time), subject to each Fund’s investment restrictions and its contractual obligations under the line of credit. Interest is charged to the Funds based upon the terms set forth in the agreement. In addition, a commitment fee of 0.15% per annum, payable at the end of each calendar quarter, is accrued and apportioned among the participating funds based on their average daily unused portion of the line of credit. The Funds paid an arrangement fee, an upfront fee, and other fees in connection with the new line of credit agreement, which are being amortized over a period of 364 days and are reflected as miscellaneous expenses on the Statements of Operations. The unamortized balance is reflected as prepaid expenses on the Statements of Assets and Liabilities.
Prior to April 12, 2018, each Fund, together with certain other funds of Natixis Funds Trusts and Loomis Sayles Funds Trusts, entered into a 364-day, $400,000,000 syndicated, committed, unsecured line of credit with Citibank, N.A. to be used for temporary or emergency purposes only. Any one Fund was able borrow up to the full $400,000,000 under the line of credit (as long as all borrowings by all Funds in the aggregate did not exceed the $400,000,000 limit at any time), subject to each Fund’s investment restrictions and its contractual obligations under the line of credit. Interest was charged to the Funds at a rate equal to the greater of the eurodollar or the federal funds rate plus 1.00%. In addition, a commitment fee of 0.15% per annum, payable on the last business day of each month, was accrued and apportioned among the participating funds based on their average daily unused portion of the line of credit.
For the year ended September 30, 2018, none of the Funds had borrowings under this agreement.
9. Concentration of Risk. Limited Term Government and Agency Fund’s investments in mortgage-related and asset-backed securities are subject to certain risks not associated with investments in other securities. Mortgage-related and asset-backed securities are subject to the risk that unexpected changes in interest rates will have a direct effect on expected maturity. A shortened maturity may result in the reinvestment of prepaid amounts in securities with lower yields than the original obligations. An extended maturity may result in a reduction of a security’s value.
Each Fund’s investments in foreign securities are subject to foreign currency fluctuations, higher volatility than U.S. securities, varying degrees of regulation and limited liquidity. Greater political, economic, credit and information risks are also associated with foreign securities.
10. Concentration of Ownership. From time to time, a Fund may have a concentration of one or more accounts constituting a significant percentage of shares outstanding. Investment activities by holders of such accounts could have material impacts on the Funds. As of September 30, 2018, based on management’s evaluation of the shareholder account base, the Funds had accounts representing controlling ownership
| 110
Notes to Financial Statements (continued)
September 30, 2018
of more than 5% of the Fund’s total outstanding shares. The number of such accounts, based on accounts that represent more than 5% of an individual class of shares, and the aggregate percentage of net assets represented by such holdings were as follows:
| | | | | | | | |
Fund | | Number of 5%
Account Holders | | | Percentage of
Ownership | |
High Income Fund | | | 1 | | | | 6.07 | % |
Intermediate Duration Bond Fund | | | 2 | | | | 15.75 | % |
Omnibus shareholder accounts for which Natixis Advisors understands that the intermediary has discretion over the underlying shareholder accounts or investment models where a shareholder account may be invested for a non-discretionary customer are included in the table above. For other omnibus accounts, the Funds do not have information on the individual shareholder accounts underlying the omnibus accounts; therefore, there could be other 5% shareholders in addition to those disclosed in the table above.
111 |
Notes to Financial Statements (continued)
September 30, 2018
11. Capital Shares. Each Fund may issue an unlimited number of shares of beneficial interest, without par value. Transactions in capital shares were as follows:
| | | | | | | | | | | | | | | | |
| |
| Year Ended
September 30, 2018 |
| |
| Year Ended
September 30, 2017(a) |
|
High Income Fund | | | Shares | | | | Amount | | | | Shares | | | | Amount | |
| Class A | |
Issued from the sale of shares | | | 1,898,245 | | | $ | 8,166,854 | | | | 2,869,491 | | | $ | 12,272,049 | |
Issued in connection with the reinvestment of distributions | | | 243,140 | | | | 1,040,786 | | | | 306,554 | | | | 1,311,455 | |
Redeemed | | | (3,771,177 | ) | | | (16,210,208 | ) | | | (3,623,241 | ) | | | (15,504,179 | ) |
| | | | | | | | | | | | | | | | |
Net change | | | (1,629,792 | ) | | $ | (7,002,568 | ) | | | (447,196 | ) | | $ | (1,920,675 | ) |
| | | | | | | | | | | | | | | | |
| Class C | |
Issued from the sale of shares | | | 122,450 | | | $ | 527,966 | | | | 471,847 | | | $ | 2,010,717 | |
Issued in connection with the reinvestment of distributions | | | 61,116 | | | | 262,711 | | | | 88,277 | | | | 378,228 | |
Redeemed | | | (1,279,539 | ) | | | (5,486,771 | ) | | | (897,288 | ) | | | (3,849,291 | ) |
| | | | | | | | | | | | | | | | |
Net change | | | (1,095,973 | ) | | $ | (4,696,094 | ) | | | (337,164 | ) | | $ | (1,460,346 | ) |
| | | | | | | | | | | | | | | | |
| Class N | |
Issued from the sale of shares | | | 2,698,050 | | | $ | 11,518,120 | | | | 240 | | | $ | 1,001 | |
Issued in connection with the reinvestment of distributions | | | 61,394 | | | | 259,688 | | | | 10 | | | | 41 | |
Redeemed | | | (325,438 | ) | | | (1,383,775 | ) | | | — | | | | — | |
| | | | | | | | | | | | | | | | |
Net change | | | 2,434,006 | | | $ | 10,394,033 | | | | 250 | | | $ | 1,042 | |
| | | | | | | | | | | | | | | | |
| Class Y | |
Issued from the sale of shares | | | 9,865,696 | | | $ | 42,237,402 | | | | 9,715,068 | | | $ | 41,499,158 | |
Issued in connection with the reinvestment of distributions | | | 1,120,509 | | | | 4,782,844 | | | | 1,184,729 | | | | 5,054,088 | |
Redeemed | | | (11,587,593 | ) | | | (49,564,049 | ) | | | (10,799,917 | ) | | | (45,851,330 | ) |
| | | | | | | | | | | | | | | | |
Net change | | | (601,388 | ) | | $ | (2,543,803 | ) | | | 99,880 | | | $ | 701,916 | |
| | | | | | | | | | | | | | | | |
Increase (decrease) from capital share transactions | | | (893,147 | ) | | $ | (3,848,432 | ) | | | (684,230 | ) | | $ | (2,678,063 | ) |
| | | | | | | | | | | | | | | | |
| (a) | From commencement of operations on November 30, 2016 through September 30, 2017 for Class N shares. |
| 112
Notes to Financial Statements (continued)
September 30, 2018
11. Capital Shares (continued).
| | | | | | | | | | | | | | | | |
| |
| Year Ended
September 30, 2018 |
| |
| Year Ended
September 30, 2017 |
|
Intermediate Duration Bond Fund | | | Shares | | | | Amount | | | | Shares | | | | Amount | |
| Class A | |
Issued from the sale of shares | | | 419,513 | | | $ | 4,226,997 | | | | 495,534 | | | $ | 5,098,171 | |
Issued in connection with the reinvestment of distributions | | | 44,777 | | | | 451,282 | | | | 51,612 | | | | 528,641 | |
Redeemed | | | (664,405 | ) | | | (6,691,192 | ) | | | (263,005 | ) | | | (2,708,601 | ) |
| | | | | | | | | | | | | | | | |
Net change | | | (200,115 | ) | | $ | (2,012,913 | ) | | | 284,141 | | | $ | 2,918,211 | |
| | | | | | | | | | | | | | | | |
| Class C | |
Issued from the sale of shares | | | 244 | | | $ | 3,933 | | | | 14,097 | | | $ | 144,076 | |
Issued in connection with the reinvestment of distributions | | | 3,007 | | | | 30,450 | | | | 5,796 | | | | 59,316 | |
Redeemed | | | (316,184 | ) | | | (3,174,018 | ) | | | — | | | | — | |
| | | | | | | | | | | | | | | | |
Net change | | | (312,933 | ) | | $ | (3,139,635 | ) | | | 19,893 | | | $ | 203,392 | |
| | | | | | | | | | | | | | | | |
| Class Y | |
Issued from the sale of shares | | | 3,847,881 | | | $ | 38,930,563 | | | | 6,045,802 | | | $ | 62,224,245 | |
Issued in connection with the reinvestment of distributions | | | 331,230 | | | | 3,335,145 | | | | 342,222 | | | | 3,505,355 | |
Redeemed | | | (4,349,784 | ) | | | (43,786,379 | ) | | | (4,606,062 | ) | | | (47,400,228 | ) |
| | | | | | | | | | | | | | | | |
Net change | | | (170,673 | ) | | $ | (1,520,671 | ) | | | 1,781,962 | | | $ | 18,329,372 | |
| | | | | | | | | | | | | | | | |
Increase (decrease) from capital share transactions | | | (683,721 | ) | | $ | (6,673,219 | ) | | | 2,085,996 | | | $ | 21,450,975 | |
| | | | | | | | | | | | | | | | |
113 |
Notes to Financial Statements (continued)
September 30, 2018
11. Capital Shares (continued).
| | | | | | | | | | | | | | | | |
| |
| Year Ended
September 30, 2018 |
| |
| Year Ended
September 30, 2017(a) |
|
Limited Term Government and Agency Fund | | | Shares | | | | Amount | | | | Shares | | | | Amount | |
| Class A | |
Issued from the sale of shares | | | 8,514,333 | | | $ | 95,199,331 | | | | 3,991,528 | | | $ | 45,399,327 | |
Issued in connection with the reinvestment of distributions | | | 415,392 | | | | 4,644,926 | | | | 454,875 | | | | 5,170,894 | |
Redeemed | | | (9,012,064 | ) | | | (100,870,225 | ) | | | (13,213,781 | ) | | | (150,164,121 | ) |
| | | | | | | | | | | | | | | | |
Net change | | | (82,339 | ) | | $ | (1,025,968 | ) | | | (8,767,378 | ) | | $ | (99,593,900 | ) |
| | | | | | | | | | | | | | | | |
| Class C | |
Issued from the sale of shares | | | 404,620 | | | $ | 4,537,413 | | | | 757,506 | | | $ | 8,626,416 | |
Issued in connection with the reinvestment of distributions | | | 25,353 | | | | 283,986 | | | | 29,711 | | | | 337,959 | |
Redeemed | | | (2,149,966 | ) | | | (24,060,145 | ) | | | (3,304,176 | ) | | | (37,593,668 | ) |
| | | | | | | | | | | | | | | | |
Net change | | | (1,719,993 | ) | | $ | (19,238,746 | ) | | | (2,516,959 | ) | | $ | (28,629,293 | ) |
| | | | | | | | | | | | | | | | |
| Class N | |
Issued from the sale of shares | | | 707,393 | | | $ | 7,898,516 | | | | 166,111 | | | $ | 1,892,253 | |
Issued in connection with the reinvestment of distributions | | | 4,698 | | | | 52,619 | | | | 1,700 | | | | 19,353 | |
Redeemed | | | (593,846 | ) | | | (6,627,527 | ) | | | (527 | ) | | | (5,984 | ) |
| | | | | | | | | | | | | | | | |
Net change | | | 118,245 | | | $ | 1,323,608 | | | | 167,284 | | | $ | 1,905,622 | |
| | | | | | | | | | | | | | | | |
| Class Y | |
Issued from the sale of shares | | | 15,567,203 | | | $ | 174,641,549 | | | | 13,725,909 | | | $ | 156,563,024 | |
Issued in connection with the reinvestment of distributions | | | 509,058 | | | | 5,709,282 | | | | 431,654 | | | | 4,921,367 | |
Redeemed | | | (14,832,325 | ) | | | (166,390,937 | ) | | | (18,111,061 | ) | | | (206,644,972 | ) |
| | | | | | | | | | | | | | | | |
Net change | | | 1,243,936 | | | $ | 13,959,894 | | | | (3,953,498 | ) | | $ | (45,160,581 | ) |
| | | | | | | | | | | | | | | | |
Increase (decrease) from capital share transactions | | | (440,151 | ) | | $ | (4,981,212 | ) | | | (15,070,551 | ) | | $ | (171,478,152 | ) |
| | | | | | | | | | | | | | | | |
| (a) | From commencement of operations on February 1, 2017 through September 30, 2017 for Class N shares. |
12. Subsequent Event. On October 5, 2018, the Board of Trustees approved a change to the fiscal year end of High Income Fund from September 30 to December 31.
| 114
Report of Independent Registered Public Accounting Firm
To the Board of Trustees of Loomis Sayles Funds I and Loomis Sayles Funds II and Shareholders of Loomis Sayles Intermediate Duration Bond Fund, Loomis Sayles High Income Fund and Loomis Sayles Limited Term Government and Agency Fund:
Opinions on the Financial Statements
We have audited the accompanying statements of assets and liabilities, including the portfolios of investments, of Loomis Sayles Intermediate Duration Bond Fund (one of the funds constituting Loomis Sayles Funds I), and Loomis Sayles High Income Fund and Loomis Sayles Limited Term Government and Agency Fund (two of the funds constituting Loomis Sayles Funds II) (hereafter collectively referred to as the “Funds”) as of September 30, 2018, the related statements of operations for the year ended September 30, 2018, the statements of changes in net assets for each of the two years in the period ended September 30, 2018, including the related notes, and the financial highlights for each of the periods indicated therein (collectively referred to as the “financial statements”). In our opinion, the financial statements present fairly, in all material respects, the financial position of each of the Funds as of September 30, 2018, the results of each of their operations for the year then ended, the changes in each of their net assets for each of the two years in the period ended September 30, 2018 and each of the financial highlights for each of the periods indicated therein in conformity with accounting principles generally accepted in the United States of America.
Basis for Opinions
These financial statements are the responsibility of the Funds’ management. Our responsibility is to express an opinion on the Funds’ financial statements based on our audits. We are a public accounting firm registered with the Public Company Accounting Oversight Board (United States) (“PCAOB”) and are required to be independent with respect to the Funds in accordance with the U.S. federal securities laws and the applicable rules and regulations of the Securities and Exchange Commission and the PCAOB.
We conducted our audits of these financial statements in accordance with the standards of the PCAOB. Those standards require that we plan and perform the audit to obtain reasonable assurance about whether the financial statements are free of material misstatement, whether due to error or fraud.
Our audits included performing procedures to assess the risks of material misstatement of the financial statements, whether due to error or fraud, and performing procedures that respond to those risks. Such procedures included examining, on a test basis, evidence regarding the amounts and disclosures in the financial statements. Our audits also included evaluating the accounting principles used and significant estimates made by management, as well as evaluating the overall presentation of the financial statements. Our procedures included confirmation of securities owned as of
115 |
Report of Independent Registered Public Accounting Firm
September 30, 2018 by correspondence with the custodian, and brokers; when replies were not received from brokers, we performed other auditing procedures. We believe that our audits provide a reasonable basis for our opinions.
PricewaterhouseCoopers LLP
Boston, Massachusetts
November 20, 2018
We have served as the auditor of one or more investment companies in the Natixis Investment Company Complex since at least 1995. We have not determined the specific year we began serving as auditor.
| 116
2018 U.S. Tax Distribution Information to Shareholders (Unaudited)
Corporate Dividends Received Deduction. For the fiscal year ended September 30, 2018, a percentage of dividends distributed by the Funds listed below qualify for the dividends received deduction for corporate shareholders. These percentages are as follows:
| | | | |
Fund | | Qualifying
Percentage | |
High Income | | | 1.67 | % |
Qualified Dividend Income. For the fiscal year ended September 30, 2018, the Funds below will designate up to the maximum amount allowable pursuant to the Internal Revenue Code as qualified dividend income eligible for reduced tax rates. These lower rates range from 0% to 20% depending on an individual’s tax bracket. If the Funds pay a distribution during calendar year 2018, complete information will be reported in conjunction with Form 1099-DIV.
117 |
Trustee and Officer Information
The tables below provide certain information regarding the trustees and officers of Loomis Sayles Funds I and Loomis Sayles Funds II (the “Trusts”). Unless otherwise indicated, the address of all persons below is 888 Boylston Street, Suite 800, Boston, MA 02199-8197. The Funds’ Statements of Additional Information include additional information about the trustees of the Trusts and are available by calling Natixis Funds at 800-225-5478.
| | | | | | | | |
Name and Year of Birth | | Position(s) Held
with the Trusts,
Length of Time
Served and Term of Office1 | | Principal
Occupation(s)
During Past 5 Years | | Number of
Portfolios in
Fund Complex
Overseen2 and Other
Directorships Held
During Past 5 Years | | Experience,
Qualifications,
Attributes, Skills
for Board Membership |
|
| INDEPENDENT TRUSTEES |
| | | | |
Kenneth A. Drucker (1945) | | Chairperson of the Board of Trustees since January 2017 Trustee since 2008 Ex Officio member of Audit Committee, Contract Review Committee and Governance Committee | | Retired | | 51 None | | Significant experience on the Board and on the boards of other business organizations (including at investment companies); executive experience (including as treasurer of an aerospace, automotive, and metal manufacturing corporation) |
| | | | |
Edmond J. English (1953) | | Trustee since 2013 Audit Committee Member and Governance Committee Member | | Executive Chairman; formerly, Chief Executive Officer of Bob’s Discount Furniture (retail) | | 51 Director, Burlington Stores, Inc. (retail) | | Significant experience on the Board and significant experience on the boards of other business organizations (including retail companies and a bank); executive experience (including at a retail company) |
| 118
Trustee and Officer Information
| | | | | | | | |
Name and Year of Birth | | Position(s) Held
with the Trusts,
Length of Time
Served and Term of Office1 | | Principal
Occupation(s)
During Past 5 Years | | Number of
Portfolios in
Fund Complex
Overseen2 and Other
Directorships Held
During Past 5 Years | | Experience,
Qualifications,
Attributes, Skills
for Board Membership |
| | | |
INDEPENDENT TRUSTEES continued | | | | | | |
| | | | |
Richard A. Goglia (1951) | | Trustee since 2015 Audit Committee Member | | Retired; formerly Vice President and Treasurer of Raytheon Company (defense) | | 51 None | | Experience on the Board and executive experience (including his role as vice president and treasurer of a defense company and experience at a financial services company) |
| | | | |
Wendell J. Knox (1948) | | Trustee since 2009 Contract Review Committee Member and Governance Committee Member | | Director of Abt Associates Inc. (research and consulting) | | 51 Director, Eastern Bank (bank); Director, The Hanover Insurance Group (property and casualty insurance) | | Significant experience on the Board and on the boards of other business organizations (including at a bank and at a property and casualty insurance firm); executive experience (including roles as president and chief executive officer of a research and consulting company) |
119 |
Trustee and Officer Information
| | | | | | | | |
Name and Year of Birth | | Position(s) Held
with the Trusts,
Length of Time
Served and Term of Office1 | | Principal
Occupation(s)
During Past 5 Years | | Number of
Portfolios in
Fund Complex
Overseen2 and Other
Directorships Held
During Past 5 Years | | Experience,
Qualifications,
Attributes, Skills
for Board Membership |
| | | |
INDEPENDENT TRUSTEES continued | | | | | | |
| | | | |
Martin T. Meehan (1956) | | Trustee since 2012 Audit Committee Member | | President, University of Massachusetts; formerly, Chancellor and faculty member, University of Massachusetts Lowell | | 51 None | | Significant experience on the Board and on the boards of other business organizations; experience as President of the University of Massachusetts; government experience (including as a member of the U.S. House of Representatives); academic experience |
| | | | |
Maureen B. Mitchell (1951) | | Trustee since 2017 Contract Review Committee Member | | Retired; formerly President, Global Sales and Marketing, GE Asset Management, Inc. (financial services) | | 51 Director, Sterling Bancorp (Bank) | | Experience on the Board and on the boards of other business organizations; financial services industry and executive experience (including role as president of global sales and marketing at a financial services company) |
| 120
Trustee and Officer Information
| | | | | | | | |
Name and Year of Birth | | Position(s) Held
with the Trusts,
Length of Time
Served and Term of Office1 | | Principal
Occupation(s)
During Past 5 Years | | Number of
Portfolios in
Fund Complex
Overseen2 and Other
Directorships Held
During Past 5 Years | | Experience,
Qualifications,
Attributes, Skills
for Board Membership |
| | | |
INDEPENDENT TRUSTEES continued | | | | | | |
| | | | |
James P. Palermo (1955) | | Trustee since 2016 Contract Review Committee Member | | Founding Partner, Breton Capital Management, LLC (private equity); Partner, STEP Partners, LLC (private equity); formerly, Chief Executive Officer of Global Client Management of The Bank of New York Mellon Corporation | | 51 Director, FutureFuel Corp. (Chemicals and Biofuels) | | Experience on the Board and on the boards of other business organizations; financial services industry and executive experience (including roles as chief executive officer of client management and asset servicing for a banking and financial services company) |
| | | | |
Erik R. Sirri (1958) | | Trustee since 2009 Chairperson of the Audit Committee | | Professor of Finance at Babson College | | 51 None | | Significant experience on the Board; experience as Director of the Division of Trading and Markets at the Securities and Exchange Commission; academic experience; training as an economist |
121 |
Trustee and Officer Information
| | | | | | | | |
Name and Year of Birth | | Position(s) Held
with the Trusts,
Length of Time
Served and Term of Office1 | | Principal
Occupation(s)
During Past 5 Years | | Number of
Portfolios in
Fund Complex
Overseen2 and Other
Directorships Held
During Past 5 Years | | Experience,
Qualifications,
Attributes, Skills
for Board Membership |
| | | |
INDEPENDENT TRUSTEES continued | | | | | | |
| | | | |
Peter J. Smail (1952) | | Trustee since 2009 Chairperson of the Contract Review Committee and Governance Committee Member | | Retired | | 51 None | | Significant experience on the Board; mutual fund industry and executive experience (including roles as president and chief executive officer for an investment adviser) |
| | | | |
Cynthia L. Walker (1956) | | Trustee since 2005 Chairperson of the Governance Committee and Audit Committee Member | | Deputy Dean for Finance and Administration, Yale University School of Medicine | | 51 None | | Significant experience on the Board; executive experience in a variety of academic organizations (including roles as dean for finance and administration) |
|
| INTERESTED TRUSTEES |
| | | | |
Kevin P. Charleston3
(1965) One Financial Center Boston, MA 02111 | | Trustee since 2015 President and Chief Executive Officer of Loomis Sayles Funds I since 2015 | | President, Chief Executive Officer and Chairman of the Board of Directors; formerly, Chief Financial Officer, Loomis, Sayles & Company, L.P. | | 51 None | | Experience on the Board; continuing service as President, Chief Executive Officer and Chairman of the Board of Directors of Loomis, Sayles & Company, L.P. |
| 122
Trustee and Officer Information
| | | | | | | | |
Name and Year of Birth | | Position(s) Held
with the Trusts,
Length of Time
Served and Term of Office1 | | Principal
Occupation(s)
During Past 5 Years | | Number of
Portfolios in
Fund Complex
Overseen2 and Other
Directorships Held
During Past 5 Years | | Experience,
Qualifications,
Attributes, Skills
for Board Membership |
| | | |
INTERESTED TRUSTEES continued | | | | | | |
| | | | |
David L. Giunta4 (1965) | | Trustee since 2011 President of Loomis Sayles Funds II and Executive Vice President of Loomis Sayles Funds I since 2008; Chief Executive Officer of Loomis Sayles Funds II since 2015 | | President and Chief Executive Officer, Natixis Advisors, L.P., Natixis Distribution, L.P., Natixis Distribution Corporation and Chairman of the Board of Natixis Distribution Corporation | | 51 None | | Significant experience on the Board; experience as President and Chief Executive Officer, Natixis Advisors, L.P., Natixis Distribution, L.P., Natixis Distribution Corporation and Chairman of the Board of Natixis Distribution Corporation |
| 1 | Each trustee serves until retirement, resignation or removal from the Board. The current retirement age is 75. The position of Chairperson of the Board is appointed for a three-year term. |
| 2 | The trustees of the Trusts serve as trustees of a fund complex that includes all series of the Natixis Funds Trust I, Natixis Funds Trust II, Natixis Funds Trust IV and Gateway Trust, Loomis Sayles Funds I and Loomis Sayles Funds II and Natixis ETF Trust (collectively, the “Fund Complex”). |
| 3 | Mr. Charleston is deemed an “interested person” of the Trusts because he holds the following positions with an affiliated person of the Trusts: President, Chief Executive Officer and Chairman of the Board of Directors of Loomis, Sayles & Company, L.P. |
| 4 | Mr. Giunta is deemed an “interested person” of the Trusts because he holds the following positions with an affiliated person of the Trusts: President and Chief Executive Officer, Natixis Advisors, L.P., Natixis Distribution, L.P., Natixis Distribution Corporation and Chairman of the Board of Natixis Distribution Corporation. |
123 |
Trustee and Officer Information
| | | | | | |
Name and Year of Birth | | Position(s) Held with the Trusts | | Term of Office1 and Length of Time Served | | Principal Occupation(s) During Past 5 Years2 |
|
| OFFICERS OF THE TRUSTS |
| | | |
Daniel J. Fuss
(1933) One Financial Center Boston, MA 02111 | | Executive Vice President of Loomis Sayles Funds I and Loomis Sayles Funds II | | Since 2003 | | Vice Chairman and Director, Loomis, Sayles & Company, L.P. |
| | | |
Russell L. Kane (1969) | | Secretary, Clerk and Chief Legal Officer | | Since 2016 | | Executive Vice President, General Counsel, Secretary and Clerk, Natixis Distribution Corporation, Natixis Advisors, L.P. and Natixis Distribution, L.P.; formerly, Chief Compliance Officer for Mutual Funds, Senior Vice President, Deputy General Counsel, Assistant Secretary and Assistant Clerk, Natixis Distribution Corporation, Natixis Advisors, L.P. and Natixis Distribution, L.P. |
| | | |
Michael C. Kardok
(1959) | | Treasurer, Principal Financial and Accounting Officer | | Since 2004 | | Senior Vice President, Natixis Advisors, L.P. and Natixis Distribution, L.P. |
| | | |
Rosa Licea-Mailloux
(1976) | | Chief Compliance Officer, Assistant Secretary and Anti-Money Laundering Officer | | Since 2016 | | Senior Vice President, Deputy General Counsel, Assistant Secretary and Assistant Clerk, Natixis Distribution Corporation, Natixis Advisors, L.P. and Natixis Distribution, L.P.; formerly, Associate General Counsel, Natixis Distribution, L.P. |
| 1 | Each officer of the Trusts serves for an indefinite term in accordance with the Trusts’ current by-laws until the date his or her successor is elected and qualified, or until he or she sooner dies, retires, is removed or becomes disqualified. |
| 2 | Each person listed above, except as noted, holds the same position(s) with the Fund Complex. Previous positions during the past five years with Natixis Distribution, L.P., Natixis Advisors, L.P. or Loomis, Sayles & Company, L.P. are omitted, if not materially different from an officer’s current position with such entity. |
| 124


Annual Report
September 30, 2018
Loomis Sayles Investment Grade Bond Fund
Loomis Sayles Strategic Income Fund
Table of Contents

LOOMIS SAYLES INVESTMENT GRADE BOND FUND
| | | | |
| Managers | | Symbols | | |
| Matthew J. Eagan, CFA® | | Class A | | LIGRX |
| Daniel J. Fuss, CFA®, CIC | | Class C | | LGBCX |
| Brian P. Kennedy | | Class N | | LGBNX |
| Elaine M. Stokes | | Class Y | | LSIIX |
| Loomis, Sayles & Company, L.P. | | Admin Class | | LIGAX |
Investment Goal
The Fund seeks high total investment return through a combination of current income and capital appreciation.
Market Conditions
Healthy economic indicators, including strong gross domestic product growth and low unemployment, characterized the 12 months ending September 30, 2018. Inflation was generally stable, trending close to the Federal Reserve’s (Fed’s) 2% target rate. Bolstered by these factors, the Fed met expectations and undertook a steady pace of rate increases. This contributed to US interest rates remaining well ahead of those of other developed economies, where monetary policies were more accommodative. Against this backdrop, ongoing US trade negotiations, particularly with China, and other geopolitical issues represented a developing risk.
US interest rates moved higher during the period, especially along the shorter end of the yield curve (a curve that shows the relationship among bond yields across the maturity spectrum). US Treasuries with maturities along the short end of the curve showed more modest losses than those with longer maturities, where declines were fairly steep.
Investment grade corporate bonds posted negative returns, though they outperformed Treasuries of similar duration (price sensitivity to interest rate changes). Spreads (the difference in yield between non-Treasury and Treasury securities of similar maturity) generally widened and the sector’s relatively longer duration weighed on returns as yields rose.
High yield corporate bonds posted positive returns, supported by investor demand for income and relatively shorter duration. Notably, gains in the CCC-rated tier of the market made it the top-performing quality tier by a significant margin.
Despite some upward movement in yields, several developed economy government bond markets remained at a disadvantage relative to the United States from an income-generating perspective. The US dollar posted strong performance relative to other developed and emerging market currencies, particularly in the latter half of the period. US dollar strength minimized returns for emerging market debt investors.
1 |
Performance Results
For the 12 months ended September 30, 2018, Class Y shares of the Loomis Sayles Investment Grade Bond Fund returned 0.43 %. The Fund outperformed its benchmark, the Bloomberg Barclays U.S. Government/Credit Bond Index, which returned -1.37%.
Explanation of Fund Performance
The Fund’s out-of-benchmark exposure to high yield corporate credit contributed positively to relative return, with basic industry, energy and finance holdings the strongest performers. A below-benchmark stance with respect to overall portfolio duration (and corresponding sensitivity to interest rate changes) had a positive impact on relative return in a rising rate environment. Finally, issuer selection within investment grade corporate credit added to performance, most notably within the banking, basic industry and communications segments.
On the downside, an allocation to non-US-dollar-denominated issues had a negative impact on relative performance. Holdings denominated in the New Zealand dollar and Canadian dollar were the worst performers within the sector.
Outlook
Our key investment themes are centered on our outlook for steady growth and inflation conditions. While ongoing trade negotiations raise uncertainty about global growth and pose a risk to our outlook, indicators in the United States, including manufacturing activity, business and consumer sentiment, spending, and employment, remain positive for the US economy. This leads us to expect modest improvement in US GDP growth over the next year and relatively stable inflation. Treasury yields have been increasing, and we expect this trend to continue at a modest pace. For this reason, we think it is important to maintain less interest rate sensitivity in the portfolio.
Lower inventories and strong demand have pushed oil prices higher over the past year and raised expectations for higher inflation. We expect inflation to increase at a steady pace that keeps the Fed on its gradual track toward normalizing monetary policy.
We have shifted to a more defensive profile within the portfolio and are holding higher reserves in the form of cash and short-maturity US Treasury debt to maintain flexibility. However, we have maintained our exposure to investment grade and high yield corporate bonds. We believe the environment for risk assets should remain favorable and there is further upside in the credit sectors given the outlook for continued profit growth, earnings growth and the low probability of defaults or economic recession. As we remain in an extended late expansion phase of the credit cycle,1 we continue to be highly selective with a keen focus on undervalued issues that have solid fundamentals.
We believe convertible bonds are still attractive in this late-cycle environment. We are very price sensitive in this sector, but believe it remains supported by strong corporate earnings and a positive US economic backdrop.
We believe the portfolio is well-positioned, with broad diversification, a lower risk profile and substantial liquidity built into its holdings. We are closely monitoring risk factors that
| 2
LOOMIS SAYLES INVESTMENT GRADE BOND FUND
may introduce market volatility and intend to use any dislocation as a buying opportunity in areas with supportive fundamentals.
Investment Changes
Effective November 1, 2018, the Fund’s principal investment strategies will be amended and the Fund’s fiscal year end will change from September 30 to December 31. The Fund will no longer invest in non-US-dollar-denominated bonds or equity securities, among other changes. These changes are intended to eliminate the volatility associated with currency and equity allocations and address the variability of the Fund’s monthly ordinary income distributions. Additionally, Dan Fuss will no longer serve as a co-portfolio manager of the Fund. Matt Eagan, Brian Kennedy, and Elaine Stokes will continue to manage the Fund, representing over 50 years of combined investment experience.
| 1 | A credit cycle is a cyclical pattern that follows credit availability and corporate health. |
Hypothetical Growth of $100,000 Investment in Class Y Shares4
September 30, 2008 through September 30, 2018

3 |
Average Annual Total Returns — September 30, 20184
| | | | | | | | | | | | | | | | | | | | | | | | |
| | | | | | | | | | | | | | | Expense Ratios5 | |
| | | 1 Year | | | 5 Years | | | 10 Years | | | Life of
Class N | | | Gross | | | Net | |
| | | | | | | |
| Class Y (Inception 12/31/96) | | | | | | | | | | | | | | | | | | | | | | | | |
| NAV | | | 0.43 | % | | | 2.85 | % | | | 6.27 | % | | | — | % | | | 0.57 | % | | | 0.53 | % |
| | | | | | | |
| Class A (Inception 12/31/96) | | | | | | | | | | | | | | | | | | | | | | | | |
| NAV | | | 0.19 | | | | 2.59 | | | | 6.00 | | | | — | | | | 0.82 | | | | 0.78 | |
| With 4.25% Maximum Sales Charge | | | -4.05 | | | | 1.71 | | | | 5.54 | | | | — | | | | | | | | | |
| | | | | | | |
| Class C (Inception 9/12/03) | | | | | | | | | | | | | | | | | | | | | | | | |
| NAV | | | -0.53 | | | | 1.83 | | | | 5.22 | | | | — | | | | 1.57 | | | | 1.53 | |
| With CDSC2 | | | -1.50 | | | | 1.83 | | | | 5.22 | | | | — | | | | | | | | | |
| | | | | | | |
| Class N (Inception 2/1/13) | | | | | | | | | | | | | | | | | | | | | | | | |
| NAV | | | 0.50 | | | | 2.96 | | | | — | | | | 2.44 | | | | 0.48 | | | | 0.48 | |
| | | | | | | |
| Admin Class (Inception 2/1/10)1 | | | | | | | | | | | | | | | | | | | | | | | | |
| NAV | | | -0.07 | | | | 2.35 | | | | 5.73 | | | | — | | | | 1.03 | | | | 1.03 | |
| | | | | | | |
| Comparative Performance | | | | | | | | | | | | | | | | | | | | | | | | |
| Bloomberg Barclays U.S. Government/Credit Bond Index3 | | | -1.37 | | | | 2.23 | | | | 3.95 | | | | 1.71 | | | | | | | | | |
Performance data shown represents past performance and is no guarantee of, and not necessarily indicative of, future results. Total return and value will vary, and you may have a gain or loss when shares are sold. Current performance may be lower or higher than quoted. For most recent month-end performance, visit im.natixis.com. Performance for other share classes will be greater or less than shown based on differences in fees and sales charges. You may not invest directly in an index. Performance for periods less than one year is cumulative, not annualized. Returns reflect changes in share price and reinvestment of dividends and capital gains, if any. The table(s) do not reflect taxes shareholders might owe on any fund distributions or when they redeem their shares.
| 1 | Prior to the inception of Admin Class shares (2/1/10), performance is that of Class A shares, restated to reflect the higher net expenses of Admin Class shares. |
| 2 | Performance for Class C shares assumes a 1% contingent deferred sales charge (“CDSC”) applied when you sell shares within one year of purchase. |
| 3 | The Bloomberg Barclays U.S. Government/Credit Bond Index is the non-securitized component of the U.S. Aggregate Index and was the first macro index launched by Barclays Capital. The U.S. Government/Credit Bond Index includes Treasuries (i.e., public obligations of the U.S. Treasury that have remaining maturities of more than one year), government-related issues (i.e., agency, sovereign, supranational, and local authority debt), and corporates. The U.S. Government/Credit Bond Index was launched on January 1, 1979, with index history backfilled to 1973, and is a subset of the U.S. Aggregate Index. |
| 4 | Fund performance has been increased by fee waivers and/or expense reimbursements, if any, without which performance would have been lower. |
| 5 | Expense ratios are as shown in the Fund’s prospectus in effect as of the date of this report. The expense ratios for the current reporting period can be found in the Financial Highlights section of this report under Ratios to Average Net Assets. Net expenses reflect contractual expense caps set to expire on 1/31/20. When a Fund’s expenses are below the cap, gross and net expense ratios will be the same. See Note 5 of the Notes to Financial Statements for more information about the Fund’s expense caps. |
| 4
LOOMIS SAYLES STRATEGIC INCOME FUND
| | | | |
| Managers | | Symbols | | |
| Matthew J. Eagan, CFA® | | Class A | | NEFZX |
| Daniel J. Fuss, CFA®, CIC | | Class C | | NECZX |
| Brian P. Kennedy | | Class N | | NEZNX |
| Elaine M. Stokes | | Class Y | | NEZYX |
| Loomis, Sayles & Company, L.P. | | Admin Class | | NEZAX |
Investment Goal
The Fund seeks high current income with a secondary objective of capital growth.
Market Conditions
Healthy economic indicators, including strong gross domestic product growth and low unemployment, characterized the 12 months ending September 30, 2018. Inflation was generally stable, trending close to the Federal Reserve’s (Fed’s) 2% target rate. Bolstered by these factors, the Fed met expectations and undertook a steady pace of rate increases. This contributed to US interest rates remaining well ahead of those of other developed economies, where monetary policies were more accommodative. Against this backdrop, ongoing US trade negotiations, particularly with China, and other geopolitical issues represented a developing risk.
US interest rates moved higher during the period, especially along the shorter end of the yield curve (a curve that shows the relationship among bond yields across the maturity spectrum). US Treasuries with maturities along the short end of the curve showed more modest losses than those with longer maturities, where declines were fairly steep.
Investment grade corporate bonds posted negative returns, though they outperformed Treasuries of similar duration (price sensitivity to interest rate changes). Spreads (the difference in yield between non-Treasury and Treasury securities of similar maturity) generally widened and the sector’s relatively longer duration weighed on returns as yields rose.
High yield corporate bonds posted positive returns, supported by investor demand for income and relatively shorter duration. Notably, gains in the CCC-rated tier of the market made it the top-performing quality tier by a significant margin.
Despite some upward movement in yields, several developed economy government bond markets remained at a disadvantage relative to the United States from an income-generating perspective. The US dollar posted strong performance relative to other developed and emerging market currencies, particularly in the latter half of the period. US dollar strength minimized returns for emerging market debt investors.
5 |
Performance Results
For the 12 months ended September 30, 2018, Class Y shares of the Loomis Sayles Strategic Income Fund returned 1.66%. The Fund outperformed its benchmark, the Bloomberg Barclays U.S. Aggregate Bond Index, which returned -1.22%.
Explanation of Fund Performance
The Fund’s allocation to high yield corporate credit contributed positively to performance relative to the benchmark, with consumer non-cyclical, electric and energy names bolstering return. A below-benchmark stance with respect to overall portfolio duration (and corresponding sensitivity to interest rate changes) also had a positive impact on relative return. Finally, exposure to convertible securities added to relative performance, with energy and insurance holdings the leading contributors.
On the downside, an allocation to non-US-dollar-denominated issues had a negative impact on relative performance. Holdings denominated in the New Zealand dollar and Brazilian real were the worst performers within the sector.
Outlook
Our key investment themes are centered on our outlook for steady growth and inflation conditions. While going trade negotiations raise uncertainty about global growth and pose a risk to our outlook, indicators in the United States, including manufacturing activity, business and consumer sentiment, spending, and employment, remain positive for the US economy. This leads us to expect modest improvement in US GDP growth over the next year and relatively stable inflation. Treasury yields have been increasing, and we expect this trend to continue at a modest pace. For this reason, we think it is important to maintain less interest rate sensitivity in the portfolio.
Lower inventories and strong demand have pushed oil prices higher over the past year and raised expectations for higher inflation. We expect inflation to increase at a steady pace that keeps the Fed on its gradual track toward normalizing monetary policy.
We have shifted to a more defensive profile within the portfolio and are holding higher reserves in the form of cash and short-maturity US Treasury debt to maintain flexibility. However, we have maintained our exposure to investment grade and high yield corporate bonds. We believe the environment for risk assets should remain favorable and there is further upside in the credit sectors given the outlook for continued profit growth, earnings growth and the low probability of defaults or economic recession. As we remain in an extended late expansion phase of the credit cycle,1 we continue to be highly selective with a keen focus on undervalued issues that have solid fundamentals.
Anticipated central bank action, election cycles, geopolitical risks and trade policy uncertainty have been shaping the risk profile of the global market. We remain highly selective about our non-US exposure and have generally maintained current allocations to selected developed market and emerging market sovereign and credit positions. We believe the US dollar is likely to be range bound or slightly stronger, which could keep the pressure on emerging market assets.
| 6
LOOMIS SAYLES STRATEGIC INCOME FUND
We believe convertible bonds are still attractive in this late-cycle environment. We are very price sensitive in this sector, but believe it remains supported by strong corporate earnings and a positive US economic backdrop.
We believe the portfolio is well-positioned, with broad diversification, a lower risk profile and substantial liquidity built into its holdings. We are closely monitoring risk factors that may introduce market volatility and intend to use any dislocation as a buying opportunity in areas with supportive fundamentals.
| 1 | A credit cycle is a cyclical pattern that follows credit availability and corporate health. |
Hypothetical Growth of $100,000 Investment in Class Y Shares5
September 30, 2008 through September 30, 2018
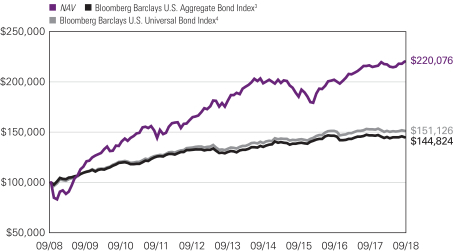
7 |
Average Annual Total Returns — September 30, 20185
| | | | | | | | | | | | | | | | | | | | | | | | |
| | | | | | | | | | | | | | | Expense Ratios6 | |
| | | 1 Year | | | 5 Years | | | 10 Years | | | Life of
Class N | | | Gross | | | Net | |
| | | | | | | |
| Class Y (Inception 12/1/99) | | | | | | | | | | | | | | | | | | | | | | | | |
| NAV | | | 1.66 | % | | | 3.99 | % | | | 8.21 | % | | | — | % | | | 0.71 | % | | | 0.71 | % |
| | | | | | | |
| Class A (Inception 5/1/95) | | | | | | | | | | | | | | | | | | | | | | | | |
| NAV | | | 1.34 | | | | 3.72 | | | | 7.93 | | | | — | | | | 0.96 | | | | 0.96 | |
| With 4.25% Maximum Sales Charge | | | -2.98 | | | | 2.82 | | | | 7.46 | | | | — | | | | | | | | | |
| | | | | | | |
| Class C (Inception 5/1/95) | | | | | | | | | | | | | | | | | | | | | | | | |
| NAV | | | 0.60 | | | | 2.94 | | | | 7.13 | | | | — | | | | 1.71 | | | | 1.71 | |
| With CDSC2 | | | -0.37 | | | | 2.94 | | | | 7.13 | | | | — | | | | | | | | | |
| | | | | | | |
| Class N (Inception 2/1/13) | | | | | | | | | | | | | | | | | | | | | | | | |
| NAV | | | 1.67 | | | | 4.07 | | | | — | | | | 4.31 | | | | 0.63 | | | | 0.63 | |
| | | | | | | |
| Admin Class (Inception 2/1/10)1 | | | | | | | | | | | | | | | | | | | | | | | | |
| NAV | | | 1.09 | | | | 3.47 | | | | 7.65 | | | | — | | | | 1.19 | | | | 1.19 | |
| | | | | | | |
| Comparative Performance | | | | | | | | | | | | | | | | | | | | | | | | |
| Bloomberg Barclays U.S. Aggregate Bond Index3 | | | -1.22 | | | | 2.16 | | | | 3.77 | | | | 1.71 | | | | | | | | | |
| Bloomberg Barclays U.S. Universal Bond Index4 | | | -1.00 | | | | 2.53 | | | | 4.22 | | | | 2.06 | | | | | | | | | |
Performance data shown represents past performance and is no guarantee of, and not necessarily indicative of, future results. Total return and value will vary, and you may have a gain or loss when shares are sold. Current performance may be lower or higher than quoted. For most recent month-end performance, visit im.natixis.com. Performance for other share classes will be greater or less than shown based on differences in fees and sales charges. You may not invest directly in an index. Performance for periods less than one year is cumulative, not annualized. Returns reflect changes in share price and reinvestment of dividends and capital gains, if any. The table(s) do not reflect taxes shareholders might owe on any fund distributions or when they redeem their shares.
| 1 | Prior to the inception of Admin Class shares (2/1/10), performance is that of Class A shares, restated to reflect the higher net expenses of Admin Class shares. |
| 2 | Class C share performance assumes a 1% CDSC applied when you sell shares within one year of purchase. |
| 3 | The Bloomberg Barclays U.S. Aggregate Bond Index is an unmanaged index that covers the U.S.-dollar-denominated, investment-grade, fixed-rate, taxable bond market of SEC-registered securities. The index includes bonds from the Treasury, government-related, corporate, mortgage-backed securities, asset-backed securities, and collateralized mortgage-backed securities sectors. |
| 4 | The Bloomberg Barclays U.S. Universal Bond Index represents the union of the U.S. Aggregate Index, the U.S. High-Yield Corporate Index, the 144A Index, the Eurodollar Index, the Emerging Markets Index, and the non-ERISA portion of the CMBS Index. Municipal debt, private placements, and non-dollar-denominated issues are excluded from the Universal Bond Index. The only constituent of the index that includes floating-rate debt is the Emerging Markets Index. |
| 5 | Fund performance has been increased by fee waivers and/or expense reimbursements, if any, without which performance would have been lower. |
| 6 | Expense ratios are as shown in the Fund’s prospectus in effect as of the date of this report. The expense ratios for the current reporting period can be found in the Financial Highlights section of this report under Ratios to Average Net Assets. Net expenses reflect contractual expense caps set to expire on 1/31/19. When a Fund’s expenses are below the cap, gross and net expense ratios will be the same. See Note 5 of the Notes to Financial Statements for more information about the Fund’s expense caps. |
| 8
ADDITIONAL INFORMATION
The views expressed in this report reflect those of the portfolio managers as of the dates indicated. The managers’ views are subject to change at any time without notice based on changes in market or other conditions. References to specific securities or industries should not be regarded as investment advice. Because the Funds are actively managed, there is no assurance that they will continue to invest in the securities or industries mentioned.
All investing involves risk, including the risk of loss. There is no assurance that any investment will meet its performance objectives or that losses will be avoided.
ADDITIONAL INDEX INFORMATION
This document may contain references to third party copyrights, indexes, and trademarks, each of which is the property of its respective owner. Such owner is not affiliated with Natixis Investment Managers or any of its related or affiliated companies (collectively “Natixis Affiliates”) and does not sponsor, endorse or participate in the provision of any Natixis Affiliates services, funds or other financial products.
The index information contained herein is derived from third parties and is provided on an “as is” basis. The user of this information assumes the entire risk of use of this information. Each of the third party entities involved in compiling, computing or creating index information disclaims all warranties (including, without limitation, any warranties of originality, accuracy, completeness, timeliness, non-infringement, merchantability and fitness for a particular purpose) with respect to such information.
PROXY VOTING INFORMATION
A description of the Natixis Funds’ proxy voting policies and procedures is available without charge, upon request, by calling Natixis Funds at 800-225-5478; on the Natixis Funds’ website at im.natixis.com; and on the Securities and Exchange Commission’s (“SEC’s”) website at www.sec.gov. Information regarding how the Natixis Funds voted proxies relating to portfolio securities during the most recent 12-month period ended June 30 is available from the Natixis Funds’ website and the SEC’s website.
QUARTERLY PORTFOLIO SCHEDULES
The Natixis Funds file complete schedules of portfolio holdings with the SEC for the first and third quarters of each fiscal year on Form N-Q. The Funds’ Forms N-Q are available on the SEC’s website at www.sec.gov and may be reviewed and copied at the SEC’s Public Reference Room in Washington, DC. Information on the operation of the Public Reference Room may be obtained by calling 800-SEC-0330.
9 |
UNDERSTANDING YOUR FUND’S EXPENSES
As a mutual fund shareholder, you incur different types of costs: transaction costs, including sales charges (loads) on purchases and contingent deferred sales charges on redemptions; and ongoing costs, including management fees, distribution fees (12b-1 fees) and/or service fees, and other fund expenses. Certain exemptions may apply. These costs are described in more detail in the Funds’ prospectuses. The following examples are intended to help you understand the ongoing costs of investing in the Funds and help you compare these with the ongoing costs of investing in other mutual funds.
The first line in the table for each class of Fund shares shows the actual account values and actual Fund expenses you would have paid on a $1,000 investment in the Fund from April 1, 2018 through September 30, 2018. To estimate the expenses you paid over the period, simply divide your account value by $1,000 (for example $8,600 account value divided by $1,000 = 8.6) and multiply the result by the number in the Expenses Paid During Period column as shown below for your class.
The second line in the table for each class of Fund shares provides information about hypothetical account values and hypothetical expenses based on the Fund’s actual expense ratios and an assumed rate of return of 5% per year before expenses, which is not the Fund’s actual return. The hypothetical account values and expenses may not be used to estimate the actual ending account balance or expenses you paid on your investment for the period. You may use this information to compare the ongoing costs of investing in the Fund to other funds. To do so, compare this 5% hypothetical example with the 5% hypothetical examples that appear in the shareholder reports of the other funds.
Please note that the expenses shown reflect ongoing costs only, and do not include any transaction costs, such as sales charges. Therefore, the second line in the table of each fund is useful in comparing ongoing costs only, and will not help you determine the relative costs of owning different funds. If transaction costs were included, total costs would be higher.
| 10
| | | | | | | | | | | | |
LOOMIS SAYLES INVESTMENT GRADE
BOND FUND | | BEGINNING
ACCOUNT VALUE
4/1/2018 | | | ENDING
ACCOUNT VALUE
9/30/2018 | | | EXPENSES PAID
DURING PERIOD*
4/1/2018 – 9/30/2018 | |
| Class A | | | | | | | | | | | | |
| Actual | | | $1,000.00 | | | | $1,000.10 | | | | $3.96 | |
| Hypothetical (5% return before expenses) | | | $1,000.00 | | | | $1,021.11 | | | | $4.00 | |
| Class C | | | | | | | | | | | | |
| Actual | | | $1,000.00 | | | | $996.60 | | | | $7.71 | |
| Hypothetical (5% return before expenses) | | | $1,000.00 | | | | $1,017.35 | | | | $7.79 | |
| Class N | | | | | | | | | | | | |
| Actual | | | $1,000.00 | | | | $1,001.50 | | | | $2.36 | |
| Hypothetical (5% return before expenses) | | | $1,000.00 | | | | $1,022.71 | | | | $2.38 | |
| Class Y | | | | | | | | | | | | |
| Actual | | | $1,000.00 | | | | $1,002.10 | | | | $2.71 | |
| Hypothetical (5% return before expenses) | | | $1,000.00 | | | | $1,022.36 | | | | $2.74 | |
| Admin Class | | | | | | | | | | | | |
| Actual | | | $1,000.00 | | | | $999.60 | | | | $5.16 | |
| Hypothetical (5% return before expenses) | | | $1,000.00 | | | | $1,019.90 | | | | $5.22 | |
| * | Expenses are equal to the Fund’s annualized expense ratio (after waiver/reimbursement): 0.79%, 1.54%, 0.47%, 0.54% and 1.03% for Class A, C, N, Y and Admin Class, respectively, multiplied by the average account value over the period, multiplied by the number of days in the most recent fiscal half-year (183), divided by 365 (to reflect the half-year period). |
11 |
| | | | | | | | | | | | |
LOOMIS SAYLES STRATEGIC INCOME
FUND | | BEGINNING
ACCOUNT VALUE
4/1/2018 | | | ENDING
ACCOUNT VALUE
9/30/2018 | | | EXPENSES PAID
DURING PERIOD*
4/1/2018 – 9/30/2018 | |
| Class A | | | | | | | | | | | | |
| Actual | | | $1,000.00 | | | | $1,010.30 | | | | $4.84 | |
| Hypothetical (5% return before expenses) | | | $1,000.00 | | | | $1,020.26 | | | | $4.86 | |
| Class C | | | | | | | | | | | | |
| Actual | | | $1,000.00 | | | | $1,006.80 | | | | $8.60 | |
| Hypothetical (5% return before expenses) | | | $1,000.00 | | | | $1,016.50 | | | | $8.64 | |
| Class N | | | | | | | | | | | | |
| Actual | | | $1,000.00 | | | | $1,012.70 | | | | $3.18 | |
| Hypothetical (5% return before expenses) | | | $1,000.00 | | | | $1,021.91 | | | | $3.19 | |
| Class Y | | | | | | | | | | | | |
| Actual | | | $1,000.00 | | | | $1,012.30 | | | | $3.58 | |
| Hypothetical (5% return before expenses) | | | $1,000.00 | | | | $1,021.51 | | | | $3.60 | |
| Admin Class | | | | | | | | | | | | |
| Actual | | | $1,000.00 | | | | $1,009.10 | | | | $6.09 | |
| Hypothetical (5% return before expenses) | | | $1,000.00 | | | | $1,019.00 | | | | $6.12 | |
| * | Expenses are equal to the Fund’s annualized expense ratio: 0.96%, 1.71%, 0.63%, 0.71% and 1.21% for Class A, C, N, Y and Admin Class, respectively, multiplied by the average account value over the period, multiplied by the number of days in the most recent fiscal half-year (183), divided by 365 (to reflect the half-year period). |
| 12
BOARD APPROVAL OF THE EXISTING ADVISORY AGREEMENTS
The Board of Trustees of the Trust (the “Board”), including the Independent Trustees, considers matters bearing on each Fund’s advisory agreement (collectively, the “Agreements”) at most of its meetings throughout the year. Each year, usually in the spring, the Contract Review Committee of the Board meets to review the Agreements to determine whether to recommend that the full Board approve the continuation of the Agreements, typically for an additional one-year period. After the Contract Review Committee has made its recommendation, the full Board, including the Independent Trustees, determines whether to approve the continuation of the Agreements.
In connection with these meetings, the Trustees receive materials that the Funds’ investment adviser (the “Adviser”) believes to be reasonably necessary for the Trustees to evaluate the Agreements. These materials generally include, among other items, (i) information on the investment performance of the Funds and the performance of peer groups of funds and the Funds’ performance benchmarks, (ii) information on the Funds’ advisory fees and other expenses, including information comparing the Funds’ advisory fees to the fees charged to institutional accounts with similar strategies managed by the Adviser, if any, and to those of peer groups of funds and information about any applicable expense caps and/or fee “breakpoints,” (iii) sales and redemption data in respect of the Funds, (iv) information about the profitability of the Agreements to the Adviser and (v) information obtained through the completion by the Adviser of a questionnaire distributed on behalf of the Trustees. The Board, including the Independent Trustees, also considers other matters such as (i) the Adviser’s financial results and financial condition, (ii) each Fund’s investment objective and strategies and the size, education and experience of the Adviser’s investment staff and its use of technology, external research and trading cost measurement tools, (iii) arrangements in respect of the distribution of the Funds’ shares and the related costs, (iv) the allocation of the Funds’ brokerage, if any, including, to the extent applicable, the use of “soft” commission dollars to pay for research and other similar services, (v) the resources devoted to, and the record of compliance with, the Funds’ investment policies and restrictions, policies on personal securities transactions and other compliance policies, (vi) the Adviser’s policies and procedures relating to, among other things, compliance, trading and best execution, proxy voting and valuation, (vii) information about amounts invested by the Funds’ portfolio managers in the Funds or in similar accounts that they manage and (viii) the general economic outlook with particular emphasis on the mutual fund industry. Throughout the process, the Trustees are afforded the opportunity to ask questions of and request additional materials from the Adviser.
In addition to the materials requested by the Trustees in connection with their annual consideration of the continuation of the Agreements, the Trustees receive materials in advance of each regular quarterly meeting of the Board that provide detailed information about the Funds’ investment performance and the fees charged to the Funds for advisory and other services. This information generally includes, among other things, an internal performance rating for each Fund based on agreed-upon criteria, graphs showing each Fund’s performance and expense differentials against each Fund’s peer group/category of
13 |
funds, performance ratings provided by a third-party, total return information for various periods, and third-party performance rankings for various periods comparing a Fund against similarly categorized funds. The portfolio management team for each Fund or other representatives of the Adviser make periodic presentations to the Contract Review Committee and/or the full Board, and Funds identified as presenting possible performance concerns may be subject to more frequent Board or Committee presentations and reviews. In addition, each quarter the Trustees are provided with detailed statistical information about each Fund’s portfolio. The Trustees also receive periodic updates between meetings.
The Board most recently approved the continuation of the Agreements for a one year period at its meeting held in June 2018. In considering whether to approve the continuation of the Agreements, the Board, including the Independent Trustees, did not identify any single factor as determinative. Individual Trustees may have evaluated the information presented differently from one another, giving different weights to various factors. Matters considered by the Trustees, including the Independent Trustees, in connection with their approval of the Agreements included, but were not limited to, the factors listed below.
The nature, extent and quality of the services provided to the Funds under the Agreements. The Trustees considered the nature, extent and quality of the services provided by the Adviser and its affiliates to the Funds and the resources dedicated to the Funds by the Adviser and its affiliates.
The Trustees considered not only the advisory services provided by the Adviser to the Funds, but also the monitoring and oversight services provided by Natixis Advisors, L.P. (“Natixis Advisors”). They also considered the administrative and shareholder services provided by Natixis Advisors and its affiliates to the Funds.
For each Fund, the Trustees also considered the benefits to shareholders of investing in a mutual fund that is part of a family of funds that offers shareholders the right to exchange shares of one type of fund for shares of another type of fund, and provides a variety of fund and shareholder services.
After reviewing these and related factors, the Trustees concluded, within the context of their overall conclusions regarding each of the Agreements, that the nature, extent and quality of services provided supported the renewal of the Agreements.
Investment performance of the Funds and the Adviser. As noted above, the Trustees received information about the performance of the Funds over various time periods, including information that compared the performance of the Funds to the performance of peer groups and categories of funds and the Funds’ respective performance benchmarks. In addition, the Trustees reviewed data prepared by an independent third party that analyzed the performance of the Funds using a variety of performance metrics, including metrics that measured the performance of the Funds on a risk adjusted basis.
| 14
The Board noted that, through December 31, 2017, each Fund’s one-, three- and five-year performance stated as percentile rankings within categories selected by the independent third-party data provider was as follows (where the best performance would be in the first percentile of its category):
| | | | | | | | | | | | |
| | | One-Year | | | Three-Year | | | Five-Year | |
Loomis Sayles Investment Grade Bond Fund | | | 3 | % | | | 59 | % | | | 24 | % |
Loomis Sayles Strategic Income Fund | | | 30 | % | | | 97 | % | | | 13 | % |
In the case of each Fund that had performance that lagged that of a relevant category median as determined by the independent third party for certain (although not necessarily all) periods, the Board concluded that other factors relevant to performance supported renewal of the Agreements. These factors included one or more of the following: (1) that the underperformance was attributable, to a significant extent, to investment decisions (such as security selection or sector allocation) by the Adviser that were reasonable and consistent with the Fund’s investment objective and policies; (2) that the Fund’s more recent performance, although lagging in certain periods, had shown improvement relative to its category; and (3) that the Fund’s performance, although lagging in certain periods, was stronger over the long term.
The Trustees also considered the Adviser’s performance and reputation generally, the performance of the fund family generally, and the historical responsiveness of the Adviser to Trustee concerns about performance and the willingness of the Adviser to take steps intended to improve performance.
After reviewing these and related factors, the Trustees concluded, within the context of their overall conclusions regarding each of the Agreements, that the performance of the Funds and the Adviser and/or other relevant factors supported the renewal of the Agreements.
The costs of the services to be provided and profits to be realized by the Adviser and its affiliates from their respective relationships with the Funds. The Trustees considered the fees charged to the Funds for advisory and administrative services as well as the total expense levels of the Funds. This information included comparisons (provided both by management and by an independent third party) of the Funds’ advisory fees and total expense levels to those of their peer groups and information about the advisory fees charged by the Adviser to comparable accounts (such as institutional separate accounts), as well as information about differences in such fees and the reasons for any such differences. In considering the fees charged to comparable accounts, the Trustees considered, among other things, management’s representations about the differences between managing mutual funds as compared to other types of accounts, including the additional resources required to effectively manage mutual fund assets and the greater regulatory costs associated with the management of such assets. In evaluating each Fund’s advisory fee, the Trustees also took into account the demands, complexity and quality of the investment management of such Fund, as well as the need for the Adviser to offer competitive compensation and the potential need to expend additional resources to the extent the Fund grows in size. The Trustees considered that over the past several years, management had made recommendations regarding reductions in advisory fee rates, implementation of advisory fee breakpoints and the institution of advisory fee waivers and expense caps for various
15 |
funds in the fund family. They noted that all of the Funds included have expense caps in place, and they considered the amounts reimbursed by the Adviser for the Loomis Sayles Investment Grade Bond Fund under its cap. The Trustees also considered that the current expenses for Loomis Sayles Strategic Income Fund were below its cap. The Trustees further noted that management had proposed to reduce the expense cap of the Loomis Sayles Investment Grade Bond Fund and that the Loomis Sayles Strategic Income Fund’s total advisory fee rate was below the median of a peer group of funds.
The Trustees noted that the Loomis Sayles Investment Grade Bond Fund had an advisory fee rate that was above the median of a peer group of funds. In this regard, the Trustees considered the factors that management believed justified such relatively higher advisory fee rate, including: (1) that the advisory fee rate was only 1 basis point above the peer group median; and (2) that management had proposed to further reduce the expense cap of the Fund, which had also been reduced last year.
The Trustees also considered the compensation directly or indirectly received by the Adviser and its affiliates from their relationships with the Funds. The Trustees reviewed information provided by management as to the profitability of the Adviser’s and its affiliates’ relationships with the Funds, and information about the allocation of expenses used to calculate profitability. They also reviewed information provided by management about the effect of distribution costs and changes in asset levels on Adviser profitability, including information regarding resources spent on distribution activities. When reviewing profitability, the Trustees also considered information about court cases in which adviser compensation or profitability were issues, the performance of the Funds, the expense levels of the Funds, whether the Adviser had implemented breakpoints and/or expense caps with respect to such Funds and the overall profit margin of Natixis Investment Managers compared to that of certain other investment managers for which such data was available.
After reviewing these and related factors, the Trustees concluded, within the context of their overall conclusions regarding each of the Agreements, that the advisory fee charged to each of the Funds was fair and reasonable, and that the costs of these services generally and the related profitability of the Adviser and its affiliates in respect of their relationships with the Funds supported the renewal of the Agreements.
Economies of Scale. The Trustees considered the existence of any economies of scale in the provision of services by the Adviser and whether those economies are shared with the Funds through breakpoints in their investment advisory fees or other means, such as expense caps. The Trustees also discussed with management the factors considered with respect to the implementation of breakpoints in investment advisory fees or expense caps for certain funds. Management explained that a number of factors are taken into account in considering the possible implementation of breakpoints or an expense cap for a fund, including, among other things, factors such as a fund’s assets, the projected growth of a fund, projected profitability and a fund’s fees and performance. With respect to economies of scale, the Trustees noted that each of the Funds had breakpoints in its advisory fee and that each of the Funds was subject to an expense cap. The Trustees considered management’s proposal to reduce the expense cap for Loomis Sayles Investment Grade Bond Fund, which had also been reduced last year. In considering these issues, the Trustees also took note of the costs of the services provided (both on an absolute and on a
| 16
relative basis) and the profitability to the Adviser and its affiliates of their relationships with the Funds, as discussed above.
After reviewing these and related factors, the Trustees concluded, within the context of their overall conclusions regarding each of the Agreements, that the extent to which economies of scale were shared with the Funds supported the renewal of the Agreements.
The Trustees also considered other factors, which included but were not limited to the following:
| · | | The effect of recent market and economic events on the performance, asset levels and expense ratios of each Fund. |
| · | | Whether each Fund has operated in accordance with its investment objective and the Fund’s record of compliance with its investment restrictions, and the compliance programs of the Funds and the Adviser. They also considered the compliance-related resources the Adviser and its affiliates were providing to the Funds. |
| · | | So-called “fallout benefits” to the Adviser, such as the engagement of affiliates of the Adviser to provide distribution and administrative services to the Funds, and the benefits of research made available to the Adviser by reason of brokerage commissions (if any) generated by the Funds’ securities transactions. The Trustees also considered the benefits to the parent company of Natixis Advisors from the retention of the Adviser. The Trustees considered the possible conflicts of interest associated with these fallout and other benefits, and the reporting, disclosure and other processes in place to disclose and monitor such possible conflicts of interest. |
| · | | The Trustees’ review and discussion of the Funds’ advisory arrangements in prior years, and management’s record of responding to Trustee concerns raised during the year and in prior years. |
Based on their evaluation of all factors that they deemed to be material, including those factors described above, and assisted by the advice of independent counsel, the Trustees, including the Independent Trustees, concluded that each of the existing Agreements, with the further reduction in the expense cap for the Loomis Sayles Investment Grade Bond Fund described above, should be continued through June 30, 2019.
17 |
Portfolio of Investments – as of September 30, 2018
Loomis Sayles Investment Grade Bond Fund
| | | | | | | | |
Principal
Amount (‡) | | | Description | | Value (†) | |
| | Bonds and Notes — 55.9% of Net Assets | |
| | Non-Convertible Bonds — 54.1% | |
| | | | ABS Other — 1.1% | |
| $ | 51,362,940 | | | FAN Engine Securitization Ltd., Series 2013-1A, Class 1A, 4.625%, 10/15/2043, 144A(a)(b)(c) | | $ | 50,772,266 | |
| | 10,483,054 | | | Trinity Rail Leasing LLC, Series 2010-1A, Class A, 5.194%, 10/16/2040, 144A | | | 10,880,219 | |
| | 1,712,484 | | | Trinity Rail Leasing LP, Series 2012-1A, Class A1, 2.266%, 1/15/2043, 144A | | | 1,662,722 | |
| | | | | | | | |
| | | | | | | 63,315,207 | |
| | | | | | | | |
| | | | Aerospace & Defense — 1.9% | |
| | 1,865,000 | | | Bombardier, Inc., 7.450%, 5/01/2034, 144A | | | 1,890,383 | |
| | 1,455,000 | | | Embraer Netherlands Finance BV, 5.400%, 2/01/2027 | | | 1,484,100 | |
| | 550,000 | | | Leonardo U.S. Holdings, Inc., 6.250%, 1/15/2040, 144A | | | 574,095 | |
| | 650,000 | | | Leonardo U.S. Holdings, Inc., 7.375%, 7/15/2039 | | | 754,000 | |
| | 78,795,000 | | | Textron, Inc., 5.950%, 9/21/2021 | | | 83,032,108 | |
| | 11,040,000 | | | Textron, Inc., EMTN, 6.625%, 4/07/2020, (GBP) | | | 15,380,173 | |
| | | | | | | | |
| | | | | | | 103,114,859 | |
| | | | | | | | |
| | | | Airlines — 1.6% | |
| | 3,412,100 | | | Air Canada Pass Through Trust, Series 2013-1, Class B, 5.375%, 11/15/2022, 144A | | | 3,484,607 | |
| | 1,959,407 | | | American Airlines Pass Through Certificates, Series 2016-3, Class B, 3.750%, 4/15/2027 | | | 1,891,572 | |
| | 735,000 | | | American Airlines Pass Through Certificates, Series 2017-2, Class B, 3.700%, 4/15/2027 | | | 709,053 | |
| | 42,049,022 | | | Continental Airlines Pass Through Certificates, Series 2007-1, Class A, 5.983%, 10/19/2023 | | | 44,276,779 | |
| | 1,511,770 | | | Continental Airlines Pass Through Certificates, Series 2012-1, Class B, 6.250%, 10/11/2021 | | | 1,548,747 | |
| | 213,322 | | | Continental Airlines Pass Through Trust, Series 1999-1, Class A, 6.545%, 8/02/2020 | | | 215,844 | |
| | 403,667 | | | Continental Airlines Pass Through Trust, Series 2001-1, Class A-1, 6.703%, 12/15/2022 | | | 424,872 | |
| | 1,119,507 | | | Delta Air Lines Pass Through Trust, Series 2007-1, Class A, 6.821%, 2/10/2024(a) | | | 1,226,868 | |
| | 5,973,407 | | | Delta Air Lines Pass Through Trust, Series 2007-1, Class B, 8.021%, 2/10/2024(a) | | | 6,562,386 | |
| | 10,784,998 | | | Delta Air Lines Pass Through Trust, Series 2009-1, Class A, 7.750%, 6/17/2021 | | | 11,247,566 | |
| | 14,605,319 | | | UAL Pass Through Trust, Series 2007-1, Class A, 6.636%, 1/02/2024 | | | 15,280,815 | |
| | 1,061,219 | | | Virgin Australia Pass Through Certificates, Series 2013-1A, 5.000%, 4/23/2025, 144A | | | 1,082,253 | |
| | | | | | | | |
| | | | | | | 87,951,362 | |
| | | | | | | | |
| | | | Automotive — 0.6% | |
| | 23,581,000 | | | Cummins, Inc., 5.650%, 3/01/2098 | | | 25,136,167 | |
| | 5,274,000 | | | Cummins, Inc., 6.750%, 2/15/2027 | | | 6,119,457 | |
| | 255,000 | | | Ford Motor Co., 6.625%, 2/15/2028 | | | 269,211 | |
| | 240,000 | | | Ford Motor Co., 7.500%, 8/01/2026 | | | 272,319 | |
See accompanying notes to financial statements.
| 18
Portfolio of Investments – as of September 30, 2018
Loomis Sayles Investment Grade Bond Fund – (continued)
| | | | | | | | |
Principal
Amount (‡) | | | Description | | Value (†) | |
| | | | Automotive — continued | |
| $ | 2,370,000 | | | Goodyear Tire & Rubber Co. (The), 7.000%, 3/15/2028 | | $ | 2,464,800 | |
| | | | | | | | |
| | | | | | | 34,261,954 | |
| | | | | | | | |
| | | | Banking — 8.1% | |
| | 1,468,000 | | | Ally Financial, Inc., 8.000%, 11/01/2031 | | | 1,778,115 | |
| | 84,339,000 | | | Bank of America Corp., 6.110%, 1/29/2037 | | | 96,994,042 | |
| | 49,304,000 | | | Bank of America Corp., (fixed rate to 12/20/2027, variable rate thereafter), 3.419%, 12/20/2028 | | | 46,276,241 | |
| | 100,000 | | | Bank of America Corp., MTN, 4.250%, 10/22/2026 | | | 98,854 | |
| | 25,627,000 | | | Bank of America Corp., Series L, MTN, 4.183%, 11/25/2027 | | | 25,012,769 | |
| | 25,090,000 | | | Bank of Nova Scotia (The), 2.130%, 6/15/2020, (CAD) | | | 19,234,987 | |
| | 17,000,000 | | | Citigroup, Inc., 3.500%, 5/15/2023 | | | 16,722,286 | |
| | 1,660,000 | | | Citigroup, Inc., 4.500%, 1/14/2022 | | | 1,706,942 | |
| | 22,960,000 | | | Citigroup, Inc., 5.130%, 11/12/2019, (NZD) | | | 15,606,208 | |
| | 22,154,000 | | | Deutsche Bank AG, (fixed rate to 12/01/2027, variable rate thereafter), 4.875%, 12/01/2032 | | | 19,684,937 | |
| | 6,645,000 | | | Goldman Sachs Group, Inc. (The), GMTN, 5.375%, 3/15/2020 | | | 6,849,605 | |
| | 70,245,000 | | | JPMorgan Chase & Co., 4.125%, 12/15/2026 | | | 69,727,490 | |
| | 36,745,000 | | | JPMorgan Chase & Co., 4.250%, 11/02/2018, (NZD) | | | 24,396,416 | |
| | 100,000 | | | Keybank NA, 6.950%, 2/01/2028 | | | 119,084 | |
| | 3,725,000 | | | Lloyds Banking Group PLC, 4.344%, 1/09/2048 | | | 3,238,136 | |
| | 1,375,000 | | | Lloyds Banking Group PLC, 5.300%, 12/01/2045 | | | 1,391,549 | |
| | 1,845,000 | | | Morgan Stanley, 4.350%, 9/08/2026 | | | 1,830,767 | |
| | 30,000,000 | | | Morgan Stanley, 4.750%, 11/16/2018, (AUD) | | | 21,750,164 | |
| | 5,900,000 | | | Morgan Stanley, 5.750%, 1/25/2021 | | | 6,201,587 | |
| | 20,695,000 | | | Morgan Stanley, MTN, 4.100%, 5/22/2023 | | | 20,823,114 | |
| | 38,206,000 | | | Morgan Stanley, Series F, GMTN, 5.625%, 9/23/2019 | | | 39,156,439 | |
| | 8,638,000 | | | National City Corp., 6.875%, 5/15/2019 | | | 8,860,485 | |
| | | | | | | | |
| | | | | | | 447,460,217 | |
| | | | | | | | |
| | | | Brokerage — 1.5% | |
| | 50,270,000 | | | Jefferies Group LLC, 5.125%, 1/20/2023 | | | 51,978,104 | |
| | 19,498,000 | | | Jefferies Group LLC, 6.250%, 1/15/2036 | | | 19,721,804 | |
| | 8,760,000 | | | Jefferies Group LLC, 6.450%, 6/08/2027 | | | 9,489,227 | |
| | | | | | | | |
| | | | | | | 81,189,135 | |
| | | | | | | | |
| | | | Building Materials — 0.6% | |
| | 1,610,000 | | | Masco Corp., 6.500%, 8/15/2032 | | | 1,764,582 | |
| | 3,110,000 | | | Masco Corp., 7.125%, 3/15/2020 | | | 3,266,416 | |
| | 2,667,000 | | | Masco Corp., 7.750%, 8/01/2029 | | | 3,163,516 | |
| | 23,975,000 | | | Owens Corning, 7.000%, 12/01/2036 | | | 27,315,443 | |
| | | | | | | | |
| | | | | | | 35,509,957 | |
| | | | | | | | |
| | | | Cable Satellite — 0.7% | |
| | 10,790,000 | | | DISH DBS Corp., 5.000%, 3/15/2023 | | | 9,791,925 | |
| | 17,832,000 | | | Shaw Communications, Inc., 5.650%, 10/01/2019, (CAD) | | | 14,198,367 | |
| | 13,630,000 | | | Time Warner Cable LLC, 4.125%, 2/15/2021 | | | 13,739,449 | |
| | 2,800,000 | | | Time Warner Cable LLC, 4.500%, 9/15/2042 | | | 2,389,499 | |
| | | | | | | | |
| | | | | | | 40,119,240 | |
| | | | | | | | |
See accompanying notes to financial statements.
19 |
Portfolio of Investments – as of September 30, 2018
Loomis Sayles Investment Grade Bond Fund – (continued)
| | | | | | | | |
Principal
Amount (‡) | | | Description | | Value (†) | |
| | | | Chemicals — 0.9% | |
| $ | 654,000 | | | Consolidated Energy Finance S.A., 6.500%, 5/15/2026, 144A | | $ | 660,540 | |
| | 50,500,000 | | | INVISTA Finance LLC, 4.250%, 10/15/2019, 144A | | | 50,436,875 | |
| | | | | | | | |
| | | | | | | 51,097,415 | |
| | | | | | | | |
| | | | Construction Machinery — 0.1% | |
| | 6,787,000 | | | Toro Co. (The), 6.625%, 5/01/2037(b)(c) | | | 7,719,993 | |
| | | | | | | | |
| | | | Consumer Products — 0.2% | |
| | 7,458,000 | | | Hasbro, Inc., 6.600%, 7/15/2028 | | | 8,451,253 | |
| | | | | | | | |
| | | | Diversified Manufacturing — 0.1% | |
| | 5,305,000 | | | General Electric Co., Series A, MTN, 3-month LIBOR + 0.300%, 2.639%, 5/13/2024(d) | | | 5,072,588 | |
| | | | | | | | |
| | | | Electric — 1.6% | |
| | 23,301,726 | | | Alta Wind Holdings LLC, 7.000%, 6/30/2035, 144A | | | 24,899,967 | |
| | 30,430,000 | | | EDP Finance BV, 4.125%, 1/15/2020, 144A | | | 30,584,584 | |
| | 4,491,000 | | | Empresa Nacional de Electricidad S.A., 7.875%, 2/01/2027 | | | 5,427,220 | |
| | 13,025,000 | | | Enel Finance International NV, 6.000%, 10/07/2039, 144A | | | 14,166,093 | |
| | 9,007,000 | | | Enel Finance International NV, 6.800%, 9/15/2037, 144A | | | 10,406,934 | |
| | 3,523,869 | | | Mackinaw Power LLC, 6.296%, 10/31/2023, 144A | | | 3,622,335 | |
| | | | | | | | |
| | | | | | | 89,107,133 | |
| | | | | | | | |
| | | | Finance Companies — 4.3% | |
| | 6,700,000 | | | Antares Holdings LP, 6.000%, 8/15/2023, 144A | | | 6,726,371 | |
| | 18,830,000 | | | International Lease Finance Corp., 4.625%, 4/15/2021 | | | 19,211,472 | |
| | 62,425(††) | | | Navient Corp., 6.000%, 12/15/2043 | | | 1,388,072 | |
| | 3,885,000 | | | Navient Corp., 6.750%, 6/15/2026 | | | 3,836,437 | |
| | 6,730,000 | | | Navient Corp., MTN, 6.125%, 3/25/2024 | | | 6,730,000 | |
| | 90,196,000 | | | Navient LLC, 5.500%, 1/25/2023 | | | 89,970,510 | |
| | 3,280,000 | | | Navient LLC, MTN, 7.250%, 1/25/2022 | | | 3,460,400 | |
| | 22,116,000 | | | Navient LLC, Series A, MTN, 5.625%, 8/01/2033 | | | 18,522,150 | |
| | 7,805,000 | | | Quicken Loans, Inc., 5.250%, 1/15/2028, 144A | | | 7,248,894 | |
| | 6,820,000 | | | Quicken Loans, Inc., 5.750%, 5/01/2025, 144A | | | 6,811,475 | |
| | 16,717,000 | | | Springleaf Finance Corp., 5.250%, 12/15/2019 | | | 16,946,859 | |
| | 4,920,000 | | | Springleaf Finance Corp., 6.875%, 3/15/2025 | | | 4,907,700 | |
| | 31,883,000 | | | Springleaf Finance Corp., 7.750%, 10/01/2021 | | | 34,393,149 | |
| | 16,599,000 | | | Springleaf Finance Corp., 8.250%, 10/01/2023 | | | 18,300,397 | |
| | | | | | | | |
| | | | | | | 238,453,886 | |
| | | | | | | | |
| | | | Gaming — 0.1% | |
| | 3,260,000 | | | International Game Technology PLC, 6.250%, 1/15/2027, 144A | | | 3,300,424 | |
| | | | | | | | |
| | | | Government Owned – No Guarantee — 0.8% | |
| | 3,720,000 | | | Abu Dhabi National Energy Co. PJSC, 6.500%, 10/27/2036, 144A | | | 4,451,054 | |
| | 12,575,000 | | | Pertamina Persero PT, 6.450%, 5/30/2044, 144A | | | 13,657,582 | |
| | 17,435,000 | | | Petrobras Global Finance BV, 4.375%, 5/20/2023 | | | 16,559,763 | |
| | 11,555,000 | | | Petrobras Global Finance BV, 5.625%, 5/20/2043 | | | 9,359,550 | |
| | 1,000,000 | | | Telekom Malaysia Berhad, 7.875%, 8/01/2025, 144A | | | 1,205,747 | |
| | | | | | | | |
| | | | | | | 45,233,696 | |
| | | | | | | | |
See accompanying notes to financial statements.
| 20
Portfolio of Investments – as of September 30, 2018
Loomis Sayles Investment Grade Bond Fund – (continued)
| | | | | | | | |
Principal
Amount (‡) | | | Description | | Value (†) | |
| | | | Health Insurance — 0.0% | |
| $ | 1,261,000 | | | Cigna Corp., 7.875%, 5/15/2027 | | $ | 1,552,418 | |
| | | | | | | | |
| | | | Healthcare — 0.8% | |
| | 7,692,000 | | | Boston Scientific Corp., 6.000%, 1/15/2020 | | | 7,960,473 | |
| | 9,385,000 | | | HCA, Inc., 4.500%, 2/15/2027 | | | 9,185,569 | |
| | 6,175,000 | | | HCA, Inc., 5.375%, 9/01/2026 | | | 6,236,750 | |
| | 4,806,000 | | | HCA, Inc., 7.050%, 12/01/2027 | | | 5,154,435 | |
| | 1,592,000 | | | HCA, Inc., 7.500%, 11/06/2033 | | | 1,725,537 | |
| | 1,295,000 | | | HCA, Inc., 7.690%, 6/15/2025 | | | 1,447,162 | |
| | 2,480,000 | | | HCA, Inc., MTN, 7.580%, 9/15/2025 | | | 2,759,000 | |
| | 3,068,000 | | | HCA, Inc., MTN, 7.750%, 7/15/2036 | | | 3,344,120 | |
| | 1,735,000 | | | Tenet Healthcare Corp., 6.750%, 6/15/2023 | | | 1,728,494 | |
| | 4,785,000 | | | Tenet Healthcare Corp., 6.875%, 11/15/2031 | | | 4,283,532 | |
| | | | | | | | |
| | | | | | | 43,825,072 | |
| | | | | | | | |
| | | | Home Construction — 0.2% | |
| | 3,990,000 | | | PulteGroup, Inc., 6.000%, 2/15/2035 | | | 3,760,575 | |
| | 3,567,000 | | | PulteGroup, Inc., 6.375%, 5/15/2033 | | | 3,424,712 | |
| | 1,615,000 | | | TRI Pointe Group, Inc./TRI Pointe Homes, Inc., 5.875%, 6/15/2024 | | | 1,602,888 | |
| | | | | | | | |
| | | | | | | 8,788,175 | |
| | | | | | | | |
| | | | Independent Energy — 1.3% | |
| | 29,185,000 | | | California Resources Corp., 8.000%, 12/15/2022, 144A | | | 27,871,675 | |
| | 7,335,000 | | | Continental Resources, Inc., 3.800%, 6/01/2024 | | | 7,193,155 | |
| | 9,787,000 | | | EQT Corp., 8.125%, 6/01/2019 | | | 10,104,910 | |
| | 29,027,000 | | | Noble Energy, Inc., 3.900%, 11/15/2024 | | | 28,505,950 | |
| | 400,000 | | | QEP Resources, Inc., 5.250%, 5/01/2023 | | | 389,500 | |
| | 235,000 | | | Vine Oil & Gas LP/Vine Oil & Gas Finance Corp., 8.750%, 4/15/2023, 144A | | | 229,713 | |
| | 60,000 | | | Whiting Petroleum Corp., 6.250%, 4/01/2023 | | | 62,109 | |
| | | | | | | | |
| | | | | | | 74,357,012 | |
| | | | | | | | |
| | | | Integrated Energy — 0.2% | |
| | 7,700,000 | | | Reliance Holdings USA, Inc., 5.400%, 2/14/2022, 144A | | | 7,966,695 | |
| | | | | | | | |
| | | | Life Insurance — 2.0% | |
| | 1,475,000 | | | American International Group, Inc., 4.875%, 6/01/2022 | | | 1,537,020 | |
| | 600,000 | | | AXA S.A., EMTN, (fixed rate to 10/16/2019, variable rate thereafter), 6.772%, (GBP)(e) | | | 813,453 | |
| | 5,900,000 | | | AXA S.A., EMTN, (fixed rate to 4/16/2020, variable rate thereafter), 5.250%, 4/16/2040, (EUR) | | | 7,322,416 | |
| | 15,000,000 | | | Global Atlantic Fin Co., 8.625%, 4/15/2021, 144A | | | 16,588,199 | |
| | 9,063,000 | | | Mutual of Omaha Insurance Co., 6.800%, 6/15/2036, 144A | | | 11,287,736 | |
| | 26,914,000 | | | National Life Insurance Co., 10.500%, 9/15/2039, 144A(b)(c) | | | 42,965,771 | |
| | 6,440,000 | | | NLV Financial Corp., 7.500%, 8/15/2033, 144A(b)(c) | | | 7,819,262 | |
| | 2,872,000 | | | Penn Mutual Life Insurance Co. (The), 6.650%, 6/15/2034, 144A | | | 3,338,887 | |
| | 14,489,000 | | | Penn Mutual Life Insurance Co. (The), 7.625%, 6/15/2040, 144A | | | 19,081,022 | |
| | | | | | | | |
| | | | | | | 110,753,766 | |
| | | | | | | | |
| | | | Local Authorities — 0.5% | |
| | 37,829,000 | | | New South Wales Treasury Corp., 3.500%, 3/20/2019, (AUD) | | | 27,541,162 | |
See accompanying notes to financial statements.
21 |
Portfolio of Investments – as of September 30, 2018
Loomis Sayles Investment Grade Bond Fund – (continued)
| | | | | | | | |
Principal
Amount (‡) | | | Description | | Value (†) | |
| | | | Local Authorities — continued | |
| | 489,000 | | | Province of Nova Scotia, 6.600%, 6/01/2027, (CAD) | | $ | 480,716 | |
| | | | | | | | |
| | | | | | | 28,021,878 | |
| | | | | | | | |
| | | | Lodging — 1.0% | |
| | 52,516,000 | | | Choice Hotels International, Inc., 5.700%, 8/28/2020 | | | 54,616,640 | |
| | | | | | | | |
| | | | Media Entertainment — 0.4% | |
| | 4,482,000 | | | 21st Century Fox America, Inc., 8.150%, 10/17/2036 | | | 6,537,251 | |
| | 358,000,000 | | | Grupo Televisa SAB, EMTN, 7.250%, 5/14/2043, (MXN) | | | 13,549,058 | |
| | 1,365,000 | | | iHeartCommunications, Inc., 9.000%, 12/15/2019(f) | | | 1,027,163 | |
| | 3,635,000 | | | iHeartCommunications, Inc., 9.000%, 3/01/2021(f) | | | 2,708,075 | |
| | | | | | | | |
| | | | | | | 23,821,547 | |
| | | | | | | | |
| | | | Metals & Mining — 1.6% | |
| | 1,689,997 | | | 1839688 Alberta ULC, PIK, 14.000%, 2/13/2020(a)(c)(f)(g)(h) | | | 845 | |
| | 430,000 | | | ArcelorMittal, 5.500%, 3/01/2021 | | | 446,213 | |
| | 47,920,000 | | | ArcelorMittal, 6.750%, 3/01/2041 | | | 54,682,800 | |
| | 19,365,000 | | | ArcelorMittal, 7.000%, 10/15/2039 | | | 22,508,955 | |
| | 4,612,000 | | | United States Steel Corp., 6.650%, 6/01/2037 | | | 4,121,975 | |
| | 3,655,000 | | | Vale Overseas Ltd., 6.875%, 11/21/2036 | | | 4,244,186 | |
| | 4,893,000 | | | Worthington Industries, Inc., 6.500%, 4/15/2020 | | | 5,084,420 | |
| | | | | | | | |
| | | | | | | 91,089,394 | |
| | | | | | | | |
| | | | Midstream — 1.6% | |
| | 650,000 | | | DCP Midstream Operating LP, 6.450%, 11/03/2036, 144A | | | 680,875 | |
| | 525,000 | | | Energy Transfer Partners LP/Regency Energy Finance Corp., 4.500%, 11/01/2023 | | | 532,131 | |
| | 3,328,000 | | | Florida Gas Transmission Co. LLC, 7.900%, 5/15/2019, 144A | | | 3,427,071 | |
| | 14,300,000 | | | IFM U.S. Colonial Pipeline 2 LLC, 6.450%, 5/01/2021, 144A | | | 15,064,763 | |
| | 14,660,000 | | | Kinder Morgan Energy Partners LP, 3.500%, 9/01/2023 | | | 14,334,212 | |
| | 3,105,000 | | | Kinder Morgan Energy Partners LP, 5.300%, 9/15/2020 | | | 3,214,762 | |
| | 7,461,000 | | | Kinder Morgan Energy Partners LP, 5.800%, 3/01/2021 | | | 7,841,803 | |
| | 85,000 | | | NGPL PipeCo LLC, 7.768%, 12/15/2037, 144A | | | 104,125 | |
| | 31,311,000 | | | ONEOK Partners LP, 4.900%, 3/15/2025 | | | 32,499,418 | |
| | 1,404,000 | | | Panhandle Eastern Pipe Line Co. LP, 8.125%, 6/01/2019 | | | 1,448,294 | |
| | 225,000 | | | Plains All American Pipeline LP / PAA Finance Corp., 2.850%, 1/31/2023 | | | 213,789 | |
| | 8,405,000 | | | Williams Cos., Inc., 3.350%, 8/15/2022 | | | 8,253,570 | |
| | | | | | | | |
| | | | | | | 87,614,813 | |
| | | | | | | | |
| | | | Mortgage Related — 0.0% | |
| | 15,833 | | | FHLMC, 5.000%, 12/01/2031 | | | 16,696 | |
| | 2,052 | | | FNMA, 6.000%, 7/01/2029 | | | 2,257 | |
| | | | | | | | |
| | | | | | | 18,953 | |
| | | | | | | | |
| | | | Non-Agency Commercial Mortgage-Backed Securities — 1.0% | |
| | 11,095,000 | | | Commercial Mortgage Pass Through Certificates, Series 2014-LC15, Class A2, 2.840%, 4/10/2047 | | | 11,092,259 | |
| | 4,274,460 | | | Commercial Mortgage Pass Through Certificates, Series 2014-UBS2, Class A2, 2.820%, 3/10/2047 | | | 4,273,070 | |
See accompanying notes to financial statements.
| 22
Portfolio of Investments – as of September 30, 2018
Loomis Sayles Investment Grade Bond Fund – (continued)
| | | | | | | | |
Principal
Amount (‡) | | | Description | | Value (†) | |
| | | | Non-Agency Commercial Mortgage-Backed Securities — continued | |
| $ | 6,737,114 | | | Commercial Mortgage Pass Through Certificates, Series 2014-UBS4, Class A2, 2.963%, 8/10/2047 | | $ | 6,739,033 | |
| | 1,875,481 | | | Institutional Mortgage Securities Canada, Inc., Series 2014-5A, Class A1, 2.003%, 7/12/2047, 144A, (CAD) | | | 1,449,812 | |
| | 27,000,000 | | | Institutional Mortgage Securities Canada, Inc., Series 2014-5A, Class A2, 2.616%, 7/12/2047, 144A, (CAD) | | | 20,704,703 | |
| | 4,495,000 | | | JP Morgan Chase Commercial Mortgage Securities Trust, Series 2014-C20, Class A2, 2.872%, 7/15/2047 | | | 4,492,253 | |
| | 1,943,111 | | | Morgan Stanley Bank of America Merrill Lynch Trust, Series 2014-C14, Class A2, 2.916%, 2/15/2047 | | | 1,942,285 | |
| | 2,125,000 | | | WFRBS Commercial Mortgage Trust, Series 2011-C3, Class D, 5.865%, 3/15/2044, 144A(i) | | | 1,913,730 | |
| | | | | | | | |
| | | | | | | 52,607,145 | |
| | | | | | | | |
| | | | Oil Field Services — 0.1% | |
| | 5,000,000 | | | Nabors Industries, Inc., 5.100%, 9/15/2023 | | | 4,768,750 | |
| | | | | | | | |
| | | | Paper — 1.4% | |
| | 363,000 | | | Georgia-Pacific LLC, 7.750%, 11/15/2029 | | | 477,175 | |
| | 7,049,000 | | | International Paper Co., 8.700%, 6/15/2038 | | | 9,751,485 | |
| | 5,270,000 | | | WestRock MWV LLC, 7.550%, 3/01/2047(b)(c) | | | 6,758,379 | |
| | 4,273,000 | | | WestRock MWV LLC, 8.200%, 1/15/2030 | | | 5,548,949 | |
| | 26,007,000 | | | Weyerhaeuser Co., 6.875%, 12/15/2033 | | | 31,715,830 | |
| | 7,374,000 | | | Weyerhaeuser Co., 7.375%, 10/01/2019 | | | 7,681,677 | |
| | 13,539,000 | | | Weyerhaeuser Co., 7.375%, 3/15/2032 | | | 17,123,700 | |
| | | | | | | | |
| | | | | | | 79,057,195 | |
| | | | | | | | |
| | | | Property & Casualty Insurance — 0.2% | |
| | 2,740,000 | | | Fidelity National Financial, Inc., 5.500%, 9/01/2022 | | | 2,910,173 | |
| | 1,889,000 | | | MBIA Insurance Corp., 3-month LIBOR + 11.260%, 13.599%, 1/15/2033, 144A(d)(j) | | | 1,159,374 | |
| | 5,725,000 | | | Nationstar Mortgage Holdings, Inc., 9.125%, 7/15/2026, 144A | | | 5,996,937 | |
| | 2,212,000 | | | XLIT Ltd., 6.250%, 5/15/2027 | | | 2,508,639 | |
| | | | | | | | |
| | | | | | | 12,575,123 | |
| | | | | | | | |
| | | | Railroads — 0.2% | |
| | 9,787,000 | | | Canadian Pacific Railway Co., 7.250%, 5/15/2019 | | | 10,054,625 | |
| | | | | | | | |
| | | | REITs – Health Care — 0.1% | |
| | 5,972,000 | | | Welltower, Inc., 6.500%, 3/15/2041 | | | 7,112,130 | |
| | | | | | | | |
| | | | REITs – Single Tenant — 0.2% | |
| | 8,690,000 | | | Realty Income Corp., 5.750%, 1/15/2021 | | | 9,085,914 | |
| | | | | | | | |
| | | | Retailers — 0.5% | |
| | 1,255,000 | | | Group 1 Automotive, Inc., 5.000%, 6/01/2022 | | | 1,248,725 | |
| | 5,979,000 | | | J.C. Penney Corp., Inc., 6.375%, 10/15/2036 | | | 2,391,600 | |
| | 5,446,000 | | | J.C. Penney Corp., Inc., 7.625%, 3/01/2097 | | | 2,069,480 | |
| | 10,467,000 | | | Macy’s Retail Holdings, Inc., 6.790%, 7/15/2027 | | | 11,245,440 | |
| | 8,064,000 | | | Marks & Spencer PLC, 7.125%, 12/01/2037, 144A | | | 8,639,781 | |
See accompanying notes to financial statements.
23 |
Portfolio of Investments – as of September 30, 2018
Loomis Sayles Investment Grade Bond Fund – (continued)
| | | | | | | | |
Principal
Amount (‡) | | | Description | | Value (†) | |
| | | | Retailers — continued | |
| $ | 3,755,000 | | | PVH Corp., 7.750%, 11/15/2023 | | $ | 4,280,700 | |
| | | | | | | | |
| | | | | | | 29,875,726 | |
| | | | | | | | |
| | | | Supermarkets — 0.3% | |
| | 4,510,000 | | | Albertson’s Cos. LLC/Safeway, Inc./New Albertson’s, Inc./Albertson’s LLC, 6.625%, 6/15/2024 | | | 4,335,237 | |
| | 1,120,000 | | | Koninklijke Ahold Delhaize NV, 5.700%, 10/01/2040 | | | 1,217,921 | |
| | 6,765,000 | | | New Albertsons LP, 7.450%, 8/01/2029 | | | 5,581,125 | |
| | 7,640,000 | | | New Albertsons LP, 8.000%, 5/01/2031 | | | 6,494,000 | |
| | 1,054,000 | | | New Albertsons LP, Series C, MTN, 6.625%, 6/01/2028 | | | 798,405 | |
| | | | | | | | |
| | | | | | | 18,426,688 | |
| | | | | | | | |
| | | | Supranational — 0.1% | |
| | 9,640,000 | | | European Investment Bank, MTN, 6.000%, 8/06/2020, (AUD) | | | 7,430,054 | |
| | | | | | | | |
| | | | Technology — 0.4% | |
| | 16,735,000 | | | KLA-Tencor Corp., 5.650%, 11/01/2034 | | | 17,739,512 | |
| | 1,410,000 | | | Samsung Electronics Co. Ltd., 7.700%, 10/01/2027, 144A | | | 1,596,712 | |
| | | | | | | | |
| | | | | | | 19,336,224 | |
| | | | | | | | |
| | | | Treasuries — 11.9% | |
| | 132,000,000 | | | Canadian Government International Bond, 0.750%, 9/01/2020, (CAD) | | | 99,412,101 | |
| | 61,795,000 | | | Canadian Government International Bond, 1.750%, 9/01/2019, (CAD) | | | 47,720,389 | |
| | 391,985,000 | | | Iceland Government International Bond, 7.250%, 10/26/2022, (ISK) | | | 3,218,835 | |
| | 1,195,394,000 | | | Iceland Government International Bond, 8.750%, 2/26/2019, (ISK) | | | 9,408,399 | |
| | 2,755,000(†††) | | | Mexican Fixed Rate Bonds, Series M, 7.750%, 5/29/2031, (MXN) | | | 14,404,348 | |
| | 2,965,000(†††) | | | Mexican Fixed Rate Bonds, Series M-20, 7.500%, 6/03/2027, (MXN) | | | 15,416,606 | |
| | 7,555,000(†††) | | | Mexican Fixed Rate Bonds, Series M-20, 8.000%, 12/07/2023, (MXN) | | | 40,764,057 | |
| | 1,925,000(†††) | | | Mexican Fixed Rate Bonds, Series M-20, 8.500%, 5/31/2029, (MXN) | | | 10,672,054 | |
| | 23,970,000(†††) | | | Mexican Fixed Rate Bonds, Series M-20, 10.000%, 12/05/2024, (MXN) | | | 141,960,192 | |
| | 36,850,000 | | | New Zealand Government Bond, 5.000%, 3/15/2019, (NZD) | | | 24,791,753 | |
| | 290,574,000 | | | Norway Government Bond, 3.750%, 5/25/2021, 144A, (NOK) | | | 38,005,348 | |
| | 416,760,000 | | | Norway Government Bond, 4.500%, 5/22/2019, 144A, (NOK) | | | 52,405,736 | |
| | 43,590,000 | | | Republic of Brazil, 8.500%, 1/05/2024, (BRL) | | | 10,496,657 | |
| | 23,848,000 | | | Republic of Brazil, 10.250%, 1/10/2028, (BRL) | | | 6,192,963 | |
| | 150,000,000 | | | U.S. Treasury Note, 1.250%, 6/30/2019 | | | 148,570,313 | |
| | | | | | | | |
| | | | | | | 663,439,751 | |
| | | | | | | | |
| | | | Wireless — 0.7% | |
| | 559,910,000 | | | America Movil SAB de CV, 6.450%, 12/05/2022, (MXN) | | | 27,424,340 | |
| | 58,200,000 | | | America Movil SAB de CV, 8.460%, 12/18/2036, (MXN) | | | 2,721,368 | |
| | 6,373,000 | | | Sprint Capital Corp., 6.875%, 11/15/2028 | | | 6,404,865 | |
| | 612,000 | | | Sprint Capital Corp., 8.750%, 3/15/2032 | | | 688,500 | |
| | 1,609,000 | | | Sprint Communications, Inc., 6.000%, 11/15/2022 | | | 1,641,180 | |
| | 985,000 | | | Sprint Corp., 7.125%, 6/15/2024 | | | 1,021,938 | |
| | | | | | | | |
| | | | | | | 39,902,191 | |
| | | | | | | | |
| | | | Wirelines — 3.2% | |
| | 61,415,000 | | | AT&T, Inc., 4.300%, 2/15/2030, 144A | | | 59,062,632 | |
| | 406,000 | | | Bell Canada, Inc., MTN, 7.300%, 2/23/2032, (CAD) | | | 412,221 | |
See accompanying notes to financial statements.
| 24
Portfolio of Investments – as of September 30, 2018
Loomis Sayles Investment Grade Bond Fund – (continued)
| | | | | | | | |
Principal
Amount (‡) | | | Description | | Value (†) | |
| | | | Wirelines — continued | |
| $ | 2,936,000 | | | BellSouth Telecommunications LLC, 5.850%, 11/15/2045 | | $ | 2,940,932 | |
| | 4,990,000 | | | CenturyLink, Inc., Series G, 6.875%, 1/15/2028 | | | 4,790,899 | |
| | 2,738,000 | | | CenturyLink, Inc., Series P, 7.600%, 9/15/2039 | | | 2,443,665 | |
| | 2,710,000 | | | CenturyLink, Inc., Series S, 6.450%, 6/15/2021 | | | 2,811,625 | |
| | 195,000 | | | Cincinnati Bell Telephone Co. LLC, 6.300%, 12/01/2028 | | | 182,325 | |
| | 14,475,000 | | | Embarq Corp., 7.995%, 6/01/2036 | | | 14,475,000 | |
| | 910,000 | | | Frontier Communications Corp., 7.125%, 1/15/2023 | | | 643,825 | |
| | 265,000 | | | Frontier Communications Corp., 7.875%, 1/15/2027 | | | 155,025 | |
| | 455,000 | | | Frontier Communications Corp., 9.000%, 8/15/2031 | | | 288,925 | |
| | 2,755,000 | | | Qwest Capital Funding, Inc., 6.875%, 7/15/2028 | | | 2,554,711 | |
| | 4,370,000 | | | Qwest Capital Funding, Inc., 7.625%, 8/03/2021 | | | 4,517,444 | |
| | 2,694,000 | | | Qwest Capital Funding, Inc., 7.750%, 2/15/2031 | | | 2,502,052 | |
| | 12,308,000 | | | Qwest Corp., 6.875%, 9/15/2033 | | | 12,239,697 | |
| | 9,077,000 | | | Qwest Corp., 7.250%, 9/15/2025 | | | 9,792,652 | |
| | 2,490,000 | | | Telecom Italia Capital S.A., 6.000%, 9/30/2034 | | | 2,371,725 | |
| | 5,775,000 | | | Telecom Italia Capital S.A., 6.375%, 11/15/2033 | | | 5,659,500 | |
| | 4,100,000 | | | Telefonica Emisiones SAU, EMTN, 5.289%, 12/09/2022, (GBP) | | | 6,016,273 | |
| | 9,100,000 | | | Telefonica Emisiones SAU, EMTN, 5.375%, 2/02/2026, (GBP) | | | 13,697,373 | |
| | 31,293,000 | | | Verizon Communications, Inc., 4.329%, 9/21/2028, 144A | | | 31,451,030 | |
| | | | | | | | |
| | | | | | | 179,009,531 | |
| | | | | | | | |
| | | | Total Non-Convertible Bonds
(Identified Cost $3,072,836,919) | | | 3,006,465,729 | |
| | | | | | | | |
| | | | | | | | |
| | Convertible Bonds — 1.5% | |
| | | | Cable Satellite — 0.2% | |
| | 9,050,000 | | | DISH Network Corp., 2.375%, 3/15/2024 | | | 8,021,323 | |
| | 6,190,000 | | | DISH Network Corp., 3.375%, 8/15/2026 | | | 5,903,811 | |
| | | | | | | | |
| | | | | | | 13,925,134 | |
| | | | | | | | |
| | | | Finance Companies — 0.1% | |
| | 3,905,000 | | | Euronet Worldwide, Inc., 1.500%, 10/01/2044 | | | 5,437,986 | |
| | | | | | | | |
| | | | REITs – Mortgage — 0.2% | |
| | 8,710,000 | | | iStar, Inc., 3.125%, 9/15/2022, 144A | | | 8,467,305 | |
| | | | | | | | |
| | | | Technology — 1.0% | |
| | 46,000,000 | | | Booking Holdings, Inc., 0.900%, 9/15/2021 | | | 54,576,608 | |
| | 337,678 | | | Liberty Interactive LLC, 3.500%, 1/15/2031 | | | 438,766 | |
| | | | | | | | |
| | | | | | | 55,015,374 | |
| | | | | | | | |
| | | | Total Convertible Bonds
(Identified Cost $71,527,508) | | | 82,845,799 | |
| | | | | | | | |
| | | | | | | | |
| | Municipals — 0.3% | |
| | | | Illinois — 0.2% | |
| | 9,150,000 | | | State of Illinois, 5.100%, 6/01/2033 | | | 8,781,712 | |
| | | | | | | | |
See accompanying notes to financial statements.
25 |
Portfolio of Investments – as of September 30, 2018
Loomis Sayles Investment Grade Bond Fund – (continued)
| | | | | | | | |
Principal
Amount (‡) | | | Description | | Value (†) | |
| | | | Michigan — 0.0% | |
| $ | 1,660,000 | | | Michigan Tobacco Settlement Finance Authority Taxable Turbo, Series A, 7.309%, 6/01/2034 | | $ | 1,681,630 | |
| | | | | | | | |
| | | | Virginia — 0.1% | |
| | 7,705,000 | | | Virginia Tobacco Settlement Financing Corp., Series A-1, 6.706%, 6/01/2046 | | | 7,637,967 | |
| | | | | | | | |
| | | | Total Municipals
(Identified Cost $16,412,481) | | | 18,101,309 | |
| | | | | | | | |
| | | | | | | | |
| | | | Total Bonds and Notes
(Identified Cost $3,160,776,908) | | | 3,107,412,837 | |
| | | | | | | | |
| | | | | | | | |
| Shares | | | | | | |
| | Common Stocks — 0.7% | |
| | | | Automobiles — 0.7% | |
| | 4,063,816 | | | Ford Motor Co.
(Identified Cost $34,826,997) | | | 37,590,298 | |
| | | | | | | | |
| | | | | | | | |
| | Preferred Stocks — 0.1% | |
| | | | Independent Energy — 0.1% | |
| | 43,031 | | | Chesapeake Energy Corp., 5.000% (Identified Cost $3,673,619) | | | 2,652,000 | |
| | | | | | | | |
| | | | | | | | |
Principal
Amount (‡) | | | | | | |
| | Short-Term Investments — 36.0% | |
| $ | 25,000,000 | | | Federal Home Loan Bank Discount Notes, 1.955%, 10/10/2018(k) | | | 24,986,800 | |
| | 106,313,572 | | | Tri-Party Repurchase Agreement with Fixed Income Clearing Corporation, dated 9/28/2018 at 1.300% to be repurchased at $106,325,089 on 10/01/2018 collateralized by $61,345,000 Federal Home Loan Mortgage Corp., 3.750% due 3/27/2019 valued at $61,745,828; $47,065,000 Federal Home Loan Mortgage Corp., 1.250% due 10/02/2019 valued at $46,696,387 including accrued interest (Note 2 of Notes to Financial Statements) | | | 106,313,572 | |
| | 125,000,000 | | | U.S. Treasury Bills, 1.969% - 1.985%, 11/01/2018(k)(l) | | | 124,777,995 | |
| | 300,000,000 | | | U.S. Treasury Bills, 1.995%, 11/08/2018(k) | | | 299,344,500 | |
| | 25,000,000 | | | U.S. Treasury Bills, 2.030%, 11/15/2018(k) | | | 24,934,961 | |
| | 200,000,000 | | | U.S. Treasury Bills, 2.060%, 11/29/2018(k) | | | 199,304,292 | |
| | 267,820,000 | | | U.S. Treasury Bills, 2.075%, 10/18/2018(k) | | | 267,558,522 | |
| | 400,000,000 | | | U.S. Treasury Bills, 2.080% - 2.086%, 12/06/2018(k)(l) | | | 398,439,832 | |
| | 350,000,000 | | | U.S. Treasury Bills, 2.118%, 12/20/2018(k) | | | 348,344,304 | |
| | 32,180,000 | | | U.S. Treasury Bills, 2.140%, 12/27/2018(k) | | | 32,012,604 | |
See accompanying notes to financial statements.
| 26
Portfolio of Investments – as of September 30, 2018
Loomis Sayles Investment Grade Bond Fund – (continued)
| | | | | | | | |
Principal
Amount (‡) | | | Description | | Value (†) | |
| | Short-Term Investments — (continued) | |
| $ | 180,000,000 | | | U.S. Treasury Bills, 2.160% - 2.200%, 04/25/2019(k)(l) | | $ | 177,587,224 | |
| | | | | | | | |
| | | | Total Short-Term Investments
(Identified Cost $2,003,856,102) | | | 2,003,604,606 | |
| | | | | | | | |
| | | | | | | | |
| | | | Total Investments — 92.7%
(Identified Cost $5,203,133,626) | | | 5,151,259,741 | |
| | | | Other assets less liabilities — 7.3% | | | 407,315,550 | |
| | | | | | | | |
| | | | Net Assets — 100.0% | | $ | 5,558,575,291 | |
| | | | | | | | |
| | | | | | | | |
| | (‡) | | | Principal Amount stated in U.S. dollars unless otherwise noted. | |
| | (†) | | | See Note 2 of Notes to Financial Statements. | | | | |
| | (††) | | | Amount shown represents units. One unit represents a principal amount of 25. | |
| | (†††) | | | Amount shown represents units. One unit represents a principal amount of 100. | |
| | (a) | | | Level 3 security. Value has been determined using significant unobservable inputs. See Note 3 of Notes to Financial Statements. | |
| | (b) | | | Securities classified as fair valued pursuant to the Fund’s pricing policies and procedures. At September 30, 2018, the value of these securities amounted to $116,035,671 or 2.1% of net assets. See Note 2 of Notes to Financial Statements. | |
| | (c) | | | Illiquid security. (Unaudited) | |
| | (d) | | | Variable rate security. Rate as of September 30, 2018 is disclosed. | |
| | (e) | | | Perpetual bond with no specified maturity date. | |
| | (f) | | | The issuer is in default with respect to interest and/or principal payments. Income is not being accrued. | |
| | (g) | | | Payment-in-kind security for which the issuer has the option at each interest payment date of making interest payments in cash or additional principal. | |
| | (h) | | | Fair valued by the Fund’s adviser. At September 30, 2018, the value of this security amounted to $845 or less than 0.1% of net assets. See Note 2 of Notes to Financial Statements. | |
| | (i) | | | Variable rate security. The interest rate adjusts periodically based on; (i) changes in current interest rates and/or prepayments on underlying pools of assets, if applicable, (ii) reference to a base lending rate plus or minus a margin, and/or (iii) reference to a base lending rate adjusted by a multiplier and/or subject to certain floors or caps. Rate as of September 30, 2018 is disclosed. | |
| | (j) | | | Non-income producing security. | |
| | (k) | | | Interest rate represents discount rate at time of purchase; not a coupon rate. | |
| | (l) | | | The Fund’s investment in U.S. Government/Agency securities is comprised of various lots with differing discount rates. These separate investments, which have the same maturity date, have been aggregated for the purpose of presentation in the Portfolio of Investments. | |
| | | | | | | | |
| | 144A | | | All or a portion of these securities are exempt from registration under Rule 144A of the Securities Act of 1933. These securities may be resold in transactions exempt from registration, normally to qualified institutional buyers. At September 30, 2018, the value of Rule 144A holdings amounted to $635,804,314 or 11.4% of net assets. | |
| | ABS | | | Asset-Backed Securities | | | | |
| | EMTN | | | Euro Medium Term Note | | | | |
| | FHLMC | | | Federal Home Loan Mortgage Corp. | | | | |
See accompanying notes to financial statements.
27 |
Portfolio of Investments – as of September 30, 2018
Loomis Sayles Investment Grade Bond Fund – (continued)
| | | | | | | | |
| | | | | | | | |
| | FNMA | | | Federal National Mortgage Association | | | | |
| | GMTN | | | Global Medium Term Note | | | | |
| | LIBOR | | | London Interbank Offered Rate | | | | |
| | MTN | | | Medium Term Note | | | | |
| | PIK | | | Payment-in-Kind | | | | |
| | PJSC | | | Private Joint-Stock Company | | | | |
| | REITs | | | Real Estate Investment Trusts | | | | |
| | | | | | | | |
| | AUD | | | Australian Dollar | | | | |
| | BRL | | | Brazilian Real | | | | |
| | CAD | | | Canadian Dollar | | | | |
| | EUR | | | Euro | | | | |
| | GBP | | | British Pound | | | | |
| | ISK | | | Icelandic Krona | | | | |
| | MXN | | | Mexican Peso | | | | |
| | NOK | | | Norwegian Krone | | | | |
| | NZD | | | New Zealand Dollar | | | | |
Industry Summary at September 30, 2018
| | | | |
Treasuries | | | 11.9 | % |
Banking | | | 8.1 | |
Finance Companies | | | 4.4 | |
Wirelines | | | 3.2 | |
Life Insurance | | | 2.0 | |
Other Investments, less than 2% each | | | 27.1 | |
Short-Term Investments | | | 36.0 | |
| | | | |
Total Investments | | | 92.7 | |
Other assets less liabilities | | | 7.3 | |
| | | | |
Net Assets | | | 100.0 | % |
| | | | |
Currency Exposure Summary at September 30, 2018
| | | | |
United States Dollar | | | 79.2 | % |
Mexican Peso | | | 4.8 | |
Canadian Dollar | | | 3.7 | |
Other, less than 2% each | | | 5.0 | |
| | | | |
Total Investments | | | 92.7 | |
Other assets less liabilities | | | 7.3 | |
| | | | |
Net Assets | | | 100.0 | % |
| | | | |
See accompanying notes to financial statements.
| 28
Portfolio of Investments – as of September 30, 2018
Loomis Sayles Strategic Income Fund
| | | | | | | | |
Principal
Amount (‡) | | | Description | | Value (†) | |
| | Bonds and Notes — 69.6% of Net Assets | |
| | Non-Convertible Bonds — 63.7% | |
| | | | ABS Other — 0.3% | |
| $ | 22,378,976 | | | GCA2014 Holdings Ltd., Series 2014-1, Class C, 6.000%, 1/05/2030, 144A(a)(b)(c)(d) | | $ | 17,108,727 | |
| | 8,984,885 | | | GCA2014 Holdings Ltd., Series 2014-1, Class D, 7.500%, 1/05/2030, 144A(a)(b)(c)(d) | | | 3,571,492 | |
| | 42,000,000 | | | GCA2014 Holdings Ltd., Series 2014-1, Class E, Zero Coupon, 1/05/2030, 144A(a)(b)(c)(d)(e) | | | — | |
| | 9,440,756 | | | Global Container Assets Ltd., Series 2015-1A, Class B, 4.500%, 2/05/2030, 144A(d)(f) | | | 8,953,489 | |
| | | | | | | | |
| | | | | | | 29,633,708 | |
| | | | | | | | |
| | | | Aerospace & Defense — 1.0% | |
| | 620,000 | | | Bombardier, Inc., 7.350%, 12/22/2026, 144A, (CAD) | | | 492,645 | |
| | 10,225,000 | | | Bombardier, Inc., 7.450%, 5/01/2034, 144A | | | 10,364,162 | |
| | 3,145,000 | | | Embraer Netherlands Finance BV, 5.400%, 2/01/2027 | | | 3,207,900 | |
| | 9,576,000 | | | Leonardo U.S. Holdings, Inc., 6.250%, 1/15/2040, 144A | | | 9,995,525 | |
| | 8,815,000 | | | Leonardo U.S. Holdings, Inc., 7.375%, 7/15/2039, 144A | | | 10,225,400 | |
| | 5,310,000 | | | Textron Financial Corp., 3-month LIBOR + 1.735%, 4.049%, 2/15/2067, 144A(g) | | | 4,632,975 | |
| | 24,513,000 | | | TransDigm, Inc., 6.500%, 7/15/2024 | | | 25,113,568 | |
| | 17,765,000 | | | TransDigm, Inc., 6.500%, 5/15/2025 | | | 18,098,094 | |
| | | | | | | | |
| | | | | | | 82,130,269 | |
| | | | | | | | |
| | | | Airlines — 2.8% | |
| | 130,040,000 | | | American Airlines Group, Inc., 5.500%, 10/01/2019, 144A | | | 131,828,050 | |
| | 10,946,717 | | | American Airlines Pass Through Certificates, Series 2013-1, Class A, 4.000%, 1/15/2027 | | | 10,886,401 | |
| | 1,959,407 | | | American Airlines Pass Through Certificates, Series 2016-3, Class B, 3.750%, 4/15/2027 | | | 1,891,572 | |
| | 1,963,081 | | | Continental Airlines Pass Through Certificates, Series 2012-1, Class B, 6.250%, 10/11/2021 | | | 2,011,098 | |
| | 1,936,054 | | | Continental Airlines Pass Through Certificates, Series 2012-2, Class B, 5.500%, 4/29/2022 | | | 1,974,427 | |
| | 930 | | | Continental Airlines Pass Through Trust, Series 1999-2, Class B, 7.566%, 9/15/2021 | | | 973 | |
| | 240,530 | | | Continental Airlines Pass Through Trust, Series 2001-1, Class A-1, 6.703%, 12/15/2022 | | | 253,166 | |
| | 445,691 | | | Northwest Airlines, Inc., Series 2002-1, Class G2, (MBIA Insured), 6.264%, 5/20/2023(a) | | | 455,986 | |
| | 32,758,234 | | | US Airways Pass Through Trust, Series 2011-1B, Class B, 9.750%, 4/22/2020 | | | 32,923,008 | |
| | 4,858,893 | | | US Airways Pass Through Trust, Series 2012-1B, Class B, 8.000%, 4/01/2021 | | | 5,065,396 | |
| | 48,950,000 | | | Virgin Australia Holdings Ltd., 8.500%, 11/15/2019, 144A | | | 49,684,250 | |
| | 1,464,426 | | | Virgin Australia Pass Through Certificates, Series 2013-1B, 6.000%, 4/23/2022, 144A | | | 1,485,616 | |
| | 1,032,606 | | | Virgin Australia Pass Through Certificates, Series 2013-1C, 7.125%, 10/23/2018, 144A | | | 1,027,752 | |
| | | | | | | | |
| | | | | | | 239,487,695 | |
| | | | | | | | |
See accompanying notes to financial statements.
29 |
Portfolio of Investments – as of September 30, 2018
Loomis Sayles Strategic Income Fund – (continued)
| | | | | | | | |
Principal
Amount (‡) | | | Description | | Value (†) | |
| | | | Automotive — 0.4% | |
| $ | 1,210,000 | | | Allison Transmission, Inc., 4.750%, 10/01/2027, 144A | | $ | 1,141,938 | |
| | 1,220,000 | | | Ford Motor Co., 6.625%, 2/15/2028 | | | 1,287,991 | |
| | 1,345,000 | | | Ford Motor Co., 7.500%, 8/01/2026 | | | 1,526,120 | |
| | 4,795,000 | | | Goodyear Tire & Rubber Co. (The), 4.875%, 3/15/2027 | | | 4,405,406 | |
| | 4,977,000 | | | Goodyear Tire & Rubber Co. (The), 7.000%, 3/15/2028 | | | 5,176,080 | |
| | 26,055,000 | | | Midas Intermediate Holdco II LLC/Midas Intermediate Holdco II Finance, Inc., 7.875%, 10/01/2022, 144A | | | 23,058,675 | |
| | | | | | | | |
| | | | | | | 36,596,210 | |
| | | | | | | | |
| | | | Banking — 4.9% | |
| | 6,000,000 | | | Ally Financial, Inc., 8.000%, 11/01/2031 | | | 7,267,500 | |
| | 983,000 | | | Bank of America Corp., (fixed rate to 12/20/2027, variable rate thereafter), 3.419%, 12/20/2028 | | | 922,634 | |
| | 265,000 | | | Bank of America Corp., MTN, 4.250%, 10/22/2026 | | | 261,963 | |
| | 7,045,000 | | | Bank of America Corp., Series L, MTN, 4.183%, 11/25/2027 | | | 6,876,145 | |
| | 10,000,000 | | | Bank of Nova Scotia (The), 2.462%, 3/14/2019, (CAD) | | | 7,754,268 | |
| | 36,445,000 | | | Citigroup, Inc., 5.130%, 11/12/2019, (NZD) | | | 24,772,136 | |
| | 3,450,000 | | | Cooperatieve Rabobank UA, 3.950%, 11/09/2022 | | | 3,430,387 | |
| | 2,165,000 | | | Deutsche Bank AG, (fixed rate to 12/01/2027, variable rate thereafter), 4.875%, 12/01/2032 | | | 1,923,711 | |
| | 25,000,000 | | | Goldman Sachs Group, Inc. (The), 3.550%, 2/12/2021, (CAD) | | | 19,549,026 | |
| | 19,245,000 | | | Intesa Sanpaolo SpA, 5.017%, 6/26/2024, 144A | | | 17,366,411 | |
| | 45,620,000 | | | JPMorgan Chase & Co., 4.250%, 11/02/2018, (NZD) | | | 30,288,869 | |
| | 36,195,000 | | | Morgan Stanley, 4.350%, 9/08/2026 | | | 35,915,773 | |
| | 35,325,000 | | | Morgan Stanley, 4.750%, 11/16/2018, (AUD) | | | 25,610,818 | |
| | 185,000,000 | | | Morgan Stanley, GMTN, 5.000%, 9/30/2021, (AUD) | | | 141,107,912 | |
| | 46,735,000 | | | Morgan Stanley, MTN, 4.100%, 5/22/2023 | | | 47,024,317 | |
| | 10,000,000 | | | Morgan Stanley, MTN, 6.250%, 8/09/2026 | | | 11,241,373 | |
| | 53,095,000 | | | Morgan Stanley, Series MPLE, 3.125%, 8/05/2021, (CAD) | | | 41,122,368 | |
| | | | | | | | |
| | | | | | | 422,435,611 | |
| | | | | | | | |
| | | | Brokerage — 1.3% | |
| | 3,325,000 | | | Jefferies Finance LLC/JFIN Co-Issuer Corp., 6.875%, 4/15/2022, 144A | | | 3,341,625 | |
| | 1,675,000 | | | Jefferies Finance LLC/JFIN Co-Issuer Corp., 7.250%, 8/15/2024, 144A | | | 1,624,750 | |
| | 22,540,000 | | | Jefferies Finance LLC/JFIN Co-Issuer Corp., 7.500%, 4/15/2021, 144A | | | 23,047,150 | |
| | 43,025,000 | | | Jefferies Group LLC, 5.125%, 1/20/2023 | | | 44,486,929 | |
| | 20,010,000 | | | Jefferies Group LLC, 6.250%, 1/15/2036 | | | 20,239,681 | |
| | 15,215,000 | | | Jefferies Group LLC, 6.450%, 6/08/2027 | | | 16,481,574 | |
| | | | | | | | |
| | | | | | | 109,221,709 | |
| | | | | | | | |
| | | | Building Materials — 0.3% | |
| | 5,565,000 | | | American Woodmark Corp., 4.875%, 3/15/2026, 144A | | | 5,314,575 | |
| | 1,859,000 | | | Masco Corp., 6.500%, 8/15/2032 | | | 2,037,490 | |
| | 195,000 | | | Masco Corp., 7.125%, 3/15/2020 | | | 204,807 | |
| | 1,226,000 | | | Masco Corp., 7.750%, 8/01/2029 | | | 1,454,245 | |
| | 10,800,000 | | | Owens Corning, 7.000%, 12/01/2036 | | | 12,304,767 | |
| | | | | | | | |
| | | | | | | 21,315,884 | |
| | | | | | | | |
See accompanying notes to financial statements.
| 30
Portfolio of Investments – as of September 30, 2018
Loomis Sayles Strategic Income Fund – (continued)
| | | | | | | | |
Principal
Amount (‡) | | | Description | | Value (†) | |
| | | | Cable Satellite — 1.3% | |
| $ | 850,000 | | | CCO Holdings LLC/CCO Holdings Capital Corp., 5.125%, 5/01/2023, 144A | | $ | 851,318 | |
| | 975,000 | | | CCO Holdings LLC/CCO Holdings Capital Corp., 5.375%, 5/01/2025, 144A | | | 967,687 | |
| | 3,315,000 | | | CCO Holdings LLC/CCO Holdings Capital Corp., 5.750%, 1/15/2024 | | | 3,368,869 | |
| | 4,360,000 | | | CCO Holdings LLC/CCO Holdings Capital Corp., 5.875%, 5/01/2027, 144A | | | 4,321,850 | |
| | 17,880,000 | | | CSC Holdings LLC, 5.375%, 2/01/2028, 144A | | | 17,030,700 | |
| | 17,679,000 | | | DISH DBS Corp., 5.875%, 11/15/2024 | | | 15,844,804 | |
| | 25,270,000 | | | Shaw Communications, Inc., 5.650%, 10/01/2019, (CAD) | | | 20,120,723 | |
| | 4,835,000 | | | Time Warner Cable LLC, 4.500%, 9/15/2042 | | | 4,126,153 | |
| | 135,000 | | | Time Warner Cable LLC, 5.875%, 11/15/2040 | | | 136,298 | |
| | 11,275,000 | | | Videotron Ltd., 5.625%, 6/15/2025, 144A, (CAD) | | | 9,016,246 | |
| | 7,000,000 | | | Virgin Media Finance PLC, 6.000%, 10/15/2024, 144A | | | 7,004,760 | |
| | 20,300,000 | | | VTR Finance BV, 6.875%, 1/15/2024, 144A | | | 20,655,250 | |
| | 5,165,000 | | | Ziggo BV, 5.500%, 1/15/2027, 144A | | | 4,846,061 | |
| | | | | | | | |
| | | | | | | 108,290,719 | |
| | | | | | | | |
| | | | Chemicals — 2.0% | |
| | 19,810,000 | | | Aruba Investments, Inc., 8.750%, 2/15/2023, 144A | | | 20,602,400 | |
| | 3,416,000 | | | Chemours Co. (The), 6.625%, 5/15/2023 | | | 3,568,319 | |
| | 18,254,000 | | | Consolidated Energy Finance S.A., 6.500%, 5/15/2026, 144A | | | 18,436,540 | |
| | 26,164,000 | | | Hexion, Inc., 7.875%, 2/15/2023(d)(f) | | | 20,931,200 | |
| | 8,757,000 | | | Hexion, Inc., 9.200%, 3/15/2021(d)(f) | | | 7,093,170 | |
| | 16,660,000 | | | Hexion, Inc./Hexion Nova Scotia Finance ULC, 9.000%, 11/15/2020 | | | 13,841,628 | |
| | 90,205,000 | | | INVISTA Finance LLC, 4.250%, 10/15/2019, 144A | | | 90,092,244 | |
| | 885,000 | | | TPC Group, Inc., 8.750%, 12/15/2020, 144A | | | 882,787 | |
| | | | | | | | |
| | | | | | | 175,448,288 | |
| | | | | | | | |
| | | | Construction Machinery — 0.1% | |
| | 1,310,000 | | | United Rentals North America, Inc., 4.875%, 1/15/2028 | | | 1,228,125 | |
| | 5,105,000 | | | United Rentals North America, Inc., 5.750%, 11/15/2024 | | | 5,252,024 | |
| | | | | | | | |
| | | | | | | 6,480,149 | |
| | | | | | | | |
| | | | Consumer Cyclical Services — 0.1% | |
| | 5,500,000 | | | ServiceMaster Co. LLC (The), 7.450%, 8/15/2027 | | | 5,781,875 | |
| | | | | | | | |
| | | | Consumer Products — 0.1% | |
| | 11,880,000 | | | Avon Products, Inc., 8.950%, 3/15/2043 | | | 10,632,600 | |
| | | | | | | | |
| | | | Electric — 1.0% | |
| | 5,093,000 | | | AES Corp. (The), 4.875%, 5/15/2023 | | | 5,137,564 | |
| | 9,371,000 | | | AES Corp. (The), 5.500%, 4/15/2025 | | | 9,597,591 | |
| | 31,888,312 | | | Alta Wind Holdings LLC, 7.000%, 6/30/2035, 144A | | | 34,075,497 | |
| | 29,959,000 | | | EDP Finance BV, 4.125%, 1/15/2020, 144A | | | 30,111,192 | |
| | 3,570,000 | | | Empresa Nacional de Electricidad S.A., 7.875%, 2/01/2027 | | | 4,314,222 | |
| | 5,991,000 | | | Vistra Energy Corp., 7.625%, 11/01/2024 | | | 6,447,814 | |
| | | | | | | | |
| | | | | | | 89,683,880 | |
| | | | | | | | |
| | | | Finance Companies — 3.4% | |
| | 9,075,000 | | | iStar, Inc., 5.000%, 7/01/2019 | | | 9,090,201 | |
| | 2,260,000 | | | Navient Corp., 5.875%, 10/25/2024 | | | 2,214,800 | |
| | 109,950(††) | | | Navient Corp., 6.000%, 12/15/2043 | | | 2,444,830 | |
See accompanying notes to financial statements.
31 |
Portfolio of Investments – as of September 30, 2018
Loomis Sayles Strategic Income Fund – (continued)
| | | | | | | | |
Principal
Amount (‡) | | | Description | | Value (†) | |
| | | | Finance Companies — continued | |
| $ | 30,265,000 | | | Navient Corp., MTN, 6.125%, 3/25/2024 | | $ | 30,265,000 | |
| | 22,945,000 | | | Navient LLC, 5.500%, 1/25/2023 | | | 22,887,638 | |
| | 7,780,000 | | | Navient LLC, MTN, 5.500%, 1/15/2019 | | | 7,818,900 | |
| | 6,490,000 | | | Navient LLC, MTN, 7.250%, 1/25/2022 | | | 6,846,950 | |
| | 50,910,000 | | | Navient LLC, Series A, MTN, 5.625%, 8/01/2033 | | | 42,637,125 | |
| | 45,875,000 | | | Springleaf Finance Corp., 5.250%, 12/15/2019 | | | 46,505,781 | |
| | 23,115,000 | | | Springleaf Finance Corp., 6.875%, 3/15/2025 | | | 23,057,212 | |
| | 4,075,000 | | | Springleaf Finance Corp., 7.125%, 3/15/2026 | | | 4,054,625 | |
| | 26,970,000 | | | Springleaf Finance Corp., 7.750%, 10/01/2021 | | | 29,093,348 | |
| | 55,015,000 | | | Springleaf Finance Corp., 8.250%, 10/01/2023 | | | 60,654,037 | |
| | | | | | | | |
| | | | | | | 287,570,447 | |
| | | | | | | | |
| | | | Gaming — 0.1% | |
| | 5,475,000 | | | International Game Technology PLC, 6.250%, 1/15/2027, 144A | | | 5,542,890 | |
| | | | | | | | |
| | | | Government Owned – No Guarantee — 0.8% | |
| | 22,160,000 | | | Pertamina Persero PT, 6.450%, 5/30/2044, 144A | | | 24,067,754 | |
| | 21,145,000 | | | Petrobras Global Finance BV, 4.375%, 5/20/2023 | | | 20,083,521 | |
| | 30,955,000 | | | Petrobras Global Finance BV, 5.625%, 5/20/2043 | | | 25,073,550 | |
| | | | | | | | |
| | | | | | | 69,224,825 | |
| | | | | | | | |
| | | | Healthcare — 3.2% | |
| | 40,686,000 | | | HCA, Inc., 5.875%, 5/01/2023 | | | 42,923,730 | |
| | 14,620,000 | | | HCA, Inc., 7.050%, 12/01/2027 | | | 15,679,950 | |
| | 20,447,000 | | | HCA, Inc., 7.500%, 12/15/2023 | | | 22,491,700 | |
| | 24,215,000 | | | HCA, Inc., 7.500%, 11/06/2033 | | | 26,246,154 | |
| | 14,056,000 | | | HCA, Inc., 7.690%, 6/15/2025 | | | 15,707,580 | |
| | 32,745,000 | | | HCA, Inc., 8.360%, 4/15/2024 | | | 37,247,437 | |
| | 10,815,000 | | | HCA, Inc., MTN, 7.580%, 9/15/2025 | | | 12,031,688 | |
| | 9,492,000 | | | HCA, Inc., MTN, 7.750%, 7/15/2036 | | | 10,346,280 | |
| | 955,000 | | | Tenet Healthcare Corp., 4.375%, 10/01/2021 | | | 950,865 | |
| | 18,365,000 | | | Tenet Healthcare Corp., 5.125%, 5/01/2025 | | | 18,089,525 | |
| | 37,980,000 | | | Tenet Healthcare Corp., 6.750%, 6/15/2023 | | | 37,837,575 | |
| | 35,329,000 | | | Tenet Healthcare Corp., 6.875%, 11/15/2031 | | | 31,626,521 | |
| | 1,015,000 | | | Tenet Healthcare Corp., 7.500%, 1/01/2022, 144A | | | 1,059,406 | |
| | 990,000 | | | Tenet Healthcare Corp., 8.125%, 4/01/2022 | | | 1,043,262 | |
| | | | | | | | |
| | | | | | | 273,281,673 | |
| | | | | | | | |
| | | | Home Construction — 0.9% | |
| | 151,000 | | | Beazer Homes USA, Inc., 7.250%, 2/01/2023 | | | 148,735 | |
| | 13,360,000 | | | K. Hovnanian Enterprises, Inc., 5.000%, 11/01/2021 | | | 11,935,423 | |
| | 47,260,000 | | | PulteGroup, Inc., 6.000%, 2/15/2035 | | | 44,542,550 | |
| | 13,190,000 | | | PulteGroup, Inc., 6.375%, 5/15/2033 | | | 12,663,851 | |
| | 10,305,000 | | | TRI Pointe Group, Inc./TRI Pointe Homes, Inc., 4.375%, 6/15/2019 | | | 10,356,525 | |
| | 195,000 | | | TRI Pointe Group, Inc./TRI Pointe Homes, Inc., 5.875%, 6/15/2024 | | | 193,538 | |
| | | | | | | | |
| | | | | | | 79,840,622 | |
| | | | | | | | |
| | | | Independent Energy — 4.3% | |
| | 595,000 | | | Anadarko Petroleum Corp., 3.450%, 7/15/2024 | | | 572,757 | |
| | 540,000 | | | Anadarko Petroleum Corp., 4.500%, 7/15/2044 | | | 494,602 | |
See accompanying notes to financial statements.
| 32
Portfolio of Investments – as of September 30, 2018
Loomis Sayles Strategic Income Fund – (continued)
| | | | | | | | |
Principal
Amount (‡) | | | Description | | Value (†) | |
| | | | Independent Energy — continued | |
| $ | 4,810,000 | | | Antero Resources Corp., 5.625%, 6/01/2023 | | $ | 4,924,237 | |
| | 18,736,000 | | | Ascent Resources Utica Holdings LLC/ARU Finance Corp., 10.000%, 4/01/2022, 144A | | | 21,078,000 | |
| | 8,145,000 | | | Baytex Energy Corp., 5.125%, 6/01/2021, 144A | | | 8,022,825 | |
| | 8,225,000 | | | Baytex Energy Corp., 5.625%, 6/01/2024, 144A | | | 7,854,875 | |
| | 17,375,000 | | | Bellatrix Exploration Ltd., 8.500%, 5/15/2020, 144A(d)(f) | | | 10,642,187 | |
| | 8,645,000 | | | California Resources Corp., 5.500%, 9/15/2021 | | | 7,962,909 | |
| | 1,188,000 | | | California Resources Corp., 6.000%, 11/15/2024 | | | 1,009,800 | |
| | 50,620,000 | | | California Resources Corp., 8.000%, 12/15/2022, 144A | | | 48,342,100 | |
| | 1,310,000 | | | Chesapeake Energy Corp., 4.875%, 4/15/2022 | | | 1,272,338 | |
| | 55,000 | | | Chesapeake Energy Corp., 6.875%, 11/15/2020 | | | 57,613 | |
| | 21,335,000 | | | Chesapeake Energy Corp., 8.000%, 1/15/2025 | | | 22,001,719 | |
| | 39,020,000 | | | Chesapeake Energy Corp., 8.000%, 6/15/2027 | | | 39,800,400 | |
| | 15,215,000 | | | Continental Resources, Inc., 3.800%, 6/01/2024 | | | 14,920,771 | |
| | 5,450,000 | | | Continental Resources, Inc., 4.500%, 4/15/2023 | | | 5,545,931 | |
| | 440,000 | | | Continental Resources, Inc., 5.000%, 9/15/2022 | | | 446,380 | |
| | 19,290,000 | | | Eclipse Resources Corp., 8.875%, 7/15/2023 | | | 19,627,575 | |
| | 1,567,000 | | | Halcon Resources Corp., 6.750%, 2/15/2025 | | | 1,504,320 | |
| | 15,580,000 | | | Lonestar Resources America, Inc., 11.250%, 1/01/2023, 144A | | | 17,099,050 | |
| | 180,000 | | | MEG Energy Corp., 6.375%, 1/30/2023, 144A | | | 163,800 | |
| | 12,740,000 | | | MEG Energy Corp., 7.000%, 3/31/2024, 144A | | | 11,625,250 | |
| | 1,065,000 | | | Oasis Petroleum, Inc., 6.875%, 1/15/2023 | | | 1,083,638 | |
| | 7,170,000 | | | Pan American Energy LLC/Argentine Branch, 7.875%, 5/07/2021, 144A | | | 7,296,909 | |
| | 2,055,000 | | | QEP Resources, Inc., 5.250%, 5/01/2023 | | | 2,001,056 | |
| | 18,400,000 | | | Rex Energy Corp., 8.000%, 10/01/2020(h) | | | 4,968,000 | |
| | 17,908,000 | | | Sanchez Energy Corp., 6.125%, 1/15/2023 | | | 10,207,560 | |
| | 9,520,000 | | | Sanchez Energy Corp., 7.750%, 6/15/2021 | | | 6,664,000 | |
| | 8,241,000 | | | SM Energy Co., 5.000%, 1/15/2024 | | | 8,024,674 | |
| | 15,904,000 | | | SM Energy Co., 6.125%, 11/15/2022 | | | 16,381,120 | |
| | 1,110,000 | | | Southwestern Energy Co., 6.200%, 1/23/2025 | | | 1,101,675 | |
| | 14,955,000 | | | Vine Oil & Gas LP/Vine Oil & Gas Finance Corp., 8.750%, 4/15/2023, 144A | | | 14,618,512 | |
| | 19,960,000 | | | Whiting Petroleum Corp., 5.750%, 3/15/2021 | | | 20,459,000 | |
| | 3,550,000 | | | Whiting Petroleum Corp., 6.250%, 4/01/2023 | | | 3,674,782 | |
| | 21,785,000 | | | Whiting Petroleum Corp., 6.625%, 1/15/2026 | | | 22,656,400 | |
| | | | | | | | |
| | | | | | | 364,106,765 | |
| | | | | | | | |
| | | | Life Insurance — 0.7% | |
| | 15,000,000 | | | Global Atlantic Fin Co., 8.625%, 4/15/2021, 144A | | | 16,588,199 | |
| | 20,000,000 | | | National Life Insurance Co., 10.500%, 9/15/2039, 144A(d)(f) | | | 31,928,194 | |
| | 8,920,000 | | | NLV Financial Corp., 7.500%, 8/15/2033, 144A(d)(f) | | | 10,830,407 | |
| | | | | | | | |
| | | | | | | 59,346,800 | |
| | | | | | | | |
| | | | Local Authorities — 0.8% | |
| | 95,480,000 | | | New South Wales Treasury Corp., 4.000%, 4/08/2021, (AUD) | | | 72,043,034 | |
| | | | | | | | |
| | | | Media Entertainment — 1.2% | |
| | 1,000,000 | | | Clear Channel Worldwide Holdings, Inc., Series B, 7.625%, 3/15/2020 | | | 1,002,500 | |
| | 111,590,000 | | | Grupo Televisa SAB, EMTN, 7.250%, 5/14/2043, (MXN) | | | 4,223,295 | |
| | 16,770,000 | | | iHeartCommunications, Inc., 9.000%, 12/15/2019(h) | | | 12,619,425 | |
See accompanying notes to financial statements.
33 |
Portfolio of Investments – as of September 30, 2018
Loomis Sayles Strategic Income Fund – (continued)
| | | | | | | | |
Principal
Amount (‡) | | | Description | | Value (†) | |
| | | | Media Entertainment — continued | |
| $ | 47,480,000 | | | iHeartCommunications, Inc., 9.000%, 3/01/2021(h) | | $ | 35,372,600 | |
| | 33,370,000 | | | iHeartCommunications, Inc., 9.000%, 9/15/2022(h) | | | 25,152,637 | |
| | 7,180,000 | | | Outfront Media Capital LLC/Outfront Media Capital Corp., 5.250%, 2/15/2022 | | | 7,269,750 | |
| | 17,950,000 | | | Outfront Media Capital LLC/Outfront Media Capital Corp., 5.875%, 3/15/2025 | | | 18,129,500 | |
| | | | | | | | |
| | | | | | | 103,769,707 | |
| | | | | | | | |
| | | | Metals & Mining — 1.1% | |
| | 8,202,122 | | | 1839688 Alberta ULC, PIK, 14.000%, 2/13/2020(a)(b)(d)(h)(i) | | | 4,101 | |
| | 2,000,000 | | | AK Steel Corp., 7.625%, 10/01/2021 | | | 2,037,500 | |
| | 25,271,000 | | | ArcelorMittal, 6.750%, 3/01/2041 | | | 28,837,418 | |
| | 8,705,000 | | | Barrick North America Finance LLC, 5.750%, 5/01/2043 | | | 9,664,273 | |
| | 12,315,000 | | | First Quantum Minerals Ltd., 7.250%, 5/15/2022, 144A | | | 12,053,306 | |
| | 1,810,000 | | | First Quantum Minerals Ltd., 7.500%, 4/01/2025, 144A | | | 1,717,238 | |
| | 16,135,000 | | | Russel Metals, Inc., 6.000%, 4/19/2022, 144A, (CAD) | | | 12,647,921 | |
| | 11,719,000 | | | United States Steel Corp., 6.650%, 6/01/2037 | | | 10,473,856 | |
| | 2,655,000 | | | United States Steel Corp., 7.375%, 4/01/2020 | | | 2,777,794 | |
| | 10,000,000 | | | Worthington Industries, Inc., 6.500%, 4/15/2020 | | | 10,391,212 | |
| | | | | | | | |
| | | | | | | 90,604,619 | |
| | | | | | | | |
| | | | Midstream — 0.5% | |
| | 8,935,000 | | | IFM U.S. Colonial Pipeline 2 LLC, 6.450%, 5/01/2021, 144A | | | 9,412,843 | |
| | 13,667,000 | | | NGL Energy Partners LP/NGL Energy Finance Corp., 6.125%, 3/01/2025 | | | 12,812,813 | |
| | 882,000 | | | NGL Energy Partners LP/NGL Energy Finance Corp., 6.875%, 10/15/2021 | | | 898,493 | |
| | 8,125,000 | | | NGL Energy Partners LP/NGL Energy Finance Corp., 7.500%, 11/01/2023 | | | 8,125,000 | |
| | 505,000 | | | NGPL PipeCo LLC, 7.768%, 12/15/2037, 144A | | | 618,625 | |
| | 11,820,000 | | | Summit Midstream Partners LP, Series A, (fixed rate to 12/15/2022, variable rate thereafter), 9.500%(j) | | | 11,738,915 | |
| | | | | | | | |
| | | | | | | 43,606,689 | |
| | | | | | | | |
| | | | Non-Agency Commercial Mortgage-Backed Securities — 0.1% | |
| | 2,317,295 | | | GS Mortgage Securities Trust, Series 2007-GG10, Class AM, 5.977%, 8/10/2045(k) | | | 2,347,852 | |
| | 3,442,205 | | | Institutional Mortgage Securities Canada, Inc., Series 2014-5A, Class A1, 2.003%, 7/12/2047, 144A, (CAD) | | | 2,660,943 | |
| | | | | | | | |
| | | | | | | 5,008,795 | |
| | | | | | | | |
| | | | Oil Field Services — 2.6% | |
| | 11,165,000 | | | Ensco PLC, 7.750%, 2/01/2026 | | | 11,081,263 | |
| | 7,120,000 | | | Global Marine, Inc., 7.000%, 6/01/2028 | | | 7,155,600 | |
| | 12,610,000 | | | Noble Holding International Ltd., 7.750%, 1/15/2024 | | | 12,515,425 | |
| | 19,385,000 | | | Noble Holding International Ltd., 7.875%, 2/01/2026, 144A | | | 20,111,937 | |
| | 18,385,000 | | | Pioneer Energy Services Corp., 6.125%, 3/15/2022 | | | 16,151,958 | |
| | 12,020,000 | | | Precision Drilling Corp., 5.250%, 11/15/2024 | | | 11,527,180 | |
| | 474,543 | | | Precision Drilling Corp., 6.500%, 12/15/2021 | | | 481,661 | |
| | 2,080,000 | | | Shelf Drilling Holdings Ltd., 8.250%, 2/15/2025, 144A | | | 2,145,000 | |
| | 75,824,250 | | | Transocean Proteus Ltd., 6.250%, 12/01/2024, 144A | | | 77,151,174 | |
| | 39,300,000 | | | Transocean, Inc., 5.800%, 10/15/2022 | | | 39,152,625 | |
| | 28,580,000 | | | Transocean, Inc., 6.800%, 3/15/2038 | | | 24,721,700 | |
| | | | | | | | |
| | | | | | | 222,195,523 | |
| | | | | | | | |
See accompanying notes to financial statements.
| 34
Portfolio of Investments – as of September 30, 2018
Loomis Sayles Strategic Income Fund – (continued)
| | | | | | | | |
Principal
Amount (‡) | | | Description | | Value (†) | |
| | | | Paper — 0.5% | |
| $ | 15,225,000 | | | Georgia-Pacific LLC, 7.750%, 11/15/2029 | | $ | 20,013,757 | |
| | 4,865,000 | | | WestRock MWV LLC, 7.950%, 2/15/2031 | | | 6,281,614 | |
| | 8,750,000 | | | WestRock MWV LLC, 8.200%, 1/15/2030 | | | 11,362,814 | |
| | 2,840,000 | | | Weyerhaeuser Co., 6.950%, 10/01/2027 | | | 3,330,036 | |
| | | | | | | | |
| | | | | | | 40,988,221 | |
| | | | | | | | |
| | | | Property & Casualty Insurance — 0.6% | |
| | 12,510,000 | | | MBIA Insurance Corp., 3-month LIBOR + 11.260%, 13.599%, 1/15/2033, 144A(e)(g) | | | 7,678,013 | |
| | 25,465,000 | | | Nationstar Mortgage Holdings, Inc., 9.125%, 7/15/2026, 144A | | | 26,674,587 | |
| | 17,870,000 | | | XL Group PLC, 3-month LIBOR + 2.458%, 4.797%(g)(j) | | | 17,613,119 | |
| | | | | | | | |
| | | | | | | 51,965,719 | |
| | | | | | | | |
| | | | Retailers — 0.7% | |
| | 3,325,000 | | | Dillard’s, Inc., 7.000%, 12/01/2028 | | | 3,487,160 | |
| | 1,500,000 | | | Dillard’s, Inc., 7.750%, 7/15/2026 | | | 1,655,955 | |
| | 5,110,000 | | | Foot Locker, Inc., 8.500%, 1/15/2022 | | | 5,761,525 | |
| | 7,000 | | | J.C. Penney Corp., Inc., 5.650%, 6/01/2020 | | | 6,265 | |
| | 27,224,000 | | | J.C. Penney Corp., Inc., 6.375%, 10/15/2036 | | | 10,889,600 | |
| | 2,510,000 | | | J.C. Penney Corp., Inc., 7.625%, 3/01/2097 | | | 953,800 | |
| | 12,275,000 | | | Macy’s Retail Holdings, Inc., 6.790%, 7/15/2027 | | | 13,187,903 | |
| | 6,365,000 | | | Marks & Spencer PLC, 7.125%, 12/01/2037, 144A | | | 6,819,470 | |
| | 17,163,000 | | | TRU Taj LLC/TRU Taj Finance, Inc., 11.000%, 1/22/2019, 144A | | | 17,578,344 | |
| | | | | | | | |
| | | | | | | 60,340,022 | |
| | | | | | | | |
| | | | Supermarkets — 1.9% | |
| | 11,495,000 | | | Albertson’s Cos. LLC/Safeway, Inc./New Albertson’s, Inc./Albertson’s LLC, 5.750%, 3/15/2025 | | | 10,345,500 | |
| | 9,465,000 | | | Albertson’s Cos. LLC/Safeway, Inc./New Albertson’s, Inc./Albertson’s LLC, 6.625%, 6/15/2024 | | | 9,098,231 | |
| | 87,475,000 | | | New Albertsons LP, 7.450%, 8/01/2029 | | | 72,166,875 | |
| | 25,595,000 | | | New Albertsons LP, 7.750%, 6/15/2026 | | | 22,324,983 | |
| | 28,915,000 | | | New Albertsons LP, 8.000%, 5/01/2031 | | | 24,577,750 | |
| | 9,390,000 | | | New Albertsons LP, 8.700%, 5/01/2030 | | | 8,286,675 | |
| | 18,387,000 | | | New Albertsons LP, Series C, MTN, 6.625%, 6/01/2028 | | | 13,928,153 | |
| | 2,290,000 | | | Safeway, Inc., 7.250%, 2/01/2031 | | | 2,181,225 | |
| | | | | | | | |
| | | | | | | 162,909,392 | |
| | | | | | | | |
| | | | Technology — 1.1% | |
| | 4,537,000 | | | Advanced Micro Devices, Inc., 7.000%, 7/01/2024 | | | 4,786,535 | |
| | 17,060,000 | | | Amkor Technology, Inc., 6.375%, 10/01/2022 | | | 17,361,962 | |
| | 56,340,000 | | | KLA-Tencor Corp., 4.650%, 11/01/2024 | | | 57,731,788 | |
| | 15,170,000 | | | KLA-Tencor Corp., 5.650%, 11/01/2034 | | | 16,080,573 | |
| | 150,000 | | | Samsung Electronics Co. Ltd., 7.700%, 10/01/2027, 144A | | | 169,863 | |
| | | | | | | | |
| | | | | | | 96,130,721 | |
| | | | | | | | |
| | | | Transportation Services — 0.1% | |
| | 10,503,000 | | | APL Ltd., 8.000%, 1/15/2024(d)(f) | | | 9,452,700 | |
| | | | | | | | |
See accompanying notes to financial statements.
35 |
Portfolio of Investments – as of September 30, 2018
Loomis Sayles Strategic Income Fund – (continued)
| | | | | | | | |
Principal
Amount (‡) | | | Description | | Value (†) | |
| | | | Treasuries — 18.4% | |
| | 312,000,000 | | | Canadian Government International Bond, 0.750%, 9/01/2020, (CAD) | | $ | 234,974,056 | |
| | 80,645,000 | | | Canadian Government International Bond, 1.750%, 9/01/2019, (CAD) | | | 62,277,058 | |
| | 1,010,000 | | | Hellenic Republic Government Bond, Series PSI, (Step to 3.650% on 2/24/2020), 3.000%, 2/24/2024, (EUR)(l) | | | 1,162,209 | |
| | 1,100,000 | | | Hellenic Republic Government Bond, Series PSI, (Step to 3.650% on 2/24/2020), 3.000%, 2/24/2035, (EUR)(l) | | | 1,099,147 | |
| | 4,000,000 | | | Hellenic Republic Government Bond, Series PSI, (Step to 3.650% on 2/24/2020), 3.000%, 2/24/2036, (EUR)(l) | | | 3,947,934 | |
| | 4,455,000 | | | Hellenic Republic Government Bond, Series PSI, (Step to 3.650% on 2/24/2020), 3.000%, 2/24/2037, (EUR)(l) | | | 4,359,257 | |
| | 5,820,000 | | | Hellenic Republic Government Bond, Series PSI, (Step to 3.650% on 2/24/2020), 3.000%, 2/24/2038, (EUR)(l) | | | 5,641,769 | |
| | 4,000,000 | | | Hellenic Republic Government Bond, Series PSI, (Step to 3.650% on 2/24/2020), 3.000%, 2/24/2039, (EUR)(l) | | | 3,872,178 | |
| | 4,680,000 | | | Hellenic Republic Government Bond, Series PSI, (Step to 3.650% on 2/24/2020), 3.000%, 2/24/2040, (EUR)(l) | | | 4,513,859 | |
| | 5,970,000 | | | Hellenic Republic Government Bond, Series PSI, (Step to 3.650% on 2/24/2020), 3.000%, 2/24/2041, (EUR)(l) | | | 5,767,012 | |
| | 4,000,000 | | | Hellenic Republic Government Bond, Series PSI, (Step to 3.650% on 2/24/2020), 3.000%, 2/24/2042, (EUR)(l) | | | 3,874,843 | |
| | 1,605,660,000 | | | Iceland Government International Bond, 7.250%, 10/26/2022, (ISK) | | | 13,185,082 | |
| | 4,496,156,000 | | | Iceland Government International Bond, 8.750%, 2/26/2019, (ISK) | | | 35,387,188 | |
| | 10,000,000(†††) | | | Mexican Fixed Rate Bonds, Series M, 5.750%, 3/05/2026, (MXN) | | | 47,130,491 | |
| | 9,930,439(†††) | | | Mexican Fixed Rate Bonds, Series M, 6.500%, 6/10/2021, (MXN) | | | 51,444,705 | |
| | 4,250,000(†††) | | | Mexican Fixed Rate Bonds, Series M, 7.750%, 5/29/2031, (MXN) | | | 22,220,864 | |
| | 7,740,000(†††) | | | Mexican Fixed Rate Bonds, Series M-20, 7.500%, 6/03/2027, (MXN) | | | 40,244,360 | |
| | 27,224,481(†††) | | | Mexican Fixed Rate Bonds, Series M-20, 8.000%, 12/07/2023, (MXN) | | | 146,893,489 | |
| | 3,035,000(†††) | | | Mexican Fixed Rate Bonds, Series M-20, 8.500%, 5/31/2029, (MXN) | | | 16,825,810 | |
| | 21,700,000(†††) | | | Mexican Fixed Rate Bonds, Series M-20, 10.000%, 12/05/2024, (MXN) | | | 128,516,319 | |
| | 252,700,000 | | | New Zealand Government Bond, 5.000%, 3/15/2019, (NZD) | | | 170,010,199 | |
| | 175,365,000 | | | New Zealand Government Bond, 6.000%, 5/15/2021, (NZD) | | | 128,738,536 | |
| | 458,725,000 | | | Norway Government Bond, 3.750%, 5/25/2021, 144A, (NOK) | | | 59,998,496 | |
| | 658,049,000 | | | Norway Government Bond, 4.500%, 5/22/2019, 144A, (NOK) | | | 82,746,766 | |
| | 162,850,000 | | | Republic of Brazil, 8.500%, 1/05/2024, (BRL) | | | 39,214,972 | |
| | 55,925,000 | | | Republic of Brazil, 10.250%, 1/10/2028, (BRL) | | | 14,522,872 | |
| | 250,000,000 | | | U.S. Treasury Note, 1.000%, 11/30/2018 | | | 249,523,303 | |
| | | | | | | | |
| | | | | | | 1,578,092,774 | |
| | | | | | | | |
| | | | Wireless — 1.3% | |
| | 293,000,000 | | | America Movil SAB de CV, 6.450%, 12/05/2022, (MXN) | | | 14,351,113 | |
| | 134,600,000 | | | America Movil SAB de CV, 8.460%, 12/18/2036, (MXN) | | | 6,293,748 | |
| | 49,955,000 | | | Sprint Capital Corp., 6.875%, 11/15/2028 | | | 50,204,775 | �� |
| | 6,260,000 | | | Sprint Capital Corp., 8.750%, 3/15/2032 | | | 7,042,500 | |
| | 21,052,000 | | | Sprint Communications, Inc., 6.000%, 11/15/2022 | | | 21,473,040 | |
| | 8,200,000 | | | Sprint Corp., 7.125%, 6/15/2024 | | | 8,507,500 | |
| | 4,727,000 | | | Sprint Corp., 7.250%, 9/15/2021 | | | 4,998,802 | |
| | | | | | | | |
| | | | | | | 112,871,478 | |
| | | | | | | | |
See accompanying notes to financial statements.
| 36
Portfolio of Investments – as of September 30, 2018
Loomis Sayles Strategic Income Fund – (continued)
| | | | | | | | |
Principal
Amount (‡) | | | Description | | Value (†) | |
| | | | Wirelines — 3.8% | |
| | 4,370,000 | | | Bell Canada, Inc., MTN, 6.550%, 5/01/2029, 144A, (CAD) | | $ | 4,096,091 | |
| | 7,545,000 | | | Bell Canada, Inc., Series M-17, 6.100%, 3/16/2035, (CAD) | | | 7,068,987 | |
| | 1,240,000 | | | CenturyLink, Inc., 5.625%, 4/01/2025 | | | 1,212,472 | |
| | 7,410,000 | | | CenturyLink, Inc., Series G, 6.875%, 1/15/2028 | | | 7,114,341 | |
| | 1,800,000 | | | CenturyLink, Inc., Series P, 7.600%, 9/15/2039 | | | 1,606,500 | |
| | 28,385,000 | | | CenturyLink, Inc., Series S, 6.450%, 6/15/2021 | | | 29,449,437 | |
| | 7,940,000 | | | CenturyLink, Inc., Series W, 6.750%, 12/01/2023 | | | 8,247,675 | |
| | 350,000 | | | Cincinnati Bell Telephone Co. LLC, 6.300%, 12/01/2028 | | | 327,250 | |
| | 3,620,000 | | | Cincinnati Bell, Inc., 7.000%, 7/15/2024, 144A | | | 3,321,350 | |
| | 22,335,000 | | | Cincinnati Bell, Inc., 8.000%, 10/15/2025, 144A | | | 20,827,387 | |
| | 8,581,000 | | | Consolidated Communications, Inc., 6.500%, 10/01/2022 | | | 8,109,045 | |
| | 3,200,000 | | | Embarq Corp., 7.995%, 6/01/2036 | | | 3,200,000 | |
| | 18,725,000 | | | Frontier Communications Corp., 6.875%, 1/15/2025 | | | 11,381,617 | |
| | 38,336,000 | | | Frontier Communications Corp., 7.875%, 1/15/2027 | | | 22,426,560 | |
| | 25,745,000 | | | Level 3 Parent LLC, 5.750%, 12/01/2022 | | | 26,039,780 | |
| | 42,460,000 | | | Qwest Capital Funding, Inc., 6.875%, 7/15/2028 | | | 39,373,158 | |
| | 12,463,000 | | | Qwest Capital Funding, Inc., 7.625%, 8/03/2021 | | | 12,883,502 | |
| | 25,945,000 | | | Qwest Capital Funding, Inc., 7.750%, 2/15/2031 | | | 24,096,419 | |
| | 26,401,000 | | | Qwest Corp., 6.875%, 9/15/2033 | | | 26,254,488 | |
| | 30,646,000 | | | Telecom Italia Capital S.A., 6.000%, 9/30/2034 | | | 29,190,315 | |
| | 16,440,000 | | | Telecom Italia Capital S.A., 6.375%, 11/15/2033 | | | 16,111,200 | |
| | 14,223,000 | | | Verizon Communications, Inc., 4.329%, 9/21/2028, 144A | | | 14,294,826 | |
| | 6,309,000 | | | Windstream Services LLC/Windstream Finance Corp., 9.000%, 6/30/2025, 144A | | | 4,873,703 | |
| | 8,865,000 | | | Windstream Services LLC/Windstream Finance Corp., 10.500%, 6/30/2024, 144A | | | 7,535,250 | |
| | | | | | | | |
| | | | | | | 329,041,353 | |
| | | | | | | | |
| | | | Total Non-Convertible Bonds
(Identified Cost $5,919,807,058) | | | 5,455,073,366 | |
| | | | | | | | |
| | | | | | | | |
| | Convertible Bonds — 4.3% | |
| | | | Building Materials — 0.2% | |
| | 16,682,000 | | | KB Home, 1.375%, 2/01/2019 | | | 16,929,377 | |
| | | | | | | | |
| | | | Cable Satellite — 1.7% | |
| | 14,660,000 | | | DISH Network Corp., 2.375%, 3/15/2024 | | | 12,993,656 | |
| | 138,515,000 | | | DISH Network Corp., 3.375%, 8/15/2026 | | | 132,110,898 | |
| | | | | | | | |
| | | | | | | 145,104,554 | |
| | | | | | | | |
| | | | Chemicals — 0.1% | |
| | 4,135,000 | | | RPM International, Inc., 2.250%, 12/15/2020 | | | 5,091,012 | |
| | | | | | | | |
| | | | Healthcare — 0.1% | |
| | 8,835,000 | | | Evolent Health, Inc., 2.000%, 12/01/2021 | | | 11,868,206 | |
| | | | | | | | |
| | | | Independent Energy — 0.4% | |
| | 31,000,000 | | | Chesapeake Energy Corp., 5.500%, 9/15/2026 | | | 30,620,157 | |
| | 6,625,000 | | | Whiting Petroleum Corp., 1.250%, 4/01/2020 | | | 6,353,713 | |
| | | | | | | | |
| | | | | | | 36,973,870 | |
| | | | | | | | |
See accompanying notes to financial statements.
37 |
Portfolio of Investments – as of September 30, 2018
Loomis Sayles Strategic Income Fund – (continued)
| | | | | | | | |
Principal
Amount (‡) | | | Description | | Value (†) | |
| | | | Leisure — 0.3% | |
| $ | 27,795,000 | | | Rovi Corp., 0.500%, 3/01/2020 | | $ | 26,213,743 | |
| | | | | | | | |
| | | | Midstream — 0.1% | |
| | 10,955,000 | | | SM Energy Co., 1.500%, 7/01/2021 | | | 11,991,255 | |
| | | | | | | | |
| | | | Pharmaceuticals — 0.0% | |
| | 1,655,000 | | | BioMarin Pharmaceutical, Inc., 1.500%, 10/15/2020 | | | 1,985,343 | |
| | | | | | | | |
| | | | REITs – Mortgage — 0.2% | |
| | 14,245,000 | | | iStar, Inc., 3.125%, 9/15/2022, 144A | | | 13,848,077 | |
| | | | | | | | |
| | | | Technology — 1.2% | |
| | 10,415,000 | | | Booking Holdings, Inc., 0.900%, 9/15/2021 | | | 12,356,856 | |
| | 5,009,424 | | | Liberty Interactive LLC, 3.500%, 1/15/2031 | | | 6,509,055 | |
| | 23,990,000 | | | Nuance Communications, Inc., 1.000%, 12/15/2035 | | | 22,642,481 | |
| | 11,265,000 | | | Nuance Communications, Inc., 1.250%, 4/01/2025 | | | 11,634,267 | |
| | 39,710,000 | | | Nuance Communications, Inc., 1.500%, 11/01/2035 | | | 40,235,006 | |
| | 5,205,000 | | | Western Digital Corp., 1.500%, 2/01/2024, 144A | | | 4,816,556 | |
| | | | | | | | |
| | | | | | | 98,194,221 | |
| | | | | | | | |
| | | | Total Convertible Bonds
(Identified Cost $365,365,365) | | | 368,199,658 | |
| | | | | | | | |
| | | | | | | | |
| | Municipals — 1.6% | |
| | | | District of Columbia — 0.1% | |
| | 3,850,000 | | | Metropolitan Washington Airports Authority, Series D, 8.000%, 10/01/2047 | | | 5,206,971 | |
| | | | | | | | |
| | | | Illinois — 0.2% | |
| | 17,570,000 | | | State of Illinois, 5.100%, 6/01/2033 | | | 16,862,808 | |
| | | | | | | | |
| | | | Michigan — 0.1% | |
| | 8,930,000 | | | Michigan Tobacco Settlement Finance Authority Taxable Turbo, Series A, 7.309%, 6/01/2034 | | | 9,046,358 | |
| | | | | | | | |
| | | | Puerto Rico — 0.4% | |
| | 63,900,000 | | | Commonwealth of Puerto Rico, GO, Refunding, Series A, 8.000%, 7/01/2035(h) | | | 36,982,125 | |
| | | | | | | | |
| | | | Virginia — 0.8% | |
| | 69,695,000 | | | Virginia Tobacco Settlement Financing Corp., Series A-1, 6.706%, 6/01/2046 | | | 69,088,653 | |
| | | | | | | | |
| | | | Total Municipals
(Identified Cost $150,510,547) | | | 137,186,915 | |
| | | | | | | | |
| | | | | | | | |
| | | | Total Bonds and Notes
(Identified Cost $6,435,682,970) | | | 5,960,459,939 | |
| | | | | | | | |
| | | | | | | | |
| | Loan Participations — 0.1% | |
| | | | ABS Other — 0.1% | |
| | 8,736,971 | | | Rise Ltd., Series 2014-1, Class B, 6.500%, 2/15/2039 (a)(k) (Identified Cost $8,802,498) | | | 8,343,807 | |
| | | | | | | | |
| | | | | | | | |
See accompanying notes to financial statements.
| 38
Portfolio of Investments – as of September 30, 2018
Loomis Sayles Strategic Income Fund – (continued)
| | | | | | | | |
Principal
Amount (‡) | | | Description | | Value (†) | |
| | Senior Loans — 1.1% | |
| | | | Chemicals — 0.4% | |
| $ | 31,355,000 | | | Houghton International, Inc., New 2nd Lien Term Loan, 1-month LIBOR + 8.500%, 10.742%, 12/20/2020(g) | | $ | 31,315,806 | |
| | | | | | | | |
| | | | Construction Machinery — 0.4% | |
| | 21,276,992 | | | Onsite Rental Group Pty Ltd., Notes, 6.100%, 10/26/2023, 144A(c)(d)(f) | | | 16,383,284 | |
| | 15,562,263 | | | Onsite Rental Group Pty Ltd., Term Loan B, 1-month LIBOR + 4.500%, 6.716%, 10/26/2022(g) | | | 15,251,017 | |
| | | | | | | | |
| | | | | | | 31,634,301 | |
| | | | | | | | |
| | | | Financial Other — 0.2% | |
| | 12,682,801 | | | DBRS Ltd., Term Loan, 3-month LIBOR + 5.250%, 7.563%, 3/04/2022(g) | | | 12,698,654 | |
| | | | | | | | |
| | | | Natural Gas — 0.0% | |
| | 1,531,886 | | | Southcross Holdings Borrower LP, Exit Term Loan B, 5.500% PIK, 3.500% Cash, 4/13/2023(m) | | | 1,424,654 | |
| | | | | | | | |
| | | | Oil Field Services — 0.0% | |
| | 2,858,066 | | | Petroleum Geo-Services ASA, New Term Loan B, 3-month LIBOR + 2.500%, 4.886%, 3/19/2021(g) | | | 2,759,835 | |
| | | | | | | | |
| | | | Retailers — 0.0% | |
| | 2,614,748 | | | Toys “R” Us Property Co. I LLC, New Term Loan B, 1-month LIBOR + 5.000%, 7.242%, 8/21/2019(g)(h) | | | 2,244,316 | |
| | | | | | | | |
| | | | Technology — 0.1% | |
| | 9,507,380 | | | IQOR U.S., Inc., 2nd Lien Term Loan, 3-month LIBOR + 8.750%, 11.087%, 4/01/2022(g) | | | 7,244,624 | |
| | | | | | | | |
| | | | Transportation Services — 0.0% | |
| | 2,918,811 | | | OSG Bulk Ships, Inc., OBS Term Loan, 3-month LIBOR + 4.250%, 6.770%, 8/05/2019(g) | | | 2,887,813 | |
| | | | | | | | |
| | | | Total Senior Loans
(Identified Cost $100,408,252) | | | 92,210,003 | |
| | | | | | | | |
| | | | | | | | |
| Shares | | | | | | |
| | Common Stocks — 5.3% | |
| | | | Aerospace & Defense — 0.4% | |
| | 1,423,650 | | | Arconic, Inc. | | | 31,334,536 | |
| | | | | | | | |
| | | | Diversified Telecommunication Services — 0.0% | |
| | 145,667 | | | Cincinnati Bell, Inc.(e) | | | 2,323,389 | |
| | | | | | | | |
| | | | Media — 0.0% | |
| | 303,043 | | | Dex Media, Inc.(c)(e) | | | 3,181,952 | |
| | | | | | | | |
| | | | Oil, Gas & Consumable Fuels — 0.2% | |
| | 1,514 | | | Southcross Holdings LP, Class A(c)(e) | | | 340,650 | |
| | 1,514 | | | Southcross Holdings Group LLC(c)(e) | | | — | |
| | 225,503 | | | Paragon Offshore Ltd., Litigation Units, Class B(c)(e) | | | 8,738,241 | |
| | 156,902 | | | Paragon Offshore Ltd., Litigation Units, Class A(c)(e) | | | 126,777 | |
| | 5,886 | | | Frontera Energy Corp.(e) | | | 83,210 | |
| | 846,398 | | | Chesapeake Energy Corp.(e) | | | 3,800,327 | |
| | | | | | | | |
| | | | | | | 13,089,205 | |
| | | | | | | | |
See accompanying notes to financial statements.
39 |
Portfolio of Investments – as of September 30, 2018
Loomis Sayles Strategic Income Fund – (continued)
| | | | | | | | |
Shares | | | Description | | Value (†) | |
| | | | Pharmaceuticals — 4.7% | |
| | 6,514,190 | | | Bristol-Myers Squibb Co. | | $ | 404,400,915 | |
| | | | | | | | |
| | | | Specialty Retail — 0.0% | |
| | 11,662,687 | | | Onsite Rental Group Pty Ltd.(a)(b)(c)(d)(e) | | | — | |
| | | | | | | | |
| | | | Total Common Stocks
(Identified Cost $248,231,757) | | | 454,329,997 | |
| | | | | | | | |
| | | | | | | | |
| | Preferred Stocks — 1.8% | |
| | Convertible Preferred Stocks — 1.7% | |
| | | | Banking — 0.3% | |
| | 19,062 | | | Bank of America Corp., Series L, 7.250% | | | 24,670,994 | |
| | | | | | | | |
| | | | Communications — 0.0% | |
| | 10,483 | | | Cincinnati Bell, Inc., Series B, 6.750% | | | 513,772 | |
| | | | | | | | |
| | | | Energy — 0.1% | |
| | 242,297 | | | El Paso Energy Capital Trust I, 4.750% | | | 11,385,536 | |
| | | | | | | | |
| | | | Independent Energy — 0.5% | |
| | 172,972 | | | Chesapeake Energy Corp., 4.500% | | | 9,323,191 | |
| | 231,033 | | | Chesapeake Energy Corp., 5.000% | | | 14,238,564 | |
| | 32,522 | | | Chesapeake Energy Corp., Series A, 5.750%, 144A | | | 19,475,035 | |
| | | | | | | | |
| | | | | | | 43,036,790 | |
| | | | | | | | |
| | | | Midstream — 0.5% | |
| | 18,957 | | | Chesapeake Energy Corp., 5.750% | | | 11,351,954 | |
| | 43,178 | | | Chesapeake Energy Corp., 5.750%, 144A | | | 27,162,852 | |
| | 6,017 | | | Chesapeake Energy Corp., 5.750% | | | 3,785,235 | |
| | | | | | | | |
| | | | | | | 42,300,041 | |
| | | | | | | | |
| | | | REITs – Health Care — 0.1% | |
| | 116,700 | | | Welltower, Inc., Series I, 6.500% | | | 7,062,684 | |
| | | | | | | | |
| | | | REITs – Mortgage — 0.2% | |
| | 325,207 | | | iStar, Inc., Series J, 4.500% | | | 15,437,576 | |
| | | | | | | | |
| | | | Total Convertible Preferred Stocks
(Identified Cost $165,100,758) | | | 144,407,393 | |
| | | | | | | | |
| | | | | | | | |
| | Non-Convertible Preferred Stocks — 0.1% | |
| | | | Finance Companies — 0.0% | |
| | 10,425 | | | iStar, Inc., Series G, 7.650% | | | 253,432 | |
| | | | | | | | |
| | | | Home Construction — 0.0% | |
| | 208,246 | | | Hovnanian Enterprises, Inc., 7.625%(e) | | | 1,145,353 | |
| | | | | | | | |
| | | | REITs – Office Property — 0.0% | |
| | 1,596 | | | Highwoods Realty LP, Series A, 8.625% | | | 1,915,200 | |
| | | | | | | | |
See accompanying notes to financial statements.
| 40
Portfolio of Investments – as of September 30, 2018
Loomis Sayles Strategic Income Fund – (continued)
| | | | | | | | |
Shares | | | Description | | Value (†) | |
| | | | REITs – Warehouse/Industrials — 0.1% | |
| | 116,192 | | | ProLogis, Inc., Series Q, 8.540% | | $ | 7,436,288 | |
| | | | | | | | |
| | | | Total Non-Convertible Preferred Stocks
(Identified Cost $8,540,569) | | | 10,750,273 | |
| | | | | | | | |
| | | | | | | | |
| | | | Total Preferred Stocks
(Identified Cost $173,641,327) | | | 155,157,666 | |
| | | | | | | | |
| | | | | | | | |
| | Closed-End Investment Companies — 0.0% | |
| | 170,282 | | | NexPoint Strategic Opportunities Fund (Identified Cost $10,230,310) | | | 3,814,317 | |
| | | | | | | | |
| | | | | | | | |
Principal
Amount (‡) | | | | | | |
| | Short-Term Investments — 17.3% | |
| $ | 124,969,685 | | | Tri-Party Repurchase Agreement with Fixed Income Clearing Corporation, dated 9/28/2018 at 1.300% to be repurchased at $124,983,223 on 10/01/2018 collateralized by $128,080,000 U.S. Treasury Bond, 3.125% due 8/15/2044 valued at $127,208,031; $275,000 U.S. Treasury Note, 2.000% due 10/31/2022 valued at $267,265 including accrued interest (Note 2 of Notes to Financial Statements) | | | 124,969,685 | |
| | 300,000,000 | | | U.S. Treasury Bills, 1.980% - 1.985%, 11/01/2018(n)(o) | | | 299,467,188 | |
| | 208,000,000 | | | U.S. Treasury Bills, 1.995%, 11/08/2018(n) | | | 207,545,520 | |
| | 400,000,000 | | | U.S. Treasury Bills, 2.030% - 2.047%, 11/15/2018(n)(o) | | | 398,959,376 | |
| | 100,000,000 | | | U.S. Treasury Bills, 2.060%, 11/29/2018(n) | | | 99,652,146 | |
| | 89,275,000 | | | U.S. Treasury Bills, 2.075%, 10/18/2018(n) | | | 89,187,839 | |
| | 80,000,000 | | | U.S. Treasury Bills, 2.081% - 2.086%, 12/06/2018(n)(o) | | | 79,687,966 | |
| | 25,000,000 | | | U.S. Treasury Bills, 2.118%, 12/20/2018(n) | | | 24,881,736 | |
| | 10,725,000 | | | U.S. Treasury Bills, 2.140%, 12/27/2018(n) | | | 10,669,210 | |
| | 150,000,000 | | | U.S. Treasury Bills, 2.160% - 2.200%, 4/25/2019(n)(o) | | | 147,989,354 | |
| | | | | | | | |
| | | | Total Short-Term Investments
(Identified Cost $1,483,233,210) | | | 1,483,010,020 | |
| | | | | | | | |
| | | | | | | | |
| | | | Total Investments — 95.2%
(Identified Cost $8,460,230,324) | | | 8,157,325,749 | |
| | | | Other assets less liabilities — 4.8% | | | 410,518,873 | |
| | | | | | | | |
| | | | Net Assets — 100.0% | | $ | 8,567,844,622 | |
| | | | | | | | |
| | | | | | | | |
| | (‡) | | | Principal Amount stated in U.S. dollars unless otherwise noted. | | | | |
| | (†) | | | See Note 2 of Notes to Financial Statements. | | | | |
| | (††) | | | Amount shown represents units. One unit represents a principal amount of 25. | |
| | (†††) | | | Amount shown represents units. One unit represents a principal amount of 100. | |
| | (a) | | | Level 3 security. Value has been determined using significant unobservable inputs. See Note 3 of Notes to Financial Statements. | |
| | (b) | | | Fair valued by the Fund’s adviser. At September 30, 2018, the value of these securities amounted to $20,684,320 or 0.2% of net assets. See Note 2 of Notes to Financial Statements. | |
See accompanying notes to financial statements.
41 |
Portfolio of Investments – as of September 30, 2018
Loomis Sayles Strategic Income Fund – (continued)
| | | | | | | | |
| | | | | | | | |
| | (c) | | | Securities subject to restriction on resale. At September 30, 2018, the restricted securities held by the Fund are as follows: | |
| | | | | | | | | | | | | | |
| | | | | | | | | | | | | | |
| | | Acquisition
Date | | Acquisition
Cost | | | Value | | | % of
Net Assets | |
| Dex Media, Inc. | | August 12, 2016 | | $ | 1,476,220 | | | $ | 3,181,952 | | | | Less than 0.1% | |
| GCA2014 Holdings Ltd., Series 2014-1, Class C | | December 18, 2014 | | | 21,396,647 | | | | 17,108,727 | | | | 0.2% | |
| GCA2014 Holdings Ltd., Series 2014-1, Class D | | December 18, 2014 | | | 8,494,926 | | | | 3,571,492 | | | | Less than 0.1% | |
| GCA2014 Holdings Ltd., Series 2014-1, Class E | | December 18, 2014 | | | 32,732,982 | | | | — | | | | — | |
| Onsite Rental Group Pty Ltd., Notes | | October 26, 2017 | | | 15,666,497 | | | | 16,383,284 | | | | 0.2% | |
| Onsite Rental Group Pty Ltd. | | October 26, 2017 | | | — | | | | — | | | | — | |
| Paragon Offshore Ltd., Litigation Units Class A | | July 18, 2017 | | | 1,167,146 | | | | 126,777 | | | | Less than 0.1% | |
| Paragon Offshore Ltd., Litigation Units Class B | | July 18, 2017 | | | 22,768,653 | | | | 8,738,241 | | | | 0.1% | |
| Southcross Holdings Group LLC | | April 29, 2016 | | | — | | | | — | | | | — | |
| Southcross Holdings LP, Class A | | April 29, 2016 | | | 2,215,133 | | | | 340,650 | | | | Less than 0.1% | |
| | | | | | | | | | | | | | |
| | | | | | | | |
| | (d) | | | Illiquid security. (Unaudited) | | | | |
| | (e) | | | Non-income producing security. | | | | |
| | (f) | | | Securities classified as fair valued pursuant to the Fund’s pricing policies and procedures. At September 30, 2018, the value of these securities amounted to $116,214,631 or 1.4% of net assets. See Note 2 of Notes to Financial Statements. | |
| | (g) | | | Variable rate security. Rate as of September 30, 2018 is disclosed. | |
| | (h) | | | The issuer is in default with respect to interest and/or principal payments. Income is not being accrued. | |
| | (i) | | | Payment-in-kind security for which the issuer has the option at each interest payment date of making interest payments in cash or additional principal. | |
| | (j) | | | Perpetual bond with no specified maturity date. | |
| | (k) | | | Variable rate security. The interest rate adjusts periodically based on; (i) changes in current interest rates and/or prepayments on underlying pools of assets, if applicable, (ii) reference to a base lending rate plus or minus a margin, and/or (iii) reference to a base lending rate adjusted by a multiplier and/or subject to certain floors or caps. Rate as of September 30, 2018 is disclosed. | |
| | (l) | | | Coupon rate is a fixed rate for an initial period then resets at a specified date and rate. | |
| | (m) | | | Payment-in-kind security for which the issuer has the option at each interest payment date of making interest payments in cash or additional principal. For the period ended September 30, 2018, interest payments were made in cash and principal. | |
| | (n) | | | Interest rate represents discount rate at time of purchase; not a coupon rate. | |
| | (o) | | | The Fund’s investment in U.S. Government/Agency securities is comprised of various lots with differing discount rates. These separate investments, which have the same maturity date, have been aggregated for the purpose of presentation in the Portfolio of Investments. | |
| | | | | |
| | 144A | | | All or a portion of these securities are exempt from registration under Rule 144A of the Securities Act of 1933. These securities may be resold in transactions exempt from registration, normally to qualified institutional buyers. At September 30, 2018, the value of Rule 144A holdings amounted to $1,296,739,034 or 15.1% of net assets. | |
| | ABS | | | Asset-Backed Securities | | | | |
| | EMTN | | | Euro Medium Term Note | | | | |
| | GMTN | | | Global Medium Term Note | | | | |
| | GO | | | General Obligation | | | | |
| | LIBOR | | | London Interbank Offered Rate | | | | |
See accompanying notes to financial statements.
| 42
Portfolio of Investments – as of September 30, 2018
Loomis Sayles Strategic Income Fund – (continued)
| | | | | | | | |
| | | | | | | | |
| | MBIA | | | Municipal Bond Investors Assurance Corp. | | | | |
| | MTN | | | Medium Term Note | | | | |
| | PIK | | | Payment-in-Kind | | | | |
| | REITs | | | Real Estate Investment Trusts | | | | |
| | | | | | | | |
| | AUD | | | Australian Dollar | | | | |
| | BRL | | | Brazilian Real | | | | |
| | CAD | | | Canadian Dollar | | | | |
| | EUR | | | Euro | | | | |
| | ISK | | | Icelandic Krona | | | | |
| | MXN | | | Mexican Peso | | | | |
| | NOK | | | Norwegian Krone | | | | |
| | NZD | | | New Zealand Dollar | | | | |
Industry Summary at September 30, 2018
| | | | |
Treasuries | | | 18.4 | % |
Banking | | | 5.2 | |
Independent Energy | | | 5.2 | |
Pharmaceuticals | | | 4.7 | |
Wirelines | | | 3.8 | |
Finance Companies | | | 3.4 | |
Healthcare | | | 3.3 | |
Cable Satellite | | | 3.0 | |
Airlines | | | 2.8 | |
Oil Field Services | | | 2.6 | |
Chemicals | | | 2.5 | |
Technology | | | 2.4 | |
Other Investments, less than 2% each | | | 20.6 | |
Short-Term Investments | | | 17.3 | |
| | | | |
Total Investments | | | 95.2 | |
Other assets less liabilities | | | 4.8 | |
| | | | |
Net Assets | | | 100.0 | % |
| | | | |
Currency Exposure Summary at September 30, 2018
| | | | |
United States Dollar | | | 74.5 | % |
Mexican Peso | | | 5.6 | |
Canadian Dollar | | | 4.9 | |
New Zealand Dollar | | | 4.2 | |
Australian Dollar | | | 2.7 | |
Other, less than 2% each | | | 3.3 | |
| | | | |
Total Investments | | | 95.2 | |
Other assets less liabilities | | | 4.8 | |
| | | | |
Net Assets | | | 100.0 | % |
| | | | |
See accompanying notes to financial statements.
43 |
This Page Intentionally Left Blank
| 44
Statements of Assets and Liabilities
September 30, 2018
| | | | | | | | |
| | | Investment
Grade Bond
Fund | | | Strategic
Income
Fund | |
ASSETS | |
Investments at cost | | $ | 5,203,133,626 | | | $ | 8,460,230,324 | |
Net unrealized depreciation | | | (51,873,885 | ) | | | (302,904,575 | ) |
| | | | | | | | |
Investments at value | | | 5,151,259,741 | | | | 8,157,325,749 | |
Cash | | | 10 | | | | — | |
Foreign currency at value (identified cost $46,611 and $43,217, respectively) | | | 56,426 | | | | 43,619 | |
Receivable for Fund shares sold | | | 10,809,496 | | | | 11,644,039 | |
Receivable for securities sold | | | 363,336,542 | | | | 311,864,792 | |
Dividends and interest receivable | | | 44,865,535 | | | | 112,740,960 | |
Tax reclaims receivable | | | — | | | | 926,106 | |
Prepaid expenses (Note 8) | | | 6,226 | | | | 9,281 | |
| | | | | | | | |
TOTAL ASSETS | | | 5,570,333,976 | | | | 8,594,554,546 | |
| | | | | | | | |
LIABILITIES | |
Payable for securities purchased | | | 1,363,902 | | | | 1,428,285 | |
Payable for Fund shares redeemed | | | 7,315,775 | | | | 11,424,083 | |
Payable to custodian bank (Note 7) | | | — | | | | 7,666,023 | |
Management fees payable (Note 5) | | | 1,709,008 | | | | 3,965,681 | |
Deferred Trustees’ fees (Note 5) | | | 752,029 | | | | 1,341,883 | |
Administrative fees payable (Note 5) | | | 199,407 | | | | 308,271 | |
Payable to distributor (Note 5d) | | | 45,879 | | | | 85,632 | |
Other accounts payable and accrued expenses | | | 372,685 | | | | 490,066 | |
| | | | | | | | |
TOTAL LIABILITIES | | | 11,758,685 | | | | 26,709,924 | |
| | | | | | | | |
NET ASSETS | | $ | 5,558,575,291 | | | $ | 8,567,844,622 | |
| | | | | | | | |
NET ASSETS CONSIST OF: | |
Paid-in capital | | $ | 5,621,673,484 | | | $ | 8,913,607,644 | |
Accumulated loss | | | (63,098,193 | ) | | | (345,763,022 | ) |
| | | | | | | | |
NET ASSETS | | $ | 5,558,575,291 | | | $ | 8,567,844,622 | |
| | | | | | | | |
See accompanying notes to financial statements.
45 |
Statements of Assets and Liabilities (continued)
September 30, 2018
| | | | | | | | |
| | | Investment
Grade Bond
Fund | | | Strategic
Income
Fund | |
COMPUTATION OF NET ASSET VALUE AND OFFERING PRICE: | | | | | | | | |
Class A shares: | |
Net assets | | $ | 777,390,942 | | | $ | 1,986,300,178 | |
| | | | | | | | |
Shares of beneficial interest | | | 70,791,620 | | | | 138,005,516 | |
| | | | | | | | |
Net asset value and redemption price per share | | $ | 10.98 | | | $ | 14.39 | |
| | | | | | | | |
Offering price per share (100/95.75 of net asset value) (Note 1) | | $ | 11.47 | | | $ | 15.03 | |
| | | | | | | | |
Class C shares: (redemption price per share is equal to net asset value less any applicable contingent deferred sales charge) (Note 1) | | | | | | | | |
Net assets | | $ | 412,788,060 | | | $ | 1,153,852,571 | |
| | | | | | | | |
Shares of beneficial interest | | | 38,015,198 | | | | 79,451,461 | |
| | | | | | | | |
Net asset value and offering price per share | | $ | 10.86 | | | $ | 14.52 | |
| | | | | | | | |
Class N shares: | |
Net assets | | $ | 1,251,189,264 | | | $ | 176,455,900 | |
| | | | | | | | |
Shares of beneficial interest | | | 113,924,091 | | | | 12,272,775 | |
| | | | | | | | |
Net asset value, offering and redemption price per share | | $ | 10.98 | | | $ | 14.38 | |
| | | | | | | | |
Class Y shares: | |
Net assets | | $ | 3,001,906,314 | | | $ | 5,118,015,616 | |
| | | | | | | | |
Shares of beneficial interest | | | 273,173,957 | | | | 355,984,348 | |
| | | | | | | | |
Net asset value, offering and redemption price per share | | $ | 10.99 | | | $ | 14.38 | |
| | | | | | | | |
Admin Class shares: | |
Net assets | | $ | 115,300,711 | | | $ | 133,220,357 | |
| | | | | | | | |
Shares of beneficial interest | | | 10,526,363 | | | | 9,288,294 | |
| | | | | | | | |
Net asset value, offering and redemption price per share | | $ | 10.95 | | | $ | 14.34 | |
| | | | | | | | |
See accompanying notes to financial statements.
| 46
Statements of Operations
For the Year Ended September 30, 2018
| | | | | | | | |
| | | Investment
Grade Bond
Fund | | | Strategic
Income
Fund | |
INVESTMENT INCOME | | | | | | | | |
Interest | | $ | 208,583,162 | | | $ | 394,395,051 | |
Dividends | | | 3,275,378 | | | | 25,705,582 | |
| | | | | | | | |
| | | 211,858,540 | | | | 420,100,633 | |
| | | | | | | | |
Expenses | |
Management fees (Note 5) | | | 24,064,905 | | | | 52,154,306 | |
Service and distribution fees (Note 5) | | | 7,990,970 | | | | 23,046,569 | |
Administrative fees (Note 5) | | | 2,648,877 | | | | 4,086,855 | |
Trustees’ fees and expenses (Note 5) | | | 233,306 | | | | 367,930 | |
Transfer agent fees and expenses (Notes 5 and 6) | | | 4,648,637 | | | | 7,446,568 | |
Audit and tax services fees | | | 63,525 | | | | 64,127 | |
Custodian fees and expenses | | | 267,227 | | | | 458,679 | |
Legal fees | | | 122,938 | | | | 187,305 | |
Registration fees | | | 258,232 | | | | 247,887 | |
Shareholder reporting expenses | | | 714,099 | | | | 752,767 | |
Miscellaneous expenses (Note 8) | | | 159,795 | | | | 259,883 | |
| | | | | | | | |
Total expenses | | | 41,172,511 | | | | 89,072,876 | |
Less waiver and/or expense reimbursement (Note 5) | | | (1,270,386 | ) | | | — | |
| | | | | | | | |
Net expenses | | | 39,902,125 | | | | 89,072,876 | |
| | | | | | | | |
Net investment income | | | 171,956,415 | | | | 331,027,757 | |
| | | | | | | | |
NET REALIZED AND UNREALIZED GAIN (LOSS) ON INVESTMENTS AND FOREIGN CURRENCY TRANSACTIONS | | | | | | | | |
Net realized gain (loss) on: | |
Investments | | | (64,668,766 | ) | | | 5,557,331 | |
Foreign currency transactions (Note 2c) | | | (4,121,375 | ) | | | (3,416,189 | ) |
Net change in unrealized appreciation (depreciation) on: | |
Investments | | | (88,563,612 | ) | | | (220,658,716 | ) |
Foreign currency translations (Note 2c) | | | 193,101 | | | | 59,675 | |
| | | | | | | | |
Net realized and unrealized loss on investments and foreign currency transactions | | | (157,160,652 | ) | | | (218,457,899 | ) |
| | | | | | | | |
NET INCREASE IN NET ASSETS RESULTING FROM OPERATIONS | | $ | 14,795,763 | | | $ | 112,569,858 | |
| | | | | | | | |
See accompanying notes to financial statements.
47 |
Statements of Changes in Net Assets
| | | | | | | | | | | | | | | | |
| | | Investment Grade Bond Fund | | | Strategic Income Fund | |
| | | Year Ended
September 30,
2018 | | | Year Ended
September 30,
2017 | | | Year Ended
September 30,
2018 | | | Year Ended
September 30,
2017 | |
FROM OPERATIONS: | | | | | | | | | | | | | | | | |
Net investment income | | $ | 171,956,415 | | | $ | 205,406,044 | | | $ | 331,027,757 | | | $ | 398,140,452 | |
Net realized gain (loss) on investments and foreign currency transactions | | | (68,790,141 | ) | | | 116,825,138 | | | | 2,141,142 | | | | 129,390,356 | |
Net change in unrealized appreciation (depreciation) on investments and foreign currency translations | | | (88,370,511 | ) | | | (91,129,640 | ) | | | (220,599,041 | ) | | | 172,652,000 | |
| | | | | | | | | | | | | | | | |
Net increase in net assets resulting from operations | | | 14,795,763 | | | | 231,101,542 | | | | 112,569,858 | | | | 700,182,808 | |
| | | | | | | | | | | | | | | | |
FROM DISTRIBUTIONS TO SHAREHOLDERS: | | | | | | | | | | | | | | | | |
Class A | | | (26,935,957 | ) | | | (60,689,574 | )(a) | | | (83,233,392 | ) | | | (129,973,495 | )(a) |
Class C | | | (15,654,049 | ) | | | (48,818,614 | )(a) | | | (65,182,313 | ) | | | (147,784,447 | )(a) |
Class N | | | (41,987,053 | ) | | | (22,304,558 | )(a) | | | (7,465,601 | ) | | | (8,302,607 | )(a) |
Class Y | | | (111,284,265 | ) | | | (262,616,392 | )(a) | | | (249,028,627 | ) | | | (319,830,876 | )(a) |
Admin Class | | | (778,851 | ) | | | (1,844,361 | )(a) | | | (5,735,653 | ) | | | (7,820,574 | )(a) |
| | | | | | | | | | | | | | | | |
Total distributions | | | (196,640,175 | ) | | | (396,273,499 | ) | | | (410,645,586 | ) | | | (613,711,999 | ) |
| | | | | | | | | | | | | | | | |
NET DECREASE IN NET ASSETS FROM CAPITAL SHARE TRANSACTIONS (NOTE 11) | | | (534,159,760 | ) | | | (345,835,758 | ) | | | (1,369,576,617 | ) | | | (1,423,618,832 | ) |
| | | | | | | | | | | | | | | | |
Net decrease in net assets | | | (716,004,172 | ) | | | (511,007,715 | ) | | | (1,667,652,345 | ) | | | (1,337,148,023 | ) |
NET ASSETS | | | | | | | | | | | | | | | | |
Beginning of the year | | | 6,274,579,463 | | | | 6,785,587,178 | | | | 10,235,496,967 | | | | 11,572,644,990 | |
| | | | | | | | | | | | | | | | |
End of the year | | $ | 5,558,575,291 | | | $ | 6,274,579,463 | | | $ | 8,567,844,622 | | | $ | 10,235,496,967 | |
| | | | | | | | | | | | | | | | |
| (a) | See Note 2e of Notes to Financial Statements. |
See accompanying notes to financial statements.
| 48
Financial Highlights
For a share outstanding throughout each period.
| | | | | | | | | | | | | | | | | | | | |
| | | Investment Grade Bond Fund—Class A | |
| | | Year Ended
September 30,
2018 | | | Year Ended
September 30,
2017 | | | Year Ended
September 30,
2016 | | | Year Ended
September 30,
2015 | | | Year Ended
September 30,
2014 | |
Net asset value, beginning of the period | | $ | 11.30 | | | $ | 11.59 | | | $ | 11.10 | | | $ | 12.11 | | | $ | 12.22 | |
| | | | | | | | | | | | | | | | | | | | |
INCOME (LOSS) FROM INVESTMENT OPERATIONS: | | | | | | | | | | | | | | | | | | | | |
Net investment income(a) | | | 0.30 | | | | 0.36 | | | | 0.39 | | | | 0.40 | | | | 0.46 | |
Net realized and unrealized gain (loss) | | | (0.28 | ) | | | 0.05 | | | | 0.48 | | | | (0.95 | ) | | | 0.26 | |
| | | | | | | | | | | | | | | | | | | | |
Total from Investment Operations | | | 0.02 | | | | 0.41 | | | | 0.87 | | | | (0.55 | ) | | | 0.72 | |
| | | | | | | | | | | | | | | | | | | | |
LESS DISTRIBUTIONS FROM: | | | | | | | | | | | | | | | | | | | | |
Net investment income | | | (0.21 | ) | | | (0.26 | ) | | | (0.23 | ) | | | (0.34 | ) | | | (0.51 | ) |
Net realized capital gains | | | (0.13 | ) | | | (0.44 | ) | | | (0.15 | ) | | | (0.12 | ) | | | (0.32 | ) |
| | | | | | | | | | | | | | | | | | | | |
Total Distributions | | | (0.34 | ) | | | (0.70 | ) | | | (0.38 | ) | | | (0.46 | ) | | | (0.83 | ) |
| | | | | | | | | | | | | | | | | | | | |
Net asset value, end of the period | | $ | 10.98 | | | $ | 11.30 | | | $ | 11.59 | | | $ | 11.10 | | | $ | 12.11 | |
| | | | | | | | | | | | | | | | | | | | |
Total return(b) | | | 0.19 | %(c) | | | 3.88 | % | | | 8.06 | % | | | (4.72 | )% | | | 6.04 | % |
RATIOS TO AVERAGE NET ASSETS: | | | | | | | | | | | | | | | | | | | | |
Net assets, end of the period (000’s) | | $ | 777,391 | | | $ | 902,955 | | | $ | 1,130,260 | | | $ | 1,628,216 | | | $ | 1,932,847 | |
Net expenses | | | 0.80 | %(d)(f) | | | 0.82 | %(e) | | | 0.85 | % | | | 0.83 | % | | | 0.83 | % |
Gross expenses | | | 0.82 | % | | | 0.82 | % | | | 0.85 | % | | | 0.83 | % | | | 0.83 | % |
Net investment income | | | 2.73 | % | | | 3.23 | % | | | 3.49 | % | | | 3.38 | % | | | 3.75 | % |
Portfolio turnover rate | | | 3 | % | | | 10 | % | | | 11 | % | | | 23 | % | | | 19 | % |
| (a) | Per share net investment income has been calculated using the average shares outstanding during the period. |
| (b) | A sales charge for Class A shares is not reflected in total return calculations. |
| (c) | Had certain expenses not been waived/reimbursed during the period, total returns would have been lower. |
| (d) | Effective July 1, 2018, the expense limit decreased to 0.78%. |
| (e) | Effective July 1, 2017, the expense limit decreased to 0.80%. |
| (f) | The investment adviser agreed to waive its fees and/or reimburse a portion of the Fund’s expenses during the period. Without this waiver/reimbursement, expenses would have been higher. |
See accompanying notes to financial statements.
49 |
Financial Highlights (continued)
For a share outstanding throughout each period.
| | | | | | | | | | | | | | | | | | | | |
| | | Investment Grade Bond Fund—Class C | |
| | | Year Ended
September 30,
2018 | | | Year Ended
September 30,
2017 | | | Year Ended
September 30,
2016 | | | Year Ended
September 30,
2015 | | | Year Ended
September 30,
2014 | |
Net asset value, beginning of the period | | $ | 11.19 | | | $ | 11.48 | | | $ | 11.00 | | | $ | 12.00 | | | $ | 12.11 | |
| | | | | | | | | | | | | | | | | | | | |
INCOME (LOSS) FROM INVESTMENT OPERATIONS: | | | | | | | | | | | | | | | | | | | | |
Net investment income(a) | | | 0.22 | | | | 0.27 | | | | 0.30 | | | | 0.31 | | | | 0.36 | |
Net realized and unrealized gain (loss) | | | (0.28 | ) | | | 0.06 | | | | 0.47 | | | | (0.94 | ) | | | 0.27 | |
| | | | | | | | | | | | | | | | | | | | |
Total from Investment Operations | | | (0.06 | ) | | | 0.33 | | | | 0.77 | | | | (0.63 | ) | | | 0.63 | |
| | | | | | | | | | | | | | | | | | | | |
LESS DISTRIBUTIONS FROM: | | | | | | | | | | | | | | | | | | | | |
Net investment income | | | (0.14 | ) | | | (0.18 | ) | | | (0.14 | ) | | | (0.25 | ) | | | (0.42 | ) |
Net realized capital gains | | | (0.13 | ) | | | (0.44 | ) | | | (0.15 | ) | | | (0.12 | ) | | | (0.32 | ) |
| | | | | | | | | | | | | | | | | | | | |
Total Distributions | | | (0.27 | ) | | | (0.62 | ) | | | (0.29 | ) | | | (0.37 | ) | | | (0.74 | ) |
| | | | | | | | | | | | | | | | | | | | |
Net asset value, end of the period | | $ | 10.86 | | | $ | 11.19 | | | $ | 11.48 | | | $ | 11.00 | | | $ | 12.00 | |
| | | | | | | | | | | | | | | | | | | | |
Total return(b) | | | (0.53 | )%(c) | | | 3.12 | % | | | 7.18 | % | | | (5.40 | )% | | | 5.29 | % |
RATIOS TO AVERAGE NET ASSETS: | | | | | | | | | | | | | | | | | | | | |
Net assets, end of the period (000’s) | | $ | 412,788 | | | $ | 689,798 | | | $ | 1,001,522 | | | $ | 1,219,687 | | | $ | 1,524,806 | |
Net expenses | | | 1.55 | %(d)(e) | | | 1.57 | %(f) | | | 1.60 | % | | | 1.58 | % | | | 1.58 | % |
Gross expenses | | | 1.57 | % | | | 1.57 | % | | | 1.60 | % | | | 1.58 | % | | | 1.58 | % |
Net investment income | | | 1.96 | % | | | 2.49 | % | | | 2.74 | % | | | 2.63 | % | | | 3.00 | % |
Portfolio turnover rate | | | 3 | % | | | 10 | % | | | 11 | % | | | 23 | % | | | 19 | % |
| (a) | Per share net investment income has been calculated using the average shares outstanding during the period. |
| (b) | A contingent deferred sales charge for Class C shares is not reflected in total return calculations. |
| (c) | Had certain expenses not been waived/reimbursed during the period, total returns would have been lower. |
| (d) | The investment adviser agreed to waive its fees and/or reimburse a portion of the Fund’s expenses during the period. Without this waiver/reimbursement, expenses would have been higher. |
| (e) | Effective July 1, 2018, the expense limit decreased to 1.53%. |
| (f) | Effective July 1, 2017, the expense limit decreased to 1.55%. |
See accompanying notes to financial statements.
| 50
Financial Highlights (continued)
For a share outstanding throughout each period.
| | | | | | | | | | | | | | | | | | | | |
| | | Investment Grade Bond Fund—Class N | |
| | | Year Ended
September 30,
2018 | | | Year Ended
September 30,
2017 | | | Year Ended
September 30,
2016 | | | Year Ended
September 30,
2015 | | | Year Ended
September 30,
2014 | |
Net asset value, beginning of the period | | $ | 11.30 | | | $ | 11.58 | | | $ | 11.11 | | | $ | 12.11 | | | $ | 12.22 | |
| | | | | | | | | | | | | | | | | | | | |
INCOME (LOSS) FROM INVESTMENT OPERATIONS: | | | | | | | | | | | | | | | | | | | | |
Net investment income(a) | | | 0.34 | | | | 0.39 | | | | 0.43 | | | | 0.44 | | | | 0.50 | |
Net realized and unrealized gain (loss) | | | (0.28 | ) | | | 0.07 | | | | 0.47 | | | | (0.93 | ) | | | 0.26 | |
| | | | | | | | | | | | | | | | | | | | |
Total from Investment Operations | | | 0.06 | | | | 0.46 | | | | 0.90 | | | | (0.49 | ) | | | 0.76 | |
| | | | | | | | | | | | | | | | | | | | |
LESS DISTRIBUTIONS FROM: | | | | | | | | | | | | | | | | | | | | |
Net investment income | | | (0.25 | ) | | | (0.30 | ) | | | (0.28 | ) | | | (0.39 | ) | | | (0.55 | ) |
Net realized capital gains | | | (0.13 | ) | | | (0.44 | ) | | | (0.15 | ) | | | (0.12 | ) | | | (0.32 | ) |
| | | | | | | | | | | | | | | | | | | | |
Total Distributions | | | (0.38 | ) | | | (0.74 | ) | | | (0.43 | ) | | | (0.51 | ) | | | (0.87 | ) |
| | | | | | | | | | | | | | | | | | | | |
Net asset value, end of the period | | $ | 10.98 | | | $ | 11.30 | | | $ | 11.58 | | | $ | 11.11 | | | $ | 12.11 | |
| | | | | | | | | | | | | | | | | | | | |
Total return | | | 0.50 | % | | | 4.34 | % | | | 8.31 | % | | | (4.28 | )% | | | 6.41 | % |
RATIOS TO AVERAGE NET ASSETS: | | | | | | | | | | | | | | | | | | | | |
Net assets, end of the period (000’s) | | $ | 1,251,189 | | | $ | 1,203,169 | | | $ | 47,343 | | | $ | 21,851 | | | $ | 6,101 | |
Net expenses | | | 0.47 | %(b) | | | 0.48 | %(c) | | | 0.47 | % | | | 0.47 | % | | | 0.47 | %(d) |
Gross expenses | | | 0.47 | % | | | 0.48 | % | | | 0.47 | % | | | 0.47 | % | | | 0.47 | %(d) |
Net investment income | | | 3.05 | % | | | 3.51 | % | | | 3.88 | % | | | 3.78 | % | | | 4.07 | % |
Portfolio turnover rate | | | 3 | % | | | 10 | % | | | 11 | % | | | 23 | % | | | 19 | % |
| (a) | Per share net investment income has been calculated using the average shares outstanding during the period. |
| (b) | Effective July 1, 2018, the expense limit decreased to 0.48%. |
| (c) | Effective July 1, 2017, the expense limit decreased to 0.50%. |
| (d) | Includes fee/expense recovery of less than 0.01%. |
See accompanying notes to financial statements.
51 |
Financial Highlights (continued)
For a share outstanding throughout each period.
| | | | | | | | | | | | | | | | | | | | |
| | | Investment Grade Bond Fund—Class Y | |
| | | Year Ended
September 30,
2018 | | | Year Ended
September 30,
2017 | | | Year Ended
September 30,
2016 | | | Year Ended
September 30,
2015 | | | Year Ended
September 30,
2014 | |
Net asset value, beginning of the period | | $ | 11.31 | | | $ | 11.59 | | | $ | 11.11 | | | $ | 12.12 | | | $ | 12.23 | |
| | | | | | | | | | | | | | | | | | | | |
INCOME (LOSS) FROM INVESTMENT OPERATIONS: | | | | | | | | | | | | | | | | | | | | |
Net investment income(a) | | | 0.33 | | | | 0.39 | | | | 0.42 | | | | 0.43 | | | | 0.49 | |
Net realized and unrealized gain (loss) | | | (0.28 | ) | | | 0.06 | | | | 0.47 | | | | (0.95 | ) | | | 0.26 | |
| | | | | | | | | | | | | | | | | | | | |
Total from Investment Operations | | | 0.05 | | | | 0.45 | | | | 0.89 | | | | (0.52 | ) | | | 0.75 | |
| | | | | | | | | | | | | | | | | | | | |
LESS DISTRIBUTIONS FROM: | | | | | | | | | | | | | | | | | | | | |
Net investment income | | | (0.24 | ) | | | (0.29 | ) | | | (0.26 | ) | | | (0.37 | ) | | | (0.54 | ) |
Net realized capital gains | | | (0.13 | ) | | | (0.44 | ) | | | (0.15 | ) | | | (0.12 | ) | | | (0.32 | ) |
| | | | | | | | | | | | | | | | | | | | |
Total Distributions | | | (0.37 | ) | | | (0.73 | ) | | | (0.41 | ) | | | (0.49 | ) | | | (0.86 | ) |
| | | | | | | | | | | | | | | | | | | | |
Net asset value, end of the period | | $ | 10.99 | | | $ | 11.31 | | | $ | 11.59 | | | $ | 11.11 | | | $ | 12.12 | |
| | | | | | | | | | | | | | | | | | | | |
Total return | | | 0.43 | %(b) | | | 4.24 | % | | | 8.25 | % | | | (4.47 | )% | | | 6.30 | % |
RATIOS TO AVERAGE NET ASSETS: | | | | | | | | | | | | | | | | | | | | |
Net assets, end of the period (000’s) | | $ | 3,001,906 | | | $ | 3,453,137 | | | $ | 4,571,167 | | | $ | 6,081,536 | | | $ | 6,911,938 | |
Net expenses | | | 0.55 | %(c)(d) | | | 0.57 | %(e) | | | 0.60 | % | | | 0.58 | % | | | 0.59 | % |
Gross expenses | | | 0.57 | % | | | 0.57 | % | | | 0.60 | % | | | 0.58 | % | | | 0.59 | % |
Net investment income | | | 2.98 | % | | | 3.48 | % | | | 3.74 | % | | | 3.63 | % | | | 3.99 | % |
Portfolio turnover rate | | | 3 | % | | | 10 | % | | | 11 | % | | | 23 | % | | | 19 | % |
| (a) | Per share net investment income has been calculated using the average shares outstanding during the period. |
| (b) | Had certain expenses not been waived/reimbursed during the period, total returns would have been lower. |
| (c) | The investment adviser agreed to waive its fees and/or reimburse a portion of the Fund’s expenses during the period. Without this waiver/reimbursement, expenses would have been higher. |
| (d) | Effective July 1, 2018, the expense limit decreased to 0.53%. |
| (e) | Effective July 1, 2017, the expense limit decreased to 0.55%. |
See accompanying notes to financial statements.
| 52
Financial Highlights (continued)
For a share outstanding throughout each period.
| | | | | | | | | | | | | | | | | | | | |
| | | Investment Grade Bond Fund—Admin Class | |
| | | Year Ended
September 30,
2018 | | | Year Ended
September 30,
2017 | | | Year Ended
September 30,
2016 | | | Year Ended
September 30,
2015 | | | Year Ended
September 30,
2014 | |
Net asset value, beginning of the period | | $ | 11.28 | | | $ | 11.56 | | | $ | 11.08 | | | $ | 12.09 | | | $ | 12.20 | |
| | | | | | | | | | | | | | | | | | | | |
INCOME (LOSS) FROM INVESTMENT OPERATIONS: | | | | | | | | | | | | | | | | | | | | |
Net investment income(a) | | | 0.28 | | | | 0.34 | | | | 0.37 | | | | 0.37 | | | | 0.43 | |
Net realized and unrealized gain (loss) | | | (0.28 | ) | | | 0.06 | | | | 0.47 | | | | (0.95 | ) | | | 0.26 | |
| | | | | | | | | | | | | | | | | | | | |
Total from Investment Operations | | | 0.00 | (b) | | | 0.40 | | | | 0.84 | | | | (0.58 | ) | | | 0.69 | |
| | | | | | | | | | | | | | | | | | | | |
LESS DISTRIBUTIONS FROM: | | | | | | | | | | | | | | | | | | | | |
Net investment income | | | (0.20 | ) | | | (0.24 | ) | | | (0.21 | ) | | | (0.31 | ) | | | (0.48 | ) |
Net realized capital gains | | | (0.13 | ) | | | (0.44 | ) | | | (0.15 | ) | | | (0.12 | ) | | | (0.32 | ) |
| | | | | | | | | | | | | | | | | | | | |
Total Distributions | | | (0.33 | ) | | | (0.68 | ) | | | (0.36 | ) | | | (0.43 | ) | | | (0.80 | ) |
| | | | | | | | | | | | | | | | | | | | |
Net asset value, end of the period | | $ | 10.95 | | | $ | 11.28 | | | $ | 11.56 | | | $ | 11.08 | | | $ | 12.09 | |
| | | | | | | | | | | | | | | | | | | | |
Total return | | | (0.07 | )%(c) | | | 3.76 | %(c) | | | 7.73 | % | | | (4.95 | )% | | | 5.79 | % |
RATIOS TO AVERAGE NET ASSETS: | | | | | | | | | | | | | | | | | | | | |
Net assets, end of the period (000’s) | | $ | 115,301 | | | $ | 25,521 | | | $ | 35,294 | | | $ | 37,355 | | | $ | 25,585 | |
Net expenses | | | 1.02 | %(d)(e)(f) | | | 1.02 | %(f)(g)(h) | | | 1.07 | %(i) | | | 1.08 | % | | | 1.09 | % |
Gross expenses | | | 1.05 | %(d) | | | 1.03 | %(g) | | | 1.07 | %(i) | | | 1.08 | % | | | 1.09 | % |
Net investment income | | | 2.56 | % | | | 3.03 | % | | | 3.27 | % | | | 3.14 | % | | | 3.49 | % |
Portfolio turnover rate | | | 3 | % | | | 10 | % | | | 11 | % | | | 23 | % | | | 19 | % |
| (a) | Per share net investment income has been calculated using the average shares outstanding during the period. |
| (b) | Amount rounds to less than $0.01 per share. |
| (c) | Had certain expenses not been waived/reimbursed during the period, total returns would have been lower. |
| (d) | Includes refund of prior year service fee of 0.02%. See Note 5b of Notes to Financial Statements. |
| (e) | Effective July 1, 2018, the expense limit decreased to 1.03%. |
| (f) | The investment adviser agreed to waive its fees and/or reimburse a portion of the Fund’s expenses during the period. Without this waiver/reimbursement, expenses would have been higher. |
| (g) | Includes refund of prior year service fee of 0.05%. |
| (h) | Effective July 1, 2017, the expense limit decreased to 1.05%. |
| (i) | Includes refund of prior year service fee of 0.03%. |
See accompanying notes to financial statements.
53 |
Financial Highlights (continued)
For a share outstanding throughout each period.
| | | | | | | | | | | | | | | | | | | | |
| | | Strategic Income Fund—Class A | |
| | | Year Ended
September 30,
2018 | | | Year Ended
September 30,
2017 | | | Year Ended
September 30,
2016 | | | Year Ended
September 30,
2015 | | | Year Ended
September 30,
2014 | |
Net asset value, beginning of the period | | $ | 14.84 | | | $ | 14.70 | | | $ | 14.70 | | | $ | 16.75 | | | $ | 15.93 | |
| | | | | | | | | | | | | | | | | | | | |
INCOME (LOSS) FROM INVESTMENT OPERATIONS: | | | | | | | | | | | | | | | | | | | | |
Net investment income(a) | | | 0.52 | | | | 0.56 | | | | 0.57 | | | | 0.64 | | | | 0.58 | |
Net realized and unrealized gain (loss) | | | (0.33 | ) | | | 0.42 | | | | 0.61 | | | | (1.74 | ) | | | 0.90 | |
| | | | | | | | | | | | | | | | | | | | |
Total from Investment Operations | | | 0.19 | | | | 0.98 | | | | 1.18 | | | | (1.10 | ) | | | 1.48 | |
| | | | | | | | | | | | | | | | | | | | |
LESS DISTRIBUTIONS FROM: | | | | | | | | | | | | | | | | | | | | |
Net investment income | | | (0.57 | ) | | | (0.52 | ) | | | (0.36 | ) | | | (0.57 | ) | | | (0.62 | ) |
Net realized capital gains | | | (0.07 | ) | | | (0.32 | ) | | | (0.82 | ) | | | (0.38 | ) | | | (0.04 | ) |
| | | | | | | | | | | | | | | | | | | | |
Total Distributions | | | (0.64 | ) | | | (0.84 | ) | | | (1.18 | ) | | | (0.95 | ) | | | (0.66 | ) |
| | | | | | | | | | | | | | | | | | | | |
Net asset value, end of the period | | $ | 14.39 | | | $ | 14.84 | | | $ | 14.70 | | | $ | 14.70 | | | $ | 16.75 | |
| | | | | | | | | | | | | | | | | | | | |
Total return(b) | | | 1.34 | % | | | 7.01 | % | | | 8.72 | % | | | (6.88 | )% | | | 9.34 | % |
RATIOS TO AVERAGE NET ASSETS: | | | | | | | | | | | | | | | | | | | | |
Net assets, end of the period (000’s) | | $ | 1,986,300 | | | $ | 1,999,385 | | | $ | 2,514,770 | | | $ | 3,318,262 | | | $ | 4,408,257 | |
Net expenses | | | 0.96 | % | | | 0.96 | % | | | 0.96 | % | | | 0.94 | % | | | 0.94 | % |
Gross expenses | | | 0.96 | % | | | 0.96 | % | | | 0.96 | % | | | 0.94 | % | | | 0.94 | % |
Net investment income | | | 3.57 | % | | | 3.82 | % | | | 4.01 | % | | | 3.95 | % | | | 3.44 | % |
Portfolio turnover rate | | | 6 | % | | | 11 | % | | | 17 | % | | | 23 | % | | | 26 | % |
| (a) | Per share net investment income has been calculated using the average shares outstanding during the period. |
| (b) | A sales charge for Class A shares is not reflected in total return calculations. |
See accompanying notes to financial statements.
| 54
Financial Highlights (continued)
For a share outstanding throughout each period.
| | | | | | | | | | | | | | | | | | | | |
| | | Strategic Income Fund—Class C | |
| | | Year Ended
September 30,
2018 | | | Year Ended
September 30,
2017 | | | Year Ended
September 30,
2016 | | | Year Ended
September 30,
2015 | | | Year Ended
September 30,
2014 | |
Net asset value, beginning of the period | | $ | 14.97 | | | $ | 14.81 | | | $ | 14.80 | | | $ | 16.85 | | | $ | 16.03 | |
| | | | | | | | | | | | | | | | | | | | |
INCOME (LOSS) FROM INVESTMENT OPERATIONS: | | | | | | | | | | | | | | | | | | | | |
Net investment income(a) | | | 0.41 | | | | 0.45 | | | | 0.47 | | | | 0.52 | | | | 0.45 | |
Net realized and unrealized gain (loss) | | | (0.33 | ) | | | 0.44 | | | | 0.61 | | | | (1.74 | ) | | | 0.90 | |
| | | | | | | | | | | | | | | | | | | | |
Total from Investment Operations | | | 0.08 | | | | 0.89 | | | | 1.08 | | | | (1.22 | ) | | | 1.35 | |
| | | | | | | | | | | | | | | | | | | | |
LESS DISTRIBUTIONS FROM: | | | | | | | | | | | | | | | | | | | | |
Net investment income | | | (0.46 | ) | | | (0.41 | ) | | | (0.25 | ) | | | (0.45 | ) | | | (0.49 | ) |
Net realized capital gains | | | (0.07 | ) | | | (0.32 | ) | | | (0.82 | ) | | | (0.38 | ) | | | (0.04 | ) |
| | | | | | | | | | | | | | | | | | | | |
Total Distributions | | | (0.53 | ) | | | (0.73 | ) | | | (1.07 | ) | | | (0.83 | ) | | | (0.53 | ) |
| | | | | | | | | | | | | | | | | | | | |
Net asset value, end of the period | | $ | 14.52 | | | $ | 14.97 | | | $ | 14.81 | | | $ | 14.80 | | | $ | 16.85 | |
| | | | | | | | | | | | | | | | | | | | |
Total return(b) | | | 0.60 | % | | | 6.20 | % | | | 7.91 | % | | | (7.60 | )% | | | 8.54 | % |
RATIOS TO AVERAGE NET ASSETS: | | | | | | | | | | | | | | | | | | | | |
Net assets, end of the period (000’s) | | $ | 1,153,853 | | | $ | 2,248,939 | | | $ | 3,433,204 | | | $ | 4,295,139 | | | $ | 5,390,222 | |
Net expenses | | | 1.71 | % | | | 1.71 | % | | | 1.71 | % | | | 1.69 | % | | | 1.69 | % |
Gross expenses | | | 1.71 | % | | | 1.71 | % | | | 1.71 | % | | | 1.69 | % | | | 1.69 | % |
Net investment income | | | 2.79 | % | | | 3.08 | % | | | 3.26 | % | | | 3.20 | % | | | 2.68 | % |
Portfolio turnover rate | | | 6 | % | | | 11 | % | | | 17 | % | | | 23 | % | | | 26 | % |
| (a) | Per share net investment income has been calculated using the average shares outstanding during the period. |
| (b) | A contingent deferred sales charge for Class C shares is not reflected in total return calculations. |
See accompanying notes to financial statements.
55 |
Financial Highlights (continued)
For a share outstanding throughout each period.
| | | | | | | | | | | | | | | | | | | | |
| | | Strategic Income Fund—Class N | |
| | | Year Ended
September 30,
2018 | | | Year Ended
September 30,
2017 | | | Year Ended
September 30,
2016 | | | Year Ended
September 30,
2015 | | | Year Ended
September 30,
2014 | |
Net asset value, beginning of the period | | $ | 14.83 | | | $ | 14.69 | | | $ | 14.69 | | | $ | 16.73 | | | $ | 15.92 | |
| | | | | | | | | | | | | | | | | | | | |
INCOME (LOSS) FROM INVESTMENT OPERATIONS: | | | | | | | | | | | | | | | | | | | | |
Net investment income(a) | | | 0.56 | | | | 0.60 | | | | 0.61 | | | | 0.69 | | | | 0.61 | |
Net realized and unrealized gain (loss) | | | (0.32 | ) | | | 0.43 | | | | 0.62 | | | | (1.73 | ) | | | 0.91 | |
| | | | | | | | | | | | | | | | | | | | |
Total from Investment Operations | | | 0.24 | | | | 1.03 | | | | 1.23 | | | | (1.04 | ) | | | 1.52 | |
| | | | | | | | | | | | | | | | | | | | |
LESS DISTRIBUTIONS FROM: | | | | | | | | | | | | | | | | | | | | |
Net investment income | | | (0.62 | ) | | | (0.57 | ) | | | (0.41 | ) | | | (0.62 | ) | | | (0.67 | ) |
Net realized capital gains | | | (0.07 | ) | | | (0.32 | ) | | | (0.82 | ) | | | (0.38 | ) | | | (0.04 | ) |
| | | | | | | | | | | | | | | | | | | | |
Total Distributions | | | (0.69 | ) | | | (0.89 | ) | | | (1.23 | ) | | | (1.00 | ) | | | (0.71 | ) |
| | | | | | | | | | | | | | | | | | | | |
Net asset value, end of the period | | $ | 14.38 | | | $ | 14.83 | | | $ | 14.69 | | | $ | 14.69 | | | $ | 16.73 | |
| | | | | | | | | | | | | | | | | | | | |
Total return | | | 1.67 | % | | | 7.38 | % | | | 9.09 | % | | | (6.58 | )% | | | 9.70 | % |
RATIOS TO AVERAGE NET ASSETS: | | | | | | | | | | | | | | | | | | | | |
Net assets, end of the period (000’s) | | $ | 176,456 | | | $ | 141,695 | | | $ | 130,637 | | | $ | 83,405 | | | $ | 57,752 | |
Net expenses | | | 0.63 | % | | | 0.63 | % | | | 0.63 | % | | | 0.62 | % | | | 0.62 | % |
Gross expenses | | | 0.63 | % | | | 0.63 | % | | | 0.63 | % | | | 0.62 | % | | | 0.62 | % |
Net investment income | | | 3.91 | % | | | 4.13 | % | | | 4.34 | % | | | 4.33 | % | | | 3.62 | % |
Portfolio turnover rate | | | 6 | % | | | 11 | % | | | 17 | % | | | 23 | % | | | 26 | % |
| (a) | Per share net investment income has been calculated using the average shares outstanding during the period. |
See accompanying notes to financial statements.
| 56
Financial Highlights (continued)
For a share outstanding throughout each period.
| | | | | | | | | | | | | | | | | | | | |
| | | Strategic Income Fund—Class Y | |
| | | Year Ended
September 30,
2018 | | | Year Ended
September 30,
2017 | | | Year Ended
September 30,
2016 | | | Year Ended
September 30,
2015
| | | Year Ended
September 30,
2014 | |
Net asset value, beginning of the period | | $ | 14.83 | | | $ | 14.69 | | | $ | 14.69 | | | $ | 16.73 | | | $ | 15.92 | |
| | | | | | | | | | | | | | | | | | | | |
INCOME (LOSS) FROM INVESTMENT OPERATIONS: | | | | | | | | | | | | | | | | | | | | |
Net investment income(a) | | | 0.55 | | | | 0.59 | | | | 0.61 | | | | 0.68 | | | | 0.61 | |
Net realized and unrealized gain (loss) | | | (0.32 | ) | | | 0.43 | | | | 0.61 | | | | (1.73 | ) | | | 0.90 | |
| | | | | | | | | | | | | | | | | | | | |
Total from Investment Operations | | | 0.23 | | | | 1.02 | | | | 1.22 | | | | (1.05 | ) | | | 1.51 | |
| | | | | | | | | | | | | | | | | | | | |
LESS DISTRIBUTIONS FROM: | | | | | | | | | | | | | | | | | | | | |
Net investment income | | | (0.61 | ) | | | (0.56 | ) | | | (0.40 | ) | | | (0.61 | ) | | | (0.66 | ) |
Net realized capital gains | | | (0.07 | ) | | | (0.32 | ) | | | (0.82 | ) | | | (0.38 | ) | | | (0.04 | ) |
| | | | | | | | | | | | | | | | | | | | |
Total Distributions | | | (0.68 | ) | | | (0.88 | ) | | | (1.22 | ) | | | (0.99 | ) | | | (0.70 | ) |
| | | | | | | | | | | | | | | | | | | | |
Net asset value, end of the period | | $ | 14.38 | | | $ | 14.83 | | | $ | 14.69 | | | $ | 14.69 | | | $ | 16.73 | |
| | | | | | | | | | | | | | | | | | | | |
Total return | | | 1.66 | % | | | 7.22 | % | | | 9.00 | % | | | (6.65 | )% | | | 9.63 | % |
RATIOS TO AVERAGE NET ASSETS: | | | | | | | | | | | | | | | | | | | | |
Net assets, end of the period (000’s) | | $ | 5,118,016 | | | $ | 5,702,607 | | | $ | 5,350,759 | | | $ | 7,018,369 | | | $ | 8,747,384 | |
Net expenses | | | 0.71 | % | | | 0.71 | % | | | 0.71 | % | | | 0.69 | % | | | 0.69 | % |
Gross expenses | | | 0.71 | % | | | 0.71 | % | | | 0.71 | % | | | 0.69 | % | | | 0.69 | % |
Net investment income | | | 3.82 | % | | | 4.04 | % | | | 4.26 | % | | | 4.21 | % | | | 3.65 | % |
Portfolio turnover rate | | | 6 | % | | | 11 | % | | | 17 | % | | | 23 | % | | | 26 | % |
| (a) | Per share net investment income has been calculated using the average shares outstanding during the period. |
See accompanying notes to financial statements.
57 |
Financial Highlights (continued)
For a share outstanding throughout each period.
| | | | | | | | | | | | | | | | | | | | |
| | | Strategic Income Fund—Admin Class | |
| | | Year Ended
September 30,
2018 | | | Year Ended
September 30,
2017 | | | Year Ended
September 30,
2016 | | | Year Ended
September 30,
2015 | | | Year Ended
September 30,
2014 | |
Net asset value, beginning of the period | | $ | 14.79 | | | $ | 14.65 | | | $ | 14.66 | | | $ | 16.70 | | | $ | 15.89 | |
| | | | | | | | | | | | | | | | | | | | |
INCOME (LOSS) FROM INVESTMENT OPERATIONS: | | | | | | | | | | | | | | | | | | | | |
Net investment income(a) | | | 0.48 | | | | 0.52 | | | | 0.53 | | | | 0.60 | | | | 0.53 | |
Net realized and unrealized gain (loss) | | | (0.33 | ) | | | 0.43 | | | | 0.61 | | | | (1.73 | ) | | | 0.90 | |
| | | | | | | | | | | | | | | | | | | | |
Total from Investment Operations | | | 0.15 | | | | 0.95 | | | | 1.14 | | | | (1.13 | ) | | | 1.43 | |
| | | | | | | | | | | | | | | | | | | | |
LESS DISTRIBUTIONS FROM: | | | | | | | | | | | | | | | | | | | | |
Net investment income | | | (0.53 | ) | | | (0.49 | ) | | | (0.33 | ) | | | (0.53 | ) | | | (0.58 | ) |
Net realized capital gains | | | (0.07 | ) | | | (0.32 | ) | | | (0.82 | ) | | | (0.38 | ) | | | (0.04 | ) |
| | | | | | | | | | | | | | | | | | | | |
Total Distributions | | | (0.60 | ) | | | (0.81 | ) | | | (1.15 | ) | | | (0.91 | ) | | | (0.62 | ) |
| | | | | | | | | | | | | | | | | | | | |
Net asset value, end of the period | | $ | 14.34 | | | $ | 14.79 | | | $ | 14.65 | | | $ | 14.66 | | | $ | 16.70 | |
| | | | | | | | | | | | | | | | | | | | |
Total return | | | 1.09 | % | | | 6.79 | % | | | 8.42 | % | | | (7.13 | )% | | | 9.12 | % |
RATIOS TO AVERAGE NET ASSETS: | | | | | | | | | | | | | | | | | | | | |
Net assets, end of the period (000’s) | | $ | 133,220 | | | $ | 142,871 | | | $ | 143,275 | | | $ | 141,844 | | | $ | 139,423 | |
Net expenses | | | 1.20 | %(b) | | | 1.19 | %(c) | | | 1.20 | %(d) | | | 1.19 | % | | | 1.19 | % |
Gross expenses | | | 1.20 | %(b) | | | 1.19 | %(c) | | | 1.20 | %(d) | | | 1.19 | % | | | 1.19 | % |
Net investment income | | | 3.33 | % | | | 3.57 | % | | | 3.76 | % | | | 3.73 | % | | | 3.15 | % |
Portfolio turnover rate | | | 6 | % | | | 11 | % | | | 17 | % | | | 23 | % | | | 26 | % |
| (a) | Per share net investment income has been calculated using the average shares outstanding during the period. |
| (b) | Includes refund of prior year service fee of 0.01%. See Note 5b of Notes to Financial Statements. |
| (c) | Includes refund of prior year service fee of 0.02%. |
| (d) | Includes refund of prior year service fee of 0.01%. |
See accompanying notes to financial statements.
| 58
Notes to Financial Statements
September 30, 2018
1. Organization. Loomis Sayles Funds II (the “Trust”) is organized as a Massachusetts business trust. The Trust is registered under the Investment Company Act of 1940, as amended (the “1940 Act”) as an open-end management investment company. The Declaration of Trust permits the Board of Trustees to authorize the issuance of an unlimited number of shares of the Trust in multiple series. The financial statements for certain funds of the Trust are presented in separate reports. The following funds (individually, a “Fund” and collectively, the “Funds”) are included in this report:
Loomis Sayles Investment Grade Bond Fund (the “Investment Grade Bond Fund”)
Loomis Sayles Strategic Income Fund (the “Strategic Income Fund”)
Each Fund is a diversified investment company.
Each Fund offers Class A, Class C, Class N, Class Y and Admin Class shares.
Class A shares are sold with a maximum front-end sales charge of 4.25%. Class C shares do not pay a front-end sales charge, pay higher Rule 12b-1 fees than Class A shares for ten years (at which point they automatically convert to Class A shares) and may be subject to a contingent deferred sales charge (“CDSC”) of 1.00% if those shares are redeemed within one year of acquisition, except for reinvested distributions. Class N and Class Y shares do not pay a front-end sales charge, a CDSC or Rule 12b-1 fees. Class N shares are offered with an initial minimum investment of $1,000,000. Class Y shares are offered with an initial minimum investment of $100,000. Certain categories of investors are exempted from the minimum investment amounts for Class N and Class Y as outlined in the relevant Funds’ prospectus. Admin Class shares do not pay a front-end sales charge or a CDSC, but do pay a Rule 12b-1 fee. Admin Class shares are offered exclusively through intermediaries.
Most expenses can be directly attributed to a Fund. Expenses which cannot be directly attributed to a Fund are generally apportioned based on the relative net assets of each of the funds in Natixis Funds Trust I, Natixis Funds Trust II, Natixis Funds Trust IV, and Gateway Trust (“Natixis Funds Trusts”), Loomis Sayles Funds I and Loomis Sayles Funds II (“Loomis Sayles Funds Trusts”) and Natixis ETF Trust. Expenses of a Fund are borne pro rata by the holders of each class of shares, except that each class bears expenses unique to that class (such as the Rule 12b-1 fees applicable to Class A, Class C and Admin Class), and transfer agent fees are borne collectively for Class A, Class C, Class Y, and Admin Class and individually for Class N. In addition, each class votes as a class only with respect to its own Rule 12b-1 Plan. Shares of each class would receive their pro rata share of the net assets of the Fund if the Fund were liquidated. The Trustees approve separate distributions from net investment income on each class of shares.
2. Significant Accounting Policies. The following is a summary of significant accounting policies consistently followed by each Fund in the preparation of its financial statements. The Funds’ financial statements follow the accounting and
59 |
Notes to Financial Statements (continued)
September 30, 2018
reporting guidelines provided for investment companies and are prepared in accordance with accounting principles generally accepted in the United States of America which require the use of management estimates that affect the reported amounts and disclosures in the financial statements. Actual results could differ from those estimates. Management has evaluated the events and transactions subsequent to year-end through the date the financial statements were issued and has determined that there were no material events that would require disclosure in the Funds’ financial statements.
a. Valuation. Fund securities and other investments are valued at market value based on market quotations obtained or determined by independent pricing services recommended by the adviser and approved by the Board of Trustees. Fund securities and other investments for which market quotations are not readily available are valued at fair value as determined in good faith by the adviser pursuant to procedures approved by the Board of Trustees, as described below. Market value is determined as follows:
Debt securities and unlisted preferred equity securities are valued based on evaluated bids furnished to the Fund by an independent pricing service, or bid prices obtained from broker-dealers. Senior loans are valued at bid prices supplied by an independent pricing service, if available. Listed equity securities (including shares of closed-end investment companies and exchange-traded funds) are valued at the last sale price quoted on the exchange where they are traded most extensively or, if there is no reported sale during the day, the closing bid quotation as reported by an independent pricing service. Securities traded on the NASDAQ Global Select Market, NASDAQ Global Market and NASDAQ Capital Market are valued at the NASDAQ Official Closing Price (“NOCP”), or if lacking an NOCP, at the most recent bid quotations on the applicable NASDAQ Market. Unlisted equity securities (except unlisted preferred equity securities) are valued at the last sale price quoted in the market where they are traded most extensively or, if there is no reported sale during the day, the closing bid quotation as reported by an independent pricing service. If there is no last sale price or closing bid quotation available, unlisted equity securities will be valued using evaluated bids furnished by an independent pricing service, if available. In some foreign markets, an official close price and a last sale price may be available from the foreign exchange or market. In those cases, the official close price is used. Broker-dealer bid prices may be used to value debt and unlisted equity securities and senior loans where an independent pricing service is unable to price a security or where an independent pricing service does not provide a reliable price for the security. Forward foreign currency contracts are valued utilizing interpolated rates determined based on information provided by an independent pricing service.
Fund securities and other investments for which market quotations are not readily available are valued at fair value as determined in good faith by the adviser pursuant to
| 60
Notes to Financial Statements (continued)
September 30, 2018
procedures approved by the Board of Trustees. The Fund may also value securities and other investments at fair value in other circumstances such as when extraordinary events occur after the close of a foreign market but prior to the close of the New York Stock Exchange. This may include situations relating to a single issuer (such as a declaration of bankruptcy or a delisting of the issuer’s security from the primary market on which it has traded) as well as events affecting the securities markets in general (such as market disruptions or closings and significant fluctuations in U.S. and/or foreign markets). When fair valuing its securities or other investments, the Fund may, among other things, use modeling tools or other processes that may take into account factors such as securities or other market activity and/or significant events that occur after the close of the foreign market and before the time the Fund’s net asset value (“NAV”) is calculated. Fair value pricing may require subjective determinations about the value of a security, and fair values used to determine a Fund’s NAV may differ from quoted or published prices, or from prices that are used by others, for the same securities. In addition, the use of fair value pricing may not always result in adjustments to the prices of securities held by the Fund.
Illiquid securities for which market quotations are readily available and have been evaluated by the adviser are considered and classified as fair valued securities pursuant to the Fund’s pricing policies and procedures.
As of September 30, 2018, securities of the Funds were fair valued as follows:
| | | | | | | | | | | | | | | | |
Fund | | Securities
classified as fair valued | | | Percentage of
Net Assets | | | Securities fair
valued by the
Fund’s adviser | | | Percentage of Net Assets | |
Investment Grade Bond Fund | | $ | 116,035,671 | | | | 2.1 | % | | $ | 845 | | | | Less than 0.1 | % |
Strategic Income Fund | | | 116,214,631 | | | | 1.4 | % | | | 20,684,320 | | | | 0.2 | % |
b. Investment Transactions and Related Investment Income. Investment transactions are accounted for on a trade date plus one day basis for daily NAV calculation. However, for financial reporting purposes, investment transactions are reported on trade date. Dividend income is recorded on ex-dividend date, or in the case of certain foreign securities, as soon as a Fund is notified, and interest income is recorded on an accrual basis. Interest income is increased by the accretion of discount and decreased by the amortization of premium, if applicable. Distributions received from investments in securities that represent a return of capital or capital gain are recorded as a reduction of cost of investments or as a realized gain, respectively. In determining net gain or loss on securities sold, the cost of securities has been determined on an identified cost basis. Investment income, non-class specific expenses and realized and unrealized gains and losses are allocated on a pro rata basis to each class based on the relative net assets of each class to the total net assets of the Fund.
61 |
Notes to Financial Statements (continued)
September 30, 2018
c. Foreign Currency Translation. The books and records of the Funds are maintained in U.S. dollars. The values of securities, currencies and other assets and liabilities denominated in currencies other than U.S. dollars are translated into U.S. dollars based upon foreign exchange rates prevailing at the end of the period. Purchases and sales of investment securities, income and expenses are translated into U.S. dollars on the respective dates of such transactions.
Net realized foreign exchange gains or losses arise from sales of foreign currency, changes in exchange rates between the trade and settlement dates on securities transactions and the difference between the amounts of dividends, interest and foreign withholding taxes recorded on the Fund’s books and the U.S. dollar equivalent of the amounts actually received or paid. Net unrealized foreign exchange gains or losses arise from changes in the value of assets and liabilities, other than investment securities, as of the end of the fiscal period, resulting from changes in exchange rates. Net realized foreign exchange gains or losses and the net change in unrealized foreign exchange gains or losses are disclosed in the Statements of Operations. For federal income tax purposes, net realized foreign exchange gains or losses are characterized as ordinary income and may, if the Funds have net losses, reduce the amount of income available to be distributed by the Funds.
The values of investment securities are presented at the foreign exchange rates prevailing at the end of the period for financial reporting purposes. Net realized and unrealized gains or losses on investments reported in the Statements of Operations reflect gains or losses resulting from changes in exchange rates and fluctuations which arise due to changes in market prices of investment securities. For federal income tax purposes, a portion of the net realized gain or loss on investments arising from changes in exchange rates, which is reflected in the Statements of Operations, may be characterized as ordinary income and may, if the Funds have net losses, reduce the amount of income available to be distributed by the Funds.
During the year ended September 30, 2018, the amount of income available to be distributed has been reduced by the following amounts as a result of losses arising from changes in exchange rates:
| | | | |
Investment Grade Bond Fund | | $ | 120,034,497 | |
Strategic Income Fund | | $ | 46,611,188 | |
The Funds may use foreign currency exchange contracts to facilitate transactions in foreign-denominated investments. Losses may arise from changes in the value of the foreign currency or if the counterparties do not perform under the contracts’ terms.
d. Forward Foreign Currency Contracts. The Funds may enter into forward foreign currency contracts, including forward foreign cross currency contracts, to acquire exposure to foreign currencies or to hedge the Funds’ investments against currency fluctuation. A contract can also be used to offset a previous contract. These contracts
| 62
Notes to Financial Statements (continued)
September 30, 2018
involve market risk in excess of the unrealized gain or loss reflected in the Funds’ Statements of Assets and Liabilities. The U.S. dollar value of the currencies a Fund has committed to buy or sell represents the aggregate exposure to each currency a Fund has acquired or hedged through currency contracts outstanding at period end. Gains or losses are recorded for financial statement purposes as unrealized until settlement date. Contracts are traded over-the-counter directly with a counterparty. Risks may arise upon entering into these contracts from the potential inability of counterparties to meet the terms of their contracts and from unanticipated movements in the value of a foreign currency relative to the U.S. dollar. Certain contracts may require the movement of cash and/or securities as collateral for the Funds’ or counterparty’s net obligations under the contracts.
No forward foreign currency contracts were held by the Funds during the year ended September 30, 2018.
e. New Disclosure Requirements. In accordance with new reporting requirements pursuant to Regulation S-X of the Securities and Exchange Commission, presentation of certain amounts on the Statements of Changes in Net Assets, for the year ended September 30, 2017, have been conformed to meet the new disclosure requirements. These adjustments include Distributions to Shareholders; where the prior disclosure separately stated distributions from net investment income and distributions from net realized capital gains for each share class of the Fund, they are now combined into a single line item for each respective share class. In addition, disclosure of Undistributed Net Investment Income has been removed from the Statements of Changes in Net Assets.
The following is a summary of the previously disclosed amounts, as reported at September 30, 2017:
| | | | |
| Investment Grade Bond Fund | | | |
FROM DISTRIBUTIONS TO SHAREHOLDERS: | | | | |
Net investment income | | | | |
Class A | | $ | (22,698,039 | ) |
Class C | | | (13,586,835 | ) |
Class N | | | (19,578,968 | ) |
Class Y | | | (95,925,578 | ) |
Admin Class | | | (642,265 | ) |
Net realized capital gains | | | | |
Class A | | | (37,991,535 | ) |
Class C | | | (35,231,779 | ) |
Class N | | | (2,725,590 | ) |
Class Y | | | (166,690,814 | ) |
Admin Class | | | (1,202,096 | ) |
| | | | |
Total distributions | | $ | (396,273,499 | ) |
| | | | |
UNDISTRIBUTED NET INVESTMENT INCOME | | $ | 60,682,395 | |
| | | | |
63 |
Notes to Financial Statements (continued)
September 30, 2018
| | | | |
| Strategic Income Fund | | | |
FROM DISTRIBUTIONS TO SHAREHOLDERS: | | | | |
Net investment income | | | | |
Class A | | $ | (78,875,422 | ) |
Class C | | | (78,726,042 | ) |
Class N | | | (5,305,880 | ) |
Class Y | | | (205,067,266 | ) |
Admin Class | | | (4,720,753 | ) |
Net realized capital gains | | | | |
Class A | | | (51,098,073 | ) |
Class C | | | (69,058,405 | ) |
Class N | | | (2,996,727 | ) |
Class��Y | | | (114,763,610 | ) |
Admin Class | | | (3,099,821 | ) |
| | | | |
Total distributions | | $ | (613,711,999 | ) |
| | | | |
UNDISTRIBUTED NET INVESTMENT INCOME | | $ | 28,981,152 | |
| | | | |
f. Federal and Foreign Income Taxes. The Trust treats each Fund as a separate entity for federal income tax purposes. Each Fund intends to meet the requirements of the Internal Revenue Code of 1986, as amended, applicable to regulated investment companies, and to distribute to its shareholders substantially all of its net investment income and any net realized capital gains at least annually. Management has performed an analysis of each Fund’s tax positions for the open tax years as of September 30, 2018 and has concluded that no provisions for income tax are required. The Funds’ federal tax returns for the prior three fiscal years remain subject to examination by the Internal Revenue Service. Management is not aware of any events that are reasonably possible to occur in the next twelve months that would result in the amounts of any unrecognized tax benefits significantly increasing or decreasing for the Funds. However, management’s conclusions regarding tax positions taken may be subject to review and adjustment at a later date based on factors including, but not limited to, new tax laws and accounting regulations and interpretations thereof.
A Fund may be subject to foreign withholding taxes on investment income and taxes on capital gains on investments that are accrued and paid based upon the Fund’s understanding of the tax rules and regulations that exist in the countries in which the Fund invests. Foreign withholding taxes on dividend and interest income are reflected on the Statements of Operations as a reduction of investment income, net of amounts eligible to be reclaimed. Dividends and interest receivable on the Statements of Assets and Liabilities are net of foreign withholding taxes. Foreign withholding taxes where reclaims have been or will be filed are reflected on the Statements of Assets and Liabilities as tax reclaims receivable. Capital gains taxes paid are included in net realized gain (loss) on investments in the Statements of Operations. Accrued but unpaid capital gains taxes are reflected as foreign taxes payable on the Statements of Assets and Liabilities, if applicable, and reduce unrealized gains on investments. In the event that realized gains on investments are subsequently offset by realized losses,
| 64
Notes to Financial Statements (continued)
September 30, 2018
taxes paid on realized gains may be returned to a Fund. Such amounts, if applicable, are reflected as foreign tax rebates receivable on the Statements of Assets and Liabilities and are recorded as a realized gain when received.
g. Dividends and Distributions to Shareholders. Dividends and distributions are recorded on ex-dividend date. The timing and characterization of certain income and capital gain distributions are determined in accordance with federal tax regulations, which may differ from accounting principles generally accepted in the United States of America. Permanent differences are primarily due to differing treatments for book and tax purposes of items such as distribution redesignations, defaulted and/or non-income producing securities, foreign currency gains and losses, premium amortization, convertible bonds, paydown gains and losses, partnership basis adjustments, contingent payment debt instruments, and capital gain and return of capital distributions received. Permanent book and tax basis differences relating to shareholder distributions will result in reclassifications to capital accounts reported on the Statements of Assets and Liabilities. Temporary differences between book and tax distributable earnings are primarily due to corporate actions, deferred Trustees’ fees, wash sales, premium amortization, return of capital distributions received, trust preferred securities, defaulted and/or non-income producing securities, contingent payment debt instruments, partnership basis adjustments and convertible bonds. Amounts of income and capital gain available to be distributed on a tax basis are determined annually, and at other times during the Funds’ fiscal year as may be necessary to avoid knowingly declaring and paying a return of capital distribution. Distributions from net investment income and net realized short-term capital gains are reported as distributed from ordinary income for tax purposes.
The tax characterization of distributions is determined on an annual basis. The tax character of distributions paid to shareholders during the years ended September 30, 2018 and 2017 were as follows:
| | | | | | | | | | | | |
| | | 2018 Distributions Paid From: | |
Fund | | Ordinary
Income | | | Long-Term
Capital
Gains | | | Total | |
Investment Grade Bond Fund | | $ | 126,989,994 | | | $ | 69,650,181 | | | $ | 196,640,175 | |
Strategic Income Fund | | | 365,189,758 | | | | 45,455,828 | | | | 410,645,586 | |
| | | | | | | | | | | | |
| | | 2017 Distributions Paid From: | |
Fund | | Ordinary
Income | | | Long-Term
Capital
Gains | | | Total | |
Investment Grade Bond Fund | | $ | 158,093,971 | | | $ | 238,179,528 | | | $ | 396,273,499 | |
Strategic Income Fund | | | 372,695,363 | | | | 241,016,636 | | | | 613,711,999 | |
65 |
Notes to Financial Statements (continued)
September 30, 2018
For the year ended September 30, 2017 differences between amounts previously reported and now disclosed in Note 2e of the Notes to Financial Statements are primarily attributable to different book and tax treatment for short-term capital gains.
Distributions paid to shareholders from net investment income and net realized capital gains, based on accounting principles generally accepted in the United States of America, are consolidated and reported on the Statements of Changes in Net Assets as Distributions to Shareholders. Distributions paid to shareholders from net investment income and net realized capital gains expressed in per-share amounts, based on accounting principles generally accepted in the United States of America, are separately stated and reported within the Financial Highlights.
As of September 30, 2018, the components of distributable earnings on a tax basis were as follows:
| | | | | | | | |
| | | Investment
Grade Bond
Fund | | | Strategic
Income Fund | |
Undistributed ordinary income | | $ | 559,022 | | | $ | 12,798,460 | |
Undistributed long-term capital gains | | | 26,482,210 | | | | 34,578,731 | |
| | | | | | | | |
Total undistributed earnings | | | 27,041,232 | | | | 47,377,191 | |
| | | | | | | | |
Unrealized depreciation | | | (87,081,062 | ) | | | (360,598,689 | ) |
| | | | | | | | |
Total accumulated losses | | $ | (60,039,830 | ) | | $ | (313,221,498 | ) |
| | | | | | | | |
As of September 30, 2018, unrealized appreciation (depreciation) as a component of distributable earnings was as follows:
| | | | | | | | |
| | | Investment
Grade Bond
Fund | | | Strategic
Income Fund | |
Unrealized appreciation (depreciation) Investments | | $ | 114,863,448 | | | $ | 102,198,245 | |
Foreign currency translations | | | (201,944,510 | ) | | | (462,796,934 | ) |
| | | | | | | | |
Total unrealized depreciation | | $ | (87,081,062 | ) | | $ | (360,598,689 | ) |
| | | | | | | | |
As of September 30, 2018, the cost of investments and unrealized appreciation (depreciation) on a federal tax basis were as follows:
| | | | | | | | |
| | | Investment
Grade Bond
Fund | | | Strategic
Income Fund | |
Federal tax cost | | $ | 5,240,724,476 | | | $ | 8,526,267,833 | |
| | | | | | | | |
Gross tax appreciation | | $ | 236,522,892 | | | $ | 502,804,118 | |
Gross tax depreciation | | | (325,987,627 | ) | | | (871,746,202 | ) |
| | | | | | | | |
Net tax depreciation | | $ | (89,464,735 | ) | | $ | (368,942,084 | ) |
| | | | | | | | |
| 66
Notes to Financial Statements (continued)
September 30, 2018
Differences between these amounts and those reported in the components of distributable earnings are primarily attributable to foreign currency mark-to-market.
h. Loan Participations. Each Fund may invest in loans to corporate, governmental or other borrowers. The Funds’ investments in loans may be in the form of participations in loans or assignments of all or a portion of loans. A loan is often administered by a bank or other financial institution that acts as agent for all holders. The agent administers the terms of the loan, as specified in the loan agreement. When investing in a loan participation, (i) a Fund has the right to receive payments of principal, interest and any fees to which it is entitled only from the party from whom the Fund has purchased the participation and only upon receipt by that party of payments from the borrower and (ii) a Fund generally has no right to enforce compliance by the borrower with the terms of the loan agreement or to vote on matters arising under the loan agreement. Thus, a Fund may be subject to credit risk both of the party from whom it purchased the loan participation and the borrower and the Fund may have minimal control over the terms of any loan modification. When a Fund purchases assignments from lenders, it acquires direct rights against the borrower on the loan. Loan agreements and participations outstanding at the end of the period, if any, are listed in each applicable Fund’s Schedule of Investments.
i. Repurchase Agreements. Each Fund may enter into repurchase agreements, under the terms of a Master Repurchase Agreement, under which each Fund acquires securities as collateral and agrees to resell the securities at an agreed upon time and at an agreed upon price. It is each Fund’s policy that the market value of the collateral for repurchase agreements be at least equal to 102% of the repurchase price, including interest. Certain repurchase agreements are tri-party arrangements whereby the collateral is held in a segregated account for the benefit of the Fund and on behalf of the counterparty. Repurchase agreements could involve certain risks in the event of default or insolvency of the counterparty, including possible delays or restrictions upon a Fund’s ability to dispose of the underlying securities. As of September 30, 2018, each Fund, as applicable, had investments in repurchase agreements for which the value of the related collateral exceeded the value of the repurchase agreement. The gross value of repurchase agreements is included in the Statements of Assets and Liabilities for financial reporting purposes.
j. Securities Lending. The Funds have entered into an agreement with State Street Bank and Trust Company (“State Street Bank”), as agent of the Funds, to lend securities to certain designated borrowers. The loans are collateralized with cash or securities in an amount equal to at least 105% or 102% of the market value (including accrued interest) of the loaned international or domestic securities, respectively, when the loan is initiated. Thereafter, the value of the collateral must remain at least 102% of the market value (including accrued interest) of loaned securities for U.S. equities and U.S. corporate debt; at least 105% of the market value (including accrued interest) of loaned securities for non-U.S. equities; and at least 100% of the market value (including
67 |
Notes to Financial Statements (continued)
September 30, 2018
accrued interest) of loaned securities for U.S. Government securities, sovereign debt issued by non-U.S. Governments and non-U.S. corporate debt. In the event that the market value of the collateral falls below the required percentages described above, the borrower will deliver additional collateral on the next business day. As with other extensions of credit, the Funds may bear the risk of loss with respect to the investment of the collateral. The Funds invest cash collateral in short-term investments, a portion of the income from which is remitted to the borrowers and the remainder allocated between the Funds and State Street Bank as lending agent.
For the year ended September 30, 2018, neither Fund had loaned securities under this agreement.
k. Indemnifications. Under the Trust’s organizational documents, its officers and Trustees are indemnified against certain liabilities arising out of the performance of their duties to the Funds. Additionally, in the normal course of business, the Funds enter into contracts with service providers that contain general indemnification clauses. The Funds’ maximum exposure under these arrangements is unknown as this would involve future claims that may be made against the Funds that have not yet occurred. However, based on experience, the Funds expect the risk of loss to be remote.
3. Fair Value Measurements. In accordance with accounting standards related to fair value measurements and disclosures, the Funds have categorized the inputs utilized in determining the value of each Fund’s assets or liabilities. These inputs are summarized in the three broad levels listed below:
| | • | | Level 1 – quoted prices in active markets for identical assets or liabilities; |
| | • | | Level 2 – prices determined using other significant inputs that are observable either directly, or indirectly through corroboration with observable market data (which could include quoted prices for similar assets or liabilities, interest rates, credit risk, etc.); and |
| | • | | Level 3 – prices determined using significant unobservable inputs when quoted prices or observable inputs are unavailable such as when there is little or no market activity for an asset or liability (unobservable inputs reflect each Fund’s own assumptions in determining the fair value of assets or liabilities and would be based on the best information available). |
The inputs or methodology used for valuing securities are not necessarily an indication of the risk associated with investing in those securities.
The Funds’ pricing policies and procedures are recommended by the adviser and approved by the Board of Trustees. Debt securities are valued based on evaluated bids furnished to the Funds by an independent pricing service. Broker-dealer bid prices may be used if an independent pricing service either is unable to price a security or does not provide a reliable price for a security. Broker-dealer bid prices for which the Funds do not have knowledge of the inputs used by the broker-dealer are categorized in
| 68
Notes to Financial Statements (continued)
September 30, 2018
Level 3. All security prices, including those obtained from an independent pricing service and broker-dealer bid prices, are reviewed on a daily basis by the adviser, subject to oversight by Fund management and the Board of Trustees. If the adviser, in good faith, believes that the price provided by an independent pricing service is unreliable, broker-dealer bid prices may be used until the price provided by the independent pricing service is considered to be reliable. Reliability of all security prices, including those obtained from an independent pricing service and broker-dealer bid prices, is tested in a variety of ways, including comparison to recent transaction prices and daily fluctuations, amongst other validation procedures in place. Securities for which market quotations are not readily available are valued at fair value as determined in good faith by the Funds’ adviser pursuant to procedures approved by the Board of Trustees. Fair valued securities may be categorized in Level 3.
The following is a summary of the inputs used to value the Funds’ investments as of September 30, 2018, at value:
Investment Grade Bond Fund
Asset Valuation Inputs
| | | | | | | | | | | | | | | | |
Description | | Level 1 | | | Level 2 | | | Level 3 | | | Total | |
Bonds and Notes | | | | | | | | | | | | | | | | |
Non-Convertible Bonds | | | | | | | | | | | | | | | | |
ABS Other | | $ | — | | | $ | 12,542,941 | | | $ | 50,772,266 | (b) | | $ | 63,315,207 | |
Airlines | | | — | | | | 80,162,108 | | | | 7,789,254 | (b) | | | 87,951,362 | |
Finance Companies | | | 1,388,072 | | | | 237,065,814 | | | | — | | | | 238,453,886 | |
Metals & Mining | | | — | | | | 91,088,549 | | | | 845 | (c) | | | 91,089,394 | |
All Other Non-Convertible Bonds(a) | | | — | | | | 2,525,655,880 | | | | — | | | | 2,525,655,880 | |
| | | | | | | | | | | | | | | | |
Total Non-Convertible Bonds | | | 1,388,072 | | | | 2,946,515,292 | | | | 58,562,365 | | | | 3,006,465,729 | |
| | | | | | | | | | | | | | | | |
Convertible Bonds(a) | | | — | | | | 82,845,799 | | | | — | | | | 82,845,799 | |
Municipals(a) | | | — | | | | 18,101,309 | | | | — | | | | 18,101,309 | |
| | | | | | | | | | | | | | | | |
Total Bonds and Notes | | | 1,388,072 | | | | 3,047,462,400 | | | | 58,562,365 | | | | 3,107,412,837 | |
| | | | | | | | | | | | | | | | |
Common Stocks(a) | | | 37,590,298 | | | | — | | | | — | | | | 37,590,298 | |
Preferred Stocks(a) | | | — | | | | 2,652,000 | | | | — | | | | 2,652,000 | |
Short-Term Investments | | | — | | | | 2,003,604,606 | | | | — | | | | 2,003,604,606 | |
| | | | | | | | | | | | | | | | |
Total | | $ | 38,978,370 | | | $ | 5,053,719,006 | | | $ | 58,562,365 | | | $ | 5,151,259,741 | |
| | | | | | | | | | | | | | | | |
| (a) | Details of the major categories of the Fund’s investments are reflected within the Portfolio of Investments. |
| (b) | Valued using broker-dealer bid prices. |
| (c) | Fair valued by the Fund’s adviser. |
69 |
Notes to Financial Statements (continued)
September 30, 2018
Strategic Income Fund
Asset Valuation Inputs
| | | | | | | | | | | | | | | | |
Description | | Level 1 | | | Level 2 | | | Level 3 | | | Total | |
Bonds and Notes | | | | | | | | | | | | | | | | |
Non-Convertible Bonds | | | | | | | | | | | | | | | | |
ABS Other | | $ | — | | | $ | 8,953,489 | | | $ | 20,680,219 | (b)(c) | | $ | 29,633,708 | |
Airlines | | | — | | | | 239,031,709 | | | | 455,986 | (d) | | | 239,487,695 | |
Finance Companies | | | 2,444,830 | | | | 285,125,617 | | | | — | | | | 287,570,447 | |
Metals & Mining | | | — | | | | 90,600,518 | | | | 4,101 | (e) | | | 90,604,619 | |
All Other Non-Convertible Bonds(a) | | | — | | | | 4,807,776,897 | | | | — | | | | 4,807,776,897 | |
| | | | | | | | | | | | | | | | |
Total Non-Convertible Bonds | | | 2,444,830 | | | | 5,431,488,230 | | | | 21,140,306 | | | | 5,455,073,366 | |
| | | | | | | | | | | | | | | | |
Convertible Bonds(a) | | | — | | | | 368,199,658 | | | | — | | | | 368,199,658 | |
Municipals(a) | | | — | | | | 137,186,915 | | | | — | | | | 137,186,915 | |
| | | | | | | | | | | | | | | | |
Total Bonds and Notes | | | 2,444,830 | | | | 5,936,874,803 | | | | 21,140,306 | | | | 5,960,459,939 | |
| | | | | | | | | | | | | | | | |
Loan Participations(a) | | | — | | | | — | | | | 8,343,807 | (d) | | | 8,343,807 | |
Senior Loans(a) | | | — | | | | 92,210,003 | | | | — | | | | 92,210,003 | |
Common Stocks | | | | | | | | | | | | | | | | |
Media | | | — | | | | 3,181,952 | | | | — | | | | 3,181,952 | |
Oil, Gas & Consumable Fuels | | | 3,883,537 | | | | 9,205,668 | | | | — | | | | 13,089,205 | |
Specialty Retail | | | — | | | | — | | | | — | (c) | | | — | |
All Other Common Stocks(a) | | | 438,058,840 | | | | — | | | | — | | | | 438,058,840 | |
| | | | | | | | | | | | | | | | |
Total Common Stocks | | | 441,942,377 | | | | 12,387,620 | | | | — | | | | 454,329,997 | |
| | | | | | | | | | | | | | | | |
Preferred Stocks | | | | | | | | | | | | | | | | |
Convertible Preferred Stocks | | | | | | | | | | | | | | | | |
Independent Energy | | | 9,323,191 | | | | 33,713,599 | | | | — | | | | 43,036,790 | |
Midstream | | | — | | | | 42,300,041 | | | | — | | | | 42,300,041 | |
REITs – Mortgage | | | — | | | | 15,437,576 | | | | — | | | | 15,437,576 | |
All Other Convertible Preferred Stocks(a) | | | 43,632,986 | | | | — | | | | — | | | | 43,632,986 | |
| | | | | | | | | | | | | | | | |
Total Convertible Preferred Stocks | | | 52,956,177 | | | | 91,451,216 | | | | — | | | | 144,407,393 | |
| | | | | | | | | | | | | | | | |
Non-Convertible Preferred Stocks | | | | | | | | | | | | | | | | |
REITs – Office Property | | | — | | | | 1,915,200 | | | | — | | | | 1,915,200 | |
REITs – Warehouse/Industrials | | | — | | | | 7,436,288 | | | | — | | | | 7,436,288 | |
All Other Non-Convertible Preferred Stocks(a) | | | 1,398,785 | | | | — | | | | — | | | | 1,398,785 | |
| | | | | | | | | | | | | | | | |
Total Non-Convertible Preferred Stocks | | | 1,398,785 | | | | 9,351,488 | | | | — | | | | 10,750,273 | |
| | | | | | | | | | | | | | | | |
Total Preferred Stocks | | | 54,354,962 | | | | 100,802,704 | | | | — | | | | 155,157,666 | |
| | | | | | | | | | | | | | | | |
| 70
Notes to Financial Statements (continued)
September 30, 2018
Strategic Income Fund (continued)
Asset Valuation Inputs (continued)
| | | | | | | | | | | | | | | | |
Description | | Level 1 | | | Level 2 | | | Level 3 | | | Total | |
Closed-End Investment Companies | | $ | 3,814,317 | | | $ | — | | | $ | — | | | $ | 3,814,317 | |
Short-Term Investments | | | — | | | | 1,483,010,020 | | | | — | | | | 1,483,010,020 | |
| | | | | | | | | | | | | | | | |
Total | | $ | 502,556,486 | | | $ | 7,625,285,150 | | | $ | 29,484,113 | | | $ | 8,157,325,749 | |
| | | | | | | | | | | | | | | | |
| (a) | Details of the major categories of the Fund’s investments are reflected within the Portfolio of Investments. |
| (b) | Fair valued by the Fund’s adviser ($3,571,492) or fair valued by the Fund’s adviser using broker-dealer bid prices for which the inputs are unobservable to the Fund ($17,108,727). |
| (c) | Includes a security fair valued at zero using Level 3 inputs. |
| (d) | Valued using broker-dealer bid prices. |
| (e) | Fair valued by the Fund’s adviser. |
The following is a reconciliation of Level 3 investments for which significant unobservable inputs were used to determine fair value as of September 30, 2017 and/or September 30, 2018:
Investment Grade Bond Fund
Asset Valuation Inputs
| | | | | | | | | | | | | | | | | | | | |
Investments in Securities | | Balance as of
September 30,
2017 | | | Accrued
Discounts
(Premiums) | | | Realized
Gain
(Loss) | | | Change in
Unrealized
Appreciation
(Depreciation) | | | Purchases | |
Bonds and Notes | | | | | | | | | | | | | | | | | | | | |
Non-Convertible Bonds | | | | | | | | | | | | | | | | | | | | |
ABS Other | | $ | 52,564,401 | | | $ | — | | | $ | 26,515 | | | $ | (5,666 | ) | | $ | — | |
Airlines | | | — | | | | 10,001 | | | | 9,839 | | | | (501,456 | ) | | | — | |
Metals & Mining | | | 676 | | | | 13,647 | | | | — | | | | (13,478 | ) | | | — | |
| | | | | | | | | | | | | | | | | | | | |
Total | | $ | 52,565,077 | | | $ | 23,648 | | | $ | 36,354 | | | $ | (520,600 | ) | | $ | — | |
| | | | | | | | | | | | | | | | | | | | |
71 |
Notes to Financial Statements (continued)
September 30, 2018
Investment Grade Bond Fund (continued)
Asset Valuation Inputs (continued)
| | | | | | | | | | | | | | | | | | | | |
Investments in Securities | | Sales | | | Transfers
into Level 3 | | | Transfers
out of
Level 3 | | | Balance as of
September 30,
2018 | | | Change in
Unrealized
Appreciation
(Depreciation)
from
Investments
Still Held at
September 30,
2018 | |
Bonds and Notes | | | | | | | | | | | | | | | | | | | | |
Non-Convertible Bonds | | | | | | | | | | | | | | | | | | | | |
ABS Other | | $ | (1,812,984 | ) | | $ | — | | | $ | — | | | $ | 50,772,266 | | | $ | — | |
Airlines | | | (1,212,873 | ) | | | 9,483,743 | | | | — | | | | 7,789,254 | | | | (501,456 | ) |
Metals & Mining | | | — | | | | — | | | | — | | | | 845 | | | | (13,478 | ) |
| | | | | | | | | | | | | | | | | | | | |
Total | | $ | (3,025,857 | ) | | $ | 9,483,743 | | | $ | — | | | $ | 58,562,365 | | | $ | (514,934 | ) |
| | | | | | | | | | | | | | | | | | | | |
Debt securities valued at $9,483,743 were transferred from Level 2 to Level 3 during the period ended September 30, 2018. At September 30, 2017, these securities were valued on the basis of evaluated bids furnished to the Fund by an independent pricing service in accordance with the Fund’s valuation policies. At September 30, 2018, these securities were valued using broker-dealer bid prices based on inputs unobservable to the Fund as an independent pricing service did not provide a reliable price for the securities.
All transfers are recognized as of the beginning of the reporting period.
| 72
Notes to Financial Statements (continued)
September 30, 2018
Strategic Income Fund
Asset Valuation Inputs
| | | | | | | | | | | | | | | | | | | | |
Investments in Securities | | Balance as of
September 30,
2017 | | | Accrued
Discounts
(Premiums) | | | Realized
Gain (Loss) | | | Change in
Unrealized
Appreciation
(Depreciation) | | | Purchases | |
Bonds and Notes | | | | | | | | | | | | | | | | | | | | |
Non-Convertible Bonds | | | | | | | | | | | | | | | | | | | | |
ABS Other | | $ | 16,947,329 | (a) | | $ | — | | | $ | — | | | $ | 1,785,527 | | | $ | 1,947,363 | |
Airlines | | | 923 | | | | — | | | | 2,269 | | | | (22,847 | ) | | | — | |
Chemicals | | | 18,072,420 | | | | — | | | | — | | | | — | | | | — | |
Metals & Mining | | | 3,281 | | | | 66,810 | | | | — | | | | (65,990 | ) | | | — | |
Retailers | | | 24,046,500 | | | | — | | | | — | | | | — | | | | — | |
Loan Participations | | | | | | | | | | | | | | | | | | | | |
ABS Other | | | 10,742,735 | | | | — | | | | (14,643 | ) | | | (431,968 | ) | | | — | |
Senior Loans | | | | | | | | | | | | | | | | | | | | |
Consumer Cyclical Services | | | 7,518,416 | | | | — | | | | (5,407 | ) | | | 835,380 | | | | 809,081 | |
Common Stocks | | | | | | | | | | | | | | | | | | | | |
Media | | | 1,757,649 | | | | — | | | | — | | | | — | | | | — | |
Oil, Gas & Consumable Fuels | | | 7,921,777 | (a) | | | — | | | | (22,293,519 | ) | | | 26,629,418 | | | | — | |
Specialty Retail | | | — | | | | — | | | | — | | | | — | | | | — | |
| | | | | | | | | | | | | | | | | | | | |
Total | | $ | 87,011,030 | | | $ | 66,810 | | | $ | (22,311,300 | ) | | $ | 28,729,520 | | | $ | 2,756,444 | |
| | | | | | | | | | | | | | | | | | | | |
73 |
Notes to Financial Statements (continued)
September 30, 2018
Strategic Income Fund (continued)
Asset Valuation Inputs (continued)
| | | | | | | | | | | | | | | | | | | | |
Investments in Securities | | Sales | | | Transfers
into Level 3 | | | Transfers
out of
Level 3 | | | Balance as of
September 30,
2018 | | | Change in
Unrealized
Appreciation
(Depreciation)
from
Investments
Still Held at
September 30,
2018 | |
Bonds and Notes | | | | | | | | | | | | | | | | | | | | |
Non-Convertible Bonds | | | | | | | | | | | | | | | | | | | | |
ABS Other | | $ | — | | | $ | — | | | $ | — | | | $ | 20,680,219 | | | $ | 1,785,527 | |
Airlines | | | (29,284 | ) | | | 505,848 | | | | (923 | ) | | | 455,986 | | | | (22,847 | ) |
Chemicals | | | — | | | | — | | | | (18,072,420 | ) | | | — | | | | — | |
Metals & Mining | | | — | | | | — | | | | — | | | | 4,101 | | | | (65,990 | ) |
Retailers | | | — | | | | — | | | | (24,046,500 | ) | | | — | | | | — | |
Loan Participations | | | | | | | | | | | | | | | | | | | | |
ABS Other | | | (1,952,317 | ) | | | — | | | | — | | | | 8,343,807 | | | | (436,849 | ) |
Senior Loans | | | | | | | | | | | | | | | | | | | | |
Consumer Cyclical Services | | | (9,157,470 | ) | | | — | | | | — | | | | — | | | | — | |
Common Stocks | | | | | | | | | | | | | | | | | | | | |
Media | | | — | | | | — | | | | (1,757,649 | ) | | | — | | | | — | |
Oil, Gas & Consumable Fuels | | | (6,885,524 | ) | | | — | | | | (5,372,152 | )(a) | | | — | | | | — | |
Specialty Retail | | | — | | | | — | | | | — | | | | — | (a) | | | — | |
| | | | | | | | | | | | | | | | | | | | |
Total | | $ | (18,024,595 | ) | | $ | 505,848 | | | $ | (49,249,644 | ) | | $ | 29,484,113 | | | $ | 1,259,841 | |
| | | | | | | | | | | | | | | | | | | | |
| (a) | Includes a security fair valued at zero using Level 3 inputs. |
A debt security valued at $505,848 was transferred from Level 2 to Level 3 during the period ended September 30, 2018. At September 30, 2017, this security was valued on the basis of evaluated bids furnished to the Fund by an independent pricing service in accordance with the Fund’s valuation policies. At September 30, 2018, this security was valued using broker-dealer bid prices based on inputs unobservable to the Fund as an independent pricing service did not provide a reliable price for the security.
| 74
Notes to Financial Statements (continued)
September 30, 2018
A debt security valued at $923 was transferred from Level 3 to Level 2 during the period ended September 30, 2018. At September 30, 2017, this security was valued using broker-dealer bid prices based on inputs unobservable to the Fund as an independent pricing service did not provide a reliable price for the security. At September 30, 2018, this security was valued on the basis of evaluated bids furnished to the Fund by an independent pricing service in accordance with the Fund’s valuation policies.
Debt securities valued at $18,072,420 were transferred from Level 3 to Level 2 during the period ended September 30, 2018. At September 30, 2017, these securities were valued at fair value as determined in good faith by the Fund’s investment adviser as an independent pricing service did not provide a reliable price for the securities. At September 30, 2018, these securities were valued on the basis of evaluated bids furnished to the Fund by an independent pricing service in accordance with the Fund’s valuation policies.
A debt security valued at $24,046,500 was transferred from Level 3 to Level 2 during the period ended September 30, 2018. At September 30, 2017, this security was valued using broker-dealer bid prices based on inputs unobservable to the Fund as an independent pricing service was unable to price the security. At September 30, 2018, this security was valued on the basis of evaluated bids furnished to the Fund by an independent pricing service in accordance with the Fund’s valuation policies.
Common stocks valued at $7,129,801 were transferred from Level 3 to Level 2 during the period ended September 30, 2018. At September 30, 2017, these securities were valued at fair value as determined in good faith by the Fund’s adviser using broker-dealer bid prices for which the inputs are unobservable to the Fund. At September 30, 2018, these securities were valued on the basis of closing bid quotations furnished to the Fund by an independent pricing service in accordance with the Fund’s valuation policies.
All transfers are recognized as of the beginning of the reporting period.
4. Purchases and Sales of Securities. For the year ended September 30, 2018, purchases and sales of securities (excluding short-term investments and including paydowns) were as follows:
| | | | | | | | | | | | | | | | |
| | | U.S. Government/
Agency Securities | | | Other Securities | |
Fund | | Purchases | | | Sales | | | Purchases | | | Sales | |
Investment Grade Bond Fund | | $ | — | | | $ | 829,990,954 | | | $ | 134,824,998 | | | $ | 1,061,927,393 | |
Strategic Income Fund | | | — | | | | 250,000,000 | | | | 438,908,021 | | | | 1,097,100,423 | |
75 |
Notes to Financial Statements (continued)
September 30, 2018
5. Management Fees and Other Transactions with Affiliates.
a. Management Fees. Loomis, Sayles & Company, L.P. (“Loomis Sayles”) serves as investment adviser to each Fund. Under the terms of the management agreements, each Fund pays a management fee at the following annual rates, calculated daily and payable monthly, based on each Fund’s average daily net assets:
| | | | | | | | | | | | | | | | | | | | |
| | | Percentage of Average Daily Net Assets | |
Fund | | First $200 million | | | Next $1.8 billion | | | Next
$13 billion | | | Next
$10 billion | | | Over
$25 billion | |
Investment Grade Bond Fund | | | 0.40 | % | | | 0.40 | % | | | 0.40 | % | | | 0.38 | % | | | 0.38 | % |
Strategic Income Fund | | | 0.65 | % | | | 0.60 | % | | | 0.55 | % | | | 0.54 | % | | | 0.53 | % |
Loomis Sayles has given binding undertakings to the Funds to waive management fees and/or reimburse certain expenses to limit the Funds’ operating expenses, exclusive of acquired fund fees and expenses, brokerage expenses, interest expense, taxes, organizational and extraordinary expenses such as litigation and indemnification expenses. These undertakings are in effect until January 31, 2019, except for Investment Grade Bond Fund which are in effect until January 31, 2020 may be terminated before then only with the consent of the Funds’ Board of Trustees and are reevaluated on an annual basis. Management fees payable, as reflected on the Statements of Assets and Liabilities, is net of waivers and/or expense reimbursements, if any, pursuant to these undertakings. Waivers/reimbursements that exceed management fees payable are reflected on the Statements of Assets and Liabilities as receivable from investment adviser.
For the year ended September 30, 2018 the expense limits as a percentage of average daily net assets under the expense limitation agreements were as follows:
| | | | | | | | | | | | | | | | | | | | |
| | | Expense Limit as a Percentage
of Average Daily Net Assets | |
Fund | | Class A | | | Class C | | | Class N | | | Class Y | | | Admin Class | |
Investment Grade Bond Fund | | | 0.78 | % | | | 1.53 | % | | | 0.48 | % | | | 0.53 | % | | | 1.03 | % |
Strategic Income Fund | | | 1.25 | % | | | 2.00 | % | | | 0.95 | % | | | 1.00 | % | | | 1.50 | % |
Prior to July 1, 2018, the expense limits as a percentage of average daily net assets under the expense limitation agreements for Investment Grade Bond Fund were as follows:
| | | | | | | | | | | | | | | | | | | | |
| | | Expense Limit as a Percentage of
Average Daily Net Assets | |
Fund | | Class A | | | Class C | | | Class N | | | Class Y | | | Admin Class | |
Investment Grade Bond Fund | | | 0.80 | % | | | 1.55 | % | | | 0.50 | % | | | 0.55 | % | | | 1.05 | % |
| 76
Notes to Financial Statements (continued)
September 30, 2018
Loomis Sayles shall be permitted to recover expenses borne under the expense limitation agreements (whether through waiver of management fees or otherwise) on a class by class basis in later periods to the extent the annual operating expenses of a class fall below a class’ expense limits, provided, however, that a class is not obligated to pay such waived/reimbursed fees or expenses more than one year after the end of the fiscal year in which the fees or expenses were waived/reimbursed.
For the year ended September 30, 2018, the management fees for each Fund were as follows:
| | | | | | | | |
Fund | | Gross
Management
Fees | | | Percentage of
Average
Daily Net Assets | |
Investment Grade Bond Fund | | $ | 24,064,905 | | | | 0.40 | % |
Strategic Income Fund | | | 52,154,306 | | | | 0.56 | % |
For the year ended September 30, 2018, class-specific expenses have been reimbursed as follows:
| | | | | | | | | | | | | | | | | | | | | | | | |
| | | Reimbursement1 | |
Fund | | Class A | | | Class C | | | Class N | | | Class Y | | | Admin
Class | | | Total | |
Investment Grade Bond Fund | | $ | 228,064 | | | $ | 152,404 | | | $ | — | | | $ | 878,186 | | | $ | 11,732 | | | $ | 1,270,386 | |
| 1 | Waiver/expense reimbursements are subject to possible recovery until September 30, 2019. |
No expenses were recovered for either Fund during the year ended September 30, 2018 under the terms of the expense limitation agreements.
Certain officers and employees of Loomis Sayles are also officers or Trustees of the Trust. Loomis Sayles’ general partner is indirectly owned by Natixis Investment Managers, L.P. (“Natixis”), which is part of Natixis Investment Managers, an international asset management group based in Paris, France.
b. Service and Distribution Fees. Natixis Distribution, L.P. (“Natixis Distribution”), which is a wholly-owned subsidiary of Natixis, has entered into a distribution agreement with the Trust. Pursuant to this agreement, Natixis Distribution serves as principal underwriter of the Funds of the Trust.
Pursuant to Rule 12b-1 under the 1940 Act, the Trust has adopted a Service Plan relating to each Fund’s Class A shares (the “Class A Plans”), a Distribution and Service Plan relating to each Fund’s Class C shares (the “Class C Plans”), and a Distribution Plan relating to each Fund’s Admin Class shares (the “Admin Class Plans”).
Under the Class A Plans, each Fund pays Natixis Distribution a monthly service fee at an annual rate not to exceed 0.25% of the average daily net assets attributable to the
77 |
Notes to Financial Statements (continued)
September 30, 2018
Fund’s Class A shares, as reimbursement for expenses incurred by Natixis Distribution in providing personal services to investors in Class A shares and/or the maintenance of shareholder accounts.
Under the Class C Plans, each Fund pays Natixis Distribution a monthly service fee at an annual rate not to exceed 0.25% of the average daily net assets attributable to the Fund’s Class C shares, as compensation for services provided by Natixis Distribution in providing personal services to investors in Class C shares and/or the maintenance of shareholder accounts.
Also under the Class C Plans, each Fund pays Natixis Distribution a monthly distribution fee at an annual rate of 0.75% of the average daily net assets attributable to the Funds’ Class C shares, as compensation for services provided by Natixis Distribution in connection with the marketing or sale of Class C shares.
Under the Admin Class Plans, each Fund pays Natixis Distribution a monthly distribution fee at an annual rate not to exceed 0.25% of the average daily net assets attributable to the Fund’s Admin Class shares, as compensation for services provided by Natixis Distribution in connection with the marketing or sale of Admin Class shares or for payments made by Natixis Distribution to securities dealers or other financial intermediaries as commissions, asset-based sales charges or other compensation with respect to the sale of Admin Class shares, or for providing personal services to investors and/or the maintenance of shareholder accounts.
In addition, the Admin Class shares of the Funds may pay Natixis Distribution an administrative service fee, at an annual rate not to exceed 0.25% of the average daily net assets attributable to Admin Class shares. These fees are subsequently paid to securities dealers or financial intermediaries for providing personal services and/or account maintenance for their customers who hold such shares.
For the year ended September 30, 2018, the service and distribution fees for each Fund were as follows:
| | | | | | | | | | | | | | | | | | | | |
| | | Service Fees | | | Distribution Fees | |
Fund | | Class A | | | Class C | | | Admin Class | | | Class C | | | Admin Class | |
Investment Grade Bond Fund | | $ | 2,162,593 | | | $ | 1,409,469 | | | $ | 91,090 | | | $ | 4,228,408 | | | $ | 99,410 | |
Strategic Income Fund | | | 4,737,552 | | | | 4,409,727 | | | | 325,673 | | | | 13,229,181 | | | | 344,436 | |
For the year ended September 30, 2018, Natixis Distribution refunded Investment Grade Bond Fund $8,320 and Strategic Income Fund $18,763 of prior year Admin Class service fees paid to Natixis Distribution in excess of amounts subsequently paid to securities dealers or financial intermediaries. Service and distribution fees on the Statements of Operations have been reduced by these amounts.
| 78
Notes to Financial Statements (continued)
September 30, 2018
c. Administrative Fees. Natixis Advisors, L.P. (“Natixis Advisors”) provides certain administrative services for the Funds and contracts with State Street Bank to serve as sub-administrator. Natixis Advisors is a wholly-owned subsidiary of Natixis. Pursuant to an agreement among Natixis Funds Trusts, Loomis Sayles Funds Trusts, Natixis ETF Trust and Natixis Advisors, each Fund pays Natixis Advisors monthly its pro rata portion of fees equal to an annual rate of 0.0575% of the first $15 billion of the average daily net assets of the Natixis Funds Trusts, Loomis Sayles Funds Trusts and Natixis ETF Trust, 0.0500% of the next $15 billion, 0.0400% of the next $30 billion, 0.0275% of the next $30 billion and 0.0225% of such assets in excess of $90 billion, subject to an annual aggregate minimum fee for the Natixis Funds Trusts, Loomis Sayles Funds Trusts and Natixis ETF Trust of $10 million, which is reevaluated on an annual basis.
Prior to July 1, 2018, each Fund paid Natixis Advisors monthly its pro rata portion of fees equal to an annual rate of 0.0575% of the first $15 billion of the average daily net assets of the Natixis Funds Trusts, Loomis Sayles Funds Trusts and Natixis ETF Trust, 0.0500% of the next $15 billion, 0.0400% of the next $30 billion, 0.0350% of the next $30 billion and 0.0325% of such assets in excess of $90 billion, subject to an annual aggregate minimum fee for the Natixis Funds Trusts, Loomis Sayles Funds Trusts and Natixis ETF Trust of $10 million, which was reevaluated on an annual basis.
For the year ended September 30, 2018, the administrative fees for each Fund were as follows:
| | | | |
Fund | | Administrative
Fees | |
Investment Grade Bond Fund | | $ | 2,648,877 | |
Strategic Income Fund | | | 4,086,855 | |
d. Sub-Transfer Agent Fees. Natixis Distribution has entered into agreements, which include servicing agreements, with financial intermediaries that provide recordkeeping, processing, shareholder communications and other services to customers of the intermediaries that hold positions in the Funds and has agreed to compensate the intermediaries for providing those services. Intermediaries transact with the Funds primarily through the use of omnibus accounts on behalf of their customers who hold positions in the Funds. These services would have been provided by the Funds’ transfer agent and other service providers if the shareholders’ accounts were maintained directly at the Funds’ transfer agent. Accordingly, the Funds have agreed to reimburse Natixis Distribution for all or a portion of the servicing fees paid to these intermediaries. The reimbursement amounts (sub-transfer agent fees) paid to Natixis Distribution are subject to a current per-account equivalent fee limit approved by the Funds’ Board of Trustees, which is based on fees for similar services paid to the Funds’ transfer agent and other service providers. Class N shares do not bear such expenses.
79 |
Notes to Financial Statements (continued)
September 30, 2018
For the year ended September 30, 2018, the sub-transfer agent fees (which are reflected in transfer agent fees and expenses in the Statements of Operations) for each Fund were as follows:
| | | | |
Fund | | Sub-Transfer
Agent Fees | |
Investment Grade Bond Fund | | $ | 4,420,691 | |
Strategic Income Fund | | | 6,954,311 | |
As of September 30, 2018, the Funds owe Natixis Distribution the following reimbursements for sub-transfer agent fees (which are reflected in the Statements of Assets and Liabilities as payable to distributor):
| | | | |
Fund | | Reimbursements
of Sub-Transfer
Agent Fees | |
Investment Grade Bond Fund | | $ | 45,879 | |
Strategic Income Fund | | | 85,632 | |
Sub-transfer agent fees attributable to Class A, Class C, Class Y, and Admin Class are allocated on a pro rata basis to each class based on the relative net assets of each class to the total net assets of those classes.
e. Commissions. Commissions (including CDSCs) on Fund shares retained by Natixis Distribution during the year ended September 30, 2018, were as follows:
| | | | |
Fund | | Commissions | |
Investment Grade Bond Fund | | $ | 42,900 | |
Strategic Income Fund | | | 79,041 | |
f. Trustees Fees and Expenses. The Trust does not pay any compensation directly to its officers or Trustees who are directors, officers or employees of Natixis Advisors, Natixis Distribution, Natixis or their affiliates. The Chairperson of the Board of Trustees receives a retainer fee at the annual rate of $340,000. The Chairperson does not receive any meeting attendance fees for Board of Trustees meetings or committee meetings that he attends. Each Independent Trustee (other than the Chairperson) receives, in the aggregate, a retainer fee at the annual rate of $170,000. Each Independent Trustee also receives a meeting attendance fee of $10,000 for each meeting of the Board of Trustees that he or she attends in person and $5,000 for each meeting of the Board of Trustees that he or she attends telephonically. In addition, the chairperson of the Contract Review Committee and the chairperson of the Audit Committee each receive an additional retainer fee at the annual rate of $20,000. The chairperson of the Governance Committee receives an additional retainer fee at the annual rate of $12,000. Each Contract Review Committee member is compensated $6,000 for each Committee meeting that he or she attends in person and $3,000 for each meeting that he or she
| 80
Notes to Financial Statements (continued)
September 30, 2018
attends telephonically. Each Audit Committee member is compensated $6,000 for each Committee meeting that he or she attends in person and $3,000 for each meeting that he or she attends telephonically. These fees are allocated among the funds in the Natixis Funds Trusts, Loomis Sayles Funds Trusts and Natixis ETF Trust based on a formula that takes into account, among other factors, the relative net assets of each fund. Trustees are reimbursed for travel expenses in connection with attendance at meetings.
Prior to January 1, 2018, the Chairperson of the Board received a retainer fee at the annual rate of $325,000 and each Independent Trustee (other than the Chairperson) received, in the aggregate, a retainer fee at the annual rate of $155,000, the chairperson of the Contract Review Committee and Audit Committee each received an additional retainer fee at the annual rate of $17,500 and the chairperson of the Governance Committee received an additional retainer fee at the annual rate of $10,000. All other Trustee fees remained unchanged.
A deferred compensation plan (the “Plan”) is available to the Trustees on a voluntary basis. Deferred amounts remain in the Funds until distributed in accordance with the provisions of the Plan. The value of a participating Trustee’s deferral account is based on theoretical investments of deferred amounts, on the normal payment dates, in certain funds of the Natixis Funds Trusts, Loomis Sayles Funds Trusts and Natixis ETF Trust as designated by the participating Trustees. Changes in the value of participants’ deferral accounts are allocated pro rata among the funds in the Natixis Funds Trusts, Loomis Sayles Funds Trusts and Natixis ETF Trust, and are normally reflected as Trustees’ fees and expenses in the Statements of Operations. The portions of the accrued obligations allocated to the Funds under the Plan are reflected as Deferred Trustees’ fees in the Statements of Assets and Liabilities.
g. Affiliated Ownership. As of September 30, 2018, Loomis Sayles Employees’ Profit Sharing Retirement Plan held shares of the Investment Grade Bond Fund representing 0.11% of the Fund’s net assets.
Investment activities of affiliated shareholders could have material impacts on the Fund.
6. Class-Specific Transfer Agent Fees and Expenses. Transfer agent fees and expenses attributable to Class A, Class C, Class Y and Admin Class are allocated on a pro rata basis to each class based on the relative net assets of each class to the total net assets of those classes. Transfer agent fees and expenses attributable to Class N are allocated to Class N.
81 |
Notes to Financial Statements (continued)
September 30, 2018
For the year ended September 30, 2018, the Funds incurred the following class-specific transfer agent fees and expenses (including sub-transfer agent fees, where applicable):
| | | | | | | | | | | | | | | | | | | | |
| | | Transfer Agent Fees and Expenses | |
Fund | | Class A | | | Class C | | | Class N | | | Class Y | | | Admin Class | |
Investment Grade Bond Fund | | $ | 840,943 | | | $ | 557,690 | | | $ | 3,203 | | | $ | 3,209,405 | | | $ | 37,396 | |
Strategic Income Fund | | | 1,548,869 | | | | 1,436,184 | | | | 1,978 | | | | 4,347,028 | | | | 112,509 | |
7. Payable to Custodian Bank. The Funds’ custodian bank, State Street Bank, provides overdraft protection to the Funds in the event of a cash shortfall. Cash overdrafts bear interest at a rate per annum equal to the Federal Funds rate plus 2.00%. At September 30, 2018, the Strategic Income Fund had a payable of $7,666,023 to the custodian bank for an inadvertent overdraft due to a security sale transaction not settling as expected.
8. Line of Credit. Effective April 12, 2018, each Fund, together with certain other funds of Natixis Funds Trusts, Loomis Sayles Funds Trusts and Natixis ETF Trust, entered into a $400,000,000 committed unsecured line of credit provided by State Street Bank. Any one Fund may borrow up to $350,000,000 under the line of credit agreement (as long as all borrowings by all Funds in the aggregate do not exceed the $400,000,000 limit at any time), subject to each Fund’s investment restrictions and its contractual obligations under the line of credit. Interest is charged to the Funds based upon the terms set forth in the agreement. In addition, a commitment fee of 0.15% per annum, payable at the end of each calendar quarter, is accrued and apportioned among the participating funds based on their average daily unused portion of the line of credit. The Funds paid an arrangement fee, an upfront fee, and other fees in connection with the new line of credit agreement, which are being amortized over a period of 364 days and are reflected as miscellaneous expenses on the Statements of Operations. The unamortized balance is reflected as prepaid expenses on the Statements of Assets and Liabilities.
Prior to April 12, 2018, each Fund, together with certain other funds of Natixis Funds Trusts and Loomis Sayles Funds Trusts, entered into a 364-day, $400,000,000 syndicated, committed, unsecured line of credit with Citibank, N.A. to be used for temporary or emergency purposes only. Any one Fund was able borrow up to the full $400,000,000 under the line of credit (as long as all borrowings by all Funds in the aggregate did not exceed the $400,000,000 limit at any time), subject to each Fund’s investment restrictions and its contractual obligations under the line of credit. Interest was charged to the Funds at a rate equal to the greater of the eurodollar or the federal funds rate plus 1.00%. In addition, a commitment fee of 0.15% per annum, payable on the last business day of each month, was accrued and apportioned among the participating funds based on their average daily unused portion of the line of credit.
| 82
Notes to Financial Statements (continued)
September 30, 2018
For the year ended September 30, 2018, neither Fund had borrowings under this agreement.
9. Concentration of Risk. Each Fund’s investments in foreign securities are subject to foreign currency fluctuations, higher volatility than U.S. securities, varying degrees of regulation and limited liquidity. Greater political, economic, credit and information risks are also associated with foreign securities.
10. Concentration of Ownership. From time to time, a Fund may have a concentration of one or more accounts constituting a significant percentage of shares outstanding. Investment activities by holders of such accounts could have material impacts on the Funds. As of September 30, 2018, based on management’s evaluation of the shareholder account base, the Investment Grade Bond Fund had accounts representing controlling ownership of more than 5% of the Fund’s total outstanding shares. The number of such accounts, based on accounts that represent more than 5% of an individual class of shares, and the aggregate percentage of net assets represented by such holdings were as follows:
| | | | |
Number of 5%
Account Holders | | Percentage of
Ownership | |
| 2 | | | 24.05 | % |
Omnibus shareholder accounts for which Natixis Advisors understands that the intermediary has discretion over the underlying shareholder accounts or investment models where a shareholder account may be invested for a non-discretionary customer are included in the table above. For other omnibus accounts, the Fund does not have information on the individual shareholder accounts underlying the omnibus accounts; therefore, there could be other 5% shareholders in addition to those disclosed in the table above.
83 |
Notes to Financial Statements (continued)
September 30, 2018
11. Capital Shares. Each Fund may issue an unlimited number of shares of beneficial interest, without par value. Transactions in capital shares were as follows:
| | | | | | | | | | | | | | | | |
| |
| Year Ended
September 30, 2018 |
| |
| Year Ended
September 30, 2017 |
|
Investment Grade Bond Fund | | | Shares | | | | Amount | | | | Shares | | | | Amount | |
| Class A | | | | | | | | | | | | | | | | |
Issued from the sale of shares | | | 26,350,729 | | | $ | 290,166,021 | | | | 19,528,126 | | | $ | 217,152,190 | |
Issued in connection with the reinvestment of distributions | | | 1,939,385 | | | | 21,405,938 | | | | 4,610,265 | | | | 50,116,925 | |
Redeemed | | | (37,379,900 | ) | | | (411,498,034 | ) | | | (41,811,856 | ) | | | (466,635,041 | ) |
| | | | | | | | | | | | | | | | |
Net change | | | (9,089,786 | ) | | $ | (99,926,075 | ) | | | (17,673,465 | ) | | $ | (199,365,926 | ) |
| | | | | | | | | | | | | | | | |
| Class C | | | | | | | | | | | | | | | | |
Issued from the sale of shares | | | 2,011,124 | | | $ | 22,000,351 | | | | 3,086,119 | | | $ | 33,663,672 | |
Issued in connection with the reinvestment of distributions | | | 1,080,461 | | | | 11,807,321 | | | | 3,067,848 | | | | 32,931,990 | |
Redeemed | | | (26,695,866 | ) | | | (290,792,159 | ) | | | (31,785,356 | ) | | | (350,114,834 | ) |
| | | | | | | | | | | | | | | | |
Net change | | | (23,604,281 | ) | | $ | (256,984,487 | ) | | | (25,631,389 | ) | | $ | (283,519,172 | ) |
| | | | | | | | | | | | | | | | |
| Class N | | | | | | | | | | | | | | | | |
Issued from the sale of shares | | | 47,337,549 | | | $ | 520,862,751 | | | | 113,062,434 | | | $ | 1,236,685,568 | |
Issued in connection with the reinvestment of distributions | | | 3,799,061 | | | | 41,897,623 | | | | 2,009,435 | | | | 22,234,080 | |
Redeemed | | | (43,651,422 | ) | | | (478,691,782 | ) | | | (12,720,056 | ) | | | (141,192,418 | ) |
| | | | | | | | | | | | | | | | |
Net change | | | 7,485,188 | | | $ | 84,068,592 | | | | 102,351,813 | | | $ | 1,117,727,230 | |
| | | | | | | | | | | | | | | | |
| Class Y | | | | | | | | | | | | | | | | |
Issued from the sale of shares | | | 83,609,222 | | | $ | 923,226,055 | | | | 96,437,874 | | | $ | 1,075,867,439 | |
Issued in connection with the reinvestment of distributions | | | 8,916,183 | | | | 98,436,771 | | | | 21,650,224 | | | | 235,495,402 | |
Redeemed | | | (124,671,025 | ) | | | (1,373,103,002 | ) | | | (207,134,566 | ) | | | (2,283,144,056 | ) |
| | | | | | | | | | | | | | | | |
Net change | | | (32,145,620 | ) | | $ | (351,440,176 | ) | | | (89,046,468 | ) | | $ | (971,781,215 | ) |
| | | | | | | | | | | | | | | | |
| Admin Class | | | | | | | | | | | | | | | | |
Issued from the sale of shares | | | 9,244,822 | | | $ | 100,929,159 | | | | 658,125 | | | $ | 7,267,683 | |
Issued in connection with the reinvestment of distributions | | | 37,178 | | | | 408,621 | | | | 74,152 | | | | 803,727 | |
Redeemed | | | (1,018,175 | ) | | | (11,215,394 | ) | | | (1,522,308 | ) | | | (16,968,085 | ) |
| | | | | | | | | | | | | | | | |
Net change | | | 8,263,825 | | | $ | 90,122,386 | | | | (790,031 | ) | | $ | (8,896,675 | ) |
| | | | | | | | | | | | | | | | |
Increase (decrease) from capital share transactions | | | (49,090,674 | ) | | $ | (534,159,760 | ) | | | (30,789,540 | ) | | $ | (345,835,758 | ) |
| | | | | | | | | | | | | | | | |
| 84
Notes to Financial Statements (continued)
September 30, 2018
11. Capital Shares (continued).
| | | | | | | | | | | | | | | | |
| |
| Year Ended
September 30, 2018 |
| |
| Year Ended
September 30, 2017 |
|
Strategic Income Fund | | | Shares | | | | Amount | | | | Shares | | | | Amount | |
| Class A | | | | | | | | | | | | | | | | |
Issued from the sale of shares | | | 51,625,278 | | | $ | 738,924,261 | | | | 34,163,244 | | | $ | 498,076,337 | |
Issued in connection with the reinvestment of distributions | | | 4,060,455 | | | | 58,682,435 | | | | 6,886,842 | | | | 98,525,119 | |
Redeemed | | | (52,391,158 | ) | | | (758,110,873 | ) | | | (77,412,456 | ) | | | (1,124,169,037 | ) |
| | | | | | | | | | | | | | | | |
Net change | | | 3,294,575 | | | $ | 39,495,823 | | | | (36,362,370 | ) | | $ | (527,567,581 | ) |
| | | | | | | | | | | | | | | | |
| Class C | | | | | | | | | | | | | | | | |
Issued from the sale of shares | | | 2,803,621 | | | $ | 41,029,278 | | | | 6,318,531 | | | $ | 91,629,894 | |
Issued in connection with the reinvestment of distributions | | | 3,309,104 | | | | 48,333,624 | | | | 6,434,294 | | | | 92,620,761 | |
Redeemed | | | (76,940,917 | ) | | | (1,116,045,348 | ) | | | (94,279,847 | ) | | | (1,380,990,323 | ) |
| | | | | | | | | | | | | | | | |
Net change | | | (70,828,192 | ) | | $ | (1,026,682,446 | ) | | | (81,527,022 | ) | | $ | (1,196,739,668 | ) |
| | | | | | | | | | | | | | | | |
| Class N | | | | | | | | | | | | | | | | |
Issued from the sale of shares | | | 4,812,920 | | | $ | 69,711,732 | | | | 4,399,351 | | | $ | 63,538,392 | |
Issued in connection with the reinvestment of distributions | | | 485,081 | | | | 6,999,401 | | | | 548,523 | | | | 7,855,589 | |
Redeemed | | | (2,582,475 | ) | | | (37,282,778 | ) | | | (4,286,131 | ) | | | (61,729,981 | ) |
| | | | | | | | | | | | | | | | |
Net change | | | 2,715,526 | | | $ | 39,428,355 | | | | 661,743 | | | $ | 9,664,000 | |
| | | | | | | | | | | | | | | | |
| Class Y | | | | | | | | | | | | | | | | |
Issued from the sale of shares | | | 77,541,895 | | | $ | 1,122,643,031 | | | | 122,181,068 | | | $ | 1,771,665,978 | |
Issued in connection with the reinvestment of distributions | | | 12,318,919 | | | | 177,879,588 | | | | 16,052,646 | | | | 229,905,077 | |
Redeemed | | | (118,518,308 | ) | | | (1,716,975,666 | ) | | | (117,951,245 | ) | | | (1,708,750,729 | ) |
| | | | | | | | | | | | | | | | |
Net change | | | (28,657,494 | ) | | $ | (416,453,047 | ) | | | 20,282,469 | | | $ | 292,820,326 | |
| | | | | | | | | | | | | | | | |
| Admin Class | | | | | | | | | | | | | | | | |
Issued from the sale of shares | | | 1,110,070 | | | $ | 16,029,203 | | | | 1,318,704 | | | $ | 19,155,611 | |
Issued in connection with the reinvestment of distributions | | | 336,388 | | | | 4,845,855 | | | | 441,805 | | | | 6,304,627 | |
Redeemed | | | (1,818,549 | ) | | | (26,240,360 | ) | | | (1,879,607 | ) | | | (27,256,147 | ) |
| | | | | | | | | | | | | | | | |
Net change | | | (372,091 | ) | | $ | (5,365,302 | ) | | | (119,098 | ) | | $ | (1,795,909 | ) |
| | | | | | | | | | | | | | | | |
Increase (decrease) from capital share transactions | | | (93,847,676 | ) | | $ | (1,369,576,617 | ) | | | (97,064,278 | ) | | $ | (1,423,618,832 | ) |
| | | | | | | | | | | | | | | | |
12. Subsequent Event. On October 5, 2018, the Board of Trustees approved a change to the fiscal year end of Investment Grade Bond Fund from September 30 to December 31.
85 |
Report of Independent Registered Public Accounting Firm
To the Board of Trustees of Loomis Sayles Funds II and Shareholders of Loomis Sayles Strategic Income Fund and Loomis Sayles Investment Grade Bond Fund:
Opinions on the Financial Statements
We have audited the accompanying statements of assets and liabilities, including the portfolios of investments, of Loomis Sayles Strategic Income Fund and Loomis Sayles Investment Grade Bond Fund (two of the funds constituting Loomis Sayles Funds II, hereafter collectively referred to as the “Funds”) as of September 30, 2018, the related statements of operations for the year ended September 30, 2018, the statements of changes in net assets for each of the two years in the period ended September 30, 2018, including the related notes, and the financial highlights for each of the five years in the period ended September 30, 2018 (collectively referred to as the “financial statements”). In our opinion, the financial statements present fairly, in all material respects, the financial position of each of the Funds as of September 30, 2018, the results of each of their operations for the year then ended, the changes in each of their net assets for each of the two years in the period ended September 30, 2018 and each of the financial highlights for each of the five years in the period ended September 30, 2018 in conformity with accounting principles generally accepted in the United States of America.
Basis for Opinions
These financial statements are the responsibility of the Funds’ management. Our responsibility is to express an opinion on the Funds’ financial statements based on our audits. We are a public accounting firm registered with the Public Company Accounting Oversight Board (United States) (“PCAOB”) and are required to be independent with respect to the Funds in accordance with the U.S. federal securities laws and the applicable rules and regulations of the Securities and Exchange Commission and the PCAOB.
We conducted our audits of these financial statements in accordance with the standards of the PCAOB. Those standards require that we plan and perform the audit to obtain reasonable assurance about whether the financial statements are free of material misstatement, whether due to error or fraud.
Our audits included performing procedures to assess the risks of material misstatement of the financial statements, whether due to error or fraud, and performing procedures that respond to those risks. Such procedures included examining, on a test basis, evidence regarding the amounts and disclosures in the financial statements. Our audits also included evaluating the accounting principles used and significant estimates made by management, as well as evaluating the overall presentation of the financial statements. Our procedures included confirmation of securities owned as of
| 86
Report of Independent Registered Public Accounting Firm
September 30, 2018 by correspondence with the custodian, and brokers; when replies were not received from brokers, we performed other auditing procedures. We believe that our audits provide a reasonable basis for our opinions.
PricewaterhouseCoopers LLP
Boston, Massachusetts
November 20, 2018
We have served as the auditor of one or more investment companies in the Natixis Investment Company Complex since at least 1995. We have not determined the specific year we began serving as auditor.
87 |
2018 U.S. Tax Distribution Information to Shareholders (Unaudited)
Corporate Dividends Received Deduction. For the fiscal year ended September 30, 2018, a percentage of dividends distributed by the Funds listed below qualify for the dividends received deduction for corporate shareholders. These percentages are as follows:
| | | | |
Fund | | Qualifying
Percentage | |
Investment Grade Bond Fund | | | 6.14 | % |
Strategic Income Fund | | | 8.39 | % |
Capital Gains Distributions. Pursuant to Internal Revenue Section 852(b), the following Funds paid distributions, which have been designated as capital gains distributions for the fiscal year ended September 30, 2018, unless subsequently determined to be different.
| | | | |
Fund | | Amount | |
Investment Grade Bond Fund | | $ | 69,650,181 | |
Strategic Income Fund | | | 45,455,828 | |
Qualified Dividend Income. For the fiscal year ended September 30, 2018, the Funds below will designate up to the maximum amount allowable pursuant to the Internal Revenue Code as qualified dividend income eligible for reduced tax rates. These lower rates range from 0% to 20% depending on an individual’s tax bracket. If the Funds pay a distribution during calendar year 2018, complete information will be reported in conjunction with Form 1099-DIV.
| | | | |
Fund | | | |
Investment Grade Bond Fund | | | | |
Strategic Income Fund | | | | |
| 88
Trustee and Officer Information
The tables below provide certain information regarding the trustees and officers of Loomis Sayles Funds II (the “Trust”). Unless otherwise indicated, the address of all persons below is 888 Boylston Street, Suite 800, Boston, MA 02199-8197. The Funds’ Statement of Additional Information includes additional information about the trustees of the Trust and is available by calling Natixis Funds at 800-225-5478.
| | | | | | | | |
Name and Year of Birth | | Position(s) Held
with the Trust,
Length of Time
Served and Term of Office1 | | Principal
Occupation(s)
During Past 5 Years | | Number of
Portfolios in
Fund Complex
Overseen2
and Other
Directorships Held
During Past 5 Years | | Experience,
Qualifications,
Attributes, Skills
for Board Membership |
|
| INDEPENDENT TRUSTEES |
| | | | |
Kenneth A. Drucker (1945) | | Chairperson of the Board of Trustees since January 2017 Trustee since 2008 Ex Officio member of Audit Committee, Contract Review Committee and Governance Committee | | Retired | | 51 None | | Significant experience on the Board and on the boards of other business organizations (including at investment companies); executive experience (including as treasurer of an aerospace, automotive, and metal manufacturing corporation) |
| | | | |
Edmond J. English (1953) | | Trustee since 2013 Audit Committee Member and Governance Committee Member | | Executive Chairman; formerly, Chief Executive Officer of Bob’s Discount Furniture (retail) | | 51 Director, Burlington Stores, Inc. (retail) | | Significant experience on the Board and significant experience on the boards of other business organizations (including retail companies and a bank); executive experience (including at a retail company) |
89 |
Trustee and Officer Information
| | | | | | | | |
Name and Year of Birth | | Position(s) Held
with the Trust,
Length of Time
Served and Term of Office1 | | Principal
Occupation(s)
During Past 5 Years | | Number of
Portfolios in
Fund Complex
Overseen2
and Other
Directorships Held
During Past 5 Years | | Experience,
Qualifications,
Attributes, Skills
for Board Membership |
| | | |
INDEPENDENT TRUSTEES continued | | | | | | |
| | | | |
Richard A. Goglia (1951) | | Trustee since 2015 Audit Committee Member | | Retired; formerly Vice President and Treasurer of Raytheon Company (defense) | | 51 None | | Experience on the Board and executive experience (including his role as vice president and treasurer of a defense company and experience at a financial services company) |
| | | | |
Wendell J. Knox (1948) | | Trustee since 2009 Contract Review Committee Member and Governance Committee Member | | Director of Abt Associates Inc. (research and consulting) | | 51 Director, Eastern Bank (bank); Director, The Hanover Insurance Group (property and casualty insurance) | | Significant experience on the Board and on the boards of other business organizations (including at a bank and at a property and casualty insurance firm); executive experience (including roles as president and chief executive officer of a research and consulting company) |
| 90
Trustee and Officer Information
| | | | | | | | |
Name and Year of Birth | | Position(s) Held
with the Trust,
Length of Time
Served and Term of Office1 | | Principal
Occupation(s)
During Past 5 Years | | Number of
Portfolios in
Fund Complex
Overseen2
and Other
Directorships Held
During Past 5 Years | | Experience,
Qualifications,
Attributes, Skills
for Board Membership |
| | | |
INDEPENDENT TRUSTEES continued | | | | | | |
| | | | |
Martin T. Meehan (1956) | | Trustee since 2012 Audit Committee Member | | President, University of Massachusetts; formerly, Chancellor and faculty member, University of Massachusetts Lowell | | 51 None | | Significant experience on the Board and on the boards of other business organizations; experience as President of the University of Massachusetts; government experience (including as a member of the U.S. House of Representatives); academic experience |
| | | | |
Maureen B. Mitchell (1951) | | Trustee since 2017 Contract Review Committee Member | | Retired; formerly President, Global Sales and Marketing, GE Asset Management, Inc. (financial services) | | 51 Director, Sterling Bancorp (Bank) | | Experience on the Board and on the boards of other business organizations; financial services industry and executive experience (including role as president of global sales and marketing at a financial services company) |
91 |
Trustee and Officer Information
| | | | | | | | |
Name and Year of Birth | | Position(s) Held
with the Trust,
Length of Time
Served and Term of Office1 | | Principal
Occupation(s)
During Past 5 Years | | Number of
Portfolios in
Fund Complex
Overseen2
and Other
Directorships Held
During Past 5 Years | | Experience,
Qualifications,
Attributes, Skills
for Board Membership |
| | | |
INDEPENDENT TRUSTEES continued | | | | | | |
| | | | |
James P. Palermo (1955) | | Trustee since 2016 Contract Review Committee Member | | Founding Partner, Breton Capital Management, LLC (private equity); Partner, STEP Partners, LLC (private equity); formerly, Chief Executive Officer of Global Client Management of The Bank of New York Mellon Corporation | | 51 Director, FutureFuel Corp. (Chemicals and Biofuels) | | Experience on the Board and on the boards of other business organizations; financial services industry and executive experience (including roles as chief executive officer of client management and asset servicing for a banking and financial services company) |
| | | | |
Erik R. Sirri (1958) | | Trustee since 2009 Chairperson of the Audit Committee | | Professor of Finance at Babson College | | 51 None | | Significant experience on the Board; experience as Director of the Division of Trading and Markets at the Securities and Exchange Commission; academic experience; training as an economist |
| | | | |
Peter J. Smail (1952) | | Trustee since 2009 Chairperson of the Contract Review Committee and Governance Committee Member | | Retired | | 51 None | | Significant experience on the Board; mutual fund industry and executive experience (including roles as president and chief executive officer for an investment adviser) |
| 92
Trustee and Officer Information
| | | | | | | | |
Name and Year of Birth | | Position(s) Held
with the Trust,
Length of Time
Served and Term of Office1 | | Principal
Occupation(s)
During Past 5 Years | | Number of
Portfolios in
Fund Complex
Overseen2
and Other
Directorships Held
During Past 5 Years | | Experience,
Qualifications,
Attributes, Skills
for Board Membership |
| | | |
INDEPENDENT TRUSTEES continued | | | | | | |
| | | | |
Cynthia L. Walker (1956) | | Trustee since 2005 Chairperson of the Governance Committee and Audit Committee Member | | Deputy Dean for Finance and Administration, Yale University School of Medicine | | 51 None | | Significant experience on the Board; executive experience in a variety of academic organizations (including roles as dean for finance and administration) |
|
| INTERESTED TRUSTEES |
| | | | |
Kevin P. Charleston3 (1965)
One Financial Center
Boston, MA 02111 | | Trustee since 2015 | | President, Chief Executive Officer and Chairman of the Board of Directors; formerly, Chief Financial Officer, Loomis, Sayles & Company, L.P. | | 51 None | | Experience on the Board; continuing service as President, Chief Executive Officer and Chairman of the Board of Directors of Loomis, Sayles & Company, L.P. |
93 |
Trustee and Officer Information
| | | | | | | | |
Name and Year of Birth | | Position(s) Held
with the Trust,
Length of Time
Served and Term of Office1 | | Principal
Occupation(s)
During Past 5 Years | | Number of
Portfolios in
Fund Complex
Overseen2
and Other
Directorships Held
During Past 5 Years | | Experience,
Qualifications,
Attributes, Skills
for Board Membership |
| | | |
INTERESTED TRUSTEES continued | | | | | | |
| | | | |
David L. Giunta4 (1965) | | Trustee since 2011 President of Loomis Sayles Funds II since 2008; Chief Executive Officer of Loomis Sayles Funds II since 2015 | | President and Chief Executive Officer, Natixis Advisors, L.P., Natixis Distribution, L.P., Natixis Distribution Corporation and Chairman of the Board of Natixis Distribution Corporation | | 51 None | | Significant experience on the Board; experience as President and Chief Executive Officer, Natixis Advisors, L.P., Natixis Distribution, L.P., Natixis Distribution Corporation and Chairman of the Board of Natixis Distribution Corporation |
| 1 | Each trustee serves until retirement, resignation or removal from the Board. The current retirement age is 75. The position of Chairperson of the Board is appointed for a three-year term. |
| 2 | The trustees of the Trust serve as trustees of a fund complex that includes all series of the Natixis Funds Trust I, Natixis Funds Trust II, Natixis Funds Trust IV, Gateway Trust, Loomis Sayles Funds I, Loomis Sayles Funds II and Natixis ETF Trust (collectively, the “Fund Complex”). |
| 3 | Mr. Charleston is deemed an “interested person” of the Trust because he holds the following positions with an affiliated person of the Trust: President, Chief Executive Officer and Chairman of the Board of Directors of Loomis, Sayles & Company, L.P. |
| 4 | Mr. Giunta is deemed an “interested person” of the Trust because he holds the following positions with an affiliated person of the Trust: President and Chief Executive Officer, Natixis Advisors, L.P., Natixis Distribution, L.P., Natixis Distribution Corporation and Chairman of the Board of Natixis Distribution Corporation. |
| 94
Trustee and Officer Information
| | | | | | |
Name and Year of Birth | | Position(s) Held with the Trust | | Term of Office1 and Length of Time Served | | Principal Occupation(s) During Past 5 Years2 |
|
| OFFICERS OF THE TRUST |
| | | |
Daniel J. Fuss (1933)
One Financial Center
Boston, MA 02111 | | Executive Vice President | | Since June 2003 | | Vice Chairman and Director, Loomis, Sayles & Company, L.P. |
| | | |
Russell L. Kane (1969) | | Secretary, Clerk and Chief Legal Officer | | Since July 2016 | | Executive Vice President, General Counsel, Secretary and Clerk, Natixis Distribution Corporation, Natixis Advisors, L.P. and Natixis Distribution, L.P.; formerly, Chief Compliance Officer for Mutual Funds, Senior Vice President, Deputy General Counsel, Assistant Secretary and Assistant Clerk, Natixis Distribution Corporation, Natixis Advisors, L.P. and Natixis Distribution, L.P. |
| | | |
Michael C. Kardok (1959) | | Treasurer, Principal Financial and Accounting Officer | | Since October 2004 | | Senior Vice President, Natixis Advisors, L.P. and Natixis Distribution, L.P. |
95 |
Trustee and Officer Information
| | | | | | |
Name and Year of Birth | | Position(s) Held with the Trust | | Term of Office1 and Length of Time Served | | Principal Occupation(s) During Past 5 Years2 |
| | |
OFFICERS OF THE TRUST
continued | | | | |
| | | |
Rosa Licea-Mailloux (1976) | | Chief Compliance Officer, Assistant Secretary and Anti-Money Laundering Officer | | Since July 2016 | | Senior Vice President, Deputy General Counsel, Assistant Secretary and Assistant Clerk, Natixis Distribution Corporation, Natixis Advisors, L.P. and Natixis Distribution, L.P.; formerly, Associate General Counsel, Natixis Distribution, L.P. |
| 1 | Each officer of the Trust serves for an indefinite term in accordance with the Trust’s current by-laws until the date his or her successor is elected and qualified, or until he or she sooner dies, retires, is removed or becomes disqualified. |
| 2 | Each person listed above, except as noted, holds the same position(s) with the Fund Complex. Previous positions during the past five years with Natixis Distribution, L.P., Natixis Advisors, L.P. or Loomis, Sayles & Company, L.P. are omitted, if not materially different from an officer’s current position with such entity. |
| 96
Item 2. Code of Ethics.
The Registrant has adopted a code of ethics that applies to the Registrant’s principal executive officer, principal financial officer and persons performing similar functions. There have been no amendments or waivers of the Registrant’s code of ethics during the period.
Item 3. Audit Committee Financial Expert.
The Board of Trustees of the Registrant has established an audit committee. Mr. Edmond J. English, Mr. Richard A. Goglia, Mr. Martin T. Meehan, Mr. Erik R. Sirri and Ms. Cynthia L. Walker are members of the audit committee and have been designated as “audit committee financial experts” by the Board of Trustees. Each of these individuals is also an Independent Trustee of the Registrant.
Item 4. Principal Accountant Fees and Services.
Fees billed by the Principal Accountant for services rendered to the Registrant.
The table below sets forth fees billed by the principal accountant, PricewaterhouseCoopers LLP, for the past two fiscal years for professional services rendered in connection with a) the audit of the Registrant’s annual financial statements and services provided in connection with regulatory filings; b) audit-related services (including services that are reasonably related to the performance of the audit of the Registrant’s financial statements and but not reported under “Audit Fees”); c) tax compliance, tax advice and tax planning and d) all other fees billed for professional services rendered by the principal accountant to the Registrant, other than the services reported as a part of (a) through (c) of this Item.
| | | | | | | | | | | | | | | | | | | | | | | | | | | | | | | | |
| | | Audit fees | | | Audit-related fees1 | | | Tax fees2 | | | All other fees | |
| | | 10/1/16-
9/30/17 | | | 10/1/17-
9/30/18 | | | 10/1/16-
9/30/17 | | | 10/1/17-
9/30/18 | | | 10/1/16-
9/30/17 | | | 10/1/17-
9/30/18 | | | 10/1/16-
9/30/17 | | | 10/1/17-
9/30/18 | |
Loomis Sayles Funds II | | $ | 379,111 | | | $ | 345,589 | | | $ | 15,384 | | | $ | 4,749 | | | $ | 148,072 | | | $ | 65,572 | | | $ | — | | | $ | — | |
| | 1. | Audit-related fees consist of: |
| | | 2017 & 2018 — performance of agreed-upon procedures related to the Registrant’s deferred compensation plan. |
| | | 2017 & 2018 — review of Registrant’s tax returns. |
Aggregate fees billed to the Registrant for non-audit services during 2017 and 2018 were $163,456 and $70,321, respectively.
Fees billed by the Principal Accountant for services rendered to the Adviser and Control Affiliates.
The following table sets forth the fees billed by the Registrant’s principal accountant for non-audit services rendered to Loomis, Sayles & Company, L.P. and entities controlling, controlled by or under common control with Loomis, Sayles & Company, L.P. Registrant (“Control Affiliates”) that provide ongoing services to the Registrant, for engagements that related directly to the operations and financial reporting of the Registrant for the last two fiscal years.
| | | | | | | | | | | | | | | | | | | | | | | | |
| | | Audit-related fees | | | Tax fees | | | All other fees | |
| | | 10/1/16-
9/30/17 | | | 10/1/17-
9/30/18 | | | 10/1/16-
9/30/17 | | | 10/1/17-
9/30/18 | | | 10/1/16-
9/30/17 | | | 10/1/17-
9/30/18 | |
Control Affiliates | | $ | — | | | $ | — | | | $ | — | | | $ | — | | | $ | — | | | $ | — | |
The following table sets forth the aggregate fees billed by the Registrant’s principal accountant for non-audit services rendered to Loomis, Sayles & Company, L.P. and Control Affiliates that provide ongoing services to the Registrant, for the last two fiscal years, including the fees disclosed in the table above.
| | | | | | | | |
| | | Aggregate Non-Audit Fees | |
| | | 10/1/16-
9/30/17 | | | 10/1/17-
9/30/18 | |
Control Affiliates | | $ | 77,290 | | | $ | 62,411 | |
None of the services described above were approved pursuant to (c)(7)(i)(C) of Regulation S-X.
Audit Committee Pre Approval Policies.
Annually, the Registrant’s Audit Committee reviews the audit, audit-related, tax and other non-audit services together with the projected fees, for services proposed to be rendered to the Trust and/or other entities for which pre-approval is required during the upcoming year. Any subsequent revisions to already pre-approved services or fees (including fee increases) and requests for pre-approval of new services would be presented for consideration quarterly as needed.
If, in the opinion of management, a proposed engagement by the Registrant’s independent accountants needs to commence before the next regularly scheduled Audit Committee meeting, any member of the Audit Committee who is an independent Board member is authorized to pre-approve the engagement, but only for engagements to provide audit, audit related and tax services. This approval is subject to review of the full Audit Committee at its next quarterly meeting. All other engagements require the approval of all the members of the Audit Committee.
Item 5. Audit Committee of Listed Registrants.
Not applicable.
Item 6. Schedule of Investments.
Included as part of the Report to Shareholders filed as Item 1 herewith.
Item 7. Disclosure of Proxy Voting Policies and Procedures for Closed-End Management Investment Companies.
Not applicable.
Item 8. Portfolio Managers of Closed-End Management Investment Companies
Not applicable.
Item 9. Purchases of Equity Securities by Closed-End Management Investment Companies and Affiliated Purchasers.
Not applicable.
Item 10. Submission of Matters to a Vote of Securities Holders.
There were no material changes to the procedures by which shareholders may recommend nominees to the Registrant’s Board of Trustees.
Item 11. Controls and Procedures.
The Registrant’s principal executive officer and principal financial officer have concluded that the Registrant’s disclosure controls and procedures are sufficient to ensure that information required to be disclosed by the Registrant in this Form N-CSR was recorded, processed, summarized and reported within the time periods specified in the Securities and Exchange Commission’s rules and forms, based upon such officers’ evaluation of these controls and procedures as of a date within 90 days of the filing date of the report.
There were no changes in the Registrant’s internal control over financial reporting that occurred during the Registrant’s last fiscal quarter of the period covered by the report that has materially affected, or is reasonably likely to materially affect, the Registrant’s internal control over financial reporting.
Item 12. Disclosure of Securities Lending Activities for Closed-End Management Investment Companies.
Not applicable.
Item 13. Exhibits.
| | |
| |
| (a) (1) | | Code of Ethics required by Item 2 hereof, filed herewith as Exhibit (a)(1). |
| |
| (a) (2) | | Certifications of Principal Executive Officer and Principal Financial Officer pursuant to Rule 30a-2(a) under the Investment Company Act of 1940 (17 CFR 270.30a-2(a)), filed herewith as Exhibits (a)(2)(1) and (a)(2)(2), respectively. |
| |
| (a) (3) | | Not applicable. |
| |
| (b) | | Certification of Principal Executive Officer and Principal Financial Officer pursuant to Section 906 of Sarbanes-Oxley Act of 2002 are filed herewith as Exhibit (b). |
SIGNATURES
Pursuant to the requirements of the Securities Exchange Act of 1934 and the Investment Company Act of 1940, the Registrant has duly caused this report to be signed on its behalf by the undersigned, thereunto duly authorized.
| | |
| Loomis Sayles Funds II |
| |
| By: | | /s/ David L. Giunta |
| | |
| |
Name: Title: Date: | | David L. Giunta President and Chief Executive Officer November 20, 2018 |
Pursuant to the requirements of the Securities Exchange Act of 1934 and the Investment Company Act of 1940, this report has been signed by the following persons on behalf of the Registrant and in the capacities and on the dates indicated.
| | |
| |
Name: Title: Date: | | David L. Giunta President and Chief Executive Officer November 20, 2018 |
| | |
| By: | | /s/ Michael C. Kardok |
| | |
| |
Name: Title: Date: | | Michael C. Kardok Treasurer November 20, 2018 |