UNITED STATES
SECURITIES AND EXCHANGE COMMISSION
Washington, D.C. 20549
FORM N-CSR
CERTIFIED SHAREHOLDER REPORT OF REGISTERED
MANAGEMENT INVESTMENT COMPANIES
Investment Company Act file number: 811-06241
Loomis Sayles Funds II
(Exact name of Registrant as specified in charter)
888 Boylston Street, Suite 800 Boston, Massachusetts 02199-8197
(Address of principal executive offices) (Zip code)
Susan McWhan Tobin, Esq.
Natixis Distribution, LLC
888 Boylston Street, Suite 800
Boston, Massachusetts 02199-8197
(Name and address of agent for service)
Registrant’s telephone number, including area code: (617) 449-2139
Date of fiscal year end: September 30
Date of reporting period: September 30, 2023
Item 1. Reports to Stockholders.
(a) The Registrant’s annual report transmitted to shareholders pursuant to Rule 30e-1 under the Investment Company Act of 1940 is as follows:
Annual Report
September 30, 2023
Loomis Sayles Core Plus Bond Fund |
Loomis Sayles Credit Income Fund |
Loomis Sayles Global Allocation Fund |
Loomis Sayles Growth Fund |
Loomis Sayles Intermediate Duration Bond Fund |
Loomis Sayles Limited Term Government and Agency Fund |
Loomis Sayles Core Plus Bond Fund
|
|
|
|
|
Loomis, Sayles & Company, L.P. |
Investment GoalThe Fund seeks high total investment return through a combination of current income and capital appreciation.
Market Conditions
The US fixed income market produced a narrow gain in the 12 months ended September 30, 2023, albeit with a high level of volatility along the way. The majority of positive return occurred in the early part of the period. During this time, signs of cooling inflation and slightly more dovish commentary from US Federal Reserve (Fed) officials raised hopes that the central bank was approaching the end of its long series of interest rate hikes, even as the Fed continued to raise rates. This backdrop changed for the worse as crude oil prices surged to their highest level since July 2022, raising the possibility that inflation—which had been ticking lower since late last year—would begin to reaccelerate. In addition to being hurt by the prospect of rising rates, US Treasuries faced pressure from increased supply due to the need to fund the nation’s burgeoning debt load. Later in the period, the possibility of a government shutdown emerged as an additional source of instability for the market.
Investment grade corporate bonds logged robust, broad-based gains and strongly outperformed Treasuries. The category was helped by both its yield advantage and a decline in its yield spread relative to government issues. Lower-rated bonds, shorter-term debt, and economically sensitive issues exhibited leadership. High yield corporate bonds delivered a strong, double-digit gain and finished well ahead of the investment grade market, mostly due to its lower degree of sensitivity to interest rates. A large contribution from yield helped results, as did a decline in yield spreads brought about by investors’ elevated appetite for risk.
Floating rate securitized credit sectors displayed outperformance versus corporates and the broader fixed income markets. Agency mortgage-backed securities (MBS) continued to suffer from unfavorable supply/demand dynamics. Despite elevated levels of rate volatility, agency MBS outperformed US Treasuries over the period.
Performance Results
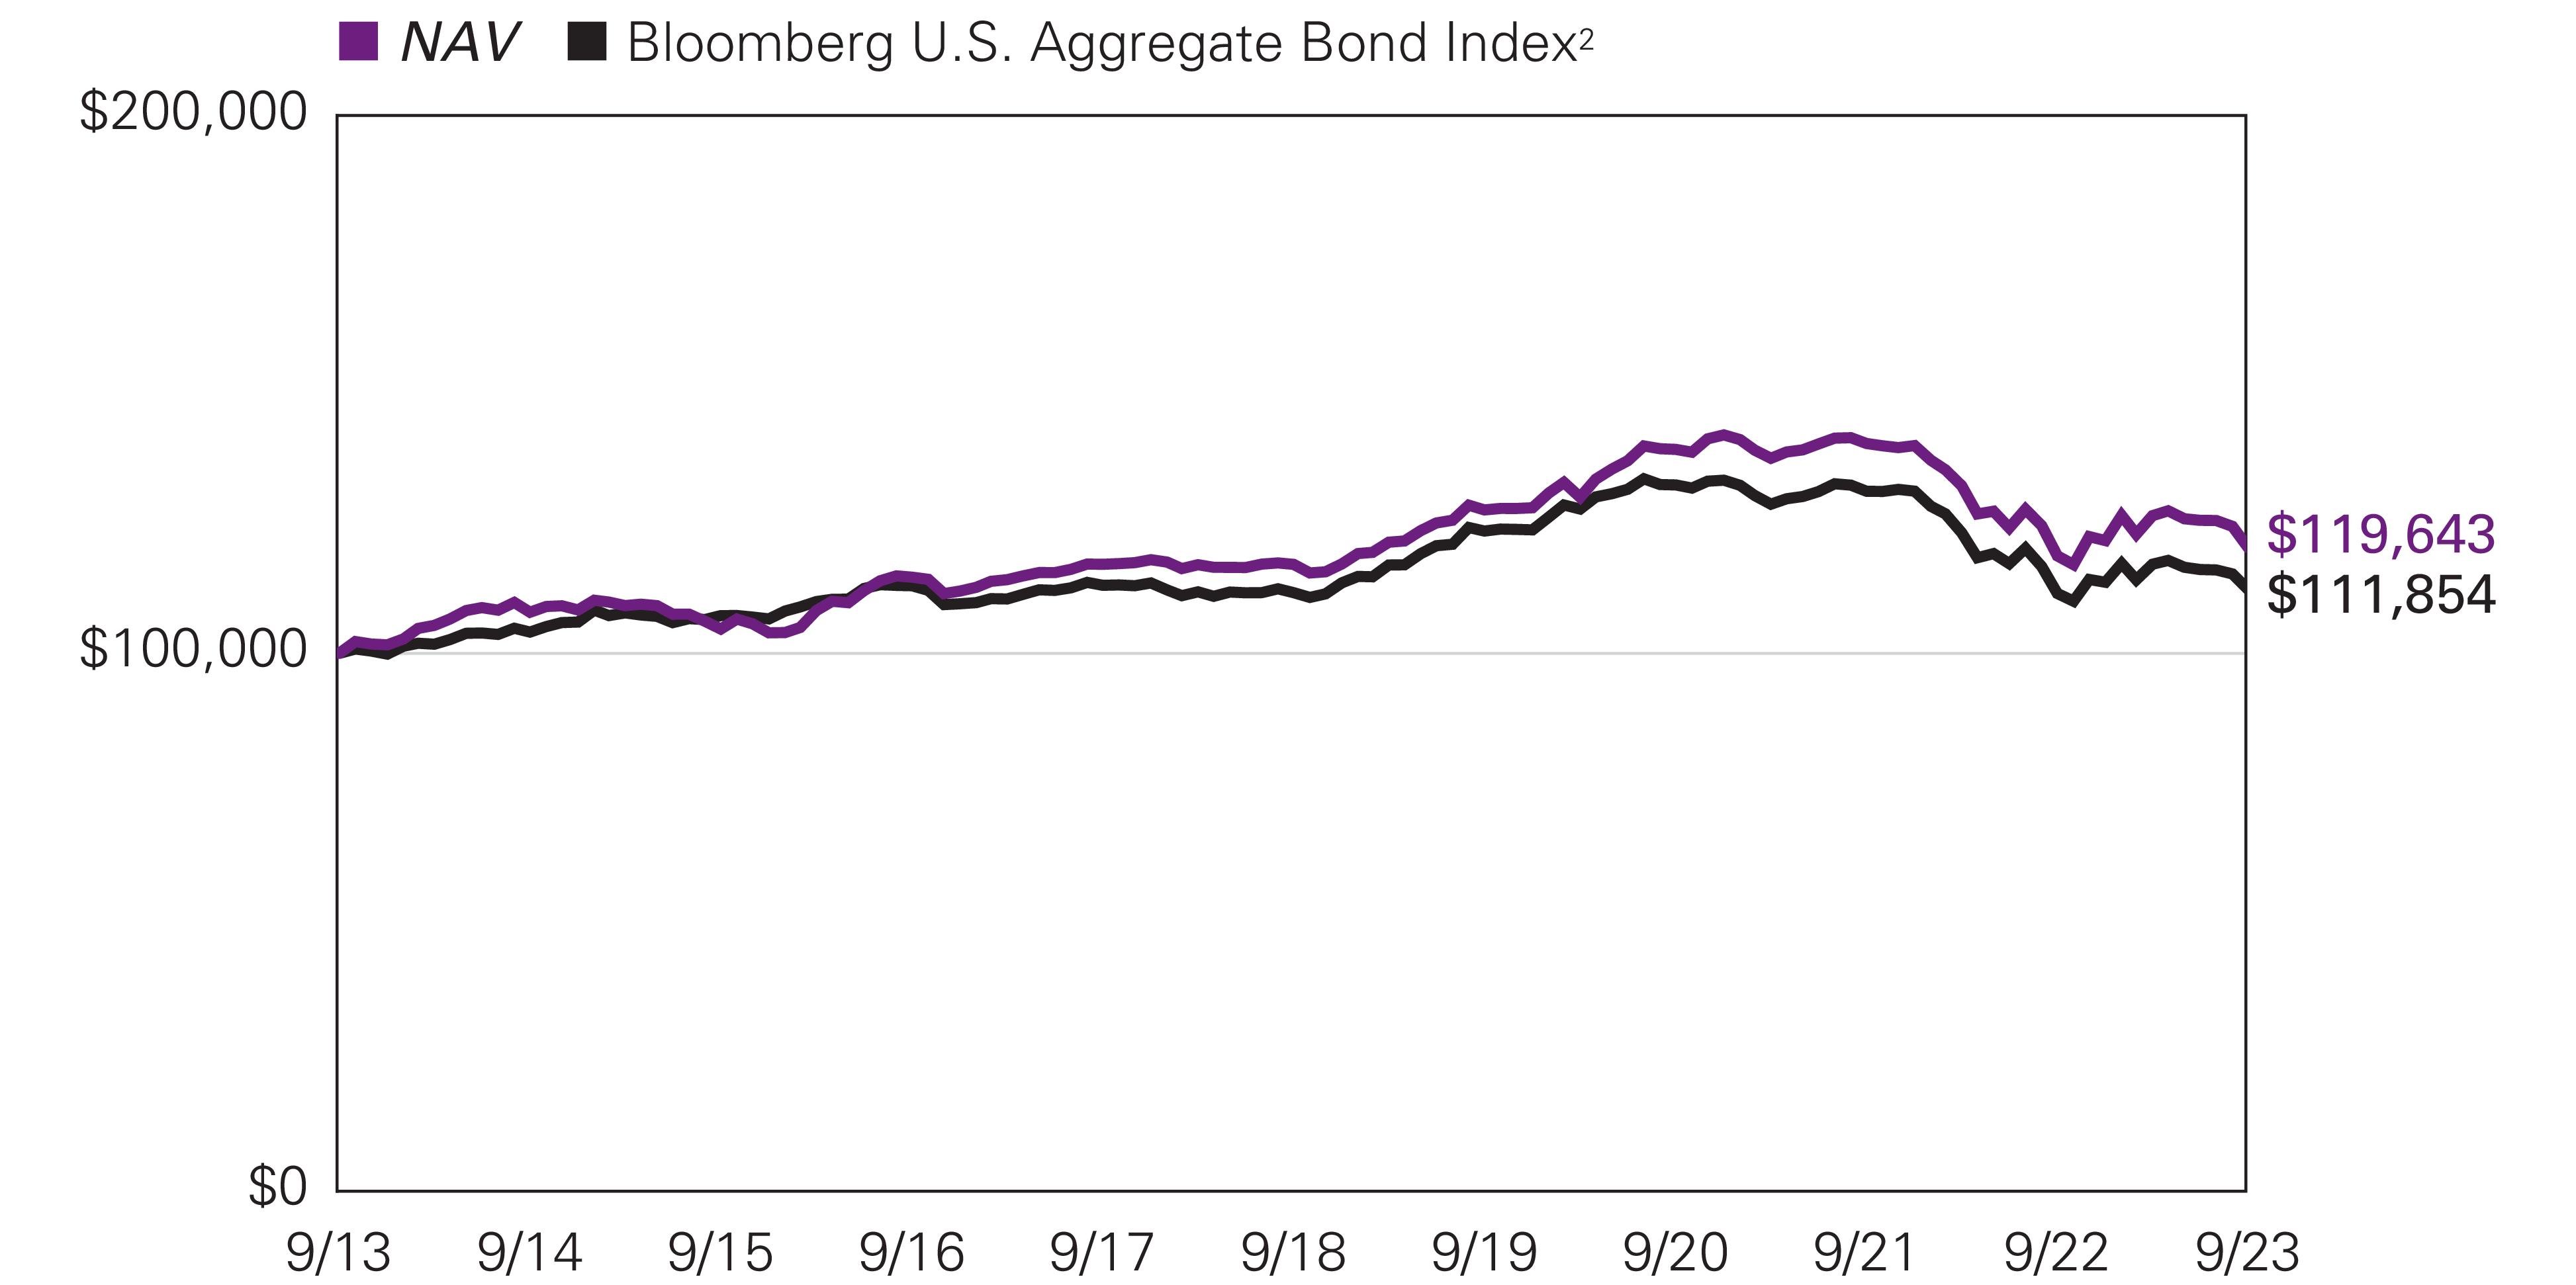
For the 12 months ended September 30, 2023, Class Y shares of the Loomis Sayles Core Plus Bond Fund returned 1.28% at net asset value. The Fund outperformed its benchmark, the Bloomberg US Aggregate Bond Index, which returned 0.64%.
Explanation of Fund Performance
The Fund’s excess returns over the trailing twelve months were primarily driven by sector allocation. Out-of-benchmark positions in “plus” sectors were the most impactful. We currently hold non-US dollar local government emerging market bonds in Mexico and Uruguay, which has been an important source of diversification and yield. Our allocation to high yield was also additive, due to spread tightening over the period and its lower interest rate sensitivity in general. Allocations to floating rate bank loans and collateralized loan obligations (CLOs) contributed positively, also a result of lower interest rate sensitivity. Within the “core” sectors, the Fund’s market value underweight to US Treasuries contributed to positive relative performance, while the underweight to investment grade corporates was a detractor.
Security selection over the period was also positive, as our relative value process identified issues and issuers which outperformed the benchmark across investment grade corporate, securitized credit, government-related, and securitized agency sectors. Securities held within the finance companies, banking, and electric utilities industries contributed the most to corporate-specific returns. Within government-related, our security selection in sovereigns was a contributor, while our decision not to own supranationals detracted. A 2% allocation to non-agency commercial mortgage-backed securities (CMBS), diversified across retail, office, and hospitality, also detracted.
The primary detractor from relative performance was due to duration and yield curve positioning. The Fund’s interest rate risk, as measured by duration, was higher than that of the benchmark by 1.3 years. This detracted from relative value in an environment of rising yields. Additionally, our decision to concentrate in the belly of the yield curve modestly detracted from relative returns. We are
Loomis Sayles Core Plus Bond Fund
expressing our duration and curve views through US Treasuries and utilizing interest rate futures to make adjustments efficiently. Exposure to Ultra Bond interest rate futures, which effectively increased the Fund’s allocation to the long end of the curve, detracted from performance.
Outlook
We continue to believe that we remain in the very late expansion phase of the credit cycle1, and that the significant increase in rates is now starting to impact business and consumer spending decisions. Corporate and consumer balance sheets have begun to show some signs of strain, and we expect the lagged effects of tighter credit conditions on the real economy will eventually translate to employment pressure and corporate profit degradation. Should growth and inflation sufficiently moderate over the coming three-to-six-month period, we think the Fed can pause hiking at or near the current 5.5% fed funds rate, and then consider easing policy somewhat starting in early summer 2024. This "soft landing" scenario is also currently the stated goal of the Fed. Recession risk could continue to be a factor if incoming economic data obscures the true impact of higher rates and restrictive monetary policy pushes the economy into downturn. We believe interest rates are likely to fall in either of those scenarios and are positioned with more interest rate risk in the portfolio relative to our benchmark. Our yield curve positioning continues to be concentrated in the five-to-ten-year part of the curve, an expression of our view that the yield curve will steepen, with short-term rates falling more sharply than long-term rates. The primary risk we face is that inflation remains above the Fed’s target, and doesn't moderate as we forecast, in which case we could see more rate hikes, and a peak fed funds rate of 6% or higher.
Portfolio liquidity remains at cycle highs, with nearly 40% of the portfolio in US Treasuries and cash equivalents. Looking ahead, we expect Treasury valuations to be supported by slowing economic activity and decelerating inflation. Additionally, Treasuries are a source of significant liquidity for re-entering credit sectors, should tangible signs of economic weakness cause credit spreads to widen from current levels. Weaker agency MBS valuations provided an opportunity to add to the sector in August, although we remain modestly underweight. In our view, MBS remain an attractive alternative to credit securities given their high current yield, return potential and the full backing of the US agencies. Within investment grade corporate credit, we remain approximately 8% market value underweight. We have a modest bias towards BBB-rated securities for incremental carry and tend to favor industries that we believe are less economically sensitive.
We have a large overweight to investment grade securitized credit, primarily in the front end of the yield curve for more defensive, non-corporate yield. We continue to favor higher-rated asset-backed securities (ABS) related to consumer receivables, as well as whole loan ABS, and have minimal exposure to commercial real estate.
Within the plus sectors, we have continued to reduce our overall allocation to high yield, which is currently approximately 5% in fixed rate high yield corporates, including just over 1% in emerging market high yield corporates. We have been incrementally reducing high yield exposure in response to the Fed's aggressive tightening path along with growing signs of economic slowdown. We have rotated bank loan exposure to high quality, investment grade CLOs, which are now at approximately 3%. We currently hold a 3.3% allocation to non-US dollar, now evenly split between Mexico and Uruguay, after monetizing a portion of our Mexican exposure to lock in significant gains.
1 A credit cycle is a cyclical pattern that follows credit availability and corporate health.
Loomis Sayles Core Plus Bond Fund
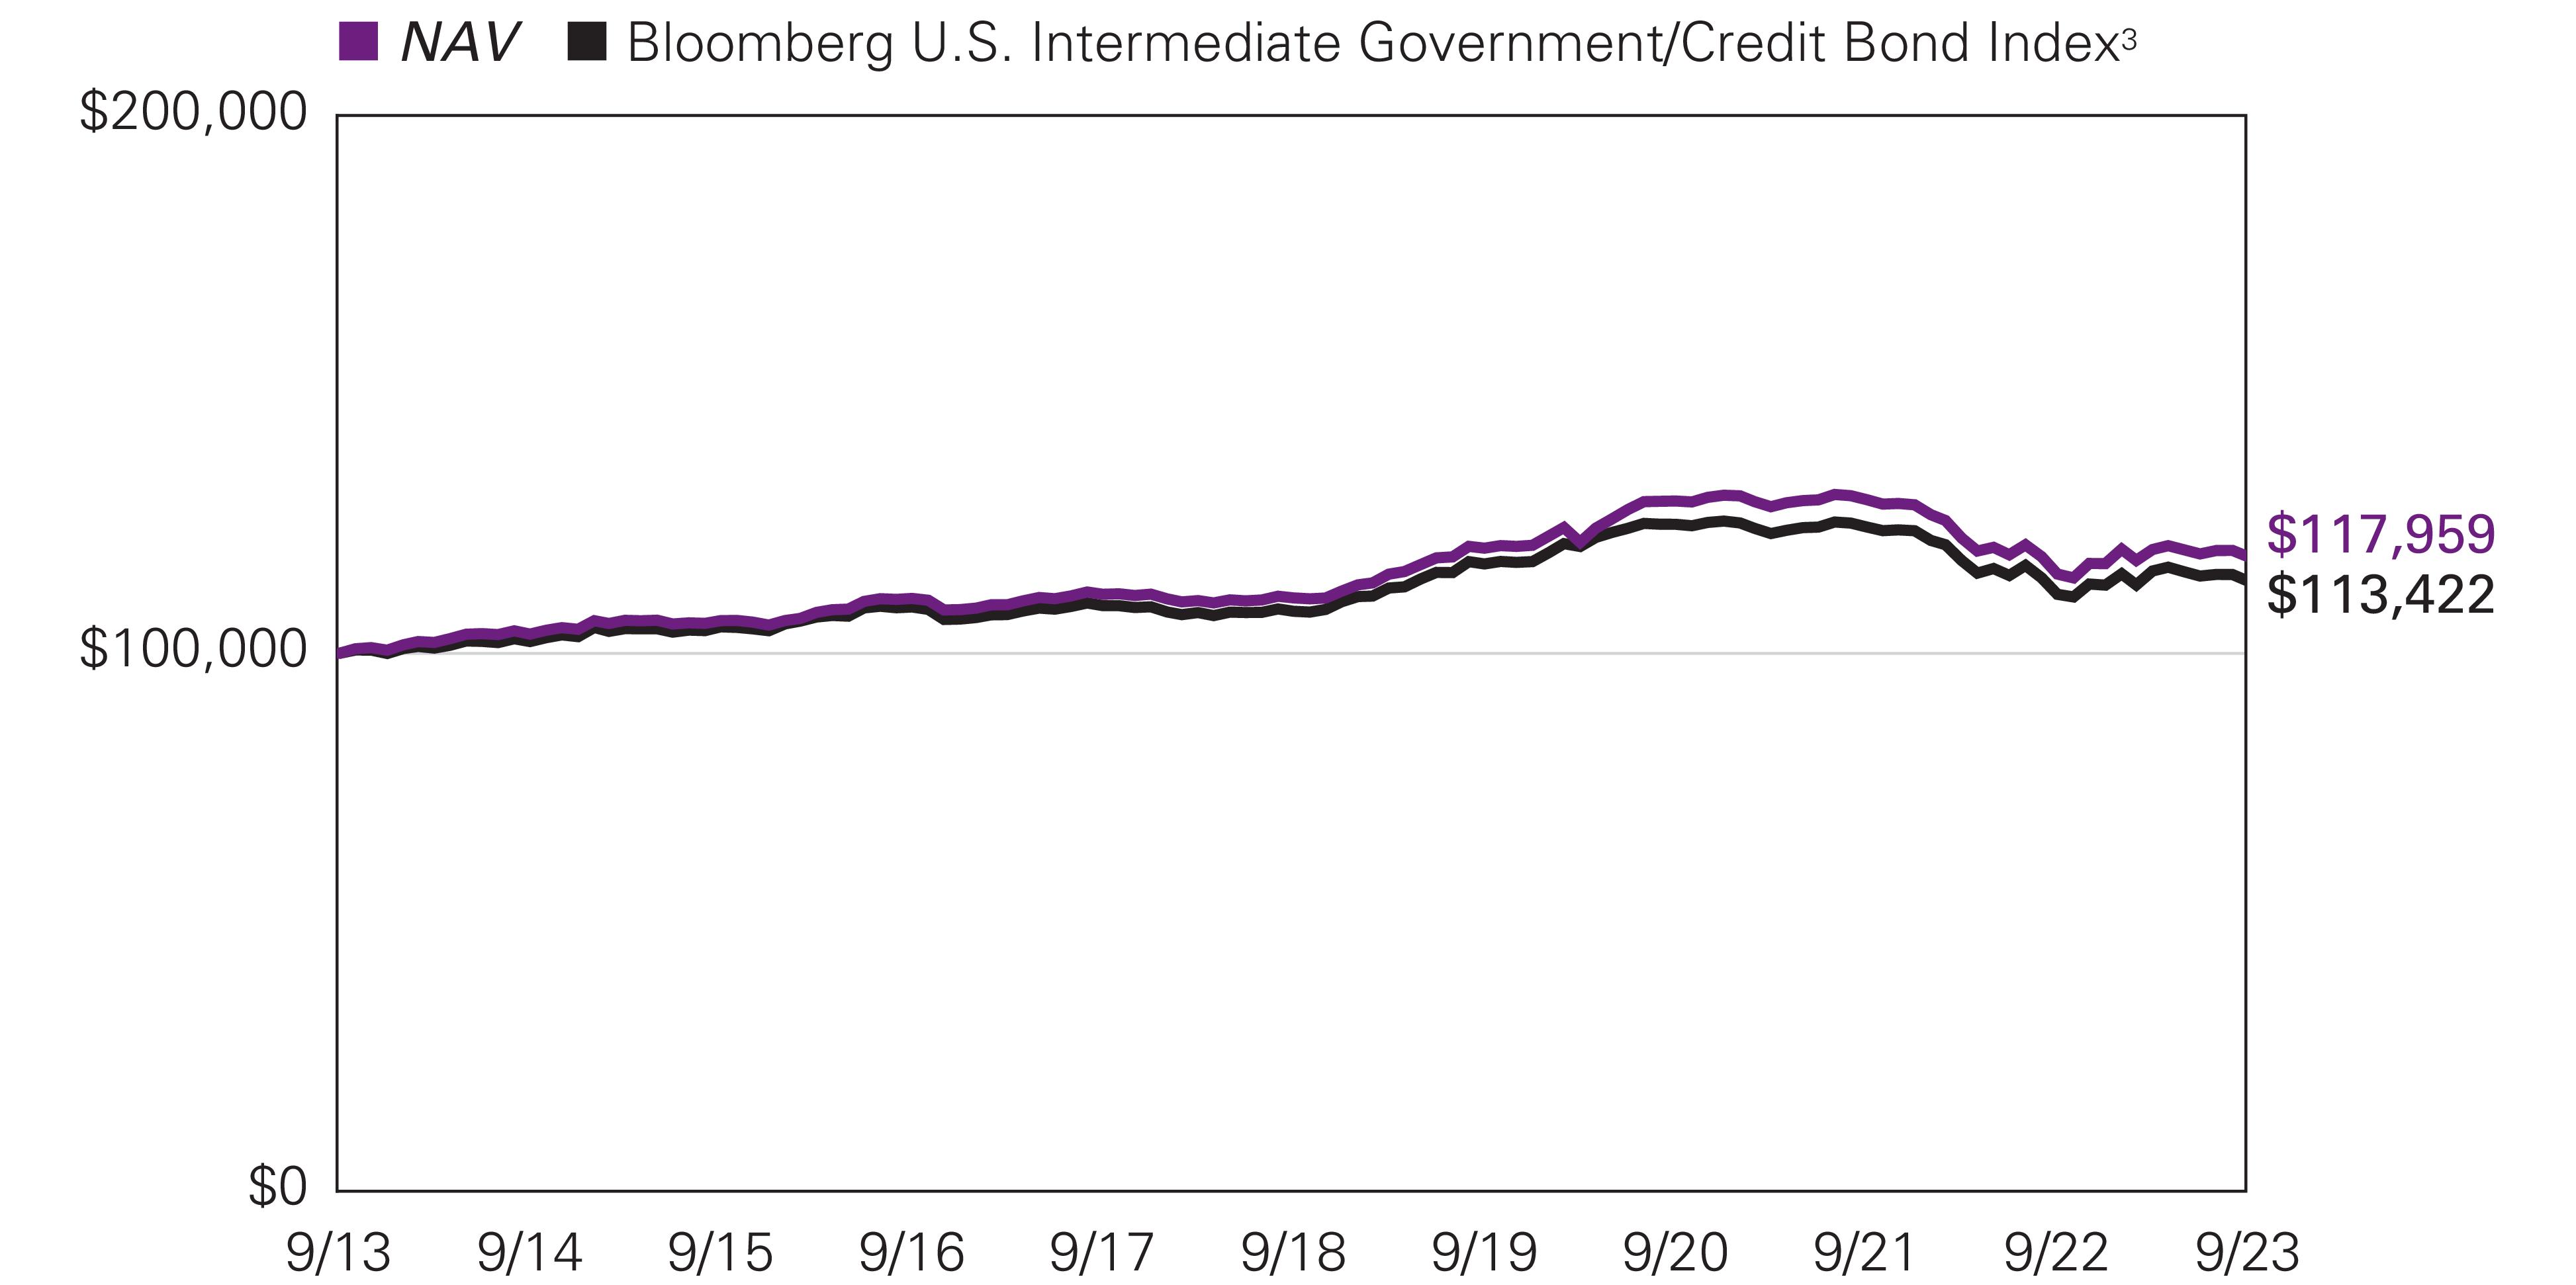
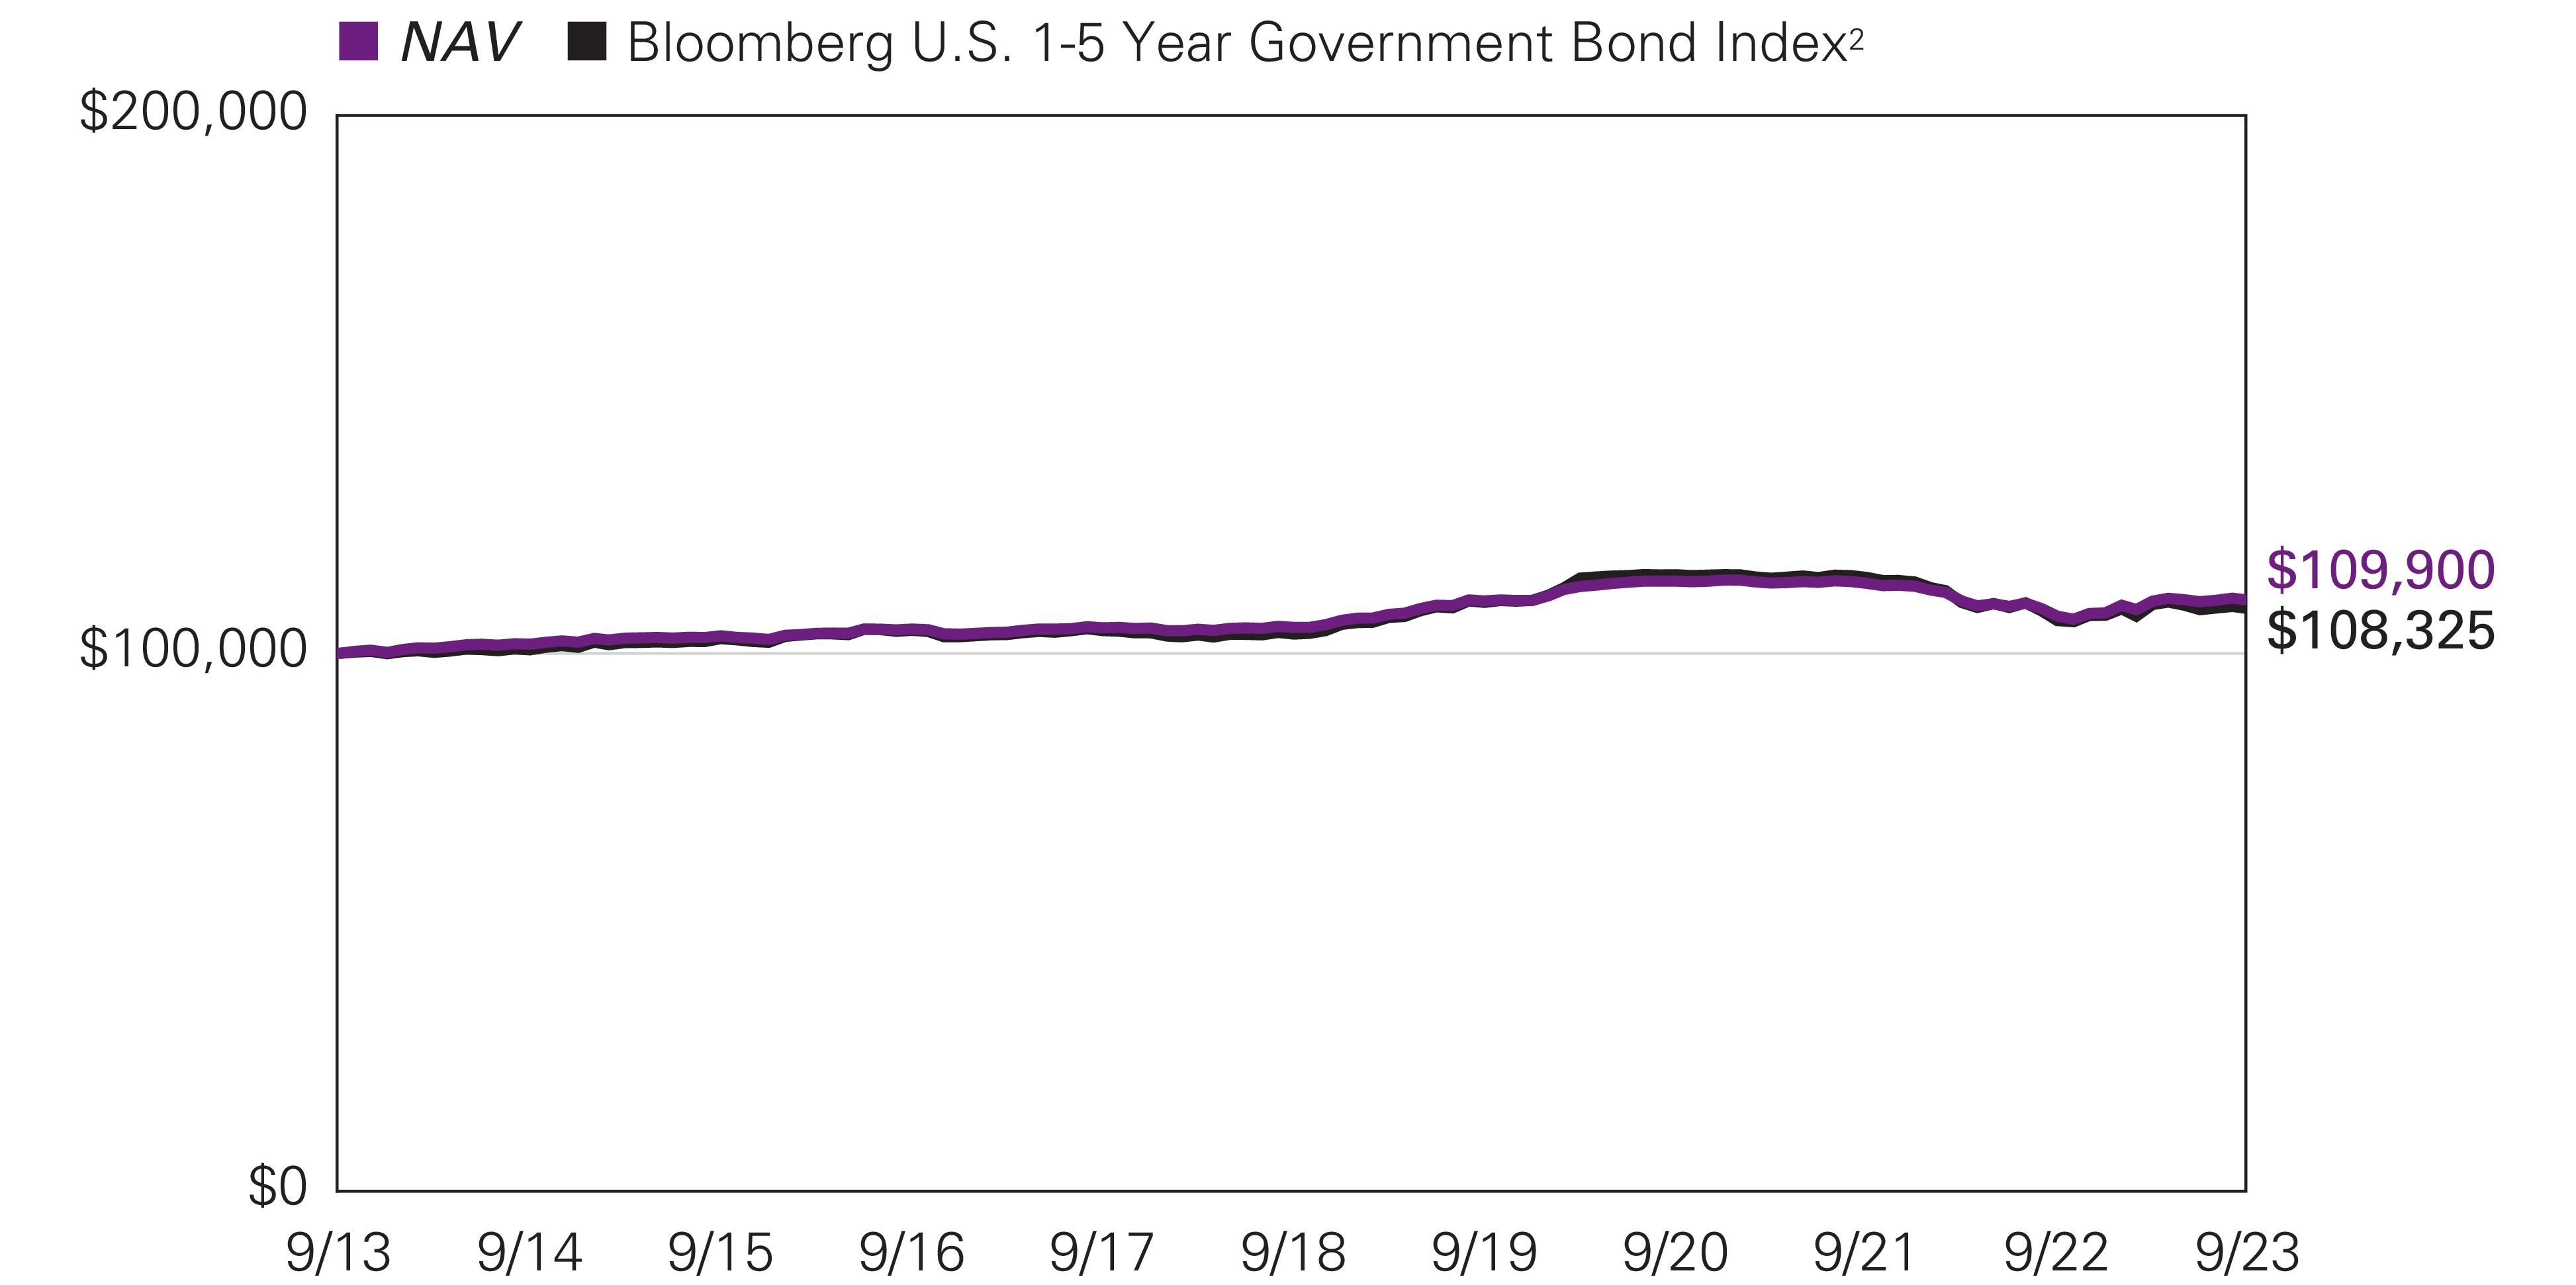
Hypothetical Growth of $100,000 Investment in Class Y Shares1 |
September 30, 2013 through September 30, 2023 |
Loomis Sayles Core Plus Bond Fund
Average Annual Total Returns — September 30, 20231 |
| | | | |
| | |
| | | | | |
| | | | | |
| | | | | |
| | | | | |
With 4.25% Maximum Sales Charge | | | | | |
| | | | | |
| | | | | |
| | | | | |
| | | | | |
| | | | | |
| | | | | |
Bloomberg U.S. Aggregate Bond Index2 | | | | | |
Performance data shown represents past performance and is no guarantee of, and not necessarily indicative of, future results. Total return and value will vary, and you may have a gain or loss when shares are sold. Current performance may be lower or higher than quoted. For most recent month-end performance, visit im.natixis.com/performance. Performance for other share classes will be greater or less than shown based on differences in fees and sales charges. You may not invest directly in an index. Performance for periods less than one year is cumulative, not annualized. Returns reflect changes in share price and reinvestment of dividends and capital gains, if any. The table(s) do not reflect taxes shareholders might owe on any fund distributions or when they redeem their shares.
| Fund performance has been increased by fee waivers and/or expense reimbursements, if any, without which performance would have been lower. |
| Bloomberg U.S. Aggregate Bond Index is a broad-based index that covers the U.S. dollar-denominated, investment-grade, fixed-rate, taxable bond market of SEC- registered securities. The index includes bonds from the Treasury, government-related, corporate, mortgage-backed securities, asset-backed securities, and collateralized mortgage-backed securities sectors. |
| Expense ratios are as shown in the Fund’s prospectus in effect as of the date of this report. The expense ratios for the current reporting period can be found in the Financial Highlights section of this report under Ratios to Average Net Assets. Net expenses reflect contractual expense limitations set to expire on 1/31/24. When a Fund’s expenses are below the limitation, gross and net expense ratios will be the same. See Note 5 of the Notes to Financial Statements for more information about the Fund’s expense limitations. |
| Performance for Class C shares assumes a 1.00% contingent deferred sales charge (“CDSC”) applied when you sell shares within one year of purchase, and includes automatic conversion to Class A shares after eight years. |
Loomis Sayles Credit Income Fund
|
|
|
|
|
Loomis, Sayles & Company, L.P. |
| Effective June 30, 2023, Peter Sheehan serves as portfolio manager of the Fund. |
Investment GoalThe Fund seeks high current income with a secondary objective of capital growth.
Market Conditions
The US fixed income market produced a narrow gain in the 12 months ended September 30, 2023, albeit with a high level of volatility along the way. The majority of the positive return occurred in the early part of the period. During this time, signs of cooling inflation and slightly more dovish commentary from US Federal Reserve (Fed) officials raised hopes that the central bank was approaching the end of its long series of interest rate hikes. While the Fed continued to raise rates—with a total of 1.25 percentage points of increases in late 2022, followed by four quarter-point hikes in 2023—investors appeared encouraged by hopes that the Fed was nearing the end of its hiking cycle.
This backdrop changed for the worse in the final three months of the period, leading to a downturn that significantly dampened 12-month returns. Crude oil prices surged to their highest level since July 2022, raising the possibility that inflation—which had been ticking lower since late last year—would begin to reaccelerate. In addition, the Fed made it clear that although its pace of interest rate increases slowed in 2023, it remained open to further hikes if necessary. These developments fed through to longer-term expectations, with the futures markets beginning to factor in fewer rate cuts in 2024 than was the case earlier in the year.
US Treasuries posted a loss and underperformed the more credit-oriented areas of the bond market in the annual period. Performance was mixed across the curve: while the two and five-year issues produced positive total returns, the 10-year note lost ground and the 30-year bond suffered a double-digit loss. In terms of yield movements, the two-year climbed from 4.22% at the start of the period to 5.03% on the final trading day of September 2023, and the 10-year rose from 3.83% to 4.57%.
Notably, the yield curve remained inverted throughout the period (meaning that short-term yields traded above those on longer-term debt). At the end of June, in fact, the curve was at its highest degree of inversion on the last day of a calendar quarter in history. Although an inverted yield curve has often been a precursor to a recession historically, economic growth stayed in positive territory.
Investment grade corporate bonds logged robust, broad-based gains and strongly outperformed Treasuries. The category was helped by both its yield advantage and a decline in its yield spread relative to government issues. The ICE BofA US Corporate Index Option-Adjusted Spread opened the period at 1.67 over Treasuries and closed at 1.23, indicating outperformance. Lower-rated bonds, shorter-term debt, and economically sensitive issues exhibited leadership, providing a tailwind for the category.
High yield corporate bonds delivered a strong, double-digit gain and finished well ahead of the investment-grade market, mostly due to the lower duration of high yield. A large contribution from yield helped results, as did a decline in yield spreads brought about by investors’ elevated appetite for risk. Senior loans, which typically feature floating rates, benefited from the rising-rate environment and were one of the top-performing segments of the bond market.
Over the prior year, securitized assets produced largely positive total returns, with the exception of non-agency commercial mortgage-backed securities (CMBS) and agency mortgage-backed securities (MBS). Collateralized loan obligations (CLOs) and commercial asset-backed securities (ABS) provided particularly strong returns over the period, with portions of the residential mortgage-backed securities (RMBS) market also outperforming. Headwinds facing the commercial real estate sector emerged in the first half of 2023, negatively impacting non-agency CMBS performance over the period. The shorter duration in most securitized credit sectors led to outperformance versus corporates and the broader Bloomberg US Aggregate Bond Index. A challenging technical backdrop negatively impacted agency MBS returns as elevated levels of rate volatility continued. However, agency MBS did outperform US Treasuries over the period.
Loomis Sayles Credit Income Fund
Developed market government bonds weakened in local currency terms given the challenging rate environment. However, emerging market bonds gained ground, reflecting both positive local market performance and favorable currency translation.
Performance Results
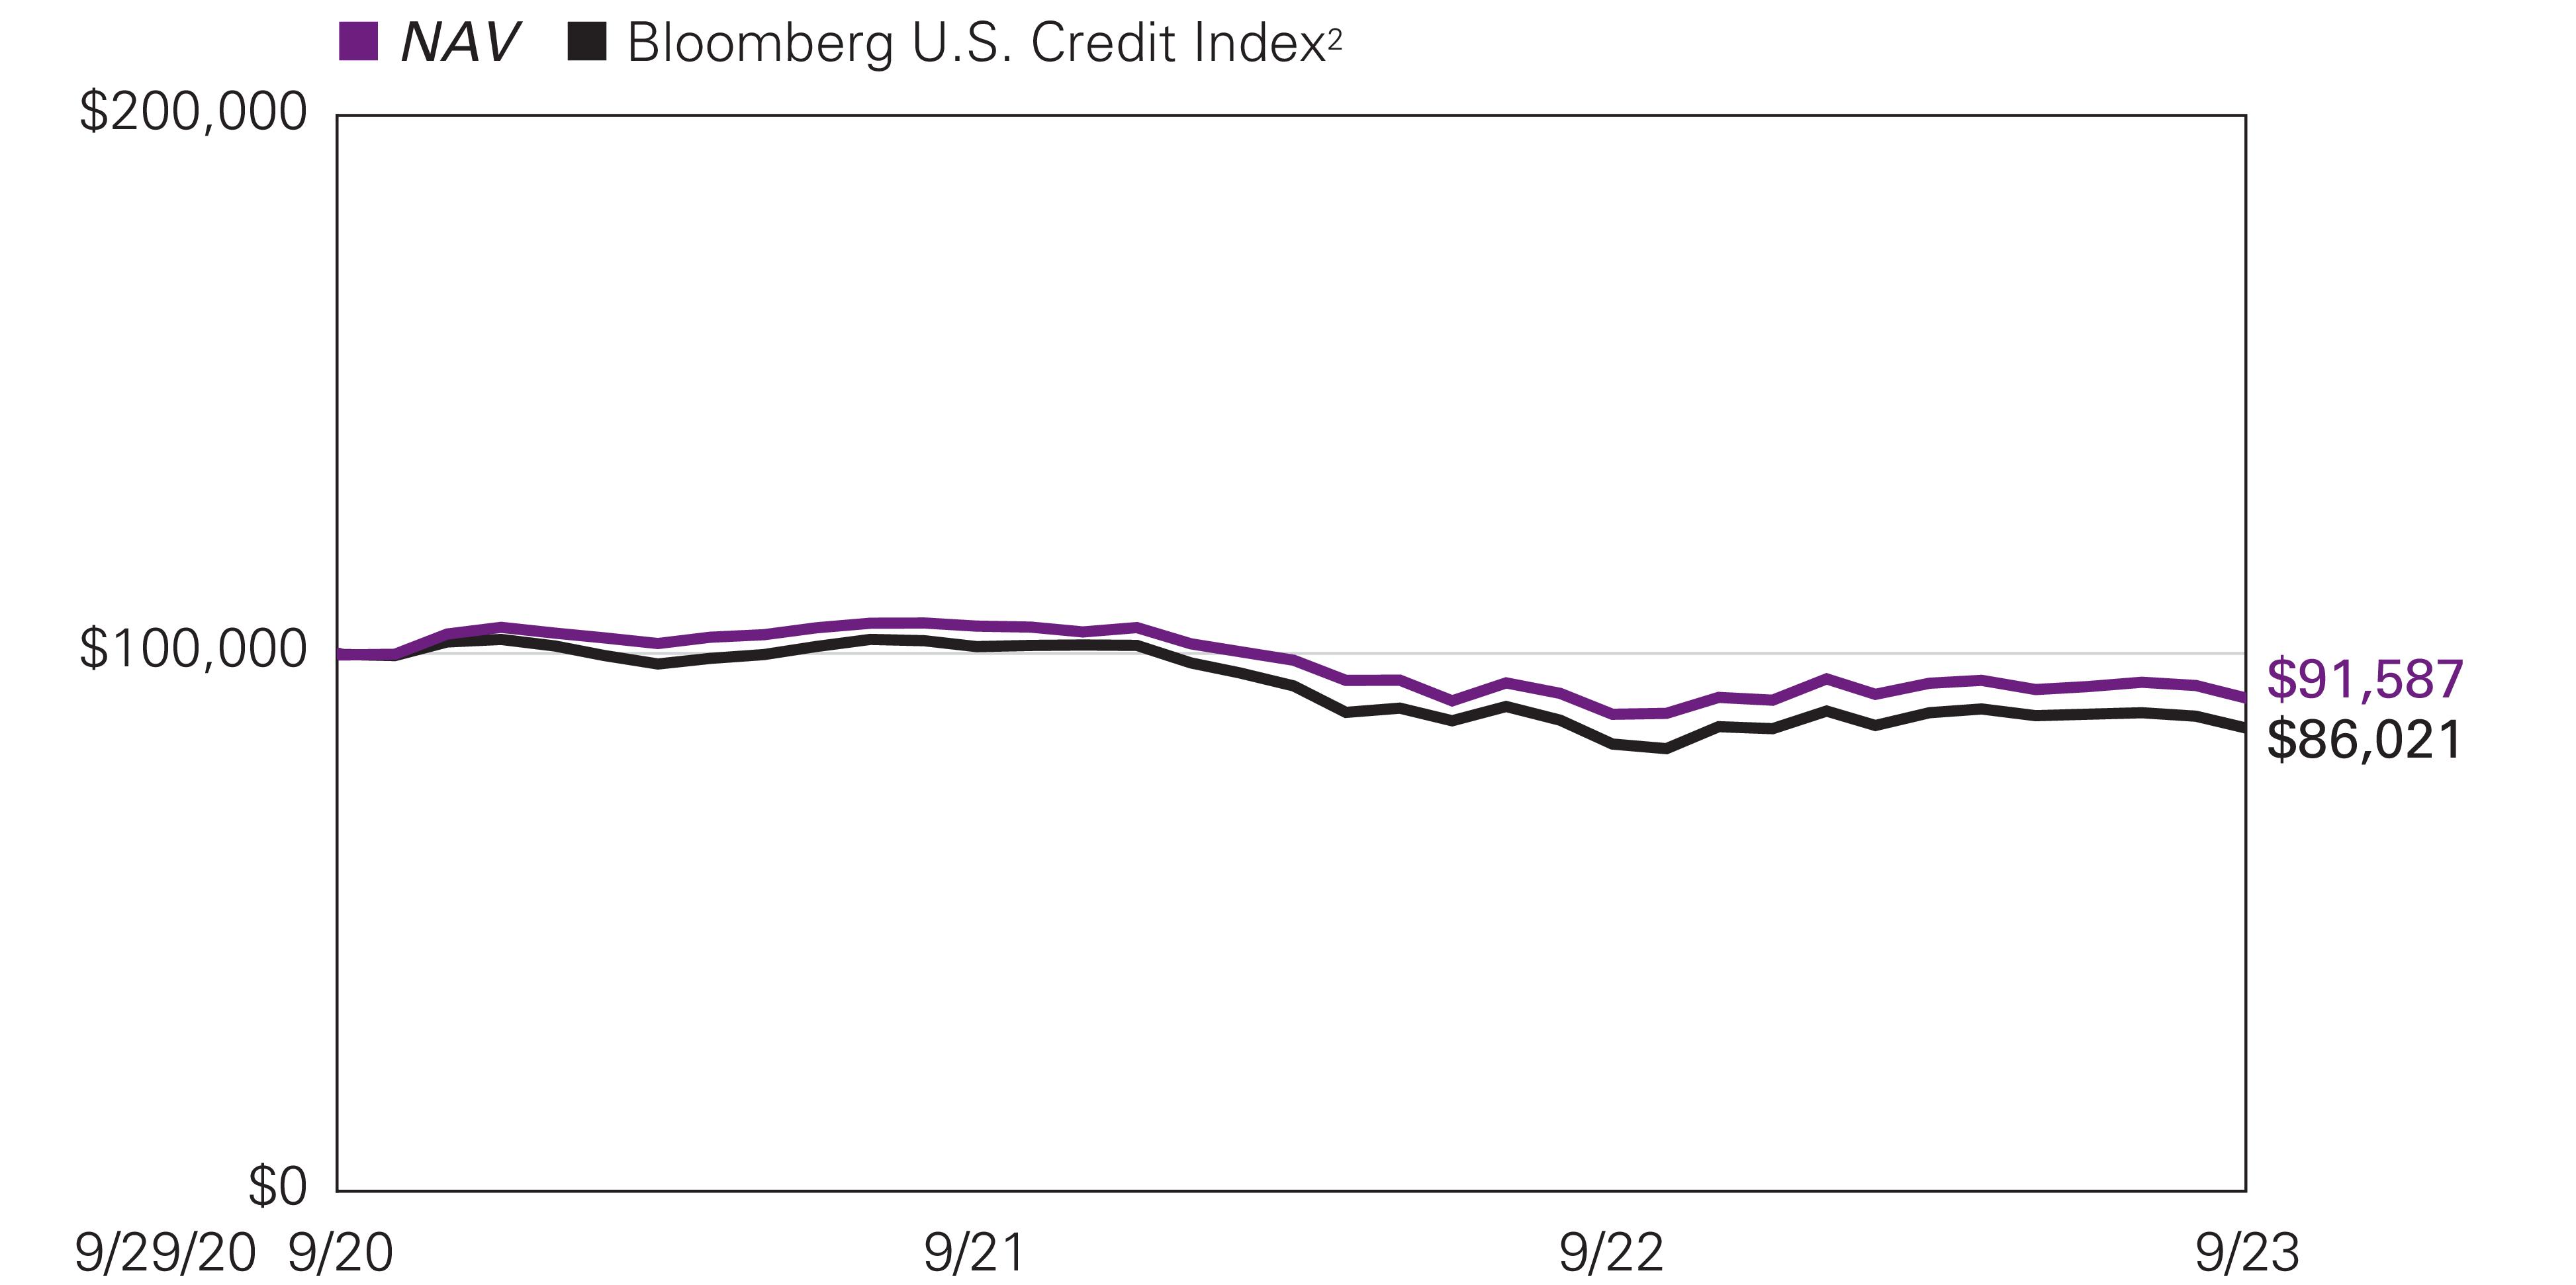
For the 12 months ended September 30, 2023, Class Y shares of the Loomis Sayles Credit Income Fund returned 3.27% at net asset value. The Fund underperformed its benchmark, the Bloomberg US Credit Index, which returned 3.47%.
Explanation of Fund Performance
The year brought continued volatility as the positive returns investors realized in the first half of the year were erased by the rise in US long-term yields during the third quarter of 2023. Due to this volatility, the Fund underperformed its index during the period. Duration positioning in US Treasuries was the main detractor from performance, and the team continued to use Treasury futures to manage overall portfolio duration, which had a negative impact. The Fund began the period with shorter duration relative to the benchmark but brought overall duration positioning closer to neutral (increased duration) during the year as we believed the Fed could be nearing the end of its hiking cycle. Given this positioning, the rise in interest rates in 2023 led to the majority of negative returns.
Both high yield and investment grade credit were strong contributors to performance over the year. Within high yield credit, our higher conviction names in the consumer cyclical and communications space were beneficial. For investment grade credit, names in banking and consumer cyclical were positive. Securitized credit was also beneficial given the asset class’ shorter duration profile. Here, holdings in CLOs aided returns. Finally, performance was aided by defensive, reserve-like positions.
Outlook
A rise in US long-term yields during the third quarter erased the overall positive returns realized in the first half of the year across most sectors of the global fixed income market. Inflation — while still above the Fed’s 2% target — continued to decline from its mid-2022 peak and helped create optimism early in the year that central banks would be able to conclude their long series of interest rate hikes. More recently, a re-pricing of expectations for growth (resilient), inflation (stickier) and Fed policy (higher for longer), as well as concern for significant US Treasury issuance over the coming 12-24 months, pushed yields higher. Since hitting a low of 3.31% for the year on April 6, the 10-year US Treasury yield climbed higher, ending September at 4.57%. As a result, performance of high quality, long duration bonds suffered. Sectors that have less interest rate sensitivity, such as high yield corporates and bank loans, continue to be bright spots on a year-to-date return basis.
In our view, the credit cycle1is firmly in the late cycle stage. Monetary policy is restrictive and lending standards have tightened; however, the economic backdrop has remained resilient and forecasts are reflecting better-than-expected growth for the remainder of 2023. Most notably, resiliency can be seen in areas such as services/housing, while manufacturing has also experienced a bounce from more depressed levels witnessed late last year. While the risk of downturn remains, at this time we do not expect a technical recession of back-to-back quarters with negative GDP. Our base case calls for below trend US growth and our view is dependent on a strong consumer and stable corporate fundamentals. The consumer appears to maintain strong levels of excess savings and continues to spend at a healthy rate. Shifts in hiring and firing dynamics, including labor hoarding, have led to employment remaining robust. We believe these factors should help support consumer confidence and spending going forward. Monetary policy has helped to cool employment, but it is still growing, and investors have likely had to reassess how much flexibility the Fed may have in the near term.
Corporate fundamentals appear stable, highlighted by strong leverage and interest coverage ratios, and specific to the high yield market, a maturity wall that seems manageable, in our opinion, through 2025. We are carefully monitoring the pace of corporate earnings growth. Earnings have contracted over the past three quarters, putting us in the midst of a “profits recession.” While we believe earnings will trough at the end of 2023, if this trend continues, or accelerates as pricing power fades and margins come under further pressure, companies may need to aggressively cut costs (via job cuts). This could lead to an environment where the pace of earnings growth declines materially and ultimately leads to recession. Under this scenario, we believe a healthy consumer combined with stable corporate fundamentals should serve to minimize the potential for a hard landing by providing a floor to economic activity that could result in a mild or shallow recession.
While inflation has peaked and positive real rates should have the effect of slowing growth and rolling inflation down over time, in our opinion inflation will continue to be sticky. We believe inflation will remain elevated and above the Fed's target through the end of 2023 and into 2024 as services inflation remains high, which is worrisome because services inflation is currently stickier than goods inflation. Rising wages may be a major factor that keeps inflation elevated and constrains Fed policy in the near term. In addition, we foresee longer-term structural concerns that could support higher levels of inflation, including the impact of de-globalization, de-carbonization, aging demographics and growing government deficits. We anticipate the Fed will be driven by how firm evidence is that inflation continues to moderate. The potential for an extended Fed pause and short-term rates that stay “higher for longer” remains; in our view, policymakers will be slow to react to the onset of a downturn and will likely tolerate a rise in unemployment, particularly
Loomis Sayles Credit Income Fund
while inflation is above target. We believe value has returned to US fixed income markets and a combination of discount-to-par, favorable yields and an increase in issuer performance dispersion is helping to create opportunities in bonds. We expect defaults/losses to remain relatively low, while slowly increasing to more normal levels associated with a late cycle environment. With the potential for a downturn in 2024, we have been holding larger-than-average liquid reserves. We are comfortable with how we are being compensated by short-term yields as we patiently wait for opportunities to potentially develop. If volatility increases and we see what we view as more attractive yields and spreads, we would consider re-deploying reserves. Overall, we are maintaining an up-in-quality bias and are focused on credits that we believe can weather a slowdown, or credits that will benefit from the transition of goods to services spending. We are mindful of the risks going forward, such as tighter financial conditions and their impact on the financial system, slower Chinese growth, geopolitical risk, and the broader economic impact of a further decline in the commercial real estate market. Much of the turmoil leaves us with a wide range of potential outcomes for growth, inflation and central bank policy response. Based on the uncertain backdrop, we feel it is prudent to maintain a balanced risk profile between interest rate and spread risk. We believe the 10-year US Treasury range is currently around 3.75% - 4.75%, with a potential path to 5% over the long term. We have structured our portfolios for a steeper yield curve, which we believe will be primarily driven by a fall in short-term rates as inflation moderates, combined with secular trends that could potentially keep a floor under long-term yields.
The Fund closed as of November 6, 2023, and as it closed, primary consideration was given to clients and their interests. There was no unusual market action that affected our trading of the portfolio during liquidation. All Fund assets were subsequently redeemed or distributed to Fund shareholders.
1 A credit cycle is a cyclical pattern that follows credit availability and corporate health.
Hypothetical Growth of $100,000 Investment in Class Y Shares1 |
September 29, 2020 (inception) through September 30, 2023 |
Loomis Sayles Credit Income Fund
Average Annual Total Returns — September 30, 20231 |
| | | |
| | |
Class Y (Inception 9/29/20) | | | | |
| | | | |
Class A (Inception 9/29/20) | | | | |
| | | | |
With 4.25% Maximum Sales Charge | | | | |
Class C (Inception 9/29/20) | | | | |
| | | | |
| | | | |
Class N (Inception 9/29/20) | | | | |
| | | | |
| | | | |
Bloomberg U.S. Credit Index2 | | | | |
Performance data shown represents past performance and is no guarantee of, and not necessarily indicative of, future results. Total return and value will vary, and you may have a gain or loss when shares are sold. Current performance may be lower or higher than quoted. For most recent month-end performance, visit im.natixis.com/performance. Performance for other share classes will be greater or less than shown based on differences in fees and sales charges. You may not invest directly in an index. Performance for periods less than one year is cumulative, not annualized. Returns reflect changes in share price and reinvestment of dividends and capital gains, if any. The table(s) do not reflect taxes shareholders might owe on any fund distributions or when they redeem their shares.
| Fund performance has been increased by fee waivers and/or expense reimbursements, if any, without which performance would have been lower. |
| Bloomberg U.S. Credit Index measures the investment grade, U.S. dollar-denominated, fixed-rate, taxable corporate and government-related bond markets. It is composed of the U.S. Corporate Index and a non-corporate component that includes non-U.S. agencies, sovereigns, supranationals and local authorities. The Index was called the U.S. Corporate Index until July 2000, when it was renamed to reflect its inclusion of both corporate and non-corporate issuers. The Index is a subset of the U.S. Government/Credit Index and U.S. Aggregate Index. |
| Expense ratios are as shown in the Fund’s prospectus in effect as of the date of this report. The expense ratios for the current reporting period can be found in the Financial Highlights section of this report under Ratios to Average Net Assets. Net expenses reflect contractual expense limitations set to expire on 1/31/24. When a Fund’s expenses are below the limitation, gross and net expense ratios will be the same. See Note 5 of the Notes to Financial Statements for more information about the Fund’s expense limitations. |
| Performance for Class C shares assumes a 1.00% contingent deferred sales charge (“CDSC”) applied when you sell shares within one year of purchase. |
Loomis Sayles Global Allocation Fund
|
|
|
|
|
Loomis, Sayles & Company, L.P |
Investment GoalThe Fund seeks high total investment return through a combination of capital appreciation and current income.
Market Conditions
The past 12-month period was characterized by “risk on” sentiment, with credit and equity markets outperforming global government bonds. One reason for the favorable showing from risk assets was timing: when the reporting period began in October 2022, risk assets were near the end of a protracted, 10-month decline brought about by the US Federal Reserve’s (Fed) aggressive interest rate increases. By the fourth quarter of 2022, however, cooler inflation prompted investors to begin looking ahead to when the central bank could shift to a neutral policy. Although the Fed continued to raise rates throughout 2023, the slower pace of tightening fostered persistent optimism about the longer-term outlook. The markets were further cheered by economic data and corporate earnings that consistently exceeded the depressed expectations that were in place in late 2022.
While total returns were generally positive for the full period, the backdrop became less supportive in August and September of 2023. A sharp increase in oil prices raised fears that inflation would reaccelerate and lead the Fed and other central banks to maintain tight monetary policies for longer than the markets had been expecting. Signs of slowing growth, particularly in Europe and China, further weighed on sentiment by raising the odds that the world economy could enter a period of stagflation.
The US fixed-income market posted a narrow gain for the 12 months ended September 30, 2023, albeit with a high level of volatility along the way. US Treasuries suffered losses and underperformed the more credit-oriented areas of the bond market. Performance was mixed across the yield curve: while the two- and five-year issues produced positive total returns, the 10-year note lost ground and the 30-year bond experienced a double-digit decline. Global developed market government bonds weakened in local currency terms, but currency translation helped results. The credit-sensitive segments of the market—investment grade corporate high-yield bonds, senior loans, and emerging-market issues—finished with healthy gains and strongly outpaced government debt thanks in part to the “risk-on” market in the first half of 2023.
The US dollar posted mixed results, initially falling sharply in late 2022 on expectations that the Fed would shift to a less aggressive policy stance. However, once investors began to see “higher-for-longer” as being the most likely scenario, the dollar staged an impressive rally in the third calendar quarter of 2023 and made up for most of its earlier losses. For the full period, the euro and British pound appreciated relative to the dollar while the Japanese yen struggled against the dollar.
Despite the late downturn, equities delivered robust gains over the full 12 months. Growth stocks in general, and US mega-cap technology companies in particular, generated meaningful outperformance. Mid- and small-cap stocks, while finishing behind large caps, also posted solid gains. The developed international markets were an additional source of positive performance, with Europe leading the way higher. Value stocks, defensive sectors, and the emerging markets gained ground in absolute terms but underperformed the broad-based indexes. The emerging markets were hurt by the weak showing for China, which experienced a slower-than-expected economic recovery after reopening from the government’s extended Covid-19 lockdowns.
Performance Results
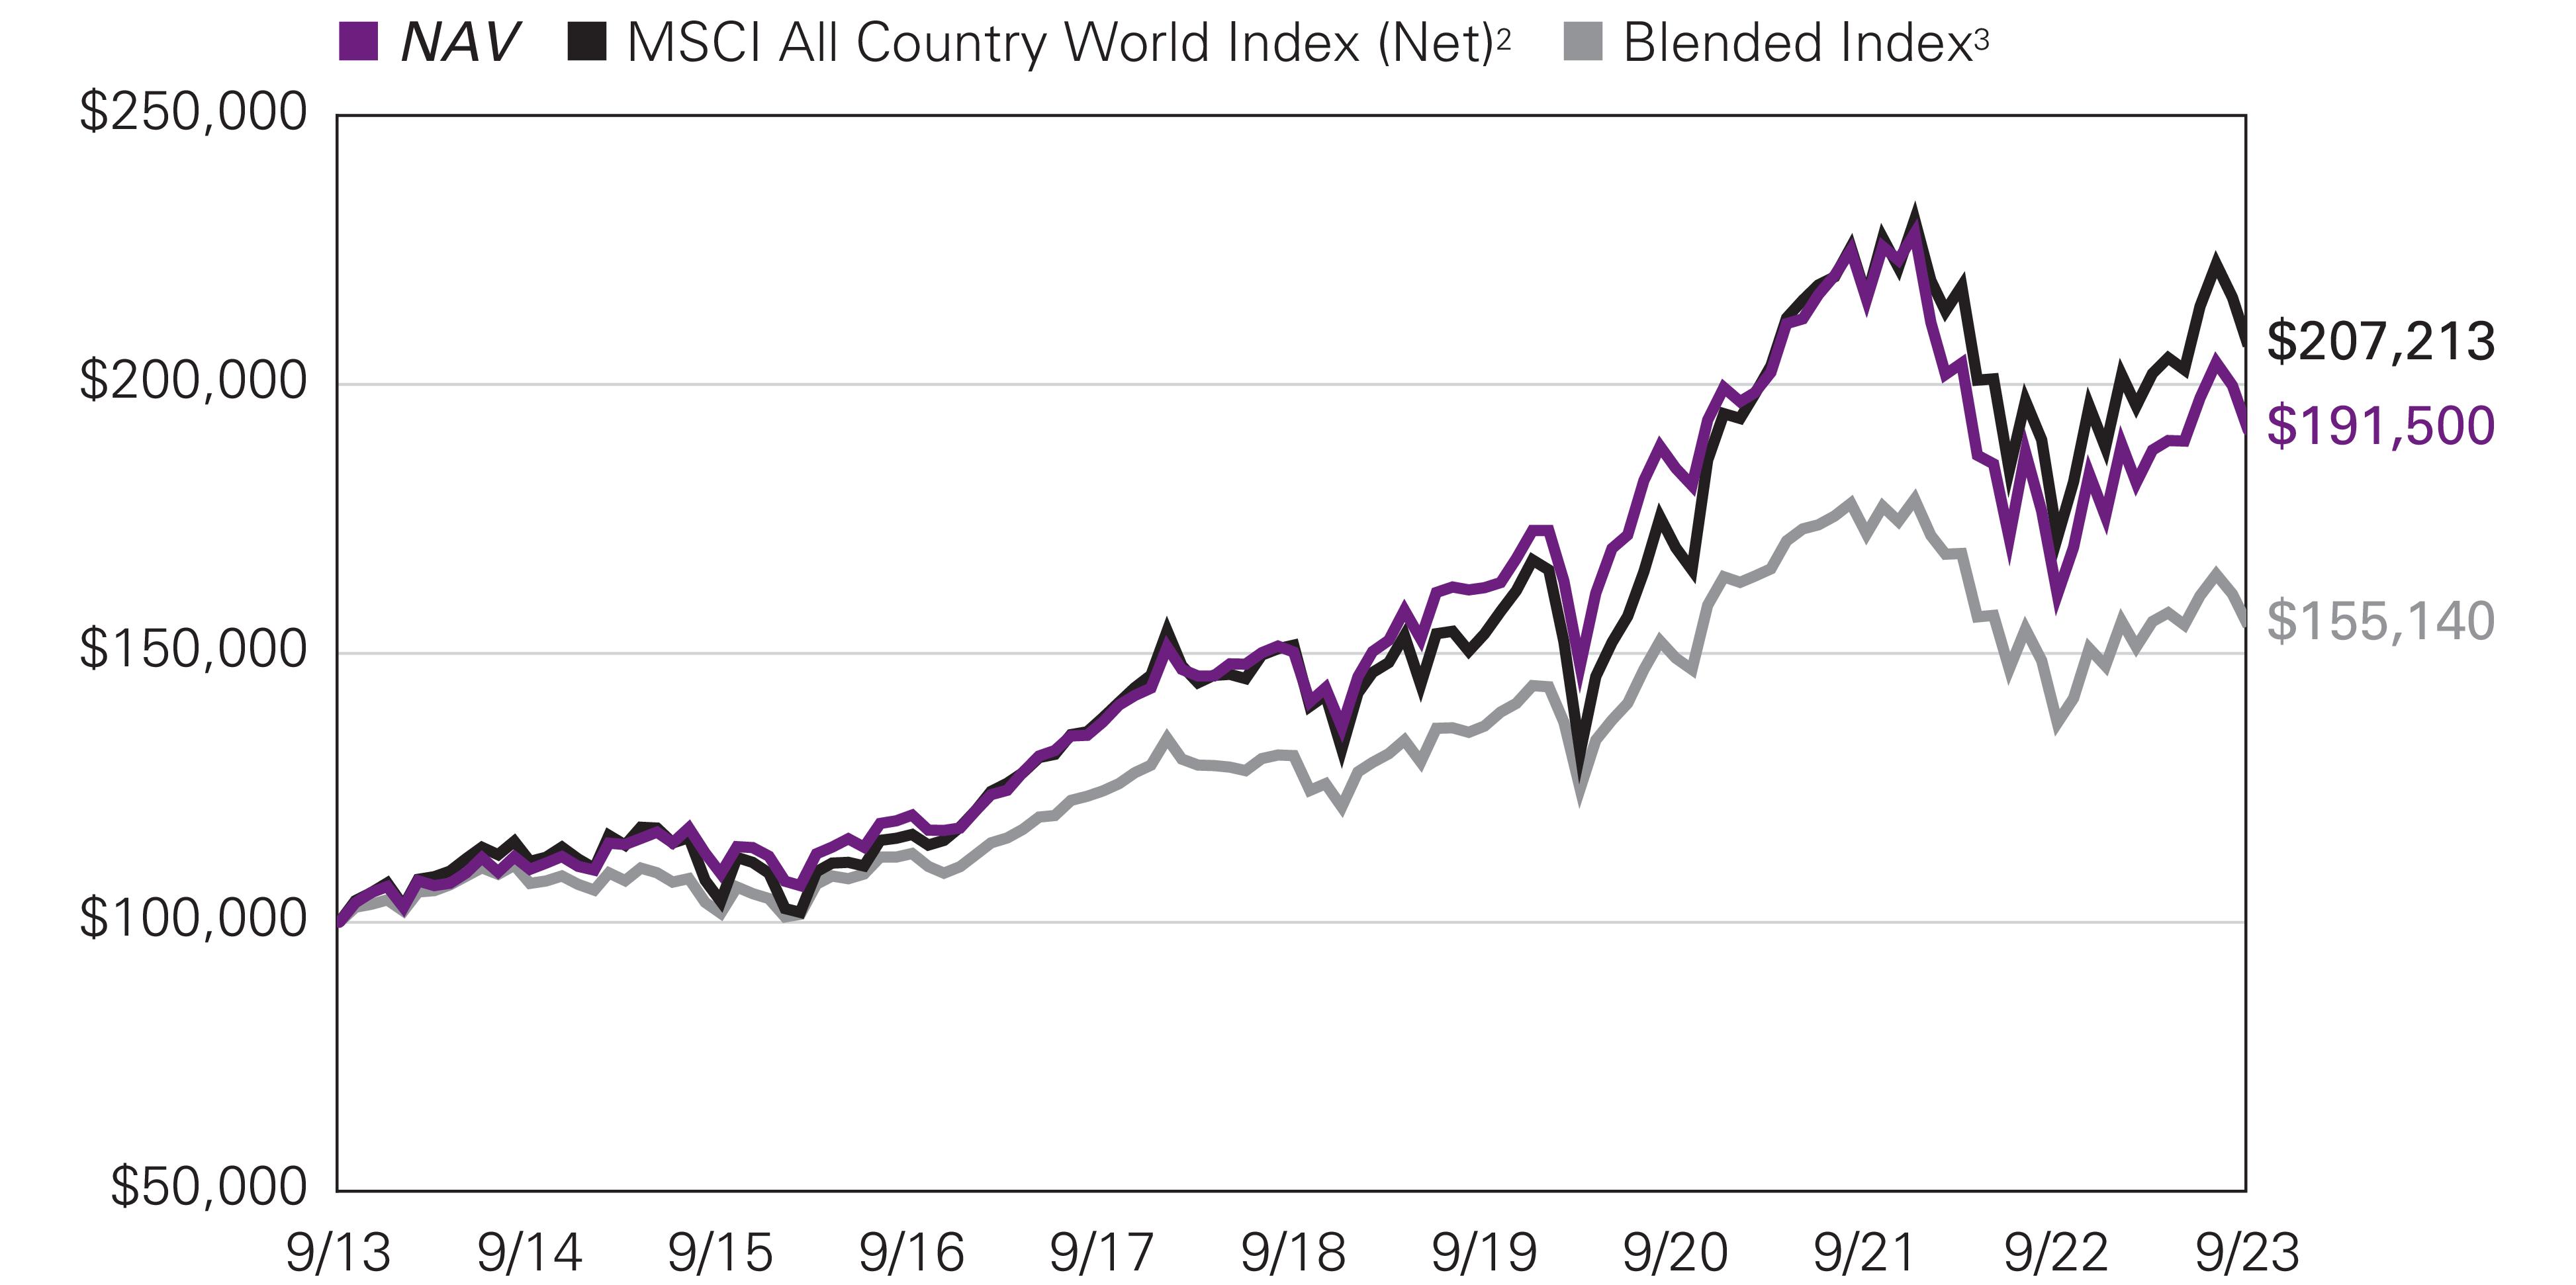
For the 12 months ended September 30, 2023, Class Y shares of the Loomis Sayles Global Allocation Fund returned 19.00% at net asset value. The Fund underperformed its primary benchmark, the MSCI All Country World Index (Net), which returned 20.80%. The Fund outperformed its secondary blended index (60% MSCI All Country World Index (Net)/40% Bloomberg Global Aggregate Bond Index) which returned 13.18%.
Explanation of Fund Performance
In equities, the largest detractors from performance were Zions Bank, Estee Lauder and Danaher.
Zions Bank is a high-quality regional bank with a client base dominated by small to mid-size businesses (SME’s) in the western US. It has a strong franchise in its home base of Utah, where it has the leading market share, and in higher growth southern and western
Loomis Sayles Global Allocation Fund
states. Zions has a high-quality management team; since 2018, management’s strategy has shifted away from acquisitions and towards better allocation of excess capital generation, including share buybacks. Its focus on SME’s provides it with low-cost funding, as it has a relatively high proportion of non-interest bearing commercial deposits. The bank has made significant improvements since the Global Financial Crisis, better managing its expenses and materially improving its efficiency ratio to bring it more in line with peers. Zions has also improved its credit risk management through diversifying its loan book, primarily by reducing the proportion of real estate and energy loans. We believe the bank is well placed to benefit in a rising interest rate environment due to its strong base of non-interest bearing deposits. We also think Zions has an opportunity to further improve its operations by increasing its fee income through wealth management and capital market services. The stock is attractively valued under our discounted cash flow methodology.
Shares of Zions fell just under 40% in the first quarter; investors were concerned about midsize regional bank deposit outflows and rising cost of deposits that could put pressure on profitability. These concerns were exacerbated by the failure of Silicon Valley Bank and another regional bank in March, following deposit runs amid scrutiny of banks’ unrealized losses in their securities portfolios. The stock recovered in the third quarter on signs of the regional banking crisis receding. Zions also announced second quarter results which showed stable credit quality and some signs that the downward pressure on net interest margins is easing.
Shares of Estee Lauder, a multi-national manufacturer and marketer of prestige beauty products, underperformed. We eliminated our position due to concerns regarding the company's ability to grow its intrinsic value. There has been significant erosion of the company's earning power due to an oversupply of inventory in the Asia-Pacific region and a slowdown in developed markets, with limited ability to forecast a path to recovery. Additionally, we have been finding better risk/reward opportunities to include in the portfolio and had been trimming the position size prior to exiting.
Danaher is a technology-focused health care company with a highly durable portfolio. Approximately three quarters of its businesses are healthcare-centric (life sciences and diagnostics) and are supported by secular drivers, such as an aging population, growth of chronic disease and rising healthcare costs. Its other businesses, under the umbrella of “Environmental & Applied Solutions,” sell products geared toward water quality where demand is underpinned by increasing regulatory and safety requirements. Shares retreated in the third quarter after the company reduced its full-year revenue and profit guidance on lower expectations for bioprocessing growth. The adjusted growth forecast stemmed from a decline in pandemic-related demand; we believe these Covid revenue streams will be fully replaced over the next two years driven by strong demand for bioprocessing instruments consumables as well as a recovery in demand for non-Covid molecular tests as patient volume returns. We believe Danaher is well positioned to manage any economic slowdown with three-quarters of its revenue recurring and over 85% of revenue attributable to healthcare end markets. Longer-term, we expect Danaher to continue apply the Danaher Business System continuous improvement strategy to consolidate the life science and tools industry, to right-size acquired companies and to deliver attractive returns to shareholders. Danaher’s shares are attractively valued based on our discounted cash flow methodology.
Within fixed income, while yield curve exposure as a whole contributed to performance, allocations to the US dollar (particularly the five- and ten-year segments) and euro-pay markets detracted. Both the Fed and European Central Bank (ECB) continued aggressive monetary tightening over the year in order to tame persistently high inflation.
Within corporate credit, select holdings in the communications and technology sectors detracted from performance. Within communications, cable satellite provider CSC and media entertainment company IHRT were the biggest detractors, while within technology Commscope was a notable underperformer.
In equities, the largest contributors to performance were Nvidia, ASML and Linde.
Nvidia's origins are in hardware and the gaming end market; it created the world’s first discrete graphics processing unit (GPU) in 1999. The company has since evolved into a larger ecosystem of products with the GPU at its core; its accelerators are used in the gaming, professional visualization, data center and automotive markets. The company created a singular platform across all products and updates are fully compatible, making for seamless transitions for their customers. Nvidia has only one GPU competitor, and holds a 70% or higher market share across all of its end markets. The company has continued to grow by creating new uses for its hardware and software. Specifically, the recent artificial intelligence (AI) renaissance is increasingly leveraging GPUs rather than CPUs, leading to new and larger opportunities in the data center and automotive markets. The company is starting to explore options to monetize its software (currently it is "free" with its hardware) via licensing and subscription models. Nvidia’s gross margin has been on an upward trajectory over the last decade as its business mix shifts towards the more profitable data center business; we expect this trend to continue as standalone software sales and new markets provide a lift. Capital allocation is strong with dividends, repurchases and select M&A, while maintaining a net cash position.
Shares of Nvidia outperformed over the period. In the company’s first quarter earnings release, management noted their view of the data center market had improved given the excitement around ChatGPT (an AI tool). Management also introduced AI as a Service which will provide access to sophisticated AI tools otherwise not affordable to many. In the second quarter, shares continued to outperform; the company announced first quarter revenue above consensus expectations while raising guidance materially. The rapid
Loomis Sayles Global Allocation Fund
rise in AI utilization and popularity of generative AI tools such as ChatGPT has been a significant tailwind for Nvidia, as the company is a critical supplier to the industry.
Shares of ASML, a leader in photolithography (the process in which a light source is used to etch a pattern on a silicon wafer) outperformed. We believe ASML is uniquely positioned in the utilization of extreme ultraviolet (EUV), the next generation technology which allows chipmakers to continue to make chips smaller while maintaining their power (i.e., Moore’s law). The barriers to entry are high given the required technical expertise (EUV was in development for ten years) and associated R&D spending. ASML partners with its customers, aligning its product roadmap with their needs, which we believe has led to a symbiotic relationship. ASML is moving toward a value-based service model under which it will be paid according to the wafer output of its machines, which should be more profitable. Under this model, ASML agrees to meet a set level of output, and if it is not met ASML is obligated to fix the issues at no additional cost to the customer. Assuming their machines are delivering as promised, we believe the company should enjoy a solid revenue stream based on chip output.
Linde is one of the largest industrial gases companies in the world, formed in 2018 as the result of a merger between Linde and Praxair. Linde’s industrial gases are used across industries – from high purity gases in semiconductor production to natural gas liquefaction plants in the energy sector. The company rates highly across our quality criteria. Industrial gases are critical products in many applications, driving pricing power. Contracts are long-term in nature and switching costs are high, particularly for large customers with on-site plants, which provides revenue visibility. We believe the company has meaningful scale, holding the top one or two positions in every market globally, where density is a competitive advantage; the market structure is also consolidated creating a disciplined market environment. With regard to ESG initiatives, we believe greenhouse gas emissions reduction presents a material opportunity for the company. Linde continues to lower its carbon footprint internally and, most importantly, we believe it also has an opportunity externally as the company continues to expand its hydrogen portfolio, which can help lower the carbon footprint of its customers. We expect revenue growth, operating margin expansion and capital allocation to be among the key drivers of intrinsic value growth. The company’s strong free cash flow generation and appetite to repurchase shares over time further add to our intrinsic value growth outlook. The stock outperformed over the period as business execution around top line, margin expansion and capital deployment continued to be strong.
In fixed income, credit positioning was a top contributor to performance over the period. In particular, allocations to the consumer non-cyclical, consumer cyclical and finance company industries contributed over the period. Holdings of pharmaceutical and healthcare companies such as Teva Pharmaceuticals and Teladoc Health were top drivers of returns. Exposure to Uber contributed positively to performance within the consumer cyclical sector.
Currency allocation also contributed to performance over the period. In particular, exposure to the euro, Brazilian real and Polish zloty contributed over the period, as those currencies appreciated against the US dollar.
Outlook
Currently, our core view is that the global economy is in a vulnerable position and therefore at risk of entering the downturn phase of the credit cycle1. However, asset valuations are generally reflecting a “soft landing” scenario. As we view the probability of this outcome as only around 20%, we find risk assets optimistically priced.
While earnings for companies in the S&P 500 Index were negative for the past three quarters, they did not collapse to the point where companies began to shed jobs – a scenario that typically heralds a downturn in the economy. Corporations have been losing pricing power, and economic growth appears set to continue slowing. We believe top-line revenue growth will be more challenging to generate, and we suspect that further profit margin compression is ahead. We view credit spreads as tight and likely to widen over the next six-to-twelve months. In our view, growth expectations are too high as bond yields have surged, the US dollar has strengthened and energy prices have increased.
China’s economic growth has been a disappointment for the last few months. It wasn’t long ago that the market was incredibly bullish on the country’s post-Covid recovery story, but that optimistic scenario has failed to play out. Since China is a large source of external demand for the rest of the global economy, its continued economic underperformance would weigh on total global economic growth. However, the most recent data prints in the country have shown evidence of stabilization.
We are watching 2024 GDP growth expectations closely. Bloomberg consensus estimates are calling for growth of 0.9% in the United States in the coming year, while the Fed sees an expansion of 1.5%. In our view, growth expectations are too high given the combination of higher bond yields, the strong US dollar and rising energy prices. In this vein, leading indicators have continued to show a stagnant economic environment in the euro area. Manufacturing purchasing managers indexes (PMIs) in the region remained weak, and services PMIs also dropped into contraction territory. At its September 14 meeting, the ECB revised down its 2023 growth forecasts due to weaker second quarter growth and the slowdown in China. The ECB acknowledged that tighter financial conditions
Loomis Sayles Global Allocation Fund
have had an increasing impact on activity, and that core inflation pressure has begun to ease. This is in line with our expectation that the ECB will soon shift from aggressive hiking to a more neutral posture.
Globally, inflation remains far above central banks’ typical 2% targets. In our view, this adds to a growing belief that the economy is entering a higher-for-longer interest rate environment. The Fed’s September forecasts boosted the median expected fed funds rate in 2024 from 4.6% to 5.1%. The central bank’s September Summary of Economic Projections included higher GDP growth forecasts for 2023 and 2024, further suggesting that rates could remain elevated for some time.
1 A credit cycle is a cyclical pattern that follows credit availability and corporate health.
Top Ten Holdings as of September 30, 2023 |
| |
1 Alphabet, Inc., Class A | |
| |
3 Mastercard, Inc., Class A | |
| |
| |
6 UnitedHealth Group, Inc. | |
| |
| |
| |
10 Atlas Copco AB, Class A | |
The portfolio is actively managed and holdings are subject to change. There is no guarantee the Fund continues to invest in the securities referenced. The holdings listed exclude any temporary cash investments, are presented on an individual security basis and do not represent holdings of the issuer. |
Hypothetical Growth of $100,000 Investment in Class Y Shares1 |
September 30, 2013 through September 30, 2023 |
See notes to chart on page 13.
Loomis Sayles Global Allocation Fund
Average Annual Total Returns — September 30, 20231 |
| | | | | |
| | |
| | | | | | |
| | | | | | |
| | | | | | |
| | | | | | |
With 5.75% Maximum Sales Charge | | | | | | |
| | | | | | |
| | | | | | |
| | | | | | |
Class N (Inception 2/2/17) | | | | | | |
| | | | | | |
| | | | | | |
MSCI All Country World Index (Net)2 | | | | | | |
| | | | | | |
Performance data shown represents past performance and is no guarantee of, and not necessarily indicative of, future results. Total return and value will vary, and you may have a gain or loss when shares are sold. Current performance may be lower or higher than quoted. For most recent month-end performance, visit im.natixis.com/performance. Performance for other share classes will be greater or less than shown based on differences in fees and sales charges. You may not invest directly in an index. Performance for periods less than one year is cumulative, not annualized. Returns reflect changes in share price and reinvestment of dividends and capital gains, if any. The table(s) do not reflect taxes shareholders might owe on any fund distributions or when they redeem their shares.
| Fund performance has been increased by fee waivers and/or expense reimbursements, if any, without which performance would have been lower. |
| MSCI All Country World Index (Net) is a free float-adjusted market capitalization weighted index that is designed to measure the equity market performance of developed and emerging markets. |
| Blended Index is an unmanaged, blended index composed of the following weights: 60% MSCI All Country World Index (Net) and 40% Bloomberg Global Aggregate Bond Index. The Bloomberg Global Aggregate Bond Index provides a broad-based measure of the global investment-grade fixed income markets. The four major components of this index are the U.S. Aggregate, the Pan-European Aggregate, the Asian-Pacific Aggregate, and the Canadian Aggregate Indices. The Index also includes Eurodollar and Euro-Yen corporate bonds, Canadian government, agency and corporate securities, and USD investment grade 144A securities. |
| Expense ratios are as shown in the Fund’s prospectus in effect as of the date of this report. The expense ratios for the current reporting period can be found in the Financial Highlights section of this report under Ratios to Average Net Assets. Net expenses reflect contractual expense limitations set to expire on 1/31/25. When a Fund’s expenses are below the limitation, gross and net expense ratios will be the same. See Note 5 of the Notes to Financial Statements for more information about the Fund’s expense limitations. |
| Performance for Class C shares assumes a 1.00% contingent deferred sales charge (“CDSC”) applied when you sell shares within one year of purchase, and includes automatic conversion to Class A shares after eight years. |
Loomis Sayles Growth Fund
|
Aziz V. Hamzaogullari, CFA® |
Loomis, Sayles & Company, L.P. |
Investment GoalThe Fund seeks long-term growth of capital.
Market Conditions
US equities produced strong performance in the 12 months ended September 30, 2023. When the reporting period began in October 2022, stocks were near the end of a protracted, ten-month decline brought about in part by the US Federal Reserve’s (Fed) aggressive interest rate increases. By the fourth quarter of 2022, however, cooler inflation prompted the Fed to begin decelerating the pace of rate hikes, which provided relief to markets. Although the Fed continued to raise rates throughout 2023, its slower pace of tightening may have fostered renewed optimism about the longer-term outlook. Investors may have been further encouraged by economic data and corporate earnings that consistently exceeded the depressed expectations that were in place in late 2022. While the backdrop became less favorable in August and September, the US market finished firmly in positive territory on the strength of its earlier gains. Growth stocks in general, and US mega-cap technology companies in particular, delivered meaningful outperformance. Mid- and small-cap stocks, while finishing behind large caps, also posted solid gains.
Performance Results
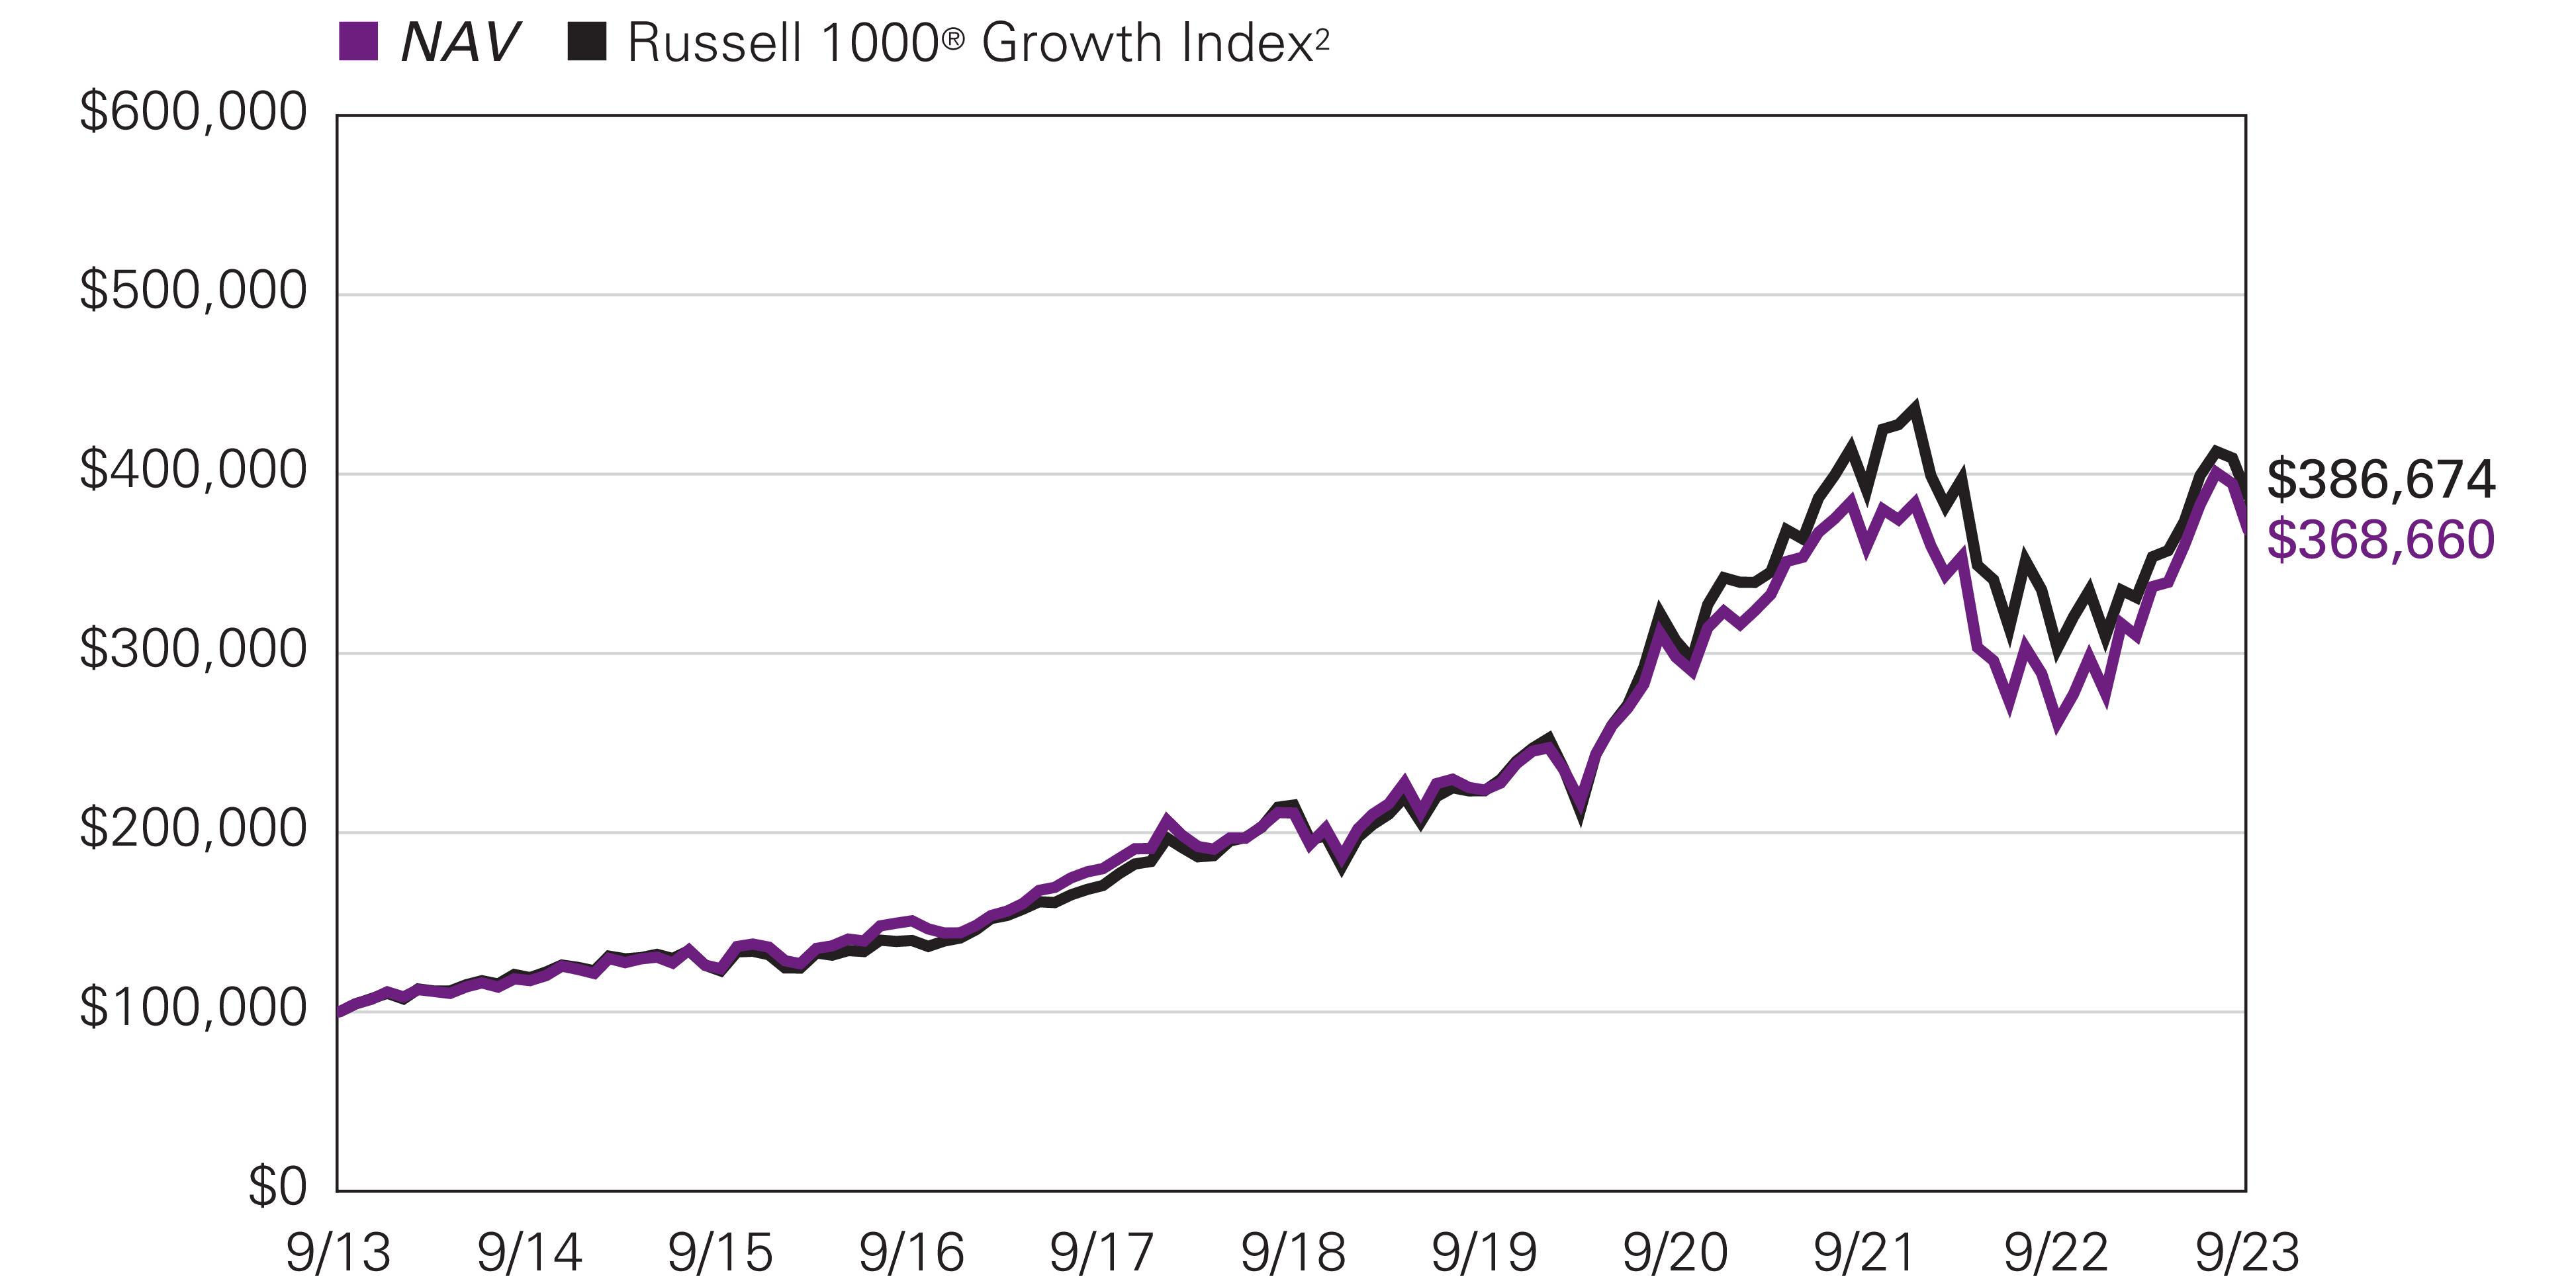
For the 12 months ended September 30, 2023, Class Y shares of the Loomis Sayles Growth Fund returned 40.97% at net asset value. The Fund outperformed its benchmark, the Russell 1000® Growth Index, which returned 27.72%.
Explanation of Fund Performance
We are an active manager with a long-term, private equity approach to investing. Through our proprietary bottom-up research framework, we look to invest in those few high-quality businesses with sustainable competitive advantages and profitable growth when they trade at a significant discount to intrinsic value. Given the rare confluence of quality, growth, and valuation, we may study dozens of companies but may only invest in a select few businesses each year. We believe identifying those few businesses with these characteristics is an art, not a science. As a result of this rigorous approach, ours is a selective, high-conviction portfolio of typically 30-40 names.
The Fund’s positions in Nvidia, Meta Platforms, and Boeing contributed the most to performance. Stock selection in the information technology, communication services, industrials, consumer staples, consumer discretionary, and healthcare sectors, along with our allocations in the communication services, consumer staples, consumer discretionary, healthcare, and industrials sectors, contributed positively to relative performance.
Nvidia is the world leader in artificial intelligence (AI) computing, which enable computers to mimic human-like intelligence for problem solving and decision-making capabilities. We believe the company’s competitive advantages include its intellectual property, brands, and a large and growing ecosystem of developers and applications utilizing its GPU (graphic processing unit) technology. A portfolio holding since January 2019, after shares were under pressure throughout most of 2022 given a weak market backdrop, shares rebounded substantially over the past 12 months, with gains accelerating following the company’s first quarter earnings report in May. Nvidia reported financial results that were well above consensus expectations, as AI applications, including generative AI, are driving strong demand for GPUs by companies looking to leverage these capabilities and drive competitive differentiation. The company also provided revenue guidance that was substantially higher than consensus expectations, resulting in a material increase in expectations for revenue, profits, and free cash flow for its full fiscal year. Revenue in the company’s gaming segment has been depressed, which we believe reflected global demand for PCs returning to pre-pandemic levels after a period of excess, and the impact of macroeconomic weakness and Covid-19 restrictions on China consumer spending. However, we believe the company has done a good job of clearing existing inventory in its retail channels, which contributed to the gaming business returning to growth in the most recent quarter. In the company’s data center business, we believe the company’s decades of focused investment, cumulative know-how, and robust software platform and architecture that has attracted millions of developers, position the company to benefit from several secular long-term growth drivers, including continued growth in use cases for artificial intelligence. To further drive adoption by enterprises, Nvidia is also partnering with cloud service providers including Oracle, Microsoft, and Google to offer AI services via the cloud. We believe Nvidia remains strongly positioned to benefit from secular growth in gaming and is still in the early stages of growth in its data center business, which has the potential to be much larger in the long term. We believe Nvidia’s strong growth prospects are not currently
Loomis Sayles Growth Fund
reflected in its share price. As a result, we believe the company’s shares are trading at a significant discount to our estimate of intrinsic value, offering a compelling reward-to-risk opportunity.
Meta Platforms operates online social networking platforms that allow people to connect, share, and interact with friends and communities. With 3.9 billion monthly users, 200 million businesses, and 10 million advertisers worldwide using its family of apps – Facebook, Messenger, WhatsApp, and Instagram – the scale and reach of Meta’s network is unrivaled. A strategy holding since its IPO in 2012, Meta’s shares were under pressure throughout most of 2022, due to a perceived lack of discipline in the company’s capital expenditures – especially with respect to the metaverse – that coincided with what we believed was temporary fundamental weakness arising from the company’s transition to a new advertising format and maneuvering around privacy changes imposed by Apple in 2021. Our analysis suggested that Meta was being priced as if a high-quality, high-returning, growth company – whose returns on capital were many times larger than its cost of capital – would become a low-quality business that ceased to grow and would henceforth generate low margins and low returns on invested capital. We took advantage of near-term price weakness to add to our holdings on multiple occasions during this period, most recently in October and November 2022. Despite ongoing macroeconomic pressure on advertising spending, Meta has since posted three consecutive quarters of better-than-expected financial results, including accelerating revenue growth in the second half of the period. Following this period of temporary weakness and elevated investment spending, Meta announced a set of efficiency measures that have already led to significant improvements in margins and lower capital expenditure plans, and shares responded positively to the company’s increased focus on productivity and cost management. We believe founder and CEO Mark Zuckerberg has always managed the company with a long-term focus and strong strategic vision. Over the past ten years, Meta has spent over $125 billion on research and development and $110 billion on capital expenditures – a level of investment that few firms can match and which creates high barriers to entry for competitors that are further compounded by the growth of cumulative knowledge over time. The successful development of a metaverse is not an explicit part of our investment thesis for Meta. However, given the potential size of the opportunity, which we estimate could impact over $1 trillion of spending over the long term, and Meta’s positioning with billions of users and hundreds of millions of businesses, we believe Meta’s current balanced approach to its forward-looking investments make sense. We expect that corporations will continue to allocate an increasing proportion of their advertising spending online, and Meta remains one of very few platforms where advertisers can reach consumers at such scale in such a targeted and effective fashion. We believe Meta’s brands, network, and targeting advantage position the company to take increasing share of the industry’s profit pool and grow its market share from 6% currently to approximately 10% of the total global advertising market over our investment time horizon. On the basis of its core business alone, we believe the company is substantially undervalued and trades at a significant to our estimate of intrinsic value. In the second half of the period, we trimmed our position on multiple occasions as it reached our maximum allowable position size of eight percent due to market appreciation.
Founded in 1916, Boeing is a global leader in the commercial and defense aerospace industries. Along with Airbus, Boeing is part of a global duopoly that accounts for almost all commercial planes sold with greater than 125 seats – the largest market segment. A holding since March 2020, Boeing’s financial results during the period were mixed and largely below consensus expectations from an income statement standpoint. However, shares responded positively to the company’s significantly improved free cash flow (FCF) generation and outlook for substantial further FCF growth. While the company has previously faced execution issues across several programs that temporarily paused aircraft deliveries, it is increasing production of both its 737 MAX and 787 Dreamliner models, and will resume production of the 777x earlier than anticipated, with expected entry into service in 2025. Despite the near-term challenges, we did not view the issues as structural and believed the long-term earnings power of the company remained unchanged and significantly underappreciated. Boeing has also made significant progress with the 737 MAX, which is now cleared to fly in almost all countries, including China. However, while over 90% of the MAX fleet in China is back in service, there has not been any concrete progress with respect to pending deliveries, and Boeing has remarked over one-third of planes originally earmarked for Chinese customers to other customers. We estimate that Boeing has approximately $38 billion of aircraft currently in inventory that will generate substantial revenue and cash flow as they are likely delivered over the next 12-to-24 months. As of June quarter-end, backlog of $440 billion, or approximately 4,900 aircraft, was up 18% year over year. Despite still uneven quarterly results, air traffic recovery is underway and absent further issues with the MAX and 787, we believe the company’s long-term earnings power remains intact. In the interim, Boeing’s financial results remain impacted by the decline in global air travel that began with Covid-19. At its low point in April 2020, travel demand, as measured by revenue passenger kilometer (RPK), which represents distance flown by paying passengers, had declined 94% from April 2019. And while demand year to date has returned to 89% of pre-pandemic levels, with domestic travel exceeding 2019 levels, international travel remains at 83%, due primarily to China. We believe the impact of Covid-19, along with the grounding of the MAX, the fourth generation of its most profitable airplane model, represented temporary, not structural, issues that created the opportunity to initiate our position. We believe Boeing’s strong and sustainable competitive advantages include its significant cumulative knowledge and experience in aeronautical development, scale, and a client base that faces switching costs due to plane-specific operational and maintenance issues, which collectively result in significant barriers to entry. Global growth in air travel is the primary secular growth driver for Boeing. Over our long-term investment horizon, we believe demand for global air travel will continue to grow at a mid-single-digit rate, as it has for the past four decades. We believe Boeing is one of only two companies globally which possess the requisite expertise and scale to profitably serve the global demand for commercial aircraft. We believe the current
Loomis Sayles Growth Fund
market price embeds expectations for aircraft deliveries and margins that are well below our long-term assumptions. As a result, we believe the company is selling at a significant discount to our estimate of intrinsic value and offers a compelling reward-to-risk opportunity. We took advantage of near-term price weakness to add to our position on several occasions during the year.
The Fund’s positions in PayPal, Walt Disney, and Illumina detracted the most from performance. Stock selection in the financials sector, along with our allocations in the information technology and financials sectors, detracted from relative performance.
PayPal is a leading technology platform that enables digital payments and simplifies commerce experiences on behalf of consumers and merchants, globally. The company operates a “two-sided” network that connects almost 400 million consumers with 35 million merchants across more than 200 markets around the world. The company provides its solutions through a family of brands that span several areas of payment solutions and include Braintree, Honey, Zettle, Venmo, and Xoom. While the majority of its transactions take place online, PayPal offers customers the ability to move money in digital form from any device when sending payments or getting paid. PayPal provides merchants with an end-to-end payments solution that provides authorization and settlement capabilities, as well as instant access to funds. A strategy holding since the first quarter of 2022, PayPal reported fundamentally solid financial results that were generally above or in-line with consensus expectations during the period. However, shares responded negatively to a modest reduction in the company’s target for year-end operating margin expansion, as well as lower-than-expected transaction margins in its most recent quarterly report. We believe the decline in margins was due to short-term factors that do not impact our structural investment thesis for the company. We took advantage of near-term price weakness to add to our position during the period. We believe PayPal’s strong and sustainable competitive advantages include its two-sided network, scale, and brand advantages. We believe the company’s biggest advantage is its rare two-sided network, which very few companies have been able to replicate. The network is sustained by the high value proposition offered to both consumers and merchants. Consumers benefit from a secure digital wallet that enables seamless checkout across devices, platforms, and merchants, along with solutions to manage and move money domestically and internationally, and access to credit and alternative payment solutions. Merchants benefit from the ability to enable all aspects of digital checkouts online and in store, as well as credit solutions, risk management and fraud prevention tools, and other value-added services to attract new customers and increase sales. As PayPal’s already massive two-sided network grows, we believe it becomes increasingly attractive to new participants, which we believe will enable the company to grow its digital checkout volumes from approximately 1.5% of global personal consumption expenditures today to approximately 3% over our long-term investment horizon. Collectively, we believe PayPal can generate compounded annual revenue growth in the low-double-digits. As the company continues to grow, we expect it will realize operating leverage in general and administrative, customer support, and operations expenses that will enable operating margins to expand. As a result, we expect operating profits and free cash flows will grow faster than revenues, in the low-to-mid teens. We believe the assumptions embedded in PayPal’s share price underestimate the company’s significant long-term growth opportunities and the sustainability of its business model. We believe the company’s shares currently sell at a significant discount to our estimate of intrinsic value and thereby offer a compelling reward-to-risk opportunity.
Founded almost 100 years ago, Disney is one of the largest and most renowned vertically integrated media companies in the world, with iconic entertainment brands and decades of film and TV content that it leverages across its media networks, theme parks, motion picture studios, and direct-to-consumer (DTC) businesses. A holding since the second quarter of 2020, Disney’s share price has been volatile over the past year due in part to activist investor campaigns, the surprise return of Bob Iger as CEO, greater than expected losses in the company’s DTC business, and continued weakness in linear networks. In the second half of the period, shares also responded negatively to lower-than-expected subscriptions to the company’s core Disney+ DTC platform, due in part to pricing increases implemented in the beginning of the year in North America (NA). The price hikes contributed to a modest decline in NA subscribers, but also to healthy growth in NA average revenue per user (ARPU). We believe the market continues to underappreciate the long-term opportunity for subscriber growth, pricing increases, and margin expansion in the company’s DTC platform. Globally, subscribers to its DTC streaming services declined 1% year over year, driven by subscriber declines at Disney Hotstar, where last year the company walked away from the digital rights to broadcast Indian Premiere League (IPL) cricket, which had been an important customer acquisition tool for the service. ARPU at Hotstar was over six-times lower than Disney’s core markets, and the company has been re-evaluating its level of investment spending in markets with lower profitability. Following the November 2019 launch of its Disney+ service, the company surpassed its five-year goal of attaining 130 million global subscribers in just 12 months, which we believe underscores the global appeal of its unique content and brands. Recently, operating losses of $512 million in the company’s DTC segment narrowed from $1.1 billion in the prior-year quarter, benefiting from price increases for both Disney+ and ESPN+, as well as lower content and marketing spending. We believe Disney’s strong and sustainable competitive advantages include its iconic brands, content, and intellectual property (IP), its massive scale in the media, entertainment, and leisure industries, and a structural cost advantage that directly benefits its streaming business. We believe the company is pursuing a well-articulated strategy to optimize distribution for its high-quality, best-in-class brands and franchises through a multi-pronged DTC approach that we believe will be central to the company’s media strategy over the next decade. Over our long-term investment horizon, we believe the company’s portfolio of iconic brands, its massive scale and geographic reach, and nearly impossible-to-replicate guest experiences, leave the company well positioned to benefit from secular growth in global entertainment spending. We believe current market expectations
Loomis Sayles Growth Fund
substantially underestimate the uniqueness of the company’s IP, the opportunity to monetize that IP across several global business segments, and its ability to generate sustainable growth in free cash flow. As a result we believe the shares trade at a substantial discount to our estimate of intrinsic value and offer a compelling reward-to-risk opportunity. We took advantage of near-term price weakness to add to our position on multiple occasions during the period.
Founded in 1998, Illumina is the industry leader in fast-growing field of sequencing for genetic and genomic analysis, supporting research, clinical, and consumer genetics applications. The company’s customers include leading genomic research centers, academic institutions, government laboratories, hospitals, pharmaceutical and biotechnology companies, commercial molecular diagnostic laboratories, and consumer genomics companies. Because genes determine cell function and characteristics, understanding genetic sequencing and variation can provide valuable information in fields ranging from disease treatment to crop optimization. A strategy holding since March 2020, Illumina’s shares have been pressured during the period due to lower-than-expected results in its core business, ongoing uncertainty regarding its acquisition of GRAIL, and an activist investor campaign that succeeded in ousting the Chairman of the Board and later prompted the resignation of CEO Francis DeSouza. The company did report strong orders for its newest sequencing platform, NovaSeq X, including over 260 orders from approximately 30 countries that led it to increase its full-year projected shipments. However, the company’s recent results and guidance are below our long-term expectations. While the launch of a new platform typically results in an initial slowdown in revenues as customers exhaust existing inventory while evaluating the new platform, we believe the company’s acquisition of GRAIL has detracted from near-term focus and returns. GRAIL was founded by Illumina in 2016 and was spun out as a standalone company in 2017, with Illumina retaining an equity interest that represented approximately 15% ownership. The company reacquired GRAIL in August 2021, but uncertainty remains as the company closed the transaction prior to receiving approval from the EU, which has since ordered that the business be divested. Illumina is challenging divestiture rulings from both the EU and FTC. We believe the legal challenges should conclude by the first quarter of 2024. GRAIL is an early leader in asymptomatic cancer screening through liquid biopsies, which utilize Illumina’s Next Generation Sequencing technology to detect tumor DNA in the bloodstream before it could otherwise be sampled via a traditional biopsy. To date, GRAIL has produced increasingly compelling data in support of its screening technology, and we believe continued reduction in sequencing costs is broadening the accessible market opportunity that we estimate to be in excess of $20 billion. We believe the combination with Illumina provides GRAIL with structural operating and distribution advantages relative to competitors that potentially position it to become the standard of care. And while realizing the acquisition’s potential will take substantial ongoing investment that will depress Illumina’s near-term financial results, we believe successful execution could yield significant value to Illumina. However, our structural investment thesis for Illumina is not premised on a successful completion of the GRAIL acquisition. While the process is likely to remain a distraction over the coming year, we believe Illumina’s core business remains highly attractive on a reward-to-risk basis and remains substantially discounted to intrinsic value regardless of the GRAIL outcome. As we do with all regulatory developments, we continue to monitor and assess any potential structural impact to our investment thesis for Illumina. The activist investor campaign was seeking three board seats. They succeeded in securing one seat while the Chairman, John Thompson, was voted off the board. About two weeks following the annual meeting, CEO Francis DeSouza submitted his resignation. The timing of the leadership turnover comes at an inopportune moment. Illumina is in the early stages of a major platform launch while simultaneously facing more competition than in recent years. They are also involved in legal disputes with regulators both home and abroad. Though this level of management uncertainty is not a desirable situation, we believe it presents an opportunity for the business to redouble its focus on the significant opportunity in its core markets and reinvigorate operational execution - which appears to have diminished over last several quarters under DeSouza. In September, the company named Jacob Thaysen, Ph.D. as its new CEO. Thaysen previously served as President of the Life Sciences and Applied Markets Group at Agilent, a well-regarded life sciences company. Jacob brings a background in research and development (R&D) as well as experience operating in genetics and clinical end markets. In addition to the activist sponsored candidate, Illumina also added two new board members with significant experience at innovative, market-expanding healthcare businesses that we believe should contribute positively to Illumina’s to return to growth. Despite the near term uncertainty, we believe Illumina remains advantageously positioned in a high quality industry benefitting from long-term, secular growth. We believe Illumina is at the forefront of a multi-decade transformation that will see genetic analysis incorporated into multiple facets of our lives. While demand today is still predominantly from large life sciences research facilities, over the next decade we believe democratization of gene sequencing technology and greater practical application will result in the equipment becoming ubiquitous in clinical settings as well, with oncology offering the largest market opportunity. We believe Illumina is a dominant competitor whose sequencing technology represents the critical enabling technology that ideally positions it to capitalize on an approximately $100 billion market opportunity. We believe Illumina’s shares embed expectations for key revenue and cash flow growth drivers that are well below our long-term assumptions. As a result, we believe the company is selling at a significant discount to our estimate of its intrinsic value and offers a compelling reward-to-risk opportunity. We added to our position on multiple occasions during the period.
All aspects of our quality-growth-valuation investment thesis must be present simultaneously for us to make an investment. Often our research is completed well in advance of the opportunity to invest. We are patient investors and maintain coverage of high-quality businesses in order to take advantage of meaningful price dislocations if and when they occur. During the period, we initiated a new
Loomis Sayles Growth Fund
positions in Thermo Fisher Scientific. We added to our existing holdings in Amazon, Block, Disney, Illumina, Meta Platforms, PayPal, and Tesla. We trimmed our existing positions in Deere, Monster Beverage, Novartis, Regeneron Pharmaceuticals, Roche, Vertex Pharmaceuticals, and Yum China. We also trimmed our positions in Meta Platforms and Nvidia as they reached our maximum allowable position size due to market appreciation.
Outlook
Our investment process is characterized by bottom-up, fundamental research and a long-term investment time horizon. The nature of the process leads to a lower-turnover portfolio in which sector positioning is the result of stock selection. As of September 30, we were overweight in the communication services, financials, healthcare, and industrials sectors and equal weight in the consumer discretionary sector. We were underweight in the information technology and consumer staples sectors. We held no positions in the real estate, energy, materials, or utilities sectors.
Top Ten Holdings as of September 30, 2023 |
| |
1 Meta Platforms, Inc., Class A | |
| |
| |
| |
| |
| |
| |
| |
9 Alphabet, Inc., Class A | |
| |
The portfolio is actively managed and holdings are subject to change. There is no guarantee the Fund continues to invest in the securities referenced. The holdings listed exclude any temporary cash investments, are presented on an individual security basis and do not represent holdings of the issuer. |
Loomis Sayles Growth Fund
Hypothetical Growth of $100,000 Investment in Class Y Shares1 |
September 30, 2013 through September 30, 2023 |
Loomis Sayles Growth Fund
Average Annual Total Returns — September 30, 20231 |
| | | | |
| | |
| | | | | |
| | | | | |
| | | | | |
| | | | | |
With 5.75% Maximum Sales Charge | | | | | |
| | | | | |
| | | | | |
| | | | | |
| | | | | |
| | | | | |
| | | | | |
Russell 1000® Growth Index2 | | | | | |
Performance data shown represents past performance and is no guarantee of, and not necessarily indicative of, future results. Total return and value will vary, and you may have a gain or loss when shares are sold. Current performance may be lower or higher than quoted. For most recent month-end performance, visit im.natixis.com/performance. Performance for other share classes will be greater or less than shown based on differences in fees and sales charges. You may not invest directly in an index. Performance for periods less than one year is cumulative, not annualized. Returns reflect changes in share price and reinvestment of dividends and capital gains, if any. The table(s) do not reflect taxes shareholders might owe on any fund distributions or when they redeem their shares.
| Fund performance has been increased by fee waivers and/or expense reimbursements, if any, without which performance would have been lower. |
| Russell 1000® Growth Index is an unmanaged index that measures the performance of the large-cap growth segment of the U.S. equity universe. It includes those Russell 1000® Index companies with higher price-to-book ratios and higher forecasted growth values. |
| Expense ratios are as shown in the Fund’s prospectus in effect as of the date of this report. The expense ratios for the current reporting period can be found in the Financial Highlights section of this report under Ratios to Average Net Assets. Net expenses reflect contractual expense limitations set to expire on 1/31/25. When a Fund’s expenses are below the limitation, gross and net expense ratios will be the same. See Note 5 of the Notes to Financial Statements for more information about the Fund’s expense limitations. |
| Performance for Class C shares assumes a 1.00% contingent deferred sales charge (“CDSC”) applied when you sell shares within one year of purchase, and includes automatic conversion to Class A shares after eight years. |
Loomis Sayles Intermediate Duration Bond Fund
|
|
|
|
Loomis, Sayles & Company, L.P. |
Investment GoalThe Fund seeks above-average total return through a combination of current income and capital appreciation.
Market Conditions
The US fixed-income market produced a narrow gain in the 12 months ended September 30, 2023, albeit with a high level of volatility along the way. The majority of the positive return occurred in the early part of the period. During this time, signs of cooling inflation and slightly more dovish commentary from US Federal Reserve (Fed) officials raised hopes that the central bank was approaching the end of its long series of interest rate hikes. While the Fed continued to raise rates—with a total of 1.25 percentage points of increases in late 2022, followed by four quarter-point hikes in 2023—investors appeared encouraged by hopes that the Fed was nearing the end of its hiking cycle.
This backdrop changed for the worse in the final three months of the period, leading to a downturn that significantly dampened 12-month returns. Crude oil prices surged to their highest level since July 2022, raising the possibility that inflation—which had been ticking lower since late last year—would begin to reaccelerate. In addition, the Fed made it clear that although its pace of interest-rate increases slowed in 2023, it remained open to further hikes if necessary. These developments fed through to longer-term expectations, with the futures markets beginning to factor in fewer rate cuts in 2024 than was the case earlier in the year.
US Treasuries posted a loss and underperformed the more credit-oriented areas of the bond market in the annual period. Performance was mixed across the curve: while the two- and five-year issues produced positive total returns, the 10-year note lost ground and the 30-year bond suffered a double-digit loss. In terms of yield movements, the two-year climbed from 4.22% at the start of the period to 5.03% on the final trading day of September 2023, and the 10-year rose from 3.83% to 4.57%.
Notably, the yield curve remained inverted throughout the period (meaning that short-term yields traded above those on longer-term debt). At the end of June, in fact, the curve was at its highest degree of inversion on the last day of a calendar quarter in history. Although an inverted yield curve has often been a precursor to a recession historically, economic growth stayed in positive territory.
Investment-grade corporate bonds logged robust, broad-based gains and strongly outperformed Treasuries. The category was helped by both its yield advantage and a decline in its yield spread relative to government issues. The ICE BofA US Corporate Index Option-Adjusted Spread opened the period at 1.67 over Treasuries and closed at 1.23, indicating outperformance. Lower-rated bonds, shorter-term debt, and economically sensitive issues exhibited leadership, providing a tailwind for the category.
Over the prior year, securitized assets produced largely positive total returns, with the exception of non-agency commercial mortgage-backed securities (CMBS) and agency mortgage-backed securities (MBS). Collateralized loan obligations (CLOs) and commercial asset-backed securities (ABS) provided particularly strong returns over the period, with portions of the residential mortgage-backed securities (RMBS) market also outperforming. Headwinds facing the commercial real estate sector emerged in the first half of 2023, negatively impacting non-agency CMBS performance over the period. The shorter duration in most securitized credit sectors led to outperformance versus corporates and the broader Bloomberg US Aggregate Bond Index. A challenging technical backdrop negatively impacted agency MBS returns as elevated levels of rate volatility continued. However, agency MBS did outperform US Treasury over the period.
Performance Results
For the 12 months ended September 30, 2023, Class Y shares of the Loomis Sayles Intermediate Duration Bond Fund returned 2.81%. The Fund outperformed its benchmark, the Bloomberg US Intermediate Government/Credit Bond Index, which returned 2.20%.
Explanation of Fund Performance
Sector allocation coupled with effects from duration and yield curve positioning positively contributed to performance over the year. Investment grade corporate bonds were beneficial to performance due to positive sector allocation effects. The sector also generated positive issue selection. US Treasuries and securitized credit also generated positive allocation effects over the one-year period.
Loomis Sayles Intermediate Duration Bond Fund
Security selection effects overall dragged on performance slightly over the year. US Treasury positions weighed on return by way of negative selection effects. Securitized credit holdings generated negative issue selection during the period as well.
Outlook
The Fed increased rates by another 0.25% in July, after skipping the June meeting, bringing the Fed Funds rate to 5.50%. The Fed expressed encouragement over the continued moderation of inflationary pressures through most measures. However, the Fed remained concerned about shelter costs, wage-led pressures in the services economy, tight credit spreads and solid equity market performance. The Fed Funds rate remained steady at the September meeting but bond yields rose sharply in the subsequent weeks in response to hawkish Fed guidance and improving economic sentiment. Expectations for an eventual reversal in monetary policy have been pushed out to mid-2024. From a yield curve perspective, the net result over the quarter was that the curve remains inverted but experienced some "bear-steepening" as longer dated yields rose more than intermediate yields. While the equity market has pulled back from its recent highs, credit spreads have moved relatively little off of their recent cycle tightening, at least thus far.
We continue to believe that we remain in the very late expansion phase of the credit cycle1, and that the significant increase in rates is now starting to impact business and consumer spending decisions. Corporate and consumer balance sheets have been starting to show some signs of strain, and we expect that the lagged effects of tighter credit conditions on the real economy eventually translate into employment pressure and corporate profit degradation. Should growth and inflation sufficiently moderate over the coming 3-6 month period, we think the Fed can pause hiking at or near the current 5.5% Fed Funds rate, and then consider easing policy somewhat starting in the early summer of 2024. This "soft landing" scenario is also currently the stated goal of the Fed.
We view the primary market risks to be above-trend economic growth and persistent "sticky" inflation. If inflation remains above the Fed’s target, and doesn't moderate as we forecast, we could see several more rate hikes this year. Rate hikes may continue into next year, with a peak fed funds rate of 6% or higher, even if unemployment is starting to rise and economic growth is weakening. Recession risk could continue to be a factor if incoming economic data obscures the true impact of higher rates and restrictive monetary policy pushes the economy into downturn. We anticipate potential volatility around government shutdowns, labor unrest, and other knock-on effects from higher inflation and tighter credit conditions.
We continue to favor spread sectors, such as corporate bonds and securitized assets.
The strategy’s corporate bond risk relative to benchmark declined during the quarter, migrating closer to one-third of budget. For mandates which allow for non-investment grade allocations, the team continues to hold a small number of issuers we believe offer value.
We believe ABS continue to be a favorable alternative in the front end of the curve. We currently favor consumer related collateral and prefer the top of the capital stack but are not limited to the highest quality band of the structure. We believe the strategy’s ABS risk relative to benchmark is healthy, but in the lower third of our budget.
The strategy continues to hold CMBS, including both agency and non-agency backed CMBS. CMBS risk relative to benchmark is healthy in our view and sized similarly to ABS risk. We tend to favor senior parts of the capital stack in CMBS opportunities.
We continue to follow our process of seeking to build diversified exposures by asset class, industry and issuers.
1 A credit cycle is a cyclical pattern that follows credit availability and corporate health.
Loomis Sayles Intermediate Duration Bond Fund
Hypothetical Growth of $100,000 Investment in Class Y Shares1, 2 |
September 30, 2013 through September 30, 2023 |
Loomis Sayles Intermediate Duration Bond Fund
Average Annual Total Returns — September 30, 20231,2 |
| | | | | |
| | |
| | | | | | |
| | | | | | |
| | | | | | |
| | | | | | |
With 4.25% Maximum Sales Charge | | | | | | |
Class C (Inception 8/31/16) | | | | | | |
| | | | | | |
| | | | | | |
Class N (Inception 2/1/19) | | | | | | |
| | | | | | |
| | | | | | |
Bloomberg U.S. Intermediate Government/Credit Bond | | | | | | |
Performance data shown represents past performance and is no guarantee of, and not necessarily indicative of, future results. Total return and value will vary, and you may have a gain or loss when shares are sold. Current performance may be lower or higher than quoted. For most recent month-end performance, visit im.natixis.com/performance. Performance for other share classes will be greater or less than shown based on differences in fees and sales charges. You may not invest directly in an index. Performance for periods less than one year is cumulative, not annualized. Returns reflect changes in share price and reinvestment of dividends and capital gains, if any. The table(s) do not reflect taxes shareholders might owe on any fund distributions or when they redeem their shares.
| Fund performance has been increased by fee waivers and/or expense reimbursements, if any, without which performance would have been lower. |
| As of August 31, 2016, the Fund's Retail Class shares and Institutional Class shares were redesignated as Class A shares and Class Y shares, respectively. Accordingly, the returns shown in the table for Class A shares prior to August 31, 2016 are those of Retail Class shares, restated to reflect the sales loads of Class A shares, and the returns in the table for Class Y shares prior to August 31, 2016 are those of Institutional Class shares. Prior to the inception of Class C shares (August 31, 2016), performance is that of Retail Class shares, restated to reflect the higher net expenses and sales loads of Class C shares. |
| Bloomberg U.S. Intermediate Government/Credit Bond Index includes securities in the intermediate maturity range within the Government and Credit Indices. The Government Index includes treasuries (i.e., public obligations of the U.S. Treasury that have remaining maturities of more than one year) and agencies (i.e., publicly issued debt of U.S. Government agencies, quasi-federal corporations, and corporate or foreign debt guaranteed by the U.S. Government). The Credit Index includes publicly issued U.S. corporate and foreign debentures and secured notes that meet specified maturity, liquidity, and quality requirements. |
| Expense ratios are as shown in the Fund’s prospectus in effect as of the date of this report. The expense ratios for the current reporting period can be found in the Financial Highlights section of this report under Ratios to Average Net Assets. Net expenses reflect contractual expense limitations set to expire on 1/31/24. When a Fund’s expenses are below the limitation, gross and net expense ratios will be the same. See Note 5 of the Notes to Financial Statements for more information about the Fund’s expense limitations. |
| Performance for Class C shares assumes a 1.00% contingent deferred sales charge (“CDSC”) applied when you sell shares within one year of purchase, and includes automatic conversion to Class A shares after eight years. |
Loomis Sayles Limited Term Government and Agency Fund
|
|
|
|
Loomis, Sayles & Company, L.P. |
Investment GoalThe Fund seeks high current return consistent with preservation of capital.
Market Conditions
The US fixed-income market produced a narrow gain in the 12 months ended September 30, 2023, albeit with a high level of volatility along the way. The majority of the positive return occurred in the early part of the period. During this time, signs of cooling inflation and slightly more dovish commentary from US Federal Reserve (Fed) officials raised hopes that the central bank was approaching the end of its long series of interest rate hikes. While the Fed continued to raise rates—with a total of 1.25 percentage points of increases in late 2022, followed by four quarter-point hikes in 2023—investors appeared encouraged by hopes that the Fed was nearing the end of its hiking cycle.
This backdrop changed for the worse in the final three months of the period, leading to a downturn that significantly dampened 12-month returns. Crude oil prices surged to their highest level since July 2022, raising the possibility that inflation—which had been ticking lower since late last year—would begin to reaccelerate. In addition, the Fed made it clear that although its pace of interest-rate increases slowed in 2023, it remained open to further hikes if necessary. These developments fed through to longer-term expectations, with the futures markets beginning to factor in fewer rate cuts in 2024 than was the case earlier in the year.
US Treasuries posted a loss and underperformed the more credit-oriented areas of the bond market in the annual period. Performance was mixed across the curve: while the two- and five-year issues produced positive total returns, the 10-year note lost ground and the 30-year bond suffered a double-digit loss. In terms of yield movements, the two-year climbed from 4.22% at the start of the period to 5.03% on the final trading day of September 2023, and the ten-year rose from 3.83% to 4.57%.
Notably, the yield curve remained inverted throughout the period (meaning that short-term yields traded above those on longer-term debt). At the end of June, in fact, the curve was at its highest degree of inversion on the last day of a calendar quarter in history. Although an inverted yield curve has often been a precursor to a recession historically, economic growth stayed in positive territory.
Over the prior year, securitized assets produced largely positive total returns, with the exception of non-agency commercial mortgage-backed securities (CMBS) and agency mortgage-backed securities (MBS). Collateralized loan obligations (CLOs) and commercial asset-backed securities (ABS) provided particularly strong returns over the period, with portions of the residential mortgage-backed securities (RMBS) market also outperforming. Headwinds facing the commercial real estate sector emerged in the first half of 2023, negatively impacting non-agency CMBS performance over the period. The shorter duration in most securitized credit sectors led to outperformance versus corporates and the broader Bloomberg US Aggregate Bond Index. A challenging technical backdrop negatively impacted agency MBS returns as elevated levels of rate volatility continued. However, agency MBS did outperform US Treasury over the period.
Performance Results
For the 12 months ended September 30, 2023, Class Y shares of the Loomis Sayles Limited Term Government and Agency Fund returned 2.79%. The Fund outperformed its benchmark, the Bloomberg US 1-5 Year Government Bond Index, which returned 2.10%.
Explanation of Fund Performance
Duration and yield curve contributions were the bulk of the excess return over the benchmark during the period. The 2-Year US Treasury yield increased approximately 70 bps over the period. The duration posture of the fund over the period was near our target of 2 years while the duration of the benchmark remains longer - closer to 2.5 years. This accounted for the performance impact from duration during the period. Contributions from holdings in agency backed mortgages contributed to performance as well, representing the second largest contribution over the period. Holdings in agency space included agency CMBS, CMOs and GNMA reverse mortgages. Non-agency backed holdings of ABS and CMBS also contributed to performance but to a smaller extent.
Detractors over the period included issue selection within US Treasury securities. Additionally, the fund did not hold any US Agency securities while the benchmark contains securities from the sector. As a result, this accounted for some slight performance detraction during the period. This also represented a detractor from an allocation perspective.
Loomis Sayles Limited Term Government and Agency Fund
Outlook
Agency MBS spreads (the difference in yield between agency MBS and Treasuries of similar maturity) are trending higher than their longer-term averages. We continue to favor MBS sectors less likely to face refinancing and extension risk, such as low loan balance mortgages and home equity conversion mortgages.
Within the commercial real estate sector, we have focused on agency CMBS opportunities.
Our non-agency securitized exposures remain steady, utilizing ABS and CMBS equally. In aggregate, non-agency exposure continues to be in the upper end of our preferred zone.
Hypothetical Growth of $100,000 Investment in Class Y Shares1 |
September 30, 2013 through September 30, 2023 |
See notes to chart on page 27.
Loomis Sayles Limited Term Government and Agency Fund
Average Annual Total Returns — September 30, 20231 |
| | | | | |
| | |
| | | | | | |
| | | | | | |
| | | | | | |
| | | | | | |
With 2.25% Maximum Sales Charge | | | | | | |
| | | | | | |
| | | | | | |
| | | | | | |
Class N (Inception 2/1/17) | | | | | | |
| | | | | | |
| | | | | | |
Bloomberg U.S. 1-5 Year Government Bond Index2 | | | | | | |
Performance data shown represents past performance and is no guarantee of, and not necessarily indicative of, future results. Total return and value will vary, and you may have a gain or loss when shares are sold. Current performance may be lower or higher than quoted. For most recent month-end performance, visit im.natixis.com/performance. Performance for other share classes will be greater or less than shown based on differences in fees and sales charges. You may not invest directly in an index. Performance for periods less than one year is cumulative, not annualized. Returns reflect changes in share price and reinvestment of dividends and capital gains, if any. The table(s) do not reflect taxes shareholders might owe on any fund distributions or when they redeem their shares.
| Fund performance has been increased by fee waivers and/or expense reimbursements, if any, without which performance would have been lower. |
| Bloomberg U.S. 1-5 Year Government Bond Index is a subindex of the Bloomberg U.S. Government Index, which is comprised of the Bloomberg U.S. Treasury and U.S. Agency Indices. The Bloomberg U.S. Government Index includes Treasuries (public obligations of the U.S. Treasury that have remaining maturities of more than one year) and U.S. agency debentures (publicly issued debt of U.S. government agencies, quasi-federal corporations, and corporate or foreign debt guaranteed by the U.S. government). The Bloomberg U.S. Government Index is a component of the Bloomberg U.S. Government/Credit Index and the Bloomberg U.S. Aggregate Bond Index. |
| Expense ratios are as shown in the Fund’s prospectus in effect as of the date of this report. The expense ratios for the current reporting period can be found in the Financial Highlights section of this report under Ratios to Average Net Assets. Net expenses reflect contractual expense limitations set to expire on 1/31/24. When a Fund’s expenses are below the limitation, gross and net expense ratios will be the same. See Note 5 of the Notes to Financial Statements for more information about the Fund’s expense limitations. |
| Performance for Class C shares assumes a 1.00% contingent deferred sales charge (“CDSC”) applied when you sell shares within one year of purchase, and includes automatic conversion to Class A shares after eight years. |
ADDITIONAL INFORMATION
The views expressed in this report reflect those of the portfolio managers as of the dates indicated. The managers’ views are subject to change at any time without notice based on changes in market or other conditions. References to specific securities or industries should not be regarded as investment advice. Because the Funds are actively managed, there is no assurance that they will continue to invest in the securities or industries mentioned.
All investing involves risk, including the risk of loss. There is no assurance that any investment will meet its performance objectives or that losses will be avoided.
ADDITIONAL INDEX INFORMATION
This document may contain references to third party copyrights, indexes, and trademarks, each of which is the property of its respective owner. Such owner is not affiliated with Natixis Investment Managers or any of its related or affiliated companies (collectively “Natixis Affiliates”) and does not sponsor, endorse or participate in the provision of any Natixis Affiliates services, funds or other financial products.
The index information contained herein is derived from third parties and is provided on an “as is” basis. The user of this information assumes the entire risk of use of this information. Each of the third party entities involved in compiling, computing or creating index information disclaims all warranties (including, without limitation, any warranties of originality, accuracy, completeness, timeliness, non-infringement, merchantability and fitness for a particular purpose) with respect to such information.
PROXY VOTING INFORMATION
A description of the Natixis Funds' proxy voting policies and procedures is available without charge, upon request, by calling Natixis Funds at 800-225-5478; on the Natixis Funds’ website at im.natixis.com, and on the Securities and Exchange Commission (“SEC”) website at www.sec.gov. Information about how the Natixis Funds voted proxies relating to portfolio securities during the most recent 12-month period ended June 30 is available through the Natixis Funds’ website and the SEC website.
QUARTERLY PORTFOLIO SCHEDULES
The Natixis Funds file a complete schedule of portfolio holdings with the SEC for the first and third quarters of each fiscal year as an exhibit to its reports on Form N-PORT. The Funds’ Form N-PORT reports are available on the SEC website at www.sec.gov. First and third quarter schedules of portfolio holdings are also available at im.natixis.com/funddocuments. A hard copy may be requested from the Fund at no charge by calling 800-225-5478.
CFA® and Chartered Financial Analyst® are registered trademarks owned by the CFA Institute.
Understanding Fund Expenses
As a mutual fund shareholder, you incur different costs: transaction costs, including sales charges (loads) on purchases and contingent deferred sales charges on redemptions, and ongoing costs, including management fees, distribution and/or service fees ("12b-1 fees"), and other fund expenses. Certain exemptions may apply. These costs are described in more detail in the Funds’ prospectus. The following examples are intended to help you understand the ongoing costs of investing in the Funds and help you compare these with the ongoing costs of investing in other mutual funds.
The first line in the table of each class of Fund shares shows the actual account values and actual Fund expenses you would have paid on a $1,000 investment in the Fund from April 1, 2023 through September 30, 2023. To estimate the expenses you paid over the period, simply divide your account value by $1,000 (for example $8,600 account value divided by $1,000 = 8.60) and multiply the result by the number in the Expenses Paid During Period column as shown for your class.
The second line in the table for each class of fund shares provides information about hypothetical account values and hypothetical expenses based on the Fund’s actual expense ratios and an assumed rate of return of 5% per year before expenses, which is not the Fund’s actual return. The hypothetical account values and expenses may not be used to estimate the actual ending account balance or expenses you paid on your investment for the period. You may use this information to compare the ongoing costs of investing in the Fund and other funds. To do so, compare this 5% hypothetical example with the 5% hypothetical examples that appear in the shareholder reports of the other funds.
Please note that the expenses shown reflect ongoing costs only, and do not include any transaction costs, such as sales charges. Therefore, the second line in the table of each fund is useful in comparing ongoing costs only, and will not help you determine the relative costs of owning funds. If transaction costs were included, total costs would be higher.
Loomis Sayles Core Plus Bond Fund | Beginning
Account Value
4/1/2023 | Ending
Account Value
9/30/2023 | Expenses Paid
4/1/2023 – 9/30/2023 |
| | | |
| | | |
Hypothetical (5% return before expenses) | | | |
| | | |
| | | |
Hypothetical (5% return before expenses) | | | |
| | | |
| | | |
Hypothetical (5% return before expenses) | | | |
| | | |
| | | |
Hypothetical (5% return before expenses) | | | |
| Expenses are equal to the Fund’s annualized expense ratio (after waiver/reimbursement): 0.74%, 1.49%, 0.39% and 0.49% for Class A, C, N and Y, respectively, multiplied by the average account value over the period, multiplied by the number of days in the most recent fiscal half-year (183), divided by 365 (to reflect the half-year period). |
Loomis Sayles Credit Income Fund | Beginning
Account Value
4/1/2023 | Ending
Account Value
9/30/2023 | Expenses Paid
4/1/2023 – 9/30/2023 |
| | | |
| | | |
Hypothetical (5% return before expenses) | | | |
| | | |
| | | |
Hypothetical (5% return before expenses) | | | |
| | | |
| | | |
Hypothetical (5% return before expenses) | | | |
| | | |
| | | |
Hypothetical (5% return before expenses) | | | |
| Expenses are equal to the Fund’s annualized expense ratio (after waiver/reimbursement): 0.82%, 1.56%, 0.52% and 0.57% for Class A, C, N and Y, respectively, multiplied by the average account value over the period, multiplied by the number of days in the most recent fiscal half-year (183), divided by 365 (to reflect the half-year period). |
Loomis Sayles Global Allocation Fund | Beginning
Account Value
4/1/2023 | Ending
Account Value
9/30/2023 | Expenses Paid
4/1/2023 – 9/30/2023 |
| | | |
| | | |
Hypothetical (5% return before expenses) | | | |
| | | |
| | | |
Hypothetical (5% return before expenses) | | | |
| | | |
| | | |
Hypothetical (5% return before expenses) | | | |
| | | |
| | | |
Hypothetical (5% return before expenses) | | | |
| Expenses are equal to the Fund's annualized expense ratio: 1.17%, 1.92%, 0.82% and 0.92% for Class A, C, N and Y, respectively, multiplied by the average account value over the period, multiplied by the number of days in the most recent fiscal half–year (183), divided by 365 (to reflect the half–year period). |
Loomis Sayles Growth Fund | Beginning
Account Value
4/1/2023 | Ending
Account Value
9/30/2023 | Expenses Paid
4/1/2023 – 9/30/2023 |
| | | |
| | | |
Hypothetical (5% return before expenses) | | | |
| | | |
| | | |
Hypothetical (5% return before expenses) | | | |
| | | |
| | | |
Hypothetical (5% return before expenses) | | | |
| | | |
| | | |
Hypothetical (5% return before expenses) | | | |
| Expenses are equal to the Fund's annualized expense ratio: 0.92%, 1.67%, 0.57% and 0.67% for Class A, C, N and Y, respectively, multiplied by the average account value over the period, multiplied by the number of days in the most recent fiscal half–year (183), divided by 365 (to reflect the half–year period). |
Loomis Sayles Intermediate Duration Bond Fund | Beginning
Account Value
4/1/2023 | Ending
Account Value
9/30/2023 | Expenses Paid
4/1/2023 – 9/30/2023 |
| | | |
| | | |
Hypothetical (5% return before expenses) | | | |
| | | |
| | | |
Hypothetical (5% return before expenses) | | | |
| | | |
| | | |
Hypothetical (5% return before expenses) | | | |
| | | |
| | | |
Hypothetical (5% return before expenses) | | | |
| Expenses are equal to the Fund’s annualized expense ratio (after waiver/reimbursement): 0.65%, 1.40%, 0.35% and 0.40% for Class A, C, N and Y, respectively, multiplied by the average account value over the period, multiplied by the number of days in the most recent fiscal half-year (183), divided by 365 (to reflect the half-year period). |
Loomis Sayles Limited Term Government And Agency Fund | Beginning
Account Value
4/1/2023 | Ending
Account Value
9/30/2023 | Expenses Paid
4/1/2023 – 9/30/2023 |
| | | |
| | | |
Hypothetical (5% return before expenses) | | | |
| | | |
| | | |
Hypothetical (5% return before expenses) | | | |
| | | |
| | | |
Hypothetical (5% return before expenses) | | | |
| | | |
| | | |
Hypothetical (5% return before expenses) | | | |
| Expenses are equal to the Fund’s annualized expense ratio (after waiver/reimbursement): 0.70%, 1.45%, 0.40% and 0.45% for Class A, C, N and Y, respectively, multiplied by the average account value over the period, multiplied by the number of days in the most recent fiscal half-year (183), divided by 365 (to reflect the half-year period). |
BOARD APPROVAL OF THE EXISTING ADVISORY AGREEMENTS
The Board of Trustees of the Trusts (the “Board”), including the Independent Trustees, considers matters bearing on each Fund’s advisory agreement (collectively, the “Agreements”) at most of its meetings throughout the year. Each year, usually in the spring, the Contract Review Committee of the Board meets to review the Agreements to determine whether to recommend that the full Board approve the continuation of the Agreements, typically for an additional one-year period. This meeting typically includes all the Independent Trustees, including the Trustees who do not serve on the Contract Review Committee. After the Contract Review Committee has made its recommendation, the full Board, including the Independent Trustees, determines whether to approve the continuation of the Agreements at its June board meeting.
In connection with these meetings, the Trustees receive materials that the Funds’ investment adviser and Loomis Sayles Core Plus Bond Fund’s advisory administrator (the “Advisers”) believe to be reasonably necessary for the Trustees to evaluate the Agreements. These materials generally include, among other items, (i) information on the investment performance of the Funds and the performance of peer groups of funds and the Funds’ performance benchmarks, (ii) information on the Funds’ advisory fees and other expenses, including information comparing the Funds’ advisory fees to the fees charged to institutional accounts with similar strategies managed by the Advisers, if any, and to those of peer groups of funds and information about any applicable expense limitations and/or fee “breakpoints,” (iii) sales and redemption data in respect of the Funds, (iv) information about the profitability of the Agreements to the Advisers, including how profitability is determined by the Fund, and (v) information obtained through the completion by the Advisers of a questionnaire distributed on behalf of the Trustees. The Board, including the Independent Trustees, also considers other matters such as (i) each Fund’s investment objective and strategies and the size, education and experience of the Advisers’ investment staffs and their use of technology, external research and trading cost measurement tools, (ii) arrangements in respect of the distribution of the Funds’ shares and the related costs, (iii) the allocation of the Funds’ brokerage, if any, including, to the extent applicable, allocations to brokers affiliated with the Advisers and the use of “soft” commission dollars to pay for research and other similar services, (iv) the Advisers’ policies and procedures relating to, among other things, compliance, trading and best execution, proxy voting, liquidity and valuation, (v) information about amounts invested by the Funds’ portfolio managers in the Funds or in similar accounts that they manage and (vi) the general economic outlook with particular emphasis on the mutual fund industry. Throughout the process, the Trustees are afforded the opportunity to ask questions of and request additional materials from the Advisers and the Independent Trustees meet separately with independent legal counsel outside the presence of Adviser personnel.
In addition to the materials requested by the Trustees in connection with their annual consideration of the continuation of the Agreements, the Trustees receive materials in advance of each regular quarterly meeting of the Board that provide detailed information about the Funds’ investment performance and the fees charged to the Funds for advisory and other services. The information received by the Trustees generally includes, where available, among other things, an internal performance rating for each Fund based on agreed-upon criteria, graphs showing each Fund’s performance and expense differentials against each Fund’s peer group/category of funds, total return information for various periods, performance rankings provided by a third-party data provider for various periods comparing a Fund against similarly categorized funds, and performance ratings provided by a different third-party rating organization. The portfolio management team for each Fund or other representatives of the Advisers make periodic presentations to the Contract Review Committee and/or the full Board, and Funds identified as presenting possible performance concerns may be subject to more frequent Board or Committee presentations and reviews. In addition, the Trustees are periodically provided with detailed statistical information about each Fund’s portfolio. The Trustees also receive periodic updates between meetings, both at the Board and at the Committee level.
The Board most recently approved the continuation of the Agreements for a one-year period at its meeting held in June 2023. In considering whether to approve the continuation of the Agreements, the Board, including the Independent Trustees, did not identify any single factor as determinative. Individual Trustees may have evaluated the information presented differently from one another, giving different weights to various factors. Matters considered by the Trustees, including the Independent Trustees, in connection with their approval of the Agreements included, but were not limited to, the factors listed below.
The nature, extent and quality of the services provided to the Funds under the Agreements. The Trustees considered the nature, extent and quality of the services provided by the Advisers and their affiliates to the Funds and the resources dedicated to the Funds by the Advisers and their affiliates. The Trustees also considered their experience with other funds advised or sub-advised by the Advisers, as well as the affiliation between the Advisers and Natixis Investment Managers, LLC, whose affiliates provide investment advisory services to other funds in the Natixis family of funds.
The Trustees considered not only the advisory services provided by the Advisers to the Funds, but also the benefits to the Funds from the monitoring and oversight services provided by Natixis Advisors, LLC (“Natixis Advisors”). They also considered the administrative and shareholder services provided by Natixis Advisors and its affiliates to the Funds. They also took into consideration increases in the services provided resulting from new regulatory requirements, such as recent rules relating to the fair valuation of investments and the use of derivatives, as well as from monitoring proposed rules, such as those relating to privacy and cybersecurity, environmental, social and governance-specific disclosures, and vendor oversight.
For each Fund, the Trustees also considered the benefits to shareholders of investing in a mutual fund that is part of a family of funds that offers shareholders the right to exchange shares of one type of fund for shares of another type of fund, and provides a variety of fund and shareholder services.
After reviewing these and related factors, the Trustees concluded, within the context of their overall conclusions regarding each of the Agreements, that the nature, extent and quality of services provided supported the renewal of the Agreements.
Investment performance of the Funds and the Advisers. As noted above, the Trustees received information about the performance of the Funds over various time periods, including information that compared the performance of the Funds to the performance of peer groups and categories of funds and the Funds’ respective performance benchmarks. The Board noted that while it found the data provided by the independent third-party data provider useful, it recognized its limitations, including, in particular, that notable differences may exist between the Funds and the performance comparisons (for example, with respect to investment strategies) and that the results of the performance comparisons may vary depending on (i) the end dates for the performance periods that were selected and (ii) the selection of the performance comparisons. The Trustees also received information about how comparative peer groups are constructed. In addition, the Trustees reviewed data prepared by an independent third-party rating organization that analyzed the performance of the Funds using a variety of performance metrics, including metrics that measured the performance of the Funds on a risk adjusted basis.
The Board noted that, through December 31, 2022, each Fund’s one-, three- and five-year performance, stated as percentile rankings within categories selected by the independent third-party data provider, was as follows (where the best performance would be in the first percentile of its category):
| | | |
Loomis Sayles Core Plus Bond Fund | | | |
Loomis Sayles Credit Income Fund | | | |
Loomis Sayles Global Allocation Fund | | | |
Loomis Sayles Growth Fund | | | |
Loomis Sayles Intermediate Duration Bond Fund | | | |
Loomis Sayles Limited Term Government and Agency Fund | | | |
In the case of a Fund that had performance that lagged that of a relevant category median as determined by the independent third-party data provider for certain (although not necessarily all) periods, the Board concluded that other factors relevant to performance supported renewal of the Agreements. These factors included one or more of the following: (1) that the underperformance was attributable, to a significant extent, to investment decisions (such as security selection or sector allocation) by the Advisers that were reasonable and consistent with the Fund’s investment objective and policies; (2) that the Fund had outperformed its relevant performance benchmark for the one-year period ended December 31, 2022; (3) that the Fund had outperformed its relevant performance benchmark for the three-, five-, and ten-year periods ended December 31, 2022; (4) that the average duration of funds in the Fund’s category is considerably shorter than that of the Fund, as a result of the Fund’s mandate, such that its performance relative to its category would be expected to lag in certain market conditions; and (5) that the Fund’s long-term (five-year and 10-year) performance was stronger relative to its category. The Board also considered information about the Funds’ more recent performance, including how performance over various periods had been impacted by various factors such as market and economic events.
The Trustees also considered the Advisers’ performance and reputation generally, the performance of the fund family generally, and the historical responsiveness of the Advisers to Trustee concerns about performance and the willingness of the Advisers to take steps intended to improve performance.
After reviewing these and related factors, the Trustees concluded, within the context of their overall conclusions regarding each of the Agreements, that the performance of the Funds and the Advisers and/or other relevant factors supported the renewal of the Agreements.
The costs of the services to be provided and profits to be realized by the Advisers and their affiliates from their respective relationships with the Funds. The Trustees considered the fees charged to the Funds for advisory and administrative services as well as the total expense levels of the Funds. This information included comparisons (provided both by management and by an independent third party) of the Funds’ advisory fees and total expense levels to those of their peer groups and information about the advisory fees charged by the Advisers to comparable accounts (such as institutional separate accounts), as well as information about differences in such fees and the reasons for any such differences. In considering the fees charged to comparable accounts, the Trustees considered, among other things, management’s representations about the differences between managing mutual funds as compared to other types of accounts, including the additional resources required to effectively manage mutual fund assets, the greater regulatory costs associated with the management of such assets, and the entrepreneurial, regulatory and other risks associated with sponsoring and managing mutual funds. In evaluating
each Fund’s advisory fee, the Trustees also took into account the demands, complexity and quality of the investment management of such Fund, as well as the need for the Advisers to offer competitive compensation and the potential need to expend additional resources to the extent the Fund grows in size. The Trustees considered that over the past several years, management had demonstrated its intention to have competitive fee levels by making recommendations regarding reductions in advisory fee rates, implementation of advisory fee breakpoints and the institution of advisory fee waivers and expense limitations for various funds in the fund family. They noted that the Funds have expense limitations in place, and they considered the amounts waived or reimbursed by the Advisers for Loomis Sayles Core Plus Bond Fund, Loomis Sayles Credit Income Fund, Loomis Sayles Intermediate Duration Bond Fund, and Loomis Sayles Limited Term Government and Agency Fund under their respective expense limitation agreements. The Trustees also considered that the current expenses for Loomis Sayles Global Allocation Fund and Loomis Sayles Growth Fund were below each Fund’s expense limitation and that management had proposed to reduce the expense limitation for all share classes of those Funds, effective July 1, 2023. The Trustees also noted that the total advisory fee rate for Loomis Sayles Growth Fund, Loomis Sayles Intermediate Duration Bond Fund, and Loomis Sayles Limited Term Government and Agency Fund was below the median of its peer group of funds. The Board also considered that the fee and expense information reflected information as of a certain date and that historical asset levels may differ from current asset levels, particularly in a period of market volatility.
The Trustees noted that certain of the Funds had total advisory fee rates that were above the median of a peer group of funds. In this regard, the Trustees considered the factors that management believed justified such relatively higher advisory fee rates, including: (1) that the advisory fee was only one basis point higher than the median of a peer group of funds; and (2) that the advisory fee was only two basis points higher than the median of a peer group of funds.
The Trustees also considered the compensation directly or indirectly received by the Advisers and their affiliates from their relationships with the Funds. The Trustees reviewed information provided by management as to the profitability of the Advisers’ and their affiliates’ relationships with the Funds, and information about how expenses are determined and allocated for purposes of profitability calculations. They also reviewed information provided by management about the effect of distribution costs and changes in asset levels on Adviser profitability, including information regarding resources spent on distribution activities. When reviewing profitability, the Trustees also considered information about court cases in which adviser compensation or profitability were issues, the performance of the Funds, the expense levels of the Funds, whether the Advisers had implemented breakpoints and/or expense limitations with respect to such Funds and the overall profit margin of Natixis Investment Managers, LLC compared to that of certain other investment managers for which such data was available. The Board also noted the competitive nature of the global asset management industry.
After reviewing these and related factors, the Trustees concluded, within the context of their overall conclusions regarding each of the Agreements, that the advisory fee charged to each of the Funds was fair and reasonable, and that the costs of these services generally and the related profitability of the Advisers and their affiliates in respect of their relationships with the Funds supported the renewal of the Agreements.
Economies of Scale. The Trustees considered the existence of any economies of scale in the provision of services by the Advisers and whether those economies are shared with the Funds through breakpoints in their investment advisory fees or other means, such as expense limitations. The Trustees also considered management’s explanation of the factors that are taken into account with respect to the implementation of breakpoints in investment advisory fees or expense limitations, which reduced the total expenses borne by shareholders of certain Funds. With respect to economies of scale, the Trustees noted that each of Loomis Sayles Core Plus Bond Fund, Loomis Sayles Global Allocation Fund and Loomis Sayles Limited Term Government and Agency Fund had breakpoints in its advisory fee and that each of the Funds was subject to an expense limitation. In considering these issues, the Trustees also took note of the costs of the services provided (both on an absolute and on a relative basis) and the profitability to the Advisers and their affiliates of their relationships with the Funds, as discussed above. The Trustees also considered that the Funds have benefitted from the substantial reinvestment each Adviser has made into its business.
After reviewing these and related factors, the Trustees concluded, within the context of their overall conclusions regarding the Agreements, that the extent to which economies of scale were shared with the Funds supported the renewal of the Agreements.
The Trustees also considered other factors, which included but were not limited to the following:
• The effect of various factors and recent market and economic events, such as recent market volatility, geopolitical instability, aggressive domestic and foreign central bank policies, and lingering effects of the Covid-19 crisis, as applicable, on the performance, asset levels and expense ratios of each Fund.
• Whether each Fund has operated in accordance with its investment objective and the Fund’s record of compliance with its investment restrictions, and the compliance programs of the Funds and the Advisers. They also considered the compliance-related resources the Advisers and their affiliates were providing to the Funds.
• So-called “fallout benefits” to the Advisers, such as the engagement of affiliates of the Advisers to provide distribution and administrative services to the Funds, and the benefits of research made available to the Advisers by reason of brokerage commissions (if any) generated by the Funds’ securities transactions. The Trustees considered the possible conflicts of interest associated with these fallout and other benefits, and the reporting, disclosure and other processes in place to disclose and monitor such possible conflicts of interest.
• The Trustees’ review and discussion of the Funds’ advisory arrangements in prior years, and management’s record of responding to Trustee concerns raised during the year and in prior years.
Based on their evaluation of all factors that they deemed to be material, including those factors described above, and assisted by the advice of independent counsel, the Trustees, including the Independent Trustees, concluded that the existing Agreements should be continued through June 30, 2024.
LIQUIDITY RISK MANAGEMENT PROGRAM
Annual Report for the Period Commencing on January 1, 2022 and ending December 31, 2022 (including updates through September 30, 2023)
Effective December 1, 2018 (September 29, 2020 for Loomis Sayles Credit Income Fund), the Funds adopted a liquidity risk management program (the “Program”) pursuant to the requirements of Rule 22e-4 under the Investment Company Act of 1940, as amended (the “Rule”). The Rule requires registered open-end funds, including mutual funds and exchange-traded funds, to establish liquidity risk management programs in order to effectively manage fund liquidity and mitigate the risk that a fund could not meet redemption requests without significantly diluting the interests of remaining investors.
The Rule requires the Funds to assess, manage and review their liquidity risk considering applicable factors during normal and foreseeable stressed conditions. In fulfilling this requirement, each Fund assesses and reviews (where applicable and amongst other matters) its investment strategy, portfolio holdings, possible investment concentrations, use of derivatives, short-term and long-term cash flow projections, use of cash and cash equivalents, as well as borrowing arrangements and other funding sources. Each Program has established a Program Administrator, which is the adviser of the Funds.
In accordance with the Program, each of the Fund’s portfolio investments is classified into one of four liquidity categories based on a determination of a reasonable expectation for how long it would take to convert the investment to cash (or sell or dispose of the investment) without significantly changing its market value.
Each Fund is prohibited from acquiring an investment if, after the acquisition, its holdings of illiquid assets will exceed 15% of its net assets. If a Fund does not hold a majority of highly liquid investments in its portfolio, then the Fund is required to establish a highly liquid investment minimum (“HLIM”). Loomis Sayles Core Plus Bond Fund, Loomis Sayles Credit Income Fund and Loomis Sayles Intermediate Duration Bond Fund have established an HLIM.
During the period from January 1, 2022 to December 31, 2022, there were no material changes to the Program and no material events that impacted the operation of the Funds’ Programs. During the period, the Funds held sufficient liquid assets to meet redemptions on a timely basis and did not have any HLIM or illiquid security violations.
During the period January 1, 2023 through September 30, 2023, the Funds held sufficient liquid assets to meet redemptions on a timely basis and did not have any HLIM or illiquid security violations.
Annual Program Assessment and Conclusion
In the opinion of the Program Administrators, the Program of each Fund approved by the Funds’ Board is operating effectively. The Program Administrators have also monitored, assessed and managed each Fund’s liquidity risk regularly throughout the period.
Pursuant to the Rule’s requirements, the Board has received and reviewed a written report prepared by each Fund’s Program Administrator that addressed the operation of the Programs, assessed their adequacy and effectiveness and described any material changes made to the Programs.
Portfolio of Investments – as of September 30, 2023
Loomis Sayles Core Plus Bond Fund
| | |
Bonds and Notes — 91.8% of Net Assets |
|
|
Non-Convertible Bonds — 91.7% |
| |
| AmeriCredit Automobile Receivables Trust, Series 2023-1, Class C, 5.800%, 12/18/2028 | |
| Avis Budget Rental Car Funding AESOP LLC, Series 2019-2A, Class A, 3.350%, 9/22/2025(a) | |
| Avis Budget Rental Car Funding AESOP LLC, Series 2020-2A, Class A, 2.020%, 2/20/2027(a) | |
| Avis Budget Rental Car Funding AESOP LLC, Series 2022-1A, Class A, 3.830%, 8/21/2028(a) | |
| Avis Budget Rental Car Funding AESOP LLC, Series 2023-2A, Class A, 5.200%, 10/20/2027(a) | |
| Avis Budget Rental Car Funding AESOP LLC, Series 2023-8A, Class A, 6.020%, 2/20/2030(a) | |
| Carvana Auto Receivables Trust, Series 2023-N1, Class A, 6.360%, 4/12/2027(a) | |
| Carvana Auto Receivables Trust, Series 2023-P1, Class A3, 5.980%, 12/10/2027(a) | |
| Credit Acceptance Auto Loan Trust, Series 2023-1A, Class A, 6.480%, 3/15/2033(a) | |
| DT Auto Owner Trust, Series 2023-1A, Class C, 5.550%, 10/16/2028(a) | |
| Exeter Automobile Receivables Trust, Series 2021-2A, Class C, 0.980%, 6/15/2026 | |
| Exeter Automobile Receivables Trust, Series 2023-1A, Class C, 5.820%, 2/15/2028 | |
| Ford Credit Auto Lease Trust, Series 2023-B, Class C, 6.430%, 4/15/2027 | |
| Ford Credit Auto Owner Trust, Series 2018-1, Class B, 3.340%, 7/15/2031(a) | |
| Ford Credit Auto Owner Trust, Series 2023-1, Class A, 4.850%, 8/15/2035(a) | |
| GM Financial Automobile Leasing Trust, Series 2023-1, Class B, 5.510%, 1/20/2027 | |
| Hertz Vehicle Financing III LLC, Series 2023-2A, Class A, 5.570%, 9/25/2029(a) | |
| Hertz Vehicle Financing LLC, Series 2021-1A, Class A, 1.210%, 12/26/2025(a) | |
| NextGear Floorplan Master Owner Trust, Series 2023-1A, Class A2, 5.740%, 3/15/2028(a) | |
| OneMain Direct Auto Receivables Trust, Series 2023-1A, Class A, 5.410%, 11/14/2029(a) | |
| Santander Bank Auto Credit-Linked Notes, Series 2022-C, Class B, 6.451%, 12/15/2032(a) | |
| Santander Bank Auto Credit-Linked Notes, Series 2022-C, Class C, 6.986%, 12/15/2032(a) | |
| Santander Drive Auto Receivables Trust, Series 2021-3, Class C, 0.950%, 9/15/2027 | |
| Santander Drive Auto Receivables Trust, Series 2022-2, Class B, 3.440%, 9/15/2027 | |
| Westlake Automobile Receivables Trust, Series 2022-2A, Class C, 4.850%, 9/15/2027(a) | |
| Westlake Automobile Receivables Trust, Series 2023-1A, Class B, 5.410%, 1/18/2028(a) | |
| Westlake Automobile Receivables Trust, Series 2023-2A, Class C, 6.290%, 3/15/2028(a) | |
| | |
| |
| CoreVest American Finance Ltd., Series 2019-3, Class A, 2.705%, 10/15/2052(a) | |
| | |
|
| ABS Home Equity — continued |
| Countrywide Asset-Backed Certificates, Series 2004-S1, Class A3, 5.115%, 2/25/2035(b) | |
| OBX Trust, Series 2018-EXP1, Class 1A3, 4.000%, 4/25/2048(a)(b) | |
| Progress Residential Trust, Series 2023-SFR1, Class A, 4.300%, 3/17/2040(a) | |
| Sequoia Mortgage Trust, Series 2017-CH1, Class A1, 4.000%, 8/25/2047(a)(b) | |
| Sequoia Mortgage Trust, Series 2018-CH1, Class A1, 4.000%, 3/25/2048(a)(b) | |
| Sequoia Mortgage Trust, Series 2018-CH3, Class A2, 4.000%, 8/25/2048(a)(b) | |
| Towd Point Mortgage Trust, Series 2015-1, Class A5, 4.308%, 10/25/2053(a)(b) | |
| Towd Point Mortgage Trust, Series 2015-4, Class M2, 3.750%, 4/25/2055(a)(b) | |
| Towd Point Mortgage Trust, Series 2016-2, Class M2, 3.000%, 8/25/2055(a)(b) | |
| Towd Point Mortgage Trust, Series 2018-3, Class A1, 3.750%, 5/25/2058(a)(b) | |
| | |
| |
| Affirm Asset Securitization Trust, Series 2023-A, Class A, 6.610%, 1/18/2028(a) | |
| CLI Funding VIII LLC, Series 2021-1A, Class A, 1.640%, 2/18/2046(a) | |
| DB Master Finance LLC, Series 2021-1A, Class A2II, 2.493%, 11/20/2051(a) | |
| Donlen Fleet Lease Funding 2 LLC, Series 2021-2, Class A2, 0.560%, 12/11/2034(a) | |
| Jack in the Box Funding LLC, Series 2022-1A, Class A2I, 3.445%, 2/26/2052(a) | |
| Jack in the Box Funding LLC, Series 2022-1A, Class A2II, 4.136%, 2/26/2052(a) | |
| Lunar Structured Aircraft Portfolio Notes, Series 2021-1, Class A, 2.636%, 10/15/2046(a) | |
| Navigator Aircraft ABS Ltd., Series 2021-1, Class A, 2.771%, 11/15/2046(a)(b) | |
| OneMain Financial Issuance Trust, Series 2020-1A, Class A, 3.840%, 5/14/2032(a) | |
| OneMain Financial Issuance Trust, Series 2021-1A, Class A2, 30 day USD SOFR Average + 0.760%, 6.073%, 6/16/2036(a)(c) | |
| Textainer Marine Containers Ltd., Series 2021-3A, Class A, 1.940%, 8/20/2046(a) | |
| Textainer Marine Containers VII Ltd., Series 2020-2A, Class A, 2.100%, 9/20/2045(a) | |
| Wheels Fleet Lease Funding 1 LLC, Series 2023-1A, Class A, 5.800%, 4/18/2038(a) | |
| | |
| |
| Navient Private Education Refi Loan Trust, Series 2020-HA, Class A, 1.310%, 1/15/2069(a) | |
| Navient Private Education Refi Loan Trust, Series 2021-CA, Class A, 1.060%, 10/15/2069(a) | |
| Navient Private Education Refi Loan Trust, Series 2023-A, Class A, 5.510%, 10/15/2071(a) | |
| SMB Private Education Loan Trust, Series 2021-A, Class APT2, 1.070%, 1/15/2053(a) | |
See accompanying notes to financial statements.
Portfolio of Investments – as of September 30, 2023
Loomis Sayles Core Plus Bond Fund (continued)
| | |
|
| ABS Student Loan — continued |
| SMB Private Education Loan Trust, Series 2021-C, Class A2, 1 mo. USD SOFR + 0.914%, 6.247%, 1/15/2053(a)(c) | |
| SMB Private Education Loan Trust, Series 2023-A, Class A1A, 5.380%, 1/15/2053(a) | |
| SoFi Professional Loan Program LLC, Series 2020-A, Class A2FX, 2.540%, 5/15/2046(a) | |
| | |
| ABS Whole Business — 0.3% |
| Domino's Pizza Master Issuer LLC, Series 2018-1A, Class A2I, 4.116%, 7/25/2048(a) | |
| Planet Fitness Master Issuer LLC, Series 2022-1A, Class A2I, 3.251%, 12/05/2051(a) | |
| Planet Fitness Master Issuer LLC, Series 2022-1A, Class A2II, 4.008%, 12/05/2051(a) | |
| | |
| Aerospace & Defense — 0.5% |
| Boeing Co., 5.705%, 5/01/2040 | |
| Boeing Co., 5.805%, 5/01/2050 | |
| Textron, Inc., 3.000%, 6/01/2030 | |
| | |
| Agency Commercial Mortgage-Backed Securities — 0.5% |
| Federal Home Loan Mortgage Corp., 3.350%, 8/01/2037 | |
| Federal Home Loan Mortgage Corp., 3.450%, 5/01/2037 | |
| Federal Home Loan Mortgage Corp., 3.700%, 5/01/2037 | |
| Federal Home Loan Mortgage Corp., 3.750%, 5/01/2037 | |
| Federal Home Loan Mortgage Corp., 3.900%, 7/01/2037 | |
| Federal Home Loan Mortgage Corp., 3.900%, 7/01/2037 | |
| Federal National Mortgage Association, 3.850%, 9/01/2037 | |
| Federal National Mortgage Association, 3.940%, 9/01/2032 | |
| Federal National Mortgage Association, 4.240%, 7/01/2038 | |
| | |
| |
| American Airlines, Inc./AAdvantage Loyalty IP Ltd., 5.500%, 4/20/2026(a) | |
| American Airlines, Inc./AAdvantage Loyalty IP Ltd., 5.750%, 4/20/2029(a) | |
| Continental Airlines Pass-Through Trust, Series 2012-2, Class A, 4.000%, 4/29/2026 | |
| Delta Air Lines, Inc./SkyMiles IP Ltd., 4.750%, 10/20/2028(a) | |
| United Airlines Pass-Through Trust, Series 2020-1, Class B, 4.875%, 7/15/2027 | |
| United Airlines Pass-Through Trust, Series 2023-1, Class A, 5.800%, 7/15/2037 | |
| | |
|
| |
| United Airlines, Inc., 4.375%, 4/15/2026(a) | |
| United Airlines, Inc., 4.625%, 4/15/2029(a) | |
| | |
| |
| American Homes 4 Rent LP, 3.375%, 7/15/2051 | |
| |
| Ford Motor Credit Co. LLC, 6.800%, 5/12/2028 | |
| Ford Motor Credit Co. LLC, 6.950%, 3/06/2026 | |
| General Motors Co., 5.000%, 4/01/2035 | |
| General Motors Financial Co., Inc., 2.350%, 1/08/2031 | |
| General Motors Financial Co., Inc., 2.900%, 2/26/2025 | |
| Goodyear Tire & Rubber Co., 5.625%, 4/30/2033 | |
| Hyundai Capital America, 2.375%, 10/15/2027(a) | |
| Hyundai Capital America, 2.650%, 2/10/2025(a) | |
| Hyundai Capital America, 3.000%, 2/10/2027(a) | |
| Hyundai Capital America, 6.100%, 9/21/2028(a) | |
| Lear Corp., 3.550%, 1/15/2052 | |
| Lear Corp., 5.250%, 5/15/2049 | |
| Nissan Motor Acceptance Co. LLC, 7.050%, 9/15/2028(a) | |
| | |
| |
| Banco Santander Chile, 2.700%, 1/10/2025(a) | |
| Banco Santander SA, 1.849%, 3/25/2026 | |
| Banco Santander SA, 2.958%, 3/25/2031 | |
| Bangkok Bank PCL, 4.050%, 3/19/2024(a) | |
| Bank of America Corp., (fixed rate to 11/10/2027, variable rate thereafter), 6.204%, 11/10/2028 | |
| Bank of America Corp., (fixed rate to 4/22/2024, variable rate thereafter), 0.976%, 4/22/2025 | |
| Bank of America Corp., (fixed rate to 4/24/2027, variable rate thereafter), 3.705%, 4/24/2028 | |
| Bank of America Corp., (fixed rate to 4/25/2033, variable rate thereafter), 5.288%, 4/25/2034 | |
| Bank of America Corp., MTN, (fixed rate to 4/23/2026, variable rate thereafter), 3.559%, 4/23/2027 | |
| Barclays PLC, (fixed rate to 3/10/2041, variable rate thereafter), 3.811%, 3/10/2042 | |
| BBVA Bancomer SA, 1.875%, 9/18/2025(a) | |
| BNP Paribas SA, (fixed rate to 1/13/2026, variable rate thereafter), 1.323%, 1/13/2027(a) | |
| BNP Paribas SA, (fixed rate to 11/19/2024, variable rate thereafter), 2.819%, 11/19/2025(a) | |
| Capital One Financial Corp., (fixed rate to 6/08/2033, variable rate thereafter), 6.377%, 6/08/2034 | |
| Citigroup, Inc., (fixed rate to 5/01/2024, variable rate thereafter), 0.981%, 5/01/2025 | |
| Deutsche Bank AG, 1.686%, 3/19/2026 | |
| Deutsche Bank AG, (fixed rate to 10/07/2031, variable rate thereafter), 3.742%, 1/07/2033 | |
| Deutsche Bank AG, (fixed rate to 10/14/2030, variable rate thereafter), 3.729%, 1/14/2032 | |
| Deutsche Bank AG, (fixed rate to 11/10/2032, variable rate thereafter), 7.079%, 2/10/2034 | |
See accompanying notes to financial statements.
Portfolio of Investments – as of September 30, 2023
Loomis Sayles Core Plus Bond Fund (continued)
| | |
|
| |
| Deutsche Bank AG, (fixed rate to 11/24/2025, variable rate thereafter), 2.129%, 11/24/2026 | |
| Goldman Sachs Group, Inc., 6.750%, 10/01/2037 | |
| Goldman Sachs Group, Inc., (fixed rate to 6/05/2027, variable rate thereafter), 3.691%, 6/05/2028 | |
| HSBC Holdings PLC, 4.950%, 3/31/2030 | |
| HSBC Holdings PLC, (fixed rate to 5/24/2024, variable rate thereafter), 0.976%, 5/24/2025 | |
| Intesa Sanpaolo SpA, (fixed rate to 6/01/2031, variable rate thereafter), 4.198%, 6/01/2032(a) | |
| JPMorgan Chase & Co., (fixed rate to 10/15/2029, variable rate thereafter), 2.739%, 10/15/2030 | |
| JPMorgan Chase & Co., (fixed rate to 5/13/2030, variable rate thereafter), 2.956%, 5/13/2031 | |
| Macquarie Bank Ltd., 3.231%, 3/21/2025(a) | |
| Mitsubishi UFJ Financial Group, Inc., (fixed rate to 4/19/2033, variable rate thereafter), 5.406%, 4/19/2034 | |
| Morgan Stanley, (fixed rate to 2/01/2028, variable rate thereafter), 5.123%, 2/01/2029 | |
| Morgan Stanley, (fixed rate to 7/22/2027, variable rate thereafter), 3.591%, 7/22/2028(b) | |
| Morgan Stanley, MTN, (fixed rate to 4/20/2028, variable rate thereafter), 5.164%, 4/20/2029 | |
| PNC Financial Services Group, Inc., (fixed rate to 1/24/2033, variable rate thereafter), 5.068%, 1/24/2034 | |
| Santander Holdings USA, Inc., (fixed rate to 1/06/2027, variable rate thereafter), 2.490%, 1/06/2028 | |
| Societe Generale SA, 2.625%, 1/22/2025(a) | |
| Standard Chartered PLC, (fixed rate to 1/12/2032, variable rate thereafter), 3.603%, 1/12/2033(a) | |
| Standard Chartered PLC, (fixed rate to 1/30/2025, variable rate thereafter), 2.819%, 1/30/2026(a) | |
| Standard Chartered PLC, (fixed rate to 3/15/2028, variable rate thereafter), 4.866%, 3/15/2033(a) | |
| Sumitomo Mitsui Financial Group, Inc., 1.474%, 7/08/2025 | |
| Sumitomo Mitsui Financial Group, Inc., 3.040%, 7/16/2029 | |
| Toronto-Dominion Bank, MTN, 5.523%, 7/17/2028 | |
| Truist Financial Corp., MTN, (fixed rate to 6/08/2033, variable rate thereafter), 5.867%, 6/08/2034 | |
| UBS Group AG, (fixed rate to 11/15/2032, variable rate thereafter), 9.016%, 11/15/2033(a) | |
| UBS Group AG, (fixed rate to 7/15/2025, variable rate thereafter), 6.373%, 7/15/2026(a) | |
| UBS Group AG, (fixed rate to 8/11/2027, variable rate thereafter), 6.442%, 8/11/2028(a) | |
| UniCredit SpA, (fixed rate to 6/03/2026, variable rate thereafter), 1.982%, 6/03/2027(a) | |
| | |
| | |
|
| Building Materials — 0.4% |
| American Builders & Contractors Supply Co., Inc., 3.875%, 11/15/2029(a) | |
| Cemex SAB de CV, 3.875%, 7/11/2031(a) | |
| Mohawk Industries, Inc., 3.625%, 5/15/2030 | |
| Summit Materials LLC/Summit Materials Finance Corp., 5.250%, 1/15/2029(a) | |
| | |
| |
| CCO Holdings LLC/CCO Holdings Capital Corp., 4.250%, 1/15/2034(a) | |
| Charter Communications Operating LLC/Charter Communications Operating Capital, 5.500%, 4/01/2063 | |
| Time Warner Cable LLC, 4.500%, 9/15/2042 | |
| Time Warner Cable LLC, 5.500%, 9/01/2041 | |
| Time Warner Cable LLC, 5.875%, 11/15/2040 | |
| Time Warner Cable LLC, 6.550%, 5/01/2037 | |
| Time Warner Cable LLC, 6.750%, 6/15/2039 | |
| | |
| |
| Alpek SAB de CV, 3.250%, 2/25/2031(a) | |
| Braskem America Finance Co., 7.125%, 7/22/2041(a) | |
| Celanese U.S. Holdings LLC, 6.050%, 3/15/2025 | |
| Celanese U.S. Holdings LLC, 6.330%, 7/15/2029 | |
| Celanese U.S. Holdings LLC, 6.379%, 7/15/2032 | |
| Nutrien Ltd., 5.800%, 3/27/2053 | |
| Orbia Advance Corp. SAB de CV, 5.875%, 9/17/2044(a) | |
| Orbia Advance Corp. SAB de CV, 6.750%, 9/19/2042(a) | |
| Sociedad Quimica y Minera de Chile SA, 3.500%, 9/10/2051(a) | |
| Sociedad Quimica y Minera de Chile SA, 4.250%, 1/22/2050(a) | |
| | |
| Collateralized Mortgage Obligations — 0.6% |
| Federal Home Loan Mortgage Corp., 6.763%, 10/25/2053(c) | |
| Government National Mortgage Association, Series 2010-H24, Class FA, 1 mo. USD SOFR + 0.464%, 5.782%, 10/20/2060(c) | |
| Government National Mortgage Association, Series 2012-H18, Class NA, 1 mo. USD SOFR + 0.634%, 5.952%, 8/20/2062(c) | |
| Government National Mortgage Association, Series 2013-H01, Class FA, 1.650%, 1/20/2063(d) | |
| Government National Mortgage Association, Series 2013-H03, Class HA, 1.750%, 12/20/2062(d) | |
| Government National Mortgage Association, Series 2013-H04, Class BA, 1.650%, 2/20/2063(d) | |
| Government National Mortgage Association, Series 2013-H10, Class PA, 2.500%, 4/20/2063(d) | |
See accompanying notes to financial statements.
Portfolio of Investments – as of September 30, 2023
Loomis Sayles Core Plus Bond Fund (continued)
| | |
|
| Collateralized Mortgage Obligations — continued |
| Government National Mortgage Association, Series 2015-H10, Class JA, 2.250%, 4/20/2065 | |
| Government National Mortgage Association, Series 2015-H13, Class FL, 1 mo. USD SOFR + 0.394%, 4.908%, 5/20/2063(c)(d) | |
| | |
| Consumer Cyclical Services — 0.0% |
| Expedia Group, Inc., 6.250%, 5/01/2025(a) | |
| |
| Kimberly-Clark de Mexico SAB de CV, 2.431%, 7/01/2031(a) | |
| Natura &Co. Luxembourg Holdings Sarl, 6.000%, 4/19/2029(a) | |
| Natura Cosmeticos SA, 4.125%, 5/03/2028(a) | |
| | |
| |
| AES Corp., 3.300%, 7/15/2025(a) | |
| AES Corp., 3.950%, 7/15/2030(a) | |
| Calpine Corp., 5.000%, 2/01/2031(a) | |
| CenterPoint Energy, Inc., SOFR Index + 0.650%, 5.991%, 5/13/2024(c) | |
| Clearway Energy Operating LLC, 3.750%, 2/15/2031(a) | |
| Cometa Energia SA de CV, 6.375%, 4/24/2035(a) | |
| DPL, Inc., 4.350%, 4/15/2029 | |
| Edison International, 4.950%, 4/15/2025 | |
| Enel Americas SA, 4.000%, 10/25/2026 | |
| Enel Generacion Chile SA, 4.250%, 4/15/2024 | |
| Entergy Corp., 2.800%, 6/15/2030 | |
| IPALCO Enterprises, Inc., 4.250%, 5/01/2030 | |
| National Rural Utilities Cooperative Finance Corp., (fixed rate to 5/01/2023, variable rate thereafter), 8.541%, 4/30/2043(c) | |
| NRG Energy, Inc., 3.875%, 2/15/2032(a) | |
| Pattern Energy Operations LP/Pattern Energy Operations, Inc., 4.500%, 8/15/2028(a) | |
| Transelec SA, 4.250%, 1/14/2025(a) | |
| | |
| |
| AerCap Ireland Capital DAC/AerCap Global Aviation Trust, 3.000%, 10/29/2028 | |
| Air Lease Corp., GMTN, 3.750%, 6/01/2026 | |
| Aircastle Ltd., 2.850%, 1/26/2028(a) | |
| Ares Capital Corp., 2.150%, 7/15/2026 | |
| Avolon Holdings Funding Ltd., 2.750%, 2/21/2028(a) | |
| Blue Owl Capital Corp., 2.625%, 1/15/2027 | |
| Blue Owl Capital Corp., 3.400%, 7/15/2026 | |
| Blue Owl Technology Finance Corp., 3.750%, 6/17/2026(a) | |
| FS KKR Capital Corp., 3.400%, 1/15/2026 | |
| Navient Corp., 5.000%, 3/15/2027 | |
| Navient Corp., MTN, 6.125%, 3/25/2024 | |
| OneMain Finance Corp., 3.875%, 9/15/2028 | |
| Rocket Mortgage LLC/Rocket Mortgage Co-Issuer, Inc., 3.875%, 3/01/2031(a) | |
| Rocket Mortgage LLC/Rocket Mortgage Co-Issuer, Inc., 4.000%, 10/15/2033(a) | |
| | |
| | |
|
| |
| Icahn Enterprises LP/Icahn Enterprises Finance Corp., 4.375%, 2/01/2029 | |
| |
| BRF SA, 5.750%, 9/21/2050(a) | |
| Gruma SAB de CV, 4.875%, 12/01/2024(a) | |
| JBS USA LUX SA/JBS USA Food Co./JBS Luxembourg Sarl, 7.250%, 11/15/2053(a) | |
| Minerva Luxembourg SA, 4.375%, 3/18/2031(a) | |
| Post Holdings, Inc., 4.500%, 9/15/2031(a) | |
| Smithfield Foods, Inc., 3.000%, 10/15/2030(a) | |
| | |
| Government Owned - No Guarantee — 1.5% |
| Antares Holdings LP, 3.950%, 7/15/2026(a) | |
| BOC Aviation USA Corp., 1.625%, 4/29/2024(a) | |
| Empresa de los Ferrocarriles del Estado, 3.068%, 8/18/2050(a) | |
| Freeport Indonesia PT, 5.315%, 4/14/2032(a) | |
| Korea National Oil Corp., 4.875%, 4/03/2028(a) | |
| NBN Co. Ltd., 1.450%, 5/05/2026(a) | |
| OCP SA, 3.750%, 6/23/2031(a) | |
| Saudi Arabian Oil Co., 3.500%, 11/24/2070(a) | |
| Tennessee Valley Authority, 4.250%, 9/15/2065 | |
| Tennessee Valley Authority, 4.625%, 9/15/2060 | |
| Tennessee Valley Authority, 4.875%, 1/15/2048 | |
| Tennessee Valley Authority, 5.250%, 9/15/2039 | |
| | |
| |
| Centene Corp., 3.375%, 2/15/2030 | |
| |
| CVS Health Corp., 5.250%, 1/30/2031 | |
| HCA, Inc., 4.625%, 3/15/2052 | |
| | |
| |
| Forestar Group, Inc., 3.850%, 5/15/2026(a) | |
| NVR, Inc., 3.000%, 5/15/2030 | |
| | |
| Independent Energy — 0.4% |
| Devon Energy Corp., 4.500%, 1/15/2030 | |
| EQT Corp., 3.125%, 5/15/2026(a) | |
| EQT Corp., 3.900%, 10/01/2027 | |
| EQT Corp., 5.000%, 1/15/2029 | |
| Leviathan Bond Ltd., 6.125%, 6/30/2025(a) | |
| Pan American Energy LLC, 9.125%, 4/30/2027(a) | |
| | |
| |
| Georgetown University, Series A, 5.215%, 10/01/2118 | |
| |
| Brighthouse Financial, Inc., 5.625%, 5/15/2030 | |
| OneAmerica Financial Partners, Inc., 4.250%, 10/15/2050(a) | |
| | |
| |
| Hilton Domestic Operating Co., Inc., 3.625%, 2/15/2032(a) | |
See accompanying notes to financial statements.
Portfolio of Investments – as of September 30, 2023
Loomis Sayles Core Plus Bond Fund (continued)
| | |
|
| Media Entertainment — 0.6% |
| Grupo Televisa SAB, EMTN, 7.250%, 5/14/2043, (MXN) | |
| Outfront Media Capital LLC/Outfront Media Capital Corp., 4.250%, 1/15/2029(a) | |
| Prosus NV, 3.680%, 1/21/2030(a) | |
| Prosus NV, 3.832%, 2/08/2051(a) | |
| Warnermedia Holdings, Inc., 5.391%, 3/15/2062 | |
| | |
| |
| Anglo American Capital PLC, 2.250%, 3/17/2028(a) | |
| Anglo American Capital PLC, 3.875%, 3/16/2029(a) | |
| Anglo American Capital PLC, 3.950%, 9/10/2050(a) | |
| Anglo American Capital PLC, 5.625%, 4/01/2030(a) | |
| FMG Resources August 2006 Pty. Ltd., 4.375%, 4/01/2031(a) | |
| Fresnillo PLC, 4.250%, 10/02/2050(a) | |
| Glencore Funding LLC, 2.500%, 9/01/2030(a) | |
| POSCO, 5.625%, 1/17/2026(a) | |
| SunCoke Energy, Inc., 4.875%, 6/30/2029(a) | |
| | |
| |
| Energy Transfer LP, 5.150%, 2/01/2043 | |
| Energy Transfer LP, 5.300%, 4/15/2047 | |
| Energy Transfer LP, 5.400%, 10/01/2047 | |
| Energy Transfer LP, 5.950%, 10/01/2043 | |
| Energy Transfer LP, 6.500%, 2/01/2042 | |
| Energy Transfer LP, 6.625%, 10/15/2036 | |
| EQM Midstream Partners LP, 6.500%, 7/01/2027(a) | |
| Gray Oak Pipeline LLC, 2.600%, 10/15/2025(a) | |
| Gray Oak Pipeline LLC, 3.450%, 10/15/2027(a) | |
| Sempra Global, 3.250%, 1/15/2032(a) | |
| Targa Resources Partners LP/Targa Resources Partners Finance Corp., 6.500%, 7/15/2027 | |
| Williams Cos., Inc., 3.500%, 11/15/2030 | |
| | |
| | |
| Federal Home Loan Mortgage Corp., 1.500%, with various maturities from 2050 to 2051(e) | |
| Federal Home Loan Mortgage Corp., 2.000%, with various maturities from 2050 to 2052(e) | |
| Federal Home Loan Mortgage Corp., 2.500%, with various maturities from 2050 to 2051(e) | |
| Federal Home Loan Mortgage Corp., 3.000%, with various maturities from 2042 to 2052(e) | |
| Federal Home Loan Mortgage Corp., 3.500%, with various maturities from 2043 to 2052(e) | |
| Federal Home Loan Mortgage Corp., 4.000%, with various maturities from 2044 to 2052(e) | |
| Federal Home Loan Mortgage Corp., 4.500%, with various maturities from 2041 to 2052(e) | |
| Federal Home Loan Mortgage Corp., 5.000%, with various maturities in 2048(e) | |
| Federal Home Loan Mortgage Corp., 5.500%, with various maturities in 2053(e) | |
| | |
|
| Mortgage Related — continued | |
| Federal Home Loan Mortgage Corp., 6.000%, with various maturities from 2035 to 2053(e) | |
| Federal Home Loan Mortgage Corp., 6.500%, with various maturities in 2053(e) | |
| Federal Home Loan Mortgage Corp., 7.000%, 9/01/2053 | |
| Federal National Mortgage Association, 2.000%, with various maturities from 2037 to 2052(e) | |
| Federal National Mortgage Association, 2.500%, with various maturities from 2045 to 2062(e) | |
| Federal National Mortgage Association, 3.000%, with various maturities from 2045 to 2052(e) | |
| Federal National Mortgage Association, 3.500%, with various maturities from 2043 to 2052(e) | |
| Federal National Mortgage Association, 4.000%, with various maturities from 2041 to 2052(e) | |
| Federal National Mortgage Association, 4.500%, with various maturities from 2043 to 2053(e) | |
| Federal National Mortgage Association, 5.000%, with various maturities from 2048 to 2053(e) | |
| Federal National Mortgage Association, 5.500%, with various maturities from 2050 to 2053(e) | |
| Federal National Mortgage Association, 6.000%, with various maturities from 2034 to 2053(e) | |
| Federal National Mortgage Association, 6.500%, with various maturities from 2029 to 2053(e) | |
| Federal National Mortgage Association, 7.000%, with various maturities in 2030(e) | |
| Federal National Mortgage Association, 7.500%, with various maturities from 2024 to 2032(e) | |
| Government National Mortgage Association, 3.659%, 7/20/2063(b) | |
| Government National Mortgage Association, 3.890%, 12/20/2062(b) | |
| Government National Mortgage Association, 4.344%, 11/20/2066(b) | |
| Government National Mortgage Association, 4.387%, 12/20/2066(b) | |
| Government National Mortgage Association, 4.388%, 12/20/2063(b) | |
| Government National Mortgage Association, 4.390%, 11/20/2062(b) | |
| Government National Mortgage Association, 4.393%, 2/20/2066(b) | |
| Government National Mortgage Association, 4.408%, 6/20/2064(b) | |
| Government National Mortgage Association, 4.412%, 2/20/2066(b) | |
| Government National Mortgage Association, 4.422%, 5/20/2063(b) | |
See accompanying notes to financial statements.
Portfolio of Investments – as of September 30, 2023
Loomis Sayles Core Plus Bond Fund (continued)
| | |
|
| Mortgage Related — continued | |
| Government National Mortgage Association, 4.426%, 10/20/2066(b) | |
| Government National Mortgage Association, 4.450%, 6/20/2066(b) | |
| Government National Mortgage Association, 4.496%, 9/20/2066(b) | |
| Government National Mortgage Association, 4.507%, 6/20/2066(b) | |
| Government National Mortgage Association, 4.510%, 12/20/2064(b) | |
| Government National Mortgage Association, 4.544%, 10/20/2064(b) | |
| Government National Mortgage Association, 4.557%, 1/20/2064(b) | |
| Government National Mortgage Association, 4.574%, 2/20/2065(b) | |
| Government National Mortgage Association, 4.600%, 1/20/2065(b) | |
| Government National Mortgage Association, 4.605%, 3/20/2065(b) | |
| Government National Mortgage Association, 4.609%, with various maturities from 2065 to 2066(b)(e) | |
| Government National Mortgage Association, 4.615%, 3/20/2066(b) | |
| Government National Mortgage Association, 4.634%, 12/20/2064(b) | |
| Government National Mortgage Association, 4.654%, 6/20/2064(b) | |
| Government National Mortgage Association, 4.657%, 5/20/2063(b) | |
| Government National Mortgage Association, 4.659%, 12/20/2066(b) | |
| Government National Mortgage Association, 4.677%, 8/20/2061(b) | |
| Government National Mortgage Association, 4.692%, 1/20/2065(b) | |
| Government National Mortgage Association, 4.700%, with various maturities from 2062 to 2066(b)(e) | |
| Government National Mortgage Association, 4.730%, 1/20/2064(b) | |
| Government National Mortgage Association, 5.500%, 4/15/2038 | |
| Government National Mortgage Association, 6.000%, with various maturities from 2029 to 2038(e) | |
| Government National Mortgage Association, 6.500%, with various maturities from 2029 to 2032(e) | |
| Government National Mortgage Association, 7.000%, 9/15/2025 | |
| Government National Mortgage Association, 7.500%, with various maturities from 2025 to 2030(e) | |
| Uniform Mortgage-Backed Security, TBA, 3.500%, 11/01/2053(f) | |
| | |
| |
| Boston Gas Co., 3.001%, 8/01/2029(a) | |
| | |
|
| Non-Agency Commercial Mortgage-Backed Securities — 2.0% |
| AOA Mortgage Trust, Series 2021-1177, Class A, 1 mo. USD SOFR + 0.989%, 6.322%, 10/15/2038(a)(c) | |
| BANK, Series 2019-BN16, Class A4, 4.005%, 2/15/2052 | |
| BANK, Series 2019-BN20, Class A3, 3.011%, 9/15/2062 | |
| BANK, Series 2019-BN22, Class A4, 2.978%, 11/15/2062 | |
| BANK, Series 2019-BN24, Class A3, 2.960%, 11/15/2062 | |
| BPR Trust, Series 2021-NRD, Class A, 1 mo. USD SOFR + 1.525%, 6.858%, 12/15/2038(a)(c) | |
| Citigroup Commercial Mortgage Trust, Series 2019-C7, Class A4, 3.102%, 12/15/2072 | |
| Citigroup Commercial Mortgage Trust, Series 2019-GC43, Class A4, 3.038%, 11/10/2052 | |
| Citigroup Commercial Mortgage Trust, Series 2020-GC46, Class A5, 2.717%, 2/15/2053 | |
| Commercial Mortgage Trust, Series 2010-C1, Class D, 5.985%, 7/10/2046(a)(b) | |
| Credit Suisse Mortgage Trust, Series 2014-USA, Class A1, 3.304%, 9/15/2037(a) | |
| Credit Suisse Mortgage Trust, Series 2014-USA, Class A2, 3.953%, 9/15/2037(a) | |
| DC Commercial Mortgage Trust, Series 2023-DC, Class A, 6.314%, 9/12/2040(a) | |
| Extended Stay America Trust, Series 2021-ESH, Class A, 1 mo. USD SOFR + 1.194%, 6.527%, 7/15/2038(a)(c) | |
| Extended Stay America Trust, Series 2021-ESH, Class D, 1 mo. USD SOFR + 2.364%, 7.697%, 7/15/2038(a)(c) | |
| GS Mortgage Securities Trust, Series 2011-GC5, Class C, 5.299%, 8/10/2044(a)(b) | |
| GS Mortgage Securities Trust, Series 2014-GC18, Class B, 4.885%, 1/10/2047(b) | |
| GS Mortgage Securities Trust, Series 2020-GC45, Class A5, 2.911%, 2/13/2053 | |
| Med Trust, Series 2021-MDLN, Class A, 1 mo. USD SOFR + 1.064%, 6.397%, 11/15/2038(a)(c) | |
| Morgan Stanley Bank of America Merrill Lynch Trust, Series 2013-C11, Class A4, 4.020%, 8/15/2046(b) | |
| WFRBS Commercial Mortgage Trust, Series 2011-C4, Class D, 4.993%, 6/15/2044(a)(b) | |
| WFRBS Commercial Mortgage Trust, Series 2014-C20, Class AS, 4.176%, 5/15/2047 | |
| | |
| |
| EPR Properties, 3.600%, 11/15/2031 | |
| |
| Klabin Austria GmbH, 7.000%, 4/03/2049(a) | |
| |
| Amgen, Inc., 5.750%, 3/02/2063 | |
See accompanying notes to financial statements.
Portfolio of Investments – as of September 30, 2023
Loomis Sayles Core Plus Bond Fund (continued)
| | |
|
| Pharmaceuticals — continued |
| Teva Pharmaceutical Finance Netherlands III BV, 3.150%, 10/01/2026 | |
| Teva Pharmaceutical Finance Netherlands III BV, 7.125%, 1/31/2025 | |
| Viatris, Inc., 4.000%, 6/22/2050 | |
| | |
| Property & Casualty Insurance — 0.1% |
| Ascot Group Ltd., 4.250%, 12/15/2030(a) | |
| Liberty Mutual Group, Inc., 3.950%, 5/15/2060(a) | |
| | |
| |
| Thaioil Treasury Center Co. Ltd., 3.750%, 6/18/2050(a) | |
| Thaioil Treasury Center Co. Ltd., 4.875%, 1/23/2043(a) | |
| | |
| |
| Alibaba Group Holding Ltd., 3.250%, 2/09/2061 | |
| Dick's Sporting Goods, Inc., 4.100%, 1/15/2052 | |
| El Puerto de Liverpool SAB de CV, 3.875%, 10/06/2026(a) | |
| Falabella SA, 3.375%, 1/15/2032(a) | |
| Lithia Motors, Inc., 4.375%, 1/15/2031(a) | |
| MercadoLibre, Inc., 3.125%, 1/14/2031 | |
| | |
| |
| Panama Government International Bonds, 6.853%, 3/28/2054 | |
| Republic of South Africa Government International Bonds, 7.300%, 4/20/2052 | |
| | |
| |
| Baidu, Inc., 2.375%, 10/09/2030 | |
| Baidu, Inc., 3.075%, 4/07/2025 | |
| Broadcom, Inc., 3.137%, 11/15/2035(a) | |
| Corning, Inc., 5.450%, 11/15/2079 | |
| Equifax, Inc., 2.600%, 12/15/2025 | |
| Equifax, Inc., 7.000%, 7/01/2037 | |
| Hewlett Packard Enterprise Co., 6.200%, 10/15/2035 | |
| Iron Mountain, Inc., 4.500%, 2/15/2031(a) | |
| Jabil, Inc., 3.000%, 1/15/2031 | |
| Jabil, Inc., 5.450%, 2/01/2029 | |
| Molex Electronic Technologies LLC, 3.900%, 4/15/2025(a) | |
| Oracle Corp., 4.100%, 3/25/2061 | |
| Qorvo, Inc., 1.750%, 12/15/2024(a) | |
| Sabre Global, Inc., 8.625%, 6/01/2027(a) | |
| Science Applications International Corp., 4.875%, 4/01/2028(a) | |
| Sensata Technologies, Inc., 3.750%, 2/15/2031(a) | |
| Tencent Holdings Ltd., 3.290%, 6/03/2060(a) | |
| Ziff Davis, Inc., 4.625%, 10/15/2030(a) | |
| | |
| |
| BAT Capital Corp., 2.789%, 9/06/2024 | |
| | |
|
| |
| Mexico Bonos, Series M, 5.750%, 3/05/2026, (MXN) | |
| Mexico Bonos, Series M 20, 8.500%, 5/31/2029, (MXN) | |
| U.S. Treasury Bonds, 1.750%, 8/15/2041 | |
| U.S. Treasury Bonds, 2.000%, 11/15/2041 | |
| U.S. Treasury Bonds, 2.375%, 2/15/2042 | |
| U.S. Treasury Bonds, 3.250%, 5/15/2042 | |
| U.S. Treasury Bonds, 3.375%, 8/15/2042 | |
| U.S. Treasury Bonds, 3.625%, 2/15/2053 | |
| U.S. Treasury Bonds, 3.625%, 5/15/2053 | |
| U.S. Treasury Bonds, 3.875%, 2/15/2043 | |
| U.S. Treasury Bonds, 3.875%, 5/15/2043 | |
| U.S. Treasury Bonds, 4.125%, 8/15/2053 | |
| U.S. Treasury Notes, 2.750%, 7/31/2027 | |
| U.S. Treasury Notes, 2.750%, 8/15/2032 | |
| U.S. Treasury Notes, 2.875%, 5/15/2032 | |
| U.S. Treasury Notes, 3.125%, 8/31/2029 | |
| U.S. Treasury Notes, 3.375%, 5/15/2033 | |
| U.S. Treasury Notes, 3.500%, 1/31/2028 | |
| U.S. Treasury Notes, 3.500%, 4/30/2028 | |
| U.S. Treasury Notes, 3.500%, 1/31/2030 | |
| U.S. Treasury Notes, 3.500%, 2/15/2033 | |
| U.S. Treasury Notes, 3.625%, 3/31/2028 | |
| U.S. Treasury Notes, 3.625%, 5/31/2028 | |
| U.S. Treasury Notes, 3.625%, 3/31/2030 | |
| U.S. Treasury Notes, 3.750%, 6/30/2030 | |
| U.S. Treasury Notes, 3.875%, 11/30/2027 | |
| U.S. Treasury Notes, 3.875%, 12/31/2027 | |
| U.S. Treasury Notes, 3.875%, 9/30/2029 | |
| U.S. Treasury Notes, 3.875%, 11/30/2029 | |
| U.S. Treasury Notes, 3.875%, 12/31/2029 | |
| U.S. Treasury Notes, 3.875%, 8/15/2033 | |
| U.S. Treasury Notes, 4.000%, 6/30/2028 | |
| U.S. Treasury Notes, 4.125%, 9/30/2027 | |
| U.S. Treasury Notes, 4.125%, 10/31/2027 | |
| U.S. Treasury Notes, 4.125%, 7/31/2028 | |
| U.S. Treasury Notes, 4.125%, 11/15/2032 | |
| U.S. Treasury Notes, 4.625%, 9/30/2028 | |
| Uruguay Government International Bonds, 8.250%, 5/21/2031, (UYU) | |
| Uruguay Government International Bonds, 8.500%, 3/15/2028, (UYU)(a) | |
| Uruguay Government International Bonds, 8.500%, 3/15/2028, (UYU) | |
| | |
| |
| Bharti Airtel Ltd., 4.375%, 6/10/2025(a) | |
| Crown Castle, Inc., 4.150%, 7/01/2050 | |
| Empresa Nacional de Telecomunicaciones SA, 3.050%, 9/14/2032(a) | |
| Kenbourne Invest SA, 4.700%, 1/22/2028(a) | |
| Millicom International Cellular SA, 4.500%, 4/27/2031(a) | |
| SBA Communications Corp., 3.125%, 2/01/2029 | |
| Sitios Latinoamerica SAB de CV, 5.375%, 4/04/2032(a) | |
| | |
| |
| AT&T, Inc., 1.700%, 3/25/2026 | |
| AT&T, Inc., 3.500%, 9/15/2053 | |
See accompanying notes to financial statements.
Portfolio of Investments – as of September 30, 2023
Loomis Sayles Core Plus Bond Fund (continued)
| | |
|
| |
| AT&T, Inc., 3.550%, 9/15/2055 | |
| AT&T, Inc., 3.650%, 6/01/2051 | |
| AT&T, Inc., 3.650%, 9/15/2059 | |
| AT&T, Inc., 3.800%, 12/01/2057 | |
| | |
| Total Non-Convertible Bonds
(Identified Cost $6,983,349,225) | |
|
|
|
| |
| University of Virginia, 3.227%, 9/01/2119
(Identified Cost $12,785,000) | |
| Total Bonds and Notes
(Identified Cost $6,996,134,225) | |
|
|
Collateralized Loan Obligations — 3.1% |
| 37 Capital CLO 1 Ltd., Series 2021-1A, Class D, 3 mo. USD SOFR + 3.782%, 9.090%, 10/15/2034(a)(c) | |
| 37 Capital CLO II Ltd., Series 2022-1A, Class C1, 3 mo. USD SOFR + 3.350%, 8.658%, 7/15/2034(a)(c) | |
| AIMCO CLO 14 Ltd., Series 2021-14A, Class B, 3 mo. USD SOFR + 1.612%, 6.938%, 4/20/2034(a)(c) | |
| Allegro CLO XII Ltd., Series 2020-1A, Class B, 3 mo. USD SOFR + 1.962%, 7.295%, 1/21/2032(a)(c) | |
| AMMC CLO 16 Ltd., Series 2015-16A, Class BR2, 3 mo. USD SOFR + 1.712%, 7.023%, 4/14/2029(a)(c) | |
| AMMC CLO 26 Ltd., Series 2023-26A, Class D, 3 mo. USD SOFR + 5.750%, 10.893%, 4/15/2036(a)(c) | |
| ARES XXXVII CLO Ltd., Series 2015-4A, Class A3R, 3 mo. USD SOFR + 1.762%, 7.070%, 10/15/2030(a)(c) | |
| Atrium IX, Series 9A, Class BR2, 3 mo. USD SOFR + 1.762%, 7.150%, 5/28/2030(a)(c) | |
| Atrium XIII, Series 13A, Class A1, 3 mo. USD SOFR + 1.442%, 6.787%, 11/21/2030(a)(c) | |
| Atrium XV, Series 15A, Class B, 3 mo. USD SOFR + 2.012%, 7.357%, 1/23/2031(a)(c) | |
| Atrium XV, Series 15A, Class D, 3 mo. USD SOFR + 3.262%, 8.607%, 1/23/2031(a)(c) | |
| Bain Capital Credit CLO Ltd., Series 2019-1A, Class CR, 3 mo. USD SOFR + 2.412%, 7.732%, 4/19/2034(a)(c) | |
| Bain Capital Credit CLO Ltd., Series 2020-1A, Class B, 3 mo. USD SOFR + 1.962%, 7.272%, 4/18/2033(a)(c) | |
| Bain Capital Credit CLO Ltd., Series 2021-7A, Class D, 3 mo. USD SOFR + 3.512%, 8.857%, 1/22/2035(a)(c) | |
| Bain Capital Credit CLO Ltd., Series 2023-1A, Class B, 3 mo. USD SOFR + 2.250%, 6.993%, 4/16/2036(a)(c) | |
| Bain Capital Credit CLO Ltd., Series 2023-1A, Class D, 3 mo. USD SOFR + 4.900%, 9.643%, 4/16/2036(a)(c) | |
| | |
|
| Balboa Bay Loan Funding Ltd., Series 2021-1A, Class A, 3 mo. USD SOFR + 1.462%, 6.788%, 7/20/2034(a)(c) | |
| Balboa Bay Loan Funding Ltd., Series 2023-1A, Class B, 3 mo. USD SOFR + 2.550%, 7.429%, 4/20/2035(a)(c) | |
| Ballyrock CLO Ltd., Series 2019-1A, Class A2R, 3 mo. USD SOFR + 1.812%, 7.120%, 7/15/2032(a)(c) | |
| Battalion CLO VIII, Series 2015-8A, Class BR2, 3 mo. USD SOFR + 2.262%, 7.572%, 7/18/2030(a)(c) | |
| Battalion CLO X Ltd., Series 2016-10A, Class A1R2, 3 mo. USD SOFR + 1.432%, 6.777%, 1/25/2035(a)(c) | |
| Battalion CLO XIX Ltd., Series 2021-19A, Class D, 3 mo. USD SOFR + 3.512%, 8.820%, 4/15/2034(a)(c) | |
| Betony CLO 2 Ltd., Series 2018-1A, Class A2, 3 mo. USD SOFR + 1.862%, 7.231%, 4/30/2031(a)(c) | |
| BlueMountain CLO XXIX Ltd., Series 2020-29A, Class BR, 3 mo. USD SOFR + 2.012%, 7.363%, 7/25/2034(a)(c) | |
| Buttermilk Park CLO Ltd., Series 2018-1A, Class C, 3 mo. USD SOFR + 2.362%, 7.670%, 10/15/2031(a)(c) | |
| Carbone CLO Ltd., Series 2017-1A, Class A1, 3 mo. USD SOFR + 1.402%, 6.728%, 1/20/2031(a)(c) | |
| Carlyle Global Market Strategies CLO Ltd., Series 2015-5A, Class A2RR, 3 mo. USD SOFR + 1.912%, 7.238%, 1/20/2032(a)(c) | |
| CarVal CLO II Ltd., Series 2019-1A, Class DR, 3 mo. USD SOFR + 3.462%, 8.788%, 4/20/2032(a)(c) | |
| CarVal CLO III Ltd., Series 2019-2A, Class DR, 3 mo. USD SOFR + 3.212%, 8.538%, 7/20/2032(a)(c) | |
| Cayuga Park CLO Ltd., Series 2020-1A, Class B1R, 3 mo. USD SOFR + 1.912%, 7.220%, 7/17/2034(a)(c) | |
| CIFC Funding Ltd., Series 2017-1A, Class B, 3 mo. USD SOFR + 1.962%, 7.295%, 4/23/2029(a)(c) | |
| CIFC Funding Ltd., Series 2019-3A, Class CR, 3 mo. USD SOFR + 3.312%, 8.620%, 10/16/2034(a)(c) | |
| CIFC Funding Ltd., Series 2019-5A, Class CR, 3 mo. USD SOFR + 3.412%, 8.720%, 1/15/2035(a)(c) | |
| CIFC Funding Ltd., Series 2020-1A, Class BR, 3 mo. USD SOFR + 1.912%, 7.220%, 7/15/2036(a)(c) | |
| CIFC Funding Ltd., Series 2020-3A, Class DR, 3 mo. USD SOFR + 3.362%, 8.688%, 10/20/2034(a)(c) | |
| CIFC Funding Ltd., Series 2021-7A, Class D, 3 mo. USD SOFR + 3.262%, 8.607%, 1/23/2035(a)(c) | |
| Clover CLO LLC, Series 2018-1A, Class A1R, 3 mo. USD SOFR + 1.382%, 6.708%, 4/20/2032(a)(c) | |
See accompanying notes to financial statements.
Portfolio of Investments – as of September 30, 2023
Loomis Sayles Core Plus Bond Fund (continued)
| | |
|
| Clover CLO Ltd., Series 2019-1A, Class BR, 3 mo. USD SOFR + 1.850%, 7.160%, 4/18/2035(a)(c) | |
| Crown City CLO III, Series 2021-1A, Class A1A, 3 mo. USD SOFR + 1.432%, 6.758%, 7/20/2034(a)(c) | |
| Dryden 30 Senior Loan Fund, Series 2013-30A, Class AR, 3 mo. USD SOFR + 1.082%, 6.446%, 11/15/2028(a)(c) | |
| Dryden 78 CLO Ltd., Series 2020-78A, Class A, 3 mo. USD SOFR + 1.442%, 6.750%, 4/17/2033(a)(c) | |
| Elmwood CLO III Ltd., Series 2019-3A, Class AR, 3 mo. USD SOFR + 1.422%, 6.748%, 10/20/2034(a)(c) | |
| Elmwood CLO IV Ltd., Series 2020-1A, Class A, 3 mo. USD SOFR + 1.502%, 6.810%, 4/15/2033(a)(c) | |
| Fortress Credit BSL XII Ltd., Series 2021-4A, Class D, 3 mo. USD SOFR + 3.912%, 9.220%, 10/15/2034(a)(c) | |
| Generate CLO 9 Ltd., Series 9A, Class A, 3 mo. USD SOFR + 1.462%, 6.788%, 10/20/2034(a)(c) | |
| GoldenTree Loan Management U.S. CLO 2 Ltd., Series 2017-2A, Class BR, 3 mo. USD SOFR + 1.662%, 6.988%, 11/20/2030(a)(c) | |
| Greywolf CLO VI Ltd., Series 2018-1A, Class A2, 3 mo. USD SOFR + 1.890%, 7.241%, 4/26/2031(a)(c) | |
| Hayfin U.S. XII Ltd., Series 2018-9A, Class BR, 3 mo. USD SOFR + 2.062%, 7.427%, 4/28/2031(a)(c) | |
| Invesco U.S. CLO Ltd., Series 2023-2A, Class D, 3 mo. USD SOFR + 4.950%, 9.806%, 4/21/2036(a)(c) | |
| LCM XX LP, Series 20A, Class BR, 3 mo. USD SOFR + 1.812%, 7.138%, 10/20/2027(a)(c) | |
| Long Point Park CLO Ltd., Series 2017-1A, Class A2, 3 mo. USD SOFR + 1.637%, 6.945%, 1/17/2030(a)(c) | |
| Madison Park Funding LIX Ltd., Series 2021-59A, Class A, 3 mo. USD SOFR + 1.402%, 6.712%, 1/18/2034(a)(c) | |
| Madison Park Funding XXII Ltd., Series 2016-22A, Class BR, 3 mo. USD SOFR + 1.862%, 7.170%, 1/15/2033(a)(c) | |
| Madison Park Funding XXXV Ltd., Series 2019-35A, Class CR, 3 mo. USD SOFR + 2.162%, 7.488%, 4/20/2032(a)(c) | |
| Madison Park Funding XXXVIII Ltd., Series 2021-38A, Class B, 3 mo. USD SOFR + 1.912%, 7.220%, 7/17/2034(a)(c) | |
| Magnetite XVIII Ltd., Series 2016-18A, Class AR2, 3 mo. USD SOFR + 1.142%, 6.506%, 11/15/2028(a)(c) | |
| Magnetite XXI Ltd., Series 2019-21A, Class BR, 3 mo. USD SOFR + 1.612%, 6.938%, 4/20/2034(a)(c) | |
| MP CLO VIII Ltd., Series 2015-2A, Class ARR, 3 mo. USD LIBOR + 1.200%, 6.827%, 4/28/2034(a)(c) | |
| | |
|
| Neuberger Berman CLO XIV, Series 2013-14A, Class BR2, 3 mo. USD SOFR + 1.762%, 7.127%, 1/28/2030(a)(c) | |
| Neuberger Berman CLO XIV Ltd., Series 2013-14A, Class CR2, 3 mo. USD SOFR + 2.162%, 7.527%, 1/28/2030(a)(c) | |
| Neuberger Berman Loan Advisers CLO 40 Ltd., Series 2021-40A, Class B, 3 mo. USD SOFR + 1.662%, 6.970%, 4/16/2033(a)(c) | |
| NYACK Park CLO Ltd., Series 2021-1A, Class D, 3 mo. USD SOFR + 3.062%, 8.388%, 10/20/2034(a)(c) | |
| Octagon Investment Partners 31 Ltd., Series 2017-1A, Class B1R, 3 mo. USD SOFR + 1.762%, 7.088%, 7/20/2030(a)(c) | |
| Octagon Investment Partners 32 Ltd., Series 2017-1A, Class CR, 3 mo. USD SOFR + 2.312%, 7.620%, 7/15/2029(a)(c) | |
| OHA Credit Funding 10 Ltd., Series 2021-10A, Class A, 3 mo. USD SOFR + 1.392%, 6.702%, 1/18/2036(a)(c) | |
| OHA Credit Funding 16 Ltd., Series 2023-16A, Class B, 3 mo. USD SOFR + 2.250%, 6.745%, 10/20/2036(a)(c) | |
| OHA Credit Funding 8 Ltd., Series 2021-8A, Class B1, 3 mo. USD SOFR + 1.762%, 7.072%, 1/18/2034(a)(c) | |
| OHA Credit Partners XI Ltd., Series 2015-11A, Class BR, 3 mo. USD SOFR + 1.912%, 7.238%, 1/20/2032(a)(c) | |
| OZLM Funding IV Ltd., Series 2013-4A, Class A2R, 3 mo. USD SOFR + 1.962%, 7.307%, 10/22/2030(a)(c) | |
| Palmer Square CLO Ltd., Series 2015-2A, Class BR2, 3 mo. USD SOFR + 2.212%, 7.538%, 7/20/2030(a)(c) | |
| Palmer Square CLO Ltd., Series 2019-1A, Class A2R, 3 mo. USD SOFR + 1.962%, 7.331%, 11/14/2034(a)(c) | |
| Palmer Square Loan Funding Ltd., Series 2020-4A, Class C, 3 mo. USD SOFR + 3.862%, 9.253%, 11/25/2028(a)(c) | |
| Palmer Square Loan Funding Ltd., Series 2021-1A, Class B, 3 mo. USD SOFR + 2.062%, 7.388%, 4/20/2029(a)(c) | |
| Palmer Square Loan Funding Ltd., Series 2021-3A, Class A2, 3 mo. USD SOFR + 1.662%, 6.988%, 7/20/2029(a)(c) | |
| Palmer Square Loan Funding Ltd., Series 2021-4A, Class A2, 3 mo. USD SOFR + 1.662%, 6.970%, 10/15/2029(a)(c) | |
| Palmer Square Loan Funding Ltd., Series 2022-2A, Class A2, 3 mo. USD SOFR + 1.900%, 7.208%, 10/15/2030(a)(c) | |
| Post CLO Ltd., Series 2021-1A, Class A, 3 mo. USD SOFR + 1.462%, 6.770%, 10/15/2034(a)(c) | |
| Post CLO Ltd., Series 2021-1A, Class B, 3 mo. USD SOFR + 2.012%, 7.320%, 10/15/2034(a)(c) | |
| Post CLO Ltd., Series 2022-1A, Class B, 3 mo. USD SOFR + 1.900%, 7.226%, 4/20/2035(a)(c) | |
| PPM CLO 5 Ltd., Series 2021-5A, Class B, 3 mo. USD SOFR + 1.962%, 7.272%, 10/18/2034(a)(c) | |
See accompanying notes to financial statements.
Portfolio of Investments – as of September 30, 2023
Loomis Sayles Core Plus Bond Fund (continued)
| | |
|
| Recette CLO Ltd., Series 2015-1A, Class BRR, 3 mo. USD SOFR + 1.662%, 6.988%, 4/20/2034(a)(c) | |
| Regatta IX Funding Ltd., Series 2017-1A, Class B, 3 mo. USD SOFR + 2.062%, 7.370%, 4/17/2030(a)(c) | |
| Riserva CLO Ltd., Series 2016-3A, Class DRR, 3 mo. USD SOFR + 3.512%, 8.822%, 1/18/2034(a)(c) | |
| Rockford Tower CLO Ltd., Series 2017-1A, Class BR2A, 3 mo. USD SOFR + 1.912%, 7.238%, 4/20/2034(a)(c) | |
| RR 26 Ltd., Series 2023-26A, Class A1, 3 mo. USD SOFR + 1.780%, 6.512%, 4/15/2038(a)(c) | |
| Signal Peak CLO 1 Ltd., Series 2014-1A, Class AR3, 3 mo. USD SOFR + 1.422%, 6.730%, 4/17/2034(a)(c) | |
| Signal Peak CLO Ltd., Series 2022-12A, Class B1, 3 mo. USD SOFR + 2.600%, 7.910%, 7/18/2034(a)(c) | |
| Silver Creek CLO Ltd., Series 2014-1A, Class DR, 3 mo. USD SOFR + 3.612%, 8.938%, 7/20/2030(a)(c) | |
| THL Credit Wind River CLO Ltd., Series 2017-4A, Class B, 3 mo. USD SOFR + 1.712%, 7.091%, 11/20/2030(a)(c) | |
| TICP CLO V Ltd., Series 2016-5A, Class CR, 3 mo. USD SOFR + 2.462%, 7.770%, 7/17/2031(a)(c) | |
| TICP CLO XII Ltd., Series 2018-12A, Class BR, 3 mo. USD SOFR + 1.912%, 7.220%, 7/15/2034(a)(c) | |
| Trestles CLO IV Ltd., Series 2021-4A, Class A, 3 mo. USD SOFR + 1.432%, 6.765%, 7/21/2034(a)(c) | |
| Trinitas CLO XVI Ltd., Series 2021-16A, Class A1, 3 mo. USD SOFR + 1.442%, 6.768%, 7/20/2034(a)(c) | |
| Trinitas CLO XVIII Ltd., Series 2021-18A, Class A1, 3 mo. USD SOFR + 1.432%, 6.758%, 1/20/2035(a)(c) | |
| Wellington Management CLO 1 Ltd., Series 2023-1A, Class C, 3 mo. USD SOFR + 3.100%, 9.400%, 10/20/2036(a)(c) | |
| Wind River CLO Ltd., Series 2021-3A, Class A, 3 mo. USD SOFR + 1.412%, 6.738%, 7/20/2033(a)(c) | |
| Total Collateralized Loan Obligations
(Identified Cost $203,861,428) | |
|
|
Short-Term Investments — 8.8% |
| Tri-Party Repurchase Agreement with Fixed Income Clearing Corporation, dated 9/29/2023 at 2.500% to be repurchased at $80,556,073 on 10/02/2023 collateralized by $58,545,500 U.S. Treasury Note, 0.750% due 8/31/2026 valued at $52,131,330; $33,072,800 U.S. Treasury Note, 1.375% due 8/31/2026 valued at $30,018,791; including accrued interest (Note 2 of Notes to Financial Statements) | |
| Federal Home Loan Bank Discount Notes, 5.150%-5.220%, 10/05/2023(h)(i) | |
| | |
|
| Federal Home Loan Bank Discount Notes, 5.220%-5.270%, 10/02/2023(h)(i)(j) | |
| Federal Home Loan Bank Discount Notes, 5.250%, 10/10/2023(i) | |
| Federal Home Loan Bank Discount Notes, 5.250%, 10/11/2023(i) | |
| Federal Home Loan Bank Discount Notes, 5.250%, 10/16/2023(i) | |
| Federal National Mortgage Association Discount Notes, 5.225%, 10/02/2023(i) | |
| U.S. Treasury Bills, 5.251%–5.262%, 2/01/2024(h)(i)(k) | |
| U.S. Treasury Bills, 5.266%–5.268%, 11/02/2023(h)(i) | |
| U.S. Treasury Bills, 5.300%, 12/21/2023(i) | |
| Total Short-Term Investments
(Identified Cost $587,663,098) | |
| Total Investments — 103.7%
(Identified Cost $7,787,658,751) | |
| Other assets less liabilities — (3.7)% | |
| | |
| See Note 2 of Notes to Financial Statements. |
| Principal Amount stated in U.S. dollars unless otherwise noted. |
| All or a portion of these securities are exempt from registration under Rule 144A of the Securities Act of 1933. These securities may be resold in transactions exempt from registration, normally to qualified institutional buyers. At September 30, 2023, the value of Rule 144A holdings amounted to $1,401,270,934 or 20.9% of net assets. |
| Variable rate security. The interest rate adjusts periodically based on; (i) changes in current interest rates and/or prepayments on underlying pools of assets, if applicable, (ii) reference to a base lending rate plus or minus a margin, and/or (iii) reference to a base lending rate adjusted by a multiplier and/or subject to certain floors or caps. Rate as of September 30, 2023 is disclosed. |
| Variable rate security. Rate as of September 30, 2023 is disclosed. |
| Level 3 security. Value has been determined using significant unobservable inputs. See Note 3 of Notes to Financial Statements. |
| The Fund’s investment in mortgage related securities of Federal Home Loan Mortgage Corporation, Federal National Mortgage Association and Government National Mortgage Association are interests in separate pools of mortgages. All separate investments in securities of each issuer which have the same coupon rate have been aggregated for the purpose of presentation in the Portfolio of Investments. |
| When-issued/delayed delivery. |
| Amount shown represents units. One unit represents a principal amount of 100. |
| The Fund's investment in U.S. Government/Agency securities is comprised of various lots with differing discount rates. These separate investments, which have the same maturity date, have been aggregated for the purpose of presentation in the Portfolio of Investments. |
| Interest rate represents discount rate at time of purchase; not a coupon rate. |
See accompanying notes to financial statements.
Portfolio of Investments – as of September 30, 2023
Loomis Sayles Core Plus Bond Fund (continued)
| Interest rate represents annualized yield at time of purchase; not a coupon rate. The Fund’s investment in this security is comprised of various lots with differing annualized yields. |
| Security (or a portion thereof) has been pledged as collateral for open derivative contracts. |
| London Interbank Offered Rate |
| |
| Real Estate Investment Trusts |
| Secured Overnight Financing Rate |
| |
At September 30, 2023, open long futures contracts were as follows:
| | | | | Unrealized
Appreciation
(Depreciation) |
CBOT 10 Year U.S. Treasury Notes Futures | | | | | |
CBOT 2 Year U.S. Treasury Notes Futures | | | | | |
CBOT 5 Year U.S. Treasury Notes Futures | | | | | |
CME Ultra Long Term U.S. Treasury Bond Futures | | | | | |
Ultra 10-Year U.S. Treasury Notes Futures | | | | | |
| | | | | |
Industry Summary at September 30, 2023
| |
| |
| |
| |
| |
Non-Agency Commercial Mortgage-Backed Securities | |
Other Investments, less than 2% each | |
Collateralized Loan Obligations | |
| |
| |
Other assets less liabilities (including futures contracts) | |
| |
See accompanying notes to financial statements.
Portfolio of Investments – as of September 30, 2023
Loomis Sayles Credit Income Fund
| | |
Bonds and Notes — 88.6% of Net Assets |
|
|
Non-Convertible Bonds — 83.3% |
| Aerospace & Defense — 0.8% |
| Huntington Ingalls Industries, Inc., 4.200%, 5/01/2030 | |
| Textron, Inc., 3.000%, 6/01/2030 | |
| TransDigm, Inc., 6.250%, 3/15/2026(a) | |
| TransDigm, Inc., 6.750%, 8/15/2028(a) | |
| | |
| |
| American Airlines Pass-Through Trust, Series 2016-3, Class A, 3.250%, 4/15/2030 | |
| United Airlines Pass-Through Trust, Series 2020-1, Class B, 4.875%, 7/15/2027 | |
| United Airlines Pass-Through Trust, Series 2023-1, Class A, 5.800%, 7/15/2037 | |
| | |
| |
| American Homes 4 Rent LP, 2.375%, 7/15/2031 | |
| |
| Allison Transmission, Inc., 3.750%, 1/30/2031(a) | |
| General Motors Co., 5.200%, 4/01/2045 | |
| General Motors Co., 6.250%, 10/02/2043 | |
| General Motors Financial Co., Inc., 3.100%, 1/12/2032 | |
| General Motors Financial Co., Inc., 5.850%, 4/06/2030 | |
| General Motors Financial Co., Inc., 6.000%, 1/09/2028 | |
| General Motors Financial Co., Inc., Series C, (fixed rate to 9/30/2030, variable rate thereafter), 5.700%(b) | |
| | |
| |
| Ally Financial, Inc., 2.200%, 11/02/2028 | |
| Ally Financial, Inc., Series B, (fixed rate to 5/15/2026, variable rate thereafter), 4.700%(b) | |
| Ally Financial, Inc., Series C, (fixed rate to 5/15/2028, variable rate thereafter), 4.700%(b) | |
| Bank of America Corp., (fixed rate to 4/25/2033, variable rate thereafter), 5.288%, 4/25/2034 | |
| Bank of America Corp., (fixed rate to 9/15/2033, variable rate thereafter), 5.872%, 9/15/2034 | |
| Bank of America Corp., MTN, 4.250%, 10/22/2026 | |
| Barclays PLC, (fixed rate to 5/09/2033, variable rate thereafter), 6.224%, 5/09/2034 | |
| Barclays PLC, (fixed rate to 9/23/2030, variable rate thereafter), 3.564%, 9/23/2035 | |
| Citigroup, Inc., 4.450%, 9/29/2027 | |
| Credit Agricole SA, (fixed rate to 1/10/2028, variable rate thereafter), 4.000%, 1/10/2033(a) | |
| Deutsche Bank AG, (fixed rate to 9/18/2030, variable rate thereafter), 3.547%, 9/18/2031 | |
| Morgan Stanley, 3.625%, 1/20/2027 | |
| Morgan Stanley, (fixed rate to 1/19/2033, variable rate thereafter), 5.948%, 1/19/2038 | |
| Morgan Stanley, (fixed rate to 1/21/2027, variable rate thereafter), 2.475%, 1/21/2028 | |
| NatWest Group PLC, (fixed rate to 6/14/2026, variable rate thereafter), 1.642%, 6/14/2027 | |
| Santander Holdings USA, Inc., 3.244%, 10/05/2026 | |
| Societe Generale SA, (fixed rate to 7/08/2030, variable rate thereafter), 3.653%, 7/08/2035(a) | |
| | |
|
| |
| Standard Chartered PLC, (fixed rate to 4/01/2030, variable rate thereafter), 4.644%, 4/01/2031(a) | |
| UBS Group AG, (fixed rate to 8/12/2032, variable rate thereafter), 6.537%, 8/12/2033(a) | |
| | |
| |
| Jefferies Financial Group, Inc., 6.250%, 1/15/2036 | |
| Jefferies Financial Group, Inc., 6.500%, 1/20/2043 | |
| | |
| Building Materials — 1.1% |
| Cemex SAB de CV, 3.875%, 7/11/2031(a) | |
| |
| CCO Holdings LLC/CCO Holdings Capital Corp., 4.250%, 2/01/2031(a) | |
| CCO Holdings LLC/CCO Holdings Capital Corp., 4.500%, 8/15/2030(a) | |
| CCO Holdings LLC/CCO Holdings Capital Corp., 4.750%, 2/01/2032(a) | |
| CCO Holdings LLC/CCO Holdings Capital Corp., 5.125%, 5/01/2027(a) | |
| CCO Holdings LLC/CCO Holdings Capital Corp., 5.500%, 5/01/2026(a) | |
| Charter Communications Operating LLC/Charter Communications Operating Capital, 2.300%, 2/01/2032 | |
| Charter Communications Operating LLC/Charter Communications Operating Capital, 2.800%, 4/01/2031 | |
| Charter Communications Operating LLC/Charter Communications Operating Capital, 3.950%, 6/30/2062 | |
| Charter Communications Operating LLC/Charter Communications Operating Capital, 4.400%, 4/01/2033 | |
| Charter Communications Operating LLC/Charter Communications Operating Capital, 4.800%, 3/01/2050 | |
| CSC Holdings LLC, 4.625%, 12/01/2030(a) | |
| CSC Holdings LLC, 5.000%, 11/15/2031(a) | |
| Directv Financing LLC/Directv Financing Co-Obligor, Inc., 5.875%, 8/15/2027(a) | |
| DISH DBS Corp., 5.125%, 6/01/2029 | |
| DISH DBS Corp., 5.250%, 12/01/2026(a) | |
| DISH DBS Corp., 5.750%, 12/01/2028(a) | |
| Time Warner Cable LLC, 4.500%, 9/15/2042 | |
| | |
| |
| Celanese U.S. Holdings LLC, 6.330%, 7/15/2029 | |
| Celanese U.S. Holdings LLC, 6.379%, 7/15/2032 | |
| Celanese U.S. Holdings LLC, 6.700%, 11/15/2033 | |
| CF Industries, Inc., 4.500%, 12/01/2026(a) | |
| FMC Corp., 3.450%, 10/01/2029 | |
| Hercules LLC, 6.500%, 6/30/2029 | |
| | |
| Construction Machinery — 1.6% |
| Ashtead Capital, Inc., 5.950%, 10/15/2033(a) | |
| Caterpillar Financial Services Corp., MTN, 0.950%, 1/10/2024 | |
| John Deere Capital Corp., MTN, 0.900%, 1/10/2024 | |
| John Deere Capital Corp., MTN, 1.250%, 1/10/2025 | |
| | |
| Consumer Cyclical Services — 2.6% |
| Expedia Group, Inc., 2.950%, 3/15/2031 | |
| Expedia Group, Inc., 3.250%, 2/15/2030 | |
See accompanying notes to financial statements.
Portfolio of Investments – as of September 30, 2023
Loomis Sayles Credit Income Fund (continued)
| | |
|
| Consumer Cyclical Services — continued |
| Go Daddy Operating Co. LLC/GD Finance Co., Inc., 3.500%, 3/01/2029(a) | |
| Uber Technologies, Inc., 4.500%, 8/15/2029(a) | |
| Uber Technologies, Inc., 7.500%, 9/15/2027(a) | |
| | |
| Diversified Manufacturing — 0.4% |
| Ingersoll Rand, Inc., 5.700%, 8/14/2033 | |
| Nordson Corp., 5.600%, 9/15/2028 | |
| Nordson Corp., 5.800%, 9/15/2033 | |
| Veralto Corp., 5.450%, 9/18/2033(a) | |
| | |
| |
| AES Corp., 2.450%, 1/15/2031 | |
| AES Corp., 3.950%, 7/15/2030(a) | |
| Calpine Corp., 3.750%, 3/01/2031(a) | |
| IPALCO Enterprises, Inc., 4.250%, 5/01/2030 | |
| NRG Energy, Inc., 4.450%, 6/15/2029(a) | |
| Pacific Gas & Electric Co., 5.450%, 6/15/2027 | |
| Southern Co., 5.700%, 3/15/2034 | |
| Vistra Operations Co. LLC, 3.700%, 1/30/2027(a) | |
| | |
| |
| AerCap Ireland Capital DAC/AerCap Global Aviation Trust, 3.875%, 1/23/2028 | |
| Air Lease Corp., 3.125%, 12/01/2030 | |
| Air Lease Corp., MTN, 3.000%, 2/01/2030 | |
| Air Lease Corp., Series B, (fixed rate to 6/15/2026, variable rate thereafter), 4.650%(b) | |
| Aircastle Ltd., 4.125%, 5/01/2024 | |
| Aircastle Ltd., 6.500%, 7/18/2028(a) | |
| Aircastle Ltd., Series A, (fixed rate to 6/15/2026, variable rate thereafter), 5.250%(a)(b) | |
| Ares Capital Corp., 2.875%, 6/15/2028 | |
| Ares Capital Corp., 3.200%, 11/15/2031 | |
| Aviation Capital Group LLC, 1.950%, 1/30/2026(a) | |
| Aviation Capital Group LLC, 6.250%, 4/15/2028(a) | |
| Aviation Capital Group LLC, 6.375%, 7/15/2030(a) | |
| Barings BDC, Inc., 3.300%, 11/23/2026 | |
| Blackstone Secured Lending Fund, 2.125%, 2/15/2027 | |
| Blue Owl Capital Corp., 2.625%, 1/15/2027 | |
| Blue Owl Capital Corp., 2.875%, 6/11/2028 | |
| Blue Owl Technology Finance Corp., 2.500%, 1/15/2027 | |
| GATX Corp., 5.450%, 9/15/2033 | |
| GATX Corp., 6.050%, 3/15/2034 | |
| Hercules Capital, Inc., 3.375%, 1/20/2027 | |
| Nationstar Mortgage Holdings, Inc., 5.750%, 11/15/2031(a) | |
| Navient Corp., 5.000%, 3/15/2027 | |
| Oaktree Specialty Lending Corp., 2.700%, 1/15/2027 | |
| OneMain Finance Corp., 3.500%, 1/15/2027 | |
| OneMain Finance Corp., 5.375%, 11/15/2029 | |
| OneMain Finance Corp., 7.125%, 3/15/2026 | |
| Rocket Mortgage LLC/Rocket Mortgage Co-Issuer, Inc., 2.875%, 10/15/2026(a) | |
| Rocket Mortgage LLC/Rocket Mortgage Co-Issuer, Inc., 3.625%, 3/01/2029(a) | |
| | |
|
| Finance Companies — continued |
| Rocket Mortgage LLC/Rocket Mortgage Co-Issuer, Inc., 3.875%, 3/01/2031(a) | |
| Rocket Mortgage LLC/Rocket Mortgage Co-Issuer, Inc., 4.000%, 10/15/2033(a) | |
| | |
| |
| Icahn Enterprises LP/Icahn Enterprises Finance Corp., 4.375%, 2/01/2029 | |
| Icahn Enterprises LP/Icahn Enterprises Finance Corp., 5.250%, 5/15/2027 | |
| | |
| |
| Central American Bottling Corp./CBC Bottling Holdco SL/Beliv Holdco SL, 5.250%, 4/27/2029(a) | |
| JBS USA LUX SA/JBS USA Food Co./JBS USA Finance, Inc., 3.000%, 2/02/2029 | |
| Pilgrim's Pride Corp., 3.500%, 3/01/2032 | |
| Pilgrim's Pride Corp., 4.250%, 4/15/2031 | |
| Pilgrim's Pride Corp., 5.875%, 9/30/2027(a) | |
| Post Holdings, Inc., 4.625%, 4/15/2030(a) | |
| Smithfield Foods, Inc., 3.000%, 10/15/2030(a) | |
| | |
| |
| GLP Capital LP/GLP Financing II, Inc., 3.250%, 1/15/2032 | |
| Light & Wonder International, Inc., 7.000%, 5/15/2028(a) | |
| Light & Wonder International, Inc., 7.250%, 11/15/2029(a) | |
| Light & Wonder International, Inc., 7.500%, 9/01/2031(a) | |
| VICI Properties LP/VICI Note Co., Inc., 3.875%, 2/15/2029(a) | |
| VICI Properties LP/VICI Note Co., Inc., 4.250%, 12/01/2026(a) | |
| VICI Properties LP/VICI Note Co., Inc., 4.500%, 9/01/2026(a) | |
| VICI Properties LP/VICI Note Co., Inc., 4.625%, 6/15/2025(a) | |
| VICI Properties LP/VICI Note Co., Inc., 5.625%, 5/01/2024(a) | |
| | |
| |
| Centene Corp., 2.500%, 3/01/2031 | |
| Centene Corp., 2.625%, 8/01/2031 | |
| Centene Corp., 3.000%, 10/15/2030 | |
| Centene Corp., 3.375%, 2/15/2030 | |
| Centene Corp., 4.625%, 12/15/2029 | |
| Molina Healthcare, Inc., 3.875%, 11/15/2030(a) | |
| Molina Healthcare, Inc., 3.875%, 5/15/2032(a) | |
| | |
| |
| Bausch & Lomb Escrow Corp., 8.375%, 10/01/2028(a) | |
| Cigna Group, 4.375%, 10/15/2028 | |
| CVS Health Corp., 5.250%, 1/30/2031 | |
| CVS Pass-Through Trust, Series 2014, 4.163%, 8/11/2036(a) | |
See accompanying notes to financial statements.
Portfolio of Investments – as of September 30, 2023
Loomis Sayles Credit Income Fund (continued)
| | |
|
| |
| Encompass Health Corp., 4.750%, 2/01/2030 | |
| HCA, Inc., 4.125%, 6/15/2029 | |
| | |
| |
| MDC Holdings, Inc., 3.966%, 8/06/2061 | |
| PulteGroup, Inc., 6.000%, 2/15/2035 | |
| | |
| Independent Energy — 3.6% |
| Aker BP ASA, 4.000%, 1/15/2031(a) | |
| Continental Resources, Inc., 2.875%, 4/01/2032(a) | |
| Continental Resources, Inc., 5.750%, 1/15/2031(a) | |
| Diamondback Energy, Inc., 3.125%, 3/24/2031 | |
| Energian Israel Finance Ltd., 5.375%, 3/30/2028(a) | |
| Energian Israel Finance Ltd., 5.875%, 3/30/2031(a) | |
| EQT Corp., 3.125%, 5/15/2026(a) | |
| EQT Corp., 3.625%, 5/15/2031(a) | |
| EQT Corp., 3.900%, 10/01/2027 | |
| EQT Corp., 5.000%, 1/15/2029 | |
| EQT Corp., 5.700%, 4/01/2028 | |
| EQT Corp., 7.000%, 2/01/2030 | |
| Matador Resources Co., 6.875%, 4/15/2028(a) | |
| Occidental Petroleum Corp., 5.550%, 3/15/2026 | |
| Occidental Petroleum Corp., 8.875%, 7/15/2030 | |
| Ovintiv, Inc., 5.375%, 1/01/2026 | |
| Ovintiv, Inc., 6.500%, 8/15/2034 | |
| Southwestern Energy Co., 4.750%, 2/01/2032 | |
| | |
| |
| Jacobs Engineering Group, Inc., 6.350%, 8/18/2028 | |
| TopBuild Corp., 4.125%, 2/15/2032(a) | |
| | |
| |
| Carnival Corp., 5.750%, 3/01/2027(a) | |
| Carnival Corp., 6.000%, 5/01/2029(a) | |
| Carnival Corp., 7.000%, 8/15/2029(a) | |
| Carnival Corp., 9.875%, 8/01/2027(a) | |
| NCL Corp. Ltd., 5.875%, 3/15/2026(a) | |
| NCL Corp. Ltd., 5.875%, 2/15/2027(a) | |
| NCL Finance Ltd., 6.125%, 3/15/2028(a) | |
| Royal Caribbean Cruises Ltd., 5.500%, 4/01/2028(a) | |
| VOC Escrow Ltd., 5.000%, 2/15/2028(a) | |
| | |
| |
| Athene Global Funding, 1.608%, 6/29/2026(a) | |
| Athene Global Funding, 1.716%, 1/07/2025(a) | |
| Athene Global Funding, 2.550%, 11/19/2030(a) | |
| Athene Holding Ltd., 3.500%, 1/15/2031 | |
| CNO Financial Group, Inc., 5.250%, 5/30/2029 | |
| | |
| |
| Hilton Domestic Operating Co., Inc., 3.625%, 2/15/2032(a) | |
| Hilton Domestic Operating Co., Inc., 4.000%, 5/01/2031(a) | |
| Hilton Grand Vacations Borrower Escrow LLC/Hilton Grand Vacations Borrower Escrow, Inc., 4.875%, 7/01/2031(a) | |
| | |
|
| |
| Hilton Grand Vacations Borrower Escrow LLC/Hilton Grand Vacations Borrower Escrow, Inc., 5.000%, 6/01/2029(a) | |
| Marriott International, Inc., 5.550%, 10/15/2028 | |
| Marriott International, Inc., Series FF, 4.625%, 6/15/2030 | |
| Marriott International, Inc., Series HH, 2.850%, 4/15/2031 | |
| Marriott Ownership Resorts, Inc., 4.500%, 6/15/2029(a) | |
| Travel & Leisure Co., 4.500%, 12/01/2029(a) | |
| Travel & Leisure Co., 4.625%, 3/01/2030(a) | |
| | |
| Media Entertainment — 1.8% |
| iHeartCommunications, Inc., 4.750%, 1/15/2028(a) | |
| iHeartCommunications, Inc., 5.250%, 8/15/2027(a) | |
| Netflix, Inc., 4.875%, 6/15/2030(a) | |
| Netflix, Inc., 5.375%, 11/15/2029(a) | |
| Netflix, Inc., 5.875%, 11/15/2028 | |
| Netflix, Inc., 6.375%, 5/15/2029 | |
| Warnermedia Holdings, Inc., 4.054%, 3/15/2029 | |
| Warnermedia Holdings, Inc., 4.279%, 3/15/2032 | |
| | |
| |
| Anglo American Capital PLC, 4.500%, 3/15/2028(a) | |
| ArcelorMittal SA, 6.800%, 11/29/2032 | |
| ArcelorMittal SA, 7.000%, 10/15/2039 | |
| ATI, Inc., 5.875%, 12/01/2027 | |
| First Quantum Minerals Ltd., 6.875%, 10/15/2027(a) | |
| FMG Resources August 2006 Pty. Ltd., 4.375%, 4/01/2031(a) | |
| Freeport-McMoRan, Inc., 4.250%, 3/01/2030 | |
| Freeport-McMoRan, Inc., 4.625%, 8/01/2030 | |
| Glencore Funding LLC, 2.500%, 9/01/2030(a) | |
| Glencore Funding LLC, 3.875%, 10/27/2027(a) | |
| Glencore Funding LLC, 5.700%, 5/08/2033(a) | |
| Novelis Corp., 4.750%, 1/30/2030(a) | |
| Volcan Cia Minera SAA, 4.375%, 2/11/2026(a) | |
| | |
| |
| Cheniere Energy Partners LP, 3.250%, 1/31/2032 | |
| Cheniere Energy Partners LP, 4.000%, 3/01/2031 | |
| Cheniere Energy Partners LP, 4.500%, 10/01/2029 | |
| Cheniere Energy Partners LP, 5.950%, 6/30/2033(a) | |
| DCP Midstream Operating LP, 3.250%, 2/15/2032 | |
| DCP Midstream Operating LP, 5.125%, 5/15/2029 | |
| Enbridge, Inc., 5.700%, 3/08/2033 | |
| Energy Transfer LP, 4.000%, 10/01/2027 | |
| Energy Transfer LP, 5.750%, 2/15/2033 | |
| EnLink Midstream LLC, 6.500%, 9/01/2030(a) | |
| EnLink Midstream Partners LP, 5.450%, 6/01/2047 | |
| EQM Midstream Partners LP, Series 10Y, 5.500%, 7/15/2028 | |
| Hess Midstream Operations LP, 4.250%, 2/15/2030(a) | |
| Hess Midstream Operations LP, 5.625%, 2/15/2026(a) | |
| NGPL PipeCo LLC, 4.875%, 8/15/2027(a) | |
| Plains All American Pipeline LP/PAA Finance Corp., 3.800%, 9/15/2030 | |
| Plains All American Pipeline LP/PAA Finance Corp., 4.300%, 1/31/2043 | |
| Targa Resources Corp., 6.125%, 3/15/2033 | |
See accompanying notes to financial statements.
Portfolio of Investments – as of September 30, 2023
Loomis Sayles Credit Income Fund (continued)
| | |
|
| |
| Targa Resources Partners LP/Targa Resources Partners Finance Corp., 4.000%, 1/15/2032 | |
| Targa Resources Partners LP/Targa Resources Partners Finance Corp., 4.875%, 2/01/2031 | |
| Venture Global Calcasieu Pass LLC, 3.875%, 11/01/2033(a) | |
| Venture Global Calcasieu Pass LLC, 4.125%, 8/15/2031(a) | |
| Western Midstream Operating LP, 4.050%, 2/01/2030 | |
| Western Midstream Operating LP, 5.250%, 2/01/2050 | |
| Western Midstream Operating LP, 5.300%, 3/01/2048 | |
| Western Midstream Operating LP, 5.450%, 4/01/2044 | |
| Western Midstream Operating LP, 6.150%, 4/01/2033 | |
| | |
| |
| Southern Co. Gas Capital Corp., 5.750%, 9/15/2033 | |
| |
| Corporate Office Properties LP, 2.750%, 4/15/2031 | |
| |
| EPR Properties, 3.600%, 11/15/2031 | |
| |
| Suzano Austria GmbH, 3.750%, 1/15/2031 | |
| |
| Bausch Health Cos., Inc., 4.875%, 6/01/2028(a) | |
| Bausch Health Cos., Inc., 5.000%, 1/30/2028(a) | |
| Teva Pharmaceutical Finance Co. LLC, 6.150%, 2/01/2036 | |
| Teva Pharmaceutical Finance Netherlands III BV, 3.150%, 10/01/2026 | |
| Teva Pharmaceutical Finance Netherlands III BV, 4.100%, 10/01/2046 | |
| | |
| Property & Casualty Insurance — 1.3% |
| Fidelity National Financial, Inc., 2.450%, 3/15/2031 | |
| HUB International Ltd., 7.250%, 6/15/2030(a) | |
| SiriusPoint Ltd., 4.600%, 11/01/2026(a) | |
| Stewart Information Services Corp., 3.600%, 11/15/2031 | |
| | |
| |
| 1011778 BC ULC/New Red Finance, Inc., 4.375%, 1/15/2028(a) | |
| Yum! Brands, Inc., 4.625%, 1/31/2032 | |
| | |
| |
| Brixmor Operating Partnership LP, 4.050%, 7/01/2030 | |
| SITE Centers Corp., 3.625%, 2/01/2025 | |
| | |
| |
| Lithia Motors, Inc., 3.875%, 6/01/2029(a) | |
| Tapestry, Inc., 3.050%, 3/15/2032 | |
| | |
| |
| Broadcom, Inc., 2.450%, 2/15/2031(a) | |
| Broadcom, Inc., 2.600%, 2/15/2033(a) | |
| Broadcom, Inc., 3.137%, 11/15/2035(a) | |
| Broadcom, Inc., 3.419%, 4/15/2033(a) | |
| | |
|
| |
| Broadcom, Inc., 3.469%, 4/15/2034(a) | |
| Broadcom, Inc., 4.150%, 11/15/2030 | |
| Broadcom, Inc., 4.150%, 4/15/2032(a) | |
| Broadcom, Inc., 4.300%, 11/15/2032 | |
| CDW LLC/CDW Finance Corp., 2.670%, 12/01/2026 | |
| CDW LLC/CDW Finance Corp., 3.250%, 2/15/2029 | |
| CDW LLC/CDW Finance Corp., 3.276%, 12/01/2028 | |
| CDW LLC/CDW Finance Corp., 3.569%, 12/01/2031 | |
| CDW LLC/CDW Finance Corp., 4.250%, 4/01/2028 | |
| CommScope Technologies LLC, 5.000%, 3/15/2027(a) | |
| CommScope, Inc., 4.750%, 9/01/2029(a) | |
| Entegris Escrow Corp., 4.750%, 4/15/2029(a) | |
| Everi Holdings, Inc., 5.000%, 7/15/2029(a) | |
| Fiserv, Inc., 5.625%, 8/21/2033 | |
| Flex Ltd., 6.000%, 1/15/2028 | |
| Gartner, Inc., 3.625%, 6/15/2029(a) | |
| Global Payments, Inc., 2.900%, 5/15/2030 | |
| Global Payments, Inc., 2.900%, 11/15/2031 | |
| Global Payments, Inc., 5.300%, 8/15/2029 | |
| Global Payments, Inc., 5.400%, 8/15/2032 | |
| Iron Mountain, Inc., 5.250%, 7/15/2030(a) | |
| Jabil, Inc., 1.700%, 4/15/2026 | |
| Leidos, Inc., 2.300%, 2/15/2031 | |
| Leidos, Inc., 5.750%, 3/15/2033 | |
| Marvell Technology, Inc., 2.450%, 4/15/2028 | |
| Marvell Technology, Inc., 2.950%, 4/15/2031 | |
| Micron Technology, Inc., 4.663%, 2/15/2030 | |
| Micron Technology, Inc., 5.875%, 9/15/2033 | |
| MSCI, Inc., 3.250%, 8/15/2033(a) | |
| Open Text Corp., 6.900%, 12/01/2027(a) | |
| Oracle Corp., 3.950%, 3/25/2051 | |
| Oracle Corp., 6.150%, 11/09/2029 | |
| S&P Global, Inc., 4.250%, 5/01/2029 | |
| S&P Global, Inc., 5.250%, 9/15/2033(a) | |
| TD SYNNEX Corp., 1.750%, 8/09/2026 | |
| Trimble, Inc., 6.100%, 3/15/2033 | |
| Verisk Analytics, Inc., 4.125%, 3/15/2029 | |
| Verisk Analytics, Inc., 5.750%, 4/01/2033 | |
| VMware, Inc., 2.200%, 8/15/2031 | |
| Western Digital Corp., 2.850%, 2/01/2029 | |
| Western Digital Corp., 4.750%, 2/15/2026 | |
| | |
| Transportation Services — 0.5% |
| ERAC USA Finance LLC, 4.900%, 5/01/2033(a) | |
| Rand Parent LLC, 8.500%, 2/15/2030(a) | |
| | |
| |
| U.S. Treasury Bonds, 1.125%, 8/15/2040 | |
| U.S. Treasury Bonds, 1.875%, 2/15/2051 | |
| U.S. Treasury Bonds, 2.250%, 2/15/2052 | |
| U.S. Treasury Bonds, 3.250%, 5/15/2042 | |
| U.S. Treasury Notes, 4.625%, 6/30/2025 | |
| | |
| |
| American Tower Corp., 5.500%, 3/15/2028 | |
| American Tower Corp., 5.900%, 11/15/2033 | |
| Crown Castle, Inc., 5.100%, 5/01/2033 | |
| SBA Communications Corp., 3.125%, 2/01/2029 | |
| Sprint Capital Corp., 8.750%, 3/15/2032 | |
| T-Mobile USA, Inc., 3.375%, 4/15/2029 | |
See accompanying notes to financial statements.
Portfolio of Investments – as of September 30, 2023
Loomis Sayles Credit Income Fund (continued)
| | |
|
| |
| T-Mobile USA, Inc., 3.500%, 4/15/2031 | |
| T-Mobile USA, Inc., 3.875%, 4/15/2030 | |
| T-Mobile USA, Inc., 5.750%, 1/15/2034 | |
| | |
| Total Non-Convertible Bonds
(Identified Cost $19,511,827) | |
|
|
|
| |
| JetBlue Airways Corp., 0.500%, 4/01/2026 | |
| Southwest Airlines Co., 1.250%, 5/01/2025 | |
| | |
| |
| DISH Network Corp., 3.375%, 8/15/2026 | |
| DISH Network Corp., Zero Coupon, 0.000%–29.314%, 12/15/2025(c) | |
| | |
| Consumer Cyclical Services — 0.3% |
| Uber Technologies, Inc., Zero Coupon, 0.000%–5.152%, 12/15/2025(c) | |
| |
| Beauty Health Co., 1.250%, 10/01/2026(a) | |
| |
| PPL Capital Funding, Inc., 2.875%, 3/15/2028(a) | |
| |
| Penn Entertainment, Inc., 2.750%, 5/15/2026 | |
| |
| Envista Holdings Corp., 1.750%, 8/15/2028(a) | |
| Teladoc Health, Inc., 1.250%, 6/01/2027 | |
| | |
| Independent Energy — 0.1% |
| Northern Oil & Gas, Inc., 3.625%, 4/15/2029(a) | |
| |
| NCL Corp. Ltd., 1.125%, 2/15/2027 | |
| Media Entertainment — 0.2% |
| Snap, Inc., Zero Coupon, 6.709%–6.954%, 5/01/2027(c) | |
| Spotify USA, Inc., Zero Coupon, 5.189%–5.777%, 3/15/2026(c) | |
| | |
| |
| BioMarin Pharmaceutical, Inc., 1.250%, 5/15/2027 | |
| Guardant Health, Inc., Zero Coupon, 0.000%, 11/15/2027(d) | |
| Livongo Health, Inc., 0.875%, 6/01/2025 | |
| | |
| |
| Etsy, Inc., 0.250%, 6/15/2028 | |
| |
| Splunk, Inc., 1.125%, 6/15/2027 | |
| Unity Software, Inc., Zero Coupon, 7.084%–8.213%, 11/15/2026(c) | |
| | |
|
| |
| Wolfspeed, Inc., 0.250%, 2/15/2028 | |
| Wolfspeed, Inc., 1.875%, 12/01/2029(a) | |
| | |
| Total Convertible Bonds
(Identified Cost $1,352,444) | |
| Total Bonds and Notes
(Identified Cost $20,864,271) | |
|
|
Collateralized Loan Obligations — 3.6% |
| AIMCO CLO 14 Ltd., Series 2021-14A, Class D, 3 mo. USD SOFR + 3.162%, 8.488%, 4/20/2034(a)(e) | |
| Fillmore Park CLO Ltd., Series 2018-1A, Class D, 3 mo. USD SOFR + 3.162%, 8.470%, 7/15/2030(a)(e) | |
| Recette CLO Ltd., Series 2015-1A, Class DRR, 3 mo. USD SOFR + 3.512%, 8.838%, 4/20/2034(a)(e) | |
| Total Collateralized Loan Obligations
(Identified Cost $750,000) | |
| | |
|
|
|
Convertible Preferred Stocks — 0.9% |
| |
| Bank of America Corp., Series L, 7.250% | |
| Wells Fargo & Co., Series L, Class A, 7.500% | |
| | |
| |
| Clarivate PLC, Series A, 5.250% | |
| Total Convertible Preferred Stocks
(Identified Cost $245,301) | |
| Total Preferred Stocks
(Identified Cost $245,301) | |
| | |
Short-Term Investments — 5.8% |
| Tri-Party Repurchase Agreement with Fixed Income Clearing Corporation, dated 9/29/2023 at 2.500% to be repurchased at $226,188 on 10/02/2023 collateralized by $259,100 U.S. Treasury Note, 0.750% due 8/31/2026 valued at $230,713 including accrued interest (Note 2 of Notes to Financial Statements) | |
| U.S. Treasury Bills, 5.115%, 12/14/2023(f) | |
| U.S. Treasury Bills, 5.201%, 10/24/2023(f)(g) | |
| U.S. Treasury Bills, 5.231%, 12/28/2023(f)(h) | |
| U.S. Treasury Bills, 5.258%, 1/04/2024(f) | |
| Total Short-Term Investments
(Identified Cost $1,175,322) | |
| Total Investments — 98.9%
(Identified Cost $23,034,894) | |
| Other assets less liabilities — 1.1% | |
| | |
| See Note 2 of Notes to Financial Statements. |
See accompanying notes to financial statements.
Portfolio of Investments – as of September 30, 2023
Loomis Sayles Credit Income Fund (continued)
| All or a portion of these securities are exempt from registration under Rule 144A of the Securities Act of 1933. These securities may be resold in transactions exempt from registration, normally to qualified institutional buyers. At September 30, 2023, the value of Rule 144A holdings amounted to $7,510,399 or 37.3% of net assets. |
| Perpetual bond with no specified maturity date. |
| Interest rate represents annualized yield at time of purchase; not a coupon rate. The Fund’s investment in this security is comprised of various lots with differing annualized yields. |
| Interest rate represents annualized yield at time of purchase; not a coupon rate. |
| Variable rate security. Rate as of September 30, 2023 is disclosed. |
| Interest rate represents discount rate at time of purchase; not a coupon rate. |
| The Fund's investment in U.S. Government/Agency securities is comprised of various lots with differing discount rates. These separate investments, which have the same maturity date, have been aggregated for the purpose of presentation in the Portfolio of Investments. |
| Security (or a portion thereof) has been pledged as collateral for open derivative contracts. |
| |
| Real Estate Investment Trusts |
| Secured Overnight Financing Rate |
At September 30, 2023, open long futures contracts were as follows:
| | | | | Unrealized
Appreciation
(Depreciation) |
CBOT 10 Year U.S. Treasury Notes Futures | | | | | |
CBOT 2 Year U.S. Treasury Notes Futures | | | | | |
CBOT 5 Year U.S. Treasury Notes Futures | | | | | |
CBOT U.S. Long Bond Futures | | | | | |
| | | | | |
At September 30, 2023, open short futures contracts were as follows:
| | | | | Unrealized
Appreciation
(Depreciation) |
CME Ultra Long Term U.S. Treasury Bond Futures | | | | | |
Ultra 10 Year U.S. Treasury Notes Futures | | | | | |
| | | | | |
Industry Summary at September 30, 2023
| |
| |
| |
| |
| |
| |
| |
| |
| |
Consumer Cyclical Services | |
| |
| |
| |
Other Investments, less than 2% each | |
Collateralized Loan Obligations | |
| |
| |
Other assets less liabilities (including futures contracts) | |
| |
See accompanying notes to financial statements.
Portfolio of Investments – as of September 30, 2023
Loomis Sayles Global Allocation Fund
| | |
Common Stocks — 67.4% of Net Assets |
| |
| LVMH Moet Hennessy Louis Vuitton SE | |
| | |
| | |
| |
| Nomura Research Institute Ltd. | |
| |
| | |
| |
| | |
| |
| Taiwan Semiconductor Manufacturing Co. Ltd. | |
| |
| | |
| London Stock Exchange Group PLC | |
| | |
| |
| | |
| | |
| | |
| Alphabet, Inc., Class A(a) | |
| | |
| | |
| | |
| | |
| | |
| | |
| Goldman Sachs Group, Inc. | |
| | |
| | |
| | |
| | |
| Mastercard, Inc., Class A | |
| Mettler-Toledo International, Inc.(a) | |
| | |
| | |
| O'Reilly Automotive, Inc.(a) | |
| | |
| | |
| | |
| | |
| | |
| | |
| | |
| | |
| | |
| | |
| Total Common Stocks
(Identified Cost $1,599,072,185) | |
| | |
|
|
|
Non-Convertible Bonds — 28.3% |
| |
| AngloGold Ashanti Holdings PLC, 3.375%, 11/01/2028 | |
| | |
|
| |
| Australia Government Bonds, Series 164, 0.500%, 9/21/2026, (AUD) | |
| GAIF Bond Issuer Pty. Ltd., 3.400%, 9/30/2026(b) | |
| Glencore Funding LLC, 6.500%, 10/06/2033(b) | |
| Macquarie Group Ltd., (fixed rate to 1/14/2032, variable rate thereafter), 2.871%, 1/14/2033(b) | |
| Macquarie Group Ltd., (fixed rate to 9/23/2026, variable rate thereafter), 1.629%, 9/23/2027(b) | |
| New South Wales Treasury Corp., 2.000%, 3/08/2033, (AUD) | |
| Sydney Airport Finance Co. Pty. Ltd., 3.375%, 4/30/2025(b) | |
| | |
| |
| Anheuser-Busch InBev SA, EMTN, 2.000%, 1/23/2035, (EUR) | |
| |
| Braskem Netherlands Finance BV, 4.500%, 1/10/2028 | |
| Braskem Netherlands Finance BV, 4.500%, 1/31/2030 | |
| Brazil Government International Bonds, 4.500%, 5/30/2029 | |
| Brazil Notas do Tesouro Nacional, Series NTNF, 10.000%, 1/01/2031, (BRL) | |
| Centrais Eletricas Brasileiras SA, 4.625%, 2/04/2030(b) | |
| Embraer Netherlands Finance BV, 7.000%, 7/28/2030(b) | |
| Raizen Fuels Finance SA, 5.300%, 1/20/2027(b) | |
| Suzano Austria GmbH, 2.500%, 9/15/2028 | |
| Suzano Austria GmbH, 3.750%, 1/15/2031 | |
| Suzano Austria GmbH, Series DM3N, 3.125%, 1/15/2032 | |
| | |
| |
| 1011778 BC ULC/New Red Finance, Inc., 4.000%, 10/15/2030(b) | |
| Air Canada Pass-Through Trust, Series 2015-2, Class A, 4.125%, 6/15/2029(b) | |
| Air Canada Pass-Through Trust, Series 2017-1, Class AA, 3.300%, 7/15/2031(b) | |
| Antares Holdings LP, 3.750%, 7/15/2027(b) | |
| Antares Holdings LP, 3.950%, 7/15/2026(b) | |
| Antares Holdings LP, 7.950%, 8/11/2028(b) | |
| Bell Telephone Co. of Canada or Bell Canada, MTN, 3.600%, 9/29/2027, (CAD) | |
| Brookfield Finance I U.K. PLC/Brookfield Finance, Inc., 2.340%, 1/30/2032 | |
| Brookfield Finance, Inc., 3.900%, 1/25/2028 | |
| Brookfield Renewable Partners ULC, MTN, 4.250%, 1/15/2029, (CAD) | |
| CPPIB Capital, Inc., 0.375%, 6/20/2024, (EUR)(b) | |
| Enbridge Gas, Inc., MTN, 2.900%, 4/01/2030, (CAD) | |
See accompanying notes to financial statements.
Portfolio of Investments – as of September 30, 2023
Loomis Sayles Global Allocation Fund (continued)
| | |
|
| |
| Enbridge, Inc., MTN, 2.990%, 10/03/2029, (CAD) | |
| Federation des Caisses Desjardins du Quebec, (fixed rate to 5/26/2025, variable rate thereafter), 2.856%, 5/26/2030, (CAD) | |
| Institutional Mortgage Securities Canada, Inc., Series 2014-5A, Class A2, 2.616%, 7/12/2047, (CAD)(b) | |
| Ontario Power Generation, Inc., MTN, 2.977%, 9/13/2029, (CAD) | |
| Open Text Corp., 6.900%, 12/01/2027(b) | |
| Province of Quebec, 4.500%, 9/08/2033 | |
| Rogers Communications, Inc., 3.300%, 12/10/2029, (CAD) | |
| Toronto-Dominion Bank, MTN, 1.150%, 6/12/2025 | |
| Toronto-Dominion Bank, Series FXD, 1.950%, 1/12/2027 | |
| Videotron Ltd., 5.125%, 4/15/2027(b) | |
| | |
| |
| Antofagasta PLC, 2.375%, 10/14/2030 | |
| Antofagasta PLC, 5.625%, 5/13/2032 | |
| Banco Santander Chile, 3.177%, 10/26/2031(b) | |
| Celulosa Arauco y Constitucion SA, 4.500%, 8/01/2024 | |
| Chile Government International Bonds, 2.550%, 1/27/2032 | |
| Colbun SA, 3.150%, 3/06/2030 | |
| Corp. Nacional del Cobre de Chile, 3.000%, 9/30/2029(b) | |
| Empresa Nacional de Telecomunicaciones SA, 3.050%, 9/14/2032(b) | |
| Empresa Nacional del Petroleo, 3.450%, 9/16/2031(b) | |
| Enel Chile SA, 4.875%, 6/12/2028 | |
| Engie Energia Chile SA, 3.400%, 1/28/2030 | |
| Transelec SA, 4.250%, 1/14/2025(b) | |
| | |
| |
| Tencent Holdings Ltd., 2.880%, 4/22/2031(b) | |
| |
| Colombia Government International Bonds, 3.125%, 4/15/2031 | |
| Colombia Government International Bonds, 3.875%, 4/25/2027 | |
| Colombia Government International Bonds, 7.500%, 2/02/2034 | |
| Colombia TES, Series B, 6.250%, 11/26/2025, (COP) | |
| Colombia TES, Series B, 7.500%, 8/26/2026, (COP) | |
| Ecopetrol SA, 5.875%, 5/28/2045 | |
| Empresas Publicas de Medellin ESP, 4.250%, 7/18/2029(b) | |
| | |
| |
| CEZ AS, EMTN, 0.875%, 12/02/2026, (EUR) | |
| CEZ AS, EMTN, 3.000%, 6/05/2028, (EUR) | |
| | |
| | |
|
| |
| Orsted AS, EMTN, 2.125%, 5/17/2027, (GBP) | |
| Dominican Republic — 0.2% |
| Dominican Republic International Bonds, 4.500%, 1/30/2030(b) | |
| Dominican Republic International Bonds, 4.875%, 9/23/2032(b) | |
| Dominican Republic International Bonds, 5.950%, 1/25/2027(b) | |
| Dominican Republic International Bonds, 6.000%, 7/19/2028(b) | |
| Dominican Republic International Bonds, 8.625%, 4/20/2027(b) | |
| | |
| |
| Ecuador Government International Bonds, 6.000%, 7/31/2030 | |
| |
| BNP Paribas SA, 4.375%, 5/12/2026(b) | |
| BNP Paribas SA, (fixed rate to 6/09/2025, variable rate thereafter), 2.219%, 6/09/2026(b) | |
| Electricite de France SA, 4.875%, 9/21/2038(b) | |
| Engie SA, 1.250%, 10/24/2041, (EUR) | |
| Societe Generale SA, 4.750%, 11/24/2025(b) | |
| | |
| |
| Deutsche Bank AG, (fixed rate to 1/07/2027, variable rate thereafter), 2.552%, 1/07/2028 | |
| Deutsche Bank AG, (fixed rate to 10/07/2031, variable rate thereafter), 3.742%, 1/07/2033 | |
| Deutsche Bank AG, (fixed rate to 10/14/2030, variable rate thereafter), 3.729%, 1/14/2032 | |
| Fraport AG Frankfurt Airport Services Worldwide, 1.875%, 3/31/2028, (EUR) | |
| Siemens Financieringsmaatschappij NV, 2.350%, 10/15/2026(b) | |
| ZF North America Capital, Inc., 6.875%, 4/14/2028(b) | |
| ZF North America Capital, Inc., 7.125%, 4/14/2030(b) | |
| | |
| |
| CT Trust, 5.125%, 2/03/2032(b) | |
| |
| Bharti Airtel Ltd., 3.250%, 6/03/2031 | |
| Export-Import Bank of India, 2.250%, 1/13/2031(b) | |
| Power Finance Corp. Ltd., 3.950%, 4/23/2030(b) | |
| Shriram Finance Ltd., 4.150%, 7/18/2025(b) | |
| Shriram Finance Ltd., 4.400%, 3/13/2024 | |
| | |
| |
| Indonesia Treasury Bonds, Series FR75, 7.500%, 5/15/2038, (IDR) | |
| Indonesia Treasury Bonds, Series FR82, 7.000%, 9/15/2030, (IDR) | |
| | |
See accompanying notes to financial statements.
Portfolio of Investments – as of September 30, 2023
Loomis Sayles Global Allocation Fund (continued)
| | |
|
| |
| AerCap Ireland Capital DAC/AerCap Global Aviation Trust, 3.300%, 1/30/2032 | |
| Bank of Ireland Group PLC, 4.500%, 11/25/2023(b) | |
| Ireland Government Bonds, Zero Coupon, 0.029%, 10/18/2031, (EUR)(d) | |
| | |
| |
| Teva Pharmaceutical Finance Co. LLC, 6.150%, 2/01/2036 | |
| Teva Pharmaceutical Finance Netherlands III BV, 3.150%, 10/01/2026 | |
| Teva Pharmaceutical Finance Netherlands III BV, 4.100%, 10/01/2046 | |
| Teva Pharmaceutical Finance Netherlands III BV, 4.750%, 5/09/2027 | |
| Teva Pharmaceutical Finance Netherlands III BV, 5.125%, 5/09/2029 | |
| Teva Pharmaceutical Finance Netherlands III BV, 7.875%, 9/15/2029 | |
| Teva Pharmaceutical Finance Netherlands III BV, 8.125%, 9/15/2031 | |
| | |
| |
| Intesa Sanpaolo SpA, 5.710%, 1/15/2026(b) | |
| Intesa Sanpaolo SpA, 6.625%, 6/20/2033(b) | |
| Intesa Sanpaolo SpA, EMTN, 0.625%, 2/24/2026, (EUR) | |
| Italy Buoni Poliennali Del Tesoro, Series 10Y, 2.000%, 2/01/2028, (EUR) | |
| Italy Buoni Poliennali Del Tesoro, Series 11Y, 1.350%, 4/01/2030, (EUR) | |
| Italy Buoni Poliennali Del Tesoro, Series 7Y, 2.500%, 11/15/2025, (EUR) | |
| UniCredit SpA, (fixed rate to 4/02/2029, variable rate thereafter), 7.296%, 4/02/2034(b) | |
| UniCredit SpA, (fixed rate to 6/19/2027, variable rate thereafter), 5.861%, 6/19/2032(b) | |
| UniCredit SpA, (fixed rate to 6/30/2030, variable rate thereafter), 5.459%, 6/30/2035(b) | |
| | |
| |
| Japan Government CPI-Linked Bonds, Series 23, 0.100%, 3/10/2028, (JPY) | |
| Japan Government Ten Year Bonds, Series 371, 0.400%, 6/20/2033, (JPY) | |
| Mitsubishi UFJ Financial Group, Inc., (fixed rate to 1/19/2027, variable rate thereafter), 2.341%, 1/19/2028 | |
| Mizuho Financial Group, Inc., 2.564%, 9/13/2031 | |
| Nomura Holdings, Inc., 1.851%, 7/16/2025 | |
| Nomura Holdings, Inc., 2.710%, 1/22/2029 | |
| Sumitomo Mitsui Financial Group, Inc., 5.766%, 1/13/2033 | |
| Toyota Motor Corp., 5.123%, 7/13/2033 | |
| | |
| |
| Kia Corp., 2.750%, 2/14/2027(b) | |
| | |
|
| |
| Korea East-West Power Co. Ltd., 1.750%, 5/06/2025(b) | |
| Korea National Oil Corp., 2.125%, 4/18/2027(b) | |
| Korea Treasury Bonds, Series 2312, 0.875%, 12/10/2023, (KRW) | |
| Korea Treasury Bonds, Series 2509, 1.125%, 9/10/2025, (KRW) | |
| Korea Treasury Bonds, Series 3012, 1.500%, 12/10/2030, (KRW) | |
| Shinhan Bank Co. Ltd., 3.875%, 3/24/2026(b) | |
| SK Hynix, Inc., 2.375%, 1/19/2031(b) | |
| SK Hynix, Inc., 6.375%, 1/17/2028(b) | |
| SK Telecom Co. Ltd., 6.625%, 7/20/2027(b) | |
| | |
| |
| ArcelorMittal SA, 6.750%, 3/01/2041 | |
| Blackstone Property Partners Europe Holdings Sarl, EMTN, 1.625%, 4/20/2030, (EUR) | |
| Logicor Financing Sarl, EMTN, 0.875%, 1/14/2031, (EUR) | |
| Logicor Financing Sarl, EMTN, 1.625%, 1/17/2030, (EUR) | |
| Logicor Financing Sarl, EMTN, 2.000%, 1/17/2034, (EUR) | |
| | |
| |
| Alfa SAB de CV, 6.875%, 3/25/2044 | |
| America Movil SAB de CV, 2.125%, 3/10/2028, (EUR) | |
| America Movil SAB de CV, 2.875%, 5/07/2030 | |
| Banco Santander Mexico SA Institucion de Banca Multiple Grupo Financiero Santand, 5.375%, 4/17/2025(b) | |
| Cemex SAB de CV, 3.875%, 7/11/2031(b) | |
| Cemex SAB de CV, 5.450%, 11/19/2029 | |
| Cemex SAB de CV, (fixed rate to 6/08/2026, variable rate thereafter), 5.125%(b)(f) | |
| Coca-Cola Femsa SAB de CV, 2.750%, 1/22/2030 | |
| Grupo Televisa SAB, EMTN, 7.250%, 5/14/2043, (MXN) | |
| Kimberly-Clark de Mexico SAB de CV, 2.431%, 7/01/2031 | |
| Kimberly-Clark de Mexico SAB de CV, 2.431%, 7/01/2031(b) | |
| Mexico Bonos, Series M, 5.750%, 3/05/2026, (MXN) | |
| Mexico Bonos, Series M 20, 7.500%, 6/03/2027, (MXN) | |
| Mexico Bonos, Series M 20, 8.500%, 5/31/2029, (MXN) | |
| Mexico Bonos, Series M 30, 8.500%, 11/18/2038, (MXN) | |
| Mexico Government International Bonds, 3.250%, 4/16/2030 | |
| Mexico Government International Bonds, 3.500%, 2/12/2034 | |
| Mexico Government International Bonds, 4.000%, 3/15/2115, (EUR) | |
See accompanying notes to financial statements.
Portfolio of Investments – as of September 30, 2023
Loomis Sayles Global Allocation Fund (continued)
| | |
|
| |
| Mexico Government International Bonds, 4.875%, 5/19/2033 | |
| Mexico Government International Bonds, 6.338%, 5/04/2053 | |
| Orbia Advance Corp. SAB de CV, 1.875%, 5/11/2026(b) | |
| Orbia Advance Corp. SAB de CV, 4.000%, 10/04/2027 | |
| Petroleos Mexicanos, 5.950%, 1/28/2031 | |
| Sigma Alimentos SA de CV, 2.625%, 2/07/2024, (EUR)(b) | |
| Sigma Alimentos SA de CV, 4.125%, 5/02/2026 | |
| Sigma Finance Netherlands BV, 4.875%, 3/27/2028 | |
| Unifin Financiera SAB de CV, 7.250%, 9/27/2023(h) | |
| Unifin Financiera SAB de CV, 9.875%, 1/28/2029(h) | |
| | |
| |
| Cooperatieve Rabobank UA, 4.375%, 8/04/2025 | |
| ING Groep NV, (fixed rate to 7/01/2025, variable rate thereafter), 1.400%, 7/01/2026(b) | |
| | |
| |
| Fonterra Co.-operative Group Ltd., MTN, 5.500%, 2/26/2024, (AUD) | |
| New Zealand Government Bonds, Series 429, 3.000%, 4/20/2029, (NZD) | |
| New Zealand Government Bonds, Series 524, 0.500%, 5/15/2024, (NZD) | |
| New Zealand Government Bonds, Series 531, 1.500%, 5/15/2031, (NZD) | |
| | |
| |
| DNB Bank ASA, (fixed rate to 5/25/2026, variable rate thereafter), 1.535%, 5/25/2027(b) | |
| Equinor ASA, 3.625%, 4/06/2040 | |
| Norway Government Bonds, Series 478, 1.500%, 2/19/2026, (NOK) | |
| Norway Government Bonds, Series 479, 1.750%, 2/17/2027, (NOK) | |
| Norway Government Bonds, Series 480, 2.000%, 4/26/2028, (NOK) | |
| Norway Government Bonds, Series 482, 1.375%, 8/19/2030, (NOK) | |
| Var Energi ASA, 8.000%, 11/15/2032(b) | |
| | |
| |
| Paraguay Government International Bonds, 4.950%, 4/28/2031(b) | |
| Paraguay Government International Bonds, 5.000%, 4/15/2026(b) | |
| | |
| | |
|
| |
| Corp. Financiera de Desarrollo SA, 2.400%, 9/28/2027(b) | |
| Transportadora de Gas del Peru SA, 4.250%, 4/30/2028(b) | |
| | |
| |
| Republic of Poland Government Bonds, Series 1030, 1.250%, 10/25/2030, (PLN) | |
| Republic of Poland Government Bonds, Series 725, 3.250%, 7/25/2025, (PLN) | |
| | |
| |
| EDP Finance BV, 1.710%, 1/24/2028(b) | |
| |
| Ooredoo International Finance Ltd., 2.625%, 4/08/2031(b) | |
| QatarEnergy, 2.250%, 7/12/2031(b) | |
| | |
| |
| Romania Government International Bonds, 2.000%, 4/14/2033, (EUR)(b) | |
| |
| Singapore Government Bonds, 2.125%, 6/01/2026, (SGD) | |
| |
| Anglo American Capital PLC, 2.625%, 9/10/2030(b) | |
| Anglo American Capital PLC, 5.625%, 4/01/2030(b) | |
| MTN Mauritius Investments Ltd., 4.755%, 11/11/2024 | |
| MTN Mauritius Investments Ltd., 4.755%, 11/11/2024(b) | |
| Republic of South Africa Government Bonds, Series 2035, 8.875%, 2/28/2035, (ZAR) | |
| Republic of South Africa Government Bonds, Series R213, 7.000%, 2/28/2031, (ZAR) | |
| Republic of South Africa Government International Bonds, 5.750%, 9/30/2049 | |
| | |
| |
| Banco Santander SA, (fixed rate to 9/14/2026, variable rate thereafter), 1.722%, 9/14/2027 | |
| CaixaBank SA, EMTN, (fixed rate to 11/23/2027, variable rate thereafter), 6.250%, 2/23/2033, (EUR) | |
| Cellnex Telecom SA, EMTN, 1.750%, 10/23/2030, (EUR) | |
| Naturgy Finance BV, EMTN, 1.500%, 1/29/2028, (EUR) | |
| Spain Government Bonds, 1.950%, 7/30/2030, (EUR) | |
| | |
See accompanying notes to financial statements.
Portfolio of Investments – as of September 30, 2023
Loomis Sayles Global Allocation Fund (continued)
| | |
|
| |
| International Bank for Reconstruction & Development, 1.200%, 7/22/2026, (CAD) | |
| Nordic Investment Bank, EMTN, 1.500%, 3/13/2025, (NOK) | |
| | |
| |
| Heimstaden Bostad Treasury BV, EMTN, 1.375%, 7/24/2028, (EUR) | |
| Swedbank AB, 6.136%, 9/12/2026(b) | |
| Sweden Government Bonds, Series 1057, 1.500%, 11/13/2023, (SEK) | |
| Sweden Government Bonds, Series 1058, 2.500%, 5/12/2025, (SEK) | |
| Sweden Government Bonds, Series 1062, 0.125%, 5/12/2031, (SEK) | |
| | |
| |
| Credit Suisse AG, 2.950%, 4/09/2025 | |
| Novartis Capital Corp., 2.000%, 2/14/2027 | |
| UBS Group AG, (fixed rate to 11/15/2032, variable rate thereafter), 9.016%, 11/15/2033(b) | |
| UBS Group AG, (fixed rate to 5/14/2031, variable rate thereafter), 3.091%, 5/14/2032(b) | |
| UBS Group AG, (fixed rate to 6/05/2025, variable rate thereafter), 2.193%, 6/05/2026(b) | |
| UBS Group AG, (fixed rate to 7/15/2025, variable rate thereafter), 6.373%, 7/15/2026(b) | |
| UBS Group AG, (fixed rate to 8/12/2032, variable rate thereafter), 6.537%, 8/12/2033(b) | |
| Willow No. 2 Ireland PLC for Zurich Insurance Co. Ltd., EMTN, (fixed rate to 10/01/2025, variable rate thereafter), 4.250%, 10/01/2045 | |
| | |
| |
| TSMC Arizona Corp., 2.500%, 10/25/2031 | |
| |
| HTA Group Ltd., 7.000%, 12/18/2025(b) | |
| |
| Aydem Yenilenebilir Enerji AS, 7.750%, 2/02/2027(b) | |
| TC Ziraat Bankasi AS, 5.375%, 3/02/2026(b) | |
| Turk Telekomunikasyon AS, 6.875%, 2/28/2025 | |
| Turkcell Iletisim Hizmetleri AS, 5.800%, 4/11/2028 | |
| Turkey Government International Bonds, 5.250%, 3/13/2030 | |
| Turkey Government International Bonds, 7.625%, 4/26/2029 | |
| | |
| |
| Trinidad Generation UnLtd, 5.250%, 11/04/2027(b) | |
| United Arab Emirates — 0.0% |
| Abu Dhabi Government International Bonds, 3.125%, 4/16/2030(b) | |
| | |
|
| |
| Ashtead Capital, Inc., 5.500%, 8/11/2032(b) | |
| CK Hutchison International 19 Ltd., 3.625%, 4/11/2029(b) | |
| Diageo Capital PLC, 2.125%, 4/29/2032 | |
| Nationwide Building Society, (fixed rate to 7/18/2029, variable rate thereafter), 3.960%, 7/18/2030(b) | |
| NatWest Markets PLC, 0.800%, 8/12/2024(b) | |
| Network Rail Infrastructure Finance PLC, Series 6, EMTN, 4.750%, 1/22/2024, (GBP) | |
| Santander U.K. Group Holdings PLC, (fixed rate to 1/11/2027, variable rate thereafter), 2.469%, 1/11/2028 | |
| Standard Chartered PLC, (fixed rate to 11/18/2030, variable rate thereafter), 3.265%, 2/18/2036(b) | |
| Standard Chartered PLC, (fixed rate to 3/30/2025, variable rate thereafter), 3.971%, 3/30/2026(b) | |
| Standard Chartered PLC, EMTN, 3.125%, 11/19/2024, (EUR) | |
| U.K. Gilts, 3.250%, 1/31/2033, (GBP) | |
| | |
| |
| AES Corp., 3.950%, 7/15/2030(b) | |
| Aircastle Ltd., Series A, (fixed rate to 6/15/2026, variable rate thereafter), 5.250%(b)(f) | |
| Albemarle Corp., 5.050%, 6/01/2032 | |
| Ally Financial, Inc., Series B, (fixed rate to 5/15/2026, variable rate thereafter), 4.700%(f) | |
| Ally Financial, Inc., Series C, (fixed rate to 5/15/2028, variable rate thereafter), 4.700%(f) | |
| American Airlines Pass-Through Trust, Series 2016-1, Class B, 5.250%, 7/15/2025 | |
| American Airlines Pass-Through Trust, Series 2016-3, Class B, 3.750%, 4/15/2027 | |
| American Airlines Pass-Through Trust, Series 2017-1, Class B, 4.950%, 8/15/2026 | |
| American Airlines Pass-Through Trust, Series 2017-2, Class B, 3.700%, 4/15/2027 | |
| Apple, Inc., Series MPLE, 2.513%, 8/19/2024, (CAD) | |
| Aptiv PLC, 1.600%, 9/15/2028, (EUR) | |
| Ares Capital Corp., 3.200%, 11/15/2031 | |
| Ashland, Inc., 3.375%, 9/01/2031(b) | |
| Bank of America Corp., (fixed rate to 9/21/2031, variable rate thereafter), 2.482%, 9/21/2036 | |
| Bank of America Corp., Series MPLE, (fixed rate to 9/15/2026, variable rate thereafter), 1.978%, 9/15/2027, (CAD) | |
| Barings BDC, Inc., 3.300%, 11/23/2026 | |
| Bausch Health Cos., Inc., 4.875%, 6/01/2028(b) | |
| Bausch Health Cos., Inc., 5.000%, 1/30/2028(b) | |
| Beazer Homes USA, Inc., 7.250%, 10/15/2029 | |
| Block, Inc., 3.500%, 6/01/2031 | |
| Blue Owl Capital Corp., 4.250%, 1/15/2026 | |
See accompanying notes to financial statements.
Portfolio of Investments – as of September 30, 2023
Loomis Sayles Global Allocation Fund (continued)
| | |
|
| United States — continued |
| Blue Owl Technology Finance Corp., 2.500%, 1/15/2027 | |
| Blue Owl Technology Finance Corp., 4.750%, 12/15/2025(b) | |
| BPR Trust, Series 2021-NRD, Class F, 1 mo. USD SOFR + 6.870%, 12.203%, 12/15/2038(b)(i) | |
| Broadcom, Inc., 2.450%, 2/15/2031(b) | |
| Broadcom, Inc., 2.600%, 2/15/2033(b) | |
| Broadcom, Inc., 3.187%, 11/15/2036(b) | |
| Broadcom, Inc., 3.419%, 4/15/2033(b) | |
| Broadcom, Inc., 3.469%, 4/15/2034(b) | |
| Broadcom, Inc., 4.150%, 4/15/2032(b) | |
| Carnival Corp., 5.750%, 3/01/2027(b) | |
| Carnival Corp., 7.000%, 8/15/2029(b) | |
| CCO Holdings LLC/CCO Holdings Capital Corp., 4.250%, 2/01/2031(b) | |
| CCO Holdings LLC/CCO Holdings Capital Corp., 4.250%, 1/15/2034(b) | |
| CCO Holdings LLC/CCO Holdings Capital Corp., 4.750%, 2/01/2032(b) | |
| Celanese U.S. Holdings LLC, 6.330%, 7/15/2029 | |
| Celanese U.S. Holdings LLC, 6.379%, 7/15/2032 | |
| Celanese U.S. Holdings LLC, 6.700%, 11/15/2033 | |
| Centene Corp., 2.500%, 3/01/2031 | |
| Centene Corp., 3.000%, 10/15/2030 | |
| Charles River Laboratories International, Inc., 3.750%, 3/15/2029(b) | |
| Charles River Laboratories International, Inc., 4.000%, 3/15/2031(b) | |
| Charter Communications Operating LLC/Charter Communications Operating Capital, 3.950%, 6/30/2062 | |
| Charter Communications Operating LLC/Charter Communications Operating Capital, 4.400%, 4/01/2033 | |
| Charter Communications Operating LLC/Charter Communications Operating Capital, 4.400%, 12/01/2061 | |
| CommScope Technologies LLC, 5.000%, 3/15/2027(b) | |
| CommScope, Inc., 4.750%, 9/01/2029(b) | |
| Continental Resources, Inc., 2.875%, 4/01/2032(b) | |
| Continental Resources, Inc., 5.750%, 1/15/2031(b) | |
| CSC Holdings LLC, 3.375%, 2/15/2031(b) | |
| CSC Holdings LLC, 4.125%, 12/01/2030(b) | |
| CSC Holdings LLC, 4.500%, 11/15/2031(b) | |
| CSC Holdings LLC, 4.625%, 12/01/2030(b) | |
| CSC Holdings LLC, 5.000%, 11/15/2031(b) | |
| CSC Holdings LLC, 5.375%, 2/01/2028(b) | |
| CSC Holdings LLC, 5.750%, 1/15/2030(b) | |
| CSC Holdings LLC, 6.500%, 2/01/2029(b) | |
| DH Europe Finance II Sarl, 0.750%, 9/18/2031, (EUR) | |
| Dillard's, Inc., 7.000%, 12/01/2028 | |
| Dillard's, Inc., 7.750%, 7/15/2026 | |
| Directv Financing LLC/Directv Financing Co-Obligor, Inc., 5.875%, 8/15/2027(b) | |
| | |
|
| United States — continued |
| DISH DBS Corp., 5.125%, 6/01/2029 | |
| DISH DBS Corp., 5.250%, 12/01/2026(b) | |
| DISH DBS Corp., 5.750%, 12/01/2028(b) | |
| DISH DBS Corp., 7.750%, 7/01/2026 | |
| EnLink Midstream LLC, 6.500%, 9/01/2030(b) | |
| EnLink Midstream Partners LP, 5.450%, 6/01/2047 | |
| EPR Properties, 3.600%, 11/15/2031 | |
| EQT Corp., 3.625%, 5/15/2031(b) | |
| EQT Corp., 5.000%, 1/15/2029 | |
| Everi Holdings, Inc., 5.000%, 7/15/2029(b) | |
| Expedia Group, Inc., 2.950%, 3/15/2031 | |
| Freeport-McMoRan, Inc., 4.375%, 8/01/2028 | |
| Freeport-McMoRan, Inc., 5.400%, 11/14/2034 | |
| General Motors Co., 5.200%, 4/01/2045 | |
| General Motors Co., 6.250%, 10/02/2043 | |
| General Motors Financial Co., Inc., 3.100%, 1/12/2032 | |
| General Motors Financial Co., Inc., 6.400%, 1/09/2033 | |
| GLP Capital LP/GLP Financing II, Inc., 3.250%, 1/15/2032 | |
| Goodyear Tire & Rubber Co., 7.000%, 3/15/2028 | |
| GTCR W-2 Merger Sub LLC, 7.500%, 1/15/2031(b) | |
| Hess Midstream Operations LP, 4.250%, 2/15/2030(b) | |
| Hilton Grand Vacations Borrower Escrow LLC/Hilton Grand Vacations Borrower Escrow, Inc., 4.875%, 7/01/2031(b) | |
| Hilton Grand Vacations Borrower Escrow LLC/Hilton Grand Vacations Borrower Escrow, Inc., 5.000%, 6/01/2029(b) | |
| Hyundai Capital America, 6.375%, 4/08/2030(b) | |
| Icahn Enterprises LP/Icahn Enterprises Finance Corp., 4.375%, 2/01/2029 | |
| Icahn Enterprises LP/Icahn Enterprises Finance Corp., 4.750%, 9/15/2024 | |
| Icahn Enterprises LP/Icahn Enterprises Finance Corp., 5.250%, 5/15/2027 | |
| Icahn Enterprises LP/Icahn Enterprises Finance Corp., 6.375%, 12/15/2025 | |
| iHeartCommunications, Inc., 4.750%, 1/15/2028(b) | |
| iHeartCommunications, Inc., 5.250%, 8/15/2027(b) | |
| Iron Mountain, Inc., 4.875%, 9/15/2029(b) | |
| JBS USA LUX SA/JBS USA Food Co./JBS USA Finance, Inc., 3.750%, 12/01/2031 | |
| JELD-WEN, Inc., 4.875%, 12/15/2027(b) | |
| John Deere Capital Corp., MTN, 0.450%, 6/07/2024 | |
| Light & Wonder International, Inc., 7.000%, 5/15/2028(b) | |
| Light & Wonder International, Inc., 7.250%, 11/15/2029(b) | |
| Light & Wonder International, Inc., 7.500%, 9/01/2031(b) | |
| Lithia Motors, Inc., 3.875%, 6/01/2029(b) | |
See accompanying notes to financial statements.
Portfolio of Investments – as of September 30, 2023
Loomis Sayles Global Allocation Fund (continued)
| | |
|
| United States — continued |
| Marriott Ownership Resorts, Inc., 4.500%, 6/15/2029(b) | |
| Matador Resources Co., 6.875%, 4/15/2028(b) | |
| Medtronic Global Holdings SCA, 1.125%, 3/07/2027, (EUR) | |
| Micron Technology, Inc., 5.875%, 2/09/2033 | |
| Mileage Plus Holdings LLC/Mileage Plus Intellectual Property Assets Ltd., 6.500%, 6/20/2027(b) | |
| Molina Healthcare, Inc., 3.875%, 5/15/2032(b) | |
| MSCI, Inc., 3.250%, 8/15/2033(b) | |
| Nationstar Mortgage Holdings, Inc., 5.125%, 12/15/2030(b) | |
| Nationstar Mortgage Holdings, Inc., 5.500%, 8/15/2028(b) | |
| NCL Corp. Ltd., 5.875%, 3/15/2026(b) | |
| NCL Corp. Ltd., 5.875%, 2/15/2027(b) | |
| NCL Finance Ltd., 6.125%, 3/15/2028(b) | |
| Netflix, Inc., 4.875%, 6/15/2030(b) | |
| NGPL PipeCo LLC, 7.768%, 12/15/2037(b) | |
| Occidental Petroleum Corp., 6.125%, 1/01/2031 | |
| Occidental Petroleum Corp., 6.625%, 9/01/2030 | |
| Occidental Petroleum Corp., 7.875%, 9/15/2031 | |
| Occidental Petroleum Corp., 8.875%, 7/15/2030 | |
| OneMain Finance Corp., 3.500%, 1/15/2027 | |
| OneMain Finance Corp., 4.000%, 9/15/2030 | |
| OneMain Finance Corp., 5.375%, 11/15/2029 | |
| OneMain Finance Corp., 6.875%, 3/15/2025 | |
| OneMain Finance Corp., 7.125%, 3/15/2026 | |
| OneMain Finance Corp., 8.250%, 10/01/2023 | |
| Ovintiv, Inc., 6.250%, 7/15/2033 | |
| Ovintiv, Inc., 6.500%, 8/15/2034 | |
| Ovintiv, Inc., 6.500%, 2/01/2038 | |
| Ovintiv, Inc., 6.625%, 8/15/2037 | |
| Ovintiv, Inc., 7.200%, 11/01/2031 | |
| Ovintiv, Inc., 7.375%, 11/01/2031 | |
| Ovintiv, Inc., 8.125%, 9/15/2030 | |
| Pilgrim's Pride Corp., 3.500%, 3/01/2032 | |
| Pilgrim's Pride Corp., 4.250%, 4/15/2031 | |
| Post Holdings, Inc., 4.500%, 9/15/2031(b) | |
| Prologis Euro Finance LLC, 0.250%, 9/10/2027, (EUR) | |
| Prologis Euro Finance LLC, 1.875%, 1/05/2029, (EUR) | |
| Prologis LP, 2.250%, 6/30/2029, (GBP) | |
| Rand Parent LLC, 8.500%, 2/15/2030(b) | |
| Realty Income Corp., 5.125%, 7/06/2034, (EUR) | |
| Realty Income Corp., EMTN, 1.625%, 12/15/2030, (GBP) | |
| Rocket Mortgage LLC/Rocket Mortgage Co-Issuer, Inc., 2.875%, 10/15/2026(b) | |
| Rocket Mortgage LLC/Rocket Mortgage Co-Issuer, Inc., 3.625%, 3/01/2029 | |
| Rocket Mortgage LLC/Rocket Mortgage Co-Issuer, Inc., 3.625%, 3/01/2029(b) | |
| Rocket Mortgage LLC/Rocket Mortgage Co-Issuer, Inc., 3.875%, 3/01/2031(b) | |
| | |
|
| United States — continued |
| Rocket Mortgage LLC/Rocket Mortgage Co-Issuer, Inc., 4.000%, 10/15/2033(b) | |
| Royal Caribbean Cruises Ltd., 4.250%, 7/01/2026(b) | |
| Royal Caribbean Cruises Ltd., 5.500%, 4/01/2028(b) | |
| SBA Communications Corp., 3.125%, 2/01/2029 | |
| Sensata Technologies BV, 4.000%, 4/15/2029(b) | |
| Silgan Holdings, Inc., 3.250%, 3/15/2025, (EUR) | |
| Southwestern Energy Co., 4.750%, 2/01/2032 | |
| Synchrony Bank, 5.625%, 8/23/2027 | |
| Tapestry, Inc., 3.050%, 3/15/2032 | |
| Targa Resources Corp., 6.125%, 3/15/2033 | |
| Targa Resources Partners LP/Targa Resources Partners Finance Corp., 4.875%, 2/01/2031 | |
| Thermo Fisher Scientific Finance I BV, 2.000%, 10/18/2051, (EUR) | |
| Thermo Fisher Scientific, Inc., EMTN, 1.500%, 10/01/2039, (EUR) | |
| Time Warner Cable LLC, 4.500%, 9/15/2042 | |
| Time Warner Cable LLC, 5.500%, 9/01/2041 | |
| T-Mobile USA, Inc., 3.875%, 4/15/2030 | |
| TopBuild Corp., 4.125%, 2/15/2032(b) | |
| TransDigm, Inc., 6.750%, 8/15/2028(b) | |
| Travel & Leisure Co., 4.500%, 12/01/2029(b) | |
| Travel & Leisure Co., 4.625%, 3/01/2030(b) | |
| TriNet Group, Inc., 3.500%, 3/01/2029(b) | |
| U.S. Airways Pass-Through Trust, Series 2012-2, Class A, 4.625%, 12/03/2026 | |
| U.S. Treasury Bonds, 2.250%, 2/15/2052 | |
| U.S. Treasury Bonds, 3.625%, 5/15/2053 | |
| U.S. Treasury Bonds, 4.125%, 8/15/2053 | |
| U.S. Treasury Inflation-Indexed Notes, 1.375%, 7/15/2033(j) | |
| U.S. Treasury Notes, 0.875%, 1/31/2024 | |
| U.S. Treasury Notes, 2.250%, 3/31/2024(k) | |
| U.S. Treasury Notes, 3.375%, 5/15/2033 | |
| U.S. Treasury Notes, 3.750%, 6/30/2030 | |
| Uber Technologies, Inc., 4.500%, 8/15/2029(b) | |
| Uber Technologies, Inc., 6.250%, 1/15/2028(b) | |
| Uber Technologies, Inc., 7.500%, 9/15/2027(b) | |
| Uber Technologies, Inc., 8.000%, 11/01/2026(b) | |
| United Airlines Pass-Through Trust, Series 20-1, Class A, 5.875%, 4/15/2029 | |
| United Airlines Pass-Through Trust, Series 2016-2, Class B, 3.650%, 4/07/2027 | |
| Venture Global Calcasieu Pass LLC, 3.875%, 11/01/2033(b) | |
| Venture Global Calcasieu Pass LLC, 4.125%, 8/15/2031(b) | |
| Verizon Communications, Inc., Series MPLE, 2.500%, 5/16/2030, (CAD) | |
| VICI Properties LP/VICI Note Co., Inc., 4.250%, 12/01/2026(b) | |
| VICI Properties LP/VICI Note Co., Inc., 4.500%, 9/01/2026(b) | |
See accompanying notes to financial statements.
Portfolio of Investments – as of September 30, 2023
Loomis Sayles Global Allocation Fund (continued)
| | |
|
| United States — continued |
| VICI Properties LP/VICI Note Co., Inc., 4.625%, 6/15/2025(b) | |
| VMware, Inc., 2.200%, 8/15/2031 | |
| Warnermedia Holdings, Inc., 4.279%, 3/15/2032 | |
| Western Digital Corp., 2.850%, 2/01/2029 | |
| Western Digital Corp., 3.100%, 2/01/2032 | |
| Western Midstream Operating LP, 4.050%, 2/01/2030 | |
| Western Midstream Operating LP, 5.250%, 2/01/2050 | |
| Western Midstream Operating LP, 5.300%, 3/01/2048 | |
| Western Midstream Operating LP, 5.450%, 4/01/2044 | |
| Western Midstream Operating LP, 5.500%, 8/15/2048 | |
| Yum! Brands, Inc., 4.625%, 1/31/2032 | |
| | |
| |
| Uruguay Government International Bonds, 4.375%, 1/23/2031 | |
| Uruguay Government International Bonds, 8.250%, 5/21/2031, (UYU) | |
| | |
| Total Non-Convertible Bonds
(Identified Cost $887,962,221) | |
|
|
|
| |
| BioMarin Pharmaceutical, Inc., 1.250%, 5/15/2027 | |
| DISH Network Corp., 3.375%, 8/15/2026 | |
| DISH Network Corp., Zero Coupon, 0.000%-9.514%, 12/15/2025(l) | |
| Etsy, Inc., 0.125%, 9/01/2027 | |
| Etsy, Inc., 0.250%, 6/15/2028 | |
| JetBlue Airways Corp., 0.500%, 4/01/2026 | |
| Livongo Health, Inc., 0.875%, 6/01/2025 | |
| NCL Corp. Ltd., 1.125%, 2/15/2027 | |
| Northern Oil & Gas, Inc., 3.625%, 4/15/2029(b) | |
| Penn Entertainment, Inc., 2.750%, 5/15/2026 | |
| Snap, Inc., Zero Coupon, 6.697%-7.641%, 5/01/2027(l) | |
| Southwest Airlines Co., 1.250%, 5/01/2025 | |
| Splunk, Inc., 1.125%, 6/15/2027 | |
| Spotify USA, Inc., Zero Coupon, 5.189%-5.873%, 3/15/2026(l) | |
| Teladoc Health, Inc., 1.250%, 6/01/2027 | |
| Uber Technologies, Inc., Zero Coupon, 0.000%-5.582%, 12/15/2025(l) | |
| Unity Software, Inc., Zero Coupon, 7.197%-7.334%, 11/15/2026(l) | |
| Zillow Group, Inc., 1.375%, 9/01/2026 | |
| Total Convertible Bonds
(Identified Cost $83,506,676) | |
|
|
| | |
|
|
| |
| Tobacco Settlement Financing Corp., Series A-1, 6.706%-, 6/01/2046
(Identified cost $119,990) | |
| Total Bonds and Notes
(Identified Cost $971,588,887) | |
|
|
|
| |
| 1011778 BC Unlimited Liability Co., 2023 Term Loan B5, 1 mo. USD SOFR + 2.250%, 7.566%, 9/23/2030(m) | |
| |
| Carnival Corp., 2021 Incremental Term Loan B, 1 mo. USD SOFR + 3.250%, 8.681%, 10/18/2028(i)(n) | |
| Carnival Corp., 2021 Incremental Term Loan B, 10/18/2028(o) | |
| Carnival Corp., 2023 Term Loan B, 8/08/2027(o) | |
| Carnival Corp., 2023 Term Loan B, 1 mo. USD SOFR + 3.000%, 8.327%, 8/08/2027(i)(n) | |
| GTCR W Merger Sub LLC, USD Term Loan B, 9/20/2030(o) | |
| HUB International Ltd., 2023 Term Loan B, 3 mo. USD SOFR + 4.250%, 9.584%, 6/20/2030(i)(n) | |
| Star Parent, Inc., 2023 Term Loan B, 9/19/2030(o) | |
| Uber Technologies, Inc., 2023 Term Loan B, 3 mo. USD SOFR + 2.750%, 8.159%, 3/03/2030(i)(m) | |
| | |
| Total Senior Loans
(Identified Cost $6,402,711) | |
| | |
|
| |
| El Paso Energy Capital Trust I, 4.750%, 3/31/2028
(Identified Cost $1,125,845) | |
See accompanying notes to financial statements.
Portfolio of Investments – as of September 30, 2023
Loomis Sayles Global Allocation Fund (continued)
| | |
Short-Term Investments — 1.7% |
| Tri-Party Repurchase Agreement with Fixed Income Clearing Corporation, dated 9/29/2023 at 2.500% to be repurchased at $42,218,898 on 10/02/2023 collateralized by $48,351,700 U.S. Treasury Note, 0.750% due 8/31/2026 valued at $43,054,350 including accrued interest (Note 2 of Notes to Financial Statements) | |
| U.S. Treasury Bills, 5.170%, 12/21/2023(p) | |
| Total Short-Term Investments
(Identified Cost $46,311,829) | |
| Total Investments — 100.1%
(Identified Cost $2,624,501,457) | |
| Other assets less liabilities — (0.1)% | |
| | |
| See Note 2 of Notes to Financial Statements. |
| Principal Amount stated in U.S. dollars unless otherwise noted. |
| Non-income producing security. |
| All or a portion of these securities are exempt from registration under Rule 144A of the Securities Act of 1933. These securities may be resold in transactions exempt from registration, normally to qualified institutional buyers. At September 30, 2023, the value of Rule 144A holdings amounted to $277,712,051 or 10.3% of net assets. |
| Amount shown represents units. One unit represents a principal amount of 1,000. |
| Interest rate represents annualized yield at time of purchase; not a coupon rate. |
| Amount shown represents principal amount including inflation adjustments. |
| Perpetual bond with no specified maturity date. |
| Amount shown represents units. One unit represents a principal amount of 100. |
| The issuer is in default with respect to interest and/or principal payments. Income is not being accrued. |
| Variable rate security. Rate as of September 30, 2023 is disclosed. |
| Treasury Inflation Protected Security (TIPS). |
| Security (or a portion thereof) has been pledged as collateral for open derivative contracts. |
| Interest rate represents annualized yield at time of purchase; not a coupon rate. The Fund’s investment in this security is comprised of various lots with differing annualized yields. |
| Stated interest rate has been determined in accordance with the provisions of the loan agreement and is subject to a minimum benchmark floor rate of 0.00%, to which the spread is added. |
| Stated interest rate has been determined in accordance with the provisions of the loan agreement and is subject to a minimum benchmark floor rate of 0.75%, to which the spread is added. |
| Position is unsettled. Contract rate was not determined at September 30, 2023 and does not take effect until settlement date. Maturity date is not finalized until settlement date. |
| Interest rate represents discount rate at time of purchase; not a coupon rate. |
| |
| |
| |
| Secured Overnight Financing Rate |
At September 30, 2023, the Fund had the following open forward foreign currency contracts:
| | Currency
Bought/
Sold (B/S) | | | | Unrealized
Appreciation
(Depreciation) |
| | | | | | | |
| | | | | | | |
| | | | | | | |
| | | | | | | |
| | | | | | | |
| | | | | | | |
Morgan Stanley Capital Services LLC | | | | | | | |
Morgan Stanley Capital Services LLC | | | | | | | |
| | | | | | | |
| | | | | | | |
| | | | | | | |
See accompanying notes to financial statements.
Portfolio of Investments – as of September 30, 2023
Loomis Sayles Global Allocation Fund (continued)
At September 30, 2023, the Fund had the following open forward cross currency contracts:
| | | | | Unrealized
Appreciaation
(Depreciation) |
Morgan Stanley Capital Services LLC | | | | | | | |
At September 30, 2023, open long futures contracts were as follows:
| | | | | Unrealized
Appreciation
(Depreciation) |
CBOT 10 Year U.S. Treasury Notes Futures | | | | | |
CBOT 2 Year U.S. Treasury Notes Futures | | | | | |
CBOT 5 Year U.S. Treasury Notes Futures | | | | | |
CBOT U.S. Long Bond Futures | | | | | |
| | | | | |
At September 30, 2023, open short futures contracts were as follows:
| | | | | Unrealized
Appreciation
(Depreciation) |
CME Ultra Long Term U.S. Treasury Bond Futures | | | | | |
Ultra 10 Year U.S. Treasury Notes Futures | | | | | |
| | | | | |
Industry Summary at September 30, 2023
| |
Semiconductors & Semiconductor Equipment | |
| |
| |
| |
Life Sciences Tools & Services | |
| |
| |
Textiles, Apparel & Luxury Goods | |
Interactive Media & Services | |
| |
| |
| |
| |
Health Care Providers & Services | |
Hotels, Restaurants & Leisure | |
| |
| |
Consumer Staples Distribution & Retail | |
| |
Other Investments, less than 2% each | |
| |
| |
Other assets less liabilities (including forward foreign currency and futures contracts) | |
| |
Currency Exposure Summary at September 30, 2023
| |
| |
| |
| |
| |
| |
Other assets less liabilities (including forward foreign currency and futures contracts) | |
| |
See accompanying notes to financial statements.
Portfolio of Investments – as of September 30, 2023
Loomis Sayles Growth Fund
| | |
Common Stocks — 98.1% of Net Assets |
| Aerospace & Defense — 4.7% |
| | |
| Air Freight & Logistics — 1.6% |
| Expeditors International of Washington, Inc. | |
| |
| | |
| |
| Monster Beverage Corp.(a) | |
| |
| Regeneron Pharmaceuticals, Inc.(a) | |
| Vertex Pharmaceuticals, Inc.(a) | |
| | |
| |
| Alibaba Group Holding Ltd., ADR(a) | |
| | |
| | |
| |
| FactSet Research Systems, Inc. | |
| | |
| | |
| |
| | |
| | |
| | |
| Financial Services — 7.3% |
| | |
| | |
| | |
| | |
| Health Care Equipment & Supplies — 1.3% |
| Intuitive Surgical, Inc.(a) | |
| Hotels, Restaurants & Leisure — 3.8% |
| | |
| | |
| | |
| | |
| Interactive Media & Services — 14.3% |
| Alphabet, Inc., Class A(a) | |
| Alphabet, Inc., Class C(a) | |
| Meta Platforms, Inc., Class A(a) | |
| | |
| |
| Shopify, Inc., Class A(a) | |
| Life Sciences Tools & Services — 2.6% |
| | |
| Thermo Fisher Scientific, Inc. | |
| | |
| |
| | |
| |
| | |
| | |
| | |
| | |
| | |
| Semiconductors & Semiconductor Equipment — 8.9% |
| | |
| | |
| | |
| |
| | |
| | |
| | |
| | |
| Workday, Inc., Class A(a) | |
| | |
| Total Common Stocks
(Identified Cost $6,102,374,554) | |
| | |
Short-Term Investments — 1.9% |
| Tri-Party Repurchase Agreement with Fixed Income Clearing Corporation, dated 9/29/2023 at 2.500% to be repurchased at $198,789,609 on 10/02/2023 collateralized by $204,263,500 U.S. Treasury Note, 4.375% due 8/15/2026 valued at $202,723,198 including accrued interest (Note 2 of Notes to Financial Statements)
(Identified Cost $198,748,203) | |
| Total Investments — 100.0%
(Identified Cost $6,301,122,757) | |
| Other assets less liabilities — 0.0% | |
| | |
| See Note 2 of Notes to Financial Statements. |
| Non-income producing security. |
| An American Depositary Receipt is a certificate issued by a custodian bank representing the right to receive securities of the foreign issuer described. The values of ADRs may be significantly influenced by trading on exchanges not located in the United States. |
See accompanying notes to financial statements.
Portfolio of Investments – as of September 30, 2023
Loomis Sayles Growth Fund (continued)
Industry Summary at September 30, 2023
| |
Interactive Media & Services | |
Semiconductors & Semiconductor Equipment | |
| |
| |
| |
| |
| |
| |
| |
Hotels, Restaurants & Leisure | |
| |
| |
Life Sciences Tools & Services | |
Other Investments, less than 2% each | |
| |
| |
Other assets less liabilities | |
| |
See accompanying notes to financial statements.
Portfolio of Investments – as of September 30, 2023
Loomis Sayles Intermediate Duration Bond Fund
| | |
Bonds and Notes — 97.7% of Net Assets |
| |
| Ally Auto Receivables Trust, Series 2022-3, Class A3, 5.070%, 4/15/2027 | |
| American Credit Acceptance Receivables Trust, Series 2020-4, Class C, 1.310%, 12/14/2026(a) | |
| American Credit Acceptance Receivables Trust, Series 2022-1, Class B, 1.680%, 9/14/2026(a) | |
| American Credit Acceptance Receivables Trust, Series 2022-4, Class C, 7.860%, 2/15/2029(a) | |
| American Credit Acceptance Receivables Trust, Series 2023-3, Class C, 6.440%, 10/12/2029(a) | |
| AmeriCredit Automobile Receivables Trust, Series 2020-2, Class B, 0.970%, 2/18/2026 | |
| AmeriCredit Automobile Receivables Trust, Series 2021-2, Class B, 0.690%, 1/19/2027 | |
| AmeriCredit Automobile Receivables Trust, Series 2021-3, Class C, 1.410%, 8/18/2027 | |
| AmeriCredit Automobile Receivables Trust, Series 2022-2, Class A3, 4.380%, 4/18/2028 | |
| AmeriCredit Automobile Receivables Trust, Series 2023-1, Class B, 5.570%, 3/20/2028 | |
| Avis Budget Rental Car Funding AESOP LLC, Series 2019-2A, Class A, 3.350%, 9/22/2025(a) | |
| Avis Budget Rental Car Funding AESOP LLC, Series 2023-2A, Class A, 5.200%, 10/20/2027(a) | |
| Avis Budget Rental Car Funding AESOP LLC, Series 2023-3A, Class A, 5.440%, 2/22/2028(a) | |
| Carmax Auto Owner Trust, Series 2023-3, Class A3, 5.280%, 5/15/2028 | |
| CarMax Auto Owner Trust, Series 2020-3, Class A3, 0.620%, 3/17/2025 | |
| CarMax Auto Owner Trust, Series 2023-2, Class A3, 5.050%, 1/18/2028 | |
| CarNow Auto Receivables Trust, Series 2023-1A, Class A, 6.620%, 12/16/2024(a) | |
| Carvana Auto Receivables Trust, Series 2021-N4, Class C, 1.720%, 9/11/2028 | |
| Carvana Auto Receivables Trust, Series 2021-P4, Class A3, 1.310%, 1/11/2027 | |
| Carvana Auto Receivables Trust, Series 2023-N1, Class A, 6.360%, 4/12/2027(a) | |
| Carvana Auto Receivables Trust, Series 2023-P1, Class A3, 5.980%, 12/10/2027(a) | |
| Carvana Auto Receivables Trust, Series 2023-P4, Class A3, 6.160%, 10/10/2028(a) | |
| Credit Acceptance Auto Loan Trust, Series 2021-3A, Class A, 1.000%, 5/15/2030(a) | |
| Credit Acceptance Auto Loan Trust, Series 2022-3A, Class A, 6.570%, 10/15/2032(a) | |
| Credit Acceptance Auto Loan Trust, Series 2023-1A, Class A, 6.480%, 3/15/2033(a) | |
| Credit Acceptance Auto Loan Trust, Series 2023-2A, Class B, 6.610%, 7/15/2033(a) | |
| Credit Acceptance Auto Loan Trust, Series 2023-3A, Class C, 7.620%, 12/15/2033(a) | |
| Drive Auto Receivables Trust, Series 2021-3, Class B, 1.110%, 5/15/2026 | |
| DT Auto Owner Trust, Series 2020-2A, Class C, 3.280%, 3/16/2026(a) | |
| DT Auto Owner Trust, Series 2021-2A, Class B, 0.810%, 1/15/2027(a) | |
| | |
| |
| DT Auto Owner Trust, Series 2021-4A, Class C, 1.500%, 9/15/2027(a) | |
| DT Auto Owner Trust, Series 2022-3A, Class B, 6.740%, 7/17/2028(a) | |
| DT Auto Owner Trust, Series 2023-2A, Class B, 5.410%, 2/15/2029(a) | |
| Exeter Automobile Receivables Trust, Series 2021-4A, Class B, 1.050%, 5/15/2026 | |
| Exeter Automobile Receivables Trust, Series 2022-5A, Class B, 5.970%, 3/15/2027 | |
| Exeter Automobile Receivables Trust, Series 2023-1A, Class B, 5.720%, 4/15/2027 | |
| Exeter Automobile Receivables Trust, Series 2023-2A, Class B, 5.610%, 9/15/2027 | |
| Exeter Automobile Receivables Trust, Series 2023-3A, Class B, 6.110%, 9/15/2027 | |
| Flagship Credit Auto Trust, Series 2021-2, Class B, 0.930%, 6/15/2027(a) | |
| Flagship Credit Auto Trust, Series 2022-4, Class A3, 6.320%, 6/15/2027(a) | |
| Flagship Credit Auto Trust, Series 2023-1, Class A3, 5.010%, 8/16/2027(a) | |
| Flagship Credit Auto Trust, Series 2023-2, Class C, 5.810%, 5/15/2029(a) | |
| Ford Credit Auto Owner Trust, Series 2018-1, Class A, 3.190%, 7/15/2031(a) | |
| Ford Credit Auto Owner Trust, Series 2021-1, Class A, 1.370%, 10/17/2033(a) | |
| Ford Credit Auto Owner Trust, Series 2023-2, Class A, 5.280%, 2/15/2036(a) | |
| Ford Credit Floorplan Master Owner Trust A, Series 2023-1, Class A1, 4.920%, 5/15/2028(a) | |
| Foursight Capital Automobile Receivables Trust, Series 2022-1, Class A3, 1.830%, 12/15/2026(a) | |
| Foursight Capital Automobile Receivables Trust, Series 2022-2, Class A3, 4.590%, 6/15/2027(a) | |
| GECU Auto Receivables Trust, Series 2023-1A, Class A3, 5.630%, 8/15/2028(a) | |
| GLS Auto Receivables Issuer Trust, Series 2020-4A, Class C, 1.140%, 11/17/2025(a) | |
| GLS Auto Receivables Issuer Trust, Series 2021-4A, Class B, 1.530%, 4/15/2026(a) | |
| GM Financial Automobile Leasing Trust, Series 2023-2, Class A3, 5.050%, 7/20/2026 | |
| GM Financial Consumer Automobile Receivables Trust, Series 2020-2, Class A3, 1.490%, 12/16/2024 | |
| Harley-Davidson Motorcycle Trust, Series 2023-B, Class A3, 5.690%, 8/15/2028 | |
| Harley-Davidson Motorcycle Trust, Series 2023-B, Class A4, 5.780%, 4/15/2031 | |
| Hertz Vehicle Financing III LLC, Series 2023-3A, Class A, 5.940%, 2/25/2028(a) | |
| Hyundai Auto Lease Securitization Trust, Series 2023-B, Class A3, 5.150%, 6/15/2026(a) | |
| Hyundai Auto Receivables Trust, Series 2020-A, Class A3, 1.410%, 11/15/2024 | |
| Mercedes-Benz Auto Receivables Trust, Series 2020-1, Class A3, 0.550%, 2/18/2025 | |
| Navistar Financial Dealer Note Master Owner Trust II, Series 2023-1, Class A, 6.180%, 8/25/2028(a) | |
| Prestige Auto Receivables Trust, Series 2020-1A, Class C, 1.310%, 11/16/2026(a) | |
See accompanying notes to financial statements.
Portfolio of Investments – as of September 30, 2023
Loomis Sayles Intermediate Duration Bond Fund (continued)
| | |
| |
| Prestige Auto Receivables Trust, Series 2021-1A, Class C, 1.530%, 2/15/2028(a) | |
| Prestige Auto Receivables Trust, Series 2023-1A, Class C, 5.650%, 2/15/2028(a) | |
| Santander Consumer Auto Receivables Trust, Series 2020-AA, Class C, 3.710%, 2/17/2026(a) | |
| Santander Drive Auto Receivables Trust, Series 2022-3, Class B, 4.130%, 8/16/2027 | |
| Santander Drive Auto Receivables Trust, Series 2022-4, Class B, 4.420%, 11/15/2027 | |
| Santander Drive Auto Receivables Trust, Series 2022-5, Class B, 4.430%, 3/15/2027 | |
| Santander Drive Auto Receivables Trust, Series 2023-1, Class C, 5.090%, 5/15/2030 | |
| Santander Drive Auto Receivables Trust, Series 2023-2, Class A3, 5.210%, 7/15/2027 | |
| Santander Drive Auto Receivables Trust, Series 2023-3, Class C, 5.770%, 11/15/2030 | |
| Santander Drive Auto Receivables Trust, Series 2023-4, Class B, 5.770%, 12/15/2028 | |
| SFS Auto Receivables Securitization Trust, Series 2023-1A, Class A3, 5.470%, 10/20/2028(a) | |
| Toyota Auto Loan Extended Note Trust, Series 2020-1A, Class A, 1.350%, 5/25/2033(a) | |
| Toyota Auto Receivables Owner Trust, Series 2023-C, Class A3, 5.160%, 4/17/2028 | |
| United Auto Credit Securitization Trust, Series 2022-2, Class C, 5.810%, 5/10/2027(a) | |
| Westlake Automobile Receivables Trust, Series 2021-2A, Class B, 0.620%, 7/15/2026(a) | |
| Westlake Automobile Receivables Trust, Series 2021-3A, Class C, 1.580%, 1/15/2027(a) | |
| Westlake Automobile Receivables Trust, Series 2023-1A, Class C, 5.740%, 8/15/2028(a) | |
| Westlake Automobile Receivables Trust, Series 2023-3A, Class C, 6.020%, 9/15/2028(a) | |
| World Omni Auto Receivables Trust, Series 2020-B, Class A3, 0.630%, 5/15/2025 | |
| World Omni Automobile Lease Securitization Trust, Series 2023-A, Class A3, 5.070%, 9/15/2026 | |
| World Omni Select Auto Trust, Series 2021-A, Class B, 0.850%, 8/16/2027 | |
| | |
| |
| Mercury Financial Credit Card Master Trust, Series 2022-1A, Class A, 2.500%, 9/21/2026(a) | |
| Mission Lane Credit Card Master Trust, Series 2023-A, Class A, 7.230%, 7/17/2028(a) | |
| | |
| |
| Countrywide Asset-Backed Certificates, Series 2004-S1, Class A3, 5.115%, 2/25/2035(b) | |
| |
| Affirm Asset Securitization Trust, Series 2022-A, Class A, 4.300%, 5/17/2027(a) | |
| Affirm Asset Securitization Trust, Series 2023-A, Class A, 6.610%, 1/18/2028(a) | |
| Affirm Asset Securitization Trust, Series 2023-B, Class A, 6.820%, 9/15/2028(a) | |
| Aqua Finance Trust, Series 2021-A, Class A, 1.540%, 7/17/2046(a) | |
| | |
| |
| BHG Securitization Trust, Series 2022-C, Class A, 5.320%, 10/17/2035(a) | |
| Chesapeake Funding II LLC, Series 2020-1A, Class A1, 0.870%, 8/15/2032(a) | |
| Chesapeake Funding II LLC, Series 2023-1A, Class A1, 5.650%, 5/15/2035(a) | |
| CNH Equipment Trust, Series 2020-A, Class A3, 1.160%, 6/16/2025 | |
| Daimler Trucks Retail Trust, Series 2023-1, Class A4, 5.930%, 12/16/2030 | |
| DLLMT LLC, Series 2023-1A, Class A3, 5.340%, 3/22/2027(a) | |
| Donlen Fleet Lease Funding 2 LLC, Series 2021-2, Class A2, 0.560%, 12/11/2034(a) | |
| Enterprise Fleet Financing LLC, Series 2022-3, Class A2, 4.380%, 7/20/2029(a) | |
| Enterprise Fleet Financing LLC, Series 2023-2, Class A2, 5.560%, 4/22/2030(a) | |
| Frontier Issuer LLC, Series 2023-1, Class A2, 6.600%, 8/20/2053(a) | |
| Hilton Grand Vacations Trust, Series 2022-2A, Class C, 5.570%, 1/25/2037(a) | |
| M&T Equipment Notes, Series 2023-1A, Class A3, 5.740%, 7/15/2030(a) | |
| Marlette Funding Trust, Series 2022-3A, Class A, 5.180%, 11/15/2032(a) | |
| MVW LLC, Series 2020-1A, Class A, 1.740%, 10/20/2037(a) | |
| OneMain Financial Issuance Trust, Series 2022-S1, Class A, 4.130%, 5/14/2035(a) | |
| SCF Equipment Leasing LLC, Series 2022-1A, Class A3, 2.920%, 7/20/2029(a) | |
| Sierra Timeshare Receivables Funding LLC, Series 2020-2A, Class A, 1.330%, 7/20/2037(a) | |
| Wheels Fleet Lease Funding 1 LLC, Series 2023-1A, Class A, 5.800%, 4/18/2038(a) | |
| | |
| |
| Massachusetts Educational Financing Authority, Series 2018-A, Class A, 3.850%, 5/25/2033 | |
| Navient Private Education Refi Loan Trust, Series 2020-GA, Class A, 1.170%, 9/16/2069(a) | |
| Navient Private Education Refi Loan Trust, Series 2020-HA, Class A, 1.310%, 1/15/2069(a) | |
| | |
| ABS Whole Business — 0.1% |
| Planet Fitness Master Issuer LLC, Series 2018-1A, Class A2II, 4.666%, 9/05/2048(a) | |
| Agency Commercial Mortgage-Backed Securities — 0.5% |
| Federal Home Loan Mortgage Corp. Multifamily Structured Pass-Through Certificates, Series K042, Class A2, 2.670%, 12/25/2024 | |
| Federal Home Loan Mortgage Corp. Multifamily Structured Pass-Through Certificates, Series KJ26, Class A2, 2.606%, 7/25/2027 | |
| | |
| |
| Invitation Homes Operating Partnership LP, 2.000%, 8/15/2031 | |
See accompanying notes to financial statements.
Portfolio of Investments – as of September 30, 2023
Loomis Sayles Intermediate Duration Bond Fund (continued)
| | |
| |
| American Honda Finance Corp., GMTN, 5.125%, 7/07/2028 | |
| BMW U.S. Capital LLC, 5.150%, 8/11/2033(a) | |
| Daimler Truck Finance North America LLC, 5.200%, 1/17/2025(a) | |
| Daimler Truck Finance North America LLC, 5.400%, 9/20/2028(a) | |
| Denso Corp., 1.239%, 9/16/2026(a) | |
| General Motors Financial Co., Inc., 6.050%, 10/10/2025 | |
| Harley-Davidson Financial Services, Inc., 3.350%, 6/08/2025(a) | |
| Harley-Davidson Financial Services, Inc., 6.500%, 3/10/2028(a) | |
| Hyundai Capital America, 2.100%, 9/15/2028(a) | |
| Hyundai Capital America, 5.700%, 6/26/2030(a) | |
| Hyundai Capital America, 5.950%, 9/21/2026(a) | |
| Kia Corp., 1.000%, 4/16/2024(a) | |
| LKQ Corp., 5.750%, 6/15/2028(a) | |
| Mercedes-Benz Finance North America LLC, 4.800%, 3/30/2028(a) | |
| Mercedes-Benz Finance North America LLC, 5.100%, 8/03/2028(a) | |
| Nissan Motor Acceptance Co. LLC, 7.050%, 9/15/2028(a) | |
| PACCAR Financial Corp., MTN, 4.950%, 8/10/2028 | |
| Toyota Motor Credit Corp., 4.550%, 5/17/2030 | |
| Toyota Motor Credit Corp., MTN, 5.000%, 8/14/2026 | |
| Toyota Motor Credit Corp., MTN, 5.250%, 9/11/2028 | |
| Volkswagen Group of America Finance LLC, 3.350%, 5/13/2025(a) | |
| Volkswagen Group of America Finance LLC, 4.250%, 11/13/2023(a) | |
| | |
| |
| ABN AMRO Bank NV, (fixed rate to 9/18/2026, variable rate thereafter), 6.339%, 9/18/2027(a) | |
| AIB Group PLC, (fixed rate to 9/13/2028, variable rate thereafter), 6.608%, 9/13/2029(a) | |
| AIB Group PLC, (fixed rate to 10/14/2025, variable rate thereafter), 7.583%, 10/14/2026(a) | |
| Ally Financial, Inc., 7.100%, 11/15/2027 | |
| American Express Co., (fixed rate to 5/01/2033, variable rate thereafter), 5.043%, 5/01/2034 | |
| American Express Co., (fixed rate to 7/27/2028, variable rate thereafter), 5.282%, 7/27/2029 | |
| ANZ New Zealand International Ltd., 5.355%, 8/14/2028(a) | |
| ASB Bank Ltd., (fixed rate to 6/17/2027, variable rate thereafter), 5.284%, 6/17/2032(a) | |
| Bank of America Corp., MTN, (fixed rate to 4/02/2025, variable rate thereafter), 3.384%, 4/02/2026 | |
| Bank of America Corp., (fixed rate to 4/25/2033, variable rate thereafter), 5.288%, 4/25/2034 | |
| Bank of America NA, 5.526%, 8/18/2026 | |
| Bank of Ireland Group PLC, 4.500%, 11/25/2023(a) | |
| Bank of Ireland Group PLC, (fixed rate to 9/16/2025, variable rate thereafter), 6.253%, 9/16/2026(a) | |
| Bank of Montreal, 5.300%, 6/05/2026 | |
| Bank of Montreal, 5.717%, 9/25/2028 | |
| | |
| |
| Bank of New York Mellon Corp., (fixed rate to 4/26/2026, variable rate thereafter), 4.947%, 4/26/2027 | |
| Bank of New Zealand, 2.000%, 2/21/2025(a) | |
| Bank of New Zealand, 2.285%, 1/27/2027(a) | |
| Banque Federative du Credit Mutuel SA, 5.790%, 7/13/2028(a) | |
| BNP Paribas SA, (fixed rate to 6/12/2028, variable rate thereafter), 5.335%, 6/12/2029(a) | |
| CaixaBank SA, (fixed rate to 9/13/2033, variable rate thereafter), 6.840%, 9/13/2034(a) | |
| Canadian Imperial Bank of Commerce, 5.001%, 4/28/2028 | |
| Canadian Imperial Bank of Commerce, 6.092%, 10/03/2033 | |
| Capital One Financial Corp., (fixed rate to 12/06/2023, variable rate thereafter), 1.343%, 12/06/2024 | |
| Capital One Financial Corp., (fixed rate to 6/08/2028, variable rate thereafter), 6.312%, 6/08/2029 | |
| Citibank NA, 5.803%, 9/29/2028 | |
| Citigroup, Inc., (fixed rate to 4/08/2025, variable rate thereafter), 3.106%, 4/08/2026 | |
| Citigroup, Inc., (fixed rate to 5/25/2033, variable rate thereafter), 6.174%, 5/25/2034 | |
| Citizens Financial Group, Inc., (fixed rate to 5/21/2032, variable rate thereafter), 5.641%, 5/21/2037 | |
| Cooperatieve Rabobank UA, (fixed rate to 2/28/2028, variable rate thereafter), 5.564%, 2/28/2029(a) | |
| Credit Agricole SA, (fixed rate to 10/03/2028, variable rate thereafter), 6.316%, 10/03/2029(a) | |
| Credit Suisse AG, 5.000%, 7/09/2027 | |
| Danske Bank AS, (fixed rate to 9/10/2024, variable rate thereafter), 0.976%, 9/10/2025(a) | |
| Danske Bank AS, (fixed rate to 9/22/2025, variable rate thereafter), 6.259%, 9/22/2026(a) | |
| Deutsche Bank AG, (fixed rate to 11/10/2032, variable rate thereafter), 7.079%, 2/10/2034 | |
| Deutsche Bank AG, (fixed rate to 7/13/2026, variable rate thereafter), 7.146%, 7/13/2027 | |
| DNB Bank ASA, (fixed rate to 9/16/2025, variable rate thereafter), 1.127%, 9/16/2026(a) | |
| Federation des Caisses Desjardins du Quebec, 5.700%, 3/14/2028(a) | |
| Fifth Third Bancorp, (fixed rate to 7/27/2028, variable rate thereafter), 6.339%, 7/27/2029 | |
| Goldman Sachs Group, Inc., (fixed rate to 8/10/2025, variable rate thereafter), 5.798%, 8/10/2026 | |
| HSBC Holdings PLC, (fixed rate to 8/14/2026, variable rate thereafter), 5.887%, 8/14/2027 | |
| HSBC USA, Inc., 3.750%, 5/24/2024 | |
| HSBC USA, Inc., 5.625%, 3/17/2025 | |
| Huntington Bancshares, Inc., (fixed rate to 8/21/2028, variable rate thereafter), 6.208%, 8/21/2029 | |
| Huntington National Bank, 5.650%, 1/10/2030 | |
| ING Groep NV, (fixed rate to 9/11/2033, variable rate thereafter), 6.114%, 9/11/2034 | |
| Intesa Sanpaolo SpA, 7.000%, 11/21/2025(a) | |
See accompanying notes to financial statements.
Portfolio of Investments – as of September 30, 2023
Loomis Sayles Intermediate Duration Bond Fund (continued)
| | |
| |
| JPMorgan Chase & Co., (fixed rate to 6/01/2028, variable rate thereafter), 2.069%, 6/01/2029 | |
| JPMorgan Chase & Co., (fixed rate to 6/01/2033, variable rate thereafter), 5.350%, 6/01/2034 | |
| JPMorgan Chase & Co., (fixed rate to 12/15/2024, variable rate thereafter), 5.546%, 12/15/2025 | |
| KeyBank NA, 5.850%, 11/15/2027 | |
| Lloyds Banking Group PLC, (fixed rate to 8/07/2026, variable rate thereafter), 5.985%, 8/07/2027 | |
| Macquarie Group Ltd., (fixed rate to 6/15/2033, variable rate thereafter), 5.887%, 6/15/2034(a) | |
| Morgan Stanley, (fixed rate to 7/20/2028, variable rate thereafter), 5.449%, 7/20/2029 | |
| National Australia Bank Ltd., 4.900%, 6/13/2028 | |
| National Bank of Canada, (fixed rate to 6/09/2024, variable rate thereafter), 3.750%, 6/09/2025 | |
| NatWest Markets PLC, 1.600%, 9/29/2026(a) | |
| Nordea Bank Abp, 1.500%, 9/30/2026(a) | |
| Northern Trust Corp., (fixed rate to 5/08/2027, variable rate thereafter), 3.375%, 5/08/2032 | |
| PNC Financial Services Group, Inc., (fixed rate to 6/12/2028, variable rate thereafter), 5.582%, 6/12/2029 | |
| Royal Bank of Canada, GMTN, 5.200%, 8/01/2028 | |
| Santander Holdings USA, Inc., (fixed rate to 6/12/2028, variable rate thereafter), 6.565%, 6/12/2029 | |
| State Street Corp., 5.272%, 8/03/2026 | |
| Sumitomo Mitsui Financial Group, Inc., 5.800%, 7/13/2028 | |
| Sumitomo Mitsui Trust Bank Ltd., 2.550%, 3/10/2025(a) | |
| Svenska Handelsbanken AB, 5.500%, 6/15/2028(a) | |
| Swedbank AB, 5.472%, 6/15/2026(a) | |
| Swedbank AB, 6.136%, 9/12/2026(a) | |
| Synchrony Bank, 5.400%, 8/22/2025 | |
| Synchrony Financial, 4.875%, 6/13/2025 | |
| Toronto-Dominion Bank, MTN, 5.523%, 7/17/2028 | |
| Truist Financial Corp., MTN, (fixed rate to 1/26/2033, variable rate thereafter), 5.122%, 1/26/2034 | |
| UBS AG, 5.650%, 9/11/2028 | |
| UBS Group AG, (fixed rate to 9/22/2033, variable rate thereafter), 6.301%, 9/22/2034(a) | |
| UniCredit SpA, (fixed rate to 9/22/2025, variable rate thereafter), 2.569%, 9/22/2026(a) | |
| Wells Fargo & Co., MTN, (fixed rate to 4/25/2025, variable rate thereafter), 3.908%, 4/25/2026 | |
| Wells Fargo & Co., MTN, (fixed rate to 7/25/2028, variable rate thereafter), 5.574%, 7/25/2029 | |
| | |
| |
| Ameriprise Financial, Inc., 5.150%, 5/15/2033 | |
| Blue Owl Finance LLC, 4.375%, 2/15/2032(a) | |
| Jefferies Financial Group, Inc., 5.875%, 7/21/2028 | |
| | |
| Building Materials — 0.1% |
| Ferguson Finance PLC, 4.650%, 4/20/2032(a) | |
| Mohawk Industries, Inc., 5.850%, 9/18/2028 | |
| | |
| | |
| |
| Cabot Corp., 4.000%, 7/01/2029 | |
| Celanese U.S. Holdings LLC, 6.700%, 11/15/2033 | |
| EIDP, Inc., 4.500%, 5/15/2026 | |
| FMC Corp., 5.650%, 5/18/2033 | |
| | |
| Collateralized Mortgage Obligations — 0.6% |
| Government National Mortgage Association, Series 2014-H14, Class FA, 1 mo. USD SOFR + 0.614%, 5.718%, 7/20/2064(c) | |
| Government National Mortgage Association, Series 2014-H15, Class FA, 1 mo. USD SOFR + 0.614%, 5.932%, 7/20/2064(c) | |
| Government National Mortgage Association, Series 2015-H09, Class HA, 1.750%, 3/20/2065(d) | |
| Government National Mortgage Association, Series 2015-H10, Class JA, 2.250%, 4/20/2065 | |
| Government National Mortgage Association, Series 2016-H06, Class FC, 1 mo. USD SOFR + 1.034%, 4.853%, 2/20/2066(c) | |
| Government National Mortgage Association, Series 2018-H17, Class JA, 3.750%, 9/20/2068(b) | |
| Government National Mortgage Association, Series 2019-H01, Class FL, 1 mo. USD SOFR + 0.564%, 5.882%, 12/20/2068(c) | |
| Government National Mortgage Association, Series 2019-H01, Class FT, 1 mo. USD SOFR + 0.514%, 5.832%, 10/20/2068(c) | |
| Government National Mortgage Association, Series 2019-H10, Class FM, 1 mo. USD SOFR + 0.514%, 5.832%, 5/20/2069(c) | |
| | |
| Construction Machinery — 0.9% |
| Caterpillar Financial Services Corp., DMTN, 4.350%, 5/15/2026 | |
| Caterpillar Financial Services Corp., 5.150%, 8/11/2025 | |
| CNH Industrial Capital LLC, 5.500%, 1/12/2029 | |
| John Deere Capital Corp., MTN, 4.950%, 7/14/2028 | |
| | |
| Consumer Cyclical Services — 0.0% |
| Expedia Group, Inc., 6.250%, 5/01/2025(a) | |
| |
| Brunswick Corp., 4.400%, 9/15/2032 | |
| Unilever Capital Corp., 5.000%, 12/08/2033 | |
| Whirlpool Corp., 5.500%, 3/01/2033 | |
| | |
| |
| AES Corp., 3.300%, 7/15/2025(a) | |
| American Electric Power Co., Inc., 5.699%, 8/15/2025 | |
| Consolidated Edison Co. of New York, Inc., Series B, 2.900%, 12/01/2026 | |
| DTE Energy Co., 4.220%, 11/01/2024 | |
| Edison International, 4.700%, 8/15/2025 | |
| Entergy Corp., 0.900%, 9/15/2025 | |
| Interstate Power & Light Co., 5.700%, 10/15/2033 | |
| National Rural Utilities Cooperative Finance Corp., MTN, 5.050%, 9/15/2028 | |
See accompanying notes to financial statements.
Portfolio of Investments – as of September 30, 2023
Loomis Sayles Intermediate Duration Bond Fund (continued)
| | |
| |
| National Rural Utilities Cooperative Finance Corp., (fixed rate to 5/01/2023, variable rate thereafter), 8.541%, 4/30/2043(c) | |
| NextEra Energy Capital Holdings, Inc., 5.749%, 9/01/2025 | |
| NextEra Energy Capital Holdings, Inc., 6.051%, 3/01/2025 | |
| Southern California Edison Co., 5.650%, 10/01/2028 | |
| Vistra Operations Co. LLC, 5.125%, 5/13/2025(a) | |
| WEC Energy Group, Inc., 4.750%, 1/09/2026 | |
| Xcel Energy, Inc., 5.450%, 8/15/2033 | |
| | |
| |
| AerCap Ireland Capital DAC/AerCap Global Aviation Trust, 3.150%, 2/15/2024 | |
| Air Lease Corp., 1.875%, 8/15/2026 | |
| Aircastle Ltd., 2.850%, 1/26/2028(a) | |
| Aircastle Ltd., 6.500%, 7/18/2028(a) | |
| Ares Capital Corp., 2.875%, 6/15/2028 | |
| Ares Capital Corp., 4.250%, 3/01/2025 | |
| Aviation Capital Group LLC, 4.375%, 1/30/2024(a) | |
| Bain Capital Specialty Finance, Inc., 2.550%, 10/13/2026 | |
| Barings BDC, Inc., 3.300%, 11/23/2026 | |
| Blackstone Private Credit Fund, 2.625%, 12/15/2026 | |
| Blackstone Secured Lending Fund, 2.850%, 9/30/2028 | |
| Blue Owl Capital Corp., 3.750%, 7/22/2025 | |
| Blue Owl Capital Corp., 4.250%, 1/15/2026 | |
| Blue Owl Credit Income Corp., 7.750%, 9/16/2027 | |
| Blue Owl Credit Income Corp., 7.950%, 6/13/2028(a) | |
| Blue Owl Technology Finance Corp., 4.750%, 12/15/2025(a) | |
| FS KKR Capital Corp., 3.125%, 10/12/2028 | |
| Golub Capital BDC, Inc., 2.500%, 8/24/2026 | |
| Hercules Capital, Inc., 3.375%, 1/20/2027 | |
| Main Street Capital Corp., 3.000%, 7/14/2026 | |
| Morgan Stanley Direct Lending Fund, 4.500%, 2/11/2027 | |
| Sixth Street Specialty Lending, Inc., 6.950%, 8/14/2028 | |
| USAA Capital Corp., 3.375%, 5/01/2025(a) | |
| | |
| |
| LeasePlan Corp. NV, 2.875%, 10/24/2024(a) | |
| ORIX Corp., 3.250%, 12/04/2024 | |
| | |
| |
| Cargill, Inc., 4.500%, 6/24/2026(a) | |
| Conagra Brands, Inc., 5.300%, 10/01/2026 | |
| JBS USA LUX SA/JBS USA Food Co./JBS Luxembourg Sarl, 6.750%, 3/15/2034(a) | |
| Pernod Ricard International Finance LLC, 1.250%, 4/01/2028(a) | |
| | |
| Government Owned - No Guarantee — 0.3% |
| Antares Holdings LP, 3.750%, 7/15/2027(a) | |
| BOC Aviation USA Corp., 1.625%, 4/29/2024(a) | |
| | |
| | |
| |
| Healthpeak OP LLC, 5.250%, 12/15/2032 | |
| Omega Healthcare Investors, Inc., 4.500%, 1/15/2025 | |
| | |
| |
| GE HealthCare Technologies, Inc., 5.550%, 11/15/2024 | |
| IQVIA, Inc., 5.700%, 5/15/2028(a) | |
| Thermo Fisher Scientific, Inc., 4.977%, 8/10/2030 | |
| | |
| |
| Federal Home Loan Mortgage Corp., 1 yr. CMT + 2.225%, 5.216%, 1/01/2035(c) | |
| Federal Home Loan Mortgage Corp., 1 yr. CMT + 2.500%, 5.280%, 5/01/2036(c) | |
| | |
| Independent Energy — 0.2% |
| ConocoPhillips Co., 5.050%, 9/15/2033 | |
| Pioneer Natural Resources Co., 5.100%, 3/29/2026 | |
| | |
| |
| Allianz SE, (fixed rate to 3/06/2033, variable rate thereafter), 6.350%, 9/06/2053(a) | |
| Athene Global Funding, 2.500%, 3/24/2028(a) | |
| Brighthouse Financial Global Funding, 1.200%, 12/15/2023(a) | |
| Brighthouse Financial Global Funding, 1.750%, 1/13/2025(a) | |
| CNO Global Funding, 2.650%, 1/06/2029(a) | |
| Corebridge Financial, Inc., 6.050%, 9/15/2033(a) | |
| Corebridge Global Funding, 0.900%, 9/22/2025(a) | |
| Corebridge Global Funding, 5.750%, 7/02/2026(a) | |
| Equitable Financial Life Global Funding, 5.500%, 12/02/2025(a) | |
| F&G Annuities & Life, Inc., 7.400%, 1/13/2028 | |
| F&G Global Funding, 5.150%, 7/07/2025(a) | |
| Five Corners Funding Trust III, 5.791%, 2/15/2033(a) | |
| GA Global Funding Trust, 1.250%, 12/08/2023(a) | |
| GA Global Funding Trust, 2.250%, 1/06/2027(a) | |
| Great-West Lifeco U.S. Finance 2020 LP, 0.904%, 8/12/2025(a) | |
| Guardian Life Global Funding, 1.100%, 6/23/2025(a) | |
| Jackson National Life Global Funding, 1.750%, 1/12/2025(a) | |
| Jackson National Life Global Funding, 3.875%, 6/11/2025(a) | |
| Lincoln National Corp., 3.400%, 3/01/2032 | |
| MassMutual Global Funding II, 5.050%, 6/14/2028(a) | |
| MetLife, Inc., 5.375%, 7/15/2033 | |
| Metropolitan Life Global Funding I, 0.950%, 7/02/2025(a) | |
| New York Life Global Funding, 4.700%, 4/02/2026(a) | |
| New York Life Global Funding, 5.450%, 9/18/2026(a) | |
| Northwestern Mutual Global Funding, 4.900%, 6/12/2028(a) | |
| Protective Life Global Funding, 1.646%, 1/13/2025(a) | |
| Protective Life Global Funding, 4.714%, 7/06/2027(a) | |
| Reliance Standard Life Global Funding II, 2.750%, 5/07/2025(a) | |
See accompanying notes to financial statements.
Portfolio of Investments – as of September 30, 2023
Loomis Sayles Intermediate Duration Bond Fund (continued)
| | |
| Life Insurance — continued |
| Reliance Standard Life Global Funding II, 5.243%, 2/02/2026(a) | |
| RGA Global Funding, 2.700%, 1/18/2029(a) | |
| Security Benefit Global Funding, 1.250%, 5/17/2024(a) | |
| | |
| |
| Hyatt Hotels Corp., 5.750%, 1/30/2027 | |
| Marriott International, Inc., 5.550%, 10/15/2028 | |
| Marriott International, Inc., Series Z, 4.150%, 12/01/2023 | |
| | |
| Media Entertainment — 0.4% |
| Prosus NV, 4.193%, 1/19/2032(a) | |
| Take-Two Interactive Software, Inc., 4.950%, 3/28/2028 | |
| | |
| |
| BHP Billiton Finance USA Ltd., 4.875%, 2/27/2026 | |
| Glencore Funding LLC, 6.375%, 10/06/2030(a) | |
| Northern Star Resources Ltd., 6.125%, 4/11/2033(a) | |
| | |
| |
| Enbridge, Inc., 5.700%, 3/08/2033 | |
| ONEOK, Inc., 5.550%, 11/01/2026 | |
| Williams Cos., Inc., 5.400%, 3/02/2026 | |
| | |
| |
| Federal Home Loan Mortgage Corp., 3.000%, 10/01/2026 | |
| Federal Home Loan Mortgage Corp., 6.500%, 1/01/2024 | |
| Federal Home Loan Mortgage Corp., 8.000%, 7/01/2025 | |
| Government National Mortgage Association, 3.890%, with various maturities in 2062(b)(e) | |
| Government National Mortgage Association, 4.015%, 4/20/2063(b) | |
| Government National Mortgage Association, 4.157%, 6/20/2066(b) | |
| Government National Mortgage Association, 4.256%, 11/20/2066(b) | |
| Government National Mortgage Association, 4.389%, 9/20/2066(b) | |
| Government National Mortgage Association, 4.410%, 10/20/2066(b) | |
| Government National Mortgage Association, 4.426%, 10/20/2066(b) | |
| Government National Mortgage Association, 4.453%, 11/20/2066(b) | |
| Government National Mortgage Association, 4.466%, 11/20/2064(b) | |
| Government National Mortgage Association, 4.471%, 8/20/2066(b) | |
| Government National Mortgage Association, 4.496%, 9/20/2066(b) | |
| Government National Mortgage Association, 4.585%, 7/20/2067(b) | |
| | |
| Mortgage Related — continued |
| Government National Mortgage Association, 4.586%, 10/20/2066(b) | |
| Government National Mortgage Association, 4.639%, 4/20/2067(b) | |
| Government National Mortgage Association, 4.670%, 1/20/2067(b) | |
| Government National Mortgage Association, 4.700%, with various maturities from 2061 to 2064(b)(e) | |
| Government National Mortgage Association, 6.500%, 12/15/2023 | |
| | |
| |
| Sempra, 5.400%, 8/01/2026 | |
| Southern Co. Gas Capital Corp., 5.750%, 9/15/2033 | |
| | |
| Non-Agency Commercial Mortgage-Backed Securities — 5.4% |
| BANK, Series 2019-BN24, Class A3, 2.960%, 11/15/2062 | |
| BANK, Series 2020-BN25, Class A5, 2.649%, 1/15/2063 | |
| BANK, Series 2021-BN37, Class A5, 2.618%, 11/15/2064(b) | |
| BANK, Series 2023-5YR3, Class A3, 6.724%, 9/15/2056(b) | |
| BBCMS Mortgage Trust, Series 2020-BID, Class A, 1 mo. USD SOFR + 2.254%, 7.588%, 10/15/2037(a)(c) | |
| BBCMS Mortgage Trust, Series 2021-C12, Class A5, 2.689%, 11/15/2054 | |
| BBCMS Mortgage Trust, Series 2023-C20, Class A5, 5.576%, 7/15/2056 | |
| BB-UBS Trust, Series 2012-TFT, Class A, 2.892%, 6/05/2030(a) | |
| Benchmark Mortgage Trust, Series 2020-B16, Class A5, 2.732%, 2/15/2053 | |
| Benchmark Mortgage Trust, Series 2021-B31, Class A5, 2.669%, 12/15/2054 | |
| Benchmark Mortgage Trust, Series 2023-V2, Class A3, 5.812%, 5/15/2055(b) | |
| BPR Trust, Series 2021-NRD, Class A, 1 mo. USD SOFR + 1.525%, 6.858%, 12/15/2038(a)(c) | |
| BPR Trust, Series 2022-OANA, Class A, 1 mo. USD SOFR + 1.898%, 7.230%, 4/15/2037(a)(c) | |
| CFCRE Commercial Mortgage Trust, Series 2016-C3, Class A3, 3.865%, 1/10/2048 | |
| CFCRE Commercial Mortgage Trust, Series 2016-C4, Class A4, 3.283%, 5/10/2058 | |
| Citigroup Commercial Mortgage Trust, Series 2016-GC37, Class A4, 3.314%, 4/10/2049 | |
| Citigroup Commercial Mortgage Trust, Series 2019-C7, Class A4, 3.102%, 12/15/2072 | |
| Commercial Mortgage Pass-Through Certificates, Series 2012-LTRT, Class A2, 3.400%, 10/05/2030(a) | |
| Commercial Mortgage Pass-Through Certificates, Series 2014-CR16, Class ASB, 3.653%, 4/10/2047 | |
| Commercial Mortgage Pass-Through Certificates, Series 2014-UBS3, Class A4, 3.819%, 6/10/2047 | |
| Commercial Mortgage Pass-Through Certificates, Series 2015-DC1, Class A5, 3.350%, 2/10/2048 | |
| Commercial Mortgage Pass-Through Certificates, Series 2016-DC2, Class A5, 3.765%, 2/10/2049 | |
See accompanying notes to financial statements.
Portfolio of Investments – as of September 30, 2023
Loomis Sayles Intermediate Duration Bond Fund (continued)
| | |
| Non-Agency Commercial Mortgage-Backed Securities — continued |
| Credit Suisse Mortgage Trust, Series 2014-USA, Class A2, 3.953%, 9/15/2037(a) | |
| CSAIL Commercial Mortgage Trust, Series 2015-C4, Class ASB, 3.617%, 11/15/2048 | |
| CSAIL Commercial Mortgage Trust, Series 2019-C18, Class A4, 2.968%, 12/15/2052 | |
| DC Commercial Mortgage Trust, Series 2023-DC, Class A, 6.314%, 9/12/2040(a) | |
| GS Mortgage Securities Corp. II, Series 2023- SHIP, Class A, 4.466%, 9/10/2038(a)(b) | |
| GS Mortgage Securities Corp. Trust, Series 2012-BWTR, Class A, 2.954%, 11/05/2034(a) | |
| GS Mortgage Securities Corportation Trust, Series 2013-PEMB, Class A, 3.668%, 3/05/2033(a)(b) | |
| GS Mortgage Securities Trust, Series 2014-GC18, Class A4, 4.074%, 1/10/2047 | |
| GS Mortgage Securities Trust, Series 2020-GC45, Class A5, 2.911%, 2/13/2053 | |
| Hudsons Bay Simon JV Trust, Series 2015-HB10, Class A10, 4.155%, 8/05/2034(a) | |
| Hudsons Bay Simon JV Trust, Series 2015-HB7, Class A7, 3.914%, 8/05/2034(a) | |
| JPMBB Commercial Mortgage Securities Trust, Series 2014-C19, Class ASB, 3.584%, 4/15/2047 | |
| JPMCC Commercial Mortgage Securities Trust, Series 2019-COR5, Class A4, 3.386%, 6/13/2052 | |
| Med Trust, Series 2021-MDLN, Class A, 1 mo. USD SOFR + 1.064%, 6.397%, 11/15/2038(a)(c) | |
| Morgan Stanley Bank of America Merrill Lynch Trust, Series 2015-C22, Class A4, 3.306%, 4/15/2048 | |
| Morgan Stanley Capital I Trust, Series 2020-L4, Class A3, 2.698%, 2/15/2053 | |
| New Economy Assets Phase 1 Sponsor LLC, Series 2021-1, Class A1, 1.910%, 10/20/2061(a) | |
| SCOTT Trust, Series 2023-SFS, Class A, 5.910%, 3/15/2040(a) | |
| SPGN Mortgage Trust, Series 2022-TFLM, Class A, 1 mo. USD SOFR + 1.550%, 6.882%, 2/15/2039(a)(c) | |
| Wells Fargo Commercial Mortgage Trust, Series 2016-C33, Class A4, 3.426%, 3/15/2059 | |
| Wells Fargo Commercial Mortgage Trust, Series 2020-C58, Class A4, 2.092%, 7/15/2053 | |
| Wells Fargo Commercial Mortgage Trust, Series 2022-C62, Class A4, 4.000%, 4/15/2055(b) | |
| WFRBS Commercial Mortgage Trust, Series 2014-C19, Class A5, 4.101%, 3/15/2047 | |
| WFRBS Commercial Mortgage Trust, Series 2014-C20, Class ASB, 3.638%, 5/15/2047 | |
| | |
| |
| Hudson Pacific Properties LP, 5.950%, 2/15/2028 | |
| |
| Prologis LP, 5.125%, 1/15/2034 | |
| |
| Amcor Flexibles North America, Inc., 4.000%, 5/17/2025 | |
| | |
| Property & Casualty Insurance — 0.1% |
| Assured Guaranty U.S. Holdings, Inc., 6.125%, 9/15/2028 | |
| Trustage Financial Group, Inc., 4.625%, 4/15/2032(a) | |
| | |
| |
| CSX Corp., 5.200%, 11/15/2033 | |
| Norfolk Southern Corp., 5.050%, 8/01/2030 | |
| Union Pacific Corp., 3.646%, 2/15/2024 | |
| | |
| |
| Phillips 66 Co., 4.950%, 12/01/2027 | |
| |
| AutoNation, Inc., 3.500%, 11/15/2024 | |
| AutoNation, Inc., 4.500%, 10/01/2025 | |
| AutoZone, Inc., 5.050%, 7/15/2026 | |
| Dollar General Corp., 5.450%, 7/05/2033 | |
| Walgreens Boots Alliance, Inc., 0.950%, 11/17/2023 | |
| | |
| |
| Panama Government International Bonds, 6.875%, 1/31/2036 | |
| |
| Avnet, Inc., 5.500%, 6/01/2032 | |
| Avnet, Inc., 6.250%, 3/15/2028 | |
| Broadcom, Inc., 4.000%, 4/15/2029(a) | |
| CDW LLC/CDW Finance Corp., 3.276%, 12/01/2028 | |
| Equifax, Inc., 5.100%, 6/01/2028 | |
| Fiserv, Inc., 5.625%, 8/21/2033 | |
| Flex Ltd., 6.000%, 1/15/2028 | |
| Global Payments, Inc., 1.500%, 11/15/2024 | |
| Hewlett Packard Enterprise Co., 5.250%, 7/01/2028 | |
| Intel Corp., 5.200%, 2/10/2033 | |
| Intuit, Inc., 5.200%, 9/15/2033 | |
| Microchip Technology, Inc., 0.972%, 2/15/2024 | |
| Micron Technology, Inc., 6.750%, 11/01/2029 | |
| Qorvo, Inc., 1.750%, 12/15/2024(a) | |
| S&P Global, Inc., 5.250%, 9/15/2033(a) | |
| | |
| |
| Altria Group, Inc., 2.450%, 2/04/2032 | |
| BAT Capital Corp., 6.343%, 8/02/2030 | |
| Philip Morris International, Inc., 5.125%, 2/15/2030 | |
| Philip Morris International, Inc., 5.500%, 9/07/2030 | |
| | |
| Transportation Services — 0.5% |
| Element Fleet Management Corp., 3.850%, 6/15/2025(a) | |
| Element Fleet Management Corp., 6.271%, 6/26/2026(a) | |
| Penske Truck Leasing Co. LP/PTL Finance Corp., 4.000%, 7/15/2025(a) | |
| Penske Truck Leasing Co. LP/PTL Finance Corp., 5.550%, 5/01/2028(a) | |
| Penske Truck Leasing Co. LP/PTL Finance Corp., 6.050%, 8/01/2028(a) | |
| | |
| |
| U.S. Treasury Notes, 2.750%, 7/31/2027 | |
See accompanying notes to financial statements.
Portfolio of Investments – as of September 30, 2023
Loomis Sayles Intermediate Duration Bond Fund (continued)
| | |
| |
| U.S. Treasury Notes, 3.250%, 6/30/2027 | |
| U.S. Treasury Notes, 3.500%, 4/30/2028 | |
| U.S. Treasury Notes, 3.625%, 3/31/2028 | |
| U.S. Treasury Notes, 3.625%, 5/31/2028 | |
| U.S. Treasury Notes, 3.875%, 4/30/2025 | |
| U.S. Treasury Notes, 3.875%, 11/30/2027 | |
| U.S. Treasury Notes, 3.875%, 12/31/2027 | |
| U.S. Treasury Notes, 3.875%, 8/15/2033 | |
| U.S. Treasury Notes, 4.000%, 2/29/2028 | |
| U.S. Treasury Notes, 4.125%, 7/31/2028 | |
| U.S. Treasury Notes, 4.625%, 6/30/2025 | |
| U.S. Treasury Notes, 4.750%, 7/31/2025 | |
| | |
| |
| American Tower Corp., 5.250%, 7/15/2028 | |
| |
| AT&T, Inc., 5.400%, 2/15/2034 | |
| Bell Telephone Co. of Canada or Bell Canada, 5.100%, 5/11/2033 | |
| | |
| Total Bonds and Notes
(Identified Cost $351,538,288) | |
|
|
Short-Term Investments — 2.4% |
| Tri-Party Repurchase Agreement with Fixed Income Clearing Corporation, dated 9/29/2023 at 2.500% to be repurchased at $8,428,769 on 10/02/2023 collateralized by $9,653,200 U.S. Treasury Note, 0.750% due 8/31/2026 valued at $8,595,608 including accrued interest (Note 2 of Notes to Financial Statements)
(Identified Cost $8,427,014) | |
| Total Investments — 100.1%
(Identified Cost $359,965,302) | |
| Other assets less liabilities — (0.1)% | |
| | |
| See Note 2 of Notes to Financial Statements. |
| All or a portion of these securities are exempt from registration under Rule 144A of the Securities Act of 1933. These securities may be resold in transactions exempt from registration, normally to qualified institutional buyers. At September 30, 2023, the value of Rule 144A holdings amounted to $88,139,011 or 25.5% of net assets. |
| Variable rate security. The interest rate adjusts periodically based on; (i) changes in current interest rates and/or prepayments on underlying pools of assets, if applicable, (ii) reference to a base lending rate plus or minus a margin, and/or (iii) reference to a base lending rate adjusted by a multiplier and/or subject to certain floors or caps. Rate as of September 30, 2023 is disclosed. |
| Variable rate security. Rate as of September 30, 2023 is disclosed. |
| Level 3 security. Value has been determined using significant unobservable inputs. See Note 3 of Notes to Financial Statements. |
| The Fund’s investment in mortgage related securities of Government National Mortgage Association are interests in separate pools of mortgages. All separate investments in securities of each issuer which have the same coupon rate have been aggregated for the purpose of presentation in the Portfolio of Investments. |
| |
| Adjustable Rate Mortgages |
| Constant Maturity Treasury |
| |
| |
| Real Estate Investment Trusts |
| Secured Overnight Financing Rate |
At September 30, 2023, open long futures contracts were as follows:
| | | | | Unrealized
Appreciation
(Depreciation) |
CBOT 5 Year U.S. Treasury Notes Futures | | | | | |
Ultra 10-Year U.S. Treasury Notes Futures | | | | | |
| | | | | |
See accompanying notes to financial statements.
Portfolio of Investments – as of September 30, 2023
Loomis Sayles Intermediate Duration Bond Fund (continued)
Industry Summary at September 30, 2023
| |
| |
| |
Non-Agency Commercial Mortgage-Backed Securities | |
| |
| |
| |
| |
| |
| |
Other Investments, less than 2% each | |
| |
| |
Other assets less liabilities (including futures contracts) | |
| |
See accompanying notes to financial statements.
Portfolio of Investments – as of September 30, 2023
Loomis Sayles Limited Term Government and Agency Fund
| | |
Bonds and Notes — 95.5% of Net Assets |
| |
| Avis Budget Rental Car Funding AESOP LLC, Series 2022-1A, Class A, 3.830%, 8/21/2028(a) | |
| Carvana Auto Receivables Trust, Series 2021-N2, Class A2, 0.970%, 3/10/2028 | |
| Credit Acceptance Auto Loan Trust, Series 2020-3A, Class A, 1.240%, 10/15/2029(a) | |
| Exeter Automobile Receivables Trust, Series 2022-5A, Class A3, 5.430%, 4/15/2026 | |
| GM Financial Consumer Automobile Receivables Trust, Series 2020-2, Class A3, 1.490%, 12/16/2024 | |
| GM Financial Revolving Receivables Trust, Series 2021-1, Class A, 1.170%, 6/12/2034(a) | |
| Hertz Vehicle Financing III LLC, Series 2023-3A, Class A, 5.940%, 2/25/2028(a) | |
| Hyundai Auto Receivables Trust, Series 2020-A, Class A3, 1.410%, 11/15/2024 | |
| Nissan Auto Receivables Owner Trust, Series 2020-A, Class A3, 1.380%, 12/16/2024 | |
| PenFed Auto Receivables Owner Trust, Series 2022-A, Class A4, 4.180%, 12/15/2028(a) | |
| Toyota Auto Loan Extended Note Trust, Series 2020-1A, Class A, 1.350%, 5/25/2033(a) | |
| Toyota Auto Loan Extended Note Trust, Series 2022-1A, Class A, 3.820%, 4/25/2035(a) | |
| | |
| |
| Chesapeake Funding II LLC, Series 2020-1A, Class A1, 0.870%, 8/15/2032(a) | |
| CNH Equipment Trust, Series 2020-A, Class A3, 1.160%, 6/16/2025 | |
| Donlen Fleet Lease Funding 2 LLC, Series 2021-2, Class A2, 0.560%, 12/11/2034(a) | |
| Enterprise Fleet Financing LLC, Series 2022-3, Class A2, 4.380%, 7/20/2029(a) | |
| MVW LLC, Series 2020-1A, Class A, 1.740%, 10/20/2037(a) | |
| Sierra Timeshare Receivables Funding LLC, Series 2020-2A, Class A, 1.330%, 7/20/2037(a) | |
| Welk Resorts LLC, Series 2019-AA, Class A, 2.800%, 6/15/2038(a) | |
| | |
| |
| Navient Private Education Refi Loan Trust, Series 2019-FA, Class A2, 2.600%, 8/15/2068(a) | |
| Navient Private Education Refi Loan Trust, Series 2020-DA, Class A, 1.690%, 5/15/2069(a) | |
| Navient Private Education Refi Loan Trust, Series 2021-CA, Class A, 1.060%, 10/15/2069(a) | |
| Navient Private Education Refi Loan Trust, Series 2021-EA, Class A, 0.970%, 12/16/2069(a) | |
| SMB Private Education Loan Trust, Series 2021-D, Class A1A, 1.340%, 3/17/2053(a) | |
| | |
| Agency Commercial Mortgage-Backed Securities — 27.6% |
| Federal Home Loan Mortgage Corp. Multifamily Structured Pass-Through Certificates, Series K038, Class A2, 3.389%, 3/25/2024 | |
| | |
| Agency Commercial Mortgage-Backed Securities — continued |
| Federal Home Loan Mortgage Corp. Multifamily Structured Pass-Through Certificates, Series K064, Class A2, 3.224%, 3/25/2027 | |
| Federal Home Loan Mortgage Corp. Multifamily Structured Pass-Through Certificates, Series K139, Class A1, 2.209%, 10/25/2031 | |
| Federal Home Loan Mortgage Corp. Multifamily Structured Pass-Through Certificates, Series K747, Class A2, 2.050%, 11/25/2028(b) | |
| Federal Home Loan Mortgage Corp. Multifamily Structured Pass-Through Certificates, Series KC06, Class A2, 2.541%, 8/25/2026 | |
| Federal Home Loan Mortgage Corp. Multifamily Structured Pass-Through Certificates, Series K-F100, Class AS, 30 day USD SOFR Average + 0.180%, 5.491%, 1/25/2028(c) | |
| Federal Home Loan Mortgage Corp. Multifamily Structured Pass-Through Certificates, Series K-F121, Class AS, 30 day USD SOFR Average + 0.180%, 5.491%, 8/25/2028(c) | |
| Federal Home Loan Mortgage Corp. Multifamily Structured Pass-Through Certificates, Series KF123, Class AS, 30 day USD SOFR Average + 0.200%, 5.511%, 9/25/2028(c) | |
| Federal Home Loan Mortgage Corp. Multifamily Structured Pass-Through Certificates, Series KF53, Class A, 30 day USD SOFR Average + 0.504%, 5.816%, 10/25/2025(c) | |
| Federal Home Loan Mortgage Corp. Multifamily Structured Pass-Through Certificates, Series KF72, Class A, 30 day USD SOFR Average + 0.614%, 5.926%, 10/25/2026(c) | |
| Federal Home Loan Mortgage Corp. Multifamily Structured Pass-Through Certificates, Series KF74, Class AS, 1 mo. USD SOFR Historical Calendar Day Compounded + 0.530%, 5.842%, 1/25/2027(c) | |
| Federal Home Loan Mortgage Corp. Multifamily Structured Pass-Through Certificates, Series KF77, Class AL, 30 day USD SOFR Average + 0.814%, 6.126%, 2/25/2027(c) | |
| Federal Home Loan Mortgage Corp. Multifamily Structured Pass-Through Certificates, Series KF77, Class AS, 30 day USD SOFR Average + 0.900%, 6.211%, 2/25/2027(c) | |
| Federal Home Loan Mortgage Corp. Multifamily Structured Pass-Through Certificates, Series KF78, Class AL, 30 day USD SOFR Average + 0.914%, 6.226%, 3/25/2030(c) | |
| Federal Home Loan Mortgage Corp. Multifamily Structured Pass-Through Certificates, Series KF78, Class AS, 30 day USD SOFR Average + 1.000%, 6.311%, 3/25/2030(c) | |
| Federal Home Loan Mortgage Corp. Multifamily Structured Pass-Through Certificates, Series KF79, Class AL, 30 day USD SOFR Average + 0.584%, 5.896%, 5/25/2030(c) | |
| Federal Home Loan Mortgage Corp. Multifamily Structured Pass-Through Certificates, Series KF79, Class AS, 30 day USD SOFR Average + 0.580%, 5.891%, 5/25/2030(c) | |
See accompanying notes to financial statements.
Portfolio of Investments – as of September 30, 2023
Loomis Sayles Limited Term Government and Agency Fund (continued)
| | |
| Agency Commercial Mortgage-Backed Securities — continued |
| Federal Home Loan Mortgage Corp. Multifamily Structured Pass-Through Certificates, Series KF80, Class AL, 30 day USD SOFR Average + 0.554%, 5.866%, 6/25/2030(c) | |
| Federal Home Loan Mortgage Corp. Multifamily Structured Pass-Through Certificates, Series KF80, Class AS, 30 day USD SOFR Average + 0.510%, 5.821%, 6/25/2030(c) | |
| Federal Home Loan Mortgage Corp. Multifamily Structured Pass-Through Certificates, Series KF81, Class AL, 30 day USD SOFR Average + 0.474%, 5.786%, 6/25/2027(c) | |
| Federal Home Loan Mortgage Corp. Multifamily Structured Pass-Through Certificates, Series KF81, Class AS, 30 day USD SOFR Average + 0.400%, 5.711%, 6/25/2027(c) | |
| Federal Home Loan Mortgage Corp. Multifamily Structured Pass-Through Certificates, Series KF84, Class AL, 30 day USD SOFR Average + 0.414%, 5.726%, 7/25/2030(c) | |
| Federal Home Loan Mortgage Corp. Multifamily Structured Pass-Through Certificates, Series KF84, Class AS, 30 day USD SOFR Average + 0.320%, 5.631%, 7/25/2030(c) | |
| Federal Home Loan Mortgage Corp. Multifamily Structured Pass-Through Certificates, Series KF85, Class AL, 30 day USD SOFR Average + 0.414%, 5.726%, 8/25/2030(c) | |
| Federal Home Loan Mortgage Corp. Multifamily Structured Pass-Through Certificates, Series KF85, Class AS, 30 day USD SOFR Average + 0.330%, 5.641%, 8/25/2030(c) | |
| Federal Home Loan Mortgage Corp. Multifamily Structured Pass-Through Certificates, Series KF86, Class AL, 30 day USD SOFR Average + 0.404%, 5.716%, 8/25/2027(c) | |
| Federal Home Loan Mortgage Corp. Multifamily Structured Pass-Through Certificates, Series KF86, Class AS, 30 day USD SOFR Average + 0.320%, 5.631%, 8/25/2027(c) | |
| Federal Home Loan Mortgage Corp. Multifamily Structured Pass-Through Certificates, Series KF93, Class AL, 30 day USD SOFR Average + 0.394%, 5.706%, 10/25/2027(c) | |
| Federal Home Loan Mortgage Corp. Multifamily Structured Pass-Through Certificates, Series KF93, Class AS, 30 day USD SOFR Average + 0.310%, 5.621%, 10/25/2027(c) | |
| Federal Home Loan Mortgage Corp. Multifamily Structured Pass-Through Certificates, Series KF97, Class AS, 30 day USD SOFR Average + 0.250%, 5.561%, 12/25/2030(c) | |
| Federal Home Loan Mortgage Corp. Multifamily Structured Pass-Through Certificates, Series KJ20, Class A2, 3.799%, 12/25/2025 | |
| Federal Home Loan Mortgage Corp. Multifamily Structured Pass-Through Certificates, Series KJ21, Class A2, 3.700%, 9/25/2026 | |
| Federal Home Loan Mortgage Corp. Multifamily Structured Pass-Through Certificates, Series KJ26, Class A2, 2.606%, 7/25/2027 | |
| | |
| Agency Commercial Mortgage-Backed Securities — continued |
| Federal Home Loan Mortgage Corp. Multifamily Structured Pass-Through Certificates, Series KJ37, Class A2, 2.333%, 11/25/2030 | |
| Federal Home Loan Mortgage Corp. Multifamily Structured Pass-Through Certificates, Series KJ42, Class A2, 4.118%, 11/25/2032 | |
| Federal Home Loan Mortgage Corp. Multifamily Structured Pass-Through Certificates, Series KS12, Class A, 30 day USD SOFR Average + 0.764%, 6.076%, 8/25/2029(c) | |
| Federal Home Loan Mortgage Corp. Multifamily Structured Pass-Through Certificates, Series KS14, Class AL, 30 day USD SOFR Average + 0.454%, 5.766%, 4/25/2030(c) | |
| Federal Home Loan Mortgage Corp. Multifamily Structured Pass-Through Certificates, Series KS14, Class AS, 30 day USD SOFR Average + 0.370%, 5.681%, 4/25/2030(c) | |
| Federal Home Loan Mortgage Corp. Multifamily Structured Pass-Through Certificates, Series Q008, Class A, 30 day USD SOFR Average + 0.504%, 5.816%, 10/25/2045(c) | |
| Federal Home Loan Mortgage Corp. Multifamily Structured Pass-Through Certificates, Series Q015, Class A, 30 day USD SOFR Average + 0.200%, 5.513%, 8/25/2024(c) | |
| Federal Home Loan Mortgage Corp. Multifamily Structured Pass-Through Certificates, Series Q016, Class APT1, 1.242%, 5/25/2051(b) | |
| Federal National Mortgage Association, 3.580%, 1/01/2026 | |
| Federal National Mortgage Association, Series 2014-M2, Class A2, 3.513%, 12/25/2023(b) | |
| Federal National Mortgage Association, Series 2020-M5, Class FA, 30 day USD SOFR Average + 0.574%, 5.886%, 1/25/2027(c) | |
| Government National Mortgage Association, Series 2003-72, Class Z, 5.412%, 11/16/2045(b) | |
| | |
| Collateralized Mortgage Obligations — 10.7% |
| Federal Home Loan Mortgage Corp., Series 2131, Class ZB, REMIC, 6.000%, 3/15/2029(d) | |
| Federal Home Loan Mortgage Corp., Series 2978, Class JG, REMIC, 5.500%, 5/15/2035(d) | |
| Federal Home Loan Mortgage Corp., Series 3036, Class NE, REMIC, 5.000%, 9/15/2035(d) | |
| Federal Home Loan Mortgage Corp., Series 3412, Class AY, REMIC, 5.500%, 2/15/2038(d) | |
| Federal Home Loan Mortgage Corp., Series 3561, Class W, IO, REMIC, 2.600%, 6/15/2048(b)(e) | |
| Federal Home Loan Mortgage Corp., Series 3620, Class AT, REMIC, 3.841%, 12/15/2036(b)(e) | |
| Federal Home Loan Mortgage Corp., Series 4212, Class FW, REMIC, 0.000%, 6/15/2043(b)(d) | |
| Federal Home Loan Mortgage Corp. Structured Pass-Through Certificates, Series T-60, Class 2A1, 3.926%, 3/25/2044(b)(d) | |
| Federal Home Loan Mortgage Corp. Structured Pass-Through Certificates, Series T-62, Class 1A1, 1 yr. MTA + 1.200%, 5.826%, 10/25/2044(c)(d) | |
See accompanying notes to financial statements.
Portfolio of Investments – as of September 30, 2023
Loomis Sayles Limited Term Government and Agency Fund (continued)
| | |
| Collateralized Mortgage Obligations — continued |
| Federal National Mortgage Association, Series 1994-42, Class FD, REMIC, 10 yr. CMT - 0.500%, 3.770%, 4/25/2024(c)(d) | |
| Federal National Mortgage Association, Series 2002-W10, Class A7, REMIC, 4.419%, 8/25/2042(b)(d) | |
| Federal National Mortgage Association, Series 2003-48, Class GH, REMIC, 5.500%, 6/25/2033(d) | |
| Federal National Mortgage Association, Series 2005-100, Class BQ, REMIC, 5.500%, 11/25/2025(d) | |
| Federal National Mortgage Association, Series 2007-73, Class A1, REMIC, 30 day USD SOFR Average + 0.174%, 5.462%, 7/25/2037(c)(d) | |
| Federal National Mortgage Association, Series 2008-86, Class LA, REMIC, 3.492%, 8/25/2038(b) | |
| Federal National Mortgage Association, Series 2012-56, Class FK, REMIC, 30 day USD SOFR Average + 0.564%, 5.879%, 6/25/2042(c)(d) | |
| Federal National Mortgage Association, Series 2012-58, Class KF, REMIC, 30 day USD SOFR Average + 0.664%, 5.979%, 6/25/2042(c) | |
| Federal National Mortgage Association, Series 2012-83, Class LF, REMIC, 30 day USD SOFR Average + 0.624%, 5.939%, 8/25/2042(c) | |
| Federal National Mortgage Association, Series 2013-67, Class NF, REMIC, 30 day USD SOFR Average + 1.114%, 5.000%, 7/25/2043(c) | |
| Federal National Mortgage Association, Series 2015-4, Class BF, REMIC, 30 day USD SOFR Average + 0.514%, 5.829%, 2/25/2045(c) | |
| Federal National Mortgage Association, Series 2020-35, Class FA, REMIC, 30 day USD SOFR Average + 0.614%, 5.242%, 6/25/2050(c) | |
| Government National Mortgage Association, Series 2005-18, Class F, 1 mo. USD SOFR + 0.314%, 5.639%, 2/20/2035(c)(d) | |
| Government National Mortgage Association, Series 2007-59, Class FM, 1 mo. USD SOFR + 0.634%, 5.959%, 10/20/2037(c)(d) | |
| Government National Mortgage Association, Series 2009-H01, Class FA, 1 mo. USD SOFR + 1.264%, 6.589%, 11/20/2059(c)(d) | |
| Government National Mortgage Association, Series 2010-H20, Class AF, 1 mo. USD SOFR + 0.444%, 5.762%, 10/20/2060(c) | |
| Government National Mortgage Association, Series 2010-H24, Class FA, 1 mo. USD SOFR + 0.464%, 5.782%, 10/20/2060(c) | |
| Government National Mortgage Association, Series 2010-H27, Class FA, 1 mo. USD SOFR + 0.494%, 5.812%, 12/20/2060(c) | |
| Government National Mortgage Association, Series 2011-H08, Class FA, 1 mo. USD SOFR + 0.714%, 6.032%, 2/20/2061(c) | |
| Government National Mortgage Association, Series 2011-H23, Class HA, 3.000%, 12/20/2061(d) | |
| Government National Mortgage Association, Series 2012-124, Class HT, 0.000%, 7/20/2032(b)(d) | |
| | |
| Collateralized Mortgage Obligations — continued |
| Government National Mortgage Association, Series 2012-18, Class FM, 1 mo. USD SOFR + 0.364%, 5.689%, 9/20/2038(c) | |
| Government National Mortgage Association, Series 2012-H15, Class FA, 1 mo. USD SOFR + 0.564%, 5.500%, 5/20/2062(c)(d) | |
| Government National Mortgage Association, Series 2012-H18, Class NA, 1 mo. USD SOFR + 0.634%, 5.952%, 8/20/2062(c) | |
| Government National Mortgage Association, Series 2012-H29, Class HF, 1 mo. USD SOFR + 0.614%, 4.785%, 10/20/2062(c)(d) | |
| Government National Mortgage Association, Series 2013-H02, Class GF, 1 mo. USD SOFR + 0.614%, 5.001%, 12/20/2062(c)(d) | |
| Government National Mortgage Association, Series 2013-H08, Class FA, 1 mo. USD SOFR + 0.464%, 5.782%, 3/20/2063(c)(d) | |
| Government National Mortgage Association, Series 2013-H10, Class FA, 1 mo. USD SOFR + 0.514%, 5.832%, 3/20/2063(c) | |
| Government National Mortgage Association, Series 2013-H14, Class FG, 1 mo. USD SOFR + 0.584%, 5.902%, 5/20/2063(c)(d) | |
| Government National Mortgage Association, Series 2014-H14, Class FA, 1 mo. USD SOFR + 0.614%, 5.718%, 7/20/2064(c) | |
| Government National Mortgage Association, Series 2014-H15, Class FA, 1 mo. USD SOFR + 0.614%, 5.932%, 7/20/2064(c) | |
| Government National Mortgage Association, Series 2015-H04, Class FL, 1 mo. USD SOFR + 0.584%, 5.688%, 2/20/2065(c) | |
| Government National Mortgage Association, Series 2015-H05, Class FA, 1 mo. USD SOFR + 0.414%, 4.741%, 4/20/2061(c)(d) | |
| Government National Mortgage Association, Series 2015-H09, Class HA, 1.750%, 3/20/2065(d) | |
| Government National Mortgage Association, Series 2015-H10, Class FC, 1 mo. USD SOFR + 0.594%, 5.698%, 4/20/2065(c) | |
| Government National Mortgage Association, Series 2015-H10, Class JA, 2.250%, 4/20/2065 | |
| Government National Mortgage Association, Series 2015-H11, Class FA, 1 mo. USD SOFR + 0.364%, 4.774%, 4/20/2065(c)(d) | |
| Government National Mortgage Association, Series 2015-H12, Class FL, 1 mo. USD SOFR + 0.344%, 5.662%, 5/20/2065(c) | |
| Government National Mortgage Association, Series 2015-H19, Class FH, 1 mo. USD SOFR + 0.414%, 4.497%, 7/20/2065(c)(d) | |
| Government National Mortgage Association, Series 2015-H29, Class FA, 1 mo. USD SOFR + 0.814%, 4.629%, 10/20/2065(c)(d) | |
| Government National Mortgage Association, Series 2015-H30, Class FA, 1 mo. USD SOFR + 0.794%, 4.810%, 8/20/2061(c)(d) | |
| Government National Mortgage Association, Series 2016-H06, Class FC, 1 mo. USD SOFR + 1.034%, 4.853%, 2/20/2066(c) | |
See accompanying notes to financial statements.
Portfolio of Investments – as of September 30, 2023
Loomis Sayles Limited Term Government and Agency Fund (continued)
| | |
| Collateralized Mortgage Obligations — continued |
| Government National Mortgage Association, Series 2016-H20, Class FB, 1 mo. USD SOFR + 0.664%, 5.982%, 9/20/2066(c) | |
| Government National Mortgage Association, Series 2017-H05, Class FC, 1 mo. USD SOFR + 0.864%, 5.144%, 2/20/2067(c) | |
| Government National Mortgage Association, Series 2018-H02, Class FJ, 1 mo. USD SOFR + 0.314%, 4.408%, 10/20/2064(c)(d) | |
| Government National Mortgage Association, Series 2018-H11, Class FJ, 1 yr. USD SOFR + 0.795%, 5.027%, 6/20/2068(c) | |
| Government National Mortgage Association, Series 2018-H14, Class FG, 1 mo. USD SOFR + 0.464%, 5.782%, 9/20/2068(c) | |
| Government National Mortgage Association, Series 2018-H16, Class FA, 1 mo. USD SOFR + 0.534%, 5.385%, 9/20/2068(c) | |
| Government National Mortgage Association, Series 2019-H04, Class NA, 3.500%, 9/20/2068 | |
| Government National Mortgage Association, Series 2019-H13, Class FT, 1 yr. CMT + 0.450%, 5.830%, 8/20/2069(c) | |
| Government National Mortgage Association, Series 2020-30, Class F, 1 mo. USD SOFR + 0.514%, 5.844%, 4/20/2048(c) | |
| Government National Mortgage Association, Series 2020-53, Class NF, 1 mo. USD SOFR + 0.564%, 5.894%, 5/20/2046(c) | |
| Government National Mortgage Association, Series 2020-H01, Class FT, 1 yr. CMT + 0.500%, 5.880%, 1/20/2070(c) | |
| Government National Mortgage Association, Series 2020-H02, Class FG, 1 mo. USD SOFR + 0.714%, 5.414%, 1/20/2070(c) | |
| Government National Mortgage Association, Series 2020-H04, Class FP, 1 mo. USD SOFR + 0.614%, 5.294%, 6/20/2069(c) | |
| Government National Mortgage Association, Series 2020-H07, Class FL, 1 mo. USD SOFR + 0.764%, 6.082%, 4/20/2070(c) | |
| Government National Mortgage Association, Series 2020-H10, Class FD, 1 mo. USD SOFR + 0.514%, 5.832%, 5/20/2070(c) | |
| | |
| |
| Federal Home Loan Mortgage Corp., 1 yr. RFUCC Treasury + 1.732%, 4.126%, 4/01/2037(c) | |
| Federal Home Loan Mortgage Corp., 1 yr. RFUCC Treasury + 1.742%, 4.229%, 12/01/2037(c) | |
| Federal Home Loan Mortgage Corp., 1 yr. CMT + 2.286%, 4.430%, 2/01/2036(c) | |
| Federal Home Loan Mortgage Corp., 1 yr. RFUCC Treasury + 1.903%, 4.453%, 4/01/2037(c) | |
| Federal Home Loan Mortgage Corp., 1 yr. CMT + 2.250%, 4.498%, 2/01/2035(c) | |
| Federal Home Loan Mortgage Corp., 1 yr. CMT + 2.245%, 4.538%, 3/01/2036(c) | |
| Federal Home Loan Mortgage Corp., 1 yr. CMT + 2.267%, 4.587%, 2/01/2036(c) | |
| | |
| |
| Federal Home Loan Mortgage Corp., 1 yr. CMT + 2.204%, 4.593%, 9/01/2038(c) | |
| Federal Home Loan Mortgage Corp., 6 mo. RFUCC Treasury + 1.770%, 4.643%, 6/01/2037(c) | |
| Federal Home Loan Mortgage Corp., 1 yr. RFUCC Treasury + 1.840%, 4.825%, 1/01/2046(c) | |
| Federal Home Loan Mortgage Corp., 1 yr. RFUCC Treasury + 1.678%, 4.875%, 3/01/2038(c) | |
| Federal Home Loan Mortgage Corp., 1 yr. CMT + 2.165%, 4.993%, 4/01/2036(c) | |
| Federal Home Loan Mortgage Corp., 1 yr. RFUCC Treasury + 1.770%, 5.021%, 11/01/2038(c) | |
| Federal Home Loan Mortgage Corp., 1 yr. CMT + 2.249%, 5.155%, 3/01/2037(c) | |
| Federal Home Loan Mortgage Corp., 1 yr. RFUCC Treasury + 1.897%, 5.275%, 9/01/2041(c) | |
| Federal Home Loan Mortgage Corp., 1 yr. RFUCC Treasury + 1.935%, 5.297%, 12/01/2034(c) | |
| Federal Home Loan Mortgage Corp., 1 yr. RFUCC Treasury + 1.765%, 5.746%, 9/01/2035(c) | |
| Federal Home Loan Mortgage Corp., 1 yr. RFUCC Treasury + 1.703%, 5.771%, 11/01/2038(c) | |
| Federal Home Loan Mortgage Corp., 1 yr. CMT + 2.248%, 5.900%, 9/01/2038(c) | |
| Federal Home Loan Mortgage Corp., 1 yr. CMT + 2.220%, 6.142%, 7/01/2033(c) | |
| Federal National Mortgage Association, 1 yr. RFUCC Treasury + 1.800%, 4.050%, 10/01/2041(c) | |
| Federal National Mortgage Association, 1 yr. RFUCC Treasury + 1.800%, 4.050%, 12/01/2041(c) | |
| Federal National Mortgage Association, 1 yr. RFUCC Treasury + 1.729%, 4.074%, 1/01/2037(c) | |
| Federal National Mortgage Association, 1 yr. RFUCC Treasury + 1.734%, 4.188%, 2/01/2037(c) | |
| Federal National Mortgage Association, 1 yr. CMT + 2.185%, 4.310%, 12/01/2034(c) | |
| Federal National Mortgage Association, 1 yr. CMT + 2.185%, 4.310%, 1/01/2036(c) | |
| Federal National Mortgage Association, 1 yr. RFUCC Treasury + 1.565%, 4.315%, 4/01/2037(c) | |
| Federal National Mortgage Association, 1 yr. RFUCC Treasury + 1.667%, 4.392%, 10/01/2033(c) | |
| Federal National Mortgage Association, 1 yr. RFUCC Treasury + 1.820%, 4.445%, 2/01/2047(c) | |
| Federal National Mortgage Association, 1 yr. RFUCC Treasury + 1.729%, 4.476%, 11/01/2035(c) | |
| Federal National Mortgage Association, 1 yr. RFUCC Treasury + 1.804%, 4.520%, 3/01/2037(c) | |
| Federal National Mortgage Association, 1 yr. RFUCC Treasury + 1.800%, 4.544%, 3/01/2034(c) | |
| Federal National Mortgage Association, 1 yr. CMT + 2.486%, 4.611%, 5/01/2035(c) | |
| Federal National Mortgage Association, 1 yr. RFUCC Treasury + 1.559%, 4.685%, 7/01/2035(c) | |
| Federal National Mortgage Association, 1 yr. CMT + 2.228%, 4.701%, 4/01/2034(c) | |
| Federal National Mortgage Association, 1 yr. CMT + 2.147%, 4.721%, 9/01/2034(c) | |
| Federal National Mortgage Association, 1 yr. CMT + 2.196%, 4.740%, 4/01/2034(c) | |
| Federal National Mortgage Association, 1 yr. RFUCC Treasury + 1.550%, 4.824%, 4/01/2037(c) | |
See accompanying notes to financial statements.
Portfolio of Investments – as of September 30, 2023
Loomis Sayles Limited Term Government and Agency Fund (continued)
| | |
| |
| Federal National Mortgage Association, 1 yr. CMT + 2.131%, 4.843%, 6/01/2036(c) | |
| Federal National Mortgage Association, 1 yr. RFUCC Treasury + 1.680%, 5.014%, 11/01/2036(c) | |
| Federal National Mortgage Association, 1 yr. RFUCC Treasury + 1.706%, 5.045%, 9/01/2037(c) | |
| Federal National Mortgage Association, 6 mo. RFUCC Treasury + 2.065%, 5.056%, 7/01/2037(c) | |
| Federal National Mortgage Association, 1 yr. CMT + 2.287%, 5.148%, 10/01/2033(c) | |
| Federal National Mortgage Association, 1 yr. CMT + 2.211%, 5.211%, 4/01/2033(c) | |
| Federal National Mortgage Association, 1 yr. CMT + 2.214%, 5.262%, 10/01/2034(c) | |
| Federal National Mortgage Association, 1 yr. RFUCC Treasury + 1.806%, 5.275%, 7/01/2041(c) | |
| Federal National Mortgage Association, 1 yr. CMT + 2.170%, 5.343%, 12/01/2040(c) | |
| Federal National Mortgage Association, 1 yr. CMT + 2.500%, 5.477%, 8/01/2036(c) | |
| Federal National Mortgage Association, 1 yr. CMT + 2.185%, 5.687%, 11/01/2033(c) | |
| Federal National Mortgage Association, 1 yr. RFUCC Treasury + 1.564%, 5.742%, 9/01/2037(c) | |
| Federal National Mortgage Association, 1 yr. RFUCC Treasury + 1.515%, 5.765%, 8/01/2035(c) | |
| Federal National Mortgage Association, 1 yr. RFUCC Treasury + 1.639%, 5.889%, 8/01/2038(c) | |
| Federal National Mortgage Association, 1 yr. CMT + 2.287%, 5.924%, 6/01/2033(c) | |
| Federal National Mortgage Association, 1 yr. RFUCC Treasury + 1.681%, 5.931%, 7/01/2038(c) | |
| Federal National Mortgage Association, 1 yr. CMT + 2.145%, 5.934%, 9/01/2036(c) | |
| Federal National Mortgage Association, 1 yr. RFUCC Treasury + 1.713%, 5.963%, 8/01/2034(c) | |
| Federal National Mortgage Association, 1 yr. CMT + 2.270%, 6.020%, 6/01/2037(c) | |
| Federal National Mortgage Association, 1 yr. RFUCC Treasury + 2.473%, 6.223%, 6/01/2035(c) | |
| Federal National Mortgage Association, 1 yr. CMT + 2.223%, 6.223%, 8/01/2035(c) | |
| Federal National Mortgage Association, 1 yr. CMT + 2.440%, 6.266%, 8/01/2033(c) | |
| Federal National Mortgage Association, 6 mo. RFUCC Treasury + 1.546%, 6.747%, 7/01/2035(c) | |
| Federal National Mortgage Association, 6 mo. RFUCC Treasury + 1.460%, 7.161%, 2/01/2037(c) | |
| | |
| |
| Federal Home Loan Mortgage Corp., 3.000%, 10/01/2026 | |
| Federal Home Loan Mortgage Corp., 4.000%, with various maturities from 2024 to 2042(f) | |
| Federal Home Loan Mortgage Corp., 4.500%, with various maturities from 2025 to 2034(f) | |
| Federal Home Loan Mortgage Corp., 5.500%, 10/01/2023 | |
| Federal Home Loan Mortgage Corp., 6.500%, 12/01/2034 | |
| | |
| Mortgage Related — continued |
| Federal Home Loan Mortgage Corp., 7.500%, 6/01/2026 | |
| Federal National Mortgage Association, 3.000%, 3/01/2042 | |
| Federal National Mortgage Association, 5.000%, with various maturities from 2037 to 2038(f) | |
| Federal National Mortgage Association, 5.500%, with various maturities from 2024 to 2033(f) | |
| Federal National Mortgage Association, 6.500%, with various maturities from 2032 to 2037(f) | |
| Federal National Mortgage Association, 7.500%, with various maturities from 2030 to 2032(f) | |
| Government National Mortgage Association, 4.140%, with various maturities from 2061 to 2063(b)(f) | |
| Government National Mortgage Association, 4.390%, 12/20/2062(b) | |
| Government National Mortgage Association, 4.439%, 10/20/2065(b) | |
| Government National Mortgage Association, 4.547%, 1/20/2064(b) | |
| Government National Mortgage Association, 4.576%, 2/20/2066(b) | |
| Government National Mortgage Association, 4.619%, 8/20/2062(b) | |
| Government National Mortgage Association, 4.630%, with various maturities from 2062 to 2063(b)(f) | |
| Government National Mortgage Association, 4.642%, 2/20/2062(b) | |
| Government National Mortgage Association, 4.663%, 11/20/2063(b) | |
| Government National Mortgage Association, 4.677%, 8/20/2061(b) | |
| Government National Mortgage Association, 4.700%, with various maturities from 2061 to 2064(b)(f) | |
| Government National Mortgage Association, 4.889%, 4/20/2061(b) | |
| Government National Mortgage Association, 6.000%, 12/15/2031 | |
| Government National Mortgage Association, 6.500%, 5/15/2031 | |
| Government National Mortgage Association, 1 mo. RFUCC Treasury + 1.758%, 6.875%, 2/20/2061(c) | |
| Government National Mortgage Association, 7.000%, 10/15/2028 | |
| Government National Mortgage Association, 1 mo. RFUCC Treasury + 1.890%, 7.038%, 2/20/2063(c) | |
| Government National Mortgage Association, 1 mo. RFUCC Treasury + 2.170%, 7.318%, 3/20/2063(c) | |
| Government National Mortgage Association, 1 mo. RFUCC Treasury + 2.186%, 7.335%, 5/20/2065(c) | |
| Government National Mortgage Association, 1 mo. RFUCC Treasury + 2.229%, 7.378%, 6/20/2065(c) | |
| Government National Mortgage Association, 1 mo. RFUCC Treasury + 2.329%, 7.477%, 2/20/2063(c) | |
| | |
| Non-Agency Commercial Mortgage-Backed Securities — 3.6% |
| BANK, Series 2020-BN25, Class A5, 2.649%, 1/15/2063 | |
See accompanying notes to financial statements.
Portfolio of Investments – as of September 30, 2023
Loomis Sayles Limited Term Government and Agency Fund (continued)
| | |
| Non-Agency Commercial Mortgage-Backed Securities — continued |
| BBCMS Mortgage Trust, Series 2020-BID, Class A, 1 mo. USD SOFR + 2.254%, 7.588%, 10/15/2037(a)(c) | |
| BPR Trust, Series 2021-NRD, Class A, 1 mo. USD SOFR + 1.525%, 6.858%, 12/15/2038(a)(c) | |
| BPR Trust, Series 2022-SSP, Class A, 1 mo. USD SOFR + 3.000%, 8.332%, 5/15/2039(a)(c) | |
| CFCRE Commercial Mortgage Trust, Series 2016-C7, Class A3, 3.839%, 12/10/2054 | |
| Commercial Mortgage Pass-Through Certificates, Series 2012-LTRT, Class A2, 3.400%, 10/05/2030(a) | |
| Commercial Mortgage Pass-Through Certificates, Series 2014-UBS2, Class A5, 3.961%, 3/10/2047 | |
| Commercial Mortgage Pass-Through Certificates, Series 2016-DC2, Class ASB, 3.550%, 2/10/2049 | |
| DROP Mortgage Trust, Series 2021-FILE, Class A, 1 mo. USD SOFR + 1.264%, 6.597%, 10/15/2043(a)(c) | |
| Hudsons Bay Simon JV Trust, Series 2015-HB7, Class A7, 3.914%, 8/05/2034(a) | |
| SPGN Mortgage Trust, Series 2022-TFLM, Class A, 1 mo. USD SOFR + 1.550%, 6.882%, 2/15/2039(a)(c) | |
| Starwood Retail Property Trust, Series 2014-STAR, Class A, PRIME + 0.000%, 8.500%, 11/15/2027(a)(c) | |
| | |
| |
| U.S. Treasury Notes, 0.375%, 9/30/2027 | |
| U.S. Treasury Notes, 2.750%, 4/30/2027 | |
| U.S. Treasury Notes, 2.750%, 2/15/2028 | |
| U.S. Treasury Notes, 3.875%, 3/31/2025 | |
| U.S. Treasury Notes, 3.875%, 4/30/2025 | |
| U.S. Treasury Notes, 3.875%, 11/30/2027 | |
| U.S. Treasury Notes, 3.875%, 12/31/2027 | |
| U.S. Treasury Notes, 4.000%, 2/29/2028 | |
| U.S. Treasury Notes, 4.000%, 6/30/2028 | |
| U.S. Treasury Notes, 4.125%, 10/31/2027 | |
| U.S. Treasury Notes, 4.125%, 7/31/2028 | |
| U.S. Treasury Notes, 4.250%, 5/31/2025 | |
| U.S. Treasury Notes, 4.375%, 8/31/2028 | |
| U.S. Treasury Notes, 4.625%, 6/30/2025 | |
| U.S. Treasury Notes, 4.625%, 3/15/2026 | |
| U.S. Treasury Notes, 4.625%, 9/30/2028 | |
| U.S. Treasury Notes, 4.750%, 7/31/2025 | |
| U.S. Treasury Notes, 5.000%, 8/31/2025 | |
| U.S. Treasury Notes, 5.000%, 9/30/2025 | |
| | |
| Total Bonds and Notes
(Identified Cost $744,443,600) | |
|
|
Short-Term Investments — 13.9% |
| Tri-Party Repurchase Agreement with Fixed Income Clearing Corporation, dated 9/29/2023 at 2.500% to be repurchased at $16,184,070 on 10/02/2023 collateralized by $18,183,500 U.S. Treasury Note, 1.375% due 8/31/2026 valued at $16,504,399 including accrued interest (Note 2 of Notes to Financial Statements) | |
| Federal Home Loan Bank Discount Notes, 5.220%, 10/02/2023(g) | |
| | |
|
| Federal Home Loan Bank Discount Notes, 5.250%, 10/11/2023(g) | |
| Federal National Mortgage Association Discount Notes, 5.225%, 10/02/2023(g) | |
| Total Short-Term Investments
(Identified Cost $104,249,423) | |
| Total Investments — 109.4%
(Identified Cost $848,693,023) | |
| Other assets less liabilities — (9.4)% | |
| | |
| See Note 2 of Notes to Financial Statements. |
| All or a portion of these securities are exempt from registration under Rule 144A of the Securities Act of 1933. These securities may be resold in transactions exempt from registration, normally to qualified institutional buyers. At September 30, 2023, the value of Rule 144A holdings amounted to $40,995,820 or 5.5% of net assets. |
| Variable rate security. The interest rate adjusts periodically based on; (i) changes in current interest rates and/or prepayments on underlying pools of assets, if applicable, (ii) reference to a base lending rate plus or minus a margin, and/or (iii) reference to a base lending rate adjusted by a multiplier and/or subject to certain floors or caps. Rate as of September 30, 2023 is disclosed. |
| Variable rate security. Rate as of September 30, 2023 is disclosed. |
| Level 3 security. Value has been determined using significant unobservable inputs. See Note 3 of Notes to Financial Statements. |
| Interest only security. Security represents right to receive monthly interest payments on an underlying pool of mortgages. Principal shown is the outstanding par amount of the pool held as of the end of the period. |
| The Fund’s investment in mortgage related securities of Federal Home Loan Mortgage Corporation, Federal National Mortgage Association and Government National Mortgage Association are interests in separate pools of mortgages. All separate investments in securities of each issuer which have the same coupon rate have been aggregated for the purpose of presentation in the Portfolio of Investments. |
| Interest rate represents discount rate at time of purchase; not a coupon rate. |
| |
| Adjustable Rate Mortgages |
| Constant Maturity Treasury |
| Monthly Treasury Average Interest |
| Real Estate Mortgage Investment Conduit |
| Secured Overnight Financing Rate |
See accompanying notes to financial statements.
Portfolio of Investments – as of September 30, 2023
Loomis Sayles Limited Term Government and Agency Fund (continued)
Industry Summary at September 30, 2023
| |
Agency Commercial Mortgage-Backed Securities | |
Collateralized Mortgage Obligations | |
Non-Agency Commercial Mortgage-Backed Securities | |
| |
| |
Other Investments, less than 2% each | |
| |
| |
Other assets less liabilities | |
| |
See accompanying notes to financial statements.
Statements of Assets and Liabilities
| | | |
| | | |
| | | |
Net unrealized appreciation (depreciation) | | | |
| | | |
| | | |
Due from brokers (Note 2) | | | |
Foreign currency at value (identified cost $145, $0 and $4,750,191, respectively) | | | |
Receivable for Fund shares sold | | | |
Receivable from investment adviser (Note 6) | | | |
Receivable for securities sold | | | |
Receivable for when-issued/delayed delivery securities sold (Note 2) | | | |
Collateral received for open forward foreign currency contracts (Notes 2 and 4) | | | |
Dividends and interest receivable | | | |
Unrealized appreciation on forward foreign currency contracts (Note 2) | | | |
| | | |
Receivable for variation margin on futures contracts (Note 2) | | | |
Prepaid expenses (Note 8) | | | |
| | | |
| | | |
Payable for securities purchased | | | |
Payable for when-issued/delayed delivery securities purchased (Note 2) | | | |
Payable for Fund shares redeemed | | | |
Unrealized depreciation on forward foreign currency contracts (Note 2) | | | |
Foreign taxes payable (Note 2) | | | |
| | | |
Management fees payable (Note 6) | | | |
Deferred Trustees’ fees (Note 6) | | | |
Administrative fees payable (Note 6) | | | |
Payable to distributor (Note 6d) | | | |
Audit and tax services fees payable | | | |
Other accounts payable and accrued expenses | | | |
| | | |
| | | |
| | | |
| | | |
Accumulated earnings (loss) | | | |
| | | |
See accompanying notes to financial statements.
Statements of Assets and Liabilities (continued)
| | | |
COMPUTATION OF NET ASSET VALUE AND OFFERING PRICE: | | | |
| | | |
| | | |
Shares of beneficial interest | | | |
Net asset value and redemption price per share | | | |
Offering price per share (100/[100-maximum sales charge] of net asset value) (Note 1) | | | |
Class C shares: (redemption price per share is equal to net asset value less any applicable contingent deferred sales charge) (Note 1) | | | |
| | | |
Shares of beneficial interest | | | |
Net asset value and offering price per share | | | |
| | | |
| | | |
Shares of beneficial interest | | | |
Net asset value, offering and redemption price per share | | | |
| | | |
| | | |
Shares of beneficial interest | | | |
Net asset value, offering and redemption price per share | | | |
| Net asset value calculations have been determined utilizing fractional share and penny amounts. |
See accompanying notes to financial statements.
Statements of Assets and Liabilities (continued)
| | Intermediate
Duration Bond
Fund | Limited Term
Government
and Agency
Fund |
| | | |
| | | |
Net unrealized appreciation (depreciation) | | | |
| | | |
| | | |
Due from brokers (Note 2) | | | |
Receivable for Fund shares sold | | | |
Receivable for securities sold | | | |
Dividends and interest receivable | | | |
| | | |
Receivable for variation margin on futures contracts (Note 2) | | | |
Prepaid expenses (Note 8) | | | |
| | | |
| | | |
Payable for securities purchased | | | |
Payable for Fund shares redeemed | | | |
| | | |
Management fees payable (Note 6) | | | |
Deferred Trustees’ fees (Note 6) | | | |
Administrative fees payable (Note 6) | | | |
Payable to distributor (Note 6d) | | | |
Audit and tax services fees payable | | | |
Other accounts payable and accrued expenses | | | |
| | | |
| | | |
| | | |
| | | |
Accumulated earnings (loss) | | | |
| | | |
COMPUTATION OF NET ASSET VALUE AND OFFERING PRICE: | | | |
| | | |
| | | |
Shares of beneficial interest | | | |
Net asset value and redemption price per share | | | |
Offering price per share (100/[100-maximum sales charge] of net asset value) (Note 1) | | | |
Class C shares: (redemption price per share is equal to net asset value less any applicable contingent deferred sales charge) (Note 1) | | | |
| | | |
Shares of beneficial interest | | | |
Net asset value and offering price per share | | | |
| | | |
| | | |
Shares of beneficial interest | | | |
Net asset value, offering and redemption price per share | | | |
| | | |
| | | |
Shares of beneficial interest | | | |
Net asset value, offering and redemption price per share | | | |
See accompanying notes to financial statements.
For the Year Ended September 30, 2023
| | | |
| | | |
| | | |
| | | |
Less net foreign taxes withheld | | | |
| | | |
| | | |
| | | |
Service and distribution fees (Note 6) | | | |
Administrative fees (Note 6) | | | |
Trustees' fees and expenses (Note 6) | | | |
Transfer agent fees and expenses (Notes 6 and 7) | | | |
Audit and tax services fees | | | |
Custodian fees and expenses | | | |
| | | |
| | | |
Shareholder reporting expenses | | | |
| | | |
| | | |
Less waiver and/or expense reimbursement (Note 6) | | | |
| | | |
| | | |
Net realized and unrealized gain (loss) on Investments, Futures contracts, Forward foreign currency contracts and Foreign currency transactions | | | |
Net realized gain (loss) on: | | | |
| | | |
| | | |
Forward foreign currency contracts (Note 2e) | | | |
Foreign currency transactions (Note 2d) | | | |
Net change in unrealized appreciation (depreciation) on: | | | |
| | | |
| | | |
Forward foreign currency contracts (Note 2e) | | | |
Foreign currency translations (Note 2d) | | | |
Net realized and unrealized gain (loss) on Investments, Futures contracts, Forward foreign currency contracts and Foreign currency transactions | | | |
NET INCREASE IN NET ASSETS RESULTING FROM OPERATIONS | | | |
See accompanying notes to financial statements.
Statements of Operations (continued)
For the Year Ended September 30, 2023
| | Intermediate
Duration Bond
Fund | Limited Term
Government
and Agency
Fund |
| | | |
| | | |
| | | |
Less net foreign taxes withheld | | | |
| | | |
| | | |
| | | |
Service and distribution fees (Note 6) | | | |
Administrative fees (Note 6) | | | |
Trustees' fees and expenses (Note 6) | | | |
Transfer agent fees and expenses (Notes 6 and 7) | | | |
Audit and tax services fees | | | |
Custodian fees and expenses | | | |
| | | |
| | | |
Shareholder reporting expenses | | | |
| | | |
| | | |
Less waiver and/or expense reimbursement (Note 6) | | | |
| | | |
Net investment income (loss) | | | |
Net realized and unrealized gain (loss) on Investments, Futures contracts and foreign currency transactions | | | |
Net realized gain (loss) on: | | | |
| | | |
| | | |
Net change in unrealized appreciation (depreciation) on: | | | |
| | | |
| | | |
Foreign currency translations (Note 2d) | | | |
Net realized and unrealized gain (loss) on Investments, Futures contracts and foreign currency transactions | | | |
NET INCREASE IN NET ASSETS RESULTING FROM OPERATIONS | | | |
See accompanying notes to financial statements.
Statements of Changes in Net Assets
| | |
| Year Ended
September 30, 2023 | Year Ended
September 30, 2022 | Year Ended
September 30, 2023 | Year Ended
September 30, 2022 |
| | | | |
| | | | |
Net realized gain (loss) on investments, futures contracts, swap agreements and foreign currency transactions | | | | |
Net change in unrealized appreciation (depreciation) on investments, futures contracts and foreign currency translations | | | | |
Net increase (decrease) in net assets resulting from operations | | | | |
FROM DISTRIBUTIONS TO SHAREHOLDERS: | | | | |
| | | | |
| | | | |
| | | | |
| | | | |
| | | | |
NET INCREASE (DECREASE) IN NET ASSETS FROM CAPITAL SHARES TRANSACTIONS (Note 11) | | | | |
Net increase (decrease) in net assets | | | | |
| | | | |
| | | | |
| | | | |
See accompanying notes to financial statements.
Statements of Changes in Net Assets (continued)
| | |
| Year Ended
September 30, 2023 | Year Ended
September 30, 2022 | Year Ended
September 30, 2023 | Year Ended
September 30, 2022 |
| | | | |
Net investment income (loss) | | | | |
Net realized gain on investments, futures contracts, swap agreements, forward foreign currency contracts and foreign currency transactions | | | | |
Net change in unrealized appreciation (depreciation) on investments, futures contracts, forward foreign currency contracts and foreign currency translations | | | | |
Net increase (decrease) in net assets resulting from operations | | | | |
FROM DISTRIBUTIONS TO SHAREHOLDERS: | | | | |
| | | | |
| | | | |
| | | | |
| | | | |
| | | | |
NET DECREASE IN NET ASSETS FROM CAPITAL SHARES TRANSACTIONS (Note 11) | | | | |
Net increase (decrease) in net assets | | | | |
| | | | |
| | | | |
| | | | |
See accompanying notes to financial statements.
Statements of Changes in Net Assets (continued)
| Intermediate Duration Bond
Fund | Limited Term Government and
Agency Fund |
| Year Ended
September 30, 2023 | Year Ended
September 30, 2022 | Year Ended
September 30, 2023 | Year Ended
September 30, 2022 |
| | | | |
| | | | |
Net realized loss on investments and futures contracts | | | | |
Net change in unrealized appreciation (depreciation) on investments and futures contracts | | | | |
Net increase (decrease) in net assets resulting from operations | | | | |
FROM DISTRIBUTIONS TO SHAREHOLDERS: | | | | |
| | | | |
| | | | |
| | | | |
| | | | |
| | | | |
NET INCREASE (DECREASE) IN NET ASSETS FROM CAPITAL SHARES TRANSACTIONS (Note 11) | | | | |
Net increase (decrease) in net assets | | | | |
| | | | |
| | | | |
| | | | |
See accompanying notes to financial statements.
For a share outstanding throughout each period.
| Core Plus Bond Fund—Class A |
| Year Ended
September 30,
2023 | Year Ended
September 30,
2022 | Year Ended
September 30,
2021 | Year Ended
September 30,
2020 | Year Ended
September 30,
2019 |
Net asset value, beginning of the period | | | | | |
INCOME (LOSS) FROM INVESTMENT OPERATIONS: | | | | | |
| | | | | |
Net realized and unrealized gain (loss) | | | | | |
Total from Investment Operations | | | | | |
| | | | | |
| | | | | |
Net realized capital gains | | | | | |
| | | | | |
Net asset value, end of the period | | | | | |
| | | | | |
RATIOS TO AVERAGE NET ASSETS: | | | | | |
Net assets, end of the period (000's) | | | | | |
| | | | | |
| | | | | |
| | | | | |
| | | | | |
| Per share net investment income has been calculated using the average shares outstanding during the period. |
| A sales charge for Class A shares is not reflected in total return calculations. |
| Had certain expenses not been waived/reimbursed during the period, total returns would have been lower. |
| The investment adviser agreed to waive its fees and/or reimburse a portion of the Fund’s expenses during the period. Without this waiver/reimbursement, expenses would have been higher. |
| Effective July 1, 2022, the expense limit decreased from 0.75% to 0.74%. |
| Effective July 1, 2020, the expense limit decreased from 0.80% to 0.75%. |
| The variation in the Fund’s turnover rate from 2019 to 2020 was primarily due to a significant repositioning of the portfolio. |
See accompanying notes to financial statements.
Financial Highlights (continued)
For a share outstanding throughout each period.
| Core Plus Bond Fund—Class C |
| Year Ended
September 30,
2023 | Year Ended
September 30,
2022 | Year Ended
September 30,
2021 | Year Ended
September 30,
2020 | Year Ended
September 30,
2019 |
Net asset value, beginning of the period | | | | | |
INCOME (LOSS) FROM INVESTMENT OPERATIONS: | | | | | |
| | | | | |
Net realized and unrealized gain (loss) | | | | | |
Total from Investment Operations | | | | | |
| | | | | |
| | | | | |
Net realized capital gains | | | | | |
| | | | | |
Net asset value, end of the period | | | | | |
| | | | | |
RATIOS TO AVERAGE NET ASSETS: | | | | | |
Net assets, end of the period (000's) | | | | | |
| | | | | |
| | | | | |
| | | | | |
| | | | | |
| Per share net investment income has been calculated using the average shares outstanding during the period. |
| A contingent deferred sales charge for Class C shares is not reflected in total return calculations. |
| Had certain expenses not been waived/reimbursed during the period, total returns would have been lower. |
| The investment adviser agreed to waive its fees and/or reimburse a portion of the Fund’s expenses during the period. Without this waiver/reimbursement, expenses would have been higher. |
| Effective July 1, 2022, the expense limit decreased from 1.50% to 1.49%. |
| Effective July 1, 2020, the expense limit decreased from 1.55% to 1.50%. |
| The variation in the Fund’s turnover rate from 2019 to 2020 was primarily due to a significant repositioning of the portfolio. |
See accompanying notes to financial statements.
Financial Highlights (continued)
For a share outstanding throughout each period.
| Core Plus Bond Fund—Class N |
| Year Ended
September 30,
2023 | Year Ended
September 30,
2022 | Year Ended
September 30,
2021 | Year Ended
September 30,
2020 | Year Ended
September 30,
2019 |
Net asset value, beginning of the period | | | | | |
INCOME (LOSS) FROM INVESTMENT OPERATIONS: | | | | | |
| | | | | |
Net realized and unrealized gain (loss) | | | | | |
Total from Investment Operations | | | | | |
| | | | | |
| | | | | |
Net realized capital gains | | | | | |
| | | | | |
Net asset value, end of the period | | | | | |
| | | | | |
RATIOS TO AVERAGE NET ASSETS: | | | | | |
Net assets, end of the period (000's) | | | | | |
| | | | | |
| | | | | |
| | | | | |
| | | | | |
| Per share net investment income has been calculated using the average shares outstanding during the period. |
| Effective July 1, 2022, the expense limit decreased from 0.45% to 0.44%. |
| Effective July 1, 2020, the expense limit decreased from 0.50% to 0.45%. |
| The variation in the Fund’s turnover rate from 2019 to 2020 was primarily due to a significant repositioning of the portfolio. |
See accompanying notes to financial statements.
Financial Highlights (continued)
For a share outstanding throughout each period.
| Core Plus Bond Fund—Class Y |
| Year Ended
September 30,
2023 | Year Ended
September 30,
2022 | Year Ended
September 30,
2021 | Year Ended
September 30,
2020 | Year Ended
September 30,
2019 |
Net asset value, beginning of the period | | | | | |
INCOME (LOSS) FROM INVESTMENT OPERATIONS: | | | | | |
| | | | | |
Net realized and unrealized gain (loss) | | | | | |
Total from Investment Operations | | | | | |
| | | | | |
| | | | | |
Net realized capital gains | | | | | |
| | | | | |
Net asset value, end of the period | | | | | |
| | | | | |
RATIOS TO AVERAGE NET ASSETS: | | | | | |
Net assets, end of the period (000's) | | | | | |
| | | | | |
| | | | | |
| | | | | |
| | | | | |
| Per share net investment income has been calculated using the average shares outstanding during the period. |
| Had certain expenses not been waived/reimbursed during the period, total returns would have been lower. |
| The investment adviser agreed to waive its fees and/or reimburse a portion of the Fund’s expenses during the period. Without this waiver/reimbursement, expenses would have been higher. |
| Effective July 1, 2022, the expense limit decreased from 0.50% to 0.49%. |
| Effective July 1, 2020, the expense limit decreased from 0.55% to 0.50%. |
| The variation in the Fund’s turnover rate from 2019 to 2020 was primarily due to a significant repositioning of the portfolio. |
See accompanying notes to financial statements.
Financial Highlights (continued)
For a share outstanding throughout each period.
| Credit Income Fund—Class A |
| Year Ended
September 30,
2023 | Year Ended
September 30,
2022 | Year Ended
September 30,
2021 | Period Ended
September 30,
|
Net asset value, beginning of the period | | | | |
INCOME (LOSS) FROM INVESTMENT OPERATIONS: | | | | |
Net investment income (loss)(a) | | | | |
Net realized and unrealized gain (loss) | | | | |
Total from Investment Operations | | | | |
| | | | |
| | | | |
Net realized capital gains | | | | |
| | | | |
Net asset value, end of the period | | | | |
| | | | |
RATIOS TO AVERAGE NET ASSETS: | | | | |
Net assets, end of the period (000's) | | | | |
| | | | |
| | | | |
Net investment income (loss) | | | | |
| | | | |
| From commencement of operations on September 29, 2020 through September 30, 2020. |
| Per share net investment income (loss) has been calculated using the average shares outstanding during the period. |
| Amount rounds to less than $0.01 per share. |
| A sales charge for Class A shares is not reflected in total return calculations. |
| Had certain expenses not been waived/reimbursed during the period, total returns would have been lower. |
| Periods less than one year are not annualized. |
| The investment adviser agreed to waive its fees and/or reimburse a portion of the Fund’s expenses during the period. Without this waiver/reimbursement, expenses would have been higher. |
| Computed on an annualized basis for periods less than one year. |
See accompanying notes to financial statements.
Financial Highlights (continued)
For a share outstanding throughout each period.
| Credit Income Fund—Class C |
| Year Ended
September 30,
2023 | Year Ended
September 30,
2022 | Year Ended
September 30,
2021 | Period Ended
September 30,
|
Net asset value, beginning of the period | | | | |
INCOME (LOSS) FROM INVESTMENT OPERATIONS: | | | | |
Net investment income (loss)(a) | | | | |
Net realized and unrealized gain (loss) | | | | |
Total from Investment Operations | | | | |
| | | | |
| | | | |
Net realized capital gains | | | | |
| | | | |
Net asset value, end of the period | | | | |
| | | | |
RATIOS TO AVERAGE NET ASSETS: | | | | |
Net assets, end of the period (000's) | | | | |
| | | | |
| | | | |
Net investment income (loss) | | | | |
| | | | |
| From commencement of operations on September 29, 2020 through September 30, 2020. |
| Per share net investment income (loss) has been calculated using the average shares outstanding during the period. |
| Amount rounds to less than $0.01 per share. |
| A contingent deferred sales charge for Class C shares is not reflected in total return calculations. |
| Had certain expenses not been waived/reimbursed during the period, total returns would have been lower. |
| Periods less than one year are not annualized. |
| The investment adviser agreed to waive its fees and/or reimburse a portion of the Fund’s expenses during the period. Without this waiver/reimbursement, expenses would have been higher. |
| Computed on an annualized basis for periods less than one year. |
See accompanying notes to financial statements.
Financial Highlights (continued)
For a share outstanding throughout each period.
| Credit Income Fund—Class N |
| Year Ended
September 30,
2023 | Year Ended
September 30,
2022 | Year Ended
September 30,
2021 | Period Ended
September 30,
|
Net asset value, beginning of the period | | | | |
INCOME (LOSS) FROM INVESTMENT OPERATIONS: | | | | |
| | | | |
Net realized and unrealized gain (loss) | | | | |
Total from Investment Operations | | | | |
| | | | |
| | | | |
Net realized capital gains | | | | |
| | | | |
Net asset value, end of the period | | | | |
| | | | |
RATIOS TO AVERAGE NET ASSETS: | | | | |
Net assets, end of the period (000's) | | | | |
| | | | |
| | | | |
| | | | |
| | | | |
| From commencement of operations on September 29, 2020 through September 30, 2020. |
| Per share net investment income has been calculated using the average shares outstanding during the period. |
| Amount rounds to less than $0.01 per share. |
| Had certain expenses not been waived/reimbursed during the period, total returns would have been lower. |
| Periods less than one year are not annualized. |
| The investment adviser agreed to waive its fees and/or reimburse a portion of the Fund’s expenses during the period. Without this waiver/reimbursement, expenses would have been higher. |
| Computed on an annualized basis for periods less than one year. |
See accompanying notes to financial statements.
Financial Highlights (continued)
For a share outstanding throughout each period.
| Credit Income Fund—Class Y |
| Year Ended
September 30,
2023 | Year Ended
September 30,
2022 | Year Ended
September 30,
2021 | Period Ended
September 30,
|
Net asset value, beginning of the period | | | | |
INCOME (LOSS) FROM INVESTMENT OPERATIONS: | | | | |
Net investment income (loss)(a) | | | | |
Net realized and unrealized gain (loss) | | | | |
Total from Investment Operations | | | | |
| | | | |
| | | | |
Net realized capital gains | | | | |
| | | | |
Net asset value, end of the period | | | | |
| | | | |
RATIOS TO AVERAGE NET ASSETS: | | | | |
Net assets, end of the period (000's) | | | | |
| | | | |
| | | | |
Net investment income (loss) | | | | |
| | | | |
| From commencement of operations on September 29, 2020 through September 30, 2020. |
| Per share net investment income (loss) has been calculated using the average shares outstanding during the period. |
| Amount rounds to less than $0.01 per share. |
| Had certain expenses not been waived/reimbursed during the period, total returns would have been lower. |
| Periods less than one year are not annualized. |
| The investment adviser agreed to waive its fees and/or reimburse a portion of the Fund’s expenses during the period. Without this waiver/reimbursement, expenses would have been higher. |
| Computed on an annualized basis for periods less than one year. |
See accompanying notes to financial statements.
Financial Highlights (continued)
For a share outstanding throughout each period.
| Global Allocation Fund—Class A |
| Year Ended
September 30,
2023 | Year Ended
September 30,
2022 | Year Ended
September 30,
2021 | Year Ended
September 30,
2020 | Year Ended
September 30,
2019 |
Net asset value, beginning of the period | | | | | |
INCOME (LOSS) FROM INVESTMENT OPERATIONS: | | | | | |
| | | | | |
Net realized and unrealized gain (loss) | | | | | |
Total from Investment Operations | | | | | |
| | | | | |
| | | | | |
Net realized capital gains | | | | | |
| | | | | |
Net asset value, end of the period | | | | | |
| | | | | |
RATIOS TO AVERAGE NET ASSETS: | | | | | |
Net assets, end of the period (000's) | | | | | |
| | | | | |
| | | | | |
| | | | | |
| | | | | |
| Per share net investment income has been calculated using the average shares outstanding during the period. |
| A sales charge for Class A shares is not reflected in total return calculations. |
See accompanying notes to financial statements.
Financial Highlights (continued)
For a share outstanding throughout each period.
| Global Allocation Fund—Class C |
| Year Ended
September 30,
2023 | Year Ended
September 30,
2022 | Year Ended
September 30,
2021 | Year Ended
September 30,
2020 | Year Ended
September 30,
2019 |
Net asset value, beginning of the period | | | | | |
INCOME (LOSS) FROM INVESTMENT OPERATIONS: | | | | | |
Net investment income (loss)(a) | | | | | |
Net realized and unrealized gain (loss) | | | | | |
Total from Investment Operations | | | | | |
| | | | | |
| | | | | |
Net realized capital gains | | | | | |
| | | | | |
Net asset value, end of the period | | | | | |
| | | | | |
RATIOS TO AVERAGE NET ASSETS: | | | | | |
Net assets, end of the period (000's) | | | | | |
| | | | | |
| | | | | |
Net investment income (loss) | | | | | |
| | | | | |
| Per share net investment income (loss) has been calculated using the average shares outstanding during the period. |
| Amount rounds to less than $0.01 per share. |
| A contingent deferred sales charge for Class C shares is not reflected in total return calculations. |
See accompanying notes to financial statements.
Financial Highlights (continued)
For a share outstanding throughout each period.
| Global Allocation Fund—Class N |
| Year Ended
September 30,
2023 | Year Ended
September 30,
2022 | Year Ended
September 30,
2021 | Year Ended
September 30,
2020 | Year Ended
September 30,
2019 |
Net asset value, beginning of the period | | | | | |
INCOME (LOSS) FROM INVESTMENT OPERATIONS: | | | | | |
| | | | | |
Net realized and unrealized gain (loss) | | | | | |
Total from Investment Operations | | | | | |
| | | | | |
| | | | | |
Net realized capital gains | | | | | |
| | | | | |
Net asset value, end of the period | | | | | |
| | | | | |
RATIOS TO AVERAGE NET ASSETS: | | | | | |
Net assets, end of the period (000's) | | | | | |
| | | | | |
| | | | | |
| | | | | |
| | | | | |
| Per share net investment income has been calculated using the average shares outstanding during the period. |
See accompanying notes to financial statements.
Financial Highlights (continued)
For a share outstanding throughout each period.
| Global Allocation Fund—Class Y |
| Year Ended
September 30,
2023 | Year Ended
September 30,
2022 | Year Ended
September 30,
2021 | Year Ended
September 30,
2020 | Year Ended
September 30,
2019 |
Net asset value, beginning of the period | | | | | |
INCOME (LOSS) FROM INVESTMENT OPERATIONS: | | | | | |
| | | | | |
Net realized and unrealized gain (loss) | | | | | |
Total from Investment Operations | | | | | |
| | | | | |
| | | | | |
Net realized capital gains | | | | | |
| | | | | |
Net asset value, end of the period | | | | | |
| | | | | |
RATIOS TO AVERAGE NET ASSETS: | | | | | |
Net assets, end of the period (000's) | | | | | |
| | | | | |
| | | | | |
| | | | | |
| | | | | |
| Per share net investment income has been calculated using the average shares outstanding during the period. |
See accompanying notes to financial statements.
Financial Highlights (continued)
For a share outstanding throughout each period.
| |
| Year Ended
September 30,
2023 | Year Ended
September 30,
2022 | Year Ended
September 30,
2021 | Year Ended
September 30,
2020 | Year Ended
September 30,
2019 |
Net asset value, beginning of the period | | | | | |
INCOME (LOSS) FROM INVESTMENT OPERATIONS: | | | | | |
Net investment income (loss)(a) | | | | | |
Net realized and unrealized gain (loss) | | | | | |
Total from Investment Operations | | | | | |
| | | | | |
| | | | | |
Net realized capital gains | | | | | |
| | | | | |
Net asset value, end of the period | | | | | |
| | | | | |
RATIOS TO AVERAGE NET ASSETS: | | | | | |
Net assets, end of the period (000's) | | | | | |
| | | | | |
| | | | | |
Net investment income (loss) | | | | | |
| | | | | |
| Per share net investment income (loss) has been calculated using the average shares outstanding during the period. |
| A sales charge for Class A shares is not reflected in total return calculations. |
See accompanying notes to financial statements.
Financial Highlights (continued)
For a share outstanding throughout each period.
| |
| Year Ended
September 30,
2023 | Year Ended
September 30,
2022 | Year Ended
September 30,
2021 | Year Ended
September 30,
2020 | Year Ended
September 30,
2019 |
Net asset value, beginning of the period | | | | | |
INCOME (LOSS) FROM INVESTMENT OPERATIONS: | | | | | |
| | | | | |
Net realized and unrealized gain (loss) | | | | | |
Total from Investment Operations | | | | | |
| | | | | |
Net realized capital gains | | | | | |
Net asset value, end of the period | | | | | |
| | | | | |
RATIOS TO AVERAGE NET ASSETS: | | | | | |
Net assets, end of the period (000's) | | | | | |
| | | | | |
| | | | | |
| | | | | |
| | | | | |
| Per share net investment loss has been calculated using the average shares outstanding during the period. |
| A contingent deferred sales charge for Class C shares is not reflected in total return calculations. |
See accompanying notes to financial statements.
Financial Highlights (continued)
For a share outstanding throughout each period.
| |
| Year Ended
September 30,
2023 | Year Ended
September 30,
2022 | Year Ended
September 30,
2021 | Year Ended
September 30,
2020 | Year Ended
September 30,
2019 |
Net asset value, beginning of the period | | | | | |
INCOME (LOSS) FROM INVESTMENT OPERATIONS: | | | | | |
Net investment income (loss)(a) | | | | | |
Net realized and unrealized gain (loss) | | | | | |
Total from Investment Operations | | | | | |
| | | | | |
| | | | | |
Net realized capital gains | | | | | |
| | | | | |
Net asset value, end of the period | | | | | |
| | | | | |
RATIOS TO AVERAGE NET ASSETS: | | | | | |
Net assets, end of the period (000's) | | | | | |
| | | | | |
| | | | | |
Net investment income (loss) | | | | | |
| | | | | |
| Per share net investment income (loss) has been calculated using the average shares outstanding during the period. |
See accompanying notes to financial statements.
Financial Highlights (continued)
For a share outstanding throughout each period.
| Intermediate Duration Bond Fund—Class A |
| Year Ended
September 30,
2023 | Year Ended
September 30,
2022 | Year Ended
September 30,
2021 | Year Ended
September 30,
2020 | Year Ended
September 30,
2019 |
Net asset value, beginning of the period | | | | | |
INCOME (LOSS) FROM INVESTMENT OPERATIONS: | | | | | |
| | | | | |
Net realized and unrealized gain (loss) | | | | | |
Total from Investment Operations | | | | | |
| | | | | |
| | | | | |
Net realized capital gains | | | | | |
| | | | | |
Net asset value, end of the period | | | | | |
| | | | | |
RATIOS TO AVERAGE NET ASSETS: | | | | | |
Net assets, end of the period (000's) | | | | | |
| | | | | |
| | | | | |
| | | | | |
| | | | | |
| Per share net investment income has been calculated using the average shares outstanding during the period. |
| Amount rounds to less than $0.01 per share. |
| A sales charge for Class A shares is not reflected in total return calculations. |
| Had certain expenses not been waived/reimbursed during the period, total returns would have been lower. |
| The investment adviser agreed to waive its fees and/or reimburse a portion of the Fund’s expenses during the period. Without this waiver/reimbursement, expenses would have been higher. |
See accompanying notes to financial statements.
Financial Highlights (continued)
For a share outstanding throughout each period.
| Intermediate Duration Bond Fund—Class C |
| Year Ended
September 30,
2023 | Year Ended
September 30,
2022 | Year Ended
September 30,
2021 | Year Ended
September 30,
2020 | Year Ended
September 30,
2019 |
Net asset value, beginning of the period | | | | | |
INCOME (LOSS) FROM INVESTMENT OPERATIONS: | | | | | |
| | | | | |
Net realized and unrealized gain (loss) | | | | | |
Total from Investment Operations | | | | | |
| | | | | |
| | | | | |
Net realized capital gains | | | | | |
| | | | | |
Net asset value, end of the period | | | | | |
| | | | | |
RATIOS TO AVERAGE NET ASSETS: | | | | | |
Net assets, end of the period (000's) | | | | | |
| | | | | |
| | | | | |
| | | | | |
| | | | | |
| Per share net investment income has been calculated using the average shares outstanding during the period. |
| A contingent deferred sales charge for Class C shares is not reflected in total return calculations. |
| Had certain expenses not been waived/reimbursed during the period, total returns would have been lower. |
| The investment adviser agreed to waive its fees and/or reimburse a portion of the Fund’s expenses during the period. Without this waiver/reimbursement, expenses would have been higher. |
See accompanying notes to financial statements.
Financial Highlights (continued)
For a share outstanding throughout each period.
| Intermediate Duration Bond Fund—Class N |
| Year Ended
September 30,
2023 | Year Ended
September 30,
2022 | Year Ended
September 30,
2021 | Year Ended
September 30,
2020 | Period Ended
September 30,
|
Net asset value, beginning of the period | | | | | |
INCOME (LOSS) FROM INVESTMENT OPERATIONS: | | | | | |
| | | | | |
Net realized and unrealized gain (loss) | | | | | |
Total from Investment Operations | | | | | |
| | | | | |
| | | | | |
Net realized capital gains | | | | | |
| | | | | |
Net asset value, end of the period | | | | | |
| | | | | |
RATIOS TO AVERAGE NET ASSETS: | | | | | |
Net assets, end of the period (000's) | | | | | |
| | | | | |
| | | | | |
| | | | | |
| | | | | |
| From commencement of Class operations on February 1, 2019 through September 30, 2019. |
| Per share net investment income has been calculated using the average shares outstanding during the period. |
| Had certain expenses not been waived/reimbursed during the period, total returns would have been lower. |
| Periods less than one year are not annualized. |
| The investment adviser agreed to waive its fees and/or reimburse a portion of the Fund’s expenses during the period. Without this waiver/reimbursement, expenses would have been higher. |
| Computed on an annualized basis for periods less than one year. |
| Represents the Fund’s portfolio turnover rate for year ended September 30, 2019. |
See accompanying notes to financial statements.
Financial Highlights (continued)
For a share outstanding throughout each period.
| Intermediate Duration Bond Fund—Class Y |
| Year Ended
September 30,
2023 | Year Ended
September 30,
2022 | Year Ended
September 30,
2021 | Year Ended
September 30,
2020 | Year Ended
September 30,
2019 |
Net asset value, beginning of the period | | | | | |
INCOME (LOSS) FROM INVESTMENT OPERATIONS: | | | | | |
| | | | | |
Net realized and unrealized gain (loss) | | | | | |
Total from Investment Operations | | | | | |
| | | | | |
| | | | | |
Net realized capital gains | | | | | |
| | | | | |
Net asset value, end of the period | | | | | |
| | | | | |
RATIOS TO AVERAGE NET ASSETS: | | | | | |
Net assets, end of the period (000's) | | | | | |
| | | | | |
| | | | | |
| | | | | |
| | | | | |
| Per share net investment income has been calculated using the average shares outstanding during the period. |
| Had certain expenses not been waived/reimbursed during the period, total returns would have been lower. |
| The investment adviser agreed to waive its fees and/or reimburse a portion of the Fund’s expenses during the period. Without this waiver/reimbursement, expenses would have been higher. |
See accompanying notes to financial statements.
Financial Highlights (continued)
For a share outstanding throughout each period.
| Limited Term Government and Agency Fund—Class A |
| Year Ended
September 30,
2023 | Year Ended
September 30,
2022 | Year Ended
September 30,
2021 | Year Ended
September 30,
2020 | Year Ended
September 30,
2019 |
Net asset value, beginning of the period | | | | | |
INCOME (LOSS) FROM INVESTMENT OPERATIONS: | | | | | |
| | | | | |
Net realized and unrealized gain (loss) | | | | | |
Total from Investment Operations | | | | | |
| | | | | |
| | | | | |
Net asset value, end of the period | | | | | |
| | | | | |
RATIOS TO AVERAGE NET ASSETS: | | | | | |
Net assets, end of the period (000's) | | | | | |
| | | | | |
| | | | | |
| | | | | |
| | | | | |
| Per share net investment income has been calculated using the average shares outstanding during the period. |
| A sales charge for Class A shares is not reflected in total return calculations. |
| Had certain expenses not been waived/reimbursed during the period, total returns would have been lower. |
| The investment adviser agreed to waive its fees and/or reimburse a portion of the Fund’s expenses during the period. Without this waiver/reimbursement, expenses would have been higher. |
| Includes refund of prior year service fee of 0.01%. See Note 6b of Notes to Financial Statements. |
| Includes refund of prior year service fee of 0.01%. |
| Effective July 1, 2021, the expense limit decreased from 0.75% to 0.70%. |
| Effective July 1, 2020, the expense limit decreased from 0.80% to 0.75%. |
| The variation in the Fund’s turnover rate from 2019 to 2020 is due to changes in volume of U.S. Treasury securities related to certain trading strategies. |
See accompanying notes to financial statements.
Financial Highlights (continued)
For a share outstanding throughout each period.
| Limited Term Government and Agency Fund—Class C |
| Year Ended
September 30,
2023 | Year Ended
September 30,
2022 | Year Ended
September 30,
2021 | Year Ended
September 30,
2020 | Year Ended
September 30,
2019 |
Net asset value, beginning of the period | | | | | |
INCOME (LOSS) FROM INVESTMENT OPERATIONS: | | | | | |
Net investment income (loss)(a) | | | | | |
Net realized and unrealized gain (loss) | | | | | |
Total from Investment Operations | | | | | |
| | | | | |
| | | | | |
Net asset value, end of the period | | | | | |
| | | | | |
RATIOS TO AVERAGE NET ASSETS: | | | | | |
Net assets, end of the period (000's) | | | | | |
| | | | | |
| | | | | |
Net investment income (loss) | | | | | |
| | | | | |
| Per share net investment income (loss) has been calculated using the average shares outstanding during the period. |
| Amount rounds to less than $0.01 per share. |
| A contingent deferred sales charge for Class C shares is not reflected in total return calculations. |
| Had certain expenses not been waived/reimbursed during the period, total returns would have been lower. |
| The investment adviser agreed to waive its fees and/or reimburse a portion of the Fund’s expenses during the period. Without this waiver/reimbursement, expenses would have been higher. |
| Effective July 1, 2021, the expense limit decreased from 1.50% to 1.45%. |
| Effective July 1, 2020, the expense limit decreased from 1.55% to 1.50%. |
| The variation in the Fund’s turnover rate from 2019 to 2020 is due to changes in volume of U.S. Treasury securities related to certain trading strategies. |
See accompanying notes to financial statements.
Financial Highlights (continued)
For a share outstanding throughout each period.
| Limited Term Government and Agency Fund—Class N |
| Year Ended
September 30,
2023 | Year Ended
September 30,
2022 | Year Ended
September 30,
2021 | Year Ended
September 30,
2020 | Year Ended
September 30,
2019 |
Net asset value, beginning of the period | | | | | |
INCOME (LOSS) FROM INVESTMENT OPERATIONS: | | | | | |
| | | | | |
Net realized and unrealized gain (loss) | | | | | |
Total from Investment Operations | | | | | |
| | | | | |
| | | | | |
Net asset value, end of the period | | | | | |
| | | | | |
RATIOS TO AVERAGE NET ASSETS: | | | | | |
Net assets, end of the period (000's) | | | | | |
| | | | | |
| | | | | |
| | | | | |
| | | | | |
| Per share net investment income has been calculated using the average shares outstanding during the period. |
| Had certain expenses not been waived/reimbursed during the period, total returns would have been lower. |
| The investment adviser agreed to waive its fees and/or reimburse a portion of the Fund’s expenses during the period. Without this waiver/reimbursement, expenses would have been higher. |
| Effective July 1, 2021, the expense limit decreased from 0.45% to 0.40% |
| Effective July 1, 2020, the expense limit decreased from 0.50% to 0.45%. |
| The variation in the Fund’s turnover rate from 2019 to 2020 is due to changes in volume of U.S. Treasury securities related to certain trading strategies. |
See accompanying notes to financial statements.
Financial Highlights (continued)
For a share outstanding throughout each period.
| Limited Term Government and Agency Fund—Class Y |
| Year Ended
September 30,
2023 | Year Ended
September 30,
2022 | Year Ended
September 30,
2021 | Year Ended
September 30,
2020 | Year Ended
September 30,
2019 |
Net asset value, beginning of the period | | | | | |
INCOME (LOSS) FROM INVESTMENT OPERATIONS: | | | | | |
| | | | | |
Net realized and unrealized gain (loss) | | | | | |
Total from Investment Operations | | | | | |
| | | | | |
| | | | | |
Net asset value, end of the period | | | | | |
| | | | | |
RATIOS TO AVERAGE NET ASSETS: | | | | | |
Net assets, end of the period (000's) | | | | | |
| | | | | |
| | | | | |
| | | | | |
| | | | | |
| Per share net investment income has been calculated using the average shares outstanding during the period. |
| Had certain expenses not been waived/reimbursed during the period, total returns would have been lower. |
| The investment adviser agreed to waive its fees and/or reimburse a portion of the Fund’s expenses during the period. Without this waiver/reimbursement, expenses would have been higher. |
| Effective July 1, 2021, the expense limit decreased from 0.50% to 0.45%. |
| Effective July 1, 2020, the expense limit decreased from 0.55% to 0.50%. |
| The variation in the Fund’s turnover rate from 2019 to 2020 is due to changes in volume of U.S. Treasury securities related to certain trading strategies. |
See accompanying notes to financial statements.
Notes to Financial Statements
1.Organization. Natixis Funds Trust I, Loomis Sayles Funds I and Loomis Sayles Funds II (the “Trusts” and each a “Trust”) are each organized as a Massachusetts business trust. Each Trust is registered under the Investment Company Act of 1940, as amended (the “1940 Act”) as an open-end management investment company. Each Declaration of Trust permits the Board of Trustees to authorize the issuance of an unlimited number of shares of the Trust in multiple series. The financial statements for certain funds of the Trusts are presented in separate reports. The following funds (individually, a “Fund” and collectively, the “Funds”) are included in this report:
Natixis Funds Trust I:
Loomis Sayles Core Plus Bond Fund ("Core Plus Bond Fund")
Loomis Sayles Funds I:
Loomis Sayles Intermediate Duration Bond Fund (“Intermediate Duration Bond Fund”)
Loomis Sayles Funds II:
Loomis Sayles Credit Income Fund (“Credit Income Fund”)
Loomis Sayles Global Allocation Fund (“Global Allocation Fund”)
Loomis Sayles Growth Fund (“Growth Fund”)
Loomis Sayles Limited Term Government and Agency Fund (“Limited Term Government and Agency Fund”)
Each Fund is a diversified investment company.
Each Fund, except Growth Fund, offers Class A, Class C, Class N and Class Y shares. Growth Fund was closed to new investors effective April 28, 2017. Growth Fund offers Class A, Class C, Class N, and Class Y shares to defined contribution and defined benefit plans, clients of registered investment advisers and registered representatives trading through intermediary programs/platforms on which the Fund is already available and existing shareholders.
Effective April 25, 2023, Growth Fund began accepting orders for the purchase of shares from new investors.
Class A shares are sold with a maximum front-end sales charge of 4.25% for Core Plus Bond Fund, Credit Income Fund and Intermediate Duration Bond Fund, 5.75% for Global Allocation Fund and Growth Fund, and 2.25% for Limited Term Government and Agency Fund. Class C shares do not pay a front-end sales charge, pay higher Rule 12b-1 fees than Class A shares for eight years (at which point they automatically convert to Class A shares) (prior to May 1, 2021, Class C shares automatically converted to Class A shares after ten years) and may be subject to a contingent deferred sales charge (“CDSC”) of 1.00% if those shares are redeemed within one year of acquisition, except for reinvested distributions. Class N and Class Y shares do not pay a front-end sales charge, a CDSC or Rule 12b-1 fees. Class N shares are offered with an initial minimum investment of $1,000,000. Class Y shares are offered with an initial minimum investment of $100,000. Certain categories of investors are exempted from the minimum investment amounts for Class N and Class Y as outlined in the relevant Funds' prospectus.
Most expenses can be directly attributed to a Fund. Expenses which cannot be directly attributed to a Fund are generally apportioned based on the relative net assets of each of the Funds in Natixis Funds Trust I, Natixis Funds Trust II, Natixis Funds Trust IV and Gateway Trust (“Natixis Funds Trusts”), Loomis Sayles Funds I and Loomis Sayles Funds II (“Loomis Sayles Funds Trusts”), and Natixis ETF Trust and Natixis ETF Trust II ("Natixis ETF Trusts"). Expenses of a Fund are borne pro rata by the holders of each class of shares, except that each class bears expenses unique to that class (such as the Rule 12b-1 fees applicable to Class A and Class C), and transfer agent fees are borne collectively for Class A, Class C and Class Y, and individually for Class N. In addition, each class votes as a class only with respect to its own Rule 12b-1 Plan. Shares of each class would receive their pro rata share of the net assets of the Fund if the Fund were liquidated. The Trustees approve separate distributions from net investment income on each class of shares.
2.Significant Accounting Policies. The following is a summary of significant accounting policies consistently followed by each Fund in the preparation of its financial statements. The Funds' financial statements follow the accounting and reporting guidelines provided for investment companies and are prepared in accordance with accounting principles generally accepted in the United States of America which require the use of management estimates that affect the reported amounts and disclosures in the financial statements. Actual results could differ from those estimates. Management has evaluated the events and transactions subsequent to year-end through the date the financial statements were issued and has determined that there were no material events that would require disclosure in the Funds' financial statements.
a. Valuation. Registered investment companies are required to value portfolio investments using an unadjusted, readily available market quotation. Each Fund obtains readily available market quotations from independent pricing services. Fund investments for which readily available market quotations are not available are priced at fair value pursuant to the Funds’ Valuation Procedures. The Board of Trustees has approved a valuation designee who is subject to the Board’s oversight.
Notes to Financial Statements (continued)
Unadjusted readily available market quotations that are utilized for exchange traded equity securities (including shares of closed-end investment companies and exchange-traded funds) include the last sale price quoted on the exchange where the security is traded most extensively. Futures contracts are valued at the closing settlement price on the exchange on which the valuation designee believes that, over time, they are traded most extensively. Shares of open-end investment companies are valued at net asset value (“NAV”) per share.
Exchange traded equity securities for which there is no reported sale during the day are fair valued at the closing bid quotation as reported by an independent pricing service. Unlisted equity securities (except unlisted preferred equity securities) are fair valued at the last sale price quoted in the market where they are traded most extensively or, if there is no reported sale during the day, the closing bid quotation as reported by an independent pricing service. If there is no last sale price or closing bid quotation available, unlisted equity securities will be fair valued using evaluated bids furnished by an independent pricing service, if available.
Debt securities and unlisted preferred equity securities are fair valued based on evaluated bids furnished to the Funds by an independent pricing service or bid prices obtained from broker-dealers. Short sales of debt investments are fair valued based on an evaluated ask price furnished to the Funds by an independent pricing service. Senior loans and collateralized loan obligations (“CLOs”) are fair valued at bid prices supplied by an independent pricing service, if available. Broker-dealer bid prices may be used to fair value debt, unlisted equities, senior loans and CLOs where an independent pricing service is unable to price an investment or where an independent pricing service does not provide a reliable price for the investment. Forward foreign currency contracts are fair valued utilizing interpolated rates determined based on information provided by an independent pricing service. Bilateral credit default swaps are fair valued based on mid prices (between the bid price and the ask price) supplied by an independent pricing service. Bilateral interest rate swaps are fair valued based on prices supplied by an independent pricing source. Centrally cleared swap agreements are fair valued at settlement prices of the clearing house on which the contracts were traded or prices obtained from broker-dealers.
The Funds may also fair value investments in other circumstances such as when extraordinary events occur after the close of a foreign market, but prior to the close of the New York Stock Exchange. This may include situations relating to a single issuer (such as a declaration of bankruptcy or a delisting of the issuer’s security from the primary market on which it has traded) as well as events affecting the securities markets in general (such as market disruptions or closings and significant fluctuations in U.S. and/or foreign markets). When fair valuing a Fund’s investments, the valuation designee may, among other things, use modeling tools or other processes that may take into account factors such as issuer specific information, or other related market activity and/or information that occurred after the close of the foreign market but before the time the Fund’s NAV is calculated. Fair valuation by the Fund(s) valuation designee may require subjective determinations about the value of the investment, and fair values used to determine a Fund’s NAV may differ from quoted or published prices, or from prices that are used by others, for the same investments. In addition, the use of fair value pricing may not always result in adjustments to the prices of investments held by a Fund.
b. Investment Transactions and Related Investment Income. Investment transactions are accounted for on a trade date plus one day basis for daily NAV calculation. However, for financial reporting purposes, investment transactions are reported on trade date. Dividend income (including income reinvested) and foreign withholding tax, if applicable, is recorded on the ex-dividend date, or in the case of certain foreign securities, as soon as a Fund is notified, and interest income is recorded on an accrual basis. Loan consent fees, upfront origination fees and/or amendment fees are recorded when received and included in interest income on the Statements of Operations. Interest income is increased by the accretion of discount and decreased by the amortization of premium, if applicable. Periodic principal adjustments for inflation-protected securities are recorded to interest income. Negative principal adjustments (in the event of deflation) are recorded as reductions of interest income to the extent of interest income earned, not to exceed the amount of positive principal adjustments on a cumulative basis. For securities with paydown provisions, principal payments received are treated as a proportionate reduction to the cost basis of the securities, and excess or shortfall amounts are recorded as income. In determining net gain or loss on securities sold, the cost of securities has been determined on an identified cost basis. Investment income, non-class specific expenses and realized and unrealized gains and losses are allocated on a pro rata basis to each class based on the relative net assets of each class to the total net assets of the Fund.
c. Short Sales. A short sale is a transaction in which a Fund sells a security it does not own, usually in anticipation of a decline in the fair market value of the security. When closing out a short position, a Fund will have to purchase the security it originally sold short. The value of short sales is reflected as a liability in the Statements of Assets and Liabilities and is marked-to-market daily. A Fund will realize a profit from closing out a short position if the price of the security sold short has declined since the short position was opened; a Fund will realize a loss from closing out a short position if the value of the shorted security has risen since the short position was opened. Because there is no upper limit on the price to which a security can rise, short selling exposes a Fund to potentially unlimited losses. The Funds intend to cover their short sale transactions by segregating or earmarking liquid assets, such that the segregated/earmarked amount, equals the current market value of the securities underlying the short sale.
Notes to Financial Statements (continued)
d. Foreign Currency Translation. The books and records of the Funds are maintained in U.S. dollars. The values of securities, currencies and other assets and liabilities denominated in currencies other than U.S. dollars, if any, are translated into U.S. dollars based upon foreign exchange rates prevailing at the end of the period. Purchases and sales of investment securities, income and expenses are translated into U.S. dollars on the respective dates of such transactions.
Net realized foreign exchange gains or losses arise from sales of foreign currency, changes in exchange rates between the trade and settlement dates on securities transactions and the difference between the amounts of dividends, interest and foreign withholding taxes recorded in the Funds’ books and records and the U.S. dollar equivalent of the amounts actually received or paid. Net unrealized foreign exchange gains or losses arise from changes in the value of assets and liabilities, other than investment securities, as of the end of the fiscal period, resulting from changes in exchange rates. Net realized foreign exchange gains or losses and the net change in unrealized foreign exchange gains or losses are disclosed in the Statements of Operations. For federal income tax purposes, net realized foreign exchange gains or losses are characterized as ordinary income, and may, if the Funds have net losses, reduce the amount of income available to be distributed by the Funds.
The values of investment securities are presented at the foreign exchange rates prevailing at the end of the period for financial reporting purposes. Net realized and unrealized gains or losses on investments reported in the Statements of Operations reflect gains or losses resulting from changes in exchange rates and fluctuations which arise due to changes in market prices of investment securities. For federal income tax purposes, a portion of the net realized gain or loss on investments arising from changes in exchange rates, which is reflected in the Statements of Operations, may be characterized as ordinary income and may, if the Funds have net losses, reduce the amount of income available to be distributed by the Funds.
The Funds may use foreign currency exchange contracts to facilitate transactions in foreign-denominated investments. Losses may arise from changes in the value of the foreign currency or if the counterparties do not perform under the contracts’ terms.
e. Forward Foreign Currency Contracts. A Fund may enter into forward foreign currency contracts, including forward foreign cross currency contracts, to acquire exposure to foreign currencies or to hedge the Funds’ investments against currency fluctuation. A contract can also be used to offset a previous contract. These contracts involve market risk in excess of the unrealized appreciation (depreciation) reflected in the Funds’ Statements of Assets and Liabilities. The U.S. dollar value of the currencies a Fund has committed to buy or sell represents the aggregate exposure to each currency a Fund has acquired or hedged through currency contracts outstanding at period end. Gains or losses are recorded for financial statement purposes as unrealized until settlement date. Contracts are traded over-the-counter directly with a counterparty. Risks may arise upon entering into these contracts from the potential inability of counterparties to meet the terms of their contracts and from unanticipated movements in the value of a foreign currency relative to the U.S. dollar. Certain contracts may require the movement of cash and/or securities as collateral for the Funds’ or counterparty’s net obligations under the contracts. Forward foreign currency contracts outstanding at the end of the period, if any, are listed in each applicable Fund's Portfolio of Investments.
f. Futures Contracts. A Fund may enter into futures contracts. Futures contracts are agreements between two parties to buy and sell a particular instrument or index for a specified price on a specified future date.
When a Fund enters into a futures contract, it is required to deposit with (or for the benefit of) its broker an amount of cash or short-term high-quality securities as “initial margin.” As the value of the contract changes, the value of the futures contract position increases or declines. Subsequent payments, known as “variation margin,” are made or received by a Fund, depending on the price fluctuations in the fair value of the contract and the value of cash or securities on deposit with the broker. The aggregate principal amounts of the contracts are not recorded in the financial statements. Daily fluctuations in the value of the contracts are recorded in the Statements of Assets and Liabilities as a receivable (payable) and in the Statements of Operations as unrealized appreciation (depreciation) until the contracts are closed, when they are recorded as realized gains (losses). Realized gain or loss on a futures position is equal to the difference between the value of the contract at the time it was opened and the value at the time it was closed, minus brokerage commissions. When a Fund enters into a futures contract certain risks may arise, such as illiquidity in the futures market, which may limit a Fund’s ability to close out a futures contract prior to settlement date, and unanticipated movements in the value of securities or interest rates. Futures contracts outstanding at the end of the period, if any, are listed in each applicable Fund’s Portfolio of Investments.
Futures contracts are exchange-traded. Exchange-traded futures contracts are standardized and are settled through a clearing house with fulfillment supported by the credit of the exchange. Therefore, counterparty credit risks to the Funds are reduced; however, in the event that a counterparty enters into bankruptcy, a Fund’s claim against initial/variation margin on deposit with the counterparty may be subject to terms of a final settlement in bankruptcy court.
g. Swap Agreements. A Fund may enter into credit default swaps. A credit default swap is an agreement between two parties (the “protection buyer” and “protection seller”) to exchange the credit risk of an issuer (“reference obligation”) for a specified time period.
Notes to Financial Statements (continued)
The reference obligation may be one or more debt securities or an index of such securities. The Funds may be either the protection buyer or the protection seller. As a protection buyer, the Funds have the ability to hedge the downside risk of an issuer or group of issuers. As a protection seller, the Funds have the ability to gain exposure to an issuer or group of issuers whose bonds are unavailable or in short supply in the cash bond market, as well as realize additional income in the form of fees paid by the protection buyer. The protection buyer is obligated to pay the protection seller a stream of payments (“fees”) over the term of the contract, provided that no credit event, such as a default or a downgrade in credit rating, occurs on the reference obligation. The Funds may also pay or receive upfront premiums. If a credit event occurs, the protection seller must pay the protection buyer the difference between the agreed upon notional value and market value of the reference obligation. Market value in this case is determined by a facilitated auction whereby a minimum number of allowable broker bids, together with a specified valuation method, are used to calculate the value. The maximum potential amount of undiscounted future payments that a Fund as the protection seller could be required to make under a credit default swap agreement would be an amount equal to the notional amount of the agreement.
Implied credit spreads, represented in absolute terms, are disclosed in the Portfolio of Investments for those agreements for which the Fund is the protection seller. Implied credit spreads serve as an indicator of the current status of the payment/performance risk and represent the likelihood or risk of default for the credit derivative. The implied credit spread of a particular reference entity reflects the cost of buying/selling protection and may include upfront payments required to be made to enter into the agreement. Wider credit spreads represent a deterioration of the reference entity’s credit soundness and a greater likelihood or risk of default or other credit event occurring as defined under the terms of the agreement.
The notional amounts of swap agreements are not recorded in the financial statements. Swap agreements are valued daily and fluctuations in the value are recorded in the Statements of Operations as change in unrealized appreciation (depreciation) on swap agreements. Fees are accrued in accordance with the terms of the agreement and are recorded in the Statement of Assets and Liabilities as part of unrealized appreciation (depreciation) on swap agreements. When received or paid, fees are recorded in the Statement of Operations as realized gain or loss. Upfront premiums paid or received by the Funds are recorded on the Statements of Assets and Liabilities as an asset or liability, respectively, and are amortized or accreted over the term of the agreement and recorded as realized gain or loss. Payments made or received by the Funds as a result of a credit event or termination of the agreement are recorded as realized gain or loss.
Swap agreements are privately negotiated in the over-the-counter market and may be entered into as a bilateral contract or centrally cleared (“centrally cleared swaps”). Bilateral swap agreements are traded between counterparties and, as such, are subject to the risk that a party to the agreement will not be able to meet its obligations. In a centrally cleared swap, immediately following execution of the swap agreement, the swap agreement is novated to a central counterparty (the “CCP”) and the Fund faces the CCP through a broker. Upon entering into a centrally cleared swap, the Fund is required to deposit initial margin with the broker in the form of cash or securities in an amount that varies depending on the size and risk profile of the particular swap. Subsequent payments, known as “variation margin,” are made or received by the Fund based on the daily change in the value of the centrally cleared swap agreement. For centrally cleared swaps, the Fund’s counterparty credit risk is reduced as the CCP stands between the Fund and the counterparty. Swap agreements outstanding at the end of the period, if any, are listed in each applicable Fund's Portfolio of Investments.
h. When-Issued and Delayed Delivery Transactions. A Fund may enter into when-issued or delayed delivery transactions. When-issued refers to transactions made conditionally because a security, although authorized, has not been issued. Delayed delivery refers to transactions for which delivery or payment will occur at a later date, beyond the normal settlement period. The price of when-issued and delayed delivery securities and the date when the securities will be delivered and paid for are fixed at the time the transaction is negotiated. The security and the obligation to pay for it are recorded by the Funds at the time the commitment is entered into. The value of the security may vary with market fluctuations during the time before the Funds take delivery of the security. No interest accrues to the Funds until the transaction settles.
Delayed delivery transactions include those designated as To Be Announced (“TBAs”) in the Portfolios of Investments. For TBAs, the actual security that will be delivered to fulfill the transaction is not designated at the time of the trade. The security is "to be announced" 48 hours prior to the established trade settlement date. Certain transactions require the Funds or counterparty to post cash and/or securities as collateral for the net mark-to-market exposure to the other party.
Purchases of when-issued or delayed delivery securities may have a similar effect on the Funds’ NAV as if the Funds’ had created a degree of leverage in the portfolio. Risks may arise upon entering into such transactions from the potential inability of counterparties to meet their obligations under the transactions. Additionally, losses may arise due to changes in the value of the underlying securities.
i. Federal and Foreign Income Taxes. The Trusts treat each Fund as a separate entity for federal income tax purposes. Each Fund intends to meet the requirements of the Internal Revenue Code of 1986, as amended, applicable to regulated investment companies, and to distribute to its shareholders substantially all of its net investment income and any net realized capital gains at least annually.
Notes to Financial Statements (continued)
Management has performed an analysis of each Fund’s tax positions for the open tax years as of September 30, 2023 and has concluded that no provisions for income tax are required. The Funds’ federal tax returns for the prior three fiscal years, where applicable, remain subject to examination by the Internal Revenue Service. Management is not aware of any events that are reasonably possible to occur in the next twelve months that would result in the amounts of any unrecognized tax benefits significantly increasing or decreasing for the Funds. However, management’s conclusions regarding tax positions taken may be subject to review and adjustment at a later date based on factors including, but not limited to, new tax laws and accounting regulations and interpretations thereof.
A Fund may be subject to foreign withholding taxes on investment income and taxes on capital gains on investments that are accrued and paid based upon the Fund’s understanding of the tax rules and regulations that exist in the countries in which the Fund invests. Foreign withholding taxes on dividend and interest income are reflected on the Statements of Operations as a reduction of investment income, net of amounts that have been or are expected to be reclaimed and paid. Dividends and interest receivable on the Statements of Assets and Liabilities are net of foreign withholding taxes. Foreign withholding taxes where reclaims have been or are expected to be filed and paid are reflected on the Statements of Assets and Liabilities as tax reclaims receivable. Capital gains taxes paid are included in net realized gain (loss) on investments in the Statements of Operations. Accrued but unpaid capital gains taxes are reflected as foreign taxes payable on the Statements of Assets and Liabilities, if applicable, and reduce unrealized gains on investments. In the event that realized gains on investments are subsequently offset by realized losses, taxes paid on realized gains may be returned to a Fund. Such amounts, if applicable, are reflected as foreign tax rebates receivable on the Statements of Assets
and Liabilities and are recorded as a realized gain when received.
Certain Funds have filed tax reclaims for previously withheld taxes on dividends earned in certain European Union countries ("EU reclaims") and may continue to make such filings when it is determined to be in the best interest of the Funds and their shareholders. These filings are subject to various administrative proceedings by the local jurisdictions’ tax authorities within the European Union, as well as a number of related judicial proceedings. EU reclaims are recognized by a Fund when deemed more likely than not to be collected, and are reflected as a reduction of foreign taxes withheld in the Statements of Operations. Any related receivable is reflected as tax reclaims receivable in the Statements of Assets and Liabilities. Under certain circumstances, EU reclaims may be subject to closing agreements with the Internal Revenue Service ("IRS"), which may materially reduce the reclaim amounts realized by the Funds. Fees and expenses associated with closing agreements will be reflected in the Statements of Operations when it is determined that a closing agreement with the IRS is required.
j. Dividends and Distributions to Shareholders. Dividends and distributions are recorded on the ex-dividend date. The timing and characterization of certain income and capital gain distributions are determined in accordance with federal tax regulations, which may differ from accounting principles generally accepted in the United States of America. Permanent differences are primarily due to differing treatments for book and tax purposes of items such as foreign currency gains and losses, net operating losses, premium amortization, capital gains taxes, convertible bond adjustments, defaulted and/or non-income producing securities, return of capital distributions received, redemptions in-kind, trust preferred securities and paydown gains and losses. Permanent book and tax basis differences relating to shareholder distributions will result in reclassifications to capital accounts reported on the Statements of Assets and Liabilities. Temporary differences between book and tax distributable earnings are primarily due to deferred Trustees’ fees, forward foreign currency contract mark-to-market, wash sales, premium amortization, futures contract mark-to-market, convertible bond adjustments, defaulted and/or non-income producing securities, dividends payable, return of capital distributions received, trust preferred securities and paydown gains and losses. Amounts of income and capital gain available to be distributed on a tax basis are determined annually, and at other times during the Funds’ fiscal year as may be necessary to avoid knowingly declaring and paying a return of capital distribution. Distributions from net investment income and net realized short-term capital gains are considered to be distributed from ordinary income for tax purposes.
Notes to Financial Statements (continued)
The tax characterization of distributions is determined on an annual basis. The tax character of distributions paid to shareholders during the years ended September 30, 2023 and 2022 was as follows:
| | |
| | | | | | |
| | | | | | |
| | | | | | |
| | | | | | |
| | | | | | |
Intermediate Duration Bond Fund | | | | | | |
Limited Term Government and Agency Fund | | | | | | |
Distributions paid to shareholders from net investment income and net realized capital gains, based on accounting principles generally accepted in the United States of America, are consolidated and reported on the Statements of Changes in Net Assets as Distributions to Shareholders. Distributions paid to shareholders from net investment income and net realized capital gains expressed in per-share amounts, based on accounting principles generally accepted in the United States of America, are separately stated and reported within the Financial Highlights.
As of September 30, 2023, the components of distributable earnings on a tax basis were as follows:
| | | | |
Undistributed ordinary income | | | | |
Undistributed long-term capital gains | | | | |
Total undistributed earnings | | | | |
Capital loss carryforward: | | | | |
| | | | |
| | | | |
| | | | |
| | | | |
Total capital loss carryforward | | | | |
Late-year ordinary and post-October
| | | | |
Unrealized appreciation (depreciation) | | | | |
Total accumulated earnings (losses) | | | | |
| Under current tax law, net operating losses, capital losses, foreign currency losses, and losses on passive foreign investment companies and contingent payment debt instruments after October 31 or December 31, as applicable, may be deferred and treated as occurring on the first day of the following taxable year. Credit Income Fund is deferring capital losses, Global Allocation Fund is deferring currency losses and Growth Fund is deferring net operating losses. |
Notes to Financial Statements (continued)
| Intermediate
Duration Bond
Fund | Limited Term
Government
and Agency
Fund |
Undistributed ordinary income | | |
Capital loss carryforward: | | |
| | |
| | |
| | |
| | |
Total capital loss carryforward | | |
| | |
| | |
As of September 30, 2023, the tax cost of investments (including derivatives, if applicable) and unrealized appreciation (depreciation) on a federal tax basis were as follows:
| | | | | Intermediate
Duration Bond
Fund | Limited Term
Government
and Agency
Fund |
| | | | | | |
| | | | | | |
| | | | | | |
Net tax appreciation (depreciation) | | | | | | |
The difference between these amounts and those reported in the components of distributable earnings, if any, is primarily attributable to capital gains taxes and foreign exchange gains or losses.
k. Senior Loans. A Fund’s investment in senior loans may be to corporate, governmental or other borrowers. Senior loans, which include both secured and unsecured loans made by banks and other financial institutions to corporate customers, typically hold the most senior position in a borrower’s capital structure, may be secured by the borrower’s assets and have interest rates that reset frequently. Senior Loans can include term loans, revolving credit facility loans and second lien loans. A senior loan is often administered by a bank or other financial institution that acts as agent for all holders. The agent administers the terms of the senior loan, as specified in the loan agreement. Large loans may be shared or syndicated among several lenders. The Fund may enter into the primary syndicate for a loan or it may also purchase all or a portion of loans from other lenders (sometimes referred to as loan assignments), in either case becoming a direct lender. The settlement period for senior loans is uncertain as there is no standardized settlement schedule applicable to such investments. Senior loans outstanding at the end of the period, if any, are listed in each applicable Fund’s Portfolio of Investments.
l. Collateralized Loan Obligations. A Fund may invest in CLOs. A CLO is a type of asset-backed security designed to redirect the cash flows from a pool of leveraged loans to investors based on their risk preferences. Cash flows from a CLO are split into two or more portions, called tranches, varying in risk and yield. The risk of an investment in a CLO depends largely on the type of the collateralized securities and the class of the instrument in which the Fund invests. CLOs outstanding at the end of the period, if any, are listed in each applicable Fund’s Portfolio of Investments.
m. Repurchase Agreements. Each Fund may enter into repurchase agreements, under the terms of a Master Repurchase Agreement, under which each Fund acquires securities as collateral and agrees to resell the securities at an agreed upon time and at an agreed upon price. It is each Fund’s policy that the market value of the collateral for repurchase agreements be at least equal to 102% of the repurchase price, including interest. Certain repurchase agreements are tri-party arrangements whereby the collateral is held in a segregated account for the benefit of the Fund and on behalf of the counterparty. Repurchase agreements could involve certain risks in the event of default or insolvency of the counterparty, including possible delays or restrictions upon a Fund’s ability to dispose of the underlying securities. As of September 30, 2023, each Fund, as applicable, had investments in repurchase agreements for which the
Notes to Financial Statements (continued)
value of the related collateral exceeded the value of the repurchase agreement. The gross value of repurchase agreements is included in the Statements of Assets and Liabilities for financial reporting purposes.
n. Due to/from Brokers. Transactions and positions in certain futures, forward foreign currency contracts and swap agreements are maintained and cleared by registered U.S. broker/dealers pursuant to customer agreements between the Funds and the various broker/ dealers. The due from brokers balance in the Statements of Assets and Liabilities for Credit Income Fund represents cash pledged as initial margin for closed centrally cleared swap agreements. The due from brokers balance in the Statements of Assets and Liabilities for Global Allocation Fund represents cash pledged as collateral for forward foreign currency contracts and as initial margin for futures contracts and closed centrally cleared swap agreements. The due from brokers balance in the Statements of Assets and Liabilities for Intermediate Duration Bond Fund represents cash pledged as initial margin for futures contracts. The due to brokers balance in the Statements of Assets and Liabilities for Core Plus Bond Fund represents cash received as collateral for delayed delivery securities. The due to brokers balance in the Statements of Assets and Liabilities for Global Allocation Fund represents cash received as collateral for forward foreign currency contracts. In certain circumstances a Fund’s use of cash held at brokers is restricted by regulation or broker mandated limits.
o. Indemnifications. Under the Trusts' organizational documents, their officers and Trustees are indemnified against certain liabilities arising out of the performance of their duties to the Funds. Additionally, in the normal course of business, the Funds enter into contracts with service providers that contain general indemnification clauses. The Funds’ maximum exposure under these arrangements is unknown as this would involve future claims that may be made against the Funds that have not yet occurred. However, based on experience, the Funds expect the risk of loss to be remote.
p. New Accounting Pronouncement. In March 2020, the Financial Accounting Standards Board (“FASB”) issued ASU 2020-04, Reference Rate Reform (Topic 848) (“ASU 2020-04”) in response to concerns about structural risks of interbank offered rates, and particularly the risk of cessation of the London Interbank Offered Rate (“LIBOR”), which was expected to occur no later than June 30, 2023. In January 2021, FASB issued Accounting Standard Update 2021-01 (“ASU 2021-01”), which is an update of ASU 2020-04. Regulators have undertaken reference rate reform initiatives to identify alternative reference rates that are more observable or transaction based and less susceptible to manipulation than LIBOR. ASU 2020-04 provides temporary guidance to ease the potential burden in accounting for (or recognizing the effects of) reference rate reform on financial reporting. ASU 2020-04 is elective and applies to all entities, subject to meeting certain criteria, that have contracts that reference LIBOR or another reference rate expected to be discontinued because of reference rate reform. ASU 2020-04 amendments offer optional expedients for contract modifications that would allow an entity to account for such modifications by prospectively adjusting the effective interest rate, instead of evaluating each contract, in accordance with existing accounting standards, as to whether reference rate modifications constitute the establishment of new contracts or the continuation of existing contracts. ASU 2021-01 clarifies that certain provisions in Topic 848, if elected by an entity, apply to derivative instruments that use an interest rate for margining, discounting, or contract price alignment that is modified as a result of reference rate reform. In December 2022, FASB issued a further update to Topic 848 under ASU 2022-06, which defers the sunset date of Topic 848 to December 31, 2024, after which entities will no longer be permitted to apply the optional expedients provided in Topic 848. As of June 30, 2023, LIBOR had ceased to be published on a representative basis, and will be replaced by an alternative reference rate at the next reset date subsequent to June 30, 2023 for all investments for which LIBOR is the current reference rate. Management has elected to apply the optional expedients when appropriate and account for such modifications by prospectively adjusting the effective interest rate. There is no material impact to the Funds' financial statements.
3.Fair Value Measurements. In accordance with accounting standards related to fair value measurements and disclosures, the Funds have categorized the inputs utilized in determining the value of each Fund’s assets or liabilities. These inputs are summarized in the three broad levels listed below:
• Level 1 — quoted prices in active markets for identical assets or liabilities;
• Level 2 — prices determined using other significant inputs that are observable either directly, or indirectly through corroboration with observable market data (which could include quoted prices for similar assets or liabilities, interest rates, credit risk, etc.); and
• Level 3 — prices determined using significant unobservable inputs when quoted prices or observable inputs are unavailable such as when there is little or no market activity for an asset or liability (unobservable inputs reflect each Fund’s own assumptions in determining the fair value of assets or liabilities and would be based on the best information available).
The inputs or methodology used for valuing securities are not necessarily an indication of the risk associated with investing in those securities.
Notes to Financial Statements (continued)
The Funds' pricing policies have been approved by the Board of Trustees. Investments for which market quotations are readily available are categorized in Level 1. Other investments for which an independent pricing service is utilized are categorized in Level 2. Broker-dealer bid prices for which the Funds have knowledge of the inputs used by the broker-dealer are categorized in Level 2. All other investments, including broker-dealer bid prices for which the Funds do not have knowledge of the inputs used by the broker-dealer, as well as investments fair valued by the valuation designee, are categorized in Level 3. All Level 2 and 3 securities are defined as being fair valued.
Under certain conditions and based upon specific facts and circumstances, the Fund’s valuation designee may determine that a fair valuation should be made for portfolio investment(s). These valuation designee fair valuations will be based upon a significant amount of Level 3 inputs.
The following is a summary of the inputs used to value the Funds' investments as of September 30, 2023, at value:
|
|
| | | | |
| | | | |
| | | | |
Collateralized Mortgage Obligations | | | | |
All Other Non-Convertible Bonds(a) | | | | |
Total Non-Convertible Bonds | | | | |
| | | | |
| | | | |
Collateralized Loan Obligations | | | | |
| | | | |
| | | | |
|
Liability Valuation Inputs |
| | | | |
Futures Contracts (unrealized depreciation) | | | | |
| Details of the major categories of the Fund’s investments are reflected within the Portfolio of Investments. |
Notes to Financial Statements (continued)
|
|
| | | | |
| | | | |
Collateralized Loan Obligations | | | | |
| | | | |
| | | | |
| | | | |
Futures Contracts (unrealized appreciation) | | | | |
| | | | |
|
Liability Valuation Inputs |
| | | | |
Futures Contracts (unrealized depreciation) | | | | |
| Details of the major categories of the Fund’s investments are reflected within the Portfolio of Investments. |
|
|
| | | | |
| | | | |
| | | | |
| | | | |
| | | | |
| | | | |
| | | | |
| | | | |
| | | | |
| | | | |
| | | | |
| | | | |
| | | | |
| | | | |
| | | | |
Forward Foreign Currency Contracts (unrealized appreciation) | | | | |
Futures Contracts (unrealized appreciation) | | | | |
| | | | |
|
Liability Valuation Inputs |
| | | | |
Forward Foreign Currency Contracts (unrealized depreciation) | | | | |
Futures Contracts (unrealized depreciation) | | | | |
| | | | |
| Details of the major categories of the Fund’s investments are reflected within the Portfolio of Investments. |
Notes to Financial Statements (continued)
| Details of the major categories of the Fund’s investments are reflected within the Portfolio of Investments. |
Intermediate Duration Bond Fund |
|
| | | | |
| | | | |
Collateralized Mortgage Obligations | | | | |
All Other Bonds and Notes(a) | | | | |
| | | | |
| | | | |
| | | | |
|
Liability Valuation Inputs |
| | | | |
Futures Contracts (unrealized depreciation) | | | | |
| Details of the major categories of the Fund’s investments are reflected within the Portfolio of Investments. |
Limited Term Government and Agency Fund |
|
| | | | |
| | | | |
Collateralized Mortgage Obligations | | | | |
All Other Bonds and Notes(a) | | | | |
| | | | |
| | | | |
| | | | |
| Details of the major categories of the Fund’s investments are reflected within the Portfolio of Investments. |
Notes to Financial Statements (continued)
The following is a reconciliation of Level 3 investments for which significant unobservable inputs were used to determine fair value as of September 30, 2022 and/or September 30, 2023:
|
|
| Balance as of
September 30,
2022 | Accrued
Discounts
(Premiums) | | Change in
Unrealized
Appreciation
(Depreciation) | | | | | Balance as of
September 30,
2023 | Change in
Unrealized
Appreciation
(Depreciation)
from
Investments
Still Held at
September 30,
2023 |
| | | | | | | | | | |
| | | | | | | | | | |
Collateralized Mortgage Obligations | | | | | | | | | | |
Intermediate Duration Bond Fund |
|
| Balance as of
September 30,
2022 | Accrued
Discounts
(Premiums) | | Change in
Unrealized
Appreciation
(Depreciation) | | | | | Balance as of
September 30,
2023 | Change in
Unrealized
Appreciation
(Depreciation)
from
Investments
Still Held at
September 30,
2023 |
| | | | | | | | | | |
Collateralized Mortgage Obligations | | | | | | | | | | |
Limited Term Government and Agency Fund |
|
| Balance as of
September 30,
2022 | Accrued
Discounts
(Premiums) | | Change in
Unrealized
Appreciation
(Depreciation) | | | | | Balance as of
September 30,
2023 | Change in
Unrealized
Appreciation
(Depreciation)
from
Investments
Still Held at
September 30,
2023 |
| | | | | | | | | | |
Collateralized Mortgage Obligations | | | | | | | | | | |
Debt securities valued at $3,335,230 were transferred from Level 2 to Level 3 during the period ended September 30, 2023. At September 30, 2022, these securities were fair valued based on evaluated bids furnished to the Fund by an independent pricing service in accordance with the Fund's valuation policies. At September 30, 2023, these securities were fair valued as determined by the Fund's valuation designee as an independent pricing service did not provide a reliable price for the securities.
Notes to Financial Statements (continued)
4.Derivatives. Derivative instruments are defined as financial instruments whose value and performance are based on the value and performance of an underlying asset, reference rate or index. Derivative instruments that Core Plus Bond Fund, Credit Income Fund, Global Allocation Fund and Intermediate Duration Bond Fund used during the period include forward foreign currency contracts and futures contracts.
The Funds are subject to the risk that changes in foreign currency exchange rates will have an unfavorable effect on the value of Fund assets denominated in foreign currencies. The Funds may enter into forward foreign currency contracts for hedging purposes to protect the value of the Funds’ holdings of foreign securities. The Funds may also use forward foreign currency contracts to gain exposure to foreign currencies, regardless of whether securities denominated in such currencies are held in the Funds. During the year ended September 30, 2023, Global Allocation Fund engaged in forward foreign currency transactions for hedging purposes and to gain exposure to foreign currencies.
The Funds are subject to the risk that changes in interest rates will affect the value of the Funds’ investments in fixed income securities. The Funds will be subject to increased interest rate risk to the extent that they invest in fixed income securities with longer maturities or durations, as compared to investing in fixed income securities with shorter maturities or durations. The Funds may use futures contracts to hedge against changes in interest rates and to manage duration without having to buy or sell portfolio securities. The Funds may also use futures contracts to gain investment exposure. During the year ended September 30, 2023, Core Plus Bond Fund, Credit Income Fund, Global Allocation Fund and Intermediate Duration Bond Fund each used futures contracts to manage duration.
The following is a summary of derivative instruments for Core Plus Bond Fund as of September 30, 2023, as reflected within the Statements of Assets and Liabilities:
| Unrealized
depreciation
on futures
|
Exchange-traded liability derivatives | |
| |
| Represents cumulative unrealized appreciation (depreciation) on futures contracts. Only the current day’s variation margin on futures contracts is reported within the Statements of Assets and Liabilities as receivable or payable for variation margin, as applicable. |
Transactions in derivative instruments for Core Plus Bond Fund during the year ended September 30, 2023, as reflected within the Statements of Operations were as follows:
Net Realized Gain (Loss) on: | |
| |
Net Change in Unrealized
Appreciation (Depreciation) on: | |
| |
The following is a summary of derivative instruments for Credit Income Fund as of September 30, 2023, as reflected within the Statements of Assets and Liabilities:
| Unrealized
appreciation
on futures
|
Exchange-traded asset derivatives | |
| |
Notes to Financial Statements (continued)
| Unrealized
depreciation
on futures
|
Exchange-traded liability derivatives | |
| |
| Represents cumulative unrealized appreciation (depreciation) on futures contracts. Only the current day’s variation margin on futures contracts is reported within the Statements of Assets and Liabilities as receivable or payable for variation margin, as applicable. |
Transactions in derivative instruments for Credit Income Fund during the year ended September 30, 2023, as reflected within the Statements of Operations were as follows:
Net Realized Gain (Loss) on: | |
| |
Net Change in Unrealized
Appreciation (Depreciation) on: | |
| |
The following is a summary of derivative instruments for Global Allocation Fund as of September 30, 2023, as reflected within the Statements of Assets and Liabilities:
| Unrealized
appreciation
on forward
foreign
currency
contracts | Unrealized
appreciation
on futures
| |
Over-the-counter asset derivatives | | | |
Foreign exchange contracts | | | |
Exchange-traded asset derivatives | | | |
| | | |
| | | |
| Unrealized
depreciation
on forward
foreign
currency
contracts | Unrealized
depreciation
on futures
| |
Over-the-counter liability derivatives | | | |
Foreign exchange contracts | | | |
Exchange-traded liability derivatives | | | |
| | | |
Total liability derivatives | | | |
| Represents cumulative unrealized appreciation (depreciation) on futures contracts. Only the current day’s variation margin on futures contracts is reported within the Statements of Assets and Liabilities as receivable or payable for variation margin, as applicable. |
Notes to Financial Statements (continued)
Transactions in derivative instruments for Global Allocation Fund during the year ended September 30, 2023, as reflected within the Statements of Operations were as follows:
Net Realized Gain (Loss) on: | Forward
foreign
currency
contracts | |
| | |
Foreign exchange contracts | | |
| | |
Net Change in Unrealized
Appreciation (Depreciation) on: | Forward
foreign
currency
contracts | |
| | |
Foreign exchange contracts | | |
| | |
The following is a summary of derivative instruments for Intermediate Duration Bond Fund as of September 30, 2023, as reflected within the Statements of Assets and Liabilities:
| Unrealized
depreciation
on futures
|
Exchange-traded liability derivatives | |
| |
| Represents cumulative unrealized appreciation (depreciation) on futures contracts. Only the current day’s variation margin on futures contracts is reported within the Statements of Assets and Liabilities as receivable or payable for variation margin, as applicable. |
Transactions in derivative instruments for Intermediate Duration Bond Fund during the year ended September 30, 2023, as reflected within the Statements of Operations were as follows:
Net Realized Gain (Loss) on: | |
| |
Net Change in Unrealized
Appreciation (Depreciation) on: | |
| |
As the Funds value their derivatives at fair value and recognize changes in fair value through the Statements of Operations, they do not qualify for hedge accounting under authoritative guidance for derivative instruments. The Funds’ investments in derivatives may represent an economic hedge; however, they are considered to be non-hedge transactions for the purpose of these disclosures.
The volume of forward foreign currency contract, futures contract and swap agreement activity, as a percentage of net assets for Core Plus Bond Fund, Credit Income Fund, Global Allocation Fund and Intermediate Duration Bond Fund, based on gross month-end notional amounts outstanding during the period, including long and short positions at absolute value, was as follows for the year ended September 30, 2023:
| |
Average Notional Amount Outstanding | |
Highest Notional Amount Outstanding | |
Lowest Notional Amount Outstanding | |
Notional Amount Outstanding as of September 30, 2023 | |
Notes to Financial Statements (continued)
| |
Average Notional Amount Outstanding | |
Highest Notional Amount Outstanding | |
Lowest Notional Amount Outstanding | |
Notional Amount Outstanding as of September 30, 2023 | |
| | |
Average Notional Amount Outstanding | | |
Highest Notional Amount Outstanding | | |
Lowest Notional Amount Outstanding | | |
Notional Amount Outstanding as of September 30, 2023 | | |
Intermediate Duration Bond Fund | |
Average Notional Amount Outstanding | |
Highest Notional Amount Outstanding | |
Lowest Notional Amount Outstanding | |
Notional Amount Outstanding as of September 30, 2023 | |
Notional amounts outstanding at the end of the prior period are included in the average notional amount outstanding.
Unrealized gain and/or loss on open forwards and futures is recorded in the Statements of Assets and Liabilities. The aggregate notional values of forwards and futures contracts are not recorded in the Statements of Assets and Liabilities, and therefore are not included in the Funds’ net assets.
Over-the-counter derivatives, including forward foreign currency contracts, are entered into pursuant to International Swaps and Derivatives Association, Inc. (“ISDA”) agreements negotiated between the Funds and their counterparties. ISDA agreements typically contain, among other things, terms for the posting of collateral and master netting provisions in the event of a default or other termination event. Collateral is posted by a Fund or the counterparty to the extent of the net mark-to-market exposure to the other party of all open contracts under the agreement, subject to minimum transfer requirements. Master netting provisions allow the Funds and the counterparty, in the event of a default or other termination event, to offset amounts owed by each related to derivative contracts, including any posted collateral, to one net amount payable by either the Funds or the counterparty. The Funds' ISDA agreements typically contain provisions that allow a counterparty to terminate open contracts early if the NAV of a Fund declines beyond a certain threshold. For financial reporting purposes, the Funds do not offset derivative assets and liabilities, and any related collateral received or pledged, on the Statements of Assets and Liabilities.
As of September 30, 2023, gross amounts of over-the-counter derivative assets and liabilities not offset in the Statements of Assets and Liabilities and the related net amounts after taking into account master netting arrangements, by counterparty, are as follows:
|
| | | | Collateral
(Received)/
Pledged | |
| | | | | |
| | | | | |
| | | | | |
| | | | | |
|
| Gross Amounts of
Liabilities | | | Collateral
(Received)/
Pledged | |
| | | | | |
Morgan Stanley Capital Services LLC | | | | | |
| | | | | |
The actual collateral received or pledged, if any, may exceed the amounts shown in the table due to overcollateralization. Timing differences may exist between when contracts under the ISDA agreements are marked-to-market and when collateral moves. The
Notes to Financial Statements (continued)
ISDA agreements include tri-party control agreements under which collateral is held for the benefit of the secured party at a third party custodian, State Street Bank and Trust Company (“State Street Bank”).
Counterparty risk is managed based on policies and procedures established by each Fund’s adviser. Such policies and procedures may include, but are not limited to, minimum counterparty credit rating requirements, monitoring of counterparty credit default swap spreads and posting of collateral. A Fund’s risk of loss from counterparty credit risk on over-the-counter derivatives is generally limited to the Fund’s aggregated unrealized gains and the amount of any collateral pledged to the counterparty, which may be offset by any collateral posted to the Fund by the counterparty. ISDA master agreements can help to manage counterparty risk by specifying collateral posting arrangements at pre-arranged exposure levels. Under these ISDA agreements, collateral is routinely transferred if the total net exposure in respect of certain transactions, net of existing collateral already in place, exceeds a specified amount. With exchange-traded derivatives, there is minimal counterparty credit risk to the Fund because the exchange’s clearing house, as counterparty to these instruments, stands between the buyer and the seller of the contract. Credit risk still exists in exchange-traded derivatives with respect to initial and variation margin that is held in a broker’s customer accounts. While brokers typically are required to segregate customer margin for exchange-traded derivatives from their own assets, in the event that a broker becomes insolvent or goes into bankruptcy and at that time there is a shortfall in the aggregate amount of margin held by the broker for all its customers, U.S. bankruptcy laws will typically allocate that shortfall on a pro rata basis across all of the broker’s customers, potentially resulting in losses to the Fund.
5.Purchases and Sales of Securities. For the year ended September 30, 2023, purchases and sales of securities (excluding short-term investments and including paydowns) were as follows:
| U.S. Government/
Agency Securities | |
| | | | |
| | | | |
| | | | |
| | | | |
| | | | |
Intermediate Duration Bond Fund | | | | |
Limited Term Government and Agency Fund | | | | |
6.Management Fees and Other Transactions with Affiliates.
a. Management Fees. Loomis, Sayles & Company, L.P. (“Loomis Sayles”) serves as investment adviser to each Fund. Loomis Sayles is a limited partnership whose sole general partner, Loomis, Sayles & Company, Inc., is indirectly owned by Natixis Investment Managers, LLC, which is part of Natixis Investment Managers, an international asset management group based in Paris, France.
Under the terms of the management agreements, each Fund pays a management fee at the following annual rates, calculated daily and payable monthly, based on the Fund’s average daily net assets:
| Percentage of Average Daily Net Assets |
| | | | | | |
| | | | | | |
| | | | | | |
| | | | | | |
| | | | | | |
Intermediate Duration Bond Fund | | | | | | |
Limited Term Government and Agency Fund | | | | | | |
Notes to Financial Statements (continued)
Natixis Advisors, LLC ("Natixis Advisors") serves as the advisory administrator to Core Plus Bond Fund. Natixis Advisors is a wholly-owned subsidiary of Natixis Investment Managers, LLC. Under the terms of the advisory administration agreement, the Fund pays an advisory administration fee at the following annual rates, calculated daily and payable monthly, based on its average daily net assets:
| Percentage of Average Daily Net Assets |
| | | |
| | | |
Management and advisory administration fees are presented in the Statements of Operations as management fees.
Loomis Sayles has given binding undertakings to the Funds to waive management fees and/or reimburse certain expenses to limit the Funds' operating expenses, exclusive of acquired fund fees and expenses, brokerage expenses, interest expense, taxes, organizational and extraordinary expenses such as litigation and indemnification expenses. These undertakings are in effect until January 31, 2024, except for Global Allocation Fund and Growth Fund which is in effect until January 31, 2025, may be terminated before then only with the consent of the Funds' Board of Trustees and are reevaluated on an annual basis. Management fees payable, as reflected on the Statements of Assets and Liabilities, is net of waivers and/or expense reimbursements, if any, pursuant to these undertakings. Waivers/reimbursements that exceed management fees payable are reflected on the Statements of Assets and Liabilities as receivable from investment adviser.
For the year ended September 30, 2023 the expense limits as a percentage of average daily net assets under the expense limitation agreements were as follows:
| Expense Limit as a Percentage of
Average Daily Net Assets |
| | | | |
| | | | |
| | | | |
| | | | |
| | | | |
Intermediate Duration Bond Fund | | | | |
Limited Term Government and Agency Fund | | | | |
Prior to July 1, 2023, the expense limits as a percentage of average daily net assets under the expense limitation agreement for Global Allocation Fund and Growth Fund were as follows:
| Expense Limit as a Percentage of
Average Daily Net Assets |
| | | | |
| | | | |
| | | | |
Loomis Sayles and Natixis Advisors have agreed to equally bear the waivers and/or expense reimbursements for Core Plus Bond Fund.
Loomis Sayles (and Natixis Advisors for Core Plus Bond Fund) shall be permitted to recover expenses borne under the expense limitation agreements (whether through waiver of management fees or otherwise) on a class by class basis in later periods to the extent the annual operating expenses of a class fall below both (1) a class' expense limitation ratio in place at the time such amounts were waived/reimbursed and (2) a class' current applicable expense limitation ratio, provided, however, that a class is not obligated to pay such waived/reimbursed fees or expenses more than one year after the end of the fiscal year in which the fees or expenses were waived/reimbursed.
Notes to Financial Statements (continued)
For the year ended September 30, 2023, the management fees and waivers of management fees for each Fund were as follows:
| | Contractual
Waivers of
Management
| | Percentage of
Average
Daily Net Assets |
| | |
| | | | | |
| | | | | |
| | | | | |
| | | | | |
Intermediate Duration Bond Fund | | | | | |
Limited Term Government and Agency Fund | | | | | |
| Waiver/expense reimbursements are subject to possible recovery until September 30, 2024. |
For the year ended September 30, 2023, class-specific expenses have been reimbursed as follows:
In addition, Loomis Sayles reimbursed non-class specific expenses of Credit Income Fund in the amount of $121,283. Expense reimbursements are subject to possible recovery until September 30, 2024.
For the year ended September 30, 2023, the advisory administration fees for Core Plus Bond Fund were $10,359,921 (effective rate of 0.16% of average daily net assets).
No expenses were recovered for any of the Funds during the year ended September 30, 2023 under the terms of the expense limitation agreements.
b. Service and Distribution Fees. Natixis Distribution, LLC (“Natixis Distribution”), which is a wholly-owned subsidiary of Natixis Investment Managers, LLC, has entered into a distribution agreement with the Trust. Pursuant to this agreement, Natixis Distribution serves as principal underwriter of the Funds of the Trusts.
Pursuant to Rule 12b-1 under the 1940 Act, the Trust has adopted a Service Plan relating to the Fund’s Class A shares (the “Class A Plan”) and a Distribution and Service Plan relating to the Fund’s Class C shares (the “Class C Plan”).
Under the Class A Plan, each Fund pays Natixis Distribution a monthly service fee at an annual rate not to exceed 0.25% of the average daily net assets attributable to the Fund’s Class A shares, as reimbursement for expenses incurred by Natixis Distribution in providing personal services to investors in Class A shares and/or the maintenance of shareholder accounts.
Under the Class C Plan, each Fund pays Natixis Distribution a monthly service fee at an annual rate not to exceed 0.25% of the average daily net assets attributable to the Fund’s Class C shares, as compensation for services provided by Natixis Distribution in providing personal services to investors in Class C shares and/or the maintenance of shareholder accounts.
Also under the Class C Plan, each Fund pays Natixis Distribution a monthly distribution fee at the annual rate of 0.75% of the average daily net assets attributable to the Fund’s Class C shares, as compensation for services provided by Natixis Distribution in connection with the marketing or sale of Class C shares.
For the year ended September 30, 2023, the service and distribution fees for the Fund were as follows:
| | | |
| | | | |
| | | | |
| | | | |
| | | | |
| | | | |
Intermediate Duration Bond Fund | | | | |
Limited Term Government and Agency Fund | | | | |
Notes to Financial Statements (continued)
For the year ended September 30, 2023, Natixis Distribution refunded Limited Term Government and Agency Fund $12,768 of prior year Class A service fees paid to Natixis Distribution in excess of amounts subsequently paid to securities dealers or financial intermediaries. Service and distribution fees on the Statements of Operations have been reduced by these amounts.
c. Administrative Fees. Natixis Advisors provides certain administrative services for the Funds and contracts with State Street Bank to serve as sub-administrator. Pursuant to an agreement among Natixis Funds Trusts, Loomis Sayles Funds Trusts, Natixis ETF Trusts and Natixis Advisors, each Fund pays Natixis Advisors monthly its pro rata portion of fees equal to an annual rate of 0.0540% of the first $15 billion of the average daily net assets of the Natixis Funds Trusts, Loomis Sayles Funds Trusts and Natixis ETF Trusts, 0.0500% of the next $15 billion, 0.0400% of the next $30 billion, 0.0275% of the next $30 billion and 0.0225% of such assets in excess of $90 billion, subject to an annual aggregate minimum fee for the Natixis Funds Trusts, Loomis Sayles Funds Trusts and Natixis ETF Trusts of $10 million, which is reevaluated on an annual basis.
For the year ended September 30, 2023, the administrative fees for each Fund were as follows:
| |
| |
| |
| |
| |
Intermediate Duration Bond Fund | |
Limited Term Government and Agency Fund | |
d. Sub-Transfer Agent Fees. Natixis Distribution has entered into agreements, which include servicing agreements, with financial intermediaries that provide recordkeeping, processing, shareholder communications and other services to customers of the intermediaries that hold positions in the Funds and has agreed to compensate the intermediaries for providing those services. Intermediaries transact with the Funds primarily through the use of omnibus accounts on behalf of their customers who hold positions in the Funds. These services would have been provided by the Funds’ transfer agent and other service providers if the shareholders’ accounts were maintained directly at the Funds’ transfer agent. Accordingly, the Funds have agreed to reimburse Natixis Distribution for all or a portion of the servicing fees paid to these intermediaries. The reimbursement amounts (sub-transfer agent fees) paid to Natixis Distribution are subject to a current per-account equivalent fee limit approved by the Funds’ Board of Trustees, which is based on fees for similar services paid to the Funds’ transfer agent and other service providers. Class N shares do not bear such expenses.
For the year ended September 30, 2023, the sub-transfer agent fees (which are reflected in transfer agent fees and expenses in the Statements of Operations) for each Fund were as follows:
| |
| |
| |
| |
| |
Intermediate Duration Bond Fund | |
Limited Term Government and Agency Fund | |
As of September 30, 2023, the Funds owe Natixis Distribution the following reimbursements for sub-transfer agent fees (which are reflected in the Statements of Assets and Liabilities as payable to distributor):
| Reimbursements
of Sub-Transfer
Agent Fees |
| |
| |
| |
Intermediate Duration Bond Fund | |
Limited Term Government and Agency Fund | |
Notes to Financial Statements (continued)
e. Commissions. Commissions (including CDSCs) on Fund shares retained by Natixis Distribution during the year ended September 30, 2023 were as follows:
| |
| |
| |
| |
Limited Term Government and Agency Fund | |
f. Trustees Fees and Expenses. The Trusts do not pay any compensation directly to their officers or Trustees who are directors, officers or employees of Natixis Advisors, Natixis Distribution, Natixis Investment Managers, LLC or their affiliates. The Chairperson of the Board of Trustees receives a retainer fee at the annual rate of $369,000. The Chairperson does not receive any meeting attendance fees for Board of Trustees meetings or committee meetings that he attends. Each Independent Trustee (other than the Chairperson) receives, in the aggregate, a retainer fee at the annual rate of $210,000. Each Independent Trustee also receives a meeting attendance fee of $10,000 for each meeting of the Board of Trustees that he or she attends in person and $5,000 for each meeting of the Board of Trustees that he or she attends telephonically. In addition, the chairperson of the Contract Review Committee, the chairperson of the Audit Committee and the chairperson of the Governance Committee each receive an additional retainer fee at the annual rate of $20,000. Each Contract Review Committee member is compensated $6,000 for each Committee meeting that he or she attends in person and $3,000 for each meeting that he or she attends telephonically. Each Audit Committee member is compensated $6,000 for each Committee meeting that he or she attends in person and $3,000 for each meeting that he or she attends telephonically. Each Governance Committee member is compensated $2,500 for each Committee meeting that he or she attends either in person or telephonically. These fees are allocated among the funds in the Natixis Funds Trusts, Loomis Sayles Funds Trusts and Natixis ETF Trusts based on a formula that takes into account, among other factors, the relative net assets of each fund. Trustees are reimbursed for travel expenses in connection with attendance at meetings.
A deferred compensation plan (the “Plan”) is available to the Trustees on a voluntary basis. The value of a participating Trustee’s deferral account is based on theoretical investments of deferred amounts, on the normal payment dates, in certain funds of the Natixis Funds Trusts, Loomis Sayles Funds Trusts and Natixis ETF Trusts as designated by the participating Trustees. Changes in the value of participants’ deferral accounts are allocated pro rata among the funds in the Natixis Funds Trusts, Loomis Sayles Funds Trusts and Natixis ETF Trusts and are normally reflected as Trustees’ fees and expenses in the Statements of Operations. Deferred amounts remain in the funds until distributed in accordance with the provisions of the Plan. The portions of the accrued obligations allocated to the Funds under the Plan are reflected as Deferred Trustees’ fees in the Statements of Assets and Liabilities.
Certain officers and employees of Natixis Advisors and Loomis Sayles are also officers and/or Trustees of the Trusts.
Notes to Financial Statements (continued)
g. Affiliated Ownership. As of September 30, 2023, the percentage of each Fund’s net assets owned by affiliates is as follows:
| |
| |
Loomis Sayles Employees’ Profit Sharing Retirement Plan | |
| |
| |
| |
| |
| |
Loomis Sayles Employees’ Profit Sharing Retirement Plan | |
| |
Loomis Sayles Employees’ Profit Sharing Retirement Plan | |
Loomis Sayles Funded Pension Plan and Trust | |
| |
Intermediate Duration Bond Fund | |
Loomis Sayles Employees’ Profit Sharing Retirement Plan | |
Limited Term Government and Agency Fund | |
Loomis Sayles Employees’ Profit Sharing Retirement Plan | |
Loomis Sayles Distribution and Trust | |
Natixis Sustainable Future 2015 Fund | |
Natixis Sustainable Future 2020 Fund | |
Natixis Sustainable Future 2025 Fund | |
Natixis Sustainable Future 2030 Fund | |
Natixis Sustainable Future 2035 Fund | |
Natixis Sustainable Future 2040 Fund | |
Natixis Sustainable Future 2045 Fund | |
| |
Investment activities of affiliated shareholders could have material impacts on the Funds.
h. Reimbursement of Transfer Agent Fees and Expenses. Natixis Advisors has given a binding contractual undertaking to Credit Income Fund, Intermediate Duration Bond Fund and Limited Term Government and Agency Fund to reimburse any and all transfer agency expenses for the Funds’ Class N shares. This undertaking is in effect through January 31, 2024 and is not subject to recovery under the expense limitation agreement described above.
For the year ended September 30, 2023, Natixis Advisors reimbursed the Funds for transfer agency expenses as follows:
| Reimbursement of
Transfer Agency
Expenses |
| |
| |
Intermediate Duration Bond Fund | |
Limited Term Government and Agency Fund | |
i. Payment by Affiliates. For the year ended September 30, 2023, Loomis Sayles reimbursed Core Plus Bond Fund $127,673 in connection with a trading error and overdraft.
Notes to Financial Statements (continued)
7.Class-Specific Transfer Agent Fees and Expenses. Transfer agent fees and expenses attributable to Class A, Class C and Class Y are allocated on a pro rata basis to each class based on the relative net assets of each class to the total net assets of those classes. Transfer agent fees and expenses attributable to Class N are allocated to Class N.
For the year ended September 30, 2023 the Funds incurred the following class-specific transfer agent fees and expenses (including sub-transfer agent fees, where applicable):
| Transfer Agent Fees and Expenses |
| | | | |
| | | | |
| | | | |
| | | | |
| | | | |
Intermediate Duration Bond Fund | | | | |
Limited Term Government and Agency Fund | | | | |
8.Line of Credit. Each Fund, together with certain other funds of Natixis Funds Trusts, Loomis Sayles Funds Trusts and Natixis ETF Trusts, entered into a syndicated, revolving, committed, unsecured line of credit with State Street Bank as administrative agent. The aggregate revolving commitment amount is $575,000,000. Any one Fund may borrow up to $402,500,000 under the line of credit agreement (as long as all borrowings by all Funds in the aggregate do not exceed the $575,000,000 limit at any time), subject to each Fund’s investment restrictions and its contractual obligations under the line of credit. Interest is charged to the Funds based upon the terms set forth in the agreement. In addition, a commitment fee of 0.15% per annum, payable at the end of each calendar quarter, is accrued and apportioned among the participating funds based on their average daily unused portion of the line of credit. The Funds paid certain legal fees in connection with the line of credit agreement, which are being amortized over a period of 364 days and are reflected in legal fees on the Statements of Operations. The unamortized balance is reflected as prepaid expenses on the Statements of Assets and Liabilities.
Prior to April 6, 2023, each Fund, together with certain other funds of Natixis Funds Trusts and Loomis Sayles Funds Trusts and Natixis ETF Trusts, entered into a $500,000,000 committed unsecured line of credit provided by State Street Bank. Any one Fund was able to borrow up to $350,000,000 under the line of credit agreement (as long as all borrowings by all Funds in the aggregate did not exceed the $500,000,000 limit at any time), subject to each Fund’s investment restrictions and its contractual obligations under the line of credit. Interest was charged to the Funds based upon the terms set forth in the agreement. In addition, a commitment fee of 0.15% per annum, payable at the end of each calendar quarter, was accrued and apportioned among the participating funds based on their average daily unused portion of the line of credit.
For the year ended September 30, 2023, Growth Fund had an average daily balance on the line of credit (for those days on which there were borrowings) of $39,590,909 at a weighted average interest rate of 5.39%. Interest expense incurred on the line of credit was $65,187.
For the year ended September 30, 2023, Limited Term Government and Agency Fund had an average daily balance on the line of credit (for those days on which there were borrowings) of $5,000,000 at a weighted average interest rate of 5.43%. Interest expense incurred on the line of credit was $754.
9.Risk. Global Allocation Fund's investments in foreign securities may be subject to greater political, economic, environmental, credit/counterparty and information risks. The Fund's investments in foreign securities also are subject to foreign currency fluctuations and other foreign currency-related risks. Foreign securities may be subject to higher volatility than U.S. securities, varying degrees of regulation and limited liquidity.
Core Plus Bond Fund and Limited Term Government and Agency Fund's investments in mortgage-related and asset-backed securities are subject to certain risks not associated with investments in other securities. Mortgage-related and asset-backed securities are subject to the risk that unexpected changes in interest rates will have a direct effect on expected maturity. A shortened maturity may result in the reinvestment of prepaid amounts in securities with lower yields than the original obligations. An extended maturity may result in a reduction of a security's value.
Geopolitical events (such as trading halts, sanctions or wars) could increase volatility and uncertainty in the financial markets and adversely affect regional and global economies. These, and other related events, could significantly impact a Fund's performance and the value of an investment in the Fund, even if the Fund does not have direct exposure to issuers in the country or countries involved.
Notes to Financial Statements (continued)
10.Concentration of Ownership. From time to time, a Fund may have a concentration of one or more accounts constituting a significant percentage of shares outstanding. Investment activities by holders of such accounts could have material impacts on the Funds. As of September 30, 2023, based on management’s evaluation of the shareholder account base, the Funds had accounts representing controlling ownership of more than 5% of the Funds’ total outstanding shares. The number of such accounts, based on accounts that represent more than 5% of an individual class of shares, and the aggregate percentage of net assets represented by such holdings were as follows:
| Number of 5%
Account Holders | |
| | |
| | |
Intermediate Duration Bond Fund | | |
Limited Term Government and Agency Fund | | |
Omnibus shareholder accounts for which Natixis Advisors understands that the intermediary has discretion over the underlying shareholder accounts or investment models where a shareholder account may be invested for a non-discretionary customer are included in the table above. For other omnibus accounts, the Funds do not have information on the individual shareholder accounts underlying the omnibus accounts; therefore, there could be other 5% shareholders in addition to those disclosed in the table above.
11.Capital Shares. Each Fund may issue an unlimited number of shares of beneficial interest, without par value. Transactions in capital shares were as follows:
|
| Year Ended
September 30, 2023 | Year Ended
September 30, 2022 |
| | | | |
| | | | |
Issued from the sale of shares | | | | |
Issued in connection with the reinvestment of distributions | | | | |
| | | | |
| | | | |
| | | | |
Issued from the sale of shares | | | | |
Issued in connection with the reinvestment of distributions | | | | |
| | | | |
| | | | |
| | | | |
Issued from the sale of shares | | | | |
Issued in connection with the reinvestment of distributions | | | | |
| | | | |
| | | | |
| | | | |
Issued from the sale of shares | | | | |
Issued in connection with the reinvestment of distributions | | | | |
| | | | |
| | | | |
Increase (decrease) from capital share transactions | | | | |
Notes to Financial Statements (continued)
11.Capital Shares (continued).
|
| Year Ended
September 30, 2023 | Year Ended
September 30, 2022 |
| | | | |
| | | | |
Issued from the sale of shares | | | | |
Issued in connection with the reinvestment of distributions | | | | |
| | | | |
| | | | |
| | | | |
Issued in connection with the reinvestment of distributions | | | | |
| | | | |
| | | | |
Issued from the sale of shares | | | | |
Issued in connection with the reinvestment of distributions | | | | |
| | | | |
| | | | |
Increase (decrease) from capital share transactions | | | | |
|
| Year Ended
September 30, 2023 | Year Ended
September 30, 2022 |
| | | | |
| | | | |
Issued from the sale of shares | | | | |
Issued in connection with the reinvestment of distributions | | | | |
| | | | |
| | | | |
| | | | |
Issued from the sale of shares | | | | |
Issued in connection with the reinvestment of distributions | | | | |
| | | | |
| | | | |
| | | | |
Issued from the sale of shares | | | | |
Issued in connection with the reinvestment of distributions | | | | |
| | | | |
| | | | |
| | | | |
Issued from the sale of shares | | | | |
Issued in connection with the reinvestment of distributions | | | | |
| | | | |
| | | | |
Decrease from capital share transactions | | | | |
Notes to Financial Statements (continued)
11.Capital Shares (continued).
|
| Year Ended
September 30, 2023 | Year Ended
September 30, 2022 |
| | | | |
| | | | |
Issued from the sale of shares | | | | |
Issued in connection with the reinvestment of distributions | | | | |
| | | | |
| | | | |
| | | | |
Issued from the sale of shares | | | | |
Issued in connection with the reinvestment of distributions | | | | |
| | | | |
| | | | |
| | | | |
Issued from the sale of shares | | | | |
Issued in connection with the reinvestment of distributions | | | | |
| | | | |
| | | | |
| | | | |
Issued from the sale of shares | | | | |
Issued in connection with the reinvestment of distributions | | | | |
| | | | |
Redeemed in-kind (Note 12) | | | | |
| | | | |
Decrease from capital share transactions | | | | |
Notes to Financial Statements (continued)
11.Capital Shares (continued).
|
| Year Ended
September 30, 2023 | Year Ended
September 30, 2022 |
Intermediate Duration Bond Fund | | | | |
| | | | |
Issued from the sale of shares | | | | |
Issued in connection with the reinvestment of distributions | | | | |
| | | | |
| | | | |
| | | | |
Issued from the sale of shares | | | | |
Issued in connection with the reinvestment of distributions | | | | |
| | | | |
| | | | |
| | | | |
Issued from the sale of shares | | | | |
Issued in connection with the reinvestment of distributions | | | | |
| | | | |
| | | | |
| | | | |
Issued from the sale of shares | | | | |
Issued in connection with the reinvestment of distributions | | | | |
| | | | |
| | | | |
Increase (decrease) from capital share transactions | | | | |
Notes to Financial Statements (continued)
11.Capital Shares (continued).
|
| Year Ended
September 30, 2023 | Year Ended
September 30, 2022 |
Limited Term Government and Agency Fund | | | | |
| | | | |
Issued from the sale of shares | | | | |
Issued in connection with the reinvestment of distributions | | | | |
| | | | |
| | | | |
| | | | |
Issued from the sale of shares | | | | |
Issued in connection with the reinvestment of distributions | | | | |
| | | | |
| | | | |
| | | | |
Issued from the sale of shares | | | | |
Issued in connection with the reinvestment of distributions | | | | |
| | | | |
| | | | |
| | | | |
Issued from the sale of shares | | | | |
Issued in connection with the reinvestment of distributions | | | | |
| | | | |
| | | | |
Decrease from capital share transactions | | | | |
12.Redemption In-Kind. In certain circumstances, a Fund may distribute portfolio securities rather than cash as payment for redemption of Fund shares (redemption in-kind). For financial reporting purposes, the Fund will recognize a gain on in-kind redemptions to the extent the value of the distributed securities on the date of redemption exceeds the cost of those securities; the Fund will recognize a loss if the cost exceeds value. Gains and losses realized on redemptions in-kind are not recognized for tax purposes, and are re-classified from realized gain (loss) to paid-in-capital. Growth Fund realized a gain of $14,126,530 on redemptions-in-kind during the year ended September 30, 2023. This amount is included in realized gain (loss) on the Statements of Operations.
13.Subsequent Event. On September 14, 2023, the Board of Trustees approved a plan to liquidate Credit Income Fund. Liquidation took place on November 6, 2023.
Report of Independent Registered Public Accounting Firm
To the Board of Trustees of Natixis Funds Trust I, Loomis Sayles Funds I and Loomis Sayles Funds II and Shareholders of Loomis Sayles Core Plus Bond Fund, Loomis Sayles Intermediate Duration Bond Fund, Loomis Sayles Credit Income Fund, Loomis Sayles Global Allocation Fund, Loomis Sayles Growth Fund and Loomis Sayles Limited Term Government and Agency Fund:
Opinions on the Financial Statements
We have audited the accompanying statements of assets and liabilities, including the portfolios of investments, of Loomis Sayles Core Plus Bond Fund (one of the funds constituting Natixis Funds Trust I), Loomis Sayles Intermediate Duration Bond Fund (one of the funds constituting Loomis Sayles Funds I), and Loomis Sayles Credit Income Fund, Loomis Sayles Global Allocation Fund, Loomis Sayles Growth Fund and Loomis Sayles Limited Term Government and Agency Fund (four of the funds constituting Loomis Sayles Funds II) (hereafter collectively referred to as the “Funds”) as of September 30, 2023, the related statements of operations for the year ended September 30, 2023, the statements of changes in net assets for each of the two years in the period ended September 30, 2023, including the related notes,and the financial highlights for each of the periods indicated therein (collectively referred to as the “financial statements”). In our opinion, the financial statements present fairly, in all material respects, the financial position of each of the Funds as of September 30, 2023, the results of each of their operations for the year then ended, the changes in each of their net assets for each of the two years in the period ended September 30, 2023 and each of the financial highlights for each of the periods indicated therein, in conformity with accounting principles generally accepted in the United States of America.
Basis for Opinions
These financial statements are the responsibility of the Funds’ management. Our responsibility is to express an opinion on the Funds’ financial statements based on our audits. We are a public accounting firm registered with the Public Company Accounting Oversight Board (United States) (PCAOB) and are required to be independent with respect to the Funds in accordance with the U.S. federal securities laws and the applicable rules and regulations of the Securities and Exchange Commission and the PCAOB.
We conducted our audits of these financial statements in accordance with the standards of the PCAOB. Those standards require that we plan and perform the audit to obtain reasonable assurance about whether the financial statements are free of material misstatement, whether due to error or fraud.
Our audits included performing procedures to assess the risks of material misstatement of the financial statements, whether due to error or fraud, and performing procedures that respond to those risks. Such procedures included examining, on a test basis, evidence regarding the amounts and disclosures in the financial statements. Our audits also included evaluating the accounting principles used and significant estimates made by management, as well as evaluating the overall presentation of the financial statements. Our procedures included confirmation of securities owned as of September 30, 2023 by correspondence with the custodian, transfer agent, agency banks and brokers; when replies were not received from brokers, we performed other auditing procedures. We believe that our audits provide a reasonable basis for our opinions.
/s/PricewaterhouseCoopers LLP
Boston, Massachusetts
November 21, 2023
We have served as the auditor of one or more investment companies in the Natixis Investment Company Complex since at least 1995. We have not determined the specific year we began serving as auditor.
2023 U.S. Tax Distribution Information to Shareholders (Unaudited)
Corporate Dividends Received Deduction. For the fiscal year ended September 30, 2023, a percentage of dividends distributed by the
Funds listed below qualify for the dividends received deduction for corporate shareholders. These percentages are as follows:
Qualified Dividend Income. For the fiscal year ended September 30, 2023, the Funds below will designate up to the maximum amount allowable pursuant to the Internal Revenue Code as qualified dividend income eligible for reduced tax rates. These lower rates range from 0% to 20% depending on an individual’s tax bracket. If the Funds pay a distribution during calendar year 2023, complete information will be reported in conjunction with Form 1099-DIV.
Fund
Credit Income Fund
Growth Fund
Capital Gains Distributions. Pursuant to Internal Revenue Section 852(b), the following Funds paid distributions, which have been designated as capital gains distributions for the fiscal year ended September 30, 2023, unless subsequently determined to be different.
Trustee and Officer Information
The tables below provide certain information regarding the Trustees and officers of Natixis Funds Trust I, Loomis Sayles Funds I and Loomis Sayles Funds II (the "Trusts"). Unless otherwise indicated, the address of all persons below is 888 Boylston Street, Suite 800, Boston, MA 02199-8197. The Funds' Statements of Additional Information include additional information about the Trustees of the Trusts and are available by calling Natixis Funds/Loomis Sayles Funds at 800-225-5478/800-633-3330.
| Position(s) Held with
the Trusts, Length
of Time Served and
| Principal
Occupation(s)
During Past 5 Years | Number of Portfolios
in Fund Complex
Overseen2and Other
Directorships Held
During Past 5 Years | Experience,
Qualifications,
Attributes, Skills for
Board Membership |
| | | | |
| Trustee since 2013
Contract Review
Committee Member
and Governance
Committee Member | Executive Chairman of Bob’s Discount Furniture (retail) | 52
Director, Burlington Stores, Inc. (retail); Director, Rue Gilt Groupe, Inc.
(e-commerce retail) | Significant experience on the Board and on the boards of other business organizations (including retail companies and a bank); executive experience (including at a retail company) |
| Trustee since 2015
Audit Committee
Member and
Governance
Committee Member | | 52
Formerly, Director of Triumph Group (aerospace industry) | Significant experience on the Board and executive experience (including his role as Vice President and treasurer of a defense company and experience at a financial services company) |
| Trustee since 2012
Chairperson of the
Governance Committee
and Contract Review
Committee Member | President, University of Massachusetts | | Significant experience on the Board and on the boards of other business organizations; experience as President of the University of Massachusetts; government experience (including as a member of the U.S. House of Representatives); academic experience |
Maureen B. Mitchell
(1951) | Trustee since 2017
Chairperson of the
Contract Review
Committee | | 52
Director, Sterling Bancorp (bank) | Significant experience on the Board; financial services industry and executive experience (including role as President of global sales and marketing at a financial services company) |
Trustee and Officer Information
| Position(s) Held with the Trusts, Length of Time Served and Term of Office1 | Principal Occupation(s) During Past 5 Years | Number of Portfolios in Fund Complex Overseen2and Other Directorships Held During Past 5 Years | Experience, Qualifications, Attributes, Skills for Board Membership |
Independent Trustees − continued |
| Trustee since 2016
Audit Committee Member
and Governance
Committee Member | Founding Partner, Breton Capital Management, LLC (private equity); Partner, STEP Partners, LLC (private equity) | 52
Director, FutureFuel.io (chemicals and biofuels) | Significant experience on the Board; financial services industry and executive experience (including roles as Chief Executive Officer of client management and asset servicing for a banking and financial services company) |
| Chairperson of the
Board of Trustees since
January 2021
Trustee since 2009
Ex Officio Member of
the Audit Committee,
Contract Review
Committee and
Governance
Committee | Professor of Finance at Babson College | | Significant experience on the Board; experience as Director of the Division of Trading and Markets at the Securities and Exchange Commission; academic experience; training as an economist |
| Trustee since 2009
Contract Review
Committee Member | | | Significant experience on the Board; mutual fund industry and executive experience (including roles as President and Chief Executive Officer for an investment adviser) |
Trustee and Officer Information
| Position(s) Held with the Trusts, Length of Time Served and Term of Office1 | Principal Occupation(s) During Past 5 Years | Number of Portfolios in Fund Complex Overseen2and Other Directorships Held During Past 5 Years | Experience, Qualifications, Attributes, Skills for Board Membership |
Independent Trustees − continued |
| Trustee since 2019
Audit Committee
Member and
Governance
Committee Member | Managing Director of Accordia Partners, LLC (real estate development); President of Primary Corporation (real estate development); Managing Principal of Merrick Capital Partners (infrastructure finance) | 52
Advisor/Risk Management Committee, Eastern Bank (bank); Director, Apartment Investment and Management Company (real estate investment trust); formerly, Director, Ares Commercial Real Estate Corporation (real estate investment trust) | Experience on the Board and significant experience on the boards of other business organizations (including real estate companies and banks) |
| Trustee since 2005
Chairperson of the
Audit Committee | Retired; formerly, Deputy Dean for Finance and Administration, Yale University School of Medicine | | Significant experience on the Board; executive experience in a variety of academic organizations (including roles as dean for finance and administration) |
| | | | |
(1965)
One Financial Center
Boston, MA 02111 | Trustee since 2015
President and Chief
Executive Officer of
Loomis Sayles Funds I
since 2015 | President, Chief Executive Officer and Chairman of the Board of Directors, Loomis, Sayles & Company, L.P. | | Significant experience on the Board; continuing service as President, Chief Executive Officer and Chairman of the Board of Directors of Loomis, Sayles & Company, L.P. |
Trustee and Officer Information
| Position(s) Held with the Trusts, Length of Time Served and Term of Office1 | Principal Occupation(s) During Past 5 Years | Number of Portfolios in Fund Complex Overseen2and Other Directorships Held During Past 5 Years | Experience, Qualifications, Attributes, Skills for Board Membership |
Interested Trustees − continued |
| Trustee since 2011
President and Chief
Executive Officer of
Natixis Funds Trust I;
President of
Loomis Sayles Funds
II and Executive Vice
President of Loomis
Sayles Funds I since
2008; Chief Executive
Officer of Loomis
Sayles Funds II since
2015 | President and Chief Executive Officer, Natixis Advisors, LLC and Natixis Distribution, LLC | | Significant experience on the Board; experience as President and Chief Executive Officer of Natixis Advisors, LLC and Natixis Distribution, LLC |
| Each Trustee serves until retirement, resignation or removal from the Board. The current retirement age is 75. The position of Chairperson of the Board is appointed for a three-year term. |
| The Trustees of the Trusts serve as Trustees of a fund complex that includes all series of the Natixis Funds Trust I, Natixis Funds Trust II, Natixis Funds Trust IV, Gateway Trust, Loomis Sayles Funds I, Loomis Sayles Funds II, Natixis ETF Trust and Natixis ETF Trust II (collectively, the “Fund Complex”). |
| Mr. Charleston is deemed an “interested person” of the Trusts because he holds the following positions with an affiliated person of the Trusts: President, Chief Executive Officer and Chairman of the Board of Directors of Loomis, Sayles & Company, L.P. |
| Mr. Giunta is deemed an “interested person” of the Trusts because he holds the following positions with an affiliated person of the Trusts: President and Chief Executive Officer, Natixis Advisors, LLC and Natixis Distribution, LLC. |
Trustee and Officer Information
| Position(s) Held
with the Trusts | | |
| | | |
| Treasurer, Principal
Financial and
Accounting Officer | | Senior Vice President, Natixis Advisors, LLC and Natixis Distribution, LLC; formerly, Vice President, Natixis Advisors, LLC and Natixis Distribution, LLC; Assistant Treasurer of the Fund Complex; Managing Director, State Street Bank and Trust Company |
| Secretary and Chief
Legal Officer | | Executive Vice President, General Counsel and Secretary, Natixis Advisors, LLC and Natixis Distribution, LLC; formerly, Executive Vice President and Chief Compliance Officer of Natixis Investment Managers (March 2019 – May 2022) and Senior Vice President and Head of Compliance, U.S. for Natixis Investment Managers (July 2011 – March 2019) |
| Chief Compliance
Officer, Assistant
Secretary and
Anti-Money
Laundering Officer | | Senior Vice President, Natixis Advisors, LLC and Natixis Distribution, LLC; formerly, Vice President, Head of Corporate Compliance, Global Atlantic Financial Group |
| Each officer of the Trusts serves for an indefinite term in accordance with the Trusts' current by-laws until the date his or her successor is elected and qualified, or until he or she sooner dies, retires, is removed or becomes disqualified. |
| Each person listed above, except as noted, holds the same position(s) with the Fund Complex. Previous positions during the past five years with Natixis Distribution, LLC, Natixis Advisors, LLC or Loomis, Sayles & Company, L.P. are omitted, if not materially different from an officer’s current position with such entity. |
This Page Intentionally Left Blank
Contact us by mail:
If you wish to communicate with the funds’ Board of Trustees, you may do so by writing to:
Secretary of the Funds
Natixis Advisors, LLC
888 Boylston Street, Suite 800
Boston, MA 02199-8197
The correspondence must (a) be signed by the shareholder; (b) include the shareholder’s name and address; and (c) identify the fund(s), account number, share class, and number of shares held in that fund, as of a recent date.
Or by e-mail:
secretaryofthefunds@natixis.com (Communications regarding recommendations for Trustee candidates may not be submitted by e-mail.)
Please note: Unlike written correspondence, e-mail is not secure. Please do NOT include your account number, Social Security number, PIN, or any other non-public personal information in an e-mail communication because this information may be viewed by others.
 Exp. 11/30/246031448.1.1LSIF58A-0923
Loomis Sayles Small Cap Growth Fund |
Loomis Sayles Small Cap Value Fund |
Loomis Sayles Small/Mid Cap Growth Fund |
Annual Report
September 30, 2023
Loomis Sayles Small Cap Growth Fund
Investment ObjectiveThe Fund’s investment objective is long-term capital growth from investments in common stocks or other equity securities.
Market Conditions
Despite weakness in the final two months of the period, US equities produced strong performance in the 12 months ended September 30, 2023. One reason for the robust returns was timing: when the reporting period began in October 2022, stocks were near the end of a protracted, ten-month decline brought about by the US Federal Reserve’s (Fed) aggressive interest-rate increases. By the fourth quarter of 2022, however, cooler inflation prompted the Fed to begin decelerating the pace of rate hikes, which provided relief to risk assets.
Building off a rally that initially started in the second half of 2022, the Russell 2000® Growth Index had a strong start to 2023, returning 6.1%, during what shaped up to be another volatile quarter in Q1 2023. The ‘January Effect’ was on full display with the Russell 2000® Growth Index up 9.9% in January, led by a powerful rally in some of the hardest hit areas from 2022. The Russell 2000® Growth Index had another positive quarter in Q2 2023, returning 7.1%. Within the small cap growth space, lower quality drove performance during Q2 2023 where non-revenue companies in particular were the most dominant group in terms of performance. However, most of the gains during the first half of 2023 were mostly reversed in Q3 2023 with equity markets including small cap growth stocks broadly declining. The Russell 2000® Growth Index fell by 7.3% in Q3 2023 where high quality held up relatively better with highest return on equity (ROE) names noticeably outperforming the broader indices.
The overall market continues to be volatile and make little forward progress. At one point, the market seems to be enthusiastic about the future for reasons such as generative AI, new weight loss drugs, and declining inflation. The next period, we have reasons to be pessimistic – including sticky inflation, higher interest rates, and geopolitical concerns. Enthusiasm around generative artificial intelligence (AI) in the second quarter and the strength from the first half of the year were largely reversed during the third quarter, leaving broader measures of the market relatively unchanged YTD 2023. In fact, the broader market remains essentially at the same level it was more than two years ago, with small caps actually at their pre-pandemic levels.
Performance Results
For the 12 months ended September 30, 2023, Institutional Class shares of the Loomis Sayles Small Cap Growth Fund returned 11.64% at net asset value. The Fund outperformed its benchmark, the Russell 2000® Growth Index, which returned 9.59%.
Explanation of Fund Performance
Stock selection in the consumer staples, financials and energy sectors contributed most strongly to positive relative performance during the period. Conversely, stock selection within the healthcare and industrials sectors detracted from relative performance.
The Fund’s top contributors to relative performance at the individual stock level were Weatherford International, Rambus and e.l.f. Beauty. Weatherford International is an oilfield services company with a focus on international and offshore markets. Relatively new management has sold off underperforming assets and refocused the portfolio on growth areas of the market. The company has also significantly paid down debt, creating earnings leverage on a go- forward basis. Rambus sells memory controller chips, as well as intellectual property, which benefits from the growing demand for computer power. We believe that the transition to the next generation (DDR5) should drive the business, which is being partly driven by data center spend. e.l.f Beauty is a multi-brand beauty company that makes prestigious quality products accessible to everyone. The company is benefiting from continued momentum in its makeup and skincare category and has been gaining market share as its innovation and marketing investments bear fruit.
Conversely, the largest detractors from relative performance among individual stocks were Advanced Drainage Systems, Evolent Health and Axonics. Advanced Drainage Systems is a leading manufacturer and provider of plastic pipes for the commercial and residential wastewater market. The company saw a slowdown in its residential business as distributors drastically cut orders in order to work down their inventory. This prompted the company to slightly lower guidance and introduced a level of uncertainty going forward. The stock triggered our stop loss and was ultimately sold. Evolent Health is a technology and services company that enables healthcare providers and payers to deliver high quality care in a cost-effective manner by directing providers to the best course of care. While the company has executed on delivering its growth targets and margin progression, the investment thesis has become more complicated due to a large acquisition, as well as the perceived risk of patients losing Medicaid coverage, as many of the patients they serve are on Medicaid. These perceived risks have weighed on the stock over the last year. Axonics is a medical device company that is a leader in the treatment of urinary incontinence. The stock has been a
detractor due to the company facing concerns around the introduction of new technology. We believe the lack of proper reimbursement and worse clinical outcomes for the competitor will limit uptake.
Outlook
The economy has remained resilient well past the time that liquidity began to be removed via interest rate increases and quantitative tightening. The labor market remains strong and earnings continue to grow, albeit modestly. Various outcomes are still on the table, including both soft and hard landings, and these paths could all lead the market in multiple directions. If it is a soft landing, the market would likely move higher at a moderate pace with earnings growth. If it is a hard landing, it’s likely the market would retrench for a period, and then possibly bounce meaningfully higher if the Fed cuts interest rates, even if not by much. Our belief is that regardless of the scenario, the easy money period is over and quality companies that can generate superior returns and have durable revenue growth will likely outperform. We believe higher rates will reward more disciplined and well-managed companies going forward. We also believe small caps are likely to outperform large caps. Small caps are further out on the risk spectrum, and therefore should earn a higher return over the long term. Having underperformed large caps for a sustained period of time and given the absolute and relative valuation levels, we believe we are close to a pivot point for small caps to return to strength. Regardless, our philosophy and process remain consistent - focused on driving alpha via stock selection in high quality secular growth companies.
Top Ten Holdings as of September 30, 2023 |
| |
1 Weatherford International PLC | |
2 MACOM Technology Solutions Holdings, Inc. | |
3 Option Care Health, Inc. | |
| |
5 Casella Waste Systems, Inc., Class A | |
6 Kinsale Capital Group, Inc. | |
| |
| |
| |
10 Merit Medical Systems, Inc. | |
The portfolio is actively managed and holdings are subject to change. There is no guarantee the Fund continues to invest in the securities referenced. The holdings listed exclude any temporary cash investments, are presented on an individual security basis and do not represent holdings of the issuer. |
Hypothetical Growth of $100,000 Investment in Institutional Class Shares1 |
September 30, 2013 through September 30, 2023 |
See notes to chart on page 3.
Loomis Sayles Small Cap Growth Fund
Average Annual Total Returns — September 30, 20231 |
| | | | |
| | |
| | | | | |
| | | | | |
| | | | | |
| | | | | |
Russell 2000® Growth Index2 | | | | | |
Performance data shown represents past performance and is no guarantee of, and not necessarily indicative of, future results. Total return and value will vary, and you may have a gain or loss when shares are sold. Current performance may be lower or higher than quoted. For most recent month-end performance, visit loomissayles.com. Performance for other share classes will be greater or less than shown based on differences in fees and sales charges. You may not invest directly in an index. Performance for periods less than one year is cumulative, not annualized. Returns reflect changes in share price and reinvestment of dividends and capital gains, if any. The table(s) do not reflect taxes shareholders might owe on any fund distributions or when they redeem their shares.
| Fund performance has been increased by fee waivers and/or expense reimbursements, if any, without which performance would have been lower. |
| Russell 2000® Growth Index is an unmanaged index that measures the performance of the small-cap growth segment of the U.S. equity universe. It includes those Russell 2000® companies with higher price-to-book ratios and higher forecasted growth values. |
| Expense ratios are as shown in the Fund’s prospectus in effect as of the date of this report. The expense ratios for the current reporting period can be found in the Financial Highlights section of this report under Ratios to Average Net Assets. Net expenses reflect contractual expense limitations set to expire on 1/31/25. When a Fund’s expenses are below the limitation, gross and net expense ratios will be the same. See Note 5 of the Notes to Financial Statements for more information about the Fund’s expense limitations. |
Loomis Sayles Small Cap Value Fund
Investment ObjectiveThe Fund’s investment objective is long-term capital growth from investments in common stocks or other equity securities.
Market Conditions
US equity markets have rebounded over the past twelve months after posting a negative return for the prior one-year period. Investors have responded positively to a moderating inflation rate, corporate earnings which proved to be more resilient than previously expected and the consensus that the US Federal Reserve (Fed) may finally be nearing the end of its interest rate increases to combat a higher than target inflation rate.
To combat higher levels of inflation, the Fed raised short-term interest rates a total of six times to a Fed Funds target rate of 5.25% to 5.50% from about 3% one year ago and essentially a 0% rate two years ago. In response, market interest rates rose quite dramatically across the interest rate curve, creating a difficult environment for fixed-income investors, higher risk equites and regional bank balance sheets.
Rising interest rate environments have generally favored higher quality investments as the higher cost of capital negatively affects companies with high debt levels, low to no profitability and riskier business models. This held true over the past year as the most profitable companies drastically outperformed those with lower levels of profitability in the benchmark index, and companies with no earnings performed poorly.
During the period, large cap growth stocks led the market, augmented by outsized gains in several well-known mega cap stocks in information technology or technology-enabled businesses. Small cap value was one of the weaker-performing market segments as a larger concentration of bank stocks and utility stocks weighed down index returns.
Performance Results
For the 12 months ended September 30, 2023, Institutional Class shares of the Loomis Sayles Small Cap Value Fund returned 20.73% at net asset value. The Fund outperformed its benchmark, the Russell 2000® Value Index, which returned 7.84%.
Explanation of Fund Performance
The Fund’s relative performance benefited from a market environment that favored larger capitalization and higher quality stocks, positive sector allocation and strong stock selection metrics. As a result of the Fund’s long-term fundamental approach and the investment team’s valuation work, the Fund had overweight positions in the three best performing index sectors (energy, industrials and information technology) and underweight allocations to the underperforming financials and utilities sectors. Of particular significance regarding changes to the Fund over the last 12 months was the addition of several new energy stocks, as energy was the best performing index sector during the period.
Stock selection measures also contributed positively to performance, with notable contributions in health care, information technology, consumer staples and energy. Among individual stocks, Super Micro Computer, Inc., Weatherford International and Rambus, Inc. made the largest positive contributions to performance for the period.
Super Micro is a vertically integrated supplier of servers for data centers and cloud computing, as well as related accessories including cables and power supplies. Being vertically integrated provides certain competitive advantages, establishing Super Micro as a low-cost provider and allowing the company to provide custom designs and configurations to customers more quickly. The rise of artificial intelligence and Chat GPT has created increased demand for innovative, power efficient solutions at the lowest total cost which drove accelerating market share gains and strong stock price performance for the company.
Weatherford International provides equipment and services to the oil and natural gas industry, with a significant presence in international and off-shore markets. The company has a long history, but the current business composition emerged from bankruptcy in late 2019 with a streamlined business, new management and a dramatically improved financial footing. Since this emergence, the company has demonstrated solid progress in improving business practices, increasing margins, and paying down high cost debt with ample free cash flow. The stock was added to the Fund during the third quarter of 2022 and has steadily gained attention from Wall Street and the broader investment community, with attractive exposure to international and off-shore production where growth rates are accelerating and oil field service capacity remains tight. Stock price appreciation has been driven by meaningful increases in earnings and cash flow of the business, as well as increased investor awareness.
Loomis Sayles Small Cap Value Fund
Rambus develops semiconductors and intellectual property mainly for data centers. The company’s products facilitate high speed communication between memory and microprocessors. A subset of memory processing is reaching an inflection point as the industry transitions to the next generation of memory technology, which investors expect to drastically increase the company’s market share as well as the overall size of the market for interface technology. The share price of Rambus increased as the latest generation processors from Intel and AMD ushered in the era of new technology.
Detracting from relative return was an overweight position to the health care sector, an underweight to the consumer discretionary sector and lagging stock selection within the industrials sector. Over the past year, Pacira Biosciences, Inc., LSB Industries, Inc. and Viavi Solutions, Inc. detracted the most from performance.
Pacira Biosciences is a pharmaceutical company that focuses on non-opioid pain management treatments, with its main product used in operating rooms following various elective procedures. The company has been negatively affected by two events. First, elective procedure volumes and broad health care utilization has struggled to rebound back to pre-pandemic volumes. Second was Pacira's strategic decision to enter into a favorable pricing agreement with numerous hospitals, which lowers margins in the near term but could increase volume over time.
LSB is a US based producer of nitrogen chemicals with a favorable cost structure with access to ample natural gas which is the largest input in the production process. The decline in nitrogen prices to below mid-cycle levels negatively impacted the company’s share price even though the company remains profitable and has opportunistically repurchased equity and debt while investigating cost effective options to expand production.
Viavi Solutions provides test and measurement solutions to the telecommunications industry in addition to manufacturing optical pigmentation used to prevent the counterfeiting of currency. Elongated lead times in prior periods caused telecommunication customers to order excess test and measurement equipment which are only now being utilized, in turn depressing current revenue. Additionally, some customers have paused network investments ahead of stimulus programs that will begin in 2024.
Outlook
We remain committed to identifying inefficiencies in the small cap market that result in stock prices and valuations that do not accurately reflect our assessment of the underlying value of corporate enterprises. This approach is applied consistently over time, regardless of the current market environment.
While many forms of inefficiency may exist, we focus on companies that are misunderstood, underfollowed or in the midst of a “special situation” where we believe we can use our strengths consistent with our time horizon, resource deployment or a willingness to solve complex situations. We require fundamentally sound business models, capable management teams and financial stability. Key to our process is identifying distinct, company-specific catalysts on the horizon to sustain, enhance or highlight the fundamental outlook.
Our goal is to achieve an attractive total return for our investors, while managing to an appropriate level of risk over a market cycle.
Top Ten Holdings as of September 30, 2023 |
| |
1 Weatherford International PLC | |
2 Northern Oil & Gas, Inc. | |
| |
| |
| |
| |
| |
8 Federal Agricultural Mortgage Corp., Class C | |
| |
| |
The portfolio is actively managed and holdings are subject to change. There is no guarantee the Fund continues to invest in the securities referenced. The holdings listed exclude any temporary cash investments, are presented on an individual security basis and do not represent holdings of the issuer. |
Hypothetical Growth of $100,000 Investment in Institutional Class Shares1 |
September 30, 2013 through September 30, 2023 |
Average Annual Total Returns — September 30, 20231 |
| | | | |
| | |
| | | | | |
| | | | | |
| | | | | |
| | | | | |
| | | | | |
Russell 2000® Value Index2 | | | | | |
| | | | | |
Performance data shown represents past performance and is no guarantee of, and not necessarily indicative of, future results. Total return and value will vary, and you may have a gain or loss when shares are sold. Current performance may be lower or higher than quoted. For most recent month-end performance, visit loomissayles.com. Performance for other share classes will be greater or less than shown based on differences in fees and sales charges. You may not invest directly in an index. Performance for periods less than one year is cumulative, not annualized. Returns reflect changes in share price and reinvestment of dividends and capital gains, if any. The table(s) do not reflect taxes shareholders might owe on any fund distributions or when they redeem their shares.
| Fund performance has been increased by fee waivers and/or expense reimbursements, if any, without which performance would have been lower. |
| Russell 2000® Value Index is an unmanaged index that measures the performance of the small-cap value segment of the U.S. equity universe. It includes those Russell 2000® companies with lower price-to-book ratios and lower forecasted growth values. |
| Russell 2000® Index is an unmanaged index that measures the performance of the small-cap segment of the U.S. equity universe. |
| Expense ratios are as shown in the Fund’s prospectus in effect as of the date of this report. The expense ratios for the current reporting period can be found in the Financial Highlights section of this report under Ratios to Average Net Assets. Net expenses reflect contractual expense limitations set to expire on 1/31/24. When a Fund’s expenses are below the limitation, gross and net expense ratios will be the same. See Note 5 of the Notes to Financial Statements for more information about the Fund’s expense limitations. |
Loomis Sayles Small/Mid Cap Growth Fund
Investment ObjectiveThe Fund’s investment objective is long-term capital growth from investments in common stocks or other equity securities.
Market Conditions
Despite weakness in the final two months of the period, US equities produced strong performance in the 12 months ended September 30, 2023. One reason for the robust returns was timing: when the reporting period began in October 2022, stocks were near the end of a protracted, ten-month decline brought about by the US Federal Reserve’s (Fed) aggressive interest-rate increases. By the fourth quarter of 2022, however, cooler inflation prompted the Fed to begin decelerating the pace of rate hikes, which provided relief to risk assets.
Building off a rally that initially started in the second half of 2022, the Russell 2500® Growth Index had a strong start to 2023, returning 6.5%, during what shaped up to be another volatile quarter in Q1 2023. The ‘January Effect’ was on full display with the Russell 2500® Growth Index up 10% in January, led by a powerful rally in some of the hardest hit areas from 2022. The Russell 2500® Growth Index had another positive quarter in Q2 2023, returning 6.4%. Within the small/mid cap growth space, lower quality drove performance during Q2 2023 where non-revenue companies in particular were the most dominant group in terms of performance. However, most of the gains during the first half of 2023 were reversed in Q3 2023 with equity markets including small/mid cap growth stocks broadly declining. The Russell 2500® Growth Index fell by 6.8% in Q3 2023 where high quality held up relatively better with highest return on equity (ROE) names noticeably outperforming the broader indices.
The overall market continues to be volatile and make little forward progress. At one point, the market seems to be enthusiastic about the future for reasons such as generative AI, new weight loss drugs, and declining inflation. The next period, we have reasons to be pessimistic – including sticky inflation, higher interest rates, and geopolitical concerns. Enthusiasm around generative artificial intelligence (AI) in the second quarter and the strength from the first half of the year were largely reversed during the third quarter, leaving broader measures of the market relatively unchanged YTD 2023. In fact, the broader market remains essentially at the same level it was more than two years ago, with small caps actually at their pre-pandemic levels.
Performance Results
For the 12 months ended September 30, 2023, Institutional Class shares of the Loomis Sayles Small/Mid Cap Growth Fund returned 4.06% at net asset value. The Fund underperformed its benchmark, the Russell 2500® Growth Index, which returned 10.61%.
Explanation of Fund Performance
Stock selection within the information technology and healthcare sectors were the largest detractors from relative performance. Conversely, stock selection in the financials and energy sectors contributed most strongly to positive relative performance during the period.
The Fund’s largest detractors of relative performance among individual stocks were R1 RCM, Paylocity Holding and AngioDynamics. R1 RCM is a healthcare technology and services company that manages account receivables for healthcare providers. The company’s value proposition is that it can do it better and more efficiently, and at a lower price. It is a complicated service with very large clients that take a while to bring on board. In the fall of 2022, the company announced that some of their new clients were costing more and taking more time to bring on board than expected, causing them to lower their earnings estimates and the stock to fall. It triggered our stop loss and was sold. Paylocity is a payroll and human capital management software provider to small and mid-sized businesses. Their best in class product has allowed them to gain share and maintain a high level of recurring revenue growth. However, the stock has seen its multiple compress, along with other software companies, as uncertainty abounds for spending priorities in an uncertain market. AngioDynamics is a medical device company focused on addressing venous and arterial diseases. A combination of competition and supply chain issues weighed on the top and bottom line performance. As a result, the stock triggered the stop-loss and we exited the position.
Conversely, the Fund’s top contributors to relative performance at the individual stock level were Axon Enterprises, ChampionX and Deckers Outdoor. Axon designs and sells products that address the law enforcement market. Products include tasers, body cameras, patrol car cameras, and various software applications. The company has executed consistently by producing superior products that solve their customers' problems. Additionally, the company has expanded their addressable market to other end markets with similar demand trends. This has led to a consistent increase in earnings revisions, which has driven the stock. ChampionX is an oilfield services provider that operates mainly in the production phase of wells through its production chemicals and artificial lift businesses. Management has positioned the company well in the current spending upcycle, while showing improved margin expansion. Deckers Outdoor is a global footwear and lifestyle brand company serving casual and high performance needs. Its two signature brands are Ugg, representing approximately 60% of sales and Hoka, representing
about 30% of sales. Ugg is a steady grower generating healthy cash flow. Hoka is the growth engine. The Hoka brand is capitalizing on the success of its popular ultra-cushioned performance running sneakers and expanding into new geographies and categories including outdoor.
Outlook
The economy has remained resilient well past the time that liquidity began to be removed via interest rate increases and quantitative tightening. The labor market remains strong and earnings continue to grow, albeit modestly. Various outcomes are still on the table, including both soft and hard landings, and these paths could all lead the market in multiple directions. If it is a soft landing, the market would likely move higher at a moderate pace with earnings growth. If it is a hard landing, it’s likely the market would retrench for a period, and then possibly bounce meaningfully higher if the Fed cuts interest rates, even if not by much. Our belief is that regardless of the scenario, the easy money period is over and quality companies that can generate superior returns and have durable revenue growth will likely outperform. We believe higher rates will reward more disciplined and well-managed companies going forward. We also believe small caps are set to outperform large caps. Small caps are further out on the risk spectrum, and therefore should earn a higher return over the long term. Having underperformed large caps for a sustained period of time and given the absolute and relative valuation levels, we believe we are close to a pivot point for small caps to return to strength. Regardless, our philosophy and process remain consistent - focused on driving alpha via stock selection in high quality secular growth companies.
Top Ten Holdings as of September 30, 2023 |
| |
1 Kinsale Capital Group, Inc. | |
| |
| |
| |
| |
6 Pure Storage, Inc., Class A | |
| |
| |
9 Advanced Energy Industries, Inc. | |
| |
The portfolio is actively managed and holdings are subject to change. There is no guarantee the Fund continues to invest in the securities referenced. The holdings listed exclude any temporary cash investments, are presented on an individual security basis and do not represent holdings of the issuer. |
Hypothetical Growth of $100,000 Investment in Institutional Class Shares1 |
June 30, 2015 (inception) through September 30, 2023 |
See notes to chart on page 9.
Loomis Sayles Small/Mid Cap Growth Fund
Average Annual Total Returns — September 30, 20231 |
| | | | | |
| | |
Institutional Class (Inception 6/30/15) | | | | | | |
Class N (Inception 10/1/19) | | | | | | |
| | | | | | |
Russell 2500™ Growth Index2 | | | | | | |
Performance data shown represents past performance and is no guarantee of, and not necessarily indicative of, future results. Total return and value will vary, and you may have a gain or loss when shares are sold. Current performance may be lower or higher than quoted. For most recent month-end performance, visit loomissayles.com. Performance for other share classes will be greater or less than shown based on differences in fees and sales charges. You may not invest directly in an index. Performance for periods less than one year is cumulative, not annualized. Returns reflect changes in share price and reinvestment of dividends and capital gains, if any. The table(s) do not reflect taxes shareholders might owe on any fund distributions or when they redeem their shares.
| Fund performance has been increased by fee waivers and/or expense reimbursements, if any, without which performance would have been lower. |
| Russell 2500™ Growth Index measures the performance of the small-to-mid-cap growth segment of the U.S. equity universe. It includes those Russell 2500™ Index companies with higher price-to-book ratios and higher forecasted growth values. The Index is constructed to provide a comprehensive and unbiased barometer of the small-to-mid-cap growth market. The Index is completely reconstituted annually to ensure larger stocks do not distort the performance and characteristics of the true small-to-mid-cap opportunity set and that the represented companies continue to reflect growth characteristics. Indices are unmanaged. |
| Expense ratios are as shown in the Fund’s prospectus in effect as of the date of this report. The expense ratios for the current reporting period can be found in the Financial Highlights section of this report under Ratios to Average Net Assets. Net expenses reflect contractual expense limitations set to expire on 1/31/24. When a Fund’s expenses are below the limitation, gross and net expense ratios will be the same. See Note 5 of the Notes to Financial Statements for more information about the Fund’s expense limitations. |
ADDITIONAL INFORMATION
The views expressed in this report reflect those of the portfolio managers as of the dates indicated. The managers’ views are subject to change at any time without notice based on changes in market or other conditions. References to specific securities or industries should not be regarded as investment advice. Because the Funds are actively managed, there is no assurance that they will continue to invest in the securities or industries mentioned.
All investing involves risk, including the risk of loss. There is no assurance that any investment will meet its performance objectives or that losses will be avoided.
Additional Index Information
This document may contain references to third party copyrights, indexes, and trademarks, each of which is the property of its respective owner. Such owner is not affiliated with Natixis Investment Managers or any of its related or affiliated companies (collectively “Natixis Affiliates”) and does not sponsor, endorse or participate in the provision of any Natixis Affiliates services, funds or other financial products.
The index information contained herein is derived from third parties and is provided on an “as is” basis. The user of this information assumes the entire risk of use of this information. Each of the third party entities involved in compiling, computing or creating index information disclaims all warranties (including, without limitation, any warranties of originality, accuracy, completeness, timeliness, non-infringement, merchantability and fitness for a particular purpose) with respect to such information.
Proxy Voting Information
A description of the Funds' proxy voting policies and procedures is available without charge, upon request, by calling Loomis Sayles Funds at 800-633-3330; on the Funds’ website at www.loomissayles.com, and on the Securities and Exchange Commission (“SEC”) website at www.sec.gov. Information regarding how the Funds voted proxies relating to portfolio securities during the most recent 12-month period ended June 30 is available through the Funds’ website and the SEC website.
Quarterly Portfolio Schedules
The Loomis Sayles Funds file a complete schedule of portfolio holdings with the SEC for the first and third quarters of each fiscal year as an exhibit to its reports on Form N-PORT. The Funds’ Form N-PORT reports are available on the SEC website at www.sec.gov. First and third quarter schedules of portfolio holdings are also available at loomissayles.com. A hard copy may be requested from the Fund at no charge by calling 800-633-3330.
CFA® and Chartered Financial Analyst® are registered trademarks owned by the CFA Institute.
Understanding Your Fund's Expenses
As a mutual fund shareholder, you incur different costs: (1) transaction costs and (2) ongoing costs, including management fees, distribution and/or service fees ("12b-1 fees"), and other fund expenses. Certain exemptions may apply. These costs are described in more detail in the Funds’ prospectus. The following examples are intended to help you understand the ongoing costs of investing in the Funds and help you compare these with the ongoing costs of investing in other mutual funds.
The first line in the table of each class of Fund shares shows the actual account values and actual Fund expenses you would have paid on a $1,000 investment in the Fund from April 1, 2023 through September 30, 2023. To estimate the expenses you paid over the period, simply divide your account value by $1,000 (for example $8,600 account value divided by $1,000 = 8.60) and multiply the result by the number in the Expenses Paid During Period column as shown for your class.
The second line in the table for each class of fund shares provides information about hypothetical account values and hypothetical expenses based on the Fund’s actual expense ratios and an assumed rate of return of 5% per year before expenses, which is not the Fund’s actual return. The hypothetical account values and expenses may not be used to estimate the actual ending account balance or expenses you paid on your investment for the period. You may use this information to compare the ongoing costs of investing in each Fund and other funds. To do so, compare this 5% hypothetical example with the 5% hypothetical examples that appear in the shareholder reports of the other funds.
Please note that the expenses shown reflect ongoing costs only, and do not include any transaction costs, such as sales charges. Therefore, the second line in the table of each fund is useful in comparing ongoing costs only, and will not help you determine the relative costs of owning funds. If transaction costs were included, total costs would be higher.
Loomis Sayles Small Cap Growth Fund | Beginning
Account Value
4/1/2023 | Ending
Account Value
9/30/2023 | Expenses Paid
4/1/2023 – 9/30/2023 |
| | | |
| | | |
Hypothetical (5% return before expenses) | | | |
| | | |
| | | |
Hypothetical (5% return before expenses) | | | |
| | | |
| | | |
Hypothetical (5% return before expenses) | | | |
| Expenses are equal to the Fund's annualized expense ratio: 0.94%, 1.19% and 0.83% for Institutional Class, Retail Class and Class N, respectively, multiplied by the average account value over the period, multiplied by the number of days in the most recent fiscal half–year (183), divided by 365 (to reflect the half–year period). |
Loomis Sayles Small Cap Value Fund | Beginning
Account Value
4/1/2023 | Ending
Account Value
9/30/2023 | Expenses Paid
4/1/2023 – 9/30/2023 |
| | | |
| | | |
Hypothetical (5% return before expenses) | | | |
| | | |
| | | |
Hypothetical (5% return before expenses) | | | |
| | | |
| | | |
Hypothetical (5% return before expenses) | | | |
| | | |
| | | |
Hypothetical (5% return before expenses) | | | |
| Expenses are equal to the Fund's annualized expense ratio (after waiver/reimbursement): 0.90%, 1.15%, 1.40% and 0.85% for Institutional Class, Retail Class, Admin Class and Class N, respectively, multiplied by the average account value over the period, multiplied by the number of days in the most recent fiscal half–year (183), divided by 365 (to reflect the half–year period). |
Loomis Sayles Small/Mid Cap Growth Fund | Beginning
Account Value
4/1/2023 | Ending
Account Value
9/30/2023 | Expenses Paid
4/1/2023 – 9/30/2023 |
| | | |
| | | |
Hypothetical (5% return before expenses) | | | |
| | | |
| | | |
Hypothetical (5% return before expenses) | | | |
| Expenses are equal to the Fund's annualized expense ratio (after waiver/reimbursement): 0.85% and 0.83% for Institutional Class and Class N, respectively, multiplied by the average account value over the period, multiplied by the number of days in the most recent fiscal half–year (183), divided by 365 (to reflect the half–year period). |
BOARD APPROVAL OF THE EXISTING ADVISORY AGREEMENTS
The Board of Trustees of the Trust (the “Board”), including the Independent Trustees, considers matters bearing on each Fund’s advisory agreement (collectively, the “Agreements”) at most of its meetings throughout the year. Each year, usually in the spring, the Contract Review Committee of the Board meets to review the Agreements to determine whether to recommend that the full Board approve the continuation of the Agreements, typically for an additional one-year period. This meeting typically includes all the Independent Trustees, including the Trustees who do not serve on the Contract Review Committee. After the Contract Review Committee has made its recommendation, the full Board, including the Independent Trustees, determines whether to approve the continuation of the Agreements at its June Board meeting.
In connection with these meetings, the Trustees receive materials that the Funds’ investment adviser (the “Adviser”) believes to be reasonably necessary for the Trustees to evaluate the Agreements. These materials generally include, among other items, (i) information on the investment performance of the Funds and the performance of peer groups of funds and the Funds’ performance benchmarks, (ii) information on the Funds’ advisory fees and other expenses, including information comparing the Funds’ advisory fees to the fees charged to institutional accounts with similar strategies managed by the Adviser, if any, and to those of peer groups of funds and information about any applicable expense limitations and/or fee “breakpoints,” (iii) sales and redemption data in respect of the Funds, (iv) information about the profitability of the Agreements to the Adviser, including how profitability is determined for the Funds, and (v) information obtained through the completion by the Adviser of a questionnaire distributed on behalf of the Trustees. The Board, including the Independent Trustees, also considers other matters such as (i) each Fund’s investment objective and strategies and the size, education and experience of the Adviser’s investment staff and its use of technology, external research and trading cost measurement tools, (ii) arrangements in respect of the distribution of the Funds’ shares and the related costs, (iii) the allocation of the Funds’ brokerage, if any, including, to the extent applicable, allocations to brokers affiliated with the Adviser and the use of “soft” commission dollars to pay for research and other similar services, (iv) the Adviser’s policies and procedures relating to, among other things, compliance, trading and best execution, proxy voting, liquidity and valuation, (v) information about amounts invested by the Funds’ portfolio managers in the Funds or in similar accounts that they manage and (vi) the general economic outlook with particular emphasis on the mutual fund industry. Throughout the process, the Trustees are afforded the opportunity to ask questions of and request additional materials from the Adviser and the Independent Trustees meet separately with independent legal counsel outside the presence of Adviser personnel.
In addition to the materials requested by the Trustees in connection with their annual consideration of the continuation of the Agreements, the Trustees receive materials in advance of each regular quarterly meeting of the Board that provide detailed information about the Funds’ investment performance and the fees charged to the Funds for advisory and other services. The information received by the Trustees generally includes, where available, among other things, an internal performance rating for each Fund based on agreed-upon criteria, graphs showing each Fund’s performance and expense differentials against each Fund’s peer group/category of funds, total return information for various periods, performance rankings provided by a third-party data provider for various periods comparing a Fund against similarly categorized funds, and performance ratings provided by a different third-party rating organization. The portfolio management team for each Fund or other representatives of the Adviser make periodic presentations to the Contract Review Committee and/or the full Board, and Funds identified as presenting possible performance concerns may be subject to more frequent Board or Committee presentations and reviews. In addition, the Trustees are periodically provided with detailed statistical information about each Fund’s portfolio. The Trustees also receive periodic updates between meetings, both at the Board and at the Committee level.
The Board most recently approved the continuation of the Agreements for a one-year period at its meeting held in June 2023. In the case of Loomis Sayles Institutional High Income Fund, the Board approved the Agreement with an amendment that reduced the Fund’s advisory fee effective July 1, 2023. In considering whether to approve the continuation of the Agreements, the Board, including the Independent Trustees, did not identify any single factor as determinative. Individual Trustees may have evaluated the information presented differently from one another, giving different weights to various factors. Matters considered by the Trustees, including the Independent Trustees, in connection with their approval of the Agreements included, but were not limited to, the factors listed below.
The nature, extent and quality of the services provided to the Funds under the Agreements.The Trustees considered the nature, extent and quality of the services provided by the Adviser and its affiliates to the Funds and the resources dedicated to the Funds by the Adviser and its affiliates. The Trustees also considered their experience with other funds advised or sub-advised by the Adviser, as well as the affiliation between the Adviser and Natixis Investment Managers, LLC, whose affiliates provide investment advisory services to other funds in the Natixis family of funds.
The Trustees considered not only the advisory services provided by the Adviser to the Funds, but also the benefits to the Funds from the monitoring and oversight services provided by Natixis Advisors, LLC (“Natixis Advisors”). They also considered the administrative and shareholder services provided by Natixis Advisors and its affiliates to the Funds. They also took into consideration increases in the services provided resulting from new regulatory requirements, such as recent rules relating to the fair valuation of investments and the use of derivatives, as well as from monitoring proposed rules, such as those relating to privacy and cybersecurity, environmental, social and governance-specific disclosures, and vendor oversight.
For each Fund, the Trustees also considered the benefits to shareholders of investing in a mutual fund that is part of a family of funds that offers shareholders the right to exchange shares of one type of fund for shares of another type of fund, and provides a variety of fund and shareholder services.
After reviewing these and related factors, the Trustees concluded, within the context of their overall conclusions regarding each of the Agreements, that the nature, extent and quality of services provided supported the renewal of the Agreements.
Investment performance of the Funds and the Adviser. As noted above, the Trustees received information about the performance of the Funds over various time periods, including information that compared the performance of the Funds to the performance of peer groups and categories of funds and the Funds’ respective performance benchmarks. The Board noted that while it found the data provided by the independent third-party data provider useful, it recognized its limitations, including, in particular, that notable differences may exist between the Funds and the performance comparisons (for example, with respect to investment strategies) and that the results of the performance comparisons may vary depending on (i) the end dates for the performance periods that were selected and (ii) the selection of the performance comparisons. The Trustees also received information about how comparative peer groups are constructed. In addition, the Trustees reviewed data prepared by an independent third-party rating organization that analyzed the performance of the Funds using a variety of performance metrics, including metrics that measured the performance of the Funds on a risk adjusted basis.
The Board noted that, through December 31, 2022, each Fund’s one-, three- and five-year performance, stated as percentile rankings within categories selected by the independent third-party data provider, was as follows (where the best performance would be in the first percentile of its category):
| | | |
Loomis Sayles Small Cap Growth Fund | | | |
Loomis Sayles Small Cap Value Fund | | | |
Loomis Sayles Small/Mid Cap Growth Fund | | | |
In the case of each Fund that had performance that lagged that of a relevant category median as determined by the independent third-party data provider for certain periods, the Board concluded that other factors relevant to performance supported renewal of the Agreements. These factors included one or more of the following: (1) that the underperformance was attributable, to a significant extent, to investment decisions (such as security selection or sector allocation) by the Adviser that were reasonable and consistent with the Fund’s investment objective and policies; and (2) that the Fund’s shorter-term (one- and three-year) performance was stronger relative to its category. The Board also considered information about the Funds’ more recent performance, including how performance over various periods had been impacted by various factors such as market and economic events.
The Trustees also considered the Adviser’s performance and reputation generally, the performance of the fund family generally, and the historical responsiveness of the Adviser to Trustee concerns about performance and the willingness of the Adviser to take steps intended to improve performance.
After reviewing these and related factors, the Trustees concluded, within the context of their overall conclusions regarding each of the Agreements, that the performance of the Funds and the Adviser and/or other relevant factors supported the renewal of the Agreements.
The costs of the services to be provided and profits to be realized by the Adviser and its affiliates from their respective relationships with the Funds. The Trustees considered the fees charged to the Funds for advisory and administrative services as well as the total expense levels of the Funds. This information included comparisons (provided both by management and by an independent third party) of the Funds’ advisory fees and total expense levels to those of their peer groups and information about the advisory fees charged by the Adviser to comparable accounts (such as institutional separate accounts), as well as information about differences in such fees and the reasons for any such differences. In considering the fees charged to comparable accounts, the Trustees considered, among other things, management’s representations about the differences between managing mutual funds as compared to other types of accounts, including the additional resources required to effectively manage mutual fund assets, the greater regulatory costs associated with the management of such assets, and the entrepreneurial, regulatory and other risks associated with sponsoring and managing mutual funds. In evaluating each Fund’s advisory fee, the Trustees also took into account the demands, complexity and quality of the investment management of such Fund and the need for the Adviser to offer competitive compensation and the potential need to expend additional resources to the extent the Fund grows in size. The Trustees considered that over the past several years, management had demonstrated its intention to have competitive fee levels by making recommendations regarding reductions in advisory fee rates, implementation of advisory fee breakpoints and the institution of advisory fee waivers and expense limitations for various funds in the fund family. They noted that all of the Funds have expense limitations in place, and they considered the amounts waived or reimbursed by the Adviser for certain Funds under their respective expense limitation agreements. The Trustees also considered that Loomis Sayles Small Cap Growth Fund’s current expenses are below its expense limitation. They also noted that management had proposed to reduce the expense limitation for Loomis Sayles Small Cap Growth Fund on all share classes, effective as of July 1, 2023. The Trustees further noted that the Funds had total advisory fee rates that were at or below the medians of their respective peer groups of funds. The Board also
considered that the fee and expense information reflected information as of a certain date and that historical asset levels may differ from current asset levels, particularly in a period of market volatility.
The Trustees also considered the compensation directly or indirectly received by the Adviser and its affiliates from their relationships with the Funds. The Trustees reviewed information provided by management as to the profitability of the Adviser’s and its affiliates’ relationships with the Funds, and information about how expenses are determined and allocated for purposes of profitability calculations. They also reviewed information provided by management about the effect of distribution costs and changes in asset levels on Adviser profitability, including information regarding resources spent on distribution activities. When reviewing profitability, the Trustees also considered information about court cases in which adviser compensation or profitability were issues, the performance of the Funds, the expense levels of the Funds, whether the Adviser had implemented breakpoints and/or expense limitations with respect to such Funds and the overall profit margin of Natixis Investment Managers, LLC compared to that of certain other investment managers for which such data was available. The Board also noted the competitive nature of the global asset management industry.
After reviewing these and related factors, the Trustees concluded, within the context of their overall conclusions regarding each of the Agreements, that the advisory fee charged to each of the Funds was fair and reasonable, and that the costs of these services generally and the related profitability of the Adviser and its affiliates in respect of their relationships with the Funds supported the renewal of the Agreements.
Economies of Scale. The Trustees considered the existence of any economies of scale in the provision of services by the Adviser and whether those economies are shared with the Funds through breakpoints in their investment advisory fees or other means, such as expense limitations. The Trustees also considered management’s explanation of the factors that are taken into account with respect to the implementation of breakpoints in investment advisory fees or expense limitations, which reduced the total expenses borne by shareholders of certain Funds. With respect to economies of scale, the Trustees noted that although none of the Funds’ advisory fees were subject to breakpoints, each of the Funds was subject to an expense limitation. The Trustees also considered management’s proposal to reduce the expense limitation for Loomis Sayles Small Cap Growth Fund. In considering these issues, the Trustees also took note of the costs of the services provided (both on an absolute and on a relative basis) and the profitability to the Adviser and its affiliates of their relationships with the Funds, as discussed above. The Trustees also considered that the Funds have benefitted from the substantial reinvestment the Adviser has made into its business.
After reviewing these and related factors, the Trustees concluded, within the context of their overall conclusions regarding each of the Agreements, that the extent to which economies of scale were shared with the Funds supported the renewal of the Agreements.
The Trustees also considered other factors, which included but were not limited to the following:
• The effect of various factors and recent market and economic events, such as recent market volatility, geopolitical instability, aggressive domestic and foreign bank policies, and lingering effects of the Covid-19 crisis, as applicable, on the performance, asset levels and expense ratios of each Fund.
• Whether each Fund has operated in accordance with its investment objective and the Fund’s record of compliance with its investment restrictions, and the compliance programs of the Funds and the Adviser. They also considered the compliance-related resources the Adviser and its affiliates were providing to the Funds.
• So-called “fallout benefits” to the Adviser, such as the engagement of affiliates of the Adviser to provide distribution and administrative services to the Funds, and the benefits of research made available to the Adviser by reason of brokerage commissions (if any) generated by the Funds’ securities transactions. The Trustees considered the possible conflicts of interest associated with these fallout and other benefits, and the reporting, disclosure and other processes in place to disclose and monitor such possible conflicts of interest.
• The Trustees’ review and discussion of the Funds’ advisory arrangements in prior years, and management’s record of responding to Trustee concerns raised during the year and in prior years.
Based on their evaluation of all factors that they deemed to be material, including those factors described above, and assisted by the advice of independent counsel, the Trustees, including the Independent Trustees, concluded that each of the existing Agreements should be continued through June 30, 2024.
LIQUIDITY RISK MANAGEMENT PROGRAM
Annual Report for the Period Commencing on January 1, 2022 and ending December 31, 2022 (including updates through September 30, 2023)
Effective December 1, 2018, the Funds adopted a liquidity risk management program (the “Program”) pursuant to the requirements of Rule 22e-4 under the Investment Company Act of 1940, as amended (the “Rule”). The Rule requires registered open-end funds, including mutual funds and exchange-traded funds, to establish liquidity risk management programs in order to effectively manage fund liquidity and mitigate the risk that a fund could not meet redemption requests without significantly diluting the interests of remaining investors.
The Rule requires the Funds to assess, manage and review their liquidity risk considering applicable factors during normal and foreseeable stressed conditions. In fulfilling this requirement, each Fund assesses and reviews (where applicable and amongst other matters) its investment strategy, portfolio holdings, possible investment concentrations, use of derivatives, short-term and long-term cash flow projections, use of cash and cash equivalents, as well as borrowing arrangements and other funding sources. Each Program has established a Program Administrator, which is the adviser of the Funds.
In accordance with the Program, each of the Fund’s portfolio investments is classified into one of four liquidity categories based on a determination of a reasonable expectation for how long it would take to convert the investment to cash (or sell or dispose of the investment) without significantly changing its market value.
Each Fund is prohibited from acquiring an investment if, after the acquisition, its holdings of illiquid assets will exceed 15% of its net assets. If a Fund does not hold a majority of highly liquid investments in its portfolio, then the Fund is required to establish a highly liquid investment minimum (“HLIM”). None of the Funds has established an HLIM.
During the period from January 1, 2022 to December 31, 2022, there were no material changes to the Program and no material events that impacted the operation of the Funds’ Programs. During the period, the Funds held sufficient liquid assets to meet redemptions on a timely basis and did not have any illiquid security violations.
During the period January 1, 2023 through September 30, 2023, the Funds held sufficient liquid assets to meet redemptions on a timely basis and did not have any illiquid security violations.
Annual Program Assessment and Conclusion
In the opinion of the Program Administrators, the Program of each Fund approved by the Funds’ Board is operating effectively. The Program Administrators have also monitored, assessed and managed each Fund’s liquidity risk regularly throughout the period.
Pursuant to the Rule’s requirements, the Board has received and reviewed a written report prepared by each Fund’s Program Administrator that addressed the operation of the Programs, assessed their adequacy and effectiveness and described any material changes made to the Programs.
Portfolio of Investments – as of September 30, 2023
Loomis Sayles Small Cap Growth Fund
| | |
Common Stocks— 96.5% of Net Assets |
| Aerospace & Defense — 3.3% |
| | |
| | |
| Kratos Defense & Security Solutions, Inc.(a) | |
| | |
| Automobile Components — 2.7% |
| | |
| | |
| | |
| | |
| |
| | |
| |
| | |
| |
| | |
| | |
| | |
| | |
| | |
| Xenon Pharmaceuticals, Inc.(a) | |
| | |
| |
| | |
| |
| Hamilton Lane, Inc., Class A | |
| PJT Partners, Inc., Class A | |
| | |
| Commercial Services & Supplies — 2.5% |
| ACV Auctions, Inc., Class A(a) | |
| Casella Waste Systems, Inc., Class A(a) | |
| | |
| Communications Equipment — 1.8% |
| | |
| Extreme Networks, Inc.(a) | |
| | |
| Construction & Engineering — 2.0% |
| | |
| WillScot Mobile Mini Holdings Corp.(a) | |
| | |
| Diversified Consumer Services — 0.8% |
| Grand Canyon Education, Inc.(a) | |
| Electronic Equipment, Instruments & |
| Advanced Energy Industries, Inc. | |
| | |
| Electronic Equipment, Instruments & Components — continued |
| | |
| | |
| | |
| Energy Equipment & Services — 5.5% |
| | |
| | |
| Oceaneering International, Inc.(a) | |
| Weatherford International PLC(a) | |
| | |
| Financial Services — 2.6% |
| | |
| | |
| | |
| |
| | |
| | |
| | |
| Ground Transportation — 0.8% |
| | |
| Health Care Equipment & Supplies — 7.9% |
| | |
| | |
| | |
| Inspire Medical Systems, Inc.(a) | |
| | |
| Merit Medical Systems, Inc.(a) | |
| PROCEPT BioRobotics Corp.(a) | |
| Treace Medical Concepts, Inc.(a) | |
| | |
| Health Care Providers & Services — 5.4% |
| Acadia Healthcare Co., Inc.(a) | |
| | |
| Option Care Health, Inc.(a) | |
| | |
| | |
| | |
| Health Care Technology — 1.4% |
| Evolent Health, Inc., Class A(a) | |
| | |
| | |
| Hotels, Restaurants & Leisure — 3.1% |
| Life Time Group Holdings, Inc.(a) | |
| Papa John's International, Inc. | |
| | |
| | |
| Household Durables — 1.2% |
| Installed Building Products, Inc. | |
See accompanying notes to financial statements.
Portfolio of Investments – as of September 30, 2023
Loomis Sayles Small Cap Growth Fund (continued)
| | |
| |
| BRP Group, Inc., Class A(a) | |
| Goosehead Insurance, Inc., Class A(a) | |
| Kinsale Capital Group, Inc. | |
| | |
| |
| Malibu Boats, Inc., Class A(a) | |
| Life Sciences Tools & Services — 1.1% |
| Medpace Holdings, Inc.(a) | |
| |
| Albany International Corp., Class A | |
| | |
| Helios Technologies, Inc. | |
| | |
| | |
| Oil, Gas & Consumable Fuels — 1.0% |
| Magnolia Oil & Gas Corp., Class A | |
| Personal Care Products — 3.7% |
| | |
| | |
| | |
| | |
| |
| Supernus Pharmaceuticals, Inc.(a) | |
| Ventyx Biosciences, Inc.(a) | |
| | |
| Professional Services — 5.5% |
| | |
| Huron Consulting Group, Inc.(a) | |
| | |
| | |
| WNS Holdings Ltd., ADR(a) | |
| | |
| Semiconductors & Semiconductor Equipment — 5.8% |
| MACOM Technology Solutions Holdings, Inc.(a) | |
| | |
| | |
| Silicon Laboratories, Inc.(a) | |
| | |
| |
| | |
| Clearwater Analytics Holdings, Inc., Class A(a) | |
| | |
| | |
| Tenable Holdings, Inc.(a) | |
| | |
| | |
| | |
| | |
| |
| Boot Barn Holdings, Inc.(a) | |
| Technology Hardware, Storage & Peripherals — 1.4% |
| Pure Storage, Inc., Class A(a) | |
| Textiles, Apparel & Luxury Goods — 1.6% |
| | |
| | |
| | |
| Trading Companies & Distributors — 3.8% |
| Applied Industrial Technologies, Inc. | |
| | |
| SiteOne Landscape Supply, Inc.(a) | |
| | |
| Total Common Stocks
(Identified Cost $1,879,352,008)
| |
| | |
Short-Term Investments — 4.2% |
| Tri-Party Repurchase Agreement with Fixed Income Clearing Corporation, dated 9/29/2023 at 2.500% to be repurchased at $92,364,197 on 10/02/2023 collateralized by $94,907,600 U.S. Treasury Note, 4.375% due 8/15/2026 valued at $94,191,925 including accrued interest (Note 2 of Notes to Financial Statements)
(Identified Cost $92,344,958) | |
| Total Investments — 100.7%
(Identified Cost $1,971,696,966)
| |
| Other assets less liabilities — (0.7)% | |
| | |
| See Note 2 of Notes to Financial Statements. |
| Non-income producing security. |
| An American Depositary Receipt is a certificate issued by a custodian bank representing the right to receive securities of the foreign issuer described. The values of ADRs may be significantly influenced by trading on exchanges not located in the United States. |
See accompanying notes to financial statements.
Portfolio of Investments – as of September 30, 2023
Loomis Sayles Small Cap Growth Fund (continued)
Industry Summary at September 30, 2023
Health Care Equipment & Supplies | |
| |
Semiconductors & Semiconductor Equipment | |
Energy Equipment & Services | |
| |
Health Care Providers & Services | |
| |
| |
Trading Companies & Distributors | |
| |
| |
| |
Hotels, Restaurants & Leisure | |
Electronic Equipment, Instruments & Components | |
| |
| |
| |
Commercial Services & Supplies | |
Construction & Engineering | |
Other Investments, less than 2% each | |
| |
| |
Other assets less liabilities | |
| |
See accompanying notes to financial statements.
Portfolio of Investments – as of September 30, 2023
Loomis Sayles Small Cap Value Fund
| | |
Common Stocks— 98.9% of Net Assets |
| Aerospace & Defense — 3.5% |
| | |
| | |
| | |
| | |
| |
| | |
| | |
| | |
| | |
| OceanFirst Financial Corp. | |
| Pinnacle Financial Partners, Inc. | |
| | |
| Prosperity Bancshares, Inc. | |
| | |
| | |
| | |
| | |
| |
| | |
| United Therapeutics Corp.(a) | |
| | |
| |
| | |
| Janus International Group, Inc.(a) | |
| Quanex Building Products Corp. | |
| | |
| | |
| |
| | |
| | |
| | |
| |
| | |
| | |
| | |
| | |
| | |
| Commercial Services & Supplies — 2.6% |
| CECO Environmental Corp.(a) | |
| | |
| | |
| | |
| Communications Equipment — 0.6% |
| | |
| Construction & Engineering — 1.9% |
| | |
| MDU Resources Group, Inc. | |
| | |
| | |
| Construction Materials — 0.9% |
| | |
| Consumer Staples Distribution & Retail — 1.1% |
| | |
| Electric Utilities — 0.7% |
| | |
| Electrical Equipment — 1.0% |
| | |
| Electronic Equipment, Instruments & |
| | |
| | |
| Kimball Electronics, Inc.(a) | |
| | |
| Methode Electronics, Inc. | |
| National Instruments Corp. | |
| | |
| | |
| TTM Technologies, Inc.(a) | |
| | |
| | |
| Energy Equipment & Services — 7.2% |
| | |
| Newpark Resources, Inc.(a) | |
| | |
| | |
| Weatherford International PLC(a) | |
| | |
| |
| Atlanta Braves Holdings, Inc., Class C(a) | |
| Financial Services — 3.2% |
| | |
| Euronet Worldwide, Inc.(a) | |
| Federal Agricultural Mortgage Corp., Class C | |
| International Money Express, Inc.(a) | |
| | |
| |
| | |
| | |
| | |
| Health Care Equipment & Supplies — 3.9% |
| | |
| | |
| | |
| Lantheus Holdings, Inc.(a) | |
| UFP Technologies, Inc.(a) | |
| | |
| Health Care Providers & Services — 3.1% |
| | |
See accompanying notes to financial statements.
Portfolio of Investments – as of September 30, 2023
Loomis Sayles Small Cap Value Fund (continued)
| | |
| Health Care Providers & Services — continued |
| AMN Healthcare Services, Inc.(a) | |
| Option Care Health, Inc.(a) | |
| Tenet Healthcare Corp.(a) | |
| | |
| Health Care Technology — 0.6% |
| | |
| Hotels, Restaurants & Leisure — 1.6% |
| | |
| Marriott Vacations Worldwide Corp. | |
| | |
| Household Durables — 1.8% |
| | |
| Skyline Champion Corp.(a) | |
| | |
| Household Products — 0.8% |
| Spectrum Brands Holdings, Inc. | |
| |
| | |
| |
| | |
| | |
| | |
| |
| | |
| |
| | |
| |
| Albany International Corp., Class A | |
| | |
| | |
| | |
| | |
| Marine Transportation — 0.8% |
| Genco Shipping & Trading Ltd. | |
| |
| John Wiley & Sons, Inc., Class A | |
| | |
| | |
| | |
| |
| | |
| Postal Realty Trust, Inc., Class A | |
| | |
| Oil, Gas & Consumable Fuels — 5.8% |
| Antero Resources Corp.(a) | |
| California Resources Corp. | |
| Delek U.S. Holdings, Inc. | |
| | |
| Oil, Gas & Consumable Fuels — continued |
| International Seaways, Inc. | |
| | |
| | |
| | |
| Personal Care Products — 1.3% |
| | |
| |
| ANI Pharmaceuticals, Inc.(a) | |
| Pacira BioSciences, Inc.(a) | |
| Supernus Pharmaceuticals, Inc.(a) | |
| | |
| Professional Services — 3.4% |
| | |
| | |
| CSG Systems International, Inc. | |
| | |
| Science Applications International Corp. | |
| | |
| Real Estate Management & Development — 0.8% |
| Colliers International Group, Inc. | |
| |
| | |
| Semiconductors & Semiconductor Equipment — 2.4% |
| | |
| | |
| Tower Semiconductor Ltd.(a) | |
| | |
| |
| Academy Sports & Outdoors, Inc. | |
| Boot Barn Holdings, Inc.(a) | |
| | |
| Technology Hardware, Storage & Peripherals — 1.2% |
| Super Micro Computer, Inc.(a) | |
| Textiles, Apparel & Luxury Goods — 0.9% |
| | |
| Trading Companies & Distributors — 3.6% |
| Alta Equipment Group, Inc. | |
| Custom Truck One Source, Inc.(a) | |
| | |
| | |
| | |
| | |
| |
| | |
See accompanying notes to financial statements.
Portfolio of Investments – as of September 30, 2023
Loomis Sayles Small Cap Value Fund (continued)
| | |
| Wireless Telecommunication Services — 1.3% |
| | |
| Total Common Stocks
(Identified Cost $255,533,897)
| |
| | |
Short-Term Investments — 1.5% |
| Tri-Party Repurchase Agreement with Fixed Income Clearing Corporation, dated 9/29/2023 at 2.500% to be repurchased at $5,056,971 on 10/02/2023 collateralized by $5,791,600 U.S. Treasury Note, 0.750% due 8/31/2026 valued at $5,157,080 including accrued interest (Note 2 of Notes to Financial Statements)
(Identified Cost $5,055,918) | |
| Total Investments — 100.4%
(Identified Cost $260,589,815)
| |
| Other assets less liabilities — (0.4)% | |
| | |
| See Note 2 of Notes to Financial Statements. |
| Non-income producing security. |
| Real Estate Investment Trusts |
Industry Summary at September 30, 2023
| |
Electronic Equipment, Instruments & Components | |
Energy Equipment & Services | |
Oil, Gas & Consumable Fuels | |
Health Care Equipment & Supplies | |
Trading Companies & Distributors | |
| |
| |
| |
| |
| |
| |
Health Care Providers & Services | |
Commercial Services & Supplies | |
Semiconductors & Semiconductor Equipment | |
| |
Other Investments, less than 2% each | |
| |
| |
Other assets less liabilities | |
| |
See accompanying notes to financial statements.
Portfolio of Investments – as of September 30, 2023
Loomis Sayles Small/Mid Cap Growth Fund
| | |
Common Stocks— 96.6% of Net Assets |
| Aerospace & Defense — 5.7% |
| | |
| | |
| | |
| | |
| | |
| Automobile Components — 1.4% |
| | |
| |
| | |
| |
| | |
| | |
| | |
| Neurocrine Biosciences, Inc.(a) | |
| | |
| United Therapeutics Corp.(a) | |
| | |
| | |
| |
| Savers Value Village, Inc.(a) | |
| |
| | |
| |
| Hamilton Lane, Inc., Class A | |
| StepStone Group, Inc., Class A | |
| | |
| Commercial Services & Supplies — 2.5% |
| | |
| | |
| | |
| Communications Equipment — 1.4% |
| | |
| Construction & Engineering — 2.0% |
| | |
| WillScot Mobile Mini Holdings Corp.(a) | |
| | |
| Consumer Staples Distribution & Retail — 3.6% |
| BJ's Wholesale Club Holdings, Inc.(a) | |
| Casey's General Stores, Inc. | |
| Performance Food Group Co.(a) | |
| | |
| Electronic Equipment, Instruments & |
| Advanced Energy Industries, Inc. | |
| | |
| Electronic Equipment, Instruments & Components — continued |
| | |
| | |
| | |
| Energy Equipment & Services — 4.1% |
| | |
| Expro Group Holdings NV(a) | |
| | |
| | |
| Financial Services — 2.4% |
| | |
| | |
| | |
| |
| | |
| Health Care Equipment & Supplies — 6.7% |
| | |
| | |
| | |
| | |
| Merit Medical Systems, Inc.(a) | |
| | |
| PROCEPT BioRobotics Corp.(a) | |
| | |
| Health Care Providers & Services — 3.2% |
| Acadia Healthcare Co., Inc.(a) | |
| | |
| Privia Health Group, Inc.(a) | |
| | |
| Health Care Technology — 0.9% |
| Evolent Health, Inc., Class A(a) | |
| Hotels, Restaurants & Leisure — 4.8% |
| | |
| | |
| Planet Fitness, Inc., Class A(a) | |
| | |
| | |
| |
| Kinsale Capital Group, Inc. | |
| Reinsurance Group of America, Inc. | |
| | |
| |
| | |
| | |
| | |
| | |
| |
| | |
See accompanying notes to financial statements.
Portfolio of Investments – as of September 30, 2023
Loomis Sayles Small/Mid Cap Growth Fund (continued)
| | |
| Oil, Gas & Consumable Fuels — 3.9% |
| | |
| Magnolia Oil & Gas Corp., Class A | |
| | |
| | |
| |
| Ventyx Biosciences, Inc.(a) | |
| Professional Services — 5.5% |
| | |
| | |
| | |
| Paylocity Holding Corp.(a) | |
| | |
| Semiconductors & Semiconductor Equipment — 5.7% |
| Allegro MicroSystems, Inc.(a) | |
| Monolithic Power Systems, Inc. | |
| | |
| | |
| Silicon Laboratories, Inc.(a) | |
| | |
| |
| | |
| Clearwater Analytics Holdings, Inc., Class A(a) | |
| CyberArk Software Ltd.(a) | |
| DoubleVerify Holdings, Inc.(a) | |
| PowerSchool Holdings, Inc., Class A(a) | |
| Tyler Technologies, Inc.(a) | |
| | |
| | |
| |
| | |
| Technology Hardware, Storage & Peripherals — 1.7% |
| Pure Storage, Inc., Class A(a) | |
| Textiles, Apparel & Luxury Goods — 3.4% |
| | |
| | |
| Skechers USA, Inc., Class A(a) | |
| | |
| Trading Companies & Distributors — 1.5% |
| SiteOne Landscape Supply, Inc.(a) | |
| Total Common Stocks
(Identified Cost $138,419,405)
| |
| | |
Short-Term Investments — 3.6% |
| Tri-Party Repurchase Agreement with Fixed Income Clearing Corporation, dated 9/29/2023 at 2.500% to be repurchased at $5,195,065 on 10/02/2023 collateralized by $5,949,800 U.S. Treasury Note, 0.750% due 8/31/2026 valued at $5,297,948 including accrued interest (Note 2 of Notes to Financial Statements)
(Identified Cost $5,193,983) | |
| Total Investments — 100.2%
(Identified Cost $143,613,388)
| |
| Other assets less liabilities — (0.2)% | |
| | |
| See Note 2 of Notes to Financial Statements. |
| Non-income producing security. |
Industry Summary at September 30, 2023
| |
| |
Health Care Equipment & Supplies | |
Semiconductors & Semiconductor Equipment | |
| |
| |
Hotels, Restaurants & Leisure | |
Energy Equipment & Services | |
Oil, Gas & Consumable Fuels | |
Consumer Staples Distribution & Retail | |
Electronic Equipment, Instruments & Components | |
Textiles, Apparel & Luxury Goods | |
Health Care Providers & Services | |
| |
| |
| |
Commercial Services & Supplies | |
| |
Construction & Engineering | |
Other Investments, less than 2% each | |
| |
| |
Other assets less liabilities | |
| |
See accompanying notes to financial statements.
Statements of Assets and Liabilities
| | | |
| | | |
| | | |
Net unrealized appreciation | | | |
| | | |
| | | |
Receivable for Fund shares sold | | | |
Receivable for securities sold | | | |
Dividends and interest receivable | | | |
Prepaid expenses (Note 7) | | | |
| | | |
| | | |
Payable for securities purchased | | | |
Payable for Fund shares redeemed | | | |
Management fees payable (Note 5) | | | |
Deferred Trustees’ fees (Note 5) | | | |
Administrative fees payable (Note 5) | | | |
Payable to distributor (Note 5d) | | | |
Audit and tax services fees payable | | | |
Other accounts payable and accrued expenses | | | |
| | | |
| | | |
| | | |
| | | |
Accumulated earnings (loss) | | | |
| | | |
COMPUTATION OF NET ASSET VALUE AND OFFERING PRICE: | | | |
| | | |
| | | |
Shares of beneficial interest | | | |
Net asset value, offering and redemption price per share | | | |
| | | |
| | | |
Shares of beneficial interest | | | |
Net asset value, offering and redemption price per share | | | |
| | | |
| | | |
Shares of beneficial interest | | | |
Net asset value, offering and redemption price per share | | | |
| | | |
| | | |
Shares of beneficial interest | | | |
Net asset value, offering and redemption price per share | | | |
See accompanying notes to financial statements.
For the Year Ended September 30, 2023
| | | |
| | | |
| | | |
| | | |
Less net foreign taxes withheld | | | |
| | | |
| | | |
| | | |
Service and distribution fees (Note 5) | | | |
Administrative fees (Note 5) | | | |
Trustees' fees and expenses (Note 5) | | | |
Transfer agent fees and expenses (Notes 5 and 6) | | | |
Audit and tax services fees | | | |
Custodian fees and expenses | | | |
| | | |
| | | |
Shareholder reporting expenses | | | |
| | | |
| | | |
Less waiver and/or expense reimbursement (Note 5) | | | |
| | | |
Net investment income (loss) | | | |
Net realized and unrealized gain (loss) on Investments | | | |
Net realized gain (loss) on: | | | |
| | | |
Net change in unrealized appreciation (depreciation) on: | | | |
| | | |
Net realized and unrealized gain on Investments | | | |
NET INCREASE IN NET ASSETS RESULTING FROM OPERATIONS | | | |
See accompanying notes to financial statements.
Statements of Changes in Net Assets
| | |
| Year Ended
September 30, 2023 | Year Ended
September 30, 2022 | Year Ended
September 30, 2023 | Year Ended
September 30, 2022 |
| | | | |
Net investment income (loss) | | | | |
Net realized gain on investments | | | | |
Net change in unrealized appreciation (depreciation) on investments | | | | |
Net increase (decrease) in net assets resulting from operations | | | | |
FROM DISTRIBUTIONS TO SHAREHOLDERS: | | | | |
| | | | |
| | | | |
| | | | |
| | | | |
| | | | |
NET INCREASE (DECREASE) IN NET ASSETS FROM CAPITAL SHARES TRANSACTIONS (Note 10) | | | | |
Net increase (decrease) in net assets | | | | |
| | | | |
| | | | |
| | | | |
See accompanying notes to financial statements.
Statements of Changes in Net Assets (continued)
| Small/Mid Cap Growth Fund |
| Year Ended
September 30, 2023 | Year Ended
September 30, 2022 |
| | |
| | |
Net realized loss on investments | | |
Net change in unrealized appreciation (depreciation) on investments | | |
Net increase (decrease) in net assets resulting from operations | | |
FROM DISTRIBUTIONS TO SHAREHOLDERS: | | |
| | |
| | |
| | |
NET INCREASE (DECREASE) IN NET ASSETS FROM CAPITAL SHARES TRANSACTIONS (Note 10) | | |
Net increase (decrease) in net assets | | |
| | |
| | |
| | |
See accompanying notes to financial statements.
For a share outstanding throughout each period.
| Small Cap Growth Fund – Institutional Class |
| Year Ended
September 30,
2023 | Year Ended
September 30,
2022 | Year Ended
September 30,
2021 | Year Ended
September 30,
2020 | Year Ended
September 30,
2019 |
Net asset value, beginning of the period | | | | | |
INCOME (LOSS) FROM INVESTMENT OPERATIONS: | | | | | |
| | | | | |
Net realized and unrealized gain (loss) | | | | | |
Total from Investment Operations | | | | | |
| | | | | |
Net realized capital gains | | | | | |
Net asset value, end of the period | | | | | |
| | | | | |
RATIOS TO AVERAGE NET ASSETS: | | | | | |
Net assets, end of the period (000's) | | | | | |
| | | | | |
| | | | | |
| | | | | |
| | | | | |
| Per share net investment loss has been calculated using the average shares outstanding during the period. |
| Includes a non-recurring dividend. Without this dividend, net investment loss per share would have been $(0.16), total return would have been (24.83%) and the ratio of net investment loss to average net assets would have been (0.56%). |
| Small Cap Growth Fund– Retail Class |
| Year Ended
September 30,
2023 | Year Ended
September 30,
2022 | Year Ended
September 30,
2021 | Year Ended
September 30,
2020 | Year Ended
September 30,
2019 |
Net asset value, beginning of the period | | | | | |
INCOME (LOSS) FROM INVESTMENT OPERATIONS: | | | | | |
| | | | | |
Net realized and unrealized gain (loss) | | | | | |
Total from Investment Operations | | | | | |
| | | | | |
Net realized capital gains | | | | | |
Net asset value, end of the period | | | | | |
| | | | | |
RATIOS TO AVERAGE NET ASSETS: | | | | | |
Net assets, end of the period (000's) | | | | | |
| | | | | |
| | | | | |
| | | | | |
| | | | | |
| Per share net investment loss has been calculated using the average shares outstanding during the period. |
| Includes a non-recurring dividend. Without this dividend, net investment loss per share would have been $(0.21), total return would have been (25.01%) and the ratio of net investment loss to average net assets would have been (0.81%). |
| Had certain expenses not been waived/reimbursed during the period, total returns would have been lower. |
| The administrator agreed to waive its fees and/or reimburse a portion of the Fund’s expenses during the period. Without this waiver/reimbursement, expenses would have been higher. |
See accompanying notes to financial statements.
Financial Highlights (continued)
For a share outstanding throughout each period.
| Small Cap Growth Fund– Class N |
| Year Ended
September 30,
2023 | Year Ended
September 30,
2022 | Year Ended
September 30,
2021 | Year Ended
September 30,
2020 | Year Ended
September 30,
2019 |
Net asset value, beginning of the period | | | | | |
INCOME (LOSS) FROM INVESTMENT OPERATIONS: | | | | | |
| | | | | |
Net realized and unrealized gain (loss) | | | | | |
Total from Investment Operations | | | | | |
| | | | | |
Net realized capital gains | | | | | |
Net asset value, end of the period | | | | | |
| | | | | |
RATIOS TO AVERAGE NET ASSETS: | | | | | |
Net assets, end of the period (000's) | | | | | |
| | | | | |
| | | | | |
| | | | | |
| | | | | |
| Per share net investment loss has been calculated using the average shares outstanding during the period. |
| Includes a non-recurring dividend. Without this dividend, net investment loss per share would have been $(0.13), total return would have been (24.71%) and the ratio of net investment loss to average net assets would have been (0.44%). |
| Small Cap Value Fund – Institutional Class |
| Year Ended
September 30,
2023 | Year Ended
September 30,
2022 | Year Ended
September 30,
2021 | Year Ended
September 30,
2020 | Year Ended
September 30,
2019 |
Net asset value, beginning of the period | | | | | |
INCOME (LOSS) FROM INVESTMENT OPERATIONS: | | | | | |
| | | | | |
Net realized and unrealized gain (loss) | | | | | |
Total from Investment Operations | | | | | |
| | | | | |
| | | | | |
Net realized capital gains | | | | | |
| | | | | |
Net asset value, end of the period | | | | | |
| | | | | |
RATIOS TO AVERAGE NET ASSETS: | | | | | |
Net assets, end of the period (000's) | | | | | |
| | | | | |
| | | | | |
| | | | | |
| | | | | |
| Per share net investment income has been calculated using the average shares outstanding during the period. |
| Had certain expenses not been waived/reimbursed during the period, total returns would have been lower. |
| The investment adviser agreed to waive its fees and/or reimburse a portion of the Fund’s expenses during the period. Without this waiver/reimbursement, expenses would have been higher. |
See accompanying notes to financial statements.
Financial Highlights (continued)
For a share outstanding throughout each period.
| Small Cap Value Fund– Retail Class |
| Year Ended
September 30,
2023 | Year Ended
September 30,
2022 | Year Ended
September 30,
2021 | Year Ended
September 30,
2020 | Year Ended
September 30,
2019 |
Net asset value, beginning of the period | | | | | |
INCOME (LOSS) FROM INVESTMENT OPERATIONS: | | | | | |
Net investment income (loss)(a) | | | | | |
Net realized and unrealized gain (loss) | | | | | |
Total from Investment Operations | | | | | |
| | | | | |
| | | | | |
Net realized capital gains | | | | | |
| | | | | |
Net asset value, end of the period | | | | | |
| | | | | |
RATIOS TO AVERAGE NET ASSETS: | | | | | |
Net assets, end of the period (000's) | | | | | |
| | | | | |
| | | | | |
Net investment income (loss) | | | | | |
| | | | | |
| Per share net investment income (loss) has been calculated using the average shares outstanding during the period. |
| Had certain expenses not been waived/reimbursed during the period, total returns would have been lower. |
| The investment adviser agreed to waive its fees and/or reimburse a portion of the Fund’s expenses during the period. Without this waiver/reimbursement, expenses would have been higher. |
| Small Cap Value Fund– Admin Class |
| Year Ended
September 30,
2023 | Year Ended
September 30,
2022 | Year Ended
September 30,
2021 | Year Ended
September 30,
2020 | Year Ended
September 30,
2019 |
Net asset value, beginning of the year | | | | | |
INCOME (LOSS) FROM INVESTMENT OPERATIONS: |
| | | | | |
Net realized and unrealized gain (loss) | | | | | |
Total from Investment Operations | | | | | |
| | | | | |
| | | | | |
Net realized capital gains | | | | | |
| | | | | |
Net asset value, end of the period | | | | | |
| | | | | |
RATIOS TO AVERAGE NET ASSETS: | | | | | |
Net assets, end of the period (000's) | | | | | |
| | | | | |
| | | | | |
| | | | | |
| | | | | |
| Per share net investment loss has been calculated using the average shares outstanding during the period. |
| Had certain expenses not been waived/reimbursed during the period, total returns would have been lower. |
| The investment adviser agreed to waive its fees and/or reimburse a portion of the Fund’s expenses during the period. Without this waiver/reimbursement, expenses would have been higher. |
See accompanying notes to financial statements.
Financial Highlights (continued)
For a share outstanding throughout each period.
| Small Cap Value Fund– Class N |
| Year Ended
September 30,
2023 | Year Ended
September 30,
2022 | Year Ended
September 30,
2021 | Year Ended
September 30,
2020 | Year Ended
September 30,
2019 |
Net asset value, beginning of the period | | | | | |
INCOME (LOSS) FROM INVESTMENT OPERATIONS: | | | | | |
| | | | | |
Net realized and unrealized gain (loss) | | | | | |
Total from Investment Operations | | | | | |
| | | | | |
| | | | | |
Net realized capital gains | | | | | |
| | | | | |
Net asset value, end of the period | | | | | |
| | | | | |
RATIOS TO AVERAGE NET ASSETS: | | | | | |
Net assets, end of the period (000's) | | | | | |
| | | | | |
| | | | | |
| | | | | |
| | | | | |
| Per share net investment income has been calculated using the average shares outstanding during the period. |
| Had certain expenses not been waived/reimbursed during the period, total returns would have been lower. |
| The investment adviser agreed to waive its fees and/or reimburse a portion of the Fund’s expenses during the period. Without this waiver/reimbursement, expenses would have been higher. |
See accompanying notes to financial statements.
Financial Highlights (continued)
For a share outstanding throughout each period.
| Small/Mid Cap Growth Fund – Institutional Class |
| Year Ended
September 30,
2023 | Year Ended
September 30,
2022 | Year Ended
September 30,
2021 | Year Ended
September 30,
2020 | Year Ended
September 30,
2019 |
Net asset value, beginning of the period | | | | | |
INCOME (LOSS) FROM INVESTMENT OPERATIONS: | | | | | |
| | | | | |
Net realized and unrealized gain (loss) | | | | | |
Total from Investment Operations | | | | | |
| | | | | |
Net realized capital gains | | | | | |
Net asset value, end of the period | | | | | |
| | | | | |
RATIOS TO AVERAGE NET ASSETS: | | | | | |
Net assets, end of the period (000's) | | | | | |
| | | | | |
| | | | | |
| | | | | |
| | | | | |
| Per share net investment loss has been calculated using the average shares outstanding during the period. |
| Includes a non-recurring dividend. Without this dividend, net investment loss per share would have been $(0.08), total return would have been 29.49% and the ratio of net investment loss to average net assets would have been (0.52%). |
| The amount shown for a share outstanding does not correspond with the aggregate realized and unrealized gain (loss) on investments for the period due to the timing of sales and redemptions of fund shares in relation to fluctuating market values of investments of the Fund. |
| Had certain expenses not been waived/reimbursed during the period, total returns would have been lower. |
| The investment adviser agreed to waive its fees and/or reimburse a portion of the Fund’s expenses during the period. Without this waiver/reimbursement, expenses would have been higher. |
| Includes additional voluntary waiver of advisory fee of 0.01%. |
See accompanying notes to financial statements.
Financial Highlights (continued)
For a share outstanding throughout each period.
| Small/Mid Cap Growth Fund– Class N |
| Year Ended
September 30,
2023 | Year Ended
September 30,
2022 | Year Ended
September 30,
2021 | Period Ended
September 30,
|
Net asset value, beginning of the period | | | | |
INCOME (LOSS) FROM INVESTMENT OPERATIONS: | | | | |
| | | | |
Net realized and unrealized gain (loss) | | | | |
Total from Investment Operations | | | | |
| | | | |
Net realized capital gains | | | | |
Net asset value, end of the period | | | | |
| | | | |
RATIOS TO AVERAGE NET ASSETS: | | | | |
Net assets, end of the period (000's) | | | | |
| | | | |
| | | | |
| | | | |
| | | | |
| Class operations commenced on October 1, 2019. |
| Per share net investment loss has been calculated using the average shares outstanding during the period. |
| Includes a non-recurring dividend. Without this dividend, net investment loss per share would have been $(0.07), total return would have been 29.66% and the ratio of net investment loss to average net assets would have been (0.50%). |
| Had certain expenses not been waived/reimbursed during the period, total returns would have been lower. |
| Periods less than one year are not annualized. |
| The investment adviser agreed to waive its fees and/or reimburse a portion of the Fund’s expenses during the period. Without this waiver/reimbursement, expenses would have been higher. |
| Computed on an annualized basis for periods less than one year. |
| Represents the Fund’s portfolio turnover rate for the year ended September 30, 2020. |
See accompanying notes to financial statements.
Notes to Financial Statements
1.Organization. Loomis Sayles Funds I and Loomis Sayles Funds II (the “Trusts” and each a “Trust”) are each organized as a Massachusetts business trust. Each Trust is registered under the Investment Company Act of 1940, as amended (the “1940 Act”), as an open-end management investment company. Each Declaration of Trust permits the Board of Trustees to authorize the issuance of an unlimited number of shares of the Trust in multiple series. The financial statements for certain funds of the Trusts are presented in separate reports. The following funds (individually, a “Fund” and collectively, the “Funds”) are included in this report:
Loomis Sayles Funds I:
Loomis Sayles Small Cap Value Fund (“Small Cap Value Fund”)
Loomis Sayles Funds II:
Loomis Sayles Small Cap Growth Fund (“Small Cap Growth Fund”)
Loomis Sayles Small/Mid Cap Growth Fund (“Small/Mid Cap Growth Fund”)
Each Fund is a diversified investment company.
Small Cap Growth Fund offers Institutional Class, Retail Class and Class N shares. Small Cap Value Fund offers Institutional Class, Retail Class, Admin Class and Class N shares. Small/Mid Cap Growth Fund offers Institutional Class and Class N shares.
Each share class is sold without a sales charge. Retail Class and Admin Class shares pay a Rule 12b-1 fee. Class N shares are offered with an initial minimum investment of $1,000,000. Institutional Class shares are intended for institutional investors with a minimum initial investment of $100,000. Certain categories of investors are exempted from the minimum investment amount for Class N and Institutional Class as outlined in the relevant Fund’s prospectus. Admin Class shares are offered exclusively through intermediaries.
Most expenses can be directly attributed to a Fund. Expenses which cannot be directly attributed to a Fund are generally apportioned based on the relative net assets of each of the Funds in Natixis Funds Trust I, Natixis Funds Trust II, Natixis Funds Trust IV and Gateway Trust (“Natixis Funds Trusts”), Loomis Sayles Funds I and Loomis Sayles Funds II (“Loomis Sayles Funds Trusts”), and Natixis ETF Trust and Natixis ETF Trust II (“Natixis ETF Trusts”). Expenses of a Fund are borne pro rata by the holders of each class of shares, except that each class bears expenses unique to that class (such as the Rule 12b-1 fees applicable to Retail Class and Admin Class), and transfer agent fees are borne collectively for Institutional Class, Retail Class and Admin Class, and individually for Class N. In addition, each class votes as a class only with respect to its own Rule 12b-1 Plan. Shares of each class would receive their pro rata share of the net assets of a Fund if the Fund were liquidated. The Trustees approve separate distributions from net investment income on each class of shares.
2.Significant Accounting Policies. The following is a summary of significant accounting policies consistently followed by each Fund in the preparation of its financial statements. The Funds' financial statements follow the accounting and reporting guidelines provided for investment companies and are prepared in accordance with accounting principles generally accepted in the United States of America which require the use of management estimates that affect the reported amounts and disclosures in the financial statements. Actual results could differ from those estimates. Management has evaluated the events and transactions subsequent to year-end through the date the financial statements were issued and has determined that there were no material events that would require disclosure in the Funds' financial statements.
a. Valuation. Registered investment companies are required to value portfolio investments using an unadjusted, readily available market quotation. Each Fund obtains readily available market quotations from independent pricing services. Fund investments for which readily
available market quotations are not available are priced at fair value pursuant to the Funds’ Valuation Procedures. The Board of Trustees has approved a valuation designee who is subject to the Board’s oversight.
Unadjusted readily available market quotations that are utilized for exchange traded equity securities (including shares of closed-end investment companies and exchange-traded funds) include the last sale price quoted on the exchange where the security is traded most extensively. Shares of open-end investment companies are valued at net asset value ("NAV") per share.
Exchange traded equity securities for which there is no reported sale during the day are fair valued at the closing bid quotation as reported by an independent pricing service. Unlisted equity securities (except unlisted preferred equity securities) are fair valued at the last sale price quoted in the market where they are traded most extensively or, if there is no reported sale during the day, the closing bid quotation as reported by an independent pricing service. If there is no last sale price or closing bid quotation available, unlisted equity securities will be fair valued using evaluated bids furnished by an independent pricing service, if available.
Debt securities and unlisted preferred equity securities are fair valued based on evaluated bids furnished to the Funds by an independent pricing service or bid prices obtained from broker-dealers. Broker-dealer bid prices may be used to fair value debt and unlisted equities where an independent pricing service is unable to price an investment or where an independent pricing service does not provide a reliable price for the investment.
The Funds may also fair value investments in other circumstances such as when extraordinary events occur after the close of a foreign market, but prior to the close of the New York Stock Exchange. This may include situations relating to a single issuer (such as a declaration of bankruptcy or a delisting of the issuer’s security from the primary market on which it has traded) as well as events affecting the securities
Notes to Financial Statements (continued)
markets in general (such as market disruptions or closings and significant fluctuations in U.S. and/or foreign markets). When fair valuing a Fund’s investments, the valuation designee may, among other things, use modeling tools or other processes that may take into account factors such as issuer specific information, or other related market activity and/or information that occurred after the close of the foreign market but before the time the Fund’s NAV is calculated. Fair valuation by the Fund(s) valuation designee may require subjective determinations about the value of the investment, and fair values used to determine a Fund’s NAV may differ from quoted or published prices, or from prices that are used by others, for the same investments. In addition, the use of fair value pricing may not always result in adjustments to the prices of investments held by a Fund.
b. Investment Transactions and Related Investment Income. Investment transactions are accounted for on a trade date plus one day basis for daily NAV calculation. However, for financial reporting purposes, investment transactions are reported on trade date. Dividend income (including income reinvested) and foreign withholding tax, if applicable, is recorded on the ex-dividend date, or in the case of certain foreign securities, as soon as a Fund is notified, and interest income is recorded on an accrual basis. Interest income is increased by the accretion of discount and decreased by the amortization of premium, if applicable. Distributions received from investments in securities that represent a return of capital or capital gain are recorded as a reduction of cost of investments or as a realized gain, respectively. The calendar year-end amounts of ordinary income, capital gains and return of capital included in distributions received from the Funds’ investments in real estate investment trusts (“REITs”) are reported to the Funds after the end of the fiscal year; accordingly, the Funds estimate these amounts for accounting purposes until the characterization of REIT distributions is reported to the Funds after the end of the fiscal year. Estimates are based on the most recent REIT distribution information available. In determining net gain or loss on securities sold, the cost of securities has been determined on an identified cost basis. Investment income, non-class specific expenses and realized and unrealized gains and losses are allocated on a pro rata basis to each class based on the relative net assets of each class to the total net assets of the Fund.
c. Foreign Currency Translation. The books and records of the Funds are maintained in U.S. dollars. The values of securities, currencies and other assets and liabilities denominated in currencies other than U.S. dollars, if any, are translated into U.S. dollars based upon foreign exchange rates prevailing at the end of the period. Purchases and sales of investment securities, income and expenses are translated into U.S. dollars on the respective dates of such transactions.
Net realized foreign exchange gains or losses arise from sales of foreign currency, changes in exchange rates between the trade and settlement dates on securities transactions and the difference between the amounts of dividends, interest and foreign withholding taxes recorded in the Funds’ books and records and the U.S. dollar equivalent of the amounts actually received or paid. Net unrealized foreign exchange gains or losses arise from changes in the value of assets and liabilities, other than investment securities, as of the end of the fiscal period, resulting from changes in exchange rates.
The values of investment securities are presented at the foreign exchange rates prevailing at the end of the period for financial reporting purposes. Net realized and unrealized gains or losses on investments reported in the Statements of Operations reflect gains or losses resulting from changes in exchange rates and fluctuations which arise due to changes in market prices of investment securities.
The Funds may use foreign currency exchange contracts to facilitate transactions in foreign-denominated investments. Losses may arise from changes in the value of the foreign currency or if the counterparties do not perform under the contracts’ terms.
d. Federal and Foreign Income Taxes. The Trusts treat each Fund as a separate entity for federal income tax purposes. Each Fund intends to meet the requirements of the Internal Revenue Code of 1986, as amended, applicable to regulated investment companies, and to distribute to its shareholders substantially all of its net investment income and any net realized capital gains at least annually. Management has performed an analysis of each Fund’s tax positions for the open tax years as of September 30, 2023 and has concluded that no provisions for income tax are required. The Funds’ federal tax returns for the prior three fiscal years remain subject to examination by the Internal Revenue Service. Management is not aware of any events that are reasonably possible to occur in the next twelve months that would result in the amounts of any unrecognized tax benefits significantly increasing or decreasing for the Funds. However, management’s conclusions regarding tax positions taken may be subject to review and adjustment at a later date based on factors including, but not limited to, new tax laws and accounting regulations and interpretations thereof.
A Fund may be subject to foreign withholding taxes on investment income and taxes on capital gains on investments that are accrued and paid based upon the Fund’s understanding of the tax rules and regulations that exist in the countries in which the Fund invests. Foreign withholding taxes on dividend and interest income are reflected on the Statements of Operations as a reduction of investment income, net of amounts that have been or are expected to be reclaimed and paid. Dividends and interest receivable on the Statements of Assets and Liabilities are net of foreign withholding taxes. Foreign withholding taxes where reclaims have been or are expected to be filed and paid are reflected on the Statements of Assets and Liabilities as tax reclaims receivable. Capital gains taxes paid are included in net realized gain (loss) on investments in the Statements of Operations. Accrued but unpaid capital gains taxes are reflected as foreign taxes payable on the Statements of Assets and Liabilities, if applicable, and reduce unrealized gains on investments. In the event that realized gains on investments are subsequently offset by realized losses, taxes paid on realized gains may be returned to a Fund. Such amounts, if applicable, are reflected as foreign tax rebates receivable on the Statements of Assets and Liabilities and are recorded as a realized gain when received.
Notes to Financial Statements (continued)
e. Dividends and Distributions to Shareholders. Dividends and distributions are recorded on the ex-dividend date. The timing and characterization of certain income and capital gain distributions are determined in accordance with federal tax regulations, which may differ from accounting principles generally accepted in the United States of America. Permanent differences are primarily due to differing treatments for book and tax purposes of items such as return of capital distributions received, distribution re-designations, capital gain distributions received, redemptions in-kind and net operating losses. Permanent book and tax basis differences relating to shareholder distributions will result in reclassifications to capital accounts reported on the Statements of Assets and Liabilities. Temporary differences between book and tax distributable earnings are primarily due to deferred Trustees’ fees, return of capital distributions received and wash sales. Amounts of income and capital gain available to be distributed on a tax basis are determined annually, and at other times during the Funds’ fiscal year as may be necessary to avoid knowingly declaring and paying a return of capital distribution. Distributions from net investment income and short-term capital gains are reported as distributed from ordinary income for tax purposes.
The tax characterization of distributions is determined on an annual basis. The tax character of distributions paid to shareholders during the years ended September 30, 2023 and 2022 was as follows:
| | |
| | | | | | |
| | | | | | |
| | | | | | |
Small/Mid Cap Growth Fund | | | | | | |
Distributions paid to shareholders from net investment income and net realized capital gains, based on accounting principles generally accepted in the United States of America, are consolidated and reported on the Statements of Changes in Net Assets as Distributions to Shareholders. Distributions paid to shareholders from net investment income and net realized capital gains expressed in per-share amounts, based on accounting principles generally accepted in the United States of America, are separately stated and reported within the Financial Highlights.
As of September 30, 2023, the components of distributable earnings on a tax basis were as follows:
| | | |
Undistributed ordinary income | | | |
Undistributed long-term capital gains | | | |
Total undistributed earnings | | | |
Capital loss carryforward: | | | |
| | | |
| | | |
Late-year ordinary and post-October
| | | |
Unrealized appreciation (depreciation) | | | |
Total accumulated earnings (losses) | | | |
| Under current tax law, net operating losses, capital losses, foreign currency losses, and losses on passive foreign investment companies and contingent payment debt instruments after October 31 or December 31, as applicable, may be deferred and treated as occurring on the first day of the following taxable year. Small Cap Growth Fund and Small/Mid Cap Growth Fund are deferring net operating losses. |
As of September 30, 2023, the tax cost of investments and unrealized appreciation (depreciation) on a federal tax basis were as follows:
| | | |
| | | |
| | | |
| | | |
Net tax appreciation (depreciation) | | | |
Notes to Financial Statements (continued)
f. Repurchase Agreements. Each Fund may enter into repurchase agreements, under the terms of a Master Repurchase Agreement, under which each Fund acquires securities as collateral and agrees to resell the securities at an agreed upon time and at an agreed upon price. It is
each Fund’s policy that the market value of the collateral for repurchase agreements be at least equal to 102% of the repurchase price, including interest. Certain repurchase agreements are tri-party arrangements whereby the collateral is held in a segregated account for the benefit of the Fund and on behalf of the counterparty. Repurchase agreements could involve certain risks in the event of default or insolvency of the counterparty, including possible delays or restrictions upon a Fund’s ability to dispose of the underlying securities. As of September 30, 2023, each Fund, as applicable, had investments in repurchase agreements for which the value of the related collateral exceeded the value of the repurchase agreement. The gross value of repurchase agreements is included in the Statements of Assets and Liabilities for financial reporting purposes.
g. Indemnifications. Under the Trusts’ organizational documents, their officers and Trustees are indemnified against certain liabilities arising out of the performance of their duties to the Funds. Additionally, in the normal course of business, the Funds enter into contracts with service providers that contain general indemnification clauses. The Funds' maximum exposure under these arrangements is unknown as this would involve future claims that may be made against the Funds that have not yet occurred. However, based on experience, the Funds expect the risk of loss to be remote.
3.Fair Value Measurements. In accordance with accounting standards related to fair value measurements and disclosures, the Funds have categorized the inputs utilized in determining the value of each Fund’s assets or liabilities. These inputs are summarized in the three broad levels listed below:
• Level 1 — quoted prices in active markets for identical assets or liabilities;
• Level 2 — prices determined using other significant inputs that are observable either directly, or indirectly through corroboration with observable market data (which could include quoted prices for similar assets or liabilities, interest rates, credit risk, etc.); and
• Level 3 — prices determined using significant unobservable inputs when quoted prices or observable inputs are unavailable such as when there is little or no market activity for an asset or liability (unobservable inputs reflect each Fund’s own assumptions in determining the fair value of assets or liabilities and would be based on the best information available).
The inputs or methodology used for valuing securities are not necessarily an indication of the risk associated with investing in those securities.
The Funds' pricing policies have been approved by the Board of Trustees. Investments for which market quotations are readily available are categorized in Level 1. Other investments for which an independent pricing service is utilized are categorized in Level 2. Broker-dealer bid prices for which the Funds have knowledge of the inputs used by the broker-dealer are categorized in Level 2. All other investments, including broker-dealer bid prices for which the Funds do not have knowledge of the inputs used by the broker-dealer, as well as investments fair valued by the valuation designee, are categorized in Level 3. All Level 2 and 3 securities are defined as being fair valued.
Under certain conditions and based upon specific facts and circumstances, the Fund’s valuation designee may determine that a fair valuation should be made for portfolio investment(s). These valuation designee fair valuations will be based upon a significant amount of Level 3 inputs.
The following is a summary of the inputs used to value the Funds' investments as of September 30, 2023, at value:
| Details of the major categories of the Fund’s investments are reflected within the Portfolio of Investments. |
Notes to Financial Statements (continued)
| Details of the major categories of the Fund’s investments are reflected within the Portfolio of Investments. |
Small/Mid Cap Growth Fund |
|
| | | | |
| | | | |
| | | | |
| | | | |
| Details of the major categories of the Fund’s investments are reflected within the Portfolio of Investments. |
4.Purchases and Sales of Securities. For the year ended September 30, 2023, purchases and sales of securities (excluding short-term investments) were as follows:
| | |
| | |
| | |
Small/Mid Cap Growth Fund | | |
5.Management Fees and Other Transactions with Affiliates.
a. Management Fees. Loomis, Sayles & Company, L.P. (“Loomis Sayles”) serves as investment adviser to each Fund. Loomis Sayles is a limited partnership whose sole general partner, Loomis, Sayles & Company, Inc., is indirectly owned by Natixis Investment Managers, LLC, which is part of Natixis Investment Managers, an international asset management group based in Paris, France.
Under the terms of the management agreements, each Fund pays a management fee at the following annual rates, calculated daily and payable
monthly, based on each Fund’s average daily net assets:
| Percentage of
Average Daily
Net Assets |
| |
| |
Small/Mid Cap Growth Fund | |
Loomis Sayles has given binding undertakings to the Funds to waive management fees and/or reimburse certain expenses to limit the Funds’ operating expenses, exclusive of acquired fund fees and expenses, brokerage expenses, interest expense, taxes, organizational and extraordinary expenses such as litigation and indemnification expenses. These undertakings are in effect until January 31, 2024, except for Small Cap Growth Fund which is in effect until January 31, 2025, may be terminated before then only with the consent of the Funds’ Board of Trustees and are reevaluated on an annual basis. Management fees payable, as reflected on the Statements of Assets and Liabilities, is net of waivers and/or expense reimbursements, if any, pursuant to these undertakings.Waivers/reimbursements that exceed management fees payable are reflected on the Statements of Assets and Liabilities as receivable from investment adviser.
Notes to Financial Statements (continued)
For the year ended September 30, 2023 the expense limits as a percentage of average daily net assets under the expense limitation agreements were as follows:
| Expense Limit as a Percentage of
Average Daily Net Assets |
| | | | |
| | | | |
| | | | |
Small/Mid Cap Growth Fund | | | | |
Prior to July 1, 2023, the expense limits as a percentage of average daily net assets under the expense limitation agreements for Small Cap Growth Fund were as follows:
| Expense Limit as a Percentage of
Average Daily Net Assets |
| | | |
| | | |
Loomis Sayles shall be permitted to recover expenses borne under the expense limitation agreements (whether through waiver of management fees or otherwise) on a class by class basis in later periods to the extent the annual operating expenses of a class fall below both (1) a class’ expense limitation ratio in place at the time such amounts were waived/reimbursed and (2) a class’ current applicable expense limitation ratio, provided, however, that a class is not obligated to pay such waived/reimbursed fees or expenses more than one year after the end of the fiscal year in which the fees or expenses were waived/reimbursed.
For the year ended September 30, 2023, the management fees for each Fund were as follows:
| | Contractual
Waivers of
Management
| Voluntary
Waivers of
Management
| | Percentage of
Average
Daily Net Assets |
| | |
| | | | | | |
| | | | | | |
Small/Mid Cap Growth Fund | | | | | | |
| Waiver/expense reimbursements are subject to possible recovery until September 30, 2024. |
| In order to ensure that the total annual fund operating expenses after fee waiver and/or expense reimbursement do not exceed limitations, the Adviser may voluntarily waive additional advisory fees for Small/Mid Cap Growth Fund. Voluntary management fee waivers are not subject to recovery under the expense limitation agreement described above. |
b. Service and Distribution Fees. Natixis Distribution, LLC (“Natixis Distribution”), which is a wholly-owned subsidiary of Natixis Investment Managers, LLC, has entered into a distribution agreement with the Trusts. Pursuant to this agreement, Natixis Distribution serves
as principal underwriter of the Funds of the Trusts.
Pursuant to Rule 12b-1 under the 1940 Act, Small Cap Growth Fund and Small Cap Value Fund have adopted a Distribution Plan relating to each Fund’s Retail Class shares (the “Retail Class Plans”) and Small Cap Value Fund has adopted a Distribution Plan relating to its Admin
Class shares (the “Admin Class Plan”).
Under the Retail Class Plans, each Fund pays Natixis Distribution a monthly distribution fee at an annual rate not to exceed 0.25% of the average daily net assets attributable to the Fund’s Retail Class shares, as compensation for services provided by Natixis Distribution in
connection with the marketing or sale of Retail Class shares or for payments made by Natixis Distribution to securities dealers or other financial intermediaries as commissions, asset-based sales charges or other compensation with respect to the sale of Retail Class shares, or for
providing personal services to investors and/or the maintenance of shareholder accounts.
Under the Admin Class Plan, Small Cap Value Fund pays Natixis Distribution a monthly distribution fee at an annual rate not to exceed 0.25% of the average daily net assets attributable to the Fund’s Admin Class shares, as compensation for services provided by Natixis
Distribution in connection with the marketing or sale of Admin Class shares or for payments made by Natixis Distribution to securities dealers or other financial intermediaries as commissions, asset-based sales charges or other compensation with respect to the sale of Admin
Class shares, or for providing personal services to investors and/or the maintenance of shareholder accounts.
Notes to Financial Statements (continued)
In addition, the Admin Class shares of Small Cap Value Fund may pay Natixis Distribution an administrative service fee, at an annual rate not to exceed 0.25% of the average daily net assets attributable to Admin Class shares. These fees are subsequently paid to securities dealers or
financial intermediaries for providing personal services and/or account maintenance for their customers who hold such shares.
For the year ended September 30, 2023, the service and distribution fees for each Fund were as follows:
c. Administrative Fees. Natixis Advisors, LLC (“Natixis Advisors”) provides certain administrative services for the Funds and contracts with State Street Bank and Trust Company (“State Street Bank”) to serve as sub-administrator. Natixis Advisors is a wholly-owned subsidiary of
Natixis Investment Managers, LLC. Pursuant to an agreement among Natixis Funds Trusts, Loomis Sayles Funds Trusts, Natixis ETF Trusts and Natixis Advisors, each Fund pays Natixis Advisors monthly its pro rata portion of fees equal to an annual rate of 0.0540% of the first $15 billion of the average daily net assets of the Natixis Funds Trusts, Loomis Sayles Funds Trusts and Natixis ETF Trusts, 0.0500% of the next $15 billion, 0.0400% of the next $30 billion, 0.0275% of the next $30 billion and 0.0225% of such assets in excess of $90 billion, subject to an annual aggregate minimum fee for the Natixis Funds Trusts, Loomis Sayles Funds Trusts and Natixis ETF Trusts of $10 million, which is reevaluated on an annual basis.
For the year ended September 30, 2023, the administrative fees for each Fund were as follows:
| |
| |
| |
Small/Mid Cap Growth Fund | |
d. Sub-Transfer Agent Fees. Natixis Distribution has entered into agreements, which include servicing agreements, with financial intermediaries that provide recordkeeping, processing, shareholder communications and other services to customers of the intermediaries that hold positions in the Funds and has agreed to compensate the intermediaries for providing those services. Intermediaries transact with the Funds primarily through the use of omnibus accounts on behalf of their customers who hold positions in the Funds. These services would have been provided by the Funds’ transfer agent and other service providers if the shareholders’ accounts were maintained directly at the Funds’ transfer agent. Accordingly, the Funds have agreed to reimburse Natixis Distribution for all or a portion of the servicing fees paid to these intermediaries. The reimbursement amounts (sub-transfer agent fees) paid to Natixis Distribution are subject to a current per-account equivalent fee limit approved by the Funds’ Board of Trustees, which is based on fees for similar services paid to the Funds’ transfer agent and other service providers. Class N shares do not bear such expenses.
For the year ended September 30, 2023, the sub-transfer agent fees (which are reflected in transfer agent fees and expenses in the Statements of Operations) for each Fund were as follows:
| |
| |
| |
Small/Mid Cap Growth Fund | |
As of September 30, 2023, the Funds owe Natixis Distribution the following reimbursements for sub-transfer agent fees (which are reflected in the Statements of Assets and Liabilities as payable to distributor):
| Reimbursements
of Sub-Transfer
Agent Fees |
| |
| |
Small/Mid Cap Growth Fund | |
Sub-transfer agent fees attributable to Institutional Class, Retail Class and Admin Class are allocated on a pro rata basis to each class based on the relative net assets of each class to the total net assets of those classes.
Notes to Financial Statements (continued)
e. Trustees Fees and Expenses. The Trusts do not pay any compensation directly to their officers or Trustees who are directors, officers or employees of Natixis Advisors, Natixis Distribution, Natixis Investment Managers, LLC or their affiliates. The Chairperson of the Board of Trustees receives a retainer fee at the annual rate of $369,000. The Chairperson does not receive any meeting attendance fees for Board of Trustees meetings or committee meetings that he attends. Each Independent Trustee (other than the Chairperson) receives, in the aggregate, a retainer fee at the annual rate of $210,000. Each Independent Trustee also receives a meeting attendance fee of $10,000 for each meeting of the Board of Trustees that he or she attends in person and $5,000 for each meeting of the Board of Trustees that he or she attends telephonically. In addition, the chairperson of the Contract Review Committee, the chairperson of the Audit Committee and the chairperson of the Governance Committee each receive an additional retainer fee at the annual rate of $20,000. Each Contract Review Committee member is compensated $6,000 for each Committee meeting that he or she attends in person and $3,000 for each meeting that he or she attends telephonically. Each Audit Committee member is compensated $6,000 for each Committee meeting that he or she attends in person and $3,000 for each meeting that he or she attends telephonically. Each Governance Committee member is compensated $2,500 for each Committee meeting that he or she attends either in person or telephonically. These fees are allocated among the funds in the Natixis Funds Trusts, Loomis Sayles Funds Trusts and Natixis ETF Trusts based on a formula that takes into account, among other factors, the relative net assets of each fund. Trustees are reimbursed for travel expenses in connection with attendance at meetings.
A deferred compensation plan (the “Plan”) is available to the Trustees on a voluntary basis. The value of a participating Trustee’s deferral account is based on theoretical investments of deferred amounts, on the normal payment dates, in certain funds of the Natixis Funds Trusts, Loomis Sayles Funds Trusts and Natixis ETF Trusts as designated by the participating Trustees. Changes in the value of participants’ deferral accounts are allocated pro rata among the funds in the Natixis Funds Trusts, Loomis Sayles Funds Trusts and Natixis ETF Trusts and are normally reflected as Trustees’ fees and expenses in the Statements of Operations. Deferred amounts remain in the funds until distributed in accordance with the provisions of the Plan. The portions of the accrued obligations allocated to the Funds under the Plan are reflected as Deferred Trustees’ fees in the Statements of Assets and Liabilities.
Certain officers and employees of Natixis Advisors and Loomis Sayles are also officers and/or Trustees of the Trusts.
f. Affiliated Ownership. As of September 30, 2023, Loomis Sayles Funded Pension Plan and Trust (“Pension Plan”), Loomis Sayles Employees’ Profit Sharing Retirement Plan (“Retirement Plan”) and Loomis Sayles non-qualified retirement plans held shares of the Funds representing the following percentages of the Funds’ net assets:
| | | Non-Qualified
Retirement Plans | Total Affiliated
Onwership |
| | | | |
| | | | |
Investment activities of affiliated shareholders could have material impacts on the Funds.
g. Reimbursement of Transfer Agent Fees and Expenses. Natixis Advisors has given a binding contractual undertaking to Small/Mid Cap Growth Fund to reimburse any and all transfer agency expenses for the Fund’s Class N shares. This undertaking is in effect through January 31, 2024 and is not subject to recovery under the expense limitation agreement described above.
For the year ended September 30, 2023, Natixis Advisors reimbursed Small/Mid Cap Growth Fund $1,389 for transfer agency expenses related to Class N shares.
6.Class-Specific Transfer Agent Fees and Expenses. Transfer agent fees and expenses attributable to Institutional Class, Retail Class and Admin Class are allocated on a pro rata basis to each class based on the relative net assets of each class to the total net assets of those classes. Transfer agent fees and expenses attributable to Class N are allocated to Class N.
For the year ended September 30, 2023 the Funds incurred the following class-specific transfer agent fees and expenses (including sub-transfer agent fees, where applicable):
| Transfer Agent Fees and Expenses |
| | | | |
| | | | |
| | | | |
Small/Mid Cap Growth Fund | | | | |
7.Line of Credit. Each Fund, together with certain other funds of Natixis Funds Trusts, Loomis Sayles Funds Trusts and Natixis ETF Trusts, entered into a syndicated, revolving, committed, unsecured line of credit with State Street Bank as administrative agent. The aggregate revolving commitment amount is $575,000,000. Any one Fund may borrow up to $402,500,000 under the line of credit agreement (as long
Notes to Financial Statements (continued)
as all borrowings by all Funds in the aggregate do not exceed the $575,000,000 limit at any time), subject to each Fund’s investment restrictions and its contractual obligations under the line of credit. Interest is charged to the Funds based upon the terms set forth in the agreement. In addition, a commitment fee of 0.15% per annum, payable at the end of each calendar quarter, is accrued and apportioned among the participating funds based on their average daily unused portion of the line of credit. The Funds paid certain legal fees in connection with the line of credit agreement, which are being amortized over a period of 364 days and are reflected in legal fees on the Statements of Operations. The unamortized balance is reflected as prepaid expenses on the Statements of Assets and Liabilities.
Prior to April 6, 2023, each Fund, together with certain other funds of Natixis Funds Trusts and Loomis Sayles Funds Trusts and Natixis ETF Trusts, entered into a $500,000,000 committed unsecured line of credit provided by State Street Bank. Any one Fund was able to borrow up to $350,000,000 under the line of credit agreement (as long as all borrowings by all Funds in the aggregate did not exceed the $500,000,000 limit at any time), subject to each Fund’s investment restrictions and its contractual obligations under the line of credit. Interest was charged to the Funds based upon the terms set forth in the agreement. In addition, a commitment fee of 0.15% per annum, payable at the end of each calendar quarter, was accrued and apportioned among the participating funds based on their average daily unused portion of the line of credit.
For the year ended September 30, 2023, Small Cap Value Fund had an average daily balance on the line of credit (for those days on which there were borrowings) of $6,700,000 at a weighted average interest rate of 5.93%. Interest expense incurred on the line of credit was $1,104.
8.Risk. Geopolitical events (such as trading halts, sanctions or wars) could increase volatility and uncertainty in the financial markets and adversely affect regional and global economies. These, and other related events, could significantly impact a Fund's performance and the value of an investment in the Fund, even if the Fund does not have direct exposure to issuers in the country or countries involved.
9.Concentration of Ownership. From time to time, a Fund may have a concentration of one or more accounts constituting a significant percentage of shares outstanding. Investment activities by holders of such accounts could have material impacts on the Funds. As of September 30, 2023, based on management’s evaluation of the shareholder account base, the Funds had accounts representing controlling ownership of more than 5% of the Funds’ total outstanding shares. The number of such accounts, based on accounts that represent more than 5% of an individual class of shares, and the aggregate percentage of net assets represented by such holdings were as follows:
| Number of 5%
Non-Affiliated
Account Holders | Percentage of
Non-Affiliated
Ownership | Percentage of
Affiliated
Ownership
(Note 5f) | Total
Percentage of
Ownership |
| | | | |
Small/Mid Cap Growth Fund | | | | |
Omnibus shareholder accounts for which Natixis Advisors understands that the intermediary has discretion over the underlying shareholder
accounts or investment models where a shareholder account may be invested for a non-discretionary customer are included in the table above.
For other omnibus accounts, the Funds do not have information on the individual shareholder accounts underlying the omnibus accounts;
therefore, there could be other 5% shareholders in addition to those disclosed in the table above.
Notes to Financial Statements (continued)
10.Capital Shares. Each Fund may issue an unlimited number of shares of beneficial interest, without par value. Transactions in capital shares were as follows:
|
| Year Ended
September 30, 2023 | Year Ended
September 30, 2022 |
| | | | |
| | | | |
Issued from the sale of shares | | | | |
Issued in connection with the reinvestment of distributions | | | | |
| | | | |
| | | | |
| | | | |
Issued from the sale of shares | | | | |
Issued in connection with the reinvestment of distributions | | | | |
| | | | |
| | | | |
| | | | |
Issued from the sale of shares | | | | |
Issued in connection with the reinvestment of distributions | | | | |
| | | | |
| | | | |
Increase from capital share transactions | | | | |
|
| Year Ended
September 30, 2023 | Year Ended
September 30, 2022 |
| | | | |
| | | | |
Issued from the sale of shares | | | | |
Issued in connection with the reinvestment of distributions | | | | |
| | | | |
| | | | |
| | | | |
Issued from the sale of shares | | | | |
Issued in connection with the reinvestment of distributions | | | | |
| | | | |
| | | | |
| | | | |
Issued from the sale of shares | | | | |
Issued in connection with the reinvestment of distributions | | | | |
| | | | |
| | | | |
| | | | |
Issued from the sale of shares | | | | |
Issued in connection with the reinvestment of distributions | | | | |
| | | | |
| | | | |
Increase (decrease) from capital share transactions | | | | |
Notes to Financial Statements (continued)
10.Capital Shares (continued).
|
| Year Ended
September 30, 2023 | Year Ended
September 30, 2022 |
Small/Mid Cap Growth Fund | | | | |
| | | | |
Issued from the sale of shares | | | | |
Issued in connection with the reinvestment of distributions | | | | |
| | | | |
| | | | |
| | | | |
Issued from the sale of shares | | | | |
Issued in connection with the reinvestment of distributions | | | | |
| | | | |
Redeemed in-kind (Note 11) | | | | |
| | | | |
Increase (decrease) from capital share transactions | | | | |
11.Redemption In-Kind. In certain circumstances, a Fund may distribute portfolio securities rather than cash as payment for redemption of Fund shares (redemption in-kind). For financial reporting purposes, the Fund will recognize a gain on in-kind redemptions to the extent the value of the distributed securities on the date of redemption exceeds the cost of those securities; the Fund will recognize a loss if the cost exceeds value. Gains and losses realized on redemptions in-kind are not recognized for tax purposes, and are re-classified from realized gain (loss) to paid-in-capital. Small/Mid Cap Growth Fund realized a gain of $3,963,912 on a redemption-in-kind during the year ended September 30, 2023. This amount is included in realized gain (loss) on the Statements of Operations.
Report of Independent Registered Public Accounting Firm
To the Board of Trustees of Loomis Sayles Funds I and Loomis Sayles Funds II and Shareholders of Loomis Sayles Small Cap Value Fund, Loomis Sayles Small Cap Growth Fund and Loomis Sayles Small/Mid Cap Growth Fund:
Opinions on the Financial Statements
We have audited the accompanying statements of assets and liabilities, including the portfolios of investments, of Loomis Sayles Small Cap Value Fund (one of the funds constituting Loomis Sayles Funds I), and Loomis Sayles Small Cap Growth Fund and Loomis Sayles Small/Mid Cap Growth Fund (two of the funds constituting Loomis Sayles Funds II) (hereafter collectively referred to as the “Funds”) as of September 30, 2023, the related statements of operations for the year ended September 30, 2023, the statements of changes in net assets for each of the two years in the period ended September 30, 2023, including the related notes, and the financial highlights for each of the periods indicated therein (collectively referred to as the “financial statements”). In our opinion, the financial statements present fairly, in all material respects, the financial position of each of the Funds as of September 30, 2023, the results of each of their operations for the year then ended, the changes in each of their net assets for each of the two years in the period ended September 30, 2023 and each of the financial highlights for each of the periods indicated therein in conformity with accounting principles generally accepted in the United States of America.
Basis for Opinions
These financial statements are the responsibility of the Funds’ management. Our responsibility is to express an opinion on the Funds’ financial statements based on our audits. We are a public accounting firm registered with the Public Company Accounting Oversight Board (United States) (PCAOB) and are required to be independent with respect to the Funds in accordance with the U.S. federal securities laws and the applicable rules and regulations of the Securities and Exchange Commission and the PCAOB.
We conducted our audits of these financial statements in accordance with the standards of the PCAOB. Those standards require that we plan and perform the audit to obtain reasonable assurance about whether the financial statements are free of material misstatement, whether due to error or fraud.
Our audits included performing procedures to assess the risks of material misstatement of the financial statements, whether due to error or fraud, and performing procedures that respond to those risks. Such procedures included examining, on a test basis, evidence regarding the amounts and disclosures in the financial statements. Our audits also included evaluating the accounting principles used and significant estimates made by management, as well as evaluating the overall presentation of the financial statements. Our procedures included confirmation of securities owned as of September 30, 2023 by correspondence with the custodian, transfer agent and brokers; when replies were not received from brokers, we performed other auditing procedures. We believe that our audits provide a reasonable basis for our opinions.
/s/PricewaterhouseCoopers LLP
Boston, Massachusetts
November 21, 2023
We have served as the auditor of one or more investment companies in the Natixis Investment Company Complex since at least 1995. We have not determined the specific year we began serving as auditor.
2023 U.S. Tax Distribution Information to Shareholders (Unaudited)
Corporate Dividends Received Deduction. For the fiscal year ended September 30, 2023, a percentage of dividends distributed by the Fund listed below qualifies for the dividends received deduction for corporate shareholders. This percentage is as follows:
Qualified Dividend Income. For the fiscal year ended September 30, 2023, the Funds below will designate up to the maximum amount allowable pursuant to the Internal Revenue Code as qualified dividend income eligible for reduced tax rates. These lower rates range from 0% to 20% depending on an individual’s tax bracket. If the Funds pay a distribution during calendar year 2023, complete information will be reported in conjunction with Form 1099-DIV.
Fund
Small Cap Value Fund
Capital Gains Distributions. Pursuant to Internal Revenue Section 852(b), the following Funds paid distributions, which have been designated as capital gains distributions for the fiscal year ended September 30, 2023, unless subsequently determined to be different.
Trustee and Officer Information
The tables below provide certain information regarding the Trustees and officers of Loomis Sayles Funds I and Loomis Sayles Funds II (the "Trusts"). Unless otherwise indicated, the address of all persons below is 888 Boylston Street, Suite 800, Boston, MA 02199-8197. The Funds' Statements of Additional Information include additional information about the Trustees of the Trusts and are available by calling Loomis Sayles Funds at 800-633-3330.
| Position(s) Held with
the Trusts, Length
of Time Served and
| Principal
Occupation(s)
During Past 5 Years | Number of Portfolios
in Fund Complex
Overseen2and Other
Directorships Held
During Past 5 Years | Experience,
Qualifications,
Attributes, Skills for
Board Membership |
| | | | |
| Trustee since 2013
Contract Review
Committee Member
and Governance
Committee Member | Executive Chairman of Bob’s Discount Furniture (retail) | 52
Director, Burlington Stores, Inc. (retail); Director, Rue Gilt Groupe, Inc.
(e-commerce retail) | Significant experience on the Board and on the boards of other business organizations (including retail companies and a bank); executive experience (including at a retail company) |
| Trustee since 2015
Audit Committee
Member and
Governance
Committee Member | | 52
Formerly, Director of Triumph Group (aerospace industry) | Significant experience on the Board and executive experience (including his role as Vice President and treasurer of a defense company and experience at a financial services company) |
| Trustee since 2012
Chairperson of the
Governance Committee
and Contract Review
Committee Member | President, University of Massachusetts | | Significant experience on the Board and on the boards of other business organizations; experience as President of the University of Massachusetts; government experience (including as a member of the U.S. House of Representatives); academic experience |
Maureen B. Mitchell
(1951) | Trustee since 2017
Chairperson of the
Contract Review
Committee | | 52
Director, Sterling Bancorp (bank) | Significant experience on the Board; financial services industry and executive experience (including role as President of global sales and marketing at a financial services company) |
Trustee and Officer Information
| Position(s) Held with the Trusts, Length of Time Served and Term of Office1 | Principal Occupation(s) During Past 5 Years | Number of Portfolios in Fund Complex Overseen2and Other Directorships Held During Past 5 Years | Experience, Qualifications, Attributes, Skills for Board Membership |
Independent Trustees − continued |
| Trustee since 2016
Audit Committee Member
and Governance
Committee Member | Founding Partner, Breton Capital Management, LLC (private equity); Partner, STEP Partners, LLC (private equity) | 52
Director, FutureFuel.io (chemicals and biofuels) | Significant experience on the Board; financial services industry and executive experience (including roles as Chief Executive Officer of client management and asset servicing for a banking and financial services company) |
| Chairperson of the Board
of Trustees since 2021
Trustee since 2009
Ex Officio Member of the
Audit Committee,
Contract Review
Committee and
Governance Committee | Professor of Finance at Babson College | | Significant experience on the Board; experience as Director of the Division of Trading and Markets at the Securities and Exchange Commission; academic experience; training as an economist |
| Trustee since 2009
Contract Review
Committee Member | | | Significant experience on the Board; mutual fund industry and executive experience (including roles as President and Chief Executive Officer for an investment adviser) |
| Trustee since 2019
Audit Committee Member
and Governance
Committee Member | Managing Director of Accordia Partners, LLC (real estate development); President of Primary Corporation (real estate development); Managing Principal of Merrick Capital Partners (infrastructure finance) | 52
Advisor/Risk Management Committee, Eastern Bank (bank); Director, Apartment Investment and Management Company (real estate investment trust); formerly, Director, Ares Commercial Real Estate Corporation (real estate investment trust) | Experience on the Board and significant experience on the boards of other business organizations (including real estate companies and banks) |
| Trustee since 2005
Chairperson of the Audit
Committee | Retired; formerly, Deputy Dean for Finance and Administration, Yale University School of Medicine | | Significant experience on the Board; executive experience in a variety of academic organizations (including roles as dean for finance and administration) |
Trustee and Officer Information
| Position(s) Held with the Trusts, Length of Time Served and Term of Office1 | Principal Occupation(s) During Past 5 Years | Number of Portfolios in Fund Complex Overseen2and Other Directorships Held During Past 5 Years | Experience, Qualifications, Attributes, Skills for Board Membership |
| | | | |
(1965)
One Financial Center
Boston, MA 02111 | Trustee since 2015
President and Chief
Executive Officer of
Loomis Sayles Funds I
since 2015 | President, Chief Executive Officer and Chairman of the Board of Directors, Loomis, Sayles & Company, L.P. | | Significant experience on the Board; continuing service as President, Chief Executive Officer and Chairman of the Board of Directors of Loomis, Sayles & Company, L.P. |
| Trustee since 2011
President of Loomis Sayles
Funds II and Executive
Vice President of Loomis
Sayles Funds I since 2008;
Chief Executive Officer of
Loomis Sayles Funds II
since 2015 | President and Chief Executive Officer, Natixis Advisors, LLC and Natixis Distribution, LLC | | Significant experience on the Board; experience as President and Chief Executive Officer of Natixis Advisors, LLC and Natixis Distribution, LLC |
| Each Trustee serves until retirement, resignation or removal from the Board. The current retirement age is 75. The position of Chairperson of the Board is appointed for a three-year term. |
| The Trustees of the Trusts serve as Trustees of a fund complex that includes all series of the Natixis Funds Trust I, Natixis Funds Trust II, Natixis Funds Trust IV, Gateway Trust, Loomis Sayles Funds I, Loomis Sayles Funds II, Natixis ETF Trust and Natixis ETF Trust II (collectively, the “Fund Complex”). |
| Mr. Charleston is deemed an “interested person” of the Trusts because he holds the following positions with an affiliated person of the Trusts: President, Chief Executive Officer and Chairman of the Board of Directors of Loomis, Sayles & Company, L.P. |
| Mr. Giunta is deemed an “interested person” of the Trusts because he holds the following positions with an affiliated person of the Trusts: President and Chief Executive Officer, Natixis Advisors, LLC and Natixis Distribution, LLC. |
Trustee and Officer Information
| Position(s) Held
with the Trusts | | |
| | | |
| Treasurer, Principal
Financial and
Accounting Officer | | Senior Vice President, Natixis Advisors, LLC and Natixis Distribution, LLC; formerly, Vice President, Natixis Advisors, LLC and Natixis Distribution, LLC; Assistant Treasurer of the Fund Complex; Managing Director, State Street Bank and Trust Company |
| Secretary and Chief
Legal Officer | | Executive Vice President, General Counsel and Secretary, Natixis Advisors, LLC and Natixis Distribution, LLC; formerly, Executive Vice President and Chief Compliance Officer of Natixis Investment Managers (March 2019 – May 2022) and Senior Vice President and Head of Compliance, U.S. for Natixis Investment Managers (July 2011 – March 2019) |
| Chief Compliance
Officer, Assistant
Secretary and
Anti-Money
Laundering Officer | | Senior Vice President, Natixis Advisors, LLC and Natixis Distribution, LLC; formerly, Vice President, Head of Corporate Compliance, Global Atlantic Financial Group |
| Each officer of the Trusts serves for an indefinite term in accordance with the Trusts' current by-laws until the date his or her successor is elected and qualified, or until he or she sooner dies, retires, is removed or becomes disqualified. |
| Each person listed above, except as noted, holds the same position(s) with the Fund Complex. Previous positions during the past five years with Natixis Distribution, LLC, Natixis Advisors, LLC or Loomis, Sayles & Company, L.P. are omitted, if not materially different from an officer’s current position with such entity. |
This Page Intentionally Left Blank
This Page Intentionally Left Blank
This Page Intentionally Left Blank
LOOMIS SAYLES FUNDS
Loomis Sayles Funds, a Boston-based family of mutual funds advised by Loomis, Sayles & Company, L.P., offers a range of fixed income and equity investments to fit the goals of the most demanding investor. Investment minimums and a pricing structure that includes multiple share classes make the funds suitable investments for individual investors, retirement plan participants, high net worth individuals and small institutions, including endowments and foundations.
PHONE 800-633-3330 FOR THE FOLLOWING FUND INFORMATION:
• Net asset values, yields, distribution information, fund information and fund literature
• Speak to a customer service representative regarding new or existing accounts
Before investing, consider the fund’s investment objectives, risks, charges, and expenses. Please visit www.loomissayles.com or call 800-633-3330 for a prospectus and a summary prospectus, if available, containing this and other information.
If you wish to communicate with the funds’ Board of Trustees, you may do so by writing to:
Natixis Advisors, LLC
888 Boylston Street, Suite 800
Boston, MA 02199-8197
The correspondence must be in writing, signed by the shareholder, including the shareholder’s name and address, and should identify the fund(s), account number, class of shares, and number of shares held in the fund(s) as of a recent date.
or by email at:secretaryofthefunds@natixis.comCommunications regarding recommendations for Trustee candidates may not be submitted by e-mail.Please note: Unlike written correspondence, e-mail is not secure. Please do NOT include your account number, social security number, PIN, or any other non-public, personal information in an e-mail communication because this information may be viewed by others.
 Exp. 11/30/246031442.1.1M-LSEFA-0923
(b) Not Applicable.
Item 2. Code of Ethics.
The Registrant has adopted a code of ethics that applies to the Registrant’s principal executive officer, principal financial officer and persons performing similar functions. There have been no amendments or waivers of the Registrant’s code of ethics during the period.
Item 3. Audit Committee Financial Expert.
The Board of Trustees of the Registrant has established an audit committee. Ms. Maureen Mitchell, Mr. James Palermo, Mr. Peter Smail, Mr. Kirk A. Sykes and Ms. Cynthia L. Walker are members of the audit committee and have been designated as “audit committee financial experts” by the Board of Trustees. Each of these individuals is also an Independent Trustee of the Registrant.
Item 4. Principal Accountant Fees and Services.
Fees billed by the Principal Accountant for services rendered to the Registrant.
The table below sets forth fees billed by the principal accountant, PricewaterhouseCoopers LLP, for the past two fiscal years for professional services rendered in connection with a) the audit of the Registrant’s annual financial statements and services provided in connection with regulatory filings; b) audit-related services (including services that are reasonably related to the performance of the audit of the Registrant’s financial statements but not reported under “Audit Fees”); c) tax compliance, tax advice and tax planning and d) all other fees billed for professional services rendered by the principal accountant to the Registrant, other than the services reported as a part of (a) through (c) of this Item.
| | | | | | | | | | | | | | | | | | | | | | | | | | | | | | | | |
| | | Audit fees | | | Audit-related fees1 | | | Tax fees2 | | | All other fees | |
| | | 10/1/21-
9/30/22 | | | 10/1/22-
9/30/23 | | | 10/1/21-
9/30/22 | | | 10/1/22-
9/30/23 | | | 10/1/21-
9/30/22 | | | 10/1/22-
9/30/23 | | | 10/1/21-
9/30/22 | | | 10/1/22-
9/30/23 | |
Loomis Sayles Funds II — Loomis Sayles Credit Income Fund, Loomis Sayles Global Allocation Fund, Loomis Sayles Growth Fund, Loomis Sayles Limited Term Government and Agency Fund, Loomis Sayles Small Cap Growth Fund and Loomis Sayles Small/Mid Cap Growth Fund | | $ | 268,783 | | | $ | 276,847 | | | $ | 3,489 | | | $ | 3,713 | | | $ | 71,349 | | | $ | 47,739 | | | $ | — | | | $ | — | |
| | 1. | Audit-related fees consist of: |
2022 & 2023 – performance of agreed-upon procedures related to the Registrant’s deferred compensation plan.
2022 & 2023 – review of Registrant’s tax returns
2022 - filings with the French tax authorities to reclaim taxes withheld on dividend income received from French resident companies
Aggregate fees billed to the Registrant for non-audit services during 2022 and 2023 were $74,838 and $51,452, respectively.
Fees billed by the Principal Accountant for services rendered to the Adviser and Control Affiliates.
The following table sets forth the fees billed by the Registrant’s principal accountant for non-audit services rendered to Loomis, Sayles & Company, L.P. and entities controlling, controlled by or under common control with Loomis, Sayles & Company, L.P. (“Control Affiliates”) that provide ongoing services to the Registrant, for engagements that related directly to the operations and financial reporting of the Registrant for the last two fiscal years.
| | | | | | | | | | | | | | | | | | | | | | | | |
| | | Audit-related fees | | | Tax fees | | | All other fees | |
| | | 10/1/21-
9/30/22 | | | 10/1/22-
9/30/23 | | | 10/1/21-
9/30/22 | | | 10/1/22-
9/30/23 | | | 10/1/21-
9/30/22 | | | 10/1/22-
9/30/23 | |
Control Affiliates | | $ | — | | | $ | — | | | $ | — | | | $ | — | | | $ | 50,000 | | | $ | — | |
The following table sets forth the aggregate fees billed by the Registrant’s principal accountant for non-audit services rendered to Loomis, Sayles & Company, L.P. and Control Affiliates that provide ongoing services to the Registrant, for the last two fiscal years, including the fees disclosed in the table above.
| | | | | | | | |
| | | Aggregate Non-Audit Fees | |
| | | 10/1/21-9/30/22 | | | 10/1/22-9/30/23 | |
Control Affiliates | | $ | 50,000 | | | $ | — | |
None of the services described above were approved pursuant to paragraph (c)(7)(i)(C) of Regulation S-X.
Audit Committee Pre Approval Policies.
Annually, the Registrant’s Audit Committee reviews the audit, audit-related, tax and other non-audit services together with the projected fees, for services proposed to be rendered to the Registrant and/or other entities for which pre-approval is required during the upcoming year. Any subsequent revisions to already pre-approved services or fees (including fee increases) and requests for pre-approval of new services would be presented for consideration quarterly as needed.
If, in the opinion of management, a proposed engagement by the Registrant’s independent accountants needs to commence before the next regularly scheduled Audit Committee meeting, any member of the Audit Committee who is an Independent Trustee of the Registrant is authorized to pre-approve the engagement, but only for engagements to provide audit, audit related and tax services. This approval is subject to review by the full Audit Committee at its next quarterly meeting. All other engagements require the approval of all the members of the Audit Committee.
Item 5. Audit Committee of Listed Registrants.
Not applicable.
Item 6. Schedule of Investments.
Included as part of the Report to Shareholders filed as Item 1 herewith.
Item 7. Disclosure of Proxy Voting Policies and Procedures for Closed-End Management Investment Companies.
Not applicable.
Item 8. Portfolio Managers of Closed-End Management Investment Companies
Not applicable.
Item 9. Purchases of Equity Securities by Closed-End Management Investment Companies and Affiliated Purchasers.
Not applicable.
Item 10. Submission of Matters to a Vote of Securities Holders.
There were no material changes to the procedures by which shareholders may recommend nominees to the Registrant’s Board of Trustees.
Item 11. Controls and Procedures.
The Registrant’s principal executive officer and principal financial officer have concluded that the Registrant’s disclosure controls and procedures are sufficient to ensure that information required to be disclosed by the Registrant in this Form N-CSR was recorded, processed, summarized and reported within the time periods specified in the Securities and Exchange Commission’s rules and forms, based upon such officers’ evaluation of these controls and procedures as of a date within 90 days of the filing date of the report.
There were no changes in the Registrant’s internal control over financial reporting that occurred during the period covered by the report that have materially affected, or is reasonably likely to materially affect, the Registrant’s internal control over financial reporting.
Item 12. Disclosure of Securities Lending Activities for Closed-End Management Investment Companies.
Not applicable.
Item 13. Exhibits.
SIGNATURES
Pursuant to the requirements of the Securities Exchange Act of 1934 and the Investment Company Act of 1940, the Registrant has duly caused this report to be signed on its behalf by the undersigned, thereunto duly authorized.
| | |
| Loomis Sayles Funds II |
| |
| By: | | /s/ David L. Giunta |
| |
| Name: | | David L. Giunta |
| Title: | | President and Chief Executive Officer |
| Date: | | November 21, 2023 |
Pursuant to the requirements of the Securities Exchange Act of 1934 and the Investment Company Act of 1940, this report has been signed by the following persons on behalf of the Registrant and in the capacities and on the dates indicated.
| | |
| By: | | /s/ David L. Giunta |
| |
| Name: | | David L. Giunta |
| Title: | | President and Chief Executive Officer |
| Date: | | November 21, 2023 |
| |
| By: | | /s/ Matthew Block |
| |
| Name: | | Matthew Block |
| Title: | | Treasurer and Principal Financial and Accounting Officer |
| Date: | | November 21, 2023 |