| | |
| UNITED STATES |
| SECURITIES AND EXCHANGE COMMISSION |
| Washington, D.C. 20549 |
|
| FORM N-CSR |
|
| CERTIFIED SHAREHOLDER REPORT OF REGISTERED |
| MANAGEMENT INVESTMENT COMPANIES |
| |
| Investment Company Act file number | 811-06247 |
| |
| AMERICAN CENTURY WORLD MUTUAL FUNDS, INC. |
| (Exact name of registrant as specified in charter) |
| |
| 4500 MAIN STREET, KANSAS CITY, MISSOURI | 64111 |
| (Address of principal executive offices) | (Zip Code) |
| |
| CHARLES A. ETHERINGTON |
| 4500 MAIN STREET, KANSAS CITY, MISSOURI 64111 |
| (Name and address of agent for service) |
| |
| Registrant’s telephone number, including area code: | 816-531-5575 |
| |
| Date of fiscal year end: | 11-30 |
| |
| Date of reporting period: | 05-28-2010 |
| |
| |
| |
| |
| | |
| |
| ITEM 1. REPORTS TO STOCKHOLDERS. |
|
| Semiannual Report | |
| May 28, 2010 | |

|
| American Century Investments® |
International Stock Fund
| |
| President’s Letter | 2 |
| Independent Chairman’s Letter | 3 |
| Market Perspective | 4 |
| International Equity Total Returns | 4 |
| |
| International Stock | |
| |
| Performance | 5 |
| Portfolio Commentary | 6 |
| Top Ten Holdings | 8 |
| Types of Investments | 8 |
| Investments by Country | 8 |
| |
| Shareholder Fee Example | 9 |
| |
| Financial Statements | |
| |
| Schedule of Investments | 11 |
| Statement of Assets and Liabilities | 14 |
| Statement of Operations | 15 |
| Statement of Changes in Net Assets | 16 |
| Notes to Financial Statements | 17 |
| Financial Highlights | 22 |
| |
| Other Information | |
| |
| Board Approval of Management and Subadvisory Agreements | 23 |
| Additional Information | 29 |
| Index Definitions | 30 |
Any opinions expressed in this report reflect those of the author as of the date of the report, and do not necessarily represent the opinions of American Century Investments or any other person in the American Century Investments organization. Any such opinions are subject to change at any time based upon market or other conditions and American Century Investments disclaims any responsibility to update such opinions. These opinions may not be relied upon as investment advice and, because investment decisions made by American Century Investments funds are based on numerous factors, may not be relied upon as an indication of trading intent on behalf of any American Century Investments fund. Security examples are used for representational purposes only and are not intended as recommendations to purchase or sell securities. Performance information for comparative indices and securities is provided to American Century Investments by third party vendors. To the best of American Century Investments’ knowledge, such information is accurate at the time of printing.

Dear Investor:
To learn more about the capital markets, your investment, and the portfolio management strategies American Century Investments provides, we encourage you to review this shareholder report for the financial reporting period ended May 28, 2010.
On the following pages, you will find investment performance and portfolio information, presented with the expert perspective and commentary of our portfolio management team. This report remains one of our most important vehicles for conveying the information you need about your investment performance, and about the market factors and strategies that affect fund returns. For additional information on the markets, we encourage you to visit the “Insights & News” tab at our Web site, americancentury.com, for updates and further expert commentary.
The top of our Web site’s home page also provides a link to “Our Story,” which, first and foremost, outlines our commitment—since 1958—to helping clients reach their financial goals. We believe strongly that we will only be successful when our clients are successful. That’s who we are.
Another important, unique facet of our story and who we are is “Profits with a Purpose,” which describes our bond with the Stowers Institute for Medical Research (SIMR). SIMR is a world-class biomedical organization—founded by our company founder James E. Stowers, Jr. and his wife Virginia—that is dedicated to researching the causes, treatment, and prevention of gene-based diseases, including cancer. Through American Century Investments’ private ownership structure, more than 40% of our profits support SIMR.
Mr. Stowers’ example of achieving financial success and using that platform to help humanity motivates our entire American Century Investments team. His story inspires us to help each of our clients achieve success. Thank you for sharing your financial journey with us.
Sincerely,

Jonathan Thomas
President and Chief Executive Officer
American Century Investments
2
|
| Independent Chairman’s Letter |

Fellow Shareholders,
The principal event at a recent board meeting was the retirement of Jim Stowers, Jr. from the American Century Mutual Funds Kansas City board. This was one of those times when you felt like you were living a historical moment. Jim—who celebrated his 86th birthday in January—founded what was known as Twentieth Century Mutual Funds over 50 years ago. Through the years, his number one priority has been to “Put Investors First!” The board presented Jim with a resolution acknowledging that, by building a successful investment company, he has impacted the lives of many by helping them on the path to financial success.
We respect Jim’s decision to focus his energy on the Stowers Institute for Medical Research and American Century Companies, Inc. (ACC), the parent company of the funds’ investment advisor. The pioneering medical research that Jim and his wife Virginia have made possible through the Institute should enrich the lives of millions in the future.
Shortly after his retirement from the board, we received word that ACC’s co-chairman Richard W. Brown had succeeded Jim as trustee of a trust that holds a significant interest in ACC stock as a part of Jim’s long-standing estate and business succession plan. While holding less than a majority interest, the trust is presumed to control the funds’ investment advisors under the Investment Company Act of 1940. This change triggered the need for a shareholder proxy to approve new management and subadvisory agreements for the funds. I am happy to report that all of the proposals contained in the proxy received the necessary votes and were approved.
On behalf of the board, I want to once again thank Jim for his mutual fund board service. More than three years ago, Jim and Richard Brown installed a strong and effective leadership team at American Century Investments and I look forward to continuing to work with them on behalf of fund shareholders. And while Jim no longer sits on the fund board, the inherent optimism captured by his favorite catch phrase—“The best is yet to be”—still resonates with all of us who have the privilege of serving you. I invite you to send your comments, questions or concerns to me at dhpratt@fundboardchair.com.

3

By Mark Kopinski, Chief Investment Officer, Global and Non-U.S. Equity
Events in May Sent Stocks Tumbling
Global stock returns generally remained robust for the first several months of the period, as the rally unleashed in March 2009 continued into 2010. Optimism regarding the global economic recovery and business sector gains helped keep stocks in positive territory.
Nevertheless, as spring set in, the global stock market rally ended abruptly, starting with the May 6 “Flash Crash” in the U.S. stock market, when the major indices plunged nearly 7% within 15 minutes. Furthermore, problems that had been percolating in Europe and in the global geopolitical arena boiled over in May, triggering a sharp stock market selloff. In particular, the expanding European government debt crisis beyond Greece, the downgrade of Spain’s credit rating, the worsening oil disaster in the Gulf of Mexico, and escalating tensions in the Middle East rattled investors’ nerves.
Overall, developed international equity markets significantly under-performed the U.S. market and the emerging markets. European stocks suffered the largest losses for the six-month period, as the mounting debt crisis worried investors. Exploding debt in Greece, Italy, Spain, Ireland, and Portugal all came under scrutiny.
Debt Remained the Roadblock to Growth
The sovereign debt problem did not just happen as a result of the recent financial crisis or recession; it is a longer-term issue. Recent events only exacerbated the problem and accelerated its becoming a crisis.
In fact, sovereign solvency has emerged as one of the most significant roadblocks to growth. Currently, the market is focused on Europe, where severe austerity measures are required to get fiscal balances back in order. This is likely to trim 0.5% from European growth during the next year. The weaker euro should help offset some of the decline in growth, but the more export-oriented northern countries will be the main beneficiaries. Commodity-based countries, such as Australia and Norway, have been the most resilient and have seen more impressive economic recoveries. The debt crisis likely will mean European interest rates will remain accommodative for the remainder of 2010.
| | | | |
| International Equity Total Returns | | | | |
| For the six months ended May 28, 2010* (in U.S. dollars) | |
| MSCI EAFE Index | -10.90% | | MSCI Europe Index | -14.77% |
| MSCI EAFE Growth Index | -8.85% | | MSCI World Free Index | -4.92% |
| MSCI EAFE Value Index | -12.95% | | MSCI Japan Index | 0.10% |
| MSCI EM Index | -2.75% | | *Total returns for periods less than one year are not annualized and are |
| | | | based on the period beginning December 1, 2009. | |
4
| | | | | | | |
| International Stock | | | | | | |
| |
| Total Returns as of May 28, 2010 | | | | | |
| | | | | | Average Annual Returns | |
| | | Ticker | | | | Since | Inception |
| | | Symbol | 6 months(1) | 1 year(2) | 5 years(2) | Inception | Date |
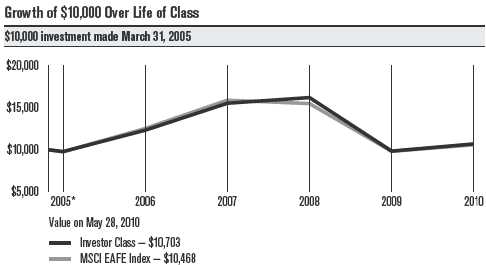
| Investor Class | ASKIX | -9.16% | 8.65% | 1.80% | 1.32% | 3/31/05 |
| MSCI EAFE Index | — | -10.90% | 6.61% | 1.39% | 0.89% | — |
| (1) | Total returns for periods less than one year are not annualized and are based on the period beginning December 1, 2009. | |
| (2) | Total returns are based on the periods beginning June 1, 2009 for the 1 year returns and June 1, 2005 for the 5 year returns. | |
| |
| *From 3/31/05, the Investor Class’s inception date. Not annualized. |
| Total Annual Fund Operating Expenses |
| Investor Class | 1.52% |
The total annual fund operating expenses shown is as stated in the fund’s prospectus current as of the date of this report. The prospectus may vary from the expense ratio shown elsewhere in this report because it is based on a different time period, includes acquired fund fees and expenses, and, if applicable, does not include fee waivers or expense reimbursements.
Data presented reflect past performance. Past performance is no guarantee of future results. Current performance may be higher or lower than the performance shown. Investment return and principal value will fluctuate, and redemption value may be more or less than original cost. To obtain performance data current to the most recent month end, please call 1-800-345-2021 or visit americancentury.com. International investing involves special risks, such as political instability and currency fluctuations. Investing in emerging markets may accentuate these risks.
Data assumes reinvestment of dividends and capital gains, and none of the charts reflect the deduction of taxes that a shareholder would pay on fund distributions or the redemption of fund shares. Returns for the index are provided for comparison. The fund’s total returns include operating expenses (such as transaction costs and management fees) that reduce returns, while the total returns of the index do not.
5
International Stock
Portfolio Managers: Alex Tedder and Raj Gandhi
Performance Summary
The International Stock portfolio returned -9.16%* for the six months ended May 28, 2010, compared with its benchmark, the MSCI EAFE Index, which returned -10.90%.
Investor confidence generally remained upbeat for the first four months of the period, as the global economic recovery appeared to gain momentum and stock prices continued to climb. But, late in the period, mounting concerns about the massive levels of sovereign debt in Greece, Spain, and other European nations put an end to the yearlong global stock market rally. Stock prices plunged, wiping out the gains achieved earlier in the period. International growth stocks fared slightly better than their value counterparts, while small-cap stocks outperformed large-cap stocks. Meanwhile, the euro tumbled sharply relative to the U.S. dollar, which added to the woes of foreign-based corporations.
Stock selection, primarily in the financials and consumer discretionary sectors, accounted for the portfolio’s outperformance relative to the benchmark. Our sector allocations also had an overall positive influence on the portfolio’s relative performance.
U.K., Italy Were Top Countries
From a regional perspective, the portfolio’s holdings in the United Kingdom and Italy contributed the most to relative performance, due to favorable stock selection. In particular, an overweight position in British technology company ARM Holdings, a designer of microchips used in mobile devices, digital TVs and other products, contributed positively. The company benefited primarily from strong growth in the smartphone and tablet computer markets, and it posted record royalty revenues, profits, and net cash generation.
At the opposite end of the spectrum, Japan and Norway represented the largest detractors to relative performance, primarily due to stock selection. Norway’s TGS-NOPEC Geophysical Co., which provides seismic data for the oil and gas industries, was among the portfolio’s largest performance detractors. The company’s stock price faltered in the wake of the oil spill in the Gulf of Mexico, which is within the company’s survey boundaries.
Financials, Consumer Discretionary Led Sector Results
Financials and consumer discretionary were the portfolio’s top-performing sectors for the six-month period. Stock selection was strong in the financials sector, with our holdings in the commercial banking industry driving results. In the consumer discretionary sector, stock selection and an overweight accounted for the portfolio’s relative outperformance. Our stock selection was particularly effective in the auto industry, where our
*Total returns for periods less than one year are not annualized and are based on the period beginning December 1, 2009.
6
International Stock
out-of-benchmark position in South Korea’s Hyundai Motor Co. was the portfolio’s top-contributing stock. In the challenging economic environment, consumers “traded down” for value, and Hyundai’s line of affordable cars benefited. Backed by a savvy, yet frugal, marketing strategy, the company continued to gain market share in a difficult climate for automakers.
Materials, Consumer Staples Sectors Lagged
The materials sector represented the portfolio’s largest performance detractor. Stock selection dragged down results, particularly in the metals and mining segment. Additionally, in the sector’s construction materials segment, German cement producer HeidelbergCement represented the portfolio’s largest performance detractor. The company said its 2009 operating income slid 38.6% from 2008 levels, as revenues plunged 21.6%. The company also said it expects Asia and Africa to drive global growth in 2010 but anticipates slack demand in the U.S. and Europe until the second half of the year.
The portfolio’s consumer staples sector also detracted from performance. While stock selection and an underweight position were slightly negative influences, currency returns accounted for the bulk of the lagging results.
Outlook
Global economic activity is improving, but significant headwinds remain—namely, the explosion of sovereign debt in developed nations. So far, government responses to the crisis have varied, and this lack of coordination may lead to divergent economic performance in the year ahead. We expect further volatility throughout the international stock markets, yet we will continue to focus on finding companies located in developed countries around the world (excluding the United States) with sustainable growth characteristics and promising long-term outlooks.
7
| |
| International Stock | |
| |
| Top Ten Holdings | |
| | % of net assets |
| | as of 5/28/10 |
| BHP Billiton Ltd. | 2.2% |
| Barclays plc | 1.8% |
| Novartis AG | 1.8% |
| BG Group plc | 1.7% |
| Saipem SpA | 1.6% |
| Credit Suisse Group AG | 1.5% |
| Vale SA Preference Shares | 1.5% |
| Nestle SA | 1.4% |
| Tesco plc | 1.4% |
| Unilever NV CVA | 1.4% |
| |
| Types of Investments in Portfolio | |
| | % of net assets |
| | as of 5/28/10 |
| Foreign Common Stocks | 99.2% |
| Other Assets and Liabilities | 0.8% |
| |
| Investments by Country | |
| | % of net assets |
| | as of 5/28/10 |
| United Kingdom | 21.3% |
| Japan | 14.6% |
| Switzerland | 10.0% |
| Germany | 7.3% |
| France | 6.8% |
| Sweden | 4.8% |
| Netherlands | 3.5% |
| Australia | 3.2% |
| People’s Republic of China | 2.8% |
| Brazil | 2.5% |
| South Korea | 2.3% |
| India | 2.0% |
| Taiwan (Republic of China) | 2.0% |
| Other Countries | 16.1% |
| Other Assets and Liabilities | 0.8% |
8
|
| Shareholder Fee Example (Unaudited) |
Fund shareholders may incur two types of costs: (1) transaction costs, including sales charges (loads) on purchase payments and redemption/ exchange fees; and (2) ongoing costs, including management fees; distribution and service (12b-1) fees; and other fund expenses. This example is intended to help you understand your ongoing costs (in dollars) of investing in your fund and to compare these costs with the ongoing cost of investing in other mutual funds.
The example is based on an investment of $1,000 made at the beginning of the period and held for the entire period from December 1, 2009 to May 28, 2010.
Actual Expenses
The table provides information about actual account values and actual expenses for each class. You may use the information, together with the amount you invested, to estimate the expenses that you paid over the period. First, identify the share class you own. Then simply divide your account value by $1,000 (for example, an $8,600 account value divided by $1,000 = 8.6), then multiply the result by the number under the heading “Expenses Paid During Period” to estimate the expenses you paid on your account during this period.
If you hold Investor Class shares of any American Century Investments fund, or Institutional Class shares of the American Century Diversified Bond Fund, in an American Century Investments account (i.e., not a financial intermediary or retirement plan account), American Century Investments may charge you a $12.50 semiannual account maintenance fee if the value of those shares is less than $10,000. We will redeem shares automatically in one of your accounts to pay the $12.50 fee. In determining your total eligible investment amount, we will include your investments in all personal accounts (including American Century Investments Brokerage accounts) registered under your Social Security number. Personal accounts include individual accounts, joint accounts, UGMA/UTMA accounts, personal trusts, Coverdell Education Savings Accounts and IRAs (including traditional, Roth, Rollover, SEP-, SARSEP- and SIMPLE-IRAs), and certain other retirement accounts. If you have only business, business retirement, employer-sponsored or American Century Investments Brokerage accounts, you are currently not subject to this fee. We will not charge the fee as long as you choose to manage your accounts exclusively online. If you are subject to the Account Maintenance Fee, your account value could be reduced by the fee amount.
Hypothetical Example for Comparison Purposes
The table also provides information about hypothetical account values and hypothetical expenses based on the actual expense ratio of each class of your fund and an assumed rate of return of 5% per year before expenses, which is not the actual return of a fund’s share class. The hypothetical account values and expenses may not be used to estimate the actual ending account balance or expenses you paid for the period. You may use this information
9
to compare the ongoing costs of investing in your fund and other funds. To do so, compare this 5% hypothetical example with the 5% hypothetical examples that appear in the shareholder reports of the other funds.
Please note that the expenses shown in the table are meant to highlight your ongoing costs only and do not reflect any transactional costs, such as sales charges (loads) or redemption/exchange fees. Therefore, the table is useful in comparing ongoing costs only, and will not help you determine the relative total costs of owning different funds. In addition, if these transactional costs were included, your costs would have been higher.
| | | | |
| | Beginning | Ending | Expenses Paid | |
| | Account Value | Account Value | During Period* | Annualized |
| | 12/1/09 | 5/28/10 | 12/1/09 - 5/28/10 | Expense Ratio* |
| Actual | $1,000 | $908.40 | $7.07 | 1.51% |
| Hypothetical | $1,000 | $1,017.12 | $7.47 | 1.51% |
| *Expenses are equal to the fund’s annualized expense ratio listed in the table above, multiplied by the average account value over the period, |
| multiplied by 179, the number of days in the most recent fiscal half-year, divided by 365, to reflect the one-half year period. | |
10
| | | | | | |
| International Stock | | | | | |
| |
| MAY 28, 2010 (UNAUDITED) | | | | | | |
| | Shares | Value | | | Shares | Value |
| Common Stocks — 99.2% | | | GERMANY — 7.3% | | |
| | | | | Allianz SE | 5,906 | $ 589,695 |
| AUSTRALIA — 3.2% | | | | | | |
| | | | | BASF SE | 12,266 | 643,029 |
| BHP Billiton Ltd. | 45,014 | $ 1,462,180 | | | | |
| | | | | Bayerische Motoren | | |
| Commonwealth Bank | | | | Werke AG | 11,411 | 525,680 |
| of Australia | 9,277 | 406,501 | | | | |
| | | | | Daimler AG(1) | 17,808 | 877,815 |
| Wesfarmers Ltd. | 9,833 | 239,337 | | | | |
| | | | | Fresenius Medical Care AG | | |
| | | 2,108,018 | | & Co. KGaA | 13,777 | 686,443 |
| AUSTRIA — 0.5% | | | | Metro AG | 9,438 | 493,930 |
| Erste Group Bank AG | 8,526 | 304,263 | | SAP AG(1) | 8,673 | 368,188 |
| BELGIUM — 0.7% | | | | Siemens AG | 6,809 | 611,917 |
| Anheuser-Busch InBev NV | 9,901 | 473,620 | | | | 4,796,697 |
| BERMUDA — 0.2% | | | | HONG KONG — 1.7% | | |
| Seadrill Ltd. | 7,235 | 148,152 | | CNOOC Ltd. | 378,000 | 591,705 |
| BRAZIL — 2.5% | | | | Li & Fung Ltd. | 122,000 | 541,563 |
| Banco Santander Brasil | | | | | | |
| SA ADR | 35,471 | 369,608 | | | | 1,133,268 |
| Itau Unibanco Holding SA | | | | INDIA — 2.0% | | |
| Preference Shares | 17,380 | 321,399 | | Housing Development | | |
| Vale SA Preference Shares | 41,300 | 952,228 | | Finance Corp. Ltd. | 7,276 | 436,413 |
| | | 1,643,235 | | Infosys Technologies Ltd. | 11,234 | 645,464 |
| CANADA — 1.0% | | | | Larsen & Toubro Ltd. | 6,806 | 238,220 |
| Canadian National | | | | | | 1,320,097 |
| Railway Co. | 10,970 | 629,597 | | INDONESIA — 1.1% | | |
| CZECH REPUBLIC — 1.0% | | | | PT Bank Mandiri | | |
| CEZ AS(1) | 14,940 | 623,919 | | (Persero) Tbk | 562,000 | 309,787 |
| DENMARK — 1.8% | | | | PT Bank Rakyat Indonesia | 280,500 | 253,594 |
| Carlsberg A/S B Shares | 4,370 | 330,052 | | PT United Tractors Tbk | 88,000 | 168,396 |
| Novo Nordisk A/S B Shares | 10,643 | 818,250 | | | | 731,777 |
| | | 1,148,302 | | IRELAND — 0.5% | | |
| | | | | Ryanair Holdings plc ADR(1) | 14,586 | 343,354 |
| FINLAND — 0.1% | | | | | | |
| Fortum Oyj | 3,007 | 67,808 | | ISRAEL — 0.6% | | |
| FRANCE — 6.8% | | | | Teva Pharmaceutical | | |
| | | | | Industries Ltd. ADR | 7,432 | 407,422 |
| Air Liquide SA | 6,674 | 648,448 | | ITALY — 1.6% | | |
| BNP Paribas | 11,624 | 659,003 | | Saipem SpA | 33,869 | 1,050,414 |
| Cie Generale d’Optique | | | | | | |
| Essilor International SA | 5,585 | 317,706 | | JAPAN — 14.6% | | |
| Danone SA | 7,568 | 386,709 | | Asahi Glass Co. Ltd. | 53,000 | 555,612 |
| LVMH Moet Hennessy Louis | | | | Canon, Inc. | 20,100 | 823,378 |
| Vuitton SA | 6,610 | 694,004 | | Fanuc Ltd. | 7,000 | 734,551 |
| Pernod-Ricard SA | 7,974 | 597,981 | | HOYA Corp. | 18,400 | 437,211 |
| Societe Television | | | | Komatsu Ltd. | 34,200 | 642,554 |
| Francaise 1 | 12,170 | 172,492 | | Mitsubishi Corp. | 36,500 | 824,015 |
| Total SA | 10,944 | 510,458 | | Mitsubishi UFJ Financial | | |
| Vallourec SA | 2,468 | 456,491 | | Group, Inc. | 111,400 | 541,145 |
| | | 4,443,292 | | Mitsui O.S.K. Lines Ltd. | 48,000 | 340,354 |
| | | | | Nidec Corp. | 6,800 | 618,328 |
11
| | | | | | |
| International Stock | | | | | |
| |
| | Shares | Value | | | Shares | Value |
| Nomura ETF - Nikkei 225 | 7,360 | $ 799,265 | | SPAIN — 1.9% | | |
| Omron Corp. | 22,500 | 466,115 | | Banco Bilbao Vizcaya | | |
| ORIX Corp. | 8,290 | 633,321 | | Argentaria SA | 75,758 | $ 785,071 |
| Rakuten, Inc. | 772 | 540,328 | | Banco Santander SA | 45,355 | 460,330 |
| Shin-Etsu Chemical Co. Ltd. | 3,100 | 156,304 | | | | 1,245,401 |
| SOFTBANK CORP. | 17,200 | 413,872 | | SWEDEN — 4.8% | | |
| Unicharm Corp. | 6,500 | 641,080 | | Alfa Laval AB | 31,153 | 393,236 |
| Yahoo! Japan Corp. | 1,187 | 413,852 | | Atlas Copco AB A Shares | 59,033 | 835,011 |
| | | 9,581,285 | | Getinge AB B Shares | 10,506 | 207,171 |
| LUXEMBOURG — 0.9% | | | | H & M Hennes & Mauritz AB | | |
| Millicom International | | | | B Shares | 8,579 | 480,095 |
| Cellular SA | 7,182 | 574,057 | | Telefonaktiebolaget LM | | |
| MACAU — 0.3% | | | | Ericsson B Shares | 40,026 | 403,053 |
| | | | | Volvo AB B Shares(1) | 78,094 | 808,727 |
| Wynn Macau Ltd.(1) | 132,665 | 213,015 | | | | |
| NETHERLANDS — 3.5% | | | | | | 3,127,293 |
| Akzo Nobel NV | 6,794 | 345,299 | | SWITZERLAND — 10.0% | | |
| ASML Holding NV | 10,780 | 304,489 | | Adecco SA | 6,360 | 307,215 |
| Royal Dutch Shell plc | | | | Credit Suisse Group AG | 24,808 | 961,723 |
| B Shares | 30,643 | 773,383 | | Holcim Ltd. | 6,364 | 401,086 |
| Unilever NV CVA | 32,579 | 888,932 | | Kuehne + Nagel | | |
| | | 2,312,103 | | International AG | 7,233 | 677,742 |
| NORWAY — 1.0% | | | | Nestle SA | 20,186 | 911,298 |
| Telenor ASA | 31,500 | 387,890 | | Novartis AG | 25,559 | 1,157,204 |
| TGS Nopec Geophysical | | | | Roche Holding AG | 4,911 | 673,382 |
| Co. ASA(1) | 18,738 | 253,839 | | Sonova Holding AG | 4,819 | 518,595 |
| | | 641,729 | | Swatch Group AG (The) | 2,696 | 701,103 |
| PEOPLE’S REPUBLIC OF CHINA — 2.8% | | | Syngenta AG | 1,219 | 269,332 |
| Baidu, Inc. ADR(1) | 5,140 | 376,300 | | | | 6,578,680 |
| Ctrip.com International | | | | TAIWAN (REPUBLIC OF CHINA) — 2.0% | |
| Ltd. ADR(1) | 4,457 | 175,561 | | Hon Hai Precision | | |
| Industrial & Commercial | | | | Industry Co. Ltd. | 154,000 | 607,253 |
| Bank of China Ltd. H Shares | 914,000 | 672,351 | | HTC Corp. | 37,000 | 499,992 |
| Mindray Medical | | | | Taiwan Semiconductor | | |
| International Ltd. ADR | 8,046 | 239,288 | | Manufacturing Co. Ltd. ADR | 18,112 | 176,592 |
| Tencent Holdings Ltd. | 17,300 | 329,311 | | | | 1,283,837 |
| ZTE Corp. H Shares | 16,300 | 53,356 | | TURKEY — 0.3% | | |
| | | 1,846,167 | | Turkiye Garanti Bankasi AS | 47,386 | 204,393 |
| SINGAPORE — 0.9% | | | | UNITED KINGDOM — 21.3% | | |
| United Overseas Bank Ltd. | 48,098 | 621,748 | | Admiral Group plc | 30,332 | 563,846 |
| SOUTH KOREA — 2.3% | | | | Antofagasta plc | 27,655 | 352,100 |
| Hyundai Motor Co. | 6,255 | 713,848 | | ARM Holdings plc | 151,338 | 540,347 |
| POSCO | 613 | 239,053 | | Autonomy Corp. plc(1) | 7,044 | 177,926 |
| Samsung Electronics | | | | Barclays plc | 268,599 | 1,171,881 |
| Co. Ltd. | 870 | 562,347 | | BG Group plc | 71,695 | 1,097,402 |
| | | 1,515,248 | | British Airways plc(1) | 62,775 | 181,861 |
| | | | | British American | | |
| | | | | Tobacco plc | 13,689 | 403,763 |
12
| | | | | |
| International Stock | | | | |
| |
| | Shares | Value | | Market Sector Diversification | |
| British Sky Broadcasting | | | | (as a % of net assets) | |
| Group plc | 265 | $ 2,203 | | Financials | 18.2% |
| Carnival plc | 17,033 | 646,715 | | Industrials | 16.0% |
| Compass Group plc | 103,356 | 798,217 | | Consumer Discretionary | 13.7% |
| HSBC Holdings plc | | | | Information Technology | 10.9% |
| (Hong Kong) | 90,061 | 825,476 | | Consumer Staples | 10.6% |
| Intercontinental Hotels | | | | | |
| Group plc | 32,750 | 516,468 | | Materials | 9.4% |
| ITV plc(1) | 818,905 | 660,071 | | Health Care | 7.7% |
| Kingfisher plc | 179,034 | 577,609 | | Energy | 7.4% |
| Lonmin plc(1) | 29,033 | 703,194 | | Telecommunication Services | 3.0% |
| | | | | Diversified | 1.2% |
| Next plc | 5,601 | 167,854 | | | |
| | | | | Utilities | 1.1% |
| Petrofac Ltd. | 10,352 | 168,004 | | | |
| | | | | Other Assets and Liabilities | 0.8% |
| Reckitt Benckiser Group plc | 14,720 | 689,416 | | | |
| Rolls-Royce Group plc(1) | 60,061 | 510,419 | | Notes to Schedule of Investments | |
| Rolls-Royce Group plc | | | | ADR = American Depositary Receipt | |
| C Shares(1) | 5,405,490 | 7,817 | | | |
| Schroders plc | 16,204 | 310,240 | | CVA = Certificaten Van Aandelen | |
| Smiths Group plc | 26,482 | 395,324 | | ETF = Exchange Traded Fund | |
| Standard Chartered plc | 22,848 | 539,565 | | (1) Non-income producing. | |
| Tesco plc | 153,116 | 910,049 | | | |
| Tullow Oil plc | 16,993 | 273,759 | | | |
| Vodafone Group plc | 295,391 | 591,502 | | See Notes to Financial Statements. | |
| Wolseley plc(1) | 8,389 | 199,273 | | | |
| | | 13,982,301 | | | |
| TOTAL INVESTMENT | | | | | |
| SECURITIES — 99.2% | | | | | |
| (Cost $60,010,726) | | 65,100,492 | | | |
| OTHER ASSETS | | | | | |
| AND LIABILITIES — 0.8% | | 516,461 | | | |
| TOTAL NET ASSETS — 100.0% | | $65,616,953 | | | |
13
|
| Statement of Assets and Liabilities |
| |
| MAY 28, 2010 (UNAUDITED) | |
| Assets | |
| Investment securities, at value (cost of $60,010,726) | $65,100,492 |
| Foreign currency holdings, at value (cost of $111,814) | 112,008 |
| Receivable for investments sold | 1,253,896 |
| Receivable for capital shares sold | 42,070 |
| Dividends and interest receivable | 353,660 |
| Other assets | 416 |
| | 66,862,542 |
| | |
| Liabilities | |
| Disbursements in excess of demand deposit cash | 113,458 |
| Payable for investments purchased | 1,001,068 |
| Payable for capital shares redeemed | 51,893 |
| Accrued management fees | 79,170 |
| | 1,245,589 |
| Net Assets | $65,616,953 |
| | |
| Investor Class Capital Shares, $0.01 Par Value | |
| Authorized | 50,000,000 |
| Outstanding | 6,684,526 |
| | |
| Net Asset Value Per Share | $9.82 |
| | |
| Net Assets Consist of: | |
| Capital (par value and paid-in surplus) | $88,039,523 |
| Undistributed net investment income | 357,917 |
| Accumulated net realized loss on investment and foreign currency transactions | (27,865,229) |
| Net unrealized appreciation on investments and translation of assets and liabilities | |
| in foreign currencies | 5,084,742 |
| | $65,616,953 |
| |
| |
| See Notes to Financial Statements. | |
14
| |
| FOR THE SIX MONTHS ENDED MAY 28, 2010 (UNAUDITED) | |
| Investment Income (Loss) | |
| Income: | |
| Dividends (net of foreign taxes withheld of $105,021) | $ 1,005,606 |
| Interest | 97 |
| | 1,005,703 |
| Expenses: | |
| Management fees | 554,767 |
| Directors’ fees and expenses | 1,070 |
| Other expenses | 1,894 |
| | 557,731 |
| Net investment income (loss) | 447,972 |
| | |
| Realized and Unrealized Gain (Loss) | |
| Net realized gain (loss) on: | |
| Investment transactions | 2,383,629 |
| Foreign currency transactions (net of foreign tax expenses paid (refunded) of $2,645) | (6,838) |
| | 2,376,791 |
| | |
| Change in net unrealized appreciation (depreciation) on: | |
| Investments | (2,939,385) |
| Translation of assets and liabilities in foreign currencies | (6,667,865) |
| | (9,607,250) |
| | |
| Net realized and unrealized gain (loss) | (7,230,459) |
| | |
| Net Increase (Decrease) in Net Assets Resulting from Operations | $(6,782,487) |
| |
| |
| See Notes to Financial Statements. | |
15
|
| Statement of Changes in Net Assets |
| | |
| SIX MONTHS ENDED MAY 28, 2010 (UNAUDITED) AND YEAR ENDED NOVEMBER 30, 2009 | |
| Increase (Decrease) in Net Assets | 2010 | 2009 |
| Operations | | |
| Net investment income (loss) | $ 447,972 | $ 676,711 |
| Net realized gain (loss) | 2,376,791 | (11,198,804) |
| Change in net unrealized appreciation (depreciation) | (9,607,250) | 31,104,600 |
| Net increase (decrease) in net assets resulting from operations | (6,782,487) | 20,582,507 |
| | | |
| Distributions to Shareholders | | |
| From net investment income | (782,319) | (936,365) |
| | | |
| Capital Share Transactions | | |
| Proceeds from shares sold | 4,553,474 | 8,529,669 |
| Proceeds from reinvestment of distributions | 765,232 | 914,349 |
| Payments for shares redeemed | (8,842,267) | (12,302,762) |
| Net increase (decrease) in net assets from capital share transactions | (3,523,561) | (2,858,744) |
| | | |
| Redemption Fees | | |
| Increase in net assets from redemption fees | 3,364 | 2,513 |
| | | |
| Net increase (decrease) in net assets | (11,085,003) | 16,789,911 |
| | | |
| Net Assets | | |
| Beginning of period | 76,701,956 | 59,912,045 |
| End of period | $65,616,953 | $76,701,956 |
| | | |
| Undistributed net investment income | $357,917 | $692,264 |
| | | |
| Transactions in Shares of the Fund | | |
| Sold | 415,086 | 937,931 |
| Issued in reinvestment of distributions | 69,752 | 105,583 |
| Redeemed | (821,257) | (1,423,706) |
| Net increase (decrease) in shares of the fund | (336,419) | (380,192) |
| |
| |
| See Notes to Financial Statements. | | |
16
|
| Notes to Financial Statements |
MAY 28, 2010 (UNAUDITED)
1. Organization and Summary of Significant Accounting Policies
Organization — American Century World Mutual Funds, Inc. (the corporation) is registered under the Investment Company Act of 1940 (the 1940 Act) as an open-end management investment company. International Stock Fund (the fund) is one fund in a series issued by the corporation. The fund is diversified under the 1940 Act. The fund’s investment objective is to seek capital growth. The fund pursues its objective by investing primarily in equity securities of issuers in developed foreign countries that are large-sized companies, although it may invest in companies of any size. The following is a summary of the fund’s significant accounting policies.
Security Valuations — Securities traded primarily on a principal securities exchange are valued at the last reported sales price, or at the mean of the latest bid and asked prices where no last sales price is available. Depending on local convention or regulation, securities traded over-the-counter are valued at the mean of the latest bid and asked prices, the last sales price, or the official close price. Investments in open-end management investment companies are valued at the reported net asset value. Discount notes may be valued through a commercial pricing service or at amortized cost, which approximates fair value. Securities traded on foreign securities exchanges and over-the-counter markets are normally completed before the close of business on days that the New York Stock Exchange (the Exchange) is open and may also take place on days when the Exchange is not open. If an event occurs after the value of a security was established but before the net asset value per share was determined that was likely to materially change the net asset value, that security would be valued as determined in accordance with procedures adopted by the Board of Directors. If the fund determines that the market price of a portfolio security is not readily available, or that the valuation methods mentioned above do not reflect the security’s fair value, such security is valued as determined by the Board of Directors or its designee, in accordance with procedures adopted by the Board of Directors, if such determination would materially impact a fund’s net asset value. Certain other circumstances may cause the fund to use alternative procedures to value a security such as: a security has been declared in default; trading in a security has been halted during the trading day; or there is a foreign market holiday and no trading will commence .
Security Transactions — For financial reporting purposes, security transactions are accounted for as of the trade date. Net realized gains and losses are determined on the identified cost basis, which is also used for federal income tax purposes. Certain countries impose taxes on realized gains on the sale of securities registered in their country. The fund records the foreign tax expense, if any, on an accrual basis. The foreign tax expense on realized gains and unrealized appreciation reduces the net realized gain (loss) on investment transactions and net unrealized appreciation (depreciation) on investments, respectively.
Investment Income — Dividend income less foreign taxes withheld, if any, is recorded as of the ex-dividend date. Interest income is recorded on the accrual basis and includes accretion of discounts and amortization of premiums.
Foreign Currency Translations — All assets and liabilities initially expressed in foreign currencies are translated into U.S. dollars at prevailing exchange rates at period end. The fund may enter into spot foreign currency exchange contracts to facilitate transactions denominated in a foreign currency. Purchases and sales of investment securities, dividend and interest income, spot foreign currency exchange contracts, and certain expenses are translated at the rates of exchange prevailing on the respective dates of such transactions. Realized and unrealized gains and losses from foreign currency translations arise from changes in currency exchange rates.
Net realized and unrealized foreign currency exchange gains or losses occurring during the holding period of investment securities are a component of net realized gain (loss) on foreign currency transactions and net unrealized appreciation (depreciation) on translation of assets and liabilities in foreign currencies, respectively. Certain countries may impose taxes on the contract amount of purchases and sales of foreign currency contracts in their currency. The fund records the foreign tax expense, if any, as a reduction to the net realized gain (loss) on foreign currency transactions.
17
Exchange Traded Funds — The fund may invest in exchange traded funds (ETFs). ETFs are a type of index fund bought and sold on a securities exchange. An ETF trades like common stock and represents a fixed portfolio of securities designed to track the performance and dividend yield of a particular domestic or foreign market index. A fund may purchase an ETF to temporarily gain exposure to a portion of the U.S. or a foreign market while awaiting purchase of underlying securities. The risks of owning an ETF generally reflect the risks of owning the underlying securities they are designed to track, although the lack of liquidity on an ETF could result in it being more volatile. Additionally, ETFs have fees and expenses that reduce their value.
Repurchase Agreements — The fund may enter into repurchase agreements with institutions that American Century Investment Management, Inc. (ACIM) has determined are creditworthy pursuant to criteria adopted by the Board of Directors. Each repurchase agreement is recorded at cost. The fund requires that the collateral, represented by securities, received in a repurchase transaction be transferred to the custodian in a manner sufficient to enable the fund to obtain those securities in the event of a default under the repurchase agreement. ACIM monitors, on a daily basis, the securities transferred to ensure the value, including accrued interest, of the securities under each repurchase agreement is equal to or greater than amounts owed to the fund under each repurchase agreement.
Joint Trading Account — Pursuant to an Exemptive Order issued by the Securities and Exchange Commission, the fund, along with certain other funds in the American Century Investments family of funds, may transfer uninvested cash balances into a joint trading account. These balances are invested in one or more repurchase agreements that are collateralized by U.S. Treasury or Agency obligations.
Income Tax Status — It is the fund’s policy to distribute substantially all net investment income and net realized gains to shareholders and to otherwise qualify as a regulated investment company under provisions of the Internal Revenue Code. The fund is no longer subject to examination by tax authorities for years prior to 2006. Additionally, non-U.S. tax returns filed by the fund due to investments in certain foreign securities remain subject to examination by the relevant taxing authority for 7 years from the date of filing. At this time, management believes there are no uncertain tax positions which, based on their technical merit, would not be sustained upon examination and for which it is reasonably possible that the total amounts of unrecognized tax benefits will significantly change in the next twelve months. Accordingly, no provision has been made for federal or state income taxes.
Distributions to Shareholders — Distributions to shareholders are recorded on the ex-dividend date. Distributions from net investment income, if any, are generally declared and paid annually. Distributions from net realized gains, if any, are generally declared and paid twice per year. The fund may make distributions on a more frequent basis to comply with the distribution requirements of the Internal Revenue Code, in all events in a manner consistent with provisions of the 1940 Act.
Redemption — The fund may impose a 2.00% redemption fee on shares held less than 60 days. The redemption fee is retained by the fund and helps cover transaction costs that long-term investors may bear when the fund sells securities to meet investor redemptions.
Indemnifications — Under the corporation’s organizational documents, its officers and directors are indemnified against certain liabilities arising out of the performance of their duties to the fund. In addition, in the normal course of business, the fund enters into contracts that provide general indemnifications. The maximum exposure under these arrangements is unknown as this would involve future claims that may be made against a fund. The risk of material loss from such claims is considered by management to be remote.
Use of Estimates — The financial statements are prepared in conformity with accounting principles generally accepted in the United States of America, which may require management to make certain estimates and assumptions at the date of the financial statements. Actual results could differ from these estimates.
18
2. Fees and Transactions with Related Parties
Management Fees — The corporation has entered into a Management Agreement with American Century Global Investment Management, Inc. (ACGIM) (the investment advisor) (See Note 8), under which ACGIM provides the fund with investment advisory and management services in exchange for a single, unified management fee (the fee). The Agreement provides that all expenses of managing and operating the fund, except brokerage expenses, taxes, interest, fees and expenses of the independent directors (including legal counsel fees), and extraordinary expenses, will be paid by ACGIM. The fee is computed and accrued daily based on the daily net assets of the fund and paid monthly in arrears. For funds with a stepped fee schedule, the rate of the fee is determined by applying a fee rate calculation formula. This formula takes into account the f und’s assets as well as certain assets, if any, of other clients of the investment advisor outside the American Century Investments family of funds (such as subadvised funds and separate accounts) that have very similar investment teams and investment strategies (strategy assets). The annual management fee schedule ranges from 1.10% to 1.50%. The effective annual management fee for the six months ended May 28, 2010 was 1.50%.
ACGIM has entered into a Subadvisory Agreement with ACIM (the subadvisor) on behalf of the fund. The subadvisor makes investment decisions for he cash portion of the fund in accordance with the fund’s investment objectives, policies and restrictions under the supervision of ACGIM and the Board of Directors. ACGIM pays all costs associated with retaining ACIM as the subadvisor of the fund.
Acquired Fund Fees and Expenses — The fund may invest in mutual funds, exchange traded funds, and business development companies (the acquired funds). The fund will indirectly realize its pro rata share of the fees and expenses of the acquired funds in which it invests. These indirect fees and expenses are not paid out of the fund’s assets but are reflected in the return realized by the fund on its investment in the acquired funds.
Related Parties — Certain officers and directors of the corporation are also officers and/ or directors of American Century Companies, Inc. (ACC), the parent of the corporation’s investment advisor, ACGIM, the corporation’s subadvisor, ACIM, the distributor of the corporation, American Century Investment Services, Inc., and the corporation’s transfer agent, American Century Services, LLC.
The fund is eligible to invest in a money market fund for temporary purposes, which is managed by J.P. Morgan Investment Management, Inc. (JPMIM). The fund has a Mutual Funds Services Agreement with J.P. Morgan Investor Services Co. (JPMIS) and a securities lending agreement with JPMorgan Chase Bank (JPMCB). JPMCB is a custodian of the fund. JPMIM, JPMIS and JPMCB are wholly owned subsidiaries of JPMorgan Chase & Co. (JPM). JPM is an equity investor in ACC.
3. Investment Transactions
Purchases and sales of investment securities, excluding short-term investments, for the six months ended May 28, 2010, were $46,801,696 and $50,719,846, respectively.
4. Fair Value Measurements
The fund’s securities valuation process is based on several considerations and may use multiple inputs to determine the fair value of the positions held by the fund. In conformity with accounting principles generally accepted in the United States of America, the inputs used to determine a valuation are classified into three broad levels as follows:
• Level 1 valuation inputs consist of unadjusted quoted prices in an active market for identical securities;
• Level 2 valuation inputs consist of significant direct or indirect observable market data (including quoted prices for similar securities, evaluations of subsequent market events, interest rates, prepayment speeds, credit risk, etc.); or
19
• Level 3 valuation inputs consist of significant unobservable inputs (including a fund’s own assumptions).
The level classification is based on the lowest level input that is significant to the fair valuation measurement. The valuation inputs are not an indication of the risks associated with investing in these securities or other financial instruments.
The following is a summary of the valuation inputs used to determine the fair value of the fund’s securities as of May 28, 2010. The Schedule of Investments provides additional details on the fund’s portfolio holdings.
| | | |
| | Level 1 | Level 2 | Level 3 |
| Investment Securities | | | |
| Foreign Common Stocks | $2,662,182 | $62,438,310 | — |
5. Risk Factors
There are certain risks involved in investing in foreign securities. These risks include those resulting from future adverse political, social, and economic developments, fluctuations in currency exchange rates, the possible imposition of exchange controls, and other foreign laws or restrictions. Investing in emerging markets may accentuate these risks.
6. Interfund Lending
The fund, along with certain other funds in the American Century Investments family of funds, may participate in an interfund lending program, pursuant to an Exemptive Order issued by the Securities and Exchange Commission (SEC). This program provides an alternative credit facility allowing the fund to borrow from or lend to other funds in the American Century Investments family of funds that permit such transactions. Interfund lending transactions are subject to each fund’s investment policies and borrowing and lending limits. The interfund loan rate earned/paid on interfund lending transactions is determined daily based on the average of certain current market rates. Interfund lending transactions normally extend only overnight, but can have a maximum duration of seven days. The program is subject to annual approval by the Board of Directors. During the six months ended May 28, 2010, the fund did not utiliz e the program.
7. Federal Tax Information
The book-basis character of distributions made during the year from net investment income or net realized gains may differ from their ultimate characterization for federal income tax purposes. These differences reflect the differing character of certain income items and net realized gains and losses for financial statement and tax purposes, and may result in reclassification among certain capital accounts on the financial statements.
As of May 28, 2010, the components of investments for federal income tax purposes were as follows:
| | |
| Federal tax cost of investments | $60,801,437 |
| Gross tax appreciation of investments | $7,609,842 |
| Gross tax depreciation of investments | (3,310,787) |
| Net tax appreciation (depreciation) of investments | $4,299,055 |
The difference between book-basis and tax-basis cost and unrealized appreciation (depreciation) is attributable primarily to the tax deferral of losses on wash sales.
20
As of November 30, 2009, the fund had accumulated capital losses of $(28,974,208), which represent net capital loss carryovers that may be used to offset future realized capital gains for federal income tax purposes. Future capital loss carryover utilization in any given year may be subject to Internal Revenue Code limitations. Capital loss carryovers of $(13,731,461) and $(15,242,747) expire in 2016 and 2017, respectively.
8. Corporate Event
As part of a long-standing estate and business succession plan established by ACC Co-Chairman James E. Stowers, Jr., the founder of American Century Investments, ACC Co-Chairman Richard W. Brown succeeded Mr. Stowers as trustee of a trust that holds a greater-than-25% voting interest in ACC, the parent corporation of the fund’s advisors. Under the 1940 Act, this is presumed to represent control of ACC even though it is less than a majority interest. The change of trustee may technically be considered a “change of control” of ACC and therefore also a change of control of the fund’s advisors even though there has been no change to their management and none is anticipated. The “change of control” resulted in the assignment of the fund’s investment advisory and subadvisory agreements. Under the 1940 Act, an assignment automatically terminated such agreements, making the approval of a new agreement necessary.
On February 16, 2010, the Board of Directors approved interim investment advisory and subadvisory agreements under which the fund will be managed until a new agreement is approved by fund shareholders. The interim agreements are substantially identical to the terminated agreements (with the exception of different effective and termination dates) and will not result in changes in the management of American Century Investments, the fund, its investment objectives, fees or services provided. On March 29, 2010, the Board of Directors approved a new investment advisory agreement. The new agreement is also substantially identical to the terminated agreement (except for the date, the substitution of ACIM for ACGIM and certain other non-material changes). In order to streamline American Century’s corporate organization, ACGIM was merged into ACIM on July 16, 2010. The new agreement for the fund was approved by shar eholders at a Special Meeting of Shareholders on June 16, 2010. The new agreement went into effect on July 16, 2010.
9. Subsequent Events
On June 10, 2010, the Board of Directors approved a plan of reorganization (the reorganization) pursuant to which International Growth Fund (International Growth), a fund in a series issued by the corporation, would acquire all of the assets of the fund in exchange for shares of equal value of International Growth and assumption by International Growth of certain liabilities of the fund. Holders of shares of the fund would receive shares of equal value of International Growth. The financial statements and performance history of International Growth would survive after the reorganization. The reorganization is expected to be effective at the close of business on October 29, 2010; however, such timing is subject to change.
In preparing the financial statements, management evaluated the impact of events or transactions occurring through the date the financial statements were issued that would merit recognition or disclosure.
21
| | | | | | | |
| International Stock | | | | | |
| |
| Investor Class | | | | | | |
| For a Share Outstanding Throughout the Years Ended November 30 (except as noted) | | |
| | | 2010(1) | 2009 | 2008 | 2007 | 2006 | 2005(2) |
| Per-Share Data | | | | | | |
| Net Asset Value, | | | | | | |
| Beginning of Period | $10.92 | $8.09 | $16.53 | $13.57 | $10.84 | $10.00 |
| Income From | | | | | | |
| Investment Operations | | | | | | |
| Net Investment | | | | | | |
| Income (Loss) | 0.06(3) | 0.09(3) | 0.15(3) | 0.13 | 0.06 | 0.06(3) |
| Net Realized and | | | | | | |
| Unrealized Gain (Loss) | (1.05) | 2.87 | (7.81) | 2.88 | 2.74 | 0.78 |
| Total From | | | | | | |
| Investment Operations | (0.99) | 2.96 | (7.66) | 3.01 | 2.80 | 0.84 |
| Distributions | | | | | | |
| From Net | | | | | | |
| Investment Income | (0.11) | (0.13) | (0.12) | (0.05) | (0.08) | — |
| From Net Realized Gains | — | — | (0.66) | — | — | — |
| Total Distributions | (0.11) | (0.13) | (0.78) | (0.05) | (0.08) | — |
| Redemption Fees(3) | —(4) | —(4) | —(4) | —(4) | 0.01 | — |
| Net Asset Value, | | | | | | |
| End of Period | $9.82 | $10.92 | $8.09 | $16.53 | $13.57 | $10.84 |
| |
| Total Return(5) | (9.16)% | 36.96% | (48.50)% | 22.22% | 26.07% | 8.40% |
| | | | | | | |
| Ratios/Supplemental Data | | | | | | |
| Ratio of Operating | | | | | | |
| Expenses to Average | | | | | | |
| Net Assets | 1.51%(6) | 1.50% | 1.51% | 1.50% | 1.50% | 1.50%(6) |
| Ratio of Net Investment | | | | | | |
| Income (Loss) to Average | | | | | | |
| Net Assets | 1.21%(6) | 1.05% | 1.12% | 0.83% | 0.40% | 0.91%(6) |
| Portfolio Turnover Rate | 63% | 117% | 107% | 103% | 109% | 109% |
| Net Assets, End of Period | | | | | | |
| (in thousands) | $65,617 | $76,702 | $59,912 | $144,812 | $90,181 | $20,342 |
| (1) | Six months ended May 28, 2010 (unaudited). | | | | | |
| (2) | March 31, 2005 (fund inception) through November 30, 2005. | | | | |
| (3) | Computed using average shares outstanding throughout the period. | | | | |
| (4) | Per-share amount was less than $0.005. | | | | | |
| (5) | Total return assumes reinvestment of net investment income and capital gains distributions, if any. Total returns for periods less than one year |
| | are not annualized. Total returns are calculated based on the net asset value of the last business day. | | |
| (6) | Annualized. | | | | | | |
See Notes to Financial Statements.
22
|
| Board Approval of Management and Subadvisory Agreements |
American Century Global Investment Management, Inc. (“ACGIM” or the “Advisor”) currently serves as investment advisor to the Fund under an interim management agreement (the “Interim Management Agreement”) between the Advisor and the Fund approved by the Fund’s Board of Directors (the “Board”). American Century Investment Management, Inc. (“ACIM” or the “Subadvisor”) currently serves as subadvisor to the Fund under an interim investment subadvisory agreement (the “Interim Subad-visory Agreement” and, together with the Interim Management Agreement, the “Interim Agreements”). The Advisor and the Subadvisor (together, the “Advisors”) previously served as investment advisors to the Fund pursuant to agreements (the “Prior Agreements”) that terminated in accordance with their terms on February 16, 2010, as a result of a change of control of the Advisor’s and the Subadvisor’s parent company, American Century Companies, Inc. (“ACC”). The change in control occurred as the result of a change in the trustee of a trust created by James E. Stowers, Jr., the founder of American Century Investments, which holds shares representing a significant interest in ACC stock. Mr. Stowers previously served as the trustee of the trust. On February 16, 2010, Mr. Richard W. Brown, Co-Chairman of ACC with Mr. Stowers, became the trustee in accordance with the terms of the trust and Mr. Stowers’ long-standing estate and succession plan.
On February 18, 2010, the Board approved the Interim Agreements in accordance with Rule 15a-4 under the Investment Company Act to ensure continued management of the Funds by the Advisor and the Subad-visor after the termination of the Prior Agreements and until shareholder approval of a new management agreement (the “Proposed Agreement”) as required under the Act. The Board approved the Proposed Agreement and recommended its approval to shareholders. Fund shareholders approved the Proposed Agreement at a meeting on June 16, 2010.
Because American Century had indicated its intention to merge ACGIM into ACIM prior to the expiration of the Interim Agreements, the Proposed Agreement is with ACIM as sole investment advisor to the Fund. The Board took into consideration that the combination is being undertaken for reasons of organizational simplification and will eliminate the need for multiple investment management agreements without changing the nature, quality, or extent of services provided to the Fund. The Board noted that the merger was not related to the change of control that necessitated the Interim Agreements and would not result in any change to the personnel managing the Fund.
The Interim Agreements and the Proposed Agreement are substantially identical to the Prior Agreements except for their effective dates, the termination provisions of the Interim Agreements, and the elimination of a subadvisor in the Proposed Agreement. Under the Proposed Agreement, ACIM will provide the same services as provided by ACGIM and ACIM, be subject to the same duties, and receive the same compensation rate as under the Prior Agreements.
23
Basis for Board Approval of Interim Agreements
In considering the approval of the Interim Agreements, Rule 15a-4 requires the Board to approve the contracts within ten business days of the termination of the prior agreements and to determine that the compensation to be received under each interim agreement is no greater than would have been received under the corresponding prior agreement. In connection with the approval, the Board noted that it oversees on a continuous basis and evaluates at its quarterly meetings, directly and through the committees of the Board, the nature and quality of significant services provided by the Advisor and the Subadvisor, the investment performance of the Fund, shareholder services, audit and compliance functions and a variety of other matters relating to the Fund’s operations.
In evaluating the Interim Agreements, the Board, assisted by the advice of its independent legal counsel, considered a number of factors in addition to those required by the rule with no one factor being determinative to its analysis. Among the factors considered by the Board were the circumstances and effect of the change of control, the fact that the Advisor and the Subad-visor will provide the same services and receive the same compensation rate as under the Prior Agreements, and that the change of control did not result in a change of the personnel managing the Fund. Upon completion of its analysis, the Board approved the Interim Agreements, determining that the continued management of the Fund by the Advisor and the Subadvisor was in the best interests of the Fund and Fund shareholders.
Basis for Board Approval of Proposed Agreement
At a meeting held on March 29, 2010, after considering all information presented, the Board approved, and determined to recommend that shareholders approve, the Proposed Agreement. In connection with that approval, the Board requested and reviewed extensive data and information compiled by the Advisor, the Subadvisor, and certain independent providers of evaluation data concerning the Fund and services provided to the Fund. The Board oversees on a continuous basis and evaluates at its quarterly meetings, directly and through the committees of the Board, the nature and quality of significant services provided to the Fund, the investment performance of the Fund, shareholder services, audit and compliance functions and a variety of other matters relating to the Fund’s operations. The information considered and the discussions held at the meetings included, but were not limited to:
• the nature, extent and quality of investment management, shareholder services and other services provided to the Fund;
• the wide range of programs and services provided to the Fund and their shareholders on a routine and non-routine basis;
• the compliance policies, procedures, and regulatory experience of the Advisors;
• data comparing the cost of owning the Fund to the cost of owning similar funds;
24
• the fact that there will be no changes to the fees, services, or personnel who provide such services as compared to the Prior Agreements;
• data comparing the Fund’s performance to appropriate benchmarks and/ or a peer group of other mutual funds with similar investment objectives and strategies;
• financial data showing the profitability of the Fund to the Advisors and the overall profitability of the Advisors;
• data comparing services provided and charges to the Fund with those for other non-fund investment management clients of the Advisors; and
• consideration of collateral or “fall-out” benefits derived by the Advisors from the management of the Fund and potential sharing of economies of scale in connection with the management of the Fund.
The Board also considered whether there was any reason for not continuing the existing arrangement with the Advisor. In particular, the Board recognized that shareholders may have invested in the Fund on the strength of the Advisor’s industry standing and reputation and in the expectation that the Advisor will have a continuing role in providing services to the Fund.
The Board considered all of the information provided by the Advisor, the Subadvisor, the independent data providers, and the Board’s independent counsel, and evaluated such information for the Fund. The Board did not identify any single factor as being all-important or controlling, and each Board member may have attributed different levels of importance to different factors. In deciding to approve the Proposed Agreement under the terms ultimately determined by the Board to be appropriate, the Board based its decision on a number of factors, including the following:
Nature, Extent and Quality of Services – Generally. Under the Proposed Agreement, ACIM is responsible for providing or arranging for all services necessary for the operation of the Fund. The Board noted that under the Proposed Agreement, ACIM provides or arranges at its own expense a wide variety of services including:
• constructing and designing the Fund
• portfolio research and security selection
• initial capitalization/funding
• securities trading
• Fund administration
• custody of Fund assets
• daily valuation of the Fund’s portfolio
25
• shareholder servicing and transfer agency, including shareholder confir-
mations, recordkeeping and communications
• legal services
• regulatory and portfolio compliance
• financial reporting
• marketing and distribution
The Board noted that many of these services have expanded over time both in terms of quantity and complexity in response to shareholder demands, competition in the industry, changing distribution channels and the changing regulatory environment.
Investment Management Services. The investment management services provided to the Fund are complex and provide Fund shareholders access to professional money management, instant diversification of their investments within an asset class, the opportunity to easily diversify among asset classes, and liquidity. As a part of its general oversight and in evaluating investment performance, the Board expects ACIM to manage the Fund in accordance with its investment objectives and approved strategies. In providing these services, ACIM utilizes teams of investment professionals who require extensive information technology, research, training, compliance and other systems to conduct their business. The Board, directly and through its Fund Performance Review Committee, regularly reviews investment performance information for the Fund, toget her with comparative information for appropriate benchmarks and/or peer groups of similarly-managed funds, over different time horizons. If performance concerns are identified, the Fund receives special reviews until performance improves, during which time the Board discusses with ACIM the reasons for such underperformance and any efforts being undertaken to improve performance.
Shareholder and Other Services. Under the Proposed Agreement, ACIM will also provide the Fund with a comprehensive package of transfer agency, shareholder, and other services. The Board, directly and through the various committees of the Board, regularly reviews reports and evaluations of such services. These reports include, but are not limited to, information regarding the operational efficiency and accuracy of the shareholder and transfer agency services provided, staffing levels, shareholder satisfaction (as measured by external as well as internal sources), technology support, new products and services offered to Fund shareholders, securities trading activities, portfolio valuation services, auditing services, and legal and operational compliance activities. Certain aspects of shareholder and transfer agency service level eff iciency and the quality of securities trading activities are measured by independent third party providers and are presented in comparison to other fund groups not managed by ACIM.
26
Costs of Services Provided and Profitability. The Advisor provided detailed information concerning its cost of providing various services to the Fund, its profitability in managing the Fund, its overall profitability, and its financial condition. The Board reviewed with the Advisor the methodology used to prepare this financial information. The Board has also reviewed with the Advisor its methodology for compensating the investment professionals that provide services to the Fund as well as compensation to the five highest paid personnel of the Advisor. This financial information regarding the Advisor is considered in order to evaluate the Advisor’s financial condition, its ability to continue to provide services under the Proposed Agreement, and the reasonableness of the proposed management fees. The Board concluded that the Advisor’s profits were reasonable in light of the services provided to the Fund.
Ethics. The Board generally considers ACIM’s commitment to providing quality services to shareholders and to conducting its business ethically. It noted that ACIM’s practices generally meet or exceed industry best practices.
Economies of Scale. The Board also reviewed information provided by ACIM regarding the possible existence of economies of scale in connection with the management of the Fund. The Board concluded that economies of scale are difficult to measure and predict with precision, especially on a fund-by-fund basis. The analysis of economies of scale is further complicated by the additional services and content provided by ACIM and its reinvestment in its ability to provide and expand those services. Accordingly, the Board seeks to evaluate economies of scale by reviewing information, such as year-over-year profitability of its advisor generally, the profitability of its management of the Fund specifically, and the expenses incurred by the advisor in providing various functions to the Fund. The Board believes ACIM will appropriately sha re economies of scale through its competitive fee structure, offering competitive fees from fund inception, fee breakpoints as the Fund increases in size, and through reinvestment in its business to provide shareholders additional services and enhancements to existing services.
Comparison to Fees of Funds not Managed by the Advisor. Both the Prior and Proposed Agreements provide that the Fund pays ACGIM or ACIM a single, all-inclusive (or unified) management fee for providing all services necessary for the management and operation of the Fund, other than brokerage expenses, taxes, interest, extraordinary expenses, and the fees and expenses of the Fund’s Independent Directors (including their independent legal counsel) and expenses incurred in connection with the provision of shareholder services and distribution services under a plan adopted pursuant to Rule 12b-1 under the 1940 Act. Under the unified fee structure, ACIM is responsible for providing all investment advisory, custody, audit, administrative, compliance, recordkeeping, marketing and shareholder services, or arranging and supervising third parties that provide such services. By contrast, most other funds are charged a variety of fees, including an investment advisory fee, a transfer agency fee, an administrative fee, distribution charges and other expenses. Other than their investment advisory fees and any applicable Rule 12b-1 distribution fees, the components of the total fees charged by these other funds may be
27
increased without shareholder approval. The Board believes the unified fee structure is a benefit to Fund shareholders because it clearly discloses to shareholders the cost of owning Fund shares, and, since the unified fee cannot be increased without a vote of Fund shareholders, it shifts to ACIM the risk of increased costs of operating the Fund and provides a direct incentive to minimize administrative inefficiencies. Part of the Board’s analysis of fee levels involves reviewing certain evaluative data compiled by an independent provider comparing the Fund’s unified fee to the total expense ratios of similar funds not managed by ACIM. The Board concluded that the management fee to be paid by the Fund to ACIM under the Proposed Agreement is reasonable in light of the services to be provided to the Fund.
Comparison to Fees and Services Provided to Other Clients of the Advisor. The Board also requested and received information from ACIM concerning the nature and extent of the services, fees, and profitability of its advisory services to advisory clients other than the Fund. They observed that these varying types of client accounts require different services and involve different regulatory and entrepreneurial risks than the management of the Fund. The Board analyzed this information and concluded that the fees charged and services provided to the Fund were reasonable by comparison.
Collateral or “Fall-Out” Benefits Derived by the Advisor. The Board considered the existence of collateral benefits ACIM may receive as a result of its relationship with the Fund. The Board concluded that ACIM’s primary business is managing mutual funds and it generally does not use Fund or shareholder information to generate profits in other lines of business, and therefore does not derive any significant collateral benefits from them. The Board noted that ACIM receives proprietary research from broker-dealers that execute Fund portfolio transactions and concluded that this research is likely to benefit Fund shareholders. The Board also determined that ACIM is able to provide investment management services to certain clients other than the Fund, at least in part, due to its existing infrastructure built to serv e the fund complex. The Board concluded, however, that the assets of those other clients are not material to the analysis and, in any event, are included with the assets of fund clients to determine breakpoints in each fund’s fee schedule, provided they are managed using the same investment team and strategy.
Conclusion of the Board. As a result of this process, the Board, in the absence of particular circumstances and assisted by the advice of its independent legal counsel, taking into account all of the factors discussed above and the information provided by ACIM and others, concluded that the Proposed Agreement be approved and recommended its approval to Fund shareholders.
28
Retirement Account Information
As required by law, distributions you receive from certain IRAs, or 403(b), 457 and qualified plans are subject to federal income tax withholding, unless you elect not to have withholding apply. Tax will be withheld on the total amount withdrawn even though you may be receiving amounts that are not subject to withholding, such as nondeductible contributions. In such case, excess amounts of withholding could occur. You may adjust your withholding election so that a greater or lesser amount will be withheld.
If you don’t want us to withhold on this amount, you must notify us to not withhold the federal income tax. You may notify us in writing or in certain situations by telephone or through other electronic means. You have the right to revoke your withholding election at any time and any election you make may remain in effect until revoked by filing a new election.
Remember, even if you elect not to have income tax withheld, you are liable for paying income tax on the taxable portion of your withdrawal. If you elect not to have income tax withheld or you don’t have enough income tax withheld, you may be responsible for payment of estimated tax. You may incur penalties under the estimated tax rules if your withholding and estimated tax payments are not sufficient. You can reduce or defer the income tax on a distribution by directly or indirectly rolling such distribution over to another IRA or eligible plan. You should consult your tax advisor for additional information.
State tax will be withheld if, at the time of your distribution, your address is within one of the mandatory withholding states and you have federal income tax withheld. State taxes will be withheld from your distribution in accordance with the respective state rules.
Proxy Voting Guidelines
American Century Investment Management, Inc., the fund’s investment advisor, is responsible for exercising the voting rights associated with the securities purchased and/or held by the fund. A description of the policies and procedures the advisor uses in fulfilling this responsibility is available without charge, upon request, by calling 1-800-345-2021. It is also available on American Century Investments’ website at americancentury.com and on the Securities and Exchange Commission’s website at sec.gov. Information regarding how the investment advisor voted proxies relating to portfolio securities during the most recent 12-month period ended June 30 is available on the “About Us” page at americancentury.com. It is also available at sec.gov.
Quarterly Portfolio Disclosure
The fund files its complete schedule of portfolio holdings with the Securities and Exchange Commission (SEC) for the first and third quarters of each fiscal year on Form N-Q. The fund’s Forms N-Q are available on the SEC’s website at sec.gov, and may be reviewed and copied at the SEC’s Public Reference Room in Washington, DC. Information on the operation of the Public Reference Room may be obtained by calling 1-800-SEC-0330. The fund also makes its complete schedule of portfolio holdings for the most recent quarter of its fiscal year available on its website at americancentury.com and, upon request, by calling 1-800-345-2021.
29
The following indices are used to illustrate investment market, sector, or style performance or to serve as fund performance comparisons. They are not investment products available for purchase.
Morgan Stanley Capital International (MSCI) has developed several indices that measure the performance of foreign stock markets.
The MSCI EAFE (Europe, Australasia, Far East) Index is designed to measure developed market equity performance, excluding the U.S. and Canada.
The MSCI EAFE Growth Index is a capitalization-weighted index that monitors the performance of growth stocks from Europe, Australasia, and the Far East.
The MSCI EAFE Value Index is a capitalization-weighted index that monitors the performance of value stocks from Europe, Australasia, and the Far East.
The MSCI EM (Emerging Markets) Index represents the performance of stocks in global emerging market countries.
The MSCI Europe Index is designed to measure equity market performance in Europe.
The MSCI Japan Index is designed to measure equity market performance in Japan.
The MSCI World Free Index represents the performance of stocks in developed countries (including the United States) that are available for purchase by global investors.
30
31
32

| |
| |
| Contact Us | |
| americancentury.com | |
| Automated Information Line | 1-800-345-8765 |
| Investor Services Representative | 1-800-345-2021 or |
| | 816-531-5575 |
| Investors Using Advisors | 1-800-378-9878 |
| Business, Not-For-Profit, Employer-Sponsored | |
| Retirement Plans | 1-800-345-3533 |
| Banks and Trust Companies, Broker-Dealers, | |
| Financial Professionals, Insurance Companies | 1-800-345-6488 |
| Telecommunications Device for the Deaf | 1-800-634-4113 |
| American Century World Mutual Funds, Inc. | |
| Investment Advisor: | |
| American Century Investment Management, Inc. | |
| Kansas City, Missouri | |
This report and the statements it contains are submitted for the general
information of our shareholders. The report is not authorized for distribution to
prospective investors unless preceded or accompanied by an effective prospectus.
American Century Investment Services, Inc., Distributor
©2010 American Century Proprietary Holdings, Inc. All rights reserved.
1007
CL-SAN-68674
|
| Semiannual Report |
| May 28, 2010 |

|
| American Century Investments® |
International Growth Fund
| |
| President’s Letter | 2 |
| Independent Chairman’s Letter | 3 |
| Market Perspective | 4 |
| International Equity Total Returns | 4 |
| |
| International Growth | |
| |
| Performance | 5 |
| Portfolio Commentary | 7 |
| Top Ten Holdings | 9 |
| Types of Investments in Portfolio | 9 |
| Investments by Country | 9 |
| |
| Shareholder Fee Example | 10 |
| |
| Financial Statements | |
| |
| Schedule of Investments | 12 |
| Statement of Assets and Liabilities | 15 |
| Statement of Operations | 16 |
| Statement of Changes in Net Assets | 17 |
| Notes to Financial Statements | 18 |
| Financial Highlights | 25 |
| |
| Other Information | |
| |
| Board Approval of Management and Subadvisory Agreements | 31 |
| Additional Information | 37 |
| Index Definitions | 38 |
Any opinions expressed in this report reflect those of the author as of the date of the report, and do not necessarily represent the opinions of American Century Investments or any other person in the American Century Investments organization. Any such opinions are subject to change at any time based upon market or other conditions and American Century Investments disclaims any responsibility to update such opinions. These opinions may not be relied upon as investment advice and, because investment decisions made by American Century Investments funds are based on numerous factors, may not be relied upon as an indication of trading intent on behalf of any American Century Investments fund. Security examples are used for representational purposes only and are not intended as recommendations to purchase or sell securities. Performance information for comparative indices and securities is provided to American Century Investments by third party vendors. To the best of American Century Investments’ knowledge, such information is accurate at the time of printing.

Dear Investor:
To learn more about the capital markets, your investment, and the portfolio management strategies American Century Investments provides, we encourage you to review this shareholder report for the financial reporting period ended May 28, 2010.
On the following pages, you will find investment performance and portfolio information, presented with the expert perspective and commentary of our portfolio management team. This report remains one of our most important vehicles for conveying the information you need about your investment performance, and about the market factors and strategies that affect fund returns. For additional information on the markets, we encourage you to visit the “Insights & News” tab at our Web site, americancentury.com, for updates and further expert commentary.
The top of our Web site’s home page also provides a link to “Our Story,” which, first and foremost, outlines our commitment—since 1958—to helping clients reach their financial goals. We believe strongly that we will only be successful when our clients are successful. That’s who we are.
Another important, unique facet of our story and who we are is “Profits with a Purpose,” which describes our bond with the Stowers Institute for Medical Research (SIMR). SIMR is a world-class biomedical organization—founded by our company founder James E. Stowers, Jr. and his wife Virginia—that is dedicated to researching the causes, treatment, and prevention of gene-based diseases, including cancer. Through American Century Investments’ private ownership structure, more than 40% of our profits support SIMR.
Mr. Stowers’ example of achieving financial success and using that platform to help humanity motivates our entire American Century Investments team. His story inspires us to help each of our clients achieve success. Thank you for sharing your financial journey with us.
Sincerely,

Jonathan Thomas
President and Chief Executive Officer
American Century Investments
2
|
| Independent Chairman’s Letter |

Fellow Shareholders,
The principal event at a recent board meeting was the retirement of Jim Stowers, Jr. from the American Century Mutual Funds Kansas City board. This was one of those times when you felt like you were living a historical moment. Jim—who celebrated his 86th birthday in January—founded what was known as Twentieth Century Mutual Funds over 50 years ago. Through the years, his number one priority has been to “Put Investors First!” The board presented Jim with a resolution acknowledging that, by building a successful investment company, he has impacted the lives of many by helping them on the path to financial success.
We respect Jim’s decision to focus his energy on the Stowers Institute for Medical Research and American Century Companies, Inc. (ACC), the parent company of the funds’ investment advisor. The pioneering medical research that Jim and his wife Virginia have made possible through the Institute should enrich the lives of millions in the future.
Shortly after his retirement from the board, we received word that ACC’s co-chairman Richard W. Brown had succeeded Jim as trustee of a trust that holds a significant interest in ACC stock as a part of Jim’s long-standing estate and business succession plan. While holding less than a majority interest, the trust is presumed to control the funds’ investment advisors under the Investment Company Act of 1940. This change triggered the need for a shareholder proxy to approve new management and subadvisory agreements for the funds. I am happy to report that all of the proposals contained in the proxy received the necessary votes and were approved.
On behalf of the board, I want to once again thank Jim for his mutual fund board service. More than three years ago, Jim and Richard Brown installed a strong and effective leadership team at American Century Investments and I look forward to continuing to work with them on behalf of fund shareholders. And while Jim no longer sits on the fund board, the inherent optimism captured by his favorite catch phrase—“The best is yet to be”—still resonates with all of us who have the privilege of serving you. I invite you to send your comments, questions or concerns to me at dhpratt@fundboardchair.com.

3

By Mark Kopinski, Chief Investment Officer, Global and Non-U.S. Equity
Events in May Sent Stocks Tumbling
Global stock returns generally remained robust for the first several months of the period, as the rally unleashed in March 2009 continued into 2010. Optimism regarding the global economic recovery and business sector gains helped keep stocks in positive territory.
Nevertheless, as spring set in, the global stock market rally ended abruptly, starting with the May 6 “Flash Crash” in the U.S. stock market, when the major indices plunged nearly 7% within 15 minutes. Furthermore, problems that had been percolating in Europe and in the global geopolitical arena boiled over in May, triggering a sharp stock market selloff. In particular, the expanding European government debt crisis beyond Greece, the downgrade of Spain’s credit rating, the worsening oil disaster in the Gulf of Mexico, and escalating tensions in the Middle East rattled investors’ nerves.
Overall, developed international equity markets significantly under-performed the U.S. market and the emerging markets. European stocks suffered the largest losses for the six-month period, as the mounting debt crisis worried investors. Exploding debt in Greece, Italy, Spain, Ireland, and Portugal all came under scrutiny.
Debt Remained the Roadblock to Growth
The sovereign debt problem did not just happen as a result of the recent financial crisis or recession; it is a longer-term issue. Recent events only exacerbated the problem and accelerated its becoming a crisis.
In fact, sovereign solvency has emerged as one of the most significant roadblocks to growth. Currently, the market is focused on Europe, where severe austerity measures are required to get fiscal balances back in order. This is likely to trim 0.5% from European growth during the next year. The weaker euro should help offset some of the decline in growth, but the more export-oriented northern countries will be the main beneficiaries. Commodity-based countries, such as Australia and Norway, have been the most resilient and have seen more impressive economic recoveries. The debt crisis likely will mean European interest rates will remain accommodative for the remainder of 2010.
| | | | |
| International Equity Total Returns | | | | |
| For the six months ended May 28, 2010* (in U.S. dollars) | |
| MSCI EAFE Index | -10.90% | | MSCI Europe Index | -14.77% |
| MSCI EAFE Growth Index | - 8.85% | | MSCI World Free Index | - 4.92% |
| MSCI EAFE Value Index | -12.95% | | MSCI Japan Index | 0.10% |
| MSCI EM Index | - 2.75% | | | |
| *Total returns for periods less than one year are not annualized and are based on the period beginning December 1, 2009. | |
4
| | | | | | | | |
| International Growth | | | | | | |
| |
| Total Returns as of May 28, 2010 | | | | | |
| | | | | | Average Annual Returns | |
| | | Ticker | | | | | Since | Inception |
| | | Symbol | 6 months(1) | 1 year(2) | 5 years(2) | 10 years(2) | Inception | Date |
| Investor Class | TWIEX | -8.76% | 9.96% | 2.43% | -1.42% | 7.15% | 5/9/91 |
| MSCI EAFE Index | — | -10.90% | 6.61% | 1.39% | 0.66% | 4.55%(3) | — |
| MSCI EAFE Growth Index | — | -8.85% | 8.60% | 1.87% | -1.27% | 2.95%(3) | — |
| Institutional Class | TGRIX | -8.78% | 10.14% | 2.61% | -1.22% | 4.03% | 11/20/97 |
| A Class(4) | TWGAX | | | | | | 10/2/96 |
| No sales charge* | | -8.93% | 9.69% | 2.16% | -1.67% | 4.82% | |
| With sales charge* | | -14.14% | 3.41% | 0.97% | -2.25% | 4.37% | |
| B Class | CBIGX | | | | | | 1/31/03 |
| No sales charge* | | -9.27% | 8.88% | 1.42% | — | 6.03% | |
| With sales charge* | | -14.27% | 4.88% | 1.23% | — | 6.03% | |
| C Class | AIWCX | | | | | | 6/4/01 |
| No sales charge* | | -9.33% | 8.81% | 1.38% | — | 0.18% | |
| With sales charge* | | -10.24% | 8.81% | 1.38% | — | 0.18% | |
| R Class | ATGRX | -8.97% | 9.37% | 1.91% | — | 4.99% | 8/29/03 |
| * Sales charges include initial sales charges and contingent deferred sales charges (CDSCs), as applicable. A Class shares have a 5.75% |
| maximum initial sales charge for equity funds and may be subject to a maximum CDSC of 1.00%. B Class shares redeemed within six |
| years of purchase are subject to a CDSC that declines from 5.00% during the first year after purchase to 0.00% the sixth year after |
| purchase. C Class shares redeemed within 12 months of purchase are subject to a maximum CDSC of 1.00%. The SEC requires that |
| mutual funds provide performance information net of maximum sales charges in all cases where charges could be applied. |
| |
| (1) | Total returns for periods less than one year are not annualized and are based on the period beginning December 1, 2009. | |
| (2) | Total returns are based on the period beginning June 1, 2009 for the 1 year returns, June 1, 2005 for the 5 year returns, and June 1, 2000 for |
| | the 10 year returns. | | | | | | | |
| (3) | Total returns from April 30, 1991, the date nearest the Investor Class’s inception for which data are available, through May 31, 2010, the date |
| | nearest the report date for which data are available. | | | | | |
| (4) | Prior to December 3, 2007, the A Class was referred to as the Advisor Class and did not have a front-end sales charge. Performance prior to that |
| | date has been adjusted to reflect this charge. | | | | | | |
Data presented reflect past performance. Past performance is no guarantee of future results. Current performance may be higher or lower than the performance shown. Investment return and principal value will fluctuate, and redemption value may be more or less than original cost. To obtain performance data current to the most recent month end, please call 1-800-345-2021 or visit americancentury.com. International investing involves special risks, such as political instability and currency fluctuations. Investing in emerging markets may accentuate these risks.
Unless otherwise indicated, performance reflects Investor Class shares; performance for other share classes will vary due to differences in fee structure. For information about other share classes available, please consult the prospectus. Data assumes reinvestment of dividends and capital gains, and none of the charts reflect the deduction of taxes that a shareholder would pay on fund distributions or the redemption of fund shares. Returns for the indices are provided for comparison. The fund’s total returns include operating expenses (such as transaction costs and management fees) that reduce returns, while the total returns of the indices do not.
5
International Growth
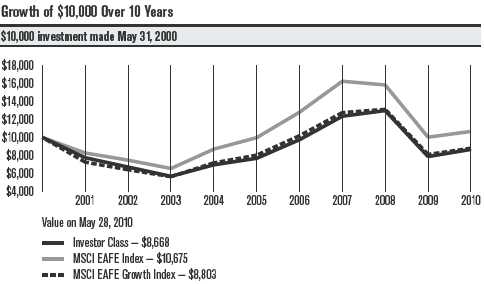
| | | | | |
| Total Annual Fund Operating Expenses | | | |
| | Institutional | | | | |
| Investor Class | Class | A Class | B Class | C Class | R Class |
| 1.40% | 1.20% | 1.65% | 2.40% | 2.40% | 1.90% |
The total annual fund operating expenses shown is as stated in the fund’s prospectus current as of the date of this report. The prospectus may vary from the expense ratio shown elsewhere in this report because it is based on a different time period, includes acquired fund fees and expenses, and, if applicable, does not include fee waivers or expense reimbursements.
Data presented reflect past performance. Past performance is no guarantee of future results. Current performance may be higher or lower than the performance shown. Investment return and principal value will fluctuate, and redemption value may be more or less than original cost. To obtain performance data current to the most recent month end, please call 1-800-345-2021 or visit americancentury.com. International investing involves special risks, such as political instability and currency fluctuations. Investing in emerging markets may accentuate these risks.
Unless otherwise indicated, performance reflects Investor Class shares; performance for other share classes will vary due to differences in fee structure. For information about other share classes available, please consult the prospectus. Data assumes reinvestment of dividends and capital gains, and none of the charts reflect the deduction of taxes that a shareholder would pay on fund distributions or the redemption of fund shares. Returns for the indices are provided for comparison. The fund’s total returns include operating expenses (such as transaction costs and management fees) that reduce returns, while the total returns of the indices do not.
6
International Growth
Portfolio Managers: Alex Tedder and Raj Gandhi
Performance Summary
The International Growth portfolio returned -8.76%* for the six months ended May 28, 2010, compared with its benchmark, the MSCI EAFE Index, which returned -10.90%.
Investor confidence generally remained upbeat for the first four months of the period, as the global economic recovery appeared to gain momentum and stock prices continued to climb. But, late in the period, mounting concerns about the massive levels of sovereign debt in Greece, Spain, and other European nations put an end to the yearlong global stock market rally. Stock prices plunged, wiping out the gains achieved earlier in the period. International growth stocks fared slightly better than their value counterparts, while small-cap stocks outperformed large-cap stocks. Meanwhile, the euro tumbled sharply relative to the U.S. dollar, which added to the woes of foreign-based corporations.
Stock selection, primarily in the financials and consumer discretionary sectors, accounted for the portfolio’s outperformance relative to the benchmark. Our sector allocations also had an overall positive influence on the portfolio’s relative performance.
U.K., Italy Were Top Countries
From a regional perspective, the portfolio’s holdings in the United Kingdom and Italy contributed the most to relative performance, due to favorable stock selection combined with underweight positions. In particular, an overweight position in British technology company ARM Holdings, a designer of microchips used in mobile devices, digital TVs and other products, contributed positively. The company benefited primarily from strong growth in the smartphone and tablet computer markets, and it posted record royalty revenues, profits, and net cash generation.
At the opposite end of the spectrum, Japan and Norway represented the largest detractors to relative performance, primarily due to stock selection. Norway’s TGS-NOPEC Geophysical Co., which provides seismic data for the oil and gas industries, was among the portfolio’s largest performance detractors. The company’s stock price faltered in the wake of the oil spill in the Gulf of Mexico, which is within the company’s survey boundaries.
Financials, Consumer Discretionary Led Sector Results
Financials and consumer discretionary were the portfolio’s top-performing sectors for the six-month period. Stock selection was strong in the financials sector, with our holdings in the commercial banking industry driving results. In the consumer discretionary sector, stock selection and an overweight accounted for the portfolio’s relative outperformance. Our stock selection was particularly effective in the auto industry, where our out-of-benchmark position in South Korea’s Hyundai Motor Co. was the portfolio’s
* All fund returns referenced in this commentary are for Investor Class shares. Total returns for periods less than one year are not annualized and are based on the period beginning December 1, 2009.
7
International Growth
top-contributing stock. In the challenging economic environment, consumers “traded down” for value, and Hyundai’s line of affordable cars benefited. Backed by a savvy, yet frugal, marketing strategy, the company continued to gain market share in a difficult climate for automakers.
Materials, Consumer Staples Sectors Lagged
The materials sector represented the portfolio’s largest performance detractor. Stock selection dragged down results, particularly in the metals and mining segment. Additionally, in the sector’s construction materials segment, German cement producer HeidelbergCement represented the portfolio’s largest performance detractor. The company said its 2009 operating income slid 38.6% from 2008 levels, as revenues plunged 21.6%. The company also said it expects Asia and Africa to drive global growth in 2010 but anticipates slack demand in the U.S. and Europe until the second half of the year.
The portfolio’s consumer staples sector also detracted from performance. While stock selection and an underweight position were slightly negative influences, currency returns accounted for the bulk of the lagging results.
Outlook
Global economic activity is improving, but significant headwinds remain—namely, the explosion of sovereign debt in developed nations. So far, government responses to the crisis have varied, and this lack of coordination may lead to divergent economic performance in the year ahead. We expect further volatility throughout the international stock markets, yet we will continue to focus on finding companies located in developed countries around the world (excluding the United States) with sustainable growth characteristics and promising long-term outlooks.
8
| |
| International Growth | |
| |
| Top Ten Holdings | |
| | % of net assets |
| | as of 5/28/10 |
| BHP Billiton Ltd. | 2.2% |
| Novartis AG | 1.8% |
| BG Group plc | 1.5% |
| Barclays plc | 1.5% |
| Unilever NV CVA | 1.5% |
| Vale SA Preference Shares | 1.5% |
| Saipem SpA | 1.4% |
| Credit Suisse Group AG | 1.4% |
| Nomura ETF — Nikkei 225 | 1.4% |
| Nestle SA | 1.3% |
| |
| Types of Investments in Portfolio | |
| | % of net assets |
| | as of 5/28/10 |
| Foreign Common Stocks | 99.5% |
| Temporary Cash Investments | 0.3% |
| Other Assets and Liabilities | 0.2% |
| |
| Investments by Country | |
| | % of net assets |
| | as of 5/28/10 |
| United Kingdom | 20.8% |
| Japan | 14.6% |
| Switzerland | 10.0% |
| Germany | 7.3% |
| France | 6.6% |
| Sweden | 4.7% |
| Netherlands | 3.7% |
| Australia | 3.2% |
| People’s Republic of China | 2.8% |
| Brazil | 2.5% |
| South Korea | 2.2% |
| Other Countries | 21.1% |
| Cash and Equivalents* | 0.5% |
| *Includes temporary cash investments and other assets and liabilities. | |
9
|
| Shareholder Fee Example (Unaudited) |
Fund shareholders may incur two types of costs: (1) transaction costs, including sales charges (loads) on purchase payments and redemption/ exchange fees; and (2) ongoing costs, including management fees; distribution and service (12b-1) fees; and other fund expenses. This example is intended to help you understand your ongoing costs (in dollars) of investing in your fund and to compare these costs with the ongoing cost of investing in other mutual funds.
The example is based on an investment of $1,000 made at the beginning of the period and held for the entire period from December 1, 2009 to May 28, 2010.
Actual Expenses
The table provides information about actual account values and actual expenses for each class. You may use the information, together with the amount you invested, to estimate the expenses that you paid over the period. First, identify the share class you own. Then simply divide your account value by $1,000 (for example, an $8,600 account value divided by $1,000 = 8.6), then multiply the result by the number under the heading “Expenses Paid During Period” to estimate the expenses you paid on your account during this period.
If you hold Investor Class shares of any American Century Investments fund, or Institutional Class shares of the American Century Diversified Bond Fund, in an American Century Investments account (i.e., not a financial intermediary or retirement plan account), American Century Investments may charge you a $12.50 semiannual account maintenance fee if the value of those shares is less than $10,000. We will redeem shares automatically in one of your accounts to pay the $12.50 fee. In determining your total eligible investment amount, we will include your investments in all personal accounts (including American Century Investments Brokerage accounts) registered under your Social Security number. Personal accounts include individual accounts, joint accounts, UGMA/UTMA accounts, personal trusts, Coverdell Education Savings Accounts and IRAs (including traditional, Roth, Rollover, SEP-, SARSEP- and SIMPLE-IRAs), and certain other retirement accounts. If you have only business, business retirement, employer-sponsored or American Century Investments Brokerage accounts, you are currently not subject to this fee. We will not charge the fee as long as you choose to manage your accounts exclusively online. If you are subject to the Account Maintenance Fee, your account value could be reduced by the fee amount.
Hypothetical Example for Comparison Purposes
The table also provides information about hypothetical account values and hypothetical expenses based on the actual expense ratio of each class of your fund and an assumed rate of return of 5% per year before expenses, which is not the actual return of a fund’s share class. The hypothetical account values and expenses may not be used to estimate the actual ending account balance or expenses you paid for the period. You may use this information to compare the ongoing costs of investing in your fund and other funds. To do so, compare this 5% hypothetical example with the 5% hypothetical examples that appear in the shareholder reports of the other funds.
10
Please note that the expenses shown in the table are meant to highlight your ongoing costs only and do not reflect any transactional costs, such as sales charges (loads) or redemption/exchange fees. Therefore, the table is useful in comparing ongoing costs only, and will not help you determine the relative total costs of owning different funds. In addition, if these transactional costs were included, your costs would have been higher.
| | | | |
| | Beginning | Ending | Expenses Paid | |
| | Account Value | Account Value | During Period* | Annualized |
| | 12/1/09 | 5/28/10 | 12/1/09 – 5/28/10 | Expense Ratio* |
| Actual | | | | |
| Investor Class | $1,000 | $912.40 | $6.33 | 1.35% |
| Institutional Class | $1,000 | $912.20 | $5.39 | 1.15% |
| A Class | $1,000 | $910.70 | $7.50 | 1.60% |
| B Class | $1,000 | $907.30 | $10.99 | 2.35% |
| C Class | $1,000 | $906.70 | $10.99 | 2.35% |
| R Class | $1,000 | $910.30 | $8.67 | 1.85% |
| Hypothetical | | | | |
| Investor Class | $1,000 | $1,017.90 | $6.68 | 1.35% |
| Institutional Class | $1,000 | $1,018.88 | $5.69 | 1.15% |
| A Class | $1,000 | $1,016.67 | $7.91 | 1.60% |
| B Class | $1,000 | $1,013.00 | $11.60 | 2.35% |
| C Class | $1,000 | $1,013.00 | $11.60 | 2.35% |
| R Class | $1,000 | $1,015.45 | $9.14 | 1.85% |
| * Expenses are equal to the class’s annualized expense ratio listed in the table above, multiplied by the average account value over the period, |
| multiplied by 179, the number of days in the most recent fiscal half-year, divided by 365, to reflect the one-half year period. |
11
| | | | | | |
| International Growth | | | | | |
| |
| MAY 28, 2010 (UNAUDITED) | | | | | | |
| | Shares | Value | | | Shares | Value |
| Common Stocks — 99.5% | | | GERMANY — 7.3% | | |
| AUSTRALIA — 3.2% | | | | Allianz SE | 129,570 | $ 12,937,142 |
| BHP Billiton Ltd. | 952,154 | $ 30,928,613 | | BASF SE | 259,140 | 13,585,087 |
| | | | | Bayerische Motoren | | |
| Commonwealth | | | | Werke AG | 267,370 | 12,317,154 |
| Bank of Australia | 196,040 | 8,590,100 | | | | |
| | | | | Daimler AG(1) | 356,900 | 17,592,768 |
| Wesfarmers Ltd. | 172,107 | 4,189,118 | | | | |
| | | 43,707,831 | | Fresenius Medical | | |
| | | | | Care AG & Co. KGaA | 276,763 | 13,789,793 |
| AUSTRIA — 0.5% | | | | Metro AG | 191,310 | 10,012,061 |
| Erste Group Bank AG | 190,630 | 6,802,922 | | SAP AG(1) | 210,770 | 8,947,662 |
| BELGIUM — 0.7% | | | | | | |
| | | | | Siemens AG | 140,080 | 12,588,823 |
| Anheuser-Busch InBev NV | 201,487 | 9,638,246 | | | | |
| | | | | | | 101,770,490 |
| BERMUDA — 0.2% | | | | | | |
| | | | | HONG KONG — 1.7% | | |
| Seadrill Ltd. | 153,030 | 3,133,613 | | | | |
| | | | | CNOOC Ltd. | 7,774,000 | 12,169,085 |
| BRAZIL — 2.5% | | | | | | |
| | | | | Li & Fung Ltd. | 2,466,000 | 10,946,686 |
| Banco Santander | | | | | | |
| Brasil SA ADR | 749,421 | 7,808,967 | | | | 23,115,771 |
| Itau Unibanco Holding SA | | | | INDIA — 1.9% | | |
| Preference Shares | 354,790 | 6,560,950 | | Housing Development | | |
| Vale SA Preference Shares | 890,500 | 20,531,688 | | Finance Corp. Ltd. | 148,758 | 8,922,479 |
| | | 34,901,605 | | Infosys Technologies Ltd. | 229,680 | 13,196,564 |
| CANADA — 0.9% | | | | Larsen & Toubro Ltd. | 140,260 | 4,909,293 |
| Canadian National | | | | | | 27,028,336 |
| Railway Co. | 212,690 | 12,206,838 | | INDONESIA — 1.1% | | |
| CZECH REPUBLIC — 1.0% | | | | PT Bank Mandiri | | |
| CEZ AS(1) | 338,020 | 14,116,289 | | (Persero) Tbk | 9,963,000 | 5,491,824 |
| DENMARK — 1.7% | | | | PT Bank Rakyat Indonesia | 5,718,000 | 5,169,521 |
| Carlsberg A/S | | | | PT United Tractors Tbk | 2,235,500 | 4,277,830 |
| B Shares | 90,050 | 6,801,178 | | | | 14,939,175 |
| Novo Nordisk A/S | | | | IRELAND — 0.5% | | |
| B Shares | 217,349 | 16,710,122 | | Ryanair Holdings plc ADR(1) | 300,581 | 7,075,677 |
| | | 23,511,300 | | ISRAEL — 0.6% | | |
| FINLAND — 0.4% | | | | Teva Pharmaceutical | | |
| Fortum Oyj | 216,290 | 4,877,352 | | Industries Ltd. ADR | 157,200 | 8,617,704 |
| FRANCE — 6.6% | | | | ITALY — 1.4% | | |
| Air Liquide SA | 143,157 | 13,909,182 | | Saipem SpA | 646,804 | 20,059,998 |
| BNP Paribas | 238,658 | 13,530,314 | | JAPAN — 14.6% | | |
| Cie Generale d’Optique | | | | Asahi Glass Co. Ltd. | 1,104,000 | 11,573,512 |
| Essilor International SA | 114,170 | 6,494,620 | | Canon, Inc. | 417,400 | 17,098,410 |
| Danone SA | 141,824 | 7,246,917 | | Fanuc Ltd. | 133,900 | 14,050,913 |
| LVMH Moet Hennessy | | | | HOYA Corp. | 376,400 | 8,943,823 |
| Louis Vuitton SA | 140,270 | 14,727,375 | | Komatsu Ltd. | 741,400 | 13,929,516 |
| Pernod-Ricard SA | 163,027 | 12,225,611 | | Mitsubishi Corp. | 731,900 | 16,523,195 |
| Societe Television | | | | Mitsubishi UFJ | | |
| Francaise 1 | 257,114 | 3,644,217 | | Financial Group, Inc. | 2,265,000 | 11,002,635 |
| Total SA | 224,026 | 10,449,178 | | Mitsui O.S.K. Lines Ltd. | 1,027,000 | 7,282,147 |
| Vallourec SA | 52,150 | 9,645,863 | | Nidec Corp. | 141,500 | 12,866,678 |
| | | 91,873,277 | | | | |
12
| | | | | | |
| International Growth | | | | | |
| |
| | Shares | Value | | | Shares | Value |
| Nomura ETF - Nikkei 225 | 174,065 | $ 18,902,727 | | SPAIN — 1.9% | | |
| Omron Corp. | 460,500 | 9,539,816 | | Banco Bilbao Vizcaya | | |
| ORIX Corp. | 170,590 | 13,032,344 | | Argentaria SA | 1,602,350 | $ 16,604,970 |
| Rakuten, Inc. | 16,440 | 11,506,464 | | Banco Santander SA | 958,444 | 9,727,709 |
| Shin-Etsu Chemical Co. Ltd. | 92,000 | 4,638,700 | | | | 26,332,679 |
| SOFTBANK CORP. | 350,800 | 8,441,053 | | SWEDEN — 4.7% | | |
| Unicharm Corp. | 134,600 | 13,275,293 | | Alfa Laval AB | 658,920 | 8,317,367 |
| Yahoo! Japan Corp. | 26,999 | 9,413,306 | | Atlas Copco AB A Shares | 1,164,180 | 16,467,105 |
| | | 202,020,532 | | Getinge AB B Shares | 217,710 | 4,293,096 |
| LUXEMBOURG — 0.9% | | | | H & M Hennes & Mauritz AB | | |
| Millicom International | | | | B Shares | 163,740 | 9,163,151 |
| Cellular SA | 160,697 | 12,844,511 | | Telefonaktiebolaget LM | | |
| MACAU — 0.4% | | | | Ericsson B Shares | 1,084,320 | 10,918,873 |
| | | | | Volvo AB B Shares(1) | 1,517,030 | 15,710,083 |
| Wynn Macau Ltd.(1) | 3,426,520 | 5,501,833 | | | | |
| NETHERLANDS — 3.7% | | | | | | 64,869,675 |
| Akzo Nobel NV | 172,340 | 8,759,015 | | SWITZERLAND — 10.0% | | |
| ASML Holding NV | 221,500 | 6,256,425 | | Adecco SA | 129,940 | 6,276,644 |
| Royal Dutch Shell plc | | | | Credit Suisse Group AG | 515,820 | 19,996,609 |
| B Shares | 627,270 | 15,831,345 | | Holcim Ltd. | 155,150 | 9,778,212 |
| Unilever NV CVA | 760,570 | 20,752,487 | | Kuehne + Nagel | | |
| | | 51,599,272 | | International AG | 147,880 | 13,856,548 |
| NORWAY — 1.0% | | | | Nestle SA | 411,340 | 18,569,970 |
| Telenor ASA | 666,310 | 8,204,912 | | Novartis AG | 542,510 | 24,562,572 |
| TGS Nopec | | | | Roche Holding AG | 103,879 | 14,243,592 |
| Geophysical Co. ASA(1) | 396,200 | 5,367,225 | | Sonova Holding AG | 101,920 | 10,968,076 |
| | | 13,572,137 | | Swatch Group AG (The) | 56,150 | 14,601,986 |
| PEOPLE’S REPUBLIC OF CHINA — 2.8% | | | Syngenta AG | 24,922 | 5,506,399 |
| Baidu, Inc. ADR(1) | 104,600 | 7,657,766 | | | | 138,360,608 |
| Ctrip.com International | | | | TAIWAN (REPUBLIC OF CHINA) — 1.9% | |
| Ltd. ADR(1) | 91,740 | 3,613,639 | | Hon Hai Precision | | |
| Industrial & Commercial | | | | Industry Co. Ltd. | 3,168,000 | 12,492,058 |
| Bank of China Ltd. | | | | HTC Corp. | 776,000 | 10,486,332 |
| H Shares | 21,188,000 | 15,586,180 | | Taiwan Semiconductor | | |
| Mindray Medical | | | | Manufacturing Co. Ltd. ADR | 370,308 | 3,610,503 |
| International Ltd. ADR | 162,760 | 4,840,482 | | | | 26,588,893 |
| Tencent Holdings Ltd. | 353,600 | 6,730,893 | | TURKEY — 0.3% | | |
| ZTE Corp. H Shares | 331,400 | 1,084,798 | | Turkiye Garanti Bankasi AS | 967,750 | 4,174,254 |
| | | 39,513,758 | | UNITED KINGDOM — 20.8% | | |
| POLAND — 1.2% | | | | Admiral Group plc | 628,536 | 11,683,947 |
| Powszechna Kasa | | | | Antofagasta plc | 513,808 | 6,541,745 |
| Oszczednosci Bank Polski SA | 1,334,070 | 16,280,762 | | ARM Holdings plc | 3,089,140 | 11,029,656 |
| SINGAPORE — 0.9% | | | | Autonomy Corp. plc(1) | 169,280 | 4,275,885 |
| United Overseas Bank Ltd. | 979,360 | 12,659,858 | | Barclays plc | 4,847,717 | 21,150,284 |
| SOUTH KOREA — 2.2% | | | | BG Group plc | 1,404,739 | 21,501,687 |
| Hyundai Motor Co. | 122,352 | 13,963,345 | | British Airways plc(1) | 1,281,630 | 3,712,915 |
| POSCO | 12,630 | 4,925,341 | | | | |
| | | | | British American | | |
| Samsung | | | | Tobacco plc | 313,318 | 9,241,450 |
| Electronics Co. Ltd. | 17,910 | 11,576,593 | | | | |
| | | | | British Sky | | |
| | | 30,465,279 | | Broadcasting Group plc | 5,370 | 44,644 |
13
| | | | | |
| International Growth | | | | |
| |
| | Shares | Value | | Market Sector Diversification | |
| Carnival plc | 370,616 | $ 14,071,673 | | (as a % of net assets) | |
| Compass Group plc | 2,063,077 | 15,933,111 | | Financials | 19.0% |
| HSBC Holdings plc | | | | Industrials | 15.7% |
| (Hong Kong) | 1,986,751 | 18,210,057 | | Consumer Discretionary | 13.5% |
| Intercontinental | | | | Information Technology | 11.1% |
| Hotels Group plc | 735,550 | 11,599,636 | | Consumer Staples | 10.2% |
| ITV plc(1) | 16,944,970 | 13,658,347 | | | |
| | | | | Materials | 9.6% |
| Kingfisher plc | 3,591,276 | 11,586,359 | | Health Care | 7.5% |
| Lonmin plc(1) | 593,190 | 14,367,367 | | Energy | 7.0% |
| Next plc | 118,330 | 3,546,187 | | Telecommunication Services | 3.1% |
| Petrofac Ltd. | 211,650 | 3,434,885 | | Utilities | 1.4% |
| Reckitt Benckiser Group plc | 276,533 | 12,951,521 | | Diversified | 1.4% |
| Rolls-Royce Group plc(1) | 1,298,026 | 11,031,073 | | Cash and Equivalents* | 0.5% |
| Rolls-Royce Group plc C | | | | | |
| Shares(1) | 125,708,040 | 181,793 | | *Includes temporary cash investments and other assets and liabilities. |
| Schroders plc | 332,669 | 6,369,253 | | Notes to Schedule of Investments | |
| Smiths Group plc | 540,810 | 8,073,217 | | ADR = American Depositary Receipt | |
| Standard Chartered plc | 462,728 | 10,927,520 | | CVA = Certificaten Van Aandelen | |
| Tesco plc | 2,822,793 | 16,777,344 | | ETF = Exchange Traded Fund | |
| Tullow Oil plc | 347,437 | 5,597,247 | | (1) Non-income producing. | |
| Vodafone Group plc | 6,898,640 | 13,814,094 | | | |
| Wolseley plc(1) | 288,440 | 6,851,625 | | | |
| | | 288,164,522 | | See Notes to Financial Statements. | |
| TOTAL COMMON STOCKS | | | | | |
| (Cost $1,230,513,612) | | 1,380,324,997 | | | |
| Temporary Cash Investments — 0.3% | | | |
| JPMorgan U.S. Treasury | | | | | |
| Plus Money Market Fund | | | | | |
| Agency Shares | 38,096 | 38,096 | | | |
| Repurchase Agreement, Credit Suisse First | | | | |
| Boston, Inc., (collateralized by various U.S. | | | | |
| Treasury obligations, 0.875%, 10/31/11, | | | | |
| valued at $3,982,228), in a joint trading | | | | |
| account at 0.15%, dated 5/28/10, due | | | | |
| 6/1/10 (Delivery value $3,900,065) | 3,900,000 | | | |
| TOTAL TEMPORARY | | | | | |
| CASH INVESTMENTS | | | | | |
| (Cost $3,938,096) | | 3,938,096 | | | |
| TOTAL INVESTMENT | | | | | |
| SECURITIES — 99.8% | | | | | |
| (Cost $1,234,451,708) | | 1,384,263,093 | | | |
| OTHER ASSETS | | | | | |
| AND LIABILITIES — 0.2% | | 3,348,286 | | | |
| TOTAL NET ASSETS — 100.0% | $1,387,611,379 | | | |
14
|
| Statement of Assets and Liabilities |
| | | | |
| MAY 28, 2010 (UNAUDITED) | | | | |
| Assets | | | | |
| Investment securities, at value (cost of $1,234,451,708) | | | $1,384,263,093 |
| Foreign currency holdings, at value (cost of $7,874,361) | | | 7,878,224 |
| Receivable for investments sold | | | | 28,410,312 |
| Receivable for capital shares sold | | | | 617,788 |
| Dividends and interest receivable | | | | 7,607,003 |
| Other assets | | | | 207,487 |
| | | | | 1,428,983,907 |
| | | | | |
| Liabilities | | | | |
| Disbursements in excess of demand deposit cash | | | 1,055,841 |
| Payable for investments purchased | | | | 38,135,008 |
| Payable for capital shares redeemed | | | | 678,469 |
| Accrued management fees | | | | 1,466,001 |
| Service fees (and distribution fees — A Class and R Class) payable | | | 34,963 |
| Distribution fees payable | | | | 2,246 |
| | | | | 41,372,528 |
| | | | | |
| Net Assets | | | | $1,387,611,379 |
| | | | | |
| Net Assets Consist of: | | | | |
| Capital (par value and paid-in surplus) | | | | $1,617,582,859 |
| Undistributed net investment income | | | | 7,880,231 |
| Accumulated net realized loss on investment and foreign currency transactions | | (387,595,829) |
| Net unrealized appreciation on investments and translation of assets and liabilities in foreign currencies | 149,744,118 |
| | | | | $1,387,611,379 |
| |
| | Net assets | Shares outstanding | Net asset value per share |
| Investor Class, $0.01 Par Value | $1,129,997,996 | 129,045,897 | | $8.76 |
| Institutional Class, $0.01 Par Value | $85,804,095 | 9,803,322 | | $8.75 |
| A Class, $0.01 Par Value | $164,294,885 | 18,750,387 | | $8.76* |
| B Class, $0.01 Par Value | $1,182,480 | 135,766 | | $8.71 |
| C Class, $0.01 Par Value | $2,494,832 | 288,226 | | $8.66 |
| R Class, $0.01 Par Value | $3,837,091 | 436,185 | | $8.80 |
| * Maximum offering price $9.29 (net asset value divided by 0.9425) | | | |
| |
| |
| See Notes to Financial Statements. | | | | |
15
| |
| FOR THE SIX MONTHS ENDED MAY 28, 2010 (UNAUDITED) | |
| Investment Income (Loss) | |
| Income: | |
| Dividends (net of foreign taxes withheld of $2,093,486) | $ 20,151,327 |
| Interest | 1,543 |
| | 20,152,870 |
| | |
| Expenses: | |
| Management fees | 9,950,390 |
| Distribution fees: | |
| B Class | 5,040 |
| C Class | 11,039 |
| Service fees: | |
| B Class | 1,680 |
| C Class | 3,680 |
| Distribution and service fees: | |
| A Class | 217,725 |
| R Class | 12,583 |
| Directors’ fees and expenses | 24,173 |
| Other expenses | 27,210 |
| | 10,253,520 |
| | |
| Net investment income (loss) | 9,899,350 |
| | |
| Realized and Unrealized Gain (Loss) | |
| Net realized gain (loss) on: | |
| Investment transactions | 72,683,254 |
| Foreign currency transactions (net of foreign tax expenses paid (refunded) of $57,042) | (1,942,111) |
| | 70,741,143 |
| | |
| Change in net unrealized appreciation (depreciation) on: | |
| Investments | (90,112,333) |
| Translation of assets and liabilities in foreign currencies | (126,942,247) |
| | (217,054,580) |
| | |
| Net realized and unrealized gain (loss) | (146,313,437) |
| | |
| Net Increase (Decrease) in Net Assets Resulting from Operations | $(136,414,087) |
| |
| |
| See Notes to Financial Statements. | |
16
|
| Statement of Changes in Net Assets |
| | |
| SIX MONTHS ENDED MAY 28, 2010 (UNAUDITED) AND YEAR ENDED NOVEMBER 30, 2009 | |
| Increase (Decrease) in Net Assets | 2010 | 2009 |
| Operations | | |
| Net investment income (loss) | $ 9,899,350 | $ 15,019,787 |
| Net realized gain (loss) | 70,741,143 | (172,012,014) |
| Change in net unrealized appreciation (depreciation) | (217,054,580) | 593,662,338 |
| Net increase (decrease) in net assets resulting from operations | (136,414,087) | 436,670,111 |
| | | |
| Distributions to Shareholders | | |
| From net investment income: | | |
| Investor Class | (19,906,689) | (18,150,440) |
| Institutional Class | (1,322,640) | (723,098) |
| A Class | (1,881,933) | (2,178,683) |
| B Class | — | (9,776) |
| C Class | — | (24,583) |
| R Class | (29,305) | (35,665) |
| Decrease in net assets from distributions | (23,140,567) | (21,122,245) |
| | | |
| Capital Share Transactions | | |
| Net increase (decrease) in net assets from capital share transactions | 12,853,462 | (85,157,099) |
| | | |
| Redemption Fees | | |
| Increase in net assets from redemption fees | 23,370 | 39,738 |
| | | |
| Net increase (decrease) in net assets | (146,677,822) | 330,430,505 |
| | | |
| Net Assets | | |
| Beginning of period | 1,534,289,201 | 1,203,858,696 |
| End of period | $1,387,611,379 | $1,534,289,201 |
| | | |
| Undistributed net investment income | $7,880,231 | $21,121,448 |
| |
| |
| See Notes to Financial Statements. | | |
17
|
| Notes to Financial Statements |
MAY 28, 2010 (UNAUDITED)
1. Organization and Summary of Significant Accounting Policies
Organization — American Century World Mutual Funds, Inc. (the corporation) is registered under the Investment Company Act of 1940 (the 1940 Act) as an open-end management investment company. International Growth Fund (the fund) is one fund in a series issued by the corporation. The fund is diversified under the 1940 Act. The fund’s investment objective is to seek capital growth. The fund pursues its objective by investing primarily in equity securities of foreign companies in at least three developed countries (excluding the United States). The following is a summary of the fund’s significant accounting policies.
Multiple Class — The fund is authorized to issue the Investor Class, the Institutional Class, the A Class, the B Class, the C Class and the R Class. The A Class may incur an initial sales charge. The A Class, B Class and C Class may be subject to a contingent deferred sales charge. The share classes differ principally in their respective sales charges and distribution and shareholder servicing expenses and arrangements. All shares of the fund represent an equal pro rata interest in the net assets of the class to which such shares belong, and have identical voting, dividend, liquidation and other rights and the same terms and conditions, except for class specific expenses and exclusive rights to vote on matters affecting only individual classes. Income, non-class specific expenses, and realized and unrealized capital gains and losses of the fund are allocated to each class of shares based on their relative net assets.
Security Valuations — Securities traded primarily on a principal securities exchange are valued at the last reported sales price, or at the mean of the latest bid and asked prices where no last sales price is available. Depending on local convention or regulation, securities traded over-the-counter are valued at the mean of the latest bid and asked prices, the last sales price, or the official close price. Investments in open-end management investment companies are valued at the reported net asset value. Discount notes may be valued through a commercial pricing service or at amortized cost, which approximates fair value. Securities traded on foreign securities exchanges and over-the-counter markets are normally completed before the close of business on days that the New York Stock Exchange (the Exchange) is open and may also take place on days when the Exchange is not open. If an event occurs after the value of a security was established but before the net asset value per share was determined that was likely to materially change the net asset value, that security would be valued as determined in accordance with procedures adopted by the Board of Directors. If the fund determines that the market price of a portfolio security is not readily available, or that the valuation methods mentioned above do not reflect the security’s fair value, such security is valued as determined by the Board of Directors or its designee, in accordance with procedures adopted by the Board of Directors, if such determination would materially impact a fund’s net asset value. Certain other circumstances may cause the fund to use alternative procedures to value a security such as: a security has been declared in default; trading in a security has been halted during the trading day; or there is a foreign market holiday and no trading will commence .
Security Transactions — For financial reporting purposes, security transactions are accounted for as of the trade date. Net realized gains and losses are determined on the identified cost basis, which is also used for federal income tax purposes. Certain countries impose taxes on realized gains on the sale of securities registered in their country. The fund records the foreign tax expense, if any, on an accrual basis. The foreign tax expense on realized gains and unrealized appreciation reduces the net realized gain (loss) on investment transactions and net unrealized appreciation (depreciation) on investments, respectively.
Investment Income — Dividend income less foreign taxes withheld, if any, is recorded as of the ex-dividend date. Interest income is recorded on the accrual basis and includes accretion of discounts and amortization of premiums.
18
Foreign Currency Translations — All assets and liabilities initially expressed in foreign currencies are translated into U.S. dollars at prevailing exchange rates at period end. The fund may enter into spot foreign currency exchange contracts to facilitate transactions denominated in a foreign currency. Purchases and sales of investment securities, dividend and interest income, spot foreign currency exchange contracts, and certain expenses are translated at the rates of exchange prevailing on the respective dates of such transactions. Realized and unrealized gains and losses from foreign currency translations arise from changes in currency exchange rates.
Net realized and unrealized foreign currency exchange gains or losses occurring during the holding period of investment securities are a component of net realized gain (loss) on foreign currency transactions and net unrealized appreciation (depreciation) on translation of assets and liabilities in foreign currencies, respectively. Certain countries may impose taxes on the contract amount of purchases and sales of foreign currency contracts in their currency. The fund records the foreign tax expense, if any, as a reduction to the net realized gain (loss) on foreign currency transactions.
Exchange Traded Funds — The fund may invest in exchange traded funds (ETFs). ETFs are a type of index fund bought and sold on a securities exchange. An ETF trades like common stock and represents a fixed portfolio of securities designed to track the performance and dividend yield of a particular domestic or foreign market index. A fund may purchase an ETF to temporarily gain exposure to a portion of the U.S. or a foreign market while awaiting purchase of underlying securities. The risks of owning an ETF generally reflect the risks of owning the underlying securities they are designed to track, although the lack of liquidity on an ETF could result in it being more volatile. Additionally, ETFs have fees and expenses that reduce their value.
Repurchase Agreements — The fund may enter into repurchase agreements with institutions that American Century Investment Management, Inc. (ACIM) has determined are creditworthy pursuant to criteria adopted by the Board of Directors. Each repurchase agreement is recorded at cost. The fund requires that the collateral, represented by securities, received in a repurchase transaction be transferred to the custodian in a manner sufficient to enable the fund to obtain those securities in the event of a default under the repurchase agreement. ACIM monitors, on a daily basis, the securities transferred to ensure the value, including accrued interest, of the securities under each repurchase agreement is equal to or greater than amounts owed to the fund under each repurchase agreement.
Joint Trading Account — Pursuant to an Exemptive Order issued by the Securities and Exchange Commission, the fund, along with certain other funds in the American Century Investments family of funds, may transfer uninvested cash balances into a joint trading account. These balances are invested in one or more repurchase agreements that are collateralized by U.S. Treasury or Agency obligations.
Income Tax Status — It is the fund’s policy to distribute substantially all net investment income and net realized gains to shareholders and to otherwise qualify as a regulated investment company under provisions of the Internal Revenue Code. The fund is no longer subject to examination by tax authorities for years prior to 2006. Additionally, non-U.S. tax returns filed by the fund due to investments in certain foreign securities remain subject to examination by the relevant taxing authority for 7 years from the date of filing. At this time, management believes there are no uncertain tax positions which, based on their technical merit, would not be sustained upon examination and for which it is reasonably possible that the total amounts of unrecognized tax benefits will significantly change in the next twelve months. Accordingly, no provision has been made for federal or state income taxes.
19
Distributions to Shareholders — Distributions to shareholders are recorded on the ex-dividend date. Distributions from net investment income, if any, are generally declared and paid annually. Distributions from net realized gains, if any, are generally declared and paid twice per year. The fund may make distributions on a more frequent basis to comply with the distribution requirements of the Internal Revenue Code, in all events in a manner consistent with provisions of the 1940 Act.
Redemption — The fund may impose a 2.00% redemption fee on shares held less than 60 days. The fee may not be applicable to all classes. The redemption fee is retained by the fund and helps cover transaction costs that long-term investors may bear when the fund sells securities to meet investor redemptions.
Indemnifications — Under the corporation’s organizational documents, its officers and directors are indemnified against certain liabilities arising out of the performance of their duties to the fund. In addition, in the normal course of business, the fund enters into contracts that provide general indemnifications. The maximum exposure under these arrangements is unknown as this would involve future claims that may be made against a fund. The risk of material loss from such claims is considered by management to be remote.
Use of Estimates — The financial statements are prepared in conformity with accounting principles generally accepted in the United States of America, which may require management to make certain estimates and assumptions at the date of the financial statements. Actual results could differ from these estimates.
Subsequent Events — In preparing the financial statements, management evaluated the impact of events or transactions occurring through the date the financial statements were issued that would merit recognition or disclosure.
2. Fees and Transactions with Related Parties
Management Fees — The corporation has entered into a Management Agreement with American Century Global Investment Management, Inc. (ACGIM) (the investment advisor) (see Note 9), under which ACGIM provides the fund with investment advisory and management services in exchange for a single, unified management fee (the fee) per class. The Agreement provides that all expenses of managing and operating the fund, except brokerage expenses, taxes, interest, fees and expenses of the independent directors (including legal counsel fees), and extraordinary expenses, will be paid by ACGIM. The fee is computed and accrued daily based on the daily net assets of the specific class of shares of the fund and paid monthly in arrears. For funds with a stepped fee schedule, the rate of the fee is determined by applying a fee rate calculation formula. This formula takes into account the fund’s assets as well as certain assets, if any, of other clients of the investment advisor outside the American Century Investments family of funds (such as subadvised funds and separate accounts) that have very similar investment teams and investment strategies (strategy assets). The strategy assets of the fund includes the assets of NT International Growth Fund, one fund in a series issued by the corporation. The annual management fee schedule ranges from 1.10% to 1.50% for the Investor Class, A Class, B Class, C Class and R Class. The Institutional Class is 0.20% less at each point within the range. The effective annual management fee for each class for the six months ended May 28, 2010 was 1.34% for the Investor Class, A Class, B Class, C Class and R Class and 1.14% for the Institutional Class.
ACGIM has entered into a Subadvisory Agreement with ACIM (the subadvisor) on behalf of the fund. The subadvisor makes investment decisions for the cash portion of the fund in accordance with the fund’s investment objectives, policies and restrictions under the supervision of ACGIM and the Board of Directors. ACGIM pays all costs associated with retaining ACIM as the subadvisor of the fund.
20
Distribution and Service Fees — The Board of Directors has adopted a separate Master Distribution and Individual Shareholder Services Plan for each of the A Class, B Class, C Class and R Class (collectively the plans), pursuant to Rule 12b-1 of the 1940 Act. The plans provide that the A Class will pay American Century Investment Services, Inc. (ACIS) an annual distribution and service fee of 0.25%. The plans provide that the B Class and the C Class will each pay ACIS an annual distribution fee of 0.75% and service fee of 0.25%. The plans provide that the R Class will pay ACIS an annual distribution and service fee of 0.50%. The fees are computed and accrued daily based on each class’s daily net assets and paid monthly in arrears. The fees are used to pay financial intermediaries for distribution and individual shareh older services. Fees incurred under the plans during the six months ended May 28, 2010, are detailed in the Statement of Operations.
Acquired Fund Fees and Expenses — The fund may invest in mutual funds, exchange traded funds, and business development companies (the acquired funds). The fund will indirectly realize its pro rata share of the fees and expenses of the acquired funds in which it invests. These indirect fees and expenses are not paid out of the fund’s assets but are reflected in the return realized by the fund on its investment in the acquired funds.
Related Parties — Certain officers and directors of the corporation are also officers and/ or directors of American Century Companies, Inc. (ACC), the parent of the corporation’s investment advisor, ACGIM, the corporation’s subadvisor, ACIM, the distributor of the corporation, ACIS, and the corporation’s transfer agent, American Century Services, LLC.
The fund is eligible to invest in a money market fund for temporary purposes, which is managed by J.P. Morgan Investment Management, Inc. (JPMIM). The fund has a Mutual Funds Services Agreement with J.P. Morgan Investor Services Co. (JPMIS) and a securities lending agreement with JPMorgan Chase Bank (JPMCB). JPMCB is a custodian of the fund. JPMIM, JPMIS and JPMCB are wholly owned subsidiaries of JPMorgan Chase & Co. (JPM). JPM is an equity investor in ACC.
3. Investment Transactions
Purchases and sales of investment securities, excluding short-term investments, for the six months ended May 28, 2010, were $1,061,645,253 and $1,068,407,456, respectively.
21
| | | | |
| 4. Capital Share Transactions | | | | |
| |
| Transactions in shares of the fund were as follows: | | |
| | Six months ended May 28, 2010 | Year ended November 30, 2009 |
| | Shares | Amount | Shares | Amount |
| Investor Class/Shares Authorized | 1,000,000,000 | | 1,000,000,000 | |
| Sold | 5,613,219 | $ 54,077,845 | 12,516,913 | $ 96,703,854 |
| Issued in reinvestment of distributions | 1,715,677 | 16,876,303 | 2,043,214 | 15,589,724 |
| Redeemed | (9,505,985) | (87,645,789) | (25,833,107) | (196,779,172) |
| | (2,177,089) | (16,691,641) | (11,272,980) | (84,485,594) |
| Institutional Class/Shares Authorized | 150,000,000 | | 150,000,000 | |
| Sold | 3,703,064 | 33,162,880 | 3,533,605 | 25,915,890 |
| Issued in reinvestment of distributions | 124,940 | 1,229,822 | 88,473 | 675,052 |
| Redeemed | (869,635) | (8,093,721) | (1,961,908) | (14,985,413) |
| | 2,958,369 | 26,298,981 | 1,660,170 | 11,605,529 |
| A Class/Shares Authorized | 125,000,000 | | 125,000,000 | |
| Sold | 2,824,326 | 27,136,842 | 5,639,882 | 42,702,246 |
| Issued in reinvestment of distributions | 128,516 | 1,263,884 | 210,171 | 1,601,500 |
| Redeemed | (2,492,831) | (23,529,749) | (7,312,770) | (56,894,013) |
| | 460,011 | 4,870,977 | (1,462,717) | (12,590,267) |
| B Class/Shares Authorized | 10,000,000 | | 10,000,000 | |
| Sold | 230 | 2,270 | 18,871 | 154,787 |
| Issued in reinvestment of distributions | — | — | 971 | 7,361 |
| Redeemed | (16,841) | (159,868) | (39,492) | (266,327) |
| | (16,611) | (157,598) | (19,650) | (104,179) |
| C Class/Shares Authorized | 10,000,000 | | 10,000,000 | |
| Sold | 13,267 | 127,011 | 36,318 | 302,120 |
| Issued in reinvestment of distributions | — | — | 2,254 | 16,969 |
| Redeemed | (44,947) | (407,617) | (177,382) | (1,285,116) |
| | (31,680) | (280,606) | (138,810) | (966,027) |
| R Class/Shares Authorized | 5,000,000 | | 5,000,000 | |
| Sold | 79,331 | 779,332 | 318,322 | 2,509,562 |
| Issued in reinvestment of distributions | 2,819 | 27,821 | 4,389 | 33,532 |
| Redeemed | (205,037) | (1,993,804) | (146,076) | (1,159,655) |
| | (122,887) | (1,186,651) | 176,635 | 1,383,439 |
| Net increase (decrease) | 1,070,113 | $ 12,853,462 | (11,057,352) | $ (85,157,099) |
22
5. Fair Value Measurements
The fund’s securities valuation process is based on several considerations and may use multiple inputs to determine the fair value of the positions held by the fund. In conformity with accounting principles generally accepted in the United States of America, the inputs used to determine a valuation are classified into three broad levels as follows:
• Level 1 valuation inputs consist of unadjusted quoted prices in an active market for identical securities;
• Level 2 valuation inputs consist of significant direct or indirect observable market data (including quoted prices for similar securities, evaluations of subsequent market events, interest rates, prepayment speeds, credit risk, etc.); or
• Level 3 valuation inputs consist of significant unobservable inputs (including a fund’s own assumptions).
The level classification is based on the lowest level input that is significant to the fair valuation measurement. The valuation inputs are not an indication of the risks associated with investing in these securities or other financial instruments.
The following is a summary of the valuation inputs used to determine the fair value of the fund’s securities as of May 28, 2010. The Schedule of Investments provides additional details on the fund’s portfolio holdings.
| | | |
| | Level 1 | Level 2 | Level 3 |
| Investment Securities | | | |
| Foreign Common Stocks | $56,069,249 | $1,324,255,748 | — |
| Temporary Cash Investments | 38,096 | 3,900,000 | — |
| Total Value of Investment Securities | $56,107,345 | $1,328,155,748 | — |
6. Risk Factors
There are certain risks involved in investing in foreign securities. These risks include those resulting from future adverse political, social, and economic developments, fluctuations in currency exchange rates, the possible imposition of exchange controls, and other foreign laws or restrictions. Investing in emerging markets may accentuate these risks.
7. Interfund Lending
The fund, along with certain other funds in the American Century Investments family of funds, may participate in an interfund lending program, pursuant to an Exemptive Order issued by the Securities and Exchange Commission (SEC). This program provides an alternative credit facility allowing the fund to borrow from or lend to other funds in the American Century Investments family of funds that permit such transactions. Interfund lending transactions are subject to each fund’s investment policies and borrowing and lending limits. The interfund loan rate earned/paid on interfund lending transactions is determined daily based on the average of certain current market rates. Interfund lending transactions normally extend only overnight, but can have a maximum duration of seven days. The program is subject to annual approval by the Board of Directors. During the six months ended May 28, 2010, the fund did not utiliz e the program.
23
8. Federal Tax Information
The book-basis character of distributions made during the year from net investment income or net realized gains may differ from their ultimate characterization for federal income tax purposes. These differences reflect the differing character of certain income items and net realized gains and losses for financial statement and tax purposes, and may result in reclassification among certain capital accounts on the financial statements.
As of May 28, 2010, the components of investments for federal income tax purposes were as follows:
| | |
| Federal tax cost of investments | $1,270,095,337 |
| Gross tax appreciation of investments | $174,244,579 |
| Gross tax depreciation of investments | (60,076,823) |
| Net tax appreciation (depreciation) of investments | $114,167,756 |
The difference between book-basis and tax-basis cost and unrealized appreciation (depreciation) is attributable primarily to the tax deferral of losses on wash sales.
As of November 30, 2009, the fund had accumulated capital losses of $(404,439,509), which represent net capital loss carryovers that may be used to offset future realized capital gains for federal income tax purposes. Future capital loss carryover utilization in any given year may be subject to Internal Revenue Code limitations. Capital loss carryovers of $(131,447,878) and $(272,991,631) expire in 2016 and 2017, respectively.
The fund had a currency loss deferral of $(10,532), which represent net currency losses incurred in the one-month period ended November 30, 2009. The fund has elected to treat such losses as having been incurred in the following fiscal year for federal income tax purposes.
9. Corporate Event
As part of a long-standing estate and business succession plan established by ACC Co-Chairman James E. Stowers, Jr., the founder of American Century Investments, ACC Co-Chairman Richard W. Brown succeeded Mr. Stowers as trustee of a trust that holds a greater-than-25% voting interest in ACC, the parent corporation of the fund’s advisors. Under the 1940 Act, this is presumed to represent control of ACC even though it is less than a majority interest. The change of trustee may technically be considered a “change of control” of ACC and therefore also a change of control of the fund’s advisors even though there has been no change to their management and none is anticipated. The “change of control” resulted in the assignment of the fund’s investment advisory and subadvisory agreements. Under the 1940 Act, an assignment automatically terminated such agreements, making the approval of a new agreement necessary.
On February 16, 2010, the Board of Directors approved interim investment advisory and subadvisory agreements under which the fund will be managed until a new agreement is approved by fund shareholders. The interim agreements are substantially identical to the terminated agreements (with the exception of different effective and termination dates) and will not result in changes in the management of American Century Investments, the fund, its investment objectives, fees or services provided. On March 29, 2010, the Board of Directors approved a new investment advisory agreement. The new agreement is also substantially identical to the terminated agreement (except for the date, the substitution of ACIM for ACGIM and certain other non-material changes). In order to streamline American Century’s corporate organization, ACGIM was merged into ACIM on July 16, 2010. The new agreement for the fund was approved by shareh olders at a Special Meeting of Shareholders on June 16, 2010. The new agreement went into effect on July 16, 2010.
24
| | | | | | | |
| International Growth | | | | | |
| |
| Investor Class | | | | | | |
| For a Share Outstanding Throughout the Years Ended November 30 (except as noted) | | |
| | | 2010(1) | 2009 | 2008 | 2007 | 2006 | 2005 |
| Per-Share Data | | | | | | |
| Net Asset Value, | | | | | | |
| Beginning of Period | $9.75 | $7.15 | $14.87 | $12.17 | $9.75 | $8.79 |
| Income From | | | | | | |
| Investment Operations | | | | | | |
| Net Investment | | | | | | |
| Income (Loss)(2) | 0.06 | 0.09 | 0.14 | 0.13 | 0.06 | 0.11 |
| Net Realized and | | | | | | |
| Unrealized Gain (Loss) | (0.90) | 2.64 | (6.96) | 2.66 | 2.54 | 0.94 |
| Total From | | | | | | |
| Investment Operations | (0.84) | 2.73 | (6.82) | 2.79 | 2.60 | 1.05 |
| Distributions | | | | | | |
| From Net | | | | | | |
| Investment Income | (0.15) | (0.13) | (0.11) | (0.09) | (0.18) | (0.09) |
| From Net Realized Gains | — | — | (0.79) | — | — | — |
| Total Distributions | (0.15) | (0.13) | (0.90) | (0.09) | (0.18) | (0.09) |
| Net Asset Value, | | | | | | |
| End of Period | $8.76 | $9.75 | $7.15 | $14.87 | $12.17 | $9.75 |
| |
| Total Return(3) | (8.76)% | 38.66% | (48.67)% | 23.09% | 27.03% | 12.09% |
| | | | | | | |
| Ratios/Supplemental Data | | | | | | |
| Ratio of Operating | | | | | | |
| Expenses to Average | | | | | | |
| Net Assets | 1.35%(4) | 1.38% | 1.31% | 1.27% | 1.26% | 1.23% |
| Ratio of Net Investment | | | | | | |
| Income (Loss) to | | | | | | |
| Average Net Assets | 1.35%(4) | 1.18% | 1.18% | 0.94% | 0.52% | 1.22% |
| Portfolio Turnover Rate | 71% | 151% | 144% | 133% | 95% | 89% |
| Net Assets, End of Period | | | | | | |
| (in thousands) | $1,129,998 | $1,279,615 | $1,018,753 | $2,267,093 | $2,352,967 | $2,249,430 |
| (1) | Six months ended May 28, 2010 (unaudited). | | | | | |
| (2) | Computed using average shares outstanding throughout the period. | | | | |
| (3) | Total return assumes reinvestment of net investment income and capital gains distributions, if any. Total returns for periods less than one year |
| | are not annualized. Total returns are calculated based on the net asset value of the last business day. The total return of the classes may not |
| | precisely reflect the class expense differences because of the impact of calculating the net asset values to two decimal places. If net asset |
| | values were calculated to three decimal places, the total return differences would more closely reflect the class expense differences. The |
| | calculation of net asset values to two decimal places is made in accordance with SEC guidelines and does not result in any gain or loss of value |
| | between one class and another. | | | | | |
| (4) | Annualized. | | | | | | |
See Notes to Financial Statements.
25
| | | | | | | |
| International Growth | | | | | |
| |
| Institutional Class | | | | | | |
| For a Share Outstanding Throughout the Years Ended November 30 (except as noted) | | |
| | | 2010(1) | 2009 | 2008 | 2007 | 2006 | 2005 |
| Per-Share Data | | | | | | |
| Net Asset Value, | | | | | | |
| Beginning of Period | $9.78 | $7.17 | $14.91 | $12.20 | $9.78 | $8.82 |
| Income From | | | | | | |
| Investment Operations | | | | | | |
| Net Investment | | | | | | |
| Income (Loss)(2) | 0.08 | 0.11 | 0.15 | 0.17 | 0.07 | 0.13 |
| Net Realized and | | | | | | |
| Unrealized Gain (Loss) | (0.92) | 2.64 | (6.96) | 2.66 | 2.55 | 0.94 |
| Total From | | | | | | |
| Investment Operations | (0.84) | 2.75 | (6.81) | 2.83 | 2.62 | 1.07 |
| Distributions | | | | | | |
| From Net | | | | | | |
| Investment Income | (0.19) | (0.14) | (0.14) | (0.12) | (0.20) | (0.11) |
| From Net Realized Gains | — | — | (0.79) | — | — | — |
| Total Distributions | (0.19) | (0.14) | (0.93) | (0.12) | (0.20) | (0.11) |
| Net Asset Value, | | | | | | |
| End of Period | $8.75 | $9.78 | $7.17 | $14.91 | $12.20 | $9.78 |
| |
| Total Return(3) | (8.78)% | 38.96% | (48.55)% | 23.36% | 27.19% | 12.28% |
| | | | | | | |
| Ratios/Supplemental Data | | | | | | |
| Ratio of Operating | | | | | | |
| Expenses to Average | | | | | | |
| Net Assets | 1.15%(4) | 1.18% | 1.11% | 1.07% | 1.06% | 1.03% |
| Ratio of Net Investment | | | | | | |
| Income (Loss) to | | | | | | |
| Average Net Assets | 1.55%(4) | 1.38% | 1.38% | 1.14% | 0.72% | 1.42% |
| Portfolio Turnover Rate | 71% | 151% | 144% | 133% | 95% | 89% |
| Net Assets, End of Period | | | | | | |
| (in thousands) | $85,804 | $66,920 | $37,160 | $80,452 | $125,814 | $247,077 |
| (1) | Six months ended May 28, 2010 (unaudited). | | | | | |
| (2) | Computed using average shares outstanding throughout the period. | | | | |
| (3) | Total return assumes reinvestment of net investment income and capital gains distributions, if any. Total returns for periods less than one year |
| | are not annualized. Total returns are calculated based on the net asset value of the last business day. The total return of the classes may not |
| | precisely reflect the class expense differences because of the impact of calculating the net asset values to two decimal places. If net asset |
| | values were calculated to three decimal places, the total return differences would more closely reflect the class expense differences. The |
| | calculation of net asset values to two decimal places is made in accordance with SEC guidelines and does not result in any gain or loss of value |
| | between one class and another. | | | | | |
| (4) | Annualized. | | | | | | |
See Notes to Financial Statements.
26
| | | | | | | |
| International Growth | | | | | |
| |
| A Class(1) | | | | | | |
| For a Share Outstanding Throughout the Years Ended November 30 (except as noted) | | |
| | | 2010(2) | 2009 | 2008 | 2007 | 2006 | 2005 |
| Per-Share Data | | | | | | |
| Net Asset Value, | | | | | | |
| Beginning of Period | $9.72 | $7.13 | $14.82 | $12.12 | $9.72 | $8.76 |
| Income From | | | | | | |
| Investment Operations | | | | | | |
| Net Investment | | | | | | |
| Income (Loss)(3) | 0.05 | 0.07 | 0.11 | 0.08 | 0.03 | 0.09 |
| Net Realized and | | | | | | |
| Unrealized Gain (Loss) | (0.91) | 2.63 | (6.94) | 2.68 | 2.52 | 0.94 |
| Total From | | | | | | |
| Investment Operations | (0.86) | 2.70 | (6.83) | 2.76 | 2.55 | 1.03 |
| Distributions | | | | | | |
| From Net | | | | | | |
| Investment Income | (0.10) | (0.11) | (0.07) | (0.06) | (0.15) | (0.07) |
| From Net Realized Gains | — | — | (0.79) | — | — | — |
| Total Distributions | (0.10) | (0.11) | (0.86) | (0.06) | (0.15) | (0.07) |
| Net Asset Value, | | | | | | |
| End of Period | $8.76 | $9.72 | $7.13 | $14.82 | $12.12 | $9.72 |
| |
| Total Return(4) | (8.93)% | 38.30% | (48.79)% | 22.87% | 26.57% | 11.85% |
| | | | | | | |
| Ratios/Supplemental Data | | | | | | |
| Ratio of Operating | | | | | | |
| Expenses to Average | | | | | | |
| Net Assets | 1.60%(5) | 1.63% | 1.56% | 1.52% | 1.51% | 1.48% |
| Ratio of Net Investment | | | | | | |
| Income (Loss) to | | | | | | |
| Average Net Assets | 1.10%(5) | 0.93% | 0.93% | 0.69% | 0.27% | 0.97% |
| Portfolio Turnover Rate | 71% | 151% | 144% | 133% | 95% | 89% |
| Net Assets, End of Period | | | | | | |
| (in thousands) | $164,295 | $177,804 | $140,798 | $241,579 | $336,497 | $259,651 |
| (1) | Prior to December 3, 2007, the A Class was referred to as the Advisor Class. | | | |
| (2) | Six months ended May 28, 2010 (unaudited). | | | | | |
| (3) | Computed using average shares outstanding throughout the period. | | | | |
| (4) | Total return assumes reinvestment of net investment income and capital gains distributions, if any, and does not reflect applicable sales charges. |
| | Total returns for periods less than one year are not annualized. Total returns are calculated based on the net asset value of the last business day. |
| | The total return of the classes may not precisely reflect the class expense differences because of the impact of calculating the net asset values |
| | to two decimal places. If net asset values were calculated to three decimal places, the total return differences would more closely reflect the |
| | class expense differences. The calculation of net asset values to two decimal places is made in accordance with SEC guidelines and does not |
| | result in any gain or loss of value between one class and another. | | | | |
| (5) | Annualized. | | | | | | |
See Notes to Financial Statements.
27
| | | | | | | |
| International Growth | | | | | |
| |
| B Class | | | | | | |
| For a Share Outstanding Throughout the Years Ended November 30 (except as noted) | | |
| | | 2010(1) | 2009 | 2008 | 2007 | 2006 | 2005 |
| Per-Share Data | | | | | | |
| Net Asset Value, | | | | | | |
| Beginning of Period | $9.60 | $7.04 | $14.68 | $12.04 | $9.65 | $8.70 |
| Income From | | | | | | |
| Investment Operations | | | | | | |
| Net Investment | | | | | | |
| Income (Loss)(2) | 0.01 | 0.01 | 0.02 | —(3) | (0.05) | 0.02 |
| Net Realized and | | | | | | |
| Unrealized Gain (Loss) | (0.90) | 2.61 | (6.87) | 2.64 | 2.52 | 0.93 |
| Total From | | | | | | |
| Investment Operations | (0.89) | 2.62 | (6.85) | 2.64 | 2.47 | 0.95 |
| Distributions | | | | | | |
| From Net | | | | | | |
| Investment Income | — | (0.06) | — | — | (0.08) | —(3) |
| From Net Realized Gains | — | — | (0.79) | — | — | — |
| Total Distributions | — | (0.06) | (0.79) | — | (0.08) | —(3) |
| Net Asset Value, | | | | | | |
| End of Period | $8.71 | $9.60 | $7.04 | $14.68 | $12.04 | $9.65 |
| |
| Total Return(4) | (9.27)% | 37.36% | (49.18)% | 21.93% | 25.71% | 10.97% |
| | | | | | | |
| Ratios/Supplemental Data | | | | | | |
| Ratio of Operating | | | | | | |
| Expenses to Average | | | | | | |
| Net Assets | 2.35%(5) | 2.38% | 2.31% | 2.27% | 2.26% | 2.23% |
| Ratio of Net Investment | | | | | | |
| Income (Loss) to | | | | | | |
| Average Net Assets | 0.35%(5) | 0.18% | 0.18% | (0.06)% | (0.48)% | 0.22% |
| Portfolio Turnover Rate | 71% | 151% | 144% | 133% | 95% | 89% |
| Net Assets, End of Period | | | | | | |
| (in thousands) | $1,182 | $1,463 | $1,211 | $3,320 | $2,699 | $1,676 |
| (1) | Six months ended May 28, 2010 (unaudited). | | | | | |
| (2) | Computed using average shares outstanding throughout the period. | | | | |
| (3) | Per-share amount was less than $0.005. | | | | | |
| (4) | Total return assumes reinvestment of net investment income and capital gains distributions, if any, and does not reflect applicable sales charges. |
| | Total returns for periods less than one year are not annualized. Total returns are calculated based on the net asset value of the last business day. |
| | The total return of the classes may not precisely reflect the class expense differences because of the impact of calculating the net asset values |
| | to two decimal places. If net asset values were calculated to three decimal places, the total return differences would more closely reflect the |
| | class expense differences. The calculation of net asset values to two decimal places is made in accordance with SEC guidelines and does not |
| | result in any gain or loss of value between one class and another. | | | | |
| (5) | Annualized. | | | | | | |
See Notes to Financial Statements.
28
| | | | | | | |
| International Growth | | | | | |
| |
| C Class | | | | | | |
| For a Share Outstanding Throughout the Years Ended November 30 (except as noted) | | |
| | | 2010(1) | 2009 | 2008 | 2007 | 2006 | 2005 |
| Per-Share Data | | | | | | |
| Net Asset Value, | | | | | | |
| Beginning of Period | $9.54 | $7.00 | $14.60 | $11.97 | $9.60 | $8.66 |
| Income From | | | | | | |
| Investment Operations | | | | | | |
| Net Investment | | | | | | |
| Income (Loss)(2) | 0.01 | 0.01 | 0.02 | —(3) | (0.05) | 0.02 |
| Net Realized and | | | | | | |
| Unrealized Gain (Loss) | (0.89) | 2.59 | (6.83) | 2.63 | 2.50 | 0.92 |
| Total From | | | | | | |
| Investment Operations | (0.88) | 2.60 | (6.81) | 2.63 | 2.45 | 0.94 |
| Distributions | | | | | | |
| From Net | | | | | | |
| Investment Income | — | (0.06) | — | — | (0.08) | —(3) |
| From Net Realized Gains | — | — | (0.79) | — | — | — |
| Total Distributions | — | (0.06) | (0.79) | — | (0.08) | —(3) |
| Net Asset Value, | | | | | | |
| End of Period | $8.66 | $9.54 | $7.00 | $14.60 | $11.97 | $9.60 |
| |
| Total Return(4) | (9.33)% | 37.29% | (49.18)% | 21.97% | 25.64% | 10.91% |
| | | | | | | |
| Ratios/Supplemental Data | | | | | | |
| Ratio of Operating | | | | | | |
| Expenses to Average | | | | | | |
| Net Assets | 2.35%(5) | 2.38% | 2.31% | 2.27% | 2.26% | 2.23% |
| Ratio of Net Investment | | | | | | |
| Income (Loss) to | | | | | | |
| Average Net Assets | 0.35%(5) | 0.18% | 0.18% | (0.06)% | (0.48)% | 0.22% |
| Portfolio Turnover Rate | 71% | 151% | 144% | 133% | 95% | 89% |
| Net Assets, End of Period | | | | | | |
| (in thousands) | $2,495 | $3,051 | $3,210 | $7,318 | $6,250 | $5,246 |
| (1) | Six months ended May 28, 2010 (unaudited). | | | | | |
| (2) | Computed using average shares outstanding throughout the period. | | | | |
| (3) | Per-share amount was less than $0.005. | | | | | |
| (4) | Total return assumes reinvestment of net investment income and capital gains distributions, if any, and does not reflect applicable sales charges. |
| | Total returns for periods less than one year are not annualized. Total returns are calculated based on the net asset value of the last business day. |
| | The total return of the classes may not precisely reflect the class expense differences because of the impact of calculating the net asset values |
| | to two decimal places. If net asset values were calculated to three decimal places, the total return differences would more closely reflect the |
| | class expense differences. The calculation of net asset values to two decimal places is made in accordance with SEC guidelines and does not |
| | result in any gain or loss of value between one class and another. | | | | |
| (5) | Annualized. | | | | | | |
See Notes to Financial Statements.
29
| | | | | | | |
| International Growth | | | | | |
| |
| R Class | | | | | | |
| For a Share Outstanding Throughout the Years Ended November 30 (except as noted) | | |
| | | 2010(1) | 2009 | 2008 | 2007 | 2006 | 2005 |
| Per-Share Data | | | | | | |
| Net Asset Value, | | | | | | |
| Beginning of Period | $9.72 | $7.13 | $14.81 | $12.12 | $9.71 | $8.75 |
| Income From | | | | | | |
| Investment Operations | | | | | | |
| Net Investment | | | | | | |
| Income (Loss)(2) | 0.03 | 0.06 | 0.09 | 0.07 | 0.01 | 0.07 |
| Net Realized and | | | | | | |
| Unrealized Gain (Loss) | (0.90) | 2.62 | (6.96) | 2.65 | 2.53 | 0.94 |
| Total From | | | | | | |
| Investment Operations | (0.87) | 2.68 | (6.87) | 2.72 | 2.54 | 1.01 |
| Distributions | | | | | | |
| From Net | | | | | | |
| Investment Income | (0.05) | (0.09) | (0.02) | (0.03) | (0.13) | (0.05) |
| From Net Realized Gains | — | — | (0.79) | — | — | — |
| Total Distributions | (0.05) | (0.09) | (0.81) | (0.03) | (0.13) | (0.05) |
| Net Asset Value, | | | | | | |
| End of Period | $8.80 | $9.72 | $7.13 | $14.81 | $12.12 | $9.71 |
| |
| Total Return(3) | (8.97)% | 37.97% | (48.92)% | 22.48% | 26.39% | 11.58% |
| | | | | | | |
| Ratios/Supplemental Data | | | | | | |
| Ratio of Operating | | | | | | |
| Expenses to Average | | | | | | |
| Net Assets | 1.85%(4) | 1.88% | 1.81% | 1.77% | 1.76% | 1.69%(5) |
| Ratio of Net Investment | | | | | | |
| Income (Loss) to | | | | | | |
| Average Net Assets | 0.85%(4) | 0.68% | 0.68% | 0.44% | 0.02% | 0.76%(5) |
| Portfolio Turnover Rate | 71% | 151% | 144% | 133% | 95% | 89% |
| Net Assets, End of Period | | | | | | |
| (in thousands) | $3,837 | $5,436 | $2,727 | $4,042 | $2,106 | $1,809 |
| (1) | Six months ended May 28, 2010 (unaudited). | | | | | |
| (2) | Computed using average shares outstanding throughout the period. | | | | |
| (3) | Total return assumes reinvestment of net investment income and capital gains distributions, if any. Total returns for periods less than one year |
| | are not annualized. Total returns are calculated based on the net asset value of the last business day. The total return of the classes may not |
| | precisely reflect the class expense differences because of the impact of calculating the net asset values to two decimal places. If net asset |
| | values were calculated to three decimal places, the total return differences would more closely reflect the class expense differences. The |
| | calculation of net asset values to two decimal places is made in accordance with SEC guidelines and does not result in any gain or loss of value |
| | between one class and another. | | | | | |
| (4) | Annualized. | | | | | | |
| (5) | During the year ended November 30, 2005, the class received a partial reimbursement of its distribution and service fees. Had fees not been |
| | reimbursed, the ratio of operating expenses to average net assets and the ratio of net investment income (loss) to average net assets would have |
| | been 1.73% and 0.72%, respectively. | | | | | |
See Notes to Financial Statements.
30
|
| Board Approval of Management and Subadvisory Agreements |
American Century Global Investment Management, Inc. (“ACGIM” or the “Advisor”) currently serves as investment advisor to the Fund under an interim management agreement (the “Interim Management Agreement”) between the Advisor and the Fund approved by the Fund’s Board of Directors (the “Board”). American Century Investment Management, Inc. (“ACIM” or the “Subadvisor”) currently serves as subadvisor to the Fund under an interim investment subadvisory agreement (the “Interim Subadvisory Agreement” and, together with the Interim Management Agreement, the “Interim Agreements”). The Advisor and the Subadvisor (together, the “Advisors”) previously served as investment advisors to the Fund pursuant to agreements (the “Prior Agreements”) that terminated in accordance with their terms on February 16, 2010, as a result of a change of control of the Advisor’s and the Subadvisor’s parent company, American Century Companies, Inc. (“ACC”). The change in control occurred as the result of a change in the trustee of a trust created by James E. Stowers, Jr., the founder of American Century Investments, which holds shares representing a significant interest in ACC stock. Mr. Stowers previously served as the trustee of the trust. On February 16, 2010, Mr. Richard W. Brown, Co-Chairman of ACC with Mr. Stowers, became the trustee in accordance with the terms of the trust and Mr. Stowers’ long-standing estate and succession plan.
On February 18, 2010, the Board approved the Interim Agreements in accordance with Rule 15a-4 under the Investment Company Act to ensure continued management of the Funds by the Advisor and the Subadvisor after the termination of the Prior Agreements and until shareholder approval of a new management agreement (the “Proposed Agreement”) as required under the Act. The Board approved the Proposed Agreement and recommended its approval to shareholders. Fund shareholders approved the Proposed Agreement at a meeting on June 16, 2010.
Because American Century had indicated its intention to merge ACGIM into ACIM prior to the expiration of the Interim Agreements, the Proposed Agreement is with ACIM as sole investment advisor to the Fund. The Board took into consideration that the combination is being undertaken for reasons of organizational simplification and will eliminate the need for multiple investment management agreements without changing the nature, quality, or extent of services provided to the Fund. The Board noted that the merger was not related to the change of control that necessitated the Interim Agreements and would not result in any change to the personnel managing the Fund.
The Interim Agreements and the Proposed Agreement are substantially identical to the Prior Agreements except for their effective dates, the termination provisions of the Interim Agreements, and the elimination of a subadvisor in the Proposed Agreement. Under the Proposed Agreement, ACIM will provide the same services as provided by ACGIM and ACIM, be subject to the same duties, and receive the same compensation rate as under the Prior Agreements.
31
Basis for Board Approval of Interim Agreements
In considering the approval of the Interim Agreements, Rule 15a-4 requires the Board to approve the contracts within ten business days of the termination of the prior agreements and to determine that the compensation to be received under each interim agreement is no greater than would have been received under the corresponding prior agreement. In connection with the approval, the Board noted that it oversees on a continuous basis and evaluates at its quarterly meetings, directly and through the committees of the Board, the nature and quality of significant services provided by the Advisor and the Subadvisor, the investment performance of the Fund, shareholder services, audit and compliance functions and a variety of other matters relating to the Fund’s operations.
In evaluating the Interim Agreements, the Board, assisted by the advice of its independent legal counsel, considered a number of factors in addition to those required by the rule with no one factor being determinative to its analysis. Among the factors considered by the Board were the circumstances and effect of the change of control, the fact that the Advisor and the Subad-visor will provide the same services and receive the same compensation rate as under the Prior Agreements, and that the change of control did not result in a change of the personnel managing the Fund. Upon completion of its analysis, the Board approved the Interim Agreements, determining that the continued management of the Fund by the Advisor and the Subadvisor was in the best interests of the Fund and Fund shareholders.
Basis for Board Approval of Proposed Agreement
At a meeting held on March 29, 2010, after considering all information presented, the Board approved, and determined to recommend that shareholders approve, the Proposed Agreement. In connection with that approval, the Board requested and reviewed extensive data and information compiled by the Advisor, the Subadvisor, and certain independent providers of evaluation data concerning the Fund and services provided to the Fund. The Board oversees on a continuous basis and evaluates at its quarterly meetings, directly and through the committees of the Board, the nature and quality of significant services provided to the Fund, the investment performance of the Fund, shareholder services, audit and compliance functions and a variety of other matters relating to the Fund’s operations. The information considered and the discussions held at the meetings included, but were not limited to:
• the nature, extent and quality of investment management, shareholder services and other services provided to the Fund;
• the wide range of programs and services provided to the Fund and their shareholders on a routine and non-routine basis;
• the compliance policies, procedures, and regulatory experience of the Advisors;
• data comparing the cost of owning the Fund to the cost of owning similar funds;
32
• the fact that there will be no changes to the fees, services, or personnel who provide such services as compared to the Prior Agreements;
• data comparing the Fund’s performance to appropriate benchmarks and/or a peer group of other mutual funds with similar investment objectives and strategies;
• financial data showing the profitability of the Fund to the Advisors and the overall profitability of the Advisors;
• data comparing services provided and charges to the Fund with those for other non-fund investment management clients of the Advisors; and
• consideration of collateral or “fall-out” benefits derived by the Advisors from the management of the Fund and potential sharing of economies of scale in connection with the management of the Fund.
The Board also considered whether there was any reason for not continuing the existing arrangement with the Advisor. In particular, the Board recognized that shareholders may have invested in the Fund on the strength of the Advisor’s industry standing and reputation and in the expectation that the Advisor will have a continuing role in providing services to the Fund.
The Board considered all of the information provided by the Advisor, the Subadvisor, the independent data providers, and the Board’s independent counsel, and evaluated such information for the Fund. The Board did not identify any single factor as being all-important or controlling, and each Board member may have attributed different levels of importance to different factors. In deciding to approve the Proposed Agreement under the terms ultimately determined by the Board to be appropriate, the Board based its decision on a number of factors, including the following:
Nature, Extent and Quality of Services — Generally. Under the Proposed Agreement, ACIM is responsible for providing or arranging for all services necessary for the operation of the Fund. The Board noted that under the Proposed Agreement, ACIM provides or arranges at its own expense a wide variety of services including:
• constructing and designing the Fund
• portfolio research and security selection
• initial capitalization/funding
• securities trading
• Fund administration
• custody of Fund assets
• daily valuation of the Fund’s portfolio
33
• shareholder servicing and transfer agency, including shareholder
confirmations, recordkeeping and communications
• legal services
• regulatory and portfolio compliance
• financial reporting
• marketing and distribution
The Board noted that many of these services have expanded over time both in terms of quantity and complexity in response to shareholder demands, competition in the industry, changing distribution channels and the changing regulatory environment.
Investment Management Services. The investment management services provided to the Fund are complex and provide Fund shareholders access to professional money management, instant diversification of their investments within an asset class, the opportunity to easily diversify among asset classes, and liquidity. As a part of its general oversight and in evaluating investment performance, the Board expects ACIM to manage the Fund in accordance with its investment objectives and approved strategies. In providing these services, ACIM utilizes teams of investment professionals who require extensive information technology, research, training, compliance and other systems to conduct their business. The Board, directly and through its Fund Performance Review Committee, regularly reviews investment performance information for the Fund, toget her with comparative information for appropriate benchmarks and/or peer groups of similarly-managed funds, over different time horizons. If performance concerns are identified, the Fund receives special reviews until performance improves, during which time the Board discusses with ACIM the reasons for such underperformance and any efforts being undertaken to improve performance.
Shareholder and Other Services. Under the Proposed Agreement, ACIM will also provide the Fund with a comprehensive package of transfer agency, shareholder, and other services. The Board, directly and through the various committees of the Board, regularly reviews reports and evaluations of such services. These reports include, but are not limited to, information regarding the operational efficiency and accuracy of the shareholder and transfer agency services provided, staffing levels, shareholder satisfaction (as measured by external as well as internal sources), technology support, new products and services offered to Fund shareholders, securities trading activities, portfolio valuation services, auditing services, and legal and operational compliance activities. Certain aspects of shareholder and transfer agency service level eff iciency and the quality of securities trading activities are measured by independent third party providers and are presented in comparison to other fund groups not managed by ACIM.
34
Costs of Services Provided and Profitability. The Advisor provided detailed information concerning its cost of providing various services to the Fund, its profitability in managing the Fund, its overall profitability, and its financial condition. The Board reviewed with the Advisor the methodology used to prepare this financial information. The Board has also reviewed with the Advisor its methodology for compensating the investment professionals that provide services to the Fund as well as compensation to the five highest paid personnel of the Advisor. This financial information regarding the Advisor is considered in order to evaluate the Advisor’s financial condition, its ability to continue to provide services under the Proposed Agreement, and the reasonableness of the proposed management fees. The Board concluded that the Advisor’s profits were reasonable in light of the services provided to the Fund.
Ethics. The Board generally considers ACIM’s commitment to providing quality services to shareholders and to conducting its business ethically. It noted that ACIM’s practices generally meet or exceed industry best practices.
Economies of Scale. The Board also reviewed information provided by ACIM regarding the possible existence of economies of scale in connection with the management of the Fund. The Board concluded that economies of scale are difficult to measure and predict with precision, especially on a fund-by-fund basis. The analysis of economies of scale is further complicated by the additional services and content provided by ACIM and its reinvestment in its ability to provide and expand those services. Accordingly, the Board seeks to evaluate economies of scale by reviewing information, such as year-over-year profitability of its advisor generally, the profitability of its management of the Fund specifically, and the expenses incurred by the advisor in providing various functions to the Fund. The Board believes ACIM will appropriately sha re economies of scale through its competitive fee structure, offering competitive fees from fund inception, fee breakpoints as the Fund increases in size, and through reinvestment in its business to provide shareholders additional services and enhancements to existing services.
Comparison to Fees of Funds not Managed by the Advisor. Both the Prior and Proposed Agreements provide that the Fund pays ACGIM or ACIM a single, all-inclusive (or unified) management fee for providing all services necessary for the management and operation of the Fund, other than brokerage expenses, taxes, interest, extraordinary expenses, and the fees and expenses of the Fund’s Independent Directors (including their independent legal counsel) and expenses incurred in connection with the provision of shareholder services and distribution services under a plan adopted pursuant to Rule 12b-1 under the 1940 Act. Under the unified fee structure, ACIM is responsible for providing all investment advisory, custody, audit, administrative, compliance, recordkeeping, marketing and shareholder services, or arranging and supervising third parties that provide such services. By contrast, most other funds are charged a variety of fees, including an investment advisory fee, a transfer agency fee, an administrative fee, distribution charges and other expenses. Other than their investment advisory fees and any applicable Rule 12b-1 distribution fees, the components of the total fees charged by these other funds may be increased without shareholder approval. The Board believes the unified
35
fee structure is a benefit to Fund shareholders because it clearly discloses to shareholders the cost of owning Fund shares, and, since the unified fee cannot be increased without a vote of Fund shareholders, it shifts to ACIM the risk of increased costs of operating the Fund and provides a direct incentive to minimize administrative inefficiencies. Part of the Board’s analysis of fee levels involves reviewing certain evaluative data compiled by an independent provider comparing the Fund’s unified fee to the total expense ratios of similar funds not managed by ACIM. The Board concluded that the management fee to be paid by the Fund to ACIM under the Proposed Agreement is reasonable in light of the services to be provided to the Fund.
Comparison to Fees and Services Provided to Other Clients of the Advisor. The Board also requested and received information from ACIM concerning the nature and extent of the services, fees, and profitability of its advisory services to advisory clients other than the Fund. They observed that these varying types of client accounts require different services and involve different regulatory and entrepreneurial risks than the management of the Fund. The Board analyzed this information and concluded that the fees charged and services provided to the Fund were reasonable by comparison.
Collateral or “Fall-Out” Benefits Derived by the Advisor. The Board considered the existence of collateral benefits ACIM may receive as a result of its relationship with the Fund. The Board concluded that ACIM’s primary business is managing mutual funds and it generally does not use Fund or shareholder information to generate profits in other lines of business, and therefore does not derive any significant collateral benefits from them. The Board noted that ACIM receives proprietary research from broker-dealers that execute Fund portfolio transactions and concluded that this research is likely to benefit Fund shareholders. The Board also determined that ACIM is able to provide investment management services to certain clients other than the Fund, at least in part, due to its existing infrastructure built to serv e the fund complex. The Board concluded, however, that the assets of those other clients are not material to the analysis and, in any event, are included with the assets of fund clients to determine breakpoints in each fund’s fee schedule, provided they are managed using the same investment team and strategy.
Conclusion of the Board. As a result of this process, the Board, in the absence of particular circumstances and assisted by the advice of its independent legal counsel, taking into account all of the factors discussed above and the information provided by ACIM and others, concluded that the Proposed Agreement be approved and recommended its approval to Fund shareholders.
36
Retirement Account Information
As required by law, distributions you receive from certain IRAs, or 403(b), 457 and qualified plans are subject to federal income tax withholding, unless you elect not to have withholding apply. Tax will be withheld on the total amount withdrawn even though you may be receiving amounts that are not subject to withholding, such as nondeductible contributions. In such case, excess amounts of withholding could occur. You may adjust your withholding election so that a greater or lesser amount will be withheld.
If you don’t want us to withhold on this amount, you must notify us to not withhold the federal income tax. You may notify us in writing or in certain situations by telephone or through other electronic means. You have the right to revoke your withholding election at any time and any election you make may remain in effect until revoked by filing a new election.
Remember, even if you elect not to have income tax withheld, you are liable for paying income tax on the taxable portion of your withdrawal. If you elect not to have income tax withheld or you don’t have enough income tax withheld, you may be responsible for payment of estimated tax. You may incur penalties under the estimated tax rules if your withholding and estimated tax payments are not sufficient. You can reduce or defer the income tax on a distribution by directly or indirectly rolling such distribution over to another IRA or eligible plan. You should consult your tax advisor for additional information.
State tax will be withheld if, at the time of your distribution, your address is within one of the mandatory withholding states and you have federal income tax withheld. State taxes will be withheld from your distribution in accordance with the respective state rules.
Proxy Voting Guidelines
American Century Investment Management, Inc., the fund’s investment advisor, is responsible for exercising the voting rights associated with the securities purchased and/or held by the fund. A description of the policies and procedures the advisor uses in fulfilling this responsibility is available without charge, upon request, by calling 1-800-345-2021. It is also available on American Century Investments’ website at americancentury.com and on the Securities and Exchange Commission’s website at sec.gov. Information regarding how the investment advisor voted proxies relating to portfolio securities during the most recent 12-month period ended June 30 is available on the “About Us” page at americancentury.com. It is also available at sec.gov.
Quarterly Portfolio Disclosure
The fund files its complete schedule of portfolio holdings with the Securities and Exchange Commission (SEC) for the first and third quarters of each fiscal year on Form N-Q. The fund’s Forms N-Q are available on the SEC’s website at sec.gov, and may be reviewed and copied at the SEC’s Public Reference Room in Washington, DC. Information on the operation of the Public Reference Room may be obtained by calling 1-800-SEC-0330. The fund also makes its complete schedule of portfolio holdings for the most recent quarter of its fiscal year available on its website at americancentury.com and, upon request, by calling 1-800-345-2021.
37
The following indices are used to illustrate investment market, sector, or style performance or to serve as fund performance comparisons. They are not investment products available for purchase.
Morgan Stanley Capital International (MSCI) has developed several indices that measure the performance of foreign stock markets.
The MSCI EAFE (Europe, Australasia, Far East) Index is designed to measure developed market equity performance, excluding the U.S. and Canada.
The MSCI EAFE Growth Index is a capitalization-weighted index that monitors the performance of growth stocks from Europe, Australasia, and the Far East.
The MSCI EAFE Value Index is a capitalization-weighted index that monitors the performance of value stocks from Europe, Australasia, and the Far East.
The MSCI EM (Emerging Markets) Index represents the performance of stocks in global emerging market countries.
The MSCI Europe Index is designed to measure equity market performance in Europe.
The MSCI Japan Index is designed to measure equity market performance in Japan.
The MSCI World Free Index represents the performance of stocks in developed countries (including the United States) that are available for purchase by global investors.
38
39
40

| |
| |
| Contact Us | |
| americancentury.com | |
| Automated Information Line | 1-800-345-8765 |
| Investor Services Representative | 1-800-345-2021 or |
| | 816-531-5575 |
| Investors Using Advisors | 1-800-378-9878 |
| Business, Not-For-Profit, Employer-Sponsored | |
| Retirement Plans | 1-800-345-3533 |
| Banks and Trust Companies, Broker-Dealers, | |
| Financial Professionals, Insurance Companies | 1-800-345-6488 |
| Telecommunications Device for the Deaf | 1-800-634-4113 |
| American Century World Mutual Funds, Inc. | |
| Investment Advisor: | |
| American Century Investment Management, Inc. | |
| Kansas City, Missouri | |
This report and the statements it contains are submitted for the general
information of our shareholders. The report is not authorized for distribution to
prospective investors unless preceded or accompanied by an effective prospectus.
American Century Investment Services, Inc., Distributor
©2010 American Century Proprietary Holdings, Inc. All rights reserved.
1007
CL-SAN-68670
|
| Semiannual Report |
| May 28, 2010 |

|
| American Century Investments® |
Global Growth Fund
| |
| President’s Letter | 2 |
| Independent Chairman’s Letter | 3 |
| Market Perspective | 4 |
| International Equity Total Returns | 4 |
| |
| Global Growth | |
| |
| Performance | 5 |
| Portfolio Commentary | 7 |
| Top Ten Holdings | 9 |
| Types of Investments in Portfolio | 9 |
| Investments by Country | 9 |
| |
| Shareholder Fee Example | 10 |
| |
| Financial Statements | |
| |
| Schedule of Investments | 12 |
| Statement of Assets and Liabilities | 14 |
| Statement of Operations | 15 |
| Statement of Changes in Net Assets | 16 |
| Notes to Financial Statements | 17 |
| Financial Highlights | 23 |
| |
| Other Information | |
| |
| Board Approval of Management and Subadvisory Agreements | 29 |
| Additional Information | 35 |
| Index Definitions | 36 |
Any opinions expressed in this report reflect those of the author as of the date of the report, and do not necessarily represent the opinions of American Century Investments or any other person in the American Century Investments organization. Any such opinions are subject to change at any time based upon market or other conditions and American Century Investments disclaims any responsibility to update such opinions. These opinions may not be relied upon as investment advice and, because investment decisions made by American Century Investments funds are based on numerous factors, may not be relied upon as an indication of trading intent on behalf of any American Century Investments fund. Security examples are used for representational purposes only and are not intended as recommendations to purchase or sell securities. Performance information for comparative indices and securities is provided to American Century Investments by third party vendors. To the best of American Century Investments’ knowledge, such information is accurate at the time of printing.

Dear Investor:
To learn more about the capital markets, your investment, and the portfolio management strategies American Century Investments provides, we encourage you to review this shareholder report for the financial reporting period ended May 28, 2010.
On the following pages, you will find investment performance and portfolio information, presented with the expert perspective and commentary of our portfolio management team. This report remains one of our most important vehicles for conveying the information you need about your investment performance, and about the market factors and strategies that affect fund returns. For additional information on the markets, we encourage you to visit the “Insights & News” tab at our Web site, americancentury.com, for updates and further expert commentary.
The top of our Web site’s home page also provides a link to “Our Story,” which, first and foremost, outlines our commitment—since 1958—to helping clients reach their financial goals. We believe strongly that we will only be successful when our clients are successful. That’s who we are.
Another important, unique facet of our story and who we are is “Profits with a Purpose,” which describes our bond with the Stowers Institute for Medical Research (SIMR). SIMR is a world-class biomedical organization—founded by our company founder James E. Stowers, Jr. and his wife Virginia—that is dedicated to researching the causes, treatment, and prevention of gene-based diseases, including cancer. Through American Century Investments’ private ownership structure, more than 40% of our profits support SIMR.
Mr. Stowers’ example of achieving financial success and using that platform to help humanity motivates our entire American Century Investments team. His story inspires us to help each of our clients achieve success. Thank you for sharing your financial journey with us.
Sincerely,

Jonathan Thomas
President and Chief Executive Officer
American Century Investments
2
|
| Independent Chairman’s Letter |

Fellow Shareholders,
The principal event at a recent board meeting was the retirement of Jim Stowers, Jr. from the American Century Mutual Funds Kansas City board. This was one of those times when you felt like you were living a historical moment. Jim—who celebrated his 86th birthday in January—founded what was known as Twentieth Century Mutual Funds over 50 years ago. Through the years, his number one priority has been to “Put Investors First!” The board presented Jim with a resolution acknowledging that, by building a successful investment company, he has impacted the lives of many by helping them on the path to financial success.
We respect Jim’s decision to focus his energy on the Stowers Institute for Medical Research and American Century Companies, Inc. (ACC), the parent company of the funds’ investment advisor. The pioneering medical research that Jim and his wife Virginia have made possible through the Institute should enrich the lives of millions in the future.
Shortly after his retirement from the board, we received word that ACC’s co-chairman Richard W. Brown had succeeded Jim as trustee of a trust that holds a significant interest in ACC stock as a part of Jim’s long-standing estate and business succession plan. While holding less than a majority interest, the trust is presumed to control the funds’ investment advisors under the Investment Company Act of 1940. This change triggered the need for a shareholder proxy to approve new management and subadvisory agreements for the funds. I am happy to report that all of the proposals contained in the proxy received the necessary votes and were approved.
On behalf of the board, I want to once again thank Jim for his mutual fund board service. More than three years ago, Jim and Richard Brown installed a strong and effective leadership team at American Century Investments and I look forward to continuing to work with them on behalf of fund shareholders. And while Jim no longer sits on the fund board, the inherent optimism captured by his favorite catch phrase—“The best is yet to be”—still resonates with all of us who have the privilege of serving you. I invite you to send your comments, questions or concerns to me at dhpratt@fundboardchair.com.
3

By Mark Kopinski, Chief Investment Officer, Global and Non-U.S. Equity
Events in May Sent Stocks Tumbling
Global stock returns generally remained robust for the first several months of the period, as the rally unleashed in March 2009 continued into 2010. Optimism regarding the global economic recovery and business sector gains helped keep stocks in positive territory.
Nevertheless, as spring set in, the global stock market rally ended abruptly, starting with the May 6 “Flash Crash” in the U.S. stock market, when the major indices plunged nearly 7% within 15 minutes. Furthermore, problems that had been percolating in Europe and in the global geopolitical arena boiled over in May, triggering a sharp stock market selloff. In particular, the expanding European government debt crisis beyond Greece, the downgrade of Spain’s credit rating, the worsening oil disaster in the Gulf of Mexico, and escalating tensions in the Middle East rattled investors’ nerves.
Overall, developed international equity markets significantly under-performed the U.S. market and the emerging markets. European stocks suffered the largest losses for the six-month period, as the mounting debt crisis worried investors. Exploding debt in Greece, Italy, Spain, Ireland, and Portugal all came under scrutiny.
Debt Remained the Roadblock to Growth
The sovereign debt problem did not just happen as a result of the recent financial crisis or recession; it is a longer-term issue. Recent events only exacerbated the problem and accelerated its becoming a crisis.
In fact, sovereign solvency has emerged as one of the most significant roadblocks to growth. Currently, the market is focused on Europe, where severe austerity measures are required to get fiscal balances back in order. This is likely to trim 0.5% from European growth during the next year. The weaker euro should help offset some of the decline in growth, but the more export-oriented northern countries will be the main beneficiaries. Commodity-based countries, such as Australia and Norway, have been the most resilient and have seen more impressive economic recoveries. The debt crisis likely will mean European interest rates will remain accommodative for the remainder of 2010.
| | | | |
| International Equity Total Returns | | | | |
| For the six months ended May 28, 2010* (in U.S. dollars) | |
| MSCI EAFE Index | -10.90% | | MSCI Europe Index | -14.77% |
| MSCI EAFE Growth Index | -8.85% | | MSCI World Free Index | -4.92% |
| MSCI EAFE Value Index | -12.95% | | MSCI Japan Index | 0.10% |
| MSCI EM Index | -2.75% | | *Total returns for periods less than one year are not annualized and are |
| | | | based on the period beginning December 1, 2009. | |
4
| | | | | | | | |
| Global Growth | | | | | | | |
| |
| Total Returns as of May 28, 2010 | | | | | |
| | | | | | Average Annual Returns | |
| | | Ticker | | | | | Since | Inception |
| | | Symbol | 6 months(1) | 1 year(2) | 5 years(2) | 10 years(2) | Inception | Date |
| Investor Class | TWGGX | -5.60% | 14.34% | 3.31% | 0.70% | 6.47% | 12/1/98 |
| MSCI World Free Index | — | -4.92% | 13.65% | 0.94% | -0.35% | 1.54%(3) | — |
| Institutional Class | AGGIX | -5.66% | 14.48% | 3.51% | — | 0.39% | 8/1/00 |
| A Class(4) | AGGRX | | | | | | 2/5/99 |
| No sales charge* | | -5.78% | 13.99% | 3.04% | 0.44% | 5.29% | |
| With sales charge* | | -11.22% | 7.38% | 1.83% | -0.14% | 4.74% | |
| B Class | ACWBX | | | | | | 12/1/05 |
| No sales charge* | | -6.13% | 13.16% | — | — | -0.66% | |
| With sales charge* | | -11.13% | 9.16% | — | — | -1.12% | |
| C Class | AGLCX | | | | | | 3/1/02 |
| No sales charge* | | -6.19% | 13.10% | 2.27% | — | 3.97% | |
| With sales charge* | | -7.13% | 13.10% | 2.27% | — | 3.97% | |
| R Class | AGORX | -5.87% | 13.70% | — | — | 1.36% | 7/29/05 |
| * Sales charges include initial sales charges and contingent deferred sales charges (CDSCs), as applicable. A Class shares have a 5.75% |
| maximum initial sales charge for equity funds and may be subject to a maximum CDSC of 1.00%. B Class shares redeemed within six |
| years of purchase are subject to a CDSC that declines from 5.00% during the first year after purchase to 0.00% the sixth year after |
| purchase. C Class shares redeemed within 12 months of purchase are subject to a maximum CDSC of 1.00%. The SEC requires that |
| mutual funds provide performance information net of maximum sales charges in all cases where charges could be applied. |
| |
| (1) | Total returns for periods less than one year are not annualized and are based on the period beginning December 1, 2009. | |
| (2) | Total returns are based on the periods beginning June 1, 2009 for the 1 year returns, June 1, 2005 for the 5 year returns and June 1, 2000 for |
| | the 10 year returns. | | | | | | | |
| (3) | Total return from 11/30/98, the date nearest the Investor Class’s inception for which data are available, through 5/31/10, the date nearest the |
| | report date for which data are available. | | | | | | |
| (4) | Prior to September 4, 2007, the A Class was referred to as the Advisor Class and did not have a front-end sales charge. Performance prior to that |
| | date has been adjusted to reflect this charge. | | | | | | |
Data presented reflect past performance. Past performance is no guarantee of future results. Current performance may be higher or lower than the performance shown. Investment return and principal value will fluctuate, and redemption value may be more or less than original cost. To obtain performance data current to the most recent month end, please call 1-800-345-2021 or visit americancentury.com. International investing involves special risks, such as political instability and currency fluctuations. Investing in emerging markets may accentuate these risks.
Unless otherwise indicated, performance reflects Investor Class shares; performance for other share classes will vary due to differences in fee structure. For information about other share classes available, please consult the prospectus. Data assumes reinvestment of dividends and capital gains, and none of the charts reflect the deduction of taxes that a shareholder would pay on fund distributions or the redemption of fund shares. Returns for the index are provided for comparison. The fund’s total returns include operating expenses (such as transaction costs and management fees) that reduce returns, while the total returns of the index do not.
5
Global Growth
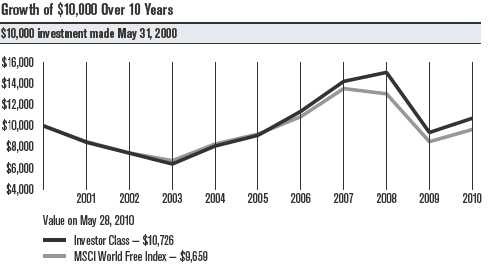
| | | | | |
| Total Annual Fund Operating Expenses | | | |
| | Institutional | | | | |
| Investor Class | Class | A Class | B Class | C Class | R Class |
| 1.22% | 1.02% | 1.47% | 2.22% | 2.22% | 1.72% |
The total annual fund operating expenses shown is as stated in the fund’s prospectus current as of the date of this report. The prospectus may vary from the expense ratio shown elsewhere in this report because it is based on a different time period, includes acquired fund fees and expenses, and, if applicable, does not include fee waivers or expense reimbursements.
Data presented reflect past performance. Past performance is no guarantee of future results. Current performance may be higher or lower than the performance shown. Investment return and principal value will fluctuate, and redemption value may be more or less than original cost. To obtain performance data current to the most recent month end, please call 1-800-345-2021 or visit americancentury.com. International investing involves special risks, such as political instability and currency fluctuations. Investing in emerging markets may accentuate these risks.
Unless otherwise indicated, performance reflects Investor Class shares; performance for other share classes will vary due to differences in fee structure. For information about other share classes available, please consult the prospectus. Data assumes reinvestment of dividends and capital gains, and none of the charts reflect the deduction of taxes that a shareholder would pay on fund distributions or the redemption of fund shares. Returns for the index are provided for comparison. The fund’s total returns include operating expenses (such as transaction costs and management fees) that reduce returns, while the total returns of the index do not.
6
Global Growth
Portfolio Managers: Keith Creveling and Brent Puff
Performance Summary
The Global Growth portfolio returned -5.60%* for the six months ended May 28, 2010, compared with its benchmark, the MSCI World Free Index, which returned -4.92%.
Investor confidence generally remained upbeat for the first four months of the period, as the global economic recovery appeared to gain momentum and stock prices continued to climb. But, late in the period, mounting concerns about the massive levels of sovereign debt in Greece, Spain, and other European nations put an end to the yearlong global stock market rally. Stock prices plunged, wiping out the gains achieved earlier in the period. International growth stocks fared slightly better than their value counterparts, while small-cap stocks outperformed large-cap stocks. Meanwhile, the euro tumbled sharply relative to the U.S. dollar, which added to the woes of foreign-based corporations.
Overall, the impact of currency exchange rates accounted for the bulk of the portfolio’s relative underperformance. Stock selection and sector allocations generally had a favorable impact on performance, but not enough to offset the impact of a strong U.S. dollar on foreign stock holdings.
Brazil Led Detractors; France Was Top Contributor
From a geographical perspective, our out-of-benchmark position in Brazil detracted the most from relative performance. In particular, Petroleo Brasileiro, Brazil’s state-run oil company, dragged down results, as investor uncertainty about a major capitalization plan involving the company and the Brazilian government weighed on the stock. While stock selection and an overweight position were positive factors in Switzerland, currency was a negative influence that landed the country among the largest detractors. Also, the portfolio was not invested in Canada, which hurt results compared with the benchmark.
On a relative basis, France led all country contributors in the fund, due to stock selection and an underweighted position, followed by a portfolio-only position in South Korea and an underweighted position in Italy. Our position in South Korea’s Hyundai Motor Co. was among the portfolio’s top-performing holdings. In the challenging economic environment, consumers “traded down” for value, and Hyundai’s line of affordable cars benefited. Backed by a savvy, yet frugal, marketing strategy, the company continued to gain market share in a difficult climate for automakers.
Financials Stocks Lagged
Stock selection led to lagging results in the portfolio’s financials sector. In particular, our overweighted position in Spain’s Banco Santander, a financial company operating in Europe, Latin America, and the United States,
|
| *All fund returns referenced in this commentary are for Investor Class shares. Total returns for periods less than one year are not annualized and are |
| based on the period beginning December 1, 2009. |
7
Global Growth
represented the portfolio’s weakest holding. The company’s stock faltered on fallout from Spain’s mounting financial and sovereign debt crisis, high unemployment, and extended economic downturn.
The portfolio’s materials and consumer discretionary sectors also were among the weakest performers. In materials, stock selection in the chemicals industry drove down results, while stock selection in the specialty retail segment hurt overall performance in the consumer discretionary sector.
Industrials Led All Sectors
Stock selection combined with an overweighted position pushed the portfolio’s industrials sector into the top-performing spot for the six-month period. U.S.-based Danaher Corp., a diversified equipment and machinery manufacturer, was the sector’s leading stock, advancing on better-than-expected earnings.
Despite overall underperformance from the information technology sector, which finished the period as the portfolio’s largest sector weighting, our overweighted position in U.S.-based Apple, Inc. represented the top contributor. Stock in the personal computer and electronic device manufacturer continued to climb during the period on strong sales of the iPhone, iPod, and iPad.
Outlook
Global economic activity is improving, but significant headwinds remain—namely, the explosion of sovereign debt in developed nations. So far, government responses to the crisis have varied, and this lack of coordination may lead to divergent economic performance in the year ahead. We expect further volatility throughout the international stock markets, yet we will continue to focus on finding companies located in developed countries around the world, including the United States, with sustainable growth characteristics and promising long-term outlooks.
8
| |
| Global Growth | |
| |
| Top Ten Holdings | |
| | % of net assets |
| | as of 5/28/10 |
| Apple, Inc. | 3.5% |
| BHP Billiton Ltd.(1) | 3.0% |
| Cisco Systems, Inc. | 2.5% |
| American Express Co. | 2.4% |
| EMC Corp. | 2.4% |
| United Parcel Service, Inc., Class B | 2.4% |
| Union Pacific Corp. | 2.3% |
| Danaher Corp. | 2.3% |
| Schlumberger Ltd. | 2.2% |
| Occidental Petroleum Corp. | 2.2% |
| (1) Includes shares traded on all exchanges. | |
| |
| Types of Investments in Portfolio | |
| | % of net assets |
| | as of 5/28/10 |
| Domestic Common Stocks | 54.8% |
| Foreign Common Stocks(2) | 44.9% |
| Total Equity Exposure | 99.7% |
| Other Assets and Liabilities | 0.3% |
| (2) Includes depositary shares, dual listed securities and foreign ordinary shares. | |
| |
| Investments by Country | |
| | % of net assets |
| | as of 5/28/10 |
| United States | 54.8% |
| United Kingdom | 9.9% |
| Switzerland | 9.8% |
| Japan | 6.5% |
| France | 3.0% |
| Australia | 3.0% |
| Other Countries | 12.7% |
| Other Assets and Liabilities | 0.3% |
9
|
| Shareholder Fee Example (Unaudited) |
Fund shareholders may incur two types of costs: (1) transaction costs, including sales charges (loads) on purchase payments and redemption/ exchange fees; and (2) ongoing costs, including management fees; distribution and service (12b-1) fees; and other fund expenses. This example is intended to help you understand your ongoing costs (in dollars) of investing in your fund and to compare these costs with the ongoing cost of investing in other mutual funds.
The example is based on an investment of $1,000 made at the beginning of the period and held for the entire period from December 1, 2009 to May 28, 2010.
Actual Expenses
The table provides information about actual account values and actual expenses for each class. You may use the information, together with the amount you invested, to estimate the expenses that you paid over the period. First, identify the share class you own. Then simply divide your account value by $1,000 (for example, an $8,600 account value divided by $1,000 = 8.6), then multiply the result by the number under the heading “Expenses Paid During Period” to estimate the expenses you paid on your account during this period.
If you hold Investor Class shares of any American Century Investments fund, or Institutional Class shares of the American Century Diversified Bond Fund, in an American Century Investments account (i.e., not a financial intermediary or retirement plan account), American Century Investments may charge you a $12.50 semiannual account maintenance fee if the value of those shares is less than $10,000. We will redeem shares automatically in one of your accounts to pay the $12.50 fee. In determining your total eligible investment amount, we will include your investments in all personal accounts (including American Century Investments Brokerage accounts) registered under your Social Security number. Personal accounts include individual accounts, joint accounts, UGMA/UTMA accounts, personal trusts, Coverdell Education Savings Accounts and IRAs (including traditional, Roth, Rollover, SEP-, SARSEP- and SIMPLE-IRAs), and certain other retirement accounts. If you have only business, business retirement, employer-sponsored or American Century Investments Brokerage accounts, you are currently not subject to this fee. We will not charge the fee as long as you choose to manage your accounts exclusively online. If you are subject to the Account Maintenance Fee, your account value could be reduced by the fee amount.
Hypothetical Example for Comparison Purposes
The table also provides information about hypothetical account values and hypothetical expenses based on the actual expense ratio of each class of your fund and an assumed rate of return of 5% per year before expenses, which is not the actual return of a fund’s share class. The hypothetical account values and expenses may not be used to estimate the actual ending account balance or expenses you paid for the period. You may use this information
10
to compare the ongoing costs of investing in your fund and other funds. To do so, compare this 5% hypothetical example with the 5% hypothetical examples that appear in the shareholder reports of the other funds.
Please note that the expenses shown in the table are meant to highlight your ongoing costs only and do not reflect any transactional costs, such as sales charges (loads) or redemption/exchange fees. Therefore, the table is useful in comparing ongoing costs only, and will not help you determine the relative total costs of owning different funds. In addition, if these transactional costs were included, your costs would have been higher.
| | | | |
| | Beginning | Ending | Expenses Paid | |
| | Account Value | Account Value | During Period* | Annualized |
| | 12/1/09 | 5/28/10 | 12/1/09 - 5/28/10 | Expense Ratio* |
| Actual | | | | |
| Investor Class | $1,000 | $944.00 | $5.53 | 1.16% |
| Institutional Class | $1,000 | $943.40 | $4.57 | 0.96% |
| A Class | $1,000 | $942.20 | $6.71 | 1.41% |
| B Class | $1,000 | $938.70 | $10.27 | 2.16% |
| C Class | $1,000 | $938.10 | $10.27 | 2.16% |
| R Class | $1,000 | $941.30 | $7.90 | 1.66% |
| Hypothetical | | | | |
| Investor Class | $1,000 | $1,018.83 | $5.74 | 1.16% |
| Institutional Class | $1,000 | $1,019.81 | $4.75 | 0.96% |
| A Class | $1,000 | $1,017.61 | $6.98 | 1.41% |
| B Class | $1,000 | $1,013.93 | $10.67 | 2.16% |
| C Class | $1,000 | $1,013.93 | $10.67 | 2.16% |
| R Class | $1,000 | $1,016.38 | $8.21 | 1.66% |
|
| *Expenses are equal to the class’s annualized expense ratio listed in the table above, multiplied by the average account value over the period, |
| multiplied by 179, the number of days in the most recent fiscal half-year, divided by 365, to reflect the one-half year period. |
11
| | | | | | |
| Global Growth | | | | | | |
| |
| MAY 28, 2010 (UNAUDITED) | | | | | | |
| | Shares | Value | | | Shares | Value |
| Common Stocks — 99.7% | | | Nidec Corp. | 43,900 | $ 3,991,853 |
| AUSTRALIA — 3.0% | | | | ORIX Corp. | 58,580 | 4,475,261 |
| BHP Billiton Ltd. | 295,170 | $ 9,587,943 | | Rakuten, Inc. | 8,822 | 6,174,575 |
| BHP Billiton Ltd. ADR | 33,990 | 2,203,912 | | SMC Corp. | 26,600 | 3,402,697 |
| | | 11,791,855 | | | | 25,677,096 |
| BRAZIL — 1.6% | | | | NETHERLANDS — 1.2% | | |
| | | | | ASML Holding NV | | |
| Banco Santander Brasil | | | | New York Shares | 169,210 | 4,781,875 |
| SA ADR | 390,170 | 4,065,571 | | | | |
| Itau Unibanco | | | | PEOPLE’S REPUBLIC OF CHINA — 0.9% | |
| Holding SA ADR | 113,280 | 2,085,485 | | Baidu, Inc. ADR(1) | 17,880 | 1,308,995 |
| | | 6,151,056 | | Ctrip.com International | | |
| | | | | Ltd. ADR(1) | 51,470 | 2,027,403 |
| FRANCE — 3.0% | | | | | | |
| Accor SA(1) | 74,560 | 3,513,518 | | | | 3,336,398 |
| Cie Generale d’Optique | | | | POLAND — 0.9% | | |
| Essilor International SA | 42,290 | 2,405,689 | | Powszechna Kasa | | |
| LVMH Moet Hennessy Louis | | | | Oszczednosci Bank Polski SA | 282,110 | 3,442,822 |
| Vuitton SA | 29,890 | 3,138,242 | | SOUTH KOREA — 1.4% | | |
| Pernod-Ricard SA | 36,587 | 2,743,708 | | Hyundai Motor Co. | 47,820 | 5,457,427 |
| | | 11,801,157 | | SWEDEN — 1.0% | | |
| GERMANY — 1.3% | | | | Atlas Copco AB A Shares | 266,890 | 3,775,108 |
| Bayerische Motoren | | | | SWITZERLAND — 9.8% | | |
| Werke AG | 65,650 | 3,024,353 | | ABB Ltd.(1) | 187,070 | 3,191,113 |
| Fresenius Medical Care | | | | Adecco SA | 125,250 | 6,050,098 |
| AG & Co. KGaA | 41,360 | 2,060,773 | | Credit Suisse Group AG | 127,030 | 4,924,527 |
| | | 5,085,126 | | Holcim Ltd. | 56,610 | 3,567,803 |
| HONG KONG — 0.7% | | | | Nestle SA | 130,310 | 5,882,853 |
| CNOOC Ltd. | 1,688,000 | 2,642,322 | | Novartis AG | 43,530 | 1,970,855 |
| Li & Fung Ltd. | 36,000 | 159,806 | | Roche Holding AG | 14,400 | 1,974,487 |
| | | 2,802,128 | | Sonova Holding AG | 19,180 | 2,064,047 |
| INDIA — 1.1% | | | | Swatch Group AG (The) | 22,890 | 5,952,617 |
| HDFC Bank Ltd. | 24,690 | 1,004,953 | | Xstrata plc | 211,420 | 3,090,034 |
| HDFC Bank Ltd. ADR | 6,030 | 838,170 | | | | 38,668,434 |
| Infosys Technologies | | | | TAIWAN (REPUBLIC OF CHINA) — 0.2% | |
| Ltd. ADR | 42,800 | 2,462,284 | | | | |
| | | | | Wistron Corp. | 495,518 | 810,706 |
| | | 4,305,407 | | | | |
| | | | | UNITED KINGDOM — 9.9% | | |
| INDONESIA — 0.6% | | | | | | |
| | | | | Admiral Group plc | 194,900 | 3,623,024 |
| PT Bank Mandiri | | | | | | |
| (Persero) Tbk | 4,098,500 | 2,259,183 | | Antofagasta plc | 194,780 | 2,479,917 |
| ISRAEL — 0.6% | | | | ARM Holdings plc | 476,870 | 1,702,646 |
| Teva Pharmaceutical | | | | Barclays plc | 1,563,850 | 6,822,979 |
| Industries Ltd. ADR | 39,940 | 2,189,511 | | BG Group plc | 358,240 | 5,483,413 |
| ITALY — 1.2% | | | | Compass Group plc | 1,004,340 | 7,756,502 |
| Saipem SpA | 155,330 | 4,817,409 | | HSBC Holdings plc | 379,600 | 3,442,147 |
| JAPAN — 6.5% | | | | Petrofac Ltd. | 85,720 | 1,391,157 |
| Canon, Inc. | 62,400 | 2,556,159 | | Reckitt Benckiser Group plc | 135,725 | 6,356,729 |
| Komatsu Ltd. | 270,200 | 5,076,551 | | | | 39,058,514 |
12
| | | | | | |
| Global Growth | | | | | | |
| |
| | Shares | Value | | | Shares | Value |
| UNITED STATES — 54.8% | | | | priceline.com, Inc.(1) | 6,980 | $ 1,334,297 |
| 3M Co. | 35,270 | $ 2,797,264 | | Schlumberger Ltd. | 156,010 | 8,759,961 |
| Air Products | | | | Southwestern Energy Co.(1) | 55,555 | 2,089,424 |
| & Chemicals, Inc. | 81,530 | 5,630,462 | | SYSCO Corp. | 255,140 | 7,605,723 |
| Allergan, Inc. | 85,030 | 5,117,956 | | Union Pacific Corp. | 128,000 | 9,143,040 |
| Amazon.com, Inc.(1) | 32,410 | 4,066,159 | | United Parcel Service, Inc., | | |
| American Express Co. | 240,670 | 9,595,513 | | Class B | 147,420 | 9,252,079 |
| American Tower Corp., | | | | Visa, Inc., Class A | 74,681 | 5,411,385 |
| Class A(1) | 197,370 | 7,999,406 | | Walt Disney Co. (The) | 90,420 | 3,021,836 |
| Apache Corp. | 34,880 | 3,123,155 | | Whole Foods Market, Inc.(1) | 14,620 | 591,087 |
| Apple, Inc.(1) | 54,170 | 13,930,357 | | Yum! Brands, Inc. | 89,220 | 3,653,559 |
| Celgene Corp.(1) | 43,690 | 2,305,084 | | | | 215,430,410 |
| Cisco Systems, Inc.(1) | 422,590 | 9,787,184 | | TOTAL INVESTMENT | | |
| Cliffs Natural Resources, Inc. | 39,770 | 2,221,552 | | SECURITIES — 99.7% | | |
| Coach, Inc. | 142,340 | 5,851,597 | | (Cost $356,425,470) | | 391,641,622 |
| Colgate-Palmolive Co. | 76,250 | 5,954,363 | | OTHER ASSETS | | |
| | | | | AND LIABILITIES — 0.3% | | 1,296,518 |
| Cooper Industries plc | 94,010 | 4,415,650 | | | | |
| | | | | TOTAL NET ASSETS — 100.0% | | $392,938,140 |
| Danaher Corp. | 111,840 | 8,877,859 | | | | |
| Discovery Communications, | | | | | | |
| Inc., Class A(1) | 83,680 | 3,151,389 | | Market Sector Diversification | |
| EMC Corp.(1) | 504,670 | 9,396,955 | | (as a % of net assets) | | |
| Equinix, Inc.(1) | 23,780 | 2,187,998 | | Information Technology | | 17.1% |
| EXCO Resources, Inc. | 96,546 | 1,665,419 | | Consumer Discretionary | | 16.4% |
| Express Scripts, Inc.(1) | 58,060 | 5,840,836 | | Industrials | | 16.0% |
| Fifth Third Bancorp. | 214,860 | 2,791,031 | | Financials | | 14.8% |
| General Mills, Inc. | 97,534 | 6,947,347 | | Energy | | 9.8% |
| Goldman Sachs | | | | Consumer Staples | | 9.2% |
| Group, Inc. (The) | 8,470 | 1,221,882 | | Materials | | 7.3% |
| Google, Inc., Class A(1) | 6,060 | 2,940,191 | | Health Care | | 7.1% |
| Hewlett-Packard Co. | 133,850 | 6,158,439 | | Telecommunication Services | | 2.0% |
| Home Depot, Inc. (The) | 89,800 | 3,040,628 | | Other Assets and Liabilities | | 0.3% |
| Kohl’s Corp.(1) | 58,900 | 2,989,175 | | | | |
| MasterCard, Inc., Class A | 18,860 | 3,805,382 | | Notes to Schedule of Investments |
| Medco Health | | | | ADR = American Depositary Receipt | | |
| Solutions, Inc.(1) | 34,910 | 2,012,562 | | (1) Non-income producing. | | |
| Occidental Petroleum Corp. | 104,040 | 8,584,340 | | | | |
| PACCAR, Inc. | 68,340 | 2,801,940 | | | | |
| PNC Financial Services | | | | See Notes to Financial Statements. | | |
| Group, Inc. | 117,274 | 7,358,944 | | | | |
13
|
| Statement of Assets and Liabilities |
| | | | |
| MAY 28, 2010 (UNAUDITED) | | | | |
| Assets | | | | |
| Investment securities, at value (cost of $356,425,470) | | | $391,641,622 |
| Foreign currency holdings, at value (cost of $513,718) | | | 513,802 |
| Receivable for investments sold | | | | 6,113,701 |
| Receivable for capital shares sold | | | | 114,650 |
| Dividends and interest receivable | | | | 855,181 |
| | | | | 399,238,956 |
| | | | | |
| Liabilities | | | | |
| Disbursements in excess of demand deposit cash | | | 1,133,865 |
| Payable for investments purchased | | | | 4,611,564 |
| Payable for capital shares redeemed | | | | 190,068 |
| Accrued management fees | | | | 355,315 |
| Service fees (and distribution fees – A Class and R Class) payable | | | 7,392 |
| Distribution fees payable | | | | 2,612 |
| | | | | 6,300,816 |
| Net Assets | | | | $392,938,140 |
| | | | | |
| Net Assets Consist of: | | | | |
| Capital (par value and paid-in surplus) | | | | $453,338,533 |
| Undistributed net investment income | | | | 941,671 |
| Accumulated net realized loss on investment and foreign currency transactions | | (96,560,072) |
| Net unrealized appreciation on investments and translation of assets and liabilities in foreign currencies | 35,218,008 |
| | | | | $392,938,140 |
| |
| | Net assets | Shares outstanding | Net asset value per share |
| Investor Class, $0.01 Par Value | $314,140,146 | 42,978,441 | | $7.31 |
| Institutional Class, $0.01 Par Value | $42,630,409 | 5,780,058 | | $7.38 |
| A Class, $0.01 Par Value | $31,513,405 | 4,370,640 | | $7.21* |
| B Class, $0.01 Par Value | $754,354 | 106,946 | | $7.05 |
| C Class, $0.01 Par Value | $3,466,183 | 508,085 | | $6.82 |
| R Class, $0.01 Par Value | $433,643 | 60,051 | | $7.22 |
| *Maximum offering price $7.65 (net asset value divided by 0.9425) | | | |
| |
| |
| See Notes to Financial Statements. | | | | |
14
| |
| FOR THE SIX MONTHS ENDED MAY 28, 2010 (UNAUDITED) | |
| Investment Income (Loss) | |
| Income: | |
| Dividends (net of foreign taxes withheld of $251,604) | $ 4,002,556 |
| Interest | 1,062 |
| | 4,003,618 |
| Expenses: | |
| Management fees | 2,396,488 |
| Distribution fees: | |
| B Class | 3,088 |
| C Class | 14,349 |
| Service fees: | |
| B Class | 1,029 |
| C Class | 4,783 |
| Distribution and service fees: | |
| A Class | 42,970 |
| R Class | 1,060 |
| Directors’ fees and expenses | 6,726 |
| Other expenses | 9,288 |
| | 2,479,781 |
| | |
| Net investment income (loss) | 1,523,837 |
| | |
| Realized and Unrealized Gain (Loss) | |
| Net realized gain (loss) on: | |
| Investment transactions (net of foreign tax expenses paid (refunded) of $66,105) | 23,229,733 |
| Foreign currency transactions | 945,519 |
| | 24,175,252 |
| | |
| Change in net unrealized appreciation (depreciation) on: | |
| Investments (net of deferred foreign taxes of $(70,367)) | (31,713,560) |
| Translation of assets and liabilities in foreign currencies | (17,864,392) |
| | (49,577,952) |
| | |
| Net realized and unrealized gain (loss) | (25,402,700) |
| | |
| Net Increase (Decrease) in Net Assets Resulting from Operations | $(23,878,863) |
| |
| |
| See Notes to Financial Statements. | |
15
|
| Statement of Changes in Net Assets |
| | |
| SIX MONTHS ENDED MAY 28, 2010 (UNAUDITED) AND YEAR ENDED NOVEMBER 30, 2009 | |
| Increase (Decrease) in Net Assets | 2010 | 2009 |
| Operations | | |
| Net investment income (loss) | $ 1,523,837 | $ 2,186,335 |
| Net realized gain (loss) | 24,175,252 | (61,414,112) |
| Change in net unrealized appreciation (depreciation) | (49,577,952) | 164,334,702 |
| Net increase (decrease) in net assets resulting from operations | (23,878,863) | 105,106,925 |
| | | |
| Distributions to Shareholders | | |
| From net investment income: | | |
| Investor Class | (2,545,624) | (63,581) |
| Institutional Class | (512,165) | (59,013) |
| A Class | (82,118) | — |
| Decrease in net assets from distributions | (3,139,907) | (122,594) |
| | | |
| Capital Share Transactions | | |
| Net increase (decrease) in net assets from capital share transactions | (10,960,918) | (2,669,083) |
| | | |
| Redemption Fees | | |
| Increase in net assets from redemption fees | 5,841 | 12,362 |
| | | |
| Net increase (decrease) in net assets | (37,973,847) | 102,327,610 |
| | | |
| Net Assets | | |
| Beginning of period | 430,911,987 | 328,584,377 |
| End of period | $392,938,140 | $430,911,987 |
| | | |
| Undistributed net investment income | $941,671 | $2,557,741 |
| |
| |
| See Notes to Financial Statements. | | |
16
|
| Notes to Financial Statements |
MAY 28, 2010 (UNAUDITED)
1. Organization and Summary of Significant Accounting Policies
Organization — American Century World Mutual Funds, Inc. (the corporation) is registered under the Investment Company Act of 1940 (the 1940 Act) as an open-end management investment company. Global Growth Fund (the fund) is one fund in a series issued by the corporation. The fund is diversified under the 1940 Act. The fund’s investment objective is to seek capital growth. The fund pursues its objective by investing primarily in equity securities of issuers in the United States and other developed countries. The following is a summary of the fund’s significant accounting policies.
Multiple Class — The fund is authorized to issue the Investor Class, the Institutional Class, the A Class, the B Class, the C Class and the R Class. The A Class may incur an initial sales charge. The A Class, B Class and C Class may be subject to a contingent deferred sales charge. The share classes differ principally in their respective sales charges and distribution and shareholder servicing expenses and arrangements. All shares of the fund represent an equal pro rata interest in the net assets of the class to which such shares belong, and have identical voting, dividend, liquidation and other rights and the same terms and conditions, except for class specific expenses and exclusive rights to vote on matters affecting only individual classes. Income, non-class specific expenses, and realized and unrealized capital gains and losses of the fund are allocated to each class of shares based on their relative net assets.
Security Valuations — Securities traded primarily on a principal securities exchange are valued at the last reported sales price, or at the mean of the latest bid and asked prices where no last sales price is available. Depending on local convention or regulation, securities traded over-the-counter are valued at the mean of the latest bid and asked prices, the last sales price, or the official close price. Investments in open-end management investment companies are valued at the reported net asset value. Discount notes may be valued through a commercial pricing service or at amortized cost, which approximates fair value. Securities traded on foreign securities exchanges and over-the-counter markets are normally completed before the close of business on days that the New York Stock Exchange (the Exchange) is open and may also take place on days when the Exchange is not open. If an event occurs after the value of a security was established but before the net asset value per share was determined that was likely to materially change the net asset value, that security would be valued as determined in accordance with procedures adopted by the Board of Directors. If the fund determines that the market price of a portfolio security is not readily available, or that the valuation methods mentioned above do not reflect the security’s fair value, such security is valued as determined by the Board of Directors or its designee, in accordance with procedures adopted by the Board of Directors, if such determination would materially impact a fund’s net asset value. Certain other circumstances may cause the fund to use alternative procedures to value a security such as: a security has been declared in default; trading in a security has been halted during the trading day; or there is a foreign market holiday and no trading will commence .
Security Transactions — For financial reporting purposes, security transactions are accounted for as of the trade date. Net realized gains and losses are determined on the identified cost basis, which is also used for federal income tax purposes. Certain countries impose taxes on realized gains on the sale of securities registered in their country. The fund records the foreign tax expense, if any, on an accrual basis. The foreign tax expense on realized gains and unrealized appreciation reduces the net realized gain (loss) on investment transactions and net unrealized appreciation (depreciation) on investments, respectively.
Investment Income — Dividend income less foreign taxes withheld, if any, is recorded as of the ex-dividend date. Interest income is recorded on the accrual basis and includes accretion of discounts and amortization of premiums.
17
Foreign Currency Translations — All assets and liabilities initially expressed in foreign currencies are translated into U.S. dollars at prevailing exchange rates at period end. The fund may enter into spot foreign currency exchange contracts to facilitate transactions denominated in a foreign currency. Purchases and sales of investment securities, dividend and interest income, spot foreign currency exchange contracts, and certain expenses are translated at the rates of exchange prevailing on the respective dates of such transactions. Realized and unrealized gains and losses from foreign currency translations arise from changes in currency exchange rates.
Net realized and unrealized foreign currency exchange gains or losses occurring during the holding period of investment securities are a component of net realized gain (loss) on foreign currency transactions and net unrealized appreciation (depreciation) on translation of assets and liabilities in foreign currencies, respectively. Certain countries may impose taxes on the contract amount of purchases and sales of foreign currency contracts in their currency. The fund records the foreign tax expense, if any, as a reduction to the net realized gain (loss) on foreign currency transactions.
Repurchase Agreements — The fund may enter into repurchase agreements with institutions that American Century Investment Management, Inc. (ACIM) has determined are creditworthy pursuant to criteria adopted by the Board of Directors. Each repurchase agreement is recorded at cost. The fund requires that the collateral, represented by securities, received in a repurchase transaction be transferred to the custodian in a manner sufficient to enable the fund to obtain those securities in the event of a default under the repurchase agreement. ACIM monitors, on a daily basis, the securities transferred to ensure the value, including accrued interest, of the securities under each repurchase agreement is equal to or greater than amounts owed to the fund under each repurchase agreement.
Joint Trading Account — Pursuant to an Exemptive Order issued by the Securities and Exchange Commission, the fund, along with certain other funds in the American Century Investments family of funds, may transfer uninvested cash balances into a joint trading account. These balances are invested in one or more repurchase agreements that are collateralized by U.S. Treasury or Agency obligations.
Income Tax Status — It is the fund’s policy to distribute substantially all net investment income and net realized gains to shareholders and to otherwise qualify as a regulated investment company under provisions of the Internal Revenue Code. The fund is no longer subject to examination by tax authorities for years prior to 2006. Additionally, non-U.S. tax returns filed by the fund due to investments in certain foreign securities remain subject to examination by the relevant taxing authority for 7 years from the date of filing. At this time, management believes there are no uncertain tax positions which, based on their technical merit, would not be sustained upon examination and for which it is reasonably possible that the total amounts of unrecognized tax benefits will significantly change in the next twelve months. Accordingly, no provision has been made for federal or state income taxes.
Distributions to Shareholders — Distributions to shareholders are recorded on the ex-dividend date. Distributions from net investment income, if any, are generally declared and paid annually. Distributions from net realized gains, if any, are generally declared and paid twice per year. The fund may make distributions on a more frequent basis to comply with the distribution requirements of the Internal Revenue Code, in all events in a manner consistent with provisions of the 1940 Act.
Redemption — The fund may impose a 2.00% redemption fee on shares held less than 60 days. The fee may not be applicable to all classes. The redemption fee is retained by the fund and helps cover transaction costs that long-term investors may bear when the fund sells securities to meet investor redemptions.
18
Indemnifications — Under the corporation’s organizational documents, its officers and directors are indemnified against certain liabilities arising out of the performance of their duties to the fund. In addition, in the normal course of business, the fund enters into contracts that provide general indemnifications. The maximum exposure under these arrangements is unknown as this would involve future claims that may be made against a fund. The risk of material loss from such claims is considered by management to be remote.
Use of Estimates — The financial statements are prepared in conformity with accounting principles generally accepted in the United States of America, which may require management to make certain estimates and assumptions at the date of the financial statements. Actual results could differ from these estimates.
Subsequent Events — In preparing the financial statements, management evaluated the impact of events or transactions occurring through the date the financial statements were issued that would merit recognition or disclosure.
2. Fees and Transactions with Related Parties
Management Fees — The corporation has entered into a Management Agreement with American Century Global Investment Management, Inc. (ACGIM) (the investment advisor) (see Note 9), under which ACGIM provides the fund with investment advisory and management services in exchange for a single, unified management fee (the fee) per class. The Agreement provides that all expenses of managing and operating the fund, except brokerage expenses, taxes, interest, fees and expenses of the independent directors (including legal counsel fees), and extraordinary expenses, will be paid by ACGIM. The fee is computed and accrued daily based on the daily net assets of the specific class of shares of the fund and paid monthly in arrears. For funds with a stepped fee schedule, the rate of the fee is determined by applying a fee rate calculation formula. This formula takes into account the fund’s assets as well as certain assets, if any, of other clients of the investment advisor outside the American Century Investments family of funds (such as subadvised funds and separate accounts) that have very similar investment teams and investment strategies (strategy assets). The annual management fee schedule ranges from 1.05% to 1.30% for the Investor Class, A Class, B Class, C Class and R Class. The Institutional Class is 0.20% less at each point within the range. The effective annual management fee for each class for the six months ended May 28, 2010 was 1.15% for the Investor Class, A Class, B Class, C Class and R Class and 0.95% for the Institutional Class.
ACGIM has entered into a Subadvisory Agreement with ACIM (the subadvisor) on behalf of the fund. The subadvisor makes investment decisions for the cash portion of the fund in accordance with the fund’s investment objectives, policies and restrictions under the supervision of ACGIM and the Board of Directors. ACGIM pays all costs associated with retaining ACIM as the subadvisor of the fund.
Distribution and Service Fees — The Board of Directors has adopted a separate Master Distribution and Individual Shareholder Services Plan for each of the A Class, B Class, C Class and R Class (collectively the plans), pursuant to Rule 12b-1 of the 1940 Act. The plans provide that the A Class will pay American Century Investment Services, Inc. (ACIS) an annual distribution and service fee of 0.25%. The plans provide that the B Class and the C Class will each pay ACIS an annual distribution fee of 0.75% and service fee of 0.25%. The plans provide that the R Class will pay ACIS an annual distribution and service fee of 0.50%. The fees are computed and accrued daily based on each class’s daily net assets and paid monthly in arrears. The fees are used to pay financial intermediaries for distribution and individual shareh older services. Fees incurred under the plans during the six months ended May 28, 2010, are detailed in the Statement of Operations.
Related Parties — Certain officers and directors of the corporation are also officers and/ or directors of American Century Companies, Inc. (ACC), the parent of the corporation’s investment advisor, ACGIM, the corporation’s subadvisor, ACIM, the distributor of the corporation, ACIS, and the corporation’s transfer agent, American Century Services, LLC.
19
The fund is eligible to invest in a money market fund for temporary purposes, which is managed by J.P. Morgan Investment Management, Inc. (JPMIM). The fund has a Mutual Funds Services Agreement with J.P. Morgan Investor Services Co. (JPMIS) and a securities lending agreement with JPMorgan Chase Bank (JPMCB). JPMCB is a custodian of the fund. JPMIM, JPMIS and JPMCB are wholly owned subsidiaries of JPMorgan Chase & Co. (JPM). JPM is an equity investor in ACC.
3. Investment Transactions
Purchases and sales of investment securities, excluding short-term investments, for the six months ended May 28, 2010, were $268,476,225 and $277,527,141, respectively.
| | | | |
| 4. Capital Share Transactions | | | | |
| |
| Transactions in shares of the fund were as follows: | | |
| | Six months ended May 28, 2010 | Year ended November 30, 2009 |
| | Shares | Amount | Shares | Amount |
| Investor Class/Shares Authorized | 200,000,000 | | 200,000,000 | |
| Sold | 1,667,558 | $ 13,119,564 | 5,400,539 | $34,671,769 |
| Issued in reinvestment of distributions | 263,938 | 2,088,844 | 10,253 | 52,087 |
| Redeemed | (3,360,168) | (26,062,538) | (7,583,471) | (47,853,604) |
| | (1,428,672) | (10,854,130) | (2,172,679) | (13,129,748) |
| Institutional Class/Shares Authorized | 35,000,000 | | 35,000,000 | |
| Sold | 463,228 | 3,664,652 | 1,749,631 | 10,833,115 |
| Issued in reinvestment of distributions | 63,922 | 510,882 | 11,450 | 58,854 |
| Redeemed | (412,780) | (3,226,347) | (868,863) | (5,358,928) |
| | 114,370 | 949,187 | 892,218 | 5,533,041 |
| A Class/Shares Authorized | 35,000,000 | | 35,000,000 | |
| Sold | 546,882 | 4,212,654 | 2,253,267 | 13,745,515 |
| Issued in reinvestment of distributions | 10,288 | 80,224 | — | — |
| Redeemed | (715,942) | (5,505,553) | (1,589,618) | (9,705,190) |
| | (158,772) | (1,212,675) | 663,649 | 4,040,325 |
| B Class/Shares Authorized | 10,000,000 | | 10,000,000 | |
| Sold | 126 | 1,000 | 59,034 | 406,476 |
| Redeemed | (6,332) | (46,592) | (20,190) | (111,170) |
| | (6,206) | (45,592) | 38,844 | 295,306 |
| C Class/Shares Authorized | 10,000,000 | | 10,000,000 | |
| Sold | 147,135 | 1,089,602 | 185,636 | 1,218,550 |
| Redeemed | (125,453) | (907,695) | (129,006) | (729,428) |
| | 21,682 | 181,907 | 56,630 | 489,122 |
| R Class/Shares Authorized | 5,000,000 | | 5,000,000 | |
| Sold | 18,221 | 144,094 | 26,932 | 176,194 |
| Redeemed | (15,724) | (123,709) | (12,873) | (73,323) |
| | 2,497 | 20,385 | 14,059 | 102,871 |
| Net increase (decrease) | (1,455,101) | $(10,960,918) | (507,279) | $(2,669,083) |
20
5. Fair Value Measurements
The fund’s securities valuation process is based on several considerations and may use multiple inputs to determine the fair value of the positions held by the fund. In conformity with accounting principles generally accepted in the United States of America, the inputs used to determine a valuation are classified into three broad levels as follows:
• Level 1 valuation inputs consist of unadjusted quoted prices in an active market for identical securities;
• Level 2 valuation inputs consist of significant direct or indirect observable market data (including quoted prices for similar securities, evaluations of subsequent market events, interest rates, prepayment speeds, credit risk, etc.); or
• Level 3 valuation inputs consist of significant unobservable inputs (including a fund’s own assumptions).
The level classification is based on the lowest level input that is significant to the fair valuation measurement. The valuation inputs are not an indication of the risks associated with investing in these securities or other financial instruments.
The following is a summary of the valuation inputs used to determine the fair value of the fund’s securities as of May 28, 2010. The Schedule of Investments provides additional details on the fund’s portfolio holdings.
| | | |
| | Level 1 | Level 2 | Level 3 |
| Investment Securities | | | |
| Domestic Common Stocks | $215,430,410 | — | — |
| Foreign Common Stocks | 21,963,206 | $154,248,006 | — |
| Total Value of Investment Securities | $237,393,616 | $154,248,006 | — |
6. Risk Factors
There are certain risks involved in investing in foreign securities. These risks include those resulting from future adverse political, social, and economic developments, fluctuations in currency exchange rates, the possible imposition of exchange controls, and other foreign laws or restrictions. Investing in emerging markets may accentuate these risks.
7. Interfund Lending
The fund, along with certain other funds in the American Century Investments family of funds, may participate in an interfund lending program, pursuant to an Exemptive Order issued by the Securities and Exchange Commission (SEC). This program provides an alternative credit facility allowing the fund to borrow from or lend to other funds in the American Century Investments family of funds that permit such transactions. Interfund lending transactions are subject to each fund’s investment policies and borrowing and lending limits. The interfund loan rate earned/paid on interfund lending transactions is determined daily based on the average of certain current market rates. Interfund lending transactions normally extend only overnight, but can have a maximum duration of seven days. The program is subject to annual approval by the Board of Directors. During the six months ended May 28, 2010, the fund did not utiliz e the program.
21
8. Federal Tax Information
The book-basis character of distributions made during the year from net investment income or net realized gains may differ from their ultimate characterization for federal income tax purposes. These differences reflect the differing character of certain income items and net realized gains and losses for financial statement and tax purposes, and may result in reclassification among certain capital accounts on the financial statements.
As of May 28, 2010, the components of investments for federal income tax purposes were as follows:
| | |
| Federal tax cost of investments | $359,708,158 |
| Gross tax appreciation of investments | $49,505,939 |
| Gross tax depreciation of investments | (17,572,475) |
| Net tax appreciation (depreciation) of investments | $31,933,464 |
The difference between book-basis and tax-basis cost and unrealized appreciation (depreciation) is attributable primarily to the tax deferral of losses on wash sales and on investments in passive foreign investment companies.
As of November 30, 2009, the fund had accumulated capital losses of $(116,425,124), which represent net capital loss carryovers that may be used to offset future realized capital gains for federal income tax purposes. Future capital loss carryover utilization in any given year may be subject to Internal Revenue Code limitations. Capital loss carryovers of $(40,260,034) and $(76,165,090) expire in 2016 and 2017, respectively.
The fund had a capital loss deferral of $(667,887), which represents net capital losses incurred in the one-month period ended November 30, 2009. The fund has elected to treat such losses as having been incurred in the following fiscal year for federal income tax purposes.
9. Corporate Event
As part of a long-standing estate and business succession plan established by ACC Co-Chairman James E. Stowers, Jr., the founder of American Century Investments, ACC Co-Chairman Richard W. Brown succeeded Mr. Stowers as trustee of a trust that holds a greater-than-25% voting interest in ACC, the parent corporation of the fund’s advisors. Under the 1940 Act, this is presumed to represent control of ACC even though it is less than a majority interest. The change of trustee may technically be considered a “change of control” of ACC and therefore also a change of control of the fund’s advisors even though there has been no change to their management and none is anticipated. The “change of control” resulted in the assignment of the fund’s investment advisory and subadvisory agreements. Under the 1940 Act, an assignment automatically terminated such agreements, making the approval of a new agreement necessary.
On February 16, 2010, the Board of Directors approved interim investment advisory and subadvisory agreements under which the fund will be managed until a new agreement is approved by fund shareholders. The interim agreements are substantially identical to the terminated agreements (with the exception of different effective and termination dates) and will not result in changes in the management of American Century Investments, the fund, its investment objectives, fees or services provided. On March 29, 2010, the Board of Directors approved a new investment advisory agreement. The new agreement is also substantially identical to the terminated agreement (except for the date, the substitution of ACIM for ACGIM and certain other non-material changes). In order to streamline American Century’s corporate organization, ACGIM was merged into ACIM on July 16, 2010. The new agreement for the fund was approved by shareh olders at a Special Meeting of Shareholders on June 16, 2010. The new agreement went into effect on July 16, 2010.
22
| | | | | | | |
| Global Growth | | | | | | |
| |
| Investor Class | | | | | | |
| For a Share Outstanding Throughout the Years Ended November 30 (except as noted) | | |
| | | 2010(1) | 2009 | 2008 | 2007 | 2006 | 2005 |
| Per-Share Data | | | | | | |
| Net Asset Value, | | | | | | |
| Beginning of Period | $7.80 | $5.90 | $12.69 | $10.52 | $8.88 | $7.49 |
| Income From | | | | | | |
| Investment Operations | | | | | | |
| Net Investment | | | | | | |
| Income (Loss)(2) | 0.03 | 0.04 | 0.04 | 0.03 | —(3) | —(3) |
| Net Realized and | | | | | | |
| Unrealized Gain (Loss) | (0.46) | 1.86 | (4.75) | 2.41 | 1.70 | 1.41 |
| Total From | | | | | | |
| Investment Operations | (0.43) | 1.90 | (4.71) | 2.44 | 1.70 | 1.41 |
| Distributions | | | | | | |
| From Net | | | | | | |
| Investment Income | (0.06) | —(3) | — | (0.05) | (0.06) | (0.02) |
| From Net Realized Gains | — | — | (2.08) | (0.22) | — | — |
| Total Distributions | (0.06) | —(3) | (2.08) | (0.27) | (0.06) | (0.02) |
| Net Asset Value, | | | | | | |
| End of Period | $7.31 | $7.80 | $5.90 | $12.69 | $10.52 | $8.88 |
| |
| Total Return(4) | (5.60)% | 32.24% | (44.01)% | 23.73% | 19.30% | 18.87% |
| | | | | | | |
| Ratios/Supplemental Data | | | | | | |
| Ratio of Operating | | | | | | |
| Expenses to Average | | | | | | |
| Net Assets | 1.16%(5) | 1.22% | 1.26% | 1.30% | 1.31% | 1.30% |
| Ratio of Net Investment | | | | | | |
| Income (Loss) to Average | | | | | | |
| Net Assets | 0.73%(5) | 0.62% | 0.40% | 0.29% | (0.05)% | (0.01)% |
| Portfolio Turnover Rate | 63% | 103% | 121% | 108% | 95% | 36% |
| Net Assets, End of Period | | | | | | |
| (in thousands) | $314,140 | $346,590 | $274,599 | $481,553 | $418,185 | $378,976 |
| (1) | Six months ended May 28, 2010 (unaudited). | | | | | |
| (2) | Computed using average shares outstanding throughout the period. | | | | |
| (3) | Per-share amount was less than $0.005. | | | | | |
| (4) | Total return assumes reinvestment of net investment income and capital gains distributions, if any. Total returns for periods less than one year |
| | are not annualized. Total returns are calculated based on the net asset value of the last business day. The total return of the classes may not |
| | precisely reflect the class expense differences because of the impact of calculating the net asset values to two decimal places. If net asset |
| | values were calculated to three decimal places, the total return differences would more closely reflect the class expense differences. The |
| | calculation of net asset values to two decimal places is made in accordance with SEC guidelines and does not result in any gain or loss of value |
| | between one class and another. | | | | | |
| (5) | Annualized. | | | | | | |
See Notes to Financial Statements.
23
| | | | | | | |
| Global Growth | | | | | | |
| |
| Institutional Class | | | | | | |
| For a Share Outstanding Throughout the Years Ended November 30 (except as noted) | | |
| | | 2010(1) | 2009 | 2008 | 2007 | 2006 | 2005 |
| Per-Share Data | | | | | | |
| Net Asset Value, | | | | | | |
| Beginning of Period | $7.90 | $5.97 | $12.79 | $10.60 | $8.95 | $7.55 |
| Income From | | | | | | |
| Investment Operations | | | | | | |
| Net Investment | | | | | | |
| Income (Loss)(2) | 0.04 | 0.05 | 0.07 | 0.06 | 0.01 | 0.01 |
| Net Realized and | | | | | | |
| Unrealized Gain (Loss) | (0.47) | 1.89 | (4.81) | 2.42 | 1.72 | 1.43 |
| Total From | | | | | | |
| Investment Operations | (0.43) | 1.94 | (4.74) | 2.48 | 1.73 | 1.44 |
| Distributions | | | | | | |
| From Net | | | | | | |
| Investment Income | (0.09) | (0.01) | — | (0.07) | (0.08) | (0.04) |
| From Net Realized Gains | — | — | (2.08) | (0.22) | — | — |
| Total Distributions | (0.09) | (0.01) | (2.08) | (0.29) | (0.08) | (0.04) |
| Net Asset Value, | | | | | | |
| End of Period | $7.38 | $7.90 | $5.97 | $12.79 | $10.60 | $8.95 |
| |
| Total Return(3) | (5.66)% | 32.61% | (43.88)% | 23.99% | 19.50% | 19.22% |
| | | | | | | |
| Ratios/Supplemental Data | | | | | | |
| Ratio of Operating | | | | | | |
| Expenses to Average | | | | | | |
| Net Assets | 0.96%(4) | 1.02% | 1.05% | 1.10% | 1.11% | 1.10% |
| Ratio of Net Investment | | | | | | |
| Income (Loss) to Average | | | | | | |
| Net Assets | 0.93%(4) | 0.82% | 0.61% | 0.49% | 0.15% | 0.19% |
| Portfolio Turnover Rate | 63% | 103% | 121% | 108% | 95% | 36% |
| Net Assets, End of Period | | | | | | |
| (in thousands) | $42,630 | $44,752 | $28,477 | $16,298 | $8,540 | $8,669 |
| (1) | Six months ended May 28, 2010 (unaudited). | | | | | |
| (2) | Computed using average shares outstanding throughout the period. | | | | |
| (3) | Total return assumes reinvestment of net investment income and capital gains distributions, if any. Total returns for periods less than one year |
| | are not annualized. Total returns are calculated based on the net asset value of the last business day. The total return of the classes may not |
| | precisely reflect the class expense differences because of the impact of calculating the net asset values to two decimal places. If net asset |
| | values were calculated to three decimal places, the total return differences would more closely reflect the class expense differences. The |
| | calculation of net asset values to two decimal places is made in accordance with SEC guidelines and does not result in any gain or loss of value |
| | between one class and another. | | | | | |
| (4) | Annualized. | | | | | | |
See Notes to Financial Statements.
24
| | | | | | | |
| Global Growth | | | | | | |
| |
| A Class(1) | | | | | | |
| For a Share Outstanding Throughout the Years Ended November 30 (except as noted) | | |
| | | 2010(2) | 2009 | 2008 | 2007 | 2006 | 2005 |
| Per-Share Data | | | | | | |
| Net Asset Value, | | | | | | |
| Beginning of Period | $7.67 | $5.81 | $12.56 | $10.41 | $8.79 | $7.41 |
| Income From | | | | | | |
| Investment Operations | | | | | | |
| Net Investment | | | | | | |
| Income (Loss)(3) | 0.02 | 0.02 | 0.01 | 0.01 | (0.03) | (0.02) |
| Net Realized and | | | | | | |
| Unrealized Gain (Loss) | (0.46) | 1.84 | (4.68) | 2.38 | 1.69 | 1.40 |
| Total From | | | | | | |
| Investment Operations | (0.44) | 1.86 | (4.67) | 2.39 | 1.66 | 1.38 |
| Distributions | | | | | | |
| From Net | | | | | | |
| Investment Income | (0.02) | — | — | (0.02) | (0.04) | — |
| From Net Realized Gains | — | — | (2.08) | (0.22) | — | — |
| Total Distributions | (0.02) | — | (2.08) | (0.24) | (0.04) | — |
| Net Asset Value, | | | | | | |
| End of Period | $7.21 | $7.67 | $5.81 | $12.56 | $10.41 | $8.79 |
| |
| Total Return(4) | (5.78)% | 32.01% | (44.17)% | 23.47% | 18.97% | 18.62% |
| | | | | | | |
| Ratios/Supplemental Data | | | | | | |
| Ratio of Operating | | | | | | |
| Expenses to Average | | | | | | |
| Net Assets | 1.41%(5) | 1.47% | 1.51% | 1.55% | 1.56% | 1.55% |
| Ratio of Net Investment | | | | | | |
| Income (Loss) to Average | | | | | | |
| Net Assets | 0.48%(5) | 0.37% | 0.15% | 0.04% | (0.30)% | (0.26)% |
| Portfolio Turnover Rate | 63% | 103% | 121% | 108% | 95% | 36% |
| Net Assets, End of Period | | | | | | |
| (in thousands) | $31,513 | $34,744 | $22,447 | $18,402 | $5,571 | $3,664 |
| (1) | Prior to September 4, 2007, the A Class was referred to as the Advisor Class. | | | |
| (2) | Six months ended May 28, 2010 (unaudited). | | | | | |
| (3) | Computed using average shares outstanding throughout the period. | | | | |
| (4) | Total return assumes reinvestment of net investment income and capital gains distributions, if any, and does not reflect applicable sales charges. |
| | Total returns for periods less than one year are not annualized. Total returns are calculated based on the net asset value of the last business day. |
| | The total return of the classes may not precisely reflect the class expense differences because of the impact of calculating the net asset values |
| | to two decimal places. If net asset values were calculated to three decimal places, the total return differences would more closely reflect the |
| | class expense differences. The calculation of net asset values to two decimal places is made in accordance with SEC guidelines and does not |
| | result in any gain or loss of value between one class and another. | | | | |
| (5) | Annualized. | | | | | | |
See Notes to Financial Statements.
25
| | | | | | |
| Global Growth | | | | | |
| |
| B Class | | | | | |
| For a Share Outstanding Throughout the Years Ended November 30 (except as noted) | | |
| | | 2010(1) | 2009 | 2008 | 2007 | 2006 |
| Per-Share Data | | | | | |
| Net Asset Value, Beginning of Period | $7.51 | $5.73 | $12.50 | $10.42 | $9.02 |
| Income From Investment Operations | | | | | |
| Net Investment Income (Loss)(2) | (0.01) | (0.03) | (0.05) | (0.08) | (0.11) |
| Net Realized and Unrealized Gain (Loss) | (0.45) | 1.81 | (4.64) | 2.38 | 1.57 |
| Total From Investment Operations | (0.46) | 1.78 | (4.69) | 2.30 | 1.46 |
| Distributions | | | | | |
| From Net Investment Income | — | — | — | — | (0.06) |
| From Net Realized Gains | — | — | (2.08) | (0.22) | — |
| Total Distributions | — | — | (2.08) | (0.22) | (0.06) |
| Net Asset Value, End of Period | $7.05 | $7.51 | $5.73 | $12.50 | $10.42 |
| |
| Total Return(3) | (6.13)% | 31.06% | (44.62)% | 22.51% | 16.29% |
| | | | | | |
| Ratios/Supplemental Data | | | | | |
| Ratio of Operating Expenses | | | | | |
| to Average Net Assets | 2.16%(4) | 2.22% | 2.26% | 2.30% | 2.31% |
| Ratio of Net Investment Income (Loss) | | | | | |
| to Average Net Assets | (0.27)%(4) | (0.38)% | (0.60)% | (0.71)% | (1.05)% |
| Portfolio Turnover Rate | 63% | 103% | 121% | 108% | 95% |
| Net Assets, End of Period (in thousands) | $754 | $850 | $426 | $639 | $352 |
| (1) | Six months ended May 28, 2010 (unaudited). | | | | | |
| (2) | Computed using average shares outstanding throughout the period. | | | | |
| (3) | Total return assumes reinvestment of net investment income and capital gains distributions, if any, and does not reflect applicable sales charges. |
| | Total returns for periods less than one year are not annualized. Total returns are calculated based on the net asset value of the last business day. |
| | The total return of the classes may not precisely reflect the class expense differences because of the impact of calculating the net asset values |
| | to two decimal places. If net asset values were calculated to three decimal places, the total return differences would more closely reflect the |
| | class expense differences. The calculation of net asset values to two decimal places is made in accordance with SEC guidelines and does not |
| | result in any gain or loss of value between one class and another. | | | | |
| (4) | Annualized. | | | | | |
See Notes to Financial Statements.
26
| | | | | | | |
| Global Growth | | | | | | |
| |
| C Class | | | | | | |
| For a Share Outstanding Throughout the Years Ended November 30 (except as noted) | | |
| | | 2010(1) | 2009 | 2008 | 2007 | 2006 | 2005 |
| Per-Share Data | | | | | | |
| Net Asset Value, | | | | | | |
| Beginning of Period | $7.27 | $5.54 | $12.16 | $10.14 | $8.59 | $7.29 |
| Income From | | | | | | |
| Investment Operations | | | | | | |
| Net Investment | | | | | | |
| Income (Loss)(2) | (0.01) | (0.02) | (0.05) | (0.07) | (0.10) | (0.08) |
| Net Realized and | | | | | | |
| Unrealized Gain (Loss) | (0.44) | 1.75 | (4.49) | 2.31 | 1.65 | 1.38 |
| Total From | | | | | | |
| Investment Operations | (0.45) | 1.73 | (4.54) | 2.24 | 1.55 | 1.30 |
| Distributions | | | | | | |
| From Net Realized Gains | — | — | (2.08) | (0.22) | — | — |
| Net Asset Value, | | | | | | |
| End of Period | $6.82 | $7.27 | $5.54 | $12.16 | $10.14 | $8.59 |
| |
| Total Return(3) | (6.19)% | 31.23% | (44.64)% | 22.54% | 18.04% | 17.83% |
| | | | | | | |
| Ratios/Supplemental Data | | | | | | |
| Ratio of Operating | | | | | | |
| Expenses to Average | | | | | | |
| Net Assets | 2.16%(4) | 2.22% | 2.26% | 2.30% | 2.31% | 2.30% |
| Ratio of Net Investment | | | | | | |
| Income (Loss) to Average | | | | | | |
| Net Assets | (0.27)%(4) | (0.38)% | (0.60)% | (0.71)% | (1.05)% | (1.01)% |
| Portfolio Turnover Rate | 63% | 103% | 121% | 108% | 95% | 36% |
| Net Assets, End of Period | | | | | | |
| (in thousands) | $3,466 | $3,535 | $2,382 | $2,625 | $1,050 | $454 |
| (1) | Six months ended May 28, 2010 (unaudited). | | | | | |
| (2) | Computed using average shares outstanding throughout the period. | | | | |
| (3) | Total return assumes reinvestment of net investment income and capital gains distributions, if any, and does not reflect applicable sales charges. |
| | Total returns for periods less than one year are not annualized. Total returns are calculated based on the net asset value of the last business day. |
| | The total return of the classes may not precisely reflect the class expense differences because of the impact of calculating the net asset values |
| | to two decimal places. If net asset values were calculated to three decimal places, the total return differences would more closely reflect the |
| | class expense differences. The calculation of net asset values to two decimal places is made in accordance with SEC guidelines and does not |
| | result in any gain or loss of value between one class and another. | | | | |
| (4) | Annualized. | | | | | | |
See Notes to Financial Statements.
27
| | | | | | | |
| Global Growth | | | | | | |
| |
| R Class | | | | | | |
| For a Share Outstanding Throughout the Years Ended November 30 (except as noted) | | |
| | | 2010(1) | 2009 | 2008 | 2007 | 2006 | 2005(2) |
| Per-Share Data | | | | | | |
| Net Asset Value, | | | | | | |
| Beginning of Period | $7.67 | $5.82 | $12.62 | $10.47 | $8.86 | $8.37 |
| Income From | | | | | | |
| Investment Operations | | | | | | |
| Net Investment | | | | | | |
| Income (Loss)(3) | 0.01 | —(4) | (0.01) | 0.02 | (0.05) | (0.02) |
| Net Realized and | | | | | | |
| Unrealized Gain (Loss) | (0.46) | 1.85 | (4.71) | 2.35 | 1.71 | 0.51 |
| Total From | | | | | | |
| Investment Operations | (0.45) | 1.85 | (4.72) | 2.37 | 1.66 | 0.49 |
| Distributions | | | | | | |
| From Net | | | | | | |
| Investment Income | — | — | — | — | (0.05) | — |
| From Net Realized Gains | — | — | (2.08) | (0.22) | — | — |
| Total Distributions | — | — | (2.08) | (0.22) | (0.05) | — |
| Net Asset Value, | | | | | | |
| End of Period | $7.22 | $7.67 | $5.82 | $12.62 | $10.47 | $8.86 |
| |
| Total Return(5) | (5.87)% | 31.79% | (44.40)% | 23.08% | 18.79% | 5.85% |
| | | | | | | |
| Ratios/Supplemental Data | | | | | | |
| Ratio of Operating | | | | | | |
| Expenses to Average | | | | | | |
| Net Assets | 1.66%(6) | 1.72% | 1.76% | 1.80% | 1.81% | 1.80%(6) |
| Ratio of Net Investment | | | | | | |
| Income (Loss) to Average | | | | | | |
| Net Assets | 0.23%(6) | 0.12% | (0.10)% | (0.21)% | (0.55)% | (0.71)%(6) |
| Portfolio Turnover Rate | 63% | 103% | 121% | 108% | 95% | 36%(7) |
| Net Assets, End of Period | | | | | | |
| (in thousands) | $434 | $442 | $253 | $202 | $32 | $26 |
| (1) | Six months ended May 28, 2010 (unaudited). | | | | | |
| (2) | July 29, 2005 (commencement of sale) through November 30, 2005. | | | | |
| (3) | Computed using average shares outstanding throughout the period. | | | | |
| (4) | Per-share amount was less than $0.005. | | | | | |
| (5) | Total return assumes reinvestment of net investment income and capital gains distributions, if any. Total returns for periods less than one year |
| | are not annualized. Total returns are calculated based on the net asset value of the last business day. The total return of the classes may not |
| | precisely reflect the class expense differences because of the impact of calculating the net asset values to two decimal places. If net asset |
| | values were calculated to three decimal places, the total return differences would more closely reflect the class expense differences. The |
| | calculation of net asset values to two decimal places is made in accordance with SEC guidelines and does not result in any gain or loss of value |
| | between one class and another. | | | | | |
| (6) | Annualized. | | | | | | |
| (7) | Portfolio turnover is calculated at the fund level. Percentage indicated was calculated for the year ended November 30, 2005. | |
See Notes to Financial Statements.
28
|
| Board Approval of Management and Subadvisory Agreements |
American Century Global Investment Management, Inc. (“ACGIM” or the “Advisor”) currently serves as investment advisor to the Fund under an interim management agreement (the “Interim Management Agreement”) between the Advisor and the Fund approved by the Fund’s Board of Directors (the “Board”). American Century Investment Management, Inc. (“ACIM” or the “Subadvisor”) currently serves as subadvisor to the Fund under an interim investment subadvisory agreement (the “Interim Subad-visory Agreement” and, together with the Interim Management Agreement, the “Interim Agreements”). The Advisor and the Subadvisor (together, the “Advisors”) previously served as investment advisors to the Fund pursuant to agreements (the “Prior Agreements”) that terminated in accordance with their terms on February 16, 2010, as a result of a change of control of the Advisor’s and the Subadvisor’s parent company, American Century Companies, Inc. (“ACC”). The change in control occurred as the result of a change in the trustee of a trust created by James E. Stowers, Jr., the founder of American Century Investments, which holds shares representing a significant interest in ACC stock. Mr. Stowers previously served as the trustee of the trust. On February 16, 2010, Mr. Richard W. Brown, Co-Chairman of ACC with Mr. Stowers, became the trustee in accordance with the terms of the trust and Mr. Stowers’ long-standing estate and succession plan.
On February 18, 2010, the Board approved the Interim Agreements in accordance with Rule 15a-4 under the Investment Company Act to ensure continued management of the Funds by the Advisor and the Subad-visor after the termination of the Prior Agreements and until shareholder approval of a new management agreement (the “Proposed Agreement”) as required under the Act. The Board approved the Proposed Agreement and recommended its approval to shareholders. Fund shareholders approved the Proposed Agreement at a meeting on June 16, 2010.
Because American Century had indicated its intention to merge ACGIM into ACIM prior to the expiration of the Interim Agreements, the Proposed Agreement is with ACIM as sole investment advisor to the Fund. The Board took into consideration that the combination is being undertaken for reasons of organizational simplification and will eliminate the need for multiple investment management agreements without changing the nature, quality, or extent of services provided to the Fund. The Board noted that the merger was not related to the change of control that necessitated the Interim Agreements and would not result in any change to the personnel managing the Fund.
The Interim Agreements and the Proposed Agreement are substantially identical to the Prior Agreements except for their effective dates, the termination provisions of the Interim Agreements, and the elimination of a subadvisor in the Proposed Agreement. Under the Proposed Agreement, ACIM will provide the same services as provided by ACGIM and ACIM, be subject to the same duties, and receive the same compensation rate as under the Prior Agreements.
29
Basis for Board Approval of Interim Agreements
In considering the approval of the Interim Agreements, Rule 15a-4 requires the Board to approve the contracts within ten business days of the termination of the prior agreements and to determine that the compensation to be received under each interim agreement is no greater than would have been received under the corresponding prior agreement. In connection with the approval, the Board noted that it oversees on a continuous basis and evaluates at its quarterly meetings, directly and through the committees of the Board, the nature and quality of significant services provided by the Advisor and the Subadvisor, the investment performance of the Fund, shareholder services, audit and compliance functions and a variety of other matters relating to the Fund’s operations.
In evaluating the Interim Agreements, the Board, assisted by the advice of its independent legal counsel, considered a number of factors in addition to those required by the rule with no one factor being determinative to its analysis. Among the factors considered by the Board were the circumstances and effect of the change of control, the fact that the Advisor and the Subad-visor will provide the same services and receive the same compensation rate as under the Prior Agreements, and that the change of control did not result in a change of the personnel managing the Fund. Upon completion of its analysis, the Board approved the Interim Agreements, determining that the continued management of the Fund by the Advisor and the Subadvisor was in the best interests of the Fund and Fund shareholders.
Basis for Board Approval of Proposed Agreement
At a meeting held on March 29, 2010, after considering all information presented, the Board approved, and determined to recommend that shareholders approve, the Proposed Agreement. In connection with that approval, the Board requested and reviewed extensive data and information compiled by the Advisor, the Subadvisor, and certain independent providers of evaluation data concerning the Fund and services provided to the Fund. The Board oversees on a continuous basis and evaluates at its quarterly meetings, directly and through the committees of the Board, the nature and quality of significant services provided to the Fund, the investment performance of the Fund, shareholder services, audit and compliance functions and a variety of other matters relating to the Fund’s operations. The information considered and the discussions held at the meetings included, but were not limited to:
• the nature, extent and quality of investment management, shareholder services and other services provided to the Fund;
• the wide range of programs and services provided to the Fund and their shareholders on a routine and non-routine basis;
• the compliance policies, procedures, and regulatory experience of the Advisors;
• data comparing the cost of owning the Fund to the cost of owning similar funds;
30
• the fact that there will be no changes to the fees, services, or personnel who provide such services as compared to the Prior Agreements;
• data comparing the Fund’s performance to appropriate benchmarks and/ or a peer group of other mutual funds with similar investment objectives and strategies;
• financial data showing the profitability of the Fund to the Advisors and the overall profitability of the Advisors;
• data comparing services provided and charges to the Fund with those for other non-fund investment management clients of the Advisors; and
• consideration of collateral or “fall-out” benefits derived by the Advisors from the management of the Fund and potential sharing of economies of scale in connection with the management of the Fund.
The Board also considered whether there was any reason for not continuing the existing arrangement with the Advisor. In particular, the Board recognized that shareholders may have invested in the Fund on the strength of the Advisor’s industry standing and reputation and in the expectation that the Advisor will have a continuing role in providing services to the Fund.
The Board considered all of the information provided by the Advisor, the Subadvisor, the independent data providers, and the Board’s independent counsel, and evaluated such information for the Fund. The Board did not identify any single factor as being all-important or controlling, and each Board member may have attributed different levels of importance to different factors. In deciding to approve the Proposed Agreement under the terms ultimately determined by the Board to be appropriate, the Board based its decision on a number of factors, including the following:
Nature, Extent and Quality of Services – Generally. Under the Proposed Agreement, ACIM is responsible for providing or arranging for all services necessary for the operation of the Fund. The Board noted that under the Proposed Agreement, ACIM provides or arranges at its own expense a wide variety of services including:
• constructing and designing the Fund
• portfolio research and security selection
• initial capitalization/funding
• securities trading
• Fund administration
• custody of Fund assets
31
• daily valuation of the Fund’s portfolio
• shareholder servicing and transfer agency, including shareholder confir-
mations, recordkeeping and communications
• legal services
• regulatory and portfolio compliance
• financial reporting
• marketing and distribution
The Board noted that many of these services have expanded over time both in terms of quantity and complexity in response to shareholder demands, competition in the industry, changing distribution channels and the changing regulatory environment.
Investment Management Services. The investment management services provided to the Fund are complex and provide Fund shareholders access to professional money management, instant diversification of their investments within an asset class, the opportunity to easily diversify among asset classes, and liquidity. As a part of its general oversight and in evaluating investment performance, the Board expects ACIM to manage the Fund in accordance with its investment objectives and approved strategies. In providing these services, ACIM utilizes teams of investment professionals who require extensive information technology, research, training, compliance and other systems to conduct their business. The Board, directly and through its Fund Performance Review Committee, regularly reviews investment performance information for the Fund, toget her with comparative information for appropriate benchmarks and/or peer groups of similarly-managed funds, over different time horizons. If performance concerns are identified, the Fund receives special reviews until performance improves, during which time the Board discusses with ACIM the reasons for such underperformance and any efforts being undertaken to improve performance.
Shareholder and Other Services. Under the Proposed Agreement, ACIM will also provide the Fund with a comprehensive package of transfer agency, shareholder, and other services. The Board, directly and through the various committees of the Board, regularly reviews reports and evaluations of such services. These reports include, but are not limited to, information regarding the operational efficiency and accuracy of the shareholder and transfer agency services provided, staffing levels, shareholder satisfaction (as measured by external as well as internal sources), technology support, new products and services offered to Fund shareholders, securities trading activities, portfolio valuation services, auditing services, and legal and operational compliance activities. Certain aspects of shareholder and transfer agency service level eff iciency and the quality of securities trading activities are measured by independent third party providers and are presented in comparison to other fund groups not managed by ACIM.
32
Costs of Services Provided and Profitability. The Advisor provided detailed information concerning its cost of providing various services to the Fund, its profitability in managing the Fund, its overall profitability, and its financial condition. The Board reviewed with the Advisor the methodology used to prepare this financial information. The Board has also reviewed with the Advisor its methodology for compensating the investment professionals that provide services to the Fund as well as compensation to the five highest paid personnel of the Advisor. This financial information regarding the Advisor is considered in order to evaluate the Advisor’s financial condition, its ability to continue to provide services under the Proposed Agreement, and the reasonableness of the proposed management fees. The Board concluded that the Advisor’s profits were reasonable in light of the services provided to the Fund.
Ethics. The Board generally considers ACIM’s commitment to providing quality services to shareholders and to conducting its business ethically. It noted that ACIM’s practices generally meet or exceed industry best practices.
Economies of Scale. The Board also reviewed information provided by ACIM regarding the possible existence of economies of scale in connection with the management of the Fund. The Board concluded that economies of scale are difficult to measure and predict with precision, especially on a fund-by-fund basis. The analysis of economies of scale is further complicated by the additional services and content provided by ACIM and its reinvestment in its ability to provide and expand those services. Accordingly, the Board seeks to evaluate economies of scale by reviewing information, such as year-over-year profitability of its advisor generally, the profitability of its management of the Fund specifically, and the expenses incurred by the advisor in providing various functions to the Fund. The Board believes ACIM will appropriately sha re economies of scale through its competitive fee structure, offering competitive fees from fund inception, fee breakpoints as the Fund increases in size, and through reinvestment in its business to provide shareholders additional services and enhancements to existing services.
Comparison to Fees of Funds not Managed by the Advisor. Both the Prior and Proposed Agreements provide that the Fund pays ACGIM or ACIM a single, all-inclusive (or unified) management fee for providing all services necessary for the management and operation of the Fund, other than brokerage expenses, taxes, interest, extraordinary expenses, and the fees and expenses of the Fund’s Independent Directors (including their independent legal counsel) and expenses incurred in connection with the provision of shareholder services and distribution services under a plan adopted pursuant to Rule 12b-1 under the 1940 Act. Under the unified fee structure, ACIM is responsible for providing all investment advisory, custody, audit, administrative, compliance, recordkeeping, marketing and shareholder services, or arranging and supervising third parties that provide such services. By contrast, most other funds are charged a variety of fees, including an investment advisory fee, a transfer agency fee, an administrative fee, distribution charges and other expenses. Other than their investment advisory fees and any applicable Rule 12b-1 distribution fees, the components of the total fees charged by these other funds may be increased without shareholder approval. The Board believes the unified
33
fee structure is a benefit to Fund shareholders because it clearly discloses to shareholders the cost of owning Fund shares, and, since the unified fee cannot be increased without a vote of Fund shareholders, it shifts to ACIM the risk of increased costs of operating the Fund and provides a direct incentive to minimize administrative inefficiencies. Part of the Board’s analysis of fee levels involves reviewing certain evaluative data compiled by an independent provider comparing the Fund’s unified fee to the total expense ratios of similar funds not managed by ACIM. The Board concluded that the management fee to be paid by the Fund to ACIM under the Proposed Agreement is reasonable in light of the services to be provided to the Fund.
Comparison to Fees and Services Provided to Other Clients of the Advisor. The Board also requested and received information from ACIM concerning the nature and extent of the services, fees, and profitability of its advisory services to advisory clients other than the Fund. They observed that these varying types of client accounts require different services and involve different regulatory and entrepreneurial risks than the management of the Fund. The Board analyzed this information and concluded that the fees charged and services provided to the Fund were reasonable by comparison.
Collateral or “Fall-Out” Benefits Derived by the Advisor. The Board considered the existence of collateral benefits ACIM may receive as a result of its relationship with the Fund. The Board concluded that ACIM’s primary business is managing mutual funds and it generally does not use Fund or shareholder information to generate profits in other lines of business, and therefore does not derive any significant collateral benefits from them. The Board noted that ACIM receives proprietary research from broker-dealers that execute Fund portfolio transactions and concluded that this research is likely to benefit Fund shareholders. The Board also determined that ACIM is able to provide investment management services to certain clients other than the Fund, at least in part, due to its existing infrastructure built to serv e the fund complex. The Board concluded, however, that the assets of those other clients are not material to the analysis and, in any event, are included with the assets of fund clients to determine breakpoints in each fund’s fee schedule, provided they are managed using the same investment team and strategy.
Conclusion of the Board. As a result of this process, the Board, in the absence of particular circumstances and assisted by the advice of its independent legal counsel, taking into account all of the factors discussed above and the information provided by ACIM and others, concluded that the Proposed Agreement be approved and recommended its approval to Fund shareholders.
34
Retirement Account Information
As required by law, distributions you receive from certain IRAs, or 403(b), 457 and qualified plans are subject to federal income tax withholding, unless you elect not to have withholding apply. Tax will be withheld on the total amount withdrawn even though you may be receiving amounts that are not subject to withholding, such as nondeductible contributions. In such case, excess amounts of withholding could occur. You may adjust your withholding election so that a greater or lesser amount will be withheld.
If you don’t want us to withhold on this amount, you must notify us to not withhold the federal income tax. You may notify us in writing or in certain situations by telephone or through other electronic means. You have the right to revoke your withholding election at any time and any election you make may remain in effect until revoked by filing a new election.
Remember, even if you elect not to have income tax withheld, you are liable for paying income tax on the taxable portion of your withdrawal. If you elect not to have income tax withheld or you don’t have enough income tax withheld, you may be responsible for payment of estimated tax. You may incur penalties under the estimated tax rules if your withholding and estimated tax payments are not sufficient. You can reduce or defer the income tax on a distribution by directly or indirectly rolling such distribution over to another IRA or eligible plan. You should consult your tax advisor for additional information.
State tax will be withheld if, at the time of your distribution, your address is within one of the mandatory withholding states and you have federal income tax withheld. State taxes will be withheld from your distribution in accordance with the respective state rules.
Proxy Voting Guidelines
American Century Investment Management, Inc., the fund’s investment advisor, is responsible for exercising the voting rights associated with the securities purchased and/or held by the fund. A description of the policies and procedures the advisor uses in fulfilling this responsibility is available without charge, upon request, by calling 1-800-345-2021. It is also available on American Century Investments’ website at americancentury.com and on the Securities and Exchange Commission’s website at sec.gov. Information regarding how the investment advisor voted proxies relating to portfolio securities during the most recent 12-month period ended June 30 is available on the “About Us” page at americancentury.com. It is also available at sec.gov.
Quarterly Portfolio Disclosure
The fund files its complete schedule of portfolio holdings with the Securities and Exchange Commission (SEC) for the first and third quarters of each fiscal year on Form N-Q. The fund’s Forms N-Q are available on the SEC’s website at sec.gov, and may be reviewed and copied at the SEC’s Public Reference Room in Washington, DC. Information on the operation of the Public Reference Room may be obtained by calling 1-800-SEC-0330. The fund also makes its complete schedule of portfolio holdings for the most recent quarter of its fiscal year available on its website at americancentury.com and, upon request, by calling 1-800-345-2021.
35
The following indices are used to illustrate investment market, sector, or style performance or to serve as fund performance comparisons. They are not investment products available for purchase.
Morgan Stanley Capital International (MSCI) has developed several indices that measure the performance of foreign stock markets.
The MSCI EAFE (Europe, Australasia, Far East) Index is designed to measure developed market equity performance, excluding the U.S. and Canada.
The MSCI EAFE Growth Index is a capitalization-weighted index that monitors the performance of growth stocks from Europe, Australasia, and the Far East.
The MSCI EAFE Value Index is a capitalization-weighted index that monitors the performance of value stocks from Europe, Australasia, and the Far East.
The MSCI EM (Emerging Markets) Index represents the performance of stocks in global emerging market countries.
The MSCI Europe Index is designed to measure equity market performance in Europe.
The MSCI Japan Index is designed to measure equity market performance in Japan.
The MSCI World Free Index represents the performance of stocks in developed countries (including the United States) that are available for purchase by global investors.
36

| |
| |
| Contact Us | |
| americancentury.com | |
| Automated Information Line | 1-800-345-8765 |
| Investor Services Representative | 1-800-345-2021 or |
| | 816-531-5575 |
| Investors Using Advisors | 1-800-378-9878 |
| Business, Not-For-Profit, Employer-Sponsored | |
| Retirement Plans | 1-800-345-3533 |
| Banks and Trust Companies, Broker-Dealers, | |
| Financial Professionals, Insurance Companies | 1-800-345-6488 |
| Telecommunications Device for the Deaf | 1-800-634-4113 |
| American Century World Mutual Funds, Inc. | |
| Investment Advisor: | |
| American Century Investment Management, Inc. | |
| Kansas City, Missouri | |
This report and the statements it contains are submitted for the general
information of our shareholders. The report is not authorized for distribution to
prospective investors unless preceded or accompanied by an effective prospectus.
American Century Investment Services, Inc., Distributor
©2010 American Century Proprietary Holdings, Inc. All rights reserved.
1007
CL-SAN-68671
|
| Semiannual Report |
| May 28, 2010 |

|
| American Century Investments® |
Emerging Markets Fund
| |
| President’s Letter | 2 |
| Independent Chairman’s Letter | 3 |
| Market Perspective | 4 |
| International Equity Total Returns | 4 |
| |
| Emerging Markets | |
| |
| Performance | 5 |
| Portfolio Commentary | 7 |
| Top Ten Holdings | 9 |
| Types of Investments in Portfolio | 9 |
| Investments by Country | 9 |
| |
| Shareholder Fee Example | 10 |
| |
| Financial Statements | |
| |
| Schedule of Investments | 12 |
| Statement of Assets and Liabilities | 15 |
| Statement of Operations | 16 |
| Statement of Changes in Net Assets | 17 |
| Notes to Financial Statements | 18 |
| Financial Highlights | 24 |
| |
| Other Information | |
| |
| Board Approval of Management and Subadvisory Agreements | 30 |
| Additional Information | 36 |
| Index Definitions | 37 |
Any opinions expressed in this report reflect those of the author as of the date of the report, and do not necessarily represent the opinions of American Century Investments or any other person in the American Century Investments organization. Any such opinions are subject to change at any time based upon market or other conditions and American Century Investments disclaims any responsibility to update such opinions. These opinions may not be relied upon as investment advice and, because investment decisions made by American Century Investments funds are based on numerous factors, may not be relied upon as an indication of trading intent on behalf of any American Century Investments fund. Security examples are used for representational purposes only and are not intended as recommendations to purchase or sell securities. Performance information for comparative indices and securities is provided to American Century Investments by third party vendors. To the best of American Century Investments’ knowledge, such information is accurate at the time of printing.

Dear Investor:
To learn more about the capital markets, your investment, and the portfolio management strategies American Century Investments provides, we encourage you to review this shareholder report for the financial reporting period ended May 28, 2010.
On the following pages, you will find investment performance and portfolio information, presented with the expert perspective and commentary of our portfolio management team. This report remains one of our most important vehicles for conveying the information you need about your investment performance, and about the market factors and strategies that affect fund returns. For additional information on the markets, we encourage you to visit the “Insights & News” tab at our Web site, americancentury.com, for updates and further expert commentary.
The top of our Web site’s home page also provides a link to “Our Story,” which, first and foremost, outlines our commitment—since 1958—to helping clients reach their financial goals. We believe strongly that we will only be successful when our clients are successful. That’s who we are.
Another important, unique facet of our story and who we are is “Profits with a Purpose,” which describes our bond with the Stowers Institute for Medical Research (SIMR). SIMR is a world-class biomedical organization—founded by our company founder James E. Stowers, Jr. and his wife Virginia—that is dedicated to researching the causes, treatment, and prevention of gene-based diseases, including cancer. Through American Century Investments’ private ownership structure, more than 40% of our profits support SIMR.
Mr. Stowers’ example of achieving financial success and using that platform to help humanity motivates our entire American Century Investments team. His story inspires us to help each of our clients achieve success. Thank you for sharing your financial journey with us.
Sincerely,

Jonathan Thomas
President and Chief Executive Officer
American Century Investments
2
|
| Independent Chairman’s Letter |

Fellow Shareholders,
The principal event at a recent board meeting was the retirement of Jim Stowers, Jr. from the American Century Mutual Funds Kansas City board. This was one of those times when you felt like you were living a historical moment. Jim—who celebrated his 86th birthday in January—founded what was known as Twentieth Century Mutual Funds over 50 years ago. Through the years, his number one priority has been to “Put Investors First!” The board presented Jim with a resolution acknowledging that, by building a successful investment company, he has impacted the lives of many by helping them on the path to financial success.
We respect Jim’s decision to focus his energy on the Stowers Institute for Medical Research and American Century Companies, Inc. (ACC), the parent company of the funds’ investment advisor. The pioneering medical research that Jim and his wife Virginia have made possible through the Institute should enrich the lives of millions in the future.
Shortly after his retirement from the board, we received word that ACC’s co-chairman Richard W. Brown had succeeded Jim as trustee of a trust that holds a significant interest in ACC stock as a part of Jim’s long-standing estate and business succession plan. While holding less than a majority interest, the trust is presumed to control the funds’ investment advisors under the Investment Company Act of 1940. This change triggered the need for a shareholder proxy to approve new management and subadvisory agreements for the funds. I am happy to report that all of the proposals contained in the proxy received the necessary votes and were approved.
On behalf of the board, I want to once again thank Jim for his mutual fund board service. More than three years ago, Jim and Richard Brown installed a strong and effective leadership team at American Century Investments and I look forward to continuing to work with them on behalf of fund shareholders. And while Jim no longer sits on the fund board, the inherent optimism captured by his favorite catch phrase—“The best is yet to be”—still resonates with all of us who have the privilege of serving you. I invite you to send your comments, questions or concerns to me at dhpratt@fundboardchair.com.

3

By Mark Kopinski, Chief Investment Officer, Global and Non-U.S. Equity
Events in May Sent Stocks Tumbling
Global stock returns generally remained robust for the first several months of the period, as the rally unleashed in March 2009 continued into 2010. Optimism regarding the global economic recovery and business sector gains helped keep stocks in positive territory.
Nevertheless, as spring set in, the global stock market rally ended abruptly, starting with the May 6 “Flash Crash” in the U.S. stock market, when the major indices plunged nearly 7% within 15 minutes. Furthermore, problems that had been percolating in Europe and in the global geopolitical arena boiled over in May, triggering a sharp stock market selloff. In particular, the expanding European government debt crisis beyond Greece, the downgrade of Spain’s credit rating, the worsening oil disaster in the Gulf of Mexico, and escalating tensions in the Middle East rattled investors’ nerves.
Overall, developed international equity markets significantly under-performed the U.S. market and the emerging markets. European stocks suffered the largest losses for the six-month period, as the mounting debt crisis worried investors. Exploding debt in Greece, Italy, Spain, Ireland, and Portugal all came under scrutiny.
Debt Remained the Roadblock to Growth
The sovereign debt problem did not just happen as a result of the recent financial crisis or recession; it is a longer-term issue. Recent events only exacerbated the problem and accelerated its becoming a crisis.
In fact, sovereign solvency has emerged as one of the most significant roadblocks to growth. Currently, the market is focused on Europe, where severe austerity measures are required to get fiscal balances back in order. This is likely to trim 0.5% from European growth during the next year. The weaker euro should help offset some of the decline in growth, but the more export-oriented northern countries will be the main beneficiaries. Commodity-based countries, such as Australia and Norway, have been the most resilient and have seen more impressive economic recoveries. The debt crisis likely will mean European interest rates will remain accommodative for the remainder of 2010.
| | | | |
| International Equity Total Returns | | | | |
| For the six months ended May 28, 2010* (in U.S. dollars) | |
| MSCI EAFE Index | -10.90% | | MSCI Europe Index | -14.77% |
| MSCI EAFE Growth Index | -8.85% | | MSCI World Free Index | -4.92% |
| MSCI EAFE Value Index | -12.95% | | MSCI Japan Index | 0.10% |
| MSCI EM Index | -2.75% | | | |
*Total returns for periods less than one year are not annualized and are based on the period beginning December 1, 2009.
4
| | | | | | | |
| Emerging Markets | | | | | | |
| |
| Total Returns as of May 28, 2010 | | | | | |
| | | | | Average Annual Returns | |
| | Ticker | | | | | Since | Inception |
| | Symbol | 6 months(1) | 1 year(2) | 5 years(2) | 10 years(2) | Inception | Date |
| Investor Class | TWMIX | -3.98% | 21.57% | 11.26% | 6.58% | 7.04% | 9/30/97 |
| MSCI EM | | | | | | | |
| Growth Index | — | -2.65% | 20.94% | 11.56% | 7.60% | N/A(3) | — |
| Institutional Class | AMKIX | -4.04% | 21.67% | 11.46% | 6.78% | 11.86% | 1/28/99 |
| A Class(4) | AEMMX | | | | | | 5/12/99 |
| No sales charge* | | -4.23% | 21.00% | 10.98% | 6.32% | 9.00% | |
| With sales charge* | | -9.69% | 14.09% | 9.66% | 5.69% | 8.42% | |
| B Class | ACKBX | | | | | | 9/28/07 |
| No sales charge* | | -4.68% | 20.14% | — | — | -15.44% | |
| With sales charge* | | -9.68% | 16.14% | — | — | -16.94% | |
| C Class | ACECX | | | | | | 12/18/01 |
| No sales charge* | | -4.50% | 20.29% | 10.17% | — | 11.36% | |
| With sales charge* | | -5.45% | 20.29% | 10.17% | — | 11.36% | |
| R Class | AEMRX | -4.26% | 21.01% | — | — | -14.97% | 9/28/07 |
| * | Sales charges include initial sales charges and contingent deferred sales charges (CDSCs), as applicable. A Class shares have a 5.75% maximum initial sales charge for equity funds and may be subject to a maximum CDSC of 1.00%. B Class shares redeemed within six years of purchase are subject to a CDSC that declines from 5.00% during the first year after purchase to 0.00% the sixth year after purchase. C Class shares redeemed within 12 months of purchase are subject to a maximum CDSC of 1.00%. The SEC requires that mutual funds provide performance information net of maximum sales charges in all cases where charges could be applied. |
| (1) | Total returns for periods less than one year are not annualized and are based on the period beginning December 1, 2009. |
| (2) | Total returns are based on the periods beginning June 1, 2009 for the 1 year returns, June 1, 2005 for the 5 year returns, and June 1, 2000 for the 10 year returns. |
| (3) | Benchmark data first available 1/1/99. |
| (4) | Prior to September 4, 2007, the A Class was referred to as the Advisor Class and did not have a front-end sales charge. Performance prior to that date has been adjusted to reflect this charge. |
Data presented reflect past performance. Past performance is no guarantee of future results. Current performance may be higher or lower than the performance shown. Investment return and principal value will fluctuate, and redemption value may be more or less than original cost. To obtain performance data current to the most recent month end, please call 1-800-345-2021 or visit americancentury.com. International investing involves special risks, such as political instability and currency fluctuations. Investing in emerging markets may accentuate these risks.
Unless otherwise indicated, performance reflects Investor Class shares; performance for other share classes will vary due to differences in fee structure. For information about other share classes available, please consult the prospectus. Data assumes reinvestment of dividends and capital gains, and none of the charts reflect the deduction of taxes that a shareholder would pay on fund distributions or the redemption of fund shares. Returns for the index are provided for comparison. The fund’s total returns include operating expenses (such as transaction costs and management fees) that reduce returns, while the total returns of the index do not.
5
Emerging Markets
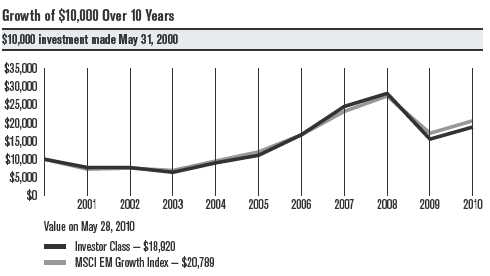
| | | | | |
| Total Annual Fund Operating Expenses | | | |
| | Institutional | | | | |
| Investor Class | Class | A Class | B Class | C Class | R Class |
| 1.78% | 1.58% | 2.03% | 2.78% | 2.78% | 2.28% |
The total annual fund operating expenses shown is as stated in the fund’s prospectus current as of the date of this report. The prospectus may vary from the expense ratio shown elsewhere in this report because it is based on a different time period, includes acquired fund fees and expenses, and, if applicable, does not include fee waivers or expense reimbursements.
Data presented reflect past performance. Past performance is no guarantee of future results. Current performance may be higher or lower than the performance shown. Investment return and principal value will fluctuate, and redemption value may be more or less than original cost. To obtain performance data current to the most recent month end, please call 1-800-345-2021 or visit americancentury.com. International investing involves special risks, such as political instability and currency fluctuations. Investing in emerging markets may accentuate these risks.
Unless otherwise indicated, performance reflects Investor Class shares; performance for other share classes will vary due to differences in fee structure. For information about other share classes available, please consult the prospectus. Data assumes reinvestment of dividends and capital gains, and none of the charts reflect the deduction of taxes that a shareholder would pay on fund distributions or the redemption of fund shares. Returns for the index are provided for comparison. The fund’s total returns include operating expenses (such as transaction costs and management fees) that reduce returns, while the total returns of the index do not.
6
Emerging Markets
Portfolio Managers: Patricia Ribeiro and Anthony Han
Performance Summary
The Emerging Markets portfolio returned -3.98%* for the six months ended May 28, 2010, compared with its benchmark, the MSCI EM Growth Index, which returned -2.65%.
Investor confidence generally remained upbeat for the first four months of the period, as the global economic recovery appeared to gain momentum and stock prices continued to climb. But, late in the period, mounting concerns about the massive levels of sovereign debt in Greece, Spain, and other European nations put an end to the yearlong global stock market rally. Stock prices fell, wiping out the gains achieved earlier in the period. Lower commodity prices, reflecting reduced economic growth expectations in the developed nations, helped drag down emerging market stocks. But, emerging market stocks fared better than their developed market counterparts, primarily because the emerging markets weren’t facing the sovereign debt problems mounting in many developed nations.
The portfolio’s underperformance relative to the benchmark primarily was due to stock selection and sector allocations, particularly in the materials and telecommunication services sectors.
China Led Detractors; Indonesia Led Contributors
From a regional perspective, the portfolio’s largest detractors to performance included China, Russia, and Chile. In each country, our stock selections hurt relative results. In addition, our underweighted positions in China and Chile were ineffective. The leading country contributors included Indonesia, South Africa, and Peru. Stock selection was effective in each country, while overweighted positions in Indonesia and Peru also helped.
Materials Sector Was Top Detractor
Poor stock selection and an underweighted position in the materials sector dragged down the portfolio’s relative performance. The metals and mining industry was the sector’s largest detractor, with our overweighted position in China’s Fushan International Energy Group among the portfolio’s weakest holdings. The company, which mines coking coal used for firing smelters in steel mills, saw its stock price steadily decline since the beginning of 2010, despite strong operating results. Macroeconomic influences, including China’s tightening efforts, combined with falling steel prices, higher production costs, and economic uncertainty in Europe, created a challenging climate for the nation’s metals and mining industry.
The portfolio’s telecommunication services and energy sectors also generated lagging results, with stock selection the primary culprit. The energy sector was home to the portfolio’s largest detractor, Petroleo Brasileiro, Brazil’s state-controlled oil company. Investor uncertainty about a major capitalization plan involving the company and the Brazilian government weighed on the stock.
*All fund returns referenced in this commentary are for Investor Class shares. Total returns for periods less than one year are not annualized and are based on the period beginning December 1, 2009.
7
Emerging Markets
Consumer Staples Led Sector Contributors
Consumer staples represented the portfolio’s top-performing sector, driven by strong stock selection. The food and staples retailing industry was the leading contributor, with CP ALL PCL, a Thailand-based company that operates convenience stores under the 7-Eleven trademark, posting the best relative performance.
The financials and health care sectors also finished the six-month period as leading contributors, with favorable stock selection driving results. In the health care sector, our overweighted position in China Shineway Pharmaceutical Group, a China-based herbal medicine provider, was the portfolio’s top-contributing stock. The company’s stock price advanced on soaring profits and improving revenues.
Outlook
Global economic activity is improving, but significant headwinds remain, particularly within the developed world, where mounting sovereign debt threatens long-term economic gains. So far, government responses to the crisis have varied, and this lack of coordination may lead to divergent economic performance in the year ahead. We expect further volatility throughout the international stock markets, yet we will continue to focus on finding companies located in emerging market countries with sustainable growth characteristics and promising long-term outlooks. Emerging markets have held up relatively well, primarily because they have managed their economies frugally throughout the past several years.
8
| |
| Emerging Markets | |
| |
| Top Ten Holdings | |
| | % of net assets |
| | as of 5/28/10 |
| Samsung Electronics Co. Ltd. | 6.5% |
| Vale SA Preference Shares | 5.9% |
| America Movil SAB de CV, Series L ADR | 2.9% |
| Infosys Technologies Ltd. | 2.8% |
| Hon Hai Precision Industry Co. Ltd. | 2.7% |
| China Life Insurance Co. Ltd. H Shares | 2.2% |
| Sberbank of Russian Federation | 2.1% |
| Itau Unibanco Holding SA Preference Shares | 2.0% |
| China Mobile Ltd. ADR | 1.8% |
| Taiwan Semiconductor Manufacturing Co. Ltd. | 1.7% |
| |
| Types of Investments in Portfolio | |
| | % of net assets |
| | as of 5/28/10 |
| Foreign Common Stocks & Rights | 99.3% |
| Temporary Cash Investments | 0.8% |
| Other Assets and Liabilities | (0.1)% |
| |
| Investments by Country | |
| | % of net assets |
| | as of 5/28/10 |
| Brazil | 14.9% |
| South Korea | 13.9% |
| India | 9.2% |
| Taiwan (Republic of China) | 9.2% |
| People’s Republic of China | 9.1% |
| South Africa | 7.1% |
| Russian Federation | 6.4% |
| Hong Kong | 5.6% |
| Mexico | 5.6% |
| Indonesia | 3.5% |
| Malaysia | 2.5% |
| Turkey | 2.1% |
| Other Countries | 10.2% |
| Cash and Equivalents* | 0.7% |
| *Includes temporary cash investments and other assets and liabilities. | |
9
|
| Shareholder Fee Example (Unaudited) |
Fund shareholders may incur two types of costs: (1) transaction costs, including sales charges (loads) on purchase payments and redemption/ exchange fees; and (2) ongoing costs, including management fees; distribution and service (12b-1) fees; and other fund expenses. This example is intended to help you understand your ongoing costs (in dollars) of investing in your fund and to compare these costs with the ongoing cost of investing in other mutual funds.
The example is based on an investment of $1,000 made at the beginning of the period and held for the entire period from December 1, 2009 to May 28, 2010.
Actual Expenses
The table provides information about actual account values and actual expenses for each class. You may use the information, together with the amount you invested, to estimate the expenses that you paid over the period. First, identify the share class you own. Then simply divide your account value by $1,000 (for example, an $8,600 account value divided by $1,000 = 8.6), then multiply the result by the number under the heading “Expenses Paid During Period” to estimate the expenses you paid on your account during this period.
If you hold Investor Class shares of any American Century Investments fund, or Institutional Class shares of the American Century Diversified Bond Fund, in an American Century Investments account (i.e., not a financial intermediary or retirement plan account), American Century Investments may charge you a $12.50 semiannual account maintenance fee if the value of those shares is less than $10,000. We will redeem shares automatically in one of your accounts to pay the $12.50 fee. In determining your total eligible investment amount, we will include your investments in all personal accounts (including American Century Investments Brokerage accounts) registered under your Social Security number. Personal accounts include individual accounts, joint accounts, UGMA/UTMA accounts, personal trusts, Coverdell Education Savings Accounts and IRAs (including traditional, Roth, Rollover, SEP-, SARSEP- and SIMPLE-IRAs), and certain other retirement accounts. If you have only business, business retirement, employer-sponsored or American Century Investments Brokerage accounts, you are currently not subject to this fee. We will not charge the fee as long as you choose to manage your accounts exclusively online. If you are subject to the Account Maintenance Fee, your account value could be reduced by the fee amount.
Hypothetical Example for Comparison Purposes
The table also provides information about hypothetical account values and hypothetical expenses based on the actual expense ratio of each class of your fund and an assumed rate of return of 5% per year before expenses, which is not the actual return of a fund’s share class. The hypothetical account values and expenses may not be used to estimate the actual ending account balance or expenses you paid for the period. You may use this information to compare the ongoing costs of investing in your fund and other funds.
To do so, compare this 5% hypothetical example with the 5% hypothetical examples that appear in the shareholder reports of the other funds.
10
Please note that the expenses shown in the table are meant to highlight your ongoing costs only and do not reflect any transactional costs, such as sales charges (loads) or redemption/exchange fees. Therefore, the table is useful in comparing ongoing costs only, and will not help you determine the relative total costs of owning different funds. In addition, if these transactional costs were included, your costs would have been higher.
| | | | |
| | Beginning | Ending | Expenses Paid | |
| | Account Value | Account Value | During Period* | Annualized |
| | 12/1/09 | 5/28/10 | 12/1/09 – 5/28/10 | Expense Ratio* |
| Actual | | | | |
| Investor Class | $1,000 | $960.20 | $8.32 | 1.73% |
| Institutional Class | $1,000 | $959.60 | $7.35 | 1.53% |
| A Class | $1,000 | $957.70 | $9.50 | 1.98% |
| B Class | $1,000 | $953.20 | $13.07 | 2.73% |
| C Class | $1,000 | $955.00 | $13.09 | 2.73% |
| R Class | $1,000 | $957.40 | $10.70 | 2.23% |
| Hypothetical | | | | |
| Investor Class | $1,000 | $1,016.04 | $8.55 | 1.73% |
| Institutional Class | $1,000 | $1,017.02 | $7.57 | 1.53% |
| A Class | $1,000 | $1,014.81 | $9.78 | 1.98% |
| B Class | $1,000 | $1,011.13 | $13.46 | 2.73% |
| C Class | $1,000 | $1,011.13 | $13.46 | 2.73% |
| R Class | $1,000 | $1,013.58 | $11.01 | 2.23% |
| * | Expenses are equal to the class’s annualized expense ratio listed in the table above, multiplied by the average account value over the period, multiplied by 179, the number of days in the most recent fiscal half-year, divided by 365, to reflect the one-half year period. |
11
|
| Schedule of Investments |
| Emerging Markets |
| | | | | | |
| MAY 28, 2010 (UNAUDITED) | | | | | | |
| |
| | Shares | Value | | | Shares | Value |
| Common Stocks & Rights — 99.3% | | JSW Steel Ltd. | 259,119 | $ 6,076,782 |
| | | | | Mundra Port and Special | | |
| BRAZIL — 14.9% | | | | Economic Zone Ltd. | 240,444 | 3,457,392 |
| Cia de Bebidas das Americas | | | | | | 52,394,121 |
| Preference Shares ADR | 47,072 | $ 4,534,916 | | | | |
| Fibria Celulose SA(1) | 246,687 | 3,955,422 | | INDONESIA — 3.5% | | |
| Gerdau SA | | | | PT Astra International Tbk | 1,329,500 | 5,981,942 |
| Preference Shares | 311,600 | 4,185,582 | | PT Bank Rakyat Indonesia | 5,198,500 | 4,699,852 |
| Hypermarcas SA(1) | 410,300 | 5,543,036 | | PT Perusahaan Gas Negara | 8,506,500 | 3,410,509 |
| Itau Unibanco Holding SA | | | | PT Semen Gresik | | |
| Preference Shares | 624,618 | 11,550,742 | | (Persero) Tbk | 6,725,000 | 6,045,227 |
| MRV Engenharia | | | | | | 20,137,530 |
| e Participacoes SA | 718,800 | 4,675,122 | | LUXEMBOURG — 1.6% | | |
| Natura Cosmeticos SA | 205,800 | 4,274,242 | | Evraz Group SA GDR(1) | 75,982 | 2,053,003 |
| PDG Realty SA | | | | Millicom International | | |
| Empreendimentos | | | | Cellular SA | 88,990 | 7,112,970 |
| e Participacoes | 524,600 | 4,510,823 | | | | 9,165,973 |
| Petroleo Brasileiro | | | | MALAYSIA — 2.5% | | |
| SA-Petrobras ADR | 222,067 | 7,910,027 | | CIMB Group Holdings Bhd | 4,398,400 | 9,058,492 |
| Vale SA | | | | | | |
| Preference Shares | 1,464,300 | 33,761,427 | | Supermax Corp. Bhd | 2,745,600 | 5,425,187 |
| | | 84,901,339 | | | | 14,483,679 |
| CANADA — 1.0% | | | | MEXICO — 5.6% | | |
| Pacific Rubiales | | | | America Movil SAB de CV, | | |
| Energy Corp.(1) | 266,066 | 5,536,721 | | Series L ADR | 351,470 | 16,638,590 |
| EGYPT — 0.9% | | | | Grupo Financiero Banorte | | |
| | | | | SAB de CV, Series O | 1,268,471 | 4,879,339 |
| Orascom | | | | | | |
| Construction Industries | 117,823 | 4,962,157 | | Mexichem SAB de CV | 1,124,649 | 2,994,596 |
| HONG KONG — 5.6% | | | | Wal-Mart de Mexico | | |
| | | | | SAB de CV | 3,183,254 | 7,106,467 |
| China Merchants Holdings | | | | | | |
| International Co. Ltd. | 1,466,000 | 4,500,733 | | | | 31,618,992 |
| China Mobile Ltd. ADR | 221,109 | 10,297,046 | | NETHERLANDS — 1.0% | | |
| | | | | X5 Retail Group NV GDR(1) | 175,517 | 5,668,810 |
| CNOOC Ltd. | 5,225,000 | 8,178,990 | | | | |
| Comba Telecom | | | | PEOPLE’S REPUBLIC OF CHINA — 9.1% | |
| Systems Holdings Ltd. | 4,928,000 | 5,815,479 | | China Life Insurance Co. Ltd. | | |
| Skyworth Digital | | | | H Shares | 2,825,000 | 12,291,765 |
| Holdings Ltd. | 4,268,000 | 3,309,577 | | China Shenhua | | |
| | | 32,101,825 | | Energy Co. Ltd. | | |
| | | | | H Shares | 654,500 | 2,609,499 |
| HUNGARY — 1.1% | | | | China Shineway | | |
| OTP Bank plc(1) | 252,952 | 6,413,672 | | Pharmaceutical Group Ltd. | 1,834,000 | 5,691,571 |
| INDIA — 9.2% | | | | China Shipping | | |
| Apollo Tyres Ltd. | 3,043,774 | 4,563,652 | | Container Lines Co. Ltd. | | |
| Ashok Leyland Ltd. | 3,865,898 | 4,996,549 | | H Shares (1) | 12,003,000 | 4,158,874 |
| Aurobindo Pharma Ltd. | 183,216 | 3,306,643 | | Ctrip.com | | |
| | | | | International Ltd. ADR(1) | 187,300 | 7,377,747 |
| Crompton Greaves Ltd. | 716,811 | 3,672,395 | | | | |
| | | | | Industrial & Commercial | | |
| HDFC Bank Ltd. | 162,236 | 6,603,467 | | Bank of China Ltd. | | |
| ICICI Bank Ltd. | 216,478 | 4,014,088 | | H Shares | 6,881,000 | 5,061,757 |
| Infosys Technologies Ltd. | 273,306 | 15,703,153 | | | | |
12
| | | | | | |
| Emerging Markets | | | | | |
| |
| |
| | Shares | Value | | | Shares | Value |
| Ping An Insurance | | | | SWITZERLAND — 0.8% | | |
| Group Co. of China Ltd. | | | | Ferrexpo plc | 1,157,579 | $ 4,444,052 |
| H Shares | 484,500 | $ 3,924,848 | | TAIWAN (REPUBLIC OF CHINA) — 9.2% | |
| Sinopharm Group Co. | | | | Eva Airways Corp.(1) | 5,836,000 | 3,227,905 |
| H Shares | 977,200 | 3,823,581 | | | | |
| Tencent Holdings Ltd. | 354,800 | 6,753,735 | | Hon Hai Precision | | |
| | | | | Industry Co. Ltd. | 3,921,480 | 15,463,181 |
| | | 51,693,377 | | | | |
| | | | | HTC Corp. | 222,000 | 2,999,956 |
| PERU — 1.2% | | | | | | |
| | | | | MediaTek, Inc. | 550,036 | 8,805,761 |
| Credicorp Ltd. | 74,171 | 6,548,558 | | | | |
| | | | | Nan Ya Printed | | |
| RUSSIAN FEDERATION — 6.4% | | | Circuit Board Corp. | 1,029,000 | 4,308,297 |
| CTC Media, Inc. | 342,273 | 5,007,454 | | Richtek Technology Corp. | 364,000 | 3,347,721 |
| NovaTek OAO GDR | 105,693 | 7,648,388 | | Taiwan Semiconductor | | |
| Polyus Gold OJSC ADR | 101,254 | 2,578,377 | | Manufacturing Co. Ltd. | 5,320,939 | 9,717,452 |
| Rosneft Oil Co. OJSC GDR | 588,138 | 4,285,889 | | Wistron Corp. | 2,525,227 | 4,131,469 |
| Sberbank of | | | | | | 52,001,742 |
| Russian Federation | 5,253,220 | 12,056,028 | | THAILAND — 1.8% | | |
| Wimm-Bill-Dann | | | | Banpu PCL | 270,000 | 4,741,412 |
| Foods OJSC ADR | 224,649 | 4,717,629 | | | | |
| | | | | CP ALL PCL | 4,480,400 | 3,745,372 |
| | | 36,293,765 | | | | |
| | | | | Kasikornbank PCL NVDR | 707,900 | 1,853,276 |
| SOUTH AFRICA — 7.1% | | | | | | |
| | | | | | | 10,340,060 |
| Aspen Pharmacare | | | | | | |
| Holdings Ltd.(1) | 664,655 | 6,976,311 | | TURKEY — 2.1% | | |
| Exxaro Resources Ltd. | 207,937 | 3,000,979 | | Asya Katilim Bankasi AS | 2,062,847 | 4,455,981 |
| Gold Fields Ltd. ADR | 177,404 | 2,439,305 | | Turkiye Garanti Bankasi AS | 1,674,014 | 7,220,625 |
| Impala Platinum | | | | | | 11,676,606 |
| Holdings Ltd. | 238,518 | 6,003,728 | | UNITED KINGDOM — 0.8% | | |
| Kumba Iron Ore Ltd. | 71,253 | 3,038,174 | | Antofagasta plc | 350,713 | 4,465,238 |
| Naspers Ltd. | | | | TOTAL COMMON STOCKS & RIGHTS | |
| N Shares | 212,155 | 8,335,799 | | (Cost $443,554,787) | | 563,966,353 |
| Shoprite Holdings Ltd. | 514,979 | 5,339,998 | | Temporary Cash Investments — 0.8% |
| Truworths International Ltd. | 725,073 | 5,179,045 | | JPMorgan U.S. Treasury | | |
| | | 40,313,339 | | Plus Money Market Fund | | |
| SOUTH KOREA — 13.9% | | | | Agency Shares | 60,022 | 60,022 |
| Doosan Infracore Co. Ltd.(1) | 220,610 | 3,176,171 | | Repurchase Agreement, Bank of America | |
| Hanjin Shipping Co. Ltd.(1) | 113,860 | 2,833,703 | | Securities, LLC, (collateralized by various | |
| | | | | U.S. Treasury obligations, 1.375%, 5/15/13, | |
| Hanjin Shipping | | | | valued at $4,810,968), in a joint trading | |
| Co. Ltd. Rights(1) | 13,424 | 75,848 | | account at 0.16%, dated 5/28/10, due | |
| Hyundai Motor Co. | 61,282 | 6,993,769 | | 6/1/10 (Delivery value $4,700,084) | 4,700,000 |
| LG Chem Ltd. | 27,607 | 6,186,520 | | TOTAL TEMPORARY | | |
| LG Household | | | | CASH INVESTMENTS | | |
| & Health Care Ltd. | 29,969 | 7,885,989 | | (Cost $4,760,022) | | 4,760,022 |
| Lumens Co. Ltd.(1) | 332,387 | 3,559,808 | | TOTAL INVESTMENT | | |
| | | | | SECURITIES — 100.1% | | |
| POSCO | 12,644 | 4,930,801 | | (Cost $448,314,809) | | 568,726,375 |
| Samsung | | | | OTHER ASSETS | | |
| Electronics Co. Ltd. | 57,207 | 36,977,228 | | AND LIABILITIES — (0.1)% | | (432,597) |
| Shinhan Financial | | | | TOTAL NET ASSETS — 100.0% | | $568,293,778 |
| Group Co. Ltd. | 175,360 | 6,184,960 | | | | |
| | | 78,804,797 | | | | |
13
| | | |
| Emerging Markets | | | |
| |
| Market Sector Diversification | | | Notes to Schedule of Investments |
| (as a % of net assets) | | | ADR = American Depositary Receipt |
| Information Technology | 20.7% | | GDR = Global Depositary Receipt |
| Financials | 18.8% | | NVDR = Non-Voting Depositary Receipt |
| Materials | 16.9% | | OJSC = Open Joint Stock Company |
| Consumer Discretionary | 9.9% | | (1) Non-income producing. |
| Consumer Staples | 8.6% | | |
| Energy | 7.2% | | |
| Industrials | 6.2% | | See Notes to Financial Statements. |
| Telecommunication Services | 6.0% | | |
| Health Care | 4.4% | | |
| Utilities | 0.6% | | |
| Cash and Equivalents* | 0.7% | | |
| *Includes temporary cash investments and other assets and liabilities. | | |
14
|
| Statement of Assets and Liabilities |
| | | | |
| MAY 28, 2010 (UNAUDITED) | | | | |
| Assets | | | | |
| Investment securities, at value (cost of $448,314,809) | | | $568,726,375 |
| Foreign currency holdings, at value (cost of $1,046,472) | | | 1,046,518 |
| Receivable for capital shares sold | | | | 325,181 |
| Dividends and interest receivable | | | | 1,969,161 |
| Other assets | | | | 252,343 |
| | | | | 572,319,578 |
| | | | | |
| Liabilities | | | | |
| Disbursements in excess of demand deposit cash | | | 27,952 |
| Payable for investments purchased | | | | 2,837,998 |
| Payable for capital shares redeemed | | | | 376,412 |
| Accrued management fees | | | | 774,966 |
| Service fees (and distribution fees — A Class and R Class) payable | | | 5,464 |
| Distribution fees payable | | | | 3,008 |
| | | | | 4,025,800 |
| | | | | |
| Net Assets | | | | $568,293,778 |
| | | | | |
| Net Assets Consist of: | | | | |
| Capital (par value and paid-in surplus) | | | | $ 680,310,896 |
| Accumulated net investment loss | | | | (53,553) |
| Accumulated net realized loss on investment and foreign currency transactions | | (232,353,010) |
| Net unrealized appreciation on investments and translation of assets and liabilities in foreign currencies | 120,389,445 |
| | | | | $ 568,293,778 |
| |
| | Net assets | Shares outstanding | Net asset value per share |
| Investor Class, $0.01 Par Value | $507,705,733 | 72,666,857 | $6.99 |
| Institutional Class, $0.01 Par Value | $33,834,546 | 4,742,668 | $7.13 |
| A Class, $0.01 Par Value | $21,142,456 | 3,106,550 | $6.81* |
| B Class, $0.01 Par Value | $234,061 | 33,793 | $6.93 |
| C Class, $0.01 Par Value | $4,749,229 | 722,137 | $6.58 |
| R Class, $0.01 Par Value | $627,753 | 90,112 | $6.97 |
| * Maximum offering price $7.23 (net asset value divided by 0.9425) | | | |
| |
| |
| See Notes to Financial Statements. | | | | |
15
| |
| FOR THE SIX MONTHS ENDED MAY 28, 2010 (UNAUDITED) | |
| Investment Income (Loss) | |
| Income: | |
| Dividends (net of foreign taxes withheld of $338,897) | $ 5,320,515 |
| Interest | 1,656 |
| | 5,322,171 |
| Expenses: | |
| Management fees | 5,280,386 |
| Distribution fees: | |
| B Class | 919 |
| C Class | 19,544 |
| Service fees: | |
| B Class | 306 |
| C Class | 6,515 |
| Distribution and service fees: | |
| A Class | 28,739 |
| R Class | 1,411 |
| Directors’ fees and expenses | 9,358 |
| Other expenses | 28,546 |
| | 5,375,724 |
| | |
| Net investment income (loss) | (53,553) |
| | |
| Realized and Unrealized Gain (Loss) | |
| Net realized gain (loss) on: | |
| Investment transactions | 38,005,794 |
| Foreign currency transactions (net of foreign tax expenses paid (refunded) of $93,723) | 5,298,823 |
| | 43,304,617 |
| | |
| Change in net unrealized appreciation (depreciation) on: | |
| Investments (net of deferred foreign taxes of $(858,586)) | (55,205,079) |
| Translation of assets and liabilities in foreign currencies | (12,261,154) |
| | (67,466,233) |
| | |
| Net realized and unrealized gain (loss) | (24,161,616) |
| | |
| Net Increase (Decrease) in Net Assets Resulting from Operations | $(24,215,169) |
| |
| |
| See Notes to Financial Statements. | |
16
|
| Statement of Changes in Net Assets |
| | |
| SIX MONTHS ENDED MAY 28, 2010 (UNAUDITED) AND YEAR ENDED NOVEMBER 30, 2009 | |
| Increase (Decrease) in Net Assets | 2010 | 2009 |
| Operations | | |
| Net investment income (loss) | $ (53,553) | $ 533,727 |
| Net realized gain (loss) | 43,304,617 | (82,169,040) |
| Change in net unrealized appreciation (depreciation) | (67,466,233) | 347,324,450 |
| Net increase (decrease) in net assets resulting from operations | (24,215,169) | 265,689,137 |
| | | |
| Distributions to Shareholders | | |
| From net investment income: | | |
| Investor Class | — | (1,926,383) |
| Institutional Class | — | (220,437) |
| A Class | — | (68,022) |
| R Class | — | (418) |
| Decrease in net assets from distributions | — | (2,215,260) |
| | | |
| Capital Share Transactions | | |
| Net increase (decrease) in net assets from capital share transactions | (32,087,829) | (3,779,410) |
| | | |
| Redemption Fees | | |
| Increase in net assets from redemption fees | 172,071 | 222,324 |
| | | |
| Net increase (decrease) in net assets | (56,130,927) | 259,916,791 |
| | | |
| Net Assets | | |
| Beginning of period | 624,424,705 | 364,507,914 |
| End of period | $568,293,778 | $624,424,705 |
| | | |
| Accumulated net investment loss | $(53,553) | — |
See Notes to Financial Statements.
17
|
| Notes to Financial Statements |
MAY 28, 2010 (UNAUDITED)
1. Organization and Summary of Significant Accounting Policies
Organization — American Century World Mutual Funds, Inc. (the corporation) is registered under the Investment Company Act of 1940 (the 1940 Act) as an open-end management investment company. Emerging Markets Fund (the fund) is one fund in a series issued by the corporation. The fund is diversified under the 1940 Act. The fund’s investment objective is to seek capital growth. The fund pursues its objective by investing at least 80% of its assets in securities of issuers in emerging market countries. The following is a summary of the fund’s significant accounting policies.
Multiple Class — The fund is authorized to issue the Investor Class, the Institutional Class, the A Class, the B Class, the C Class and the R Class. The A Class may incur an initial sales charge. The A Class, B Class and C Class may be subject to a contingent deferred sales charge. The share classes differ principally in their respective sales charges and distribution and shareholder servicing expenses and arrangements. All shares of the fund represent an equal pro rata interest in the net assets of the class to which such shares belong, and have identical voting, dividend, liquidation and other rights and the same terms and conditions, except for class specific expenses and exclusive rights to vote on matters affecting only individual classes. Income, non-class specific expenses, and realized and unrealized capital gains and losses of the fund are allocated to each class of shares based on their relative net assets.
Security Valuations — Securities traded primarily on a principal securities exchange are valued at the last reported sales price, or at the mean of the latest bid and asked prices where no last sales price is available. Depending on local convention or regulation, securities traded over-the-counter are valued at the mean of the latest bid and asked prices, the last sales price, or the official close price. Investments in open-end management investment companies are valued at the reported net asset value. Discount notes may be valued through a commercial pricing service or at amortized cost, which approximates fair value. Securities traded on foreign securities exchanges and over-the-counter markets are normally completed before the close of business on days that the New York Stock Exchange (the Exchange) is open and may also take place on days when the Exchange is not open. If an event occurs after the value of a security was established but before the net asset value per share was determined that was likely to materially change the net asset value, that security would be valued as determined in accordance with procedures adopted by the Board of Directors. If the fund determines that the market price of a portfolio security is not readily available, or that the valuation methods mentioned above do not reflect the security’s fair value, such security is valued as determined by the Board of Directors or its designee, in accordance with procedures adopted by the Board of Directors, if such determination would materially impact a fund’s net asset value. Certain other circumstances may cause the fund to use alternative procedures to value a security such as: a security has been declared in default; trading in a security has been halted during the trading day; or there is a foreign market holiday and no trading will commence .
Security Transactions — For financial reporting purposes, security transactions are accounted for as of the trade date. Net realized gains and losses are determined on the identified cost basis, which is also used for federal income tax purposes. Certain countries impose taxes on realized gains on the sale of securities registered in their country. The fund records the foreign tax expense, if any, on an accrual basis. The foreign tax expense on realized gains and unrealized appreciation reduces the net realized gain (loss) on investment transactions and net unrealized appreciation (depreciation) on investments, respectively.
Investment Income — Dividend income less foreign taxes withheld, if any, is recorded as of the ex-dividend date. Interest income is recorded on the accrual basis and includes accretion of discounts and amortization of premiums.
18
Foreign Currency Translations — All assets and liabilities initially expressed in foreign currencies are translated into U.S. dollars at prevailing exchange rates at period end. The fund may enter into spot foreign currency exchange contracts to facilitate transactions denominated in a foreign currency. Purchases and sales of investment securities, dividend and interest income, spot foreign currency exchange contracts, and certain expenses are translated at the rates of exchange prevailing on the respective dates of such transactions. Realized and unrealized gains and losses from foreign currency translations arise from changes in currency exchange rates.
Net realized and unrealized foreign currency exchange gains or losses occurring during the holding period of investment securities are a component of net realized gain (loss) on foreign currency transactions and net unrealized appreciation (depreciation) on translation of assets and liabilities in foreign currencies, respectively. Certain countries may impose taxes on the contract amount of purchases and sales of foreign currency contracts in their currency. The fund records the foreign tax expense, if any, as a reduction to the net realized gain (loss) on foreign currency transactions.
Repurchase Agreements — The fund may enter into repurchase agreements with institutions that American Century Investment Management, Inc. (ACIM) has determined are creditworthy pursuant to criteria adopted by the Board of Directors. Each repurchase agreement is recorded at cost. The fund requires that the collateral, represented by securities, received in a repurchase transaction be transferred to the custodian in a manner sufficient to enable the fund to obtain those securities in the event of a default under the repurchase agreement. ACIM monitors, on a daily basis, the securities transferred to ensure the value, including accrued interest, of the securities under each repurchase agreement is equal to or greater than amounts owed to the fund under each repurchase agreement.
Joint Trading Account — Pursuant to an Exemptive Order issued by the Securities and Exchange Commission, the fund, along with certain other funds in the American Century Investments family of funds, may transfer uninvested cash balances into a joint trading account. These balances are invested in one or more repurchase agreements that are collateralized by U.S. Treasury or Agency obligations.
Income Tax Status — It is the fund’s policy to distribute substantially all net investment income and net realized gains to shareholders and to otherwise qualify as a regulated investment company under provisions of the Internal Revenue Code. The fund is no longer subject to examination by tax authorities for years prior to 2006. Additionally, non-U.S. tax returns filed by the fund due to investments in certain foreign securities remain subject to examination by the relevant taxing authority for 7 years from the date of filing. At this time, management believes there are no uncertain tax positions which, based on their technical merit, would not be sustained upon examination and for which it is reasonably possible that the total amounts of unrecognized tax benefits will significantly change in the next twelve months. Accordingly, no provision has been made for federal or state income taxes.
Distributions to Shareholders — Distributions to shareholders are recorded on the ex-dividend date. Distributions from net investment income, if any, are generally declared and paid annually. Distributions from net realized gains, if any, are generally declared and paid twice per year. The fund may make distributions on a more frequent basis to comply with the distribution requirements of the Internal Revenue Code, in all events in a manner consistent with provisions of the 1940 Act.
Redemption — The fund may impose a 2.00% redemption fee on shares held less than 180 days. The fee may not be applicable to all classes. The redemption fee is retained by the fund and helps cover transaction costs that long-term investors may bear when the fund sells securities to meet investor redemptions.
19
Indemnifications — Under the corporation’s organizational documents, its officers and directors are indemnified against certain liabilities arising out of the performance of their duties to the fund. In addition, in the normal course of business, the fund enters into contracts that provide general indemnifications. The maximum exposure under these arrangements is unknown as this would involve future claims that may be made against a fund. The risk of material loss from such claims is considered by management to be remote.
Use of Estimates — The financial statements are prepared in conformity with accounting principles generally accepted in the United States of America, which may require management to make certain estimates and assumptions at the date of the financial statements. Actual results could differ from these estimates.
Subsequent Events — In preparing the financial statements, management evaluated the impact of events or transactions occurring through the date the financial statements were issued that would merit recognition or disclosure.
2. Fees and Transactions with Related Parties
Management Fees — The corporation has entered into a Management Agreement with American Century Global Investment Management, Inc. (ACGIM) (the investment advisor) (see Note 9), under which ACGIM provides the fund with investment advisory and management services in exchange for a single, unified management fee (the fee) per class. The Agreement provides that all expenses of managing and operating the fund, except brokerage expenses, taxes, interest, fees and expenses of the independent directors (including legal counsel fees), and extraordinary expenses, will be paid by ACGIM. The fee is computed and accrued daily based on the daily net assets of the specific class of shares of the fund and paid monthly in arrears. For funds with a stepped fee schedule, the rate of the fee is determined by applying a fee rate calculation formula. This formula takes into account the fund’s assets as well as certain assets, if any, of other clients of the investment advisor outside the American Century Investments family of funds (such as subadvised funds and separate accounts) that have very similar investment teams and investment strategies (strategy assets). The strategy assets of the fund includes the assets of NT Emerging Markets Fund, one fund in a series issued by the corporation. The annual management fee schedule ranges from 1.25% to 1.85% for the Investor Class, A Class, B Class, C Class and R Class. The Institutional Class is 0.20% less at each point within the range. The effective annual management fee for each class for the six months ended May 28, 2010 was 1.72% for the Investor Class, A Class, B Class, C Class and R Class and 1.52% for the Institutional Class.
ACGIM has entered into a Subadvisory Agreement with ACIM (the subadvisor) on behalf of the fund. The subadvisor makes investment decisions for the cash portion of the fund in accordance with the fund’s investment objectives, policies and restrictions under the supervision of ACGIM and the Board of Directors. ACGIM pays all costs associated with retaining ACIM as the subadvisor of the fund.
Distribution and Service Fees — The Board of Directors has adopted a separate Master Distribution and Individual Shareholder Services Plan for each of the A Class, B Class, C Class and R Class (collectively the plans), pursuant to Rule 12b-1 of the 1940 Act. The plans provide that the A Class will pay American Century Investment Services, Inc. (ACIS) an annual distribution and service fee of 0.25%. The plans provide that the B Class and the C Class will each pay ACIS an annual distribution fee of 0.75% and service fee of 0.25%. The plans provide that the R Class will pay ACIS an annual distribution and service fee of 0.50%. The fees are computed and accrued daily based on each class’s daily net assets and paid monthly in arrears. The fees are used to pay financial intermediaries for distribution and individual shareh older services. Fees incurred under the plans during the six months ended May 28, 2010, are detailed in the Statement of Operations.
20
Related Parties — Certain officers and directors of the corporation are also officers and/ or directors of American Century Companies, Inc. (ACC), the parent of the corporation’s investment advisor, ACGIM, the corporation’s subadvisor, ACIM, the distributor of the corporation, ACIS, and the corporation’s transfer agent, American Century Services, LLC.
The fund is eligible to invest in a money market fund for temporary purposes, which is managed by J.P. Morgan Investment Management, Inc. (JPMIM). The fund has a Mutual Funds Services Agreement with J.P. Morgan Investor Services Co. (JPMIS) and a securities lending agreement with JPMorgan Chase Bank (JPMCB). JPMCB is a custodian of the fund. JPMIM, JPMIS and JPMCB are wholly owned subsidiaries of JPMorgan Chase & Co. (JPM). JPM is an equity investor in ACC.
3. Investment Transactions
Purchases and sales of investment securities, excluding short-term investments, for the six months ended May 28, 2010, were $296,943,577 and $320,202,598, respectively.
4. Capital Share Transactions
Transactions in shares of the fund were as follows:
| | | | |
| | Six months ended May 28, 2010 | Year ended November 30, 2009 |
| | Shares | Amount | Shares | Amount |
| Investor Class/Shares Authorized | 235,000,000 | | 235,000,000 | |
| Sold | 6,011,177 | $ 45,428,391 | 19,353,332 | $109,588,071 |
| Issued in reinvestment of distributions | — | — | 411,216 | 1,603,788 |
| Redeemed | (11,235,759) | (82,969,532) | (17,730,654) | (92,632,289) |
| | (5,224,582) | (37,541,141) | 2,033,894 | 18,559,570 |
| Institutional Class/Shares Authorized | 40,000,000 | | 40,000,000 | |
| Sold | 1,642,796 | 11,686,874 | 1,317,412 | 7,262,735 |
| Issued in reinvestment of distributions | — | — | 55,526 | 220,437 |
| Redeemed | (640,264) | (4,801,518) | (4,026,999) | (25,605,195) |
| | 1,002,532 | 6,885,356 | (2,654,061) | (18,122,023) |
| A Class/Shares Authorized | 40,000,000 | | 40,000,000 | |
| Sold | 545,014 | 3,974,662 | 1,737,602 | 8,969,379 |
| Issued in reinvestment of distributions | — | — | 17,381 | 66,223 |
| Redeemed | (713,256) | (5,189,119) | (2,684,625) | (13,476,300) |
| | (168,242) | (1,214,457) | (929,642) | (4,440,698) |
| B Class/Shares Authorized | 10,000,000 | | 10,000,000 | |
| Sold | 3,156 | 24,257 | 20,988 | 121,866 |
| Redeemed | (2,625) | (19,329) | (14,744) | (73,057) |
| | 531 | 4,928 | 6,244 | 48,809 |
| C Class/Shares Authorized | 5,000,000 | | 5,000,000 | |
| Sold | 102,819 | 742,978 | 260,381 | 1,420,013 |
| Redeemed | (160,447) | (1,112,296) | (292,711) | (1,421,591) |
| | (57,628) | (369,318) | (32,330) | (1,578) |
| R Class/Shares Authorized | 10,000,000 | | 10,000,000 | |
| Sold | 49,936 | 379,742 | 59,323 | 312,438 |
| Issued in reinvestment of distributions | — | — | 107 | 418 |
| Redeemed | (30,730) | (232,939) | (22,963) | (136,346) |
| | 19,206 | 146,803 | 36,467 | 176,510 |
| Net increase (decrease) | (4,428,183) | $(32,087,829) | (1,539,428) | $ (3,779,410) |
21
5. Fair Value Measurements
The fund’s securities valuation process is based on several considerations and may use multiple inputs to determine the fair value of the positions held by the fund. In conformity with accounting principles generally accepted in the United States of America, the inputs used to determine a valuation are classified into three broad levels as follows:
• Level 1 valuation inputs consist of unadjusted quoted prices in an active market for identical securities;
• Level 2 valuation inputs consist of significant direct or indirect observable market data (including quoted prices for similar securities, evaluations of subsequent market events, interest rates, prepayment speeds, credit risk, etc.); or
• Level 3 valuation inputs consist of significant unobservable inputs (including a fund’s own assumptions).
The level classification is based on the lowest level input that is significant to the fair valuation measurement. The valuation inputs are not an indication of the risks associated with investing in these securities or other financial instruments.
The following is a summary of the valuation inputs used to determine the fair value of the fund’s securities as of May 28, 2010. The Schedule of Investments provides additional details on the fund’s portfolio holdings.
| | | |
| | Level 1 | Level 2 | Level 3 |
| Investment Securities | | | |
| Foreign Common Stocks & Rights | $72,584,242 | $491,382,111 | — |
| Temporary Cash Investments | 60,022 | 4,700,000 | — |
| Total Value of Investment Securities | $72,644,264 | $496,082,111 | — |
6. Risk Factors
There are certain risks involved in investing in foreign securities. These risks include those resulting from future adverse political, social, and economic developments, fluctuations in currency exchange rates, the possible imposition of exchange controls, and other foreign laws or restrictions. Investing in emerging markets may accentuate these risks.
7. Interfund Lending
The fund, along with certain other funds in the American Century Investments family of funds, may participate in an interfund lending program, pursuant to an Exemptive Order issued by the Securities and Exchange Commission (SEC). This program provides an alternative credit facility allowing the fund to borrow from or lend to other funds in the American Century Investments family of funds that permit such transactions. Interfund lending transactions are subject to each fund’s investment policies and borrowing and lending limits. The interfund loan rate earned/paid on interfund lending transactions is determined daily based on the average of certain current market rates. Interfund lending transactions normally extend only overnight, but can have a maximum duration of seven days. The program is subject to annual approval by the Board of Directors. During the six months ended May 28, 2010, the fund did not utiliz e the program.
22
8. Federal Tax Information
The book-basis character of distributions made during the year from net investment income or net realized gains may differ from their ultimate characterization for federal income tax purposes. These differences reflect the differing character of certain income items and net realized gains and losses for financial statement and tax purposes, and may result in reclassification among certain capital accounts on the financial statements.
As of May 28, 2010, the components of investments for federal income tax purposes were as follows:
| |
| Federal tax cost of investments | $454,791,279 |
| Gross tax appreciation of investments | $130,227,915 |
| Gross tax depreciation of investments | (16,292,819) |
| Net tax appreciation (depreciation) of investments | $113,935,096 |
The difference between book-basis and tax-basis cost and unrealized appreciation (depreciation) is attributable primarily to the tax deferral of losses on wash sales.
As of November 30, 2009, the fund had accumulated capital losses of $(267,941,226), which represent net capital loss carryovers that may be used to offset future realized capital gains for federal income tax purposes. Future capital loss carryover utilization in any given year may be subject to Internal Revenue Code limitations. Capital loss carryovers of $(150,745,366) and $(117,195,860) expire in 2016 and 2017, respectively.
The fund had a capital loss deferral of $(781,958), which represent net capital losses incurred in the one-month period ended November 30, 2009. The fund has elected to treat such losses as having been incurred in the following fiscal year for federal income tax purposes.
9. Corporate Event
As part of a long-standing estate and business succession plan established by ACC Co-Chairman James E. Stowers, Jr., the founder of American Century Investments, ACC Co-Chairman Richard W. Brown succeeded Mr. Stowers as trustee of a trust that holds a greater-than-25% voting interest in ACC, the parent corporation of the fund’s advisors. Under the 1940 Act, this is presumed to represent control of ACC even though it is less than a majority interest. The change of trustee may technically be considered a “change of control” of ACC and therefore also a change of control of the fund’s advisors even though there has been no change to their management and none is anticipated. The “change of control” resulted in the assignment of the fund’s investment advisory and subadvisory agreements. Under the 1940 Act, an assignment automatically terminated such agreements, making the approval of a new agreement necessary.
On February 16, 2010, the Board of Directors approved interim investment advisory and subadvisory agreements under which the fund will be managed until a new agreement is approved by fund shareholders. The interim agreements are substantially identical to the terminated agreements (with the exception of different effective and termination dates) and will not result in changes in the management of American Century Investments, the fund, its investment objectives, fees or services provided. On March 29, 2010, the Board of Directors approved a new investment advisory agreement. The new agreement is also substantially identical to the terminated agreement (except for the date, the substitution of ACIM for ACGIM and certain other non-material changes). In order to streamline American Century’s corporate organization, ACGIM was merged into ACIM on July 16, 2010. The new agreement for the fund was approved by shareh olders at a Special Meeting of Shareholders on June 16, 2010. The new agreement went into effect on July 16, 2010.
23
| | | | | | |
| Emerging Markets | | | | | |
| |
| Investor Class | | | | | | |
| For a Share Outstanding Throughout the Years Ended November 30 (except as noted) | | |
| | 2010(1) | 2009 | 2008 | 2007 | 2006 | 2005 |
| Per-Share Data | | | | | | |
| Net Asset Value, | | | | | | |
| Beginning of Period | $7.28 | $4.17 | $12.69 | $10.06 | $8.25 | $6.28 |
| Income From | | | | | | |
| Investment Operations | | | | | | |
| Net Investment | | | | | | |
| Income (Loss)(2) | —(3) | 0.01 | 0.09 | 0.10 | 0.11 | 0.01 |
| Net Realized and | | | | | | |
| Unrealized Gain (Loss) | (0.29) | 3.13 | (7.21) | 4.06 | 3.11 | 2.05 |
| Total From | | | | | | |
| Investment Operations | (0.29) | 3.14 | (7.12) | 4.16 | 3.22 | 2.06 |
| Distributions | | | | | | |
| From Net | | | | | | |
| Investment Income | — | (0.03) | (0.10) | (0.13) | (0.05) | — |
| From Net Realized Gains | — | — | (1.31) | (1.42) | (1.37) | (0.09) |
| Total Distributions | — | (0.03) | (1.41) | (1.55) | (1.42) | (0.09) |
| Redemption Fees(2) | —(3) | —(3) | 0.01 | 0.02 | 0.01 | —(3) |
| Net Asset Value, | | | | | | |
| End of Period | $6.99 | $7.28 | $4.17 | $12.69 | $10.06 | $8.25 |
| |
| Total Return(4) | (3.98)% | 75.36% | (62.66)% | 48.81% | 46.10% | 33.10% |
| |
| Ratios/Supplemental Data | | | | | | |
| Ratio of Operating | | | | | | |
| Expenses to Average | | | | | | |
| Net Assets | 1.73%(5) | 1.78% | 1.66% | 1.66% | 1.80% | 1.94% |
| Ratio of Net Investment | | | | | | |
| Income (Loss) to | | | | | | |
| Average Net Assets | (0.01)%(5) | 0.11% | 1.06% | 0.96% | 1.31% | 0.17% |
| Portfolio Turnover Rate | 48% | 126% | 121% | 85% | 115% | 153% |
| Net Assets, End of Period | | | | | | |
| (in thousands) | $507,706 | $567,248 | $316,695 | $1,070,138 | $523,813 | $220,720 |
| (1) | Six months ended May 28, 2010 (unaudited). |
| (2) | Computed using average shares outstanding throughout the period. |
| (3) | Per-share amount was less than $0.005. |
| (4) | Total return assumes reinvestment of net investment income and capital gains distributions, if any. Total returns for periods less than one year are not annualized. Total returns are calculated based on the net asset value of the last business day. The total return of the classes may not precisely reflect the class expense differences because of the impact of calculating the net asset values to two decimal places. If net asset values were calculated to three decimal places, the total return differences would more closely reflect the class expense differences. The calculation of net asset values to two decimal places is made in accordance with SEC guidelines and does not result in any gain or loss of value between one class and another. |
| (5) | Annualized. |
See Notes to Financial Statements.
24
| | | | | | |
| Emerging Markets | | | | | |
| |
| Institutional Class | | | | | | |
| For a Share Outstanding Throughout the Years Ended November 30 (except as noted) | | |
| | 2010(1) | 2009 | 2008 | 2007 | 2006 | 2005 |
| Per-Share Data | | | | | | |
| Net Asset Value, | | | | | | |
| Beginning of Period | $7.43 | $4.26 | $12.92 | $10.21 | $8.36 | $6.35 |
| Income From | | | | | | |
| Investment Operations | | | | | | |
| Net Investment | | | | | | |
| Income (Loss)(2) | 0.01 | 0.02 | 0.12 | 0.12 | 0.12 | 0.03 |
| Net Realized and | | | | | | |
| Unrealized Gain (Loss) | (0.31) | 3.18 | (7.35) | 4.14 | 3.16 | 2.07 |
| Total From | | | | | | |
| Investment Operations | (0.30) | 3.20 | (7.23) | 4.26 | 3.28 | 2.10 |
| Distributions | | | | | | |
| From Net | | | | | | |
| Investment Income | — | (0.03) | (0.13) | (0.15) | (0.07) | — |
| From Net Realized Gains | — | — | (1.31) | (1.42) | (1.37) | (0.09) |
| Total Distributions | — | (0.03) | (1.44) | (1.57) | (1.44) | (0.09) |
| Redemption Fees(2) | —(3) | —(3) | 0.01 | 0.02 | 0.01 | —(3) |
| Net Asset Value, | | | | | | |
| End of Period | $7.13 | $7.43 | $4.26 | $12.92 | $10.21 | $8.36 |
| |
| Total Return(4) | (4.04)% | 75.92% | (62.63)% | 49.21% | 46.31% | 33.37% |
| |
| Ratios/Supplemental Data | | | | | | |
| Ratio of Operating | | | | | | |
| Expenses to Average | | | | | | |
| Net Assets | 1.53%(5) | 1.58% | 1.46% | 1.46% | 1.60% | 1.74% |
| Ratio of Net Investment | | | | | | |
| Income (Loss) to | | | | | | |
| Average Net Assets | 0.19%(5) | 0.31% | 1.26% | 1.16% | 1.51% | 0.37% |
| Portfolio Turnover Rate | 48% | 126% | 121% | 85% | 115% | 153% |
| Net Assets, End of Period | | | | | | |
| (in thousands) | $33,835 | $27,787 | $27,235 | $74,897 | $85,886 | $113,765 |
| (1) | Six months ended May 28, 2010 (unaudited). |
| (2) | Computed using average shares outstanding throughout the period. |
| (3) | Per-share amount was less than $0.005. |
| (4) | Total return assumes reinvestment of net investment income and capital gains distributions, if any. Total returns for periods less than one year are not annualized. Total returns are calculated based on the net asset value of the last business day. The total return of the classes may not precisely reflect the class expense differences because of the impact of calculating the net asset values to two decimal places. If net asset values were calculated to three decimal places, the total return differences would more closely reflect the class expense differences. The calculation of net asset values to two decimal places is made in accordance with SEC guidelines and does not result in any gain or loss of value between one class and another. |
| (5) | Annualized. |
See Notes to Financial Statements.
25
| | | | | | |
| Emerging Markets | | | | | |
| |
| A Class(1) | | | | | | |
| For a Share Outstanding Throughout the Years Ended November 30 (except as noted) | | |
| | 2010(2) | 2009 | 2008 | 2007 | 2006 | 2005 |
| Per-Share Data | | | | | | |
| Net Asset Value, | | | | | | |
| Beginning of Period | $7.10 | $4.07 | $12.40 | $9.85 | $8.11 | $6.19 |
| Income From�� | | | | | | |
| Investment Operations | | | | | | |
| Net Investment | | | | | | |
| Income (Loss)(3) | (0.01) | (0.01) | 0.07 | 0.07 | 0.11 | (0.01) |
| Net Realized and | | | | | | |
| Unrealized Gain (Loss) | (0.28) | 3.06 | (7.03) | 3.99 | 3.02 | 2.02 |
| Total From | | | | | | |
| Investment Operations | (0.29) | 3.05 | (6.96) | 4.06 | 3.13 | 2.01 |
| Distributions | | | | | | |
| From Net | | | | | | |
| Investment Income | — | (0.02) | (0.07) | (0.11) | (0.03) | — |
| From Net Realized Gains | — | — | (1.31) | (1.42) | (1.37) | (0.09) |
| Total Distributions | — | (0.02) | (1.38) | (1.53) | (1.40) | (0.09) |
| Redemption Fees(3) | —(4) | —(4) | 0.01 | 0.02 | 0.01 | —(4) |
| Net Asset Value, | | | | | | |
| End of Period | $6.81 | $7.10 | $4.07 | $12.40 | $9.85 | $8.11 |
| |
| Total Return(5) | (4.23)% | 75.24% | (62.78)% | 48.61% | 45.59% | 32.77% |
| |
| Ratios/Supplemental Data | | | | | | |
| Ratio of Operating | | | | | | |
| Expenses to Average | | | | | | |
| Net Assets | 1.98%(6) | 2.03% | 1.91% | 1.91% | 2.05% | 2.19% |
| Ratio of Net Investment | | | | | | |
| Income (Loss) to | | | | | | |
| Average Net Assets | (0.26)%(6) | (0.14)% | 0.81% | 0.71% | 1.06% | (0.08)% |
| Portfolio Turnover Rate | 48% | 126% | 121% | 85% | 115% | 153% |
| Net Assets, End of Period | | | | | | |
| (in thousands) | $21,142 | $23,260 | $17,105 | $36,795 | $9,905 | $1,773 |
| (1) | Prior to September 4, 2007, the A Class was referred to as the Advisor Class. |
| (2) | Six months ended May 28, 2010 (unaudited). |
| (3) | Computed using average shares outstanding throughout the period. |
| (4) | Per-share amount was less than $0.005. |
| (5) | Total return assumes reinvestment of net investment income and capital gains distributions, if any, and does not reflect applicable sales charges. Total returns for periods less than one year are not annualized. Total returns are calculated based on the net asset value of the last business day. |
| | The total return of the classes may not precisely reflect the class expense differences because of the impact of calculating the net asset values to two decimal places. If net asset values were calculated to three decimal places, the total return differences would more closely reflect the class expense differences. The calculation of net asset values to two decimal places is made in accordance with SEC guidelines and does not result in any gain or loss of value between one class and another. |
| (6) | Annualized. |
See Notes to Financial Statements.
26
| | | | |
| Emerging Markets | | | | |
| |
| B Class | | | | |
| For a Share Outstanding Throughout the Years Ended November 30 (except as noted) | | |
| | 2010(1) | 2009 | 2008 | 2007(2) |
| Per-Share Data | | | | |
| Net Asset Value, Beginning of Period | $7.26 | $4.17 | $12.67 | $12.15 |
| Income From Investment Operations | | | | |
| Net Investment Income (Loss)(3) | (0.04) | (0.06) | 0.02 | (0.03) |
| Net Realized and Unrealized Gain (Loss) | (0.29) | 3.15 | (7.24) | 0.53 |
| Total From Investment Operations | (0.33) | 3.09 | (7.22) | 0.50 |
| Distributions | | | | |
| From Net Realized Gains | — | — | (1.29) | — |
| Redemption Fees(3) | —(4) | —(4) | 0.01 | 0.02 |
| Net Asset Value, End of Period | $6.93 | $7.26 | $4.17 | $12.67 |
| |
| Total Return(5) | (4.68)% | 74.10% | (63.09)% | 4.28% |
| |
| Ratios/Supplemental Data | | | | |
| Ratio of Operating Expenses to Average Net Assets | 2.73%(6) | 2.78% | 2.67% | 2.58%(6) |
| Ratio of Net Investment Income (Loss) to Average Net Assets | (1.01)%(6) | (0.89)% | 0.05% | (1.30)%(6) |
| Portfolio Turnover Rate | 48% | 126% | 121% | 85%(7) |
| Net Assets, End of Period (in thousands) | $234 | $241 | $113 | $54 |
| (1) | Six months ended May 28, 2010 (unaudited). |
| (2) | September 28, 2007 (commencement of sale) through November 30, 2007. |
| (3) | Computed using average shares outstanding throughout the period. |
| (4) | Per-share amount was less than $0.005. |
| (5) | Total return assumes reinvestment of net investment income and capital gains distributions, if any, and does not reflect applicable sales charges. Total returns for periods less than one year are not annualized. Total returns are calculated based on the net asset value of the last business day. |
| | The total return of the classes may not precisely reflect the class expense differences because of the impact of calculating the net asset values to two decimal places. If net asset values were calculated to three decimal places, the total return differences would more closely reflect the class expense differences. The calculation of net asset values to two decimal places is made in accordance with SEC guidelines and does not result in any gain or loss of value between one class and another. |
| (6) | Annualized. |
| (7) | Portfolio turnover is calculated at the fund level. Percentage indicated was calculated for the year ended November 30, 2007. |
See Notes to Financial Statements.
27
| | | | | | |
| Emerging Markets | | | | | |
| |
| C Class | | | | | | |
| For a Share Outstanding Throughout the Years Ended November 30 (except as noted) | | |
| | 2010(1) | 2009 | 2008 | 2007 | 2006 | 2005 |
| Per-Share Data | | | | | | |
| Net Asset Value, | | | | | | |
| Beginning of Period | $6.89 | $3.96 | $12.10 | $9.64 | $7.95 | $6.12 |
| Income From | | | | | | |
| Investment Operations | | | | | | |
| Net Investment | | | | | | |
| Income (Loss)(2) | (0.03) | (0.05) | 0.01 | (0.01) | 0.03 | (0.05) |
| Net Realized and | | | | | | |
| Unrealized Gain (Loss) | (0.28) | 2.98 | (6.87) | 3.90 | 2.99 | 1.97 |
| Total From | | | | | | |
| Investment Operations | (0.31) | 2.93 | (6.86) | 3.89 | 3.02 | 1.92 |
| Distributions | | | | | | |
| From Net | | | | | | |
| Investment Income | — | — | — | (0.03) | — | — |
| From Net Realized Gains | — | — | (1.29) | (1.42) | (1.34) | (0.09) |
| Total Distributions | — | — | (1.29) | (1.45) | (1.34) | (0.09) |
| Redemption Fees(2) | —(3) | —(3) | 0.01 | 0.02 | 0.01 | —(3) |
| Net Asset Value, | | | | | | |
| End of Period | $6.58 | $6.89 | $3.96 | $12.10 | $9.64 | $7.95 |
| |
| Total Return(4) | (4.50)% | 73.99% | (63.09)% | 47.39% | 44.59% | 31.67% |
| |
| Ratios/Supplemental Data | | | | | | |
| Ratio of Operating | | | | | | |
| Expenses to Average | | | | | | |
| Net Assets | 2.73%(5) | 2.78% | 2.66% | 2.66% | 2.80% | 2.94% |
| Ratio of Net Investment | | | | | | |
| Income (Loss) to | | | | | | |
| Average Net Assets | (1.01)%(5) | (0.89)% | 0.06% | (0.04)% | 0.31% | (0.83)% |
| Portfolio Turnover Rate | 48% | 126% | 121% | 85% | 115% | 153% |
| Net Assets, End of Period | | | | | | |
| (in thousands) | $4,749 | $5,372 | $3,217 | $9,098 | $2,581 | $733 |
| (1) | Six months ended May 28, 2010 (unaudited). |
| (2) | Computed using average shares outstanding throughout the period. |
| (3) | Per-share amount was less than $0.005. |
| (4) | Total return assumes reinvestment of net investment income and capital gains distributions, if any, and does not reflect applicable sales charges. Total returns for periods less than one year are not annualized. Total returns are calculated based on the net asset value of the last business day. |
| | The total return of the classes may not precisely reflect the class expense differences because of the impact of calculating the net asset values to two decimal places. If net asset values were calculated to three decimal places, the total return differences would more closely reflect the class expense differences. The calculation of net asset values to two decimal places is made in accordance with SEC guidelines and does not result in any gain or loss of value between one class and another. |
| (5) | Annualized. |
See Notes to Financial Statements.
28
| | | | |
| Emerging Markets | | | | |
| |
| R Class | | | | |
| For a Share Outstanding Throughout the Years Ended November 30 (except as noted) | | |
| | 2010(1) | 2009 | 2008 | 2007(2) |
| Per-Share Data | | | | |
| Net Asset Value, Beginning of Period | $7.28 | $4.17 | $12.68 | $12.15 |
| Income From Investment Operations | | | | |
| Net Investment Income (Loss)(3) | (0.01) | (0.02) | 0.05 | (0.01) |
| Net Realized and Unrealized Gain (Loss) | (0.30) | 3.14 | (7.22) | 0.52 |
| Total From Investment Operations | (0.31) | 3.12 | (7.17) | 0.51 |
| Distributions | | | | |
| From Net Investment Income | — | (0.01) | (0.04) | — |
| From Net Realized Gains | — | — | (1.31) | — |
| Total Distributions | — | (0.01) | (1.35) | — |
| Redemption Fees(3) | —(4) | —(4) | 0.01 | 0.02 |
| Net Asset Value, End of Period | $6.97 | $7.28 | $4.17 | $12.68 |
| |
| Total Return(5) | (4.26)% | 74.94% | (62.92)% | 4.36% |
| |
| Ratios/Supplemental Data | | | | |
| Ratio of Operating Expenses to Average Net Assets | 2.23%(6) | 2.28% | 2.19% | 2.08%(6) |
| Ratio of Net Investment Income (Loss) to Average Net Assets | (0.51)%(6) | (0.39)% | 0.53% | (0.68)%(6) |
| Portfolio Turnover Rate | 48% | 126% | 121% | 85%(7) |
| Net Assets, End of Period (in thousands) | $628 | $516 | $144 | $27 |
| (1) | Six months ended May 28, 2010 (unaudited). |
| (2) | September 28, 2007 (commencement of sale) through November 30, 2007. |
| (3) | Computed using average shares outstanding throughout the period. |
| (4) | Per-share amount was less than $0.005. |
| (5) | Total return assumes reinvestment of net investment income and capital gains distributions, if any. Total returns for periods less than one year are not annualized. Total returns are calculated based on the net asset value of the last business day. The total return of the classes may not precisely reflect the class expense differences because of the impact of calculating the net asset values to two decimal places. If net asset values were calculated to three decimal places, the total return differences would more closely reflect the class expense differences. The calculation of net asset values to two decimal places is made in accordance with SEC guidelines and does not result in any gain or loss of value between one class and another. |
| (6) | Annualized. |
| (7) | Portfolio turnover is calculated at the fund level. Percentage indicated was calculated for the year ended November 30, 2007. |
See Notes to Financial Statements.
29
|
| Board Approval of Management and Subadvisory Agreements |
American Century Global Investment Management, Inc. (“ACGIM” or the “Advisor”) currently serves as investment advisor to the Fund under an interim management agreement (the “Interim Management Agreement”) between the Advisor and the Fund approved by the Fund’s Board of Directors (the “Board”). American Century Investment Management, Inc. (“ACIM” or the “Subadvisor”) currently serves as subadvisor to the Fund under an interim investment subadvisory agreement (the “Interim Subadvisory Agreement” and, together with the Interim Management Agreement, the “Interim Agreements”). The Advisor and the Subadvisor (together, the “Advisors”) previously served as investment advisors to the Fund pursuant to agreements (the “Prior Agreements”) that terminated in accordance with their terms on February 16, 2010, as a result of a change of control of the Advisor’s and the Subadvisor’s parent company, American Century Companies, Inc. (“ACC”). The change in control occurred as the result of a change in the trustee of a trust created by James E. Stowers, Jr., the founder of American Century Investments, which holds shares representing a significant interest in ACC stock. Mr. Stowers previously served as the trustee of the trust. On February 16, 2010, Mr. Richard W. Brown, Co-Chairman of ACC with Mr. Stowers, became the trustee in accordance with the terms of the trust and Mr. Stowers’ long-standing estate and succession plan.
On February 18, 2010, the Board approved the Interim Agreements in accordance with Rule 15a-4 under the Investment Company Act to ensure continued management of the Funds by the Advisor and the Subadvisor after the termination of the Prior Agreements and until shareholder approval of a new management agreement (the “Proposed Agreement”) as required under the Act. The Board approved the Proposed Agreement and recommended its approval to shareholders. Fund shareholders approved the Proposed Agreement at a meeting on June 16, 2010.
Because American Century had indicated its intention to merge ACGIM into ACIM prior to the expiration of the Interim Agreements, the Proposed Agreement is with ACIM as sole investment advisor to the Fund. The Board took into consideration that the combination is being undertaken for reasons of organizational simplification and will eliminate the need for multiple investment management agreements without changing the nature, quality, or extent of services provided to the Fund. The Board noted that the merger was not related to the change of control that necessitated the Interim Agreements and would not result in any change to the personnel managing the Fund.
The Interim Agreements and the Proposed Agreement are substantially identical to the Prior Agreements except for their effective dates, the termination provisions of the Interim Agreements, and the elimination of a subadvisor in the Proposed Agreement. Under the Proposed Agreement, ACIM will provide the same services as provided by ACGIM and ACIM, be subject to the same duties, and receive the same compensation rate as under the Prior Agreements.
30
Basis for Board Approval of Interim Agreements
In considering the approval of the Interim Agreements, Rule 15a-4 requires the Board to approve the contracts within ten business days of the termination of the prior agreements and to determine that the compensation to be received under each interim agreement is no greater than would have been received under the corresponding prior agreement. In connection with the approval, the Board noted that it oversees on a continuous basis and evaluates at its quarterly meetings, directly and through the committees of the Board, the nature and quality of significant services provided by the Advisor and the Subadvisor, the investment performance of the Fund, shareholder services, audit and compliance functions and a variety of other matters relating to the Fund’s operations.
In evaluating the Interim Agreements, the Board, assisted by the advice of its independent legal counsel, considered a number of factors in addition to those required by the rule with no one factor being determinative to its analysis. Among the factors considered by the Board were the circumstances and effect of the change of control, the fact that the Advisor and the Subad-visor will provide the same services and receive the same compensation rate as under the Prior Agreements, and that the change of control did not result in a change of the personnel managing the Fund. Upon completion of its analysis, the Board approved the Interim Agreements, determining that the continued management of the Fund by the Advisor and the Subadvisor was in the best interests of the Fund and Fund shareholders.
Basis for Board Approval of Proposed Agreement
At a meeting held on March 29, 2010, after considering all information presented, the Board approved, and determined to recommend that shareholders approve, the Proposed Agreement. In connection with that approval, the Board requested and reviewed extensive data and information compiled by the Advisor, the Subadvisor, and certain independent providers of evaluation data concerning the Fund and services provided to the Fund. The Board oversees on a continuous basis and evaluates at its quarterly meetings, directly and through the committees of the Board, the nature and quality of significant services provided to the Fund, the investment performance of the Fund, shareholder services, audit and compliance functions and a variety of other matters relating to the Fund’s operations. The information considered and the discussions held at the meetings included, but were not limited to:
• the nature, extent and quality of investment management, shareholder services and other services provided to the Fund;
• the wide range of programs and services provided to the Fund and their shareholders on a routine and non-routine basis;
• the compliance policies, procedures, and regulatory experience of the Advisors;
• data comparing the cost of owning the Fund to the cost of owning similar funds;
31
• the fact that there will be no changes to the fees, services, or personnel who provide such services as compared to the Prior Agreements;
• data comparing the Fund’s performance to appropriate benchmarks and/or a peer group of other mutual funds with similar investment objectives and strategies;
• financial data showing the profitability of the Fund to the Advisors and the overall profitability of the Advisors;
• data comparing services provided and charges to the Fund with those for other non-fund investment management clients of the Advisors; and
• consideration of collateral or “fall-out” benefits derived by the Advisors from the management of the Fund and potential sharing of economies of scale in connection with the management of the Fund.
The Board also considered whether there was any reason for not continuing the existing arrangement with the Advisor. In particular, the Board recognized that shareholders may have invested in the Fund on the strength of the Advisor’s industry standing and reputation and in the expectation that the Advisor will have a continuing role in providing services to the Fund.
The Board considered all of the information provided by the Advisor, the Subadvisor, the independent data providers, and the Board’s independent counsel, and evaluated such information for the Fund. The Board did not identify any single factor as being all-important or controlling, and each Board member may have attributed different levels of importance to different factors. In deciding to approve the Proposed Agreement under the terms ultimately determined by the Board to be appropriate, the Board based its decision on a number of factors, including the following:
Nature, Extent and Quality of Services — Generally. Under the Proposed Agreement, ACIM is responsible for providing or arranging for all services necessary for the operation of the Fund. The Board noted that under the Proposed Agreement, ACIM provides or arranges at its own expense a wide variety of services including:
• constructing and designing the Fund • portfolio research and security selection • initial capitalization/funding • securities trading • Fund administration • custody of Fund assets • daily valuation of the Fund’s portfolio
32
• shareholder servicing and transfer agency, including shareholder confirmations, recordkeeping and communications
• legal services
• regulatory and portfolio compliance
• financial reporting
• marketing and distribution
The Board noted that many of these services have expanded over time both in terms of quantity and complexity in response to shareholder demands, competition in the industry, changing distribution channels and the changing regulatory environment.
Investment Management Services. The investment management services provided to the Fund are complex and provide Fund shareholders access to professional money management, instant diversification of their investments within an asset class, the opportunity to easily diversify among asset classes, and liquidity. As a part of its general oversight and in evaluating investment performance, the Board expects ACIM to manage the Fund in accordance with its investment objectives and approved strategies. In providing these services, ACIM utilizes teams of investment professionals who require extensive information technology, research, training, compliance and other systems to conduct their business. The Board, directly and through its Fund Performance Review Committee, regularly reviews investment performance information for the Fund, toget her with comparative information for appropriate benchmarks and/or peer groups of similarly-managed funds, over different time horizons. If performance concerns are identified, the Fund receives special reviews until performance improves, during which time the Board discusses with ACIM the reasons for such underperformance and any efforts being undertaken to improve performance.
Shareholder and Other Services. Under the Proposed Agreement, ACIM will also provide the Fund with a comprehensive package of transfer agency, shareholder, and other services. The Board, directly and through the various committees of the Board, regularly reviews reports and evaluations of such services. These reports include, but are not limited to, information regarding the operational efficiency and accuracy of the shareholder and transfer agency services provided, staffing levels, shareholder satisfaction (as measured by external as well as internal sources), technology support, new products and services offered to Fund shareholders, securities trading activities, portfolio valuation services, auditing services, and legal and operational compliance activities. Certain aspects of shareholder and transfer agency service level eff iciency and the quality of securities trading activities are measured by independent third party providers and are presented in comparison to other fund groups not managed by ACIM.
33
Costs of Services Provided and Profitability. The Advisor provided detailed information concerning its cost of providing various services to the Fund, its profitability in managing the Fund, its overall profitability, and its financial condition. The Board reviewed with the Advisor the methodology used to prepare this financial information. The Board has also reviewed with the Advisor its methodology for compensating the investment professionals that provide services to the Fund as well as compensation to the five highest paid personnel of the Advisor. This financial information regarding the Advisor is considered in order to evaluate the Advisor’s financial condition, its ability to continue to provide services under the Proposed Agreement, and the reasonableness of the proposed management fees. The Board concluded that the Advisor’s profits were reasonable in light of the services provided to the Fund.
Ethics. The Board generally considers ACIM’s commitment to providing quality services to shareholders and to conducting its business ethically. It noted that ACIM’s practices generally meet or exceed industry best practices.
Economies of Scale. The Board also reviewed information provided by ACIM regarding the possible existence of economies of scale in connection with the management of the Fund. The Board concluded that economies of scale are difficult to measure and predict with precision, especially on a fund-by-fund basis. The analysis of economies of scale is further complicated by the additional services and content provided by ACIM and its reinvestment in its ability to provide and expand those services. Accordingly, the Board seeks to evaluate economies of scale by reviewing information, such as year-over-year profitability of its advisor generally, the profitability of its management of the Fund specifically, and the expenses incurred by the advisor in providing various functions to the Fund. The Board believes ACIM will appropriately sha re economies of scale through its competitive fee structure, offering competitive fees from fund inception, fee breakpoints as the Fund increases in size, and through reinvestment in its business to provide shareholders additional services and enhancements to existing services.
Comparison to Fees of Funds not Managed by the Advisor. Both the Prior and Proposed Agreements provide that the Fund pays ACGIM or ACIM a single, all-inclusive (or unified) management fee for providing all services necessary for the management and operation of the Fund, other than brokerage expenses, taxes, interest, extraordinary expenses, and the fees and expenses of the Fund’s Independent Directors (including their independent legal counsel) and expenses incurred in connection with the provision of shareholder services and distribution services under a plan adopted pursuant to Rule 12b-1 under the 1940 Act. Under the unified fee structure, ACIM is responsible for providing all investment advisory, custody, audit, administrative, compliance, recordkeeping, marketing and shareholder services, or arranging and supervising third parties that provide such services. By contrast, most other funds are charged a variety of fees, including an investment advisory fee, a transfer agency fee, an administrative fee, distribution charges and other expenses. Other than their investment advisory fees and any applicable Rule 12b-1 distribution fees, the components of the total fees charged by these other funds may be increased without shareholder approval. The Board believes the unified
34
fee structure is a benefit to Fund shareholders because it clearly discloses to shareholders the cost of owning Fund shares, and, since the unified fee cannot be increased without a vote of Fund shareholders, it shifts to ACIM the risk of increased costs of operating the Fund and provides a direct incentive to minimize administrative inefficiencies. Part of the Board’s analysis of fee levels involves reviewing certain evaluative data compiled by an independent provider comparing the Fund’s unified fee to the total expense ratios of similar funds not managed by ACIM. The Board concluded that the management fee to be paid by the Fund to ACIM under the Proposed Agreement is reasonable in light of the services to be provided to the Fund.
Comparison to Fees and Services Provided to Other Clients of the Advisor. The Board also requested and received information from ACIM concerning the nature and extent of the services, fees, and profitability of its advisory services to advisory clients other than the Fund. They observed that these varying types of client accounts require different services and involve different regulatory and entrepreneurial risks than the management of the Fund. The Board analyzed this information and concluded that the fees charged and services provided to the Fund were reasonable by comparison.
Collateral or “Fall-Out” Benefits Derived by the Advisor. The Board considered the existence of collateral benefits ACIM may receive as a result of its relationship with the Fund. The Board concluded that ACIM’s primary business is managing mutual funds and it generally does not use Fund or shareholder information to generate profits in other lines of business, and therefore does not derive any significant collateral benefits from them. The Board noted that ACIM receives proprietary research from broker-dealers that execute Fund portfolio transactions and concluded that this research is likely to benefit Fund shareholders. The Board also determined that ACIM is able to provide investment management services to certain clients other than the Fund, at least in part, due to its existing infrastructure built to serv e the fund complex. The Board concluded, however, that the assets of those other clients are not material to the analysis and, in any event, are included with the assets of fund clients to determine breakpoints in each fund’s fee schedule, provided they are managed using the same investment team and strategy.
Conclusion of the Board. As a result of this process, the Board, in the absence of particular circumstances and assisted by the advice of its independent legal counsel, taking into account all of the factors discussed above and the information provided by ACIM and others, concluded that the Proposed Agreement be approved and recommended its approval to Fund shareholders.
35
Retirement Account Information
As required by law, distributions you receive from certain IRAs, or 403(b), 457 and qualified plans are subject to federal income tax withholding, unless you elect not to have withholding apply. Tax will be withheld on the total amount withdrawn even though you may be receiving amounts that are not subject to withholding, such as nondeductible contributions. In such case, excess amounts of withholding could occur. You may adjust your withholding election so that a greater or lesser amount will be withheld.
If you don’t want us to withhold on this amount, you must notify us to not withhold the federal income tax. You may notify us in writing or in certain situations by telephone or through other electronic means. You have the right to revoke your withholding election at any time and any election you make may remain in effect until revoked by filing a new election.
Remember, even if you elect not to have income tax withheld, you are liable for paying income tax on the taxable portion of your withdrawal. If you elect not to have income tax withheld or you don’t have enough income tax withheld, you may be responsible for payment of estimated tax. You may incur penalties under the estimated tax rules if your withholding and estimated tax payments are not sufficient. You can reduce or defer the income tax on a distribution by directly or indirectly rolling such distribution over to another IRA or eligible plan. You should consult your tax advisor for additional information.
State tax will be withheld if, at the time of your distribution, your address is within one of the mandatory withholding states and you have federal income tax withheld. State taxes will be withheld from your distribution in accordance with the respective state rules.
Proxy Voting Guidelines
American Century Investment Management, Inc., the fund’s investment advisor, is responsible for exercising the voting rights associated with the securities purchased and/or held by the fund. A description of the policies and procedures the advisor uses in fulfilling this responsibility is available without charge, upon request, by calling 1-800-345-2021. It is also available on American Century Investments’ website at americancentury.com and on the Securities and Exchange Commission’s website at sec.gov. Information regarding how the investment advisor voted proxies relating to portfolio securities during the most recent 12-month period ended June 30 is available on the “About Us” page at americancentury.com. It is also available at sec.gov.
Quarterly Portfolio Disclosure
The fund files its complete schedule of portfolio holdings with the Securities and Exchange Commission (SEC) for the first and third quarters of each fiscal year on Form N-Q. The fund’s Forms N-Q are available on the SEC’s website at sec.gov, and may be reviewed and copied at the SEC’s Public Reference Room in Washington, DC. Information on the operation of the Public Reference Room may be obtained by calling 1-800-SEC-0330. The fund also makes its complete schedule of portfolio holdings for the most recent quarter of its fiscal year available on its website at americancentury.com and, upon request, by calling 1-800-345-2021.
36
The following indices are used to illustrate investment market, sector, or style performance or to serve as fund performance comparisons. They are not investment products available for purchase.
Morgan Stanley Capital International (MSCI) has developed several indices that measure the performance of foreign stock markets.
The MSCI EAFE (Europe, Australasia, Far East) Index is designed to measure developed market equity performance, excluding the U.S. and Canada.
The MSCI EAFE Growth Index is a capitalization-weighted index that monitors the performance of growth stocks from Europe, Australasia, and the Far East.
The MSCI EAFE Value Index is a capitalization-weighted index that monitors the performance of value stocks from Europe, Australasia, and the Far East.
The MSCI EM (Emerging Markets) Index represents the performance of stocks in global emerging market countries.
The MSCI EM Growth Index represents the performance of growth stocks in global emerging market countries.
The MSCI Europe Index is designed to measure equity market performance in Europe.
The MSCI Japan Index is designed to measure equity market performance in Japan.
The MSCI World Free Index represents the performance of stocks in developed countries (including the United States) that are available for purchase by global investors.
37
38
39
40

| |
| |
| Contact Us | |
| americancentury.com | |
| Automated Information Line | 1-800-345-8765 |
| Investor Services Representative | 1-800-345-2021 or |
| | 816-531-5575 |
| Investors Using Advisors | 1-800-378-9878 |
| Business, Not-For-Profit, Employer-Sponsored | |
| Retirement Plans | 1-800-345-3533 |
| Banks and Trust Companies, Broker-Dealers, | |
| Financial Professionals, Insurance Companies | 1-800-345-6488 |
| Telecommunications Device for the Deaf | 1-800-634-4113 |
| American Century World Mutual Funds, Inc. | |
| Investment Advisor: | |
| American Century Investment Management, Inc. | |
| Kansas City, Missouri | |
This report and the statements it contains are submitted for the general
information of our shareholders. The report is not authorized for distribution to
prospective investors unless preceded or accompanied by an effective prospectus.
American Century Investment Services, Inc., Distributor
©2010 American Century Proprietary Holdings, Inc. All rights reserved.
1007 CL-SAN-68673
|
| Semiannual Report |
| May 28, 2010 |

|
| American Century Investments® |
International Value Fund
| |
| President’s Letter | 2 |
| Independent Chairman’s Letter | 3 |
| Market Perspective | 4 |
| International Equity Total Returns | 4 |
| |
| International Value | |
| |
| Performance | 5 |
| Portfolio Commentary | 7 |
| Top Ten Holdings | 9 |
| Types of Investments in Portfolio | 9 |
| Investments by Country | 9 |
| |
| Shareholder Fee Example | 10 |
| |
| Financial Statements | |
| |
| Schedule of Investments | 12 |
| Statement of Assets and Liabilities | 14 |
| Statement of Operations | 15 |
| Statement of Changes in Net Assets | 16 |
| Notes to Financial Statements | 17 |
| Financial Highlights | 23 |
| |
| Other Information | |
| |
| Board Approval of Management and Subadvisory Agreements | 29 |
| Additional Information | 37 |
| Index Definitions | 38 |
Any opinions expressed in this report reflect those of the author as of the date of the report, and do not necessarily represent the opinions of American Century Investments or any other person in the American Century Investments organization. Any such opinions are subject to change at any time based upon market or other conditions and American Century Investments disclaims any responsibility to update such opinions. These opinions may not be relied upon as investment advice and, because investment decisions made by American Century Investments funds are based on numerous factors, may not be relied upon as an indication of trading intent on behalf of any American Century Investments fund. Security examples are used for representational purposes only and are not intended as recommendations to purchase or sell securities. Performance information for comparative indices and securities is provided to American Century Investments by third party vendors. To the best of American Century Investments’ knowledge, such information is accurate at the time of printing.

Dear Investor:
To learn more about the capital markets, your investment, and the portfolio management strategies American Century Investments provides, we encourage you to review this shareholder report for the financial reporting period ended May 28, 2010.
On the following pages, you will find investment performance and portfolio information, presented with the expert perspective and commentary of our portfolio management team. This report remains one of our most important vehicles for conveying the information you need about your investment performance, and about the market factors and strategies that affect fund returns. For additional information on the markets, we encourage you to visit the “Insights & News” tab at our Web site, americancentury.com, for updates and further expert commentary.
The top of our Web site’s home page also provides a link to “Our Story,” which, first and foremost, outlines our commitment—since 1958—to helping clients reach their financial goals. We believe strongly that we will only be successful when our clients are successful. That’s who we are.
Another important, unique facet of our story and who we are is “Profits with a Purpose,” which describes our bond with the Stowers Institute for Medical Research (SIMR). SIMR is a world-class biomedical organization—founded by our company founder James E. Stowers, Jr. and his wife Virginia—that is dedicated to researching the causes, treatment, and prevention of gene-based diseases, including cancer. Through American Century Investments’ private ownership structure, more than 40% of our profits support SIMR.
Mr. Stowers’ example of achieving financial success and using that platform to help humanity motivates our entire American Century Investments team. His story inspires us to help each of our clients achieve success. Thank you for sharing your financial journey with us.
Sincerely,

Jonathan Thomas
President and Chief Executive Officer
American Century Investments
2
|
| Independent Chairman’s Letter |

Fellow Shareholders,
The principal event at a recent board meeting was the retirement of Jim Stowers, Jr. from the American Century Mutual Funds Kansas City board. This was one of those times when you felt like you were living a historical moment. Jim—who celebrated his 86th birthday in January—founded what was known as Twentieth Century Mutual Funds over 50 years ago. Through the years, his number one priority has been to “Put Investors First!” The board presented Jim with a resolution acknowledging that, by building a successful investment company, he has impacted the lives of many by helping them on the path to financial success.
We respect Jim’s decision to focus his energy on the Stowers Institute for Medical Research and American Century Companies, Inc. (ACC), the parent company of the funds’ investment advisor. The pioneering medical research that Jim and his wife Virginia have made possible through the Institute should enrich the lives of millions in the future.
Shortly after his retirement from the board, we received word that ACC’s co-chairman Richard W. Brown had succeeded Jim as trustee of a trust that holds a significant interest in ACC stock as a part of Jim’s long-standing estate and business succession plan. While holding less than a majority interest, the trust is presumed to control the funds’ investment advisors under the Investment Company Act of 1940. This change triggered the need for a shareholder proxy to approve new management and subadvisory agreements for the funds. I am happy to report that all of the proposals contained in the proxy received the necessary votes and were approved.
On behalf of the board, I want to once again thank Jim for his mutual fund board service. More than three years ago, Jim and Richard Brown installed a strong and effective leadership team at American Century Investments and I look forward to continuing to work with them on behalf of fund shareholders. And while Jim no longer sits on the fund board, the inherent optimism captured by his favorite catch phrase—“The best is yet to be”—still resonates with all of us who have the privilege of serving you. I invite you to send your comments, questions or concerns to me at dhpratt@fundboardchair.com.

3

By Mark Kopinski, Chief Investment Officer, Global and Non-U.S. Equity
Events in May Sent Stocks Tumbling
Global stock returns generally remained robust for the first several months of the period, as the rally unleashed in March 2009 continued into 2010. Optimism regarding the global economic recovery and business sector gains helped keep stocks in positive territory.
Nevertheless, as spring set in, the global stock market rally ended abruptly, starting with the May 6 “Flash Crash” in the U.S. stock market, when the major indices plunged nearly 7% within 15 minutes. Furthermore, problems that had been percolating in Europe and in the global geopolitical arena boiled over in May, triggering a sharp stock market selloff. In particular, the expanding European government debt crisis beyond Greece, the downgrade of Spain’s credit rating, the worsening oil disaster in the Gulf of Mexico, and escalating tensions in the Middle East rattled investors’ nerves.
Overall, developed international equity markets significantly under-performed the U.S. market and the emerging markets. European stocks suffered the largest losses for the six-month period, as the mounting debt crisis worried investors. Exploding debt in Greece, Italy, Spain, Ireland, and Portugal all came under scrutiny.
Debt Remained the Roadblock to Growth
The sovereign debt problem did not just happen as a result of the recent financial crisis or recession; it is a longer-term issue. Recent events only exacerbated the problem and accelerated its becoming a crisis.
In fact, sovereign solvency has emerged as one of the most significant roadblocks to growth. Currently, the market is focused on Europe, where severe austerity measures are required to get fiscal balances back in order. This is likely to trim 0.5% from European growth during the next year. The weaker euro should help offset some of the decline in growth, but the more export-oriented northern countries will be the main beneficiaries. Commodity-based countries, such as Australia and Norway, have been the most resilient and have seen more impressive economic recoveries. The debt crisis likely will mean European interest rates will remain accommodative for the remainder of 2010.
| | | | |
| International Equity Total Returns | | | | |
| For the six months ended May 28, 2010* (in U.S. dollars) | |
| MSCI EAFE Index | -10.90% | | MSCI Europe Index | -14.77% |
| MSCI EAFE Growth Index | -8.85% | | MSCI World Free Index | -4.92% |
| MSCI EAFE Value Index | -12.95% | | MSCI Japan Index | 0.10% |
| MSCI EM Index | -2.75% | | | |
| *Total returns for periods less than one year are not annualized and are based on the period beginning December 1, 2009. | |
4
| | | | | | | |
| International Value | | | | | | |
| |
| Total Returns as of May 28, 2010 | | | | | |
| | | | | Average Annual Returns | |
| | Ticker | | | | | Since | Inception |
| | Symbol | 6 months(1) | 1 year(2) | 5 years(2) | 10 years(2) | Inception | Date |
| A Class | MEQAX | | | | | | 3/31/97 |
| No sales charge* | | -13.34% | 3.62% | 1.25%(3) | 2.17%(3) | 2.44%(3) | |
| With sales charge* | | -18.36% | -2.28% | 0.05%(3) | 1.56%(3) | 1.98%(3) | |
| MSCI EAFE Index | — | -10.90% | 6.61% | 1.39% | 0.66% | 3.39%(4) | — |
| Investor Class | ACEVX | -13.32% | 3.81% | — | — | -3.51% | 4/3/06 |
| Institutional Class | ACVUX | -13.23% | 4.06% | — | — | -3.33% | 4/3/06 |
| B Class | MEQBX | | | | | | 3/31/97 |
| No sales charge* | | -13.82% | 2.81% | 0.49%(3) | 1.45%(3) | 1.74%(3) | |
| With sales charge* | | -18.82% | -1.19% | 0.29%(3) | 1.45%(3) | 1.74%(3) | |
| C Class | ACCOX | | | | | | 4/3/06 |
| No sales charge* | | -13.83% | 2.75% | — | — | -4.51% | |
| With sales charge* | | -14.68% | 2.75% | — | — | -4.51% | |
| R Class | ACVRX | -13.46% | 3.28% | — | — | -4.01% | 4/3/06 |
| * Sales charges include initial sales charges and contingent deferred sales charges (CDSCs), as applicable. A Class shares have a 5.75% |
| maximum initial sales charge for equity funds and may be subject to a maximum CDSC of 1.00%. B Class shares redeemed within six |
| years of purchase are subject to a CDSC that declines from 5.00% during the first year after purchase to 0.00% the sixth year after |
| purchase. C Class shares redeemed within 12 months of purchase are subject to a maximum CDSC of 1.00%. The SEC requires that |
| mutual funds provide performance information net of maximum sales charges in all cases where charges could be applied. |
International Value acquired all the net assets of the Mason Street International Equity Fund on March 31, 2006, pursuant to a plan of reorganization approved by the acquired fund’s shareholders on March 15, 2006. Performance information prior to April 1, 2006, is that of the Mason Street International Equity Fund.
| |
| (1) | Total returns for periods less than one year are not annualized and are based on the period beginning December 1, 2009. |
| (2) | Total returns are based on the periods beginning June 1, 2009 for the 1 year returns, June 1, 2005 for the 5 year returns and June 1, 2000 for |
| | the 10 year returns. |
| (3) | Class returns would have been lower if fees had not been waived. |
| (4) | Total return is based on the period from March 31, 1997 through May 31, 2010, the date nearest the report date for which data are available. |
Data presented reflect past performance. Past performance is no guarantee of future results. Current performance may be higher or lower than the performance shown. Investment return and principal value will fluctuate, and redemption value may be more or less than original cost. To obtain performance data current to the most recent month end, please call 1-800-345-2021 or visit americancentury.com. International investing involves special risks, such as political instability and currency fluctuations. Investing in emerging markets may accentuate these risks.
Unless otherwise indicated, performance reflects A Class shares; performance for other share classes will vary due to differences in fee structure. For information about other share classes available, please consult the prospectus. Data assumes reinvestment of dividends and capital gains, and none of the charts reflect the deduction of taxes that a shareholder would pay on fund distributions or the redemption of fund shares. Returns for the index are provided for comparison. The fund’s total returns include operating expenses (such as transaction costs and management fees) that reduce returns, while the total returns of the index do not.
5
International Value
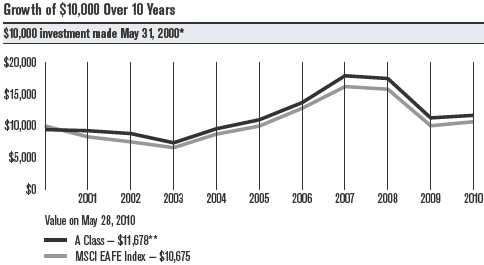
| | | | | |
| * The A Class’s initial investment is $9,425 to reflect the maximum 5.75% initial sales charge. | | |
| **Ending value would have been lower if fees had not been waived. | | | |
| |
| Total Annual Fund Operating Expenses | | | |
| | Institutional | | | | |
| Investor Class | Class | A Class | B Class | C Class | R Class |
| 1.31% | 1.11% | 1.56% | 2.31% | 2.31% | 1.81% |
The total annual fund operating expenses shown is as stated in the fund’s prospectus current as of the date of this report. The prospectus may vary from the expense ratio shown elsewhere in this report because it is based on a different time period, includes acquired fund fees and expenses, and, if applicable, does not include fee waivers or expense reimbursements.
Data presented reflect past performance. Past performance is no guarantee of future results. Current performance may be higher or lower than the performance shown. Investment return and principal value will fluctuate, and redemption value may be more or less than original cost. To obtain performance data current to the most recent month end, please call 1-800-345-2021 or visit americancentury.com. International investing involves special risks, such as political instability and currency fluctuations. Investing in emerging markets may accentuate these risks.
Unless otherwise indicated, performance reflects A Class shares; performance for other share classes will vary due to differences in fee structure. For information about other share classes available, please consult the prospectus. Data assumes reinvestment of dividends and capital gains, and none of the charts reflect the deduction of taxes that a shareholder would pay on fund distributions or the redemption chart of fund shares. Returns for the index are provided for comparison. The fund’s total returns include operating expenses (such as transaction costs and management fees) that reduce returns, while the total returns of the index do not.
6
International Value
Portfolio Managers: Gary Motyl and Guang Yang
Performance Summary
International Value declined -13.34%* for the six months ended May 28, 2010. By comparison, its benchmark, the MSCI EAFE Index, fell -10.90%. (Please see pages 5 and 6 for additional performance comparisons.)
The portfolio’s poor absolute performance reflects the challenging environment for international equities in the last six months. Every sector in the portfolio and index had negative results in dollar terms, with the exception of information technology (IT) stocks.
Relative to the benchmark, positioning in the energy and utilities sectors detracted most. At the other end of the spectrum, financial, information technology, and consumer discretionary stocks were the leading contributors to relative return.
Energy, Utilities Detracted Most
The portfolio’s energy and utilities shares were the leading detractors from relative performance because of stock choices and overweight positions in what were two of the poorest-performing portions of the MSCI EAFE Index for the six months. In the energy sector, underperformance was concentrated in the oil, gas, and consumable fuels industry segment. Stakes in Petroleo Brasileiro, Repsol YPF, and Total were the main sources of weakness. Repsol and Total were caught in the downdraft as they have exposure to central and southern Europe, whose economies and financial markets were at the center of the sovereign debt crisis. In the utilities space, our holdings in the electric utilities segment detracted most, led by Iberdrola and E.ON.
In the health care sector, pharmaceutical names detracted most. Merck KGaA (“German Merck,” as opposed to U.S.-based pharma giant Merck & Co.) was the leading detractor after cutting its dividend and revising down future earnings estimates. In addition, investors worried about the price paid to acquire life sciences company Millipore.
Elsewhere, it hurt to hold an underweight position in consumer staples shares, which held up comparatively well during a difficult period for international equities. In addition, the portfolio’s industrials holdings detracted as a result of positions in the transport and airline industries.
Among leading individual detractors were financial services firms AXA and Aviva, who had exposure to struggling European financial markets through their asset management and insurance arms.
|
| * All fund returns referenced in this commentary are for A Class shares and are not reduced by sales charges. A Class shares are subject to a |
| maximum sales charge of 5.75%. Had the sales charge been applied, returns would have been lower than those shown. Total returns for periods |
| less than one year are not annualized and are based on the period beginning December 1, 2009. |
7
International Value
Financial, IT Shares Contributed Most
The leading contribution to the portfolio’s relative performance came from positioning among financial shares, as it helped to be underrepresented in the poorest-performing sector in the index. Specifically, we held an underweight position in commercial banks, which lagged because of concerns about exposure to credit losses. Good examples were Spain’s Banco Santander, the Argentine Banco Bilbao Vizcaya Argentaria, and French banks BNP Paribas and Societe Generale, all of which performed poorly and to which we had little or no exposure. In addition, the banking stocks in the fund held up better than those in the index, such as our stake in Singaporean bank DBS Group and Australia & New Zealand Banking Group.
Holdings in the IT sector also contributed to relative return, thanks largely to positioning in the software and semiconductor industries. The top contributor in the sector was leading Japanese game maker Nintendo, which is categorized in the software sector. The company benefited from announced new product launches and resolution on some long-running lawsuits. Samsung Electronics was another leading contributor, managing positive returns in a difficult period for equities.
Top Individual Contributors
The number-one and number-six contributors to relative return for the period were China Telecom and China Mobile. These are the largest wire-line and mobile phone companies in the world, respectively, enjoying dominant market positions in the massive, growing Chinese market, as well as working on expanding their range of services and markets.
The portfolio also continued to enjoy meaningful contributions to return from holdings among auto makers and auto component companies, such as Korean car maker Hyundai Motor Co. and German automobile manufacturer Bayerische Motoren Werke. These firms benefited from improving economic growth, as did engine maker Rolls-Royce Group (categorized as an aerospace and defense company because its engines are used in military and industrial markets).
Outlook
“We believe the portfolio can outperform its benchmark over time through individual security selection, focusing on what we believe to be attractively valued, high-quality companies offering compelling risk/reward trade-offs,” said portfolio manager Guang Yang. “As a result, the portfolio’s sector and industry selection as well as capitalization range allocations are primarily a result of identifying what we believe to be superior individual securities. In keeping with our value-oriented approach, the largest overweight position as of May 28, 2010, was in telecommunication services shares; the energy and IT sectors accounted for other notable overweights. The most notable sector underweights were in consumer staples, materials, and financial shares.”
8
| |
| International Value | |
| |
| Top Ten Holdings | |
| | % of net assets |
| | as of 5/28/10 |
| China Telecom Corp. Ltd. H Shares | 2.7% |
| E.ON AG | 2.6% |
| Royal Dutch Shell plc B Shares | 2.4% |
| Telefonica SA ADR | 2.3% |
| Cie Generale des Etablissements Michelin, Class B | 2.2% |
| Nintendo Co. Ltd. | 2.2% |
| Vodafone Group plc | 2.2% |
| Telenor ASA | 2.1% |
| Roche Holding AG | 2.1% |
| Samsung Electronics Co. Ltd. | 2.1% |
| |
| Types of Investments in Portfolio | |
| | % of net assets |
| | as of 5/28/10 |
| Foreign Common Stocks & Rights | 98.7% |
| Temporary Cash Investments | 0.4% |
| Other Assets and Liabilities | 0.9% |
| |
| Investments by Country | |
| | % of net assets |
| | as of 5/28/10 |
| United Kingdom | 19.1% |
| France | 12.7% |
| Germany | 10.1% |
| Switzerland | 8.0% |
| Netherlands | 7.0% |
| South Korea | 6.1% |
| Spain | 5.8% |
| People’s Republic of China | 4.9% |
| Japan | 4.3% |
| Brazil | 3.9% |
| Hong Kong | 3.7% |
| Norway | 2.1% |
| Australia | 2.1% |
| Taiwan (Republic of China) | 2.0% |
| Other Countries | 6.9% |
| Cash and Equivalents* | 1.3% |
| *Includes temporary cash investments and other assets and liabilities. | |
9
|
| Shareholder Fee Example (Unaudited) |
Fund shareholders may incur two types of costs: (1) transaction costs, including sales charges (loads) on purchase payments and redemption/ exchange fees; and (2) ongoing costs, including management fees; distribution and service (12b-1) fees; and other fund expenses. This example is intended to help you understand your ongoing costs (in dollars) of investing in your fund and to compare these costs with the ongoing cost of investing in other mutual funds.
The example is based on an investment of $1,000 made at the beginning of the period and held for the entire period from December 1, 2009 to May 28, 2010.
Actual Expenses
The table provides information about actual account values and actual expenses for each class. You may use the information, together with the amount you invested, to estimate the expenses that you paid over the period. First, identify the share class you own. Then simply divide your account value by $1,000 (for example, an $8,600 account value divided by $1,000 = 8.6), then multiply the result by the number under the heading “Expenses Paid During Period” to estimate the expenses you paid on your account during this period.
If you hold Investor Class shares of any American Century Investments fund, or Institutional Class shares of the American Century Diversified Bond Fund, in an American Century Investments account (i.e., not a financial intermediary or retirement plan account), American Century Investments may charge you a $12.50 semiannual account maintenance fee if the value of those shares is less than $10,000. We will redeem shares automatically in one of your accounts to pay the $12.50 fee. In determining your total eligible investment amount, we will include your investments in all personal accounts (including American Century Investments Brokerage accounts) registered under your Social Security number. Personal accounts include individual accounts, joint accounts, UGMA/UTMA accounts, personal trusts, Coverdell Education Savings Accounts and IRAs (including traditional, Roth, Rollover, SEP-, SARSEP- and SIMPLE-IRAs), and certain other retirement accounts. If you have only business, business retirement, employer-sponsored or American Century Investments Brokerage accounts, you are currently not subject to this fee. We will not charge the fee as long as you choose to manage your accounts exclusively online. If you are subject to the Account Maintenance Fee, your account value could be reduced by the fee amount.
Hypothetical Example for Comparison Purposes
The table also provides information about hypothetical account values and hypothetical expenses based on the actual expense ratio of each class of your fund and an assumed rate of return of 5% per year before expenses, which is not the actual return of a fund’s share class. The hypothetical account values and expenses may not be used to estimate the actual ending account balance or expenses you paid for the period. You may use this information to compare the ongoing costs of investing in your fund and other funds. To do so, compare this 5% hypothetical example with the 5% hypothetical examples that appear in the shareholder reports of the other funds.
10
Please note that the expenses shown in the table are meant to highlight your ongoing costs only and do not reflect any transactional costs, such as sales charges (loads) or redemption/exchange fees. Therefore, the table is useful in comparing ongoing costs only, and will not help you determine the relative total costs of owning different funds. In addition, if these transactional costs were included, your costs would have been higher.
| | | | |
| | Beginning | Ending | Expenses Paid | |
| | Account Value | Account Value | During Period* | Annualized |
| | 12/1/09 | 5/28/10 | 12/1/09 – 5/28/10 | Expense Ratio* |
| Actual | | | | |
| Investor Class | $1,000 | $866.80 | $6.04 | 1.32% |
| Institutional Class | $1,000 | $867.70 | $5.13 | 1.12% |
| A Class | $1,000 | $866.60 | $7.19 | 1.57% |
| B Class | $1,000 | $861.80 | $10.59 | 2.32% |
| C Class | $1,000 | $861.70 | $10.59 | 2.32% |
| R Class | $1,000 | $865.40 | $8.32 | 1.82% |
| Hypothetical | | | | |
| Investor Class | $1,000 | $1,018.05 | $6.53 | 1.32% |
| Institutional Class | $1,000 | $1,019.03 | $5.54 | 1.12% |
| A Class | $1,000 | $1,016.82 | $7.76 | 1.57% |
| B Class | $1,000 | $1,013.14 | $11.45 | 2.32% |
| C Class | $1,000 | $1,013.14 | $11.45 | 2.32% |
| R Class | $1,000 | $1,015.60 | $9.00 | 1.82% |
| * Expenses are equal to the class’s annualized expense ratio listed in the table above, multiplied by the average account value over the period, |
| multiplied by 179, the number of days in the most recent fiscal half-year, divided by 365, to reflect the one-half year period. |
11
| | | | | | |
| International Value | | | | | |
| |
| MAY 28, 2010 (UNAUDITED) | | | | | | |
| | Shares | Value | | | Shares | Value |
| Common Stocks & Rights — 98.7% | | | ITALY — 1.1% | | |
| AUSTRALIA — 2.1% | | | | ENI SpA | 8,670 | $ 162,810 |
| Australia & New Zealand | | | | UniCredit SpA | 48,220 | 100,972 |
| Banking Group Ltd. | 14,620 | $ 276,532 | | | | 263,782 |
| National Australia Bank Ltd. | 11,380 | 237,646 | | JAPAN — 4.3% | | |
| | | 514,178 | | Mabuchi Motor Co. Ltd. | 2,800 | 140,842 |
| AUSTRIA — 0.9% | | | | Mitsubishi UFJ Financial | | |
| Telekom Austria AG | 16,860 | 213,137 | | Group, Inc. | 44,420 | 215,778 |
| | | | | Mitsubishi UFJ Financial | | |
| BRAZIL — 3.9% | | | | Group, Inc. ADR | 3,660 | 17,714 |
| Empresa Brasileira de | | | | Nintendo Co. Ltd. | 1,830 | 531,564 |
| Aeronautica SA ADR | 7,620 | 165,964 | | | | |
| Petroleo Brasileiro | | | | Sony Corp. | 5,100 | 158,598 |
| SA-Petrobras ADR | 11,580 | 412,480 | | | | 1,064,496 |
| Vale SA Preference | | | | NETHERLANDS — 7.0% | | |
| Shares ADR | 16,930 | 390,236 | | Akzo Nobel NV | 4,950 | 251,579 |
| | | 968,680 | | ING Groep NV CVA(1) | 56,972 | 450,836 |
| FRANCE — 12.7% | | | | Koninklijke Philips | | |
| Alstom SA | 2,320 | 110,106 | | Electronics NV | 9,497 | 283,203 |
| AXA SA | 26,237 | 430,755 | | Royal Dutch Shell plc | | |
| Cie Generale des | | | | B Shares | 23,125 | 583,640 |
| Etablissements Michelin, | | | | SBM Offshore NV | 9,788 | 155,945 |
| Class B | 8,110 | 539,953 | | | | 1,725,203 |
| Credit Agricole SA | 8,190 | 87,943 | | NORWAY — 2.1% | | |
| Electricite de France SA | 2,710 | 119,552 | | Telenor ASA | 42,360 | 521,619 |
| France Telecom SA | 22,060 | 420,330 | | PEOPLE’S REPUBLIC OF CHINA — 4.9% | |
| GDF Suez | 11,844 | 368,494 | | China Shenhua Energy Co. Ltd. | | |
| Sanofi-Aventis SA | 5,813 | 348,333�� | | H Shares | 26,000 | 103,662 |
| Total SA | 9,030 | 421,184 | | China Telecom Corp. Ltd. | | |
| Vivendi SA | 12,620 | 272,264 | | H Shares | 1,460,000 | 668,611 |
| | | 3,118,914 | | Shanghai Electric Group | | |
| | | | | Co. Ltd. H Shares (1) | 916,000 | 420,492 |
| GERMANY — 10.1% | | | | | | 1,192,765 |
| Bayerische Motoren Werke AG | 6,110 | 281,475 | | PORTUGAL — 0.7% | | |
| Deutsche Lufthansa AG(1) | 8,410 | 111,432 | | | | |
| | | | | Portugal Telecom SGPS SA | 15,910 | 161,604 |
| Deutsche Post AG | 11,140 | 164,668 | | RUSSIAN FEDERATION — 0.9% | | |
| E.ON AG | 20,850 | 634,995 | | OAO Gazprom ADR | 11,290 | 231,205 |
| Merck KGaA | 6,980 | 506,274 | | SINGAPORE — 1.5% | | |
| SAP AG(1) | 11,810 | 501,361 | | | | |
| | | | | DBS Group Holdings Ltd. | 38,250 | 375,255 |
| Siemens AG ADR | 3,040 | 272,171 | | SOUTH KOREA — 6.1% | | |
| | | 2,472,376 | | Hana Financial Group, Inc. | 15,320 | 385,163 |
| HONG KONG — 3.7% | | | | Hyundai Motor Co. | 2,810 | 320,689 |
| Cheung Kong Holdings Ltd. | 23,300 | 264,191 | | KB Financial Group, Inc. | 7,050 | 288,285 |
| China Mobile Ltd. | 53,500 | 498,228 | | Samsung Electronics Co. Ltd. | 790 | 510,637 |
| Hutchison Whampoa Ltd. | 23,900 | 148,728 | | | | 1,504,774 |
| | | 911,147 | | | | |
12
| | | | | | |
| International Value | | | | | |
| |
| | Shares | Value | | | Shares | Value |
| SPAIN — 5.8% | | | | Pearson plc | 16,290 | $ 223,458 |
| Banco Santander SA | 8,470 | $ 85,966 | | Rolls-Royce Group plc(1) | 40,420 | 343,503 |
| Iberdrola SA | 63,140 | 420,842 | | Rolls-Royce Group plc | | |
| Repsol YPF SA | 17,380 | 356,712 | | C Shares(1) | 3,637,800 | 5,261 |
| Telefonica SA ADR | 9,700 | 556,489 | | Unilever plc | 7,335 | 197,529 |
| | | 1,420,009 | | Vodafone Group plc | 264,953 | 530,552 |
| SWEDEN — 0.6% | | | | | | 4,691,546 |
| Telefonaktiebolaget LM | | | | TOTAL COMMON STOCKS & RIGHTS | |
| Ericsson B Shares | 14,000 | 140,977 | | (Cost $24,012,114) | | 24,248,858 |
| SWITZERLAND — 8.0% | | | | Temporary Cash Investments — 0.4% |
| ACE Ltd. | 6,380 | 313,641 | | JPMorgan U.S. Treasury | | |
| Basilea Pharmaceutica(1) | 1,960 | 119,131 | | Plus Money Market Fund | | |
| Lonza Group AG | 2,680 | 175,637 | | Agency Shares | | |
| Nestle SA | 8,240 | 371,995 | | (Cost $97,764) | 97,764 | 97,764 |
| | | | | TOTAL INVESTMENT | | |
| Novartis AG | 4,310 | 195,139 | | SECURITIES — 99.1% | | |
| Roche Holding AG | 3,770 | 516,932 | | (Cost $24,109,878) | | 24,346,622 |
| Swiss Reinsurance Co. Ltd. | 6,757 | 274,293 | | OTHER ASSETS | | |
| | | 1,966,768 | | AND LIABILITIES — 0.9% | | 231,086 |
| TAIWAN (REPUBLIC OF CHINA) — 2.0% | | | TOTAL NET ASSETS — 100.0% | | $24,577,708 |
| Compal Electronics, Inc. | 125,214 | 151,594 | | | | |
| Lite-On Technology Corp. | 61,783 | 69,792 | | Market Sector Diversification | |
| Taiwan Semiconductor | | | | (as a % of net assets) | | |
| Manufacturing Co. Ltd. | 150,749 | 275,308 | | Financials | | 18.6% |
| | | 496,694 | | Telecommunication Services | | 15.7% |
| TURKEY — 1.2% | | | | Consumer Discretionary | | 12.6% |
| Turkcell Iletisim | | | | Energy | | 11.4% |
| Hizmet AS ADR | 21,790 | 293,729 | | Industrials | | 10.8% |
| UNITED KINGDOM — 19.1% | | | | Information Technology | | 9.0% |
| Aviva plc | 95,440 | 440,151 | | Health Care | | 8.9% |
| BAE Systems plc | 37,660 | 175,504 | | Utilities | | 6.8% |
| BP plc | 53,240 | 380,536 | | Materials | | 2.6% |
| British Airways plc(1) | 110,840 | 321,106 | | | | |
| | | | | Consumer Staples | | 2.3% |
| British Sky Broadcasting | | | | | | |
| Group plc | 30,460 | 253,231 | | Cash and Equivalents* | | 1.3% |
| Burberry Group plc | 30,150 | 300,318 | | *Includes temporary cash investments and other assets and liabilities. |
| GlaxoSmithKline plc | 18,590 | 310,702 | | Notes to Schedule of Investments |
| HSBC Holdings plc | | | | | | |
| (Hong Kong) | 36,400 | 333,633 | | ADR = American Depositary Receipt | | |
| Kingfisher plc | 145,040 | 467,935 | | CVA = Certificaten Van Aandelen | | |
| Marks & Spencer Group plc | 56,340 | 287,423 | | (1) Non-income producing. | | |
| National Grid plc | 14,452 | 109,232 | | | | |
| National Grid plc Rights(1) | 5,780 | 11,472 | | See Notes to Financial Statements. | | |
13
|
| Statement of Assets and Liabilities |
| | | | |
| MAY 28, 2010 (UNAUDITED) | | | | |
| Assets | | | | |
| Investment securities, at value (cost of $24,109,878) | | | $24,346,622 |
| Foreign currency holdings, at value (cost of $36,957) | | | 36,904 |
| Receivable for capital shares sold | | | | 74,472 |
| Dividends and interest receivable | | | | 212,164 |
| | | | | 24,670,162 |
| | | | | |
| Liabilities | | | | |
| Disbursements in excess of demand deposit cash | | | 12,752 |
| Payable for capital shares redeemed | | | | 49,804 |
| Accrued management fees | | | | 25,275 |
| Service fees (and distribution fees — A Class and R Class) payable | | | 3,497 |
| Distribution fees payable | | | | 1,126 |
| | | | | 92,454 |
| | | | | |
| Net Assets | | | | $24,577,708 |
| | | | | |
| Net Assets Consist of: | | | | |
| Capital (par value and paid-in surplus) | | | | $32,992,653 |
| Undistributed net investment income | | | | 295,295 |
| Accumulated net realized loss on investment and foreign currency transactions | | (8,940,836) |
| Net unrealized appreciation on investments and translation of assets and liabilities in foreign currencies | 230,596 |
| | | | | $24,577,708 |
| |
| | Net assets | Shares outstanding | Net asset value per share |
| Investor Class, $0.01 Par Value | $5,850,867 | 959,622 | | $6.10 |
| Institutional Class, $0.01 Par Value | $1,358,587 | 223,206 | | $6.09 |
| A Class, $0.01 Par Value | $15,302,299 | 2,497,182 | | $6.13* |
| B Class, $0.01 Par Value | $1,029,459 | 171,447 | | $6.00 |
| C Class, $0.01 Par Value | $827,352 | 135,058 | | $6.13 |
| R Class, $0.01 Par Value | $209,144 | 34,240 | | $6.11 |
| *Maximum offering price $6.50 (net asset value divided by 0.9425) | | | |
| |
| |
| See Notes to Financial Statements. | | | | |
14
| |
| FOR THE SIX MONTHS ENDED MAY 28, 2010 (UNAUDITED) | |
| Investment Income (Loss) | |
| Income: | |
| Dividends (net of foreign taxes withheld of $46,168) | $ 514,800 |
| Interest | 410 |
| | 515,210 |
| Expenses: | |
| Management fees | 183,509 |
| Distribution fees: | |
| B Class | 4,755 |
| C Class | 3,506 |
| Service fees: | |
| B Class | 1,585 |
| C Class | 1,169 |
| Distribution and service fees: | |
| A Class | 22,531 |
| R Class | 422 |
| Directors’ fees and expenses | 740 |
| Other expenses | 1,343 |
| | 219,560 |
| | |
| Net investment income (loss) | 295,650 |
| | |
| Realized and Unrealized Gain (Loss) | |
| Net realized gain (loss) on: | |
| Investment transactions | (236,263) |
| Foreign currency transactions | 112,836 |
| | (123,427) |
| | |
| Change in net unrealized appreciation (depreciation) on: | |
| Investments | (1,241,077) |
| Translation of assets and liabilities in foreign currencies | (3,117,048) |
| | (4,358,125) |
| | |
| Net realized and unrealized gain (loss) | (4,481,552) |
| | |
| Net Increase (Decrease) in Net Assets Resulting from Operations | $(4,185,902) |
| |
| |
| See Notes to Financial Statements. | |
15
|
| Statement of Changes in Net Assets |
| | |
| SIX MONTHS ENDED MAY 28, 2010 (UNAUDITED) AND YEAR ENDED NOVEMBER 30, 2009 | |
| Increase (Decrease) in Net Assets | 2010 | 2009 |
| Operations | | |
| Net investment income (loss) | $ 295,650 | $ 792,809 |
| Net realized gain (loss) | (123,427) | (6,688,028) |
| Change in net unrealized appreciation (depreciation) | (4,358,125) | 15,518,583 |
| Net increase (decrease) in net assets resulting from operations | (4,185,902) | 9,623,364 |
| | | |
| Distributions to Shareholders | | |
| From net investment income: | | |
| Investor Class | (281,159) | (55,648) |
| Institutional Class | (73,160) | (609,469) |
| A Class | (645,217) | (312,916) |
| B Class | (28,789) | (20,569) |
| C Class | (19,261) | (4,827) |
| R Class | (4,722) | (1,437) |
| Decrease in net assets from distributions | (1,052,308) | (1,004,866) |
| | | |
| Capital Share Transactions | | |
| Net increase (decrease) in net assets from capital share transactions | (7,736) | (22,114,533) |
| | | |
| Redemption Fees | | |
| Increase in net assets from redemption fees | 3,329 | 2,341 |
| | | |
| Net increase (decrease) in net assets | (5,242,617) | (13,493,694) |
| | | |
| Net Assets | | |
| Beginning of period | 29,820,325 | 43,314,019 |
| End of period | $ 24,577,708 | $ 29,820,325 |
| | | |
| Undistributed net investment income | $295,295 | $1,051,953 |
| |
| |
| See Notes to Financial Statements. | | |
16
|
| Notes to Financial Statements |
MAY 28, 2010 (UNAUDITED)
1. Organization and Summary of Significant Accounting Policies
Organization — American Century World Mutual Funds, Inc. (the corporation) is registered under the Investment Company Act of 1940 (the 1940 Act) as an open-end management investment company. International Value Fund (the fund) is one fund in a series issued by the corporation. The fund is diversified under the 1940 Act. The fund’s investment objective is to seek long-term capital growth. The fund pursues its objective by investing primarily in equity securities of foreign companies. The fund may also invest a portion of its assets in U.S. companies. The following is a summary of the fund’s significant accounting policies.
Multiple Class — The fund is authorized to issue the Investor Class, the Institutional Class, the A Class, the B Class, the C Class and the R Class. The A Class may incur an initial sales charge. The A Class, B Class and C Class may be subject to a contingent deferred sales charge. The share classes differ principally in their respective sales charges and distribution and shareholder servicing expenses and arrangements. All shares of the fund represent an equal pro rata interest in the net assets of the class to which such shares belong, and have identical voting, dividend, liquidation and other rights and the same terms and conditions, except for class specific expenses and exclusive rights to vote on matters affecting only individual classes. Income, non-class specific expenses, and realized and unrealized capital gains and losses of the fund are allocated to each class of shares based on their relative net assets.
Security Valuations — Securities traded primarily on a principal securities exchange are valued at the last reported sales price, or at the mean of the latest bid and asked prices where no last sales price is available. Depending on local convention or regulation, securities traded over-the-counter are valued at the mean of the latest bid and asked prices, the last sales price, or the official close price. Investments in open-end management investment companies are valued at the reported net asset value. Discount notes may be valued through a commercial pricing service or at amortized cost, which approximates fair value. Securities traded on foreign securities exchanges and over-the-counter markets are normally completed before the close of business on days that the New York Stock Exchange (the Exchange) is open and may also take place on days when the Exchange is not open. If an event occurs after the value of a security was established but before the net asset value per share was determined that was likely to materially change the net asset value, that security would be valued as determined in accordance with procedures adopted by the Board of Directors. If the fund determines that the market price of a portfolio security is not readily available, or that the valuation methods mentioned above do not reflect the security’s fair value, such security is valued as determined by the Board of Directors or its designee, in accordance with procedures adopted by the Board of Directors, if such determination would materially impact a fund’s net asset value. Certain other circumstances may cause the fund to use alternative procedures to value a security such as: a security has been declared in default; trading in a security has been halted during the trading day; or there is a foreign market holiday and no trading will commence .
Security Transactions — For financial reporting purposes, security transactions are accounted for as of the trade date. Net realized gains and losses are determined on the identified cost basis, which is also used for federal income tax purposes.
Investment Income — Dividend income less foreign taxes withheld, if any, is recorded as of the ex-dividend date. Interest income is recorded on the accrual basis and includes accretion of discounts and amortization of premiums.
Foreign Currency Translations — All assets and liabilities initially expressed in foreign currencies are translated into U.S. dollars at prevailing exchange rates at period end. The fund may enter into spot foreign currency exchange contracts to facilitate transactions denominated in a foreign currency. Purchases and sales of investment securities, dividend and interest income, spot foreign currency exchange contracts, and certain expenses are translated at the rates of exchange prevailing on the respective dates of such transactions. Realized and unrealized gains and losses from foreign currency translations arise from changes in currency exchange rates.
17
Net realized and unrealized foreign currency exchange gains or losses occurring during the holding period of investment securities are a component of net realized gain (loss) on foreign currency transactions and net unrealized appreciation (depreciation) on translation of assets and liabilities in foreign currencies, respectively. Certain countries may impose taxes on the contract amount of purchases and sales of foreign currency contracts in their currency. The fund records the foreign tax expense, if any, as a reduction to the net realized gain (loss) on foreign currency transactions.
Repurchase Agreements — The fund may enter into repurchase agreements with institutions that American Century Investment Management, Inc. (ACIM) has determined are creditworthy pursuant to criteria adopted by the Board of Directors. Each repurchase agreement is recorded at cost. The fund requires that the collateral, represented by securities, received in a repurchase transaction be transferred to the custodian in a manner sufficient to enable the fund to obtain those securities in the event of a default under the repurchase agreement. ACIM monitors, on a daily basis, the securities transferred to ensure the value, including accrued interest, of the securities under each repurchase agreement is equal to or greater than amounts owed to the fund under each repurchase agreement.
Joint Trading Account — Pursuant to an Exemptive Order issued by the Securities and Exchange Commission, the fund, along with certain other funds in the American Century Investments family of funds, may transfer uninvested cash balances into a joint trading account. These balances are invested in one or more repurchase agreements that are collateralized by U.S. Treasury or Agency obligations.
Income Tax Status — It is the fund’s policy to distribute substantially all net investment income and net realized gains to shareholders and to otherwise qualify as a regulated investment company under provisions of the Internal Revenue Code. The fund is no longer subject to examination by tax authorities for years prior to 2006. Additionally, non-U.S. tax returns filed by the fund due to investments in certain foreign securities remain subject to examination by the relevant taxing authority for 7 years from the date of filing. At this time, management believes there are no uncertain tax positions which, based on their technical merit, would not be sustained upon examination and for which it is reasonably possible that the total amounts of unrecognized tax benefits will significantly change in the next twelve months. Accordingly, no provision has been made for federal or state income taxes.
Distributions to Shareholders — Distributions to shareholders are recorded on the ex-dividend date. Distributions from net investment income, if any, are generally declared and paid annually. Distributions from net realized gains, if any, are generally declared and paid twice per year. The fund may make distributions on a more frequent basis to comply with the distribution requirements of the Internal Revenue Code, in all events in a manner consistent with provisions of the 1940 Act.
Redemption — The fund may impose a 2.00% redemption fee on shares held less than 60 days. The fee may not be applicable to all classes. The redemption fee is retained by the fund and helps cover transaction costs that long-term investors may bear when the fund sells securities to meet investor redemptions.
Indemnifications — Under the corporation’s organizational documents, its officers and directors are indemnified against certain liabilities arising out of the performance of their duties to the fund. In addition, in the normal course of business, the fund enters into contracts that provide general indemnifications. The maximum exposure under these arrangements is unknown as this would involve future claims that may be made against a fund. The risk of material loss from such claims is considered by management to be remote.
Use of Estimates — The financial statements are prepared in conformity with accounting principles generally accepted in the United States of America, which may require management to make certain estimates and assumptions at the date of the financial statements. Actual results could differ from these estimates.
Subsequent Events — In preparing the financial statements, management evaluated the impact of events or transactions occurring through the date the financial statements were issued that would merit recognition or disclosure.
18
2. Fees and Transactions with Related Parties
Management Fees — The corporation has entered into a Management Agreement with American Century Global Investment Management, Inc. (ACGIM) (the investment advisor) (see Note 9), under which ACGIM provides the fund with investment advisory and management services in exchange for a single, unified management fee (the fee) per class. The Agreement provides that all expenses of managing and operating the fund, except brokerage expenses, taxes, interest, fees and expenses of the independent directors (including legal counsel fees), and extraordinary expenses, will be paid by ACGIM. The fee is computed and accrued daily based on the daily net assets of the specific class of shares of the fund and paid monthly in arrears. For funds with a stepped fee schedule, the rate of the fee is determined by applying a fee rate calculation formula. This formula takes into account the fund’s assets as well as certain assets, if any, of other clients of the investment advisor outside the American Century Investments family of funds (such as subadvised funds and separate accounts) that have very similar investment teams and investment strategies (strategy assets). The annual management fee schedule ranges from 1.10% to 1.30% for the Investor Class, A Class, B Class, C Class and R Class. The Institutional Class is 0.20% less at each point within the range. The effective annual management fee for each class for the six months ended May 28, 2010 was 1.30% for the Investor Class, A Class, B Class, C Class and R Class and 1.10% for the Institutional Class.
ACGIM has entered into a Subadvisory Agreement with ACIM (the subadvisor) on behalf of the fund. The subadvisor makes investment decisions for the cash portion of the fund in accordance with the fund’s investment objectives, policies and restrictions under the supervision of ACGIM and the Board of Directors. ACGIM pays all costs associated with retaining ACIM as the subadvisor of the fund.
ACGIM has entered into a Subadvisory Agreement with Templeton Investment Counsel, LLC (Templeton) on behalf of the fund. Templeton makes investment decisions for the fund in accordance with the fund’s investment objectives, policies, and restrictions under the supervision of ACGIM and the Board of Directors. ACGIM pays all costs associated with retaining Templeton as the subadvisor of the fund. Templeton has entered into a Subadvisory Agreement with Franklin Templeton Investments (Asia) Limited on behalf of the fund.
Distribution and Service Fees — The Board of Directors has adopted a separate Master Distribution and Individual Shareholder Services Plan for each of the A Class, B Class, C Class and R Class (collectively the plans), pursuant to Rule 12b-1 of the 1940 Act. The plans provide that the A Class will pay American Century Investment Services, Inc. (ACIS) an annual distribution and service fee of 0.25%. The plans provide that the B Class and the C Class will each pay ACIS an annual distribution fee of 0.75% and service fee of 0.25%. The plans provide that the R Class will pay ACIS an annual distribution and service fee of 0.50%. The fees are computed and accrued daily based on each class’s daily net assets and paid monthly in arrears. The fees are used to pay financial intermediaries for distribution and individual shareh older services. Fees incurred under the plans during the six months ended May 28, 2010, are detailed in the Statement of Operations.
Other Expenses — The fund’s total other expenses include the fees and expenses of the fund’s independent directors and their legal counsel, interest, and other miscellaneous expenses. A portion of these expenses was due to nonrecurring expenses paid by the fund. The impact of total other expenses to the annualized ratio of operating expenses to average net assets was 0.02%.
Related Parties — Certain officers and directors of the corporation are also officers and/ or directors of American Century Companies, Inc. (ACC), the parent of the corporation’s investment advisor, ACGIM, the corporation’s subadvisor, ACIM, the distributor of the corporation, ACIS, and the corporation’s transfer agent, American Century Services, LLC.
The fund is eligible to invest in a money market fund for temporary purposes, which is managed by J.P. Morgan Investment Management, Inc. (JPMIM). The fund has a Mutual Funds Services Agreement with J.P. Morgan Investor Services Co. (JPMIS). JPMorgan Chase Bank (JPMCB) is a custodian of the fund. JPMIM, JPMIS and JPMCB are wholly owned subsidiaries of JPMorgan Chase & Co. (JPM). JPM is an equity investor in ACC.
19
3. Investment Transactions
Purchases and sales of investment securities, excluding short-term investments, for the six months ended May 28, 2010, were $4,378,364 and $3,582,525, respectively.
| | | | |
| 4. Capital Share Transactions | | | | |
| |
| Transactions in shares of the fund were as follows: | | |
| | Six months ended May 28, 2010 | Year ended November 30, 2009 |
| | Shares | Amount | Shares | Amount |
| Investor Class/Shares Authorized | 55,000,000 | | 55,000,000 | |
| Sold | 347,173 | $ 2,423,066 | 673,027 | $ 4,620,879 |
| Issued in reinvestment of distributions | 38,587 | 273,798 | 9,439 | 54,649 |
| Redeemed | (390,195) | (2,771,587) | (177,325) | (1,061,257) |
| | (4,435) | (74,723) | 505,141 | 3,614,271 |
| Institutional Class/Shares Authorized | 55,000,000 | | 55,000,000 | |
| Sold | 36,253 | 247,319 | 110,391 | 687,461 |
| Issued in reinvestment of distributions | 10,333 | 73,160 | 105,262 | 609,469 |
| Redeemed | (45,101) | (316,683) | (4,343,332) | (26,020,480) |
| | 1,485 | 3,796 | (4,127,679) | (24,723,550) |
| A Class/Shares Authorized | 45,000,000 | | 55,000,000 | |
| Sold | 750,740 | 5,474,243 | 573,706 | 3,482,243 |
| Issued in reinvestment of distributions | 89,337 | 636,290 | 52,914 | 307,968 |
| Redeemed | (885,140) | (6,018,456) | (823,600) | (4,757,711) |
| | (45,063) | 92,077 | (196,980) | (967,500) |
| B Class/Shares Authorized | 5,000,000 | | 5,000,000 | |
| Sold | — | — | 22,588 | 137,394 |
| Issued in reinvestment of distributions | 4,077 | 28,443 | 3,600 | 20,448 |
| Redeemed | (42,977) | (295,765) | (102,821) | (558,503) |
| | (38,900) | (267,322) | (76,633) | (400,661) |
| C Class/Shares Authorized | 10,000,000 | | 50,000,000 | |
| Sold | 33,546 | 239,654 | 73,369 | 441,842 |
| Issued in reinvestment of distributions | 2,661 | 18,909 | 808 | 4,679 |
| Redeemed | (21,008) | (142,925) | (16,397) | (95,563) |
| | 15,199 | 115,638 | 57,780 | 350,958 |
| R Class/Shares Authorized | 5,000,000 | | 5,000,000 | |
| Sold | 19,658 | 138,144 | 5,090 | 29,371 |
| Issued in reinvestment of distributions | 667 | 4,722 | 248 | 1,437 |
| Redeemed | (2,974) | (20,068) | (2,852) | (18,859) |
| | 17,351 | 122,798 | 2,486 | 11,949 |
| Net increase (decrease) | (54,363) | $ (7,736) | (3,835,885) | $(22,114,533) |
20
5. Fair Value Measurements
The fund’s securities valuation process is based on several considerations and may use multiple inputs to determine the fair value of the positions held by the fund. In conformity with accounting principles generally accepted in the United States of America, the inputs used to determine a valuation are classified into three broad levels as follows:
• Level 1 valuation inputs consist of unadjusted quoted prices in an active market for identical securities;
• Level 2 valuation inputs consist of significant direct or indirect observable market data (including quoted prices for similar securities, evaluations of subsequent market events, interest rates, prepayment speeds, credit risk, etc.); or
• Level 3 valuation inputs consist of significant unobservable inputs (including a fund’s own assumptions).
The level classification is based on the lowest level input that is significant to the fair valuation measurement. The valuation inputs are not an indication of the risks associated with investing in these securities or other financial instruments.
The following is a summary of the valuation inputs used to determine the fair value of the fund’s securities as of May 28, 2010. The Schedule of Investments provides additional details on the fund’s portfolio holdings.
| | | |
| | Level 1 | Level 2 | Level 3 |
| Investment Securities | | | |
| Foreign Common Stocks & Rights | $2,422,424 | $21,826,434 | — |
| Temporary Cash Investments | 97,764 | — | — |
| Total Value of Investment Securities | $2,520,188 | $21,826,434 | — |
6. Risk Factors
There are certain risks involved in investing in foreign securities. These risks include those resulting from future adverse political, social, and economic developments, fluctuations in currency exchange rates, the possible imposition of exchange controls, and other foreign laws or restrictions. Investing in emerging markets may accentuate these risks.
7. Interfund Lending
The fund, along with certain other funds in the American Century Investments family of funds, may participate in an interfund lending program, pursuant to an Exemptive Order issued by the Securities and Exchange Commission (SEC). This program provides an alternative credit facility allowing the fund to borrow from or lend to other funds in the American Century Investments family of funds that permit such transactions. Interfund lending transactions are subject to each fund’s investment policies and borrowing and lending limits. The interfund loan rate earned/paid on interfund lending transactions is determined daily based on the average of certain current market rates. Interfund lending transactions normally extend only overnight, but can have a maximum duration of seven days. The program is subject to annual approval by the Board of Directors. During the six months ended May 28, 2010, the fund did not utiliz e the program.
21
8. Federal Tax Information
The book-basis character of distributions made during the year from net investment income or net realized gains may differ from their ultimate characterization for federal income tax purposes. These differences reflect the differing character of certain income items and net realized gains and losses for financial statement and tax purposes, and may result in reclassification among certain capital accounts on the financial statements.
As of May 28, 2010, the components of investments for federal income tax purposes were as follows:
| | |
| Federal tax cost of investments | $24,237,812 |
| Gross tax appreciation of investments | $ 3,978,316 |
| Gross tax depreciation of investments | (3,869,506) |
| Net tax appreciation (depreciation) of investments | $ 108,810 |
The difference between book-basis and tax-basis cost and unrealized appreciation (depreciation) is attributable primarily to the tax deferral of losses on wash sales.
As of November 30, 2009, the fund had accumulated capital losses of $(8,554,284), which represent net capital loss carryovers that may be used to offset future realized capital gains for federal income tax purposes. Future capital loss carryover utilization in any given year may be subject to Internal Revenue Code limitations. Capital loss carryovers of $(1,370,503) and $(7,183,781) expire in 2016 and 2017, respectively.
9. Corporate Event
As part of a long-standing estate and business succession plan established by ACC Co-Chairman James E. Stowers, Jr., the founder of American Century Investments, ACC Co-Chairman Richard W. Brown succeeded Mr. Stowers as trustee of a trust that holds a greater-than-25% voting interest in ACC, the parent corporation of the fund’s advisors. Under the 1940 Act, this is presumed to represent control of ACC even though it is less than a majority interest. The change of trustee may technically be considered a “change of control” of ACC and therefore also a change of control of the fund’s advisors even though there has been no change to their management and none is anticipated. The “change of control” resulted in the assignment of the fund’s investment advisory and subadvisory agreements. Under the 1940 Act, an assignment automatically terminated such agreements, making the approval of n ew agreements necessary.
On February 16, 2010, the Board of Directors approved interim investment advisory and subadvisory agreements under which the fund will be managed until new agreements are approved by fund shareholders. The interim agreements are substantially identical to the terminated agreements (with the exception of different effective and termination dates) and will not result in changes in the management of American Century Investments, the fund, its investment objectives, fees or services provided. On March 29, 2010, the Board of Directors approved new investment advisory and subadvisory agreements. The new agreements are also substantially identical to the terminated agreements (except for the date, the substitution of ACIM for ACGIM and certain other non-material changes). In order to streamline American Century’s corporate organization, ACGIM was merged into ACIM on July 16, 2010. The new agreements for the fund wer e approved by shareholders at a Special Meeting of Shareholders on June 16, 2010. The new agreements went into effect on July 16, 2010.
22
| | | | | | |
| International Value | | | | | |
| |
| Investor Class | | | | | |
| For a Share Outstanding Throughout the Years Ended November 30 (except as noted) | | |
| | | 2010(1) | 2009 | 2008 | 2007 | 2006(2) |
| Per-Share Data | | | | | |
| Net Asset Value, Beginning of Period | $7.33 | $5.47 | $11.48 | $14.36 | $12.85 |
| Income From Investment Operations | | | | | |
| Net Investment Income (Loss)(3) | 0.08 | 0.11 | 0.19 | 0.22 | 0.15 |
| Net Realized and Unrealized Gain (Loss) | (1.02) | 1.88 | (5.18) | 2.09 | 1.36 |
| Total From Investment Operations | (0.94) | 1.99 | (4.99) | 2.31 | 1.51 |
| Distributions | | | | | |
| From Net Investment Income | (0.29) | (0.13) | (0.24) | (0.47) | — |
| From Net Realized Gains | — | — | (0.78) | (4.72) | — |
| Total Distributions | (0.29) | (0.13) | (1.02) | (5.19) | — |
| Net Asset Value, End of Period | $6.10 | $7.33 | $5.47 | $11.48 | $14.36 |
| |
| Total Return(4) | (13.32)% | 36.98% | (47.43)% | 23.55% | 11.75% |
| | | | | | |
| Ratios/Supplemental Data | | | | | |
| Ratio of Operating Expenses | | | | | |
| to Average Net Assets | 1.32%(5) | 1.31% | 1.31% | 1.30% | 1.30%(5) |
| Ratio of Net Investment Income (Loss) | | | | | |
| to Average Net Assets | 2.30%(5) | 2.34% | 2.20% | 1.96% | 2.77%(5)(6) |
| Portfolio Turnover Rate | 13% | 16% | 4% | 11% | 17% |
| Net Assets, End of Period (in thousands) | $5,851 | $7,062 | $2,512 | $3,044 | $437 |
| (1) | Six months ended May 28, 2010 (unaudited). | | | | | |
| (2) | April 3, 2006 (commencement of sale) through November 30, 2006. | | | | |
| (3) | Computed using average shares outstanding throughout the period. | | | | |
| (4) | Total return assumes reinvestment of net investment income and capital gains distributions, if any. Total returns for periods less than one year |
| | are not annualized. Total returns are calculated based on the net asset value of the last business day. The total return of the classes may not |
| | precisely reflect the class expense differences because of the impact of calculating the net asset values to two decimal places. If net asset |
| | values were calculated to three decimal places, the total return differences would more closely reflect the class expense differences. The |
| | calculation of net asset values to two decimal places is made in accordance with SEC guidelines and does not result in any gain or loss of value |
| | between one class and another. | | | | | |
| (5) | Annualized. | | | | | |
| (6) | Due to cyclical dividends and the eight-month period ended November 30, 2006, the annualized ratio of net investment income (loss) to average |
| | net assets is higher than expected. | | | | | |
See Notes to Financial Statements.
23
| | | | | | |
| International Value | | | | | |
| |
| Institutional Class | | | | | |
| For a Share Outstanding Throughout the Years Ended November 30 (except as noted) | | |
| | | 2010(1) | 2009 | 2008 | 2007 | 2006(2) |
| Per-Share Data | | | | | |
| Net Asset Value, Beginning of Period | $7.34 | $5.48 | $11.50 | $14.38 | $12.85 |
| Income From Investment Operations | | | | | |
| Net Investment Income (Loss)(3) | 0.09 | 0.18 | 0.21 | 0.23 | 0.25 |
| Net Realized and Unrealized Gain (Loss) | (1.02) | 1.82 | (5.19) | 2.10 | 1.28 |
| Total From Investment Operations | (0.93) | 2.00 | (4.98) | 2.33 | 1.53 |
| Distributions | | | | | |
| From Net Investment Income | (0.32) | (0.14) | (0.26) | (0.49) | — |
| From Net Realized Gains | — | — | (0.78) | (4.72) | — |
| Total Distributions | (0.32) | (0.14) | (1.04) | (5.21) | — |
| Net Asset Value, End of Period | $6.09 | $7.34 | $5.48 | $11.50 | $14.38 |
| |
| Total Return(4) | (13.23)% | 37.18% | (47.32)% | 23.77% | 11.91% |
| | | | | | |
| Ratios/Supplemental Data | | | | | |
| Ratio of Operating Expenses | | | | | |
| to Average Net Assets | 1.12%(5) | 1.11% | 1.11% | 1.10% | 1.10%(5) |
| Ratio of Net Investment Income (Loss) | | | | | |
| to Average Net Assets | 2.50%(5) | 2.54% | 2.40% | 2.16% | 2.97%(5)(6) |
| Portfolio Turnover Rate | 13% | 16% | 4% | 11% | 17% |
| Net Assets, End of Period (in thousands) | $1,359 | $1,627 | $23,847 | $45,262 | $35,574 |
| (1) | Six months ended May 28, 2010 (unaudited). | | | | | |
| (2) | April 3, 2006 (commencement of sale) through November 30, 2006. | | | | |
| (3) | Computed using average shares outstanding throughout the period. | | | | |
| (4) | Total return assumes reinvestment of net investment income and capital gains distributions, if any. Total returns for periods less than one year |
| | are not annualized. Total returns are calculated based on the net asset value of the last business day. The total return of the classes may not |
| | precisely reflect the class expense differences because of the impact of calculating the net asset values to two decimal places. If net asset |
| | values were calculated to three decimal places, the total return differences would more closely reflect the class expense differences. The |
| | calculation of net asset values to two decimal places is made in accordance with SEC guidelines and does not result in any gain or loss of value |
| | between one class and another. | | | | | |
| (5) | Annualized. | | | | | |
| (6) | Due to cyclical dividends and the eight-month period ended November 30, 2006, the annualized ratio of net investment income (loss) to average |
| | net assets is higher than expected. | | | | | |
See Notes to Financial Statements.
24
| | | | | | | | |
| International Value | | | | | | |
| |
| A Class | | | | | | | |
| For a Share Outstanding Throughout the Years Ended November 30 (except as noted) | | |
| | | 2010(1) | 2009 | 2008 | 2007 | 2006(2) | 2006 | 2005 |
| Per-Share Data | | | | | | | |
| Net Asset Value, | | | | | | | |
| Beginning of Period | $7.33 | $5.48 | $11.49 | $14.35 | $12.70 | $10.91 | $9.64 |
| Income From | | | | | | | |
| Investment Operations | | | | | | | |
| Net Investment | | | | | | | |
| Income (Loss)(3) | 0.07 | 0.10 | 0.18 | 0.20 | 0.25 | 0.18 | 0.13 |
| Net Realized and | | | | | | | |
| Unrealized Gain (Loss) | (1.01) | 1.86 | (5.20) | 2.11 | 1.40 | 1.97 | 1.37 |
| Total From | | | | | | | |
| Investment Operations | (0.94) | 1.96 | (5.02) | 2.31 | 1.65 | 2.15 | 1.50 |
| Distributions | | | | | | | |
| From Net Investment Income | (0.26) | (0.11) | (0.21) | (0.45) | — | (0.15) | (0.11) |
| From Net Realized Gains | — | — | (0.78) | (4.72) | — | (0.21) | (0.12) |
| Total Distributions | (0.26) | (0.11) | (0.99) | (5.17) | — | (0.36) | (0.23) |
| Net Asset Value, End of Period | $6.13 | $7.33 | $5.48 | $11.49 | $14.35 | $12.70 | $10.91 |
| |
| Total Return(4) | (13.34)% | 36.40% | (47.53)% | 23.44% | 12.99% | 19.95% | 15.58% |
| | | | | | | | |
| Ratios/Supplemental Data | | | | | | | |
| Ratio of Operating Expenses | | | | | | | |
| to Average Net Assets | 1.57%(6) | 1.56% | 1.51%(5) | 1.40%(5) | 1.40%(5)(6) | 1.35% | 1.41% |
| Ratio of Operating Expenses | | | | | | | |
| to Average Net Assets | | | | | | | |
| (Before Expense Waiver) | 1.57%(6) | 1.56% | 1.56% | 1.55% | 1.55%(6) | 1.35% | 1.41% |
| Ratio of Net Investment Income | | | | | | | |
| (Loss) to Average Net Assets | 2.05%(6) | 2.09% | 2.00%(5) | 1.86%(5) | 2.67%(5)(6)(7) | 1.52% | 1.28% |
| Ratio of Net Investment Income | | | | | | | |
| (Loss) to Average Net Assets | | | | | | | |
| (Before Expense Waiver) | 2.05%(6) | 2.09% | 1.95% | 1.71% | 2.52%(6)(7) | 1.52% | 1.28% |
| Portfolio Turnover Rate | 13% | 16% | 4% | 11% | 17% | 7% | 18% |
| Net Assets, End of Period | | | | | | | |
| (in thousands) | $15,302 | $18,644 | $15,015 | $24,558 | $19,890 | $54,617 | $203,215 |
| (1) | Six months ended May 28, 2010 (unaudited). | | | | | | |
| (2) | April 1, 2006 through November 30, 2006. The fund’s fiscal year end was changed from March 31 to November 30, resulting in an eight-month |
| | annual reporting period. For the years before November 30, 2006, the fund’s fiscal year end was March 31. | | |
| (3) | Computed using average shares outstanding throughout the period. | | | | | |
| (4) | Total return assumes reinvestment of net investment income and capital gains distributions, if any, and does not reflect applicable sales charges. |
| | Total returns for periods less than one year are not annualized. Total returns are calculated based on the net asset value of the last business day. |
| | The total return of the classes may not precisely reflect the class expense differences because of the impact of calculating the net asset values |
| | to two decimal places. If net asset values were calculated to three decimal places, the total return differences would more closely reflect the |
| | class expense differences. The calculation of net asset values to two decimal places is made in accordance with SEC guidelines and does not |
| | result in any gain or loss of value between one class and another. | | | | | |
| (5) | The distributor voluntarily waived a portion of its distribution and service fees from April 1, 2006 through March 31, 2008. | |
| (6) | Annualized. | | | | | | | |
| (7) | Due to cyclical dividends and the eight-month period ended November 30, 2006, the annualized ratio of net investment income (loss) to average |
| | net assets is higher than expected. | | | | | | | |
See Notes to Financial Statements.
25
| | | | | | | | |
| International Value | | | | | | |
| |
| B Class | | | | | | | |
| For a Share Outstanding Throughout the Years Ended November 30 (except as noted) | | |
| | | 2010(1) | 2009 | 2008 | 2007 | 2006(2) | 2006 | 2005 |
| Per-Share Data | | | | | | | |
| Net Asset Value, | | | | | | | |
| Beginning of Period | $7.11 | $5.32 | $11.16 | $14.08 | $12.51 | $10.75 | $9.52 |
| Income From | | | | | | | |
| Investment Operations | | | | | | | |
| Net Investment | | | | | | | |
| Income (Loss)(3) | 0.04 | 0.05 | 0.11 | 0.12 | 0.17 | 0.10 | 0.06 |
| Net Realized and | | | | | | | |
| Unrealized Gain (Loss) | (1.00) | 1.81 | (5.05) | 2.05 | 1.40 | 1.93 | 1.34 |
| Total From | | | | | | | |
| Investment Operations | (0.96) | 1.86 | (4.94) | 2.17 | 1.57 | 2.03 | 1.40 |
| Distributions | | | | | | | |
| From Net Investment Income | (0.15) | (0.07) | (0.12) | (0.37) | — | (0.06) | (0.05) |
| From Net Realized Gains | — | — | (0.78) | (4.72) | — | (0.21) | (0.12) |
| Total Distributions | (0.15) | (0.07) | (0.90) | (5.09) | — | (0.27) | (0.17) |
| Net Asset Value, End of Period | $6.00 | $7.11 | $5.32 | $11.16 | $14.08 | $12.51 | $10.75 |
| |
| Total Return(4) | (13.82)% | 35.36% | (47.84)% | 22.51% | 12.55% | 19.07% | 14.69% |
| | | | | | | | |
| Ratios/Supplemental Data | | | | | | | |
| Ratio of Operating Expenses | | | | | | | |
| to Average Net Assets | 2.32%(6) | 2.31% | 2.22%(5) | 2.09%(5) | 2.09%(5)(6) | 2.08% | 2.09% |
| Ratio of Operating Expenses | | | | | | | |
| to Average Net Assets | | | | | | | |
| (Before Expense Waiver) | 2.32%(6) | 2.31% | 2.31% | 2.30% | 2.30%(6) | 2.08% | 2.09% |
| Ratio of Net Investment Income | | | | | | | |
| (Loss) to Average Net Assets | 1.30%(6) | 1.34% | 1.29%(5) | 1.17%(5) | 1.98%(5)(6)(7) | 0.90% | 0.61% |
| Ratio of Net Investment Income | | | | | | | |
| (Loss) to Average Net Assets | | | | | | | |
| (Before Expense Waiver) | 1.30%(6) | 1.34% | 1.20% | 0.96% | 1.77%(6)(7) | 0.90% | 0.61% |
| Portfolio Turnover Rate | 13% | 16% | 4% | 11% | 17% | 7% | 18% |
| Net Assets, End of Period | | | | | | | |
| (in thousands) | $1,029 | $1,495 | $1,526 | $4,059 | $4,313 | $4,917 | $5,165 |
| (1) | Six months ended May 28, 2010 (unaudited). | | | | | | |
| (2) | April 1, 2006 through November 30, 2006. The fund’s fiscal year end was changed from March 31 to November 30, resulting in an eight-month |
| | annual reporting period. For the years before November 30, 2006, the fund’s fiscal year end was March 31. | | |
| (3) | Computed using average shares outstanding throughout the period. | | | | | |
| (4) | Total return assumes reinvestment of net investment income and capital gains distributions, if any, and does not reflect applicable sales charges. |
| | Total returns for periods less than one year are not annualized. Total returns are calculated based on the net asset value of the last business day. |
| | The total return of the classes may not precisely reflect the class expense differences because of the impact of calculating the net asset values |
| | to two decimal places. If net asset values were calculated to three decimal places, the total return differences would more closely reflect the |
| | class expense differences. The calculation of net asset values to two decimal places is made in accordance with SEC guidelines and does not |
| | result in any gain or loss of value between one class and another. | | | | | |
| (5) | The distributor voluntarily waived a portion of its distribution and service fees from April 1, 2006 through March 31, 2008. | |
| (6) | Annualized. | | | | | | | |
| (7) | Due to cyclical dividends and the eight-month period ended November 30, 2006, the annualized ratio of net investment income (loss) to average |
| | net assets is higher than expected. | | | | | | | |
See Notes to Financial Statements.
26
| | | | | | |
| International Value | | | | | |
| |
| C Class | | | | | |
| For a Share Outstanding Throughout the Years Ended November 30 (except as noted) | | |
| | | 2010(1) | 2009 | 2008 | 2007 | 2006(2) |
| Per-Share Data | | | | | |
| Net Asset Value, Beginning of Period | $7.25 | $5.42 | $11.37 | $14.27 | $12.85 |
| Income From Investment Operations | | | | | |
| Net Investment Income (Loss)(3) | 0.05 | 0.05 | 0.12 | 0.12 | 0.14 |
| Net Realized and Unrealized Gain (Loss) | (1.02) | 1.85 | (5.17) | 2.07 | 1.28 |
| Total From Investment Operations | (0.97) | 1.90 | (5.05) | 2.19 | 1.42 |
| Distributions | | | | | |
| From Net Investment Income | (0.15) | (0.07) | (0.12) | (0.37) | — |
| From Net Realized Gains | — | — | (0.78) | (4.72) | — |
| Total Distributions | (0.15) | (0.07) | (0.90) | (5.09) | — |
| Net Asset Value, End of Period | $6.13 | $7.25 | $5.42 | $11.37 | $14.27 |
| |
| Total Return(4) | (13.83)% | 35.44% | (47.93)% | 22.28% | 11.05% |
| | | | | | |
| Ratios/Supplemental Data | | | | | |
| Ratio of Operating Expenses | | | | | |
| to Average Net Assets | 2.32%(5) | 2.31% | 2.31% | 2.30% | 2.30%(5) |
| Ratio of Net Investment Income (Loss) | | | | | |
| to Average Net Assets | 1.30%(5) | 1.34% | 1.20% | 0.96% | 1.77%(5)(6) |
| Portfolio Turnover Rate | 13% | 16% | 4% | 11% | 17% |
| Net Assets, End of Period (in thousands) | $827 | $869 | $337 | $222 | $41 |
| (1) | Six months ended May 28, 2010 (unaudited). | | | | | |
| (2) | April 3, 2006 (commencement of sale) through November 30, 2006. | | | | |
| (3) | Computed using average shares outstanding throughout the period. | | | | |
| (4) | Total return assumes reinvestment of net investment income and capital gains distributions, if any, and does not reflect applicable sales charges. |
| | Total returns for periods less than one year are not annualized. Total returns are calculated based on the net asset value of the last business day. |
| | The total return of the classes may not precisely reflect the class expense differences because of the impact of calculating the net asset values |
| | to two decimal places. If net asset values were calculated to three decimal places, the total return differences would more closely reflect the |
| | class expense differences. The calculation of net asset values to two decimal places is made in accordance with SEC guidelines and does not |
| | result in any gain or loss of value between one class and another. | | | | |
| (5) | Annualized. | | | | | |
| (6) | Due to cyclical dividends and the eight-month period ended November 30, 2006, the annualized ratio of net investment income (loss) to average |
| | net assets is higher than expected. | | | | | |
See Notes to Financial Statements.
27
| | | | | | |
| International Value | | | | | |
| |
| R Class | | | | | |
| For a Share Outstanding Throughout the Years Ended November 30 (except as noted) | | |
| | | 2010(1) | 2009 | 2008 | 2007 | 2006(2) |
| Per-Share Data | | | | | |
| Net Asset Value, Beginning of Period | $7.28 | $5.45 | $11.42 | $14.31 | $12.85 |
| Income From Investment Operations | | | | | |
| Net Investment Income (Loss)(3) | 0.09 | 0.09 | 0.13 | 0.11 | 0.19 |
| Net Realized and Unrealized Gain (Loss) | (1.04) | 1.84 | (5.14) | 2.14 | 1.27 |
| Total From Investment Operations | (0.95) | 1.93 | (5.01) | 2.25 | 1.46 |
| Distributions | | | | | |
| From Net Investment Income | (0.22) | (0.10) | (0.18) | (0.42) | — |
| From Net Realized Gains | — | — | (0.78) | (4.72) | — |
| Total Distributions | (0.22) | (0.10) | (0.96) | (5.14) | — |
| Net Asset Value, End of Period | $6.11 | $7.28 | $5.45 | $11.42 | $14.31 |
| |
| Total Return(4) | (13.46)% | 35.90% | (47.61)% | 22.91% | 11.36% |
| | | | | | |
| Ratios/Supplemental Data | | | | | |
| Ratio of Operating Expenses | | | | | |
| to Average Net Assets | 1.82%(5) | 1.81% | 1.81% | 1.80% | 1.80%(5) |
| Ratio of Net Investment Income (Loss) | | | | | |
| to Average Net Assets | 1.80%(5) | 1.84% | 1.70% | 1.46% | 2.27%(5)(6) |
| Portfolio Turnover Rate | 13% | 16% | 4% | 11% | 17% |
| Net Assets, End of Period (in thousands) | $209 | $123 | $78 | $202 | $28 |
| (1) | Six months ended May 28, 2010 (unaudited). | | | | | |
| (2) | April 3, 2006 (commencement of sale) through November 30, 2006. | | | | |
| (3) | Computed using average shares outstanding throughout the period. | | | | |
| (4) | Total return assumes reinvestment of net investment income and capital gains distributions, if any. Total returns for periods less than one year |
| | are not annualized. Total returns are calculated based on the net asset value of the last business day. The total return of the classes may not |
| | precisely reflect the class expense differences because of the impact of calculating the net asset values to two decimal places. If net asset |
| | values were calculated to three decimal places, the total return differences would more closely reflect the class expense differences. The |
| | calculation of net asset values to two decimal places is made in accordance with SEC guidelines and does not result in any gain or loss of value |
| | between one class and another. | | | | | |
| (5) | Annualized. | | | | | |
| (6) | Due to cyclical dividends and the eight-month period ended November 30, 2006, the annualized ratio of net investment income (loss) to average |
| | net assets is higher than expected. | | | | | |
See Notes to Financial Statements.
28
|
| Board Approval of Management and Subadvisory Agreements |
American Century Global Investment Management, Inc. (“ACGIM” or the “Advisor”) currently serves as investment advisor to the Fund under an interim management agreement (the “Interim Management Agreement”) between the Advisor and the Fund approved by the Fund’s Board of Directors (the “Board”). American Century Investment Management, Inc. (“ACIM” or the “Subadvisor”) currently serves as subadvisor to the Fund under an interim investment subadvisory agreement (the “Interim Subad-visory Agreement” and, together with the Interim Management Agreement, the “Interim Agreements”). The Advisor and the Subadvisor (together, the “Advisors”) previously served as investment advisors to the Fund pursuant to agreements (the “Prior Agreements”). In addition, Templeton Investment Counsel, LLC (“Templeton”) currently s erves as a subadvisor to the Fund under an interim investment subadvisory agreement with ACGIM (the “Templeton Interim Subadvisory Agreement”). Franklin Templeton Investments (Asia) Limited (“Franklin Asia” and, together with Templeton, the “Templeton Subadisors”) also currently serves as an additional subad-visor to the fund under an interim investment subadvisory agreement with Templeton (“Franklin Asia Interim Subadvisory Agreement” and, together with the Templeton Interim Subadvisory Agreement, the “Interim Templeton Agreements”). Templeton and Franklin Asia previously served as investment advisors to the Fund pursuant to agreements (the “Prior Templeton Agreements”). The Prior Agreements and Prior Templeton Agreements all terminated in accordance with their terms on February 16, 2010, as a result of a change of control of the Advisor’s and the Subadvisor’s parent company, American Century Companies, Inc. (“ACC”). The change in control occurred as the result of a change in the trustee of a trust created by James E. Stowers, Jr., the founder of American Century Investments, which holds shares representing a significant interest in ACC stock. Mr. Stowers previously served as the trustee of the trust. On February 16, 2010, Richard W. Brown, Co-Chairman of ACC with Mr. Stowers, became the trustee in accordance with the terms of the trust and Mr. Stowers’ long-standing estate and succession plan.
On February 18, 2010, the Board approved the Interim Agreements and Interim Templeton Agreements in accordance with Rule 15a-4 under the Investment Company Act to ensure continued management of the Fund by the Advisor, Subadvisor, Templeton and Franklin Asia after the termination of the Prior Agreements and Prior Templeton Agreements. In addition, because American Century had indicated its intention to merge ACGIM into ACIM prior to the expiration of the Interim Agreements and Interim Templeton Agreements, the new management agreements (which require Shareholder approval under the Act) that replace the Interim Agreements and Interim Templeton Agreements are between the Fund and ACIM as investment advisor to the Fund (the “Proposed Management Agreement”) and between ACIM and the Templeton Subadvisors as subadvisors to the Fund (the “Proposed Combined Subadvisory Agreement” and, together with the Proposed Management Agreement, the “Proposed Agreements”). The Board approved the Proposed Agreements and recommended their approval to shareholders. Fund shareholders approved the Proposed Agreements at a meeting on June 16, 2010.
29
The Board took into consideration that the combination of ACGIM into ACIM is being undertaken for reasons of organizational simplification and will eliminate the need for additional investment management agreements without changing the nature, quality, or extent of services provided to the Fund. The Board noted that the merger was not related to the change of control that necessitated the Interim Agreements and Interim Templeton Agreements and would not result in any change to the personnel managing the Fund.
The Interim Agreements and the Proposed Management Agreement are substantially identical to the Prior Agreements except for their effective dates, the termination provisions of the Interim Agreements, and the elimination of a subadvisor in the Proposed Management Agreement. The Interim Templeton Agreements and Proposed Combined Subadvisory Agreement are substantially identical to the Prior Templeton Agreements except for their effective dates, the termination provisions of the Interim Templeton Agreements and the combination of the two subadvisory agreements into the Proposed Combined Subadvisory Agreement. Under the Proposed Agreements, ACIM will provide the same services as provided by ACGIM and ACIM, and Templeton and Franklin Asia will continue to provide the same services. In addition, under the Proposed Agreements, ACIM, Templeton and Franklin Asia will be subject to the same duties, and receive the same c ompensation rate as under the Prior Agreements and Prior Templeton Agreements.
Basis for Board Approval of Interim Agreements
In considering the approval of the Interim Agreements, Rule 15a-4 requires the Board to approve the contracts within ten business days of the termination of the prior agreements and to determine that the compensation to be received under each interim agreement is no greater than would have been received under the corresponding prior agreement. In connection with the approval, the Board noted that it oversees on a continuous basis and evaluates at its quarterly meetings, directly and through the committees of the Board, the nature and quality of significant services provided by the Advisor and the Subadvisor, the investment performance of the Fund, shareholder services, audit and compliance functions and a variety of other matters relating to the Fund’s operations.
In evaluating the Interim Agreements, the Board, assisted by the advice of its independent legal counsel, considered a number of factors in addition to those required by the rule with no one factor being determinative to its analysis. Among the factors considered by the Board were the circumstances and effect of the change of control, the fact that the Advisor and the Subad-visor will provide the same services and receive the same compensation rate as under the Prior Agreements, and that the change of control did not result in a change of the personnel managing the Fund. Upon completion of its analysis, the Board approved the Interim Agreements, determining that the continued management of the Fund by the Advisor and the Subadvisor was in the best interests of the Fund and Fund shareholders.
30
Basis for Board Approval of Proposed Management Agreement
At a meeting held on March 29, 2010, after considering all information presented, the Board approved, and determined to recommend that shareholders approve, the Proposed Management Agreement. In connection with that approval, the Board requested and reviewed extensive data and information compiled by the Advisor, the Subadvisor, and certain independent providers of evaluation data concerning the Fund and services provided to the Fund. The Board oversees on a continuous basis and evaluates at its quarterly meetings, directly and through the committees of the Board, the nature and quality of significant services provided to the Fund, the investment performance of the Fund, shareholder services, audit and compliance functions and a variety of other matters relating to the Fund’s operations. The information considered and the discussions held at the meetings included, but were not limited to:
• the nature, extent and quality of investment management, shareholder services and other services provided to the Fund;
• the wide range of programs and services provided to the Fund and its shareholders on a routine and non-routine basis;
• the compliance policies, procedures, and regulatory experience of the Advisors;
• data comparing the cost of owning the Fund to the cost of owning similar funds;
• the fact that there will be no changes to the fees, services, or personnel who provide such services as compared to the Prior Agreements;
• data comparing the Fund’s performance to appropriate benchmarks and/or a peer group of other mutual funds with similar investment objectives and strategies;
• financial data showing the profitability of the Fund to the Advisors and the overall profitability of the Advisors;
• data comparing services provided and charges to the Fund with those for other non-fund investment management clients of the Advisors; and
• consideration of collateral or “fall-out” benefits derived by the Advisors from the management of the Fund and potential sharing of economies of scale in connection with the management of the Fund.
The Board also considered whether there was any reason for not continuing the existing arrangement with the consolidated Advisors. In particular, the Board recognized that shareholders may have invested in the Fund on the strength of the Advisors’ industry standing and reputation and in the expectation that the Advisors will have a continuing role in providing services to the Fund.
31
The Board considered all of the information provided by the Advisor, the Subadvisor, the independent data providers, and the Board’s independent legal counsel, and evaluated such information for the Fund. The Board did not identify any single factor as being all-important or controlling, and each Board member may have attributed different levels of importance to different factors. In deciding to approve the Proposed Management Agreement under the terms ultimately determined by the Board to be appropriate, the Board based its decision on a number of factors, including the following:
Nature, Extent and Quality of Services — Generally. Under the Proposed Management Agreement, ACIM is responsible for providing or arranging for all services necessary for the operation of the Fund. The Board noted that under the Proposed Management Agreement, ACIM provides or arranges at its own expense a wide variety of services including:
• constructing and designing the Fund
• portfolio research and security selection
• initial capitalization/funding
• securities trading
• Fund administration
• custody of Fund assets
• daily valuation of the Fund’s portfolio
• shareholder servicing and transfer agency, including shareholder
confirmations, recordkeeping and communications
• legal services
• regulatory and portfolio compliance
• financial reporting
• marketing and distribution
The Board noted that many of these services have expanded over time both in terms of quantity and complexity in response to shareholder demands, competition in the industry, changing distribution channels and the changing regulatory environment.
Investment Management Services. The investment management services provided to the Fund are complex and provide Fund shareholders access to professional money management, instant diversification of their investments within an asset class, the opportunity to easily diversify among asset classes, and liquidity. As a part of its general oversight and in evaluating investment performance, the Board expects ACIM to manage the Fund in accordance
32
with its investment objectives and approved strategies. In providing these services, ACIM utilizes teams of investment professionals who require extensive information technology, research, training, compliance and other systems to conduct their business. The Board, directly and through its Fund Performance Review Committee, regularly reviews investment performance information for the Fund, together with comparative information for appropriate benchmarks and/or peer groups of similarly-managed funds, over different time horizons. If performance concerns are identified, the Fund receives special reviews until performance improves, during which time the Board discusses with ACIM the reasons for such underperformance and any efforts being undertaken to improve performance.
Shareholder and Other Services. Under the Proposed Management Agreement, ACIM will also provide the Fund with a comprehensive package of transfer agency, shareholder, and other services. The Board, directly and through the various committees of the Board, regularly reviews reports and evaluations of such services. These reports include, but are not limited to, information regarding the operational efficiency and accuracy of the shareholder and transfer agency services provided, staffing levels, shareholder satisfaction (as measured by external as well as internal sources), technology support, new products and services offered to Fund shareholders, securities trading activities, portfolio valuation services, auditing services, and legal and operational compliance activities. Certain aspects of shareholder and transfer agency se rvice level efficiency and the quality of securities trading activities are measured by independent third party providers and are presented in comparison to other fund groups not managed by ACIM.
Costs of Services Provided and Profitability. The Advisors provided detailed information concerning their cost of providing various services to the Fund, their profitability in managing the Fund, their overall profitability, and their financial condition. The Board reviewed with the Advisors the methodology used to prepare this financial information. The Board has also reviewed with the Advisors their methodology for compensating the investment professionals that provide services to the Fund as well as compensation to the five highest paid personnel of the Advisors. This financial information regarding the Advisors is considered in order to evaluate the Advisors’ financial condition, ACIM’s ability to continue to provide services under the Proposed Management Agreement, and the reasonableness of the proposed manageme nt fees. The Board concluded that the Advisors’ profits were reasonable in light of the services provided to the Fund.
Ethics. The Board generally considers ACIM’s commitment to providing quality services to shareholders and to conducting its business ethically. It noted that ACIM’s practices generally meet or exceed industry best practices.
Economies of Scale. The Board also reviewed information provided by ACIM regarding the possible existence of economies of scale in connection with the management of the Fund. The Board concluded that economies of scale are difficult to measure and predict with precision, especially on a fund-by-fund basis. The analysis of economies of scale is further complicated by the additional services and content provided by ACIM and its reinvestment in its ability to provide and expand those services. Accordingly, the Board seeks
33
to evaluate economies of scale by reviewing information, such as year-over-year profitability of its advisor generally, the profitability of its management of the Fund specifically, and the expenses incurred by the advisor in providing various functions to the Fund. The Board believes ACIM will appropriately share economies of scale through its competitive fee structure, offering competitive fees from fund inception, fee breakpoints as the Fund increases in size, and through reinvestment in its business to provide shareholders additional services and enhancements to existing services.
Comparison to Fees of Funds not Managed by the Advisor. Both the Prior Agreements and Proposed Management Agreements provide that the Fund pays ACGIM or ACIM a single, all-inclusive (or unified) management fee for providing all services necessary for the management and operation of the Fund, other than brokerage expenses, taxes, interest, extraordinary expenses, and the fees and expenses of the Fund’s Independent Directors (including their independent legal counsel) and expenses incurred in connection with the provision of shareholder services and distribution services under a plan adopted pursuant to Rule 12b-1 under the 1940 Act. Under the unified fee structure, ACIM is responsible for providing all investment advisory, custody, audit, administrative, compliance, record-keeping, marketing and shareholder services, or ar ranging and supervising third parties that provide such services. By contrast, most other funds are charged a variety of fees, including an investment advisory fee, a transfer agency fee, an administrative fee, distribution charges and other expenses. Other than their investment advisory fees and any applicable Rule 12b-1 distribution fees, the components of the total fees charged by these other funds may be increased without shareholder approval. The Board believes the unified fee structure is a benefit to Fund shareholders because it clearly discloses to shareholders the cost of owning Fund shares, and, since the unified fee cannot be increased without a vote of Fund shareholders, it shifts to ACIM the risk of increased costs of operating the Fund and provides a direct incentive to minimize administrative inefficiencies. Part of the Board’s analysis of fee levels involves reviewing certain evaluative data compiled by an independent provider comparing the Fund’s unified fee to the total expense ra tios of similar funds not managed by ACIM. The Board concluded that the management fee to be paid by the Fund to ACIM under the Proposed Management Agreement is reasonable in light of the services to be provided to the Fund.
Comparison to Fees and Services Provided to Other Clients of the Advisor. The Board also requested and received information from ACIM concerning the nature and extent of the services, fees, and profitability of its advisory services to advisory clients other than the Fund. They observed that these varying types of client accounts require different services and involve different regulatory and entrepreneurial risks than the management of the Fund. The Board analyzed this information and concluded that the fees charged and services provided to the Fund were reasonable by comparison.
34
Collateral or “Fall-Out” Benefits Derived by the Advisor. The Board considered the existence of collateral benefits ACIM may receive as a result of its relationship with the Fund. The Board concluded that ACIM’s primary business is managing mutual funds and it generally does not use Fund or shareholder information to generate profits in other lines of business, and therefore does not derive any significant collateral benefits from them. The Board noted that ACIM receives proprietary research from broker-dealers that execute Fund portfolio transactions and concluded that this research is likely to benefit Fund shareholders. The Board also determined that ACIM is able to provide investment management services to certain clients other than the Fund, at least in part, due to its existing infrastructure built to serve th e fund complex. The Board concluded, however, that the assets of those other clients are not material to the analysis and, in any event, are included with the assets of fund clients to determine breakpoints in each fund’s fee schedule, provided they are managed using the same investment team and strategy.
Basis for the Board’s Approval of the Proposed Combined Subadvisory Agreement. At its meeting held on March 29, 2010, the Board considered and approved the Proposed Combined Subadvisory Agreement between ACIM, Templeton and Franklin Asia with respect to the Fund. In approving the Proposed Combined Subadvisory Agreement, the Board considered the following criteria relevant to Templeton and Franklin Asia:
• the nature of the investment management services provided to the Fund;
• Templeton and Franklin Asia’s breadth of experience in international fund management;
• data comparing the Fund’s performance to appropriate benchmarks and a peer group of other funds with similar objectives and strategies; and
• the compliance policies, procedures, and regulatory experience of Templeton and Franklin Asia.
The Board also considered Templeton and Franklin Asia’s positive track record with respect to complying with American Century’s stringent requirements for trading practices and soft dollar arrangements.
Under the Proposed Combined Subadvisory Agreement, Templeton and Franklin Asia are responsible for managing the investment operations and composition of the Fund, including the purchase, retention, and disposition of the investments held by the Fund. In performing its evaluation, the Board considered information received in connection with the approval of the Proposed Combined Subadvisory Agreement, as well as information provided on an ongoing basis at its regularly scheduled Board and committee meetings. The Board did not consider the profitability of Templeton because Templeton is paid from the unified fee of the fund’s advisor as a result of arm’s length negotiations.
35
After considering all information presented, and while no single factor was determinative, the Fund’s Board, including the Independent Directors, unanimously approved the Proposed Combined Subadvisory Agreement and determined to recommend that shareholders of the International Value Fund approve the Proposed Combined Subadvisory Agreement.
Conclusion of the Board. As a result of this process, the Board, in the absence of particular circumstances and assisted by the advice of its independent legal counsel, taking into account all of the factors discussed above and the information provided by ACIM and others, concluded that the Proposed Management Agreement and Proposed Combined Subadvisory Agreement be approved and recommended its approval to Fund shareholders.
36
Retirement Account Information
As required by law, distributions you receive from certain IRAs, or 403(b), 457 and qualified plans are subject to federal income tax withholding, unless you elect not to have withholding apply. Tax will be withheld on the total amount withdrawn even though you may be receiving amounts that are not subject to withholding, such as nondeductible contributions. In such case, excess amounts of withholding could occur. You may adjust your withholding election so that a greater or lesser amount will be withheld.
If you don’t want us to withhold on this amount, you must notify us to not withhold the federal income tax. You may notify us in writing or in certain situations by telephone or through other electronic means. You have the right to revoke your withholding election at any time and any election you make may remain in effect until revoked by filing a new election.
Remember, even if you elect not to have income tax withheld, you are liable for paying income tax on the taxable portion of your withdrawal. If you elect not to have income tax withheld or you don’t have enough income tax withheld, you may be responsible for payment of estimated tax. You may incur penalties under the estimated tax rules if your withholding and estimated tax payments are not sufficient. You can reduce or defer the income tax on a distribution by directly or indirectly rolling such distribution over to another IRA or eligible plan. You should consult your tax advisor for additional information.
State tax will be withheld if, at the time of your distribution, your address is within one of the mandatory withholding states and you have federal income tax withheld. State taxes will be withheld from your distribution in accordance with the respective state rules.
Proxy Voting Guidelines
American Century Investment Management, Inc., the fund’s investment advisor, is responsible for exercising the voting rights associated with the securities purchased and/or held by the fund. A description of the policies and procedures the advisor uses in fulfilling this responsibility is available without charge, upon request, by calling 1-800-345-2021. It is also available on American Century Investments’ website at americancentury.com and on the Securities and Exchange Commission’s website at sec.gov. Information regarding how the investment advisor voted proxies relating to portfolio securities during the most recent 12-month period ended June 30 is available on the “About Us” page at americancentury.com. It is also available at sec.gov.
Quarterly Portfolio Disclosure
The fund files its complete schedule of portfolio holdings with the Securities and Exchange Commission (SEC) for the first and third quarters of each fiscal year on Form N-Q. The fund’s Forms N-Q are available on the SEC’s website at sec.gov, and may be reviewed and copied at the SEC’s Public Reference Room in Washington, DC. Information on the operation of the Public Reference Room may be obtained by calling 1-800-SEC-0330. The fund also makes its complete schedule of portfolio holdings for the most recent quarter of its fiscal year available on its website at americancentury.com and, upon request, by calling 1-800-345-2021.
37
The following indices are used to illustrate investment market, sector, or style performance or to serve as fund performance comparisons. They are not investment products available for purchase.
Morgan Stanley Capital International (MSCI) has developed several indices that measure the performance of foreign stock markets.
The MSCI EAFE (Europe, Australasia, Far East) Index is designed to measure developed market equity performance, excluding the U.S. and Canada.
The MSCI EAFE Growth Index is a capitalization-weighted index that monitors the performance of growth stocks from Europe, Australasia, and the Far East.
The MSCI EAFE Value Index is a capitalization-weighted index that monitors the performance of value stocks from Europe, Australasia, and the Far East.
The MSCI EM (Emerging Markets) Index represents the performance of stocks in global emerging market countries.
The MSCI Europe Index is designed to measure equity market performance in Europe.
The MSCI Japan Index is designed to measure equity market performance in Japan.
The MSCI World Free Index represents the performance of stocks in developed countries (including the United States) that are available for purchase by global investors.
38
39
40

| |
| |
| Contact Us | |
| americancentury.com | |
| Automated Information Line | 1-800-345-8765 |
| Investor Services Representative | 1-800-345-2021 or |
| | 816-531-5575 |
| Investors Using Advisors | 1-800-378-9878 |
| Business, Not-For-Profit, Employer-Sponsored | |
| Retirement Plans | 1-800-345-3533 |
| Banks and Trust Companies, Broker-Dealers, | |
| Financial Professionals, Insurance Companies | 1-800-345-6488 |
| Telecommunications Device for the Deaf | 1-800-634-4113 |
| American Century World Mutual Funds, Inc. | |
| Investment Advisor: | |
| American Century Investment Management, Inc. | |
| Kansas City, Missouri | |
This report and the statements it contains are submitted for the general
information of our shareholders. The report is not authorized for distribution to
prospective investors unless preceded or accompanied by an effective prospectus.
American Century Investment Services, Inc., Distributor
©2010 American Century Proprietary Holdings, Inc. All rights reserved.
1007
CL-SAN-68672
|
| Semiannual Report |
| May 28, 2010 |

|
| American Century Investments® |
International Discovery Fund
| |
| President’s Letter | 2 |
| Independent Chairman’s Letter | 3 |
| Market Perspective | 4 |
| International Equity Total Returns | 4 |
| |
| International Discovery | |
| |
| Performance | 5 |
| Portfolio Commentary | 7 |
| Top Ten Holdings | 9 |
| Types of Investments in Portfolio | 9 |
| Investments by Country | 9 |
| |
| Shareholder Fee Example | 10 |
| |
| Financial Statements | |
| |
| Schedule of Investments | 12 |
| Statement of Assets and Liabilities | 15 |
| Statement of Operations | 16 |
| Statement of Changes in Net Assets | 17 |
| Notes to Financial Statements | 18 |
| Financial Highlights | 24 |
| |
| Other Information | |
| Board Approval of Management and Subadvisory Agreements | 29 |
| Additional Information | 35 |
| Index Definitions | 36 |
Any opinions expressed in this report reflect those of the author as of the date of the report, and do not necessarily represent the opinions of American Century Investments or any other person in the American Century Investments organization. Any such opinions are subject to change at any time based upon market or other conditions and American Century Investments disclaims any responsibility to update such opinions. These opinions may not be relied upon as investment advice and, because investment decisions made by American Century Investments funds are based on numerous factors, may not be relied upon as an indication of trading intent on behalf of any American Century Investments fund. Security examples are used for representational purposes only and are not intended as recommendations to purchase or sell securities. Performance information for comparative indices and securities is provided to American Century Investments by third party vendors. To the best of American Century Investments’ knowledge, such information is accurate at the time of printing.

Dear Investor:
To learn more about the capital markets, your investment, and the portfolio management strategies American Century Investments provides, we encourage you to review this shareholder report for the financial reporting period ended May 28, 2010.
On the following pages, you will find investment performance and portfolio information, presented with the expert perspective and commentary of our portfolio management team. This report remains one of our most important vehicles for conveying the information you need about your investment performance, and about the market factors and strategies that affect fund returns. For additional information on the markets, we encourage you to visit the “Insights & News” tab at our Web site, americancentury.com, for updates and further expert commentary.
The top of our Web site’s home page also provides a link to “Our Story,” which, first and foremost, outlines our commitment—since 1958—to helping clients reach their financial goals. We believe strongly that we will only be successful when our clients are successful. That’s who we are.
Another important, unique facet of our story and who we are is “Profits with a Purpose,” which describes our bond with the Stowers Institute for Medical Research (SIMR). SIMR is a world-class biomedical organization—founded by our company founder James E. Stowers, Jr. and his wife Virginia—that is dedicated to researching the causes, treatment, and prevention of gene-based diseases, including cancer. Through American Century Investments’ private ownership structure, more than 40% of our profits support SIMR.
Mr. Stowers’ example of achieving financial success and using that platform to help humanity motivates our entire American Century Investments team. His story inspires us to help each of our clients achieve success. Thank you for sharing your financial journey with us.
Sincerely,

Jonathan Thomas
President and Chief Executive Officer
American Century Investments
2
|
| Independent Chairman’s Letter |

Fellow Shareholders,
The principal event at a recent board meeting was the retirement of Jim Stowers, Jr. from the American Century Mutual Funds Kansas City board. This was one of those times when you felt like you were living a historical moment. Jim—who celebrated his 86th birthday in January—founded what was known as Twentieth Century Mutual Funds over 50 years ago. Through the years, his number one priority has been to “Put Investors First!” The board presented Jim with a resolution acknowledging that, by building a successful investment company, he has impacted the lives of many by helping them on the path to financial success.
We respect Jim’s decision to focus his energy on the Stowers Institute for Medical Research and American Century Companies, Inc. (ACC), the parent company of the funds’ investment advisor. The pioneering medical research that Jim and his wife Virginia have made possible through the Institute should enrich the lives of millions in the future.
Shortly after his retirement from the board, we received word that ACC’s co-chairman Richard W. Brown had succeeded Jim as trustee of a trust that holds a significant interest in ACC stock as a part of Jim’s long-standing estate and business succession plan. While holding less than a majority interest, the trust is presumed to control the funds’ investment advisors under the Investment Company Act of 1940. This change triggered the need for a shareholder proxy to approve new management and subadvisory agreements for the funds. I am happy to report that all of the proposals contained in the proxy received the necessary votes and were approved.
On behalf of the board, I want to once again thank Jim for his mutual fund board service. More than three years ago, Jim and Richard Brown installed a strong and effective leadership team at American Century Investments and I look forward to continuing to work with them on behalf of fund shareholders. And while Jim no longer sits on the fund board, the inherent optimism captured by his favorite catch phrase—“The best is yet to be”—still resonates with all of us who have the privilege of serving you. I invite you to send your comments, questions or concerns to me at dhpratt@fundboardchair.com.

3

By Mark Kopinski, Chief Investment Officer, Global and Non-U.S. Equity
Events in May Sent Stocks Tumbling
Global stock returns generally remained robust for the first several months of the period, as the rally unleashed in March 2009 continued into 2010. Optimism regarding the global economic recovery and business sector gains helped keep stocks in positive territory.
Nevertheless, as spring set in, the global stock market rally ended abruptly, starting with the May 6 “Flash Crash” in the U.S. stock market, when the major indices plunged nearly 7% within 15 minutes. Furthermore, problems that had been percolating in Europe and in the global geopolitical arena boiled over in May, triggering a sharp stock market selloff. In particular, the expanding European government debt crisis beyond Greece, the downgrade of Spain’s credit rating, the worsening oil disaster in the Gulf of Mexico, and escalating tensions in the Middle East rattled investors’ nerves.
Overall, developed international equity markets significantly under-performed the U.S. market and the emerging markets. European stocks suffered the largest losses for the six-month period, as the mounting debt crisis worried investors. Exploding debt in Greece, Italy, Spain, Ireland, and Portugal all came under scrutiny.
Debt Remained the Roadblock to Growth
The sovereign debt problem did not just happen as a result of the recent financial crisis or recession; it is a longer-term issue. Recent events only exacerbated the problem and accelerated its becoming a crisis.
In fact, sovereign solvency has emerged as one of the most significant roadblocks to growth. Currently, the market is focused on Europe, where severe austerity measures are required to get fiscal balances back in order. This is likely to trim 0.5% from European growth during the next year. The weaker euro should help offset some of the decline in growth, but the more export-oriented northern countries will be the main beneficiaries. Commodity-based countries, such as Australia and Norway, have been the most resilient and have seen more impressive economic recoveries. The debt crisis likely will mean European interest rates will remain accommodative for the remainder of 2010.
| | | | |
| International Equity Total Returns | | | | |
| For the six months ended May 28, 2010* (in U.S. dollars) | |
| MSCI EAFE Index | -10.90% | | MSCI Europe Index | -14.77% |
| MSCI EAFE Growth Index | -8.85% | | MSCI World Free Index | -4.92% |
| MSCI EAFE Value Index | -12.95% | | MSCI Japan Index | 0.10% |
| MSCI EM Index | -2.75% | | *Total returns for periods less than one year are not annualized and are |
| | | | based on the period beginning December 1, 2009. | |
4
| | | | | | | | |
| International Discovery | | | | | |
| |
| Total Returns as of May 28, 2010 | | | | | |
| | | | | | Average Annual Returns | |
| | | Ticker | | | | | Since | Inception |
| | | Symbol | 6 months(1) (2) | 1 year(2) | 5 years(2) | 10 years(2) | Inception | Date |
| Investor Class | TWEGX | -5.06% | 12.43% | 5.45% | 3.00% | 10.81% | 4/1/94 |
| MSCI AC World ex-US | | | | | | | |
| Mid Cap Growth Index | — | -6.37% | 12.87% | 3.34% | 0.61% | N/A(3) | — |
| Institutional Class | TIDIX | -5.09% | 12.60% | 5.64% | 3.19% | 9.08% | 1/2/98 |
| A Class(4) | ACIDX | | | | | | 4/28/98 |
| No sales charge* | | -5.26% | 12.16% | 5.19% | 2.74% | 6.98% | |
| With sales charge* | | -10.70% | 5.73% | 3.94% | 2.13% | 6.45% | |
| C Class | TWECX | | | | | | 3/1/10 |
| No sales charge* | | — | — | — | — | -4.82%(1) | |
| With sales charge* | | — | — | — | — | -5.78%(1) | |
| R Class | TWERX | | | | | | 3/1/10 |
| Before redemption fee | | — | — | — | — | -4.71%(1) | |
| Net of redemption fee(5) | | — | — | — | — | -6.61%(1) | |
| * Sales charges include initial sales charges and contingent deferred sales charges (CDSCs), as applicable. A Class shares have a 5.75% |
| maximum initial sales charge for equity funds and may be subject to a maximum CDSC of 1.00%. C Class shares redeemed within 12 |
| months of purchase are subject to a maximum CDSC of 1.00%. The SEC requires that mutual funds provide performance information |
| net of maximum sales charges in all cases where charges could be applied. | | | | |
| |
| (1) | Total returns for periods less than one year are not annualized. | | | | | |
| (2) | Total returns are based on the periods beginning December 1, 2009 for the 6 month returns, June 1, 2009 for the 1 year returns, June 1, 2005 |
| | for the 5 year returns and June 1, 2000 for the 10 year returns. | | | | | |
| (3) | Benchmark data first available June 1994. | | | | | | |
| (4) | Prior to March 1, 2010, the A Class was referred to as the Advisor Class and did not have a front-end sales charge. Performance prior to that |
| | date has been adjusted to reflect this charge. | | | | | |
| (5) | Returns reflect the deduction of a 2.00% redemption fee, incurred if shares were redeemed within 180 days after purchase. | |
Data presented reflect past performance. Past performance is no guarantee of future results. Current performance may be higher or lower than the performance shown. Investment return and principal value will fluctuate, and redemption value may be more or less than original cost. To obtain performance data current to the most recent month end, please call 1-800-345-2021 or visit americancentury.com. Historically, small company stocks have been more volatile than the stocks of larger, more established companies. International investing involves special risks, such as political instability and currency fluctuations. Investing in emerging markets may accentuate these risks.
Unless otherwise indicated, performance reflects Investor Class shares; performance for other share classes will vary due to differences in fee structure. For information about other share classes available, please consult the prospectus. Data assumes reinvestment of dividends and capital gains, and none of the charts reflect the deduction of taxes that a shareholder would pay on fund distributions or the redemption of fund shares. Returns for the index are provided for comparison. The fund’s total returns include operating expenses (such as transaction costs and management fees) that reduce returns, while the total returns of the index do not.
5
International Discovery
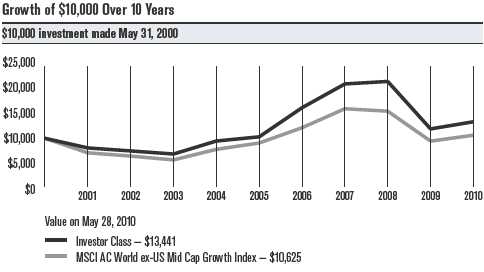
| | | | |
| Total Annual Fund Operating Expenses | | | |
| Investor Class | Institutional Class | A Class | C Class | R Class |
| 1.48% | 1.28% | 1.73% | 2.48% | 1.98% |
The total annual fund operating expenses shown is as stated in the fund’s prospectus current as of the date of this report. The prospectus may vary from the expense ratio shown elsewhere in this report because it is based on a different time period, includes acquired fund fees and expenses, and, if applicable, does not include fee waivers or expense reimbursements.
Data presented reflect past performance. Past performance is no guarantee of future results. Current performance may be higher or lower than the performance shown. Investment return and principal value will fluctuate, and redemption value may be more or less than original cost. To obtain performance data current to the most recent month end, please call 1-800-345-2021 or visit americancentury.com. Historically, small company stocks have been more volatile than the stocks of larger, more established companies. International investing involves special risks, such as political instability and currency fluctuations. Investing in emerging markets may accentuate these ris ks.
Unless otherwise indicated, performance reflects Investor Class shares; performance for other share classes will vary due to differences in fee structure. For information about other share classes available, please consult the prospectus. Data assumes reinvestment of dividends and capital gains, and none of the charts reflect the deduction of taxes that a shareholder would pay on fund distributions or the redemption of fund shares. Returns for the index are provided for comparison. The fund’s total returns include operating expenses (such as transaction costs and management fees) that reduce returns, while the total returns of the index do not.
6
International Discovery
Portfolio Managers: Mark Kopinski and Brian Brady
Performance Summary
The International Discovery portfolio returned -5.06%* for the six months ended May 28, 2010, compared with its benchmark, the MSCI All-Country World ex-U.S. Mid Cap Growth Index, which returned -6.37%.
Investor confidence generally remained upbeat for the first four months of the period, as the global economic recovery appeared to gain momentum and stock prices continued to climb. But, late in the period, mounting concerns about the massive levels of sovereign debt in Greece, Spain, and other European nations put an end to the yearlong global stock market rally. Stock prices plunged, wiping out the gains achieved earlier in the period. International growth stocks fared slightly better than their value counterparts, while small-cap stocks outperformed large-cap stocks. Meanwhile, the euro tumbled sharply relative to the U.S. dollar, which added to the woes of foreign-based corporations.
Earnings growth and momentum, which are important components of the portfolio’s investment process, performed well during the first several months of the period, which accounted for the portfolio’s relative outperformance compared with the benchmark. More specifically, our stock selection and sector allocations helped push the portfolio ahead of the index for the six-month period.
Spain Topped Contributors
From a country perspective, our exposure in Spain made the greatest contribution to relative performance, followed by South Korea and Greece. Stock selection was the driving force in Spain and South Korea, while an underweight helped relative results in Greece.
South Korea was home to the portfolio’s top two contributors for the period, both portfolio-only positions: Samsung Electro-Mechanics, an electronic equipment and products manufacturer, and Kia Motors, an automobile manufacturer. Samsung reported strong operating profits and double-digit sales growth and said it expected strong demand for its semiconductors throughout the remainder of 2010. Kia Motors experienced explosive global sales growth, with particularly strong gains in China.
At the opposite end of the performance spectrum, portfolio exposure in China, Norway, and Singapore detracted the most from results. Stock selection hurt in China and Singapore, and an overweighted position detracted in Norway. Our portfolio-only position in Norway’s Storebrand Asa, an insurance, banking, and asset-management company, represented the portfolio’s largest detractor for the period.
|
| *All fund returns referenced in this commentary are for Investor Class shares. Total returns for periods less than one year are not annualized and are |
| based on the period beginning December 1, 2009. |
7
International Discovery
Financials, Industrials Outperformed
The portfolio’s financials, industrials, and energy sectors represented the largest contributors to relative performance, primarily due to robust stock selection. In addition, an underweighted position in financials and an overweight in energy helped relative results. Within the financials sector, the commercial banking industry benefited from strong stock selection. The industrials sector, which finished the period as the portfolio’s largest sector weighting, benefited from favorable results in a variety of industries, including machinery, transportation infrastructure, and electrical equipment. Within the energy sector, our overweighted position in Canada-based Pacific Rubiales Energy Corp., an oil and natural gas company, was among the portfolio’s top contributors for the period.
Materials, Consumer Staples Disappointed
Stock selection detracted from results in the portfolio’s materials, consumer staples, and health care sectors during the period. In the materials sector, the metals and mining industry represented the largest performance detractor. In particular, our underweighted positions in two gold-mining companies, Canada’s Eldorado Gold Corp. and the United Kingdom’s Randgold Resources, dragged down relative results.
Outlook
Global economic activity is improving, but significant headwinds remain—namely, the explosion of sovereign debt in developed nations. So far, government responses to the crisis have varied, and this lack of coordination may lead to divergent economic performance in the year ahead. Among sectors, the portfolio remains heavily exposed to technology and industrials, which should benefit in the move from economic recovery to expansion. We expect further volatility throughout the international stock markets, yet we will continue to seek small- to mid-sized companies located around the world (excluding the United States) offering promising growth opportunities.
8
| |
| International Discovery | |
| |
| Top Ten Holdings | |
| | % of net assets |
| | as of 5/28/10 |
| Samsung Electro-Mechanics Co. Ltd. | 2.8% |
| FLSmidth & Co. A/S | 2.5% |
| Marubeni Corp. | 2.4% |
| Lanxess AG | 2.2% |
| Sumitomo Heavy Industries Ltd. | 2.2% |
| Omron Corp. | 2.0% |
| Vallourec SA | 2.0% |
| ARM Holdings plc | 1.9% |
| Kawasaki Kisen Kaisha Ltd. | 1.8% |
| Storebrand ASA | 1.8% |
| |
| Types of Investments in Portfolio | |
| | % of net assets |
| | as of 5/28/10 |
| Foreign Common Stocks | 98.3% |
| Temporary Cash Investments | 0.6% |
| Other Assets and Liabilities | 1.1% |
| |
| Investments by Country | |
| | % of net assets |
| | as of 5/28/10 |
| Japan | 17.4% |
| United Kingdom | 13.1% |
| Canada | 7.9% |
| France | 7.8% |
| Denmark | 6.5% |
| South Korea | 6.2% |
| Germany | 5.1% |
| Switzerland | 4.8% |
| Australia | 3.6% |
| Taiwan (Republic of China) | 3.5% |
| Sweden | 3.0% |
| Norway | 2.9% |
| Netherlands | 2.5% |
| Finland | 2.4% |
| Other Countries | 11.6% |
| Cash and Equivalents* | 1.7% |
| *Includes temporary cash investments and other assets and liabilities. | |
9
|
| Shareholder Fee Example (Unaudited) |
Fund shareholders may incur two types of costs: (1) transaction costs, including sales charges (loads) on purchase payments and redemption/ exchange fees; and (2) ongoing costs, including management fees; distribution and service (12b-1) fees; and other fund expenses. This example is intended to help you understand your ongoing costs (in dollars) of investing in your fund and to compare these costs with the ongoing cost of investing in other mutual funds.
The example is based on an investment of $1,000 made at the beginning of the period and held for the entire period from December 1, 2009 to May 28, 2010 (except as noted).
Actual Expenses
The table provides information about actual account values and actual expenses for each class. You may use the information, together with the amount you invested, to estimate the expenses that you paid over the period. First, identify the share class you own. Then simply divide your account value by $1,000 (for example, an $8,600 account value divided by $1,000 = 8.6), then multiply the result by the number under the heading “Expenses Paid During Period” to estimate the expenses you paid on your account during this period.
If you hold Investor Class shares of any American Century Investments fund, or Institutional Class shares of the American Century Diversified Bond Fund, in an American Century Investments account (i.e., not a financial intermediary or retirement plan account), American Century Investments may charge you a $12.50 semiannual account maintenance fee if the value of those shares is less than $10,000. We will redeem shares automatically in one of your accounts to pay the $12.50 fee. In determining your total eligible investment amount, we will include your investments in all personal accounts (including American Century Investments Brokerage accounts) registered under your Social Security number. Personal accounts include individual accounts, joint accounts, UGMA/UTMA accounts, personal trusts, Coverdell Education Savings Accounts and IRAs (including traditional, Roth, Rollover, SEP-, SARSEP- and SIMPLE-IRAs), and certain other retirement accounts. If you have only business, business retirement, employer-sponsored or American Century Investments Brokerage accounts, you are currently not subject to this fee. We will not charge the fee as long as you choose to manage your accounts exclusively online. If you are subject to the Account Maintenance Fee, your account value could be reduced by the fee amount.
Hypothetical Example for Comparison Purposes
The table also provides information about hypothetical account values and hypothetical expenses based on the actual expense ratio of each class of your fund and an assumed rate of return of 5% per year before expenses, which is not the actual return of a fund’s share class. The hypothetical account values and expenses may not be used to estimate the actual ending account balance or expenses you paid for the period. You may use this information
10
to compare the ongoing costs of investing in your fund and other funds. To do so, compare this 5% hypothetical example with the 5% hypothetical examples that appear in the shareholder reports of the other funds.
Please note that the expenses shown in the table are meant to highlight your ongoing costs only and do not reflect any transactional costs, such as sales charges (loads) or redemption/exchange fees. Therefore, the table is useful in comparing ongoing costs only, and will not help you determine the relative total costs of owning different funds. In addition, if these transactional costs were included, your costs would have been higher.
| | | | | |
| | | Beginning | Ending | Expenses Paid | |
| | | Account Value | Account Value | During Period(1) | Annualized |
| | | 12/1/09 | 5/28/10 | 12/1/09 - 5/28/10 | Expense Ratio(1) |
| Actual | | | | |
| Investor Class | $1,000 | $949.40 | $6.88 | 1.44% |
| Institutional Class | $1,000 | $949.10 | $5.93 | 1.24% |
| A Class | $1,000 | $947.40 | $8.07 | 1.69% |
| C Class | $1,000 | $951.80(2) | $5.74(3) | 2.44% |
| R Class | $1,000 | $952.90(2) | $4.57(3) | 1.94% |
| Hypothetical | | | | |
| Investor Class | $1,000 | $1,017.46 | $7.12 | 1.44% |
| Institutional Class | $1,000 | $1,018.44 | $6.14 | 1.24% |
| A Class | $1,000 | $1,016.23 | $8.36 | 1.69% |
| C Class | $1,000 | $1,012.55(4) | $12.04(4) | 2.44% |
| R Class | $1,000 | $1,015.01(4) | $9.59(4) | 1.94% |
| (1) | Expenses are equal to the class’s annualized expense ratio listed in the table above, multiplied by the average account value over the period, |
| | multiplied by 179, the number of days in the most recent fiscal half-year, divided by 365, to reflect the one-half year period. |
| (2) | Ending account value based on actual return from March 1, 2010 (commencement of sale) through May 28, 2010. | |
| (3) | Expenses are equal to the class’s annualized expense ratio listed in the table above, multiplied by the average account value over the period, |
| | multiplied by 88, the number of days in the period from March 1, 2010 (commencement of sale) through May 28, 2010, divided by 365, to |
| | reflect the period. Had the class been available for the full period, the expenses paid during the period would have been higher. |
| (4) | Ending account value and expenses paid during period assumes the class had been available throughout the entire period and are calculated |
| | using the class’s annualized expense ratio listed in the table above. | | |
11
| | | | | | |
| International Discovery | | | | | |
| |
| MAY 28, 2010 (UNAUDITED) | | | | | | |
| | Shares | Value | | | Shares | Value |
| Common Stocks — 98.3% | | | Technip SA | 67,100 | $ 4,369,752 |
| AUSTRALIA — 3.6% | | | | Vallourec SA | 90,400 | 16,720,728 |
| Amcor Ltd. | 2,480,300 | $ 12,862,863 | | | | 65,698,687 |
| Billabong International Ltd. | 960,000 | 8,170,947 | | GERMANY — 5.1% | | |
| Coca-Cola Amatil Ltd. | 457,600 | 4,188,744 | | adidas AG | 167,200 | 8,267,040 |
| Cochlear Ltd. | 89,800 | 5,548,265 | | Aixtron AG | 164,700 | 4,444,542 |
| | | | | Infineon Technologies AG(1) | 2,170,100 | 12,113,706 |
| | | 30,770,819 | | | | |
| AUSTRIA — 0.8% | | | | Lanxess AG | 456,800 | 18,499,750 |
| Andritz AG | 129,800 | 7,145,154 | | | | 43,325,038 |
| BELGIUM — 0.8% | | | | HONG KONG — 0.5% | | |
| Bekaert SA | 43,300 | 7,212,008 | | Noble Group Ltd. | 3,252,090 | 4,040,900 |
| BERMUDA — 1.7% | | | | HUNGARY — 0.3% | | |
| Frontline Ltd. | 330,200 | 10,860,278 | | OTP Bank plc(1) | 112,900 | 2,862,613 |
| Seadrill Ltd. | 153,700 | 3,147,333 | | INDIA — 1.0% | | |
| | | 14,007,611 | | IRB Infrastructure | | |
| | | | | Developers Ltd. | 821,500 | 4,581,896 |
| CANADA — 7.9% | | | | | | |
| | | | | Shriram Transport Finance | | |
| Gildan Activewear, Inc.(1) | 383,300 | 11,085,036 | | Co. Ltd. | 229,000 | 2,739,730 |
| Imax Corp.(1) | 645,800 | 10,946,310 | | Yes Bank Ltd.(1) | 209,167 | 1,257,373 |
| Intact Financial Corp. | 244,500 | 10,535,989 | | | | 8,578,999 |
| Lululemon Athletica, Inc.(1) | 83,700 | 3,419,982 | | INDONESIA — 0.8% | | |
| Pacific Rubiales | | | | PT United Tractors Tbk | 3,620,000 | 6,927,195 |
| Energy Corp.(1) | 398,900 | 8,300,941 | | | | |
| | | | | ISRAEL — 0.2% | | |
| Red Back Mining, Inc.(1) | 598,400 | 15,267,047 | | | | |
| | | | | Mellanox Technologies Ltd.(1) | 71,600 | 1,664,700 |
| Western Coal Corp.(1) | 1,522,900 | 7,582,664 | | | | |
| | | | | JAPAN — 17.4% | | |
| | | 67,137,969 | | Dentsu, Inc. | 310,000 | 7,856,687 |
| CAYMAN ISLANDS — 0.6% | | | | Disco Corp. | 200,800 | 13,477,486 |
| Herbalife Ltd. | 106,100 | 4,790,415 | | Fuji Heavy Industries Ltd.(1) | 852,000 | 4,790,519 |
| DENMARK — 6.5% | | | | Hino Motors Ltd. | 1,005,000 | 5,007,621 |
| Coloplast A/S B Shares | 71,800 | 7,343,033 | | Kawasaki Kisen | | |
| Danisco A/S | 230,200 | 13,516,086 | | Kaisha Ltd.(1) | 3,808,000 | 15,488,776 |
| DSV A/S | 276,300 | 4,084,280 | | Konica Minolta Holdings, Inc. | 439,000 | 4,818,921 |
| FLSmidth & Co. A/S | 335,700 | 20,829,655 | | Marubeni Corp. | 3,583,000 | 20,009,938 |
| Novozymes A/S B Shares | 83,000 | 8,807,417 | | NGK Spark Plug Co. Ltd. | 419,000 | 5,214,776 |
| | | 54,580,471 | | Nikon Corp. | 315,200 | 6,024,084 |
| FINLAND — 2.4% | | | | Omron Corp. | 823,300 | 17,055,659 |
| KONE Oyj B Shares | 171,200 | 6,683,139 | | ORIX Corp. | 153,700 | 11,742,021 |
| Metso Oyj | 423,200 | 13,229,724 | | Showa Denko KK | 7,121,000 | 14,027,102 |
| | | 19,912,863 | | Sumitomo Heavy | | |
| FRANCE — 7.8% | | | | Industries Ltd. | 3,257,000 | 18,370,725 |
| Atos Origin SA(1) | 134,500 | 5,849,202 | | Sysmex Corp. | 49,600 | 2,804,798 |
| Eutelsat Communications | 306,900 | 9,963,869 | | | | 146,689,113 |
| Publicis Groupe SA | 249,800 | 10,302,307 | | LUXEMBOURG — 0.7% | | |
| Safran SA | 280,700 | 7,539,000 | | Millicom International | | |
| Sodexo | 195,100 | 10,953,829 | | Cellular SA | 69,900 | 5,587,107 |
12
International Discovery
| | | | | | |
| | Shares | Value | | | Shares | Value |
| MEXICO — 0.5% | | | | TAIWAN (REPUBLIC OF CHINA) — 3.5% | |
| Grupo Financiero Banorte | | | | Eva Airways Corp.(1) | 12,851,000 | $ 7,107,918 |
| SAB de CV, Series O | 1,067,800 | $ 4,107,432 | | Nan Ya Printed Circuit | | |
| NETHERLANDS — 2.5% | | | | Board Corp. | 1,960,000 | 8,206,280 |
| Koninklijke Vopak NV | 246,400 | 9,362,749 | | Unimicron Technology Corp. | 5,604,000 | 7,866,667 |
| QIAGEN NV(1) | 221,600 | 4,626,511 | | Yageo Corp. | 15,798,000 | 6,810,391 |
| Randstad Holding NV(1) | 180,200 | 7,505,610 | | | | 29,991,256 |
| | | 21,494,870 | | UNITED KINGDOM — 13.1% | | |
| NORWAY — 2.9% | | | | Aggreko plc | 451,200 | 8,226,836 |
| Petroleum | | | | ARM Holdings plc | 4,465,300 | 15,943,183 |
| Geo-Services ASA(1) | 56,700 | 573,202 | | Burberry Group plc | 756,800 | 7,538,334 |
| Schibsted ASA | 419,700 | 8,335,249 | | Cairn Energy plc(1) | 1,633,800 | 9,476,571 |
| Storebrand ASA(1) | 2,834,500 | 15,283,526 | | Cookson Group plc(1) | 909,200 | 6,217,993 |
| | | 24,191,977 | | G4S plc | 950,100 | 3,605,642 |
| PANAMA — 0.5% | | | | Intercontinental Hotels | | |
| Copa Holdings SA, Class A | 80,600 | 4,110,600 | | Group plc | 892,300 | 14,071,586 |
| PEOPLE’S REPUBLIC OF CHINA — 0.9% | | | ITV plc(1) | 2,056,300 | 1,657,463 |
| Agile Property Holdings Ltd. | 3,162,000 | 3,326,005 | | Michael Page | | |
| China Yurun Food Group Ltd. | 1,653,000 | 4,366,836 | | International plc | 1,343,900 | 7,188,440 |
| | | 7,692,841 | | Rexam plc | 1,468,000 | 6,654,806 |
| SINGAPORE — 0.9% | | | | Schroders plc | 466,100 | 8,923,911 |
| Neptune Orient Lines Ltd.(1) | 5,952,000 | 7,953,594 | | Serco Group plc | 1,073,000 | 9,452,332 |
| SOUTH AFRICA — 0.8% | | | | Weir Group plc (The) | 883,400 | 11,826,562 |
| Aspen Pharmacare | | | | | | 110,783,659 |
| Holdings Ltd.(1) | 647,600 | 6,797,299 | | TOTAL COMMON STOCKS | | |
| SOUTH KOREA — 6.2% | | | | (Cost $794,625,875) | | 830,651,093 |
| Kia Motors Corp. | 478,200 | 12,333,073 | | Temporary Cash Investments — 0.6% |
| Lock & Lock Co. Ltd. | 113,050 | 3,118,971 | | JPMorgan U.S. Treasury | | |
| Melfas, Inc.(1) | 90,900 | 4,339,904 | | Plus Money Market Fund | | |
| Samsung Electro-Mechanics | | | | Agency Shares | 23,825 | 23,825 |
| Co. Ltd. | 207,500 | 24,000,322 | | Repurchase Agreement, Credit Suisse | |
| Samsung SDI Co. Ltd. | 63,700 | 8,346,427 | | First Boston, Inc., (collateralized by various | |
| | | 52,138,697 | | U.S. Treasury obligations, 0.875%, 10/31/11, | |
| | | | | valued at $4,594,879), in a joint trading | |
| SPAIN — 0.6% | | | | account at 0.15%, dated 5/28/10, due | |
| Amadeus IT Holding SA, | | | | 6/1/10 (Delivery value $4,500,075) | 4,500,000 |
| A Shares(1) | 342,500 | 5,194,894 | | TOTAL TEMPORARY | | |
| SWEDEN — 3.0% | | | | CASH INVESTMENTS | | |
| Modern Times Group AB | | | | (Cost $4,523,825) | | 4,523,825 |
| B Shares | 177,800 | 9,281,131 | | TOTAL INVESTMENT | | |
| SSAB AB A Shares | 494,100 | 7,293,341 | | SECURITIES — 98.9% | | |
| Swedish Match AB | 409,000 | 8,476,679 | | (Cost $799,149,700) | | 835,174,918 |
| | | | | OTHER ASSETS | | |
| | | 25,051,151 | | AND LIABILITIES — 1.1% | | 9,573,837 |
| SWITZERLAND — 4.8% | | | | TOTAL NET ASSETS — 100.0% | | $844,748,755 |
| Adecco SA | 240,000 | 11,593,001 | | | | |
| Clariant AG(1) | 1,224,300 | 14,238,504 | | | | |
| Informa plc | 819,400 | 4,465,572 | | | | |
| Sonova Holding AG | 17,600 | 1,894,016 | | | | |
| Sulzer AG | 96,400 | 8,020,068 | | | | |
| | | 40,211,161 | | | | |
13
| |
| International Discovery | |
| |
| Market Sector Diversification | |
| (as a % of net assets) | |
| Industrials | 30.8% |
| Consumer Discretionary | 18.3% |
| Information Technology | 16.6% |
| Materials | 12.8% |
| Financials | 7.2% |
| Energy | 4.3% |
| Consumer Staples | 4.2% |
| Health Care | 3.4% |
| Telecommunication Services | 0.7% |
| Cash and Equivalents* | 1.7% |
| *Includes temporary cash investments and other assets and liabilities. |
| |
| Notes to Schedule of Investments | |
| (1) Non-income producing. | |
See Notes to Financial Statements.
14
|
| Statement of Assets and Liabilities |
| | | | |
| MAY 28, 2010 (UNAUDITED) | | | | |
| Assets | | | | |
| Investment securities, at value (cost of $799,149,700) | | | $835,174,918 |
| Foreign currency holdings, at value (cost of $3,663,782) | | | 3,663,525 |
| Receivable for investments sold | | | | 22,563,833 |
| Receivable for capital shares sold | | | | 265,159 |
| Dividends and interest receivable | | | | 1,953,827 |
| Other assets | | | | 50,192 |
| | | | | 863,671,454 |
| | | | | |
| Liabilities | | | | |
| Disbursements in excess of demand deposit cash | | | 68,979 |
| Payable for investments purchased | | | | 17,540,063 |
| Payable for capital shares redeemed | | | | 340,830 |
| Accrued management fees | | | | 971,809 |
| Service fees (and distribution fees – A Class and R Class) payable | | | 1,000 |
| Distribution fees payable | | | | 18 |
| | | | | 18,922,699 |
| | | | | |
| Net Assets | | | | $844,748,755 |
| | | | | |
| Net Assets Consist of: | | | | |
| Capital (par value and paid-in surplus) | | | | $1,253,046,968 |
| Accumulated net investment loss | | | | (1,663,093) |
| Accumulated net realized loss on investment and foreign currency transactions | | (442,610,079) |
| Net unrealized appreciation on investments and translation of assets and liabilities in foreign currencies | 35,974,959 |
| | | | | $844,748,755 |
| |
| |
| | Net assets | Shares outstanding | Net asset value per share |
| Investor Class, $0.01 Par Value | $764,431,441 | 94,444,809 | | $8.09 |
| Institutional Class, $0.01 Par Value | $75,652,045 | 9,256,488 | | $8.17 |
| A Class, $0.01 Par Value | $4,599,144 | 579,980 | | $7.93* |
| C Class, $0.01 Par Value | $42,314 | 5,231 | | $8.09 |
| R Class, $0.01 Par Value | $23,811 | 2,941 | | $8.10 |
| *Maximum offering price $8.41 (net asset value divided by 0.9425) | | | |
| |
| |
| See Notes to Financial Statements. | | | | |
15
| |
| FOR THE SIX MONTHS ENDED MAY 28, 2010 (UNAUDITED) | |
| Investment Income (Loss) | |
| Income: | |
| Dividends (net of foreign taxes withheld of $529,518) | $ 6,477,470 |
| Interest | 3,184 |
| | 6,480,654 |
| Expenses: | |
| Management fees | 6,610,888 |
| Distribution fees — C Class | 53 |
| Service fees — C Class | 18 |
| Distribution and service fees: | |
| A Class | 7,371 |
| R Class | 32 |
| Directors’ fees and expenses | 13,572 |
| Other expenses | 23,513 |
| | 6,655,447 |
| | |
| Net investment income (loss) | (174,793) |
| | |
| Realized and Unrealized Gain (Loss) | |
| Net realized gain (loss) on: | |
| Investment transactions (net of foreign tax expenses paid (refunded) of $292,750) | 128,777,886 |
| Foreign currency transactions | (1,194,797) |
| | 127,583,089 |
| | |
| Change in net unrealized appreciation (depreciation) on: | |
| Investments (net of deferred foreign taxes of $(266,851)) | (95,619,299) |
| Translation of assets and liabilities in foreign currencies | (76,621,628) |
| | (172,240,927) |
| | |
| Net realized and unrealized gain (loss) | (44,657,838) |
| | |
| Net Increase (Decrease) in Net Assets Resulting from Operations | $(44,832,631) |
| |
| |
| See Notes to Financial Statements. | |
16
|
| Statement of Changes in Net Assets |
| | |
| SIX MONTHS ENDED MAY 28, 2010 (UNAUDITED) AND YEAR ENDED NOVEMBER 30, 2009 | |
| Increase (Decrease) in Net Assets | 2010 | 2009 |
| Operations | | |
| Net investment income (loss) | $ (174,793) | $ 1,207,984 |
| Net realized gain (loss) | 127,583,089 | (83,552,531) |
| Change in net unrealized appreciation (depreciation) | (172,240,927) | 354,090,852 |
| Net increase (decrease) in net assets resulting from operations | (44,832,631) | 271,746,305 |
| | | |
| Distributions to Shareholders | | |
| From net investment income: | | |
| Investor Class | (1,891,482) | (6,272,184) |
| Institutional Class | (506,500) | (623,699) |
| A Class | — | (57,587) |
| Decrease in net assets from distributions | (2,397,982) | (6,953,470) |
| | | |
| Capital Share Transactions | | |
| Net increase (decrease) in net assets from capital share transactions | (67,131,928) | (85,394,901) |
| | | |
| Redemption Fees | | |
| Increase in net assets from redemption fees | 74,465 | 162,422 |
| | | |
| Net increase (decrease) in net assets | (114,288,076) | 179,560,356 |
| | | |
| Net Assets | | |
| Beginning of period | 959,036,831 | 779,476,475 |
| End of period | $844,748,755 | $959,036,831 |
| | | |
| Accumulated undistributed net investment income (loss) | $(1,663,093) | $909,682 |
| |
| |
| See Notes to Financial Statements. | | |
17
|
| Notes to Financial Statements |
MAY 28, 2010 (UNAUDITED)
1. Organization and Summary of Significant Accounting Policies
Organization — American Century World Mutual Funds, Inc. (the corporation) is registered under the Investment Company Act of 1940 (the 1940 Act) as an open-end management investment company. International Discovery Fund (the fund) is one fund in a series issued by the corporation. The fund is diversified under the 1940 Act. The fund’s investment objective is to seek capital growth. The fund pursues its objective by investing primarily in equity securities of companies that are small- to medium-sized at time of purchase and are located in foreign developed countries or emerging market countries. The following is a summary of the fund’s significant accounting policies.
Multiple Class — The fund is authorized to issue the Investor Class, the Institutional Class, the A Class (formerly Advisor Class), the C Class and the R Class. The A Class may incur an initial sales charge. The A Class and the C Class may be subject to a contingent deferred sales charge. The share classes differ principally in their respective sales charges and distribution and shareholder servicing expenses and arrangements. All shares of the fund represent an equal pro rata interest in the net assets of the class to which such shares belong, and have identical voting, dividend, liquidation and other rights and the same terms and conditions, except for class specific expenses and exclusive rights to vote on matters affecting only individual classes. Income, non-class specific expenses, and realized and unrealized capital ga ins and losses of the fund are allocated to each class of shares based on their relative net assets. Sale of the C Class and R Class commenced on March 1, 2010.
Security Valuations — Securities traded primarily on a principal securities exchange are valued at the last reported sales price, or at the mean of the latest bid and asked prices where no last sales price is available. Depending on local convention or regulation, securities traded over-the-counter are valued at the mean of the latest bid and asked prices, the last sales price, or the official close price. Investments in open-end management investment companies are valued at the reported net asset value. Discount notes may be valued through a commercial pricing service or at amortized cost, which approximates fair value. Securities traded on foreign securities exchanges and over-the-counter markets are normally completed before the close of business on days that the New York Stock Exchange (the Exchange) is open and may also take place on days when the Exchange is not open. If an event occurs after the value of a security was established but before the net asset value per share was determined that was likely to materially change the net asset value, that security would be valued as determined in accordance with procedures adopted by the Board of Directors. If the fund determines that the market price of a portfolio security is not readily available, or that the valuation methods mentioned above do not reflect the security’s fair value, such security is valued as determined by the Board of Directors or its designee, in accordance with procedures adopted by the Board of Directors, if such determination would materially impact a fund’s net asset value. Certain other circumstances may cause the fund to use alternative procedures to value a security such as: a security has been declared in default; trading in a security has been halted during the trading day; or there is a foreign market holiday and no trading will commence .
Security Transactions — For financial reporting purposes, security transactions are accounted for as of the trade date. Net realized gains and losses are determined on the identified cost basis, which is also used for federal income tax purposes. Certain countries impose taxes on realized gains on the sale of securities registered in their country. The fund records the foreign tax expense, if any, on an accrual basis. The foreign tax expense on realized gains and unrealized appreciation reduces the net realized gain (loss) on investment transactions and net unrealized appreciation (depreciation) on investments, respectively.
Investment Income — Dividend income less foreign taxes withheld, if any, is recorded as of the ex-dividend date. Interest income is recorded on the accrual basis and includes accretion of discounts and amortization of premiums.
18
Foreign Currency Translations — All assets and liabilities initially expressed in foreign currencies are translated into U.S. dollars at prevailing exchange rates at period end. The fund may enter into spot foreign currency exchange contracts to facilitate transactions denominated in a foreign currency. Purchases and sales of investment securities, dividend and interest income, spot foreign currency exchange contracts, and certain expenses are translated at the rates of exchange prevailing on the respective dates of such transactions. Realized and unrealized gains and losses from foreign currency translations arise from changes in currency exchange rates.
Net realized and unrealized foreign currency exchange gains or losses occurring during the holding period of investment securities are a component of net realized gain (loss) on foreign currency transactions and net unrealized appreciation (depreciation) on translation of assets and liabilities in foreign currencies, respectively. Certain countries may impose taxes on the contract amount of purchases and sales of foreign currency contracts in their currency. The fund records the foreign tax expense, if any, as a reduction to the net realized gain (loss) on foreign currency transactions.
Repurchase Agreements — The fund may enter into repurchase agreements with institutions that American Century Investment Management, Inc. (ACIM) has determined are creditworthy pursuant to criteria adopted by the Board of Directors. Each repurchase agreement is recorded at cost. The fund requires that the collateral, represented by securities, received in a repurchase transaction be transferred to the custodian in a manner sufficient to enable the fund to obtain those securities in the event of a default under the repurchase agreement. ACIM monitors, on a daily basis, the securities transferred to ensure the value, including accrued interest, of the securities under each repurchase agreement is equal to or greater than amounts owed to the fund under each repurchase agreement.
Joint Trading Account — Pursuant to an Exemptive Order issued by the Securities and Exchange Commission, the fund, along with certain other funds in the American Century Investments family of funds, may transfer uninvested cash balances into a joint trading account. These balances are invested in one or more repurchase agreements that are collateralized by U.S. Treasury or Agency obligations.
Income Tax Status — It is the fund’s policy to distribute substantially all net investment income and net realized gains to shareholders and to otherwise qualify as a regulated investment company under provisions of the Internal Revenue Code. The fund is no longer subject to examination by tax authorities for years prior to 2006. Additionally, non-U.S. tax returns filed by the fund due to investments in certain foreign securities remain subject to examination by the relevant taxing authority for 7 years from the date of filing. At this time, management believes there are no uncertain tax positions which, based on their technical merit, would not be sustained upon examination and for which it is reasonably possible that the total amounts of unrecognized tax benefits will significantly change in the next twelve months. Accordingly, no provision has been made for federal or state income taxes.
Distributions to Shareholders — Distributions to shareholders are recorded on the ex-dividend date. Distributions from net investment income, if any, are generally declared and paid annually. Distributions from net realized gains, if any, are generally declared and paid twice per year. The fund may make distributions on a more frequent basis to comply with the distribution requirements of the Internal Revenue Code, in all events in a manner consistent with provisions of the 1940 Act.
Redemption — The fund may impose a 2.00% redemption fee on shares held less than 180 days. The fee may not be applicable to all classes. The redemption fee is retained by the fund and helps cover transaction costs that long-term investors may bear when the fund sells securities to meet investor redemptions.
19
Indemnifications — Under the corporation’s organizational documents, its officers and directors are indemnified against certain liabilities arising out of the performance of their duties to the fund. In addition, in the normal course of business, the fund enters into contracts that provide general indemnifications. The maximum exposure under these arrangements is unknown as this would involve future claims that may be made against a fund. The risk of material loss from such claims is considered by management to be remote.
Use of Estimates — The financial statements are prepared in conformity with accounting principles generally accepted in the United States of America, which may require management to make certain estimates and assumptions at the date of the financial statements. Actual results could differ from these estimates.
Subsequent Events — In preparing the financial statements, management evaluated the impact of events or transactions occurring through the date the financial statements were issued that would merit recognition or disclosure.
2. Fees and Transactions with Related Parties
Management Fees — The corporation has entered into a Management Agreement with American Century Global Investment Management, Inc. (ACGIM) (the investment advisor) (see Note 9), under which ACGIM provides the fund with investment advisory and management services in exchange for a single, unified management fee (the fee) per class. The Agreement provides that all expenses of managing and operating the fund, except brokerage expenses, taxes, interest, fees and expenses of the independent directors (including legal counsel fees), and extraordinary expenses, will be paid by ACGIM. The fee is computed and accrued daily based on the daily net assets of the specific class of shares of the fund and paid monthly in arrears. For funds with a stepped fee schedule, the rate of the fee is determined by applying a fee rate calculation formula. This formula takes into account the fund’s assets as well as certain assets, if any, of other clients of the investment advisor outside the American Century Investments family of funds (such as subadvised funds and separate accounts) that have very similar investment teams and investment strategies (strategy assets). The annual management fee schedule ranges from 1.20% to 1.75% for the Investor Class, A Class, C Class and R Class. The Institutional Class is 0.20% less at each point within the range. The effective annual management fee for each class for the six months ended May 28, 2010 was 1.43% for the Investor Class, A Class, C Class and R Class and 1.23% for the Institutional Class.
ACGIM has entered into a Subadvisory Agreement with ACIM (the subadvisor) on behalf of the fund. The subadvisor makes investment decisions for the cash portion of the fund in accordance with the fund’s investment objectives, policies and restrictions under the supervision of ACGIM and the Board of Directors. ACGIM pays all costs associated with retaining ACIM as the subadvisor of the fund.
Distribution and Service Fees — The Board of Directors has adopted a separate Master Distribution and Individual Shareholder Services Plan for each of the A Class, C Class and R Class (collectively the plans), pursuant to Rule 12b-1 of the 1940 Act. The plans provide that the A Class will pay American Century Investment Services, Inc. (ACIS) an annual distribution and service fee of 0.25%. The plans provide that the C Class will pay ACIS an annual distribution fee of 0.75% and service fee of 0.25%. The plans provide that the R Class will pay ACIS an annual distribution and service fee of 0.50%. The fees are computed and accrued daily based on each class’s daily net assets and paid monthly in arrears. The fees are used to pay financial intermediaries for distribution and individual shareholder services. Fees incurred under the plans during the six months ended May 28, 2010, are detailed in the Statement of Operations.
20
Related Parties — Certain officers and directors of the corporation are also officers and/ or directors of American Century Companies, Inc. (ACC), the parent of the corporation’s investment advisor, ACGIM, the corporation’s subadvisor, ACIM, the distributor of the corporation, ACIS, and the corporation’s transfer agent, American Century Services, LLC.
The fund is eligible to invest in a money market fund for temporary purposes, which is managed by J.P. Morgan Investment Management, Inc. (JPMIM). The fund has a Mutual Funds Services Agreement with J.P. Morgan Investor Services Co. (JPMIS) and a securities lending agreement with JPMorgan Chase Bank (JPMCB). JPMCB is a custodian of the fund. JPMIM, JPMIS and JPMCB are wholly owned subsidiaries of JPMorgan Chase & Co. (JPM). JPM is an equity investor in ACC.
3. Investment Transactions
Purchases and sales of investment securities, excluding short-term investments, for the six months ended May 28, 2010, were $967,999,272 and $1,035,267,425, respectively.
| | | | |
| 4. Capital Share Transactions | | | | |
| |
| Transactions in shares of the fund were as follows: | | |
| | Six months ended May 28, 2010(1) | Year ended November 30, 2009 |
| | Shares | Amount | Shares | Amount |
| Investor Class/Shares Authorized | 400,000,000 | | 400,000,000 | |
| Sold | 2,963,489 | $ 26,192,302 | 8,973,349 | $ 62,070,331 |
| Issued in reinvestment of distributions | 203,829 | 1,811,258 | 1,112,979 | 6,032,128 |
| Redeemed | (10,769,305) | (94,378,931) | (21,983,823) | (150,599,718) |
| | (7,601,987) | (66,375,371) | (11,897,495) | (82,497,259) |
| Institutional Class/Shares Authorized | 70,000,000 | | 70,000,000 | |
| Sold | 1,139,984 | 10,340,635 | 2,436,097 | 16,480,062 |
| Issued in reinvestment of distributions | 53,799 | 482,824 | 107,347 | 588,261 |
| Redeemed | (1,153,152) | (10,128,398) | (2,014,567) | (13,522,357) |
| | 40,631 | 695,061 | 528,877 | 3,545,966 |
| A Class/Shares Authorized | 10,000,000 | | 10,000,000 | |
| Sold | 84,595 | 727,841 | 245,044 | 1,614,204 |
| Issued in reinvestment of distributions | — | — | 10,693 | 56,778 |
| Redeemed | (262,081) | (2,250,346) | (1,230,260) | (8,114,590) |
| | (177,486) | (1,522,505) | (974,523) | (6,443,608) |
| C Class/Shares Authorized | 10,000,000 | | N/A | |
| Sold | 5,231 | 45,887 | | |
| R Class/Shares Authorized | 10,000,000 | | N/A | |
| Sold | 2,941 | 25,000 | | |
| Net increase (decrease) | (7,730,670) | $(67,131,928) | (12,343,141) | $(85,394,901) |
| (1) March 1, 2010 (commencement of sale) through May 28, 2010 for the C Class and R Class. | | |
5. Fair Value Measurements
The fund’s securities valuation process is based on several considerations and may use multiple inputs to determine the fair value of the positions held by the fund. In conformity with accounting principles generally accepted in the United States of America, the inputs used to determine a valuation are classified into three broad levels as follows:
• Level 1 valuation inputs consist of unadjusted quoted prices in an active market for identical securities;
21
• Level 2 valuation inputs consist of significant direct or indirect observable market data (including quoted prices for similar securities, evaluations of subsequent market events, interest rates, prepayment speeds, credit risk, etc.); or
• Level 3 valuation inputs consist of significant unobservable inputs (including a fund’s own assumptions).
The level classification is based on the lowest level input that is significant to the fair valuation measurement. The valuation inputs are not an indication of the risks associated with investing in these securities or other financial instruments.
The following is a summary of the valuation inputs used to determine the fair value of the fund’s securities as of May 28, 2010. The Schedule of Investments provides additional details on the fund’s portfolio holdings.
| | | |
| | Level 1 | Level 2 | Level 3 |
| Investment Securities | | | |
| Foreign Common Stocks | $52,464,428 | $778,186,665 | — |
| Temporary Cash Investments | 23,825 | 4,500,000 | — |
| Total Value of Investment Securities | $52,488,253 | $782,686,665 | — |
6. Risk Factors
There are certain risks involved in investing in foreign securities. These risks include those resulting from future adverse political, social, and economic developments, fluctuations in currency exchange rates, the possible imposition of exchange controls, and other foreign laws or restrictions. Investing in emerging markets may accentuate these risks.
The fund concentrates its investments in common stocks of smaller companies. Because of this, the fund may be subject to greater risk and market fluctuations than a fund investing in larger, more established companies.
7. Interfund Lending
The fund, along with certain other funds in the American Century Investments family of funds, may participate in an interfund lending program, pursuant to an Exemptive Order issued by the Securities and Exchange Commission (SEC). This program provides an alternative credit facility allowing the fund to borrow from or lend to other funds in the American Century Investments family of funds that permit such transactions. Interfund lending transactions are subject to each fund’s investment policies and borrowing and lending limits. The interfund loan rate earned/paid on interfund lending transactions is determined daily based on the average of certain current market rates. Interfund lending transactions normally extend only overnight, but can have a maximum duration of seven days. The program is subject to annual approval by the Board of Directors. During the six months ended May 28, 2010, the fund did not utiliz e the program.
8. Federal Tax Information
The book-basis character of distributions made during the year from net investment income or net realized gains may differ from their ultimate characterization for federal income tax purposes. These differences reflect the differing character of certain income items and net realized gains and losses for financial statement and tax purposes, and may result in reclassification among certain capital accounts on the financial statements.
22
As of May 28, 2010, the components of investments for federal income tax purposes were as follows:
| | |
| Federal tax cost of investments | $802,062,311 |
| Gross tax appreciation of investments | $ 72,856,923 |
| Gross tax depreciation of investments | (39,744,316) |
| Net tax appreciation (depreciation) of investments | $ 33,112,607 |
The difference between book-basis and tax-basis cost and unrealized appreciation (depreciation) is attributable primarily to the tax deferral of losses on wash sales and on investments in passive foreign investment companies.
As of November 30, 2009, the fund had accumulated capital losses of $(566,991,044), which represent net capital loss carryovers that may be used to offset future realized capital gains for federal income tax purposes. Future capital loss carryover utilization in any given year may be subject to Internal Revenue Code limitations. Capital loss carryovers of $(325,506,389) and $(241,484,655) expire in 2016 and 2017, respectively.
The fund had a currency loss deferral of $(163,395), which represents net foreign currency losses incurred in the one-month period ended November 30, 2009. The fund has elected to treat such losses as having been incurred in the following fiscal year for federal income tax purposes.
9. Corporate Event
As part of a long-standing estate and business succession plan established by ACC Co-Chairman James E. Stowers, Jr., the founder of American Century Investments, ACC Co-Chairman Richard W. Brown succeeded Mr. Stowers as trustee of a trust that holds a greater-than-25% voting interest in ACC, the parent corporation of the fund’s advisors. Under the 1940 Act, this is presumed to represent control of ACC even though it is less than a majority interest. The change of trustee may technically be considered a “change of control” of ACC and therefore also a change of control of the fund’s advisors even though there has been no change to their management and none is anticipated. The “change of control” resulted in the assignment of the fund’s investment advisory and subadvisory agreements. Under the 1940 Act, an assignment automatically terminated such agreements, making the approval of a new agreement necessary.
On February 16, 2010, the Board of Directors approved interim investment advisory and subadvisory agreements under which the fund will be managed until a new agreement is approved by fund shareholders. The interim agreements are substantially identical to the terminated agreements (with the exception of different effective and termination dates) and will not result in changes in the management of American Century Investments, the fund, its investment objectives, fees or services provided. On March 29, 2010, the Board of Directors approved a new investment advisory agreement. The new agreement is also substantially identical to the terminated agreement (except for the date, the substitution of ACIM for ACGIM and certain other non-material changes). In order to streamline American Century’s corporate organization, ACGIM was merged into ACIM on July 16, 2010. The new agreement for the fund was approved by shareh olders at a Special Meeting of Shareholders on June 16, 2010. The new agreement went into effect on July 16, 2010. Management agreements for new share classes of the funds that were launched after February 16, 2010 did not terminate, have not been replaced by interim agreements, and do not require approval of new agreements.
23
| | | | | | | |
| International Discovery | | | | |
| |
| Investor Class | | | | | | |
| For a Share Outstanding Throughout the Years Ended November 30 (except as noted) | | |
| | | 2010(1) | 2009 | 2008 | 2007 | 2006 | 2005 |
| Per-Share Data | | | | | | |
| Net Asset Value, | | | | | | |
| Beginning of Period | $8.55 | $6.26 | $18.40 | $18.01 | $15.94 | $15.11 |
| Income From | | | | | | |
| Investment Operations | | | | | | |
| Net Investment | | | | | | |
| Income (Loss)(2) | —(3) | 0.01 | 0.06 | 0.05 | (0.02) | 0.14 |
| Net Realized and | | | | | | |
| Unrealized Gain (Loss) | (0.44) | 2.34 | (8.09) | 4.60 | 5.00 | 2.97 |
| Total From | | | | | | |
| Investment Operations | (0.44) | 2.35 | (8.03) | 4.65 | 4.98 | 3.11 |
| Distributions | | | | | | |
| From Net | | | | | | |
| Investment Income | (0.02) | (0.06) | (0.06) | — | (0.13) | — |
| From Net Realized Gains | — | — | (4.05) | (4.26) | (2.78) | (2.28) |
| Total Distributions | (0.02) | (0.06) | (4.11) | (4.26) | (2.91) | (2.28) |
| Net Asset Value, | | | | | | |
| End of Period | $8.09 | $8.55 | $6.26 | $18.40 | $18.01 | $15.94 |
| |
| Total Return(4) | (5.06)% | 38.06% | (55.48)% | 32.18% | 36.41% | 24.30% |
| | | | | | | |
| Ratios/Supplemental Data | | | | | | |
| Ratio of Operating | | | | | | |
| Expenses to Average | | | | | | |
| Net Assets | 1.44%(5) | 1.48% | 1.37% | 1.36% | 1.41% | 1.47% |
| Ratio of Net Investment | | | | | | |
| Income (Loss) to Average | | | | | | |
| Net Assets | (0.06)%(5) | 0.13% | 0.51% | 0.30% | (0.11)% | 1.02% |
| Portfolio Turnover Rate | 104% | 207% | 175% | 162% | 148% | 145% |
| Net Assets, End of Period | | | | | | |
| (in thousands) | $764,431 | $872,865 | $713,764 | $1,758,335 | $1,446,955 | $1,145,623 |
| (1) | Six months ended May 28, 2010 (unaudited). | | | | | |
| (2) | Computed using average shares outstanding throughout the period. | | | | |
| (3) | Per-share amount was less than $0.005. | | | | | |
| (4) | Total return assumes reinvestment of net investment income and capital gains distributions, if any. Total returns for periods less than one year |
| | are not annualized. Total returns are calculated based on the net asset value of the last business day. The total return of the classes may not |
| | precisely reflect the class expense differences because of the impact of calculating the net asset values to two decimal places. If net asset |
| | values were calculated to three decimal places, the total return differences would more closely reflect the class expense differences. The |
| | calculation of net asset values to two decimal places is made in accordance with SEC guidelines and does not result in any gain or loss of value |
| | between one class and another. | | | | | |
| (5) | Annualized. | | | | | | |
See Notes to Financial Statements.
24
| | | | | | | |
| International Discovery | | | | |
| |
| Institutional Class | | | | | | |
| For a Share Outstanding Throughout the Years Ended November 30 (except as noted) | | |
| | | 2010(1) | 2009 | 2008 | 2007 | 2006 | 2005 |
| Per-Share Data | | | | | | |
| Net Asset Value, | | | | | | |
| Beginning of Period | $8.66 | $6.34 | $18.59 | $18.16 | $16.06 | $15.21 |
| Income From | | | | | | |
| Investment Operations | | | | | | |
| Net Investment | | | | | | |
| Income (Loss)(2) | 0.01 | 0.02 | 0.08 | 0.09 | 0.04 | 0.17 |
| Net Realized and | | | | | | |
| Unrealized Gain (Loss) | (0.45) | 2.37 | (8.18) | 4.64 | 5.00 | 2.99 |
| Total From | | | | | | |
| Investment Operations | (0.44) | 2.39 | (8.10) | 4.73 | 5.04 | 3.16 |
| Distributions | | | | | | |
| From Net | | | | | | |
| Investment Income | (0.05) | (0.07) | (0.10) | — | (0.16) | — |
| From Net Realized Gains | — | — | (4.05) | (4.30) | (2.78) | (2.31) |
| Total Distributions | (0.05) | (0.07) | (4.15) | (4.30) | (2.94) | (2.31) |
| Net Asset Value, | | | | | | |
| End of Period | $8.17 | $8.66 | $6.34 | $18.59 | $18.16 | $16.06 |
| |
| Total Return(3) | (5.09)% | 38.32% | (55.37)% | 32.45% | 36.65% | 24.56% |
| | | | | | | |
| Ratios/Supplemental Data | | | | | | |
| Ratio of Operating | | | | | | |
| Expenses to Average | | | | | | |
| Net Assets | 1.24%(4) | 1.28% | 1.17% | 1.16% | 1.21% | 1.27% |
| Ratio of Net Investment | | | | | | |
| Income (Loss) to Average | | | | | | |
| Net Assets | 0.14%(4) | 0.33% | 0.71% | 0.50% | 0.09% | 1.22% |
| Portfolio Turnover Rate | 104% | 207% | 175% | 162% | 148% | 145% |
| Net Assets, End of Period | | | | | | |
| (in thousands) | $75,652 | $79,830 | $55,091 | $145,723 | $105,849 | $205,406 |
| (1) | Six months ended May 28, 2010 (unaudited). | | | | | |
| (2) | Computed using average shares outstanding throughout the period. | | | | |
| (3) | Total return assumes reinvestment of net investment income and capital gains distributions, if any. Total returns for periods less than one year |
| | are not annualized. Total returns are calculated based on the net asset value of the last business day. The total return of the classes may not |
| | precisely reflect the class expense differences because of the impact of calculating the net asset values to two decimal places. If net asset |
| | values were calculated to three decimal places, the total return differences would more closely reflect the class expense differences. The |
| | calculation of net asset values to two decimal places is made in accordance with SEC guidelines and does not result in any gain or loss of value |
| | between one class and another. | | | | | |
| (4) | Annualized. | | | | | | |
See Notes to Financial Statements.
25
| | | | | | | |
| International Discovery | | | | |
| |
| A Class(1) | | | | | | |
| For a Share Outstanding Throughout the Years Ended November 30 (except as noted) | | |
| | | 2010(2) | 2009 | 2008 | 2007 | 2006 | 2005 |
| Per-Share Data | | | | | | |
| Net Asset Value, | | | | | | |
| Beginning of Period | $8.37 | $6.13 | $18.08 | $17.76 | $15.75 | $14.95 |
| Income From | | | | | | |
| Investment Operations | | | | | | |
| Net Investment | | | | | | |
| Income (Loss)(3) | (0.01) | —(4) | 0.06 | 0.07 | (0.08) | 0.10 |
| Net Realized and | | | | | | |
| Unrealized Gain (Loss) | (0.43) | 2.29 | (7.95) | 4.46 | 4.96 | 2.95 |
| Total From | | | | | | |
| Investment Operations | (0.44) | 2.29 | (7.89) | 4.53 | 4.88 | 3.05 |
| Distributions | | | | | | |
| From Net | | | | | | |
| Investment Income | — | (0.05) | (0.01) | — | (0.09) | — |
| From Net Realized Gains | — | — | (4.05) | (4.21) | (2.78) | (2.25) |
| Total Distributions | — | (0.05) | (4.06) | (4.21) | (2.87) | (2.25) |
| Net Asset Value, | | | | | | |
| End of Period | $7.93 | $8.37 | $6.13 | $18.08 | $17.76 | $15.75 |
| |
| Total Return(5) | (5.26)% | 37.71% | (55.56)% | 31.83% | 36.08% | 24.01% |
| | | | | | | |
| Ratios/Supplemental Data | | | | | | |
| Ratio of Operating | | | | | | |
| Expenses to Average | | | | | | |
| Net Assets | 1.69%(6) | 1.73% | 1.63% | 1.61% | 1.66% | 1.72% |
| Ratio of Net Investment | | | | | | |
| Income (Loss) to Average | | | | | | |
| Net Assets | (0.31)%(6) | (0.12)% | 0.25% | 0.05% | (0.36)% | 0.77% |
| Portfolio Turnover Rate | 104% | 207% | 175% | 162% | 148% | 145% |
| Net Assets, End of Period | | | | | | |
| (in thousands) | $4,599 | $6,342 | $10,622 | $2,494 | $7 | $70 |
| (1) | Prior to March 1, 2010, the A Class was referred to as the Advisor Class. | | | |
| (2) | Six months ended May 28, 2010 (unaudited). | | | | | |
| (3) | Computed using average shares outstanding throughout the period. | | | | |
| (4) | Per-share amount was less than $0.005. | | | | | |
| (5) | Total return assumes reinvestment of net investment income and capital gains distributions, if any, and does not reflect applicable sales charges. |
| | Total returns for periods less than one year are not annualized. Total returns are calculated based on the net asset value of the last business day. |
| | The total return of the classes may not precisely reflect the class expense differences because of the impact of calculating the net asset values |
| | to two decimal places. If net asset values were calculated to three decimal places, the total return differences would more closely reflect the |
| | class expense differences. The calculation of net asset values to two decimal places is made in accordance with SEC guidelines and does not |
| | result in any gain or loss of value between one class and another. | | | | |
| (6) | Annualized. | | | | | | |
See Notes to Financial Statements.
26
| | |
| International Discovery | |
| |
| C Class | |
| For a Share Outstanding Throughout the Years Ended November 30 (except as noted) | |
| | | 2010(1) |
| Per-Share Data | |
| Net Asset Value, Beginning of Period | $8.50 |
| Income From Investment Operations | |
| Net Investment Income (Loss)(2) | —(3) |
| Net Realized and Unrealized Gain (Loss) | (0.41) |
| Total From Investment Operations | (0.41) |
| Net Asset Value, End of Period | $8.09 |
| |
| Total Return(4) | (4.82)% |
| | |
| Ratios/Supplemental Data | |
| Ratio of Operating Expenses to Average Net Assets | 2.44%(5) |
| Ratio of Net Investment Income (Loss) to Average Net Assets | 0.12%(5) |
| Portfolio Turnover Rate | 104%(6) |
| Net Assets, End of Period (in thousands) | $42 |
| (1) | March 1, 2010 (commencement of sale) through May 28, 2010 (unaudited). | |
| (2) | Computed using average shares outstanding throughout the period. | |
| (3) | Per-share amount was less than $0.005. | |
| (4) | Total return assumes reinvestment of net investment income and capital gains distributions, if any, and does not reflect applicable sales charges. |
| | Total returns for periods less than one year are not annualized. Total returns are calculated based on the net asset value of the last business day. |
| | The total return of the classes may not precisely reflect the class expense differences because of the impact of calculating the net asset values |
| | to two decimal places. If net asset values were calculated to three decimal places, the total return differences would more closely reflect the |
| | class expense differences. The calculation of net asset values to two decimal places is made in accordance with SEC guidelines and does not |
| | result in any gain or loss of value between one class and another. | |
| (5) | Annualized. | |
| (6) | Portfolio turnover is calculated at the fund level. Percentage indicated was calculated for the period ended May 28, 2010. | |
See Notes to Financial Statements.
27
| | |
| International Discovery | |
| |
| R Class | |
| For a Share Outstanding Throughout the Years Ended November 30 (except as noted) | |
| | | 2010(1) |
| Per-Share Data | |
| Net Asset Value, Beginning of Period | $8.50 |
| Income From Investment Operations | |
| Net Investment Income (Loss)(2) | 0.01 |
| Net Realized and Unrealized Gain (Loss) | (0.41) |
| Total From Investment Operations | (0.40) |
| Net Asset Value, End of Period | $8.10 |
| |
| Total Return(3) | (4.71)% |
| | |
| Ratios/Supplemental Data | |
| Ratio of Operating Expenses to Average Net Assets | 1.94%(4) |
| Ratio of Net Investment Income (Loss) to Average Net Assets | 0.50%(4) |
| Portfolio Turnover Rate | 104%(5) |
| Net Assets, End of Period (in thousands) | $24 |
| (1) | March 1, 2010 (commencement of sale) through May 28, 2010 (unaudited). | |
| (2) | Computed using average shares outstanding throughout the period. | |
| (3) | Total return assumes reinvestment of net investment income and capital gains distributions, if any. Total returns for periods less than one year |
| | are not annualized. Total returns are calculated based on the net asset value of the last business day. The total return of the classes may not |
| | precisely reflect the class expense differences because of the impact of calculating the net asset values to two decimal places. If net asset |
| | values were calculated to three decimal places, the total return differences would more closely reflect the class expense differences. The |
| | calculation of net asset values to two decimal places is made in accordance with SEC guidelines and does not result in any gain or loss of value |
| | between one class and another. | |
| (4) | Annualized. | |
| (5) | Portfolio turnover is calculated at the fund level. Percentage indicated was calculated for the period ended May 28, 2010. | |
See Notes to Financial Statements.
28
|
| Board Approval of Management and Subadvisory Agreements |
American Century Global Investment Management, Inc. (“ACGIM” or the “Advisor”) currently serves as investment advisor to the Fund under an interim management agreement (the “Interim Management Agreement”) between the Advisor and the Fund approved by the Fund’s Board of Directors (the “Board”). American Century Investment Management, Inc. (“ACIM” or the “Subadvisor”) currently serves as subadvisor to the Fund under an interim investment subadvisory agreement (the “Interim Subad-visory Agreement” and, together with the Interim Management Agreement, the “Interim Agreements”). The Advisor and the Subadvisor (together, the “Advisors”) previously served as investment advisors to the Fund pursuant to agreements (the “Prior Agreements”) that terminated in accordance with their terms on February 16, 2010, as a result of a change of control of the Advisor’s and the Subadvisor’s parent company, American Century Companies, Inc. (“ACC”). The change in control occurred as the result of a change in the trustee of a trust created by James E. Stowers, Jr., the founder of American Century Investments, which holds shares representing a significant interest in ACC stock. Mr. Stowers previously served as the trustee of the trust. On February 16, 2010, Mr. Richard W. Brown, Co-Chairman of ACC with Mr. Stowers, became the trustee in accordance with the terms of the trust and Mr. Stowers’ long-standing estate and succession plan.
On February 18, 2010, the Board approved the Interim Agreements in accordance with Rule 15a-4 under the Investment Company Act to ensure continued management of the Funds by the Advisor and the Subad-visor after the termination of the Prior Agreements and until shareholder approval of a new management agreement (the “Proposed Agreement”) as required under the Act. The Board approved the Proposed Agreement and recommended its approval to shareholders. Fund shareholders approved the Proposed Agreement at a meeting on June 16, 2010.*
Because American Century had indicated its intention to merge ACGIM into ACIM prior to the expiration of the Interim Agreements, the Proposed Agreement is with ACIM as sole investment advisor to the Fund. The Board took into consideration that the combination is being undertaken for reasons of organizational simplification and will eliminate the need for multiple investment management agreements without changing the nature, quality, or extent of services provided to the Fund. The Board noted that the merger was not related to the change of control that necessitated the Interim Agreements and would not result in any change to the personnel managing the Fund.
The Interim Agreements and the Proposed Agreement are substantially identical to the Prior Agreements except for their effective dates, the termination provisions of the Interim Agreements, and the elimination of a subadvisor in the Proposed Agreement. Under the Proposed Agreement, ACIM will provide the same services as provided by ACGIM and ACIM, be subject to the same duties, and receive the same compensation rate as under the Prior Agreements.
|
| *Management agreements for new share classes of the Fund launched after February 16, 2010, did not terminate, have not been replaced by Interim |
| Management Agreements, and do not require Board or shareholder approval at this time. |
29
Basis for Board Approval of Interim Agreements
In considering the approval of the Interim Agreements, Rule 15a-4 requires the Board to approve the contracts within ten business days of the termination of the prior agreements and to determine that the compensation to be received under each interim agreement is no greater than would have been received under the corresponding prior agreement. In connection with the approval, the Board noted that it oversees on a continuous basis and evaluates at its quarterly meetings, directly and through the committees of the Board, the nature and quality of significant services provided by the Advisor and the Subadvisor, the investment performance of the Fund, shareholder services, audit and compliance functions and a variety of other matters relating to the Fund’s operations.
In evaluating the Interim Agreements, the Board, assisted by the advice of its independent legal counsel, considered a number of factors in addition to those required by the rule with no one factor being determinative to its analysis. Among the factors considered by the Board were the circumstances and effect of the change of control, the fact that the Advisor and the Subad-visor will provide the same services and receive the same compensation rate as under the Prior Agreements, and that the change of control did not result in a change of the personnel managing the Fund. Upon completion of its analysis, the Board approved the Interim Agreements, determining that the continued management of the Fund by the Advisor and the Subadvisor was in the best interests of the Fund and Fund shareholders.
Basis for Board Approval of Proposed Agreement
At a meeting held on March 29, 2010, after considering all information presented, the Board approved, and determined to recommend that shareholders approve, the Proposed Agreement. In connection with that approval, the Board requested and reviewed extensive data and information compiled by the Advisor, the Subadvisor, and certain independent providers of evaluation data concerning the Fund and services provided to the Fund. The Board oversees on a continuous basis and evaluates at its quarterly meetings, directly and through the committees of the Board, the nature and quality of significant services provided to the Fund, the investment performance of the Fund, shareholder services, audit and compliance functions and a variety of other matters relating to the Fund’s operations. The information considered and the discussions held at the meetings included, but were not limited to:
• the nature, extent and quality of investment management, shareholder services and other services provided to the Fund;
• the wide range of programs and services provided to the Fund and their shareholders on a routine and non-routine basis;
• the compliance policies, procedures, and regulatory experience of the Advisors;
• data comparing the cost of owning the Fund to the cost of owning similar funds;
30
• the fact that there will be no changes to the fees, services, or personnel who provide such services as compared to the Prior Agreements;
• data comparing the Fund’s performance to appropriate benchmarks and/ or a peer group of other mutual funds with similar investment objectives and strategies;
• financial data showing the profitability of the Fund to the Advisors and the overall profitability of the Advisors;
• data comparing services provided and charges to the Fund with those for other non-fund investment management clients of the Advisors; and
• consideration of collateral or “fall-out” benefits derived by the Advisors from the management of the Fund and potential sharing of economies of scale in connection with the management of the Fund.
The Board also considered whether there was any reason for not continuing the existing arrangement with the Advisor. In particular, the Board recognized that shareholders may have invested in the Fund on the strength of the Advisor’s industry standing and reputation and in the expectation that the Advisor will have a continuing role in providing services to the Fund.
The Board considered all of the information provided by the Advisor, the Subadvisor, the independent data providers, and the Board’s independent counsel, and evaluated such information for the Fund. The Board did not identify any single factor as being all-important or controlling, and each Board member may have attributed different levels of importance to different factors. In deciding to approve the Proposed Agreement under the terms ultimately determined by the Board to be appropriate, the Board based its decision on a number of factors, including the following:
Nature, Extent and Quality of Services – Generally. Under the Proposed Agreement, ACIM is responsible for providing or arranging for all services necessary for the operation of the Fund. The Board noted that under the Proposed Agreement, ACIM provides or arranges at its own expense a wide variety of services including:
• constructing and designing the Fund
• portfolio research and security selection
• initial capitalization/funding
• securities trading
• Fund administration
• custody of Fund assets
• daily valuation of the Fund’s portfolio
31
• shareholder servicing and transfer agency, including shareholder confir-
mations, recordkeeping and communications
• legal services
• regulatory and portfolio compliance
• financial reporting
• marketing and distribution
The Board noted that many of these services have expanded over time both in terms of quantity and complexity in response to shareholder demands, competition in the industry, changing distribution channels and the changing regulatory environment.
Investment Management Services. The investment management services provided to the Fund are complex and provide Fund shareholders access to professional money management, instant diversification of their investments within an asset class, the opportunity to easily diversify among asset classes, and liquidity. As a part of its general oversight and in evaluating investment performance, the Board expects ACIM to manage the Fund in accordance with its investment objectives and approved strategies. In providing these services, ACIM utilizes teams of investment professionals who require extensive information technology, research, training, compliance and other systems to conduct their business. The Board, directly and through its Fund Performance Review Committee, regularly reviews investment performance information for the Fund, toget her with comparative information for appropriate benchmarks and/or peer groups of similarly-managed funds, over different time horizons. If performance concerns are identified, the Fund receives special reviews until performance improves, during which time the Board discusses with ACIM the reasons for such underperformance and any efforts being undertaken to improve performance.
Shareholder and Other Services. Under the Proposed Agreement, ACIM will also provide the Fund with a comprehensive package of transfer agency, shareholder, and other services. The Board, directly and through the various committees of the Board, regularly reviews reports and evaluations of such services. These reports include, but are not limited to, information regarding the operational efficiency and accuracy of the shareholder and transfer agency services provided, staffing levels, shareholder satisfaction (as measured by external as well as internal sources), technology support, new products and services offered to Fund shareholders, securities trading activities, portfolio valuation services, auditing services, and legal and operational compliance activities. Certain aspects of shareholder and transfer agency service level eff iciency and the quality of securities trading activities are measured by independent third party providers and are presented in comparison to other fund groups not managed by ACIM.
32
Costs of Services Provided and Profitability. The Advisor provided detailed information concerning its cost of providing various services to the Fund, its profitability in managing the Fund, its overall profitability, and its financial condition. The Board reviewed with the Advisor the methodology used to prepare this financial information. The Board has also reviewed with the Advisor its methodology for compensating the investment professionals that provide services to the Fund as well as compensation to the five highest paid personnel of the Advisor. This financial information regarding the Advisor is considered in order to evaluate the Advisor’s financial condition, its ability to continue to provide services under the Proposed Agreement, and the reasonableness of the proposed management fees. The Board concluded that the Advisor’s profits were reasonable in light of the services provided to the Fund.
Ethics. The Board generally considers ACIM’s commitment to providing quality services to shareholders and to conducting its business ethically. It noted that ACIM’s practices generally meet or exceed industry best practices.
Economies of Scale. The Board also reviewed information provided by ACIM regarding the possible existence of economies of scale in connection with the management of the Fund. The Board concluded that economies of scale are difficult to measure and predict with precision, especially on a fund-by-fund basis. The analysis of economies of scale is further complicated by the additional services and content provided by ACIM and its reinvestment in its ability to provide and expand those services. Accordingly, the Board seeks to evaluate economies of scale by reviewing information, such as year-over-year profitability of its advisor generally, the profitability of its management of the Fund specifically, and the expenses incurred by the advisor in providing various functions to the Fund. The Board believes ACIM will appropriately sha re economies of scale through its competitive fee structure, offering competitive fees from fund inception, fee breakpoints as the Fund increases in size, and through reinvestment in its business to provide shareholders additional services and enhancements to existing services.
Comparison to Fees of Funds not Managed by the Advisor. Both the Prior and Proposed Agreements provide that the Fund pays ACGIM or ACIM a single, all-inclusive (or unified) management fee for providing all services necessary for the management and operation of the Fund, other than brokerage expenses, taxes, interest, extraordinary expenses, and the fees and expenses of the Fund’s Independent Directors (including their independent legal counsel) and expenses incurred in connection with the provision of shareholder services and distribution services under a plan adopted pursuant to Rule 12b-1 under the 1940 Act. Under the unified fee structure, ACIM is responsible for providing all investment advisory, custody, audit, administrative, compliance, recordkeeping, marketing and shareholder services, or arranging and supervising third parties that provide such services. By contrast, most other funds are charged a variety of fees, including an investment advisory fee, a transfer agency fee, an administrative fee, distribution charges and other expenses. Other than their investment advisory fees and any applicable Rule 12b-1 distribution fees, the components of the total fees charged by these other funds may be
33
increased without shareholder approval. The Board believes the unified fee structure is a benefit to Fund shareholders because it clearly discloses to shareholders the cost of owning Fund shares, and, since the unified fee cannot be increased without a vote of Fund shareholders, it shifts to ACIM the risk of increased costs of operating the Fund and provides a direct incentive to minimize administrative inefficiencies. Part of the Board’s analysis of fee levels involves reviewing certain evaluative data compiled by an independent provider comparing the Fund’s unified fee to the total expense ratios of similar funds not managed by ACIM. The Board concluded that the management fee to be paid by the Fund to ACIM under the Proposed Agreement is reasonable in light of the services to be provided to the Fund.
Comparison to Fees and Services Provided to Other Clients of the Advisor. The Board also requested and received information from ACIM concerning the nature and extent of the services, fees, and profitability of its advisory services to advisory clients other than the Fund. They observed that these varying types of client accounts require different services and involve different regulatory and entrepreneurial risks than the management of the Fund. The Board analyzed this information and concluded that the fees charged and services provided to the Fund were reasonable by comparison.
Collateral or “Fall-Out” Benefits Derived by the Advisor. The Board considered the existence of collateral benefits ACIM may receive as a result of its relationship with the Fund. The Board concluded that ACIM’s primary business is managing mutual funds and it generally does not use Fund or shareholder information to generate profits in other lines of business, and therefore does not derive any significant collateral benefits from them. The Board noted that ACIM receives proprietary research from broker-dealers that execute Fund portfolio transactions and concluded that this research is likely to benefit Fund shareholders. The Board also determined that ACIM is able to provide investment management services to certain clients other than the Fund, at least in part, due to its existing infrastructure built to serv e the fund complex. The Board concluded, however, that the assets of those other clients are not material to the analysis and, in any event, are included with the assets of fund clients to determine breakpoints in each fund’s fee schedule, provided they are managed using the same investment team and strategy.
Conclusion of the Board. As a result of this process, the Board, in the absence of particular circumstances and assisted by the advice of its independent legal counsel, taking into account all of the factors discussed above and the information provided by ACIM and others, concluded that the Proposed Agreement be approved and recommended its approval to Fund shareholders.
34
Retirement Account Information
As required by law, distributions you receive from certain IRAs, or 403(b), 457 and qualified plans are subject to federal income tax withholding, unless you elect not to have withholding apply. Tax will be withheld on the total amount withdrawn even though you may be receiving amounts that are not subject to withholding, such as nondeductible contributions. In such case, excess amounts of withholding could occur. You may adjust your withholding election so that a greater or lesser amount will be withheld.
If you don’t want us to withhold on this amount, you must notify us to not withhold the federal income tax. You may notify us in writing or in certain situations by telephone or through other electronic means. You have the right to revoke your withholding election at any time and any election you make may remain in effect until revoked by filing a new election.
Remember, even if you elect not to have income tax withheld, you are liable for paying income tax on the taxable portion of your withdrawal. If you elect not to have income tax withheld or you don’t have enough income tax withheld, you may be responsible for payment of estimated tax. You may incur penalties under the estimated tax rules if your withholding and estimated tax payments are not sufficient. You can reduce or defer the income tax on a distribution by directly or indirectly rolling such distribution over to another IRA or eligible plan. You should consult your tax advisor for additional information.
State tax will be withheld if, at the time of your distribution, your address is within one of the mandatory withholding states and you have federal income tax withheld. State taxes will be withheld from your distribution in accordance with the respective state rules.
Proxy Voting Guidelines
American Century Investment Management, Inc., the fund’s investment advisor, is responsible for exercising the voting rights associated with the securities purchased and/or held by the fund. A description of the policies and procedures the advisor uses in fulfilling this responsibility is available without charge, upon request, by calling 1-800-345-2021. It is also available on American Century Investments’ website at americancentury.com and on the Securities and Exchange Commission’s website at sec.gov. Information regarding how the investment advisor voted proxies relating to portfolio securities during the most recent 12-month period ended June 30 is available on the “About Us” page at americancentury.com. It is also available at sec.gov.
Quarterly Portfolio Disclosure
The fund files its complete schedule of portfolio holdings with the Securities and Exchange Commission (SEC) for the first and third quarters of each fiscal year on Form N-Q. The fund’s Forms N-Q are available on the SEC’s website at sec.gov, and may be reviewed and copied at the SEC’s Public Reference Room in Washington, DC. Information on the operation of the Public Reference Room may be obtained by calling 1-800-SEC-0330. The fund also makes its complete schedule of portfolio holdings for the most recent quarter of its fiscal year available on its website at americancentury.com and, upon request, by calling 1-800-345-2021.
35
The following indices are used to illustrate investment market, sector, or style performance or to serve as fund performance comparisons. They are not investment products available for purchase.
Morgan Stanley Capital International (MSCI) has developed several indices that measure the performance of foreign stock markets.
The MSCI AC (All Country) World ex-US Mid Cap Growth Index represents the performance of mid cap growth stocks in developed and emerging markets, excluding the United States.
The MSCI EAFE (Europe, Australasia, Far East) Index is designed to measure developed market equity performance, excluding the U.S. and Canada.
The MSCI EAFE Growth Index is a capitalization-weighted index that monitors the performance of growth stocks from Europe, Australasia, and the Far East.
The MSCI EAFE Value Index is a capitalization-weighted index that monitors the performance of value stocks from Europe, Australasia, and the Far East.
The MSCI EM (Emerging Markets) Index represents the performance of stocks in global emerging market countries.
The MSCI Europe Index is designed to measure equity market performance in Europe.
The MSCI Japan Index is designed to measure equity market performance in Japan.
The MSCI World Free Index represents the performance of stocks in developed countries (including the United States) that are available for purchase by global investors.
36

| |
| |
| Contact Us | |
| americancentury.com | |
| Automated Information Line | 1-800-345-8765 |
| Investor Services Representative | 1-800-345-2021 or |
| | 816-531-5575 |
| Investors Using Advisors | 1-800-378-9878 |
| Business, Not-For-Profit, Employer-Sponsored | |
| Retirement Plans | 1-800-345-3533 |
| Banks and Trust Companies, Broker-Dealers, | |
| Financial Professionals, Insurance Companies | 1-800-345-6488 |
| Telecommunications Device for the Deaf | 1-800-634-4113 |
| American Century World Mutual Funds, Inc. | |
| Investment Advisor: | |
| American Century Investment Management, Inc. | |
| Kansas City, Missouri | |
This report and the statements it contains are submitted for the general
information of our shareholders. The report is not authorized for distribution to
prospective investors unless preceded or accompanied by an effective prospectus.
American Century Investment Services, Inc., Distributor
©2010 American Century Proprietary Holdings, Inc. All rights reserved.
1007
CL-SAN-68675
|
| Semiannual Report |
| May 28, 2010 |

|
| American Century Investments® |
International Opportunities Fund
| |
| President’s Letter | 2 |
| Independent Chairman’s Letter | 3 |
| Market Perspective | 4 |
| International Equity Total Returns | 4 |
| |
| International Opportunities | |
| |
| Performance | 5 |
| Portfolio Commentary | 7 |
| Top Ten Holdings | 9 |
| Types of Investments in Portfolio | 9 |
| Investments by Country | 9 |
| |
| Shareholder Fee Example | 10 |
| |
| Financial Statements | |
| |
| Schedule of Investments | 12 |
| Statement of Assets and Liabilities | 15 |
| Statement of Operations | 16 |
| Statement of Changes in Net Assets | 17 |
| Notes to Financial Statements | 18 |
| Financial Highlights | 24 |
| |
| Other Information | |
| |
| Board Approval of Management and Subadvisory Agreements | 29 |
| Additional Information | 35 |
| Index Definitions | 36 |
Any opinions expressed in this report reflect those of the author as of the date of the report, and do not necessarily represent the opinions of American Century Investments or any other person in the American Century Investments organization. Any such opinions are subject to change at any time based upon market or other conditions and American Century Investments disclaims any responsibility to update such opinions. These opinions may not be relied upon as investment advice and, because investment decisions made by American Century Investments funds are based on numerous factors, may not be relied upon as an indication of trading intent on behalf of any American Century Investments fund. Security examples are used for representational purposes only and are not intended as recommendations to purchase or sell securities. Performance information for comparative indices and securities is provided to American Century Investments by third party vendors. To the best of American Century Investments’ knowledge, such information is accurate at the time of printing.

Dear Investor:
To learn more about the capital markets, your investment, and the portfolio management strategies American Century Investments provides, we encourage you to review this shareholder report for the financial reporting period ended May 28, 2010.
On the following pages, you will find investment performance and portfolio information, presented with the expert perspective and commentary of our portfolio management team. This report remains one of our most important vehicles for conveying the information you need about your investment performance, and about the market factors and strategies that affect fund returns. For additional information on the markets, we encourage you to visit the “Insights & News” tab at our Web site, americancentury.com, for updates and further expert commentary.
The top of our Web site’s home page also provides a link to “Our Story,” which, first and foremost, outlines our commitment—since 1958—to helping clients reach their financial goals. We believe strongly that we will only be successful when our clients are successful. That’s who we are.
Another important, unique facet of our story and who we are is “Profits with a Purpose,” which describes our bond with the Stowers Institute for Medical Research (SIMR). SIMR is a world-class biomedical organization—founded by our company founder James E. Stowers, Jr. and his wife Virginia—that is dedicated to researching the causes, treatment, and prevention of gene-based diseases, including cancer. Through American Century Investments’ private ownership structure, more than 40% of our profits support SIMR.
Mr. Stowers’ example of achieving financial success and using that platform to help humanity motivates our entire American Century Investments team. His story inspires us to help each of our clients achieve success. Thank you for sharing your financial journey with us.
Sincerely,

Jonathan Thomas
President and Chief Executive Officer
American Century Investments
2
|
| Independent Chairman’s Letter |

Fellow Shareholders,
The principal event at a recent board meeting was the retirement of Jim Stowers, Jr. from the American Century Mutual Funds Kansas City board. This was one of those times when you felt like you were living a historical moment. Jim—who celebrated his 86th birthday in January—founded what was known as Twentieth Century Mutual Funds over 50 years ago. Through the years, his number one priority has been to “Put Investors First!” The board presented Jim with a resolution acknowledging that, by building a successful investment company, he has impacted the lives of many by helping them on the path to financial success.
We respect Jim’s decision to focus his energy on the Stowers Institute for Medical Research and American Century Companies, Inc. (ACC), the parent company of the funds’ investment advisor. The pioneering medical research that Jim and his wife Virginia have made possible through the Institute should enrich the lives of millions in the future.
Shortly after his retirement from the board, we received word that ACC’s co-chairman Richard W. Brown had succeeded Jim as trustee of a trust that holds a significant interest in ACC stock as a part of Jim’s long-standing estate and business succession plan. While holding less than a majority interest, the trust is presumed to control the funds’ investment advisors under the Investment Company Act of 1940. This change triggered the need for a shareholder proxy to approve new management and subadvisory agreements for the funds. I am happy to report that all of the proposals contained in the proxy received the necessary votes and were approved.
On behalf of the board, I want to once again thank Jim for his mutual fund board service. More than three years ago, Jim and Richard Brown installed a strong and effective leadership team at American Century Investments and I look forward to continuing to work with them on behalf of fund shareholders. And while Jim no longer sits on the fund board, the inherent optimism captured by his favorite catch phrase—“The best is yet to be”—still resonates with all of us who have the privilege of serving you. I invite you to send your comments, questions or concerns to me at dhpratt@fundboardchair.com.

3

By Mark Kopinski, Chief Investment Officer, Global and Non-U.S. Equity
Events in May Sent Stocks Tumbling
Global stock returns generally remained robust for the first several months of the period, as the rally unleashed in March 2009 continued into 2010. Optimism regarding the global economic recovery and business sector gains helped keep stocks in positive territory.
Nevertheless, as spring set in, the global stock market rally ended abruptly, starting with the May 6 “Flash Crash” in the U.S. stock market, when the major indices plunged nearly 7% within 15 minutes. Furthermore, problems that had been percolating in Europe and in the global geopolitical arena boiled over in May, triggering a sharp stock market selloff. In particular, the expanding European government debt crisis beyond Greece, the downgrade of Spain’s credit rating, the worsening oil disaster in the Gulf of Mexico, and escalating tensions in the Middle East rattled investors’ nerves.
Overall, developed international equity markets significantly under-performed the U.S. market and the emerging markets. European stocks suffered the largest losses for the six-month period, as the mounting debt crisis worried investors. Exploding debt in Greece, Italy, Spain, Ireland, and Portugal all came under scrutiny.
Debt Remained the Roadblock to Growth
The sovereign debt problem did not just happen as a result of the recent financial crisis or recession; it is a longer-term issue. Recent events only exacerbated the problem and accelerated its becoming a crisis.
In fact, sovereign solvency has emerged as one of the most significant roadblocks to growth. Currently, the market is focused on Europe, where severe austerity measures are required to get fiscal balances back in order. This is likely to trim 0.5% from European growth during the next year. The weaker euro should help offset some of the decline in growth, but the more export-oriented northern countries will be the main beneficiaries. Commodity-based countries, such as Australia and Norway, have been the most resilient and have seen more impressive economic recoveries. The debt crisis likely will mean European interest rates will remain accommodative for the remainder of 2010.
| | | | |
| International Equity Total Returns | | | | |
| For the six months ended May 28, 2010* (in U.S. dollars) | |
| MSCI EAFE Index | -10.90% | | MSCI Europe Index | -14.77% |
| MSCI EAFE Growth Index | -8.85% | | MSCI World Free Index | -4.92% |
| MSCI EAFE Value Index | -12.95% | | MSCI Japan Index | 0.10% |
| MSCI EM Index | -2.75% | | | |
| *Total returns for periods less than one year are not annualized and are based on the period beginning December 1, 2009. | |
4
| | | | | | | |
| International Opportunities | | | | |
| |
| Total Returns as of May 28, 2010 | | | | | |
| | | | | | Average Annual Returns | |
| | | Ticker | | | | Since | Inception |
| | | Symbol | 6 months(1)(2) | 1 year(2) | 5 years(2) | Inception | Date |
| Investor Class | AIOIX | -4.25% | 16.56% | 4.81% | 11.78% | 6/1/01 |
| MSCI AC World ex-US | | | | | | |
| Small Cap Growth Index | — | -2.72% | 20.56% | 4.84% | 6.61% | — |
| Institutional Class | ACIOX | -4.19% | 16.65% | 5.04% | 15.35% | 1/9/03 |
| A Class | AIVOX | | | | | 3/1/10 |
| No sales charge* | | — | — | — | -5.58%(1) | |
| With sales charge* | | — | — | — | -11.07%(1) | |
| C Class | AIOCX | | | | | 3/1/10 |
| No sales charge* | | — | — | — | -5.81%(1) | |
| With sales charge* | | — | — | — | -6.75%(1) | |
| R Class | AIORX | | | | | 3/1/10 |
| Before redemption fee | | — | — | — | -5.63%(1) | |
| Net of redemption fee(3) | | — | — | — | -7.51%(1) | |
| *Sales charges include initial sales charges and contingent deferred sales charges (CDSCs), as applicable. A Class shares have a 5.75% |
| maximum initial sales charge for equity funds and may be subject to a maximum CDSC of 1.00%. C Class shares redeemed within 12 |
| months of purchase are subject to a maximum CDSC of 1.00%. The SEC requires that mutual funds provide performance information |
| net of maximum sales charges in all cases where charges could be applied. | | | | |
| |
| (1) | Total returns for periods less than one year are not annualized. | | | | |
| (2) | Total returns are based on the periods beginning December 1, 2009 for the 6 month returns, June 1, 2009 for the 1 year returns and June 1, 2005 |
| | for the 5 year returns. | | | | | | |
| (3) | Returns reflect the deduction of a 2.00% redemption fee, incurred if shares were redeemed within 180 days after purchase. | |
Data presented reflect past performance. Past performance is no guarantee of future results. Current performance may be higher or lower than the performance shown. Investment return and principal value will fluctuate, and redemption value may be more or less than original cost. To obtain performance data current to the most recent month end, please call 1-800-345-2021 or visit americancentury.com. Historically, small company stocks have been more volatile than the stocks of larger, more established companies. International investing involves special risks, such as political instability and currency fluctuations. Investing in emerging markets may accentuate these risks.
Unless otherwise indicated, performance reflects Investor Class shares; performance for other share classes will vary due to differences in fee structure. For information about other share classes available, please consult the prospectus. Data assumes reinvestment of dividends and capital gains, and none of the charts reflect the deduction of taxes that a shareholder would pay on fund distributions or the redemption of fund shares. Returns for the index are provided for comparison. The fund’s total returns include operating expenses (such as transaction costs and management fees) that reduce returns, while the total returns of the index do not.
5
International Opportunities
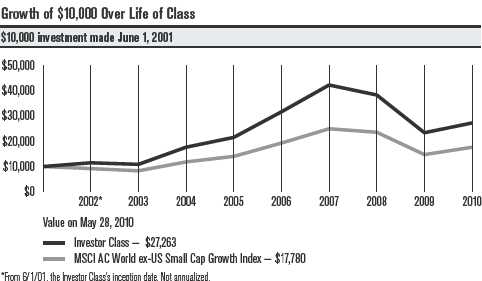
| | | | |
| Total Annual Fund Operating Expenses | | | |
| Investor Class | Institutional Class | A Class | C Class | R Class |
| 1.95% | 1.75% | 2.20% | 2.95% | 2.45% |
The total annual fund operating expenses shown is as stated in the fund’s prospectus current as of the date of this report. The prospectus may vary from the expense ratio shown elsewhere in this report because it is based on a different time period, includes acquired fund fees and expenses, and, if applicable, does not include fee waivers or expense reimbursements.
Data presented reflect past performance. Past performance is no guarantee of future results. Current performance may be higher or lower than the performance shown. Investment return and principal value will fluctuate, and redemption value may be more or less than original cost. To obtain performance data current to the most recent month end, please call 1-800-345-2021 or visit americancentury.com. Historically, small company stocks have been more volatile than the stocks of larger, more established companies. International investing involves special risks, such as political instability and currency fluctuations. Investing in emerging markets may accentuate these risks.
Unless otherwise indicated, performance reflects Investor Class shares; performance for other share classes will vary due to differences in fee structure. For information about other share classes available, please consult the prospectus. Data assumes reinvestment of dividends and capital gains, and none of the charts reflect the deduction of taxes that a shareholder would pay on fund distributions or the redemption of fund shares. Returns for the index are provided for comparison. The fund’s total returns include operating expenses (such as transaction costs and management fees) that the reduce returns, while the total returns of the index do not.
6
International Opportunities
Portfolio Managers: Mark Kopinski and Trevor Gurwich
Performance Summary
The International Opportunities portfolio returned -4.25%* for the six months ended May 28, 2010, compared with its benchmark, the MSCI All Country World ex-US Small Cap Growth Index, which returned -2.72%.
Investor confidence generally remained upbeat for the first four months of the period, as the global economic recovery appeared to gain momentum and stock prices continued to climb. But, late in the period, mounting concerns about the massive levels of sovereign debt in Greece, Spain, and other European nations put an end to the yearlong global stock market rally. Stock prices plunged, wiping out the gains achieved earlier in the period. International growth stocks fared slightly better than their value counterparts, while small-cap stocks outperformed large-cap stocks. Meanwhile, the euro tumbled sharply relative to the U.S. dollar, which added to the woes of foreign-based corporations.
The portfolio’s underperformance compared with the benchmark primarily was due to the impact of foreign currency values versus the strong U.S. dollar.
Norway, Germany Led Country Detractors
From a country perspective, Norway, Germany, and Canada were the weakest performers, as stock selection detracted from results. Our portfolio-only position in Canada’s DragonWave, a wireless network equipment producer, represented the portfolio’s largest performance detractor for the period. The company’s stock faltered in the wake of uncertainties regarding the diversification of future revenue prospects. In addition, our overweighted position in Germany’s Kloeckner & Co., a producer and distributor of steel and metal products, was the portfolio’s second-largest detractor for the period, stumbling on concern of a double dip recession due to the sovereign debt/financial crisis that started in Southern Europe.
At the opposite end of the performance spectrum, Japan, South Korea and France made the greatest positive contributions to the portfolio’s relative performance. Stock selection was strong in Japan, which finished the period as the portfolio’s largest country weighting. Our portfolio-only position in South Korea’s Mando Corporation, an auto parts manufacturer, was among the top-performing stocks for the period. The company’s initial public offering garnered widespread attention, as investors eyed the robust profit outlook for the company, which is the biggest parts supplier to fast-growing Hyundai Motor Co. and Kia Motors.
|
| *All fund returns referenced in this commentary are for Investor Class shares. Total returns for periods less than one year are not annualized and are |
| based on the period beginning December 1, 2009. |
7
International Opportunities
Industrials Stocks Lagged; Health Care Outperformed
The industrials, consumer staples, and materials sectors represented the portfolio’s weakest contributors, as negative stock selection weighed on relative performance. In the industrials sector, our overweight position in Norway’s Norwegian Air Shuttle, a low-cost Scandinavian air carrier, was among the largest detractors. The company’s stock declined due to the grounding of the company’s fleet after the Icelandic volcano disruption and rising operating expenses, including a significant jump in fuel costs.
On a positive note, strong stock selection lifted results in the health care and consumer discretionary sectors. Mexico-based Genomma Lab Internacional, a developer of over-the-counter drugs, was among the portfolio’s top contributors to relative performance. The company announced strong gains in net income and revenues, buoyed by large sales volumes in products launched within the last two years. In the consumer discretionary sector, Japan’s CyberAgent, an Internet marketing agency, soared as its Ameba Pigg online community started turning a profit, and the company predicted rising user fees and advertising revenue would drive healthy earnings growth. The company also raised its dividend and reduced its stake in netprice.com, a lower-margin online retailer.
Outlook
Global economic activity is improving, but significant headwinds remain—namely, the explosion of sovereign debt in developed nations. So far, government responses to the crisis have varied, and this lack of coordination may lead to divergent economic performance in the year ahead. Among sectors, the portfolio remains heavily exposed to technology, which should benefit from increased corporate spending, and industrials, which should benefit in the move from economic recovery to expansion. We expect further volatility throughout the international stock markets, yet we will continue to seek attractive investments in small-capitalization companies located around the world (excluding the United States).
8
| |
| International Opportunities | |
| |
| Top Ten Holdings | |
| | % of net assets as of 5/28/10 |
| Clariant AG | 2.3% |
| Disco Corp. | 2.2% |
| SXC Health Solutions Corp.* | 2.2% |
| MTU Aero Engines Holding AG | 2.2% |
| Sika AG | 2.2% |
| Zeon Corp. | 2.2% |
| FLSmidth & Co. A/S | 1.8% |
| THK Co. Ltd. | 1.7% |
| Minebea Co. Ltd. | 1.7% |
| Nabtesco Corp. | 1.7% |
| *Includes shares traded on all exchanges. | |
| |
| Types of Investments in Portfolio | |
| | % of net assets as of 5/28/10 |
| Foreign Common Stocks | 99.4% |
| Other Assets and Liabilities | 0.6% |
| |
| Investments by Country | |
| | % of net assets as of 5/28/10 |
| Japan | 16.4% |
| United Kingdom | 14.6% |
| Canada | 8.7% |
| Switzerland | 7.6% |
| South Korea | 5.3% |
| Germany | 5.1% |
| Taiwan (Republic of China) | 5.0% |
| Australia | 4.7% |
| Sweden | 3.4% |
| Denmark | 3.2% |
| India | 3.2% |
| Norway | 2.8% |
| Italy | 2.6% |
| People’s Republic of China | 2.6% |
| Bermuda | 2.0% |
| Other Countries | 12.2% |
| Other Assets and Liabilities | 0.6% |
9
|
| Shareholder Fee Example (Unaudited) |
Fund shareholders may incur two types of costs: (1) transaction costs, including sales charges (loads) on purchase payments and redemption/ exchange fees; and (2) ongoing costs, including management fees; distribution and service (12b-1) fees; and other fund expenses. This example is intended to help you understand your ongoing costs (in dollars) of investing in your fund and to compare these costs with the ongoing cost of investing in other mutual funds.
The example is based on an investment of $1,000 made at the beginning of the period and held for the entire period from December 1, 2009 to May 28, 2010 (except as noted).
Actual Expenses
The table provides information about actual account values and actual expenses for each class. You may use the information, together with the amount you invested, to estimate the expenses that you paid over the period. First, identify the share class you own. Then simply divide your account value by $1,000 (for example, an $8,600 account value divided by $1,000 = 8.6), then multiply the result by the number under the heading “Expenses Paid During Period” to estimate the expenses you paid on your account during this period.
If you hold Investor Class shares of any American Century Investments fund, or Institutional Class shares of the American Century Diversified Bond Fund, in an American Century Investments account (i.e., not a financial intermediary or retirement plan account), American Century Investments may charge you a $12.50 semiannual account maintenance fee if the value of those shares is less than $10,000. We will redeem shares automatically in one of your accounts to pay the $12.50 fee. In determining your total eligible investment amount, we will include your investments in all personal accounts (including American Century Investments Brokerage accounts) registered under your Social Security number. Personal accounts include individual accounts, joint accounts, UGMA/UTMA accounts, personal trusts, Coverdell Education Savings Accounts and IRAs (including traditional, Roth, Rollover, SEP-, SARSEP- and SIMPLE-IRAs), and certain other retirement accounts. If you have only business, business retirement, employer-sponsored or American Century Investments Brokerage accounts, you are currently not subject to this fee. We will not charge the fee as long as you choose to manage your accounts exclusively online. If you are subject to the Account Maintenance Fee, your account value could be reduced by the fee amount.
10
Hypothetical Example for Comparison Purposes
The table also provides information about hypothetical account values and hypothetical expenses based on the actual expense ratio of each class of your fund and an assumed rate of return of 5% per year before expenses, which is not the actual return of a fund’s share class. The hypothetical account values and expenses may not be used to estimate the actual ending account balance or expenses you paid for the period. You may use this information to compare the ongoing costs of investing in your fund and other funds. To do so, compare this 5% hypothetical example with the 5% hypothetical examples that appear in the shareholder reports of the other funds.
Please note that the expenses shown in the table are meant to highlight your ongoing costs only and do not reflect any transactional costs, such as sales charges (loads) or redemption/exchange fees. Therefore, the table is useful in comparing ongoing costs only, and will not help you determine the relative total costs of owning different funds. In addition, if these transactional costs were included, your costs would have been higher.
| | | | | |
| | | Beginning | Ending | Expenses Paid | |
| | | Account Value | Account Value | During Period(1) | Annualized |
| | | 12/1/09 | 5/28/10 | 12/1/09 – 5/28/10 | Expense Ratio(1) |
| Actual | | | | |
| Investor Class | $1,000 | $957.50 | $9.17 | 1.91% |
| Institutional Class | $1,000 | $958.10 | $8.21 | 1.71% |
| A Class | $1,000 | $944.20(2) | $5.06(3) | 2.16% |
| C Class | $1,000 | $941.90(2) | $6.81(3) | 2.91% |
| R Class | $1,000 | $943.70(2) | $5.65(3) | 2.41% |
| Hypothetical | | | | |
| Investor Class | $1,000 | $1,015.15 | $9.44 | 1.91% |
| Institutional Class | $1,000 | $1,016.13 | $8.45 | 1.71% |
| A Class | $1,000 | $1,013.93(4) | $10.67(4) | 2.16% |
| C Class | $1,000 | $1,010.25(4) | $14.34(4) | 2.91% |
| R Class | $1,000 | $1,012.70(4) | $11.89(4) | 2.41% |
| (1) | Expenses are equal to the class’s annualized expense ratio listed in the table above, multiplied by the average account value over the period, |
| | multiplied by 179, the number of days in the most recent fiscal half-year, divided by 365, to reflect the one-half year period. |
| (2) | Ending account value based on actual return from March 1, 2010 (commencement of sale) through May 28, 2010. | |
| (3) | Expenses are equal to the class’s annualized expense ratio listed in the table above, multiplied by the average account value over the period, |
| | multiplied by 88, the number of days in the period from March 1, 2010 (commencement of sale) through May 28, 2010, divided by 365, to |
| | reflect the period. Had the class been available for the full period, the expenses paid during the period would have been higher. |
| (4) | Ending account value and expenses paid during period assumes the class had been available throughout the entire period and are calculated |
| | using the class’s annualized expense ratio listed in the table above. | | |
11
| | | | | | |
| International Opportunities | | | | |
| |
| MAY 28, 2010 (UNAUDITED) | | | | | | |
| | Shares | Value | | | Shares | Value |
| Common Stocks — 99.4% | | | MTU Aero Engines | | |
| | | | | Holding AG | 36,688 | $ 1,963,283 |
| AUSTRALIA — 4.7% | | | | Rheinmetall AG | 23,153 | 1,313,600 |
| Ansell Ltd. | 70,413 | $ 741,916 | | | | 4,528,776 |
| Bradken Ltd. | 145,259 | 900,491 | | HONG KONG — 1.5% | | |
| Macarthur Coal Ltd. | 20,362 | 195,443 | | Daphne International | | |
| Mount Gibson Iron Ltd.(1) | 299,562 | 374,193 | | Holdings Ltd. | 858,000 | 829,578 |
| PanAust Ltd.(1) | 1,687,615 | 673,051 | | Minth Group Ltd. | 360,000 | 468,309 |
| Seek Ltd. | 203,378 | 1,272,402 | | | | 1,297,887 |
| | | 4,157,496 | | INDIA — 3.2% | | |
| BELGIUM — 0.7% | | | | Apollo Tyres Ltd. | 309,952 | 464,724 |
| Telenet Group Holding NV(1) | 24,878 | 639,488 | | Core Projects & | | |
| BERMUDA — 2.0% | | | | Technologies Ltd. | 129,023 | 632,853 |
| Golden Ocean Group Ltd.(1) | 409,857 | 634,141 | | Glenmark | | |
| | | | | Pharmaceuticals Ltd. | 83,186 | 481,028 |
| Signet Jewelers Ltd.(1) | 37,922 | 1,171,773 | | | | |
| | | | | IRB Infrastructure | | |
| | | 1,805,914 | | Developers Ltd. | 110,950 | 618,821 |
| CANADA — 8.7% | | | | S. Kumars Nationwide Ltd.(1) | 390,342 | 631,510 |
| Consolidated Thompson Iron | | | | | | 2,828,936 |
| Mines Ltd.(1) | 72,283 | 559,774 | | | | |
| | | | | INDONESIA — 1.4% | | |
| Detour Gold Corp.(1) | 34,460 | 735,107 | | | | |
| | | | | PT Holcim Indonesia Tbk(1) | 3,002,500 | 659,658 |
| Gran Tierra Energy, Inc.(1) | 81,373 | 429,650 | | | | |
| | | | | PT Perusahaan | | |
| Grande Cache Coal Corp.(1) | 83,195 | 453,762 | | Perkebunan London | | |
| Home Capital Group, Inc. | 16,342 | 683,401 | | Sumatra Indonesia Tbk(1) | 663,000 | 568,304 |
| Imax Corp.(1) | 36,821 | 624,116 | | | | 1,227,962 |
| Quadra FNX Mining Ltd.(1) | 44,458 | 599,026 | | ISRAEL — 1.4% | | |
| Red Back Mining, Inc.(1) | 20,639 | 526,565 | | Mellanox Technologies Ltd.(1) | 52,560 | 1,222,020 |
| SXC Health | | | | ITALY — 2.6% | | |
| Solutions Corp.(1) | 21,997 | 1,636,607 | | Amplifon SpA | 145,496 | 643,963 |
| SXC Health Solutions Corp. | | | | DiaSorin SpA | 18,951 | 699,166 |
| (NASDAQ)(1) | 4,716 | 346,909 | | | | |
| | | | | Safilo Group SpA(1) | 64,714 | 605,031 |
| Toromont Industries Ltd. | 16,554 | 404,255 | | Trevi Finanziaria SpA | 25,224 | 379,059 |
| Ventana Gold Corp.(1) | 66,748 | 656,444 | | | | 2,327,219 |
| | | 7,655,616 | | JAPAN — 16.4% | | |
| DENMARK — 3.2% | | | | Disco Corp. | 29,600 | 1,986,721 |
| FLSmidth & Co. A/S | 25,875 | 1,605,503 | | Hitachi Kokusai Electric, Inc. | 106,000 | 974,182 |
| GN Store Nord(1) | 164,897 | 1,263,898 | | Horiba Ltd. | 45,800 | 1,259,427 |
| | | 2,869,401 | | Minebea Co. Ltd. | 267,000 | 1,501,124 |
| FRANCE — 1.3% | | | | MISUMI Group, Inc. | 25,100 | 467,475 |
| Alten Ltd.(1) | 17,008 | 440,191 | | Monex Group, Inc. | 1,211 | 500,669 |
| Havas SA | 160,723 | 717,994 | | Mori Seiki Co. Ltd. | 85,500 | 872,308 |
| | | 1,158,185 | | Nabtesco Corp. | 111,000 | 1,470,068 |
| GERMANY — 5.1% | | | | Nifco, Inc. | 40,200 | 829,281 |
| Aixtron AG | 15,031 | 405,622 | | Pioneer Corp.(1) | 198,000 | 730,131 |
| Asian Bamboo AG | 11,277 | 432,853 | | THK Co. Ltd. | 75,100 | 1,526,647 |
| Kloeckner & Co. SE(1) | 21,903 | 413,418 | | | | |
12
International Opportunities
| | | | | | |
| | Shares | Value | | | Shares | Value |
| Toyo Ink | | | | SWEDEN — 3.4% | | |
| Manufacturing Co. Ltd. | 116,000 | $ 422,676 | | Autoliv, Inc. SDR(1) | 9,552 | $ 459,777 |
| Zeon Corp. | 336,000 | 1,922,067 | | Axis Communications AB | 63,295 | 898,801 |
| | | 14,462,776 | | Haldex AB(1) | 74,528 | 689,328 |
| LUXEMBOURG — 0.7% | | | | Kinnevik Investment AB | | |
| L’Occitane International SA(1) | 323,600 | 658,212 | | B Shares | 60,359 | 943,663 |
| MALAYSIA — 0.7% | | | | | | 2,991,569 |
| Top Glove Corp. Bhd | 157,500 | 586,757 | | SWITZERLAND — 7.6% | | |
| MEXICO — 1.9% | | | | Bank Sarasin & Cie AG, | | |
| Banco Compartamos | | | | Class B | 12,298 | 431,416 |
| SA de CV | 133,400 | 675,206 | | Clariant AG(1) | 176,196 | 2,049,144 |
| Genomma Lab Internacional | | | | Panalpina Welttransport | | |
| SA de CV, Class B(1) | 313,244 | 997,446 | | Holding AG(1) | 10,792 | 805,511 |
| | | 1,672,652 | | Petroplus Holdings AG(1) | 33,249 | 476,988 |
| NETHERLANDS — 1.1% | | | | Rieter Holding AG(1) | 4,298 | 1,030,990 |
| Aalberts Industries NV | 79,430 | 978,432 | | Sika AG | 1,247 | 1,932,023 |
| NORWAY — 2.8% | | | | | | 6,726,072 |
| Norwegian Air Shuttle AS(1) | 37,752 | 682,636 | | TAIWAN (REPUBLIC OF CHINA) — 5.0% | |
| Petroleum | | | | Macronix International | 841,000 | 540,094 |
| Geo-Services ASA(1) | 80,351 | 812,299 | | | | |
| | | | | Ralink Technology Corp. | 271,000 | 1,209,534 |
| Storebrand ASA(1) | 123,844 | 667,763 | | | | |
| | | | | St. Shine Optical Co. Ltd. | 71,000 | 498,499 |
| TGS Nopec | | | | Tripod Technology Corp. | 203,000 | 737,083 |
| Geophysical Co. ASA(1) | 20,718 | 280,662 | | | | |
| | | 2,443,360 | | Wistron NeWeb Corp. | 341,000 | 619,572 |
| PEOPLE’S REPUBLIC OF CHINA — 2.6% | | | WPG Holdings Co. Ltd. | 444,000 | 850,419 |
| China Lilang Ltd. | 435,000 | 450,574 | | | | 4,455,201 |
| Peak Sport Products Co. Ltd. | 1,001,000 | 749,295 | | UNITED KINGDOM — 14.6% | | |
| | | | | Acergy SA(1) | 62,086 | 939,411 |
| Shenguan Holdings | | | | | | |
| Group Ltd. | 718,000 | 629,153 | | ARM Holdings plc | 263,438 | 940,595 |
| Xingda International | | | | Ashtead Group plc | 334,160 | 509,857 |
| Holdings Ltd. | 748,000 | 427,091 | | Barratt Developments plc(1) | 268,433 | 417,212 |
| | | 2,256,113 | | Britvic plc | 138,912 | 923,779 |
| SOUTH AFRICA — 1.3% | | | | Chemring Group plc | 28,772 | 1,316,846 |
| Aquarius Platinum Ltd. | 91,380 | 495,633 | | Connaught plc | 122,193 | 562,935 |
| Northam Platinum Ltd. | 109,613 | 674,730 | | Cookson Group plc(1) | 152,789 | 1,044,920 |
| | | 1,170,363 | | Dimension Data Holdings plc | 743,598 | 1,090,548 |
| SOUTH KOREA — 5.3% | | | | Heritage Oil plc(1) | 73,737 | 462,936 |
| CJ CGV Co. Ltd. | 11,770 | 232,154 | | International Personal | | |
| Daum | | | | Finance plc | 188,301 | 596,603 |
| Communications Corp.(1) | 14,019 | 854,249 | | Micro Focus | | |
| Eugene Technology Co. Ltd. | 53,659 | 689,264 | | International plc | 95,162 | 653,077 |
| Hotel Shilla Co. Ltd. | 35,980 | 618,009 | | Millennium & Copthorne | | |
| Lumens Co. Ltd.(1) | 70,366 | 753,608 | | Hotels plc | 107,923 | 643,563 |
| Mando Corp.(1) | 10,100 | 1,065,249 | | Premier Oil plc(1) | 39,979 | 672,405 |
| Melfas, Inc.(1) | 10,387 | 495,914 | | Rightmove plc | 62,064 | 624,376 |
| | | 4,708,447 | | Spectris plc | 48,208 | 571,095 |
| SPAIN — 0.2% | | | | SSL International plc | 39,078 | 455,829 |
| Construcciones y Auxiliar de | | | | Telecity Group plc(1) | 82,299 | 454,936 |
| Ferrocarriles SA | 489 | 204,349 | | | | 12,880,923 |
13
| | | | |
| International Opportunities | | | |
| |
| | Value | | Market Sector Diversification | |
| TOTAL INVESTMENT | | | (as a % of net assets) | |
| SECURITIES — 99.4% | | | Industrials | 25.0% |
| (Cost $84,656,751) | $87,914,126 | | Information Technology | 20.7% |
| OTHER ASSETS | | | | |
| AND LIABILITIES — 0.6% | 499,606 | | Consumer Discretionary | 15.9% |
| TOTAL NET ASSETS — 100.0% | $88,413,732 | | Materials | 15.1% |
| | | | Health Care | 9.4% |
| | | | Financials | 5.1% |
| | | | Energy | 4.6% |
| | | | Consumer Staples | 2.9% |
| | | | Telecommunication Services | 0.7% |
| | | | Other Assets and Liabilities | 0.6% |
| |
| |
| |
| Notes to Schedule of Investments | | | |
| SDR = Swedish Depositary Receipt | | | | |
| (1) Non-income producing. | | | | |
| |
| |
| See Notes to Financial Statements. | | | | |
14
|
| Statement of Assets and Liabilities |
| | | | |
| MAY 28, 2010 (UNAUDITED) | | | | |
| Assets | | | | |
| Investment securities, at value (cost of $84,656,751) | | | $87,914,126 |
| Foreign currency holdings, at value (cost of $510,681) | | | 510,641 |
| Receivable for investments sold | | | | 1,638,271 |
| Receivable for capital shares sold | | | | 12,006 |
| Dividends and interest receivable | | | | 162,365 |
| | | | | 90,237,409 |
| | | | | |
| Liabilities | | | | |
| Disbursements in excess of demand deposit cash | | | 101,275 |
| Payable for investments purchased | | | | 1,565,159 |
| Payable for capital shares redeemed | | | | 8,290 |
| Accrued management fees | | | | 136,408 |
| Service fees (and distribution fees — A Class and R Class) payable | | | 26 |
| Distribution fees payable | | | | 14 |
| Accrued foreign taxes | | | | 12,505 |
| | | | | 1,823,677 |
| | | | | |
| Net Assets | | | | $88,413,732 |
| | | | | |
| Net Assets Consist of: | | | | |
| Capital (par value and paid-in surplus) | | | | $124,590,433 |
| Accumulated net investment loss | | | | (1,776,198) |
| Accumulated net realized loss on investment and foreign currency transactions | | (37,658,035) |
| Net unrealized appreciation on investments and translation of assets and liabilities in foreign currencies | 3,257,532 |
| | | | | $ 88,413,732 |
| |
| | Net assets | Shares outstanding | Net asset value per share |
| Investor Class, $0.01 Par Value | $88,270,493 | 17,100,746 | | $5.16 |
| Institutional Class, $0.01 Par Value | $32,087 | 6,179 | | $5.19 |
| A Class, $0.01 Par Value | $64,000 | 12,383 | | $5.17* |
| C Class, $0.01 Par Value | $23,562 | 4,537 | | $5.19 |
| R Class, $0.01 Par Value | $23,590 | 4,554 | | $5.18 |
| *Maximum offering price $5.49 (net asset value divided by 0.9425) | | | |
| |
| |
| See Notes to Financial Statements. | | | | |
15
| |
| FOR THE SIX MONTHS ENDED MAY 28, 2010 (UNAUDITED) | |
| Investment Income (Loss) | |
| Income: | |
| Dividends (net of foreign taxes withheld of $43,944) | $ 512,622 |
| Interest | 423 |
| | 513,045 |
| | |
| Expenses: | |
| Management fees | 915,657 |
| Distribution fees — C Class | 47 |
| Service fees — C Class | 16 |
| Distribution and service fees: | |
| A Class | 24 |
| R Class | 31 |
| Directors’ fees and expenses | 1,369 |
| Other expenses | 1,570 |
| | 918,714 |
| | |
| Net investment income (loss) | (405,669) |
| | |
| Realized and Unrealized Gain (Loss) | |
| Net realized gain (loss) on: | |
| Investment transactions (net of foreign tax expenses paid (refunded)of $92,075) | 12,645,373 |
| Foreign currency transactions | (820,717) |
| | 11,824,656 |
| | |
| Change in net unrealized appreciation (depreciation) on: | |
| Investments (net of deferred foreign taxes of $(57,527)) | (9,248,860) |
| Translation of assets and liabilities in foreign currencies | (6,359,510) |
| | (15,608,370) |
| | |
| Net realized and unrealized gain (loss) | (3,783,714) |
| | |
| Net Increase (Decrease) in Net Assets Resulting from Operations | $ (4,189,383) |
| |
| |
| See Notes to Financial Statements. | |
16
|
| Statement of Changes in Net Assets |
| | |
| SIX MONTHS ENDED MAY 28, 2010 (UNAUDITED) AND YEAR ENDED NOVEMBER 30, 2009 | |
| Increase (Decrease) in Net Assets | 2010 | 2009 |
| Operations | | |
| Net investment income (loss) | $ (405,669) | $ (369,299) |
| Net realized gain (loss) | 11,824,656 | (1,646,634) |
| Change in net unrealized appreciation (depreciation) | (15,608,370) | 30,801,570 |
| Net increase (decrease) in net assets resulting from operations | (4,189,383) | 28,785,637 |
| | | |
| Distributions to Shareholders | | |
| From net investment income: | | |
| Investor Class | (1,832,216) | — |
| Institutional Class | (787) | — |
| A Class | (169) | — |
| R Class | (100) | — |
| Decrease in net assets from distributions | (1,833,272) | — |
| | | |
| Capital Share Transactions | | |
| Net increase (decrease) in net assets from capital share transactions | 1,407,872 | (2,579,078) |
| | | |
| Redemption Fees | | |
| Increase in net assets from redemption fees | 27,123 | 8,832 |
| | | |
| Net increase (decrease) in net assets | (4,587,660) | 26,215,391 |
| | | |
| Net Assets | | |
| Beginning of period | 93,001,392 | 66,786,001 |
| End of period | $ 88,413,732 | $93,001,392 |
| | | |
| Accumulated undistributed net investment income (loss) | $(1,776,198) | $462,743 |
| |
| |
| See Notes to Financial Statements. | | |
17
|
| Notes to Financial Statements |
MAY 28, 2010 (UNAUDITED)
1. Organization and Summary of Significant Accounting Policies
Organization — American Century World Mutual Funds, Inc. (the corporation) is registered under the Investment Company Act of 1940 (the 1940 Act) as an open-end management investment company. International Opportunities Fund (the fund) is one fund in a series issued by the corporation. The fund is diversified under the 1940 Act. The fund’s investment objective is to seek capital growth. The fund pursues its objective by investing primarily in equity securities of issuers in developed or emerging market countries that are small-sized companies at the time of purchase. The following is a summary of the fund’s significant accounting policies.
Multiple Class — The fund is authorized to issue the Investor Class, the Institutional Class, the A Class, the C Class and the R Class. The A Class may incur an initial sales charge. The A Class and the C Class may be subject to a contingent deferred sales charge. The share classes differ principally in their respective sales charges and distribution and shareholder servicing expenses and arrangements. All shares of the fund represent an equal pro rata interest in the net assets of the class to which such shares belong, and have identical voting, dividend, liquidation and other rights and the same terms and conditions, except for class specific expenses and exclusive rights to vote on matters affecting only individual classes. Income, non-class specific expenses, and realized and unrealized capital gains and losses of the fun d are allocated to each class of shares based on their relative net assets. Sale of the A Class, C Class and R Class commenced on March 1, 2010.
Security Valuations — Securities traded primarily on a principal securities exchange are valued at the last reported sales price, or at the mean of the latest bid and asked prices where no last sales price is available. Depending on local convention or regulation, securities traded over-the-counter are valued at the mean of the latest bid and asked prices, the last sales price, or the official close price. Investments in open-end management investment companies are valued at the reported net asset value. Discount notes may be valued through a commercial pricing service or at amortized cost, which approximates fair value. Securities traded on foreign securities exchanges and over-the-counter markets are normally completed before the close of business on days that the New York Stock Exchange (the Exchange) is open and may also take place on days when the Exchange is not open. If an event occurs after the value of a security was established but before the net asset value per share was determined that was likely to materially change the net asset value, that security would be valued as determined in accordance with procedures adopted by the Board of Directors. If the fund determines that the market price of a portfolio security is not readily available, or that the valuation methods mentioned above do not reflect the security’s fair value, such security is valued as determined by the Board of Directors or its designee, in accordance with procedures adopted by the Board of Directors, if such determination would materially impact a fund’s net asset value. Certain other circumstances may cause the fund to use alternative procedures to value a security such as: a security has been declared in default; trading in a security has been halted during the trading day; or there is a foreign market holiday and no trading will commence .
Security Transactions — For financial reporting purposes, security transactions are accounted for as of the trade date. Net realized gains and losses are determined on the identified cost basis, which is also used for federal income tax purposes. Certain countries impose taxes on realized gains on the sale of securities registered in their country. The fund records the foreign tax expense, if any, on an accrual basis. The foreign tax expense on realized gains and unrealized appreciation reduces the net realized gain (loss) on investment transactions and net unrealized appreciation (depreciation) on investments, respectively.
Investment Income — Dividend income less foreign taxes withheld, if any, is recorded as of the ex-dividend date. Interest income is recorded on the accrual basis and includes accretion of discounts and amortization of premiums.
18
Foreign Currency Translations — All assets and liabilities initially expressed in foreign currencies are translated into U.S. dollars at prevailing exchange rates at period end. The fund may enter into spot foreign currency exchange contracts to facilitate transactions denominated in a foreign currency. Purchases and sales of investment securities, dividend and interest income, spot foreign currency exchange contracts, and certain expenses are translated at the rates of exchange prevailing on the respective dates of such transactions. Realized and unrealized gains and losses from foreign currency translations arise from changes in currency exchange rates.
Net realized and unrealized foreign currency exchange gains or losses occurring during the holding period of investment securities are a component of net realized gain (loss) on foreign currency transactions and net unrealized appreciation (depreciation) on translation of assets and liabilities in foreign currencies, respectively. Certain countries may impose taxes on the contract amount of purchases and sales of foreign currency contracts in their currency. The fund records the foreign tax expense, if any, as a reduction to the net realized gain (loss) on foreign currency transactions.
Repurchase Agreements — The fund may enter into repurchase agreements with institutions that American Century Investment Management, Inc. (ACIM) has determined are creditworthy pursuant to criteria adopted by the Board of Directors. Each repurchase agreement is recorded at cost. The fund requires that the collateral, represented by securities, received in a repurchase transaction be transferred to the custodian in a manner sufficient to enable the fund to obtain those securities in the event of a default under the repurchase agreement. ACIM monitors, on a daily basis, the securities transferred to ensure the value, including accrued interest, of the securities under each repurchase agreement is equal to or greater than amounts owed to the fund under each repurchase agreement.
Joint Trading Account — Pursuant to an Exemptive Order issued by the Securities and Exchange Commission, the fund, along with certain other funds in the American Century Investments family of funds, may transfer uninvested cash balances into a joint trading account. These balances are invested in one or more repurchase agreements that are collateralized by U.S. Treasury or Agency obligations.
Income Tax Status — It is the fund’s policy to distribute substantially all net investment income and net realized gains to shareholders and to otherwise qualify as a regulated investment company under provisions of the Internal Revenue Code. The fund is no longer subject to examination by tax authorities for years prior to 2006. Additionally, non-U.S. tax returns filed by the fund due to investments in certain foreign securities remain subject to examination by the relevant taxing authority for 7 years from the date of filing. At this time, management believes there are no uncertain tax positions which, based on their technical merit, would not be sustained upon examination and for which it is reasonably possible that the total amounts of unrecognized tax benefits will significantly change in the next twelve months. Accordingly, no provision has been made for federal or state income taxes.
Distributions to Shareholders — Distributions to shareholders are recorded on the ex-dividend date. Distributions from net investment income, if any, are generally declared and paid annually. Distributions from net realized gains, if any, are generally declared and paid twice per year. The fund may make distributions on a more frequent basis to comply with the distribution requirements of the Internal Revenue Code, in all events in a manner consistent with provisions of the 1940 Act.
Redemption — The fund may impose a 2.00% redemption fee on shares held less than 180 days. The fee may not be applicable to all classes. The redemption fee is retained by the fund and helps cover transaction costs that long-term investors may bear when the fund sells securities to meet investor redemptions.
19
Indemnifications — Under the corporation’s organizational documents, its officers and directors are indemnified against certain liabilities arising out of the performance of their duties to the fund. In addition, in the normal course of business, the fund enters into contracts that provide general indemnifications. The maximum exposure under these arrangements is unknown as this would involve future claims that may be made against a fund. The risk of material loss from such claims is considered by management to be remote.
Use of Estimates — The financial statements are prepared in conformity with accounting principles generally accepted in the United States of America, which may require management to make certain estimates and assumptions at the date of the financial statements. Actual results could differ from these estimates.
Subsequent Events — In preparing the financial statements, management evaluated the impact of events or transactions occurring through the date the financial statements were issued that would merit recognition or disclosure.
2. Fees and Transactions with Related Parties
Management Fees — The corporation has entered into a Management Agreement with American Century Global Investment Management, Inc. (ACGIM) (the investment advisor) (see Note 9), under which ACGIM provides the fund with investment advisory and management services in exchange for a single, unified management fee (the fee) per class. The Agreement provides that all expenses of managing and operating the fund, except brokerage expenses, taxes, interest, fees and expenses of the independent directors (including legal counsel fees), and extraordinary expenses, will be paid by ACGIM. The fee is computed and accrued daily based on the daily net assets of the specific class of shares of the fund and paid monthly in arrears. For funds with a stepped fee schedule, the rate of the fee is determined by applying a fee rate calculation formula. This formula takes into account the fund’s assets as well as certain assets, if any, of other clients of the investment advisor outside the American Century Investments family of funds (such as subadvised funds and separate accounts) that have very similar investment teams and investment strategies (strategy assets). The annual management fee schedule ranges from 1.60% to 2.00% for the Investor Class, A Class, C Class and R Class. The Institutional Class is 0.20% less at each point within the range. The effective annual management fee for each class for the six months ended May 28, 2010 was 1.90% for the Investor Class, A Class, C Class and R Class and 1.70% for the Institutional Class.
ACGIM has entered into a Subadvisory Agreement with ACIM (the subadvisor) on behalf of the fund. The subadvisor makes investment decisions for the cash portion of the fund in accordance with the fund’s investment objectives, policies and restrictions under the supervision of ACGIM and the Board of Directors. ACGIM pays all costs associated with retaining ACIM as the subadvisor of the fund.
Distribution and Service Fees — The Board of Directors has adopted a separate Master Distribution and Individual Shareholder Services Plan for each of the A Class, C Class and R Class (collectively the plans), pursuant to Rule 12b-1 of the 1940 Act. The plans provide that the A Class will pay American Century Investment Services, Inc. (ACIS) an annual distribution and service fee of 0.25%. The plans provide that the C Class will pay ACIS an annual distribution fee of 0.75% and service fee of 0.25%. The plans provide that the R Class will pay ACIS an annual distribution and service fee of 0.50%. The fees are computed and accrued daily based on each class’s daily net assets and paid monthly in arrears. The fees are used to pay financial intermediaries for distribution and individual shareholder services. Fees incurred under the plans during the six months ended May 28, 2010, are detailed in the Statement of Operations.
20
Related Parties — Certain officers and directors of the corporation are also officers and/or directors of American Century Companies, Inc. (ACC), the parent of the corporation’s investment advisor, ACGIM, the corporation’s subadvisor, ACIM, the distributor of the corporation, ACIS, and the corporation’s transfer agent, American Century Services, LLC.
The fund is eligible to invest in a money market fund for temporary purposes, which is managed by J.P. Morgan Investment Management, Inc. (JPMIM). The fund has a Mutual Funds Services Agreement with J.P. Morgan Investor Services Co. (JPMIS) and a securities lending agreement with JPMorgan Chase Bank (JPMCB). JPMCB is a custodian of the fund. JPMIM, JPMIS and JPMCB are wholly owned subsidiaries of JPMorgan Chase & Co. (JPM). JPM is an equity investor in ACC.
3. Investment Transactions
Purchases and sales of investment securities, excluding short-term investments, for the six months ended May 28, 2010, were $104,720,844 and $105,226,148, respectively.
| | | | |
| 4. Capital Share Transactions | | | | |
| |
| Transactions in shares of the fund were as follows: | | |
| | Six months ended May 28, 2010(1) | Year ended November 30, 2009 |
| | Shares | Amount | Shares | Amount |
| Investor Class/Shares Authorized | 100,000,000 | | 100,000,000 | |
| Sold | 1,900,141 | $ 10,886,748 | 2,878,583 | $ 13,930,223 |
| Issued in reinvestment of distributions | 314,167 | 1,791,301 | — | — |
| Redeemed | (2,035,056) | (11,391,196) | (3,685,056) | (15,251,912) |
| | 179,252 | 1,286,853 | (806,473) | (1,321,689) |
| Institutional Class/Shares Authorized | 10,000,000 | | 10,000,000 | |
| Issued in reinvestment of distributions | 137 | 787 | — | — |
| Redeemed | — | — | (328,394) | (1,257,389) |
| | 137 | 787 | (328,394) | (1,257,389) |
| A Class/Shares Authorized | 10,000,000 | | N/A | |
| Sold | 12,354 | 69,963 | | |
| Issued in reinvestment of distributions | 29 | 169 | | |
| | 12,383 | 70,132 | | |
| C Class/Shares Authorized | 10,000,000 | | N/A | |
| Sold | 4,537 | 25,000 | | |
| R Class/Shares Authorized | 10,000,000 | | N/A | |
| Sold | 4,537 | 25,000 | | |
| Issued in reinvestment of distributions | 17 | 100 | | |
| | 4,554 | 25,100 | | |
| Net increase (decrease) | 200,863 | $ 1,407,872 | (1,134,867) | $ (2,579,078) |
| (1) March 1, 2010 (commencement of sale) through May 28, 2010 for the A Class, C Class and R Class. | |
21
5. Fair Value Measurements
The fund’s securities valuation process is based on several considerations and may use multiple inputs to determine the fair value of the positions held by the fund. In conformity with accounting principles generally accepted in the United States of America, the inputs used to determine a valuation are classified into three broad levels as follows:
• Level 1 valuation inputs consist of unadjusted quoted prices in an active market for identical securities;
• Level 2 valuation inputs consist of significant direct or indirect observable market data (including quoted prices for similar securities, evaluations of subsequent market events, interest rates, prepayment speeds, credit risk, etc.); or
• Level 3 valuation inputs consist of significant unobservable inputs (including a fund’s own assumptions).
The level classification is based on the lowest level input that is significant to the fair valuation measurement. The valuation inputs are not an indication of the risks associated with investing in these securities or other financial instruments.
The following is a summary of the valuation inputs used to determine the fair value of the fund’s securities as of May 28, 2010. The Schedule of Investments provides additional details on the fund’s portfolio holdings.
| | | |
| | Level 1 | Level 2 | Level 3 |
| Investment Securities | | | |
| Foreign Common Stocks | $2,622,695 | $85,291,431 | — |
6. Risk Factors
There are certain risks involved in investing in foreign securities. These risks include those resulting from future adverse political, social, and economic developments, fluctuations in currency exchange rates, the possible imposition of exchange controls, and other foreign laws or restrictions. Investing in emerging markets may accentuate these risks.
The fund concentrates its investments in common stocks of smaller companies. Because of this, the fund may be subject to greater risk and market fluctuations than a fund investing in larger, more established companies.
7. Interfund Lending
The fund, along with certain other funds in the American Century Investments family of funds, may participate in an interfund lending program, pursuant to an Exemptive Order issued by the Securities and Exchange Commission (SEC). This program provides an alternative credit facility allowing the fund to borrow from or lend to other funds in the American Century Investments family of funds that permit such transactions. Interfund lending transactions are subject to each fund’s investment policies and borrowing and lending limits. The interfund loan rate earned/paid on interfund lending transactions is determined daily based on the average of certain current market rates. Interfund lending transactions normally extend only overnight, but can have a maximum duration of seven days. The program is subject to annual approval by the Board of Directors. During the six months ended May 28, 2010, the fund did not utiliz e the program.
22
8. Federal Tax Information
The book-basis character of distributions made during the year from net investment income or net realized gains may differ from their ultimate characterization for federal income tax purposes. These differences reflect the differing character of certain income items and net realized gains and losses for financial statement and tax purposes, and may result in reclassification among certain capital accounts on the financial statements.
As of May 28, 2010, the components of investments for federal income tax purposes were as follows:
| | |
| Federal tax cost of investments | $86,458,488 |
| Gross tax appreciation of investments | $ 7,055,969 |
| Gross tax depreciation of investments | (5,600,331) |
| Net tax appreciation (depreciation) of investments | $ 1,455,638 |
The difference between book-basis and tax-basis cost and unrealized appreciation (depreciation) is attributable primarily to the tax deferral of losses on wash sales and on investments in passive foreign investment companies.
As of November 30, 2009, the fund had accumulated capital losses of $(48,805,521), which represent net capital loss carryovers that may be used to offset future realized capital gains for federal income tax purposes. Future capital loss carryover utilization in any given year may be subject to Internal Revenue Code limitations. Capital loss carryovers of $(37,030,164) and $(11,775,357) expire in 2016 and 2017, respectively.
9. Corporate Event
As part of a long-standing estate and business succession plan established by ACC Co-Chairman James E. Stowers, Jr., the founder of American Century Investments, ACC Co-Chairman Richard W. Brown succeeded Mr. Stowers as trustee of a trust that holds a greater-than-25% voting interest in ACC, the parent corporation of the fund’s advisors. Under the 1940 Act, this is presumed to represent control of ACC even though it is less than a majority interest. The change of trustee may technically be considered a “change of control” of ACC and therefore also a change of control of the fund’s advisors even though there has been no change to their management and none is anticipated. The “change of control” resulted in the assignment of the fund’s investment advisory and subadvisory agreements. Under the 1940 Act, an assignment automatically terminated such agreements, making the approval of a new agreement necessary.
On February 16, 2010, the Board of Directors approved interim investment advisory and subadvisory agreements under which the fund will be managed until a new agreement is approved by fund shareholders. The interim agreements are substantially identical to the terminated agreements (with the exception of different effective and termination dates) and will not result in changes in the management of American Century Investments, the fund, its investment objectives, fees or services provided. On March 29, 2010, the Board of Directors approved a new investment advisory agreement. The new agreement is also substantially identical to the terminated agreement (except for the date, the substitution of ACIM for ACGIM and certain other non-material changes). In order to streamline American Century’s corporate organization, ACGIM was merged into ACIM on July 16, 2010. The new agreement for the fund was approved by shareh olders at a Special Meeting of Shareholders on June 16, 2010. The new agreement went into effect on July 16, 2010. Management agreements for new share classes of the funds that were launched after February 16, 2010 did not terminate, have not been replaced by interim agreements, and do not require approval of new agreements.
23
| | | | | | | |
| International Opportunities | | | | |
| |
| Investor Class | | | | | | |
| For a Share Outstanding Throughout the Years Ended November 30 (except as noted) | | |
| | | 2010(1) | 2009 | 2008 | 2007 | 2006 | 2005 |
| Per-Share Data | | | | | | |
| Net Asset Value, | | | | | | |
| Beginning of Period | $5.49 | $3.70 | $11.37 | $11.79 | $12.27 | $9.35 |
| Income From | | | | | | |
| Investment Operations | | | | | | |
| Net Investment | | | | | | |
| Income (Loss)(2) | (0.02) | (0.02) | 0.05 | 0.02 | (0.01) | 0.02 |
| Net Realized and | | | | | | |
| Unrealized Gain (Loss) | (0.20) | 1.81 | (5.06) | 2.94 | 2.53 | 3.19 |
| Total From | | | | | | |
| Investment Operations | (0.22) | 1.79 | (5.01) | 2.96 | 2.52 | 3.21 |
| Distributions | | | | | | |
| From Net | | | | | | |
| Investment Income | (0.11) | — | (0.05) | —(3) | (0.01) | — |
| From Net | | | | | | |
| Realized Gains | — | — | (2.61) | (3.38) | (2.99) | (0.29) |
| Total Distributions | (0.11) | — | (2.66) | (3.38) | (3.00) | (0.29) |
| Net Asset Value, | | | | | | |
| End of Period | $5.16 | $5.49 | $3.70 | $11.37 | $11.79 | $12.27 |
| |
| Total Return(4) | (4.25)% | 48.38% | (56.46)% | 33.73% | 25.37% | 35.28% |
| | | | | | | |
| Ratios/Supplemental Data | | | | | | |
| Ratio of Operating | | | | | | |
| Expenses to | | | | | | |
| Average Net Assets | 1.91%(5) | 1.95% | 1.87% | 1.81% | 1.85% | 1.91% |
| Ratio of Net Investment | | | | | | |
| Income (Loss) to | | | | | | |
| Average Net Assets | (0.85)%(5) | (0.52)% | 0.72% | 0.19% | (0.06)% | 0.20% |
| Portfolio Turnover Rate | 110% | 244% | 206% | 149% | 160% | 112% |
| Net Assets, End of Period | | | | | | |
| (in thousands) | $88,270 | $92,968 | $65,541 | $212,157 | $180,732 | $198,197 |
| (1) | Six months ended May 28, 2010 (unaudited). | | | | | |
| (2) | Computed using average shares outstanding throughout the period. | | | | |
| (3) | Per-share amount was less than $0.005. | | | | | |
| (4) | Total return assumes reinvestment of net investment income and capital gains distributions, if any. Total returns for periods less than one year |
| | are not annualized. Total returns are calculated based on the net asset value of the last business day. The total return of the classes may not |
| | precisely reflect the class expense differences because of the impact of calculating the net asset values to two decimal places. If net asset |
| | values were calculated to three decimal places, the total return differences would more closely reflect the class expense differences. The |
| | calculation of net asset values to two decimal places is made in accordance with SEC guidelines and does not result in any gain or loss of value |
| | between one class and another. | | | | | |
| (5) | Annualized. | | | | | | |
See Notes to Financial Statements.
24
| | | | | | | |
| International Opportunities | | | | |
| |
| Institutional Class | | | | | | |
| For a Share Outstanding Throughout the Years Ended November 30 (except as noted) | | |
| | | 2010(1) | 2009 | 2008 | 2007 | 2006 | 2005 |
| Per-Share Data | | | | | | |
| Net Asset Value, | | | | | | |
| Beginning of Period | $5.54 | $3.72 | $11.44 | $11.85 | $12.32 | $9.37 |
| Income From | | | | | | |
| Investment Operations | | | | | | |
| Net Investment | | | | | | |
| Income (Loss)(2) | (0.02) | (0.04) | 0.07 | 0.06 | 0.02 | 0.10 |
| Net Realized and | | | | | | |
| Unrealized Gain (Loss) | (0.20) | 1.86 | (5.10) | 2.94 | 2.54 | 3.14 |
| Total From | | | | | | |
| Investment Operations | (0.22) | 1.82 | (5.03) | 3.00 | 2.56 | 3.24 |
| Distributions | | | | | | |
| From Net | | | | | | |
| Investment Income | (0.13) | — | (0.08) | (0.03) | (0.04) | — |
| From Net | | | | | | |
| Realized Gains | — | — | (2.61) | (3.38) | (2.99) | (0.29) |
| Total Distributions | (0.13) | — | (2.69) | (3.41) | (3.03) | (0.29) |
| Net Asset Value, | | | | | | |
| End of Period | $5.19 | $5.54 | $3.72 | $11.44 | $11.85 | $12.32 |
| |
| Total Return(3) | (4.19)% | 48.92% | (56.44)% | 33.97% | 25.66% | 35.53% |
| | | | | | | |
| Ratios/Supplemental Data | | | | | | |
| Ratio of Operating | | | | | | |
| Expenses to | | | | | | |
| Average Net Assets | 1.71%(4) | 1.75% | 1.67% | 1.61% | 1.65% | 1.71% |
| Ratio of Net Investment | | | | | | |
| Income (Loss) to | | | | | | |
| Average Net Assets | (0.65)%(4) | (0.32)% | 0.92% | 0.39% | 0.14% | 0.40% |
| Portfolio Turnover Rate | 110% | 244% | 206% | 149% | 160% | 112% |
| Net Assets, End of Period | | | | | | |
| (in thousands) | $32 | $33 | $1,245 | $4,513 | $1,099 | $31 |
| (1) | Six months ended May 28, 2010 (unaudited). | | | | | |
| (2) | Computed using average shares outstanding throughout the period. | | | | |
| (3) | Total return assumes reinvestment of net investment income and capital gains distributions, if any. Total returns for periods less than one year |
| | are not annualized. Total returns are calculated based on the net asset value of the last business day. The total return of the classes may not |
| | precisely reflect the class expense differences because of the impact of calculating the net asset values to two decimal places. If net asset |
| | values were calculated to three decimal places, the total return differences would more closely reflect the class expense differences. The |
| | calculation of net asset values to two decimal places is made in accordance with SEC guidelines and does not result in any gain or loss of value |
| | between one class and another. | | | | | |
| (4) | Annualized. | | | | | | |
See Notes to Financial Statements.
25
| | |
| International Opportunities | |
| |
| A Class | |
| For a Share Outstanding Throughout the Years Ended November 30 (except as noted) | |
| | | 2010(1) |
| Per-Share Data | |
| Net Asset Value, Beginning of Period | $5.51 |
| Income From Investment Operations | |
| Net Investment Income (Loss)(2) | —(3) |
| Net Realized and Unrealized Gain (Loss) | (0.30) |
| Total From Investment Operations | (0.30) |
| Distributions | |
| From Net Investment Income | (0.04) |
| Net Asset Value, End of Period | $5.17 |
| |
| Total Return(4) | (5.58)% |
| | |
| Ratios/Supplemental Data | |
| Ratio of Operating Expenses to Average Net Assets | 2.16%(5) |
| Ratio of Net Investment Income (Loss) to Average Net Assets | (0.45)%(5) |
| Portfolio Turnover Rate | 110%(6) |
| Net Assets, End of Period (in thousands) | $64 |
| (1) | March 1, 2010 (commencement of sale) through May 28, 2010 (unaudited). | |
| (2) | Computed using average shares outstanding throughout the period. | |
| (3) | Per-share amount was less than $0.005. | |
| (4) | Total return assumes reinvestment of net investment income and capital gains distributions, if any, and does not reflect applicable sales charges. |
| | Total returns for periods less than one year are not annualized. Total returns are calculated based on the net asset value of the last business day. |
| | The total return of the classes may not precisely reflect the class expense differences because of the impact of calculating the net asset values |
| | to two decimal places. If net asset values were calculated to three decimal places, the total return differences would more closely reflect the |
| | class expense differences. The calculation of net asset values to two decimal places is made in accordance with SEC guidelines and does not |
| | result in any gain or loss of value between one class and another. | |
| (5) | Annualized. | |
| (6) | Portfolio turnover is calculated at the fund level. Percentage indicated was calculated for the six months ended May 28, 2010. | |
See Notes to Financial Statements.
26
| | |
| International Opportunities | |
| |
| C Class | |
| For a Share Outstanding Throughout the Years Ended November 30 (except as noted) | |
| | | 2010(1) |
| Per-Share Data | |
| Net Asset Value, Beginning of Period | $5.51 |
| Income From Investment Operations | |
| Net Investment Income (Loss)(2) | (0.02) |
| Net Realized and Unrealized Gain (Loss) | (0.30) |
| Total From Investment Operations | (0.32) |
| Net Asset Value, End of Period | $5.19 |
| |
| Total Return(3) | (5.81)% |
| | |
| Ratios/Supplemental Data | |
| Ratio of Operating Expenses to Average Net Assets | 2.91%(4) |
| Ratio of Net Investment Income (Loss) to Average Net Assets | (1.20)%(4) |
| Portfolio Turnover Rate | 110%(5) |
| Net Assets, End of Period (in thousands) | $24 |
| (1) | March 1, 2010 (commencement of sale) through May 28, 2010 (unaudited). | |
| (2) | Computed using average shares outstanding throughout the period. | |
| (3) | Total return assumes reinvestment of net investment income and capital gains distributions, if any, and does not reflect applicable sales charges. |
| | Total returns for periods less than one year are not annualized. Total returns are calculated based on the net asset value of the last business day. |
| | The total return of the classes may not precisely reflect the class expense differences because of the impact of calculating the net asset values |
| | to two decimal places. If net asset values were calculated to three decimal places, the total return differences would more closely reflect the |
| | class expense differences. The calculation of net asset values to two decimal places is made in accordance with SEC guidelines and does not |
| | result in any gain or loss of value between one class and another. | |
| (4) | Annualized. | |
| (5) | Portfolio turnover is calculated at the fund level. Percentage indicated was calculated for the six months ended May 28, 2010. | |
See Notes to Financial Statements.
27
| | |
| International Opportunities | |
| |
| R Class | |
| For a Share Outstanding Throughout the Years Ended November 30 (except as noted) | |
| | | 2010(1) |
| Per-Share Data | |
| Net Asset Value, Beginning of Period | $5.51 |
| Income From Investment Operations | |
| Net Investment Income (Loss)(2) | (0.01) |
| Net Realized and Unrealized Gain (Loss) | (0.30) |
| Total From Investment Operations | (0.31) |
| Distributions | |
| From Net Investment Income | (0.02) |
| Net Asset Value, End of Period | $5.18 |
| |
| Total Return(3) | (5.63)% |
| | |
| Ratios/Supplemental Data | |
| Ratio of Operating Expenses to Average Net Assets | 2.41%(4) |
| Ratio of Net Investment Income (Loss) to Average Net Assets | (0.70)%(4) |
| Portfolio Turnover Rate | 110%(5) |
| Net Assets, End of Period (in thousands) | $24 |
| (1) | March 1, 2010 (commencement of sale) through May 28, 2010 (unaudited). | |
| (2) | Computed using average shares outstanding throughout the period. | |
| (3) | Total return assumes reinvestment of net investment income and capital gains distributions, if any. Total returns for periods less than one year |
| | are not annualized. Total returns are calculated based on the net asset value of the last business day. The total return of the classes may not |
| | precisely reflect the class expense differences because of the impact of calculating the net asset values to two decimal places. If net asset |
| | values were calculated to three decimal places, the total return differences would more closely reflect the class expense differences. The |
| | calculation of net asset values to two decimal places is made in accordance with SEC guidelines and does not result in any gain or loss of value |
| | between one class and another. | |
| (4) | Annualized. | |
| (5) | Portfolio turnover is calculated at the fund level. Percentage indicated was calculated for the six months ended May 28, 2010. | |
See Notes to Financial Statements.
28
|
| Board Approval of Management and Subadvisory Agreements |
American Century Investment Management, Inc. (“ACIM” or the “Advisor”) currently serves as investment advisor to the Fund under an interim management agreement (the “Interim Management Agreement”) between the Advisor and the Fund approved by the Fund’s Board of Trustees (the “Board”). The Advisor previously served as investment advisor to the Fund pursuant to a management agreement (the “Prior Management Agreement”) that terminated in accordance with its terms on February 16, 2010, as a result of a change of control of the Advisor’s parent company, American Century Companies, Inc. (“ACC”). The change in control occurred as the result of a change in the trustee of a trust created by James E. Stowers, Jr., the founder of American Century Investments that holds shares representing a significant interest in ACC stock. Mr. Stowers previously served a s the trustee of the trust. On February 16, 2010, Mr. Richard W. Brown, Co-Chairman of ACC with Mr. Stowers, became the trustee in accordance with the terms of the trust and Mr. Stowers’ long-standing estate and succession plan.
On February 18, 2010, the Board approved the Interim Management Agreement in accordance with Rule 15a-4 under the Investment Company Act to ensure continued management of the Fund by the Advisor after the termination of the Prior Management Agreement and until shareholder approval of a new management agreement (the “Proposed Management Agreement”) as required under the Act. The Board approved the Proposed Management Agreement and recommended its approval to shareholders. Fund shareholders approved the Proposed Management Agreement at a meeting on June 16, 2010.*
The Interim Management Agreement and the Proposed Management Agreement are substantially identical to the Prior Management Agreement except for their effective dates and the termination provisions of the Interim Management Agreement. Under the Interim and Proposed Management Agreements, the Advisor will provide the same services to the Fund and receive the same compensation rate as under the Prior Management Agreement.
Basis for Board Approval of Interim Management Agreement
In considering the approval of the Interim Management Agreement, Rule 15a-4 requires the Board to approve the contract within ten business days of the termination of the prior agreement and to determine that the compensation to be received under the interim agreement is no greater than would have been received under the prior agreement. In connection with the approval, the Board noted that it oversees on a continuous basis and evaluates at its quarterly meetings, directly and through the committees of the Board, the nature and quality of significant services provided by the Advisor, the investment performance of the Fund, shareholder services, audit and compliance functions and a variety of other matters relating to the Fund’s operations.
|
| *Management agreements for new share classes of the Fund launched after February 16, 2010, did not terminate, have not been replaced by Interim |
| Management Agreements, and do not require Board or shareholder approval at this time. |
29
In evaluating the Interim Management Agreement, the Board, assisted by the advice of its independent legal counsel, considered a number of factors in addition to those required by the rule with no one factor being determinative to its analysis. Among the factors considered by the Board were the circumstances and effect of the change of control, the fact that the Advisor will provide the same services and receive the same compensation rate as under the Prior Management Agreements, and that the change of control did not result in a change of the personnel managing the Fund. Upon completion of its analysis, the Board approved the Interim Management Agreement, determining that the continued management of the Fund by the Advisor was in the best interests of the Fund and Fund shareholders.
Basis for Board Approval of Proposed Management Agreement
At a meeting held on April 1, 2010, after considering all information presented, the Board approved, and determined to recommend that shareholders approve, the Proposed Management Agreement. In connection with that approval, the Board requested and reviewed extensive data and information compiled by the Advisor and certain independent providers of evaluation data concerning the Fund and services provided to the Fund by the Advisor. The Board oversees on a continuous basis and evaluates at its quarterly meetings, directly and through the committees of the Board, the nature and quality of significant services provided by the Advisor, the investment performance of the Fund, shareholder services, audit and compliance functions and a variety of other matters relating to the Fund’s operations. The information considered and the discussions held at the meetings included, but were not limited to:
• the nature, extent and quality of investment management, shareholder services and other services provided to the Fund;
• the wide range of programs and services the Advisor provides to the Fund and their shareholders on a routine and non-routine basis;
• the compliance policies, procedures, and regulatory experience of the Advisor;
• data comparing the cost of owning the Fund to the cost of owning similar funds;
• the fact that there will be no changes to the fees, services, or personnel who provide such services as compared to the Prior Management Agreement;
• data comparing the Fund’s performance to appropriate benchmarks and/ or a peer group of other mutual funds with similar investment objectives and strategies;
• financial data showing the profitability of the Fund to the Advisor and the overall profitability of the Advisor;
• data comparing services provided and charges to the Fund with those for other non-fund investment management clients of the Advisor; and
30
• consideration of collateral or “fall-out” benefits derived by the Advisor from the management of the Fund and potential sharing of economies of scale in connection with the management of the Fund.
The Board also considered whether there was any reason for not continuing the existing arrangement with the Advisor. In particular, the Board recognized that shareholders may have invested in the Fund on the strength of the Advisor’s industry standing and reputation and in the expectation that the Advisor will have a continuing role in providing advisory services to the Fund.
The Board considered all of the information provided by the Advisor, the independent data providers, and the Board’s independent counsel, and evaluated such information for the Fund. The Board did not identify any single factor as being all-important or controlling, and each Board member may have attributed different levels of importance to different factors. In deciding to approve the Proposed Management Agreement under the terms ultimately determined by the Board to be appropriate, the Board based its decision on a number of factors, including the following:
Nature, Extent and Quality of Services — Generally. Under the Proposed Management Agreement, the Advisor is responsible for providing or arranging for all services necessary for the operation of the Fund. The Board noted that under the Proposed Management Agreement, the Advisor provides or arranges at its own expense a wide variety of services including:
• constructing and designing the Fund
• portfolio research and security selection
• initial capitalization/funding
• securities trading
• Fund administration
• custody of Fund assets
• daily valuation of the Fund’s portfolio
• shareholder servicing and transfer agency, including shareholder
confirmations, recordkeeping and communications
• legal services
• regulatory and portfolio compliance
• financial reporting
• marketing and distribution
31
The Board noted that many of these services have expanded over time both in terms of quantity and complexity in response to shareholder demands, competition in the industry, changing distribution channels and the changing regulatory environment.
Investment Management Services. The investment management services provided to the Fund are complex and provide Fund shareholders access to professional money management, instant diversification of their investments within an asset class, the opportunity to easily diversify among asset classes, and liquidity. As a part of its general oversight and in evaluating investment performance, the Board expects the Advisor to manage the Fund in accordance with its investment objectives and approved strategies. In providing these services, the Advisor utilizes teams of investment professionals who require extensive information technology, research, training, compliance and other systems to conduct their business. The Board, directly and through its Portfolio Committee, regularly reviews investment performance information for the Fund, t ogether with comparative information for appropriate benchmarks and/or peer groups of similarly-managed funds, over different time horizons. If performance concerns are identified, the underperforming Fund receives special reviews until performance improves, during which time the Board discusses with the Advisor the reasons for such underperformance and any efforts being undertaken to improve performance.
Shareholder and Other Services. Under the Proposed Management Agreement, the Advisor will also provide the Fund with a comprehensive package of transfer agency, shareholder, and other services. The Board, directly and through the various committees of the Board, regularly reviews reports and evaluations of such services. These reports include, but are not limited to, information regarding the operational efficiency and accuracy of the shareholder and transfer agency services provided, staffing levels, shareholder satisfaction (as measured by external as well as internal sources), technology support, new products and services offered to Fund shareholders, securities trading activities, portfolio valuation services, auditing services, and legal and operational compliance activities. Certain aspects of shareholder and transfer ag ency service level efficiency and the quality of securities trading activities are measured by independent third party providers and are presented in comparison to other fund groups not managed by the Advisor.
Costs of Services Provided and Profitability. The Advisor provided detailed information concerning its cost of providing various services to the Fund, its profitability in managing the Fund, its overall profitability, and its financial condition. The Board reviewed with the Advisor the methodology used to prepare this financial information. The Board has also reviewed with the Advisor its methodology for compensating the investment professionals that provide services to the Fund as well as compensation to the five highest paid personnel of the Advisor. This financial information regarding the Advisor is considered in order to evaluate the Advisor’s financial condition, its ability to continue to provide services under the Proposed Management Agreement, and the reasonableness of the proposed management fees.
32
Ethics. The Board generally considers the Advisor’s commitment to providing quality services to shareholders and to conducting its business ethically. It noted that the Advisor’s practices generally meet or exceed industry best practices.
Economies of Scale. The Board also reviewed information provided by the Advisor regarding the possible existence of economies of scale in connection with the management of the Fund. The Board concluded that economies of scale are difficult to measure and predict with precision, especially on a fund-by-fund basis. The analysis of economies of scale is further complicated by the additional services and content provided by the Advisor and its reinvestment in its ability to provide and expand those services. Accordingly, the Board seeks to evaluate economies of scale by reviewing information, such as year-over-year profitability of the Advisor generally, the profitability of its management of the Fund specifically, and the expenses incurred by the Advisor in providing various functions to the Fund. The Board believes the Advisor i s appropriately sharing economies of scale through its competitive fee structure, offering competitive fees from fund inception, fee breakpoints as the fund complex and the Fund increases in size, and through reinvestment in its business to provide shareholders additional services and enhancements to existing services. In particular, separate breakpoint schedules based on the size of the entire fund complex and on the size of the Fund reflect the complexity of assessing economies of scale.
Comparison to Fees of Funds not Managed by the Advisor. Both the Prior and Proposed Management Agreements provide that the Fund pays the Advisor a single, all-inclusive (or unified) management fee for providing all services necessary for the management and operation of the Fund, other than brokerage expenses, taxes, interest, extraordinary expenses, and the fees and expenses of the Fund’s Independent Trustees (including their independent legal counsel) and expenses incurred in connection with the provision of shareholder services and distribution services under a plan adopted pursuant to Rule 12b-1 under the 1940 Act. Under the unified fee structure, the Advisor is responsible for providing all investment advisory, custody, audit, administrative, compliance, recordkeeping, marketing and shareholder services, or arranging and supervising third parties that provide such services. By contrast, most other funds are charged a variety of fees, including an investment advisory fee, a transfer agency fee, an administrative fee, distribution charges and other expenses. Other than their investment advisory fees and any applicable Rule 12b-1 distribution fees, the components of the total fees charged by these other funds may be increased without shareholder approval. The Board believes the unified fee structure is a benefit to Fund shareholders because it clearly discloses to shareholders the cost of owning Fund shares, and, since the unified fee cannot be increased without a vote of Fund shareholders, it shifts to the Advisor the risk of increased costs of operating the Fund and provides a direct incentive to minimize administrative inefficiencies. Part of the Board’s analysis of fee levels involves reviewing certain evaluative data compiled by an independent provider comparing the Fund’s unified fee to the total expense rat ios of similar funds not managed by the Advisor. The Board concluded that the management fee to be paid by the Fund to the Advisor under the Proposed Management Agreement is reasonable in light of the services to be provided to the Fund.
33
Comparison to Fees and Services Provided to Other Clients of the Advisor. The Board also requested and received information from the Advisor concerning the nature and extent of the services, fees, and profitability of its advisory services to advisory clients other than the Fund. They observed that these varying types of client accounts require different services and involve different regulatory and entrepreneurial risks than the management of the Fund. The Board analyzed this information and concluded that the fees charged and services provided to the Fund were reasonable by comparison.
Collateral or “Fall-Out” Benefits Derived by the Advisor. The Board considered the existence of collateral benefits the Advisor may receive as a result of its relationship with the Fund. The Board concluded that the Advisor’s primary business is managing mutual funds and it generally does not use Fund or shareholder information to generate profits in other lines of business, and therefore does not derive any significant collateral benefits from them. The Board noted that the Advisor receives proprietary research from broker-dealers that execute Fund portfolio transactions and concluded that this research is likely to benefit Fund shareholders. The Board also determined that the Advisor is able to provide investment management services to certain clients other than the Fund, at least in part, due to its existing infrastructure built to serve the fund complex. The Board concluded, however, that the assets of those other clients are not material to the analysis and, in any event, are included with the assets of the Fund to determine breakpoints in the Fund’s fee schedule, provided they are managed using the same investment team and strategy.
Conclusion of the Board. As a result of this process, the Board, in the absence of particular circumstances and assisted by the advice of its independent legal counsel, taking into account all of the factors discussed above and the information provided by the Advisor and others, concluded that the Proposed Management Agreement be approved and recommended its approval to Fund shareholders.
34
Retirement Account Information
As required by law, distributions you receive from certain IRAs, or 403(b), 457 and qualified plans are subject to federal income tax withholding, unless you elect not to have withholding apply. Tax will be withheld on the total amount withdrawn even though you may be receiving amounts that are not subject to withholding, such as nondeductible contributions. In such case, excess amounts of withholding could occur. You may adjust your withholding election so that a greater or lesser amount will be withheld.
If you don’t want us to withhold on this amount, you must notify us to not withhold the federal income tax. You may notify us in writing or in certain situations by telephone or through other electronic means. You have the right to revoke your withholding election at any time and any election you make may remain in effect until revoked by filing a new election.
Remember, even if you elect not to have income tax withheld, you are liable for paying income tax on the taxable portion of your withdrawal. If you elect not to have income tax withheld or you don’t have enough income tax withheld, you may be responsible for payment of estimated tax. You may incur penalties under the estimated tax rules if your withholding and estimated tax payments are not sufficient. You can reduce or defer the income tax on a distribution by directly or indirectly rolling such distribution over to another IRA or eligible plan. You should consult your tax advisor for additional information.
State tax will be withheld if, at the time of your distribution, your address is within one of the mandatory withholding states and you have federal income tax withheld. State taxes will be withheld from your distribution in accordance with the respective state rules.
Proxy Voting Guidelines
American Century Investment Management, Inc., the fund’s investment advisor, is responsible for exercising the voting rights associated with the securities purchased and/or held by the fund. A description of the policies and procedures the advisor uses in fulfilling this responsibility is available without charge, upon request, by calling 1-800-345-2021. It is also available on American Century Investments’ website at americancentury.com and on the Securities and Exchange Commission’s website at sec.gov. Information regarding how the investment advisor voted proxies relating to portfolio securities during the most recent 12-month period ended June 30 is available on the “About Us” page at americancentury.com. It is also available at sec.gov.
Quarterly Portfolio Disclosure
The fund files its complete schedule of portfolio holdings with the Securities and Exchange Commission (SEC) for the first and third quarters of each fiscal year on Form N-Q. The fund’s Forms N-Q are available on the SEC’s website at sec.gov, and may be reviewed and copied at the SEC’s Public Reference Room in Washington, DC. Information on the operation of the Public Reference Room may be obtained by calling 1-800-SEC-0330. The fund also makes its complete schedule of portfolio holdings for the most recent quarter of its fiscal year available on its website at americancentury.com and, upon request, by calling 1-800-345-2021.
35
The following indices are used to illustrate investment market, sector, or style performance or to serve as fund performance comparisons. They are not investment products available for purchase.
Morgan Stanley Capital International (MSCI) has developed several indices that measure the performance of foreign stock markets.
The MSCI AC (All Country) World ex-US Small Cap Growth Index represents the performance of small cap growth stocks in developed and emerging markets, excluding the United States.
The MSCI EAFE (Europe, Australasia, Far East) Index is designed to measure developed market equity performance, excluding the U.S. and Canada.
The MSCI EAFE Growth Index is a capitalization-weighted index that monitors the performance of growth stocks from Europe, Australasia, and the Far East.
The MSCI EAFE Value Index is a capitalization-weighted index that monitors the performance of value stocks from Europe, Australasia, and the Far East.
The MSCI EM (Emerging Markets) Index represents the performance of stocks in global emerging market countries.
The MSCI Europe Index is designed to measure equity market performance in Europe.
The MSCI Japan Index is designed to measure equity market performance in Japan.
The MSCI World Free Index represents the performance of stocks in developed countries (including the United States) that are available for purchase by global investors.
36

| |
| |
| Contact Us | |
| americancentury.com | |
| Automated Information Line | 1-800-345-8765 |
| Investor Services Representative | 1-800-345-2021 or |
| | 816-531-5575 |
| Investors Using Advisors | 1-800-378-9878 |
| Business, Not-For-Profit, Employer-Sponsored | |
| Retirement Plans | 1-800-345-3533 |
| Banks and Trust Companies, Broker-Dealers, | |
| Financial Professionals, Insurance Companies | 1-800-345-6488 |
| Telecommunications Device for the Deaf | 1-800-634-4113 |
| American Century World Mutual Funds, Inc. | |
| Investment Advisor: | |
| American Century Investment Management, Inc. | |
| Kansas City, Missouri | |
This report and the statements it contains are submitted for the general
information of our shareholders. The report is not authorized for distribution to
prospective investors unless preceded or accompanied by an effective prospectus.
American Century Investment Services, Inc., Distributor
©2010 American Century Proprietary Holdings, Inc. All rights reserved.
1007
CL-SAN-68676
|
| Semiannual Report |
| May 28, 2010 |

|
| American Century Investments® |
NT International Growth Fund
| |
| President’s Letter | 2 |
| Independent Chairman’s Letter | 3 |
| Market Perspective | 4 |
| International Equity Total Returns | 4 |
| |
| NT International Growth | |
| |
| Performance | 5 |
| Portfolio Commentary | 7 |
| Top Ten Holdings | 9 |
| Types of Investments in Portfolio | 9 |
| Investments by Country | 9 |
| |
| Shareholder Fee Example | 10 |
| |
| Financial Statements | |
| |
| Schedule of Investments | 12 |
| Statement of Assets and Liabilities | 15 |
| Statement of Operations | 16 |
| Statement of Changes in Net Assets | 17 |
| Notes to Financial Statements | 18 |
| Financial Highlights | 23 |
| |
| Other Information | |
| |
| Board Approval of Management and Subadvisory Agreements | 24 |
| Additional Information | 30 |
| Index Definitions | 31 |
Any opinions expressed in this report reflect those of the author as of the date of the report, and do not necessarily represent the opinions of American Century Investments or any other person in the American Century Investments organization. Any such opinions are subject to change at any time based upon market or other conditions and American Century Investments disclaims any responsibility to update such opinions. These opinions may not be relied upon as investment advice and, because investment decisions made by American Century Investments funds are based on numerous factors, may not be relied upon as an indication of trading intent on behalf of any American Century Investments fund. Security examples are used for representational purposes only and are not intended as recommendations to purchase or sell securities. Performance information for comparative indices and securities is provided to American Century Investments by third party vendors. To the best of American Century Investments’ knowledge, such information is accurate at the time of printing.

Dear Investor:
To learn more about the capital markets, your investment, and the portfolio management strategies American Century Investments provides, we encourage you to review this shareholder report for the financial reporting period ended May 28, 2010.
On the following pages, you will find investment performance and portfolio information, presented with the expert perspective and commentary of our portfolio management team. This report remains one of our most important vehicles for conveying the information you need about your investment performance, and about the market factors and strategies that affect fund returns. For additional information on the markets, we encourage you to visit the “Insights & News” tab at our Web site, americancentury.com, for updates and further expert commentary.
The top of our Web site’s home page also provides a link to “Our Story,” which, first and foremost, outlines our commitment—since 1958—to helping clients reach their financial goals. We believe strongly that we will only be successful when our clients are successful. That’s who we are.
Another important, unique facet of our story and who we are is “Profits with a Purpose,” which describes our bond with the Stowers Institute for Medical Research (SIMR). SIMR is a world-class biomedical organization—founded by our company founder James E. Stowers, Jr. and his wife Virginia—that is dedicated to researching the causes, treatment, and prevention of gene-based diseases, including cancer. Through American Century Investments’ private ownership structure, more than 40% of our profits support SIMR.
Mr. Stowers’ example of achieving financial success and using that platform to help humanity motivates our entire American Century Investments team. His story inspires us to help each of our clients achieve success. Thank you for sharing your financial journey with us.
Sincerely,

Jonathan Thomas
President and Chief Executive Officer
American Century Investments
2
|
| Independent Chairman’s Letter |

Fellow Shareholders,
The principal event at a recent board meeting was the retirement of Jim Stowers, Jr. from the American Century Mutual Funds Kansas City board. This was one of those times when you felt like you were living a historical moment. Jim—who celebrated his 86th birthday in January—founded what was known as Twentieth Century Mutual Funds over 50 years ago. Through the years, his number one priority has been to “Put Investors First!” The board presented Jim with a resolution acknowledging that, by building a successful investment company, he has impacted the lives of many by helping them on the path to financial success.
We respect Jim’s decision to focus his energy on the Stowers Institute for Medical Research and American Century Companies, Inc. (ACC), the parent company of the funds’ investment advisor. The pioneering medical research that Jim and his wife Virginia have made possible through the Institute should enrich the lives of millions in the future.
Shortly after his retirement from the board, we received word that ACC’s co-chairman Richard W. Brown had succeeded Jim as trustee of a trust that holds a significant interest in ACC stock as a part of Jim’s long-standing estate and business succession plan. While holding less than a majority interest, the trust is presumed to control the funds’ investment advisors under the Investment Company Act of 1940. This change triggered the need for a shareholder proxy to approve new management and subadvisory agreements for the funds. I am happy to report that all of the proposals contained in the proxy received the necessary votes and were approved.
On behalf of the board, I want to once again thank Jim for his mutual fund board service. More than three years ago, Jim and Richard Brown installed a strong and effective leadership team at American Century Investments and I look forward to continuing to work with them on behalf of fund shareholders. And while Jim no longer sits on the fund board, the inherent optimism captured by his favorite catch phrase—“The best is yet to be”—still resonates with all of us who have the privilege of serving you. I invite you to send your comments, questions or concerns to me at dhpratt@fundboardchair.com.

3

By Mark Kopinski, Chief Investment Officer, Global and Non-U.S. Equity
Events in May Sent Stocks Tumbling
Global stock returns generally remained robust for the first several months of the period, as the rally unleashed in March 2009 continued into 2010. Optimism regarding the global economic recovery and business sector gains helped keep stocks in positive territory.
Nevertheless, as spring set in, the global stock market rally ended abruptly, starting with the May 6 “Flash Crash” in the U.S. stock market, when the major indices plunged nearly 7% within 15 minutes. Furthermore, problems that had been percolating in Europe and in the global geopolitical arena boiled over in May, triggering a sharp stock market selloff. In particular, the expanding European government debt crisis beyond Greece, the downgrade of Spain’s credit rating, the worsening oil disaster in the Gulf of Mexico, and escalating tensions in the Middle East rattled investors’ nerves.
Overall, developed international equity markets significantly under-performed the U.S. market and the emerging markets. European stocks suffered the largest losses for the six-month period, as the mounting debt crisis worried investors. Exploding debt in Greece, Italy, Spain, Ireland, and Portugal all came under scrutiny.
Debt Remained the Roadblock to Growth
The sovereign debt problem did not just happen as a result of the recent financial crisis or recession; it is a longer-term issue. Recent events only exacerbated the problem and accelerated its becoming a crisis.
In fact, sovereign solvency has emerged as one of the most significant roadblocks to growth. Currently, the market is focused on Europe, where severe austerity measures are required to get fiscal balances back in order. This is likely to trim 0.5% from European growth during the next year. The weaker euro should help offset some of the decline in growth, but the more export-oriented northern countries will be the main beneficiaries. Commodity-based countries, such as Australia and Norway, have been the most resilient and have seen more impressive economic recoveries. The debt crisis likely will mean European interest rates will remain accommodative for the remainder of 2010.
| | | | |
| International Equity Total Returns | | | | |
| For the six months ended May 28, 2010* (in U.S. dollars) | |
| MSCI EAFE Index | -10.90% | | MSCI Europe Index | -14.77% |
| MSCI EAFE Growth Index | -8.85% | | MSCI World Free Index | -4.92% |
| MSCI EAFE Value Index | -12.95% | | MSCI Japan Index | 0.10% |
| MSCI EM Index | -2.75% | | | |
| *Total returns for periods less than one year are not annualized and are based on the period beginning December 1, 2009. | |
4
| | | | | | |
| NT International Growth | | | | |
| |
| Total Returns as of May 28, 2010 | | | | |
| | | | | | Average Annual | |
| | | | | | Returns | |
| | | Ticker | | | Since | Inception |
| | | Symbol | 6 months(1) | 1 year(2) | Inception | Date |
| Institutional Class | ACLNX | -8.14% | 10.00% | -4.37% | 5/12/06 |
| MSCI EAFE Index | — | -10.90% | 6.61% | -5.70% | — |
| MSCI EAFE Growth Index | — | -8.85% | 8.60% | -5.01% | — |
| (1) | Total returns for periods less than one year are not annualized and are based on the period beginning December 1, 2009. | |
| (2) | Total returns are based on the period beginning June 1, 2009. | | | |
Data presented reflect past performance. Past performance is no guarantee of future results. Current performance may be higher or lower than the performance shown. Investment return and principal value will fluctuate, and redemption value may be more or less than original cost. To obtain performance data current to the most recent month end, please call 1-800-345-2021 or visit americancentury.com. International investing involves special risks, such as political instability and currency fluctuations. Investing in emerging markets may accentuate these risks.
Data assumes reinvestment of dividends and capital gains, and none of the charts reflect the deduction of taxes that a shareholder would pay on fund distributions or the redemption of fund shares. Returns for the indices are provided for comparison. The fund’s total returns include operating expenses (such as transaction costs and management fees) that reduce returns, while the total returns of the indices do not.
5
NT International Growth
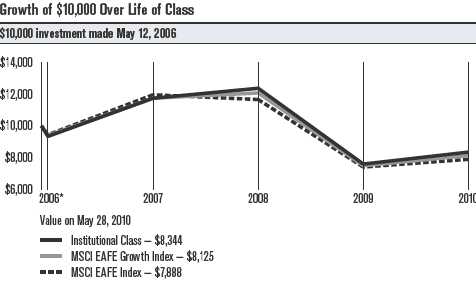
| |
| *From 5/12/06, the Institutional Class’s inception date. Not annualized. |
|
| Total Annual Fund Operating Expenses |
| Institutional Class | 1.19% |
The total annual fund operating expenses shown is as stated in the fund’s prospectus current as of the date of this report. The prospectus may vary from the expense ratio shown elsewhere in this report because it is based on a different time period, includes acquired fund fees and expenses, and, if applicable, does not include fee waivers or expense reimbursements.
Data presented reflect past performance. Past performance is no guarantee of future results. Current performance may be higher or lower than the performance shown. Investment return and principal value will fluctuate, and redemption value may be more or less than original cost. To obtain performance data current to the most recent month end, please call 1-800-345-2021 or visit americancentury.com. International investing involves special risks, such as political instability and currency fluctuations. Investing in emerging markets may accentuate these risks.
Data assumes reinvestment of dividends and capital gains, and none of the charts reflect the deduction of taxes that a shareholder would pay on fund distributions or the redemption of fund shares. Returns for the indices are provided for comparison. The fund’s total returns include operating expenses (such as transaction costs and management fees) that reduce returns, while the total returns of the indices do not.
6
NT International Growth
Portfolio Managers: Alex Tedder and Raj Gandhi
Performance Summary
The NT International Growth portfolio returned -8.14%* for the six months ended May 28, 2010, compared with its benchmark, the MSCI EAFE Index, which returned -10.90%.
Investor confidence generally remained upbeat for the first four months of the period, as the global economic recovery appeared to gain momentum and stock prices continued to climb. But, late in the period, mounting concerns about the massive levels of sovereign debt in Greece, Spain, and other European nations put an end to the yearlong global stock market rally. Stock prices plunged, wiping out the gains achieved earlier in the period. International growth stocks fared slightly better than their value counterparts, while small-cap stocks outperformed large-cap stocks. Meanwhile, the euro tumbled sharply relative to the U.S. dollar, which added to the woes of foreign-based corporations.
Stock selection, primarily in the financials and consumer discretionary sectors, accounted for the portfolio’s outperformance relative to the benchmark. Our sector allocations also had an overall positive influence on the portfolio’s relative performance.
U.K., France Were Top Countries
From a regional perspective, the portfolio’s holdings in the United Kingdom and France contributed the most to relative performance, due to favorable stock selection combined with underweight positions. At the opposite end of the spectrum, Japan and the Netherlands represented the largest detractors to relative performance, primarily due to stock selection. In Japan, our overweight position in furniture and interior goods retailer Nitori (Japan’s version of IKEA) dragged down performance. In the Netherlands, our overweight position in TNT N.V., an international freight and parcel delivery service provider, was the largest detractor.
Financials, Technology Led Sector Results
Financials and information technology were the portfolio’s top-performing sectors for the six-month period. Stock selection was strong in the financials sector, with our holdings in the commercial banking industry driving results.
The information technology sector was home to the portfolio’s top-performing stock, China’s Baidu Inc., a Chinese-language internet search provider. This portfolio-only holding benefited from soaring revenues, net income and operating profit. In addition, our overweight position in Britain’s ARM Holdings, a designer of microchips used in mobile devices, digital TVs and other products, contributed positively. The company benefited primarily from strong growth in the smartphone and tablet computer markets, and it posted record royalty revenues, profits and net cash generation.
*Total returns for periods less than one year are not annualized and are based on the period beginning December 1, 2009.
7
NT International Growth
The portfolio’s consumer discretionary sector also outperformed, due to stock selection and an overweight position. Our stock selection was particularly effective in the auto industry, where our out-of-benchmark position in South Korea’s Hyundai Motor Co. was the portfolio’s top-contributing stock. In the challenging economic environment, consumers “traded down” for value, and Hyundai’s line of affordable cars benefited. Backed by a savvy, yet frugal, marketing strategy, the company continued to gain market share in a difficult climate for automakers.
Materials, Consumer Staples Sectors Lagged
The materials sector represented the portfolio’s largest performance detractor. Stock selection dragged down results, particularly in the metals and mining segment. Additionally, in the sector’s construction materials segment, German cement producer HeidelbergCement represented the portfolio’s largest performance detractor. The company said its 2009 operating income slid 38.6% from 2008 levels, as revenues plunged 21.6%. The company also said it expects Asia and Africa to drive global growth in 2010 but anticipates slack demand in the U.S. and Europe until the second half of the year.
The portfolio’s consumer staples sector also detracted from performance. While stock selection and an underweight position were slightly negative influences, currency returns accounted for the bulk of the lagging results.
Outlook
Global economic activity is improving, but significant headwinds remain—namely, the explosion of sovereign debt in developed nations. So far, government responses to the crisis have varied, and this lack of coordination may lead to divergent economic performance in the year ahead. We expect further volatility throughout the international stock markets, yet we will continue to focus on finding companies located in developed countries around the world (excluding the United States) with sustainable growth characteristics and promising long-term outlooks.
8
| |
| NT International Growth | |
| |
| Top Ten Holdings | |
| | % of net assets as of 5/28/10 |
| BHP Billiton Ltd. | 2.3% |
| Unilever NV CVA | 1.8% |
| HSBC Holdings plc (Hong Kong) | 1.6% |
| Novo Nordisk A/S B Shares | 1.5% |
| Volvo AB B Shares | 1.5% |
| Rakuten, Inc. | 1.5% |
| BG Group plc | 1.4% |
| Vale SA Preference Shares | 1.4% |
| Barclays plc | 1.4% |
| Novartis AG | 1.3% |
| |
| Types of Investments in Portfolio | |
| | % of net assets as of 5/28/10 |
| Foreign Common Stocks | 99.4% |
| Temporary Cash Investments | 0.2% |
| Other Assets and Liabilities | 0.4% |
| |
| Investments by Country | |
| | % of net assets as of 5/28/10 |
| United Kingdom | 19.9% |
| Japan | 15.6% |
| Switzerland | 8.4% |
| France | 7.1% |
| Germany | 6.0% |
| Netherlands | 4.6% |
| Sweden | 3.7% |
| Australia | 3.4% |
| People’s Republic of China | 3.1% |
| Taiwan (Republic of China) | 2.8% |
| Spain | 2.4% |
| Brazil | 2.2% |
| India | 2.2% |
| Denmark | 2.0% |
| Other Countries | 16.0% |
| Cash and Equivalents* | 0.6% |
| *Includes temporary cash investments and other assets and liabilities. | |
9
|
| Shareholder Fee Example (Unaudited) |
Fund shareholders may incur two types of costs: (1) transaction costs, including sales charges (loads) on purchase payments and redemption/ exchange fees; and (2) ongoing costs, including management fees; distribution and service (12b-1) fees; and other fund expenses. This example is intended to help you understand your ongoing costs (in dollars) of investing in your fund and to compare these costs with the ongoing cost of investing in other mutual funds.
The example is based on an investment of $1,000 made at the beginning of the period and held for the entire period from December 1, 2009 to May 28, 2010.
Actual Expenses
The table provides information about actual account values and actual expenses for each class. You may use the information, together with the amount you invested, to estimate the expenses that you paid over the period. First, identify the share class you own. Then simply divide your account value by $1,000 (for example, an $8,600 account value divided by $1,000 = 8.6), then multiply the result by the number under the heading “Expenses Paid During Period” to estimate the expenses you paid on your account during this period.
If you hold Investor Class shares of any American Century Investments fund, or Institutional Class shares of the American Century Diversified Bond Fund, in an American Century Investments account (i.e., not a financial intermediary or retirement plan account), American Century Investments may charge you a $12.50 semiannual account maintenance fee if the value of those shares is less than $10,000. We will redeem shares automatically in one of your accounts to pay the $12.50 fee. In determining your total eligible investment amount, we will include your investments in all personal accounts (including American Century Investments Brokerage accounts) registered under your Social Security number. Personal accounts include individual accounts, joint accounts, UGMA/UTMA accounts, personal trusts, Coverdell Education Savings Accounts and IRAs (including traditional, Roth, Rollover, SEP-, SARSEP- and SIMPLE-IRAs), and certain other retirement accounts. If you have only business, business retirement, employer-sponsored or American Century Investments Brokerage accounts, you are currently not subject to this fee. We will not charge the fee as long as you choose to manage your accounts exclusively online. If you are subject to the Account Maintenance Fee, your account value could be reduced by the fee amount.
Hypothetical Example for Comparison Purposes
The table also provides information about hypothetical account values and hypothetical expenses based on the actual expense ratio of each class of your fund and an assumed rate of return of 5% per year before expenses, which is not the actual return of a fund’s share class. The hypothetical account values and expenses may not be used to estimate the actual ending account balance or expenses you paid for the period. You may use this information to compare the ongoing costs of investing in your fund and other funds. To do so, compare this 5% hypothetical example with the 5% hypothetical examples that appear in the shareholder reports of the other funds.
10
Please note that the expenses shown in the table are meant to highlight your ongoing costs only and do not reflect any transactional costs, such as sales charges (loads) or redemption/exchange fees. Therefore, the table is useful in comparing ongoing costs only, and will not help you determine the relative total costs of owning different funds. In addition, if these transactional costs were included, your costs would have been higher.
| | | | |
| | Beginning | Ending | Expenses Paid | |
| | Account Value | Account Value | During Period* | Annualized |
| | 12/1/09 | 5/28/10 | 12/1/09 – 5/28/10 | Expense Ratio* |
| Actual | $1,000 | $918.60 | $5.41 | 1.15% |
| Hypothetical | $1,000 | $1,018.88 | $5.69 | 1.15% |
| *Expenses are equal to the class’s annualized expense ratio listed in the table above, multiplied by the average account value over the period, |
| multiplied by 179, the number of days in the most recent fiscal half-year, divided by 365, to reflect the one-half year period. | |
11
| | | | | | |
| NT International Growth | | | | |
| |
| MAY 28, 2010 (UNAUDITED) | | | | | | |
| | Shares | Value | | | Shares | Value |
| Common Stocks — 99.4% | | | GERMANY — 6.0% | | |
| AUSTRALIA — 3.4% | | | | BASF SE | 31,900 | $ 1,672,317 |
| | | | | Bayerische Motoren | | |
| BHP Billiton Ltd. | 137,531 | $ 4,467,390 | | Werke AG | 44,300 | 2,040,805 |
| Commonwealth Bank | | | | Daimler AG(1) | 36,700 | 1,809,063 |
| of Australia | 31,900 | 1,397,797 | | | | |
| Wesfarmers Ltd. | 38,530 | 937,828 | | Fresenius Medical Care | | |
| | | | | AG & Co. KGaA | 35,470 | 1,767,303 |
| | | 6,803,015 | | Metro AG | 24,300 | 1,271,722 |
| AUSTRIA — 0.8% | | | | SAP AG(1) | 32,100 | 1,362,717 |
| Erste Group Bank AG | 44,100 | 1,573,776 | | | | |
| | | | | Siemens AG | 21,500 | 1,932,179 |
| BELGIUM — 1.6% | | | | | | |
| | | | | | | 11,856,106 |
| Anheuser-Busch InBev NV | 42,308 | 2,023,827 | | | | |
| | | | | HONG KONG — 1.6% | | |
| KBC Groep NV(1) | 30,800 | 1,191,888 | | | | |
| | | | | CNOOC Ltd. | 1,049,000 | 1,642,059 |
| | | 3,215,715 | | Li & Fung Ltd. | 344,000 | 1,527,032 |
| BERMUDA — 0.4% | | | | | | 3,169,091 |
| Seadrill Ltd. | 41,200 | 843,657 | | INDIA — 2.2% | | |
| BRAZIL — 2.2% | | | | HDFC Bank Ltd. | 22,100 | 899,533 |
| Banco Santander | | | | | | |
| Brasil SA ADR | 77,300 | 805,466 | | Infosys Technologies Ltd. | 28,500 | 1,637,505 |
| Itau Unibanco Holding SA | | | | Larsen & Toubro Ltd. | 27,000 | 945,037 |
| Preference Shares | 46,200 | 854,353 | | State Bank of India Ltd. | 15,800 | 760,860 |
| Vale SA Preference Shares | 117,900 | 2,718,345 | | | | 4,242,935 |
| | | 4,378,164 | | INDONESIA — 1.1% | | |
| CANADA — 0.7% | | | | PT Bank Mandiri | | |
| Canadian National | | | | (Persero) Tbk | 2,851,500 | 1,571,809 |
| Railway Co. | 25,700 | 1,474,991 | | PT United Tractors Tbk | 292,000 | 558,768 |
| CZECH REPUBLIC — 0.6% | | | | | | 2,130,577 |
| CEZ AS(1) | 26,200 | 1,094,156 | | IRELAND — 0.5% | | |
| DENMARK — 2.0% | | | | Ryanair Holdings plc ADR(1) | 37,719 | 887,905 |
| Carlsberg A/S B Shares | 13,000 | 981,847 | | ISRAEL — 0.6% | | |
| Novo Nordisk A/S B Shares | 39,600 | 3,044,508 | | Teva Pharmaceutical | | |
| | | 4,026,355 | | Industries Ltd. ADR | 22,700 | 1,244,414 |
| FINLAND — 0.5% | | | | ITALY — 1.3% | | |
| Fortum Oyj | 41,900 | 944,847 | | Saipem SpA | 82,362 | 2,554,378 |
| FRANCE — 7.1% | | | | JAPAN — 15.6% | | |
| Air Liquide SA | 17,920 | 1,741,113 | | Asahi Glass Co. Ltd. | 213,000 | 2,232,933 |
| BNP Paribas | 41,970 | 2,379,419 | | Canon, Inc. | 47,300 | 1,937,601 |
| Cie Generale d’Optique | | | | Fanuc Ltd. | 18,000 | 1,888,846 |
| Essilor International SA | 17,100 | 972,742 | | Honda Motor Co. Ltd. | 84,500 | 2,566,620 |
| Danone SA | 29,122 | 1,488,075 | | HOYA Corp. | 60,900 | 1,447,074 |
| JC Decaux SA(1) | 41,400 | 977,957 | | Komatsu Ltd. | 97,000 | 1,822,448 |
| LVMH Moet Hennessy | | | | Mitsubishi Corp. | 108,000 | 2,438,182 |
| Louis Vuitton SA | 19,200 | 2,015,867 | | Mitsubishi UFJ Financial | | |
| Pernod-Ricard SA | 24,458 | 1,834,138 | | Group, Inc. | 212,000 | 1,029,827 |
| Total SA | 30,724 | 1,433,050 | | Nidec Corp. | 24,600 | 2,236,892 |
| Vallourec SA | 6,600 | 1,220,761 | | Omron Corp. | 103,500 | 2,144,128 |
| | | 14,063,122 | | ORIX Corp. | 24,700 | 1,886,974 |
12
| | | | | | |
| NT International Growth | | | | |
| |
| | Shares | Value | | | Shares | Value |
| Rakuten, Inc. | 4,100 | $ 2,869,617 | | SPAIN — 2.4% | | |
| Shin-Etsu Chemical Co. Ltd. | 16,400 | 826,899 | | Banco Bilbao Vizcaya | | |
| SMC Corp. | 12,100 | 1,547,843 | | Argentaria SA | 205,800 | $ 2,132,682 |
| SOFTBANK CORP. | 47,200 | 1,135,740 | | Banco Santander SA | 142,358 | 1,444,859 |
| Unicharm Corp. | 14,600 | 1,439,965 | | Inditex SA | 22,200 | 1,237,014 |
| Yahoo! Japan Corp. | 4,000 | 1,394,616 | | | | 4,814,555 |
| | | 30,846,205 | | SWEDEN — 3.7% | | |
| LUXEMBOURG — 0.9% | | | | Alfa Laval AB | 72,100 | 910,099 |
| Millicom International | | | | Atlas Copco AB A Shares | 149,600 | 2,116,063 |
| Cellular SA | 21,806 | 1,742,954 | | Telefonaktiebolaget LM | | |
| MACAU — 0.6% | | | | Ericsson B Shares | 140,600 | 1,415,812 |
| Wynn Macau Ltd.(1) | 756,000 | 1,213,880 | | Volvo AB B Shares(1) | 277,500 | 2,873,739 |
| MEXICO — 0.4% | | | | | | 7,315,713 |
| Grupo Financiero Banorte | | | | SWITZERLAND — 8.4% | | |
| SAB de CV, Series O | 194,500 | 748,170 | | Adecco SA | 23,000 | 1,110,996 |
| NETHERLANDS — 4.6% | | | | Credit Suisse Group AG | 60,100 | 2,329,875 |
| Akzo Nobel NV | 23,300 | 1,184,200 | | Holcim Ltd. | 20,200 | 1,273,090 |
| ASML Holding NV | 39,500 | 1,115,706 | | Kuehne + Nagel | | |
| Koninklijke KPN NV | 65,900 | 858,497 | | International AG | 15,900 | 1,489,851 |
| Royal Dutch Shell plc, | | | | Nestle SA | 19,500 | 880,329 |
| Class A | 90,000 | 2,357,417 | | Novartis AG | 57,565 | 2,606,301 |
| Unilever NV CVA | 131,800 | 3,596,221 | | Roche Holding AG | 18,166 | 2,490,870 |
| | | 9,112,041 | | Sonova Holding AG | 7,300 | 785,586 |
| NORWAY — 1.0% | | | | Swatch Group AG (The) | 6,900 | 1,794,367 |
| Petroleum Geo-Services | | | | Syngenta AG | 4,207 | 929,517 |
| ASA(1) | 118,100 | 1,193,919 | | Zurich Financial Services AG | 4,200 | 853,569 |
| Statoil ASA | 41,600 | 833,457 | | | | 16,544,351 |
| | | 2,027,376 | | TAIWAN (REPUBLIC OF CHINA) — 2.8% | |
| PEOPLE’S REPUBLIC OF CHINA — 3.1% | | | Hon Hai Precision | | |
| Baidu, Inc. ADR(1) | 20,400 | 1,493,484 | | Industry Co. Ltd. | 492,000 | 1,940,054 |
| Ctrip.com International Ltd. | | | | HTC Corp. | 127,000 | 1,716,191 |
| ADR(1) | 28,964 | 1,140,892 | | Nan Ya Printed Circuit | | |
| Industrial & Commercial | | | | Board Corp. | 259,000 | 1,084,401 |
| Bank of China Ltd. H Shares | 656,000 | 482,562 | | Taiwan Semiconductor | | |
| Mindray Medical | | | | Manufacturing Co. Ltd. | 442,000 | 807,210 |
| International Ltd. ADR | 37,600 | 1,118,224 | | | | 5,547,856 |
| Tencent Holdings Ltd. | 66,700 | 1,269,657 | | UNITED KINGDOM — 19.9% | | |
| ZTE Corp. H Shares | 178,000 | 582,661 | | Admiral Group plc | 70,476 | 1,310,089 |
| | | 6,087,480 | | Antofagasta plc | 63,213 | 804,821 |
| POLAND — 0.9% | | | | ARM Holdings plc | 550,300 | 1,964,825 |
| Powszechna Kasa | | | | Autonomy Corp. plc(1) | 41,883 | 1,057,933 |
| Oszczednosci Bank Polski SA | 140,800 | 1,718,299 | | Barclays plc | 617,635 | 2,694,703 |
| SINGAPORE — 0.8% | | | | BG Group plc | 179,331 | 2,744,936 |
| United Overseas Bank Ltd. | 116,617 | 1,507,467 | | BP plc | 63,076 | 450,839 |
| SOUTH KOREA — 1.7% | | | | British Airways plc(1) | 288,400 | 835,502 |
| Hyundai Motor Co. | 13,495 | 1,540,109 | | | | |
| | | | | Capita Group plc (The) | 91,763 | 1,034,001 |
| POSCO | 2,400 | 935,932 | | | | |
| | | | | Carnival plc | 58,013 | 2,202,657 |
| Samsung Electronics Co. Ltd. | 1,400 | 904,926 | | | | |
| | | | | Compass Group plc | 240,039 | 1,853,817 |
| | | 3,380,967 | | | | |
13
| | | | | |
| NT International Growth | | | |
| |
| | Shares | Value | | Market Sector Diversification | |
| HSBC Holdings plc | | | | (as a % of net assets) | |
| (Hong Kong) | 336,978 | $ 3,088,655 | | Financials | 17.4% |
| Intercontinental Hotels | | | | Industrials | 17.2% |
| Group plc | 107,000 | 1,687,392 | | Consumer Discretionary | 15.2% |
| ITV plc(1) | 2,357,400 | 1,900,162 | | | |
| | | | | Information Technology | 12.8% |
| Kingfisher plc | 510,932 | 1,648,395 | | Consumer Staples | 9.6% |
| Lonmin plc(1) | 43,600 | 1,056,014 | | Materials | 8.9% |
| Reckitt Benckiser Group plc | 51,108 | 2,393,661 | | Energy | 7.6% |
| Rolls-Royce Group plc(1) | 192,729 | 1,637,878 | | Health Care | 7.1% |
| Rolls-Royce Group plc | | | | Telecommunication Services | 2.6% |
| C Shares(1) | 16,679,610 | 24,121 | | | |
| | | | | Utilities | 1.0% |
| Schroders plc | 49,409 | 945,981 | | Cash and Equivalents* | 0.6% |
| Smiths Group plc | 78,300 | 1,168,863 | | | |
| Standard Chartered plc | 31,038 | 732,976 | | *Includes temporary cash investments and other assets and liabilities. |
| Tesco plc | 342,253 | 2,034,190 | | | |
| Tullow Oil plc | 59,000 | 950,496 | | Notes to Schedule of Investments | |
| Vodafone Group plc | 711,500 | 1,424,734 | | ADR = American Depositary Receipt | |
| Wolseley plc(1) | 67,800 | 1,610,526 | | CVA = Certificaten Van Aandelen | |
| | | 39,258,167 | | (1) Non-income producing. | |
| TOTAL COMMON STOCKS | | | | | |
| (Cost $188,521,711) | | 196,368,685 | | | |
| Temporary Cash Investments — 0.2% | | See Notes to Financial Statements. | |
| JPMorgan U.S. Treasury | | | | | |
| Plus Money Market Fund | | | | | |
| Agency Shares | 54,009 | 54,009 | | | |
| Repurchase Agreement, Credit Suisse First | | | | |
| Boston, Inc., (collateralized by various U.S. | | | | |
| Treasury obligations, 0.875%, 10/31/11, | | | | |
| valued at $306,325), in a joint trading | | | | |
| account at 0.15%, dated 5/28/10, due | | | | |
| 6/1/10 (Delivery value $300,005) | | 300,000 | | | |
| TOTAL TEMPORARY | | | | | |
| CASH INVESTMENTS | | | | | |
| (Cost $354,009) | | 354,009 | | | |
| TOTAL INVESTMENT | | | | | |
| SECURITIES — 99.6% | | | | | |
| (Cost $188,875,720) | | 196,722,694 | | | |
| OTHER ASSETS AND | | | | | |
| LIABILITIES — 0.4% | | 718,863 | | | |
| TOTAL NET ASSETS — 100.0% | | $197,441,557 | | | |
14
|
| Statement of Assets and Liabilities |
| |
| MAY 28, 2010 (UNAUDITED) | |
| Assets | |
| Investment securities, at value (cost of $188,875,720) | $196,722,694 |
| Foreign currency holdings, at value (cost of $737,270) | 737,035 |
| Receivable for investments sold | 1,126,923 |
| Receivable for capital shares sold | 84,769 |
| Dividends and interest receivable | 865,097 |
| Other assets | 3,739 |
| | 199,540,257 |
| | |
| Liabilities | |
| Disbursements in excess of demand deposit cash | 137,005 |
| Payable for investments purchased | 1,768,157 |
| Accrued management fees | 176,537 |
| Accrued foreign taxes | 17,001 |
| | 2,098,700 |
| | |
| Net Assets | $197,441,557 |
| | |
| Institutional Class Capital Shares, $0.01 Par Value | |
| Authorized | 100,000,000 |
| Outstanding | 25,317,221 |
| | |
| Net Asset Value Per Share | $7.80 |
| | |
| Net Assets Consist of: | |
| Capital (par value and paid-in surplus) | $205,508,330 |
| Undistributed net investment income | 1,230,410 |
| Accumulated net realized loss on investment and foreign currency transactions | (17,120,852) |
| Net unrealized appreciation on investments and translation of assets and liabilities in foreign currencies | 7,823,669 |
| | $197,441,557 |
| |
| |
| See Notes to Financial Statements. | |
15
| |
| FOR THE SIX MONTHS ENDED MAY 28, 2010 (UNAUDITED) | |
| Investment Income (Loss) | |
| Income: | |
| Dividends (net of foreign taxes withheld of $272,409) | $ 2,480,620 |
| Interest | 1,551 |
| | 2,482,171 |
| | |
| Expenses: | |
| Management fees | 1,036,899 |
| Directors’ fees and expenses | 2,509 |
| Other expenses | 213 |
| | 1,039,621 |
| | |
| Net investment income (loss) | 1,442,550 |
| | |
| Realized and Unrealized Gain (Loss) | |
| Net realized gain (loss) on: | |
| Investment transactions (net of foreign tax expenses paid (refunded) of $25,540) | 6,019,482 |
| Foreign currency transactions (net of foreign tax expenses paid (refunded) of $3,686) | (81,022) |
| | 5,938,460 |
| | |
| Change in net unrealized appreciation (depreciation) on: | |
| Investments (net of deferred foreign taxes of $(32,043)) | (7,701,400) |
| Translation of assets and liabilities in foreign currencies | (16,870,728) |
| | (24,572,128) |
| | |
| Net realized and unrealized gain (loss) | (18,633,668) |
| | |
| Net Increase (Decrease) in Net Assets Resulting from Operations | $(17,191,118) |
| |
| |
| See Notes to Financial Statements. | |
16
|
| Statement of Changes in Net Assets |
| | |
| SIX MONTHS ENDED MAY 28, 2010 (UNAUDITED) AND YEAR ENDED NOVEMBER 30, 2009 | |
| Increase (Decrease) in Net Assets | 2010 | 2009 |
| Operations | | |
| Net investment income (loss) | $ 1,442,550 | $ 1,664,354 |
| Net realized gain (loss) | 5,938,460 | (9,900,332) |
| Change in net unrealized appreciation (depreciation) | (24,572,128) | 49,236,728 |
| Net increase (decrease) in net assets resulting from operations | (17,191,118) | 41,000,750 |
| | | |
| Distributions to Shareholders | | |
| From net investment income | (2,270,324) | (1,011,101) |
| | | |
| Capital Share Transactions | | |
| Proceeds from shares sold | 58,369,418 | 97,265,914 |
| Payments for shares redeemed | (4,942,708) | (29,638,929) |
| Net increase (decrease) in net assets from capital share transactions | 53,426,710 | 67,626,985 |
| | | |
| Net increase (decrease) in net assets | 33,965,268 | 107,616,634 |
| | | |
| Net Assets | | |
| Beginning of period | 163,476,289 | 55,859,655 |
| End of period | $197,441,557 | $163,476,289 |
| | | |
| Undistributed net investment income | $1,230,410 | $2,058,184 |
| | | |
| Transactions in Shares of the Fund | | |
| Sold | 6,891,800 | 14,216,297 |
| Redeemed | (561,734) | (4,111,431) |
| Net increase (decrease) in shares of the fund | 6,330,066 | 10,104,866 |
| |
| |
| See Notes to Financial Statements. | | |
17
|
| Notes to Financial Statements |
MAY 28, 2010 (UNAUDITED)
1. Organization and Summary of Significant Accounting Policies
Organization — American Century World Mutual Funds, Inc. (the corporation) is registered under the Investment Company Act of 1940 (the 1940 Act) as an open-end management investment company. NT International Growth Fund (the fund) is one fund in a series issued by the corporation. The fund is diversified under the 1940 Act. The fund’s investment objective is to seek capital growth. The fund pursues its objective by investing primarily in equity securities of foreign companies located in at least three developed countries (excluding United States). The fund is not permitted to invest in any securities issued by companies assigned by the Global Industry Classification Standard to the tobacco industry. The following is a summary of the fund’s significant accounting policies.
Security Valuations — Securities traded primarily on a principal securities exchange are valued at the last reported sales price, or at the mean of the latest bid and asked prices where no last sales price is available. Depending on local convention or regulation, securities traded over-the-counter are valued at the mean of the latest bid and asked prices, the last sales price, or the official close price. Investments in open-end management investment companies are valued at the reported net asset value. Discount notes may be valued through a commercial pricing service or at amortized cost, which approximates fair value. Securities traded on foreign securities exchanges and over-the-counter markets are normally completed before the close of business on days that the New York Stock Exchange (the Exchange) is open and may also take place on days when the Exchange is not open. If an event occurs after the value of a security was established but before the net asset value per share was determined that was likely to materially change the net asset value, that security would be valued as determined in accordance with procedures adopted by the Board of Directors. If the fund determines that the market price of a portfolio security is not readily available, or that the valuation methods mentioned above do not reflect the security’s fair value, such security is valued as determined by the Board of Directors or its designee, in accordance with procedures adopted by the Board of Directors, if such determination would materially impact a fund’s net asset value. Certain other circumstances may cause the fund to use alternative procedures to value a security such as: a security has been declared in default; trading in a security has been halted during the trading day; or there is a foreign market holiday and no trading will commence .
Security Transactions — For financial reporting purposes, security transactions are accounted for as of the trade date. Net realized gains and losses are determined on the identified cost basis, which is also used for federal income tax purposes. Certain countries impose taxes on realized gains on the sale of securities registered in their country. The fund records the foreign tax expense, if any, on an accrual basis. The foreign tax expense on realized gains and unrealized appreciation reduces the net realized gain (loss) on investment transactions and net unrealized appreciation (depreciation) on investments, respectively.
Investment Income — Dividend income less foreign taxes withheld, if any, is recorded as of the ex-dividend date. Interest income is recorded on the accrual basis and includes accretion of discounts and amortization of premiums.
Foreign Currency Translations — All assets and liabilities initially expressed in foreign currencies are translated into U.S. dollars at prevailing exchange rates at period end. The fund may enter into spot foreign currency exchange contracts to facilitate transactions denominated in a foreign currency. Purchases and sales of investment securities, dividend and interest income, spot foreign currency exchange contracts, and certain expenses are translated at the rates of exchange prevailing on the respective dates of such transactions. Realized and unrealized gains and losses from foreign currency translations arise from changes in currency exchange rates.
18
Net realized and unrealized foreign currency exchange gains or losses occurring during the holding period of investment securities are a component of net realized gain (loss) on foreign currency transactions and net unrealized appreciation (depreciation) on translation of assets and liabilities in foreign currencies, respectively. Certain countries may impose taxes on the contract amount of purchases and sales of foreign currency contracts in their currency. The fund records the foreign tax expense, if any, as a reduction to the net realized gain (loss) on foreign currency transactions.
Exchange Traded Funds — The fund may invest in exchange traded funds (ETFs). ETFs are a type of index fund bought and sold on a securities exchange. An ETF trades like common stock and represents a fixed portfolio of securities designed to track the performance and dividend yield of a particular domestic or foreign market index. A fund may purchase an ETF to temporarily gain exposure to a portion of the U.S. or a foreign market while awaiting purchase of underlying securities. The risks of owning an ETF generally reflect the risks of owning the underlying securities they are designed to track, although the lack of liquidity on an ETF could result in it being more volatile. Additionally, ETFs have fees and expenses that reduce their value.
Repurchase Agreements — The fund may enter into repurchase agreements with institutions that American Century Investment Management, Inc. (ACIM) has determined are credit-worthy pursuant to criteria adopted by the Board of Directors. Each repurchase agreement is recorded at cost. The fund requires that the collateral, represented by securities, received in a repurchase transaction be transferred to the custodian in a manner sufficient to enable the fund to obtain those securities in the event of a default under the repurchase agreement. ACIM monitors, on a daily basis, the securities transferred to ensure the value, including accrued interest, of the securities under each repurchase agreement is equal to or greater than amounts owed to the fund under each repurchase agreement.
Joint Trading Account — Pursuant to an Exemptive Order issued by the Securities and Exchange Commission, the fund, along with certain other funds in the American Century Investments family of funds, may transfer uninvested cash balances into a joint trading account. These balances are invested in one or more repurchase agreements that are collateralized by U.S. Treasury or Agency obligations.
Income Tax Status — It is the fund’s policy to distribute substantially all net investment income and net realized gains to shareholders and to otherwise qualify as a regulated investment company under provisions of the Internal Revenue Code. All tax years for the fund remain subject to examination by tax authorities. Additionally, non-U.S. tax returns filed by the fund due to investments in certain foreign securities remain subject to examination by the relevant taxing authority for seven years from the date of filing. At this time, management believes there are no uncertain tax positions which, based on their technical merit, would not be sustained upon examination and for which it is reasonably possible that the total amounts of unrecognized tax benefits will significantly change in the next twelve months. Accordi ngly, no provision has been made for federal or state income taxes.
Distributions to Shareholders — Distributions to shareholders are recorded on the ex-dividend date. Distributions from net investment income, if any, are generally declared and paid annually. Distributions from net realized gains, if any, are generally declared and paid twice per year. The fund may make distributions on a more frequent basis to comply with the distribution requirements of the Internal Revenue Code, in all events in a manner consistent with provisions of the 1940 Act.
Indemnifications — Under the corporation’s organizational documents, its officers and directors are indemnified against certain liabilities arising out of the performance of their duties to the fund. In addition, in the normal course of business, the fund enters into contracts that provide general indemnifications. The maximum exposure under these arrangements is unknown as this would involve future claims that may be made against a fund. The risk of material loss from such claims is considered by management to be remote.
19
Use of Estimates — The financial statements are prepared in conformity with accounting principles generally accepted in the United States of America, which may require management to make certain estimates and assumptions at the date of the financial statements. Actual results could differ from these estimates.
Subsequent Events — In preparing the financial statements, management evaluated the impact of events or transactions occurring through the date the financial statements were issued that would merit recognition or disclosure.
2. Fees and Transactions with Related Parties
Management Fees — The corporation has entered into a Management Agreement with American Century Global Investment Management, Inc. (ACGIM) (the investment advisor) (see Note 8), under which ACGIM provides the fund with investment advisory and management services in exchange for a single, unified management fee (the fee). The Agreement provides that all expenses of managing and operating the fund, except brokerage expenses, taxes, interest, fees and expenses of the independent directors (including legal counsel fees), and extraordinary expenses, will be paid by ACGIM. The fee is computed and accrued daily based on the daily net assets of the the fund and paid monthly in arrears. For funds with a stepped fee schedule, the rate of the fee is determined by applying a fee rate calculation formula. This formula takes into accou nt the fund’s assets as well as certain assets, if any, of other clients of the investment advisor outside the American Century Investments family of funds (such as subadvised funds and separate accounts) that have very similar investment teams and investment strategies (strategy assets). The strategy assets of the fund includes the assets of International Growth Fund, one fund in a series issued by the corporation. The annual management fee schedule ranges from 0.90% to 1.30%. The effective annual management fee for the six months ended May 28, 2010 was 1.14%.
ACGIM has entered into a Subadvisory Agreement with ACIM (the subadvisor) on behalf of the fund. The subadvisor makes investment decisions for the cash portion of the fund in accordance with the fund’s investment objectives, policies and restrictions under the supervision of ACGIM and the Board of Directors. ACGIM pays all costs associated with retaining ACIM as the subadvisor of the fund.
Acquired Fund Fees and Expenses — The fund may invest in mutual funds, exchange traded funds, and business development companies (the acquired funds). The fund will indirectly realize its pro rata share of the fees and expenses of the acquired funds in which it invests. These indirect fees and expenses are not paid out of the fund’s assets but are reflected in the return realized by the fund on its investment in the acquired funds.
Related Parties — Certain officers and directors of the corporation are also officers and/or directors of American Century Companies, Inc. (ACC), the parent of the corporation’s investment advisor, ACGIM, the corporation’s subadvisor, ACIM, the distributor of the corporation, American Century Investment Services, Inc., and the corporation’s transfer agent, American Century Services, LLC. The fund is wholly owned, in aggregate, by various funds in a series issued by American Century Asset Allocation Portfolios, Inc. (ACAAP). ACAAP does not invest in the fund for the purpose of exercising management or control.
The fund is eligible to invest in a money market fund for temporary purposes, which is managed by J.P. Morgan Investment Management, Inc. (JPMIM). The fund has a Mutual Funds Services Agreement with J.P. Morgan Investor Services Co. (JPMIS) and a securities lending agreement with JPMorgan Chase Bank (JPMCB). JPMCB is a custodian of the fund. JPMIM, JPMIS and JPMCB are wholly owned subsidiaries of JPMorgan Chase & Co. (JPM). JPM is an equity investor in ACC.
20
3. Investment Transactions
Purchases and sales of investment securities, excluding short-term investments, for the six months ended May 28, 2010, were $136,635,216 and $83,356,428, respectively.
4. Fair Value Measurements
The fund’s securities valuation process is based on several considerations and may use multiple inputs to determine the fair value of the positions held by the fund. In conformity with accounting principles generally accepted in the United States of America, the inputs used to determine a valuation are classified into three broad levels as follows:
• Level 1 valuation inputs consist of unadjusted quoted prices in an active market for identical securities;
• Level 2 valuation inputs consist of significant direct or indirect observable market data (including quoted prices for similar securities, evaluations of subsequent market events, interest rates, prepayment speeds, credit risk, etc.); or
• Level 3 valuation inputs consist of significant unobservable inputs (including a fund’s own assumptions).
The level classification is based on the lowest level input that is significant to the fair valuation measurement. The valuation inputs are not an indication of the risks associated with investing in these securities or other financial instruments.
The following is a summary of the valuation inputs used to determine the fair value of the fund’s securities as of May 28, 2010. The Schedule of Investments provides additional details on the fund’s portfolio holdings.
| | | |
| | Level 1 | Level 2 | Level 3 |
| Investment Securities | | | |
| Foreign Common Stocks | $8,433,339 | $187,935,346 | — |
| Temporary Cash Investments | 54,009 | 300,000 | — |
| Total Value of Investment Securities | $8,487,348 | $188,235,346 | — |
5. Risk Factors
There are certain risks involved in investing in foreign securities. These risks include those resulting from future adverse political, social, and economic developments, fluctuations in currency exchange rates, the possible imposition of exchange controls, and other foreign laws or restrictions. Investing in emerging markets may accentuate these risks.
6. Interfund Lending
The fund, along with certain other funds in the American Century Investments family of funds, may participate in an interfund lending program, pursuant to an Exemptive Order issued by the Securities and Exchange Commission (SEC). This program provides an alternative credit facility allowing the fund to borrow from or lend to other funds in the American Century Investments family of funds that permit such transactions. Interfund lending transactions are subject to each fund’s investment policies and borrowing and lending limits. The interfund loan rate earned/paid on interfund lending transactions is determined daily based on the average of certain current market rates. Interfund lending transactions normally extend only overnight, but can have a maximum duration of seven days. The program is subject to annual approval by the Board of Directors. During the six months ended May 28, 2010, the fund did not utiliz e the program.
21
7. Federal Tax Information
The book-basis character of distributions made during the year from net investment income or net realized gains may differ from their ultimate characterization for federal income tax purposes. These differences reflect the differing character of certain income items and net realized gains and losses for financial statement and tax purposes, and may result in reclassification among certain capital accounts on the financial statements.
As of May 28, 2010, the components of investments for federal income tax purposes were as follows:
| | |
| Federal tax cost of investments | $190,808,145 |
| Gross tax appreciation of investments | $ 16,555,326 |
| Gross tax depreciation of investments | (10,640,777) |
| Net tax appreciation (depreciation) of investments | $ 5,914,549 |
The difference between book-basis and tax-basis cost and unrealized appreciation (depreciation) is attributable primarily to the tax deferral of losses on wash sales.
As of November 30, 2009, the fund had accumulated capital losses of $(19,721,852), which represent net capital loss carryovers that may be used to offset future realized capital gains for federal income tax purposes. Future capital loss carryover utilization in any given year may be subject to Internal Revenue Code limitations. Capital loss carryovers of $(6,493,006) and $(13,228,846) expire in 2016 and 2017, respectively.
The fund has elected to treat $(72,856) and $(2,347) of net capital and foreign currency losses, respectively, incurred in the one-month period ended November 30, 2009, as having been incurred in the following fiscal year for federal income tax purposes.
8. Corporate Event
As part of a long-standing estate and business succession plan established by ACC Co-Chairman James E. Stowers, Jr., the founder of American Century Investments, ACC Co-Chairman Richard W. Brown succeeded Mr. Stowers as trustee of a trust that holds a greater-than-25% voting interest in ACC, the parent corporation of the fund’s advisors. Under the 1940 Act, this is presumed to represent control of ACC even though it is less than a majority interest. The change of trustee may technically be considered a “change of control” of ACC and therefore also a change of control of the fund’s advisors even though there has been no change to their management and none is anticipated. The “change of control” resulted in the assignment of the fund’s investment advisory and subadvisory agreements. Under the 1940 Act, an assignment automatically terminated such agreements, making the approval of a new agreement necessary.
On February 16, 2010, the Board of Directors approved interim investment advisory and subadvisory agreements under which the fund will be managed until a new agreement is approved by fund shareholders. The interim agreements are substantially identical to the terminated agreements (with the exception of different effective and termination dates) and will not result in changes in the management of American Century Investments, the fund, its investment objectives, fees or services provided. On March 29, 2010, the Board of Directors approved a new investment advisory agreement. The new agreement is also substantially identical to the terminated agreement (except for the date, the substitution of ACIM for ACGIM and certain other non-material changes). In order to streamline American Century’s corporate organization, ACGIM was merged into ACIM on July 16, 2010. The new agreement for the fund was approved by shareh olders at a Special Meeting of Shareholders on June 16, 2010. The new agreement went into effect on July 16, 2010.
22
| | | | | | |
| NT International Growth | | | | |
| |
| Institutional Class | | | | | |
| For a Share Outstanding Throughout the Years Ended November 30 (except as noted) | | |
| | | 2010(1) | 2009 | 2008 | 2007 | 2006(2) |
| Per-Share Data | | | | | |
| Net Asset Value, Beginning of Period | $8.61 | $6.29 | $12.72 | $10.34 | $10.00 |
| Income From Investment Operations | | | | | |
| Net Investment Income (Loss) | 0.07(3) | 0.10(3) | 0.16(3) | 0.12 | 0.03 |
| Net Realized and Unrealized Gain (Loss) | (0.76) | 2.33 | (6.18) | 2.29 | 0.31 |
| Total From Investment Operations | (0.69) | 2.43 | (6.02) | 2.41 | 0.34 |
| Distributions | | | | | |
| From Net Investment Income | (0.12) | (0.11) | (0.12) | (0.03) | — |
| From Net Realized Gains | — | — | (0.29) | — | — |
| Total Distributions | (0.12) | (0.11) | (0.41) | (0.03) | — |
| Net Asset Value, End of Period | $7.80 | $8.61 | $6.29 | $12.72 | $10.34 |
| |
| Total Return(4) | (8.14)% | 39.09% | (48.82)% | 23.40% | 3.40% |
| | | | | | |
| Ratios/Supplemental Data | | | | | |
| Ratio of Operating Expenses | | | | | |
| to Average Net Assets | 1.15%(5) | 1.18% | 1.12% | 1.07% | 1.07%(5) |
| Ratio of Net Investment Income (Loss) | | | | | |
| to Average Net Assets | 1.59%(5) | 1.41% | 1.62% | 1.15% | 0.59%(5) |
| Portfolio Turnover Rate | 46% | 132% | 119% | 104% | 65% |
| Net Assets, End of Period (in thousands) | $197,442 | $163,476 | $55,860 | $67,703 | $46,380 |
| (1) | Six months ended May 28, 2010 (unaudited). | | | | | |
| (2) | May 12, 2006 (fund inception) through November 30, 2006. | | | | |
| (3) | Computed using average shares outstanding throughout the period. | | | | |
| (4) | Total return assumes reinvestment of net investment income and capital gains distributions, if any. Total returns for periods less than one year |
| | are not annualized. Total returns are calculated based on the net assets value of the last business day. | | |
| (5) | Annualized | | | | | |
See Notes to Financial Statements.
23
|
| Board Approval of Management and Subadvisory Agreements |
American Century Global Investment Management, Inc. (“ACGIM” or the “Advisor”) currently serves as investment advisor to the Fund under an interim management agreement (the “Interim Management Agreement”) between the Advisor and the Fund approved by the Fund’s Board of Directors (the “Board”). American Century Investment Management, Inc. (“ACIM” or the “Subadvisor”) currently serves as subadvisor to the Fund under an interim investment subadvisory agreement (the “Interim Subadvisory Agreement” and, together with the Interim Management Agreement, the “Interim Agreements”). The Advisor and the Subadvisor (together, the “Advisors”) previously served as investment advisors to the Fund pursuant to agreements (the “Prior Agreements”) that terminated in accordance with their terms on February 16, 2010, as a result of a change of control of the Advisor’s and the Subadvisor’s parent company, American Century Companies, Inc. (“ACC”). The change in control occurred as the result of a change in the trustee of a trust created by James E. Stowers, Jr., the founder of American Century Investments, which holds shares representing a significant interest in ACC stock. Mr. Stowers previously served as the trustee of the trust. On February 16, 2010, Mr. Richard W. Brown, Co-Chairman of ACC with Mr. Stowers, became the trustee in accordance with the terms of the trust and Mr. Stowers’ long-standing estate and succession plan.
On February 18, 2010, the Board approved the Interim Agreements in accordance with Rule 15a-4 under the Investment Company Act to ensure continued management of the Funds by the Advisor and the Subadvisor after the termination of the Prior Agreements and until shareholder approval of a new management agreement (the “Proposed Agreement”) as required under the Act. The Board approved the Proposed Agreement and recommended its approval to shareholders. Fund shareholders approved the Proposed Agreement at a meeting on June 16, 2010.
Because American Century had indicated its intention to merge ACGIM into ACIM prior to the expiration of the Interim Agreements, the Proposed Agreement is with ACIM as sole investment advisor to the Fund. The Board took into consideration that the combination is being undertaken for reasons of organizational simplification and will eliminate the need for multiple investment management agreements without changing the nature, quality, or extent of services provided to the Fund. The Board noted that the merger was not related to the change of control that necessitated the Interim Agreements and would not result in any change to the personnel managing the Fund.
The Interim Agreements and the Proposed Agreement are substantially identical to the Prior Agreements except for their effective dates, the termination provisions of the Interim Agreements, and the elimination of a subadvisor in the Proposed Agreement. Under the Proposed Agreement, ACIM will provide the same services as provided by ACGIM and ACIM, be subject to the same duties, and receive the same compensation rate as under the Prior Agreements.
24
Basis for Board Approval of Interim Agreements
In considering the approval of the Interim Agreements, Rule 15a-4 requires the Board to approve the contracts within ten business days of the termination of the prior agreements and to determine that the compensation to be received under each interim agreement is no greater than would have been received under the corresponding prior agreement. In connection with the approval, the Board noted that it oversees on a continuous basis and evaluates at its quarterly meetings, directly and through the committees of the Board, the nature and quality of significant services provided by the Advisor and the Subadvisor, the investment performance of the Fund, shareholder services, audit and compliance functions and a variety of other matters relating to the Fund’s operations.
In evaluating the Interim Agreements, the Board, assisted by the advice of its independent legal counsel, considered a number of factors in addition to those required by the rule with no one factor being determinative to its analysis. Among the factors considered by the Board were the circumstances and effect of the change of control, the fact that the Advisor and the Subadvisor will provide the same services and receive the same compensation rate as under the Prior Agreements, and that the change of control did not result in a change of the personnel managing the Fund. Upon completion of its analysis, the Board approved the Interim Agreements, determining that the continued management of the Fund by the Advisor and the Subadvisor was in the best interests of the Fund and Fund shareholders.
Basis for Board Approval of Proposed Agreement
At a meeting held on March 29, 2010, after considering all information presented, the Board approved, and determined to recommend that shareholders approve, the Proposed Agreement. In connection with that approval, the Board requested and reviewed extensive data and information compiled by the Advisor, the Subadvisor, and certain independent providers of evaluation data concerning the Fund and services provided to the Fund. The Board oversees on a continuous basis and evaluates at its quarterly meetings, directly and through the committees of the Board, the nature and quality of significant services provided to the Fund, the investment performance of the Fund, shareholder services, audit and compliance functions and a variety of other matters relating to the Fund’s operations. The information considered and the discussions held at the meetings included, but were not limited to:
• the nature, extent and quality of investment management, shareholder services and other services provided to the Fund;
• the wide range of programs and services provided to the Fund and their shareholders on a routine and non-routine basis;
• the compliance policies, procedures, and regulatory experience of the Advisors;
• data comparing the cost of owning the Fund to the cost of owning similar funds;
25
• the fact that there will be no changes to the fees, services, or personnel who provide such services as compared to the Prior Agreements;
• data comparing the Fund’s performance to appropriate benchmarks and/or a peer group of other mutual funds with similar investment objectives and strategies;
• financial data showing the profitability of the Fund to the Advisors and the overall profitability of the Advisors;
• data comparing services provided and charges to the Fund with those for other non-fund investment management clients of the Advisors; and
• consideration of collateral or “fall-out” benefits derived by the Advisors from the management of the Fund and potential sharing of economies of scale in connection with the management of the Fund.
The Board also considered whether there was any reason for not continuing the existing arrangement with the Advisor. In particular, the Board recognized that shareholders may have invested in the Fund on the strength of the Advisor’s industry standing and reputation and in the expectation that the Advisor will have a continuing role in providing services to the Fund.
The Board considered all of the information provided by the Advisor, the Subadvisor, the independent data providers, and the Board’s independent counsel, and evaluated such information for the Fund. The Board did not identify any single factor as being all-important or controlling, and each Board member may have attributed different levels of importance to different factors. In deciding to approve the Proposed Agreement under the terms ultimately determined by the Board to be appropriate, the Board based its decision on a number of factors, including the following:
Nature, Extent and Quality of Services — Generally. Under the Proposed Agreement, ACIM is responsible for providing or arranging for all services necessary for the operation of the Fund. The Board noted that under the Proposed Agreement, ACIM provides or arranges at its own expense a wide variety of services including:
• constructing and designing the Fund
• portfolio research and security selection
• initial capitalization/funding
• securities trading
• Fund administration
• custody of Fund assets
• daily valuation of the Fund’s portfolio
26
• shareholder servicing and transfer agency, including shareholder
confirmations, recordkeeping and communications
• legal services
• regulatory and portfolio compliance
• financial reporting
• marketing and distribution
The Board noted that many of these services have expanded over time both in terms of quantity and complexity in response to shareholder demands, competition in the industry, changing distribution channels and the changing regulatory environment.
Investment Management Services. The investment management services provided to the Fund are complex and provide Fund shareholders access to professional money management, instant diversification of their investments within an asset class, the opportunity to easily diversify among asset classes, and liquidity. As a part of its general oversight and in evaluating investment performance, the Board expects ACIM to manage the Fund in accordance with its investment objectives and approved strategies. In providing these services, ACIM utilizes teams of investment professionals who require extensive information technology, research, training, compliance and other systems to conduct their business. The Board, directly and through its Fund Performance Review Committee, regularly reviews investment performance information for the Fund, toget her with comparative information for appropriate benchmarks and/or peer groups of similarly-managed funds, over different time horizons. If performance concerns are identified, the Fund receives special reviews until performance improves, during which time the Board discusses with ACIM the reasons for such underperformance and any efforts being undertaken to improve performance.
Shareholder and Other Services. Under the Proposed Agreement, ACIM will also provide the Fund with a comprehensive package of transfer agency, shareholder, and other services. The Board, directly and through the various committees of the Board, regularly reviews reports and evaluations of such services. These reports include, but are not limited to, information regarding the operational efficiency and accuracy of the shareholder and transfer agency services provided, staffing levels, shareholder satisfaction (as measured by external as well as internal sources), technology support, new products and services offered to Fund shareholders, securities trading activities, portfolio valuation services, auditing services, and legal and operational compliance activities. Certain aspects of shareholder and transfer agency service level eff iciency and the quality of securities trading activities are measured by independent third party providers and are presented in comparison to other fund groups not managed by ACIM.
27
Costs of Services Provided and Profitability. The Advisor provided detailed information concerning its cost of providing various services to the Fund, its profitability in managing the Fund, its overall profitability, and its financial condition. The Board reviewed with the Advisor the methodology used to prepare this financial information. The Board has also reviewed with the Advisor its methodology for compensating the investment professionals that provide services to the Fund as well as compensation to the five highest paid personnel of the Advisor. This financial information regarding the Advisor is considered in order to evaluate the Advisor’s financial condition, its ability to continue to provide services under the Proposed Agreement, and the reasonableness of the proposed management fees. The Board concluded that the Advisor’s profits were reasonable in light of the services provided to the Fund.
Ethics. The Board generally considers ACIM’s commitment to providing quality services to shareholders and to conducting its business ethically. It noted that ACIM’s practices generally meet or exceed industry best practices.
Economies of Scale. The Board also reviewed information provided by ACIM regarding the possible existence of economies of scale in connection with the management of the Fund. The Board concluded that economies of scale are difficult to measure and predict with precision, especially on a fund-by-fund basis. The analysis of economies of scale is further complicated by the additional services and content provided by ACIM and its reinvestment in its ability to provide and expand those services. Accordingly, the Board seeks to evaluate economies of scale by reviewing information, such as year-over-year profitability of its advisor generally, the profitability of its management of the Fund specifically, and the expenses incurred by the advisor in providing various functions to the Fund. The Board believes ACIM will appropriately sha re economies of scale through its competitive fee structure, offering competitive fees from fund inception, fee breakpoints as the Fund increases in size, and through reinvestment in its business to provide shareholders additional services and enhancements to existing services.
Comparison to Fees of Funds not Managed by the Advisor. Both the Prior and Proposed Agreements provide that the Fund pays ACGIM or ACIM a single, all-inclusive (or unified) management fee for providing all services necessary for the management and operation of the Fund, other than brokerage expenses, taxes, interest, extraordinary expenses, and the fees and expenses of the Fund’s Independent Directors (including their independent legal counsel) and expenses incurred in connection with the provision of shareholder services and distribution services under a plan adopted pursuant to Rule 12b-1 under the 1940 Act. Under the unified fee structure, ACIM is responsible for providing all investment advisory, custody, audit, administrative, compliance, recordkeeping, marketing and shareholder services, or arranging and supervising third parties that provide such services. By contrast, most other funds are charged a variety of fees, including an investment advisory fee, a transfer agency fee, an administrative fee, distribution charges and other expenses. Other than their investment advisory fees and any applicable Rule 12b-1 distribution fees, the components of the total fees charged by these other funds may be
28
increased without shareholder approval. The Board believes the unified fee structure is a benefit to Fund shareholders because it clearly discloses to shareholders the cost of owning Fund shares, and, since the unified fee cannot be increased without a vote of Fund shareholders, it shifts to ACIM the risk of increased costs of operating the Fund and provides a direct incentive to minimize administrative inefficiencies. Part of the Board’s analysis of fee levels involves reviewing certain evaluative data compiled by an independent provider comparing the Fund’s unified fee to the total expense ratios of similar funds not managed by ACIM. The Board concluded that the management fee to be paid by the Fund to ACIM under the Proposed Agreement is reasonable in light of the services to be provided to the Fund.
Comparison to Fees and Services Provided to Other Clients of the Advisor. The Board also requested and received information from ACIM concerning the nature and extent of the services, fees, and profitability of its advisory services to advisory clients other than the Fund. They observed that these varying types of client accounts require different services and involve different regulatory and entrepreneurial risks than the management of the Fund. The Board analyzed this information and concluded that the fees charged and services provided to the Fund were reasonable by comparison.
Collateral or “Fall-Out” Benefits Derived by the Advisor. The Board considered the existence of collateral benefits ACIM may receive as a result of its relationship with the Fund. The Board concluded that ACIM’s primary business is managing mutual funds and it generally does not use Fund or shareholder information to generate profits in other lines of business, and therefore does not derive any significant collateral benefits from them. The Board noted that ACIM receives proprietary research from broker-dealers that execute Fund portfolio transactions and concluded that this research is likely to benefit Fund shareholders. The Board also determined that ACIM is able to provide investment management services to certain clients other than the Fund, at least in part, due to its existing infrastructure built to serv e the fund complex. The Board concluded, however, that the assets of those other clients are not material to the analysis and, in any event, are included with the assets of fund clients to determine breakpoints in each fund’s fee schedule, provided they are managed using the same investment team and strategy.
Conclusion of the Board. As a result of this process, the Board, in the absence of particular circumstances and assisted by the advice of its independent legal counsel, taking into account all of the factors discussed above and the information provided by ACIM and others, concluded that the Proposed Agreement be approved and recommended its approval to Fund shareholders.
29
Retirement Account Information
As required by law, distributions you receive from certain IRAs, or 403(b), 457 and qualified plans are subject to federal income tax withholding, unless you elect not to have withholding apply. Tax will be withheld on the total amount withdrawn even though you may be receiving amounts that are not subject to withholding, such as nondeductible contributions. In such case, excess amounts of withholding could occur. You may adjust your withholding election so that a greater or lesser amount will be withheld.
If you don’t want us to withhold on this amount, you must notify us to not withhold the federal income tax. You may notify us in writing or in certain situations by telephone or through other electronic means. You have the right to revoke your withholding election at any time and any election you make may remain in effect until revoked by filing a new election.
Remember, even if you elect not to have income tax withheld, you are liable for paying income tax on the taxable portion of your withdrawal. If you elect not to have income tax withheld or you don’t have enough income tax withheld, you may be responsible for payment of estimated tax. You may incur penalties under the estimated tax rules if your withholding and estimated tax payments are not sufficient. You can reduce or defer the income tax on a distribution by directly or indirectly rolling such distribution over to another IRA or eligible plan. You should consult your tax advisor for additional information.
State tax will be withheld if, at the time of your distribution, your address is within one of the mandatory withholding states and you have federal income tax withheld. State taxes will be withheld from your distribution in accordance with the respective state rules.
Proxy Voting Guidelines
American Century Investment Management, Inc., the fund’s investment advisor, is responsible for exercising the voting rights associated with the securities purchased and/or held by the fund. A description of the policies and procedures the advisor uses in fulfilling this responsibility is available without charge, upon request, by calling 1-800-345-2021. It is also available on American Century Investments’ website at americancentury.com and on the Securities and Exchange Commission’s website at sec.gov. Information regarding how the investment advisor voted proxies relating to portfolio securities during the most recent 12-month period ended June 30 is available on the “About Us” page at americancentury.com. It is also available at sec.gov.
Quarterly Portfolio Disclosure
The fund files its complete schedule of portfolio holdings with the Securities and Exchange Commission (SEC) for the first and third quarters of each fiscal year on Form N-Q. The fund’s Forms N-Q are available on the SEC’s website at sec.gov, and may be reviewed and copied at the SEC’s Public Reference Room in Washington, DC. Information on the operation of the Public Reference Room may be obtained by calling 1-800-SEC-0330. The fund also makes its complete schedule of portfolio holdings for the most recent quarter of its fiscal year available on its website at americancentury.com and, upon request, by calling 1-800-345-2021.
30
The following indices are used to illustrate investment market, sector, or style performance or to serve as fund performance comparisons. They are not investment products available for purchase.
Morgan Stanley Capital International (MSCI) has developed several indices that measure the performance of foreign stock markets.
The MSCI EAFE (Europe, Australasia, Far East) Index is designed to measure developed market equity performance, excluding the U.S. and Canada.
The MSCI EAFE Growth Index is a capitalization-weighted index that monitors the performance of growth stocks from Europe, Australasia, and the Far East.
The MSCI EAFE Value Index is a capitalization-weighted index that monitors the performance of value stocks from Europe, Australasia, and the Far East.
The MSCI EM (Emerging Markets) Index represents the performance of stocks in global emerging market countries.
The MSCI Europe Index is designed to measure equity market performance in Europe.
The MSCI Japan Index is designed to measure equity market performance in Japan.
The MSCI World Free Index represents the performance of stocks in developed countries (including the United States) that are available for purchase by global investors.
31
32

| |
| |
| Contact Us | |
| americancentury.com | |
| Automated Information Line | 1-800-345-8765 |
| Investor Services Representative | 1-800-345-2021 or |
| | 816-531-5575 |
| Investors Using Advisors | 1-800-378-9878 |
| Business, Not-For-Profit, Employer-Sponsored | |
| Retirement Plans | 1-800-345-3533 |
| Banks and Trust Companies, Broker-Dealers, | |
| Financial Professionals, Insurance Companies | 1-800-345-6488 |
| Telecommunications Device for the Deaf | 1-800-634-4113 |
| American Century World Mutual Funds, Inc. | |
| Investment Advisor: | |
| American Century Investment Management, Inc. | |
| Kansas City, Missouri | |
This report and the statements it contains are submitted for the general
information of our shareholders. The report is not authorized for distribution to
prospective investors unless preceded or accompanied by an effective prospectus.
American Century Investment Services, Inc., Distributor
©2010 American Century Proprietary Holdings, Inc. All rights reserved.
1007
CL-SAN-68669
|
| Semiannual Report |
| May 28, 2010 |

|
| American Century Investments® |
NT Emerging Markets Fund
| |
| President’s Letter | 2 |
| Independent Chairman’s Letter | 3 |
| Market Perspective | 4 |
| International Equity Total Returns | 4 |
| |
| NT Emerging Markets | |
| |
| Performance | 5 |
| Portfolio Commentary | 6 |
| Top Ten Holdings | 8 |
| Types of Investments in Portfolio | 8 |
| Investments by Country | 8 |
| |
| Shareholder Fee Example | 9 |
| |
| Financial Statements | |
| |
| Schedule of Investments | 11 |
| Statement of Assets and Liabilities | 14 |
| Statement of Operations | 15 |
| Statement of Changes in Net Assets | 16 |
| Notes to Financial Statements | 17 |
| Financial Highlights | 22 |
| |
| Other Information | |
| |
| Board Approval of Management and Subadvisory Agreements | 23 |
| Additional Information | 29 |
| Index Definitions | 30 |
Any opinions expressed in this report reflect those of the author as of the date of the report, and do not necessarily represent the opinions of American Century Investments or any other person in the American Century Investments organization. Any such opinions are subject to change at any time based upon market or other conditions and American Century Investments disclaims any responsibility to update such opinions. These opinions may not be relied upon as investment advice and, because investment decisions made by American Century Investments funds are based on numerous factors, may not be relied upon as an indication of trading intent on behalf of any American Century Investments fund. Security examples are used for representational purposes only and are not intended as recommendations to purchase or sell securities. Performance information for comparative indices and securities is provided to American Century Investments by third party vendors. To the best of American Century Investments’ knowledge, such information is accurate at the time of printing.

Dear Investor:
To learn more about the capital markets, your investment, and the portfolio management strategies American Century Investments provides, we encourage you to review this shareholder report for the financial reporting period ended May 28, 2010.
On the following pages, you will find investment performance and portfolio information, presented with the expert perspective and commentary of our portfolio management team. This report remains one of our most important vehicles for conveying the information you need about your investment performance, and about the market factors and strategies that affect fund returns. For additional information on the markets, we encourage you to visit the “Insights & News” tab at our Web site, americancentury.com, for updates and further expert commentary.
The top of our Web site’s home page also provides a link to “Our Story,” which, first and foremost, outlines our commitment—since 1958—to helping clients reach their financial goals. We believe strongly that we will only be successful when our clients are successful. That’s who we are.
Another important, unique facet of our story and who we are is “Profits with a Purpose,” which describes our bond with the Stowers Institute for Medical Research (SIMR). SIMR is a world-class biomedical organization—founded by our company founder James E. Stowers, Jr. and his wife Virginia—that is dedicated to researching the causes, treatment, and prevention of gene-based diseases, including cancer. Through American Century Investments’ private ownership structure, more than 40% of our profits support SIMR.
Mr. Stowers’ example of achieving financial success and using that platform to help humanity motivates our entire American Century Investments team. His story inspires us to help each of our clients achieve success. Thank you for sharing your financial journey with us.
Sincerely,

President and Chief Executive Officer
American Century Investments
2
|
| Independent Chairman’s Letter |

Fellow Shareholders,
The principal event at a recent board meeting was the retirement of Jim Stowers, Jr. from the American Century Mutual Funds Kansas City board. This was one of those times when you felt like you were living a historical moment. Jim—who celebrated his 86th birthday in January—founded what was known as Twentieth Century Mutual Funds over 50 years ago. Through the years, his number one priority has been to “Put Investors First!” The board presented Jim with a resolution acknowledging that, by building a successful investment company, he has impacted the lives of many by helping them on the path to financial success.
We respect Jim’s decision to focus his energy on the Stowers Institute for Medical Research and American Century Companies, Inc. (ACC), the parent company of the funds’ investment advisor. The pioneering medical research that Jim and his wife Virginia have made possible through the Institute should enrich the lives of millions in the future.
Shortly after his retirement from the board, we received word that ACC’s co-chairman Richard W. Brown had succeeded Jim as trustee of a trust that holds a significant interest in ACC stock as a part of Jim’s long-standing estate and business succession plan. While holding less than a majority interest, the trust is presumed to control the funds’ investment advisors under the Investment Company Act of 1940. This change triggered the need for a shareholder proxy to approve new management and subadvisory agreements for the funds. I am happy to report that all of the proposals contained in the proxy received the necessary votes and were approved.
On behalf of the board, I want to once again thank Jim for his mutual fund board service. More than three years ago, Jim and Richard Brown installed a strong and effective leadership team at American Century Investments and I look forward to continuing to work with them on behalf of fund shareholders. And while Jim no longer sits on the fund board, the inherent optimism captured by his favorite catch phrase—“The best is yet to be”—still resonates with all of us who have the privilege of serving you. I invite you to send your comments, questions or concerns to me at dhpratt@fundboardchair.com.

3

By Mark Kopinski, Chief Investment Officer, Global and Non-U.S. Equity
Events in May Sent Stocks Tumbling
Global stock returns generally remained robust for the first several months of the period, as the rally unleashed in March 2009 continued into 2010. Optimism regarding the global economic recovery and business sector gains helped keep stocks in positive territory.
Nevertheless, as spring set in, the global stock market rally ended abruptly, starting with the May 6 “Flash Crash” in the U.S. stock market, when the major indices plunged nearly 7% within 15 minutes. Furthermore, problems that had been percolating in Europe and in the global geopolitical arena boiled over in May, triggering a sharp stock market selloff. In particular, the expanding European government debt crisis beyond Greece, the downgrade of Spain’s credit rating, the worsening oil disaster in the Gulf of Mexico, and escalating tensions in the Middle East rattled investors’ nerves.
Overall, developed international equity markets significantly under-performed the U.S. market and the emerging markets. European stocks suffered the largest losses for the six-month period, as the mounting debt crisis worried investors. Exploding debt in Greece, Italy, Spain, Ireland, and Portugal all came under scrutiny.
Debt Remained the Roadblock to Growth
The sovereign debt problem did not just happen as a result of the recent financial crisis or recession; it is a longer-term issue. Recent events only exacerbated the problem and accelerated its becoming a crisis.
In fact, sovereign solvency has emerged as one of the most significant roadblocks to growth. Currently, the market is focused on Europe, where severe austerity measures are required to get fiscal balances back in order. This is likely to trim 0.5% from European growth during the next year. The weaker euro should help offset some of the decline in growth, but the more export-oriented northern countries will be the main beneficiaries. Commodity-based countries, such as Australia and Norway, have been the most resilient and have seen more impressive economic recoveries. The debt crisis likely will mean European interest rates will remain accommodative for the remainder of 2010.
| | | | |
| International Equity Total Returns | | | | |
| For the six months ended May 28, 2010* (in U.S. dollars) | |
| MSCI EAFE Index | -10.90% | | MSCI Europe Index | -14.77% |
| MSCI EAFE Growth Index | -8.85% | | MSCI World Free Index | -4.92% |
| MSCI EAFE Value Index | -12.95% | | MSCI Japan Index | 0.10% |
| MSCI EM Index | -2.75% | | | |
| *Total returns for periods less than one year are not annualized and are based on the period beginning December 1, 2009. | |
4
| | | | | | |
| NT Emerging Markets | | | | |
| |
| Total Returns as of May 28, 2010 | | | | |
| | | | | | Average | |
| | | | | | Annual | |
| | | | | | Returns | |
| | | Ticker | | | Since | Inception |
| | | Symbol | 6 months(1) | 1 year(2) | Inception | Date |
| Institutional Class | ACLKX | -4.27% | 20.48% | 0.95% | 5/12/06 |
| MSCI EM Growth Index | — | -2.65% | 20.94% | 2.14% | — |
| (1) | Total returns for periods less than one year are not annualized and are based on the period beginning December 1, 2009. | |
| (2) | Total returns are based on the period beginning June 1, 2009. | | | | |
| |
| Growth of $10,000 Over Life of Class | | | | |
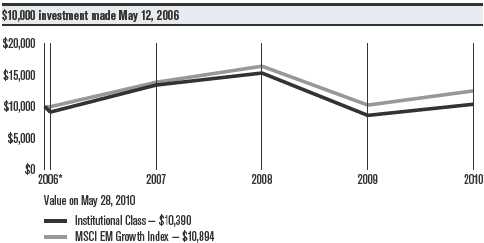
| |
| *From 5/12/06, the Institutional Class’s inception date. Not annualized. |
|
| Total Annual Fund Operating Expenses |
| Institutional Class | 1.58% |
The total annual fund operating expenses shown is as stated in the fund’s prospectus current as of the date of this report. The prospectus may vary from the expense ratio shown elsewhere in this report because it is based on a different time period, includes acquired fund fees and expenses, and, if applicable, does not include fee waivers or expense reimbursements.
Data presented reflect past performance. Past performance is no guarantee of future results. Current performance may be higher or lower than the performance shown. Investment return and principal value will fluctuate, and redemption value may be more or less than original cost. To obtain performance data current to the most recent month end, please call 1-800-345-2021 or visit americancentury.com. International investing involves special risks, such as political instability and currency fluctuations. Investing in emerging markets may accentuate these risks.
Data assumes reinvestment of dividends and capital gains, and none of the charts reflect the deduction of taxes that a shareholder would pay on fund distributions or the redemption of fund shares. Returns for the index are provided for comparison. The fund’s total returns include operating expenses (such as transaction costs and management fees) that reduce returns, while the total returns of the index do not.
5
NT Emerging Markets
Portfolio Managers: Patricia Ribeiro and Anthony Han
Performance Summary
The NT Emerging Markets portfolio returned -4.27%* for the six months ended May 28, 2010, compared with its benchmark, the MSCI EM Growth Index, which returned -2.65%.
Investor confidence generally remained upbeat for the first four months of the period, as the global economic recovery appeared to gain momentum and stock prices continued to climb. But, late in the period, mounting concerns about the massive levels of sovereign debt in Greece, Spain, and other European nations put an end to the yearlong global stock market rally. Stock prices fell, wiping out the gains achieved earlier in the period. Lower commodity prices, reflecting reduced economic growth expectations in the developed nations, helped drag down emerging market stocks. But, emerging market stocks fared better than their developed market counterparts, primarily because the emerging markets weren’t facing the sovereign debt problems mounting in many developed nations.
The portfolio’s underperformance relative to the benchmark primarily was due to stock selection and sector allocations, particularly in the materials and telecommunication services sectors.
China Led Detractors; Indonesia Led Contributors
From a regional perspective, the portfolio’s largest detractors to performance included China, Russia, and Chile. In each country, our stock selections hurt relative results. In addition, our underweighted positions in China and Chile were ineffective. The leading country contributors included Indonesia, South Africa, and Peru. Stock selection was effective in each country, while overweighted positions in Indonesia and Peru also helped.
Materials Sector Was Top Detractor
Poor stock selection and an underweighted position in the materials sector dragged down the portfolio’s relative performance. The metals and mining industry was the sector’s largest detractor, with our overweighted position in China’s Fushan International Energy Group among the portfolio’s weakest holdings. The company, which mines coking coal used for firing smelters in steel mills, saw its stock price steadily decline since the beginning of 2010, despite strong operating results. Macroeconomic influences, including China’s tightening efforts, combined with falling steel prices, higher production costs, and economic uncertainty in Europe, created a challenging climate for the nation’s metals and mining industry.
The portfolio’s telecommunication services and energy sectors also generated lagging results, with stock selection the primary culprit. The energy sector was home to the portfolio’s largest detractor, Petroleo Brasileiro, Brazil’s state-controlled oil company. Investor uncertainty about a major capitalization plan involving the company and the Brazilian government weighed on the stock.
|
| *Total returns for periods less than one year are not annualized and are based on the period beginning December 1, 2009. |
6
NT Emerging Markets
Financials Led Sector Contributors
Financials represented the portfolio’s top-performing sector, driven by strong stock selection. The commercial banking industry drove the sector’s results, with our portfolio-only position in Peru’s Credicorp Ltd., a provider of commercial banking, insurance, and investment banking services, generating strong results.
The consumer staples sector also was a top contributor, with CP ALL PCL, a Thailand-based company that operates convenience stores under the 7-Eleven trademark, posting the best relative performance. In addition, the health care sector finished the six-month period strong, with favorable stock selection driving results. In the health care sector, our overweighted position in China Shineway Pharmaceutical Group, a China-based herbal medicine provider, was the portfolio’s top-contributing stock. The company’s stock price advanced on soaring profits and improving revenues.
Outlook
Global economic activity is improving, but significant headwinds remain, particularly within the developed world, where mounting sovereign debt threatens long-term economic gains. So far, government responses to the crisis have varied, and this lack of coordination may lead to divergent economic performance in the year ahead. We expect further volatility throughout the international stock markets, yet we will continue to focus on finding companies located in emerging market countries with sustainable growth characteristics and promising long-term outlooks. Emerging markets have held up relatively well, primarily because they have managed their economies frugally throughout the past several years.
7
| |
| NT Emerging Markets | |
| |
| Top Ten Holdings | |
| | % of net assets as of 5/28/10 |
| Samsung Electronics Co. Ltd. | 6.4% |
| Vale SA Preference Shares | 5.8% |
| America Movil SAB de CV, Series L ADR | 2.9% |
| Hon Hai Precision Industry Co. Ltd. | 2.7% |
| Infosys Technologies Ltd. | 2.7% |
| China Life Insurance Co. Ltd. H Shares | 2.1% |
| Sberbank of Russian Federation | 2.1% |
| Itau Unibanco Holding SA Preference Shares | 2.0% |
| China Mobile Ltd. ADR | 1.8% |
| Taiwan Semiconductor Manufacturing Co. Ltd. | 1.7% |
| |
| Types of Investments in Portfolio | |
| | % of net assets as of 5/28/10 |
| Foreign Common Stocks & Rights | 98.9% |
| Temporary Cash Investments | 1.1% |
| Other Assets and Liabilities | —(1) |
| (1) Category is less than 0.05% of total net assets. | |
| |
| Investments by Country | |
| | % of net assets as of 5/28/10 |
| Brazil | 14.7% |
| South Korea | 13.7% |
| Taiwan (Republic of China) | 9.3% |
| India | 9.1% |
| People’s Republic of China | 9.0% |
| South Africa | 7.2% |
| Russian Federation | 6.2% |
| Hong Kong | 5.7% |
| Mexico | 5.5% |
| Indonesia | 3.5% |
| Malaysia | 2.5% |
| Turkey | 2.1% |
| Other Countries | 10.4% |
| Cash and Equivalents(2) | 1.1% |
| (2) Includes temporary cash investments and other assets and liabilities. | |
8
|
| Shareholder Fee Example (Unaudited) |
Fund shareholders may incur two types of costs: (1) transaction costs, including sales charges (loads) on purchase payments and redemption/ exchange fees; and (2) ongoing costs, including management fees; distribution and service (12b-1) fees; and other fund expenses. This example is intended to help you understand your ongoing costs (in dollars) of investing in your fund and to compare these costs with the ongoing cost of investing in other mutual funds.
The example is based on an investment of $1,000 made at the beginning of the period and held for the entire period from December 1, 2009 to May 28, 2010.
Actual Expenses
The table provides information about actual account values and actual expenses for each class. You may use the information, together with the amount you invested, to estimate the expenses that you paid over the period. First, identify the share class you own. Then simply divide your account value by $1,000 (for example, an $8,600 account value divided by $1,000 = 8.6), then multiply the result by the number under the heading “Expenses Paid During Period” to estimate the expenses you paid on your account during this period.
If you hold Investor Class shares of any American Century Investments fund, or Institutional Class shares of the American Century Diversified Bond Fund, in an American Century Investments account (i.e., not a financial intermediary or retirement plan account), American Century Investments may charge you a $12.50 semiannual account maintenance fee if the value of those shares is less than $10,000. We will redeem shares automatically in one of your accounts to pay the $12.50 fee. In determining your total eligible investment amount, we will include your investments in all personal accounts (including American Century Investments Brokerage accounts) registered under your Social Security number. Personal accounts include individual accounts, joint accounts, UGMA/UTMA accounts, personal trusts, Coverdell Education Savings Accounts and IRAs (including traditional, Roth, Rollover, SEP-, SARSEP- and SIMPLE-IRAs), and certain other retirement accounts. If you have only business, business retirement, employer-sponsored or American Century Investments Brokerage accounts, you are currently not subject to this fee. We will not charge the fee as long as you choose to manage your accounts exclusively online. If you are subject to the Account Maintenance Fee, your account value could be reduced by the fee amount.
9
Hypothetical Example for Comparison Purposes
The table also provides information about hypothetical account values and hypothetical expenses based on the actual expense ratio of each class of your fund and an assumed rate of return of 5% per year before expenses, which is not the actual return of a fund’s share class. The hypothetical account values and expenses may not be used to estimate the actual ending account balance or expenses you paid for the period. You may use this information to compare the ongoing costs of investing in your fund and other funds. To do so, compare this 5% hypothetical example with the 5% hypothetical examples that appear in the shareholder reports of the other funds.
Please note that the expenses shown in the table are meant to highlight your ongoing costs only and do not reflect any transactional costs, such as sales charges (loads) or redemption/exchange fees. Therefore, the table is useful in comparing ongoing costs only, and will not help you determine the relative total costs of owning different funds. In addition, if these transactional costs were included, your costs would have been higher.
| | | | |
| | Beginning | Ending | Expenses Paid | |
| | Account Value | Account Value | During Period* | Annualized |
| | 12/1/09 | 5/28/10 | 12/1/09 – 5/28/10 | Expense Ratio* |
| Actual | $1,000 | $957.30 | $7.34 | 1.53% |
| Hypothetical | $1,000 | $1,017.02 | $7.57 | 1.53% |
| *Expenses are equal to the fund’s annualized expense ratio listed in the table above, multiplied by the average account value over the period, |
| multiplied by 179, the number of days in the most recent fiscal half-year, divided by 365, to reflect the one-half year period. | |
10
| | | | | | |
| NT Emerging Markets | | | | | |
| |
| MAY 28, 2010 (UNAUDITED) | | | | | | |
| | Shares | Value | | | Shares | Value |
| Common Stocks & Rights — 98.9% | | | Infosys Technologies Ltd. | 32,135 | $ 1,846,358 |
| BRAZIL — 14.7% | | | | JSW Steel Ltd. | 28,790 | 675,175 |
| | | | | Mundra Port and Special | | |
| Cia de Bebidas das Americas | | | | Economic Zone Ltd. | 29,426 | 423,122 |
| Preference Shares ADR | 5,471 | $ 527,076 | | | | |
| Fibria Celulose SA(1) | 29,341 | 470,459 | | | | 6,280,130 |
| Gerdau SA | | | | INDONESIA — 3.5% | | |
| Preference Shares | 37,900 | 509,094 | | PT Astra International Tbk | 158,000 | 710,904 |
| Hypermarcas SA(1) | 49,500 | 668,731 | | PT Bank Rakyat Indonesia | 629,000 | 568,665 |
| Itau Unibanco Holding SA | | | | PT Perusahaan Gas Negara | 1,017,000 | 407,746 |
| Preference Shares | 76,559 | 1,415,767 | | PT Semen Gresik | | |
| MRV Engenharia | | | | (Persero) Tbk | 791,500 | 711,494 |
| e Participacoes SA | 90,600 | 589,268 | | | | 2,398,809 |
| Natura Cosmeticos SA | 25,300 | 525,453 | | LUXEMBOURG — 1.6% | | |
| PDG Realty SA | | | | Evraz Group SA GDR(1) | 9,820 | 265,332 |
| Empreendimentos | | | | Millicom International | | |
| e Participacoes | 61,000 | 524,514 | | Cellular SA | 10,887 | 870,198 |
| Petroleo Brasileiro | | | | | | 1,135,530 |
| SA-Petrobras ADR | 25,744 | 917,001 | | MALAYSIA — 2.5% | | |
| Vale SA Preference Shares | 175,100 | 4,037,169 | | CIMB Group Holdings Bhd | 533,300 | 1,098,330 |
| | | 10,184,532 | | Supermax Corp. Bhd | 334,100 | 660,167 |
| CANADA — 1.0% | | | | | | 1,758,497 |
| Pacific Rubiales | | | | MEXICO — 5.5% | | |
| Energy Corp.(1) | 32,066 | 667,280 | | | | |
| EGYPT — 0.9% | | | | America Movil SAB de CV, | | |
| | | | | Series L ADR | 42,596 | 2,016,495 |
| Orascom | | | | | | |
| Construction Industries | 14,037 | 591,173 | | Grupo Financiero Banorte | | |
| | | | | SAB de CV, Series O | 150,936 | 580,595 |
| HONG KONG — 5.7% | | | | Mexichem SAB de CV | 139,247 | 370,772 |
| China Merchants Holdings | | | | | | |
| International Co. Ltd. | 182,000 | 558,754 | | Wal-Mart de Mexico | | |
| | | | | SAB de CV | 387,358 | 864,759 |
| China Mobile Ltd. ADR | 27,214 | 1,267,356 | | | | 3,832,621 |
| China Overseas Land & | | | | NETHERLANDS — 1.0% | | |
| Investment Ltd. | 6,000 | 11,767 | | | | |
| | | | | X5 Retail Group NV GDR(1) | 22,033 | 711,617 |
| CNOOC Ltd. | 644,000 | 1,008,090 | | | | |
| Comba Telecom Systems | | | | PEOPLE’S REPUBLIC OF CHINA — 9.0% | |
| Holdings Ltd. | 578,000 | 682,091 | | China Life Insurance Co. Ltd. | | |
| Skyworth Digital | | | | H Shares | 335,000 | 1,457,607 |
| Holdings Ltd. | 508,000 | 393,923 | | China Shenhua Energy Co. | | |
| | | 3,921,981 | | Ltd. H Shares | 76,000 | 303,013 |
| HUNGARY — 1.2% | | | | China Shineway | | |
| | | | | Pharmaceutical Group Ltd. | 257,000 | 797,565 |
| OTP Bank plc(1) | 32,085 | 813,525 | | | | |
| | | | | China Shipping Container | | |
| INDIA — 9.1% | | | | Lines Co. Ltd. H Shares(1) | 1,474,000 | 510,721 |
| Apollo Tyres Ltd. | 363,215 | 544,583 | | Ctrip.com International Ltd. | | |
| Ashok Leyland Ltd. | 537,700 | 694,960 | | ADR(1) | 23,953 | 943,509 |
| Aurobindo Pharma Ltd. | 22,190 | 400,480 | | Industrial & Commercial | | |
| Crompton Greaves Ltd. | 85,781 | 439,477 | | Bank of China Ltd. H Shares | 791,000 | 581,870 |
| HDFC Bank Ltd. | 19,377 | 788,699 | | Ping An Insurance Group Co. | | |
| ICICI Bank Ltd. | 25,200 | 467,276 | | of China Ltd. H Shares | 49,500 | 400,991 |
11
| | | | | | |
| NT Emerging Markets | | | | | |
| |
| | Shares | Value | | | Shares | Value |
| Sinopharm Group Co. | | | | TAIWAN (REPUBLIC OF CHINA) — 9.3% | |
| H Shares | 117,200 | $ 458,579 | | Eva Airways Corp.(1) | 704,000 | $ 389,384 |
| Tencent Holdings Ltd. | 41,900 | 797,580 | | Hon Hai Precision | | |
| | | 6,251,435 | | Industry Co. Ltd. | 470,557 | 1,855,500 |
| PERU — 1.2% | | | | HTC Corp. | 28,000 | 378,373 |
| Credicorp Ltd. | 9,375 | 827,719 | | MediaTek, Inc. | 72,252 | 1,156,713 |
| RUSSIAN FEDERATION — 6.2% | | | Nan Ya Printed Circuit | | |
| CTC Media, Inc. | 41,481 | 606,867 | | Board Corp. | 125,000 | 523,360 |
| NovaTek OAO GDR | 12,756 | 923,078 | | Richtek Technology Corp. | 52,000 | 478,246 |
| Polyus Gold OJSC ADR | 10,427 | 265,518 | | Taiwan Semiconductor | | |
| Rosneft Oil Co. OJSC GDR | 69,812 | 508,735 | | Manufacturing Co. Ltd. | 636,774 | 1,162,919 |
| Sberbank of | | | | Wistron Corp. | 302,594 | 495,067 |
| Russian Federation | 620,707 | 1,424,509 | | | | 6,439,562 |
| Wimm-Bill-Dann Foods | | | | THAILAND — 2.0% | | |
| OJSC ADR | 26,267 | 551,607 | | Banpu PCL | 41,200 | 723,504 |
| | | 4,280,314 | | CP ALL PCL | 524,000 | 438,036 |
| SOUTH AFRICA — 7.2% | | | | Kasikornbank PCL NVDR | 80,900 | 211,795 |
| Aspen Pharmacare | | | | | | 1,373,335 |
| Holdings Ltd.(1) | 78,052 | 819,245 | | TURKEY — 2.1% | | |
| Exxaro Resources Ltd. | 25,380 | 366,288 | | Asya Katilim Bankasi AS | 252,569 | 545,577 |
| Gold Fields Ltd. ADR | 17,222 | 236,802 | | Turkiye Garanti Bankasi AS | 212,078 | 914,769 |
| Impala Platinum | | | | | | 1,460,346 |
| Holdings Ltd. | 29,113 | 732,802 | | | | |
| | | | | UNITED KINGDOM — 0.7% | | |
| Kumba Iron Ore Ltd. | 11,685 | 498,240 | | | | |
| | | | | Antofagasta plc | 39,753 | 506,131 |
| Naspers Ltd. N Shares | 25,992 | 1,021,254 | | | | |
| | | | | TOTAL COMMON STOCKS & RIGHTS | |
| Shoprite Holdings Ltd. | 62,245 | 645,440 | | (Cost $57,433,011) | | 68,416,504 |
| Truworths International Ltd. | 87,508 | 625,051 | | | | |
| | | 4,945,122 | | Temporary Cash Investments — 1.1% |
| SOUTH KOREA — 13.7% | | | | JPMorgan U.S. Treasury | | |
| | | | | Plus Money Market Fund | | |
| Doosan Infracore Co. Ltd.(1) | 26,730 | 384,838 | | Agency Shares | 40,122 | 40,122 |
| Hanjin Shipping Co. Ltd.(1) | 13,760 | 342,454 | | Repurchase Agreement, Credit Suisse First | |
| Hanjin Shipping Co. Ltd. | | | | Boston, Inc., (collateralized by various U.S. | |
| Rights(1) | 1,622 | 9,165 | | Treasury obligations, 0.875%, 10/31/11, | |
| Hyundai Motor Co. | 7,406 | 845,205 | | valued at $714,759), in a joint trading | |
| | | | | account at 0.15%, dated 5/28/10, | | |
| LG Chem Ltd. | 3,402 | 762,362 | | due 6/1/10 (Delivery value $700,012) | 700,000 |
| LG Household & Health | | | | TOTAL TEMPORARY | | |
| Care Ltd. | 3,666 | 964,665 | | CASH INVESTMENTS | | |
| Lumens Co. Ltd.(1) | 42,983 | 460,341 | | (Cost $740,122) | | 740,122 |
| POSCO | 1,501 | 585,347 | | TOTAL INVESTMENT | | |
| Samsung | | | | SECURITIES — 100.0% | | |
| Electronics Co. Ltd. | 6,888 | 4,452,237 | | (Cost $58,173,133) | | 69,156,626 |
| Shinhan Financial | | | | OTHER ASSETS AND LIABILITIES(2) | 13,233 |
| Group Co. Ltd. | 19,870 | 700,816 | | TOTAL NET ASSETS — 100.0% | | $69,169,859 |
| | | 9,507,430 | | | | |
| SWITZERLAND — 0.8% | | | | | | |
| Ferrexpo plc | 137,901 | 529,415 | | | | |
12
| | | | |
| NT Emerging Markets | | | | |
| |
| Market Sector Diversification | | | Notes to Schedule of Investments |
| (as a % of net assets) | | | ADR = American Depositary Receipt |
| Information Technology | 20.7% | | GDR = Global Depositary Receipt |
| Financials | 18.5% | | NVDR = Non-Voting Depositary Receipt |
| Materials | 16.7% | | OJSC = Open Joint Stock Company |
| Consumer Discretionary | 9.8% | | (1) | Non-income producing. |
| Consumer Staples | 8.5% | | (2) | Category is less than 0.05% of total net assets. |
| Energy | 7.3% | | | |
| Industrials | 6.3% | | | |
| Telecommunication Services | 6.0% | | See Notes to Financial Statements. |
| Health Care | 4.5% | | | |
| Utilities | 0.6% | | | |
| Cash and Equivalents* | 1.1% | | | |
| *Includes temporary cash investments and other assets and liabilities. | | | |
13
|
| Statement of Assets and Liabilities |
| |
| MAY 28, 2010 (UNAUDITED) | |
| Assets | |
| Investment securities, at value (cost of $58,173,133) | $69,156,626 |
| Foreign currency holdings, at value (cost of $193,768) | 195,006 |
| Receivable for capital shares sold | 52,931 |
| Dividends and interest receivable | 229,205 |
| Other assets | 3,292 |
| | 69,637,060 |
| | |
| Liabilities | |
| Disbursements in excess of demand deposit cash | 3,299 |
| Payable for investments purchased | 335,813 |
| Accrued management fees | 81,987 |
| Accrued foreign taxes | 46,102 |
| | 467,201 |
| | |
| Net Assets | $69,169,859 |
| | |
| Institutional Class Capital Shares, $0.01 Par Value | |
| Authorized | 100,000,000 |
| Outstanding | 8,167,715 |
| | |
| Net Asset Value Per Share | $8.47 |
| | |
| Net Assets Consist of: | |
| Capital (par value and paid-in surplus) | $63,953,944 |
| Undistributed net investment income | 71,539 |
| Accumulated net realized loss on investment and foreign currency transactions | (5,791,688) |
| Net unrealized appreciation on investments and translation of assets and liabilities in foreign currencies | 10,936,064 |
| | $69,169,859 |
| |
| |
| See Notes to Financial Statements. | |
14
| |
| FOR THE SIX MONTHS ENDED MAY 28, 2010 (UNAUDITED) | |
| Investment Income (Loss) | |
| Income: | |
| Dividends (net of foreign taxes withheld of $37,210) | $ 562,991 |
| Interest | 670 |
| | 563,661 |
| | |
| Expenses: | |
| Management fees | 486,851 |
| Directors’ fees and expenses | 891 |
| Other expenses | 1,636 |
| | 489,378 |
| | |
| Net investment income (loss) | 74,283 |
| | |
| Realized and Unrealized Gain (Loss) | |
| Net realized gain (loss) on: | |
| Investment transactions (net of foreign tax expenses paid (refunded) of $47,431) | 3,173,461 |
| Foreign currency transactions (net of foreign tax expenses paid (refunded) of $31,768) | 522,145 |
| | 3,695,606 |
| | |
| Change in net unrealized appreciation (depreciation) on: | |
| Investments (net of deferred foreign taxes of $(112,300)) | (5,668,318) |
| Translation of assets and liabilities in foreign currencies | (1,383,258) |
| | (7,051,576) |
| | |
| Net realized and unrealized gain (loss) | (3,355,970) |
| | |
| Net Increase (Decrease) in Net Assets Resulting from Operations | $(3,281,687) |
| |
| |
| See Notes to Financial Statements. | |
15
|
| Statement of Changes in Net Assets |
| | |
| SIX MONTHS ENDED MAY 28, 2010 (UNAUDITED) AND YEAR ENDED NOVEMBER 30, 2009 | |
| Increase (Decrease) in Net Assets | 2010 | 2009 |
| Operations | | |
| Net investment income (loss) | $ 74,283 | $ 154,330 |
| Net realized gain (loss) | 3,695,606 | (2,001,573) |
| Change in net unrealized appreciation (depreciation) | (7,051,576) | 25,523,096 |
| Net increase (decrease) in net assets resulting from operations | (3,281,687) | 23,675,853 |
| | | |
| Distributions to Shareholders | | |
| From net investment income | (94,843) | (152,834) |
| | | |
| Capital Share Transactions | | |
| Proceeds from shares sold | 16,290,141 | 32,244,736 |
| Payments for shares redeemed | (4,054,297) | (16,171,865) |
| Net increase (decrease) in net assets from capital share transactions | 12,235,844 | 16,072,871 |
| | | |
| Net increase (decrease) in net assets | 8,859,314 | 39,595,890 |
| | | |
| Net Assets | | |
| Beginning of period | 60,310,545 | 20,714,655 |
| End of period | $69,169,859 | $ 60,310,545 |
| | | |
| Undistributed net investment income | $71,539 | $92,099 |
| | | |
| Transactions in Shares of the Fund | | |
| Sold | 1,809,737 | 5,177,295 |
| Redeemed | (445,351) | (2,421,624) |
| Net increase (decrease) in shares of the fund | 1,364,386 | 2,755,671 |
| |
| |
| See Notes to Financial Statements. | | |
16
|
| Notes to Financial Statements |
MAY 28, 2010 (UNAUDITED)
1. Organization and Summary of Significant Accounting Policies
Organization — American Century World Mutual Funds, Inc. (the corporation) is registered under the Investment Company Act of 1940 (the 1940 Act) as an open-end management investment company. NT Emerging Markets Fund (the fund) is one fund in a series issued by the corporation. The fund is diversified under the 1940 Act. The fund’s investment objective is to seek capital growth. The fund pursues its objective by investing at least 80% of its assets in securities of issuers in emerging market countries. The fund is not permitted to invest in any securities issued by companies assigned by the Global Industry Classification Standard to the tobacco industry. The following is a summary of the fund’s significant accounting policies.
Security Valuations — Securities traded primarily on a principal securities exchange are valued at the last reported sales price, or at the mean of the latest bid and asked prices where no last sales price is available. Depending on local convention or regulation, securities traded over-the-counter are valued at the mean of the latest bid and asked prices, the last sales price, or the official close price. Investments in open-end management investment companies are valued at the reported net asset value. Discount notes may be valued through a commercial pricing service or at amortized cost, which approximates fair value. Securities traded on foreign securities exchanges and over-the-counter markets are normally completed before the close of business on days that the New York Stock Exchange (the Exchange) is open and may also take place on days when the Exchange is not open. If an event occurs after the value of a security was established but before the net asset value per share was determined that was likely to materially change the net asset value, that security would be valued as determined in accordance with procedures adopted by the Board of Directors. If the fund determines that the market price of a portfolio security is not readily available, or that the valuation methods mentioned above do not reflect the security’s fair value, such security is valued as determined by the Board of Directors or its designee, in accordance with procedures adopted by the Board of Directors, if such determination would materially impact a fund’s net asset value. Certain other circumstances may cause the fund to use alternative procedures to value a security such as: a security has been declared in default; trading in a security has been halted during the trading day; or there is a foreign market holiday and no trading will commence .
Security Transactions — For financial reporting purposes, security transactions are accounted for as of the trade date. Net realized gains and losses are determined on the identified cost basis, which is also used for federal income tax purposes. Certain countries impose taxes on realized gains on the sale of securities registered in their country. The fund records the foreign tax expense, if any, on an accrual basis. The foreign tax expense on realized gains and unrealized appreciation reduces the net realized gain (loss) on investment transactions and net unrealized appreciation (depreciation) on investments, respectively.
Investment Income — Dividend income less foreign taxes withheld, if any, is recorded as of the ex-dividend date. Interest income is recorded on the accrual basis and includes accretion of discounts and amortization of premiums.
Foreign Currency Translations — All assets and liabilities initially expressed in foreign currencies are translated into U.S. dollars at prevailing exchange rates at period end. The fund may enter into spot foreign currency exchange contracts to facilitate transactions denominated in a foreign currency. Purchases and sales of investment securities, dividend and interest income, spot foreign currency exchange contracts, and certain expenses are translated at the rates of exchange prevailing on the respective dates of such transactions. Realized and unrealized gains and losses from foreign currency translations arise from changes in currency exchange rates.
Net realized and unrealized foreign currency exchange gains or losses occurring during the holding period of investment securities are a component of net realized gain (loss) on foreign currency transactions and net unrealized appreciation (depreciation) on translation of assets and liabilities in foreign currencies, respectively. Certain countries may impose taxes on the contract amount of purchases and sales of foreign currency contracts in their currency. The fund records the foreign tax expense, if any, as a reduction to the net realized gain (loss) on foreign currency transactions.
17
Repurchase Agreements — The fund may enter into repurchase agreements with institutions that American Century Investment Management, Inc. (ACIM) has determined are creditworthy pursuant to criteria adopted by the Board of Directors. Each repurchase agreement is recorded at cost. The fund requires that the collateral, represented by securities, received in a repurchase transaction be transferred to the custodian in a manner sufficient to enable the fund to obtain those securities in the event of a default under the repurchase agreement. ACIM monitors, on a daily basis, the securities transferred to ensure the value, including accrued interest, of the securities under each repurchase agreement is equal to or greater than amounts owed to the fund under each repurchase agreement.
Joint Trading Account — Pursuant to an Exemptive Order issued by the Securities and Exchange Commission, the fund, along with certain other funds in the American Century Investments family of funds, may transfer uninvested cash balances into a joint trading account. These balances are invested in one or more repurchase agreements that are collateralized by U.S. Treasury or Agency obligations.
Income Tax Status — It is the fund’s policy to distribute substantially all net investment income and net realized gains to shareholders and to otherwise qualify as a regulated investment company under provisions of the Internal Revenue Code. All tax years for the fund remain subject to examination by tax authorities. Additionally, non-U.S. tax returns filed by the fund due to investments in certain foreign securities remain subject to examination by the relevant taxing authority for 7 years from the date of filing. At this time, management believes there are no uncertain tax positions which, based on their technical merit, would not be sustained upon examination and for which it is reasonably possible that the total amounts of unrecognized tax benefits will significantly change in the next twelve months. Accordingly , no provision has been made for federal or state income taxes.
Distributions to Shareholders — Distributions to shareholders are recorded on the ex-dividend date. Distributions from net investment income, if any, are generally declared and paid annually. Distributions from net realized gains, if any, are generally declared and paid twice per year. The fund may make distributions on a more frequent basis to comply with the distribution requirements of the Internal Revenue Code, in all events in a manner consistent with provisions of the 1940 Act.
Indemnifications — Under the corporation’s organizational documents, its officers and directors are indemnified against certain liabilities arising out of the performance of their duties to the fund. In addition, in the normal course of business, the fund enters into contracts that provide general indemnifications. The maximum exposure under these arrangements is unknown as this would involve future claims that may be made against a fund. The risk of material loss from such claims is considered by management to be remote.
Use of Estimates — The financial statements are prepared in conformity with accounting principles generally accepted in the United States of America, which may require management to make certain estimates and assumptions at the date of the financial statements. Actual results could differ from these estimates.
Subsequent Events — In preparing the financial statements, management evaluated the impact of events or transactions occurring through the date the financial statements were issued that would merit recognition or disclosure.
18
2. Fees and Transactions with Related Parties
Management Fees — The corporation has entered into a Management Agreement with American Century Global Investment Management, Inc. (ACGIM) (the investment advisor) (see Note 8), under which ACGIM provides the fund with investment advisory and management services in exchange for a single, unified management fee (the fee). The Agreement provides that all expenses of managing and operating the fund, except brokerage expenses, taxes, interest, fees and expenses of the independent directors (including legal counsel fees), and extraordinary expenses, will be paid by ACGIM. The fee is computed and accrued daily based on the daily net assets of the fund and paid monthly in arrears. For funds with a stepped fee schedule, the rate of the fee is determined by applying a fee rate calculation formula. This formula takes into account t he fund’s assets as well as certain assets, if any, of other clients of the investment advisor outside the American Century Investments family of funds (such as subadvised funds and separate accounts) that have very similar investment teams and investment strategies (strategy assets). The strategy assets of the fund include the assets of Emerging Markets Fund, one fund in a series issued by the corporation. The annual management fee schedule ranges from 1.05% to 1.65%. The effective annual management fee for the six months ended May 28, 2010 was 1.52%.
ACGIM has entered into a Subadvisory Agreement with ACIM (the subadvisor) on behalf of the fund. The subadvisor makes investment decisions for the cash portion of the fund in accordance with the fund’s investment objectives, policies and restrictions under the supervision of ACGIM and the Board of Directors. ACGIM pays all costs associated with retaining ACIM as the subadvisor of the fund.
Related Parties — Certain officers and directors of the corporation are also officers and/or directors of American Century Companies, Inc. (ACC), the parent of the corporation’s investment advisor, ACGIM, the corporation’s subadvisor, ACIM, the distributor of the corporation, American Century Investment Services, Inc., and the corporation’s transfer agent, American Century Services, LLC. The fund is wholly owned, in aggregate, by various funds in a series issued by American Century Asset Allocation Portfolios, Inc. (ACAAP). ACAAP does not invest in the fund for the purpose of exercising management or control.
The fund is eligible to invest in a money market fund for temporary purposes, which is managed by J.P. Morgan Investment Management, Inc. (JPMIM). The fund has a Mutual Funds Services Agreement with J.P. Morgan Investor Services Co. (JPMIS) and a securities lending agreement with JPMorgan Chase Bank (JPMCB). JPMCB is a custodian of the fund. JPMIM, JPMIS and JPMCB are wholly owned subsidiaries of JPMorgan Chase & Co. (JPM). JPM is an equity investor in ACC.
3. Investment Transactions
Purchases and sales of investment securities, excluding short-term investments, for the six months ended May 28, 2010, were $47,678,573 and $31,586,866, respectively.
19
4. Fair Value Measurements
The fund’s securities valuation process is based on several considerations and may use multiple inputs to determine the fair value of the positions held by the fund. In conformity with accounting principles generally accepted in the United States of America, the inputs used to determine a valuation are classified into three broad levels as follows:
• Level 1 valuation inputs consist of unadjusted quoted prices in an active market for identical securities;
• Level 2 valuation inputs consist of significant direct or indirect observable market data (including quoted prices for similar securities, evaluations of subsequent market events, interest rates, prepayment speeds, credit risk, etc.); or
• Level 3 valuation inputs consist of significant unobservable inputs (including a fund’s own assumptions).
The level classification is based on the lowest level input that is significant to the fair valuation measurement. The valuation inputs are not an indication of the risks associated with investing in these securities or other financial instruments.
The following is a summary of the valuation inputs used to determine the fair value of the fund’s securities as of May 28, 2010. The Schedule of Investments provides additional details on the fund’s portfolio holdings.
| | | |
| | Level 1 | Level 2 | Level 3 |
| Investment Securities | | | |
| Foreign Common Stocks & Rights | $8,764,630 | $59,651,874 | — |
| Temporary Cash Investments | 40,122 | 700,000 | — |
| Total Value of Investment Securities | $8,804,752 | $60,351,874 | — |
5. Risk Factors
There are certain risks involved in investing in foreign securities. These risks include those resulting from future adverse political, social, and economic developments, fluctuations in currency exchange rates, the possible imposition of exchange controls, and other foreign laws or restrictions. Investing in emerging markets may accentuate these risks.
6. Interfund Lending
The fund, along with certain other funds in the American Century Investments family of funds, may participate in an interfund lending program, pursuant to an Exemptive Order issued by the Securities and Exchange Commission (SEC). This program provides an alternative credit facility allowing the fund to borrow from or lend to other funds in the American Century Investments family of funds that permit such transactions. Interfund lending transactions are subject to each fund’s investment policies and borrowing and lending limits. The interfund loan rate earned/paid on interfund lending transactions is determined daily based on the average of certain current market rates. Interfund lending transactions normally extend only overnight, but can have a maximum duration of seven days. The program is subject to annual approval by the Board of Directors. During the six months ended May 28, 2010, the fund did not utiliz e the program.
20
7. Federal Tax Information
The book-basis character of distributions made during the year from net investment income or net realized gains may differ from their ultimate characterization for federal income tax purposes. These differences reflect the differing character of certain income items and net realized gains and losses for financial statement and tax purposes, and may result in reclassification among certain capital accounts on the financial statements.
As of May 28, 2010, the components of investments for federal income tax purposes were as follows:
| | |
| Federal tax cost of investments | $59,193,599 |
| Gross tax appreciation of investments | $11,888,593 |
| Gross tax depreciation of investments | (1,925,566) |
| Net tax appreciation (depreciation) of investments | $ 9,963,027 |
The difference between book-basis and tax-basis cost and unrealized appreciation (depreciation) is attributable primarily to the tax deferral of losses on wash sales.
As of November 30, 2009, the fund had accumulated capital losses of $(8,255,031), which represent net capital loss carryovers that may be used to offset future realized capital gains for federal income tax purposes. Future capital loss carryover utilization in any given year may be subject to Internal Revenue Code limitations. Capital loss carryovers of $(3,705,184) and $(4,549,847) expire in 2016 and 2017, respectively.
The fund had a capital and currency loss deferral of $(43,417) and $(2,016), respectively, which represent net capital and foreign currency losses incurred in the one-month period ended November 30, 2009. The fund has elected to treat such losses as having been incurred in the following fiscal year for federal income tax purposes.
8. Corporate Event
As part of a long-standing estate and business succession plan established by ACC Co-Chairman James E. Stowers, Jr., the founder of American Century Investments, ACC Co-Chairman Richard W. Brown succeeded Mr. Stowers as trustee of a trust that holds a greater-than-25% voting interest in ACC, the parent corporation of the fund’s advisors. Under the 1940 Act, this is presumed to represent control of ACC even though it is less than a majority interest. The change of trustee may technically be considered a “change of control” of ACC and therefore also a change of control of the fund’s advisors even though there has been no change to their management and none is anticipated. The “change of control” resulted in the assignment of the fund’s investment advisory and subadvisory agreements. Under the 1940 Act, an assignment automatically terminated such agreements, making the approval of a new agreement necessary.
On February 16, 2010, the Board of Directors approved interim investment advisory and subadvisory agreements under which the fund will be managed until a new agreement is approved by fund shareholders. The interim agreements are substantially identical to the terminated agreements (with the exception of different effective and termination dates) and will not result in changes in the management of American Century Investments, the fund, its investment objectives, fees or services provided. On March 29, 2010, the Board of Directors approved a new investment advisory agreement. The new agreement is also substantially identical to the terminated agreement (except for the date, the substitution of ACIM for ACGIM and certain other non-material changes). In order to streamline American Century’s corporate organization, ACGIM was merged into ACIM on July 16, 2010. The new agreement for the fund was approved by shareh olders at a Special Meeting of Shareholders on June 16, 2010. The new agreement went into effect on July 16, 2010.
21
| | | | | | |
| NT Emerging Markets | | | | | |
| |
| Institutional Class | | | | | |
| For a Share Outstanding Throughout the Years Ended November 30 (except as noted) | | |
| | | 2010(1) | 2009 | 2008 | 2007 | 2006(2) |
| Per-Share Data | | | | | |
| Net Asset Value, Beginning of Period | $8.86 | $5.12 | $16.19 | $11.01 | $10.00 |
| Income From Investment Operations | | | | | |
| Net Investment Income (Loss) | 0.01(3) | 0.02(3) | 0.11(3) | 0.15 | 0.07 |
| Net Realized and Unrealized Gain (Loss) | (0.39) | 3.74 | (8.52) | 5.12 | 0.94 |
| Total From Investment Operations | (0.38) | 3.76 | (8.41) | 5.27 | 1.01 |
| Distributions | | | | | |
| From Net Investment Income | (0.01) | (0.02) | (0.20) | (0.09) | — |
| From Net Realized Gains | — | — | (2.46) | — | — |
| Total Distributions | (0.01) | (0.02) | (2.66) | (0.09) | — |
| Net Asset Value, End of Period | $8.47 | $8.86 | $5.12 | $16.19 | $11.01 |
| |
| Total Return(4) | (4.27)% | 73.87% | (61.75)% | 48.22% | 10.10% |
| | | | | | |
| Ratios/Supplemental Data | | | | | |
| Ratio of Operating Expenses | | | | | |
| to Average Net Assets | 1.53%(5) | 1.57% | 1.52% | 1.46% | 1.60%(5) |
| Ratio of Net Investment Income (Loss) | | | | | |
| to Average Net Assets | 0.23%(5) | 0.36% | 1.17% | 1.12% | 1.68%(5) |
| Portfolio Turnover Rate | 50% | 158% | 157% | 113% | 59% |
| Net Assets, End of Period (in thousands) | $69,170 | $60,311 | $20,715 | $28,378 | $19,844 |
| (1) | Six months ended May 28, 2010 (unaudited). | | | | | |
| (2) | May 12, 2006 (fund inception) through November 30, 2006. | | | | |
| (3) | Computed using average shares outstanding throughout the period. | | | | |
| (4) | Total return assumes reinvestment of net investment income and capital gains distributions, if any. Total returns for periods less than one year |
| | are not annualized. Total returns are calculated based on the net assets value of the last business day. | | |
| (5) | Annualized. | | | | | |
See Notes to Financial Statements.
22
|
| Board Approval of Management and Subadvisory Agreements |
American Century Global Investment Management, Inc. (“ACGIM” or the “Advisor”) currently serves as investment advisor to the Fund under an interim management agreement (the “Interim Management Agreement”) between the Advisor and the Fund approved by the Fund’s Board of Directors (the “Board”). American Century Investment Management, Inc. (“ACIM” or the “Subadvisor”) currently serves as subadvisor to the Fund under an interim investment subadvisory agreement (the “Interim Subad-visory Agreement” and, together with the Interim Management Agreement, the “Interim Agreements”). The Advisor and the Subadvisor (together, the “Advisors”) previously served as investment advisors to the Fund pursuant to agreements (the “Prior Agreements”) that terminated in accordance with their terms on February 16, 2010, as a result of a change of control of the Advisor’s and the Subadvisor’s parent company, American Century Companies, Inc. (“ACC”). The change in control occurred as the result of a change in the trustee of a trust created by James E. Stowers, Jr., the founder of American Century Investments, which holds shares representing a significant interest in ACC stock. Mr. Stowers previously served as the trustee of the trust. On February 16, 2010, Mr. Richard W. Brown, Co-Chairman of ACC with Mr. Stowers, became the trustee in accordance with the terms of the trust and Mr. Stowers’ long-standing estate and succession plan.
On February 18, 2010, the Board approved the Interim Agreements in accordance with Rule 15a-4 under the Investment Company Act to ensure continued management of the Funds by the Advisor and the Subadvisor after the termination of the Prior Agreements and until shareholder approval of a new management agreement (the “Proposed Agreement”) as required under the Act. The Board approved the Proposed Agreement and recommended its approval to shareholders. Fund shareholders approved the Proposed Agreement at a meeting on June 16, 2010.
Because American Century had indicated its intention to merge ACGIM into ACIM prior to the expiration of the Interim Agreements, the Proposed Agreement is with ACIM as sole investment advisor to the Fund. The Board took into consideration that the combination is being undertaken for reasons of organizational simplification and will eliminate the need for multiple investment management agreements without changing the nature, quality, or extent of services provided to the Fund. The Board noted that the merger was not related to the change of control that necessitated the Interim Agreements and would not result in any change to the personnel managing the Fund.
The Interim Agreements and the Proposed Agreement are substantially identical to the Prior Agreements except for their effective dates, the termination provisions of the Interim Agreements, and the elimination of a subadvisor in the Proposed Agreement. Under the Proposed Agreement, ACIM will provide the same services as provided by ACGIM and ACIM, be subject to the same duties, and receive the same compensation rate as under the Prior Agreements.
23
Basis for Board Approval of Interim Agreements
In considering the approval of the Interim Agreements, Rule 15a-4 requires the Board to approve the contracts within ten business days of the termination of the prior agreements and to determine that the compensation to be received under each interim agreement is no greater than would have been received under the corresponding prior agreement. In connection with the approval, the Board noted that it oversees on a continuous basis and evaluates at its quarterly meetings, directly and through the committees of the Board, the nature and quality of significant services provided by the Advisor and the Subadvisor, the investment performance of the Fund, shareholder services, audit and compliance functions and a variety of other matters relating to the Fund’s operations.
In evaluating the Interim Agreements, the Board, assisted by the advice of its independent legal counsel, considered a number of factors in addition to those required by the rule with no one factor being determinative to its analysis. Among the factors considered by the Board were the circumstances and effect of the change of control, the fact that the Advisor and the Subadvisor will provide the same services and receive the same compensation rate as under the Prior Agreements, and that the change of control did not result in a change of the personnel managing the Fund. Upon completion of its analysis, the Board approved the Interim Agreements, determining that the continued management of the Fund by the Advisor and the Subadvisor was in the best interests of the Fund and Fund shareholders.
Basis for Board Approval of Proposed Agreement
At a meeting held on March 29, 2010, after considering all information presented, the Board approved, and determined to recommend that shareholders approve, the Proposed Agreement. In connection with that approval, the Board requested and reviewed extensive data and information compiled by the Advisor, the Subadvisor, and certain independent providers of evaluation data concerning the Fund and services provided to the Fund. The Board oversees on a continuous basis and evaluates at its quarterly meetings, directly and through the committees of the Board, the nature and quality of significant services provided to the Fund, the investment performance of the Fund, shareholder services, audit and compliance functions and a variety of other matters relating to the Fund’s operations. The information considered and the discussions held at the meetings included, but were not limited to:
• the nature, extent and quality of investment management, shareholder services and other services provided to the Fund;
• the wide range of programs and services provided to the Fund and their shareholders on a routine and non-routine basis;
• the compliance policies, procedures, and regulatory experience of the Advisors;
24
• data comparing the cost of owning the Fund to the cost of owning similar funds;
• the fact that there will be no changes to the fees, services, or personnel who provide such services as compared to the Prior Agreements;
• data comparing the Fund’s performance to appropriate benchmarks and/ or a peer group of other mutual funds with similar investment objectives and strategies;
• financial data showing the profitability of the Fund to the Advisors and the overall profitability of the Advisors;
• data comparing services provided and charges to the Fund with those for other non-fund investment management clients of the Advisors; and
• consideration of collateral or “fall-out” benefits derived by the Advisors from the management of the Fund and potential sharing of economies of scale in connection with the management of the Fund.
The Board also considered whether there was any reason for not continuing the existing arrangement with the Advisor. In particular, the Board recognized that shareholders may have invested in the Fund on the strength of the Advisor’s industry standing and reputation and in the expectation that the Advisor will have a continuing role in providing services to the Fund.
The Board considered all of the information provided by the Advisor, the Subadvisor, the independent data providers, and the Board’s independent counsel, and evaluated such information for the Fund. The Board did not identify any single factor as being all-important or controlling, and each Board member may have attributed different levels of importance to different factors. In deciding to approve the Proposed Agreement under the terms ultimately determined by the Board to be appropriate, the Board based its decision on a number of factors, including the following:
Nature, Extent and Quality of Services — Generally. Under the Proposed Agreement, ACIM is responsible for providing or arranging for all services necessary for the operation of the Fund. The Board noted that under the Proposed Agreement, ACIM provides or arranges at its own expense a wide variety of services including:
• constructing and designing the Fund
• portfolio research and security selection
• initial capitalization/funding
• securities trading
• Fund administration
• custody of Fund assets
25
• daily valuation of the Fund’s portfolio
• shareholder servicing and transfer agency, including shareholder
confirmations, recordkeeping and communications
• legal services
• regulatory and portfolio compliance
• financial reporting
• marketing and distribution
The Board noted that many of these services have expanded over time both in terms of quantity and complexity in response to shareholder demands, competition in the industry, changing distribution channels and the changing regulatory environment.
Investment Management Services. The investment management services provided to the Fund are complex and provide Fund shareholders access to professional money management, instant diversification of their investments within an asset class, the opportunity to easily diversify among asset classes, and liquidity. As a part of its general oversight and in evaluating investment performance, the Board expects ACIM to manage the Fund in accordance with its investment objectives and approved strategies. In providing these services, ACIM utilizes teams of investment professionals who require extensive information technology, research, training, compliance and other systems to conduct their business. The Board, directly and through its Fund Performance Review Committe e, regularly reviews investment performance information for the Fund, together with comparative information for appropriate benchmarks and/or peer groups of similarly-managed funds, over different time horizons. If performance concerns are identified, the Fund receives special reviews until performance improves, during which time the Board discusses with ACIM the reasons for such underperformance and any efforts being undertaken to improve performance.
Shareholder and Other Services. Under the Proposed Agreement, ACIM will also provide the Fund with a comprehensive package of transfer agency, shareholder, and other services. The Board, directly and through the various committees of the Board, regularly reviews reports and evaluations of such services. These reports include, but are not limited to, information regarding the operational efficiency and accuracy of the shareholder and transfer agency services provided, staffing levels, shareholder satisfaction (as measured by external as well as internal sources), technology support, new products and services offered to Fund shareholders, securities trading activities, portfolio valuation services, auditing services, and legal and operational compliance activities. Certain aspects of shareholder and transfer agency service level eff iciency and the quality of securities trading activities are measured by independent third party providers and are presented in comparison to other fund groups not managed by ACIM.
26
Costs of Services Provided and Profitability. The Advisor provided detailed information concerning its cost of providing various services to the Fund, its profitability in managing the Fund, its overall profitability, and its financial condition. The Board reviewed with the Advisor the methodology used to prepare this financial information. The Board has also reviewed with the Advisor its methodology for compensating the investment professionals that provide services to the Fund as well as compensation to the five highest paid personnel of the Advisor. This financial information regarding the Advisor is considered in order to evaluate the Advisor’s financial condition, its ability to continue to provide services under the Proposed Agreement, and the reasonableness of the proposed management fees. The Board concluded that the Advisor’s profits were reasonable in light of the services provided to the Fund.
Ethics. The Board generally considers ACIM’s commitment to providing quality services to shareholders and to conducting its business ethically. It noted that ACIM’s practices generally meet or exceed industry best practices.
Economies of Scale. The Board also reviewed information provided by ACIM regarding the possible existence of economies of scale in connection with the management of the Fund. The Board concluded that economies of scale are difficult to measure and predict with precision, especially on a fund-by-fund basis. The analysis of economies of scale is further complicated by the additional services and content provided by ACIM and its reinvestment in its ability to provide and expand those services. Accordingly, the Board seeks to evaluate economies of scale by reviewing information, such as year-over-year profitability of its advisor generally, the profitability of its management of the Fund specifically, and the expenses incurred by the advisor in providing various functions to the Fund. The Board believes ACIM will appropriately sha re economies of scale through its competitive fee structure, offering competitive fees from fund inception, fee breakpoints as the Fund increases in size, and through reinvestment in its business to provide shareholders additional services and enhancements to existing services.
Comparison to Fees of Funds not Managed by the Advisor. Both the Prior and Proposed Agreements provide that the Fund pays ACGIM or ACIM a single, all-inclusive (or unified) management fee for providing all services necessary for the management and operation of the Fund, other than brokerage expenses, taxes, interest, extraordinary expenses, and the fees and expenses of the Fund’s Independent Directors (including their independent legal counsel) and expenses incurred in connection with the provision of shareholder services and distribution services under a plan adopted pursuant to Rule 12b-1 under the 1940 Act. Under the unified fee structure, ACIM is responsible for providing all investment advisory, custody, audit, administrative, compliance, recordkeeping, marketing and shareholder services, or arranging and supervising third parties that provide such services. By contrast, most other funds are charged a variety of fees, including an investment advisory fee, a transfer agency fee, an administrative fee, distribution charges and other expenses. Other than their investment advisory fees and any applicable Rule 12b-1 distribution
27
fees, the components of the total fees charged by these other funds may be increased without shareholder approval. The Board believes the unified fee structure is a benefit to Fund shareholders because it clearly discloses to shareholders the cost of owning Fund shares, and, since the unified fee cannot be increased without a vote of Fund shareholders, it shifts to ACIM the risk of increased costs of operating the Fund and provides a direct incentive to minimize administrative inefficiencies. Part of the Board’s analysis of fee levels involves reviewing certain evaluative data compiled by an independent provider comparing the Fund’s unified fee to the total expense ratios of similar funds not managed by ACIM. The Board concluded that the management fee to be paid by the Fund to ACIM under the Proposed Agreement is reasonable in light of the services to be provided to the Fund.
Comparison to Fees and Services Provided to Other Clients of the Advisor. The Board also requested and received information from ACIM concerning the nature and extent of the services, fees, and profitability of its advisory services to advisory clients other than the Fund. They observed that these varying types of client accounts require different services and involve different regulatory and entrepreneurial risks than the management of the Fund. The Board analyzed this information and concluded that the fees charged and services provided to the Fund were reasonable by comparison.
Collateral or “Fall-Out” Benefits Derived by the Advisor. The Board considered the existence of collateral benefits ACIM may receive as a result of its relationship with the Fund. The Board concluded that ACIM’s primary business is managing mutual funds and it generally does not use Fund or shareholder information to generate profits in other lines of business, and therefore does not derive any significant collateral benefits from them. The Board noted that ACIM receives proprietary research from broker-dealers that execute Fund portfolio transactions and concluded that this research is likely to benefit Fund shareholders. The Board also determined that ACIM is able to provide investment management services to certain clients other than the Fund, at least in part, due to its existing infrastructure built to serv e the fund complex. The Board concluded, however, that the assets of those other clients are not material to the analysis and, in any event, are included with the assets of fund clients to determine breakpoints in each fund’s fee schedule, provided they are managed using the same investment team and strategy.
Conclusion of the Board. As a result of this process, the Board, in the absence of particular circumstances and assisted by the advice of its independent legal counsel, taking into account all of the factors discussed above and the information provided by ACIM and others, concluded that the Proposed Agreement be approved and recommended its approval to Fund shareholders.
28
Retirement Account Information
As required by law, distributions you receive from certain IRAs, or 403(b), 457 and qualified plans are subject to federal income tax withholding, unless you elect not to have withholding apply. Tax will be withheld on the total amount withdrawn even though you may be receiving amounts that are not subject to withholding, such as nondeductible contributions. In such case, excess amounts of withholding could occur. You may adjust your withholding election so that a greater or lesser amount will be withheld.
If you don’t want us to withhold on this amount, you must notify us to not withhold the federal income tax. You may notify us in writing or in certain situations by telephone or through other electronic means. You have the right to revoke your withholding election at any time and any election you make may remain in effect until revoked by filing a new election.
Remember, even if you elect not to have income tax withheld, you are liable for paying income tax on the taxable portion of your withdrawal. If you elect not to have income tax withheld or you don’t have enough income tax withheld, you may be responsible for payment of estimated tax. You may incur penalties under the estimated tax rules if your withholding and estimated tax payments are not sufficient. You can reduce or defer the income tax on a distribution by directly or indirectly rolling such distribution over to another IRA or eligible plan. You should consult your tax advisor for additional information.
State tax will be withheld if, at the time of your distribution, your address is within one of the mandatory withholding states and you have federal income tax withheld. State taxes will be withheld from your distribution in accordance with the respective state rules.
Proxy Voting Guidelines
American Century Investment Management, Inc., the fund’s investment advisor, is responsible for exercising the voting rights associated with the securities purchased and/or held by the fund. A description of the policies and procedures the advisor uses in fulfilling this responsibility is available without charge, upon request, by calling 1-800-345-2021. It is also available on American Century Investments’ website at americancentury.com and on the Securities and Exchange Commission’s website at sec.gov. Information regarding how the investment advisor voted proxies relating to portfolio securities during the most recent 12-month period ended June 30 is available on the “About Us” page at americancentury.com. It is also available at sec.gov.
Quarterly Portfolio Disclosure
The fund files its complete schedule of portfolio holdings with the Securities and Exchange Commission (SEC) for the first and third quarters of each fiscal year on Form N-Q. The fund’s Forms N-Q are available on the SEC’s website at sec.gov, and may be reviewed and copied at the SEC’s Public Reference Room in Washington, DC. Information on the operation of the Public Reference Room may be obtained by calling 1-800-SEC-0330. The fund also makes its complete schedule of portfolio holdings for the most recent quarter of its fiscal year available on its website at americancentury.com and, upon request, by calling 1-800-345-2021.
29
The following indices are used to illustrate investment market, sector, or style performance or to serve as fund performance comparisons. They are not investment products available for purchase.
Morgan Stanley Capital International (MSCI) has developed several indices that measure the performance of foreign stock markets.
The MSCI EAFE (Europe, Australasia, Far East) Index is designed to measure developed market equity performance, excluding the U.S. and Canada.
The MSCI EAFE Growth Index is a capitalization-weighted index that monitors the performance of growth stocks from Europe, Australasia, and the Far East.
The MSCI EAFE Value Index is a capitalization-weighted index that monitors the performance of value stocks from Europe, Australasia, and the Far East.
The MSCI EM (Emerging Markets) Index represents the performance of stocks in global emerging market countries.
The MSCI EM Growth Index represents the performance of growth stocks in global emerging market countries.
The MSCI Europe Index is designed to measure equity market performance in Europe.
The MSCI Japan Index is designed to measure equity market performance in Japan.
The MSCI World Free Index represents the performance of stocks in developed countries (including the United States) that are available for purchase by global investors.
30
31
32

| |
| |
| Contact Us | |
| americancentury.com | |
| Automated Information Line | 1-800-345-8765 |
| Investor Services Representative | 1-800-345-2021 or |
| | 816-531-5575 |
| Investors Using Advisors | 1-800-378-9878 |
| Business, Not-For-Profit, Employer-Sponsored | |
| Retirement Plans | 1-800-345-3533 |
| Banks and Trust Companies, Broker-Dealers, | |
| Financial Professionals, Insurance Companies | 1-800-345-6488 |
| Telecommunications Device for the Deaf | 1-800-634-4113 |
| American Century World Mutual Funds, Inc. | |
| Investment Advisor: | |
| American Century Investment Management, Inc. | |
| Kansas City, Missouri | |
This report and the statements it contains are submitted for the general
information of our shareholders. The report is not authorized for distribution to
prospective investors unless preceded or accompanied by an effective prospectus.
American Century Investment Services, Inc., Distributor
©2010 American Century Proprietary Holdings, Inc. All rights reserved.
1007
CL-SAN-68668
| |
| ITEM 2. CODE OF ETHICS. |
|
| Not applicable for semiannual report filings. |
|
| ITEM 3. AUDIT COMMITTEE FINANCIAL EXPERT. |
|
| Not applicable for semiannual report filings. |
|
| ITEM 4. PRINCIPAL ACCOUNTANT FEES AND SERVICES. |
|
| Not applicable for semiannual report filings. |
|
| ITEM 5. AUDIT COMMITTEE OF LISTED REGISTRANTS. |
|
| Not applicable. |
|
| ITEM 6. INVESTMENTS. |
| |
| (a) | The schedule of investments is included as part of the report to stockholders filed under Item 1 |
| | of this Form. |
| |
| (b) | Not applicable. |
|
| ITEM 7. DISCLOSURE OF PROXY VOTING POLICIES AND PROCEDURES FOR |
| CLOSED-END MANAGEMENT INVESTMENT COMPANIES. |
|
| Not applicable. |
|
| ITEM 8. PORTFOLIO MANAGERS OF CLOSED-END MANAGEMENT |
| INVESTMENT COMPANIES. |
|
| Not applicable. |
|
| ITEM 9. PURCHASES OF EQUITY SECURITIES BY CLOSED-END MANAGEMENT |
| INVESTMENT COMPANY AND AFFILIATED PURCHASERS. |
|
| Not applicable. |
|
| ITEM 10. SUBMISSION OF MATTERS TO A VOTE OF SECURITY HOLDERS. |
|
| During the reporting period, there were no material changes to the procedures by which shareholders may |
| recommend nominees to the registrant’s board. |
|
| ITEM 11. CONTROLS AND PROCEDURES. |
| |
| (a) | The registrant's principal executive officer and principal financial officer have concluded that |
| | the registrant's disclosure controls and procedures (as defined in Rule 30a-3(c) under the |
| | Investment Company Act of 1940) are effective based on their evaluation of these controls and |
| | procedures as of a date within 90 days of the filing date of this report. |
| (b) | | | There were no changes in the registrant's internal control over financial reporting (as defined in |
| | | Rule 30a-3(d) under the Investment Company Act of 1940) that occurred during the registrant's |
| | | | second fiscal quarter of the period covered by this report that have materially affected, or are |
| | | | reasonably likely to materially affect, the registrant's internal control over financial reporting. |
| |
| ITEM 12. EXHIBITS. |
| | |
| (a) | (1) | Not applicable for semiannual report filings. |
| |
| (a) | (2) | Separate certifications by the registrant’s principal executive officer and principal financial |
| | | | officer, pursuant to Section 302 of the Sarbanes-Oxley Act of 2002 and Rule 30a-2(a) under the |
| | | | Investment Company Act of 1940, are filed and attached hereto as EX-99.CERT. |
| |
| (a) | (3) | Not applicable. |
| |
| (b) | | A certification by the registrant’s chief executive officer and chief financial officer, pursuant to |
| | | | Section 906 of the Sarbanes-Oxley Act of 2002, is furnished and attached hereto as EX- |
| | | | 99.906CERT. |
SIGNATURES
Pursuant to the requirements of the Securities Exchange Act of 1934 and the Investment Company Act of 1940, the registrant has duly caused this report to be signed on its behalf by the undersigned, thereunto duly authorized.
| | |
| Registrant: | American Century World Mutual Funds, Inc. |
| |
| By: | /s/ Jonathan S. Thomas |
| | Name: | Jonathan S. Thomas |
| | Title: | President |
| |
| Date: | July 27, 2010 |
Pursuant to the requirements of the Securities Exchange Act of 1934 and the Investment Company Act of 1940, this report has been signed below by the following persons on behalf of the registrant and in the capacities and on the dates indicated.
| | |
| By: | /s/ Jonathan S. Thomas |
| | Name: | Jonathan S. Thomas |
| | Title: | President |
| | | (principal executive officer) |
| |
| Date: | July 27, 2010 |
| | |
| By: | /s/ Robert J. Leach |
| | Name: | Robert J. Leach |
| | Title: | Vice President, Treasurer, and |
| | | Chief Financial Officer |
| | | (principal financial officer) |
| |
| Date: | July 27, 2010 |