Exhibit 99.1
Investor Presentation November 2013 © 2013 Ocwen Financial Corporation. All rights reserved.

FORWARD-LOOKING STATEMENTS: Our presentation contains certain forward-looking statements that are made pursuant to the safe harbor provisions of the federal securities laws. These forward-looking statements may be identified by a reference to a future period or by the use of forward-looking terminology. They may involve risks and uncertainties that could cause the company's actual results to differ materially from the results discussed in the forward-looking statements. Important factors that could cause actual results to differ include, but are not limited to, the characteristics of our servicing portfolio, including prepayment speeds along with delinquency and advance rates; our ability to grow and adapt our business, including the availability of new loan servicing and other accretive business opportunities; our ability to successfully modify delinquent loans, manage foreclosures and sell foreclosed properties; our ability to effectively manage our exposure to interest rate changes; uncertainty related to general economic and market conditions, delinquency rates, home prices and disposition timelines on foreclosed properties; uncertainty related to acquisitions, including our ability to integrate the systems, procedures and personnel of acquired companies as well as other risks detailed in Ocwen's reports and filings with the Securities and Exchange Commission (SEC) including its Annual Report on Form 10-K for the year ended December 31, 2012 and its Quarterly Report on Form 10-Q for the quarter ended September 30, 2013. The forward-looking statements speak only as of the date they are made and except for our ongoing obligations under the U.S. federal securities laws, we undertake no obligation to update or revise forward-looking statements whether as a result of new information, future events or otherwise. NON-GAAP MEASURES: Our presentation contains non-GAAP performance measures, such as our references to "normalized" results and "adjusted cash flow from operations". We believe these non-GAAP performance measures may provide additional meaningful comparisons between current results and results in prior periods. Non-GAAP performance measures should be viewed in addition to, and not as an alternative for, the Company's reported results under accounting principles generally accepted in the United States.

Investment Highlights: "Best in Class" Servicer with Unique Advantages ??Leading provider of residential and commercial mortgage loan servicing and residential mortgage lending ??20+ years of innovation in loss mitigation ??#1 in servicing quality in third-party studies ??Ocwen's overall performance ranked best among servicers Moody's analyzed for loans delinquent at the height of mortgage crisis ( ~1.1million loans that were 60+ delinquent and in foreclosure as of Dec-2008) ??Low cost, scalable servicing platform and technology that helps keep borrowers in their homes ??70% lower than average cost-to-service non-performing non-agency loans and superior loss mitigation ??Advanced technology utilizing superior training and dialogue engines improves scalability, reduces outcome variability and substantially lowers losses compared to peers ??Applies psychological principles to overcome borrower fears and objections ??Unique track-record of successful acquisitions with experienced management team ??Sustained track-record of successful large acquisitions ??Employer of approximately 10,800 professionals and staff worldwide ??Experienced management with aligned interests (management and the Board have 20% ownership) 3
Investment Highlights: Strong Cash-flows and Substantial Prospects for Growth ??Sustained history of growth in servicing portfolio ??Compound annual growth rate of 35% in unpaid principal balance (UPB) since 2000* ??Over $480 billion servicing portfolio at the end of Q3 2013 on a pro forma basis* ??From 2012 through September 2013, acquired more than $325 billion in servicing ??Substantial growth prospects ??Embedded growth from existing book and improving economy ??$400 billion pipeline of opportunities that may close over next 12 - 18 months ??Adjacent markets and other long-term opportunities ??Strong cash-flows, balance sheet and ability to fund future growth ??$1.4 billion of cash flow from operations in the last four quarters ??Potential 10-year cash-flows in excess of $13 billion with long "tail" earnings beyond that ??Substantial ability to fund new acquisitions without new equity ??Cash in excess of requirements for growth may be used for stock repurchases * Q3 2013 pro-forma UPB estimate; includes estimates for OneWest PLS portfolio and Green Point acquisitions as if completed 4
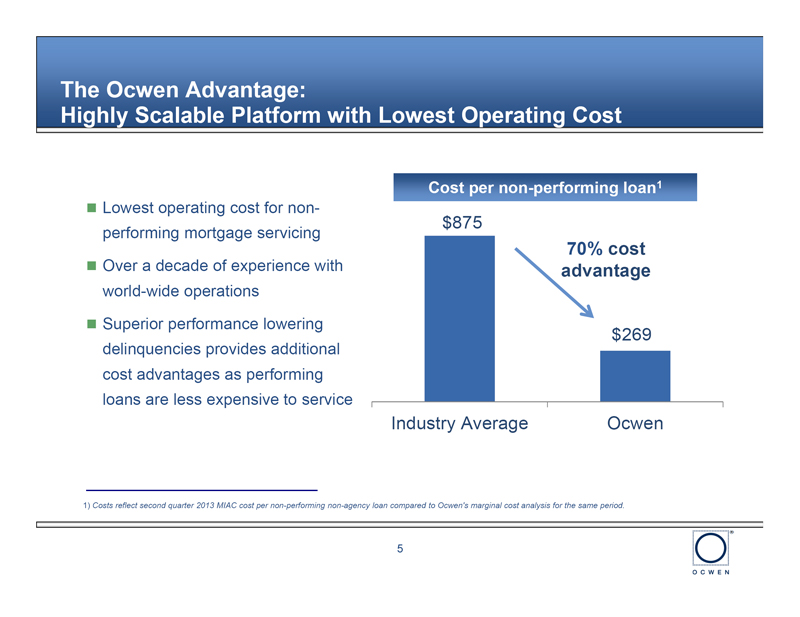
The Ocwen Advantage: Highly Scalable Platform with Lowest Operating Cost Cost per non-performing loan1 ??Lowest operating cost for non- $875 performing mortgage servicing 70% cost ??Over a decade of experience with advantage world-wide operations ??Superior performance lowering $269 delinquencies provides additional cost advantages as performing loans are less expensive to service Industry Average Ocwen 1) Costs reflect second quarter 2013 MIAC cost per non-performing non-agency loan compared to Ocwen's marginal cost analysis for the same period. 5
Low-cost, Scalable Servicing Platform and Technology that Helps Keep Borrowers in their Homes ??Proprietary servicing system developed over 20+ years at a cost of over $150 million ??Utilizes advanced optimization algorithms to reduce variability and losses by evaluating loan resolution alternatives ??Rather than allow discretion to our retention counselors, we rely on a model to make optimal decisions ??No risk of differential treatment to borrowers based on counselor bias ??Uses artificial intelligence, designed and tested by PhDs in psychology and statistics to develop dialogues with the homeowner ??Applies psychological principles to overcome borrower fears and objections ??Delivers consistent and compliant messages to borrowers ??Dialogue engine combined with proven training methods creates best-in-class retention counselor in three months, rather than the several years for other servicers ??Simplifies set-up of new call centers regardless of location ??Hiring based on language skills, empathy and intelligence; experience not required ??Has allowed more rapid scalability than other servicers 6

What this Means: LOCOM Accounting and Superior Productivity Creates Embedded Value in MSRs Our industry-lowest cost to service creates incremental value embedded in our MSRs $4,000 Millions of Dollars (as of end of Q3 2013) $3,382 $3,500 $3,000 $863 $2,519 $2,500 $1,834 $685 $685 $2,000 $1,500 $1,000 $1,834 $1,834 $1,834 $500 $0 Book Value Fair Market Value Internal Valuation o Fair market value reflects third-party estimates of value o Internal valuation revises third-party estimates of value to reflect lower servicing costs. It does not reflect Ocwen's superior ability to lower delinquencies that would further increase the value of our MSRs 7

The Ocwen Advantage: More Modifications with Lower Re-default Rates Comparison of Modification and Re-default Rates for Subprime Securities 65.0% Ocwen Mods Outstanding, 58.75% 60.0% Modifications outstanding as a percent of portfolio for subprime securities 55.0% Non-Ocwen Mods 50.0% Outstanding, 48.44% 45.0% 40.0% Non-Ocwen Mod 60+, 33.77% 35.0% 30.0% 25.0% Modification re-defaults (more than 60- Ocwen Mod 60+, days past-due) outstanding as a percent 26.86% of portfolio for subprime securities 20.0% 15.0% Oct-10 Nov-10 Dec-10 Jan-11 Feb-11 Mar-11 Apr-11 May-11 Jun-11 Jul-11 Aug-11 Sep-11 Oct-11 Nov-11 Dec-11 Jan-12 Feb-12 Mar-12 Apr-12 May-12 Jun-12 Jul-12 Aug-12 Sep-12 Oct-12 Nov-12 Dec-12 Jan-13 Feb-13 Mar-13 Apr-13 May-13 Jun-13 Jul-13 Aug-13 Sep-13 Source: BlackBox Logic - Subprime non-agency securities data. Ocwen data does not include recently acquired ResCap loans 8
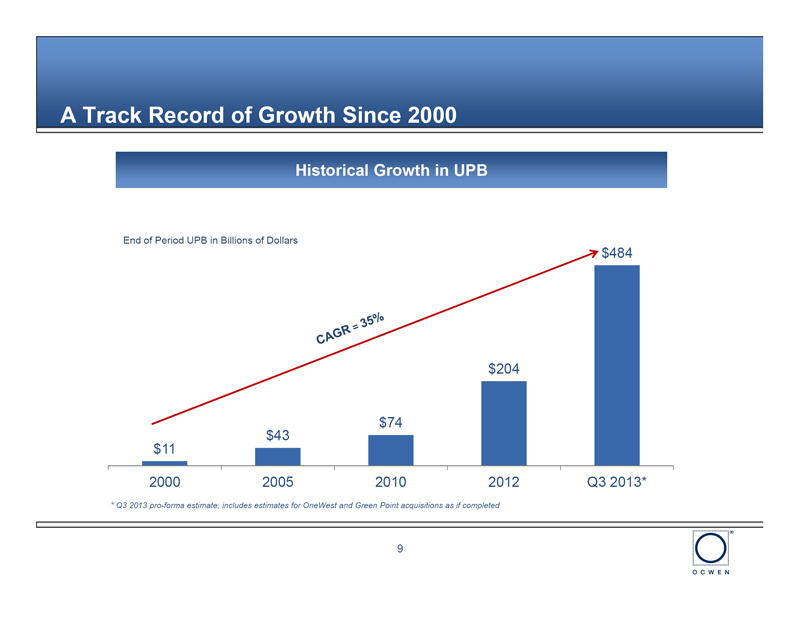
A Track Record of Growth Since 2000 Historical Growth in UPB End of Period UPB in Billions of Dollars $484 $204 $74 $43 $11 2000 2005 2010 2012 Q3 2013* * Q3 2013 pro-forma estimate; includes estimates for OneWest and Green Point acquisitions as if completed 9
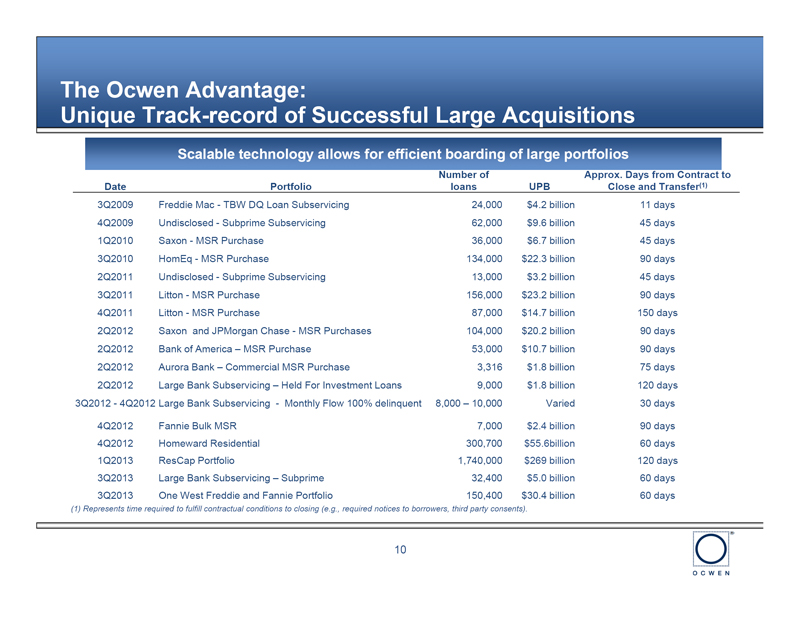
The Ocwen Advantage: Unique Track-record of Successful Large Acquisitions Scalable technology allows for efficient boarding of large portfolios Number of Approx. Days from Contract to Date Portfolio loans UPB Close and Transfer(1) 3Q2009 Freddie Mac - TBW DQ Loan Subservicing 24,000 $4.2 billion 11 days 4Q2009 Undisclosed - Subprime Subservicing 62,000 $9.6 billion 45 days 1Q2010 Saxon - MSR Purchase 36,000 $6.7 billion 45 days 3Q2010 HomEq - MSR Purchase 134,000 $22.3 billion 90 days 2Q2011 Undisclosed - Subprime Subservicing 13,000 $3.2 billion 45 days 3Q2011 Litton - MSR Purchase 156,000 $23.2 billion 90 days 4Q2011 Litton - MSR Purchase 87,000 $14.7 billion 150 days 2Q2012 Saxon and JPMorgan Chase - MSR Purchases 104,000 $20.2 billion 90 days 2Q2012 Bank of America - MSR Purchase 53,000 $10.7 billion 90 days 2Q2012 Aurora Bank - Commercial MSR Purchase 3,316 $1.8 billion 75 days 2Q2012 Large Bank Subservicing - Held For Investment Loans 9,000 $1.8 billion 120 days 3Q2012 - 4Q2012 Large Bank Subservicing - Monthly Flow 100% delinquent 8,000 - 10,000 Varied 30 days 4Q2012 Fannie Bulk MSR 7,000 $2.4 billion 90 days 4Q2012 Homeward Residential 300,700 $55.6billion 60 days 1Q2013 ResCap Portfolio 1,740,000 $269 billion 120 days 3Q2013 Large Bank Subservicing - Subprime 32,400 $5.0 billion 60 days 3Q2013 One West Freddie and Fannie Portfolio 150,400 $30.4 billion 60 days (1) Represents time required to fulfill contractual conditions to closing (e.g., required notices to borrowers, third party consents). 10
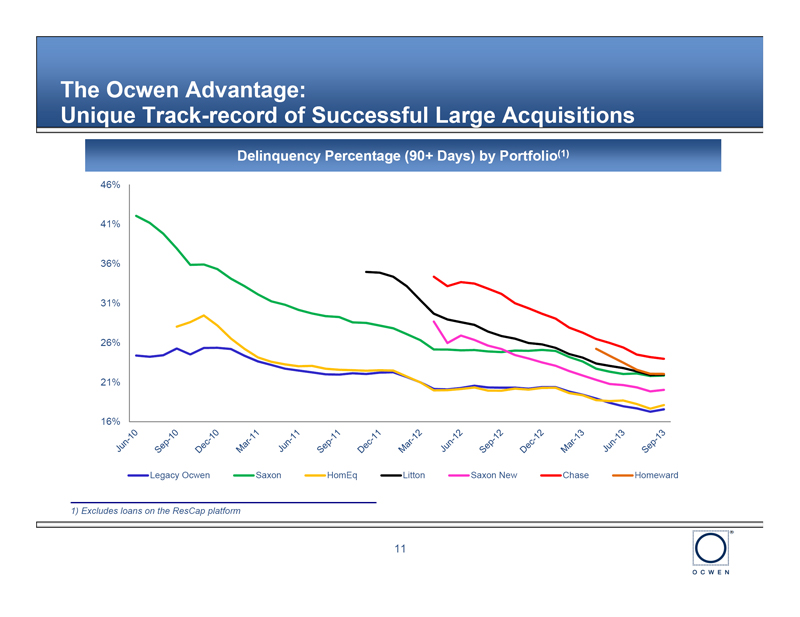
The Ocwen Advantage: Unique Track-record of Successful Large Acquisitions Delinquency Percentage (90+ Days) by Portfolio(1) 46% 41% 36% 31% 26% 21% 16% Legacy Ocwen Saxon HomEq Litton Saxon New Chase Homeward 1) Excludes loans on the ResCap platform 11

Multiple Sources of Growth Beyond 5 years 5 years Long-term opportunities Built-in Earnings tail divestiture 2013 - 2014 and servicer o Prime expansion acquisitions o Non-prime re-emergence o $400 billion potential pipeline1 New Acquisitions o Reverse Mortgages o Over $1 trillion opportunity2 o Other adjacent lending oOne West PLS- $42 billion 3Q 2013 o Greenpoint - $8 billion Sep 30, 2013 Ocwen Portfolio o $434 billion 1) Internal analysis of specific identified opportunities that we may close in the next 12-18 months 2) LPS data on delinquencies and US government data on servicing market; see next slide for calculation 12
Strong Pipeline ??Strong pipeline of opportunities ??Current pipeline of $400 billion of UPB of specifically identified opportunities that we may close over next 12-18 months ??Bank divestiture ??Still in the "middle-innings" of the melt-down, with serious delinquencies, loans in foreclosure and REO approximately the same as the average over the past 4 years1 ??One Trillion dollars in delinquent servicing at banks, typically trades at ~25% delinquency, making the total potential population $4 trillion - we believe at least 25% is likely to trade = $1 trillion ??Banks driven by desire to improve consumer franchise, reduce costs and mitigate compliance burdens ??Additional pressure from future Basel III capital regulations ??Servicer Acquisitions ??Historically, most of Ocwen's growth has come from acquisitions of existing servicers or their assets ??Low-cost and high productivity provide opportunity to continue to acquire inefficient servicers or those seeking to exit 1) Fannie Mae, Freddie Mac, FHFA, Bloomberg, Mortgage Bankers Association, and Green Street Advisors. 13
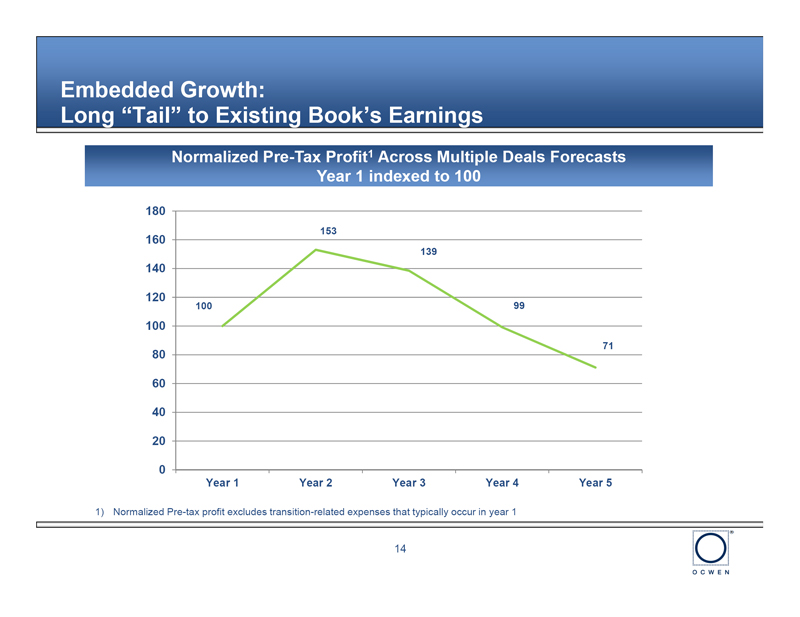
Embedded Growth: Long "Tail" to Existing Book's Earnings Normalized Pre-Tax Profit1 Across Multiple Deals Forecasts Year 1 indexed to 100 180 153 160 139 140 120 100 99 100 71 80 60 40 20 0 Year 1 Year 2 Year 3 Year 4 Year 5 1) Normalized Pre-tax profit excludes transition-related expenses that typically occur in year 1 14

Embedded Growth: A Stronger Economy Would Support Improved Profitability US Unemployment Rate(1) 10.0% ??Lower delinquency and re-default 9.0% 9.0% rates 7.8% 8.0% 7.2% ??Lower involuntary prepayments that 7.0% account for most non-prime CPR 6.0% 5.0% ??Higher interest rates - 10 year swap 4.0% rate is up 100 bps from end of Sep 2011 Sep 2012 Sep 2013 December to end of September(3) - 12-Month US Home Price Appreciation(2) 8.0% 7.2% lowers voluntary prepayments 6.0% 4.0% 3.4% 2.0% 0.0% Lower Costs -2.0% -4.0% Higher Revenue -6.0% -5.6% -8.0% 2011 Q2 2012 Q2 2013 Q2 Longer Earnings "Tail" 1) Bureau of Labor Statistics 2) FHFA seasonally adjusted purchase-only house price appreciation over prior year quarter 3) Federal Reserve 10-Year Interest rate swaps daily data 15
Long-term: Multiple Opportunities for Growth ??Prime expansion ??Acquisition of Homeward Residential added origination platform in 2013 ??Lending segment expected to contribute $18 to 22 million to pre-tax income in the fourth quarter ??Acquisition of ResCap provided a top prime loan servicing platform ??Non-prime re-emergence ??Home-ownership rates dropping to lowest level in 50 years as many buyers shut-out by high credit standards in today's mortgage market ??Already seeing politicians calling for some relaxation of QM standards ??Home-price improvements will induce private capital to accept "traditional" low-LTV non-prime risks ??Reverse mortgage & other adjacent products ??Purchase of Liberty Reverse Mortgage in 2013 provides industry leader in reverse mortgage originations ??Similar opportunities exist in a variety of adjacent spaces that leverage Ocwen's core competitive advantages 16
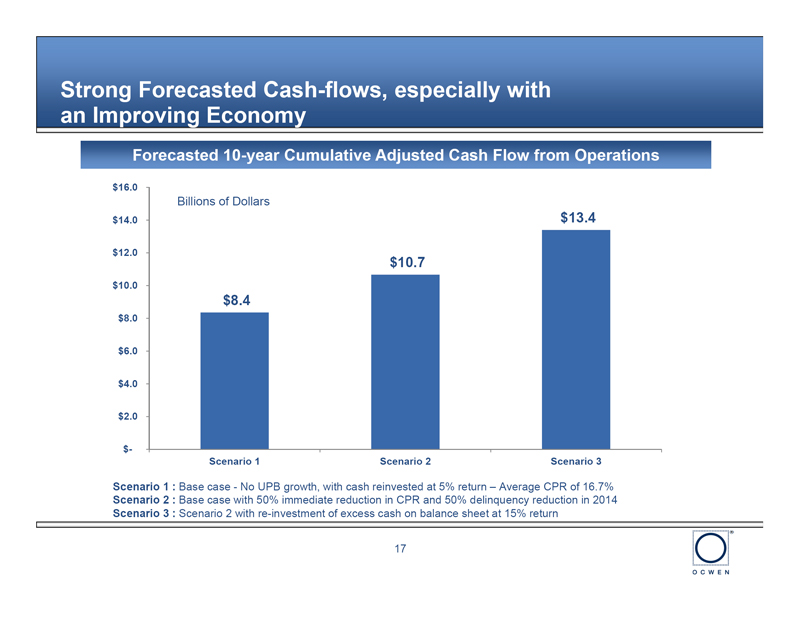
Strong Forecasted Cash-flows, especially with an Improving Economy Forecasted 10-year Cumulative Adjusted Cash Flow from Operations $16.0 Billions of Dollars $14.0 $13.4 $12.0 $10.7 $10.0 $8.4 $8.0 $6.0 $4.0 $2.0 $- Scenario 1 Scenario 2 Scenario 3 Scenario 1 : Base case - No UPB growth, with cash reinvested at 5% return - Average CPR of 16.7% Scenario 2 : Base case with 50% immediate reduction in CPR and 50% delinquency reduction in 2014 Scenario 3 : Scenario 2 with re-investment of excess cash on balance sheet at 15% return 17

Balance Sheet: Ocwen Substantially Under-Levered Compared to Peers 1) Comparison based on data as on June 30, 2013 2) Adjustment to Ocwen reported numbers consists of fair value adjustment of $637 million on MSRs and 50% of deferred servicing fees (total of $512 million) as of June 30, 2013 3) Corporate Debt (Term loans/Notes included; does not include advance financing , HLSS pledged MSRs or warehouse lines for origination) / Total equity minus goodwill 18
Experienced Management Team ??William C. Erbey, Executive Chairman ??With Ocwen and predecessors since 1983; Chairman of the Board of Directors since September 1996 ??1975 to 1983, General Electric Capital Corporation, last position as President & CEO of General Electric Mortgage Insurance Corporation ??Ronald M. Faris, President & Chief Executive Officer ??With Ocwen and predecessors / subsidiaries since 1991; President since March 2001, CEO since October 2010 ??Prior to 1991, with Kidder, Peabody & Co., Inc. and PricewaterhouseCoopers LLP ??John V. Britti, Executive Vice President & Chief Financial Officer ??With Ocwen since 2011, CFO since March 2012 ??Over 20 years in mortgage and financial servicers, including COO for mortgage insurer RMIC, Vice President at Freddie Mac and Capital One, and Senior Manager at McKinsey & Company ??Scott W. Anderson, Executive Vice President & Chief Servicing Officer ??With Ocwen since 1993 ??Assumed responsibility for Residential Loan Servicing operations in 2009 ??David Applegate, Executive Vice President, Lending ??With Ocwen since December 2012 ??Over 20 years of experience in the mortgage industry, including CEO of Homeward, President of GMAC mortgage and President of Radian Guaranty 19
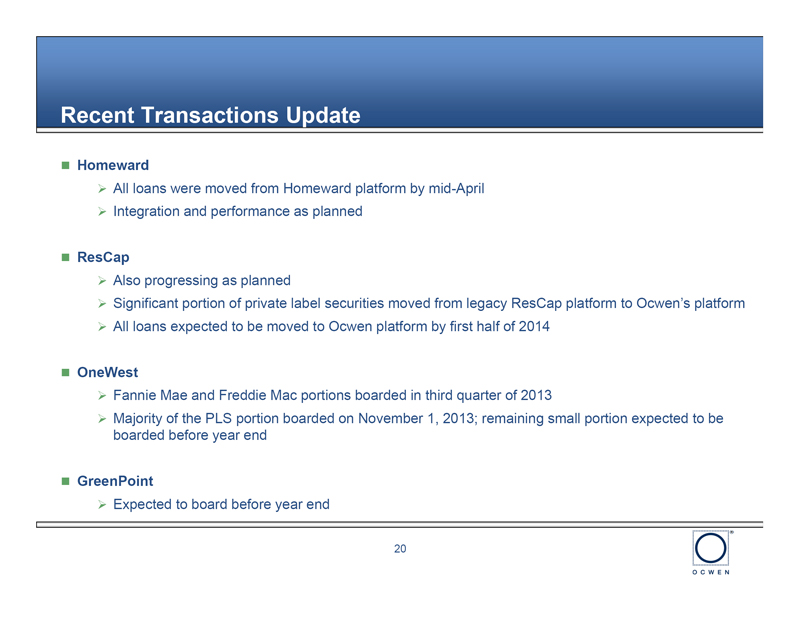
Recent Transactions Update ??Homeward ??All loans were moved from Homeward platform by mid-April ??Integration and performance as planned ??ResCap ??Also progressing as planned ??Significant portion of private label securities moved from legacy ResCap platform to Ocwen's platform ??All loans expected to be moved to Ocwen platform by first half of 2014 ??OneWest ??Fannie Mae and Freddie Mac portions boarded in third quarter of 2013 ??Majority of the PLS portion boarded on November 1, 2013; remaining small portion expected to be boarded before year end ??GreenPoint ??Expected to board before year end 20
Investment Summary ?Leading provider of residential and commercial mortgage loan servicing ?Low cost, scalable servicing platform and technology that helps keep borrowers in their homes ?Sustained history of growth in servicing portfolio with strong near-term and long-term growth prospects ?Strong cash-flow generation that leads earnings and enables growth without dilution ?Experienced, deep management team 21
Appendix ??Mortgage servicing 101 ??High quality asset nature of advances ??Portfolio summary ??Normalized pre-tax income ??Historical performance - quarterly and annual ??Historical cash flow data and adjusted cash flow from operations reconciliation ??Historical performance - normalized return on equity ??Cash collected from borrowers ??Loan modification history ??Data on non-foreclosure resolution rate & modification re-default ??Prepayment rates ??Conservative accounting ??Strong balance sheet with high quality assets ??Other supplemental disclosures 22
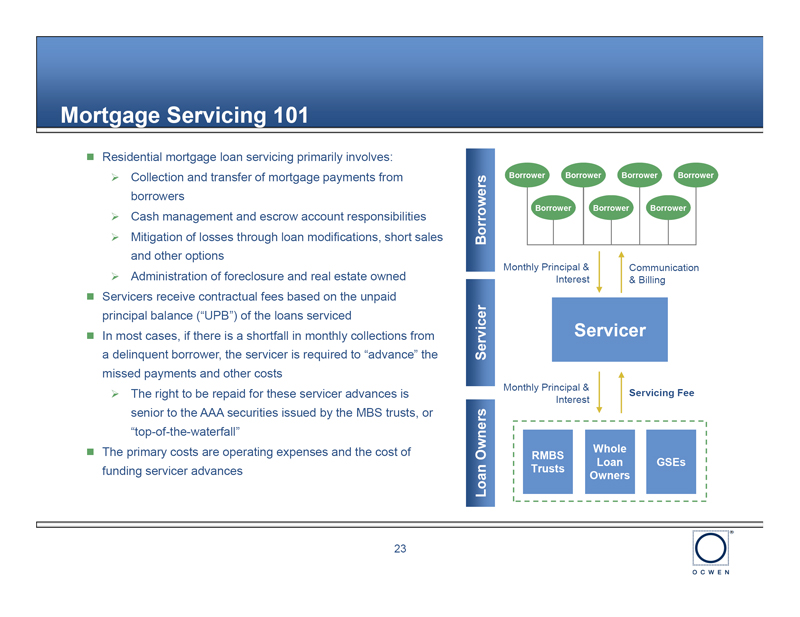
Mortgage Servicing 101 ??Residential mortgage loan servicing primarily involves: ??Collection and transfer of mortgage payments from Borrower Borrower Borrower Borrower borrowers Borrower Borrower Borrower ??Cash management and escrow account responsibilities ??Mitigation of losses through loan modifications, short sales Borrowers and other options Monthly Principal & Communication ??Administration of foreclosure and real estate owned Interest & Billing ??Servicers receive contractual fees based on the unpaid principal balance ("UPB") of the loans serviced ??In most cases, if there is a shortfall in monthly collections from Servicer a delinquent borrower, the servicer is required to "advance" the Servicer missed payments and other costs Monthly Principal & ??The right to be repaid for these servicer advances is Servicing Fee Interest senior to the AAA securities issued by the MBS trusts, or "top-of-the-waterfall" ??The primary costs are operating expenses and the cost of Whole RMBS Loan GSEs funding servicer advances Trusts Loan Owners Owners 23

Advances are High Quality Assets OCN advance collateral coverage 6/30/13 ??Advances self-liquidate at par $3.4 Billion ~1.1% ??Advances have the right to be repaid at "top-of- Advance Servicer the-waterfall," i.e. they are paid before any other Advances Rate payments to the trust $319.3 Billion (Property Value) $315.9 Billion ~98.9% ??Advances are substantially over-collateralized, as home prices would need to fall by over 90% The Downside for there to be insufficient funds to pay-back "Properties" Protection / Equity Cushion for Cushion advances at current advance rates Servicer Advances 24
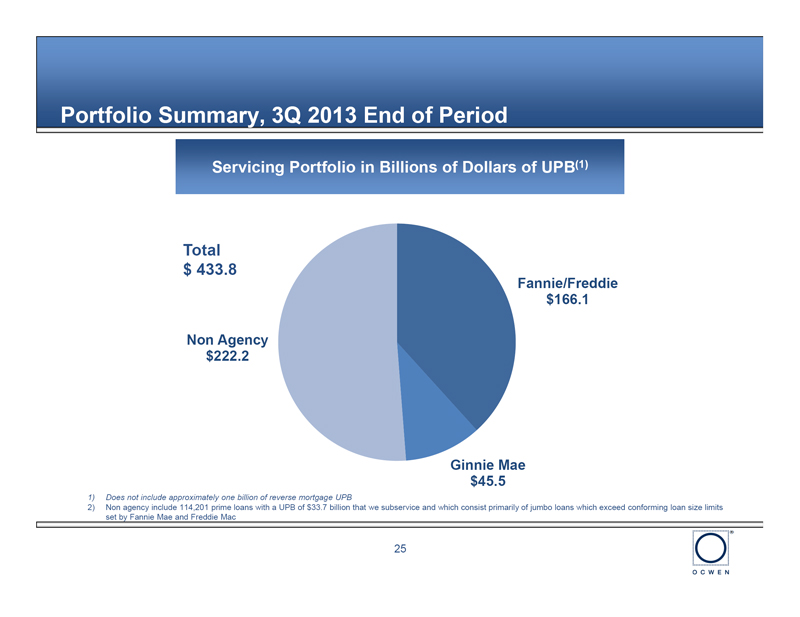
Portfolio Summary, 3Q 2013 End of Period Servicing Portfolio in Billions of Dollars of UPB(1) Total $ 433.8 Fannie/Freddie $166.1 Non Agency $222.2 Ginnie Mae $45.5 1) Does not include approximately one billion of reverse mortgage UPB 2) Non agency include 114,201 prime loans with a UPB of $33.7 billion that we subservice and which consist primarily of jumbo loans which exceed conforming loan size limits set by Fannie Mae and Freddie Mac 25
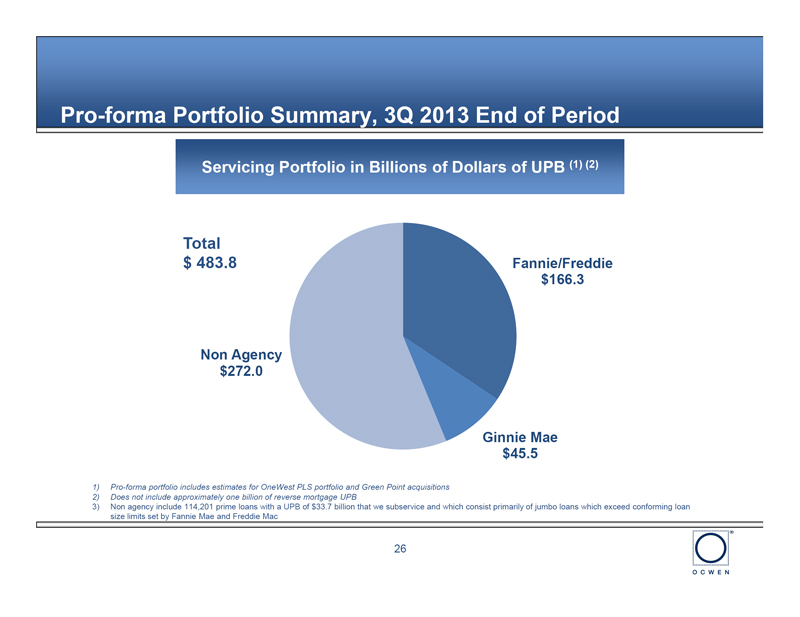
Pro-forma Portfolio Summary, 3Q 2013 End of Period Servicing Portfolio in Billions of Dollars of UPB (1) (2) Total $ 483.8 Fannie/Freddie $166.3 Non Agency $272.0 Ginnie Mae $45.5 1) Pro-forma portfolio includes estimates for OneWest PLS portfolio and Green Point acquisitions 2) Does not include approximately one billion of reverse mortgage UPB 3) Non agency include 114,201 prime loans with a UPB of $33.7 billion that we subservice and which consist primarily of jumbo loans which exceed conforming loan size limits set by Fannie Mae and Freddie Mac 26

Normalized Pre-Tax Income Growth - Up 82% from Q3 2012 Normalized Pre-Tax Income Millions of Dollars Q3 2012 Q4 2012 Q1 2013 Q2 2013 Q3 2013 Income before income taxes (GAAP) $80.7 $76.5 $51.3 $87.5 $76.3 Normalization Items: Transition Costs - 2.2 38.2 26.5 48.0 Funding Related - 1.5 17.0 - 17.9 Legal - - - - 5.1 Foreclosure Fund Reserve - - - 52.8 -Loss on Sale of Assets - 3.1 - - -Discontinued/Sold Operations - - (5.1) (0.9) (0.2) Total Normalization Items $0.0 $6.8 $50.1 $78.4 $70.7 Normalized pre-tax income (non-GAAP) $80.7 $83.3 $101.4 $165.9 $147.0 27
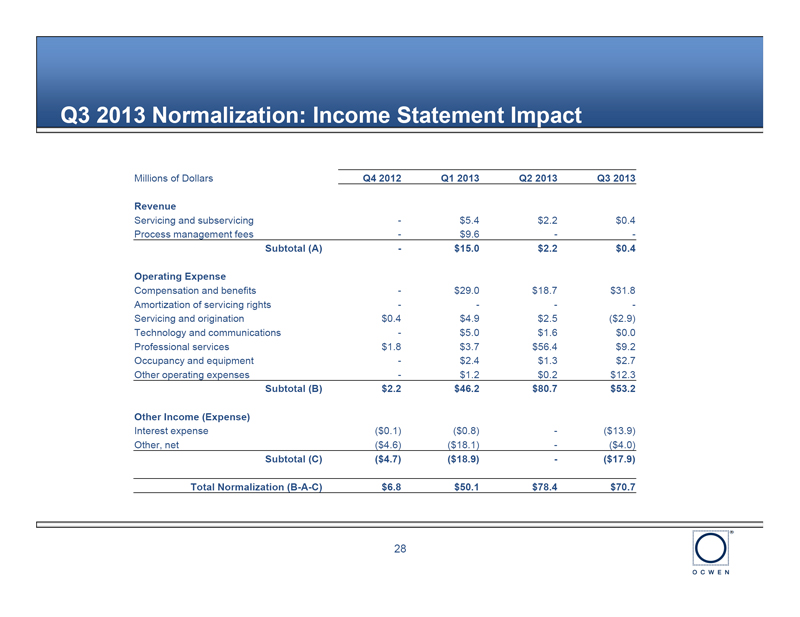
Q3 2013 Normalization: Income Statement Impact Millions of Dollars Q4 2012 Q1 2013 Q2 2013 Q3 2013 Revenue Servicing and subservicing - $5.4 $2.2 $0.4 Process management fees - $9.6 - - Subtotal (A) - $15.0 $2.2 $0.4 Operating Expense Compensation and benefits - $29.0 $18.7 $31.8 Amortization of servicing rights - - - -Servicing and origination $0.4 $4.9 $2.5 ($2.9) Technology and communications - $5.0 $1.6 $0.0 Professional services $1.8 $3.7 $56.4 $9.2 Occupancy and equipment - $2.4 $1.3 $2.7 Other operating expenses - $1.2 $0.2 $12.3 Subtotal (B) $2.2 $46.2 $80.7 $53.2 Other Income (Expense) Interest expense ($0.1) ($0.8) - ($13.9) Other, net ($4.6) ($18.1) - ($4.0) Subtotal (C) ($4.7) ($18.9) - ($17.9) Total Normalization (B-A-C) $6.8 $50.1 $78.4 $70.7 28
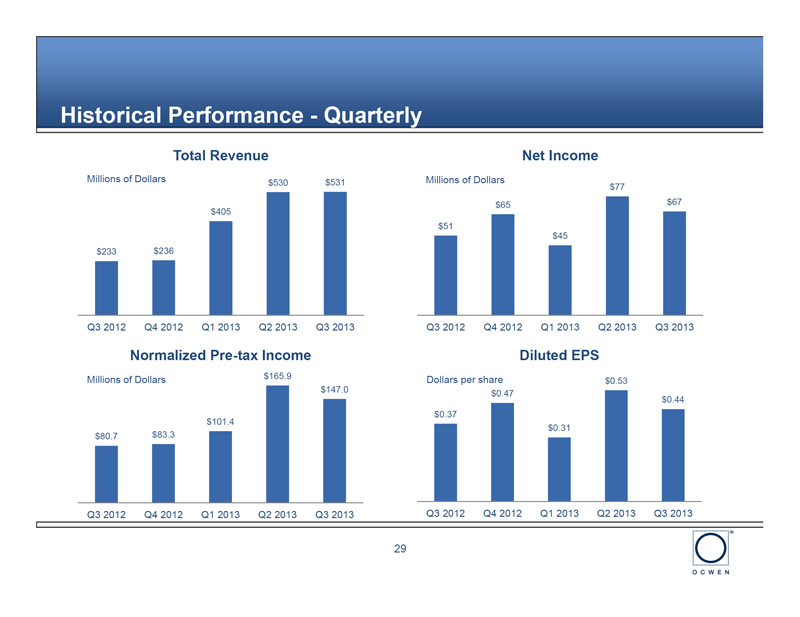
Historical Performance - Quarterly Total Revenue Net Income Millions of Dollars $530 $531 Millions of Dollars $77 $65 $67 $405 $51 $45 $233 $236 Q3 2012 Q4 2012 Q1 2013 Q2 2013 Q3 2013 Q3 2012 Q4 2012 Q1 2013 Q2 2013 Q3 2013 Normalized Pre-tax Income Diluted EPS Millions of Dollars $165.9 Dollars per share $0.53 $147.0 $0.47 $0.44 $0.37 $101.4 $0.31 $80.7 $83.3 Q3 2012 Q4 2012 Q1 2013 Q2 2013 Q3 2013 Q3 2012 Q4 2012 Q1 2013 Q2 2013 Q3 2013 29

Historical Performance - Annual Total Revenue $845 Net Income $181 Millions of Dollars Millions of Dollars $496 $360 $78 $38 2010 2011 2012 2010 2011 2012 Normalized Pre-tax Income Diluted EPS $1.31 $289.4 Millions of Dollars Dollars per share $188.8 $0.71 $122.4 $0.36 2010 2011 2012 2010 2011 2012 30
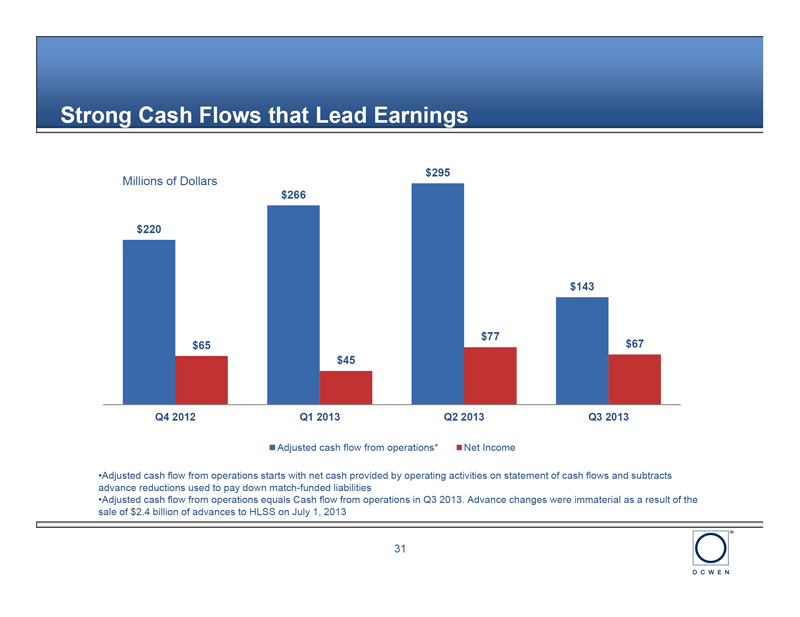
Strong Cash Flows that Lead Earnings $295 Millions of Dollars $266 $220 $143 $77 $65 $67 $45 Q4 2012 Q1 2013 Q2 2013 Q3 2013 Adjusted cash flow from operations* Net Income oAdjusted cash flow from operations starts with net cash provided by operating activities on statement of cash flows and subtracts advance reductions used to pay down match-funded liabilities oAdjusted cash flow from operations equals Cash flow from operations in Q3 2013. Advance changes were immaterial as a result of the sale of $2.4 billion of advances to HLSS on July 1, 2013 31

Consolidated Statement of Cash Flows - Adjusted Cash Flow from Operations Calculation Q3 2013 Adjusted Cash Flow from Operations of $143 million Three Months Ended Thousands of Dollars Dec 31, 2012 Mar 31,2013 Jun 30, 2013 Sep 30, 2013 Net Cash Provided by Operating Activities (A) 381,703 401,941 475,086 143,429 Decrease in Advances and Match Funded Advances (B) 229,726 186,420 242,731 -* Funding Efficiency (C) 70% 73% 74% NA Reduction of match funded liabilities (D=B*C) 161,222 136,087 179,621 -* Adjusted Cash Flow from Operations (A-D) 220,481 265,854 295,465 143,429 * Adjusted cash flow from operations equals Cash flow from operations in Q3 2013. Advance changes were immaterial ($5 million) as a result of the sale of $2.4 billion of advances to HLSS on July 1,2013 32
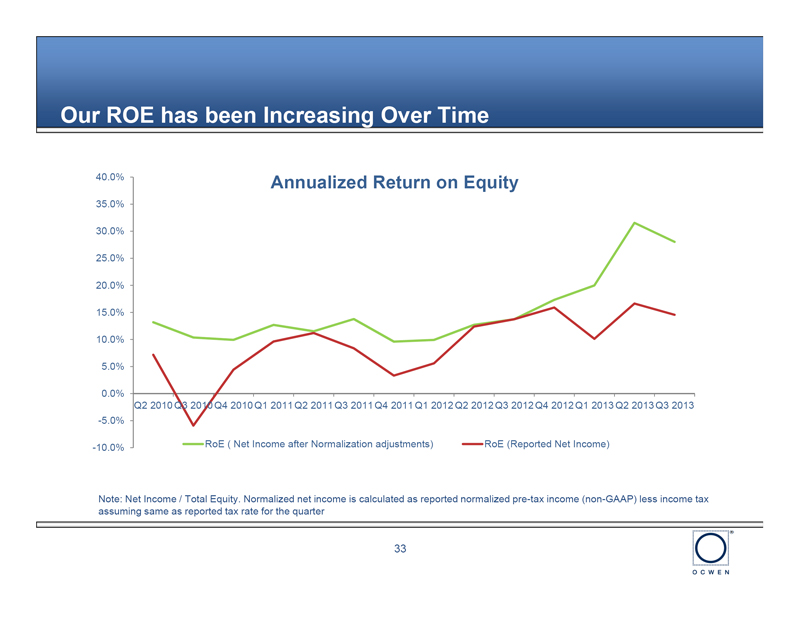
Our ROE has been Increasing Over Time 40.0% Annualized Return on Equity 35.0% 30.0% 25.0% 20.0% 15.0% 10.0% 5.0% 0.0% Q2 2010Q3 2010Q4 2010Q1 2011Q2 2011Q3 2011Q4 2011Q1 2012Q2 2012Q3 2012Q4 2012Q1 2013Q2 2013Q3 2013 -5.0% -10.0% RoE ( Net Income after Normalization adjustments) RoE (Reported Net Income) Note: Net Income / Total Equity. Normalized net income is calculated as reported normalized pre-tax income (non-GAAP) less income tax assuming same as reported tax rate for the quarter 33
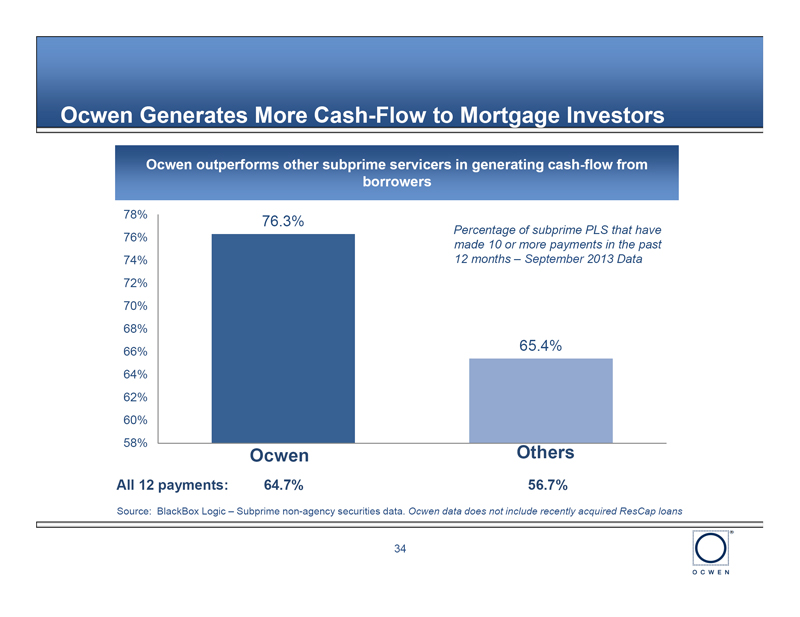
Ocwen Generates More Cash-Flow to Mortgage Investors Ocwen outperforms other subprime servicers in generating cash-flow from borrowers 78% 76.3% Percentage of subprime PLS that have 76% made 10 or more payments in the past 74% 12 months - September 2013 Data 72% 70% 68% 66% 65.4% 64% 62% 60% 58% Ocwen Others All 12 payments: 64.7% 56.7% Source: BlackBox Logic - Subprime non-agency securities data. Ocwen data does not include recently acquired ResCap loans 34

Loan Modification History Ocwen continues strong performance in helping homeowners 400,000 35,000 Since 2009, Ocwen has completed over 370,000 32,051 350,000 30,000 300,000 25,000 250,000 20,000 200,000 15,000 150,000 Quarterly Modifications Cumulative Modifications 10,000 100,000 5,000 50,000 0 0 Cumulative # modifications Quarterly # modifications 35
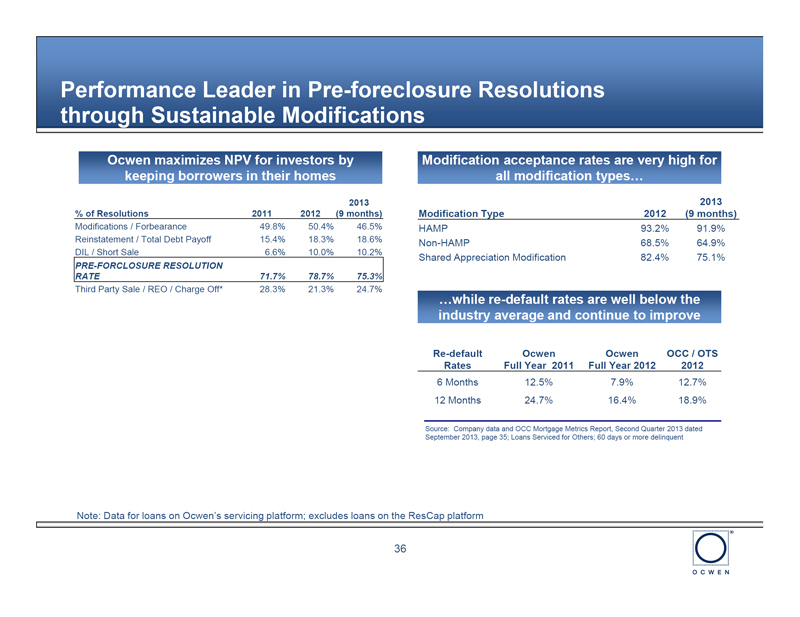
Performance Leader in Pre-foreclosure Resolutions through Sustainable Modifications Ocwen maximizes NPV for investors by Modification acceptance rates are very high for keeping borrowers in their homes all modification types... 2013 2013 % of Resolutions 2011 2012 (9 months) Modification Type 2012 (9 months) Modifications / Forbearance 49.8% 50.4% 46.5% HAMP 93.2% 91.9% Reinstatement / Total Debt Payoff 15.4% 18.3% 18.6% Non-HAMP 68.5% 64.9% DIL / Short Sale 6.6% 10.0% 10.2% Shared Appreciation Modification 82.4% 75.1% PRE-FORCLOSURE RESOLUTION RATE 71.7% 78.7% 75.3% Third Party Sale / REO / Charge Off* 28.3% 21.3% 24.7% ....while re-default rates are well below the industry average and continue to improve Re-default Ocwen Ocwen OCC / OTS Rates Full Year 2011 Full Year 2012 2012 6 Months 12.5% 7.9% 12.7% 12 Months 24.7% 16.4% 18.9% Source: Company data and OCC Mortgage Metrics Report, Second Quarter 2013 dated September 2013, page 35; Loans Serviced for Others; 60 days or more delinquent Note: Data for loans on Ocwen's servicing platform; excludes loans on the ResCap platform 36

Historical Prepayment Rates for Prime Loans Prime prepayments are more volatile 40% 35% 30% CPR 25% 20% 15% 10% 5% 0% Total Debt Pay Offs Regular Principal Amortization REO/CO/Other Involuntary Note: Historical prepayments data, includes historical ResCap loans for the entire period 37
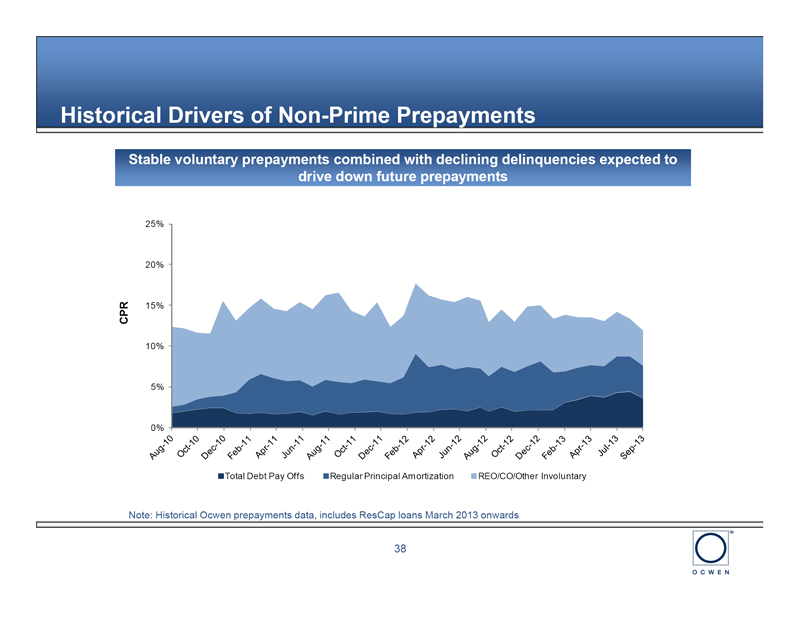
Historical Drivers of Non-Prime Prepayments Stable voluntary prepayments combined with declining delinquencies expected to drive down future prepayments 25% 20% CPR 15% 10% 5% 0% Total Debt Pay Offs Regular Principal Amortization REO/CO/Other Involuntary Note: Historical Ocwen prepayments data, includes ResCap loans March 2013 onwards 38

Strong Operations and Conservative Accounting Operations ??As advances are collected, it frees substantial cash ??In the first nine months of 2013 Ocwen collected $424 million in advances ??In the first nine months of 2013 Ocwen sold $3.49 billion in advances to HLSS Timing Differences ??Things we do not do that would accelerate earnings ??Most MSR's carried at LOCOM - No write-up for about 95% of MSRs as rates rise and do not increase earnings by changing valuation model assumptions ??Advances purchased at a discount not booked as earnings when collected, but amortized over life of MSR ??Things we do that defer earnings ??Delinquent servicing fees booked when collected, not accrued - around $501 million at the end of Q3 2013 ??Amortization of servicing higher than actual CPR - Our estimated fair value of MSRs was $685 million higher than carrying value as of September 30, 2013 39
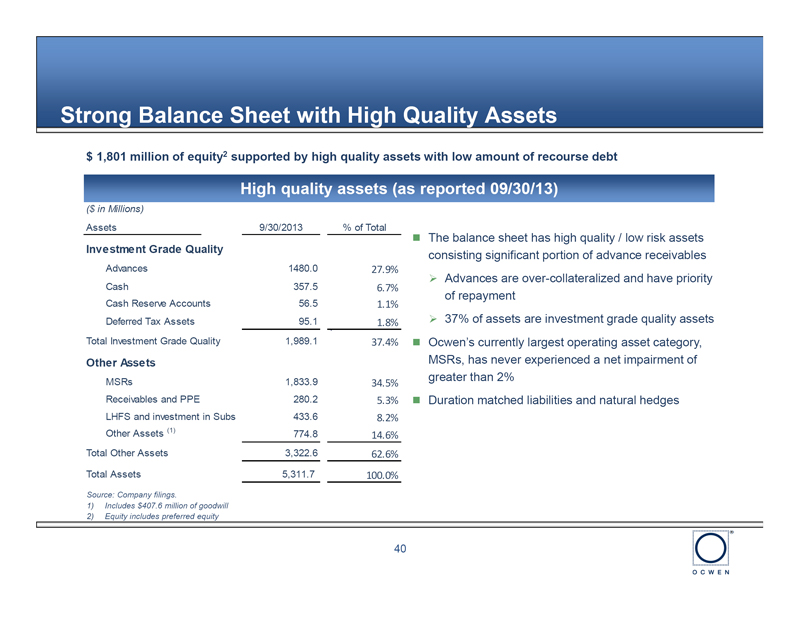
Strong Balance Sheet with High Quality Assets $ 1,801 million of equity2 supported by high quality assets with low amount of recourse debt High quality assets (as reported 09/30/13) ($ in Millions) Assets 9/30/2013 % of Total ??The balance sheet has high quality / low risk assets Investment Grade Quality consisting significant portion of advance receivables Advances 1480.0 27.9% ??Advances are over-collateralized and have priority Cash 357.5 6.7% of repayment Cash Reserve Accounts 56.5 1.1% Deferred Tax Assets 95.1 1.8% ??37% of assets are investment grade quality assets Total Investment Grade Quality 1,989.1 37.4%??Ocwen's currently largest operating asset category, Other Assets MSRs, has never experienced a net impairment of MSRs 1,833.9 greater than 2% 34.5% Receivables and PPE 280.2 5.3%??Duration matched liabilities and natural hedges LHFS and investment in Subs 433.6 8.2% Other Assets (1) 774.8 14.6% Total Other Assets 3,322.6 62.6% Total Assets 5,311.7 100.0% Source: Company filings. 1) Includes $407.6 million of goodwill 2) Equity includes preferred equity 40
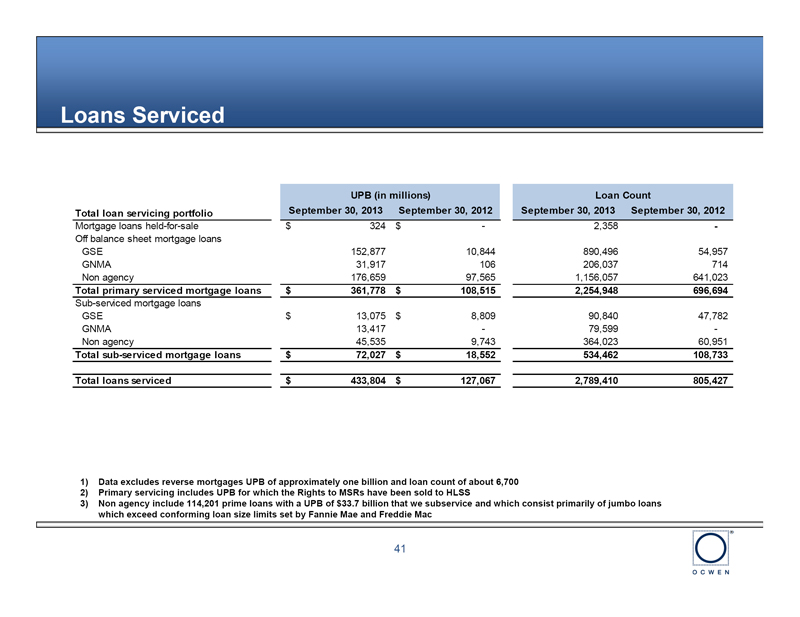
Loans Serviced UPB (in millions) Loan Count Total loan servicing portfolio September 30, 2013 September 30, 2012 September 30, 2013 September 30, 2012 Mortgage loans held-for-sale $ 324 $ - 2,358 -Off balance sheet mortgage loans GSE 152,877 10,844 890,496 54,957 GNMA 31,917 106 206,037 714 Non agency 176,659 97,565 1,156,057 641,023 Total primary serviced mortgage loans $ 361,778 $ 108,515 2,254,948 696,694 Sub-serviced mortgage loans GSE $ 13,075 $ 8,809 90,840 47,782 GNMA 13,417 - 79,599 -Non agency 45,535 9,743 364,023 60,951 Total sub-serviced mortgage loans $ 72,027 $ 18,552 534,462 108,733 Total loans serviced $ 433,804 $ 127,067 2,789,410 805,427 1) Data excludes reverse mortgages UPB of approximately one billion and loan count of about 6,700 2) Primary servicing includes UPB for which the Rights to MSRs have been sold to HLSS 3) Non agency include 114,201 prime loans with a UPB of $33.7 billion that we subservice and which consist primarily of jumbo loans which exceed conforming loan size limits set by Fannie Mae and Freddie Mac 41

Owned MSR Portfolio by Vintage Total Owned Servicing Portfolio Origination Vintage (in thousands) 2009+ 2008 & prior Total Unpaid principal balance $ 122,512,432 $ 238,940,767 $ 361,453,198 MSR carry value 956,565 874,853 1,831,418 MSR value/UPB 0.78% 0.37% 0.51% Origination Vintage Unpaid principal balance by investor (in thousands) 2009+ 2008 & prior Total FNMA $ 70,797,100 $ 24,988,187 $ 95,785,288 FHLMC 25,452,674 31,638,865 57,091,540 GNMA 25,962,791 5,954,239 31,917,029 Non Agency 299,866 176,359,475 176,659,341 Total $ 122,512,432 $ 238,940,767 $ 361,453,198 Origination Vintage Loan count by investor 2009+ 2008 & prior Total FNMA 382,208 148,146 530,354 FHLMC 134,033 226,109 360,142 GNMA 156,220 49,817 206,037 Non Agency 2,346 1,153,711 1,156,057 Total 674,807 1,577,783 2,252,590 Origination Vintage Weighted average note rate 2009+ 2008 & prior Total FNMA 4.14% 5.16% 4.41% FHLMC 4.24% 4.81% 4.57% GNMA 4.68% 5.60% 4.85% Non Agency 4.84% 5.07% 5.08% Total 4.28% 5.06% 4.80% All data is for Q3 2013 end of period, does not include loans held for sale or reverse mortgages 42

State Concentration of Serviced Assets UPB State (in millions) Loan Count CA $ 77,785 317,342 FL 29,076 191,391 NY 24,250 103,326 TX 17,520 170,978 NJ 16,665 78,900 IL 14,152 93,211 MA 13,323 61,675 MD 12,417 60,913 VA 10,953 58,424 Other 145,635 1,118,788 Total primary servicing $ 361,778 2,254,948 UPB State (in millions) Loan Count CA $ 18,839 79,259 FL 6,658 47,279 TX 3,441 33,874 WA 3,151 16,955 GA 2,793 25,368 NY 2,548 16,033 VA 2,410 15,256 MD 2,266 13,158 IL 2,229 18,561 Other 27,693 268,719 Total sub-serviced $ 72,027 534,462 Q3 2013 end of period data, includes loans held for resale and excludes reverse mortgages 43