UNITED STATES SECURITIES AND EXCHANGE COMMISSION
Washington, D.C. 20549
______________________
FORM 10-K
| (Mark One) |
[X] | ANNUAL REPORT PURSUANT TO SECTION 13 OR 15(d) OF THE SECURITIES
EXCHANGE ACT OF 1934
For the fiscal year ended December 31, 2010 |
| | |
| [ ] | TRANSITION REPORT PURSUANT TO SECTION 13 OR 15(d) OF THE SECURITIES
EXCHANGE ACT OF 1934
For the transition period from ______ to ______ |
Commission file number 1-10746
THE JONES GROUP INC.
(Exact name of registrant as specified in its charter)
Pennsylvania
(State or other jurisdiction of
incorporation or organization) | 06-0935166
(I.R.S. Employer
Identification No.) |
| | |
1411 Broadway
New York, New York
(Address of principal executive offices) | 10018
(Zip Code) |
Registrant's telephone number, including area code: (212) 642-3860
Securities registered pursuant to Section 12(b) of the Act:
| Title of each class Common Stock, $0.01 par value | Name of each exchange
on which registeredNew York Stock Exchange, Inc. |
Securities registered pursuant to Section 12(g) of the Act: None
Indicate by check mark if the registrant is a well-known seasoned issuer, as defined in Rule 405 of the Securities Act. [X] Yes [ ] No
Indicate by check mark if the registrant is not required to file reports pursuant to Section 13 or Section 15(d) of the Act. [ ] Yes [X] No
Indicate by check mark whether the registrant (1) has filed all reports required to be filed by Section 13 or 15(d) of the Securities Exchange Act of 1934 during the preceding 12 months (or for such shorter period that the registrant was required to file such reports), and (2) has been subject to such filing requirements for the past 90 days. [X] Yes [ ] No
Indicate by check mark whether the registrant has submitted electronically and posted on its corporate Web site, if any, every Interactive Data File required to be submitted and posted pursuant to Rule 405 of Regulation S-T during the preceding 12 months (or for such shorter period that the registrant was required to submit and post such files). [X] Yes [ ] No
Indicate by check mark if disclosure of delinquent filers pursuant to Item 405 of Regulation S-K is not contained herein, and will not be contained, to the best of registrant's knowledge, in definitive proxy or information statements incorporated by reference in Part III of this Form 10-K or any amendment to this Form 10-K. [X]
Indicate by check mark whether the registrant is a large accelerated filer, an accelerated filer, a non-accelerated filer, or a smaller reporting company. See the definitions of "large accelerated filer," "accelerated filer" and "smaller reporting company" in Rule 12b-2 of the Exchange Act.
| Large accelerated filer [X] | Accelerated filer [ ] |
Non-accelerated filer [ ] | Smaller reporting company [ ] | Indicate by check mark whether the registrant is a shell company (as defined in Rule 12b-2 of the Act). [ ] Yes [X] No
The aggregate market value of the voting and non-voting common equity held by non-affiliates as of the last business day of the registrant's most recently completed second fiscal quarter, based on the closing price of the registrant's common stock as reported on the New York Stock Exchange composite tape on July 3, 2010, was approximately $1,270,031,824.
As of February 10, 2011, 88,246,583 shares of the registrant's common stock were outstanding.
TABLE OF CONTENTS
DOCUMENTS INCORPORATED BY REFERENCE
The documents incorporated by reference into this Form 10-K and the Parts hereof into which such documents are incorporated are listed below:
Document
| Part
|
| Those portions of the registrant's proxy statement for the registrant's 2011 Annual Meeting of Stockholders (the "Proxy Statement") that are specifically identified herein as incorporated by reference into this Form 10-K. | III |
|
- 2 -
DEFINITIONS
As used in this Report, unless the context requires otherwise, "Jones," "our," "us" and "we" means The Jones Group Inc. and consolidated subsidiaries, "McNaughton" means McNaughton Apparel Group, Inc., "Kasper" means Kasper, Ltd., "Maxwell" means Maxwell Shoe Company Inc., "Barneys" means Barneys New York, Inc., "SWH" means Stuart Weitzman Holdings, LLC, "GRI" means GRI Group Limited, "FASB" means the Financial Accounting Standards Board, "SFAS" means Statement of Financial Accounting Standards, "ASC" means the "FASB Accounting Standards CodificationTM", "ASU" means "Accounting Standards Update" and "SEC" means the United States Securities and Exchange Commission.
STATEMENT REGARDING FORWARD-LOOKING DISCLOSURE
This Report includes, and incorporates by reference, "forward-looking statements" within the meaning of the Private Securities Litigation Reform Act of 1995. All statements regarding our expected financial position, business and financing plans are forward-looking statements. The words "believes," "expects," "plans," "intends," "anticipates" and similar expressions identify forward-looking statements. Forward-looking statements also include representations of our expectations or beliefs concerning future events that involve risks and uncertainties, including:
- those associated with the effect of national, regional and international economic conditions;
- lowered levels of consumer spending resulting from a general economic downturn or lower levels of consumer confidence;
- the tightening of the credit markets and our ability to obtain capital on satisfactory terms;
- given the uncertain economic environment, the possible unwillingness of committed lenders to meet their obligations to lend to borrowers, in general;
- the performance of our products within the prevailing retail environment;
- customer acceptance of both new designs and newly-introduced product lines;
- our reliance on a few department store groups for large portions of our business;
- our ability to identify acquisition candidates and, in a competitive environment for such acquisitions, acquire such businesses on reasonable financial and other terms;
- the integration of the organizations and operations of any acquired business into our existing organization and operations;
- consolidation of our retail customers;
- financial difficulties encountered by our customers;
- the effects of vigorous competition in the markets in which we operate;
- our ability to attract and retain qualified executives and other key personnel;
- our reliance on independent foreign manufacturers;
- changes in the costs of raw materials, labor, advertising and transportation;
- 3 -
- the general inability to obtain higher wholesale prices for our products that we have experienced for many years;
- our ability to successfully implement new operational and financial computer systems; and
- our ability to secure and protect trademarks and other intellectual property rights.
All statements other than statements of historical facts included in this Report, including, without limitation, the statements under "Management's Discussion and Analysis of Financial Condition and Results of Operations," are forward-looking statements. Although we believe that the expectations reflected in such forward-looking statements are reasonable, such expectations may prove to be incorrect. Important factors that could cause actual results to differ materially from our expectations ("Cautionary Statements") are disclosed in this Report in conjunction with the forward-looking statements. All subsequent written and oral forward-looking statements attributable to us or persons acting on our behalf are expressly qualified in their entirety by the Cautionary Statements. We do not undertake to publicly update or revise our forward-looking statements as a result of new information, future events or otherwise.
WEBSITE ACCESS TO COMPANY REPORTS
Copies of our filings under the Securities Exchange Act of 1934 (including annual reports on Form 10-K, quarterly reports on Form 10-Q, current reports on Form 8-K and all amendments to these reports) are available free of charge on our investor relations website at www.jonesgroupinc.com on the same day they are electronically filed with the SEC.
- 4 -
PART I
ITEM 1. BUSINESS
General
We are a leading global designer, marketer and wholesaler of over 35 brands with best-in-class product expertise across five divisions: apparel, footwear, jeanswear, jewelry and handbags. We have a reputation for innovation, excellence in product quality and value, operational execution and talent. We also market directly to consumers through our branded specialty retail and outlet stores and through our e-commerce sites.
Our nationally recognized brands and licensing agreements ("L") include: Nine West, Jones New York, Anne Klein, Rachel Roy (L), Robert Rodriguez, Robbi & Nikki, Stuart Weitzman, B Brian Atwood (L), Boutique 9, Easy Spirit, Gloria Vanderbilt, l.e.i, Bandolino, Enzo Angiolini, Nine & Co., GLO, Joan & David, Joneswear, Andrew Marc/Marc Moto (L), Kasper, Energie, Evan-Picone, Le Suit, Mootsies Tootsies, Grane, Erika, Napier, Jessica Simpson (L), Dockers (L), Sam & Libby, Givenchy (L), Judith Jack, Albert Nipon and Pappagallo.
Operating Segments
Our operations are comprised of five revenue-generating segments: wholesale better apparel, wholesale jeanswear, wholesale footwear and accessories, retail and licensing. We identify operating segments based on, among other things, the way our management organizes the components of our business for purposes of allocating resources and assessing performance. Segment revenues are generated from the sale of apparel, footwear and accessories through wholesale channels, our own retail locations and several e-commerce web sites that we operate and, for licensing, as a percentage of revenues for items sold by our licensees under our trademarks. See "Business Segment and Geographic Area Information" in the Notes to Consolidated Financial Statements.
Wholesale Better Apparel
Our brands cover a broad array of categories for the women's and men's markets. Within those brands, various product classifications include career and casual sportswear, jeanswear, dresses, suits, and a combination of all components termed lifestyle collection. Career and casual sportswear are marketed as individual items or groups of skirts, pants, shorts, jackets, blouses, sweaters and related accessories which, while sold as separates, are coordinated as to styles, color schemes and fabrics, and are designed to be worn together. New collections are introduced in the four principal selling seasons - Spring, Summer, Fall and Holiday. Each season is comprised of a series of individual items or groups which have systematically spaced shipment dates to ensure a fresh flow of goods to the retail floor. In addition, certain brands offer key item styles, which are less seasonal in nature, on a replenishment basis (which ship generally within three to five days from receipt of order).
The following table summarizes selected aspects of the products sold under both our brands and licensed brands:
- 5 -
Group
|
Category
|
Products
|
Brand
| Product
Classification
| Retail
Price Points
|
Jones
New
York | Better | Skirts, blouses, pants, jackets, sweaters, jeanswear, suits, dresses, casual tops, outerwear, shorts | Jones New York
Jones New York Signature
Jones New York Sport
Jones Jeans
Jones New York Dress
Jones New York Suit
Jones Wear
Jones & Co.
Jones Studio
J Jones New York | Career
Lifestyle
Lifestyle
Lifestyle
Dresses
Suits
Dresses
Career
Dresses
Lifestyle | $32 - $461
$20 - $209
$20 - $155
$36 - $59
$49 - $315
$49 - $290
$28 - $125
$29 - $159
$25 - $70
$29 - $239 |
Nine
West | Better | Skirts, blouses, pants, jackets, sweaters, suits, dresses, outerwear, shorts, casual tops, jeanswear | Nine West
Nine West Dress
Nine West Suits
Nine West Denim | Career
Dresses
Suits
Lifestyle | $49 - $199
$49 - $248
$200 - $290
$34 - $99 |
Anne
Klein | Bridge | Skirts, blouses, pants, jackets, sweaters, dresses | Anne Klein New York | Lifestyle | $95 - $895 |
Anne
Klein | Better | Skirts, blouses, pants, jackets, sweaters, vests, dresses, casual tops | AK Anne Klein
AK Sport
Anne Klein Dress
Anne Klein Suit | Lifestyle
Lifestyle
Dresses
Suits | $24 - $257
$28 - $203
$106 - $325
$275 - $359 |
Rachel
Roy | Designer | Skirts, blouses, pants, jackets, sweaters, dresses, outerwear, accessories
| Rachel Roy New York | Designer | $195 - $2,695 |
Rachel
Roy | Better | Skirts, blouses, pants, jackets, sweaters, dresses | Rachel Rachel Roy
| Lifestyle | $19 - $368 |
| Robert Rodriguez | Designer | Skirts, shorts, pants, casual tops, blouses, jackets, sweaters, dresses | Robert Rodriguez
Robert Rodriguez Black Label
Robbi & Nikki | Lifestyle
Lifestyle
Lifestyle | $120 - $995
$320 - $1,295
$45 - $295 |
| Jessica Simpson | Better | Jeanswear, pants, capris, shorts, skirts, t-shirts, casual tops, blouses, sweaters, dresses, denim jackets, casual jackets | Jessica Simpson | Lifestyle | $24 - $108 |
| Andrew Marc/ Marc Moto | Men's | Jeans, casual pants, shorts, jackets, woven and knot tops, t-shirts, sweaters | Marc Moto | Casual Jeanswear | $28 - $79 |
| Other | Bridge | Suits | Albert Nipon | Suits | $280 - $420 |
| Other | Better | Skirts, blouses, pants, jackets, sweaters, suits, dresses | Kasper
Evan-Picone
Le Suit
Rena Rowan | Suits, Dresses, Sportswear
Suits, Dresses
Suits
Dresses | $29 - $267
$77 - $200
$30 - $200
$42 - $158 |
- 6 -
In addition to the products sold under these brands, we provide design and manufacturing resources to certain retailers to develop better-priced product lines to be sold under private labels.
Wholesale Jeanswear
Our brands cover a broad array of categories for the women's, juniors and girls markets. Within those brands, our product classifications include jeanswear, casual sportswear and dresses, with a focus on fit, fabric and finish. Jeanswear and casual sportswear are designed and marketed as individual items of jeans, skirts, pants, shorts, jackets, casual tops, dresses, sweaters and related accessories which, while sold as separates, can be combined with each other and with certain of our wholesale better products into groups termed "lifestyle collection" that are designed to be worn together. New collections are introduced in the four principal selling seasons - Spring, Summer, Fall and Holiday. Each season is comprised of a series of individual items or groups which have scheduled shipment dates to ensure a fresh flow of goods to the retail floor. In addition, certain brands offer key item styles, which are less seasonal in nature, on a replenishment basis (which ship generally within five days from receipt of order).
The following table summarizes selected aspects of the products sold under our brands:
Group
|
Products
|
Brand
| Product
Classification
| Retail
Price Points
|
Jones
New
York | Skirts, blouses, pants, jackets, sweaters, casual tops, dresses | Joneswear
| Collection Sportswear
| $36 - $98 |
Gloria
Vanderbilt | Skirts, blouses, shorts, jackets, sweaters, jeanswear, capris, casual tops | Gloria Vanderbilt | Casual Sportswear | $12 - $48 |
| l.e.i. | Skirts, shorts, jeanswear, capris, casual tops, sweaters, dresses | l.e.i. | Casual Sportswear | $7 - $18 |
| Energie | Skirts, shorts, jackets, sweaters, jeanswear, casual tops, dresses | Energie | Casual Sportswear | $6 - $48 |
| Other | Skirts, blouses, pants, jackets, sweaters, jeanswear, dresses, casual tops and bottoms | Evan-Picone
Bandolino Blu
GLO
Grane
Erika | Collection Sportswear
Casual Sportswear
Casual Sportswear
Casual Sportswear
Casual Sportswear | $29 - $134
$13 - $40
$16 - $20
$20 - $25
$18 - $48 |
In addition to the products sold under these brands, we provide design and manufacturing resources to certain retailers to develop moderately-priced product lines to be sold under private labels.
Wholesale Footwear and Accessories
Our wholesale footwear and accessories operations include the sale of both brand name and private label footwear, handbags, small leather goods and costume, semi-precious, sterling silver, and marcasite jewelry. The following table summarizes selected aspects of the products sold under both our brands and licensed brands:
- 7 -
Footwear |
| | | | Retail Price Points
|
Category
| Brand
| Product Classification
| Shoes
| Boots
|
| Designer | Stuart Weitzman | Accessible Contemporary and Modern Luxury | $145 - $500 | $395 - $695 |
| Bridge | Joan & David | Sophisticated Classics | $130 - $260 | $260 - $450 |
| Better | Nine West
Nine West Kids
Enzo Angiolini
AK Anne Klein
Circa Joan & David
Boutique 9
Rachel Rachel Roy | Contemporary
Children's
Sophisticated Classics
Modern Classics
Sophisticated Classics
Contemporary
Contemporary | $29 - $129
$35 -$40
$59 - $120
$40 - $89
$69 - $149
$59 - $200
$50 - $169 | $59 - $229
$40 - $50
$79 - $250
$89 - $169
$99 - $275
$150 - $300
$99 - $250 |
| Upper Moderate | Bandolino
Easy Spirit | Modern Classics
Comfort/Fit, Active, Sport/Casuals | $49 - $89
$45 - $89 | $75 - $179
$69 - $149 |
| Moderate | Nine & Co.
Mootsies Tootsies
Mootsies Tootsies Kids
Sam & Libby
Sam & Libby Kids
Gloria Vanderbilt
Dockers(R) Women | Contemporary
Lifestyle
Children's
Contemporary
Children's
Contemporary
Lifestyle | $60 - $80
$30 - $50
$25 - $35
$30 - $55
$30 - $35
$40 - $60
$30 - $65 | $70 - $130
$60 - $80
$50
$49 - $90
$40
$60
$80 |
| Accessories |
| Category
| Brand
| Product Classification
| Retail Price Points
|
| Designer | Stuart Weitzman | Handbags | $450 - $750 |
| Bridge | Judith Jack | Marcasite and Sterling Silver Jewelry | $35 - $595 |
| Better | AK Anne Klein
Nine West
Jones New York
Givenchy
Rachel Rachel Roy
J Jones New York | Handbags and Costume Jewelry
Handbags, Small Leather Goods and Costume Jewelry
Costume Jewelry
Costume and Fashion Jewelry
Handbags and Costume Jewelry
Costume Jewelry | $18 - $198
$14 - $179
$14 - $125
$8 - $495
$16 - $195
$38 - $60 |
| Moderate | Nine & Co.
Napier
l.e.i. | Handbags, Small Leather Goods and Costume Jewelry
Costume Jewelry
Costume Jewelry | $12 - $80
$8 - $42
$5 |
Retail
We market apparel, footwear and accessories directly to consumers through our specialty retail stores operating in malls and urban retail centers, our various value-based ("outlet") stores located in major retail locations, and on several e-commerce web sites that we operate. We constantly evaluate both the opportunities for new locations and the results of underperforming locations for possible modifications or closures.
We began 2010 with 938 retail locations, had a net decrease of 179 locations during the year and added 44 locations as a result of the SWH acquisition to end the year with 803 locations. We continue to review our retail operations for underperforming locations. As a result of this review, we have decided to close retail locations that no longer provide strategic benefits. During 2010, we closed 191 underperforming locations and anticipate closing additional locations in 2011.
- 8 -
Specialty Retail Stores. At December 31, 2010, we operated a total of 279 specialty retail stores. These stores sell either footwear and accessories or apparel (or a combination of these products) primarily under their respective brand names. Our Nine West and Easy Spirit retail stores offer selections of certain exclusive styles not marketed to our wholesale customers. Our multibranded ShoeWoo specialty stores offer selections from many of our brand names. Specialty retail stores may also sell products licensed by us, including belts, legwear, outerwear, watches and sunglasses.
The following table summarizes selected aspects of our specialty retail stores at December 31, 2010. Of these stores, 268 are located within the United States and its territories, seven are located in Europe and four are located in Canada.
| | | | Retail Price Points
| | Average store
size (sq. ft.)
|
Store
type
| Number of
locations
| Brands
offered
| Shoes and
Boots
| Accessories
| Apparel
| Type of
locations
|
| Nine West | 159 | Primarily
Nine West | $29 -$300 | $2 - $250 | - | Upscale and regional malls and urban retail centers | 1,570 |
| Easy Spirit | 68 | Primarily
Easy Spirit | $20 - $179 | $5 - $59 | - | Upscale and regional malls and urban retail centers | 1,402 |
| Stuart Weitzman | 39 | Stuart Weitzman | $145 - $695 | $450 - $750 | - | Upscale and regional malls and urban retail centers | 1,658 |
| ShoeWoo | 8 | Various | $29 - $375 | $6 - $250 | - | Urban retail locations | 2,552 |
| Apparel | 4 | Various | - | - | $19 - $2,664 | Urban retail locations and regional malls | 5,123 |
| AK Anne Klein | 1 | Anne Klein | $39 - $179 | $22 - $215 | --- | Regional mall | 1,100 |
Outlet Stores. At December 31, 2010, we operated a total of 524 outlet stores. Our shoe stores focus on breadth of product line, as well as value pricing, and offer a distribution channel for our residual inventories. The majority of the shoe stores' merchandise consists of new production of current and proven prior season's styles, with the remainder of the merchandise consisting of discontinued styles from our specialty retail footwear stores and wholesale divisions. The apparel stores focus on breadth of product line and value pricing. In addition to our brand name merchandise, these stores also sell merchandise produced by our licensees.
The following table summarizes selected aspects of our outlet stores at December 31, 2010. Of these stores, 491 are located within the United States and its territories and 33 are located in Canada.
- 9 -
Store
type
| Number of
locations
| Brands
offered
| Type of
locations
| Average store
size (sq. ft.)
|
| Nine West | 176 | Primarily Nine West | Manufacturer
outlet centers | 2,890 |
| Jones New York | 159 | Primarily Jones New York and Jones New York Sport | Manufacturer
outlet centers | 3,730 |
| Easy Spirit | 104 | Primarily Easy Spirit | Manufacturer
outlet centers | 3,391 |
| Kasper | 80 | Primarily Kasper | Manufacturer
outlet centers | 2,633 |
| Stuart Weitzman | 5 | Stuart Weitzman | Manufacturer
outlet centers | 2,071 |
Internet. At December 31, 2010, we operated e-commerce web sites at www.jny.com, www.ninewest.com, www.easyspirit.com, www.stuartweitzman.com, www.anneklein.com, www.rachelroy.com and www.shoewoo.com (we discontinued www.shoewoo.com in early 2011). Through these web sites, we market either footwear and accessories, apparel or a combination of these products, primarily under their respective brand names. The selection of products is substantially consistent with the product offerings in our applicable corresponding retail store concepts. Our e-commerce systems allow us to fulfill customer orders from inventory at our retail store locations if the items are not available at our distribution center.
Licensed Brands
We have an exclusive license to produce, market and distribute costume jewelry in the United States, Canada, Mexico and Japan under the Givenchy trademark pursuant to an agreement with Givenchy, which expires on December 31, 2011. The agreement requires us to pay a percentage of net sales against guaranteed minimum royalty and advertising payments as set forth in the agreement.
We have an exclusive license to produce and sell women's footwear under the Dockers(R) and Dockers(R) Women trademarks in the United States (including its territories and possessions) pursuant to an agreement with Levi Strauss & Co. The agreement, which expires on December 31, 2011, requires us to pay a percentage of net sales against guaranteed minimum royalty and advertising payments as set forth in the agreement. In early 2009, we signed a similar agreement with Levi Strauss & Co., which gave us an exclusive license to produce and sell infants', toddlers' and boys' footwear (excluding girls' footwear) under the Dockers(R) and Dockers(R) Premium trademarks in the United States (including its territories and possessions). While this additional agreement was set to expire on December 31, 2011, we mutually agreed with Levi Strauss & Co. to terminate it effective December 31, 2010.
We had an exclusive license with New Balance Athletic Shoe, Inc. and its affiliate New Balance Licensing, LLC (together, "New Balance") to create and distribute, in the United States and certain other countries, a fashion-lifestyle footwear collection label that brought together New Balance's innovative performance and materials technology with Nine West's fashion styling. The agreement expired on December 31, 2010.
We have an exclusive, worldwide license with Rachel Roy IP Company, LLC, a limited liability company in which we own a fifty percent interest, to create, market, and distribute women's apparel, footwear, handbags, small leather goods and costume jewelry under the Rachel Roy, Rachel Roy New York, and RR & Design trademarks and variations and derivatives thereof including Rachel Roy Signature and Rachel Rachel Roy. The agreement, which remains in force as long as we remain in business and continue to exploit the rights granted to us thereunder, requires us to pay a percentage of net sales as royalty payments as set forth in the agreement.
- 10 -
We have a sub-license agreement with VCJS, LLC ("VCJS") to design, develop, produce and distribute in the United States, Mexico and Canada Jessica Simpson jeanswear and sportswear under the Jessica Simpson (signature) trademark which VCJS licenses from With You, Inc. ("WYI"). The agreement, which expires on December 31, 2014 (October 15, 2014 if the master license between WYI and VCJS is not renewed), requires us to pay a percentage of net sales against guaranteed minimum royalty and pooled marketing fee payments as set forth in the agreement. The agreement contains renewal options under certain conditions through December 31, 2023.
We have an exclusive licensing and distribution agreement with G-III Apparel Group, Ltd. ("G-III") to design, develop, produce and distribute men's jeans, casual pants, shorts, jackets, woven and knit tops, t-shirts and sweaters in the United States and its territories and possessions, including Puerto Rico, under the Andrew Marc, Marc New York and Marc Moto, A Rebel Division of Andrew Marc trademarks. The agreement, which expires on December 31, 2015, requires us to pay a percentage of net sales against guaranteed minimum royalty and pooled marketing fee payments as set forth in the agreement. The agreement contains renewal options under certain conditions through December 31, 2025.
We have an exclusive licensing and distribution agreement with BKA International, Inc. ("BKA") to create, produce, market and distribute footwear and accessory products in the United States and its territories and possessions, including Puerto Rico, and Canada under the B Brian Atwood trademark. The agreement, which expires on December 31, 2016, requires us to pay a percentage of net sales against guaranteed minimum royalty and creative director fees as set forth in the agreement. The agreement contains a renewal option under certain conditions through December 31, 2021.
We have an exclusive licensing and distribution agreement with Sanctuary Clothing, Inc. ("Sanctuary") to create, produce, market and distribute ready-to-wear women's clothing in the United States under the Live Life by Sanctuary trademark for sale exclusively to Sears and Sears.com. The agreement, which expires on December 31, 2013, requires us to pay a percentage of net sales as set forth in the agreement. No minimum payments are required under this agreement.
Design
Our apparel product lines have design teams that are responsible for the creation, development and coordination of the product group offerings within each line. We believe our design staff is recognized for its distinctive styling of garments and its ability to update fashion classics with contemporary trends. Our apparel designers travel throughout the world for fabrics and colors, and stay continuously abreast of the latest fashion trends. In addition, we actively monitor the retail sales of our products to determine and react to changes in consumer trends.
For most sportswear lines, we will develop several groups in a season. A group typically consists of an assortment of skirts, jeanswear, pants, shorts, jackets, blouses, sweaters, t-shirts and various accessories. Since different styles within a group often use the same fabric, we can redistribute styles and, in some cases, colors, to fit current market demand. We also have a key item replenishment program for certain lines which consists of core products that reflect little variation from season to season.
Our footwear and accessories product lines are developed by a combination of our own design teams and third-party designers, which independently interpret global lifestyle, clothing, footwear and accessories trends. To research and confirm such trends, the teams travel extensively in Asia, Europe and major American markets, conduct extensive market research on retailer and consumer preferences, and subscribe to fashion and color information services. Each team presents styles that maintain each brand's distinct personality. Samples are refined and then produced. After the samples are evaluated, lines are modified further for presentation at each season's shoe shows and accessory markets.
Our jewelry brands are developed by separate design teams. Each team presents styles that maintain each brand's distinct personality. A prototype is developed for each new product where appropriate. Most prototypes are produced by our contractors based on technical drawings that we supply. These prototypes are reviewed by our product development team, who negotiate costs with the contractors.
- 11 -
After samples are evaluated and cost estimates are received, the lines are modified as needed for presentation for each selling season.
In accordance with standard industry practices for licensed products, we have the right to approve the concepts and designs of all products produced and distributed by our licensees. VCJS, G-III, BKA and Sanctuary have the right to approve the concepts and designs of all products produced and distributed for the Jessica Simpson, Andrew Marc/Marc Moto, B Brian Atwood and Live Life by Sanctuary product lines, respectively. Similarly, Givenchy and Levi Strauss & Co. also provide design services to us for our licensed products and have the right to approve our designs for the Givenchy and Dockers(R) product lines, respectively.
Manufacturing and Quality Control
Apparel
Apparel sold by us is produced in accordance with our design, specification and production schedules through an extensive network of independent factories located throughout the world, primarily in Asia, with additional production located in the Middle East and Africa. Nearly all our apparel products were manufactured outside North America during 2010. Our apparel products are manufactured according to plans prepared each year which reflect prior years' experience, current fashion trends, economic conditions and management estimates of a line's performance.
We believe that outsourcing our products allows us to maximize production flexibility, while avoiding significant capital expenditures, work-in-process inventory build-ups and costs of managing a larger production work force. Our fashion designers, production staff and quality control personnel closely examine garments manufactured by contractors to ensure that they meet our high standards.
Our comprehensive quality control program is designed to ensure that raw materials and finished goods meet our exacting standards. Fabrics and trims for garments manufactured are inspected by either independent inspection services or by our contractors upon receipt in their warehouses, and most production is inspected by our quality control personnel during the manufacturing process. Our quality control program includes inspection of both prototypes of each garment prior to cutting by the contractors and a sampling of production garments upon receipt at our warehouse facilities or third-party distribution centers to ensure compliance with our specifications.
Our foreign manufacturers' operations are primarily monitored by our personnel located in Hong Kong, mainland China and the Middle East, buying agents located in other countries and independent contractors and inspection services. Finished goods are generally shipped to our warehouses for final inspection and distribution.
In addition, our apparel products are tested to ensure compliance with applicable consumer product safety laws and regulations.
For our sportswear business, we occasionally supply the raw materials to our manufacturers. Otherwise, the raw materials are purchased directly by the manufacturer in accordance with our specifications. Raw materials, which are in most instances made and/or colored especially for us, consist principally of piece goods and yarn and are purchased by the factories from a number of domestic and foreign textile mills and converters.
Our primary raw material in our jeanswear business is denim, which is primarily purchased from leading mills located in the Pacific Rim and sub-continent. Denim purchase commitments and prices are negotiated on a regular basis. We perform our own extensive testing of denim, cotton twill and other fabrics to ensure consistency and durability.
We do not have long-term arrangements with any of our suppliers. We have experienced little difficulty in satisfying our raw material requirements and consider our sources of supply adequate. Our products have historically been purchased from foreign manufacturers in pre-set United States dollar
- 12 -
prices. To date, we generally have not been materially adversely affected by fluctuations in exchange rates. However, a substantial decline of the United States dollar against major world currencies, coupled with higher labor and raw material costs being experienced by some of our foreign manufacturers, primarily in China, could cause our manufacturing costs to rise.
We believe our extensive experience in logistics and production management underlies our success in coordinating with contractors who manufacture different garments included within the same product group. We also contract for the production of a portion of our products through a network of foreign agents. We have had long-term mutually satisfactory business relationships with many of our contractors and agents but do not have long-term written agreements with any of them.
Footwear and Accessories
To provide a steady source of inventory, we rely on long-standing relationships with manufacturers in Asia and Europe. We work primarily through independent buying agents for footwear and jewelry and our own offices for handbags and small leather goods. We do not have formal purchase agreements with any of our manufacturers. Allocation of production among our manufacturing resources is determined based upon a number of factors, including manufacturing capabilities, delivery requirements and pricing.
During 2010, nearly all our non-Stuart Weitzman footwear products were manufactured by independent footwear manufacturers located in Asia (primarily China). Stuart Weitzman products are primarily manufactured in both independent and related factories in Europe, primarily in Spain. Our handbags and small leather goods are sourced through our own buying office in China, which utilizes independent third party manufacturers also located primarily in China. Our products have historically been purchased in pre-set United States dollar prices, although Stuart Weitzman products are generally purchased in Euros. To date, we generally have not been materially adversely affected by fluctuations in exchange rates. However, a substantial decline of the United States dollar against major world currencies, coupled with higher labor and raw material costs being experienced by some of our foreign manufacturers, primarily in China, could cause our manufacturing costs to rise.
For footwear and jewelry, quality control reviews are done on-site in the factories by our third-party buying agents primarily to ensure that material and component qualities and fit of the product are in accordance with our specifications. For handbags and small leather goods, quality control reviews are done on-site in the factories by our own locally-based inspection technicians. Our quality control program includes approval of prototypes, as well as approval of final production samples to ensure they meet our high standards. In addition, our footwear and accessories products are tested for compliance with applicable consumer product safety laws and regulations, including California Proposition 65.
We believe that our relationships with our Chinese and European manufacturers provide us with a responsive and adequate source of supply of our products. We also believe that purchasing a significant percentage of our products through independent third-party manufacturers allows us to maximize production flexibility while limiting our capital expenditures, work-in-process inventory and costs of managing a larger production work force. Because of sophisticated footwear manufacturing techniques, individual production lines can be quickly changed from one style to another, and production of certain styles can be completed in as few as four hours, from uncut leather to boxed footwear.
We place our projected orders for each season's styles with our manufacturers prior to the time we have received all of our customers' orders. Because of our close working relationships with our third party manufacturers (which allow for flexible production schedules and production of large quantities of footwear within a short period of time), many of our orders are finalized only after we have received orders from a majority of our customers. As a result, we are better able to meet sudden demands for particular designs, more quickly exploit market trends as they occur, reduce inventory risk and more efficiently fill reorders booked during a particular season.
- 13 -
We believe that the quality and cost of products manufactured by our suppliers provide us with the ability to remain competitive. We have historically experienced little difficulty in satisfying finished goods requirements, and we consider our source of supplies adequate.
Our jewelry products are manufactured primarily by independently-owned jewelry manufacturers in Asia. Sourcing the majority of our products from third-party manufacturers enables us to better control costs and avoid significant capital expenditures, work in process inventory, and costs of managing a larger production workforce. Our products have historically been purchased from Asian manufacturers in pre-set United States dollar prices. To date, we generally have not been materially adversely affected by fluctuations in exchange rates. However, a substantial decline of the United States dollar against major world currencies, coupled with higher labor and raw material costs being experienced by some of our foreign manufacturers, primarily in China, could cause our manufacturing costs to rise.
Forecasts for basic jewelry products are produced on a rolling 12-week basis and are adjusted based on point of sale information from retailers. Manufacturing of fashion jewelry products is based on marketing forecasts and sales plans; actual orders are received several weeks after such forecasts are produced.
Imports and Import Restrictions
Our transactions with our foreign manufacturers and suppliers are subject to the risks of doing business abroad. Imports into the United States are affected by, among other things, the cost of transportation and the imposition of import duties and restrictions. The United States, China and other countries in which our products are manufactured may, from time to time, impose new quotas, duties, tariffs or other restrictions, or adjust presently prevailing quotas, duty or tariff levels, which could affect our operations and our ability to import products at current or increased levels. We cannot predict the likelihood or frequency of any such events occurring.
On January 1, 2005, the World Trade Organization's 148 member nations lifted all quotas on apparel and textiles. As a result, all textiles and textile apparel manufactured in a member nation and exported after January 1, 2005 are no longer subject to quota restrictions. A special safeguard provision that had provided the U.S. with an additional four years beyond January 1, 2005 to apply quotas on Chinese imports of textiles expired on December 31, 2008, although a product-specific safeguard provision continues until 2012. The lifting of quotas and expiration of general safeguard provisions allows retailers, apparel firms and others to import unlimited quantities of apparel and textile items from China, India and other low-cost countries, which could allow us to improve the quality of our products for a given cost or allow us to concentrate production in the most efficient markets. In addition, if the prices of the imported goods can be shown to be less than those offered by other domestic producers from that country for the same items, the U.S. International Trade Commission may recommend that anti-dumping duties be imposed on those goods. As a result, we are unable to predict the long-term effects of the lifting of quota restrictions and related events on our results of operations.
Our imported products are also subject to United States customs duties and, in the ordinary course of business, we are from time to time subject to claims by the United States Customs Service for duties and other charges.
We monitor duty, tariff and quota-related developments and continually seek to minimize our potential exposure in these areas through, among other measures, geographical diversification of our manufacturing sources, the maintenance of overseas offices and shifts of production among countries and manufacturers.
Because our foreign manufacturers are located at significant geographic distances from us, we are generally required to allow greater lead time for foreign orders, which reduces our manufacturing flexibility. Foreign imports are also affected by the high cost of transportation into the United States and the effects of fluctuations in the value of the dollar against foreign currencies in certain countries.
- 14 -
In addition to the factors outlined above, our future import operations may be adversely affected by political instability resulting in the disruption of trade from exporting countries and restrictions on the transfer of funds.
Marketing
Our ten largest customer groups, principally department stores, accounted for approximately 55% of gross revenues in 2010. Macy's, Inc. ("Macy's"), our largest customer in 2010, accounted for 20% of our 2010 gross revenues.
We believe that several significant trends are occurring in the apparel, footwear and accessories industry. We believe a trend exists among our major customers to expand the differentiation of their offerings and to achieve strategic advantages over competitors by devoting more resources to the development of exclusive products - whether products that the retailer designs (private labels) or exclusive brands produced for the retailer by national brand manufacturers. Retailers are placing more emphasis on developing their brand images and building strong images for their private label merchandise. Exclusive brands, as the term implies, are only available from a specific retailer, and thus customers loyal to these brands can only find them in the stores of that retailer. We have responded to this trend by leveraging our design, production and marketing capabilities to develop and provide private label products for certain customers and products under certain of our brands to select customers, such as providing l.e.i. products exclusively to Wal-Mart Stores Inc. ("Walmart"), Rachel Rachel Roy products exclusively to Macy's and GLO products exclusively to Kmart Corporation ("Kmart"). While the private label lines compete directly with our product lines and may receive more prominent positioning on the retail floor by department stores, creating more competition, we believe that national brands are often preferred by the consumer.
Furthermore, we believe a trend exists among our major customers to concentrate purchasing among a narrowing group of vendors. In the future, retailers may have financial problems or continue to consolidate, undergo restructurings or reorganizations, or realign their affiliations, any of which could increase the concentration of our customers. We attempt to minimize our credit risk from our concentration of customers by closely monitoring accounts receivable balances and shipping levels and the ongoing financial performance and credit status of our customers.
We also believe that consumers will continue to increase their purchasing of apparel, footwear and accessories through e-commerce web sites. Through our e-commerce web sites, we market either footwear and accessories, apparel or a combination of these products, primarily under their respective brand names. The selection of products is substantially consistent with the product offerings in our corresponding retail store concepts. Our e-commerce systems allow us to fulfill customer orders from inventory at our retail store locations if the items are not available at our distribution center.
We believe retail demand for our apparel products is enhanced by our ability to provide our retail accounts and consumers with knowledgeable sales support. In this regard, we have an established program to place retail sales specialists in many major department stores for many of our brands, including Jones New York, Jones New York Sport, Jones New York Signature, Kasper, Anne Klein and Jessica Simpson. These individuals have been trained by us to support the sale of our products by educating other store personnel and consumers about our products and by coordinating our marketing activities with those of the stores. In addition, the retail sales specialists provide us with firsthand information concerning consumer reactions to our products. In addition, we have a program of designated sales personnel in which a store agrees to designate certain sales personnel who will devote a substantial portion of their time to selling our products in return for certain benefits.
Sportswear products are marketed to department stores and specialty retailing customers during "market weeks," which are generally four to six months in advance of the corresponding industry selling seasons. While we typically will allocate a six-week period to market a sportswear line, most major orders are written within the first three weeks of any market period.
- 15 -
We introduce new collections of footwear six times per year and showcase our footwear collections at industry-wide shoe shows, held quarterly in New York City and semi-annually in Las Vegas. We introduce new handbag and small leather goods collections at market shows that occur five times each year in New York City. Jewelry products are marketed in New York City showrooms through individual customer appointments and at five industry-wide market shows each year. Retailers visit our showrooms at these times to view various product lines and merchandise.
We market our footwear, handbag and small leather goods businesses with certain department stores and specialty retail stores by bringing our retail and sales planning expertise to those retailers. Under this program, members of branded division management who have extensive retail backgrounds work with the retailer to create a "focus area" or "concept shop" within the store that displays the full collection of a single brand in one area. These individuals assist the department and specialty retail stores by: providing advice about appropriate product assortment and product flow; making recommendations about when a product should be re-ordered; providing sales guidance, including the training of store personnel; and developing advertising programs with the retailer to promote sales of our products. In addition, our sales force and field merchandising associates for footwear, handbags and small leather goods recommend how to display our products, assist with merchandising displays and educate store personnel about us and our products. The goal of this approach is to promote high retail sell-throughs of our products. With this approach, customers are encouraged to devote greater selling space to our products, and we are better able to assess consumer preferences, the future ordering needs of our customers, and inventory requirements.
We work closely with our wholesale jewelry customers to create long-term sales programs, which include choosing among our diverse product lines and implementing sales programs at the store level. A team of sales representatives and sales managers monitors product performance against plan and are responsible for inventory management, using point-of-sale information to respond to shifts in consumer preferences. Management uses this information to adjust product mix and inventory requirements. In addition, field merchandising associates recommend how to display our products, assist with merchandising displays and educate store personnel about us and our products. Retailers are also provided with customized displays and store-level merchandising designed to maximize sales and inventory turnover. By providing retailers with in-store product management, we establish close relationships with retailers, allowing us to maximize product sales and increase floor space allocated to our product lines. We have also placed retail sales specialists in major department stores to support the sale of our jewelry products.
Advertising and Promotion
We employ a cooperative advertising program for our branded products, whereby we share the cost of certain wholesale customers' advertising and promotional expenses in newspapers, magazines and other media up to either a preset maximum percentage of the customer's purchases or an agreed-upon rate of contribution. An important part of the marketing program includes prominent displays of our products in wholesale customers' fashion catalogs as well as in-store shop displays.
We have national advertising campaigns for the following brands:
- Jones New York (in fashion and lifestyle magazines and on select high-traffic online sites),
- Nine West (footwear, jeanswear, handbags, jewelry and licensed products, primarily in fashion magazines), including a dedicated advertising campaign for the Nine West Vintage America collection,
- l.e.i. (in junior-focused and fashion magazines and radio),
- Anne Klein New York (in fashion magazines),
- AK Anne Klein (in fashion magazines), and
- Stuart Weitzman (in fashion magazines).
In 2010, Jones New York launched the Empowering Your Confidence campaign which celebrates the brand's 40 year legacy of dressing women for success. According to a study conducted by Maria Shriver and the Center for American Progress, half of all American workers are women. The Empowering Your Confidence campaign is inspired by the tremendous impact working women have had on all aspects of
- 16 -
American life. The campaign includes multi-faceted initiatives in media, networking and philanthropy with national and local components.
- Famed artist Annie Leibovitz photographed the campaign in New York City's Grand Central Station. The images capture the power and confidence of the modern working woman. Jones New York unveiled the campaign images in Grand Central Station in early August 2010, with a print debut in the September issues of fashion publications, including Vogue, Elle and Vanity Fair, as well as appearing on leading websites like The Huffington Post, monster.com and nytimes.com.
- Former White House Press Secretary Dee Dee Myers is the national ambassador for the Empowering Your Confidence campaign, who will help amplify the messaging by serving as the editor for "The Little Black Book of Career Advice" and writing journal entries about empowerment themes. Ms. Myers hosted the first annual Jones New York Power Lunch on September 23, 2010, which brought together women in varying stages of their careers - from those who are seasoned to those new to the workforce. Ms. Myers also awarded over $60,000 in grants to nine women as part of the newly-created JNY Empowerment Fund. The fund's mission is to help women reach their personal, professional and community goals through monetary grants. Dress for Success and Ladies That Launch are both partners in this initiative.
- "The Little Black Book of Career Advice," a digitally integrated and socially shareable asset available at www.jny.com, features a foreword written by Ms. Myers and inspirational quotes from over 100 successful women across the country, including Lauren Bush, Arianna Huffington, Bonnie Fuller, Deborah Norville, Bobbi Brown and Ivanka Trump, among others.
- The www.jny.com website was redesigned to include a dedicated "Empower your Confidence" section featuring "The Little Black Book of Career Advice," an Empowerment Journal featuring entries by Ms. Myers and featured bloggers, information on the Empowerment Fund, campaign images, Power Dressing videos from Lloyd Boston, and a Career Shop where consumers can shop head-to-toe power looks for the office. Jones New York has also added empowerment content to their Facebook and Twitter channels, including quarterly career chats with experienced professionals dispensing career advice and answering career questions.
- Nationally, Jones New York has partnered with The Women's Conference, one of the nation's leading conferences on women's issues and empowerment. Held in Long Beach, California from October 24-26, 2010, the conference focused on helping women become architects of change.
- Also nationally, Jones New York embarked on an Empowering Your Style road show featuring exclusive "JNY Style Guy" Lloyd Boston to help women with wardrobe solutions that make them look and feel great. The six-city tour kicked off at Fashion's Night Out in New York City on September 10, 2010, including outdoor and newspaper advertising in the New York metropolitan area, street team engagement and the opening of a new shop experience at Macy's Herald Square.
During 2010, we used several special programs to promote other product lines. The Rachel Rachel Roy line partnered with Grammy-award winning singer/songwriter Estelle for a limited-edition collection of jewelry for Spring 2010 and partnered with supermodel Jessica Stam for a limited edition sportswear collection for Fall 2010. Both the Estelle and Jessica Stam collaborations continued to leverage social and new media tactics like Facebook pop-up stores and blogger partnerships to amplify the projects. Rachel Roy continues to be a leading fashion and style influencer and, in 2010, was featured in numerous magazine stories in Vogue, Teen Vogue and Lucky and appeared on television shows such as The Nate Berkus Show, Project Runway, and The Fashion Show. Rachel Roy was also recognized by Mattel as one of their "Ten Women to Watch," and First Lady Michelle Obama has worn Rachel's designer line on numerous official visits and speaking engagements.
Given the strong recognition and brand loyalty already afforded our brands, we believe these campaigns will serve to further enhance and broaden our customer base. Our in-house creative services departments oversee the conception, production and execution of virtually all aspects of these activities. We also believe that our retail network promotes brand name recognition and supports the merchandising of complete lines by, and the marketing efforts of, our wholesale customers.
- 17 -
Backlog
We had unfilled customer orders of approximately $1.2 billion at December 31, 2010 and $1.1 billion at December 31, 2009. These amounts include both confirmed and unconfirmed orders which we believe, based on industry practice and past experience, will be largely confirmed. The amount of unfilled orders at a particular time is affected by a number of factors, including the mix of product, the timing of the receipt and processing of customer orders and scheduling of the manufacture and shipping of the product, which in some instances is dependent on the desires of the customer. Backlog is also affected by a continuing trend among customers to reduce the lead time on their orders. Due to these factors, a comparison of unfilled orders from period to period is not necessarily meaningful and may not be indicative of eventual actual shipments.
Licensing of Company Brands
We have entered into various license agreements under which independent licensees either manufacture, market and sell certain products under our trademarks in accordance with designs furnished or approved by us or distribute our products in certain countries where we do not do business. These licenses, the terms of which (not including renewals) expire at various dates through 2015, typically provide for the payment to us of a percentage of the licensee's net sales of the licensed products against guaranteed minimum royalty payments, which typically increase over the term of the agreement.
The following table sets forth information with respect to select aspects of our licensing business:
Brand
| Category
|
| Jones New York | Men's Belts, Small Leather Goods, and Cold Weather Accessories (U.S.)
Men's Belts, Small Leather Goods (Canada)
Men's Neckwear (Canada)
Men's Neckwear (U.S.)
Men's Sportswear, Sweaters, Knit Shirts, Woven Shirts, Finished Bottom Slacks
and Outerwear (Canada)
Men's Tailored Clothing, Dress Shirts, Outerwear, Dress Slacks (Canada)
Men's Sleepwear (Canada)
Men's Tailored Clothing, Formal Wear (U.S.)
Men's Umbrellas (U.S.)
Men's and Women's Optical Eyewear (U.S., Canada, Argentina, Aruba, Australia,
Bahamas, Barbados, Belize, Benelux, Bolivia, Chile, Colombia, Costa Rica, Cyprus,
Denmark, Dominican Republic, Ecuador, El Salvador, Finland, France, French Guiana,
Guatemala, Honduras, Indonesia, Ireland, Israel, Jamaica, Korea, Kuwait, Lebanon,
Mexico, Netherlands Antilles, New Zealand, Nicaragua, Norway, Panama, Paraguay,
Peru, Philippines, Qatar, Russia, Saudi Arabia, South Africa, Suriname, Sweden,
Thailand, Trinidad, Turkey, United Arab Emirates, Uruguay, Venezuela)
Women's Costume Jewelry (Canada)
Women's Hats (U.S., Canada)
Women's Leather Outerwear (U.S.)
Women's Outerwear, Rainwear (U.S.)
Women's Wool Coats (U.S.)
Women's Outerwear, Wool Coats, Rainwear (Canada)
Women's Scarves, Wraps (U.S., Canada)
Women's Sleepwear, Loungewear, Daywear, Foundations (U.S., Canada)
Women's Sunglasses (U.S., Canada)
Women's Umbrellas, Rain Accessories (U.S.)
Retail rights for Women's Apparel (Saudi Arabia) |
| Albert Nipon | Men's Tailored Clothing (U.S.) |
| Evan-Picone | Men's Tailored Clothing (U.S.)
Manufacturing and Wholesale Distribution Rights for Women's Sportswear (Japan) |
- 18 -
Brand
| Category
|
| Energie | Men's Denim and Sportswear and Footwear (U.S.)
Boys' Denim and Sportswear (4-6x and 8-20) (U.S.) |
| Gloria Vanderbilt | Handbags (U.S.)
Intimate Apparel, Sleepwear (U.S.) |
| GLO Jeans | Junior Footwear (U.S.)
Junior Handbags (U.S.) |
| GRANE | Junior Outerwear (U.S.) |
| Anne Klein New York and AK Anne Klein | Belts (U.S., Canada, Mexico, Bermuda)
Home Sewing Patterns (Worldwide)
Hosiery, Casual Legwear (U.S., Canada)
Outerwear, Wool Coats, Leather Outerwear, Rainwear (U.S., Canada)
Scarves, Cold Weather Accessories, Gloves (U.S., Canada)
Sleepwear, Loungewear (U.S., Canada)
Luggage (U.S., Canada, Bermuda, Mexico, United Kingdom)
Sunglasses, Optical Eyewear (Worldwide)
Watches (Worldwide)
Manufacturing and Wholesale and Retail Distribution Rights for Apparel (Japan)
Retail and Wholesale Distribution Rights for Handbags, non-exclusive retail rights
for Footwear (Japan)
Sublicensed Wholesale and Retail Distribution Rights for Scarves, Towels,
Jewelry (Japan)
Manufacturing and Wholesale and Retail Distribution Rights for Apparel, Handbags and
Accessories, non-exclusive retail rights for Footwear (Korea)
Manufacturing and Wholesale Distribution rights for Scarves, Handkerchiefs, Cold
Weather Accessories & Umbrellas (Korea)
Retail and Wholesale Distribution Rights for Apparel (Central America, South America,
Caribbean, Dominican Republic)
Retail Rights for Belts, Eyewear, Coats, Sleepwear, Socks, Scarves, Swimwear,
Fragrances and Cosmetics if any such items are made available in the Territory,
non-exclusive rights for Footwear, Handbags, Jewelry & Watches (Central America,
South America, Caribbean, Dominican Republic)
Retail Rights for Apparel, Belts, Sunglasses, Coats, Socks, Scarves, Swimwear, as well
as Sleepwear, Fragrances if such items are made available in the Territory, non-exclusive
rights for Footwear, Handbags, Jewelry & Watches (Saudi Arabia)
Retail and Wholesale Distribution Rights for Apparel, non-exclusive rights for Belts, Sunglasses,
Coats, Socks, Scarves, Swimwear, as well as Sleepwear, Fragrances if such items are made
available in the Territory, Footwear, Handbags, Jewelry & Watches (China, Hong Kong,
Indonesia, Macau, Malaysia, Singapore, Taiwan, Thailand)
Retail Distribution Rights for Apparel, Belts, Scarves, Sleepwear and Socks, non-exclusive rights
for Footwear, Handbags, Small Leather Goods, Eyewear, Jewelry & Watches (Philippines) |
| Anne Klein Coat | Outerwear, Wool Coats, Leather Outerwear, Rainwear (U.S., Canada) |
| Nine West | Belts (U.S., Canada, Bermuda)
Casual Legwear (U.S., Canada)
Gloves, Cold Weather Accessories (U.S., Canada)
Hats (U.S., Canada)
Leather, Wool, Casual Outerwear, Rainwear (U.S., Canada, Spain)
Optical Eyewear (U.S., Canada, China, Mexico)
Sunglasses (U.S., Canada, Spain)
Fragrance (Worldwide)
Manufacturing, Retail and Wholesale Distribution Rights for Apparel. Retail rights for Belts, Cold
Weather Accessories, Hats, Luggage, Sunglasses, Coats, Legwear, Scarves, as well as
Sleepwear, Swimwear, Fragrances and Cosmetics if such items are made available in the
Territory, Footwear, Handbags, Jewelry & non-exclusive retail rights for Watches (China,
Hong Kong, Macau, Malaysia, Singapore, Taiwan, Thailand) |
- 19 -
Brand
| Category
|
| Nine & Co. | Intimate Apparel, Sleepwear (U.S.)
Sunglasses (U.S.)
Belts (U.S.) |
| Easy Spirit | Slippers (U.S., Canada) |
| Enzo Angiolini | Sunglasses (U.S.) |
| l.e.i. | Juniors' and Girls' Scarves, Hats, Hair Accessories, Gloves, Cold Weather
Accessories (U.S., Canada)
Juniors' and Girls' Intimate Apparel (U.S., Canada)
Juniors' and Girls' Sunglasses (U.S., Canada)
Juniors' and Girls' Casual Legwear (U.S.)
Juniors' and Girls' Footwear (U.S., Canada)
Juniors' and Girls' Handbags, Belts (U.S., Canada)
Juniors' and Girls' Optical Eyewear (U.S., Canada, Mexico) |
| Rachel Rachel Roy | Women's Belts (U.S., Canada)
Women's Scarves, Wraps, Cold Weather Accessories (U.S., Canada) |
| Joan & David | Manufacturing and Retail Distribution Rights for Apparel, Footwear, Handbags (China, Hong
Kong, Korea, Macau, Malaysia, Philippines, Singapore, Taiwan, Thailand) |
| Stuart Weitzman | Children's Footwear (U.S., Hong Kong, Italy, France, Monaco, Spain, Germany) |
| International footwear and accessories retail/wholesale distribution | Nine West and Enzo Angiolini retail locations (Bahrain, Kuwait, Oman, Qatar, the United
Arab Emirates, Jordan) and AK Anne Klein retail locations and wholesale distribution
rights for AK Anne Klein footwear and accessories (Bahrain, Kuwait, Oman, Qatar, the
United Arab Emirates)
Nine West and AK Anne Klein retail locations (Saudi Arabia, Lebanon, Egypt)
Nine West and AK Anne Klein retail locations and wholesale distribution rights for Nine West,
Anne Klein, Enzo Angiolini, Bandolino and Easy Spirit footwear and accessories and AK
Anne Klein, Circa Joan & David, Sam & Libby and Mootsies Tootsies footwear (Belize,
Costa Rica, El Salvador, Guatemala, Honduras, Nicaragua, Panama)
Nine West retail locations and wholesale distribution rights for Nine West, Anne Klein, Enzo
Angiolini, Bandolino and Easy Spirit footwear and accessories and AK Anne Klein, Circa
Joan & David, Sam & Libby and Mootsies Tootsies footwear (Columbia, Ecuador, Venezuela,
the Dominican Republic, French Guiana, Guyana, Suriname, the Caribbean Islands)
Nine West and AK Anne Klein retail locations and wholesale distribution rights for Nine West
and AK Anne Klein footwear and accessories (Greece, Cyprus, Bulgaria)
Nine West retail locations and wholesale distribution rights for Nine West footwear and accessories
(Chile, Peru, Uruguay) and wholesale distribution rights for Enzo Angiolini footwear and
accessories (Chile)
Nine West, Enzo Angiolini, NW Nine West and Easy Spirit retail locations and wholesale distribution
rights for Nine West, Enzo Angiolini, NW Nine West and Easy Spirit footwear and accessories
(Hong Kong, Indonesia, Japan, Korea, Macau, Malaysia, the People's Republic of China, the
Philippines, Singapore, Taiwan, Thailand, Vietnam, Cambodia)
Nine West retail locations and wholesale distribution rights for Nine West footwear and accessories
(South Africa)
Nine West, AK Anne Klein, Enzo Angiolini and Westies retail locations, wholesale distribution rights
for Nine West footwear and accessories and Enzo Angiolini, Westies and AK Anne Klein footwear,
and manufacturing rights for Westies footwear (Mexico)
Retail locations for Nine West (Turkey, Romania, Kazakhstan, Azerbaijan, Ukraine), AK Anne Klein
(Turkey) and Enzo Angiolini (Turkey) and wholesale distribution rights for Enzo Angiolini, Circa
Joan & David, Boutique 9 and AK Anne Klein footwear (Turkey)
Nine West, AK Anne Klein and Easy Spirit retail locations and wholesale distribution rights for Nine West,
AK Anne Klein and Easy Spirit footwear and accessories (Israel)
Nine West and Bandolino retail locations, wholesale distribution rights for Nine West, Enzo Angiolini,
Easy Spirit, Bandolino, Nine & Co. and Westies footwear and accessories and AK Anne Klein,
Circa Joan & David, Sam & Libby and Mootsies Tootsies footwear (Canada) |
- 20 -
Brand
| Category
|
| | Nine West retail locations (the United Kingdom, Ireland, the Channel Islands) and wholesale distribution
rights for Nine West and Easy Spirit footwear and accessories (the United Kingdom, Ireland, the
Channel Islands)
Nine West retail locations and wholesale distribution rights for Nine West, AK Anne Klein and Enzo
Angiolini footwear and accessories (Spain, Portugal, Andorra)
Nine West retail locations (Russia, Poland)
Nine West retail locations (France)
Nine West and Enzo Angiolini retail locations and wholesale distribution rights for Nine West and Enzo
Angiolini footwear and accessories (Australia, New Zealand)
Nine West retail locations and wholesale distribution rights for Nine West footwear and accessories
(Bosnia-Herzegovina, Croatia, Macedonia, Montenegro, Serbia, Slovenia)
Nine West retail locations (India)
Wholesale distribution rights for Nine West and Napier costume jewelry (Canada)
Stuart Weitzman retail locations and wholesale distribution rights for Stuart Weitzman footwear and
accessories (Sydney, Melbourne and Brisbane, Australia)
Stuart Weitzman retail locations and wholesale distribution rights for Stuart Weitzman footwear and
accessories (Canada)
Stuart Weitzman retail locations and wholesale distribution rights for Stuart Weitzman footwear and
accessories (Beijing, China)
Stuart Weitzman retail locations and wholesale distribution rights for Stuart Weitzman footwear and
accessories (Hong Kong and Singapore)
Stuart Weitzman retail locations and wholesale distribution rights for Stuart Weitzman footwear and
accessories (Paris, France)
Stuart Weitzman retail location and wholesale distribution rights for Stuart Weitzman footwear and
accessories (Germany)
Stuart Weitzman retail locations and wholesale distribution rights for Stuart Weitzman footwear and
accessories (Greece)
Stuart Weitzman retail locations and wholesale distribution rights for Stuart Weitzman footwear and
accessories (Indonesia)
Stuart Weitzman retail locations and wholesale distribution rights for Stuart Weitzman footwear and
accessories (Tel Aviv, Israel)
Stuart Weitzman retail location and wholesale distribution rights for Stuart Weitzman footwear and
accessories (Forte dei Marmi, Italy)
Stuart Weitzman retail location and wholesale distribution rights for Stuart Weitzman footwear and
accessories (Serravalle, Italy)
Stuart Weitzman retail location and wholesale distribution rights for Stuart Weitzman footwear and
accessories (Torino, Italy)
Stuart Weitzman retail locations and wholesale distribution rights for Stuart Weitzman footwear and
accessories (Malaysia)
Stuart Weitzman retail locations and wholesale distribution rights for Stuart Weitzman footwear and
accessories (Mexico)
Stuart Weitzman retail locations and wholesale distribution rights for Stuart Weitzman footwear and
accessories (Moscow, Russia)
Stuart Weitzman retail location and wholesale distribution rights for Stuart Weitzman footwear and
accessories (St. Barth)
Stuart Weitzman retail location and wholesale distribution rights for Stuart Weitzman footwear and
accessories (Zurich, Switzerland) |
Investment in GRI
On June 20, 2008, we acquired a 10% equity interest in GRI, an international accessories and apparel brand management and retail-distribution network, for $20.2 million. On June 24, 2009, we increased our equity interest to 25% for an additional $15.2 million. The selling shareholders of GRI are entitled to receive an additional cash payment equaling 60% of the amount of GRI's fiscal year 2011 net income that exceeds a certain threshold. GRI, which (including its franchisees) operates approximately 1,060 points of sale in 13 Asian countries, is the exclusive licensee of several of our brands in Asia, including Nine West, Anne Klein New York, AK Anne Klein, Easy Spirit, Enzo Angiolini and Joan & David. GRI also distributes other women's apparel, shoes and accessory brands.
- 21 -
Trademarks
We utilize a variety of trademarks which we own, including Jones New York, Jones New York Signature, Jones New York Sport, Jones New York Jeans, Jones Wear, Evan-Picone, Erika, Energie, Nine West, Easy Spirit, Enzo Angiolini, Bandolino, Nine & Co., Westies, Pappagallo, Joan & David, Mootsies Tootsies, Sam & Libby, Napier, Judith Jack, Gloria Vanderbilt, GLO, l.e.i., Anne Klein, Anne Klein New York, AK Anne Klein, Kasper, Le Suit, Grane and Boutique 9. We have registered or applied for registration for these and other trademarks for use on a variety of items of apparel, footwear, accessories and/or related products and, in some cases, for retail store services, in the United States and certain other countries. The expiration dates of the United States trademark registrations for our material registered trademarks are as follows, with our other registered foreign and domestic trademarks expiring at various dates through 2025. Certain brands such as Jones New York are sold under several related trademarks; in these instances, the range of expiration dates is provided. All marks are subject to renewal in the ordinary course of business if no third party successfully challenges such registrations and, in the case of domestic and certain foreign registrations, applicable use and related filing requirements for the goods and services covered by such registrations have been met.
| Trademark | Expiration
Dates | | Trademark | Expiration
Dates | | Trademark | Expiration
Dates |
| Jones New York | 2012-2019 | | Nine & Co. | 2012-2016 | | Kasper | 2011-2018 |
| Jones New York Sport | 2013 | | Napier | 2019 | | Le Suit | 2018 |
| Evan-Picone | 2011-2018 | | Judith Jack | 2012-2020 | | Joan & David | 2012-2019 |
| Nine West | 2011-2020 | | Energie | 2015-2019 | | Mootsies Tootsies | 2013-2020 |
| Easy Spirit | 2011-2020 | | Gloria Vanderbilt | 2012-2020 | | Sam & Libby | 2011-2020 |
| Enzo Angiolini | 2013-2020 | | l.e.i. | 2011-2020 | | Stuart Weitzman | 2012-2020 |
| Bandolino | 2011-2017 | | Anne Klein | 2012-2020 | | | |
We carefully monitor trademark expiration dates to provide uninterrupted registration of our material trademarks. We also license the Givenchy, Rachel Roy, Rachel Roy New York, Rachel Rachel Roy, Rachel Roy Signature, Jessica Simpson, Dockers(R), B Brian Atwood and Andrew Marc/Marc Moto trademarks (see "Licensed Brands" above).
We also hold numerous patents expiring at various dates through 2025 (subject to payment of annuities and/or periodic maintenance fees) and have additional patent applications pending in the United States Patent and Trademark Office. We regard our trademarks and other proprietary rights as valuable assets which are critical in the marketing of our products. We vigorously monitor and protect our trademarks and patents against infringement and dilution where legally feasible and appropriate.
Employees
At December 31, 2010, we had approximately 6,370 full-time employees. This total includes approximately 2,390 in quality control, production, design and distribution positions, approximately 1,980 in administrative, sales, clerical and office positions and approximately 2,000 in our retail stores. We also employ approximately 4,570 part-time employees, of which approximately 4,470 work in our retail stores.
Approximately 65 of our employees located in Vaughan, Ontario are members of the Laundry and Linen Drivers and Industrial Workers Union, which has a collective bargaining agreement with us expiring on March 31, 2012. Approximately 30 of our employees located in New York, New York are members of UNITE HERE, which has a collective bargaining agreement that expires on May 31, 2013. We consider our relations with our employees to be satisfactory.
Corporate Responsibility Programs
Factory Monitoring
We implemented a comprehensive monitoring program in 1996. Through independent agreements with domestic and foreign manufacturers that produce our products, we monitor compliance with The Jones Group Standards for Contractors and Suppliers (the "Standards"). Our monitoring program
- 22 -
evaluates 100% of our global contract factories at least annually for approved factories, and more frequently for factories with major non-conformances. With 24 employees spread across five countries, our compliance staff is multi-lingual, with the majority holding a post-secondary education degree. In addition to our internal staff, we retain a number of recognized, unaffiliated third party workplace compliance audit firms to conduct factory audits on our behalf. In 2010, 1,220 audits were conducted, including 1,019 by third party auditors.
Although there are no perfect monitoring systems, we are constantly improving our program in order to address compliance issues that we encounter. In August 2006, we instituted a scorecard system to assign risk levels objectively based on audit results. The scorecard concept is a data-driven process with the underlying premise that not all violations should be treated equally, and that some findings are more serious and not as easily corrected as others. By comparing audit results, the scorecard system allows us to evaluate and determine where monitoring is needed most. Over time, audit scores reflect the compliance status of a factory, making it a useful tool for internal production divisions to benchmark their factories, vendors and agents when making sourcing decisions.
To facilitate factories' understanding of our expectations and compliance requirements, we have in place the Jones Corporate Compliance Guidebook, a comprehensive guide to our compliance standards. The purpose of the guidebook is to provide suppliers with a detailed, informative and easy-to-follow reference of our expectations in the areas that we monitor. The Guidebook includes country-specific supplements, which contain an overview of the legal requirements unique to a country. To date, we have made the guidebook and supplements available in three languages - English, Chinese and Vietnamese.
Beyond Monitoring
Reliance on audits alone creates the risk that whatever improvements we do see may be temporary and cosmetic. To address this, a large part of our compliance program emphasizes uncovering the root causes of factory noncompliance and providing factories with the tools and training needed to sustain a viable long-term compliance program.
The basic goal of our "beyond monitoring" programs is to increase factories' abilities to establish a sustainable management system. We are moving to a model of partnering with suppliers to achieve sustainable compliance through proactive solutions. We have come to understand that factories must embed ethical business practices based on strong management systems into all of their business operations.
Our beyond monitoring programs focus on providing factories with the tools and knowledge to take responsibility for their social compliance practices. From our experience, the process is complicated and challenges factories' standard business practices. Recognizing this, we have taken the approach of dividing the programs into three phases: knowledge transfer, knowledge absorption and knowledge implementation. Together, these phases create a continuous process of feedback, reinforcement and improvement.
Since 2007, we have facilitated numerous training programs which include human resource management, health and safety, and managing employment relations. In 2010, we conducted 73 training sessions which were attended by 273 suppliers.
In 2009, we introduced a Compliance Newsletter in China for our sourcing partners. The newsletter includes corporate social responsibility ("CSR") topics in focus, updates of laws and regulations and our monitoring program, as well as capacity-building events information. The quarterly newsletter serves as a supplementary communication channel with our suppliers. Ultimately, we believe that if we can help factories to build effective management systems, we can facilitate and empower factories to create sustainable solutions.
Our compliance specialists work closely with factories producing our products to develop and implement sustainable management systems for labor. By working with the factories one-on-one, we have seen marked improvements in many of our factories, in areas such as wages and benefits, health
- 23 -
and safety, employees' understanding of their rights under the local labor laws and communication between management and workers.
Additionally, we have established strong relationships with local and U.S. government officials, the International Labour Organization ("ILO") and other multilateral institutions, non-governmental organizations ("NGOs") and trade union representatives. These relationships promote ongoing dialog and enable us to address issues proactively as they arise in the field.
Internal Alignment
The effectiveness of any supply chain monitoring effort is dependent on the cooperation and collaboration among different divisions across a company. On a daily basis, our compliance group communicates the compliance status of suppliers to internal business units and provides advice on how we can work together to help key factories to improve. We recognize that in order for factories to make progress in their labor and health and safety practices, our internal business units must understand the principles embodied in the Standards and support monitoring efforts with their influence over factories. Since 2008, we have issued periodic CSR newsletters to all our employees, to communicate our compliance efforts, the major issues that affect factories' compliance, and the important CSR issues of the day.
Engagement with Other Interested Parties
Like any multinational company, our business practices impact a diverse group, including business associates, governments, trade unions, NGOs and both employees working for us and for the factories making our products. A key element in our compliance program is engagement with these parties, which encompasses issues of factory compliance and human rights, and occurs at various levels - factory, community and multi-lateral initiatives.
At the factory level, we hold ongoing and regular one-on-one meetings with our key suppliers in-country as well as in our corporate offices. Periodically we convene vendor summits in major sourcing countries to bring together a wide variety of partners and provide them with both updates to our programs and opportunities for exchanging ideas and concerns. These meetings give participants a forum for working together to identify challenges and opportunities in the countries in which they operate, as well as to complete case studies based on real-life situations we have encountered through our monitoring program. Invitees to these summits may also include agents, trade unions, NGOs and local and U.S. government officials. Individual meetings in country with interested stakeholders also occur outside of the vendor summits. Ongoing communications with local constituents makes it possible for us to stay informed and anticipate potential problems before they occur.
We have been actively involved in the ILO's Better Work program, along with other recognized international brands. The program provides a platform for brand cooperation and benefits our suppliers by reducing their number of audits, which allows them to focus more of their time toward sustainable improvements. The Better Work program combines independent factory assessments with advisory and training services to support practical improvements in factories. We are currently involved with the Better Work program in Cambodia and Jordan. By supporting Better Work, we are committed to accepting ILO monitoring reports and have stopped auditing factories in Cambodia and Jordan that have chosen to participate in Better Work.
We continue to engage with Africa Now, an international development organization tackling poverty in Africa by helping small-scale producers and promoting ethical trade, to build its social auditing programs in Africa. The proceeds that Africa Now receives from conducting social audits for brands, including ours, provides support for its programs, such as capacity building and developing new social audit teams in countries not currently serviced. The goal of all of these efforts is to facilitate improvements in the labor conditions throughout our supply chain.
Philanthropy and Community Involvement
We strive to be a trusted and responsible member of the communities in which we work and live. To accomplish this goal, we promote and support employees to make a positive impact, through a
- 24 -
combination of monetary and product donations and volunteer support. In 2010, we and our associates contributed time and money to a number of causes at the local community, national and global levels.
Our founder, Sidney Kimmel, transitioned from executive Chairman to non-executive Chairman on December 31, 2010, marking the end of the fortieth year since Mr. Kimmel founded our company. In recognition of Mr. Kimmel's contributions to us, including his many years of outstanding leadership, we agreed to donate $8 million to honor Mr. Kimmel and his accomplishments and to enhance his many charitable initiatives. We donated $6 million to the Sidney Kimmel Comprehensive Cancer Center at Johns Hopkins Medicine, in Baltimore, Maryland. Johns Hopkins has been ranked as the nation's number one hospital for 20 consecutive years by US News and World Report. Its cancer center, already named for Mr. Kimmel, is one of 40 centers designated by the National Cancer Institute as a comprehensive cancer center, and is among the most innovative in the development of advanced therapies with researchers and clinicians working together to move treatments quickly from lab to patient.
In addition, we will establish a $2 million trust for post-secondary educational assistance for qualifying children of our associates, based on, among other things, academic achievements. The trust will be administered by an independent third party.
In May 2005, we launched a charitable cause initiative, including the establishment of Jones New York In The Classroom, Inc., a not-for-profit corporation, with an initial grant from us of $1 million and a commitment of our continued support. Jones New York In The Classroom is dedicated to improving the quality of education in America and inspiring others, both individuals and corporations, to do the same through support of teachers and vital teacher-based programs in America's schools. It is focused on four areas of support for teachers: recruitment, retention, professional development and recognition and support.
Our commitment since the launch in 2005 has also included support for events to raise public awareness of Jones New York In The Classroom and its goals for teachers and education, as well as initiatives to encourage our employees to participate in volunteer opportunities and fundraising for Jones New York In The Classroom, and the other non-profit organizations it supports. The Jones New York In The Classroom program benefits three non-profit organizations: TeachersCount, Fund For Teachers and Adopt-A-Classroom. Each of these non-profit organizations supports teachers in the critical areas of recruitment, retention/recognition, and daily needs in the classroom.
Jones New York In The Classroom has developed signature programs that are central to our mission to help to improve the quality of education in America. Jones New York In The Classroom partners with TeachersCount on a Public Service Announcement ("PSA") program which features celebrities and their favorite teachers to help raise the profile and stature of the profession of teaching. 2010 PSAs included Martha Stewart, Patrick Willis, Tyler Hansbrough, New York Yankee Curtis Granderson, U.S. World Cup and L.A. Galaxy soccer star Landon Donovan, Food Networks' Guy Fieri and country singer Miranda Lambert, among others. The Shop For Education program comes alive in October in participating Macy's stores. Shop For Education Week is a week for women to shop for the cause by purchasing items in selected Jones New York apparel lines. We donate a portion of the selling price of each item up to a total of $300,000 to Jones New York In The Classroom to benefit the three nonprofit organizations it supports. During this week, we feature fashion shows at Macy's with local teachers walking the runway to be recognized in front of their families, communities and students. Jones New York also sells an exclusive t-shirt during Shop For Education Week, from which all profits are donated to Jones New York In The Classroom. Additional activities of Jones New York In The Classroom can be found at www.jnyintheclassroom.org.
Our corporate employees have the opportunity to volunteer up to three hours of paid time off each month in educational facilities in their local communities. Corporate projects have included school makeovers which transform schools with new paint, refurbishment of teacher's lounges, new supplies for teachers and children, and new playground equipment or murals. Each of our business locations is encouraged to raise or budget funds to adopt a classroom to help with daily classroom needs through Adopt-A-Classroom. We recognize volunteerism among our associates with our annual Apple Awards.
- 25 -
Winners are nominated by their peers for their dedication to the cause and are honored at a luncheon in New York City each December hosted by our Chief Executive Officer.
Our Hong Kong office was the first of our overseas affiliates to initiate a community service program by organizing and hosting an annual carnival in the lowest-income neighborhood in Hong Kong.
In addition to the localized community efforts, we took part in a number of national and industry-sponsored fundraising events. These efforts included either monetary or product donations to the American Heart Association, Breast Cancer Research Foundation, Dress for Success, Fashion Footwear Charitable Foundation, Fashion Footwear Association of New York ("FFANY") Shoes on Sale, Ovarian Cancer Research Fund, St. Jude's Children's Research Hospital and Two Ten Footwear Foundation.
On a global level, we donated product to various charitable organizations world-wide. These organizations include: Gifts In Kind International, Samaritan's Feet, Soles for Souls, and the Susie Reizod Foundation, all of which donate shoes to community charities, children, or the indigent in the United States and abroad.
The Greening of Jones
With a goal of reducing our carbon footprint and minimizing other environmental impacts, we have established an Executive Green Committee to explore environmental opportunities throughout the company. The Executive Green Committee consists of 15 strategic business executives having direct impact on our decisions to incorporate green initiatives. Additionally, we have identified more than 200 of our associates to be "eco-ambassadors" working in parallel with the Executive Green Committee to raise environmental awareness among employees, exemplify green practices in the workplace, and brainstorm new ways to increase efficiencies and adopt environmentally-friendly practices.
Working with Esty Environmental Partners in 2009, The Jones Group performed its first Greenhouse Gas Inventory to understand its climate change impact. We examined the emissions associated with all Jones Group controlled facilities. We analyzed CO2 and fugitive refrigerant hydrofluorocarbon (HFCs) emissions. The inventory accounted for all the fuel and electricity directly consumed by our business (Scope 1 and 2 emissions), sometimes relying on estimates and model extrapolations for calculation. Whenever possible, we followed the internationally-recognized Greenhouse Gas Protocol (GHG Protocol).
In addition to segmenting the footprint into electricity and direct fuel use, we broke down our Scope 1 and 2 footprints into relevant categories of emissions sources: retail stores, distribution centers and offices/other facilities to better understand our emissions profile and identify reduction opportunities.
We inventoried GHG emissions from a number of Scope 3 emissions sources, including third-party logistics. We calculated all logistics footprints by including emissions from multiple greenhouse gases: CO2, CH4, and N2O. The inventory accounted for all inbound and outbound logistics, sometimes relying on estimates and model extrapolations for calculation. For logistics emissions calculations, we used the U.S. EPA Climate Leaders' Greenhouse Gas Module for Commuting, Business Travel, and Product Transport.
With the goal of better understanding our products and their impacts, we are beginning to assess the carbon, water and toxics impact of our products across various stages of their life cycle. We are looking at raw materials production, product manufacturing, product logistics, retail sales, and consumer use and care. We are studying these impacts at both the company and divisional levels.
Energy Reduction in the Distribution Centers and Retail Locations
We have been exploring innovative ways to reduce costs while obtaining environmental benefits. In 2008, The Jones Group completed its first successful lighting retrofit project of our 1250 Forest Parkway location in West Deptford, NJ. Over the course of a year, we realized a 40% reduction in kilowatt consumption that was directly attributed to the replacement of old and inefficient lighting technology as well as the addition of motion sensors in the warehouse and offices.
- 26 -
Throughout 2010, as part of an ongoing corporate green effort, we examined opportunities to reduce energy consumption across all of our facilities. Over the past several months, we have continued to upgrade our distribution center fixtures in an effort to improve lighting and safety for the employees, as well as reduce cost and environmental pollution.
During the fourth quarter of 2010, we completed the replacement of 400 watt metal halide lamps and T12 fluorescent fixtures at our West Deptford location with newer and more efficient technology. As a result, our first measurements have yielded a 36% reduction in kilowatt usage. In addition to the reduction in cost and improved quality of lighting in the warehouse, we can expect to achieve positive results with respect to a significant estimated decrease in emissions:
- 5,926,577 pounds of carbon dioxide;
- 9,877,629 grams of sulfur dioxide; and
- 22,916,099 grams of nitrogen dioxide.
During the fourth quarter of 2010, we completed our second retrofit project at our West Deptford, NJ location. We replaced all of the metal halide lamps in our 1245 Forest Parkway distribution center and we expect to achieve similar results to previous projects, including a significant increase in overall lighting in the facility and considerable estimated reduction in emissions:
- 1,919,404 pounds of carbon dioxide;
- 7,165,776 grams of sulfur dioxide; and
- 3,199,007 grams of nitrogen dioxide.
Additionally, we continue to improve lighting at our retail store locations. Lighting retrofits and replacements of heating, ventilation and air conditioning ("HVAC") systems are reducing not only energy use, but financial costs as well. In retail stores, the new lighting fixtures generate less heat, decreasing HVAC energy use. Based on the results of these projects, we are committed to exploring similar opportunities in other distribution centers and retail stores.
Reduce the Use
Our REDUCE THE USE campaign has been put in place to create awareness, to decrease our use of paper and other supplies and to lower the overall costs of paper products. Our U.S.-based non-retail associates are paid electronically and can access their pay stubs through a secure web site. This system eliminates the printing of paychecks for employees, saving paper, printing, and shipping costs.
We use filtered-water water coolers in all distribution centers and office locations in our U.S. locations. Further, we use hand dryers in all our U.S. apparel distribution facilities in lieu of paper towels.
Packaging Initiatives
The continued goal and mission of the Jones Green Printed Materials & Packaging Group is to evaluate the current use of paper in our hangtags, shoeboxes, shopping bags and printed collateral to begin to move toward more significant use of recycled, renewable and Forest Stewardship Council-rated materials.
Except for our Robert Rodriguez products, our better apparel brands use paper stock for their hangtags certified by the Forest Stewardship Council ("FSC"). The hangtags are printed with soy-based or water-based inks. In 2010, our denim brands Gloria Vanderbilt and l.e.i. have converted to FSC certified paper stock for their hangtags. This accounts for approximately 75% of our jeanswear units. We are currently looking at FSC options for Robert Rodriguez hangtags.
Shoe boxes for Easy Spirit, Bandolino and Sam & Libby brands are made with 100% recycled materials. Together these brands account for approximately 13 million shoe boxes per year. All other footwear brands use shoe boxes that are 50%-80% post consumer material. We use a high quality, single layered corrugated cardboard instead of double, to reduce cardboard without sacrificing performance or quality.
- 27 -
We have removed silica packs in lieu of recyclable micro-pack anti-mold stickers. We have discontinued the use of UV coatings, and use soy-based inks on our boxes.
We have developed over 100 different shoe box sizes with our supplier to ensure the smallest boxes are used. Additionally, many of our tall shaft boots are folded (when the product is not affected), which can eliminate one-third of the box size.
Nine West boot and bootie boxes were updated in 2010, based on the design adopted in 2009 for Nine West Vintage America Collection. The updated box offers customers the option to forego bags in favor of an innovation in shoebox design, a built-in carrying strap. The updated shoeboxes are a one-piece construction covered by a fold-over lid. The sides run the full length of the box, and the top folds outside the bottom. The folded assembly precludes the need for glue.
Recycling
We have a longstanding practice to recycle where we can in our business processes. For several years, our distribution centers have recycled cardboard and plastic packaging, and our office locations have been recycling paper and purchasing recycled and recycling toner cartridges for printers and copiers. During 2010, we recycled 2,576 tons of cardboard, 52 tons of plastic packaging, 598 tons of wood pallets and 163 tons of miscellaneous waste (including white paper, glass, metal and plastic). In 2010 we began recycling electronic equipment, cell phones and rechargeable batteries, and recycled 61 tons of equipment this year.
ITEM 1A. RISK FACTORS
There are certain risks and uncertainties that could cause actual results and events to differ materially from those anticipated. Risks and uncertainties that could adversely affect us include, without limitation, the following factors.
The apparel, footwear and accessories industries are heavily influenced by general economic cycles that affect consumer spending. A prolonged period of depressed consumer spending would have a material adverse effect on us.
The apparel, footwear and accessories industries have historically been subject to cyclical variations, recessions in the general economy and uncertainties regarding future economic prospects that affect consumer spending habits, which could negatively impact our business. The success of our operations depends on a number of factors impacting discretionary consumer spending, including general economic conditions, consumer confidence, wages and unemployment, housing prices, consumer debt, interest rates, fuel and energy costs, taxation and political conditions. A continuation or worsening of the current downturn in the economy may affect consumer purchases of our products and adversely impact our growth and profitability.
The current state of the economy and the tightening of commercial credit markets may impair our ability to obtain capital on favorable terms.
We rely on our revolving credit facilities for backing the issuance of trade letters of credit and other supply chain purposes, and also from time to time for cash borrowings for working capital and general corporate purposes. Our current $650 million revolving credit facility matures on May 13, 2015. The loss of the use of this facility or the inability to replace this facility when it expires could materially impair our ability to purchase product from our network of independent foreign manufacturers. In addition, considering the uncertainties of the present economic environment, it is possible, in general, that one or more committed lenders would not meet its obligations to lend to borrowers and there is no assurance we would be able to replace any such lender.
- 28 -
We may not be able to respond to changing fashion and retail trends in a timely manner, which could have a material adverse effect on us.
The apparel, footwear and accessories industries have historically been subject to rapidly changing fashion trends and consumer preferences. We believe that our success is largely dependent on our ability to anticipate and respond promptly to changing consumer demands and fashion trends in the design, styling and production of our products and in the merchandising and pricing of products in our retail stores. If we do not gauge consumer needs and fashion trends and respond appropriately, then consumers may not purchase our products. This would result in reduced sales and profitability and in excess inventories, which would have a material adverse effect on us.
We believe that consumers in the United States are shopping less in department stores (our traditional distribution channel) and more in other channels, such as specialty shops and mid-tier locations where value is perceived to be higher. In response, our strategy involves adding new distribution channels, increasing investment in our core brands by focusing on design, quality and value and implementing new and enhanced retail systems. Despite our efforts to respond to these trends, there can be no assurance that these trends will not have a material adverse effect on us.
The loss of or a significant reduction of business with any of our largest customers would have a material adverse effect on us.
Our ten largest customer groups, principally department stores, accounted for approximately 55% of revenues in 2010. Macy's, Inc. accounted for approximately 20% of our 2010 gross revenues.
We believe that purchasing decisions are generally made independently by department store units within a customer group. There has been a trend, however, toward more centralized purchasing decisions. As such decisions become more centralized, the risk to us of such concentration increases. A decision by the controlling owner of a customer group of department stores to modify those customers' relationships with us (for example, decreasing the amount of product purchased from us, modifying floor space allocated to apparel in general or our products specifically, or focusing on promotion of private label products rather than our products) could have a material adverse effect on us. Furthermore, we believe a trend exists among our major customers to concentrate purchasing among a narrowing group of vendors. To the extent any of our key customers reduces the number of vendors and consequently does not purchase from us, this would have a material adverse effect on us.
In the future, retailers may have financial problems or consolidate, undergo restructurings or reorganizations, or realign their affiliations, any of which could further increase the concentration of our customers. The loss of any of our largest customers, or the bankruptcy or material financial difficulty of any large customer, would have a material adverse effect on us. We do not have long-term contracts with any of our customers, and sales to customers generally occur on an order-by-order basis. As a result, customers can terminate their relationships with us at any time or under certain circumstances cancel or delay orders.
The apparel, footwear and accessories industries are highly competitive. Any increased competition could result in reduced sales or prices, or both, which could have a material adverse effect on us.
Apparel, footwear and accessories companies face competition on many fronts, including the following:
- establishing and maintaining favorable brand recognition;
- developing products that appeal to consumers;
- pricing products appropriately; and
- obtaining access to retail outlets and sufficient floor space.
There is intense competition in the sectors of the apparel, footwear and accessories industries in which we participate. We compete with many other manufacturers and retailers, some of which are
- 29 -
larger and have greater resources than we do. Any increased competition could result in reduced sales or prices, or both, which could have a material adverse effect on us.
We compete primarily on the basis of fashion, price and quality. We believe our competitive advantages include our ability to anticipate and respond quickly to changing consumer demands, our brand names and range of products and our ability to operate within the industries' production and delivery constraints. Furthermore, our established brand names and relationships with retailers have resulted in a loyal following of customers.
We believe that, during the past few years, major department stores and specialty retailers have been increasingly sourcing products from suppliers who are well capitalized or have established reputations for delivering quality merchandise in a timely manner. However, there can be no assurance that significant new competitors will not develop in the future.
We also provide design and manufacturing resources to several of our wholesale customers to develop product lines to be sold under their own private labels. These and other private label lines compete directly with our product lines and may receive more prominent positioning on the retail floor by department stores. While this creates more competition, we believe that national brands are often preferred by the consumer.
The loss of key personnel could disrupt our operations and our ability to successfully execute our strategies.
Our executive officers and other members of senior management have substantial experience and expertise in our business. Our success depends to a significant extent both upon the continued services of these individuals as well as our ability to attract, hire, motivate and retain additional talented and highly qualified management in the future. Competition for key executives in the apparel, footwear and accessories industries is intense, and our operations and the execution of our business strategies could be adversely affected if we cannot attract and retain qualified executives and other key personnel.
Our reliance on independent manufacturers could cause delay and damage our reputation and customer relationships.
We rely upon independent third parties for the manufacture of our products. A manufacturer's failure to ship products to us in a timely manner or to meet the required quality standards could cause us to miss the delivery date requirements of our customers for those items. The failure to make timely deliveries may drive customers to cancel orders, refuse to accept deliveries or demand reduced prices, any of which could have a material adverse effect on us. This could damage our reputation. We do not have long-term written agreements with any of our third party manufacturers. As a result, any of these manufacturers may unilaterally terminate their relationships with us at any time.
Although we have an active program to train our independent manufacturers in, and monitor their compliance with, our labor and other factory standards, any failure by those manufacturers to comply with our standards or any other divergence in their labor or other practices from those generally considered ethical in the United States and the potential negative publicity relating to any of these events could materially harm us and our reputation.
The extent of our foreign operations and contract manufacturing may adversely affect our domestic business.
Nearly all of our products are manufactured outside of North America. The following may adversely affect foreign operations:
- political instability in countries where contractors and suppliers are located;
- imposition of regulations and quotas relating to imports;
- imposition of duties, taxes and other charges on imports;
- significant fluctuation of the value of the dollar against foreign currencies;
- labor shortages in countries where contractors and suppliers are located; and
- restrictions on the transfer of funds to or from foreign countries.
- 30 -
As a result of our foreign operations, our domestic business is subject to the following risks:
- a reduction in available manufacturing capacity, resulting from the closing of foreign factories that have experienced substantial declines in orders;
- uncertainties of sourcing associated with an environment in which general quota has been eliminated on apparel products pursuant to the World Trade Organization Agreement;
- reduced manufacturing flexibility because of geographic distance between us and our foreign manufacturers, increasing the risk that we may have to mark down unsold inventory as a result of misjudging the market for a foreign-made product;
- increases in manufacturing costs in the event of a decline in the value of the United States dollar against major world currencies, particularly the Chinese Yuan, and higher labor and commodity costs being experienced by our foreign manufacturers in China; and
- violations by foreign contractors of labor and wage standards and resulting adverse publicity.
Fluctuations in the price, availability and quality of raw materials could cause delay and increase costs.
Fluctuations in the price, availability and quality of the fabrics or other raw materials used by us in our manufactured apparel and in the price of materials used to manufacture our footwear and accessories could have a material adverse effect on our cost of sales or our ability to meet our customers' demands. The prices for such fabrics depend largely on the market prices for the raw materials used to produce them, particularly cotton, leather and synthetics. The price and availability of such raw materials may fluctuate significantly, depending on many factors, including crop yields and weather patterns. In the future, we may not be able to pass all or a portion of such higher raw materials prices on to our customers.
Difficulties in implementing new computer systems and software could impact our ability to design, produce and ship our products on a timely basis.
We continually improve and upgrade our computer systems and software and are in the process of implementing the SAP Apparel and Footwear Solution as our core operational and financial system. The implementation of the SAP Apparel and Footwear Solution software, which began at select locations in November 2006, is a key part of our ongoing efforts to eliminate redundancies and enhance our overall cost structure and margin performance. Difficulties migrating existing systems to new software could impact our ability to design, produce and ship our products on a timely basis.
The loss or infringement of our trademarks and other proprietary rights could have a material adverse effect on us.
We believe that our trademarks and other proprietary rights are important to our success and competitive position. Accordingly, we devote substantial resources to the establishment and protection of our trademarks on a worldwide basis. There can be no assurances that such actions taken to establish and protect our trademarks and other proprietary rights will be adequate to prevent imitation of our products by others or to prevent others from seeking to block sales of our products as violative of their trademarks and proprietary rights. Moreover, there can be no assurances that others will not assert rights in, or ownership of, our trademarks and other proprietary rights or that we will be able to successfully resolve such conflicts. In addition, the laws of certain foreign countries may not protect proprietary rights to the same extent as do the laws of the United States. The loss of such trademarks and other proprietary rights, or the loss of the exclusive use of such trademarks and other proprietary rights, could have a material adverse effect on us. Any litigation regarding our trademarks could be time-consuming and costly.
Any inability to identify acquisition candidates (or to integrate acquired businesses successfully) could have a material effect on our future growth.
A significant part of our historical growth has depended on our ability to identify acquisition candidates and, in a competitive environment for such acquisitions, acquire such businesses on reasonable financial and other terms. Difficulties in integrating the organizations and operations of any
- 31 -
acquired businesses into our existing organization and operations could have a material adverse effect on us and could damage our reputation.
We rely on our licensing partners to preserve the value of our brands.
During 2010, $48.3 million of our revenues were derived from licensing royalties. Although we generally have significant control over our licensees' products and advertising, we rely on our licensees for, among other things, operational and financial controls over their businesses. Failure of our licensees to successfully market licensed products or our inability to replace existing licensees, if necessary, could adversely affect our revenues, both directly from reduced royalties received and indirectly from reduced sales of our other products. Risks are also associated with a licensee's ability to:
- obtain capital;
- manage its labor relations;
- maintain relationships with its suppliers;
- manage its credit risk effectively; and
- maintain relationships with its customers.
In addition, we rely on our licensees to help preserve the value of our brands. Although we make every attempt to protect our brands through, among other things, approval rights over design, production processes and quality, packaging, merchandising, distribution, advertising and promotion of our licensed products, we cannot completely control the use of our brands by our licensees. The misuse of a brand by a licensee could have a material adverse effect on that brand and on us.
We have entered into license agreements to use the trademarks of others. Loss of a license could have an adverse effect on us.
Our business strategy is based on offering our products in variety of brands, channels and price points. This strategy is designed to provide stability should market trends shift. As part of this strategy we license the names and brands of recognized designers and celebrities, including Givenchy, Dockers(R), Rachel Roy, Jessica Simpson, Brian Atwood and Andrew Marc. In entering into these license agreements, we target our products towards certain market segments based on consumer demographics, design, suggested pricing and channel of distribution in order to minimize competition with our own brands and maximize profitability. If any of our licensors determines to introduce similar products under similar brand names or otherwise change the parameters of design, pricing, distribution or target market, we could experience a significant downturn in that brand's business, adversely affecting our sales and profitability. In addition, as products may be personally associated with these designers and celebrities, our sales of those products could be materially and adversely affected if any of those individual's images, reputations or popularity were to be negatively impacted.
ITEM 1B. UNRESOLVED STAFF COMMENTS
Not applicable.
- 32 -
ITEM 2. PROPERTIES
The general location, use and approximate size of our principal properties are set forth below:
Location
| Owned/Leased
| Use
| Approximate Area
in Square Feet (1)(2)
|
| Bristol, Pennsylvania | leased | Administrative and computer services | 172,600 |
| New York, New York | leased | Administrative, executive and sales offices | 617,000 |
| Vaughan, Canada | leased | Administrative offices and distribution warehouse | 125,000 |
| Lawrenceburg, Tennessee | owned | Distribution warehouses | 1,223,800 |
| South Hill, Virginia | leased | Distribution warehouses | 823,040 |
| White Plains, New York | leased | Administrative offices | 132,200 |
| West Deptford, New Jersey | leased | Distribution warehouses | 988,400 |
_________________
(1) Including mezzanine where applicable.
(2) Excludes subleased square footage.
We sublease a 234,000 square foot office building in White Plains, New York to an independent company. This sublease ends on February 28, 2012, and the sublessee has informed us that it will vacate the property at the end of the sublease. Our lease of the building runs until February 1, 2022.
We also sublease certain office space totaling 43,200 square feet in New York, New York to several independent companies.
We lease approximately 715,250 square feet of warehouse facilities in Goose Creek, South Carolina which are currently subleased to an independent company.
We lease approximately 952,000 square feet of warehouse facilities in Socorro, Texas that are currently not in use. Our lease of these facilities runs until September 14, 2011.
Our retail stores are leased pursuant to long-term leases, typically five to seven years for apparel and footwear outlet stores and ten years for footwear and accessories and apparel specialty stores. Certain leases allow us to terminate our obligations after a predetermined period (generally one to three years) in the event that a particular location does not achieve specified sales volume, and some leases have options to renew. Many leases include clauses that provide for contingent payments based on sales volumes, and many leases contain escalation clauses for increases in operating costs and real estate taxes.
We believe that our existing facilities are well maintained, in good operating condition and that our existing and planned facilities will be adequate for our operations for the foreseeable future.
ITEM 3. LEGAL PROCEEDINGS
We have been named as a defendant in various actions and proceedings arising from our ordinary business activities. Although the amount of any liability that could arise with respect to these actions cannot be accurately predicted, in our opinion, any such liability will not have a material adverse financial effect on us.
- 33 -
EXECUTIVE OFFICERS OF THE REGISTRANT
Our executive officers are as follows:
| Name | Age | Office |
| Wesley R. Card | 63 | Chief Executive Officer |
| Richard Dickson | 42 | President and Chief Executive Officer - Branded Businesses |
| Ira M. Dansky | 65 | Executive Vice President, General Counsel and Secretary |
| John T. McClain | 49 | Chief Financial Officer |
| Christopher R. Cade | 43 | Executive Vice President, Chief Accounting Officer and Controller |
Mr. Card was named Chief Executive Officer on July 12, 2007. Mr. Card was also our President from July 12, 2007 to February 7, 2010. Prior to July 12, 2007, Mr. Card had been our Chief Operating Officer since March 2002. He had also been appointed Chief Financial Officer in March 2007, a position he previously held from 1990 to March 2006.
Mr. Dickson was named President and Chief Executive Officer - Branded Businesses on February 8, 2010. Prior to joining us, Mr. Dickson served as General Manager and Senior Vice President, Barbie at Mattel, Inc. from September 2008 to February 2010, as Senior Vice President, Marketing, Media & Entertainment Worldwide, Mattel Brands from August 2005 to September 2008 and as Senior Vice President, Mattel Brands Consumer Products from May 2003 to August 2005.
Mr. Dansky has been our General Counsel since 1996 and our Secretary since January 2001. He was elected an Executive Vice President in March 2002.
Mr. McClain became our Chief Financial Officer on July 16, 2007. Prior to joining us, Mr. McClain served as Chief Accounting Officer of Avis Budget Group, Inc. (formerly Cendant Corporation), a position he assumed in July 2006. From 1999 to July 2006, Mr. McClain served as Senior Vice President, Finance and Corporate Controller for Cendant Corporation.
Mr. Cade was named Executive Vice President, Chief Accounting Officer and Controller on December 17, 2007. Prior to joining us, Mr. Cade served as Senior Vice President, Chief Accounting Officer and Controller of Realogy Corporation (formerly Cendant Corporation), a position he assumed in August 2006. From June 2004 through July 2006, Mr. Cade served as Vice President, Corporate Finance, of Cendant Corporation.
- 34 -
PART II
ITEM 5. MARKET FOR REGISTRANT'S COMMON EQUITY, RELATED STOCKHOLDER MATTERS AND ISSUER PURCHASES OF EQUITY SECURITIES
| First
Quarter | Second
Quarter | Third
Quarter | Fourth
Quarter |
| Price range of common stock: | | | | |
| 2010 | | | | |
| High | $19.45 | $24.72 | $20.15 | $20.82 |
| Low | $14.19 | $14.90 | $13.72 | $13.05 |
| 2009 | | | | |
| High | $6.40 | $11.69 | $19.09 | $19.74 |
| Low | $2.39 | $4.71 | $9.17 | $15.90 |
| Dividends paid per share of common stock: | | | | |
| 2010 | $0.05 | $0.05 | $0.05 | $0.05 |
| 2009 | $0.05 | $0.05 | $0.05 | $0.05 |
Our common stock is traded on the New York Stock Exchange under the symbol "JNY." The above figures set forth, for the periods indicated, the high and low sale prices per share of our common stock as reported on the New York Stock Exchange Composite Tape. The last reported sale price per share of our common stock on February 10, 2011 was $13.31, and on that date there were 610 holders of record of our common stock. However, many shares are held in "street name;" therefore, the number of holders of record may not represent the actual number of shareholders.
Annual CEO Certification
The Annual CEO Certification required by Section 303A.12(a) of the New York Stock Exchange Listed Company Manual was submitted to the New York Stock Exchange on May 24, 2010.
Issuer Purchases of Equity Securities
The following table sets forth the repurchases of our common stock for the fiscal quarter ended December 31, 2010.
Issuer Purchases of Equity Securities
| Period | (a) Total Number of Shares (or Units) Purchased | (b) Average Price Paid per Share (or Unit) | (c) Total Number of Shares (or Units) Purchased as Part of Publicly Announced Plans or Programs | (d) Maximum Number (or Approximate Dollar Value) of Shares (or Units) that May Yet Be Purchased Under the Plans or Programs |
October 3, 2010 to
October 30, 2010 | 140,000 | $14.51 | 140,000 | $302,100,610 |
October 31, 2010 to
November 27, 2010 | 600,000 | $14.45 | 600,000 | $293,430,350 |
November 28, 2010 to
December 31, 2010 | - | - | - | $293,430,350 |
| Total | 740,000 | $14.46 | 740,000 | $293,430,350 |
- 35 -
Comparative Performance
The SEC requires us to present a chart comparing the cumulative total stockholder return on our common stock with the cumulative total stockholder return of (i) a broad equity market index and (ii) a published industry index or peer group. The following chart compares the performance of our common stock with that of the S&P 500 Composite Index and the S&P 500 Apparel, Accessories & Luxury Goods Index, assuming an investment of $100 on December 31, 2005 in each of our common stock, the stocks comprising the S&P 500 Composite Index and the stocks comprising the S&P 500 Apparel, Accessories & Luxury Goods Index and the reinvestment of dividends.
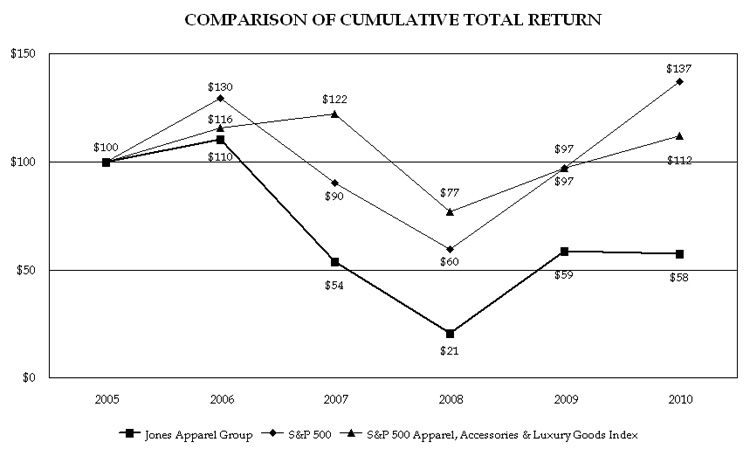
- 36 -
ITEM 6. SELECTED FINANCIAL DATA
The following financial information is qualified by reference to, and should be read in conjunction with, our Consolidated Financial Statements and Notes thereto and "Management's Discussion and Analysis of Financial Condition and Results of Operations" contained elsewhere in this Report. The selected consolidated financial information presented below is derived from our audited Consolidated Financial Statements for each of the five years in the period ended December 31, 2010. On September 6, 2007, we sold Barneys. The results of operations of Barneys have been reported as discontinued operations for all applicable periods presented.
(All amounts in millions except per share data)
| Year Ended December 31, | | 2010 | | | 2009 | | | 2008 | | | 2007 | | | 2006 | |
| Income Statement Data | | | | | | | | | | | | | | | |
| Net sales | $ | 3,593.5 | | $ | 3,279.7 | | $ | 3,562.6 | | $ | 3,793.3 | | $ | 4,014.8 | |
| | Licensing income | | 48.3 | | | 46.8 | | | 52.1 | | | 52.0 | | | 51.1 | |
| | Other revenues | | 0.9 | | | 0.9 | | | 1.7 | | | 3.2 | | | 21.1 | |
| | Total revenues | | 3,642.7 | | | 3,327.4 | | | 3,616.4 | | | 3,848.5 | | | 4,087.0 | |
| Cost of goods sold | | 2,387.2 | | | 2,181.5 | | | 2,440.2 | | | 2,609.1 | | | 2,674.2 | |
| Gross profit | | 1,255.5 | | | 1,145.9 | | | 1,176.2 | | | 1,239.4 | | | 1,412.8 | |
| | Selling, general and administrative expenses | | 1,073.0 | | | 1,008.7 | | | 1,069.2 | | | 1,100.4 | | | 1,096.3 | |
| Loss on sale of Polo Jeans Company business | | - | | | - | | | - | | | - | | | 45.1 | |
| Trademark impairments | | 37.6 | | | 28.7 | | | 25.2 | | | 88.0 | | | 50.2 | |
| Goodwill impairment | | - | | | 120.6 | | | 813.2 | | | 78.0 | | | 441.2 | |
| Operating income (loss) | | 144.9 | | | (12.1 | ) | | (731.4 | ) | | (27.0 | ) | | (220.0 | ) |
| | Interest income | | 1.5 | | | 2.8 | | | 7.5 | | | 3.7 | | | 3.5 | |
| Interest expense and financing costs | | 60.4 | | | 55.6 | | | 49.1 | | | 51.5 | | | 50.5 | |
| Loss and costs associated with repurchase of 4.250% Senior Notes | | - | | | 1.5 | | | - | | | - | | | - | |
| Gain on sale of stock in Rubicon Retail Limited | | - | | | - | | | - | | | - | | | 17.4 | |
| Gain on sale of interest in Australian joint venture | | - | | | - | | | 0.8 | | | 8.2 | | | - | |
| | Equity in (loss) earnings of unconsolidated affiliates | | (0.9 | ) | | (3.7 | ) | | (0.7 | ) | | 8.1 | | | 4.5 | |
| | Income (loss) from continuing operations before provision (benefit) for income taxes | | 85.1 | | | (70.1 | ) | | (772.9 | ) | | (58.5 | ) | | (245.1 | ) |
| Provision (benefit) for income taxes (1) | | 30.7 | | | 16.2 | | | (6.6 | ) | | (104.4 | ) | | (70.1 | ) |
| Income (loss) from continuing operations | | 54.4 | | | (86.3 | ) | | (766.3 | ) | | 45.9 | | | (175.0 | ) |
| | Income from discontinued operations, net of tax (2) | | - | | | - | | | 0.9 | | | 265.2 | | | 29.0 | |
| | Cumulative effect of change in accounting for share-based payments, net of tax | | - | | | - | | | - | | | - | | | 1.9 | |
| | Net income (loss) | | 54.4 | | | (86.3 | ) | | (765.4 | ) | | 311.1 | | | (144.1 | ) |
| | Less: income attributable to noncontrolling interest | | 0.6 | | | 0.3 | | | - | | | - | | | - | |
| | Income (loss) attributable to Jones | $ | 53.8 | | $ | (86.6 | ) | $ | (765.4 | ) | $ | 311.1 | | $ | (144.1 | ) |
| Per Share Data | | | | | | | | | | | | | | | |
| Basic earnings (loss) per share | | | | | | | | | | | | | | | |
| | | Income (loss) from continuing operations attributable to Jones | $ | 0.63 | | $ | (1.02 | ) | $ | (9.05 | ) | $ | 0.45 | | $ | (1.57 | ) |
| | Income from discontinued operations attributable to Jones | | - | | | - | | | 0.01 | | | 2.62 | | | 0.26 | |
| | | Cumulative effect of change in accounting principle | | - | | | - | | | - | | | - | | | 0.02 | |
| | Basic earnings (loss) per share attributable to Jones | $ | 0.63 | | $ | (1.02 | ) | $ | (9.04 | ) | $ | 3.07 | | $ | (1.29 | ) |
| Diluted earnings (loss) per share | | | | | | | | | | | | | | | |
| | | Income (loss) from continuing operations attributable to Jones | $ | 0.62 | | $ | (1.02 | ) | $ | (9.05 | ) | $ | 0.45 | | $ | (1.57 | ) |
| | Income from discontinued operations attributable to Jones | | - | | | - | | | 0.01 | | | 2.58 | | | 0.26 | |
| | | Cumulative effect of change in accounting principle | | - | | | - | | | - | | | - | | | 0.02 | |
| | Diluted earnings (loss) per share attributable to Jones | $ | 0.62 | | $ | (1.02 | ) | $ | (9.04 | ) | $ | 3.03 | | $ | (1.29 | ) |
| | Dividends declared per share | $ | 0.20 | | $ | 0.20 | | $ | 0.56 | | $ | 0.56 | | $ | 0.50 | |
| | Weighted average common shares outstanding | | | | | | | | | | | | | | | |
| | | Basic | | 82.1 | | | 81.7 | | | 82.9 | | | 99.9 | | | 110.6 | |
| | | Diluted | | 82.6 | | | 81.7 | | | 82.9 | | | 101.3 | | | 110.6 | |
- 37 -
| December 31, | | 2010 | | | 2009 | | | 2008 | | | 2007 | | | 2006 | |
| Balance Sheet Data | | | | | | | | | | | | | | | |
| Working capital | $ | 719.4 | | $ | 741.1 | | $ | 693.6 | | $ | 898.5 | | $ | 984.2 | |
| Total assets | | 2,332.4 | | | 2,025.0 | | | 2,427.5 | | | 3,236.6 | | | 3,801.1 | |
| Short-term debt and current portion of long-term debt and capital lease obligations | | 1.8 | | | 2.6 | | | 253.1 | | | 4.8 | | | 104.1 | |
| Long-term debt, including capital lease obligations | | 535.1 | | | 526.4 | | | 528.9 | | | 777.7 | | | 785.1 | |
| Total equity (3) | | 1,138.3 | | | 1,092.5 | | | 1,182.2 | | | 1,996.8 | | | 2,211.6 | |
| (1) | As a result of the capital gain generated by the sale of Barneys, in 2007 we reversed a $107.7 million deferred tax valuation allowance previously created from capital loss carryforwards that we had not expected to be able to utilize. The reversal of the tax valuation allowance has been recorded in income from continuing operations, as the creation of the deferred tax valuation allowance was recorded in continuing operations in 2006 upon the sale of our Polo Jeans Company business. |
| (2) | On September 6, 2007, we sold Barneys. The results of operations of Barneys have been reported as discontinued operations for all periods presented. The 2007 amount includes an after-tax gain of $254.2 million from the sale. In 2008, we reached final settlement on certain liabilities remaining from the sale, resulting in an additional after-tax gain of $0.9 million. |
| (3) | The decreases between 2006 and 2009 are primarily the result of the impairments of goodwill and indefinite-lived trademarks. |
- 38 -
ITEM 7. MANAGEMENT'S DISCUSSION AND ANALYSIS OF FINANCIAL CONDITION AND RESULTS OF OPERATIONS
The following discussion provides information and analysis of our results of operations from 2008 through 2010, and our liquidity and capital resources. The following discussion and analysis should be read in conjunction with our Consolidated Financial Statements included elsewhere herein.
Executive Overview
We design, contract for the manufacture of and market a broad range of women's collection sportswear, suits and dresses, casual sportswear and jeanswear for women and children, women's footwear and accessories, and men's jeanswear. We sell our products through a broad array of distribution channels, including better specialty and department stores and mass merchandisers, primarily in the United States and Canada. We also operate our own network of retail and factory outlet stores and several e-commerce web sites. In addition, we license the use of several of our brand names to select manufacturers and distributors of women's and men's apparel and accessories worldwide.
During 2010, the following significant events took place:
- in January 2010, we announced that GLO jeans will be carried exclusively at Kmart stores nationwide;
- in January 2010, we announced that we entered into an exclusive licensing agreement with VCJS LLC ("VCJS") to design, develop, produce and distribute Jessica Simpson jeanswear under the Jessica Simpson Collection;
- on February 4, 2010, we announced that we had acquired Moda Nicola International, LLC ("Moda"), owner of the Robert Rodriguez Collection, a privately held designer, marketer and wholesaler of women's contemporary eveningwear and sportswear;
- on May 20, 2010, we announced that our jeanswear division is entering the menswear market and had entered into an exclusive licensing and distribution agreement with G-III Apparel Group, Ltd. for Andrew Marc men's jeanswear;
- on June 2, 2010, we announced that we had acquired a 55% interest in Stuart Weitzman Holdings, LLC ("SWH"), a privately-held designer and manufacturer of women's salon footwear and accessories under the Stuart Weitzman label, pursuant to an acquisition agreement we entered into on May 6, 2010, which provides for our acquisition of the remaining 45% interest on December 31, 2012;
- on June 29, 2010, we announced an amendment and extension of our existing $650 million senior credit facility to provide for a decrease in fees and interest rates to current market rates and to extend the maturity date to May 13, 2015;
- on July 26, 2010, we announced that we had entered into an exclusive, world-wide license agreement with Inter Parfums USA, LLC, a wholly-owned subsidiary of Inter Parfums, Inc. for the creation, production, marketing and global distribution of women's fragrances under the Nine West brand;
- on August 31, 2010, we announced that we had entered into an exclusive licensing agreement with Brian Atwood to create, produce, market and distribute B Brian Atwood, a new footwear and accessory line that will be the contemporary counterpart to Brian Atwood's high-end, luxury shoe business; and
- on December 6, 2010, we announced that we had amended our exclusive licensing agreement with VCJS to add the design, development, production and distribution of Jessica Simpson Sportswear under the Jessica Simpson Collection.
Trends
The current economic environment has generally resulted in lower consumer confidence. This trend may lead to reduced consumer spending, which would affect our net sales and our future profitability. Therefore, we have taken aggressive cost reduction actions during the past several years to address the uncertainty posed by economic conditions and to protect our future profitability. We have recently completed major initiatives to simplify our distribution systems. At December 31, 2010, we had two primary distribution systems (compared to four at the end of 2007), six distribution centers plus six third-party logistics locations (compared to 11 distribution centers and three third-party logistics locations at the end of 2007) and one customer service location (compared to four at the end of 2007). We intend to
- 39 -
seek additional opportunities to reduce distribution and operational costs while further improving the speed to market of our products. For further information, see "Accrued Restructuring Costs" in Notes to Consolidated Financial Statements.
We believe that several significant trends are occurring in the apparel, footwear and accessories industry. We believe the recent general increase in commodity, labor and transportation costs that we have experienced may continue into the future. We may be limited in our ability to increase our selling prices to offset these increases. Should the consumer not accept higher retail prices for our products, our margins could be adversely affected.
We believe a trend exists among our major customers to expand the differentiation of their offerings and to achieve strategic advantages over competitors by devoting more resources to the development of exclusive products - whether products that the retailer designs under brands that it owns (private labels) or products produced exclusively for the retailer by national brand manufacturers. Retailers are placing more emphasis on developing their brand images and building strong images for their private label merchandise. Exclusive brands, as the term implies, are only available from a specific retailer, and thus customers loyal to these brands can only find them in the stores of that retailer. We have responded to this trend by leveraging our design, production and marketing capabilities to develop and provide private label products for certain customers and to provide products under certain of our brands exclusively to select customers, such as providing l.e.i. products exclusively to Walmart, Rachel Rachel Roy products exclusively to Macy's and GLO products exclusively to Kmart. While the private label lines compete directly with our product lines and may receive more prominent positioning on the retail floor by department stores, creating more competition, we believe that national brands are often preferred by the consumer.
Furthermore, we believe a trend exists among our major customers to concentrate purchasing among a narrowing group of vendors. In the future, retailers may have financial problems or continue to consolidate, undergo restructurings or reorganizations, or realign their affiliations, any of which could increase the concentration of our customers. We attempt to minimize our credit risk from our concentration of customers by closely monitoring accounts receivable balances and shipping levels and the ongoing financial performance and credit status of our customers.
Consumers are increasing their purchasing of apparel, footwear and accessories through e-commerce web sites. Through our www.jny.com, www.ninewest.com, www.stuartweitzman.com, www.easyspirit.com, www.bandolino.com, www.anneklein.com and www.rachelroy.com web sites, we market either footwear and accessories, apparel or a combination of these products, primarily under their respective brand names. The selection of products is substantially consistent with the product offerings in our corresponding retail store concepts. Our e-commerce systems allow us to fulfill customer orders from inventory at our retail store locations if the items are not available at our distribution center.
On January 1, 2005, the World Trade Organization's 148 member nations lifted all quotas on apparel and textiles. As a result, all textiles and textile apparel manufactured in a member nation and exported after January 1, 2005 are no longer subject to quota restrictions. A special safeguard provision that had provided the U.S. with an additional four years beyond January 1, 2005 to apply quotas on Chinese imports of textiles expired on December 31, 2008. The lifting of quotas and expiration of safeguard provisions allows retailers, apparel firms and others to import unlimited quantities of apparel and textile items from China, India and other lower-cost countries, which could lead to relatively lower production costs, allow us to improve the quality of our products for a given cost, or allow us to concentrate production in the most efficient markets. In addition, if the prices of the imported goods can be shown to be less than those offered by domestic producers for the same items, the U.S. International Trade Commission may recommend that anti-dumping duties be imposed on those goods. As a result, we are unable to predict the long-term effects of the lifting of quota restrictions and related events on our results of operations.
- 40 -
Retail store closings
We continue to review our retail operations for underperforming locations. As a result of this review, we have decided to close retail locations that no longer provide strategic benefits. During 2009 and 2010, we closed 99 and 191 locations, respectively, and anticipate closing additional locations in 2011. We accrued $4.6 million and $3.0 million of termination benefits and associated employee costs during 2009 and 2010, respectively, for approximately 1,585 employees, including both store employees and administrative support personnel. In connection with our decision to close these stores, we reviewed the associated long-term assets for impairments. As a result of this review, we recorded $23.2 million and $9.0 million of impairment losses in 2009 and 2010, respectively, on leasehold improvements and furniture and fixtures located in the stores to be closed. These costs are reported as selling, general and administrative ("SG&A") expenses in the retail segment.
Acquisitions
On February 4, 2010, we acquired 100% of the membership interests in Moda Nicola International, LLC ("Moda"), a privately-held designer, marketer and wholesaler of women's contemporary eveningwear and sportswear, and owner of the Robert Rodriguez Collection, for $35.7 million. Under the terms of the agreement, we made cash payments of $14.4 million to the selling members of Moda. We deferred $2.5 million of the purchase price, with payment subject to an indemnification holding period as set forth in the acquisition agreement. The selling members of Moda are also entitled to receive future cash payments upon achievement of certain financial targets set within the agreement for the years 2011 through 2014. At the acquisition date, we recorded an acquisition consideration liability for $18.8 million, based on projected revenues and gross margins of the acquired business and a discount factor based on an estimated weighted average cost of capital. Adjustments to this liability are recorded as an SG&A expense in our wholesale better apparel segment. At December 31, 2010, the liability was $22.9 million, with $4.1 million recorded as an SG&A expense during 2010.
We pursued the acquisition of Moda to increase our presence in the contemporary apparel market and to further develop a business portfolio with significant growth opportunities. Moda is reported as part of our wholesale better apparel segment.
On June 2, 2010, we acquired 55% of the membership interests in Stuart Weitzman Holdings, LLC ("SWH"), a privately-held designer and manufacturer of women's salon footwear and accessories under the Stuart Weitzman label. SWH markets its products in fine specialty and department stores worldwide and in its own chain of retail stores in the U.S. and abroad.
Under the terms of the agreement, the acquisition will occur in two stages. We made an initial cash payment of $180.3 million for a 55% interest in SWH. The purchase of the remaining 45% will occur on December 31, 2012. The remaining purchase price will be determined under a formula set forth in the agreement, which is based upon the financial results of SWH from 2010 through 2012. We recorded all SWH's identifiable assets, SWH's liabilities assumed and the noncontrolling interest at fair value under the acquisition method. Due to our obligation to purchase the remaining 45% interest, the noncontrolling interest is classified as a liability, with adjustments to the liability recorded as interest expense. We recorded a liability of $181.8 million for the initial value of the projected payments for the remaining 45% interest, based on probability-weighted projected earnings before interest, taxes, depreciation and amortization (as defined in the agreement) of the acquired business and cash distributions that are required by the agreement to be disbursed for 2010 through 2012, using a discount factor based on an estimated weighted average cost of capital. At December 31, 2010, the fair value of the liability was $191.0 million, with $14.9 million recorded as interest expense and $5.7 million of payments recorded during 2010.
We pursued the acquisition of SWH to increase our presence in the contemporary footwear market and to further develop a business portfolio with significant growth opportunities. SWH's wholesale footwear business is reported in our wholesale footwear and accessories segment, its retail business is reported in our retail segment, and its licensing business is reported in our licensing, eliminations and other segment.
- 41 -
The results of Moda and SWH are included in our results of operations from their respective acquisition dates.
Critical Accounting Policies
Several of our accounting policies involve significant or complex judgements and uncertainties and require us to make certain critical accounting estimates. We consider an accounting estimate to be critical if it requires us to make assumptions that are subjective in nature or are about matters that were highly uncertain at the time the estimate was made. The estimates with the greatest potential effect on our results of operations and financial position include the collectibility of accounts receivable, the recovery value of obsolete or overstocked inventory and the fair values of goodwill, intangible assets with indefinite lives and acquisition consideration liabilities. Estimates related to accounts receivable and inventory affect our wholesale better apparel, wholesale jeanswear, wholesale footwear and accessories and retail segments. Estimates related to goodwill affect our wholesale better apparel and wholesale footwear and accessories segments. Estimates related to intangible assets with indefinite lives affect our licensing, other and eliminations segment.
For accounts receivable, we estimate the net collectibility, considering both historical and anticipated trends of trade discounts and co-op advertising deductions taken by our customers, allowances we provide to our retail customers to flow goods through the retail channels, and the possibility of non-collection due to the financial position of our customers. For inventory, we estimate the amount of goods that we will not be able to sell in the normal course of business and write down the value of these goods to the recovery value expected to be realized through off-price channels. Historically, actual results in these areas have not been materially different than our estimates, and we do not anticipate that our estimates and assumptions are likely to materially change in the future. However, if we incorrectly anticipate trends or unexpected events occur, our results of operations could be materially affected.
Goodwill represents the excess of the purchase price and related costs over the value assigned to net tangible and identifiable intangible assets of businesses acquired. Accounting rules generally require that we test at least annually for possible goodwill impairment. We test our goodwill and our intangible assets with indefinite lives for impairment on an annual basis (during our fourth fiscal quarter) and between annual tests if an event occurs or circumstances change that would more likely than not reduce the fair value of an asset below its carrying value. As a result of the 2008 impairment analysis, we determined that the goodwill balance existing in our wholesale footwear and accessories segment was impaired as a result of decreases in projected revenues, profitability and cash flows for this segment. Accordingly, we recorded an impairment charge of $813.2 million. As a result of the 2009 impairment analysis, we determined that the goodwill balance existing in our retail segment was impaired as a result of decreases in projected revenues, profitability and cash flows for the segment. Accordingly, we recorded an impairment charge of $120.6 million. There were no impairment charges as a result of the 2010 impairment analysis.
We perform our annual impairment test for trademarks during the fourth fiscal quarter of the year. As a result of the 2008, 2009 and 2010 impairment analyses, we recorded trademark impairment charges of $25.2 million, $28.7 million and $37.6 million, respectively, as a result of decreases in projected revenues and cash flows for certain brands. All trademark impairment charges are reported as SG&A expenses in the licensing, other and eliminations segment. For more information, see "Goodwill and Other Intangible Assets" in Notes to Consolidated Financial Statements.
We test both our goodwill and our trademarks for impairment by utilizing discounted cash flow models to estimate their fair values. These cash flow models involve several assumptions. Changes in our assumptions could materially impact our fair value estimates. Assumptions critical to our fair value estimates are: (i) discount rates used to derive the present value factors used in determining the fair value of the reporting units and trademarks; (ii) royalty rates used in our trademark valuations; (iii) projected average revenue growth rates used in the reporting unit and trademark models; and (iv) projected long-term growth rates used in the derivation of terminal year values. These and other assumptions are
- 42 -
impacted by economic conditions and expectations of management and may change in the future based on period-specific facts and circumstances. Based on our latest annual testing, the following table shows the assumptions we used to derive our fair value estimates and the hypothetical additional impairment charge for goodwill and trademarks resulting from a one percentage point unfavorable change in each of our fair value assumptions (dollar amounts in millions).
| | Assumptions
| Effect of one percentage point unfavorable change in:
|
| | Goodwill | Trademarks | Goodwill | Trademarks |
| Discount rates | 13.5% | 13.5% | none | $ 8.9 |
| Royalty rates | -- | 4.0% - 7.0% | -- | $ 24.7 |
| Weighted-average revenue growth rates | 6.6% | 4.4% | none | $ 3.5 |
| Long-term growth rates | 3.0% | 0% - 3.0% | none | $ 6.7 |
At December 31, 2010, we had $161.8 million of goodwill, of which $46.7 million has been assigned to the wholesale better apparel segment and $115.1 has been assigned to the wholesale footwear and accessories segment. We also had $663.7 million of indefinite-lived trademarks. Should the economic conditions and trends (such as reduced consumer spending) deteriorate throughout 2011 and beyond, the fair values of certain trademarks could become impaired. We do not believe the remaining goodwill assigned to the wholesale better apparel segment will be impaired in the foreseeable future as the fair value of the wholesale better apparel segment at December 31, 2010 significantly exceeded the segment's carrying value. The goodwill assigned to the wholesale footwear and accessories segment is the result of the SWH acquisition. Should the operations of SWH fail to achieve projected results, this goodwill could become impaired.
At December 31, 2010, we had a total of $213.9 million accrued for contingent consideration payments relating to the acquisitions of Moda and SWH. These liabilities represent the present value, discounted at our weighted-average cost of capital, of the projected payments based on: (i) for Moda, projected revenues and probability-weighted gross margins for the years 2011 through 2014, and (ii) for SWH, probability-weighted projected earnings before interest, taxes, depreciation and amortization (as defined in the acquisition agreement) for 2010 through 2012. These and other assumptions are impacted by economic conditions and expectations of management and may change in the future based on period-specific facts and circumstances.
Other than the assumptions used in the impairment testing of our goodwill and trademarks, we have not made any material changes to any of our critical accounting estimates in the last three years. Our senior management has discussed the development and selection of our critical accounting estimates with the Audit Committee of our Board of Directors. In addition, there are other items within our financial statements that require estimation, but are not deemed critical as defined above. Changes in estimates used in these and other items could have a material impact on our financial statements.
- 43 -
Results of Operations
Statements of Operations Stated in Dollars and as a Percentage of Total Revenues
(In millions)
| 2010 | | 2009 | | 2008 | |
| Net sales | $ | 3,593.5 | | 98.6 | % | $ | 3,279.7 | | 98.6 | % | $ | 3,562.6 | | 98.5 | % |
| Licensing income | | 48.3 | | 1.4 | | | 46.8 | | 1.4 | | | 52.1 | | 1.4 | |
| Other revenues | | 0.9 | | 0.0 | | | 0.9 | | 0.0 | | | 1.7 | | 0.0 | |
| Total revenues | | 3,642.7 | | 100.0 | | | 3,327.4 | | 100.0 | | | 3,616.4 | | 100.0 | |
| Cost of goods sold | | 2,387.2 | | 65.5 | | | 2,181.5 | | 65.6 | | | 2,440.2 | | 67.5 | |
| Gross profit | | 1,255.5 | | 34.5 | | | 1,145.9 | | 34.4 | | | 1,176.2 | | 32.5 | |
| Selling, general and administrative expenses | | 1,073.0 | | 29.5 | | | 1,008.7 | | 30.3 | | | 1,069.2 | | 29.6 | |
| Trademark impairments | | 37.6 | | 1.0 | | | 28.7 | | 0.9 | | | 25.2 | | 0.7 | |
| Goodwill impairments | | - | | - | | | 120.6 | | 3.6 | | | 813.2 | | 22.5 | |
| Operating income (loss) | | 144.9 | | 4.0 | | | (12.1 | ) | (0.4 | ) | | (731.4 | ) | (20.2 | ) |
| Interest income | | 1.5 | | 0.0 | | | 2.8 | | 0.1 | | | 7.5 | | 0.2 | |
| Interest expense and financing costs | | 60.4 | | 1.7 | | | 55.6 | | 1.7 | | | 49.1 | | 1.4 | |
| Loss and costs associated with repurchase of 4.250% Senior Notes | | - | | - | | | 1.5 | | 0.0 | | | - | | - | |
| Gain on sale of interest in Australian joint venture | | - | | - | | | - | | - | | | 0.8 | | 0.0 | |
| Equity in loss of unconsolidated affiliate | | 0.9 | | 0.0 | | | 3.7 | | 0.1 | | | 0.7 | | 0.0 | |
| Income (loss) from continuing operations before provision (benefit) for income taxes | | 85.1 | | 2.3 | | | (70.1 | ) | (2.1 | ) | | (772.9 | ) | (21.4 | ) |
| Provision (benefit) for income taxes | | 30.7 | | 0.8 | | | 16.2 | | 0.5 | | | (6.6 | ) | (0.2 | ) |
| Income (loss) from continuing operations | | 54.4 | | 1.5 | | | (86.3 | ) | (2.6 | ) | | (766.3 | ) | (21.2 | ) |
| Income from discontinued operations, net of tax | | - | | - | | | - | | - | | | 0.9 | | 0.0 | |
| Net income (loss) | | 54.4 | | 1.5 | | | (86.3 | ) | (2.6 | ) | | (765.4 | ) | (21.2 | ) |
| Less: income attributable to noncontrolling interest | | 0.6 | | 0.0 | | | 0.3 | | 0.0 | | | - | | - | |
| Income (loss) attributable to Jones | $ | 53.8 | | 1.5 | % | $ | (86.6 | ) | (2.6 | %) | $ | (765.4 | ) | (21.2 | %) |
Percentage totals may not add due to rounding.
2010 Compared with 2009
Revenues. Total revenues for 2010 were $3.6 billion, compared with $3.3 billion for 2009, an increase of 9.5%. Revenues by segment were as follows:
(In millions)
| | 2010 | | | 2009 | | | Increase
(Decrease | ) | Percent
Change |
| Wholesale better apparel | $ | 1,011.9 | | $ | 922.8 | | $ | 89.1 | | 9.7 | % |
| Wholesale jeanswear | | 817.9 | | | 828.9 | | | (11.0 | ) | (1.3 | ) |
| Wholesale footwear and accessories | | 1,066.5 | | | 839.6 | | | 226.9 | | 27.0 | |
| Retail | | 698.1 | | | 689.3 | | | 8.8 | | 1.3 | |
| Licensing and other | | 48.3 | | | 46.8 | | | 1.5 | | 3.2 | |
| Total revenues | $ | 3,642.7 | | $ | 3,327.4 | | $ | 315.3 | | 9.5 | % |
Wholesale better apparel revenues increased $89.1 million, primarily due to initial shipments of our J Jones New York, Jessica Simpson and Rachel Roy Signature product lines, shipments of our Rachel Rachel Roy products that were introduced for Fall 2009 and increased shipments of our Jones New York, Jones New York Sport and Anne Klein products due to the performance of these product lines at retail, as well as $17.0 million of revenues for the Robert Rodriguez and Robbi & Nikki product lines acquired through the acquisition of Moda, partially offset by reduced shipments of our discontinued Nine West sportswear product line. The increase in revenues includes a $3.6 million favorable effect of changes in exchange rates between the U.S. and Canadian Dollars.
Wholesale jeanswear revenues decreased $11.0 million. Revenues decreased due to lower shipments of our l.e.i. products to Walmart due to competing new product initiatives and price compression, lower shipments of our Energie product line as a result of product assortment issues and lower shipments of our Erika products, primarily due to repositioning of the product at retail. These decreases were partially offset by increased shipments of our Gloria Vanderbilt products due to the performance of the products at retail and new product extensions.
Wholesale footwear and accessories revenues increased $226.9 million, primarily due to $97.2 million in sales of the acquired Stuart Weitzman product line, increases in our international business due to
- 44 -
improved global economic conditions and product performance, and increased shipments of our Nine West, Easy Spirit, AK Anne Klein and Enzo Angiolini product lines due to product performance and the improved economic conditions compared to the prior year.
Retail revenues increased $8.8 million, primarily due to $31.6 million related to the acquired Stuart Weitzman stores and a 3.6% increase in comparable store sales ($21.7 million) resulting from product performance, partially offset by the closure of underperforming locations. Comparable stores are locations (including e-commerce sites) that have been open for a full year, are not scheduled to close in the current period and are not scheduled for an expansion or downsize by more than 25% or relocation to a different street or mall. We began 2010 with 938 retail locations, had a net decrease of 179 locations during the year and added 44 locations as a result of the SWH acquisition to end the year with 803 locations. Our comparable e-commerce business sales increased 21.7% ($11.1 million), our comparable footwear store sales increased 2.4% ($8.6 million) and our comparable apparel store sales increased 1.1% ($2.0 million). The increase in revenues also included a $4.1 million favorable effect of changes in exchange rates between the U.S. and Canadian Dollars.
Licensing and other revenues increased $1.5 million, primarily due to increased sales volume of our licensees and $0.4 million of SWH licensing revenues.
Gross Profit Margin. The gross profit margins were 34.5% and 34.4% for 2010 and 2009, respectively.
Wholesale better apparel gross profit margins were 34.2% for both 2010 and 2009. Increases due to the addition of higher-margin Robert Rodriguez products and the favorable effect of changes in exchange rates between the U.S. and Canadian Dollars in 2010 were offset by higher product costs and lower recoveries on products sold to off-price retailers.
Wholesale jeanswear gross profit margins were 25.1% and 24.7% for 2010 and 2009, respectively. The increase was primarily due to increased sales of our higher-margin Gloria Vanderbilt products and lower levels of discontinued products in 2010, partially offset by price compression on our Energie, l.e.i. and private label products.
Wholesale footwear and accessories gross profit margins were 26.6% and 26.2% for 2010 and 2009, respectively. The increase was primarily due to the addition of higher-margin Stuart Weitzman products in 2010 as well as additional discounting in 2009 to assist our customers in liquidating excess jewelry inventory due to economic conditions, partially offset by increased product (material and labor) and transportation costs and increased sales in our lower-margin international business.
Retail gross profit margins were 52.0% and 50.4% for 2010 and 2009, respectively. The increase was primarily due to improved performance in our Canadian retail operations and the addition of higher-margin Stuart Weitzman locations, partially offset by increased product and transportation costs and costs to liquidate inventory in our Bandolino footwear and AK Anne Klein apparel retail locations that were closed.
SG&A Expenses. SG&A expenses were $1.1 billion in 2010 and $1.0 billion in 2009.
Wholesale better apparel SG&A expenses increased $19.3 million, primarily due to $14.6 million of expenses added as a result of the Moda acquisition, which includes a $4.1 million fair value adjustment of the related acquisition consideration payable. Our new Jessica Simpson and Andrew Marc product lines added $6.0 million of costs and we recorded $1.1 million of severance costs related to executive management changes in our Canadian business in 2010. The increase was also partially due to a $0.6 million unfavorable effect of changes in exchange rates between the U.S. and Canadian Dollars and $0.4 million of other net cost increases. These increases were offset by $3.4 million of other net cost reductions related to our Canadian operations.
- 45 -
Wholesale jeanswear SG&A expenses decreased $9.7 million, primarily due to a $4.4 million adjustment to accrued lease costs for a closed warehouse, a $3.2 million reduction in administrative costs, a $1.9 million reduction in advertising costs, a $1.1 million reduction in occupancy costs, a $1.0 million reduction in sample costs and $2.2 million of other net cost decreases, partially offset by a $4.1 million increase in charges related to the closure of our Texas warehouse.
Wholesale footwear and accessories SG&A expenses increased $38.9 million, primarily due to $27.9 million of expenses added as a result of the SWH acquisition, a $5.7 million increase in administrative costs, a $5.7 million increase in severance costs in our footwear and accessories businesses (primarily related to executive management changes in our footwear business), a $3.2 million increase in distribution costs due to increased volume, a $2.8 million increase in compensation expenses and a $1.5 million increase in advertising costs. These expenses and cost increases were partially offset by lower restructuring costs in our jewelry business of $3.7 million and $0.3 million of other net cost decreases in the current year. The prior year included $3.9 million related to the bankruptcy of our former United Kingdom footwear licensee.
Retail SG&A expenses decreased $15.9 million, primarily due to operating fewer stores in the current year. Cost reductions included a $17.0 million reduction in asset impairment and restructuring charges as compared with the prior year, an $18.3 million decrease in occupancy costs and a $16.4 million decrease in compensation costs, partially offset by a $7.7 million increase in administrative costs, a $1.5 million unfavorable effect of changes in exchange rates between the U.S. and Canadian Dollars, a $1.3 million increase in professional fees and $2.4 million of other net cost increases. The stores acquired in the SWH acquisition also added $22.9 million of expenses to the current year.
SG&A expenses for the licensing, other and eliminations segment increased $31.7 million, primarily due to a $9.0 million increase in amortization of share-based compensation, an $8.7 million increase in contributions (including contributions to the Sidney Kimmel Comprehensive Cancer Center at Johns Hopkins and to Jones New York In The Classroom and the establishment of an educational assistance fund for the children of our associates), $6.0 million of acquisition costs related to the acquisitions of Moda and SWH, a $4.0 million increase in other compensation-related costs, a $2.6 million impairment of an acquired license and $1.4 million of other cost increases.
Impairment Losses. As a result of our annual trademark impairment analyses, we recorded trademark impairment charges of $37.6 million and $28.7 million in 2010 and 2009, respectively, as a result of decreases in projected revenues for certain brands. As a result of our annual goodwill impairment analyses, we recorded $120.6 million in 2009 as a result of lower projected revenues and profitability of our retail businesses and an increase in the discount rate. For more information, see "Goodwill and Other Intangible Assets" in Notes to Consolidated Financial Statements.
Operating Income (Loss). The resulting operating income for 2010 was $144.9 million, compared with an operating loss of $12.1 million for 2009, due to the factors described above.
Net Interest Expense. Net interest expense increased $6.1 million, the result of $14.9 million of interest recorded on the SWH acquisition consideration liability and a $1.3 million reduction of interest income due to lower average cash balances in 2010, partially offset by the $4.4 million write-off of deferred financing fees in 2009 related to our prior revolving credit line, a $4.0 million reduction of interest related to the repurchase of our 4.250% Senior Notes in 2009 and $1.7 million of other decreases, primarily lower costs related to our secured revolving credit facility.
Income Taxes. The effective income tax rate was 36.1% and (23.1%) for 2010 and 2009, respectively. Excluding the effects of the goodwill and trademark impairments, the effective income tax rates on continuing operations were 36.4% and 35.0% for 2010 and 2009, respectively. The increase is primarily due to the impact of the foreign income tax differential on higher pre-tax income in 2010 compared with 2009.
- 46 -
Net Income (Loss) and Earnings (Loss) Per Share. Net income was $54.4 million in 2010, compared with a net loss of $86.3 million in 2009. Diluted earnings per share for 2010 was $0.62, compared with a diluted loss per share of $1.02 for 2009, with 1.1% more shares outstanding.
2009 Compared with 2008
Revenues. Total revenues for 2009 were $3.3 billion, compared with $3.6 billion for 2008, a decrease of 8.0%. Revenues by segment were as follows:
(In millions)
| | 2009 | | | 2008 | | | Increase
(Decrease | ) | Percent
Change |
| Wholesale better apparel | $ | 922.8 | | $ | 1,098.7 | | $ | (175.9 | ) | (16.0 | %) |
| Wholesale jeanswear | | 828.9 | | | 796.5 | | | 32.4 | | 4.1 | |
| Wholesale footwear and accessories | | 839.6 | | | 938.3 | | | (98.7 | ) | (10.5 | ) |
| Retail | | 689.3 | | | 730.2 | | | (40.9 | ) | (5.6 | ) |
| Licensing and other | | 46.8 | | | 52.7 | | | (5.9 | ) | (11.2 | ) |
| Total revenues | $ | 3,327.4 | | $ | 3,616.4 | | $ | (289.0 | ) | (8.0 | %) |
Wholesale better apparel revenues decreased $175.9 million. Revenues decreased primarily due to reduced shipments of our Anne Klein, Jones New York Sport, Jones New York, Kasper and Jones New York Suit products, primarily resulting from decreased consumer spending as a result of the general economic downturn, and due to reduced shipments of Nine West products, primarily resulting from decreased consumer spending and from the discontinuance of the Nine West sportswear line due to the performance of these products at retail. These decreases were offset by increased shipments of our Evan-Picone suit and dress products as a result of the performance of these products at retail, increases in our private label suit businesses and initial shipments of our Rachel Rachel Roy product line.
Wholesale jeanswear revenues increased $32.4 million. Revenues increased primarily due to increased shipments of our l.e.i. products to Walmart, increased shipments of private-label products due to expansion of private-label programs with several major customers, and increased shipments of our Evan-Picone product line, primarily due to the performance of this product line at retail. These increases were partially offset by reduced shipments of our Energie product line, primarily as a result of the general economic downturn and the performance of these products at retail, and a $57.9 million reduction of shipments of product lines that we are discontinuing or restructuring due to low long-term growth potential (including Jeanstar, Erika, Behold and Grane Girl).
Wholesale footwear and accessories revenues decreased $98.7 million. We experienced a $41.1 million reduction in sales in our international business, primarily due to the global economic conditions in Asia, Canada, Mexico, Turkey, Central America and the bankruptcy of our former United Kingdom licensee. We also experienced decreased orders for our Anne Klein footwear product line and our handbag and accessories products primarily due to decreased consumer spending as a result of the general economic downturn. Orders for footwear and handbag products were negatively impacted by $8.2 million as the result of the bankruptcy of several major customers in 2008, including Goody's Family Clothing, Inc., Mervyn's LLC, Gottschalks Inc. and Boscov's, Inc.
Retail revenues decreased $40.9 million, primarily due to a 4.3% decline in comparable store sales ($28.9 million) resulting from decreased consumer spending relating to current economic conditions, with the balance related to operating fewer stores in 2009. An 8.0% decrease in comparable store sales for our footwear stores ($34.3 million) and a 6.3% decrease in comparable store sales for our apparel stores ($13.3 million) were partially offset by a 60.6% increase in our comparable e-commerce business ($18.7 million). We began 2009 with 1,017 retail locations and had a net decrease of 79 locations to end the year with 938 locations.
Licensing and other revenues decreased $5.9 million, primarily due to reduced sales volume of our licensees.
- 47 -
Gross Profit Margin. The gross profit margin increased to 34.4% in 2009 compared with 32.5% in 2008.
Wholesale better apparel gross profit margins were 34.2% and 31.3% for 2009 and 2008, respectively. The increase was primarily due to better inventory management, the product mix and lower sales to off-price retailers in 2009.
Wholesale jeanswear gross profit margins were 24.7% and 21.9% for 2009 and 2008, respectively. The increase is primarily due to better inventory management, lower levels of off-price sales and the mix of products shipped in 2009, costs in 2008 related to the repositioning of l.e.i. as an exclusive brand for Walmart and the discontinuance of certain other product lines.
Wholesale footwear and accessories gross profit margins were 26.2% and 25.2% for 2009 and 2008, respectively. The increase was primarily due to lower levels of discounting and better inventory management in our footwear business, reduced sales in our lower-margin international business and lower buying agency commissions, partially offset by higher overhead unit costs due to lower volume in our costume jewelry business.
Retail gross profit margins were 50.4% and 49.6% for 2009 and 2008, respectively. The increase was primarily the result of a reduction in promotional activity in our stores due to better inventory management.
SG&A Expenses. SG&A expenses were approximately $1.0 billion in 2009 and $1.1 billion in 2008.
Wholesale better apparel SG&A expenses decreased $17.9 million, primarily due to a $7.8 million decrease in distribution costs due to a lower volume of shipments, a $4.5 million reduction in marketing and advertising costs, a $3.1 million reduction in salaries and benefits from headcount reductions, a $2.6 million decrease in postage costs, a $1.3 million reduction in our provision for doubtful accounts related to bankruptcies of several major customers in the prior period, a $1.2 million reduction in occupancy costs and $0.4 million of other net cost savings, offset by $3.0 million of administrative support cost increases.
Wholesale jeanswear SG&A expenses decreased $16.7 million, primarily due to an $8.6 million decrease in salary and benefit costs due to headcount reductions, a $7.1 million decrease in our provision for doubtful accounts due to the bankruptcies of several customers in the prior period, a $4.6 million decrease in occupancy costs due to the closing of certain facilities, a $2.5 million decrease in depreciation and amortization expenses (due to accelerated depreciation in the prior period relating to discontinued brands) and a $1.2 million reduction in travel and entertainment costs, offset by $3.1 million of higher distribution costs due to higher unit shipments, $3.1 million of net restructuring costs and $1.1 million of other cost increases in 2009.
Wholesale footwear and accessories SG&A expenses decreased $27.5 million, primarily due to a $9.1 million decrease in salary and benefit costs due to headcount reductions, a $5.5 million decrease in advertising costs, a $3.5 million decrease in outside sales force costs, a $3.0 million decrease in distribution costs, a $2.7 million reduction in professional fees, a $2.1 million decrease in product development costs, a $1.6 million decrease in travel costs, a $1.2 million decrease in postage costs and $5.5 million of other cost reductions. These decreases were offset by $3.9 million of costs related to the bankruptcy of our United Kingdom footwear licensee, a net $1.4 million increase in restructuring and severance costs, primarily related to our wholesale jewelry business, and $1.4 million in loss accruals related to certain leased property in 2009.
Retail SG&A expenses increased $2.6 million, primarily due to $28.1 million additional severance costs and asset impairments in 2009, primarily related to the closing of underperforming stores, and a $3.2 million increase in consulting costs, offset by an $8.0 million reduction in depreciation expense, a $7.8 million decrease in salaries and benefits and a $3.4 million decrease in occupancy costs due to operating fewer stores in 2009, a $8.1 million reduction in administrative support costs, and $1.4 million of other cost reductions.
- 48 -
SG&A expenses for licensing, other and eliminations decreased $1.2 million, primarily due to a $3.5 million effect of changes in the exchange rate between the U.S. Dollar and the Canadian Dollar related to foreign tax planning strategies and a $2.4 million decrease in professional fees and outside services, partially offset by a $3.6 million increase in salaries and benefits and $1.1 million of other net cost increases.
Impairment Losses. As a result of our annual trademark impairment analyses, we recorded trademark impairment charges of $28.7 million and $25.2 million in 2009 and 2008, respectively, as a result of decreases in projected revenues for certain brands. As a result of our annual goodwill impairment analyses, we recorded $120.6 million in 2009 as a result of lower projected revenues and profitability of our retail businesses and an increase in the discount rate, and we recorded $813.2 million in 2008 as a result of decreases in projected revenues and profitability for certain footwear and accessory brands. For more information, see "Goodwill and Other Intangible Assets" in Notes to Consolidated Financial Statements.
Operating Loss. The resulting operating loss for 2009 was $12.1 million, compared with a loss of $731.4 million for 2008, due to the factors described above.
Net Interest Expense. Net interest expense was $52.8 million in 2009, compared with $41.6 million in 2008. The increase was the result of: a $4.4 million write-off of deferred financing fees upon the termination of our prior revolving credit facility, compared with $1.1 million of similar charges from modifications to our credit facilities in 2008; lower interest income on our invested cash balances due to overall lower invested balances and lower interest rates in 2009; and higher amortization of deferred financing fees related to the amendment to our prior revolving credit facility on January 5, 2009 and our new secured revolving credit facility, partially offset by lower interest expense related to the 4.250% Senior Notes due 2009 (the "2009 Notes") we repurchased in May 2009.
Income Taxes. The effective income tax rate benefit on continuing operations was (23.1%) and 0.8% for 2009 and 2008, respectively. Excluding the effects of the goodwill and trademark impairments, the effective income tax rates on continuing operations were 35.0% and 33.2% for 2009 and 2008, respectively. The increase is due primarily to a lesser impact of the foreign income tax differential relative to pre-tax income in 2009 than in 2008, offset by a change in the deferred tax balance related to fixed assets.
Net Loss and Loss Per Share. Net loss was $86.3 million in 2009, compared with $765.4 million in 2008. Diluted loss per share for 2009 was $1.02, compared with $9.04 for 2008, on 1.4% fewer shares outstanding.
Liquidity and Capital Resources
Our principal capital requirements have been for working capital needs, capital expenditures, dividend payments, acquisition funding and repurchases of our common stock on the open market. We have historically relied on internally generated funds, trade credit, bank borrowings and the issuance of notes to finance our operations and expansion. As of December 31, 2010, total cash and cash equivalents were $200.8 million, a decrease of $132.6 million from the $333.4 million reported as of December 31, 2009.
We currently fund our operations primarily through cash generated by operating activities, and rely on our revolving credit facility for the issuance of trade letters of credit for the purchases of inventory and for cash borrowings for general corporate purposes as needed.
Cash flows from operating activities provided $141.3 million, $349.0 million and $175.5 million in 2010, 2009 and 2008, respectively.
Net cash provided by operating activities decreased $207.7 million from 2009 to 2010, primarily due to changes in working capital, which offset the higher net income in 2010. The primary changes in components of working capital were to accounts receivable, inventory and accounts payable. The change
- 49 -
in accounts receivable was primarily due to increased revenues and the timing of shipments compared with the prior period. The change in inventory was primarily due to the addition of new brands, higher replenishment inventory levels and the timing of receipts compared with the prior year. The change in accounts payable was primarily due to the timing of inventory payments during the prior period.
Net cash provided by operating activities increased $173.5 million from 2008 to 2009, primarily from changes in working capital. The primary changes in components of working capital were to accounts receivable, inventory and accounts payable. The change in accounts receivable was due to the lower volume of sales in 2009 and the timing of cash collections. The change in inventory was due to better inventory management, the timing of inventory receipts and the liquidation of discontinued product lines. The change in accounts payable was due to the timing of inventory payments and lower expense levels in 2009.
Cash flows from investing activities used $214.3 million, $45.2 million and $84.4 million in 2010, 2009 and 2008, respectively.
Net cash used in investing activities in 2010 funded the acquisition of Moda and SWH, as well as the purchases of equipment and leasehold improvements. Net cash used in investing activities in 2009 funded capital expenditures, primarily for computer systems, and the acquisition of an additional 15% interest in GRI. Net cash used in investing activities in 2008 funded capital expenditures, largely in our retail segment, and the acquisition of our initial 10% interest in GRI. Capital expenditures, which amounted to $41.0 million in 2010, are expected to be approximately $75 to $80 million for 2011, primarily for computer systems, office facilities and retail store remodeling. Although many of the anticipated expenditures for 2011 are discretionary, we believe they are necessary to maintain consistent operating levels. We expect to fund the expenditures from cash generated by operations.
Cash flows from financing activities used $60.1 million in 2010, primarily for a cash distribution of $19.0 million to the former owners of SWH as required by the acquisition agreement, dividends to our common shareholders, repurchases of our common stock and costs related to our secured revolving credit agreement.
Cash flows from financing activities used $310.3 million in 2009, primarily for the repurchase of our 2009 Notes and associated costs and consent fees, costs related to our new secured revolving credit agreement, and the payment of dividends to our common shareholders.
Cash flows from financing activities used $51.4 million in 2008, primarily for the payment of dividends to our common shareholders.
On April 1, 2009, we commenced a cash tender offer to purchase any and all of our outstanding 2009 Notes, as well as a consent solicitation to amend the indenture governing our outstanding 2009 Notes, our 5.125% Senior Notes due 2014 and our 6.125% Senior Notes due 2034 (collectively, the "Notes"). The purpose of the consent solicitation was to receive the consent of holders of at least a majority in principal amount of the Notes outstanding for proposed amendments to the Indenture to provide for a carveout to the lien covenant, for liens incurred in connection with the new senior secured credit facility described above. We received the required consents on April 15, 2009; consequently, the Amendments became operative upon payment of the consent fee to each validly consenting holder of the Notes, and are binding on all holders, including non-consenting holders of Notes.
Under the tender offer, we repurchased a total of $242.5 million of our outstanding 2009 Notes for a payment of $237.7 million, and we paid $12.9 million in consent fees to holders of the Notes and $1.8 million of related costs, resulting in a loss on debt extinguishment of $1.5 million. Of the consent fees paid, a net $7.1 million relates to the remaining outstanding Notes and will be amortized over the life of the remaining related Notes as additional interest expense.
- 50 -
We repurchased 740,000 shares of our common stock during 2010 for $10.7 million. We repurchased no common stock during 2009. As of December 31, 2010, $293.4 million of Board authorized repurchases was still available. We may make additional share repurchases in the future depending on, among other things, market conditions and our financial condition, although any such repurchases will be subject to limitations under our current revolving credit agreement. Our Board of Directors has authorized our common stock repurchases as a tax-effective means to enhance shareholder value and distribute cash to shareholders and, to a lesser extent, to offset the impact of dilution resulting from the issuance of shares of restricted stock and the exercise of employee stock options. In authorizing share repurchase programs, our Board of Directors gives careful consideration to both our projected cash flows and our existing capital resources.
On June 10, 2008, we received a final delivery of 3.2 million shares upon the conclusion of an accelerated stock repurchase ("ASR") program. No cash was required to complete the final delivery of shares. We also received approximately $1.0 million from Goldman as the final settlement of the ASR program, which was recorded as a reduction of the cost of the shares acquired under the ASR.
We have a secured revolving credit agreement expiring on May 13, 2015 (the "Credit Facility") with several lending institutions to borrow an aggregate principal amount of up to $650 million. Up to the entire amount of the Facility is available for cash borrowings, with up to $400 million available for trade letters of credit, up to $50 million available for standby letters of credit, and a subfacility available to our Canadian subsidiaries of up to $25 million for letters of credit and borrowings. Borrowings under the Credit Facility may be used to refinance existing indebtedness and for general corporate purposes in the ordinary course of business. Such borrowings bear interest either based on the alternate base rate, as defined in the Credit Facility, or based on Eurocurrency rates, each with a margin that depends on the availability remaining under the Credit Facility. The Credit Facility contains customary events of default.
Availability under the Credit Facility is determined with reference to a borrowing base consisting of a percentage of eligible inventory, accounts receivable, credit card receivables and licensee receivables, minus reserves determined by the joint collateral agents. At December 31, 2010, we had no cash borrowings and $28.5 million of letters of credit outstanding, and our remaining availability was $444.4 million. If availability under the Credit Facility falls below a stated level, we will be required to comply with a minimum fixed charge coverage ratio. The Credit Facility also contains affirmative and negative covenants that, among other things, will limit or restrict our ability to (1) incur indebtedness, (2) create liens, (3) merge, consolidate, liquidate or dissolve, (4) make investments (including acquisitions), loans or advances, (5) sell assets, (6) enter into sale and leaseback transactions, (7) enter into swap agreements, (8) make certain restricted payments (including dividends and other payments in respect of capital stock), (9) enter into transactions with affiliates, (10) enter into restrictive agreements, and (11) amend material documents. The Credit Facility is secured by a first priority lien on substantially all of our personal property.
In connection with the acquisition of SWH, we were required to amend certain covenants of our Credit Facility to allow the acquisition. These amendments were completed on May 5, 2010. On June 29, 2010, we completed an amendment and extension of our Credit Facility. The amended terms and conditions provide for an extension of the maturity date from March 13, 2012 to May 13, 2015. The amendment also provides for, among other things, the following changes to the Credit Facility: (1) a reduction in the interest rate spreads and commitment fees payable under the Credit Facility; (2) changes in the borrowing base eligibility criteria for accounts owing by certain customers, foreign accounts and inventory in transit; (3) changes in the calculation of the borrowing base relating to foreign accounts; (4) the establishment in the joint collateral agents' permitted discretion of reserves against the borrowing base for the Senior Notes due 2014; (5) the allowance of repayments and prepayments, including pursuant to open market purchases or a tender offer, of such notes subject to compliance with certain liquidity and/or other conditions; (6) an increase in the general debt basket from $300 million to $600 million and the addition of a new lien basket; and (7) an extension of the grace period for events of default arising from the amount of open account obligations exceeding the applicable cap therefor.
- 51 -
SWH has a $1.5 million unsecured borrowing facility with a lending institution that expires on October 1, 2011 and is renewable on an annual basis, under which no cash borrowings and $1.4 million in letters of credit were outstanding at December 31, 2010. Cash borrowings under this facility bear interest based on either the prevailing prime rate or the prevailing LIBOR rate plus 300 basis points. SWH also has a €0.3 million variable-rate unsecured borrowing facility with a European lending institution that expires in March 2011 and is renewable on an annual basis, under which no amounts were outstanding at December 31, 2010.
Proceeds from the issuance of common stock to our employees exercising stock options amounted to $0.6 million and $0.1 million in 2010 and 2008, respectively. No employees exercised stock options in 2009.
We recorded net pension and postretirement expenses of $1.7 million and $0.9 million in 2010 and 2009, respectively, to other comprehensive income resulting primarily from a lowering of the discount rate used to determine projected pension benefits. We recorded net pension and postretirement expenses of $9.3 million in 2008 to other comprehensive income resulting primarily from the downturn in the financial markets, which generated lower than expected returns on our plan assets. Our pension and postretirement plans are currently underfunded by a total of $16.7 million. As the benefits under our defined benefit pension plans are frozen with respect to service credits, the effects on future pension expense are not anticipated to be material to our results of operations or to our liquidity. We contributed $7.7 million and $1.5 million to our defined benefit plans in 2010 and 2009, respectively. We expect to contribute $4.8 million to our defined benefit plans in 2011.
On February 9, 2011, we announced that our Board of Directors had declared a quarterly cash dividend of $0.05 per share to all common stockholders of record as of February 25, 2011 for payment on March 11, 2011.
Economic Outlook
The recent economic environment has resulted in lower consumer confidence. This may lead to reduced consumer spending from recent experience, which could affect our net sales and our future profitability. Reduced consumer spending, combined with the potential for rising costs related to changes in foreign exchange rates, increasing labor costs (primarily in Asia) and commodity prices and increasing transportation costs may reduce our gross profit margins from present levels. We may be limited in our ability to increase our selling prices to offset rising costs. Should the consumer not accept higher retail prices for our products, these rising costs could have a material adverse effect on our business.
Our products are manufactured in many foreign countries, including China and Spain. Due to the current and expected future economic relationship between the United States and China, we may experience increased risk related to changes in foreign currency exchange rates should China allow the Yuan to rise in value against the Dollar. We may also experience increased risk related to changes in foreign currency rates between the Euro and the Dollar due to economic conditions in Europe. Should either of these occur, increased production costs for our goods manufactured in China and Spain could result.
When adverse economic conditions exist in the United States or abroad, we may experience increased risk related to the collectibility of our accounts receivable, and we may increase our provision for doubtful accounts in the future should any of our wholesale customers experience significant financial difficulties. If such conditions lead to defaults that are individually or cumulatively significant, we could experience a material adverse impact on our financial condition, results of operations and/or liquidity.
The economic turmoil in the credit markets over the past several years and the negative effects of the economic environment on our business may negatively impact our ability to borrow funds in the future. However, we believe that available cash and cash equivalents, funds generated by operations and the Credit Facility will provide the financial resources sufficient to meet our foreseeable working capital, dividend, capital expenditure and stock repurchase requirements and fund our contractual obligations and our acquisition liabilities and commitments. Although there can be no assurances, we believe that
- 52 -
the participating banks will be willing and able to loan funds to us in accordance with their legal obligations under the Credit Facility.
Off-Balance Sheet Arrangements
We do not have any off-balance sheet arrangements within the meaning of SEC Regulation S-K Item 303(a)(4).
Contractual Obligations and Contingent Liabilities and Commitments
The following is a summary of our significant contractual obligations for the periods indicated that existed as of December 31, 2010, and, except for purchase obligations and other long-term liabilities, is based on information appearing in the Notes to Consolidated Financial Statements (amounts in millions).
| | Total | | | Less than
1 year | | | 1 - 3
years | | | 3 - 5
years | | | More than
5 years |
| Long-term debt | $ | 500.3 | | $ | 0.1 | | $ | 0.2 | | $ | 250.0 | | $ | 250.0 |
| Interest on long-term debt (1) | | 415.3 | | | 28.1 | | | 56.3 | | | 41.9 | | | 289.0 |
| Capital lease obligations | | 39.2 | | | 3.5 | | | 7.2 | | | 7.4 | | | 21.1 |
| Operating lease obligations (2) | | 836.7 | | | 113.0 | | | 198.2 | | | 163.3 | | | 362.2 |
| Purchase obligations (3) | | 727.3 | | | 719.7 | | | 2.8 | | | 3.1 | | | 1.7 |
| Minimum royalty payments (4) | | 17.9 | | | 2.9 | | | 6.1 | | | 7.2 | | | 1.7 |
| Capital expenditure commitments | | 26.2 | | | 26.2 | | | - | | | - | | | - |
| Deferred compensation | | 9.1 | | | 9.1 | | | - | | | - | | | - |
| Acquisition consideration payable (5) | | 275.5 | | | 14.8 | | | 240.9 | | | 19.8 | | | - |
| Other long-term liabilities (6) | | 78.8 | | | 6.8 | | | 15.5 | | | 17.5 | | | 39.0 |
| Total contractual obligations (7) | $ | 2,926.3 | | $ | 924.2 | | $ | 527.2 | | $ | 510.2 | | $ | 964.7 |
| (1) | Excludes the effects of our interest rate swaps or cap. The maximum future net cash payments under these contracts total $32.3 million, for which we cannot make reasonably reliable estimates of the timing and amounts to be paid, if any. |
| (2) | Future rental commitments for leases have not been reduced by minimum non-cancelable sublease rentals aggregating $14.0 million. |
| (3) | Includes outstanding letters of credit of $29.9 million, which primarily represent inventory purchase commitments which typically mature in two to six months. |
| (4) | Under exclusive licenses to manufacture certain items under trademarks not owned by us pursuant to various license agreements, we are obligated to pay the licensors a percentage of our net sales of these licensed products, subject to minimum scheduled royalty and advertising payments. Amounts shown do not reflect the application of $1.3 million in advances against future royalties. |
| (5) | Represents estimated cash payments. Amounts reported as liabilities in the consolidated balance sheets primarily represent the present value of these payments. |
| (6) | Consists primarily of deferred rent and pension and postretirement liabilities. Pension and postretirement liabilities, which total $16.4 million, are reported under the more than five years column, as we cannot make reasonably reliable estimates of the timing and amounts to be paid. We plan to contribute $4.8 million to our defined benefit plans in 2011. Does not include $0.6 million related to the fair value of our interest rate swaps, for which we cannot make reasonably reliable estimates of the timing and amounts to be reclassified into income. |
| (7) | Excludes $5.6 million of uncertain tax positions, for which we cannot make reasonably reliable estimates of the timing and amounts to be paid. |
- 53 -
New Accounting Standards
In October 2009, the FASB issued ASU No. 2009-13, "Revenue Recognition (Topic 605): Multiple Deliverable Revenue Arrangements." ASU No. 2009-13 eliminates the residual method of allocation and requires that arrangement consideration be allocated at the inception of the arrangement to all deliverables using the relative selling price method and expands the disclosures related to multiple-deliverable revenue arrangements. ASU No. 2009-13 is effective prospectively for revenue arrangements entered into or materially modified in fiscal years beginning on or after June 15, 2010, with earlier adoption permitted. The adoption of ASU No. 2009-13 will not have a material impact on our results of operations or our financial position.
In January 2010, the FASB issued ASU No. 2010-02, "Consolidation (Topic 810): Accounting and Reporting for Decreases in Ownership of a Subsidiary - a Scope Clarification." ASU No. 2010-02 clarifies that the scope of the decrease in ownership provisions of Topic 810 applies to a subsidiary or group of assets that is a business, a subsidiary that is a business that is transferred to an equity method investee or a joint venture or an exchange of a group of assets that constitutes a business for a noncontrolling interest in an entity and does not apply to sales in substance of real estate. ASU No. 2010-02 is effective as of the beginning of the period in which an entity adopts Statement of Financial Accounting Standards No. 160, "Noncontrolling interests in Consolidated Financial Statements" ("SFAS No. 160") or, if SFAS No. 160 has been previously adopted, the first interim or annual period ending on or after December 15, 2009, applied retrospectively to the first period that the entity adopted SFAS No. 160. The adoption of ASU No. 2010-02 did not have an impact on our results of operations or our financial position.
In January 2010, the FASB issued ASU No. 2010-06, "Fair Value Measurements and Disclosures (Topic 820): Improving Disclosures about Fair Value Measurements." ASU 2010-06 requires new disclosures regarding transfers in and out of the Level 1 and 2 and activity within Level 3 fair value measurements and clarifies existing disclosures of inputs and valuation techniques for Level 2 and 3 fair value measurements. ASU 2010-06 also includes conforming amendments to employers' disclosures about postretirement benefit plan assets. The new disclosures and clarifications of existing disclosures are effective for interim and annual reporting periods beginning after December 15, 2009, except for the disclosure of activity within Level 3 fair value measurements, which is effective for fiscal years beginning after December 15, 2010, and for interim periods within those years. We have adopted ASU 2010-06 and our fair value information reflects the required disclosures.
In February 2010, the FASB issued ASU 2010-09, "Subsequent Events (Topic 855): Amendments to Certain Recognition and Disclosure Requirements." ASU 2010-09 requires an entity that is an SEC filer to evaluate subsequent events through the date that the financial statements are issued and removes the requirement that an SEC filer disclose the date through which subsequent events have been evaluated. ASC 2010-09 was effective upon issuance. The adoption of this standard had no effect on our results of operation or our financial position.
�� In April 2010, the FASB issued ASU 2010-13, "Compensation - Stock Compensation (Topic 718): Effect of Denominating the Exercise Price of a Share-Based Payment Award in the Currency of the Market in Which the Underlying Equity Security Trades." ASU 2010-13 provides amendments to Topic 718 to clarify that an employee share-based payment award with an exercise price denominated in the currency of a market in which a substantial portion of the entity's equity securities trades should not be considered to contain a condition that is not a market, performance, or service condition. Therefore, an entity would not classify such an award as a liability if it otherwise qualifies as equity. The amendments in ASU 2010-13 are effective for fiscal years, and interim periods within those fiscal years, beginning on or after December 15, 2010. The adoption of this standard will not have an effect on our results of operation or our financial position.
In December 2010, the FASB issued ASU 2010-28, "Intangibles - Goodwill and Other (Topic 350): When to Perform Step 2 of the Goodwill Impairment Test for Reporting Units with Zero or Negative Carrying Amounts." ASU 2010-28 provides amendments to Topic 350 to modify Step 1 of the goodwill impairment test for reporting units with zero or negative carrying amounts to clarify that, for those reporting units, an entity is required to perform Step 2 of the goodwill impairment test if it is more likely
- 54 -
than not that a goodwill impairment exists. In determining whether it is more likely than not that a goodwill impairment exists, an entity should consider whether there are any adverse qualitative factors indicating that an impairment may exist. For public entities, the amendments in this ASU are effective for fiscal years, and interim periods within those years, beginning after December 15, 2010. Early adoption is not permitted. The adoption of ASU No. 2010-28 will not have an impact on our results of operations or our financial position.
In December 2010, the FASB issued ASU 2010-29, "Business Combinations (Topic 805): Disclosure of Supplementary Pro Forma Information for Business Combinations." ASU 2010-29 provides amendments to Topic 805 to specify that if a public entity presents comparative financial statements, the entity should disclose revenue and earnings of the combined entity as though the business combination(s) that occurred during the current year had occurred as of the beginning of the comparable prior annual reporting period only. The amendments also expand the supplemental pro forma disclosures under Topic 805 to include a description of the nature and amount of material, nonrecurring pro forma adjustments directly attributable to the business combination included in the reported pro forma revenue and earnings. The amendments are effective prospectively for business combinations for which the acquisition date is on or after the beginning of the first annual reporting period beginning on or after December 15, 2010. Early adoption is permitted. We have early adopted ASU 2010-29 and are presenting our supplemental pro forma disclosures of business combinations that occurred in 2010 in conformity with these amendments.
ITEM 7A. QUANTITATIVE AND QUALITATIVE DISCLOSURES ABOUT MARKET RISK
Market Risk Sensitive Instruments
We are exposed to the impact of interest rate changes, foreign currency fluctuations, and changes in the market value of our fixed rate long-term debt. We manage this exposure through regular operating and financing activities and, when deemed appropriate, through the use of derivative financial instruments. Our policy allows the use of derivative financial instruments for identifiable market risk exposures, including interest rate and foreign currency fluctuations. We do not enter into derivative financial contracts for trading or other speculative purposes. The following quantitative disclosures were derived using quoted market prices, yields and theoretical pricing models obtained through independent pricing sources for the same or similar types of financial instruments, taking into consideration the underlying terms, such as the coupon rate, term to maturity and imbedded call options. Certain items such as lease contracts, insurance contracts, and obligations for pension and other post-retirement benefits were not included in the analysis. For further information see "Derivatives" and "Financial Instruments" in the Notes to Consolidated Financial Statements.
Interest Rates
Our primary interest rate exposures relate to the fair value of our fixed rate long-term debt and interest expense related to our revolving credit facility.
At December 31, 2010, the fair value of our fixed rate debt was $459.4 million. On that date, the potential decrease in fair value of our fixed rate long-term debt instruments resulting from a hypothetical 10% adverse change in interest rates was approximately $41.7 million.
Our primary interest rate exposures on variable rate credit facilities are with respect to United States and Canadian short-term rates. Cash borrowings under these facilities bear interest at rates that vary with changes in prevailing market rates. At December 31, 2010, we had $651.9 million in variable rate credit facilities, under which no cash borrowings and $29.9 million of letters of credit were outstanding.
At December 31, 2010, we had outstanding interest rate swaps to convert our $250 million 5.125% Senior Notes due 2014 (the "Notes") to variable-rate debt and an interest rate cap to limit our exposure to increases in the variable rates of our interest rate swaps. Under the terms of the swap contracts, we are required to make semiannual variable-rate payments to the counterparties calculated based on three-
- 55 -
month LIBOR rates (which are reset on the 15th day of each calendar quarter) plus 3.46%, and the counterparties were obligated to make semiannual fixed-rate payments to us of 5.125%. We also entered into an interest rate cap, at a cost of $2.7 million, that limits our three-month LIBOR rate exposure to 5.0%. The swap and cap transactions have a termination date of November 15, 2014, the date the Notes mature.
At December 31, 2010, the fair value of the interest rate swaps was a liability of $0.6 million and the fair value of the interest rate cap was an asset of $1.3 million. The maximum future net cash payments that could be made under these contracts are estimated to be $32.3 million.
Foreign Currency Exchange Rates
We are exposed to market risk related to changes in foreign currency exchange rates. Our products have historically been purchased from foreign manufacturers in pre-set United States dollar prices. With the acquisition of SWH, we also purchase certain products in Euros. We also have assets, liabilities and intercompany accounts denominated in certain foreign currencies that generate exchange gains and losses as exchange rates change. To date, we generally have not been materially adversely affected by fluctuations in exchange rates.
At December 31, 2010, we had outstanding foreign exchange contracts to exchange Canadian Dollars for a total notional value of US $20.3 million at a weighted-average exchange rate of $1.03 maturing through November 2011. The fair value of these contracts at December 31, 2010 was a $0.5 million unrealized loss. We believe that these financial instruments should not subject us to undue risk due to foreign exchange movements because gains and losses on these contracts should offset losses and gains on the assets, liabilities, and transactions being hedged. We are exposed to credit-related losses if the counterparty to a financial instrument fails to perform its obligation. However, we do not expect the counterparty, which presently has a high credit rating, to fail to meet its obligations.
MANAGEMENT'S REPORT ON INTERNAL CONTROL OVER FINANCIAL REPORTING
February 11, 2011
To the Stockholders of The Jones Group Inc.
The management of The Jones Group Inc. is responsible for establishing and maintaining adequate internal controls over financial reporting. Our management is also responsible for the preparation, integrity, objectivity and fair presentation of the financial statements and other financial information presented in this report. The financial statements have been prepared in conformity with accounting principles generally accepted in the United States of America and reflect the effects of certain judgments and estimates made by management.
In order to ensure that our internal control over financial reporting is effective, management regularly assesses such controls and did so most recently for our financial reporting as of December 31, 2010. This assessment was based on criteria for effective internal control over financial reporting described in Internal Control - Integrated Framework issued by the Committee of Sponsoring Organizations of the Treadway Commission, referred to as COSO. Our assessment included the documentation and understanding of our internal control over financial reporting. We have evaluated the design effectiveness and tested the operating effectiveness of internal controls to form our conclusion.
Our internal control over financial reporting is a process designed to provide reasonable assurance regarding the reliability of financial reporting and the preparation of financial statements for external purposes in accordance with generally accepted accounting principles. Our internal control over financial reporting includes those policies and procedures that pertain to maintaining records that, in reasonable detail, accurately and fairly reflect transactions and dispositions of assets, providing reasonable assurance that transactions are recorded as necessary to permit preparation of financial statements in accordance with generally accepted accounting principles, assuring that receipts and expenditures are being made in accordance with authorizations of our management and directors and
- 56 -
providing reasonable assurance regarding prevention or timely detection of unauthorized acquisition, use or disposition of assets that could have a material effect on our financial statements.
Because of its inherent limitations, internal control over financial reporting may not prevent or detect misstatements. Also, projections of any evaluation of effectiveness to future periods are subject to the risk that controls may become inadequate because of changes in conditions, or that the degree of compliance with the policies or procedures may deteriorate.
In accordance with SEC guidance regarding the reporting of internal control over financial reporting in connection with a material acquisition, management may omit an assessment of an acquired business' internal control over financial reporting from management's assessment of internal control over financial reporting for a period not to exceed one year. Accordingly, we have excluded SWH from the scope of management's assessment of the effectiveness of the Company's internal control over financial reporting as of December 31, 2010. SWH constituted 16% of total assets as of December 31, 2010 and 4% of sales for the year ended December 31, 2010. Management did not assess the effectiveness of internal control over financial reporting of SWH because of the timing of the acquisition, which was completed on June 2, 2010.
Based on this assessment, the undersigned officers concluded that our internal controls and procedures are effective in timely alerting them to material information required to be included in our periodic SEC filings and that information required to be disclosed by us in these periodic filings is recorded, processed, summarized and reported within the time periods specified in the SEC's rules and forms and that our internal controls are effective to provide reasonable assurance that our financial statements are fairly presented in conformity with generally accepted accounting principles.
The Audit Committee of our Board of Directors, which consists of independent, non-executive directors, meets regularly with management, the internal auditors and the independent accountants to review accounting, reporting, auditing and internal control matters. The committee has direct and private access to both internal and external auditors.
BDO USA, LLP, the independent registered public accounting firm who audits our financial statements, has audited our internal control over financial reporting as of December 31, 2010 and has expressed an unqualified opinion thereon.
 |  |
Wesley R. Card
Chief Executive Officer | John T. McClain
Chief Financial Officer |
- 57 -
 | BDO USA, LLP
Accountants and Consultants | 100 Park Ave
New York, NY 10017
Telephone: (212) 885-8000
Fax: (212) 697-1299 |
Report of Independent Registered Public Accounting Firm
Board of Directors and Stockholders
The Jones Group Inc.
New York, New York
We have audited The Jones Group Inc.'s internal control over financial reporting as of December 31, 2010, based on criteria established in Internal Control - Integrated Framework issued by the Committee of Sponsoring Organizations of the Treadway Commission (the COSO criteria). The Jones Group Inc.'s management is responsible for maintaining effective internal control over financial reporting and for its assessment of the effectiveness of internal control over financial reporting, included in the accompanying Management's Report on Internal Control over Financial Reporting. Our responsibility is to express an opinion on the company's internal control over financial reporting based on our audit.
We conducted our audit in accordance with the standards of the Public Company Accounting Oversight Board (United States). Those standards require that we plan and perform the audit to obtain reasonable assurance about whether effective internal control over financial reporting was maintained in all material respects. Our audit included obtaining an understanding of internal control over financial reporting, assessing the risk that a material weakness exists, and testing and evaluating the design and operating effectiveness of internal control based on the assessed risk. Our audit also included performing such other procedures as we considered necessary in the circumstances. We believe that our audit provides a reasonable basis for our opinion.
A company's internal control over financial reporting is a process designed to provide reasonable assurance regarding the reliability of financial reporting and the preparation of financial statements for external purposes in accordance with generally accepted accounting principles. A company's internal control over financial reporting includes those policies and procedures that (1) pertain to the maintenance of records that, in reasonable detail, accurately and fairly reflect the transactions and dispositions of the assets of the company; (2) provide reasonable assurance that transactions are recorded as necessary to permit preparation of financial statements in accordance with generally accepted accounting principles, and that receipts and expenditures of the company are being made only in accordance with authorizations of management and directors of the company; and (3) provide reasonable assurance regarding prevention or timely detection of unauthorized acquisition, use, or disposition of the company's assets that could have a material effect on the financial statements.
Because of its inherent limitations, internal control over financial reporting may not prevent or detect misstatements. Also, projections of any evaluation of effectiveness to future periods are subject to the risk that controls may become inadequate because of changes in conditions, or that the degree of compliance with the policies or procedures may deteriorate.
As indicated in the accompanying Management's Report on Internal Control over Financial Reporting, management's assessment of and conclusion on the effectiveness of internal control over financial reporting did not include the internal controls of Stuart Weitzman Holdings, LLC, which was acquired on June 2, 2010, and which is included in the consolidated balance sheet of The Jones Group Inc. as of December 31, 2010, and the related consolidated statements of operations, changes in equity, and cash flows for the year then ended. Stuart Weitzman Holdings, LLC constituted 16% of total assets as of December 31, 2010, and 4% of revenues for the year then ended. Management did not assess the effectiveness of internal control over financial reporting of Stuart Weitzman Holdings, LLC because of the timing of the acquisition, which was completed on June 2, 2010. Our audit of internal control over financial reporting of The Jones Group Inc. also did not include an evaluation of the internal control over financial reporting of Stuart Weitzman Holdings, LLC.
In our opinion, The Jones Group Inc. maintained, in all material respects, effective internal control over financial reporting as of December 31, 2010, based on the COSO criteria.
We also have audited, in accordance with the standards of the Public Company Accounting Oversight Board (United States), the consolidated balance sheets of The Jones Group Inc. as of December 31, 2010 and 2009, and the related consolidated statements of operations, changes in equity, and cash flows for each of the three years in the period ended December 31, 2010 and our report dated February 11, 2011 expressed an unqualified opinion thereon.

New York, New York
February 11, 2011
- 58 -
ITEM 8. FINANCIAL STATEMENTS AND SUPPLEMENTARY DATA
| BDO USA, LLP
Accountants and Consultants | 100 Park Ave
New York, NY 10017
Telephone: (212) 885-8000
Fax: (212) 697-1299 |
Report of Independent Registered Public Accounting Firm
Board of Directors and Stockholders
The Jones Group Inc.
New York, New York
We have audited the accompanying consolidated balance sheets of The Jones Group Inc. as of December 31, 2010 and 2009 and the related consolidated statements of operations, changes in equity, and cash flows for each of the three years in the period ended December 31, 2010. These financial statements are the responsibility of the Company's management. Our responsibility is to express an opinion on these financial statements based on our audits.
We conducted our audits in accordance with the standards of the Public Company Accounting Oversight Board (United States). Those standards require that we plan and perform the audit to obtain reasonable assurance about whether the financial statements are free of material misstatement. An audit includes examining, on a test basis, evidence supporting the amounts and disclosures in the financial statements, assessing the accounting principles used and significant estimates made by management, as well as evaluating the overall financial statement presentation. We believe that our audits provide a reasonable basis for our opinion.
In our opinion, the consolidated financial statements referred to above present fairly, in all material respects, the financial position of The Jones Group Inc. at December 31, 2010 and 2009, and the results of its operations and its cash flows for each of the three years in the period ended December 31, 2010, in conformity with accounting principles generally accepted in the United States.
We also have audited, in accordance with the standards of the Public Company Accounting Oversight Board (United States), The Jones Group Inc.'s internal control over financial reporting as of December 31, 2010, based on criteria established in Internal Control - Integrated Framework issued by the Committee of Sponsoring Organizations of the Treadway Commission (COSO) and our report dated February 11, 2011 expressed an unqualified opinion thereon.
New York, New York
February 11, 2011
- 59 -
The Jones Group Inc.
Consolidated Balance Sheets
(All amounts in millions except per share data)
| December 31, | | 2010 | | | 2009 | |
| ASSETS | | | | | | |
| CURRENT ASSETS: | | | | | | |
| | Cash and cash equivalents | $ | 200.8 | | $ | 333.4 | |
| Accounts receivable | | 345.6 | | | 303.1 | |
| | Inventories, primarily finished goods | | 465.9 | | | 375.0 | |
| Prepaid and refundable income taxes | | 18.7 | | | - | |
| Deferred taxes | | 28.0 | | | 28.1 | |
| | Prepaid expenses and other current assets | | 32.1 | | | 25.6 | |
| | TOTAL CURRENT ASSETS | | 1,091.1 | | | 1,065.2 | |
PROPERTY, PLANT AND EQUIPMENT, at cost, less accumulated depreciation and amortization | | 226.4 | | | 239.0 | |
| GOODWILL | | 161.8 | | | 40.1 | |
| OTHER INTANGIBLES, less accumulated amortization | | 726.7 | | | 559.8 | |
| PREPAID AND REFUNDABLE INCOME TAXES | | - | | | 4.7 | |
| DEFERRED TAXES | | - | | | 3.9 | |
| INVESTMENT IN AND LOANS TO UNCONSOLIDATED AFFILIATE | | 40.2 | | | 42.1 | |
| OTHER ASSETS | | 86.2 | | | 70.2 | |
| TOTAL ASSETS | $ | 2,332.4 | | $ | 2,025.0 | |
| LIABILITIES AND EQUITY | | | | | | |
| CURRENT LIABILITIES: | | | | | | |
| Current portion of long-term debt | $ | 0.1 | | $ | - | |
| Current portion of capital lease obligations | | 1.7 | | | 2.6 | |
| | Current portion of acquisition consideration payable | | 14.1 | | | - | |
| | Accounts payable | | 213.4 | | | 185.3 | |
| Income taxes payable | | - | | | 11.8 | |
| Accrued employee compensation and benefits | | 49.3 | | | 42.7 | |
| | Accrued expenses and other current liabilities | | 93.1 | | | 81.7 | |
| | TOTAL CURRENT LIABILITIES | | 371.7 | | | 324.1 | |
| NONCURRENT LIABILITIES: | | | | | | |
| Long-term debt | | 509.9 | | | 499.5 | |
| | Obligations under capital leases | | 25.2 | | | 26.9 | |
| Income taxes | | 6.3 | | | - | |
| Deferred taxes | | 0.3 | | | - | |
| Acquisition consideration payable | | 201.3 | | | - | |
| | Other | | 79.4 | | | 82.0 | |
| | TOTAL NONCURRENT LIABILITIES | | 822.4 | | | 608.4 | |
| | TOTAL LIABILITIES | | 1,194.1 | | | 932.5 | |
COMMITMENTS AND CONTINGENCIES | | - | | | - | |
EQUITY: | | | | | | |
| | Preferred stock, $.01 par value - shares authorized 1.0; none issued | | - | | | - | |
| Common stock, $.01 par value - shares authorized 200.0; issued 86.4 and 156.8 | | 0.9 | | | 1.6 | |
| | Additional paid-in capital | | 541.9 | | | 1,360.3 | |
| Retained earnings | | 603.8 | | | 1,564.4 | |
| | Accumulated other comprehensive loss | | (8.4 | ) | | (7.6 | ) |
| Treasury stock, 71.4 shares for 2009, at cost | | - | | | (1,826.3 | ) |
| TOTAL JONES STOCKHOLDERS' EQUITY | | 1,138.2 | | | 1,092.4 | |
| Noncontrolling interest | | 0.1 | | | 0.1 | |
| TOTAL EQUITY | | 1,138.3 | | | 1,092.5 | |
| TOTAL LIABILITIES AND EQUITY | $ | 2,332.4 | | $ | 2,025.0 | |
See accompanying notes to consolidated financial statements | | | | | | |
- 60 -
The Jones Group Inc.
Consolidated Statements of Operations
(All amounts in millions except per share data)
| Year Ended December 31, | | 2010 | | | 2009 | | | 2008 | |
| Net sales | $ | 3,593.5 | | $ | 3,279.7 | | $ | 3,562.6 | |
| Licensing income | | 48.3 | | | 46.8 | | | 52.1 | |
| Other revenues | | 0.9 | | | 0.9 | | | 1.7 | |
| Total revenues | | 3,642.7 | | | 3,327.4 | | | 3,616.4 | |
| Cost of goods sold | | 2,387.2 | | | 2,181.5 | | | 2,440.2 | |
| Gross profit | | 1,255.5 | | | 1,145.9 | | | 1,176.2 | |
| Selling, general and administrative expenses | | 1,073.0 | | | 1,008.7 | | | 1,069.2 | |
| Trademark impairments | | 37.6 | | | 28.7 | | | 25.2 | |
| Goodwill impairment | | - | | | 120.6 | | | 813.2 | |
| Operating income (loss) | | 144.9 | | | (12.1 | ) | | (731.4 | ) |
| Interest income | | 1.5 | | | 2.8 | | | 7.5 | |
| Interest expense and financing costs | | 60.4 | | | 55.6 | | | 49.1 | |
| Loss and costs associated with repurchase of 4.250% Senior Notes | | - | | | 1.5 | | | - | |
| Gain on sale of interest in Australian joint venture | | - | | | - | | | 0.8 | |
| Equity in loss of unconsolidated affiliate | | 0.9 | | | 3.7 | | | 0.7 | |
| Income (loss) from continuing operations before provision (benefit) for income taxes | | 85.1 | | | (70.1 | ) | | (772.9 | ) |
| Provision (benefit) for income taxes | | 30.7 | | | 16.2 | | | (6.6 | ) |
| Income (loss) from continuing operations | | 54.4 | | | (86.3 | ) | | (766.3 | ) |
| Income from discontinued operations, net of tax | | - | | | - | | | 0.9 | |
| Net income (loss) | | 54.4 | | | (86.3 | ) | | (765.4 | ) |
| Less: income attributable to noncontrolling interest | | 0.6 | | | 0.3 | | | - | |
| Income (loss) income attributable to Jones | $ | 53.8 | | $ | (86.6 | ) | $ | (765.4 | ) |
| Earnings (loss) per share | | | | | | | | | |
| Basic | | | | | | | | | |
| | | Income (loss) from continuing operations attributable to Jones | $ | 0.63 | | $ | (1.02 | ) | $ | (9.05 | ) |
| | | Income from discontinued operations attributable to Jones | | - | | | - | | | 0.01 | |
| | | Basic earnings (loss) per share attributable to Jones | $ | 0.63 | | $ | (1.02 | ) | $ | (9.04 | ) |
| Diluted | | | | | | | | | |
| | | Income (loss) from continuing operations attributable to Jones | $ | 0.62 | | $ | (1.02 | ) | $ | (9.05 | ) |
| | | Income from discontinued operations attributable to Jones | | - | | | - | | | 0.01 | |
| | | Diluted earnings (loss) per share attributable to Jones | $ | 0.62 | | $ | (1.02 | ) | $ | (9.04 | ) |
| | | | | | | | | | | |
| Weighted average common shares outstanding | | | | | | | | | |
| | | Basic | | 82.1 | | | 81.7 | | | 82.9 | |
| | Diluted | | 82.6 | | | 81.7 | | | 82.9 | |
| | | | | | | | | | |
| Dividends declared per share | $ | 0.20 | | $ | 0.20 | | $ | 0.56 | |
See accompanying notes to consolidated financial statements
- 61 -
The Jones Group Inc.
Consolidated Statements of Changes in Equity
(All amounts in millions except per share data)
| Number of
common
shares
outstanding | | | Total
stock-
holders'
equity | | | Common
stock | | | Additional
paid-in
capital | | . | Retained
earnings | | | Accumu-
lated
other
compre-
hensive
income (loss) | | | Treasury
stock | | | Non-controlling interest | |
| Balance, January 1, 2008 | 85.3 | | $ | 1,996.8 | | $ | 1.5 | | $ | 1,339.7 | | $ | 2,480.8 | | $ | 2.1 | | $ | (1,827.3 | ) | $ | - | |
| Year ended December 31, 2008: | | | | | | | | | | | | | | | | | | | | | | |
| Comprehensive loss: | | | | | | | | | | | | | | | | | | | | | | | |
| | Net loss | - | | | (765.4 | ) | | - | | | - | | | (765.4 | ) | | - | | | - | | | - | |
| | Pension and postretirement liability adjustments, net of $3.6 tax benefit | - | | | (5.7 | ) | | - | | | - | | | - | | | (5.7 | ) | | - | | | - | |
| Change in fair value of cash flow hedges, net of $0.6 tax | - | | | 0.6 | | | - | | | - | | | - | | | 0.6 | | | - | | | - | |
| | Reclassification adjustment for hedge gains and losses included in net income, net of $0.3 tax benefit | - | | | 0.7 | | | - | | | - | | | - | | | 0.7 | | | - | | | - | |
| Foreign currency translation adjustments | - | | | (9.4 | ) | | - | | | - | | | - | | | (9.4 | ) | | - | | | - | |
| | Total comprehensive loss | | | | (779.2 | ) | | | | | | | | | | | | | | | | | | |
| Issuance of restricted stock to employees, net of forfeitures | 1.3 | | | - | | | - | | | - | | | - | | | - | | | - | | | - | |
| Amortization expense in connection with employee stock options and restricted stock | - | | | 12.3 | | | - | | | 12.3 | | | - | | | - | | | - | | | - | |
| Exercise of employee stock options | - | | | 0.1 | | | - | | | 0.1 | | | - | | | - | | | - | | | - | |
| Tax effects from exercise of employee stock options and vesting of restricted stock | - | | | (1.4 | ) | | - | | | (1.4 | ) | | - | | | - | | | - | | | - | |
| Dividends on common stock ($0.56 per share) | - | | | (47.4 | ) | | - | | | - | | | (47.4 | ) | | - | | | - | | | - | |
| Treasury stock acquired | (3.2 | ) | | 1.0 | | | - | | | - | | | - | | | - | | | 1.0 | | | - | |
| Balance, December 31, 2008 | 83.4 | | | 1,182.2 | | | 1.5 | | | 1,350.7 | | | 1,668.0 | | | (11.7 | ) | | (1,826.3 | ) | | - | |
| Year ended December 31, 2009: | | | | | | | | | | | | | | | | | | | | | | | |
| Comprehensive loss: | | | | | | | | | | | | | | | | | | | | | | | |
| | Net (loss) income | - | | | (86.3 | ) | | - | | | - | | | (86.6 | ) | | - | | | - | | | 0.3 | |
| | Pension and postretirement liability adjustments, net of $0.3 tax benefit | - | | | (0.6 | ) | | - | | | - | | | - | | | (0.6 | ) | | - | | | - | |
| Change in fair value of cash flow hedges, net of $0.4 tax benefit | - | | | (0.7 | ) | | - | | | - | | | - | | | (0.7 | ) | | - | | | - | |
| | Reclassification adjustment for hedge gains and losses included in net loss, net of $0.2 tax benefit | - | | | 0.4 | | | - | | | - | | | - | | | 0.4 | | | - | | | - | |
| Foreign currency translation adjustments | - | | | 5.0 | | | - | | | - | | | - | | | 5.0 | | | - | | | - | |
| | Total comprehensive loss | | | | (82.2 | ) | | | | | | | | | | | | | | | | | | |
| Issuance of restricted stock to employees, net of forfeitures | 2.0 | | | - | | | - | | | - | | | - | | | - | | | - | | | - | |
| Amortization expense in connection with employee stock options and restricted stock | - | | | 13.0 | | | 0.1 | | | 12.9 | | | - | | | - | | | - | | | - | |
| Distributions to noncontrolling interest | - | | | (0.2 | ) | | - | | | - | | | - | | | - | | | - | | | (0.2 | ) |
| Tax effects from vesting of restricted stock | - | | | (1.1 | ) | | - | | | (1.1 | ) | | - | | | - | | | - | | | - | |
| Tax effects of expired employee stock options | - | | | (2.2 | ) | | - | | | (2.2 | ) | | - | | | - | | | - | | | - | |
| Dividends on common stock ($0.20 per share) | - | | | (17.0 | ) | | - | | | - | | | (17.0 | ) | | - | | | - | | | - | |
| Balance, December 31, 2009 | 85.4 | | | 1,092.5 | | | 1.6 | | | 1,360.3 | | | 1,564.4 | | | (7.6 | ) | | (1,826.3 | ) | | 0.1 | |
| Year ended December 31, 2010: | | | | | | | | | | | | | | | | | | | | | | | |
| Comprehensive income: | | | | | | | | | | | | | | | | | | | | | | | |
| | Net income | - | | | 54.4 | | | - | | | - | | | 53.8 | | | - | | | - | | | 0.6 | |
| | Pension and postretirement liability adjustments, net of $1.0 tax benefit | - | | | (1.7 | ) | | - | | | - | | | - | | | (1.7 | ) | | - | | | - | |
| Change in fair value of cash flow hedges, net of $0.1 tax benefit | - | | | (0.3 | ) | | - | | | - | | | - | | | (0.3 | ) | | - | | | - | |
| | Reclassification adjustment for hedge gains and losses included in net income, net of $0.1 tax benefit | - | | | 0.1 | | | - | | | - | | | - | | | 0.1 | | | - | | | - | |
| Foreign currency translation adjustments | - | | | 1.1 | | | - | | | - | | | - | | | 1.1 | | | - | | | - | |
| | Total comprehensive income | | | | 53.6 | | | | | | | | | | | | | | | | | | | |
| Issuance of restricted stock to employees, net of forfeitures | 1.7 | | | - | | | - | | | - | | | - | | | - | | | - | | | - | |
| Amortization expense in connection with employee stock options and restricted stock | - | | | 22.0 | | | - | | | 22.0 | | | - | | | - | | | - | | | - | |
| Exercise of employee stock options | - | | | 0.6 | | | - | | | 0.6 | | | - | | | - | | | - | | | - | |
| Distributions to noncontrolling interest | - | | | (0.6 | ) | | - | | | - | | | - | | | - | | | - | | | (0.6 | ) |
| Tax effects from exercise of employee stock options and vesting of restricted stock | - | | | (0.6 | ) | | - | | | (0.6 | ) | | - | | | - | | | - | | | - | |
| Tax effects of expired employee stock options | - | | | (1.1 | ) | | - | | | (1.1 | ) | | - | | | - | | | - | | | - | |
| Dividends on common stock ($0.20 per share) | - | | | (17.4 | ) | | - | | | - | | | (17.4 | ) | | - | | | - | | | - | |
| Treasury stock acquired | (0.7 | ) | | (10.7 | ) | | - | | | - | | | - | | | - | | | (10.7 | ) | | - | |
| Retirement of treasury stock | - | | | - | | | (0.7 | ) | | (839.3 | ) | | (997.0 | ) | | - | | | 1,837.0 | | | - | |
| Balance, December 31, 2010 | 86.4 | | $ | 1,138.3 | | $ | 0.9 | | $ | 541.9 | | $ | 603.8 | | $ | (8.4 | ) | $ | - | | $ | 0.1 | |
See accompanying notes to consolidated financial statements
- 62 -
The Jones Group Inc.
Consolidated Statements of Cash Flows
(All amounts in millions)
| Year Ended December 31, | | 2010 | | | 2009 | | | 2008 | |
| CASH FLOWS FROM OPERATING ACTIVITIES: | | | | | | | | | |
| Net income (loss) | $ | 54.4 | | $ | (86.3 | ) | $ | (765.4 | ) |
| Less: Income from discontinued operations, net of tax | | - | | | - | | | (0.9 | ) |
| Income (loss) from continuing operations | | 54.4 | | | (86.3 | ) | | (766.3 | ) |
| Adjustments to reconcile income (loss) from continuing operations to net cash provided by operating activities, net of acquisitions: | | | | | | | | | |
| | Loss and costs associated with repurchase of 4.250% Senior Notes | | - | | | 1.5 | | | - | |
| | Impairment losses on property, plant and equipment | | 9.0 | | | 24.4 | | | 0.9 | |
| | Goodwill impairment | | - | | | 120.6 | | | 813.2 | |
| | Other intangible asset impairments | | 40.2 | | | 28.7 | | | 25.2 | |
| | | Amortization of employee stock options and restricted stock | | 22.0 | | | 13.0 | | | 12.3 | |
| | | Depreciation and other amortization | | 91.9 | | | 78.7 | | | 80.8 | |
| | Adjustments to acquisition consideration payable | | 19.0 | | | - | | | - | |
| | | Gain on sale of interest in Australian joint venture | | - | | | - | | | (0.8 | ) |
| | Equity in loss of unconsolidated affiliates | | 0.9 | | | 3.7 | | | 0.7 | |
| | (Recovery of) provision for losses on accounts receivable | | (0.2 | ) | | 1.7 | | | 10.3 | |
| | | Deferred taxes | | 4.5 | | | 10.7 | | | (5.0 | ) |
| | Fair value adjustments related to interest rate swaps and cap | | 2.4 | | | - | | | - | |
| | Write-off of deferred financing fees | | - | | | 4.4 | | | 1.1 | |
| | | Other items, net | | 0.3 | | | 1.3 | | | 2.3 | |
| | Changes in operating assets and liabilities: | | | | | | | | | |
| | | | Accounts receivable | | (19.5 | ) | | 56.3 | | | (45.2 | ) |
| | | Inventories | | (70.3 | ) | | 136.9 | | | 11.1 | |
| | | | Prepaid expenses and other current assets | | (4.7 | ) | | 9.5 | | | 22.2 | |
| | | | Accounts payable | | 24.8 | | | (46.8 | ) | | 8.6 | |
| | | Income taxes payable/prepaid income taxes | | (21.1 | ) | | 0.6 | | | 12.8 | |
| | | | Accrued expenses and other current liabilities | | 8.0 | | | (4.6 | ) | | (15.9 | ) |
| | | Acquisition consideration payable | | (1.3 | ) | | - | | | - | |
| | | | Other assets and liabilities | | (19.0 | ) | | (5.3 | ) | | 7.2 | |
| | | | Total adjustments | | 86.9 | | | 435.3 | | | 941.8 | |
| | | Net cash provided by operating activities | | 141.3 | | | 349.0 | | | 175.5 | |
| CASH FLOWS FROM INVESTING ACTIVITIES: | | | | | | | | | |
| Acquisition of Stuart Weitzman Holdings, net of cash acquired | | (159.3 | ) | | - | | | - | |
| Acquisition of Moda Nicola International | | (14.4 | ) | | - | | | - | |
| Investment in GRI Group Limited | | - | | | (15.2 | ) | | (20.2 | ) |
| | Costs related to acquisition of Rachel Roy Fashions, Inc. | | - | | | - | | | (0.2 | ) |
| | Capital expenditures | | (41.0 | ) | | (30.0 | ) | | (71.2 | ) |
| | Proceeds from sale of interest in Australian joint venture | | - | | | - | | | 0.8 | |
| | Proceeds from sale of Mexican operations | | - | | | - | | | 5.9 | |
| Other items, net | | 0.4 | | | - | | | 0.5 | |
| | | Net cash used in investing activities | | (214.3 | ) | | (45.2 | ) | | (84.4 | ) |
| CASH FLOWS FROM FINANCING ACTIVITIES: | | | | | | | | | |
| | Repurchase of 4.250% Senior Notes | | - | | | (237.7 | ) | | - | |
| | Redemption at maturity of 4.250% Senior Notes | | - | | | (7.5 | ) | | - | |
| | Payment of consent fees | | - | | | (12.9 | ) | | - | |
| | Costs associated with consent fees and repurchase of 4.250% Senior Notes | | - | | | (1.8 | ) | | - | |
| | Costs related to secured revolving credit agreement | | (7.3 | ) | | (30.1 | ) | | - | |
| | Repayments of long-term debt | | (0.2 | ) | | - | | | (0.3 | ) |
| | Cash distributions to former owners of Stuart Weitzman Holdings | | (19.0 | ) | | - | | | - | |
| | Distributions to noncontrolling interest | | (0.6 | ) | | (0.2 | ) | | - | |
| | Payments of acquisition consideration payable | | (4.3 | ) | | - | | | - | |
| | Purchases of treasury stock | | (10.7 | ) | | - | | | 1.0 | |
| Proceeds from exercise of employee stock options | | 0.6 | | | - | | | 0.1 | |
| | Dividends paid | | (17.2 | ) | | (17.0 | ) | | (47.4 | ) |
| | Principal payments on capital leases | | (2.6 | ) | | (3.1 | ) | | (4.8 | ) |
| Excess tax benefits from share-based payment arrangements | | 1.2 | | | - | | | - | |
| | | Net cash used in financing activities | | (60.1 | ) | | (310.3 | ) | | (51.4 | ) |
| EFFECT OF EXCHANGE RATES ON CASH | | 0.5 | | | 1.6 | | | (4.2 | ) |
| NET (DECREASE) INCREASE IN CASH AND CASH EQUIVALENTS | | (132.6 | ) | | (4.9 | ) | | 35.5 | |
| CASH AND CASH EQUIVALENTS, BEGINNING | | 333.4 | | | 338.3 | | | 302.8 | |
| CASH AND CASH EQUIVALENTS, ENDING | $ | 200.8 | | $ | 333.4 | | $ | 338.3 | |
See accompanying notes to consolidated financial statements
- 63 -
The Jones Group Inc.
Notes to Consolidated Financial Statements
SUMMARY OF ACCOUNTING POLICIES
Basis of Presentation
The consolidated financial statements include the accounts of The Jones Group Inc. and our wholly-owned subsidiaries. All significant intercompany balances and transactions have been eliminated. The results of operations of acquired companies are included in our operating results from the respective dates of acquisition. We also have a 25% interest in GRI, which is accounted for under the equity method of accounting.
We design, contract for the manufacture of and market a broad range of women's collection sportswear, suits and dresses, casual sportswear and jeanswear for women and children, women's footwear and accessories, and casual jeanswear for men. We sell our products through a broad array of distribution channels, including better specialty and department stores and mass merchandisers, primarily in the United States and Canada. We also operate our own network of retail and factory outlet stores, as well as several e-commerce web sites. In addition, we license the use of several of our brand names to select manufacturers and distributors of women's and men's apparel and accessories worldwide.
The preparation of financial statements in conformity with accounting principles generally accepted in the United States requires management to make estimates and assumptions that affect the reported amounts of assets and liabilities and disclosure of contingent assets and liabilities at the date of the financial statements and the reported amounts of revenues and expenses during the reporting period. Actual results could differ from these estimates.
Credit Risk
Financial instruments which potentially subject us to concentration of credit risk consist principally of cash investments and accounts receivable. We place our cash and cash equivalents in investment-grade, highly-liquid U.S. government agency and corporate money market accounts. We perform ongoing credit evaluations of our customers' financial condition and, generally, require no collateral from our customers. The allowance for non-collection of accounts receivable is based upon the expected collectibility of all accounts receivable.
Derivative Financial Instruments
Our primary objectives for holding derivative financial instruments are to manage foreign currency and interest rate risks. We do not use financial instruments for trading or other speculative purposes. We have historically used derivative financial instruments to hedge both the fair value of recognized assets or liabilities (a "fair value" hedge) and the variability of anticipated cash flows of a forecasted transaction (a "cash flow" hedge). Our strategies related to derivative financial instruments have been:
- the use of foreign currency forward contracts to hedge a portion of anticipated future short-term inventory purchases to offset the effects of changes in foreign currency exchange rates (primarily between the U.S. Dollar and the Canadian Dollar) and
- the use of interest rate swaps and caps to effectively convert a portion of our outstanding fixed-rate debt to variable-rate debt to take advantage of lower interest rates.
Our foreign currency forward contracts are highly effective hedges because all the critical terms of the derivative instruments match those of the hedged item, and our interest rate swaps are highly effective based on regression analyses (our interest rate cap agreements do not qualify for hedge accounting). On the date a qualifying derivative contract is entered into, we designate the derivative as either a fair value hedge or a cash flow hedge. Changes in derivative fair values that are designated as fair value hedges are recognized in earnings as offsets to the changes in fair value of the related hedged assets and liabilities. Changes in derivative fair values that are designated as cash flow hedges are deferred and recorded as a component of accumulated other comprehensive income until the associated
- 64 -
hedged transactions impact the income statement, at which time the deferred gains and losses are reclassified to either cost of sales for inventory purchases or to selling, general and administrative ("SG&A") expenses for all other items. Any ineffective portion of a hedging derivative's change in fair value will be immediately recognized in cost of sales for foreign currency forward contracts and interest expense for interest rate swap contracts. Differentials to be paid or received under interest rate swap contracts and changes in the fair value of interest rate cap contracts are recognized in income as adjustments to interest expense. Gains or losses generated from the early termination of interest rate swap contracts are amortized to earnings over the remaining terms of the contracts as adjustments to interest expense. The fair values of the derivatives, which are based on observable inputs such as yield curves or foreign exchange spot rates, are reported as other current assets, other assets, accrued expenses and other current liabilities or other noncurrent liabilities, as appropriate.
Accounts Receivable
Accounts receivable are reported at amounts we expect to be collected, net of trade discounts and deductions for co-op advertising normally taken by our customers, allowances we provide to our retail customers to effectively flow goods through the retail channels, an allowance for non-collection due to the financial position of our customers and credit card accounts, and an allowance for estimated sales returns.
Inventories and Cost of Sales
Inventories are valued at the lower of cost or market. Inventory values are determined using the FIFO (first in, first out) and weighted average cost methods. We reduce the carrying cost of inventories for obsolete or slow moving items as necessary to properly reflect inventory value. The cost elements included in inventory consist of all direct costs of merchandise (net of purchase discounts and vendor allowances), allocated overhead (primarily design and indirect production costs), inbound freight and merchandise acquisition costs such as commissions and import fees.
Cost of sales includes the inventory cost elements listed above as well as warehouse outbound freight, merchandise freight between our distribution centers and retail locations and realized gains or losses on foreign currency forward contracts associated with inventory purchases. Our cost of sales may not be comparable to those of other entities, since some entities include all of the costs associated with their distribution functions in cost of sales while we include these costs in SG&A expenses. Distribution costs included in SG&A expenses for 2010, 2009 and 2008 were $104.0 million, $101.0 million and $103.1 million, respectively.
Property, Plant, Equipment and Depreciation and Amortization
Property, plant and equipment are recorded at cost. Depreciation and amortization are computed by the straight-line method over the estimated useful lives of the assets. Leasehold improvements recorded at the inception of a lease are amortized using the straight-line method over the life of the lease or the useful life of the improvement, whichever is shorter; for improvements made during the lease term, the amortization period is the shorter of the useful life or the remaining lease term (including any renewal periods that are deemed to be reasonably assured). Property under capital leases is amortized over the lives of the respective leases or the estimated useful lives of the assets, whichever is shorter.
Operating Leases
Total rent payments under operating leases that include scheduled payment increases and rent holidays are amortized on a straight-line basis over the term of the lease. Rent expense on our buildings and retail stores is classified as an SG&A expense and, for certain stores, includes contingent rents that are based on a percentage of retail sales over stated levels. Landlord allowances are amortized by the straight-line method over the term of the lease as a reduction of rent expense.
Goodwill and Other Intangibles
Goodwill represents the excess of purchase price over the fair value of net assets acquired in business combinations accounted for under the purchase method of accounting. We test at least annually our goodwill and other intangibles without determinable lives (primarily tradenames and trademarks) for impairment through the use of discounted cash flow models. Other intangibles with determinable lives,
- 65 -
including license agreements, are amortized over the estimated useful lives of the assets (currently ranging from nine months to 20 years).
Foreign Currency Translation
The financial statements of foreign subsidiaries are translated into U.S. dollars in accordance with ASC Section 830, "Foreign Currency Matters." Where the functional currency of a foreign subsidiary is its local currency, balance sheet accounts are translated at the current exchange rate and income statement items are translated at the average exchange rate for the period. Gains and losses resulting from translation are accumulated in a separate component of stockholders' equity. Gains and losses on transactions denominated and settled in a foreign currency are reflected in the consolidated statements of operations. Net foreign currency gains (losses) reflected in results from continuing operations were $0.6 million, $(1.2) million and $(0.2) million in 2010, 2009 and 2008, respectively.
Defined Benefit Plans
Our funding policy is to contribute at least the minimum amount to meet the funding ratio requirements of the Pension Protection Act.
Treasury Stock
Treasury stock is recorded at acquisition cost. Gains and losses on disposition are recorded as increases or decreases to additional paid-in capital with losses in excess of previously recorded gains charged directly to retained earnings. When treasury shares are retired and returned to authorized but unissued status, the carrying value in excess of par is allocated to additional paid-in capital and retained earnings on a pro rata basis.
Revenue Recognition
Wholesale apparel and footwear and accessories sales are recognized either when products are shipped or, in certain situations, upon acceptance by the customer. Retail sales are recorded at the time of register receipt. Allowances for estimated returns are provided when sales are recorded primarily by reducing revenues for the total revenues related to estimated returns, with an offsetting reduction to cost of sales for the cost of the estimated returns. Sales taxes collected from retail customers are excluded from reported revenues. Licensing income is recognized based on the higher of contractual minimums or sales of licensed products reported by our licensees.
Shipping and Handling Costs
Shipping and handling costs billed to customers are recorded as revenue. Freight costs associated with shipping goods to customers are recorded as a cost of sales.
Advertising Expense
We record national advertising campaign costs as an expense when the advertising first takes place and we expense advertising production costs as incurred, net of reimbursements for cooperative advertising. Advertising costs associated with our cooperative advertising programs are accrued as the related revenues are recognized. Net advertising expense reflected in results from continuing operations was $57.6 million, $45.3 million and $54.7 million in 2010, 2009 and 2008, respectively, net of co-operative advertising reimbursements of $11.1 million, $11.6 million and $12.9 million, respectively.
Income Taxes
We use the asset and liability method of accounting for income taxes. Current tax assets and liabilities are recognized for the estimated Federal, foreign, state and local income taxes payable or refundable on the tax returns for the current year. Deferred tax assets and liabilities are recognized for the expected future tax consequences of temporary differences between the financial statement and tax bases of assets and liabilities using enacted tax rates in effect for the year in which the differences are expected to reverse. Deferred income tax provisions are based on the changes to the respective assets and liabilities from period to period. Valuation allowances are recorded to reduce deferred tax assets when uncertainty regarding their realizability exists.
- 66 -
Earnings per Share
We have outstanding restricted stock grants that contain nonforfeitable rights to dividends (whether paid or unpaid) which qualify these shares as participating securities, requiring them to be included in the computation of earnings per share pursuant to the two-class method. Under the two-class method, all earnings (distributed and undistributed) are allocated to common shares and participating securities based on their respective rights to receive dividends. Basic earnings per common share is calculated by dividing earnings allocated to common shareholders by the weighted-average number of common shares outstanding during the period. Diluted earnings per share reflect, in periods in which they have a dilutive effect, the effect of unvested restricted stock not classified as participating securities and common shares issuable upon exercise of stock options. The difference between reported basic and diluted weighted-average common shares results from the assumption that all dilutive stock options outstanding were exercised and all outstanding restricted shares have vested.
The following options to purchase shares of common stock were outstanding during a portion of 2010 but were not included in the computation of diluted earnings per share because the exercise prices of the options were greater than the average market price of the common shares and, therefore, would be antidilutive. For 2009 and 2008, none of the options outstanding were included in the computation of diluted earnings per share due to the net loss for the year.
| For the year ended December 31, | 2010 | 2009 | 2008 |
| Number of options (in millions) | 6.0 | N/A | N/A |
| Weighted average exercise price | $33.25 | - | - |
Restricted Stock
Compensation cost for restricted stock is measured as the excess, if any, of the quoted market price of our stock at the date the common stock is granted over the amount the employee must pay to acquire the stock (which is generally zero). The compensation cost, net of projected forfeitures, is recognized over the period between the issue date and the date any restrictions lapse.
Long-Lived Assets
We review certain long-lived assets for impairment whenever events or changes in circumstances indicate that the carrying amount may not be recoverable. In that regard, we assess the recoverability of such assets based upon estimated non-discounted cash flow forecasts. If an asset impairment is identified, the asset is written down to fair value based on discounted cash flow or other fair value measures.
Cash Equivalents
We consider all highly liquid short-term investments to be cash equivalents.
New Accounting Standards
In October 2009, the FASB issued ASU No. 2009-13, "Revenue Recognition (Topic 605): Multiple Deliverable Revenue Arrangements." ASU No. 2009-13 eliminates the residual method of allocation and requires that arrangement consideration be allocated at the inception of the arrangement to all deliverables using the relative selling price method and expands the disclosures related to multiple-deliverable revenue arrangements. ASU No. 2009-13 is effective prospectively for revenue arrangements entered into or materially modified in fiscal years beginning on or after June 15, 2010, with earlier adoption permitted. The adoption of ASU No. 2009-13 will not have a material impact on our results of operations or our financial position.
In January 2010, the FASB issued ASU No. 2010-02, "Consolidation (Topic 810): Accounting and Reporting for Decreases in Ownership of a Subsidiary - a Scope Clarification." ASU No. 2010-02 clarifies that the scope of the decrease in ownership provisions of Topic 810 applies to a subsidiary or group of assets that is a business, a subsidiary that is a business that is transferred to an equity method investee or a joint venture or an exchange of a group of assets that constitutes a business for a noncontrolling interest in an entity and does not apply to sales in substance of real estate. ASU No. 2010-02 is effective as of the beginning of the period in which an entity adopts Statement of Financial Accounting Standards No. 160,
- 67 -
"Noncontrolling interests in Consolidated Financial Statements" ("SFAS No. 160") or, if SFAS No. 160 has been previously adopted, the first interim or annual period ending on or after December 15, 2009, applied retrospectively to the first period that the entity adopted SFAS No. 160. The adoption of ASU No. 2010-02 did not have an impact on our results of operations or our financial position.
In January 2010, the FASB issued ASU No. 2010-06, "Fair Value Measurements and Disclosures (Topic 820): Improving Disclosures about Fair Value Measurements." ASU 2010-06 requires new disclosures regarding transfers in and out of the Level 1 and 2 and activity within Level 3 fair value measurements and clarifies existing disclosures of inputs and valuation techniques for Level 2 and 3 fair value measurements. ASU 2010-06 also includes conforming amendments to employers' disclosures about postretirement benefit plan assets. The new disclosures and clarifications of existing disclosures are effective for interim and annual reporting periods beginning after December 15, 2009, except for the disclosure of activity within Level 3 fair value measurements, which is effective for fiscal years beginning after December 15, 2010, and for interim periods within those years. We have adopted ASU 2010-06 and our fair value information reflects the required disclosures.
In February 2010, the FASB issued ASU 2010-09, "Subsequent Events (Topic 855): Amendments to Certain Recognition and Disclosure Requirements." ASU 2010-09 requires an entity that is an SEC filer to evaluate subsequent events through the date that the financial statements are issued and removes the requirement that an SEC filer disclose the date through which subsequent events have been evaluated. ASC 2010-09 was effective upon issuance. The adoption of this standard had no effect on our results of operation or our financial position.
In April 2010, the FASB issued ASU 2010-13, "Compensation - Stock Compensation (Topic 718): Effect of Denominating the Exercise Price of a Share-Based Payment Award in the Currency of the Market in Which the Underlying Equity Security Trades." ASU 2010-13 provides amendments to Topic 718 to clarify that an employee share-based payment award with an exercise price denominated in the currency of a market in which a substantial portion of the entity's equity securities trades should not be considered to contain a condition that is not a market, performance, or service condition. Therefore, an entity would not classify such an award as a liability if it otherwise qualifies as equity. The amendments in ASU 2010-13 are effective for fiscal years, and interim periods within those fiscal years, beginning on or after December 15, 2010. The adoption of this standard will not have an effect on our results of operation or our financial position.
In December 2010, the FASB issued ASU 2010-28, "Intangibles - Goodwill and Other (Topic 350): When to Perform Step 2 of the Goodwill Impairment Test for Reporting Units with Zero or Negative Carrying Amounts." ASU 2010-28 provides amendments to Topic 350 to modify Step 1 of the goodwill impairment test for reporting units with zero or negative carrying amounts to clarify that, for those reporting units, an entity is required to perform Step 2 of the goodwill impairment test if it is more likely than not that a goodwill impairment exists. In determining whether it is more likely than not that a goodwill impairment exists, an entity should consider whether there are any adverse qualitative factors indicating that an impairment may exist. For public entities, the amendments in this ASU are effective for fiscal years, and interim periods within those years, beginning after December 15, 2010. Early adoption is not permitted. The adoption of ASU No. 2010-28 will not have an impact on our results of operations or our financial position.
In December 2010, the FASB issued ASU 2010-29, "Business Combinations (Topic 805): Disclosure of Supplementary Pro Forma Information for Business Combinations." ASU 2010-29 provides amendments to Topic 805 to specify that if a public entity presents comparative financial statements, the entity should disclose revenue and earnings of the combined entity as though the business combination(s) that occurred during the current year had occurred as of the beginning of the comparable prior annual reporting period only. The amendments also expand the supplemental pro forma disclosures under Topic 805 to include a description of the nature and amount of material, nonrecurring pro forma adjustments directly attributable to the business combination included in the reported pro forma revenue and earnings. The amendments are effective prospectively for business combinations for which the acquisition date is on or after the beginning of the first annual reporting period beginning on or after December 15, 2010. Early adoption is permitted. We have early adopted ASU 2010-29 and are
- 68 -
presenting our supplemental pro forma disclosures of business combinations that occurred in 2010 in conformity with these amendments.
EARNINGS (LOSS) PER SHARE
The computation of basic and diluted earnings (loss) per share is as follows:
| Year Ended December 31, | | 2010 | | | 2009 | | | 2008 | |
| (In millions except per share amounts) | | | | | | | | | |
| Income (loss) from continuing operations | $ | 54.4 | | $ | (86.3 | ) | $ | (766.3 | ) |
| Less: income from continuing operations attributable to noncontrolling interest | | 0.6 | | | 0.3 | | | - | |
| Income (loss) from continuing operations attributable to Jones | | 53.8 | | | (86.6 | ) | | (766.3 | ) |
| Less: income (loss) from continuing operations allocated to participating securities | | 2.4 | | | (3.6 | ) | | (16.0 | ) |
| Income (loss) from continuing operations available to common stockholders of Jones | | 51.4 | | | (83.0 | ) | | (750.3 | ) |
| Income from discontinued operations available to common stockholders of Jones | | - | | | - | | | 0.9 | |
| Income (loss) available to common stockholders of Jones | $ | 51.4 | | $ | (83.0 | ) | $ | (749.4 | ) |
| Weighted-average common shares outstanding - basic | | 82.1 | | | 81.7 | | | 82.9 | |
| Effect of dilutive employee stock options | | 0.5 | | | - | | | - | |
| Weighted-average common shares and share equivalents outstanding - diluted | | 82.6 | | | 81.7 | | | 82.9 | |
| Earnings (loss) per share - basic | | | | | | | | | |
| | Income (loss) from continuing operations attributable to Jones | $ | 0.63 | | $ | (1.02 | ) | $ | (9.05 | ) |
| | Income from discontinued operations attributable to Jones | | - | | | - | | | 0.01 | |
| | Basic earnings (loss) per share attributable to Jones | $ | 0.63 | | $ | (1.02 | ) | $ | (9.04 | ) |
| Earnings (loss) per share - diluted | | | | | | | | | |
| | Income (loss) from continuing operations attributable to Jones | $ | 0.62 | | $ | (1.02 | ) | $ | (9.05 | ) |
| | Income from discontinued operations attributable to Jones | | - | | | - | | | 0.01 | |
| | Diluted earnings (loss) per share attributable to Jones | $ | 0.62 | | $ | (1.02 | ) | $ | (9.04 | ) |
ACQUISITIONS
Moda Nicola International, LLC
On February 4, 2010, we acquired 100% of the membership interests in Moda Nicola International, LLC ("Moda"), a privately-held designer, marketer and wholesaler of women's contemporary eveningwear and sportswear, and owner of the Robert Rodriguez Collection, for $35.7 million. Under the terms of the agreement, we made cash payments of $14.4 million to the selling members of Moda. We deferred $2.5 million of the purchase price, with payment subject to an indemnification holding period as set forth in the acquisition agreement. The selling members of Moda are also entitled to receive future cash payments upon achievement of certain financial targets set within the agreement for the years 2011 through 2014. At the acquisition date, we recorded an acquisition consideration liability for $18.8 million, based on projected revenues and gross margins of the acquired business and a discount factor based on an estimated weighted average cost of capital. Adjustments to this liability are recorded as an SG&A expense in our wholesale better apparel segment. At December 31, 2010, the liability was $22.9 million, with $4.1 million recorded as an SG&A expense during 2010. Projected payments amount to $6.0 million in 2012, $7.3 million in 2013, $8.9 million in 2014, and $10.9 million in 2015.
- 69 -
We pursued the acquisition of Moda to increase our presence in the contemporary apparel market and to further develop a business portfolio with significant growth opportunities. Moda is reported as part of our wholesale better apparel segment.
The following table summarizes the fair values of the assets acquired and liabilities assumed from Moda on February 4, 2010
| (In millions) | | Amortization life (in months) | | | Fair Value | |
| Current assets | | | | $ | 3.2 | |
| Property, plant and equipment | | | | | 0.2 | |
| Intangible assets: | | | | | | |
| Goodwill | | | | | 6.6 | |
| Customer relationships | | 120 | | | 7.9 | |
| Trademarks | | 240 | | | 17.0 | |
| Covenants not to compete | | 59 | | | 0.2 | |
| Order backlog | | 3 | | | 1.7 | |
| Total assets acquired | | | | | 36.8 | |
| Current liabilities | | | | | (1.1 | ) |
| Total purchase price | | | | $ | 35.7 | |
The fair value of receivables acquired from Moda was $2.2 million, with gross contractual amounts receivable amounting to $2.7 million.
The acquisition resulted in the recognition of $6.6 million of goodwill, which is expected to be deductible for tax purposes. Goodwill largely consists of expected synergies resulting from the acquisition, such as manufacturing and supply chain work process improvements and the elimination of redundant corporate overhead for shared services and governance, the acquired assembled workforce, which does not qualify as an amortizable intangible asset, and the potential for product extensions, such as footwear.
The following table provides total revenues and results of operations from the acquired Moda business included in our results since the acquisition.
| (In millions) | | | | | | |
| Total revenues | | | | $ | 17.0 | |
| Loss before provision for income taxes | | | | | (6.9 | ) |
Stuart Weitzman Holdings, LLC
On June 2, 2010, we acquired 55% of the membership interests in Stuart Weitzman Holdings, LLC ("SWH"), a privately-held designer and manufacturer of women's salon footwear and accessories under the Stuart Weitzman label. SWH markets its products in fine specialty and department stores worldwide and in its own chain of retail stores in the U.S. and abroad.
Under the terms of the agreement, the acquisition will occur in two stages. We made an initial cash payment of $180.3 million for a 55% interest in SWH. The purchase of the remaining 45% will occur on December 31, 2012. The remaining purchase price will be determined under a formula set forth in the agreement, which is based upon the financial results of SWH from 2010 through 2012. We recorded all SWH's identifiable assets, SWH's liabilities assumed and the noncontrolling interest at fair value under the acquisition method. Due to our obligation to purchase the remaining 45% interest, the noncontrolling interest is classified as a liability, with adjustments to the liability recorded as interest expense. We recorded a liability of $181.8 million for the initial value of the projected payments for the remaining 45% interest, based on probability-weighted projected earnings before interest, taxes, depreciation and amortization (as defined in the agreement) of the acquired business and cash distributions that are required by the agreement to be disbursed for 2010 through 2012, using a discount factor based on an estimated weighted average cost of capital. At December 31, 2010, the fair value of the liability was
- 70 -
$191.0 million, with $14.9 million recorded as interest expense and $5.7 million of payments recorded during 2010. Projected payments amount to $14.8 million in 2011, $219.2 million in 2012 and $7.0 million in 2013.
We pursued the acquisition of SWH to increase our presence in the contemporary footwear market and to further develop a business portfolio with significant growth opportunities. SWH's wholesale footwear business is reported in our wholesale footwear and accessories segment, its retail business is reported in our retail segment, and its licensing business is reported in our licensing, eliminations and other segment.
The following table summarizes the fair values of the assets acquired and liabilities assumed from SWH on June 2, 2010.
| (In millions) | | Amortization life (in months) | | | Fair Value | |
| Cash | | | | $ | 21.0 | |
| Accounts receivable | | | | | 20.1 | |
| Inventories | | | | | 18.9 | |
| Other current assets | | | | | 1.5 | |
| Property, plant and equipment | | | | | 19.4 | |
| Intangible assets: | | | | | | |
| Trademarks | | | | | 154.1 | |
| Goodwill | | | | | 115.1 | |
| Customer relationships | | 120 | | | 20.2 | |
| Covenant not to compete | | 55 | | | 3.5 | |
| Order backlog | | 9 | | | 10.5 | |
| Favorable lease agreements | | 139 | | | 6.1 | |
| Licensing agreements | | 55 | | | 3.6 | |
| Other noncurrent assets | | | | | 0.7 | |
| Total assets acquired | | | | | 394.7 | |
| Cash distributions payable | | | | | 19.0 | |
| Current liabilities | | | | | 10.6 | |
| Unfavorable lease agreements | | 73 | | | 2.7 | |
| Other long-term liabilities | | | | | 0.3 | |
| Total liabilities assumed | | | | | 32.6 | |
| Total purchase price | | | | $ | 362.1 | |
The gross contractual accounts receivable acquired from SWH was $24.4 million.
The acquisition resulted in the recognition of $115.1 million of goodwill, which is expected to be deductible for tax purposes. Goodwill largely consists of expected synergies resulting from the acquisition, such as the elimination of redundant corporate overhead for shared services and governance, the acquired assembled workforce, which does not qualify as an amortizable intangible asset, and the potential for product extensions, such as apparel.
The following table provides total revenues and results of operations from the acquired SWH business included in our results since the acquisition.
| (In millions) | | | | | | |
| Total revenues | | | | $ | 129.2 | |
| Loss before provision for income taxes | | | | | (7.5 | ) |
The following table provides pro forma total revenues and results of operations for 2010 and 2009 as if Moda and SWH had been acquired on January 1, 2009. The unaudited pro forma results reflect certain adjustments related to the acquisitions, such as amortization expense on intangible assets acquired from Moda and SWH resulting from the fair valuation of assets acquired. The pro forma results do not include any anticipated cost synergies or other effects of the planned integration of Moda or SWH. Accordingly,
- 71 -
such pro forma amounts are not necessarily indicative of the results that actually would have occurred had the acquisitions been completed at the beginning of 2009, nor are they indicative of the future operating results of the combined companies.
| (In millions, except per share amounts) | | | | | | |
| | | 2010 | | | 2009 | |
| Total revenues | $ | 3,726.0 | | $ | 3,536.5 | |
| Net income (loss) | | 59.0 | | | (97.8 | ) |
| Earnings (loss) per share attributable to Jones | | | | | | |
| Basic | | 0.68 | | | (1.15 | ) |
| Diluted | | 0.68 | | | (1.15 | ) |
The pro forma earnings for 2010 were adjusted to exclude $6.0 million of acquisition-related expenses incurred in 2010 and $12.1 million of nonrecurring expense related to the fair value of acquisition-date order backlogs. The pro forma earnings for 2009 were adjusted to include the $12.1 million of nonrecurring expense related to the fair value of acquisition-date order backlogs..
Acquisition Expenses
During 2010, pretax charges totaling $0.6 million and $5.4 million were recorded for legal expenses and other transactions related to the Moda and SWH acquisitions, respectively. These charges, which were expensed in accordance with the accounting guidance for business combinations, were recorded as SG&A costs in our licensing, other and eliminations segment.
ACCOUNTS RECEIVABLE AND SIGNIFICANT CUSTOMERS
Accounts receivable consist of the following:
| December 31, | | 2010 | | | 2009 | |
| (In millions) | | | | | | |
| | | | | | | |
| Trade accounts receivable | $ | 374.1 | | $ | 327.9 | |
| Allowances for doubtful accounts, returns, discounts and co-op advertising | | (28.5 | ) | | (24.8 | ) |
| | $ | 345.6 | | $ | 303.1 | |
A significant portion of our sales are to retailers throughout the United States and Canada. We have one significant customer in our wholesale better apparel, wholesale jeanswear and wholesale footwear and accessories operating segments. Macy's, Inc. accounted for approximately 20%, 21% and 21% of consolidated gross revenues for 2010, 2009 and 2008, respectively, and accounted for approximately 18% and 17% of accounts receivable at December 31, 2010 and 2009, respectively.
Due to our 25% ownership interest in GRI, GRI is deemed to be a related party. Included in accounts receivable are amounts due from GRI in the amount of $25.4 million and $40.7 million at December 31, 2010 and 2009, respectively. Net revenues from GRI amounted to $71.6 million, $47.0 million and $61.1 million for 2010, 2009 and 2008, respectively. On April 23, 2009, we converted $10.0 million of outstanding GRI accounts receivable to a three-year interest-bearing convertible note. GRI has the option, during the 90-day period that begins when the audited financial statements for the GRI fiscal year ending January 31, 2011 become available (or such shorter period that ends on the maturity date of the note), to convert the note into common shares of GRI at a conversion rate based on the greater of eight times the net income of GRI for such fiscal year, or an appraised value determined as of that date.
DISCONTINUED OPERATIONS
On September 6, 2007, we completed the sale of Barneys to an affiliate of Istithmar PJSC. In 2007, we recognized a net after-tax gain on the sale of $254.2 million. In 2008, we reached final settlement on certain liabilities remaining from the sale, resulting in an additional after-tax gain of $0.9 million. The results of operations of Barneys have been reported as discontinued operations in 2008.
- 72 -
ACCRUED RESTRUCTURING COSTS
Manufacturing Restructuring
On September 12, 2006, we announced the closing of certain El Paso, Texas and Mexican operations related to the decision by Polo Ralph Lauren Corporation ("Polo") to discontinue the Polo Jeans Company product line (the "manufacturing restructuring"), which we produced for Polo subsequent to the sale of the Polo Jeans Company business to Polo in February 2006. In connection with the closings, we incurred $6.9 million of one-time termination benefits and associated employee costs for 1,838 employees and $1.0 million of other costs. Of this amount, $2.3 million has been recorded as an SG&A expense and $5.6 million was recorded as cost of sales in the wholesale jeanswear segment. At that time, we also determined the estimated fair value of the property, plant and equipment employed in Mexico was less than its carrying value. As a result, we recorded an impairment loss of $8.6 million, which was reported as cost of sales in the wholesale jeanswear segment in 2006. The closings were substantially completed by the end of March 2007. On May 8, 2008, we sold the Mexican operations for $5.9 million, resulting in a gain of $0.2 million.
The details of the manufacturing restructuring accruals are as follows:
| (In millions) | | | | | One-time termination benefits | | | Other associated costs | | | Total manufacturing restructuring | |
| Balance, January 1, 2008 | | | | $ | 0.3 | | $ | 0.9 | | $ | 1.2 | |
| Reversals | | | | | (0.2 | ) | | (0.4 | ) | | (0.6 | ) |
| Payments and reductions | | | | | (0.1 | ) | | (0.4 | ) | | (0.5 | ) |
| Balance, December 31, 2008 | | | | | - | | | 0.1 | | | 0.1 | |
| Reversals | | | | | - | | | (0.1 | ) | | (0.1 | ) |
| Balance, December 31, 2009 and 2010 | | | | $ | - | | $ | - | | $ | - | |
During 2008, $0.1 million of the termination benefits accrual were utilized (relating to severance for three employees).
Moderate Apparel Restructuring
In connection with the exit from and reorganization of certain moderate apparel product lines, we decided to close certain New York offices, and on October 9, 2007, we announced the closing of warehouse facilities in Goose Creek, South Carolina. We recorded $7.2 million of one-time termination benefits and associated employee costs for approximately 440 employees. During 2008 and 2009, we recorded $0.9 million and $3.3 million of lease obligation costs and in 2010, we reversed $1.4 million of the lease obligation costs relating to a sublease of one of the warehouse facilities. All costs are reported as SG&A expenses in our wholesale jeanswear segment. These closings were substantially complete by the end of February 2008.
The details of the moderate apparel restructuring accruals are as follows:
| (In millions) | | | | | One-time termination benefits | | | Lease obligations | | | Total moderate apparel restructuring | |
| Balance, January 1, 2008 | | | | $ | 5.7 | | $ | - | | $ | 5.7 | |
| (Reversals) additions | | | | | (0.5 | ) | | 0.9 | | | 0.4 | |
| Payments and reductions | | | | | (4.3 | ) | | (0.6 | ) | | (4.9 | ) |
| Balance, December 31, 2008 | | | | | 0.9 | | | 0.3 | | | 1.2 | |
| (Reversals) additions | | | | | (0.2 | ) | | 3.3 | | | 3.1 | |
| Payments and reductions | | | | | (0.7 | ) | | (1.6 | ) | | (2.3 | ) |
| Balance, December 31, 2009 | | | | | - | | | 2.0 | | | 2.0 | |
| Reversals | | | | | - | | | (1.4 | ) | | (1.4 | ) |
| Payments and reductions | | | | | - | | | (0.3 | ) | | (0.3 | ) |
| Balance, December 31, 2010 | | | | $ | - | | $ | 0.3 | | $ | 0.3 | |
- 73 -
During 2008 and 2009, $4.3 million and $0.7 million of the termination benefits accrual were utilized (relating to full or partial severance for 328 and one employees, respectively). The net accrual of $2.0 million at December 31, 2009 is reported as $0.7 million of accrued expenses and other current liabilities and $1.3 million of other noncurrent liabilities. The net accrual of $0.3 million at December 31, 2010 is reported as $0.1 million of accrued expenses and other current liabilities and $0.2 million of other noncurrent liabilities.
Jewelry
During 2009, we decided to discontinue the domestic manufacturing, product development and sourcing activities of our jewelry business, and also announced the closing of our jewelry distribution center during 2010. We accrued $6.3 million and $1.0 million in 2009 and 2010, respectively, of termination benefits and associated employee costs for approximately 152 employees. These costs are reported as SG&A expenses in the wholesale footwear and accessories segment.
The details of the jewelry restructuring accruals are as follows:
| (In millions) | | | | | One-time termination benefits | | | Lease obligations | | | Total jewelry restructuring | |
| Balance, January 1, 2009 | | | | $ | - | | $ | - | | $ | - | |
| Additions | | | | | 6.3 | | | - | | | 6.3 | |
| Payments and reductions | | | | | (3.4 | ) | | - | | | (3.4 | ) |
| Balance, December 31, 2009 | | | | | 2.9 | | | - | | | 2.9 | |
| Reversals | | | | | 1.0 | | | 2.7 | | | 3.7 | |
| Payments and reductions | | | | | (2.6 | ) | | (0.4 | ) | | (3.0 | ) |
| Balance, December 31, 2010 | | | | $ | 1.3 | | $ | 2.3 | | $ | 3.6 | |
During 2009 and 2010, $3.4 million and $2.6 million of the termination benefits accrual were utilized (relating to full or partial severance for 80 and 85 employees, respectively). The net accrual of $2.9 million at December 31, 2009 is reported as accrued expenses and other current liabilities. The net accrual of $3.6 million at December 31, 2010 is reported as $2.1 million of accrued expenses and other current liabilities and $1.5 million of other noncurrent liabilities.
Texas Warehouse
On December 1, 2009, we announced the closing of warehouse facilities in Socorro, Texas. We accrued $3.4 million of termination benefits and associated employee costs for 220 employees. During 2010, we recorded $6.9 million of lease obligation costs relating to the warehouse. These costs are reported as SG&A expenses in the wholesale jeanswear segment. The closing was substantially completed by the end of April 2010.
The details of the Texas warehouse restructuring accruals are as follows:
| (In millions) | | | | | One-time termination benefits | | | Lease obligations | | | Total Texas warehouse restructuring | |
| Balance, January 1, 2009 | | | | $ | - | | $ | - | | $ | - | |
| Additions | | | | | 3.1 | | | - | | | 3.1 | |
| Balance, December 31, 2009 | | | | | 3.1 | | | - | | | 3.1 | |
| Additions | | | | | 0.3 | | | 6.9 | | | 7.2 | |
| Payments and reductions | | | | | (3.4 | ) | | (2.8 | ) | | (6.2 | ) |
| Balance, December 31, 2010 | | | | $ | - | | $ | 4.1 | | $ | 4.1 | |
During 2010, $3.4 million of the accruals relating to termination benefits were utilized (relating to severance for 220 employees). The accrual of $3.1 million at December 31, 2009 is reported as accrued expenses and other current liabilities. The net accrual of $4.1 million at December 31, 2010 is reported as accrued expenses and other current liabilities.
- 74 -
Other Restructurings
Retail Stores. In 2007, we discontinued our Anne Klein Accessories retail concept. We accrued $0.1 million of one-time termination benefits and associated employee costs in 2007 for 26 employees. These amounts, which are reported as SG&A expenses in the retail segment, were paid in 2008.
We continue to review our retail operations for underperforming locations. As a result of this review, we have decided to close retail locations that no longer provide strategic benefits. During 2009 and 2010, we closed 99 and 191 locations, respectively, and anticipate closing additional locations in 2011. We accrued $4.6 million and $3.0 million of termination benefits and associated employee costs during 2009 and 2010, respectively, for approximately 1,585 employees, including both store employees and administrative support personnel. In connection with our decision to close these stores, we reviewed the associated long-term assets for impairments. As a result of this review, we recorded $23.2 million and $9.0 million of impairment losses in 2009 and 2010, respectively, on leasehold improvements and furniture and fixtures located in the stores to be closed. These costs are reported as SG&A expenses in the retail segment.
Edison Warehouse. On October 17, 2007, we announced the closing of warehouse facilities in Edison, New Jersey. In connection with the closing, we accrued $2.6 million of one-time termination benefits and associated employee costs for 158 employees. These costs are reported as SG&A expenses in the wholesale jeanswear segment. The closing was substantially complete by the end of June 2008.
Acquisition Restructurings. In connection with the acquisitions of McNaughton (in 2001), Kasper (in 2003) and Maxwell (in 2004), we assessed and formulated plans to restructure certain operations of each company. These plans involved the closure of manufacturing facilities, certain offices, foreign subsidiaries, and selected domestic and international retail locations. The objectives of the plans were to eliminate unprofitable or marginally profitable lines of business and reduce overhead expenses. These costs were reported as a component of goodwill.
The details of these restructuring accruals are as follows:
| (In millions) | | | | | Retail stores | | | Edison warehouse | | | Acquisitions | |
| Balance, January 1, 2008 | | | | $ | 0.1 | | $ | 2.8 | | $ | 1.2 | |
| Reversals | | | | | - | | | (0.2 | ) | | - | |
| Payments and reductions | | | | | (0.1 | ) | | (2.2 | ) | | (0.4 | ) |
| Balance, December 31, 2008 | | | | | - | | | 0.4 | | | 0.8 | |
| Additions | | | | | 4.6 | | | - | | | - | |
| Payments and reductions | | | | | (2.7 | ) | | (0.4 | ) | | (0.3 | ) |
| Balance, December 31, 2009 | | | | | 1.9 | | | - | | | 0.5 | |
| Additions | | | | | 3.0 | | | - | | | - | |
| Payments and reductions | | | | | (2.7 | ) | | - | | | (0.2 | ) |
| Balance, December 31, 2010 | | | | $ | 2.2 | | $ | - | | $ | 0.3 | |
During 2008, 2009 and 2010, $2.3 million, $3.1 million and $2.7 million of the accruals relating to termination benefits for the retail stores and Edison warehouse were utilized (relating to partial or full severance for 180, 378 and 871 employees, respectively). The net accrual of $2.4 million at December 31, 2009 is reported as $1.9 million of accrued expenses and other current liabilities and $0.5 million of other noncurrent liabilities. The net accrual of $2.5 million at December 31, 2010 is reported as $2.1 million of accrued expenses and other current liabilities and $0.4 million of other noncurrent liabilities.
- 75 -
PROPERTY, PLANT AND EQUIPMENT
Major classes of property, plant and equipment are as follows:
| December 31, | | 2010 | | | 2009 | | Useful lives (years) |
| (In millions) | | | | | | | |
| | | | | | | | |
| Land and buildings | $ | 73.2 | | $ | 73.1 | | 10 - 20 |
| Leasehold improvements | | 245.3 | | | 246.9 | | 1 - 30 |
| Machinery, equipment and software | | 387.1 | | | 385.2 | | 2 - 40 |
| Furniture and fixtures | | 62.5 | | | 66.0 | | 5 - 25 |
| Construction in progress | | 11.4 | | | 7.2 | | - |
| | | 779.5 | | | 778.4 | | |
| Less: accumulated depreciation and amortization | | 553.1 | | | 539.4 | | |
| | $ | 226.4 | | $ | 239.0 | | |
Depreciation and amortization expense relating to property, plant and equipment (including capitalized leases) reflected in results from continuing operations was $64.6 million, $67.5 million and $76.3 million in 2010, 2009 and 2008, respectively. At December 31, 2010, we had outstanding commitments of approximately $26.2 million relating primarily to the construction or remodeling of retail store locations and office facilities.
Included in property, plant and equipment are the following capitalized leases:
| December 31, | | 2010 | | | 2009 | | Useful lives (years) |
| (In millions) | | | | | | | |
| | | | | | | | |
| Buildings | $ | 37.8 | | $ | 37.8 | | 10 - 20 |
| Machinery and equipment | | 14.0 | | | 14.0 | | 2 - 5 |
| | | 51.8 | | | 51.8 | | |
| Less: accumulated amortization | | 29.7 | | | 25.4 | | |
| | $ | 22.1 | | $ | 26.4 | | |
GOODWILL AND OTHER INTANGIBLE ASSETS
Goodwill represents the excess of the purchase price and related costs over the value assigned to net tangible and identifiable intangible assets of businesses acquired and accounted for under the purchase method. Accounting rules require that we test at least annually for possible goodwill impairment. We perform our test in the fourth fiscal quarter of each year using a discounted cash flow analysis that requires that certain assumptions and estimates be made regarding industry economic factors and future profitability and cash flows. As a result of the 2008 impairment analysis, we determined that the goodwill balance existing in our wholesale footwear and accessories segment was impaired as a result of decreases in projected revenues and profitability for the segment. Accordingly, we recorded an impairment charge of $813.2 million. As a result of the 2009 impairment analysis, we determined that the goodwill balance existing in our retail segment was impaired as a result of decreases in projected revenues and profitability for the segment. Accordingly, we recorded an impairment charge of $120.6 million.
The changes in the carrying amount of goodwill for 2009 and 2010, by segment and in total, are as follows:
- 76 -
| (In millions) | | Wholesale Better Apparel | | | Wholesale Jeanswear | | | Wholesale Footwear & Accessories | | | Retail | | | Total | |
| Balance, January 1, 2009 | | | | | | | | | | | | | | | |
| Goodwill | $ | 40.1 | | $ | 519.2 | | $ | 813.2 | | $ | 120.6 | | $ | 1,493.1 | |
| Accumulated impairment losses | | - | | | (519.2 | ) | | (813.2 | ) | | - | | | (1,332.4 | ) |
| Net goodwill | | 40.1 | | | - | | | - | | | 120.6 | | | 160.7 | |
| Impairment loss | | - | | | - | | | - | | | (120.6 | ) | | (120.6 | ) |
| Balance, December 13, 2009 | | | | | | | | | | | | | | | |
| Goodwill | | 40.1 | | | 519.2 | | | 813.2 | | | 120.6 | | | 1,493.1 | |
| Accumulated impairment losses | | - | | | (519.2 | ) | | (813.2 | ) | | (120.6 | ) | | (1,453.0 | ) |
| Net goodwill | | 40.1 | | | - | | | - | | | - | | | 40.1 | |
| Acquisition of Moda | | 6.6 | | | - | | | - | | | - | | | 6.6 | |
| Acquisition of SWH | | - | | | - | | | 115.1 | | | - | | | 115.1 | |
| Balance, December 13, 2010 | | | | | | | | | | | | | | | |
| Goodwill | | 46.7 | | | 519.2 | | | 928.3 | | | 120.6 | | | 1,614.8 | |
| Accumulated impairment losses | | - | | | (519.2 | ) | | (813.2 | ) | | (120.6 | ) | | (1,453.0 | ) |
| Net goodwill | $ | 46.7 | | $ | - | | $ | 115.1 | | $ | - | | $ | 161.8 | |
We also perform our annual impairment test for indefinite-lived trademarks during the fourth fiscal quarter of the year. As a result of the 2008 impairment analysis, we recorded trademark impairment charges of $25.2 million as a result of decreases in projected revenues for certain brands. As a result of the 2009 impairment analysis, we recorded trademark impairment charges of $28.7 million as a result of decreases in projected revenues for certain brands. As a result of the 2010 impairment analysis, we recorded trademark impairment charges of $37.6 million as a result of decreases in projected revenues for certain brands. All trademark impairment charges are reported as SG&A expenses in the licensing, other and eliminations segment.
The components of other intangible assets are as follows:
| December 31, | | 2010 | | 2009 |
| (In millions) | | | Gross Carrying Amount | | | Accumulated Amortization | | | Gross Carrying Amount | | | Accumulated Amortization |
| Amortized intangible assets | | | | | | | | | | | | |
| License agreements | | $ | 61.4 | | $ | 50.2 | | $ | 60.5 | | $ | 48.1 |
| Customer relationships | | | 28.1 | | | 1.9 | | | - | | | - |
| Trademarks | | | 17.0 | | | 0.8 | | | - | | | - |
| Acquired order backlog | | | 10.5 | | | 10.4 | | | - | | | - |
| Acquired favorable leases | | | 6.4 | | | 0.4 | | | 0.5 | | | 0.3 |
| Covenants not to compete | | | 3.8 | | | 0.5 | | | - | | | - |
| | | 127.2 | | | 64.2 | | | 61.0 | | | 48.4 |
| Indefinite-life trademarks | | | 663.7 | | | - | | | 547.2 | | | - |
| | $ | 790.9 | | $ | 64.2 | | $ | 608.2 | | $ | 48.4 |
Amortization expense for intangible assets subject to amortization was $18.1 million, $2.3 million and $2.8 million for 2010, 2009 and 2008, respectively. Amortization expense for intangible assets subject to amortization for each of the years in the five-year period ending December 31, 2015 is estimated to be $7.5 million in 2011, $7.2 million in 2012, $6.6 million in 2013, $6.5 million in 2014 and $5.5 million in 2015.
The cash flow models we use to estimate the fair values of our goodwill and trademarks involve several assumptions. Changes in these assumptions could materially impact our fair value estimates. Assumptions critical to our fair value estimates are: (i) discount rates used to derive the present value
- 77 -
factors used in determining the fair value of the reporting units and trademarks; (ii) royalty rates used in our trademark valuations; (iii) projected revenue growth rates; and (iv) projected long-term growth rates used in the derivation of terminal year values. These and other assumptions are impacted by economic conditions and expectations of management and may change in the future based on period-specific facts and circumstances. The following table shows the assumptions we used to derive our fair value estimates as part of our annual impairment testing for 2010 and 2009.
| 2010 | | 2009 |
| | Goodwill | Trademarks | | Goodwill | Trademarks |
| Discount rates | 13.5% | 13.5% | | 12.9% | 12.9% |
| Royalty rates | -- | 4.0% - 7.0% | | -- | 4.0% - 7.0% |
| Weighted-average revenue growth rates | 6.6% | 4.4% | | 2.3% | 6.1% |
| Long-term growth rates | 3.0% | 0% - 3.0% | | 3.0% | 0% - 3.0% |
FAIR VALUES
ASC Subtopic 820-10 defines fair value as the price that would be received to sell an asset or paid to transfer a liability in an orderly transaction between market participants at the measurement date. ASC Subtopic 820-10 outlines a valuation framework, creates a fair value hierarchy in order to increase the consistency and comparability of fair value measurements, and details the disclosures that are required for items measured at fair value. We currently do not have non-financial assets and non-financial liabilities that are required to be measured at fair value on a recurring basis. We are permitted to choose to measure many financial instruments and certain other items at fair value, although we did not elect the fair value measurement option for any of our financial assets or liabilities.
We have several financial instruments that must be measured under the fair value standard, including derivatives, the assets and liabilities of The Jones Group Inc. Deferred Compensation Plan (the "Rabbi Trust") and deferred director fees that are valued based on the quoted market price of our common stock. Our financial assets and liabilities are to be measured using inputs from the three levels of the fair value hierarchy, which are as follows:
- Level 1 - inputs are unadjusted quoted prices in active markets for identical assets or liabilities that we have the ability to access at the measurement date;
- Level 2 - inputs include quoted prices for similar assets and liabilities in active markets, quoted prices for identical or similar assets or liabilities in markets that are not active, inputs other than quoted prices that are observable for the asset or liability (i.e., interest rates, yield curves, etc.), and inputs that are derived principally from or corroborated by observable market data by correlation or other means (market corroborated inputs); and
- Level 3 - unobservable inputs that reflect our assumptions about the assumptions that market participants would use in pricing assets or liabilities based on the best information available.
Assets and Liabilities Measured at Fair Value on a Recurring Basis
In accordance with the fair value hierarchy described above, the following table shows the fair value of our financial assets and liabilities that are required to be measured at fair value on a recurring basis at December 31, 2009 and 2010.
- 78 -
| (In millions) | Classification | | Total Value | | | Quoted prices in active markets for identical assets (Level 1) | | | Significant other observable inputs (Level 2) | | | Significant unobservable inputs (Level 3) |
| Description |
| December 31, 2009: | | | | | | | | | | | | |
| Rabbi Trust assets | Prepaid expenses and other current assets | $ | 7.8 | | $ | 7.8 | | $ | - | | $ | - |
| | Total assets | $ | 7.8 | | $ | 7.8 | | $ | - | | $ | - |
| Rabbi Trust liabilities | Accrued employee compensation and benefits | $ | 7.8 | | $ | 7.8 | | $ | - | | $ | - |
| Canadian Dollar - U.S. Dollar forward contracts | Accrued expenses and other current liabilities | | 0.2 | | | - | | | 0.2 | | | - |
| Deferred director fees | Accrued expenses and other current liabilities | | 1.1 | | | 1.1 | | | - | | | - |
| | Total liabilities | $ | 9.1 | | $ | 8.9 | | $ | 0.2 | | $ | - |
| December 31, 2010: | | | | | | | | | | | | |
| Rabbi Trust assets | Prepaid expenses and other current assets | $ | 9.1 | | $ | 9.1 | | $ | - | | $ | - |
| Interest rate cap | Other long-term assets | | 1.3 | | | - | | | 1.3 | | | - |
| | Total assets | $ | 10.4 | | $ | 9.1 | | $ | 1.3 | | $ | - |
| Rabbi Trust liabilities | Accrued employee compensation and benefits | $ | 9.1 | | $ | 9.1 | | $ | - | | $ | - |
| Canadian Dollar - U.S. Dollar forward contracts | Accrued expenses and other current liabilities | | 0.5 | | | - | | | 0.5 | | | - |
| Interest rate swaps | Other long-term liabilities | | 0.6 | | | - | | | 0.6 | | | - |
| Deferred director fees | Accrued expenses and other current liabilities | | 1.2 | | | 1.2 | | | - | | | - |
| Acquisition consideration | Current portion of acquisition consideration payable | | 14.1 | | | - | | | - | | | 14.1 |
| 5.125% Senior Notes due 2014 | Long-term debt | | 260.0 | | | - | | | 260.0 | | | - |
| Acquisition consideration | Acquisition consideration payable, net of current portion | | 199.8 | | | - | | | - | | | 199.8 |
| | Total liabilities | $ | 485.3 | | $ | 10.3 | | $ | 261.1 | | $ | 213.9 |
The following table presents the changes in Level 3 acquisition consideration liabilities for 2010.
| (In millions) | | | | | Acquisition of Moda | | | Acquisition of SWH | | | Total Acquisition Consideration Payable | |
| Beginning balance, January 1, 2010 | | | | $ | - | | $ | - | | $ | - | |
| Acquisition | | | | | 18.8 | | | 181.8 | | | 200.6 | |
| Payments | | | | | - | | | (5.7 | ) | | (5.7 | ) |
| Total adjustments included in earnings | | | | | 4.1 | | | 14.9 | | | 19.0 | |
| Balance, October 2, 2010 | | | | $ | 22.9 | | $ | 191.0 | | $ | 213.9 | |
Assets and Liabilities Measured at Fair Value on a Nonrecurring Basis
In accordance with the fair value hierarchy described above, the following table shows the fair value of our non-financial assets and liabilities that were measured at fair value on a nonrecurring basis at December 31, 2010, and the total losses recorded as a result of the remeasurement process.
- 79 -
| (In millions) | | | | | Fair Value Measurements Using | | | |
| Description | | Carrying Value | | | Quoted prices in active markets for identical assets (Level 1) | | | Significant other observable inputs (Level 2) | | | Significant unobservable inputs (Level 3) | | | Total losses recorded during year |
| At December 31, 2009: | | | | | | | | | | | | | | |
| Property and equipment | $ | - | | $ | - | | $ | - | | $ | - | | $ | 24.4 |
| Trademarks | | 118.2 | | | - | | | - | | | 118.2 | | | 28.7 |
| Goodwill | | - | | | - | | | - | | | - | | | 120.6 |
| At December 31, 2010: | | | | | | | | | | | | | | |
| Property and equipment | $ | - | | $ | - | | $ | - | | $ | - | | $ | 9.0 |
| License agreement | | - | | | - | | | - | | | - | | | 2.6 |
| Trademarks | | 107.2 | | | - | | | - | | | 107.2 | | | 37.6 |
During 2009 and 2010, property and equipment utilized in our retail operations with a carrying amount of $24.4 million and $9.0 million, respectively, were written down to a fair value of zero, primarily as a result of our decision to close underperforming retail locations. These losses were recorded as SG&A expenses in the retail segment. During 2009, trademarks with a carrying amount of $146.9 million were written down to a fair value of $118.2 million and the $120.6 million of goodwill assigned to our retail segment was written down to a fair value of zero. During 2010, trademarks with a carrying amount of $144.8 million were written down to a fair value of $107.2 million. During 2010, we wrote off the value of an intangible asset associated with a handbag license with a carrying value of $2.6 million due to the deteriorating financial condition of the licensee. The loss was recorded as an SG&A expense in the licensing, other and eliminations segment. For further information regarding the losses recorded for trademarks and goodwill, see "Goodwill and Other Intangible Assets."
Financial Instruments
As a result of our global operating and financing activities, we are exposed to changes in interest rates and foreign currency exchange rates which may adversely affect results of operations and financial condition. In seeking to minimize the risks and/or costs associated with such activities, we manage exposure to changes in interest rates and foreign currency exchange rates through our regular operating and financing activities and, when deemed appropriate, through the use of derivative financial instruments. The instruments eligible for utilization include forward, option, swap and cap agreements. We do not use financial instruments for trading or other speculative purposes. At December 31, 2010, we had the following derivative financial instruments outstanding:
- foreign exchange contracts to exchange Canadian Dollars for a total notional value of US $20.3 million at a weighted average exchange rate of $1.03 maturing through November 2011;
- interest rate swaps to convert our $250 million Senior Notes due 2014 to variable-rate debt; and
- an interest rate cap to limit our exposure to increases in the variable rates of our interest rate swaps.
At December 31, 2010 and 2009, the fair values of cash and cash equivalents, receivables and accounts payable approximated their carrying values due to the short-term nature of these instruments. The fair value of the note receivable from GRI approximates the $10.0 million carrying value as it is a variable-rate instrument. The estimated fair values of other financial instruments subject to fair value disclosures, determined based on broker quotes or quoted market prices or exchange rates for the same or similar instruments, and the related carrying amounts are as follows:
- 80 -
| December 31, | | 2009 | | 2008 | |
| (In millions) | | Carrying Amount | | Fair Value | | Carrying Amount | | Fair Value | |
| Long-term debt, including current portion | | $ | 510.0 | | $ | 459.4 | | $ | 499.5 | | $ | 449.4 | |
| Interest rate cap, net asset | | | 1.3 | | | 1.3 | | | - | | | - | |
| Interest rate swaps, net liability | | | 0.6 | | | 0.6 | | | - | | | - | |
| Canadian Dollar - U.S. Dollar forward contracts, net liability | | | 0.5 | | | 0.5 | | | 0.2 | | | 0.2 | |
Financial instruments expose us to counterparty credit risk for nonperformance and to market risk for changes in interest and currency rates. We manage exposure to counterparty credit risk through specific minimum credit standards and procedures to monitor the amount of credit exposure. Our financial instrument counterparties are substantial investment or commercial banks with significant experience with such instruments.
CREDIT FACILITIES
We have a secured revolving credit agreement expiring on May 13, 2015 (the "Credit Facility") with several lending institutions to borrow an aggregate principal amount of up to $650 million. Up to the entire amount of the facility is available for cash borrowings, with up to $400 million available for trade letters of credit, up to $50 million available for standby letters of credit, and a subfacility available to our Canadian subsidiaries of up to $25 million for letters of credit and borrowings. Borrowings under the Credit Facility may be used to refinance existing indebtedness and for general corporate purposes in the ordinary course of business. Such borrowings bear interest either based on the alternate base rate, as defined in the Credit Facility, or based on Eurocurrency rates, each with a margin that depends on the availability remaining under the Credit Facility. The Credit Facility contains customary events of default.
Availability under the Credit Facility is determined with reference to a borrowing base consisting of a percentage of eligible inventory, accounts receivable, credit card receivables and licensee receivables, minus reserves determined by the joint collateral agents. At December 31, 2010, we had no cash borrowings and $28.5 million of letters of credit outstanding, and our remaining availability was $444.4 million. If availability under the Credit Facility falls below a stated level, we will be required to comply with a minimum fixed charge coverage ratio. The Credit Facility also contains affirmative and negative covenants that, among other things, will limit or restrict our ability to (1) incur indebtedness, (2) create liens, (3) merge, consolidate, liquidate or dissolve, (4) make investments (including acquisitions), loans or advances, (5) sell assets, (6) enter into sale and leaseback transactions, (7) enter into swap agreements, (8) make certain restricted payments (including dividends and other payments in respect of capital stock), (9) enter into transactions with affiliates, (10) enter into restrictive agreements, and (11) amend material documents. The Credit Facility is secured by a first priority lien on substantially all of our personal property.
In connection with the acquisition of SWH, we were required to amend certain covenants of our Credit Facility to allow the acquisition. These amendments were completed on May 5, 2010. On June 29, 2010, we completed an amendment and extension of our Credit Facility. The amended terms and conditions provide for an extension of the maturity date from March 13, 2012 to May 13, 2015. The amendment also provides for, among other things, the following changes to the Credit Facility: (1) a reduction in the interest rate spreads and commitment fees payable under the Credit Facility; (2) changes in the borrowing base eligibility criteria for accounts owing by certain customers, foreign accounts and inventory in transit; (3) changes in the calculation of the borrowing base relating to foreign accounts; (4) the establishment in the joint collateral agents' permitted discretion of reserves against the borrowing base for the Senior Notes due 2014; (5) the allowance of repayments and prepayments, including pursuant to open market purchases or a tender offer, of such notes subject to compliance with certain liquidity and/or other conditions; (6) an increase in the general debt basket from $300 million to $600 million and the addition of a new lien basket; and (7) an extension of the grace period for events of default arising from the amount of open account obligations exceeding the applicable cap therefor.
- 81 -
SWH has a $1.5 million unsecured borrowing facility with a lending institution that expires on October 1, 2011 and is renewable on an annual basis, under which no cash borrowings and $1.4 million in letters of credit were outstanding at December 31, 2010. Cash borrowings under this facility bear interest based on either the prevailing prime rate or the prevailing LIBOR rate plus 300 basis points. SWH also has a €0.3 million variable-rate unsecured borrowing facility with a European lending institution that expires in March 2011 and is renewable on an annual basis, under which no amounts were outstanding at December 31, 2010.
The weighted-average interest rate for our credit facilities, based on 30-day LIBOR borrowing rates, was 3.0% and 4.7% at December 31, 2010 and 2009, respectively.
LONG-TERM DEBT
Long-term debt consists of the following:
| December 31, | | 2010 | | | 2009 | |
| (In millions) | | | | | | |
| | | | | | | |
| Notes Payable, due 2014 | $ | 0.3 | | $ | - | |
| 5.125% Senior Notes due 2014, net of unamortized discount of $0.1 and $0.1 and including fair value adjustment of $10.1 in 2010 | | 260.0 | | | 249.9 | |
| 6.125% Senior Notes due 2034, net of unamortized discount of $0.3 and $0.4 | | 249.7 | | | 249.6 | |
| | | 510.0 | | | 499.5 | |
| Less current portion | | 0.1 | | | - | |
| | $ | 509.9 | | $ | 499.5 | |
Long-term debt maturities during the next five years amount to $0.1 million in 2011, $0.1 million in 2012, $0.1 million in 2013 and $250.0 million in 2014. All of our notes contain certain covenants, including, among others, restrictions on liens, sale-leaseback transactions and additional secured debt, and pay interest semiannually. The weighted-average interest rate of our long-term debt, excluding the effects of our interest rate swaps, was 5.6% at both December 31, 2010 and 2009.
On April 1, 2009, we commenced a cash tender offer to purchase any and all of our outstanding 4.250% Senior Notes due 2009 (the "2009 Notes"), as well as a consent solicitation to amend the indenture governing our outstanding 2009 Notes, our 5.125% Senior Notes due 2014 and our 6.125% Senior Notes due 2034 (collectively, the "Notes"). The purpose of the consent solicitation was to receive the consent of holders of at least a majority in principal amount of the Notes outstanding for proposed amendments to the Indenture to provide for a carveout to the lien covenant, for liens incurred in connection with the New Credit Facility. We received the required consents on April 15, 2009. The consideration for each $1,000 principal amount of 2009 Notes validly tendered pursuant to the tender offer was $980, and the consent fee for each $1,000 principal amount of Notes with respect to which holders validly delivered pursuant to the consent solicitation was $20.
Under the tender offer, we repurchased a total of $242.5 million of our outstanding 2009 Notes for a payment of $237.7 million, and we paid $12.9 million in consent fees to holders of the Notes and $1.8 million of related costs, resulting in a loss on debt extinguishment of $1.5 million. Of the consent fees paid, a net $7.1 million relates to the remaining outstanding Notes and will be amortized over the life of the remaining related Notes as additional interest expense.
On November 15, 2009, we redeemed the remaining $7.5 million outstanding 2009 Notes at maturity.
- 82 -
ACCUMULATED OTHER COMPREHENSIVE LOSS
Accumulated other comprehensive loss is comprised of the following:
| December 31, | | 2010 | | | 2009 | |
| (In millions) | | | | | | |
| | | | | | | |
| Foreign currency translation adjustments | $ | 8.3 | | $ | 7.2 | |
| Pension and postretirement liability adjustments | | (16.4 | ) | | (14.7 | ) |
| Unrealized losses on hedge contracts | | (0.3 | ) | | (0.1 | ) |
| $ | (8.4 | ) | $ | (7.6 | ) |
DERIVATIVES
We recognize all derivatives as either assets or liabilities on the balance sheet and measure those instruments at fair value. Additionally, the fair value adjustments will affect either equity or net income, depending on whether the derivative instrument qualifies as a hedge for accounting purposes and, if so, the nature of the hedging activity.
Interest Rate Swaps and Caps
On May 27, 2010, we entered into three interest rate swap transactions to effectively convert the entire amount of our $250 million fixed-rate 5.125% Senior Notes due 2014 (the "Notes") to variable-rate debt. Under the terms of the transactions, we were required to make semiannual variable-rate payments to the counterparties calculated based on three-month LIBOR rates (which are reset on the 15th day of each calendar quarter) plus 2.92%, and the counterparties were obligated to make semiannual fixed-rate payments to us of 5.125%. Concurrently, we also entered into an interest rate cap, at a cost of $2.7 million, that limits our three-month LIBOR rate exposure to 5.0%. The swap and cap transactions had an effective date of June 1, 2010 and a termination date of November 15, 2014, the date the Notes mature. On October 18, 2010, we de-designated the hedging relationship between the swaps and the Notes and received $10.2 million upon termination of the swaps. The related fair market valuation adjustment to the Notes will be amortized as a reduction of interest expense over the remaining life of the Notes.
On December 14, 2010, we entered into three additional interest rate swap transactions to effectively convert the entire amount of the Notes to variable-rate debt. Under the terms of the transactions, we are required to make semiannual variable-rate payments to the counterparties calculated based on three-month LIBOR rates (that are reset on the 15th day of each calendar quarter) plus 3.46%, and the counterparties were obligated to make semiannual fixed-rate payments to us of 5.125%. The swap transactions have an effective date of December 17, 2010 and a termination date of November 15, 2014, the date the Notes mature.
The swap transactions were designated as hedges of the fair value of the Notes. The fair values of the swaps are recorded either as an asset or a liability, with changes in their fair values recorded through interest expense. The changes in fair value of the Notes related to the hedged portion of the Notes are also recorded through interest expense. As these changes in fair value will not exactly offset each other, the net effect on earnings represents the ineffectiveness of the hedging instruments. We evaluate effectiveness under the "long haul" method of accounting. The interest rate cap has not been designated as a hedging instrument; as a result, all changes in the fair value of the cap are recorded through interest expense.
We recorded a net increase of $1.0 million in interest expense related to the ineffectiveness of the swaps and a $1.4 million increase in interest expense related to changes in the fair value of the cap for 2010.
- 83 -
Foreign Currency Forward Contracts
We use foreign currency forward contracts for the specific purpose of hedging the exposure to variability in forecasted cash flows associated primarily with inventory purchases. Fair values of foreign currency forward contracts are calculated by comparing each agreement's contractual exchange rate with the currency exchange forward and spot rates at the reporting date.
We have outstanding forward contracts to exchange Canadian Dollars for U.S. Dollars. These contracts are designated as cash flow hedges as the principal terms of the contracts are the same as the underlying forecasted foreign currency cash flows. Therefore, changes in the fair value of these forward contracts should be highly effective in offsetting changes in the expected foreign currency cash flows, and accordingly, changes in the fair value of these contracts are recorded in accumulated other comprehensive income, net of related tax effects, with the corresponding asset or liability recorded in the balance sheet. Amounts recorded in accumulated other comprehensive income are reflected in current-period earnings when the hedged transaction affects earnings.
The following summarizes the U.S. Dollar notional amount and the fair value of our foreign currency forward exchange contracts outstanding at December 31, 2010, which mature at various dates through November 2011.
| (In millions) | | December 31, 2010 | | December 31, 2009 | |
| | | | Notional amount | | | Fair value - other current liabilities | | | Notional amount | | | Fair value - other current liabilities | |
| Canadian Dollar - U.S. Dollar | | $ | 20.3 | | $ | 0.5 | | $ | 8.6 | | $ | 0.2 | |
The effect of our cash flow hedges on the statement of operations was as follows:
| (In millions) | Amount of Pretax (Loss) Gain Recognized in Other Comprehensive Income | | Location of Pretax Loss Reclassified from Other Comprehensive Income into Income | Amount of Pretax Loss Reclassified from Other Comprehensive Income into Income | |
| Derivative type | | 2010 | | | 2009 | | | 2008 | | | 2010 | | | 2009 | | | 2008 | |
| Foreign exchange contracts | $ | (0.3 | ) | $ | (1.1 | ) | $ | 1.2 | | Cost of sales | $ | (0.1 | ) | $ | (0.6 | ) | $ | (1.0 | ) |
Since the derivatives we use in our risk management strategies are highly effective hedges because all the critical terms of the derivative instruments match those of the hedged item, we record no ineffectiveness related to our cash flow hedges. If foreign currency exchange rates between the Canadian and U.S. Dollars do not change from their December 31, 2010 amounts, we estimate that any reclassifications from other comprehensive income to earnings within the next 12 months will not be material.
For additional information on our derivative instruments, see "Fair Values."
OBLIGATIONS UNDER CAPITAL LEASES
Obligations under capital leases consist of the following:
| December 31, | | 2010 | | | 2009 | |
| (In millions) | | | | | | |
| | | | | | | |
| Warehouses, office facilities and equipment | $ | 26.9 | | $ | 29.5 | |
| Less: current portion | | 1.7 | | | 2.6 | |
| Obligations under capital leases - noncurrent | $ | 25.2 | | $ | 26.9 | |
We lease an office facility in Bristol, Pennsylvania under a 20-year net lease that runs until July 2018 and requires minimum annual rent payments of approximately $1.1 million. The building was capitalized at $12.2 million, which approximated the present value of the minimum lease payments.
- 84 -
In 2003, we entered into a sale-leaseback agreement for our Virginia warehouse facility. This transaction resulted in a net gain of $7.5 million that has been deferred and is being amortized over the lease term, which runs until March 2023 and requires minimum annual rent payments of $2.4 million. The building was capitalized at $25.6 million, which approximated the present value of the minimum lease payments.
The following is a schedule by year of future minimum lease payments under capital leases, together with the present value of the net minimum lease payments as of December 31, 2010:
| Year Ending December 31, | | |
| (In millions) | | |
| | | |
| 2011 | $ | 3.5 |
| 2012 | | 3.6 |
| 2013 | | 3.6 |
| 2014 | | 3.7 |
| 2015 | | 3.7 |
| Later years | | 21.1 |
| Total minimum lease payments | | 39.2 |
| Less: amount representing interest | | 12.3 |
| Present value of net minimum lease payments | $ | 26.9 |
COMMON STOCK
The Board of Directors has authorized several programs to repurchase our common stock from time to time in open market transactions. We repurchased 740,000 shares of our common stock during 2010 for $10.7 million and no amounts were repurchased in 2009 or 2008. As of December 31, 2010, $293.4 million of Board authorized repurchases was still available. We may make additional share repurchases in the future depending on, among other things, market conditions and our financial condition, although any such repurchases will be subject to limitations under our current revolving credit agreement.
On November 16, 2010, we retired all our treasury shares and returned them to an authorized but unissued status. The carrying value of the treasury shares in excess of par was allocated on a pro rata basis to additional paid-in capital and retained earnings.
Our Board of Directors has authorized our common stock repurchases as a tax-effective means to enhance shareholder value and distribute cash to shareholders and, to a lesser extent, to offset the impact of dilution resulting from the issuance of shares of restricted stock and the exercise of employee stock options. We believe that we have sufficient sources of funds to repurchase shares without significantly impacting our short-term or long-term liquidity. In authorizing future share repurchase programs, our Board of Directors gives careful consideration to our projected cash flows, our existing capital resources and repurchase limitations under our current revolving credit agreement.
On September 6, 2007, we entered into an accelerated stock repurchase ("ASR") agreement with Goldman, Sachs & Co. ("Goldman") to repurchase $400 million of our outstanding common stock. Purchases under the ASR were subject to collar provisions that established minimum and maximum numbers of shares based generally on the volume-weighted average price of our common stock during the term of the ASR program. We received an initial delivery of 15.5 million shares on September 11, 2007 and a second delivery of 2.4 million shares on October 18, 2007. Final settlement of the ASR program was scheduled for no later than July 19, 2008 and could occur earlier at the option of Goldman or later under certain circumstances. On June 5, 2008, Goldman informed us that it had concluded the ASR. As a result, we received a final delivery of 3.2 million shares on June 10, 2008, bringing the aggregate number of shares received under the ASR program to 21.1 million shares. No cash was required to complete the final delivery of shares. The combined average price for the shares delivered under the ASR was $19.00 per share.
- 85 -
COMMITMENTS AND CONTINGENCIES
(a) CONTINGENT LIABILITIES. We have been named as a defendant in various actions and proceedings, including actions brought by certain employees whose employment has been terminated arising from our ordinary business activities. Although the amount of any liability that could arise with respect to these actions cannot be accurately predicted, in our opinion, any such liability will not have a material adverse effect on our financial position or results of operations.
(b) ROYALTIES. We have an exclusive licenses to produce and sell women's footwear under the Dockers(R) Women trademark in the United States (including its territories and possessions) pursuant to an agreement with Levi Strauss & Co. which expires on December 31, 2011. The agreement requires us to pay a percentage of net sales against guaranteed minimum royalty and advertising payments as set forth in the agreement.
We have an exclusive license to produce, market and distribute costume jewelry in the United States, Canada, Mexico and Japan under the Givenchy trademark pursuant to an agreement with Givenchy, which expires on December 31, 2011. The agreement requires us to pay a percentage of net sales against guaranteed minimum royalty and advertising payments as set forth in the agreement.
We have a sub-license agreement with VCJS LLC ("VCJS") to design, develop, produce and distribute in the United States, Mexico and Canada Jessica Simpson jeanswear and sportswear under the Jessica Simpson (signature) trademark which VCJS licenses from With You, Inc. ("WYI"). The agreement, which expires on December 31, 2014 (October 15, 2014 if the master license between WYI and VCJS is not renewed), requires us to pay a percentage of net sales against guaranteed minimum royalty and pooled marketing fee payments as set forth in the agreement. We have paid an advance of $0.3 million that will be applied against future royalties.
We have an exclusive licensing and distribution agreement with G-III Apparel Group, Ltd. to design, develop, produce and distribute men's jeans, casual pants, shorts, jackets, woven and knit tops, t-shirts and sweaters in the United States and its territories and possessions, including Puerto Rico, under the Andrew Marc, Marc New York and Marc Moto, A Rebel Division of Andrew Marc trademarks. The agreement, which expires on December 31, 2015, requires us to pay a percentage of net sales against guaranteed minimum royalty and pooled marketing fee payments as set forth in the agreement. The agreement contains renewal options under certain conditions through December 31, 2025.
We have an exclusive licensing and distribution agreement with BKA International, Inc. ("BKA") to create, produce, market and distribute footwear and accessory products in the United States and its territories and possessions, including Puerto Rico, and Canada under the B Brian Atwood trademark. The agreement, which expires on December 31, 2016, requires us to pay a percentage of net sales against guaranteed minimum royalty and creative director fees as set forth in the agreement. The agreement contains a renewal option under certain conditions through December 31, 2021. We have paid an advance of $1.0 million that will be applied against future royalties.
We have an exclusive licensing and distribution agreement with Sanctuary Clothing, Inc. to create, produce, market and distribute ready-to-wear women's clothing in the United States under the Live Life by Sanctuary trademark for sale exclusively to Sears and Sears.com. The agreement, which expires on December 31, 2013, requires us to pay a percentage of net sales as set forth in the agreement. No minimum payments are required under this agreement.
Minimum payments under these license agreements are as follows.
- 86 -
| Year Ending December 31, | | 2011 | | | 2012 | | | 2013 | | | 2014 | | | 2015 | | | 2016 |
| (In millions) | | | | | | | | | | | | | | | | | |
| | | | | | | | | | | | | | | | | | |
| Dockers(R) Women | $ | 0.7 | | $ | - | | $ | - | | $ | - | | $ | - | | $ | - |
| Givenchy | | 0.7 | | | - | | | - | | | - | | | - | | | - |
| Jessica Simpson (1) | | 0.7 | | | 1.5 | | | 2.2 | | | 2.9 | | | - | | | - |
| Andrew Marc | | 0.2 | | | 0.3 | | | 0.4 | | | 0.6 | | | 0.7 | | | - |
| B Brian Atwood (2) | | 0.6 | | | 0.6 | | | 1.1 | | | 1.4 | | | 1.6 | | | 1.7 |
| | $ | 2.9 | | $ | 2.4 | | $ | 3.7 | | $ | 4.9 | | $ | 2.3 | | $ | 1.7 |
| (1) - | does not reflect the application of a $0.3 million advance against future royalties. |
| (2) - | does not reflect the application of a $1.0 million advance against future royalties. |
(c) LEASES. Total rent expense charged to continuing operations for 2010, 2009 and 2008 was as follows.
| Year Ended December 31, | | 2010 | | | 2009 | | | 2008 | |
| (In millions) | | | | | | | | | |
| | | | | | | | | | |
| Minimum rent | $ | 108.8 | | $ | 121.5 | | $ | 130.2 | |
| Contingent rent | | - | | | 0.5 | | | 0.3 | |
| Less: sublease rent | | (2.9 | ) | | (3.5 | ) | | (7.6 | ) |
| | $ | 105.9 | | $ | 118.5 | | $ | 122.9 | |
The following is a schedule by year of minimum rental payments required under operating leases:
| Year Ending December 31, | | |
| (In millions) | | |
| | | |
| 2011 | $ | 113.0 |
| 2012 | | 103.6 |
| 2013 | | 94.6 |
| 2014 | | 86.4 |
| 2015 | | 76.9 |
| Later years | | 362.2 |
| $ | 836.7 |
Certain of the leases provide for renewal options and the payment of real estate taxes and other occupancy costs. Future rental commitments for leases have not been reduced by minimum non-cancelable sublease rentals aggregating $14.0 million.
- 87 -
STATEMENT OF CASH FLOWS
| Year Ended December 31, | | 2010 | | | 2009 | | | 2008 | |
| (In millions) | | | | | | | | | |
| Supplemental disclosures of cash flow information for continuing operations: | | | | | | | | | |
| | Cash paid (received) during the year for: | | | | | | | | | |
| Interest | $ | 36.4 | | $ | 43.9 | | $ | 45.6 | |
| | Net income tax payments (refunds) | | 39.5 | | | (1.9 | ) | | (16.0 | ) |
| Supplemental disclosures of non-cash investing and financing activities for continuing operations: | | | | | | | | | |
| | Property acquired through capital lease financing | | - | | | 0.1 | | | 4.0 | |
| | Restricted stock issued to employees | | 29.6 | | | 7.3 | | | 20.3 | |
| | Acquisition consideration payable recorded for acquisition of Moda | | 18.8 | | | - | | | - | |
| | Acquisition consideration payable recorded for acquisition of SWH | | 181.8 | | | - | | | - | |
INCOME TAXES
The following summarizes the provision (benefit) for income taxes for continuing operations:
| Year Ended December 31, | | 2010 | | | 2009 | | | 2008 | |
| (In millions) | | | | | | | | | |
| | | | | | | | | | |
| Current: | | | | | | | | | |
| Federal | $ | 16.5 | | $ | (5.2 | ) | $ | (15.3 | ) |
| State and local | | 2.2 | | | 4.9 | | | 9.2 | |
| Foreign | | 7.5 | | | 5.8 | | | 4.5 | |
| | 26.2 | | | 5.5 | | | (1.6 | ) |
| Deferred: | | | | | | | | | |
| Federal | | 6.3 | | | 13.0 | | | 2.5 | |
| State and local | | (0.7 | ) | | 1.0 | | | (5.7 | ) |
| Foreign | | (1.1 | ) | | (3.3 | ) | | (1.8 | ) |
| | 4.5 | | | 10.7 | | | (5.0 | ) |
| Provision (benefit) for income taxes | $ | 30.7 | | $ | 16.2 | | $ | (6.6 | ) |
The domestic and foreign components of income (loss) before provision (benefit) for income taxes from continuing operations are as follows:
| Year Ended December 31, | | 2010 | | | 2009 | | | 2008 | |
| (In millions) | | | | | | | | | |
| | | | | | | | | | |
| Loss from continuing operations before provision (benefit) for income taxes | | | | | | | | | |
| United States | $ | 91.8 | | $ | (54.1 | ) | $ | (770.6 | ) |
| Foreign | | (6.7 | ) | | (16.0 | ) | | (2.3 | ) |
| $ | 85.1 | | $ | (70.1 | ) | $ | (772.9 | ) |
The provision (benefit) for income taxes from continuing operations on adjusted historical income differs from the amounts computed by applying the applicable Federal statutory rates due to the following:
- 88 -
| Year Ended December 31, | | 2010 | | | 2009 | | | 2008 | |
| (In millions) | | | | | | | | | |
| | | | | | | | | | |
| Provision (benefit) for Federal income taxes at the statutory rate | $ | 29.8 | | $ | (24.5 | ) | $ | (270.5 | ) |
| State and local income taxes, net of federal benefit | | 0.9 | | | 3.9 | | | 2.2 | |
| Foreign income tax difference | | (2.2 | ) | | (2.1 | ) | | (4.8 | ) |
| Nondeductible goodwill impairment | | - | | | 41.3 | | | 265.8 | |
| Change in deferred balance - fixed assets | | - | | | (2.3 | ) | | - | |
| Other items, net | | 2.2 | | | (0.1 | ) | | 0.7 | |
| Provision (benefit) for income taxes | $ | 30.7 | | $ | 16.2 | | $ | (6.6 | ) |
We have not provided for U.S. Federal and foreign withholding taxes on $27.2 million of foreign subsidiary undistributed earnings as of December 31, 2009. Such earnings are intended to be reinvested indefinitely.
The following is a summary of the significant components of our deferred tax assets and liabilities:
| December 31, | | 2010 | | | 2009 | |
| (In millions) | | | | | | |
| | | | | | | |
| Deferred tax assets (liabilities): | | | | | | |
| Nondeductible accruals and allowances | $ | 54.6 | | $ | 51.7 | |
| Depreciation | | 13.2 | | | 14.8 | |
| Intangible asset valuation and amortization | | (97.4 | ) | | (87.6 | ) |
| Loss and credit carryforwards | | 42.1 | | | 42.5 | |
| Amortization of stock-based compensation | | 14.1 | | | 12.4 | |
| Deferred compensation | | 3.0 | | | 2.6 | |
| Inventory valuation | | (8.6 | ) | | (7.8 | ) |
| Pension | | 7.3 | | | 8.4 | |
| Gain on sale-leaseback transaction | | 2.2 | | | 2.4 | |
| Prepaid expenses | | (2.5 | ) | | (2.0 | ) |
| Display costs | | (3.6 | ) | | (1.6 | ) |
| Contingent payment liability | | 7.0 | | | - | |
| Other (net) | | 2.1 | | | 2.0 | |
| Valuation allowances | | (5.8 | ) | | (5.8 | ) |
| Net deferred tax asset | $ | 27.7 | | $ | 32.0 | |
| Included in: | | | | | | |
| Current assets | $ | 28.0 | | $ | 28.1 | |
| Noncurrent assets | | - | | | 3.9 | |
| Noncurrent liabilities | | (0.3 | ) | | - | |
| Net deferred tax asset | $ | 27.7 | | $ | 32.0 | |
As of December 31, 2010, we had net operating loss carryforwards of $424.8 million (consisting of $3.0 million of federal, $390.5 million of state and $31.3 million of foreign carryforwards) which expire through 2030, foreign and general business tax credit carryforwards of $8.5 million, which expire through 2029 and state tax credit carryforwards of $8.1 million, which expire through 2026.
Uncertain tax positions
Our total unrecognized tax benefits as of December 31, 2010 and December 31, 2009 were $5.6 million and $6.6 million, respectively (net of federal tax benefit), which included $1.4 million and $6.0 million of interest and penalties, respectively (net of federal tax benefit).
- 89 -
| (In millions) | | 2010 | | | 2009 | |
| Uncertain tax positions, beginning of year | $ | 6.6 | | $ | 14.1 | |
| Decreases for tax positions related to prior years | | (1.0 | ) | | (0.3 | ) |
| Settlements with tax authorities during the year | | - | | | (7.2 | ) |
| Uncertain tax positions, end of year | $ | 5.6 | | $ | 6.6 | |
If recognized as of December 31, 2010 and 2009, $5.6 million and $6.6 million, respectively (net of federal tax benefit) of our unrecognized tax benefit would reduce income tax expense and the effective tax rate.
We file a consolidated U.S. federal income tax return as well as separate, unitary and combined income tax returns in multiple state jurisdictions. In addition, we file income tax returns in various foreign jurisdictions.
The Internal Revenue Service has completed examination of our federal returns for taxable years prior to 2009. Our state income tax examinations, with limited exceptions, have been completed for the periods prior to 2006. We reasonably expect to settle all ongoing audits by December 31, 2011.
STOCK OPTIONS AND RESTRICTED STOCK
Under The Jones Group Inc. 2009 Long Term Incentive Plan, we may grant stock options and other awards from time to time to key employees, officers, directors, advisors and independent consultants to us or to any of our subsidiaries. In general, options become exercisable over either a three-year or five-year period from the grant date and expire 10 years after the date of grant for options granted on or before May 28, 2003 and seven years after the date of grant thereafter. In certain cases for non-employee directors, options become exercisable six months after the grant date. Shares available for future option and restricted stock grants at December 31, 2010 and 2009 totaled 2.5 million at each date. Our policy is to issue new shares upon the exercise of options and, when possible, to offset these new shares by repurchasing shares in the open market. We currently have no plans to repurchase any shares in 2011.
Compensation cost recorded for stock-based employee compensation awards (including awards to non-employee directors) reflected as an SG&A expense was $22.0 million, $13.0 million and $12.3 million for 2010, 2009 and 2008, respectively. The total tax benefit recognized for the compensation cost recorded for stock-based employee compensation awards for 2010, 2009 and 2008 totaled $8.2 million, $4.6 million and $4.1 million, respectively. Total compensation cost related to unvested awards not yet recognized at December 31, 2010 was $14.4 million, which is expected to be amortized over a weighted-average period of approximately 25 months. Cash received from option exercises for 2010 and 2008 was $0.6 million and $0.1 million, respectively. No options were exercised in 2009.
The following tables summarize information about stock option transactions and related information (options in millions):
- 90 -
| 2010 | | 2009 | | 2008 |
| Options | | Weighted Average Exercise Price | | Options | | Weighted Average Exercise Price | | Options | | Weighted Average Exercise Price |
| Outstanding, January 1 | 6.2 | | $32.79 | | 7.0 | | $32.73 | | 7.6 | | $32.44 |
| Exercised | (0.1 | ) | 11.81 | | - | | - | | - | | - |
| Cancelled | (0.4 | ) | 32.30 | | (0.3 | ) | 33.22 | | (0.3 | ) | 34.21 |
| Expired | (1.3 | ) | 27.35 | | (0.5 | ) | 31.54 | | (0.3 | ) | 24.37 |
| Outstanding, December 31 | 4.4 | | $34.74 | | 6.2 | | $32.79 | | 7.0 | | $32.73 |
| Exercisable, December 31 | 4.4 | | $34.74 | | 6.1 | | $32.74 | | 6.8 | | $32.61 |
| 2010 | 2009 | 2008 |
| Weighted-average contractual term (in years) of: | | | |
| Options outstanding at end of year | 0.9 | 1.6 | 2.5 |
| Options exercisable at end of year | 0.9 | 1.6 | 2.5 |
| | | | |
| Intrinsic value (in millions) of: | | | |
| Options outstanding at end of year | - | $0.3 | $0.1 |
| Options exercisable at end of year | - | $0.3 | $0.1 |
| Options exercised during the year | $0.4 | - | - |
| | | | |
| Fair value (in millions) of options vested during the year | $1.1 | $2.1 | $2.2 |
The fair value of each option award is estimated on the date of the grant using the Black-Scholes-Merton option pricing model. Expected volatilities are based on historical volatility of our stock price and implied volatilities from publicly traded options on our stock. We use historical data to estimate an option's expected life; the expected life for grants to senior management-level employees and other employees are considered separately for valuation purposes. The risk-free interest rate input is based on the U.S. Treasury yield curve in effect at the time of the grant. Compensation cost, net of projected forfeitures, is recognized on a straight-line basis over the period between the grant and vesting dates, with compensation cost for grants with a graded vesting schedule recognized on a straight-line basis over the requisite service period for each separately vesting portion of the award as if the award was, in substance, multiple awards. We did not grant any options in 2008, 2009 or 2010.
Compensation cost for restricted stock is measured as the excess, if any, of the quoted market price of our stock at the grant date over the amount the employee must pay to acquire the stock (which is generally zero). The compensation cost, net of projected forfeitures, is recognized over the period between the issue date and the date any restrictions lapse, with compensation cost for grants with a graded vesting schedule recognized on a straight-line basis over the requisite service period for the total award. The restrictions do not affect voting and dividend rights.
The following tables summarize information about unvested restricted stock transactions (shares in millions):
- 91 -
| 2010 | | 2009 | | 2008 |
| Shares | | Weighted Average Fair Value | | Shares | | Weighted Average Fair Value | | Shares | | Weighted Average Fair Value |
| Nonvested, January 1 | 3.6 | | $10.33 | | 1.8 | | $19.78 | | 0.8 | | $32.48 |
| Granted | 1.9 | | 15.23 | | 2.1 | | 3.55 | | 1.3 | | 15.32 |
| Vested | (0.6 | ) | 20.48 | | (0.2 | ) | 28.99 | | (0.2 | ) | 35.34 |
| Forfeited | (0.2 | ) | 12.73 | | (0.1 | ) | 11.80 | | (0.1 | ) | 22.22 |
| Nonvested, December 31 | 4.7 | | $10.79 | | 3.6 | | $10.33 | | 1.8 | | $19.78 |
| 2010 | 2009 | 2008 |
| Fair value (in millions) of shares vested during the year | $13.8 | $4.5 | $8.0 |
During 2010, 1,941,703 shares of restricted common stock were issued to employees and directors under the 2009 Long-Term Incentive Plan. The restrictions generally lapse on the third anniversary of issue. The value of this stock based on quoted market values at the grant dates was $29.6 million.
During 2009, 2,051,820 shares of restricted common stock were issued to employees and directors under the 1999 Stock Incentive Plan and the 2009 Long-Term Incentive Plan. The restrictions generally lapse on the third anniversary of issue. The value of this stock based on quoted market values at the grant dates was $7.3 million.
During 2008, 1,327,074 shares of restricted common stock were issued to employees and directors under the 1999 Stock Incentive Plan. The restrictions generally lapse on the third anniversary of issue. The value of this stock based on quoted market values at the grant dates was $20.3 million.
EMPLOYEE BENEFIT PLANS
Defined Contribution Plan
We maintain several defined contribution plans under Section 401(k) of the Internal Revenue Code (the "Code"), of which the primary plan is The Jones Group Inc. Retirement Plan (the "Jones Plan"). Employees not covered by a collective bargaining agreement and meeting certain other requirements are eligible to participate in the Jones Plan. Under the Jones Plan, participants may elect to have up to 50% of their salary (subject to limitations imposed by the Code) deferred and deposited with a qualified trustee, who in turn invests the money in a variety of investment vehicles as selected by each participant. All employee contributions into the Jones Plan are 100% vested.
We have elected to make the Jones Plan a "Safe Harbor Plan" under Section 401(k)(12) of the Code. As a result of this election, we make a fully-vested safe harbor matching contribution for all eligible participants amounting to 100% of the first 3% of the participant's salary deferred and 50% of the next 2% of salary deferred, subject to maximums set by the Department of the Treasury. We may, at our sole discretion, contribute additional amounts to all employees on a pro rata basis.
We contributed approximately $6.7 million, $7.0 million and $7.1 million to our defined contribution plans during 2010, 2009 and 2008, respectively.
Defined Benefit Plans
We maintain several defined benefit plans, including the Pension Plan for Associates of Nine West Group Inc. (the "Cash Balance Plan") and The Napier Company Retirement Plan for certain associates of Victoria + Co Ltd. (the "Napier Plan"). The Cash Balance Plan expresses retirement benefits as an account balance which increases each year through interest credits, with service credits frozen as of February 15, 1999. All benefits under the Napier Plan are frozen at the amounts earned by the participants as of December 31, 1995. Our funding policy is to contribute at least the minimum amount to
- 92 -
meet the funding ratio requirements of the Pension Protection Act. We plan to contribute $4.8 million to our defined benefit plans in 2011. The measurement date for all plans is December 31.
Obligations and Funded Status
| Year Ended December 31, | | 2010 | | | 2009 | |
| (In millions) | | | | | | |
| | | | | | | |
| Change in benefit obligation | | | | | | |
| Benefit obligation, beginning of year | $ | 43.8 | | $ | 40.3 | |
| Interest cost | | 2.7 | | | 2.7 | |
| Actuarial loss - effect of assumption changes | | 5.0 | | | 4.1 | |
| Benefits paid | | (3.4 | ) | | (3.3 | ) |
| Benefit obligation, end of year | | 48.1 | | | 43.8 | |
| Change in plan assets | | | | | | |
| Fair value of plan assets, beginning of year | | 28.3 | | | 26.4 | |
| Actual return on plan assets | | 3.0 | | | 3.7 | |
| Employer contribution | | 7.7 | | | 1.5 | |
| Benefits paid | | (3.4 | ) | | (3.3 | ) |
| Fair value of plan assets, end of year | | 35.6 | | | 28.3 | |
| Underfunded status at end of year | $ | (12.5 | ) | $ | (15.5 | ) |
Amounts Recognized on the Balance Sheet
| December 31, | | 2010 | | | 2009 | |
| (In millions) | | | | | | |
| | | | | | | |
| Noncurrent liabilities | $ | 12.5 | | $ | 15.5 | |
Amounts Recognized in Accumulated Other Comprehensive Loss
| December 31, | | 2010 | | | 2009 | |
| (In millions) | | | | | | |
| | | | | | | |
| Net loss | $ | 26.4 | | $ | 23.8 | |
Information for Pension Plans with an Accumulated Benefit Obligation in Excess of Plan Assets
| December 31, | | 2010 | | | 2009 | |
| (In millions) | | | | | | |
| | | | | | | |
| Projected benefit obligation | $ | 48.1 | | $ | 43.8 | |
| Accumulated benefit obligation | | 48.1 | | | 43.8 | |
| Fair value of plan assets | | 35.6 | | | 28.3 | |
- 93 -
Components of Net Periodic Benefit Cost and Other Amounts Recognized in Other Comprehensive Income or Loss
| Year Ended December 31, | | 2010 | | | 2009 | |
| (In millions) | | | | | | |
| | | | | | | |
| Net Periodic Benefit Cost: | | | | | | |
| Interest cost | $ | 2.7 | | $ | 2.7 | |
| Expected return on plan assets | | (2.2 | ) | | (2.0 | ) |
| Amortization of net loss | | 1.7 | | | 1.5 | |
| Total net periodic benefit cost | | 2.2 | | | 2.2 | |
| Other Changes in Plan Assets and Benefit Obligations | | | | | | |
| Recognized in Other Comprehensive Income or Loss: | | | | | | |
| Net loss | | 4.2 | | | 2.5 | |
| Amortization of net gain | | (1.7 | ) | | (1.5 | ) |
| | | 2.5 | | | 1.0 | |
| Total recognized in net periodic benefit cost and other comprehensive income or loss | $ | 4.7 | | $ | 3.2 | |
The estimated net loss that will be amortized from accumulated other comprehensive income into net periodic benefit cost in 2011 is $1.8 million.
Assumptions
| 2010 | 2009 |
| Weighted-average assumptions used to determine: | | |
| Benefit obligations at December 31 | | |
| Discount rate | 5.6% | 6.1% |
| Expected long-term return on plan assets | 7.0% | 7.9% |
| Net periodic benefit cost for year ended December 31 | | |
| Discount rate | 6.1% | 6.8% |
| Expected long-term return on plan assets | 7.9% | 7.9% |
Significant assumptions related to the calculation of our obligations include the discount rate used to calculate the present value of benefit obligations to be paid in the future and the expected long-term rate of return on assets. We review these assumptions annually based upon currently available information, including information provided by our actuaries. Based on these reviews, we lowered the discount rate for benefit obligations at December 31, 2010 to 5.6%, as compared with 6.1% in the prior year, based on the Citigroup Above Median AA Spot Rates as of December 31, 2010, and we are lowering the expected return on asset assumption for future years from 7.9% to 7.0%. At December 31, 2010, an unfavorable quarter-point (0.25%) change in the discount rate would increase our benefit obligation liability by $1.7 million and our 2011 expense by $0.1 million, while a quarter-point change in the expected long-term return on plan asset assumption would increase our 2011 expense by $0.1 million.
Estimated Future Benefit Payments
| Year Ending December 31, | | |
| (In millions) | | |
| | | |
| 2011 | $ | 1.8 |
| 2012 | | 1.9 |
| 2013 | | 2.0 |
| 2014 | | 2.1 |
| 2015 | | 2.2 |
| 2016 through 2020 | | 14.1 |
| $ | 24.1 |
- 94 -
Plan Assets
Our overall investment strategy is to diversify investments across types of investments and investment managers. The primary objectives are to achieve a rate of return sufficient to meet current and future plan cash requirements and to emphasize long-term growth of principal while avoiding excessive risk and maintaining fund liquidity. Permitted investment vehicles include investment-grade fixed income securities, domestic and foreign equity securities, mutual funds, guaranteed insurance contracts and real estate, while speculative and derivative investment vehicles, short selling and margin transactions are generally prohibited. The investment managers have full discretion to manage their portion of the investments subject to the objectives and policies of the respective plans. The performance of the investment managers is reviewed on a regular basis. At December 31, 2010, the weighted-average target allocation percentages for fund investments were 29% domestic equity securities, 25% international equity securities, 36% fixed income securities, 5% real estate and 5% cash and cash equivalents.
To determine the overall expected long-term rate-of-return-on-assets assumption, we add an expected inflation rate to the expected long-term real returns of our various asset classes, taking into account expected volatility and correlation between the returns of the asset classes as follows: for equities and real estate, a historical average arithmetic real return; for government fixed-income securities, current yields on inflation-indexed bonds; and for corporate fixed-income securities, the yield on government fixed-income securities plus a blend of current and historical credit spreads.
The fair values of our pension plan assets at December 31, 2010 and 2009 by asset class are presented in the following table. All fair values are based on quoted prices in active markets for identical assets (Level 1 in the fair value hierarchy).
| (In millions) | | 2010 | | | 2009 |
| Asset Category | | | | | |
| Cash and equivalents (a) | $ | 2.7 | | $ | 13.2 |
| Equity Securities: | | | | | |
| U.S. companies (b) | | 13.3 | | | 12.9 |
| International companies (c) | | 7.0 | | | 2.2 |
| Real estate (d) | | 1.4 | | | - |
| Fixed income (a)(e) | | 11.2 | | | - |
| Total | $ | 35.6 | | $ | 28.3 |
| (a) | Due to a change in our fixed income managers for the plans at December 31, 2009, amounts that had been previously invested in fixed income securities were temporarily invested in money market funds pending transfer to the new fixed income manager for investment into fixed income securities. This transfer was completed in January 2010. |
| (b) | This class consists of both index and actively managed mutual funds that invest in large and mid-cap U.S. common stocks. |
| (c) | This class consists of both index and actively managed mutual funds that invest in large and emerging market international common stocks. |
| (d) | This class consists of actively managed mutual funds that invest in real estate investment trusts. |
| (e) | This class consists of managed mutual funds that invest in high-grade corporate, government and mortgage backed securities. |
Other Plans
We also maintain the Nine West Group Inc. Supplemental Executive Retirement Plan, the Nine West Group Inc. Postretirement Executive Life Plan, the Nine West Group, Inc. Postretirement Medical Plan and the Nine West Group Inc. Long Term Disabled Postemployment Benefit Plan, none of which have a material effect on our results of operations or on our financial position. These plans, which are unfunded, were underfunded by $4.2 million at December 31, 2010. Of this amount, $0.3 million is reported under accrued expenses and other current liabilities and $3.9 million is reported under other noncurrent liabilities.
- 95 -
We also maintain The Jones Group Inc. Deferred Compensation Plan, a non-qualified defined contribution plan for certain management and other highly compensated employees (the "Rabbi Trust"). Under the plan, participants may elect have up to 90% of their salary and annual bonus deferred and deposited with a qualified trustee, who in turn invests the money in a variety of investment vehicles as selected by each participant. The assets of the Rabbi Trust, consisting of primarily debt and equity securities, are recorded at current market prices (Level 1 in the fair value hierarchy). The trust assets are available to satisfy claims of our general creditors in the event of bankruptcy. The trust's assets, included in prepaid expenses and other current assets, and the corresponding deferred compensation liability, included in accrued employee compensation and benefits, were $9.1 million and $7.8 million at December 31, 2010 and 2009, respectively. This plan has no effect on our results of operations.
We participate in a multi-employer defined benefit plan that covers union employees at a distribution center that has been closed. As a result of closing this facility, in March 2009 we paid a partial withdrawal liability payment of $2.4 million. Should any of the other participating companies in this plan also cease participation, we may become liable for a full withdrawal liability payment. We do not believe any resulting liability will be material.
EQUITY METHOD INVESTMENTS
We had a 50% ownership interest in a joint venture with Sutton Development Pty. Ltd. ("Sutton") to operate retail locations in Australia, which operated under the name Nine West Australia Pty Ltd. We sold our interest in this joint venture to Sutton on December 3, 2007 for $20.7 million, which resulted in a pre-tax gain of $8.2 million. The sales price was subject to certain working capital adjustments, which resulted in additional sales proceeds and pre-tax gain of $0.8 million in 2008.
On June 20, 2008, we acquired a 10% equity interest in GRI, an international accessories and apparel brand management and retail-distribution network, for $20.2 million. On June 24, 2009, we increased our equity interest to 25% for an additional $15.2 million. The selling shareholders of GRI are entitled to receive an additional cash payment equaling 60% of the amount of GRI's fiscal year 2011 net income that exceeds a certain threshold. GRI is the exclusive licensee of several of our brands in Asia, including Nine West, Anne Klein New York, AK Anne Klein, Easy Spirit, Enzo Angiolini and Joan & David. GRI also distributes other women's apparel, shoes and accessory brands. See "Accounts Receivable" for additional information regarding GRI.
BUSINESS SEGMENT AND GEOGRAPHIC AREA INFORMATION
We identify operating segments based on, among other things, differences in products sold and the way our management organizes the components of our business for purposes of allocating resources and assessing performance. Our operations are comprised of four reportable segments: wholesale better apparel, wholesale jeanswear, wholesale footwear and accessories, and retail. Segment revenues are generated from the sale of apparel, footwear and accessories through wholesale channels and our own retail locations. The wholesale segments include wholesale operations with third party department and other retail stores and our own retail stores, the retail segment includes operations by our own stores and e-commerce web sites, and income and expenses related to trademarks, licenses and general corporate functions are reported under "licensing, other and eliminations." We define segment income as operating income before net interest expense, goodwill impairment charges, gains or losses on sales of subsidiaries, equity in earnings of unconsolidated affiliates and income taxes. Summarized below are our revenues and income by reportable segment for 2010, 2009 and 2008. We are an integrated enterprise, characterized by substantial intersegment cooperation, cost allocations, and sharing of assets. Therefore, we do not represent that these segments, if operated independently, would report the operating profit and other financial information shown below.
- 96 -
| (In millions) | | Wholesale Better Apparel | | | Wholesale Jeanswear | | | Wholesale Footwear & Accessories | | | Retail | | | Licensing, Other & Eliminations | | | Consolidated | |
| For the year ended December 31, 2010 | | | | | | | | | | |
| Revenues from external customers | $ | 1,011.9 | | $ | 817.9 | | $ | 1,066.5 | | $ | 698.1 | | $ | 48.3 | | $ | 3,642.7 | |
| | Intersegment revenues | | 143.1 | | | 3.2 | | | 59.4 | | | - | | | (205.7 | ) | | - | |
| | Total revenues | | 1,155.0 | | | 821.1 | | | 1,125.9 | | | 698.1 | | | (157.4 | ) | | 3,642.7 | |
| | Segment income (loss) | $ | 126.3 | | $ | 76.1 | | $ | 86.9 | | $ | (39.7 | ) | $ | (104.7 | ) | | 144.9 | |
| | Net interest expense | | | (58.9 | ) |
| Equity in loss of unconsolidated affiliate | | | (0.9 | ) |
| Income from continuing operations before provision for income taxes | | $ | 85.1 | |
| Depreciation and amortization | $ | 18.7 | | $ | 1.3 | | $ | 19.0 | | $ | 18.6 | | $ | 56.3 | | $ | 113.9 | |
| | | | | | | | | | | |
| For the year ended December 31, 2009 | | | | | | | | | | |
| Revenues from external customers | $ | 922.8 | | $ | 828.9 | | $ | 839.6 | | $ | 689.3 | | $ | 46.8 | | $ | 3,327.4 | |
| | Intersegment revenues | | 133.7 | | | 2.0 | | | 56.4 | | | - | | | (192.1 | ) | | - | |
| | Total revenues | | 1,056.5 | | | 830.9 | | | 896.0 | | | 689.3 | | | (145.3 | ) | | 3,327.4 | |
| | Segment income (loss) | $ | 112.1 | | $ | 65.7 | | $ | 61.4 | | $ | (71.4 | ) | $ | (59.3 | ) | | 108.5 | |
| | Net interest expense | | | (52.8 | ) |
| | Goodwill impairment | | | (120.6 | ) |
| Loss and costs associated with repurchase of 4.250% Senior Notes | | | (1.5 | ) |
| Equity in loss of unconsolidated affiliate | | | (3.7 | ) |
| Loss from continuing operations before provision for income taxes | | $ | (70.1 | ) |
| Depreciation and amortization | $ | 13.7 | | $ | 1.3 | | $ | 7.9 | | $ | 21.4 | | $ | 47.4 | | $ | 91.7 | |
| | | | | | | | | | | |
| For the year ended December 31, 2008 | | | | | | | | | | |
| Revenues from external customers | $ | 1,098.7 | | $ | 796.5 | | $ | 938.3 | | $ | 730.2 | | $ | 52.7 | | $ | 3,616.4 | |
| | Intersegment revenues | | 146.5 | | | 3.8 | | | 81.8 | | | - | | | (232.1 | ) | | - | |
| | Total revenues | | 1,245.2 | | | 800.3 | | | 1,020.1 | | | 730.2 | | | (179.4 | ) | | 3,616.4 | |
| | Segment income (loss) | $ | 122.3 | | $ | 18.8 | | $ | 56.4 | | $ | (54.3 | ) | $ | (61.6 | ) | | 81.6 | |
| | Net interest expense | | | (41.6 | ) |
| | Goodwill impairment | | | (813.2 | ) |
| | Gain on sale of Mexican operations and interest in Australian joint venture | | | 1.0 | |
| Equity in loss of unconsolidated affiliates | | | (0.7 | ) |
| Loss from continuing operations before benefit for income taxes | | $ | (772.9 | ) |
| Depreciation and amortization | $ | 7.4 | | $ | 4.2 | | $ | 8.7 | | $ | 26.2 | | $ | 46.6 | | $ | 93.1 | |
| | | | | | | | | | | | | | | | | | | |
| Total assets | | | | | | | | | | | | | | | | | | |
| December 31, 2010 | $ | 829.8 | | $ | 673.9 | | $ | 958.5 | | $ | 231.5 | | $ | (361.3 | ) | $ | 2,332.4 | |
| December 31, 2009 | | 773.1 | | | 556.2 | | | 433.7 | | | 194.1 | | | 67.9 | | | 2,025.0 | |
| December 31, 2008 | | 1,098.9 | | | 711.5 | | | 371.7 | | | 127.2 | | | 118.2 | | | 2,427.5 | |
Revenues from external customers and long-lived assets excluding deferred taxes related to continuing operations in the United States and foreign countries are as follows:
| On or for the Year Ended December 31, | | 2010 | | | 2009 | | | 2008 | |
| (In millions) | | | | | | | | | |
| | | | | | | | | | |
| Revenues from external customers: | | | | | | | | | |
| United States | $ | 3,245.2 | | $ | 3,033.6 | | $ | 3,279.0 | |
| Foreign countries | | 397.5 | | | 293.8 | | | 337.4 | |
| $ | 3,642.7 | | $ | 3,327.4 | | $ | 3,616.4 | |
| Long-lived assets: | | | | | | | | | |
| United States | $ | 1,188.6 | | $ | 908.4 | | $ | 1,083.5 | |
| Foreign countries | | 52.7 | | | 47.5 | | | 24.3 | |
| $ | 1,241.3 | | $ | 955.9 | | $ | 1,107.8 | |
- 97 -
SUPPLEMENTAL PRO FORMA CONDENSED FINANCIAL INFORMATION
Certain of our subsidiaries function as co-issuers (fully and unconditionally guaranteed on a joint and several basis) of the outstanding debt of The Jones Group Inc. ("Jones"), including Jones Apparel Group, USA, Inc. ("Jones USA"), Jones Apparel Group Holdings, Inc. ("Jones Holdings") and JAG Footwear, Accessories and Retail Corporation ("JAG Footwear").
The following condensed consolidating balance sheets, statements of operations and statements of cash flows for the "Issuers" (consisting of Jones and Jones USA, Jones Holdings, JAG Footwear, which are all our subsidiaries that act as co-issuers and co-obligors) and the "Others" (consisting of all of our other subsidiaries, excluding all obligor subsidiaries) have been prepared using the equity method of accounting in accordance with the requirements for presentation of such information. Separate financial statements and other disclosures concerning Jones are not presented as Jones has no independent operations or assets. There are no contractual restrictions on distributions from Jones USA, Jones Holdings or JAG Footwear to Jones.
Condensed Consolidating Balance Sheets
(In millions)
| | | December 31, 2010 | | December 31, 2009 | |
| | | Issuers | | | Others | | | Elim- inations | | | Cons- olidated | | | Issuers | | | Others | | | Elim- inations | | | Cons- olidated | |
| ASSETS | | | | | | | | | | | | | | | | | | | | | | | | |
| CURRENT ASSETS: | | | | | | | | | | | | | | | | | | | | | | | | |
| Cash and cash equivalents | $ | 163.0 | | $ | 37.8 | | $ | - | | $ | 200.8 | | $ | 322.1 | | $ | 11.3 | | $ | - | | $ | 333.4 | |
| Accounts receivable | | 210.2 | | | 135.4 | | | - | | | 345.6 | | | 189.5 | | | 113.6 | | | - | | | 303.1 | |
| Inventories | | 289.4 | | | 176.5 | | | - | | | 465.9 | | | 259.7 | | | 115.1 | | | 0.2 | | | 375.0 | |
| Prepaid and refundable income taxes | | 3.3 | | | 0.1 | | | 15.3 | | | 18.7 | | | 0.7 | | | 0.1 | | | (0.8 | ) | | - | |
| Deferred taxes | | 15.1 | | | 12.9 | | | - | | | 28.0 | | | 13.3 | | | 14.8 | | | - | | | 28.1 | |
| Prepaid expenses and other current assets | | 22.1 | | | 10.0 | | | - | | | 32.1 | | | 18.2 | | | 7.4 | | | - | | | 25.6 | |
| TOTAL CURRENT ASSETS | | 703.1 | | | 372.7 | | | 15.3 | | | 1,091.1 | | | 803.5 | | | 262.3 | | | (0.6 | ) | | 1,065.2 | |
| | | | | | | | | | | | | | | | | | | | | | | | | |
| Property, plant and equipment - net | | 75.1 | | | 151.3 | | | - | | | 226.4 | | | 93.4 | | | 145.6 | | | - | | | 239.0 | |
| Due from affiliates | | - | | | 1,512.4 | | | (1,512.4 | ) | | - | | | - | | | 1,382.9 | | | (1,382.9 | ) | | - | |
| Goodwill | | 46.7 | | | 115.1 | | | - | | | 161.8 | | | 40.1 | | | - | | | - | | | 40.1 | |
| Other intangibles - net | | 7.7 | | | 719.0 | | | - | | | 726.7 | | | 0.5 | | | 559.3 | | | - | | | 559.8 | |
| Prepaid and refundable income taxes | | - | | | - | | | - | | | - | | | 5.4 | | | - | | | (0.7 | ) | | 4.7 | |
| Deferred taxes | | 84.2 | | | - | | | (84.2 | ) | | - | | | 83.3 | | | - | | | (79.4 | ) | | 3.9 | |
| Investments in and loans to subsidiaries | | 2,677.5 | | | 40.2 | | | (2,677.5 | ) | | 40.2 | | | 2,125.2 | | | 42.1 | | | (2,125.2 | ) | | 42.1 | |
| Other assets | | 68.7 | | | 17.5 | | | - | | | 86.2 | | | 60.2 | | | 10.0 | | | - | | | 70.2 | |
| TOTAL ASSETS | $ | 3,663.0 | | $ | 2,928.2 | | $ | (4,258.8 | ) | $ | 2,332.4 | | $ | 3,211.6 | | $ | 2,402.2 | | $ | (3,588.8 | ) | $ | 2,025.0 | |
| LIABILITIES AND EQUITY | | | | | | | | | | | | | | | | | | | | | | | | |
| CURRENT LIABILITIES: | | | | | | | | | | | | | | | | | | | | | | | | |
| Current portion of long-term debt and capital lease obligations | $ | - | | $ | 1.8 | | $ | - | | $ | 1.8 | | $ | - | | $ | 2.6 | | $ | - | | $ | 2.6 | |
| Current portion of acquisition consideration payable | | 14.1 | | | - | | | - | | | 14.1 | | | - | | | - | | | - | | | - | |
| Accounts payable | | 145.9 | | | 67.5 | | | - | | | 213.4 | | | 129.8 | | | 55.5 | | | - | | | 185.3 | |
| Income taxes payable | | - | | | 4.4 | | | (4.4 | ) | | - | | | 23.1 | | | 7.8 | | | (19.1 | ) | | 11.8 | |
| Accrued expenses and other current liabilities | | 85.5 | | | 56.9 | | | - | | | 142.4 | | | 75.7 | | | 48.7 | | | - | | | 124.4 | |
| TOTAL CURRENT LIABILITIES | | 245.5 | | | 130.6 | | | (4.4 | ) | | 371.7 | | | 228.6 | | | 114.6 | | | (19.1 | ) | | 324.1 | |
| NONCURRENT LIABILITIES: | | | | | | | | | | | | | | | | | | | | | | | | |
| Long-term debt | | 509.7 | | | 0.2 | | | - | | | 509.9 | | | 499.5 | | | - | | | - | | | 499.5 | |
| Obligations under capital leases | | - | | | 25.2 | | | - | | | 25.2 | | | - | | | 26.9 | | | - | | | 26.9 | |
| Income taxes payable | | 6.3 | | | - | | | - | | | 6.3 | | | - | | | 0.7 | | | (0.7 | ) | | - | |
| Deferred taxes | | - | | | 72.1 | | | (71.8 | ) | | 0.3 | | | - | | | 203.5 | | | (203.5 | ) | | - | |
| Acquisition consideration payable | | 199.9 | | | 1.4 | | | - | | | 201.3 | | | - | | | - | | | - | | | - | |
| Due to affiliates | | 1,512.4 | | | - | | | (1,512.4 | ) | | - | | | 1,382.9 | | | - | | | (1,382.9 | ) | | - | |
| Other | | 57.0 | | | 22.4 | | | - | | | 79.4 | | | 63.3 | | | 18.7 | | | - | | | 82.0 | |
| TOTAL NONCURRENT LIABILITIES | | 2,285.3 | | | 121.3 | | | (1,584.2 | ) | | 822.4 | | | 1,945.7 | | | 249.8 | | | (1,587.1 | ) | | 608.4 | |
| TOTAL LIABILITIES | | 2,530.8 | | | 251.9 | | | (1,588.6 | ) | | 1,194.1 | | | 2,174.3 | | | 364.4 | | | (1,606.2 | ) | | 932.5 | |
| EQUITY: | | | | | | | | | | | | | | | | | | | | | | | | |
| Common stock and additional paid-in capital | | 542.8 | | | 2,096.2 | | | (2,096.2 | ) | | 542.8 | | | 1,361.9 | | | 1,540.5 | | | (1,540.5 | ) | | 1,361.9 | |
| Retained earnings | | 597.8 | | | 574.9 | | | (568.9 | ) | | 603.8 | | | 1,509.3 | | | 493.3 | | | (438.2 | ) | | 1,564.4 | |
| Accumulated other comprehensive (loss) income | | (8.4 | ) | | 5.1 | | | (5.1 | ) | | (8.4 | ) | | (7.6 | ) | | 3.9 | | | (3.9 | ) | | (7.6 | ) |
| Treasury stock | | - | | | - | | | - | | | - | | | (1,826.3 | ) | | - | | | - | | | (1,826.3 | ) |
| Total Jones stockholders' equity | | 1,132.2 | | | 2,676.2 | | | (2,670.2 | ) | | 1,138.2 | | | 1,037.3 | | | 2,037.7 | | | (1,982.6 | ) | | 1,092.4 | |
| Noncontrolling interest | | - | | | 0.1 | | | - | | | 0.1 | | | - | | | 0.1 | | | - | | | 0.1 | |
| TOTAL EQUITY | | 1,132.2 | | | 2,676.3 | | | (2,670.2 | ) | | 1,138.3 | | | 1,037.3 | | | 2,037.8 | | | (1,982.6 | ) | | 1,092.5 | |
| TOTAL LIABILITIES AND EQUITY | $ | 3,663.0 | | $ | 2,928.2 | | $ | (4,258.8 | ) | $ | 2,332.4 | | $ | 3,211.6 | | $ | 2,402.2 | | $ | (3,588.8 | ) | $ | 2,025.0 | |
- 98 -
Condensed Consolidating Statements of Operations
(In millions)
| Year Ended December 31, 2010 | |
| | Issuers | | | Others | | | Eliminations | | | Consolidated | |
| Net sales | $ | 2,512.5 | | $ | 1,095.2 | | $ | (14.2 | ) | $ | 3,593.5 | |
| Licensing income | | 0.1 | | | 48.2 | | | - | | | 48.3 | |
| Other revenues | | 0.9 | | | - | | | - | | | 0.9 | |
| Total revenues | | 2,513.5 | | | 1,143.4 | | | (14.2 | ) | | 3,642.7 | |
| Cost of goods sold | | 1,643.9 | | | 746.3 | | | (3.0 | ) | | 2,387.2 | |
| Gross profit | | 869.6 | | | 397.1 | | | (11.2 | ) | | 1,255.5 | |
| Selling, general and administrative expenses | | 950.9 | | | 133.2 | | | (11.1 | ) | | 1,073.0 | |
| Trademark impairments | | - | | | 37.6 | | | - | | | 37.6 | |
| Operating (loss) income | | (81.3 | ) | | 226.3 | | | (0.1 | ) | | 144.9 | |
| Net interest expense (income) and financing costs | | 64.4 | | | (5.5 | ) | | - | | | 58.9 | |
| Equity in loss of unconsolidated affiliates | | - | | | 0.9 | | | - | | | 0.9 | |
| (Loss) income from continuing operations before (benefit) provision for income taxes | | (145.7 | ) | | 230.9 | | | (0.1 | ) | | 85.1 | |
| (Benefit) provision for income taxes | | (42.9 | ) | | 75.0 | | | (1.4 | ) | | 30.7 | |
| (Loss) income before earnings of subsidiaries | | (102.8 | ) | | 155.9 | | | 1.3 | | | 54.4 | |
| Equity in earnings of subsidiaries | | 155.9 | | | - | | | (155.9 | ) | | - | |
| Net income | | 53.1 | | | 155.9 | | | (154.6 | ) | | 54.4 | |
| Less: income attributable to noncontrolling interest | | - | | | 0.6 | | | - | | | 0.6 | |
| Income attributable to Jones | $ | 53.1 | | $ | 155.3 | | $ | (154.6 | ) | $ | 53.8 | |
| Year Ended December 31, 2009 | |
| | Issuers | | | Others | | | Eliminations | | | Consolidated | |
| Net sales | $ | 2,337.9 | | $ | 955.8 | | $ | (14.0 | ) | $ | 3,279.7 | |
| Licensing income | | 0.1 | | | 46.7 | | | - | | | 46.8 | |
| Other revenues | | 0.9 | | | - | | | - | | | 0.9 | |
| Total revenues | | 2,338.9 | | | 1,002.5 | | | (14.0 | ) | | 3,327.4 | |
| Cost of goods sold | | 1,495.2 | | | 689.8 | | | (3.5 | ) | | 2,181.5 | |
| Gross profit | | 843.7 | | | 312.7 | | | (10.5 | ) | | 1,145.9 | |
| Selling, general and administrative expenses | | 930.4 | | | 89.8 | | | (11.5 | ) | | 1,008.7 | |
| Trademark impairments | | - | | | 28.7 | | | - | | | 28.7 | |
| Goodwill impairment | | 120.6 | | | - | | | - | | | 120.6 | |
| Operating (loss) income | | (207.3 | ) | | 194.2 | | | 1.0 | | | (12.1 | ) |
| Net interest expense (income) and financing costs | | 58.2 | | | (5.4 | ) | | - | | | 52.8 | |
| Loss and costs associated with repurchase of 4.250% Senior Notes | | 1.5 | | | - | | | - | | | 1.5 | |
| Equity in loss of unconsolidated affiliates | | - | | | 3.7 | | | - | | | 3.7 | |
| (Loss) income from continuing operations before (benefit) provision for income taxes | | (267.0 | ) | | 195.9 | | | 1.0 | | | (70.1 | ) |
| (Benefit) provision for income taxes | | (65.9 | ) | | 68.0 | | | 14.1 | | | 16.2 | |
| (Loss) income before earnings of subsidiaries | | (201.1 | ) | | 127.9 | | | (13.1 | ) | | (86.3 | ) |
| Equity in earnings of subsidiaries | | 272.3 | | | - | | | (272.3 | ) | | - | |
| Net income (loss) | | 71.2 | | | 127.9 | | | (285.4 | ) | | (86.3 | ) |
| Less: income attributable to noncontrolling interest | | - | | | 0.3 | | | - | | | 0.3 | |
| Income (loss) attributable to Jones | $ | 71.2 | | $ | 127.6 | | $ | (285.4 | ) | $ | (86.6 | ) |
| Year Ended December 31, 2008 | |
| | Issuers | | | Others | | | Eliminations | | | Consolidated | |
| Net sales | $ | 2,630.6 | | $ | 949.4 | | $ | (17.4 | ) | $ | 3,562.6 | |
| Licensing income | | 0.1 | | | 52.0 | | | - | | | 52.1 | |
| Other revenues | | 1.1 | | | 0.6 | | | - | | | 1.7 | |
| Total revenues | | 2,631.8 | | | 1,002.0 | | | (17.4 | ) | | 3,616.4 | |
| Cost of goods sold | | 1,756.5 | | | 692.1 | | | (8.4 | ) | | 2,440.2 | |
| Gross profit | | 875.3 | | | 309.9 | | | (9.0 | ) | | 1,176.2 | |
| Selling, general and administrative expenses | | 975.7 | | | 106.4 | | | (12.9 | ) | | 1,069.2 | |
| Trademark impairments | | - | | | 25.2 | | | - | | | 25.2 | |
| Goodwill impairment | | 812.0 | | | 67.6 | | | (66.4 | ) | | 813.2 | |
| Operating (loss) income | | (912.4 | ) | | 110.7 | | | 70.3 | | | (731.4 | ) |
| Net interest expense (income) and financing costs | | 51.6 | | | (10.0 | ) | | - | | | 41.6 | |
| Gain on sale of interest in Australian joint venture | | - | | | 0.8 | | | - | | | 0.8 | |
| Equity in loss of unconsolidated affiliates | | - | | | 0.5 | | | 0.2 | | | 0.7 | |
| (Loss) income from continuing operations before (benefit) provision for income taxes | | (964.0 | ) | | 121.0 | | | 70.1 | | | (772.9 | ) |
| (Benefit) provision for income taxes | | (106.4 | ) | | 94.9 | | | 4.9 | | | (6.6 | ) |
| (Loss) income from continuing operations | | (857.6 | ) | | 26.1 | | | 65.2 | | | (766.3 | ) |
| Income from discontinued operations, net of tax | | 0.9 | | | - | | | - | | | 0.9 | |
| Equity in earnings of subsidiaries | | 133.1 | | | - | | | (133.1 | ) | | - | |
| Net (loss) income | $ | (723.6 | ) | $ | 26.1 | | $ | (67.9 | ) | $ | (765.4 | ) |
- 99 -
Condensed Consolidating Statements of Cash Flows
(In millions)
| | | Year Ended December 31, 2010 | |
| | | Issuers | | | Others | | | Eliminations | | | Consolidated | |
| Net cash provided by operating activities | $ | 66.6 | | $ | 83.8 | | $ | (9.1 | ) | $ | 141.3 | |
| Cash flows from investing activities | | | | | | | | | | | | |
| Acquisition of Stuart Weitzman Holdings, net of cash acquired | | (159.3 | ) | | - | | | - | | | (159.3 | ) |
| Acquisition of Moda Nicola International | | (14.4 | ) | | - | | | - | | | (14.4 | ) |
| Capital expenditures | | (18.6 | ) | | (22.4 | ) | | - | | | (41.0 | ) |
| Other | | - | | | 0.4 | | | - | | | 0.4 | |
| Net cash used in investing activities | | (192.3 | ) | | (22.0 | ) | | - | | | (214.3 | ) |
| Cash flows from financing activities | | | | | | | | | | | | |
| Costs related to secured revolving credit agreement | | (7.3 | ) | | - | | | - | | | (7.3 | ) |
| Repayment of long-term debt | | - | | | (0.2 | ) | | - | | | (0.2 | ) |
| Cash distributions to former owners of Stuart Weitzman Holdings | | - | | | (19.0 | ) | | - | | | (19.0 | ) |
| Distributions to noncontrolling interest | | - | | | (0.6 | ) | | - | | | (0.6 | ) |
| Payments of acquisition consideration payable | | - | | | (4.3 | ) | | - | | | (4.3 | ) |
| Purchases of treasury stock | | (10.7 | ) | | - | | | - | | | (10.7 | ) |
| Proceeds from exercise of employee stock options | | 0.6 | | | - | | | - | | | 0.6 | |
| Dividends paid | | (17.2 | ) | | (9.1 | ) | | 9.1 | | | (17.2 | ) |
| Principal payments on capital leases | | - | | | (2.6 | ) | | - | | | (2.6 | ) |
| Excess tax benefits from share-based payments | | 1.2 | | | - | | | - | | | 1.2 | |
| Net cash used in financing activities | | (33.4 | ) | | (35.8 | ) | | 9.1 | | | (60.1 | ) |
| Effect of exchange rates on cash | | - | | | 0.5 | | | - | | | 0.5 | |
| Net (decrease) increase in cash and cash equivalents | | (159.1 | ) | | 26.5 | | | - | | | (132.6 | ) |
| Cash and cash equivalents, beginning | | 322.1 | | | 11.3 | | | - | | | 333.4 | |
| Cash and cash equivalents, ending | $ | 163.0 | | $ | 37.8 | | $ | - | | $ | 200.8 | |
| | | Year Ended December 31, 2009 | |
| | | Issuers | | | Others | | | Eliminations | | | Consolidated | |
| Net cash provided by operating activities | $ | 325.5 | | $ | 23.5 | | $ | - | | $ | 349.0 | |
| Cash flows from investing activities | | | | | | | | | | | | |
| Capital expenditures | | (15.3 | ) | | (14.7 | ) | | - | | | (30.0 | ) |
| Investment in GRI Group Limited | | - | | | (15.2 | ) | | - | | | (15.2 | ) |
| Net cash used in investing activities | | (15.3 | ) | | (29.9 | ) | | - | | | (45.2 | ) |
| Cash flows from financing activities | | | | | | | | | | | | |
| Repurchase of 4.250% Senior Notes | | (237.7 | ) | | - | | | - | | | (237.7 | ) |
| Redemption at maturity of 4.250% Senior Notes | | (7.5 | ) | | - | | | - | | | (7.5 | ) |
| Payment of consent fees | | (12.9 | ) | | - | | | - | | | (12.9 | ) |
| Costs associated with consent fees and repurchase of notes | | (1.8 | ) | | - | | | - | | | (1.8 | ) |
| Costs related to secured revolving credit agreement | | (29.6 | ) | | (0.5 | ) | | - | | | (30.1 | ) |
| Distributions to noncontrolling interest | | - | | | (0.2 | ) | | - | | | (0.2 | ) |
| Dividends paid | | (17.0 | ) | | - | | | - | | | (17.0 | ) |
| Principal payments on capital leases | | - | | | (3.1 | ) | | - | | | (3.1 | ) |
| Net cash used in financing activities | | (306.5 | ) | | (3.8 | ) | | - | | | (310.3 | ) |
| Effect of exchange rates on cash | | - | | | 1.6 | | | - | | | 1.6 | |
| Net increase (decrease) in cash and cash equivalents | | 3.7 | | | (8.6 | ) | | - | | | (4.9 | ) |
| Cash and cash equivalents, beginning | | 318.4 | | | 19.9 | | | - | | | 338.3 | |
| Cash and cash equivalents, ending | $ | 322.1 | | $ | 11.3 | | $ | - | | $ | 333.4 | |
| | | Year Ended December 31, 2008 | |
| | | Issuers | | | Others | | | Eliminations | | | Consolidated | |
| Net cash provided by operating activities | $ | 141.1 | | $ | 35.2 | | $ | (0.8 | ) | $ | 175.5 | |
| Cash flows from investing activities | | | | | | | | | | | | |
| Proceeds from sale of interest in Australian joint venture | | - | | | 0.8 | | | - | | | 0.8 | |
| Proceeds from sale of Mexican operations | | - | | | 5.9 | | | - | | | 5.9 | |
| Investment in GRI Group Limited | | - | | | (20.2 | ) | | - | | | (20.2 | ) |
| Capital expenditures | | (39.9 | ) | | (31.3 | ) | | - | | | (71.2 | ) |
| | Other | | 0.2 | | | 0.1 | | | - | | | 0.3 | |
| Net cash used in investing activities | | (39.7 | ) | | (44.7 | ) | | - | | | (84.4 | ) |
| Cash flows from financing activities | | | | | | | | | | | | |
| Repayment of long-term debt | | (0.3 | ) | | - | | | - | | | (0.3 | ) |
| Purchases of treasury stock | | 1.0 | | | - | | | - | | | 1.0 | |
| Proceeds from exercise of employee stock options | | 0.1 | | | - | | | - | | | 0.1 | |
| Dividends paid | | (47.4 | ) | | (0.8 | ) | | 0.8 | | | (47.4 | ) |
| Principal payments on capital leases | | (0.4 | ) | | (4.4 | ) | | - | | | (4.8 | ) |
| Net cash used in financing activities | | (47.0 | ) | | (5.2 | ) | | 0.8 | | | (51.4 | ) |
| Effect of exchange rates on cash | | - | | | (4.2 | ) | | - | | | (4.2 | ) |
| Net increase (decrease) in cash and cash equivalents | | 54.4 | | | (18.9 | ) | | - | | | 35.5 | |
| Cash and cash equivalents, beginning | | 264.0 | | | 38.8 | | | - | | | 302.8 | |
| Cash and cash equivalents, ending | $ | 318.4 | | $ | 19.9 | | $ | - | | $ | 338.3 | |
- 100 -
UNAUDITED CONSOLIDATED FINANCIAL INFORMATION
Unaudited interim consolidated financial information for the two years ended December 31, 2010 is summarized as follows:
| (In millions except per share data) | | First Quarter | | | Second Quarter | | | Third Quarter | | | Fourth Quarter | |
| 2010 | | | | | | | | | | | | |
| Net sales | $ | 876.1 | | $ | 849.0 | | $ | 1,009.9 | | $ | 858.4 | |
| | Total revenues | | 887.3 | | | 859.6 | | | 1,022.1 | | | 873.7 | |
| Gross profit | | 326.2 | | | 317.2 | | | 342.6 | | | 269.4 | |
| | Operating income (loss)(1) | | 76.3 | | | 55.3 | | | 60.1 | | | (46.8 | ) |
| | Net income (loss) | | 39.4 | | | 25.8 | | | 29.2 | | | (40.0 | ) |
| | | | | | | | | | | | | | |
| Basic earnings (loss) per share | $ | 0.46 | | $ | 0.30 | | $ | 0.34 | | $ | (0.47 | ) |
| | Diluted earnings (loss) per share | | 0.45 | | | 0.30 | | | 0.34 | | | (0.47 | ) |
| | | | | | | | | | | | | | |
| | Dividends declared per share | $ | 0.05 | | $ | 0.05 | | $ | 0.05 | | $ | 0.05 | |
| 2009 | | | | | | | | | | | | |
| Net sales | $ | 879.4 | | $ | 793.4 | | $ | 843.9 | | $ | 762.8 | |
| | Total revenues | | 891.1 | | | 803.9 | | | 855.7 | | | 776.7 | |
| Gross profit | | 293.3 | | | 282.1 | | | 304.4 | | | 266.1 | |
| | Operating income (loss)(2) | | 13.7 | | | 42.1 | | | 60.9 | | | (128.8 | ) |
| | Net income (loss) | | 0.3 | | | 13.1 | | | 30.6 | | | (130.3 | ) |
| | | | | | | | | | | | | | |
| Basic earnings (loss) per share | $ | 0.00 | | $ | 0.15 | | $ | 0.36 | | $ | (1.53 | ) |
| | Diluted earnings (loss) per share | | 0.00 | | | 0.15 | | | 0.36 | | | (1.53 | ) |
| | | | | | | | | | | | | | |
| | Dividends declared per share | $ | 0.05 | | $ | 0.05 | | $ | 0.05 | | $ | 0.05 | |
Quarterly figures may not add to full year due to rounding.
| (1) | Includes trademark impairments of $37.6 million in the fourth fiscal quarter of 2010. |
| (2) | Includes goodwill impairment of $120.6 million and trademark impairments of $28.7 million in the fourth fiscal quarter of 2009. |
- 101 -
ITEM 9. CHANGES IN AND DISAGREEMENTS WITH ACCOUNTANTS ON ACCOUNTING AND FINANCIAL DISCLOSURE
Not Applicable.
ITEM 9A. CONTROLS AND PROCEDURES
As required by Exchange Act Rule 13a-15(b), we carried out an evaluation, under the supervision and with the participation of our Chief Executive Officer and our Chief Financial Officer, of the effectiveness of the design and operation of our disclosure controls and procedures as of the end of the period covered by this report.
The purpose of disclosure controls is to ensure that information required to be disclosed in our reports filed with or submitted to the SEC under the Exchange Act is recorded, processed, summarized and reported within the time periods specified in the SEC's rules and forms. Disclosure controls are also designed to ensure that such information is accumulated and communicated to our management, including our Chief Executive Officer and our Chief Financial Officer, to allow timely decisions regarding required disclosure. The purpose of internal controls is to provide reasonable assurance that our transactions are properly authorized, our assets are safeguarded against unauthorized or improper use and our transactions are properly recorded and reported to permit the preparation of our financial statements in conformity with generally accepted accounting principles.
Our management does not expect that our disclosure controls or our internal controls will prevent all error and all fraud. A control system, no matter how well conceived and operated, can provide only reasonable rather than absolute assurance that the objectives of the control system are met. The design of a control system must also reflect the fact that there are resource constraints, with the benefits of controls considered relative to their costs. Because of the inherent limitations in all control systems, no evaluation of controls can provide absolute assurance that all control issues and instances of fraud (if any) within the company have been detected. These inherent limitations include the realities that judgments in decision-making can be faulty and that simple errors or mistakes can occur. Controls can also be circumvented by the individual acts of some persons, by collusion of two or more people, or by management override of the control. The design of any system of controls also is based in part upon certain assumptions about the likelihood of future events, and there can be no assurance that any design will succeed in achieving its stated goals under all potential future conditions; over time, controls may become inadequate because of changes in conditions, or the degree of compliance with the policies or procedures may deteriorate. Because of the inherent limitations in a cost-effective control system, misstatements due to error or fraud may occur and not be detected.
Our internal controls are evaluated on an ongoing basis by our Internal Audit department, by other personnel in our organization and by our independent auditors in connection with their audit and review activities. The overall goals of these various evaluation activities are to monitor our disclosure and internal controls and to make modifications as necessary, as disclosure and internal controls are intended to be dynamic systems that change (including improvements and corrections) as conditions warrant. Part of this evaluation is to determine whether there were any significant deficiencies or material weaknesses in our internal controls, or whether we had identified any acts of fraud involving personnel who have a significant role in our internal controls. Significant deficiencies are control issues that could have a significant adverse effect on the ability to record, process, summarize and report financial data in the financial statements; material weaknesses are particularly serious conditions where the internal control does not reduce to a relatively low level the risk that misstatements caused by error or fraud may occur in amounts that would be material in relation to the financial statements and not be detected within a timely period by employees in the normal course of performing their assigned functions.
Based upon this evaluation, our Chief Executive Officer and our Chief Financial Officer concluded that both our disclosure controls and procedures and our internal controls and procedures are designed to provide and are effective in providing reasonable assurance in timely alerting them to material
- 102 -
information required to be included in our periodic SEC filings and ensuring that information required to be disclosed by us in these periodic filings is recorded, processed, summarized and reported within the time periods specified in the SEC's rules and forms and that our internal controls are effective in ensuring that our financial statements are fairly presented in conformity with generally accepted accounting principles.
We have made changes to our internal controls and procedures over financial reporting to address the implementation of SAP, an enterprise resource planning ("ERP") system. We began the process of implementing SAP throughout The Jones Group Inc. and our consolidated subsidiaries in 2006. SAP will integrate our operational and financial systems and expand the functionality of our financial reporting processes. During the fourth fiscal quarter of 2010, our footwear and retail businesses were converted to this system. We have adequately controlled the transition to the new processes and controls, with no negative impact to our internal control environment. We expect to continue the implementation of this system to all locations over a multi-year period. As the phased roll out occurs, we will experience changes in internal control over financial reporting each quarter. We expect this ERP system to further advance our control environment by automating manual processes, improving management visibility and standardizing processes as its full capabilities are utilized.
Management's Annual Report on Internal Control Over Financial Reporting
Management's report on Internal Control Over Financial reporting appears on page 56. Our independent registered public accounting firm, BDO USA, LLP, has issued an audit report on our internal control over financial reporting, which appears on page 58.
PART III
ITEM 10. DIRECTORS, EXECUTIVE OFFICERS AND CORPORATE GOVERNANCE
The information about our directors appearing in the Proxy Statement under the caption "Election of Directors" is incorporated herein by reference.
We have adopted a Code of Business Conduct and Ethics and a Code of Ethics for Senior Executive and Financial Officers, which applies to our Chief Executive Officer, Chief Financial Officer, Controller and other personnel performing similar functions. Both codes are posted on our website, www.jonesgroupinc.com under the "Our Company - Corporate Governance" caption. We intend to make all required disclosures regarding any amendment to, or a waiver of, a provision of the Code of Ethics for Senior Executive and Financial Officers by posting such information on our website.
The information appearing in the Proxy Statement relating to the members of the Audit Committee and the Audit Committee financial expert under the captions "Corporate Governance - Board Structure and Committee Composition" and "Corporate Governance - Board Structure and Committee Composition - Audit Committee" and the information appearing in the Proxy Statement under the caption "Section 16(a) Beneficial Ownership Reporting Compliance" is incorporated herein by this reference.
The balance of the information required by this item is contained in the discussion entitled "Executive Officers of the Registrant" in Part I of this Form 10-K.
ITEM 11. EXECUTIVE COMPENSATION
The information appearing in the Proxy Statement under the captions "Executive Compensation," "Corporate Governance - Compensation Committee Interlocks and Insider Participation" and the information appearing in the Proxy Statement relating to the compensation of directors under the caption "Corporate Governance - Director Compensation and Stock Ownership Guidelines" is incorporated herein by this reference.
- 103 -
ITEM 12. SECURITY OWNERSHIP OF CERTAIN BENEFICIAL OWNERS AND MANAGEMENT AND RELATED STOCKHOLDER MATTERS
The information appearing in the Proxy Statement under the caption "Security Ownership of Certain Beneficial Owners" is incorporated herein by this reference.
Equity Compensation Plan Information
The following table gives information about our common stock that may be issued upon the exercise of options, warrants and rights under all of our existing equity compensation plans as of December 31, 2010. For further information, see "Stock Options and Restricted Stock" in Notes to Consolidated Financial Statements.
Plan Category | Number of securities to be issued upon exercise of outstanding options, warrants and rights | Weighted-average exercise price of outstanding options, warrants and rights | Number of securities remaining available for future issuance under equity compensation plans |
Equity compensation plans approved by security holders | 4,409,925 | $34.74 | 2,531,691 |
Equity compensation plans not approved by security holders | -- | -- | -- |
Total | 4,409,925 | $34.74 | 2,531,691 |
ITEM 13. CERTAIN RELATIONSHIPS AND RELATED TRANSACTIONS
The information appearing in the Proxy Statement under the captions "Corporate Governance - Independence of Directors," "Corporate Governance - Board Structure and Committee Composition" and "Corporate Governance - Policy with Respect to Related Person Transactions" is incorporated herein by this reference.
ITEM 14. PRINCIPAL ACCOUNTING FEES AND SERVICES
Information appearing in the Proxy Statement under the caption "Fees Paid to Independent Registered Public Accountants" is incorporated herein by this reference.
- 104 -
PART IV
ITEM 15. EXHIBITS, FINANCIAL STATEMENT SCHEDULES
| (a) The following documents are filed as part of this report: |
| 1. | Financial Statements. |
| | The following financial statements are included in Item 8 of this report: |
| | Report of Independent Registered Public Accounting Firm |
| | Consolidated Balance Sheets - December 31, 2010 and 2009 |
| | Consolidated Statements of Operations - Years ended December 31, 2010, 2009 and 2008 |
| | Consolidated Statements of Changes in Equity - Years ended December 31, 2010, 2009 and 2008 |
| | Consolidated Statements of Cash Flows - Years ended December 31, 2010, 2009 and 2008 |
| | Notes to Consolidated Financial Statements (includes certain supplemental financial information required by Item 8 of Form 10-K) |
| 2. | The schedule and report of independent registered public accounting firm thereon, listed in the Index to Financial Statement Schedules attached hereto. |
| 3. | The exhibits listed in the Exhibit Index attached hereto. |
- 105 -
SIGNATURES
Pursuant to the requirements of Section 13 or 15(d) of the Securities Exchange Act of 1934, the Registrant has duly caused this report to be signed on its behalf by the undersigned, thereunto duly authorized.
| February 11, 2011 | | THE JONES GROUP INC.
(Registrant)
|
|
By:
| /s/ Wesley R. Card
Wesley R. Card
Chief Executive Officer | POWER OF ATTORNEY
KNOW ALL MEN BY THESE PRESENTS, that each person whose signature appears on this page to this Annual Report on Form 10-K for the year ended December 31, 2010 (the "Form 10-K") constitutes and appoints Wesley R. Card, John T. McClain and Ira M. Dansky, and each of them, his true and lawful attorneys-in-fact and agents, with full power of substitution and resubstitution, for him and in his name, place and stead, in any and all capacities, to sign any and all amendments to the Form 10-K, and file the same, with all exhibits thereto, and other documents in connection therewith, with the Securities and Exchange Commission, and grants unto said attorneys-in-fact and agents, and each of them, full power and authority to do and perform each and every act and thing requisite and necessary to be done in and about the premises, as fully to all intents and purposes as he might and could do in person, hereby ratifying and confirming all that said attorneys-in-fact and agents or any of them, or their substitutes, may lawfully do or cause to be done by virtue hereof.
Pursuant to the requirements of the Securities Exchange Act of 1934, this report has been signed below by the following persons on behalf of the Registrant and in the capacities and on the dates indicated.
| Signature | Title | Date |
/s/ Wesley R. Card
Wesley R. Card | Chief Executive Officer and Director
(Principal Executive Officer) | February 11, 2011 |
/s/ John T. McClain
John T. McClain | Chief Financial Officer
(Principal Financial Officer) | February 11, 2011 |
/s/ Christopher R. Cade
Christopher R. Cade | Executive Vice President, Chief Accounting Officer and Controller
(Principal Accounting Officer) | February 11, 2011 |
/s/ Sidney Kimmel
Sidney Kimmel | Director
| February 11, 2011 |
/s/ Matthew H. Kamens
Matthew H. Kamens | Director | February 11, 2011 |
/s/ J. Robert Kerrey
J. Robert Kerrey | Director | February 11, 2011 |
/s/ Ann N. Reese
Ann N. Reese | Director | February 11, 2011 |
/s/ Gerald C. Crotty
Gerald C. Crotty | Director | February 11, 2011 |
/s/ Lowell W. Robinson
Lowell W. Robinson | Director | February 11, 2011 |
/s/ Donna F. Zarcone
Donna F. Zarcone | Director | February 11, 2011 |
/s/ Margaret H. Georgiadis
Margaret H. Georgiadis | Director | February 11, 2011 |
/s/ Robert L. Mettler
Robert L. Mettler | Director | February 11, 2011 |
- 106 -
INDEX TO FINANCIAL STATEMENT SCHEDULES
Report of Independent Registered Public Accounting Firm on Schedule II.
Schedule II. Valuation and qualifying accounts
Schedules other than those listed above have been omitted since the information is not applicable, not required or is included in the respective financial statements or notes thereto.
EXHIBIT INDEX
Exhibit No. | Description of Exhibit1 |
| 2.1 | Agreement and Plan of Merger dated September 10, 1998, among Jones Apparel Group, Inc., SAI Acquisition Corp., Sun Apparel, Inc. and the selling shareholders (incorporated by reference to Exhibit 2.1 of our Current Report on Form 8-K dated September 24, 1998). |
| 2.2 | Agreement and Plan of Merger dated as of March 1, 1999, among Jones Apparel Group, Inc., Jill Acquisition Sub Inc. and Nine West Group Inc. (incorporated by reference to Exhibit 2.1 of our Current Report on Form 8-K dated March 2, 1999). |
| 2.3 | Securities Purchase and Sale Agreement dated as of July 31, 2000, among Jones Apparel Group, Inc., Jones Apparel Group Holdings, Inc., Victoria + Co Ltd. and the Shareholders and Warrantholders of Victoria + Co Ltd (incorporated by reference to Exhibit 2.1 of our Quarterly Report on Form 10-Q for the three months ended April 2, 2000). |
| 2.4 | Agreement and Plan of Merger dated as of April 13, 2001, among Jones Apparel Group, Inc., MCN Acquisition Corp. and McNaughton Apparel Group Inc. (incorporated by reference to Exhibit 2.1 of our Current Report on Form 8-K dated April 13, 2001). |
| 2.5 | Purchase Agreement dated as of August 7, 2003 between Kasper A.S.L., Ltd. and Jones Apparel Group, Inc. (incorporated by reference to Exhibit 2.1 of our Quarterly Report on Form 10-Q for the nine months ended October 4, 2003). |
| 2.6 | Agreement and Plan of Merger dated as of June 18, 2004, among Jones Apparel Group, Inc., MSC Acquisition Corp. and Maxwell Shoe Company Inc. (incorporated by reference to Exhibit 99.D.3 of Amendment No. 16 to our Schedule TO dated June 21, 2004). |
| 2.7 | Master Purchase Agreement, dated as of May 5, 2010, by and among, STEPAHEAD, LLC, JAG Footwear, Accessories and Retail Corporation, Jones Apparel Group, Inc., Stuart Weitzman Holdings, LLC, and Mr. Stuart Weitzman (incorporated by reference to Exhibit 2.1 of our Current Report on Form 8-K dated May 5, 2010). |
| 2.8 | Common Unit Purchase Agreement, dated as of May 5, 2010, by and among, IPC/SW, LLC, JAG Footwear, Accessories and Retail Corporation and Jones Apparel Group, Inc. (incorporated by reference to Exhibit 2.2 of our Current Report on Form 8-K dated May 5, 2010). |
| 3.1 | Amended and Restated Articles of Incorporation (incorporated by reference to Exhibit 3.1 of our Quarterly Report on Form 10-Q for the nine months ended October 2, 2010). |
| 3.2 | Amended and Restated By-Laws (incorporated by reference to Exhibit 3.1 of our Current Report on Form 8-K dated December 14, 2010). |
| 4.1* | Form of Certificate evidencing shares of common stock of The Jones Group Inc. |
- 107 -
| Exhibit No. | Description of Exhibit1 |
| 4.2 | Exchange and Note Registration Rights Agreement dated June 15, 1999, among Jones Apparel Group, Inc., Bear, Stearns & Co. Inc., Chase Securities Inc., Merrill Lynch, Pierce, Fenner & Smith Incorporated, Salomon Smith Barney Inc., BancBoston Robertson Stephens Inc., Banc of America Securities LLC, ING Baring Furman Selz LLC, Lazard Freres & Co. LLC, Tucker Anthony Cleary Gull, Brean Murray & Co., Inc. and The Buckingham Research Group Incorporated (incorporated by reference to Exhibit 4.5 of our Quarterly Report on Form 10-Q for the six months ended July 4, 1999). |
| 4.3 | Indenture dated as of November 22, 2004, among Jones Apparel Group, Inc., Jones Apparel Group Holdings, Inc., Jones Apparel Group USA, Inc., Nine West Footwear Corporation and Jones Retail Corporation, as Issuers and SunTrust Bank, as Trustee, including Form of 4.250% Senior Notes due 2009, Form of 5.125% Senior Notes due 2014 and Form of 6.125% Senior Notes due 2034 (incorporated by reference to Exhibit 4.14 of our Annual Report on Form 10-K/A for the fiscal year ended December 31, 2004). |
| 4.4 | Form of Exchange and Note Registration Rights Agreement dated November 22, 2004 among Jones Apparel Group, Inc., Jones Apparel Group Holdings, Inc., Jones Apparel Group USA, Inc., Nine West Footwear Corporation and Jones Retail Corporation, and Citigroup Global Markets Inc. and J.P. Morgan Securities Inc., as Representatives of the Several Initial Purchasers listed in Schedule I thereto, with respect to 4.250% Senior Notes due 2009, 5.125% Senior Notes due 2014 and 6.125% Senior Notes due 2034 (incorporated by reference to Exhibit 4.15 of our Annual Report on Form 10-K/A for the fiscal year ended December 31, 2004). |
| 4.5 | First Supplemental Indenture dated as of December 31, 2006, by and among Jones Apparel Group, Inc., Jones Apparel Group Holdings, Inc., Jones Apparel Group USA, Inc., Nine West Footwear Corporation, Jones Retail Corporation, Kasper, Ltd., as Issuers, and U.S. Bank National Association (as successor in interest to SunTrust Bank), as Trustee, relating to the 4.250% Senior Notes Due 2009, 5.125% Senior Notes due 2014 and 6.125% Senior Notes due 2034 (incorporated by reference to Exhibit 4.7 of our Annual Report on Form 10-K for the fiscal year ended December 31, 2006). |
| 10.1 | 1991 Stock Option Plan (incorporated by reference to Exhibit 10.5 of our Registration Statement on Form S-1 filed on April 3, 1991 (Registration No. 33-39742)).+ |
| 10.2 | 1996 Stock Option Plan (incorporated by reference to Exhibit 10.33 of our Annual Report on Form 10-K for the fiscal year ended December 31, 1996).+ |
| 10.3 | 1999 Stock Incentive Plan (incorporated by reference to Exhibit 10.3 of our Annual Report on Form 10-K for the fiscal year ended December 31, 2005).+ |
| 10.4 | Form of Agreement Evidencing Stock Option Awards Under the 1999 Stock Incentive Plan (incorporated by reference to Exhibit 10.4 of our Annual Report on Form 10-K/A for the fiscal year ended December 31, 2004).+ |
| 10.5 | Form of Agreement Evidencing Restricted Stock Awards Under the 1999 Stock Incentive Plan (incorporated by reference to Exhibit 10.2 of our Quarterly Report on Form 10-Q for the three months ended April 2, 2005).+ |
| 10.6 | Employment Agreement dated as of July 1, 2000, between Jones Apparel Group, Inc. and Sidney Kimmel (incorporated by reference to Exhibit 10.1 of our Quarterly Report on Form 10-Q for the nine months ended October 1, 2000).+ |
| 10.7 | Amended and Restated Employment Agreement dated March 11, 2002, between Jones Apparel Group, Inc. and Wesley R. Card (incorporated by reference to Exhibit 10.1 of our Quarterly Report on Form 10-Q for the three months ended April 6, 2002).+ |
| 10.8 | Amended and Restated Employment Agreement dated April 4, 2002, between Jones Apparel Group, Inc. and Ira M. Dansky (incorporated by reference to Exhibit 10.2 of our Quarterly Report on Form 10-Q for the three months ended April 6, 2002).+ |
| 10.9 | Buying Agency Agreement dated August 31, 2001, between Nine West Group Inc. and Bentley HSTE Far East Services Limited (incorporated by reference to Exhibit 10.2 of our Quarterly Report on Form 10-Q for the nine months ended October 6, 2001). |
- 108 -
| Exhibit No. | Description of Exhibit1 |
| 10.10 | Buying Agency Agreement dated November 30, 2001, between Nine West Group Inc. and Bentley HSTE Far East Services, Limited (incorporated by reference to Exhibit 10.22 of our Annual Report on Form 10-K for the fiscal year ended December 31, 2001). |
| 10.11 | Amendment dated February 28, 2003 to the Amended and Restated Employment Agreement between Jones Apparel Group, Inc. and Wesley R. Card (incorporated by reference to Exhibit 10.22 of our Annual Report on Form 10-K for the fiscal year ended December 31, 2002).+ |
| 10.12 | Amendment dated February 28, 2003 to the Amended and Restated Employment Agreement between Jones Apparel Group, Inc. and Ira M. Dansky (incorporated by reference to Exhibit 10.24 of our Annual Report on Form 10-K for the fiscal year ended December 31, 2002).+ |
| 10.13 | Amendment No. 2 dated March 8, 2006 to Amended and Restated Employment Agreement between Jones Apparel Group, Inc. and Wesley R. Card (incorporated by reference to Exhibit 10.1 of our Current Report on Form 8-K dated March 8, 2006).+ |
| 10.14* | The Jones Group Inc. Deferred Compensation Plan for Outside Directors, as amended and restated effective as of January 1, 2005 (amended to reflect corporate name change only).+ |
| 10.15 | Form of Agreement Evidencing Restricted Stock Awards for Outside Directors Under the 1999 Stock Incentive Plan (incorporated by reference to Exhibit 10.1 of our Quarterly Report on Form 10-Q for the three months ended April 2, 2005).+ |
| 10.16* | The Jones Group Inc. Deferred Compensation Plan, as amended and restated effective January 1, 2010 (amended to reflect corporate name change only).+ |
| 10.17 | Amendment No. 3 dated April 17, 2007 to Amended and Restated Employment Agreement between Jones Apparel Group, Inc. and Wesley R. Card (incorporated by reference to Exhibit 10.1 of our Current Report on Form 8-K dated April 17, 2007).+ |
| 10.18 | Summary Sheet of Compensation of Non-Management Directors of The Jones Group Inc. (incorporated by reference to Exhibit 10.1 of our Quarterly Report on Form 10-Q for the nine months ended October 2, 2010).+ |
| 10.19* | The Jones Group Inc. Severance Plan, as amended, and Summary Plan Description (amended to reflect corporate name change only).+ |
| 10.20* | The Jones Group Inc. 2007 Executive Annual Cash Incentive Plan, as amended (amended to reflect corporate name change only).+ |
| 10.21 | Stock Purchase Agreement dated June 22, 2007 among Jones Apparel Group, Inc., Jones Apparel Group Holdings, Inc., Barneys New York, Inc., Istithmar Bentley Holding Co. and Istithmar Bentley Acquisition Co. (incorporated by reference to Exhibit 10.1 of our Current Report on Form 8-K dated June 22, 2007). |
| 10.22 | Amendment No. 4 dated July 12, 2007 to Amended and Restated Employment Agreement between Jones Apparel Group, Inc. and Wesley R. Card (incorporated by reference to Exhibit 10.1 of our Current Report on Form 8-K dated July 11, 2007).+ |
| 10.23 | Employment Agreement dated as of July 11, 2007 between Jones Apparel Group, Inc. and John T. McClain (incorporated by reference to Exhibit 10.2 of our Current Report on Form 8-K dated July 11, 2007).+ |
| 10.24 | Amended and Restated Stock Purchase Agreement dated August 8, 2007 among Jones Apparel Group, Inc., Jones Apparel Group Holdings, Inc., Barneys New York, Inc., Istithmar Bentley Holding Co. and Istithmar Bentley Acquisition Co. (incorporated by reference to Exhibit 10.1 of our Current Report on Form 8-K dated August 8, 2007). |
| 10.25 | Master Confirmation dated September 6, 2007 between Jones Apparel Group, Inc. and Goldman, Sachs & Co. relating to accelerated stock repurchase agreement (incorporated by reference to Exhibit 10.1 of our Current Report on Form 8-K dated September 6, 2007). |
- 109 -
| Exhibit No. | Description of Exhibit1 |
| 10.26 | Supplemental Confirmation dated September 6, 2007 between Jones Apparel Group, Inc. and Goldman, Sachs & Co. relating to accelerated stock repurchase agreement (incorporated by reference to Exhibit 10.2 of our Current Report on Form 8-K dated September 6, 2007).# |
| 10.27 | Amendment No. 2 dated December 10, 2007 to Amended and Restated Employment Agreement between Jones Apparel Group, Inc. and Ira M. Dansky (incorporated by reference to Exhibit 10.39 of our Annual Report on Form 10-K for the fiscal year ended December 31, 2007).+ |
| 10.28 | Amended and Restated Employment Agreement dated February 20, 2008 between Nine West Footwear Corporation and Andrew Cohen (incorporated by reference to Exhibit 10.40 of our Annual Report on Form 10-K for the fiscal year ended December 31, 2007).+ |
| 10.29 | Second Supplemental Indenture dated as of April 15, 2009 between Jones Apparel Group, Inc., Jones Apparel Group Holdings, Inc., Jones Apparel Group USA, Inc., Nine West Footwear Corporation and Jones Retail Corporation, as Issuers, and U.S. Bank National Association, as Trustee (incorporated by reference to Exhibit 10.1 of our Current Report on Form 8-K dated April 15, 2009). |
| 10.30 | Credit Agreement, dated as of May 13, 2009, among Jones Apparel Group, Inc., Jones Apparel Group Holdings, Inc., Jones Apparel Group USA, Inc., Jones Retail Corporation, Nine West Footwear Corporation, Energie Knitwear, Inc., Jones Investment Co. Inc., Jones Jeanswear Group, Inc., L.E.I. Group, Inc., Nine West Development Corporation and Victoria + Co Ltd., as U.S. Borrowers, Jones Apparel Group Canada, LP, as Canadian Borrower, the lenders party thereto, JPMorgan Chase Bank, N.A., as administrative agent, JPMorgan Chase Bank, N.A., Toronto Branch, as Canadian administrative agent, JPMorgan Chase Bank, N.A. and General Electric Capital Corporation, as joint collateral agents, Citibank, N.A., as syndication agent, and Bank of America, N.A., Wachovia Bank, National Association and SunTrust Bank, as documentation agents (incorporated by reference to Exhibit 10.1 of our Current Report on Form 8-K dated July 30, 2010). |
| 10.31 | Amendment No. 1, dated as of June 2, 2009, to Buying Agency Agreement between Nine West Footwear Corporation and Bentley HSTE Far East Services Limited (incorporated by reference to Exhibit 10.1 of our Quarterly Report on Form 10-Q for the fiscal quarter ended July 4, 2009). |
| 10.32* | The Jones Group Inc. 2009 Long Term Incentive Plan, as amended (amended to reflect corporate name change only).+ |
| 10.33 | Form of Section 409A Amendment to Employment Agreement (incorporated by reference to Exhibit 10.43 of our Annual Report on Form 10-K for the fiscal year ended December 31, 2009).+ |
| 10.34 | Amendment No. 2 dated December 8, 2009 to Employment Agreement between Jones Apparel Group, Inc. and John T. McClain dated as of July 11, 2007 (incorporated by reference to Exhibit 10.1 of our Current Report on Form 8-K dated December 8, 2009).+ |
| 10.35* | Form of Agreement Evidencing Restricted Stock Awards Under the 2009 Long Term Incentive Plan.+ |
| 10.36* | Form of Agreement Evidencing Restricted Stock Awards for Outside Directors Under the 2009 Long Term Incentive Plan.+ |
| 10.37 | Employment Agreement dated as of January 31, 2000, between Jones Apparel Group, Inc. and Richard Dickson (incorporated by reference to Exhibit 10.1 of our Current Report on Form 8-K dated January 31, 2010).+ |
| 10.38 | Amendment No. 6 dated as of February 9, 2010 to the Amended and Restated Employment Agreement between Jones Apparel Group, Inc. and Wesley R. Card (incorporated by reference to Exhibit 10.1 of our Current Report on Form 8-K dated February 9, 2010).+ |
| 10.39 | Amendment No. 4 dated as of February 9, 2010 to the Amended and Restated Employment Agreement between Jones Apparel Group, Inc. and Ira M. Dansky (incorporated by reference to Exhibit 10.2 of our Current Report on Form 8-K dated February 9, 2010).+ |
- 110 -
| Exhibit No. | Description of Exhibit1 |
| 10.40 | Amendment No. 1 and Consent to Credit Agreement, dated as of May 5, 2010, by and among Jones Apparel Group, Inc., JAG Footwear, Accessories and Retail Corporation, the other borrowers and subsidiaries party thereto, the lenders party thereto, JPMorgan Chase Bank, N.A., as the administrative agent for the lenders, and JPMorgan Chase Bank, N.A., Toronto Branch, as the administrative agent for the Canadian lenders (incorporated by reference to Exhibit 10.1 of our Current Report on Form 8-K dated May 5, 2010). |
| 10.41 | Amendment No. 2 to Credit Agreement and Other Loan Documents, dated as of June 29, 2010, by and among Jones Apparel Group, Inc., the other borrowers and subsidiaries party thereto, the lenders party thereto, JPMorgan Chase Bank, N.A., as the administrative agent for the lenders, and JPMorgan Chase Bank, N.A., Toronto Branch, as the administrative agent for the Canadian lenders (incorporated by reference to Exhibit 10.1 of our Current Report on Form 8-K dated June 29, 2010). |
| 10.42 | Transition Agreement between Sidney Kimmel and The Jones Group Inc. dated December 15, 2010 (incorporated by reference to Exhibit 10.1 of our Current Report on Form 8-K dated December 14, 2010).+ |
| 10.43 | Separation Agreement between Andrew Cohen and JAG Footwear, Accessories and Retail Corporation dated December 15, 2010 (incorporated by reference to Exhibit 10.1 of our Current Report on Form 8-K dated December 15, 2010).+ |
| 10.44 | Amendment No. 1 to Employment Agreement dated as of February 8, 2011 between The Jones Group Inc. and Richard Dickson (incorporated by reference to Exhibit 10.1 of our Current Report on Form 8-K dated February 8, 2011).+ |
| 12* | Computation of Ratio of Earnings to Fixed Charges. |
| 21* | List of Subsidiaries. |
| 23* | Consent of BDO USA, LLP. |
| 31* | Certifications of Chief Executive Officer and Chief Financial Officer pursuant to Rule 13a-14(a) or Rule 15d-14(a), as adopted pursuant to Section 302 of the Sarbanes-Oxley Act of 2002. |
| 32o | Certifications of Chief Executive Officer and Chief Financial Officer pursuant to 18 U.S.C. Section 1350, as adopted pursuant to Section 906 of the Sarbanes-Oxley Act of 2002. |
| 101.INS** | XBRL Instance Document |
| 101.SCH** | XBRL Taxonomy Extension Schema |
| 101.CAL** | XBRL Taxonomy Extension Calculation Linkbase |
| 101.DEF** | XBRL Taxonomy Extension Definition Linkbase |
| 101.LAB** | XBRL Taxonomy Extension Label Linkbase |
| 101.PRE** | XBRL Taxonomy Extension Presentation Linkbase |
____________________
| 1 | Exhibits filed with Forms 10-K, 10-Q, 8-K or Schedule 14A of Jones Apparel Group, Inc. were filed under SEC File No. 001-10746. |
| * | Filed herewith. |
| o | Furnished herewith. |
| # | Portions deleted pursuant to application for confidential treatment under Rule 24b-2 of the Securities Exchange Act of 1934. |
| + | Management contract or compensatory plan or arrangement. |
| ** | Pursuant to Rule 406T of Regulation S-T, these interactive data files are deemed not filed or part of a registration statement or prospectus for purposes of Sections 11 or 12 of the Securities Act of 1933 or Section 18 of the Securities Exchange Act of 1934 and otherwise are not subject to liability under those sections. |
- 111 -
| BDO USA, LLP
Accountants and Consultants | 100 Park Ave
New York, NY 10017
Telephone: (212) 885-8000
Fax: (212) 697-1299 |
Report of Independent Registered Public Accounting Firm
Board of Directors and Stockholders
The Jones Group Inc.
New York, New York
The audits referred to in our report dated February 11, 2011 relating to the consolidated financial statements of The Jones Group Inc., which is contained in Item 8 of this Form 10-K also included the audit of the financial statement schedule listed in the accompanying index. This financial statement schedule is the responsibility of the Company's management. Our responsibility is to express an opinion on this financial statement schedule based on our audits.
In our opinion such financial statement schedule, when considered in relation to the basic consolidated financial statements taken as a whole, present fairly, in all material respects, the information set forth therein.
New York, New York
February 11, 2011
- 112 -
SCHEDULE II
| THE JONES GROUP INC. |
| VALUATION AND QUALIFYING ACCOUNTS |
| YEARS ENDED DECEMBER 31, 2008, 2009 AND 2010 |
| (In Millions) |
| Column A | Column B | Column C | Column D | Column E |
| | | | | Additions | | |
| | | | Balance at beginning of period | Charged against revenues or to costs and expenses | Charged to other accounts | Deductions | Balance at end of period |
| Accounts receivable allowances | | | | | | | |
| | Allowance for doubtful accounts | | | | | | | |
| | | For the year ended December 31: | | | | | | |
| | | | 2008 | $ 2.0 | $ 10.3 | $ (0.1) | (2) | $ 9.4 | (1) | $ 2.8 |
| | | | 2009 | 2.8 | 1.7 | - | | 1.3 | (1) | 3.2 |
| | | | 2010 | 3.2 | (0.2) | - | | 1.2 | (1) | 1.8 |
| | Allowance for sales returns | | | | | | | |
| | | For the year ended December 31: | | | | | | |
| | | | 2008 | 7.8 | 31.9 | (0.4) | (2) | 31.3 | (3) | 8.0 |
| | | | 2009 | 8.0 | 24.2 | 0.2 | (2) | 26.7 | (3) | 5.7 |
| | | | 2010 | 5.7 | 34.3 | 0.1 | (2) | 32.2 | (3) | 7.9 |
| Allowance for sales discounts | | | | | | | |
| | For the year ended December 31: | | | | | | |
| | | | 2008 | 9.3 | 84.1 | - | | 85.4 | (3) | 8.0 |
| | | | 2009 | 8.0 | 71.2 | - | | 73.0 | (3) | 6.2 |
| | | | 2010 | 6.2 | 72.8 | - | | 71.9 | (3) | 7.1 |
| Allowance for co-op advertising | | | | | | | |
| | For the year ended December 31: | | | | | | |
| | | | 2008 | 9.4 | 26.2 | (0.2) | (2) | 26.8 | (3) | 8.6 |
| | | | 2009 | 8.6 | 21.6 | 0.1 | (2) | 20.6 | (3) | 9.7 |
| | | | 2010 | 9.7 | 23.6 | - | (2) | 21.6 | (3) | 11.7 |
| Deferred tax valuation allowance | | | | | | | |
| | | For the year ended December 31: | | | | | | |
| | | | 2008 | 5.2 | - | - | | - | | 5.2 |
| | | | 2009 | 5.2 | 0.6 | - | | - | | 5.8 |
| | | | 2010 | 5.8 | - | - | | - | | 5.8 |
_________________________
| (1) | Doubtful accounts written off against accounts receivable. |
| (2) | Represents effects of foreign currency translation. |
| (3) | Deductions taken by customers written off against accounts receivable. |
| (4) | Deferred tax asset written off against the deferred tax valuation allowance. |
- 113 -