We build and service the infrastructure that enables our economy to run, our people to move, and our country to grow. INVESTOR PRESENTATION Sterling Announces Name Change to Sterling Infrastructure, Inc. June 2022

DISCLOSURE: Forward-Looking Statements This presentation contains, and the officers and directors of the Company may from time to time make, statements that are considered forward-looking statements within the meaning of the Securities Act of 1933 and the Securities Exchange Act of 1934. These forward-looking statements are subject to a number of risks and uncertainties, many of which are beyond our control, which may include statements about: our business strategy; our financial strategy; our industry outlook; and our plans, objectives, expectations, forecasts, outlook and intentions. All of these types of statements, other than statements of historical fact included in this presentation, are forward-looking statements. In some cases, forward-looking statements can be identified by terminology such as “may,” “will,” “could,” “should,” “expect,” “plan,” “project,” “intend,” “anticipate,” “believe,” “estimate,” “predict,” “potential,” “pursue,” “target,” “continue,” the negative of such terms or other comparable terminology. The forward-looking statements contained in this presentation are largely based on our expectations, which reflect estimates and assumptions made by our management. These estimates and assumptions reflect our best judgment based on currently known market conditions and other factors. Although we believe such estimates and assumptions to be reasonable, they are inherently uncertain and involve a number of risks and uncertainties that are beyond our control. In addition, management’s assumptions about future events may prove to be inaccurate. Management cautions all readers that the forward- looking statements contained in this presentation are not guarantees of future performance, and we cannot assure any reader that such statements will be realized or the forward-looking events and circumstances will occur. Actual results may differ materially from those anticipated or implied in the forward-looking statements due to factors listed in the “Risk Factors” section in our filings with the U.S. Securities and Exchange Commission and elsewhere in those filings. Additional factors or risks that we currently deem immaterial, that are not presently known to us or that arise in the future could also cause our actual results to differ materially from our expected results. Given these uncertainties, investors are cautioned that many of the assumptions upon which our forward-looking statements are based are likely to change after the date the forward-looking statements are made. The forward-looking statements speak only as of the date made, and we undertake no obligation to publicly update or revise any forward-looking statements for any reason, whether as a result of new information, future events or developments, changed circumstances, or otherwise, notwithstanding any changes in our assumptions, changes in business plans, actual experience or other changes. These cautionary statements qualify all forward-looking statements attributable to us or persons acting on our behalf. This presentation may contain the financial measures: adjusted net income, EBITDA, adjusted EBITDA, and adjusted EPS, which are not calculated in accordance with U.S. GAAP. If presented, a reconciliation of the non-GAAP financial measures to the most directly comparable GAAP financial measure will be provided in the Appendix to this presentation. 2S t e r l i n g I n v e s t o r P r e s e n t a t i o n

3S t e r l i n g I n v e s t o r P r e s e n t a t i o n Aligning our name to better reflect our position as a market-leading infrastructure solutions provider driven by our Entrepreneurial Spirit and Customer-Centric Culture along with a focused, disciplined and bold determination. We are… We build and service the infrastructure that enables our economy to run, our people to move, and our country to grow.
S t e r l i n g I n v e s t o r P r e s e n t a t i o n 4 Sterling Infrastructure, Inc.
S t e r l i n g I n v e s t o r P r e s e n t a t i o n 5
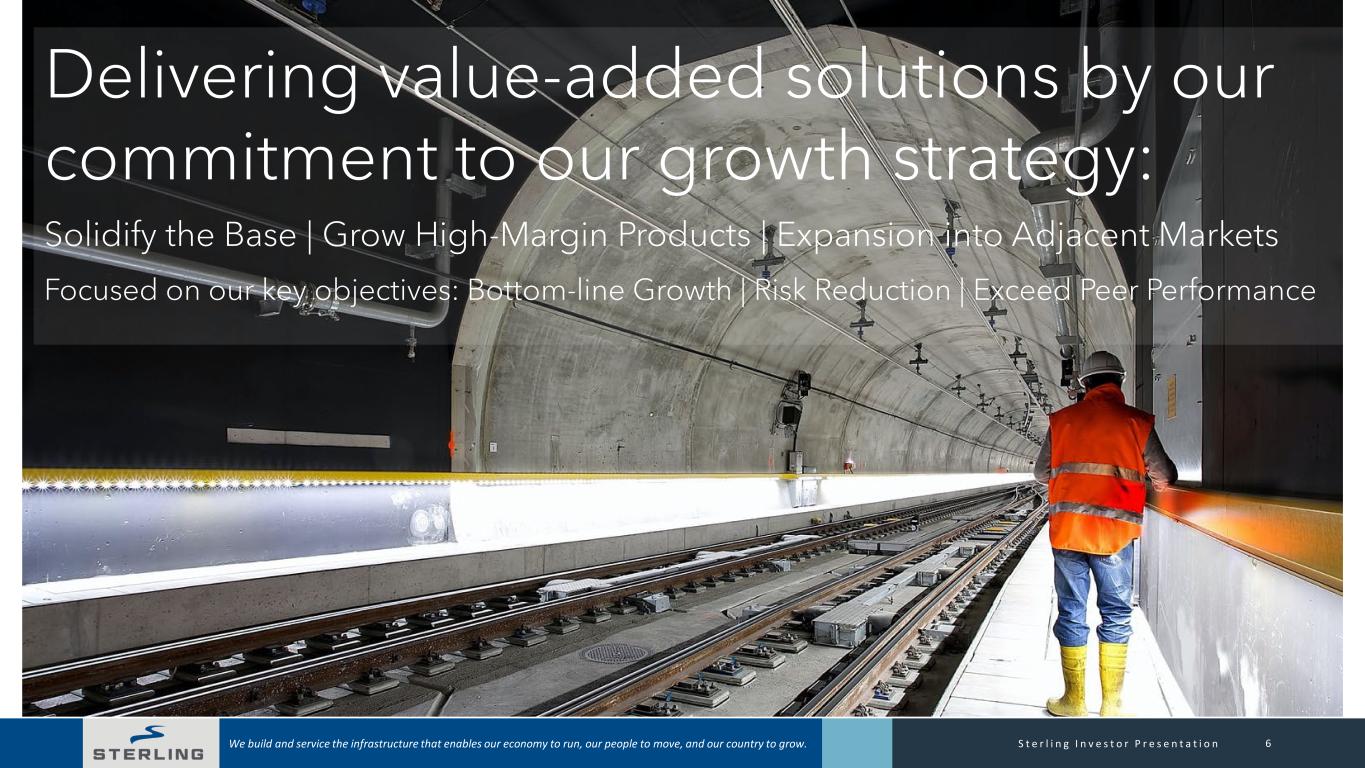
6S t e r l i n g I n v e s t o r P r e s e n t a t i o n Rebranding our company to better reflect our position as a market-leading infrastructure solutions provider driven by our Entrepreneurial Spirit and Customer-Centric Culture along with a Focused + Disciplined + Bold Determination. We are… We build and service the infrastructure that enables our economy to run, our people to move, and our country to grow. Delivering value-added solutions by our commitment to our growth strategy: Solidify the Base | Grow High-Margin Products | Expansion into Adjacent Markets Focused on our key objectives: Bottom-line Growth | Risk Reduction | Exceed Peer Performance
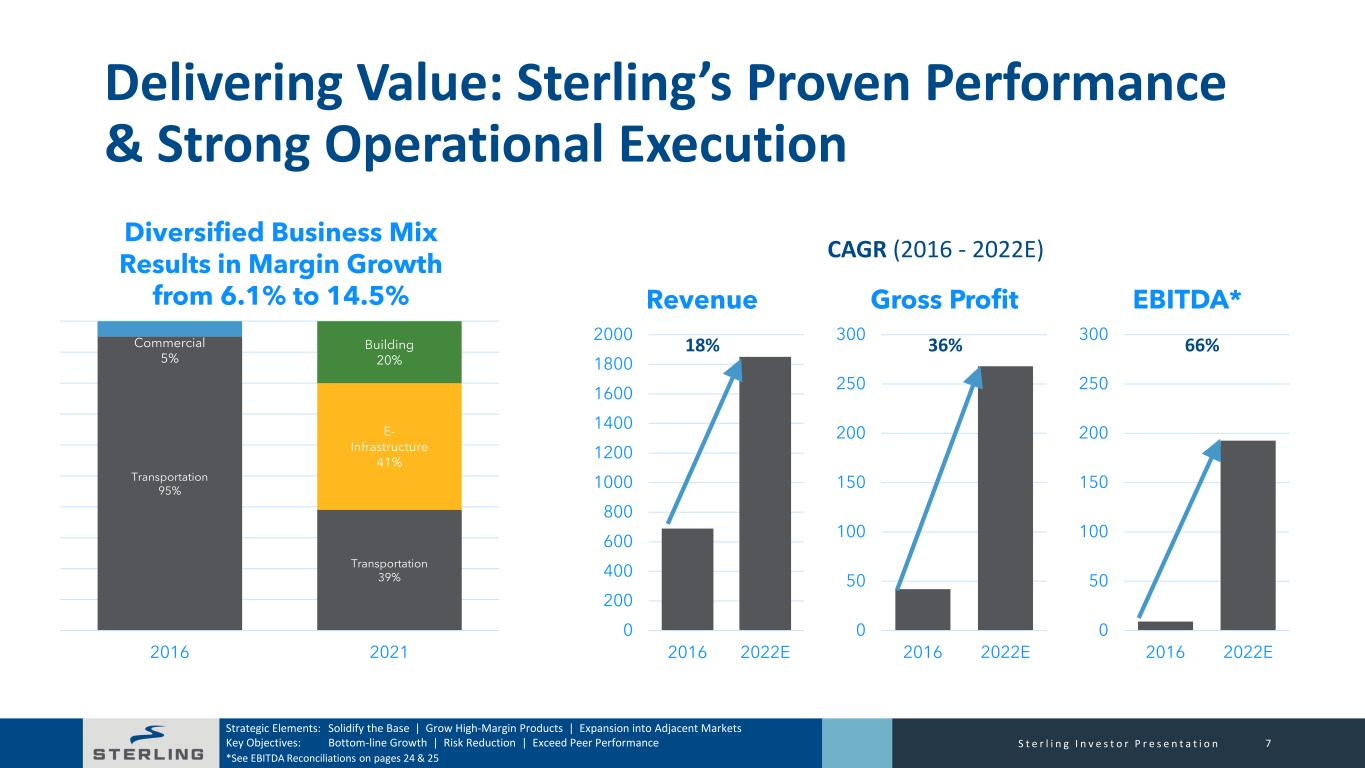
Delivering Value: Sterling’s Proven Performance & Strong Operational Execution 7S t e r l i n g I n v e s t o r P r e s e n t a t i o n Strategic Elements: Solidify the Base | Grow High-Margin Products | Expansion into Adjacent Markets Key Objectives: Bottom-line Growth | Risk Reduction | Exceed Peer Performance Transportation 95% Transportation 39% Commercial 5% E- Infrastructure 41% Building 20% 2016 2021 0 200 400 600 800 1000 1200 1400 1600 1800 2000 2016 2022E Revenue 0 50 100 150 200 250 300 2016 2022E Gross Profit 0 50 100 150 200 250 300 2016 2022E EBITDA* CAGR (2016 - 2022E) 18% 36% 66% Diversified Business Mix Results in Margin Growth from 6.1% to 14.5% *See EBITDA Reconciliations on pages 24 & 25
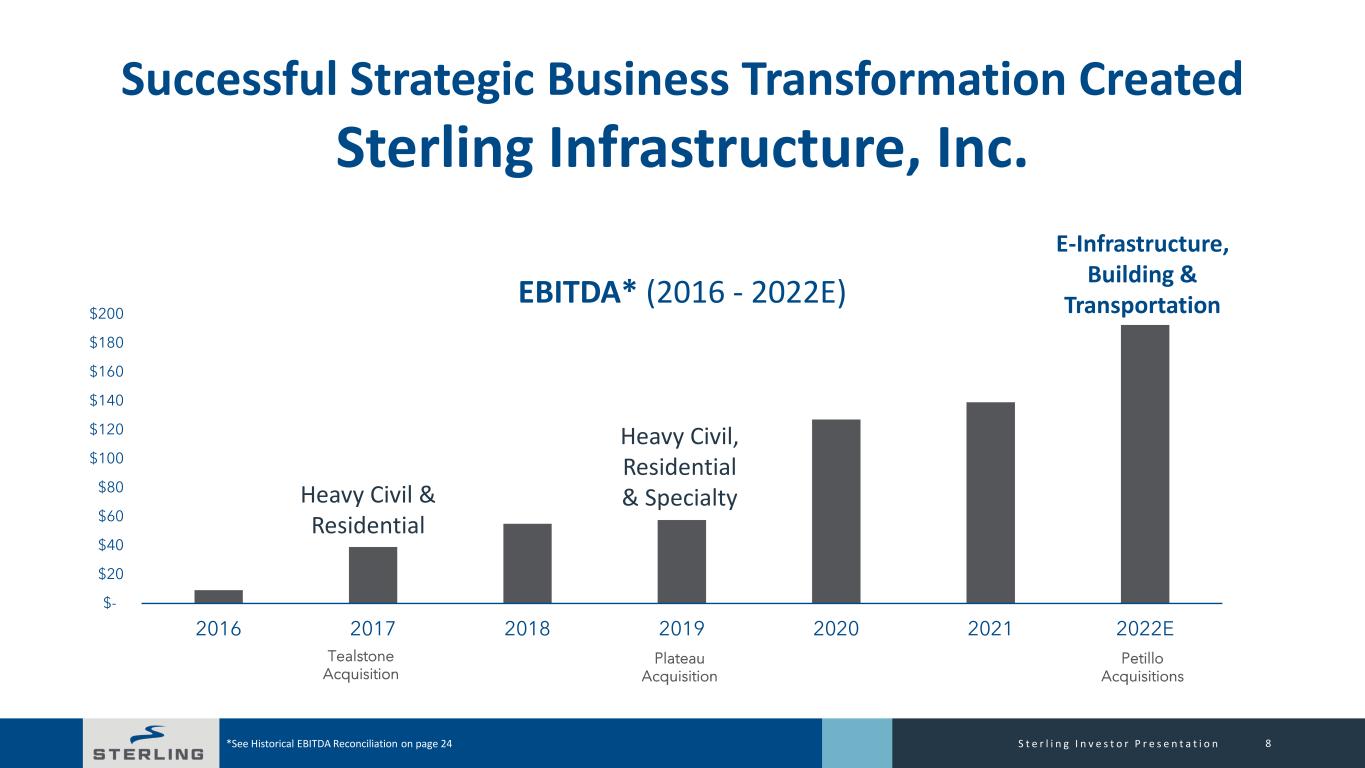
Successful Strategic Business Transformation Created Sterling Infrastructure, Inc. 8S t e r l i n g I n v e s t o r P r e s e n t a t i o n*See Historical EBITDA Reconciliation on page 24 $- $20 $40 $60 $80 $100 $120 $140 $160 $180 $200 2016 2017 2018 2019 2020 2021 2022E EBITDA* (2016 - 2022E) Tealstone Acquisition Plateau Acquisition Petillo Acquisitions Heavy Civil & Residential Heavy Civil, Residential & Specialty E-Infrastructure, Building & Transportation
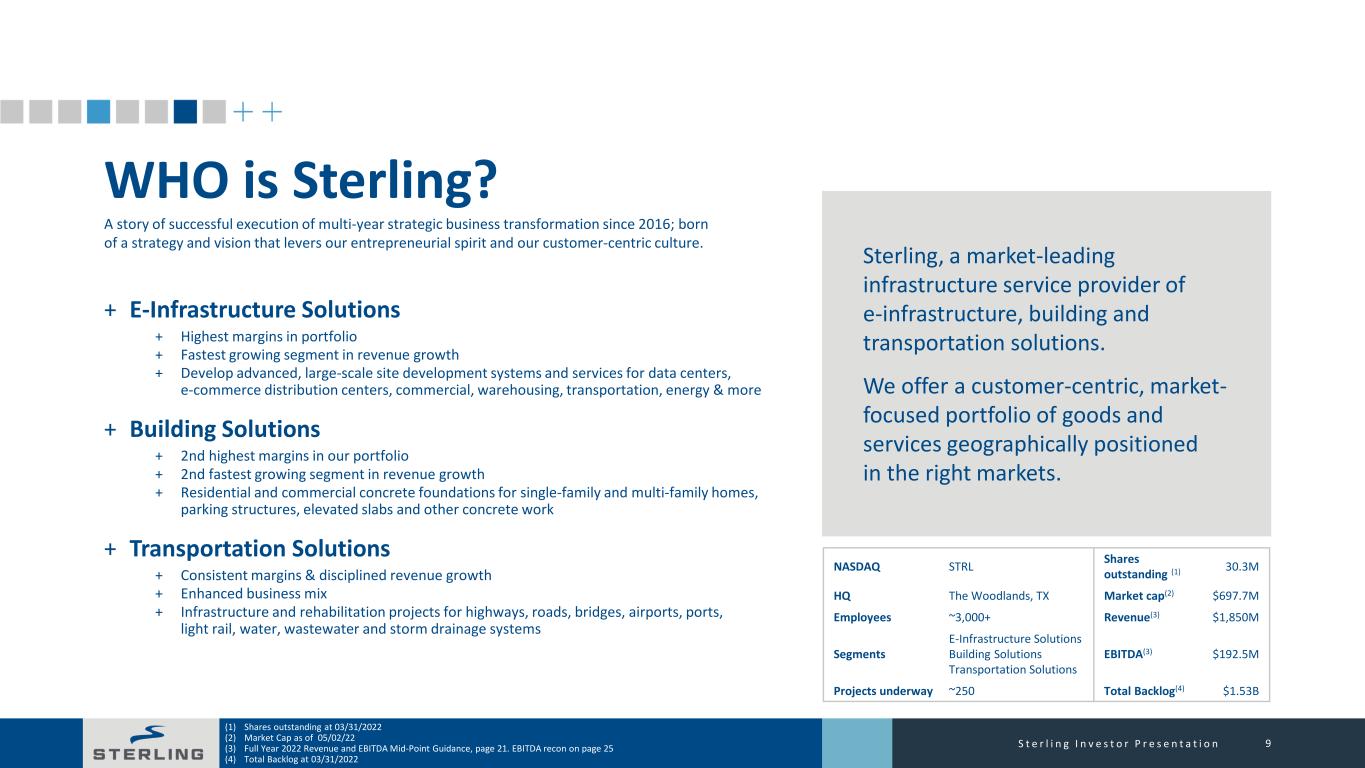
WHO is Sterling? + E-Infrastructure Solutions + Highest margins in portfolio + Fastest growing segment in revenue growth + Develop advanced, large-scale site development systems and services for data centers, e-commerce distribution centers, commercial, warehousing, transportation, energy & more + Building Solutions + 2nd highest margins in our portfolio + 2nd fastest growing segment in revenue growth + Residential and commercial concrete foundations for single-family and multi-family homes, parking structures, elevated slabs and other concrete work + Transportation Solutions + Consistent margins & disciplined revenue growth + Enhanced business mix + Infrastructure and rehabilitation projects for highways, roads, bridges, airports, ports, light rail, water, wastewater and storm drainage systems Sterling, a market-leading infrastructure service provider of e-infrastructure, building and transportation solutions. We offer a customer-centric, market- focused portfolio of goods and services geographically positioned in the right markets. 9S t e r l i n g I n v e s t o r P r e s e n t a t i o n A story of successful execution of multi-year strategic business transformation since 2016; born of a strategy and vision that levers our entrepreneurial spirit and our customer-centric culture. NASDAQ STRL Shares outstanding (1) 30.3M HQ The Woodlands, TX Market cap(2) $697.7M Employees ~3,000+ Revenue(3) $1,850M Segments E-Infrastructure Solutions Building Solutions Transportation Solutions EBITDA(3) $192.5M Projects underway ~250 Total Backlog(4) $1.53B (1) Shares outstanding at 03/31/2022 (2) Market Cap as of 05/02/22 (3) Full Year 2022 Revenue and EBITDA Mid-Point Guidance, page 21. EBITDA recon on page 25 (4) Total Backlog at 03/31/2022

Sterling’s Expanded Geographic Footprint in Strong Markets with Top Customers 10S t e r l i n g I n v e s t o r P r e s e n t a t i o n E-Infrastructure Solutions + Expanded geographic footprint providing value-added solutions to blue-chip customers in all major East Coast markets Building Solutions + Expanded geographic footprint servicing the Nation’s Top Builders in the Nation’s Top Markets: Texas & Arizona Transportation Solutions + Geographic footprint providing infrastructure solutions in the Pacific & Rocky Mountain States and Texas

WHY Sterling? + We build value for investors seeking high margins, healthy cash flow, proven performance & strong operational execution + Committed to our strategic vision, our blueprint for bottom-line growth, reducing risk and consistently outperforming peers + We are levering the foundation we built to take Sterling to a whole new level + Platforms in higher-margin, specialty-end markets with a broadened portfolio of products, services & customers + Recent Petillo acquisition positions Sterling to be an industry leader of e-infrastructure specialty site development services 11S t e r l i n g I n v e s t o r P r e s e n t a t i o n Five Year Stock Price Performance Sterling vs S&P 500 Sterling exceeded S&P 500 by 64.7% Five Year Stock Price Performance Sterling vs Peers Price performance as of 5/23/2022 closing
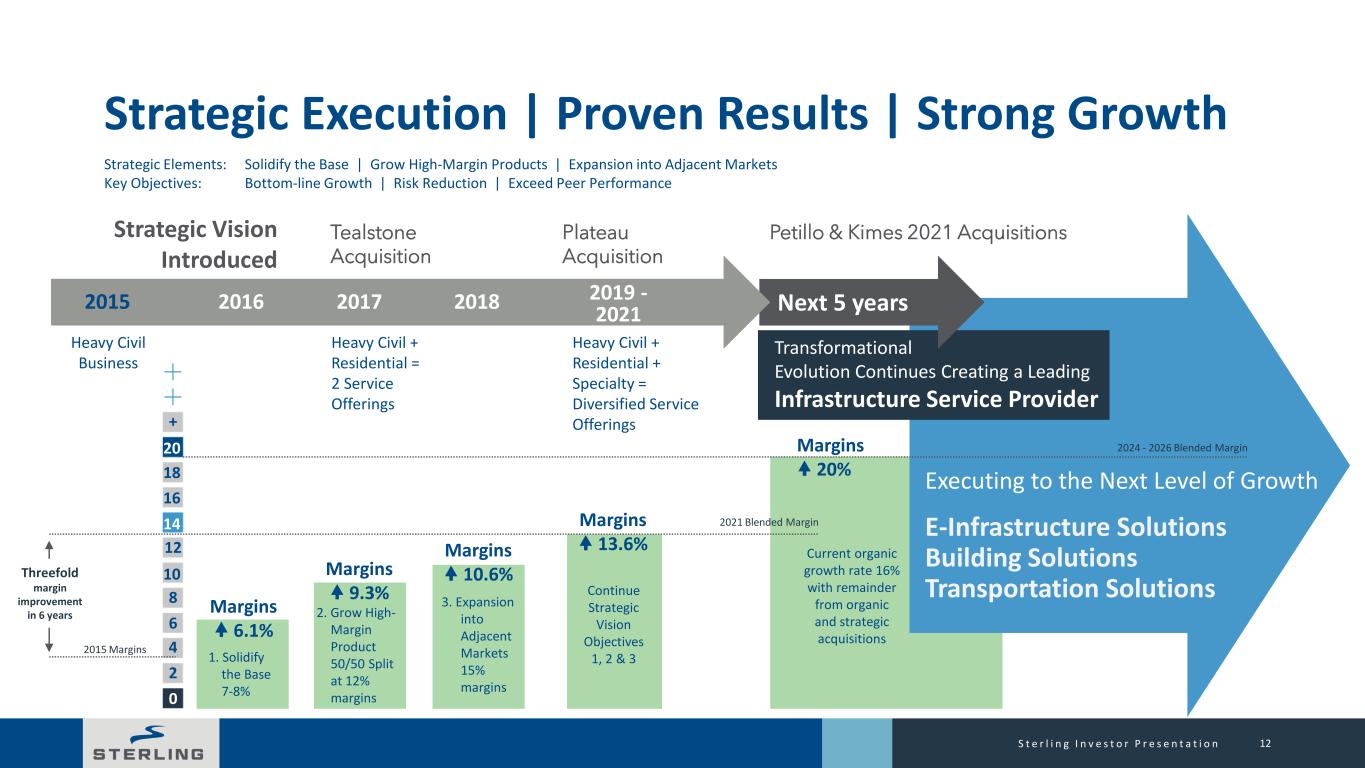
Strategic Execution | Proven Results | Strong Growth 12S t e r l i n g I n v e s t o r P r e s e n t a t i o n Strategic Elements: Solidify the Base | Grow High-Margin Products | Expansion into Adjacent Markets Key Objectives: Bottom-line Growth | Risk Reduction | Exceed Peer Performance 2015 Margins Transformational Evolution Continues Creating a Leading Infrastructure Service Provider Heavy Civil Business Margins 9.3% 0 2 4 6 8 10 12 14 16 18 20 + Margins 6.1% Strategic Vision Introduced Next 5 years2015 2016 2017 2018 2019 - 2021 1. Solidify the Base 7-8% 2. Grow High- Margin Product 50/50 Split at 12% margins Heavy Civil + Residential = 2 Service Offerings Tealstone Acquisition Margins 10.6% 3. Expansion into Adjacent Markets 15% margins Continue Strategic Vision Objectives 1, 2 & 3 Plateau Acquisition Heavy Civil + Residential + Specialty = Diversified Service Offerings Margins 20% Current organic growth rate 16% with remainder from organic and strategic acquisitions Executing to the Next Level of Growth E-Infrastructure Solutions Building Solutions Transportation Solutions Petillo & Kimes 2021 Acquisitions 2021 Blended MarginMargins 13.6% 2024 - 2026 Blended Margin Threefold margin improvement in 6 years
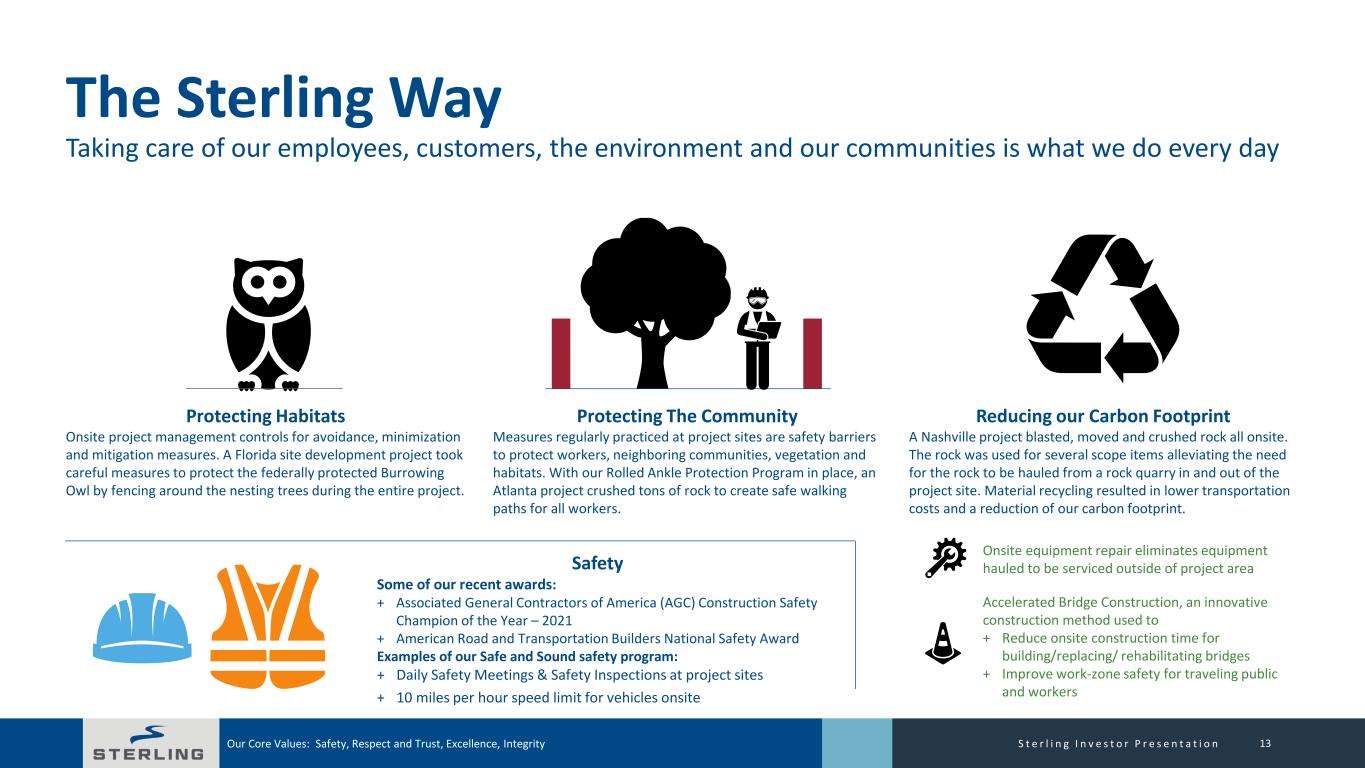
Protecting The Community Measures regularly practiced at project sites are safety barriers to protect workers, neighboring communities, vegetation and habitats. With our Rolled Ankle Protection Program in place, an Atlanta project crushed tons of rock to create safe walking paths for all workers. Reducing our Carbon Footprint A Nashville project blasted, moved and crushed rock all onsite. The rock was used for several scope items alleviating the need for the rock to be hauled from a rock quarry in and out of the project site. Material recycling resulted in lower transportation costs and a reduction of our carbon footprint. Safety Some of our recent awards: + Associated General Contractors of America (AGC) Construction Safety Champion of the Year – 2021 + American Road and Transportation Builders National Safety Award Examples of our Safe and Sound safety program: + Daily Safety Meetings & Safety Inspections at project sites + 10 miles per hour speed limit for vehicles onsite Protecting Habitats Onsite project management controls for avoidance, minimization and mitigation measures. A Florida site development project took careful measures to protect the federally protected Burrowing Owl by fencing around the nesting trees during the entire project. The Sterling Way Taking care of our employees, customers, the environment and our communities is what we do every day Onsite equipment repair eliminates equipment hauled to be serviced outside of project area S t e r l i n g I n v e s t o r P r e s e n t a t i o n 13Our Core Values: Safety, Respect and Trust, Excellence, Integrity Accelerated Bridge Construction, an innovative construction method used to + Reduce onsite construction time for building/replacing/ rehabilitating bridges + Improve work-zone safety for traveling public and workers
+ First Quarter 2022 Results S t e r l i n g I n v e s t o r P r e s e n t a t i o n 14

First Quarter 2022 Results 15S t e r l i n g I n v e s t o r P r e s e n t a t i o n Revenues: $410.3 million Net Income: $19.3 million Diluted EPS: $0.64 cents + Backlog: $1.53 billion with 12.8% margin(1) + Combined Backlog: $1.67 billion with 12.6%(1) + Cash & Cash Equivalents: $80.4 million(1) + Cash from operations: $19.2 million(2) Strong revenue growth from all segments (as compared to first quarter 2021) E-Infrastructure Solutions + Up 25.9%, excluding our recently acquired Petillo business + Market remains strong with significant activity in e- commerce, warehousing and data centers Transportation Solutions + Up 9.1% + Strong results from continued shift away from low-bid to alternative delivery Building Solutions + Up 12.8% + Continued expansion into Phoenix Sterling Reports Record First Quarter 2022 Results Earnings Continue to Outpace Expectations Petillo Delivers Immediately Accretive Earnings (1) Backlog, Combined Backlog, and Cash & Cash Equivalents at March 31, 2022 (2) Cash from operations for the three months ended March 31, 2022
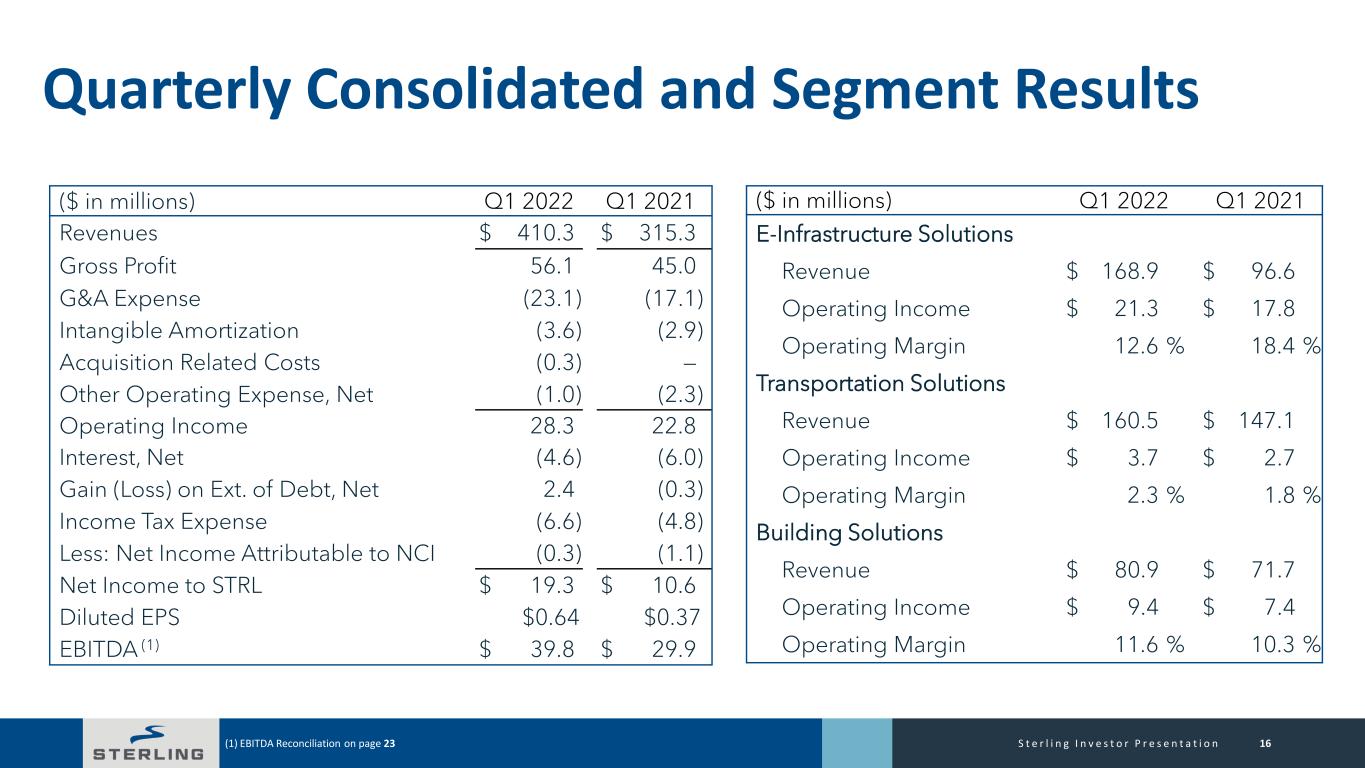
16S t e r l i n g I n v e s t o r P r e s e n t a t i o n Quarterly Consolidated and Segment Results (1) EBITDA Reconciliation on page 23 ($ in millions) Q1 2022 Q1 2021 Revenues $ 410.3 $ 315.3 Gross Profit 56.1 45.0 G&A Expense (23.1) (17.1) Intangible Amortization (3.6) (2.9) Acquisition Related Costs (0.3) — Other Operating Expense, Net (1.0) (2.3) Operating Income 28.3 22.8 Interest, Net (4.6) (6.0) Gain (Loss) on Ext. of Debt, Net 2.4 (0.3) Income Tax Expense (6.6) (4.8) Less: Net Income Attributable to NCI (0.3) (1.1) Net Income to STRL $ 19.3 $ 10.6 Diluted EPS $0.64 $0.37 EBITDA (1) $ 39.8 $ 29.9 ($ in millions) Q1 2022 Q1 2021 E-Infrastructure Solutions Revenue $ 168.9 $ 96.6 Operating Income $ 21.3 $ 17.8 Operating Margin 12.6 % 18.4 % Transportation Solutions Revenue $ 160.5 $ 147.1 Operating Income $ 3.7 $ 2.7 Operating Margin 2.3 % 1.8 % Building Solutions Revenue $ 80.9 $ 71.7 Operating Income $ 9.4 $ 7.4 Operating Margin 11.6 % 10.3 %
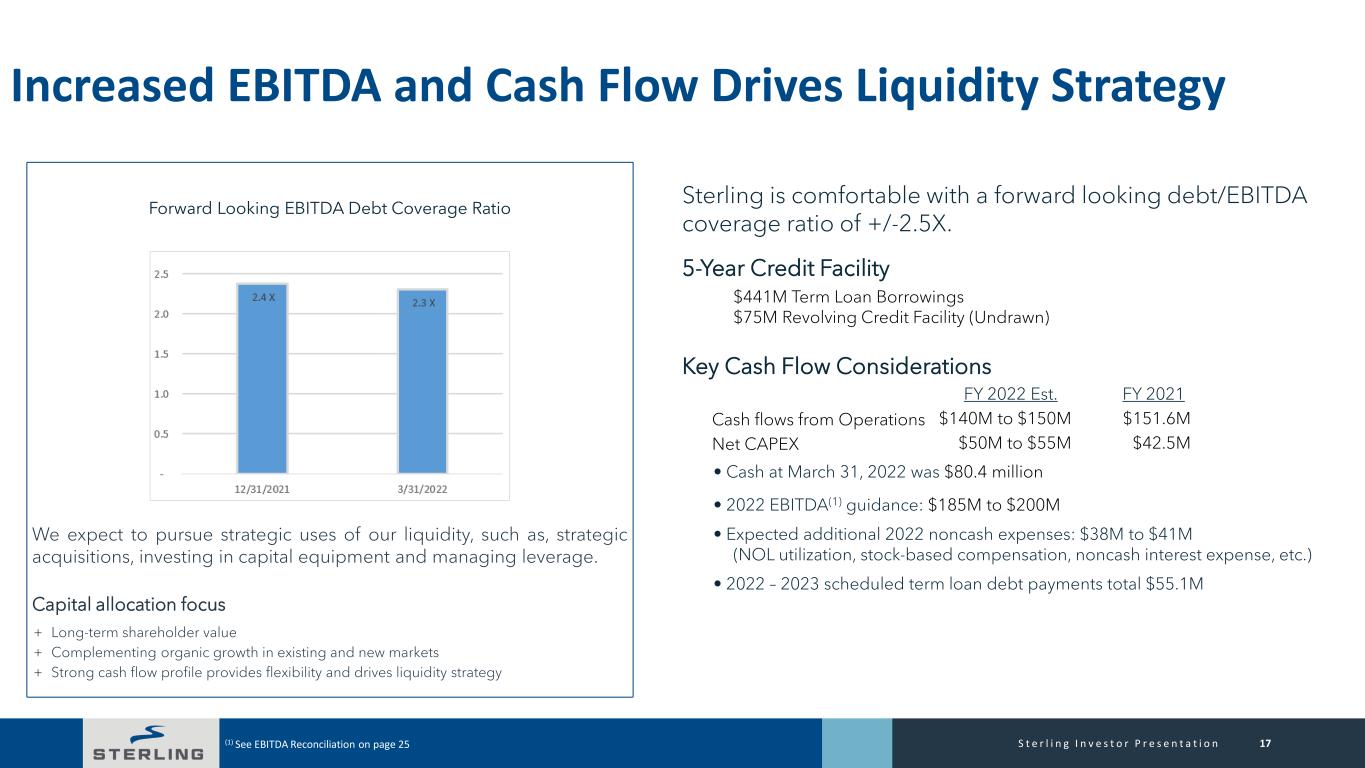
17S t e r l i n g I n v e s t o r P r e s e n t a t i o n Increased EBITDA and Cash Flow Drives Liquidity Strategy We expect to pursue strategic uses of our liquidity, such as, strategic acquisitions, investing in capital equipment and managing leverage. Capital allocation focus + Long-term shareholder value + Complementing organic growth in existing and new markets + Strong cash flow profile provides flexibility and drives liquidity strategy Forward Looking EBITDA Debt Coverage Ratio Sterling is comfortable with a forward looking debt/EBITDA coverage ratio of +/-2.5X. 5-Year Credit Facility $441M Term Loan Borrowings $75M Revolving Credit Facility (Undrawn) Key Cash Flow Considerations FY 2022 Est. FY 2021 Cash flows from Operations $140M to $150M $151.6M Net CAPEX $50M to $55M $42.5M • Cash at March 31, 2022 was $80.4 million • 2022 EBITDA(1) guidance: $185M to $200M • Expected additional 2022 noncash expenses: $38M to $41M (NOL utilization, stock-based compensation, noncash interest expense, etc.) • 2022 – 2023 scheduled term loan debt payments total $55.1M (1) See EBITDA Reconciliation on page 25
+ Contact Us Sterling Ron Ballschmiede, Chief Financial Officer Mary Morley, Investor Relations Sterling Construction Company, Inc. Tel: (281) 214-0777 The Equity Group Inc. Jeremy Hellman Tel: (212) 836-9626 jhellman@equityny.com S t e r l i n g I n v e s t o r P r e s e n t a t i o n 18

+ Appendix S t e r l i n g I n v e s t o r P r e s e n t a t i o n 19
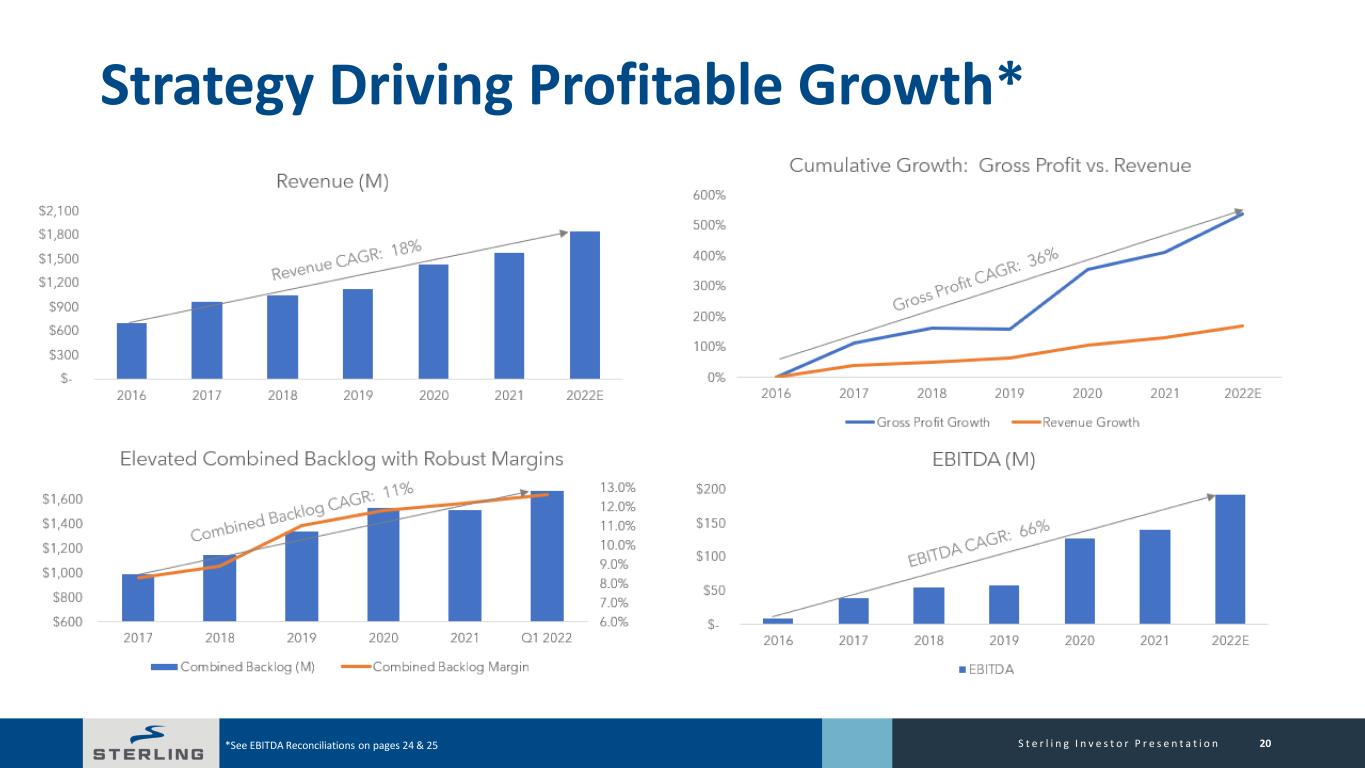
20S t e r l i n g I n v e s t o r P r e s e n t a t i o n Strategy Driving Profitable Growth* *See EBITDA Reconciliations on pages 24 & 25
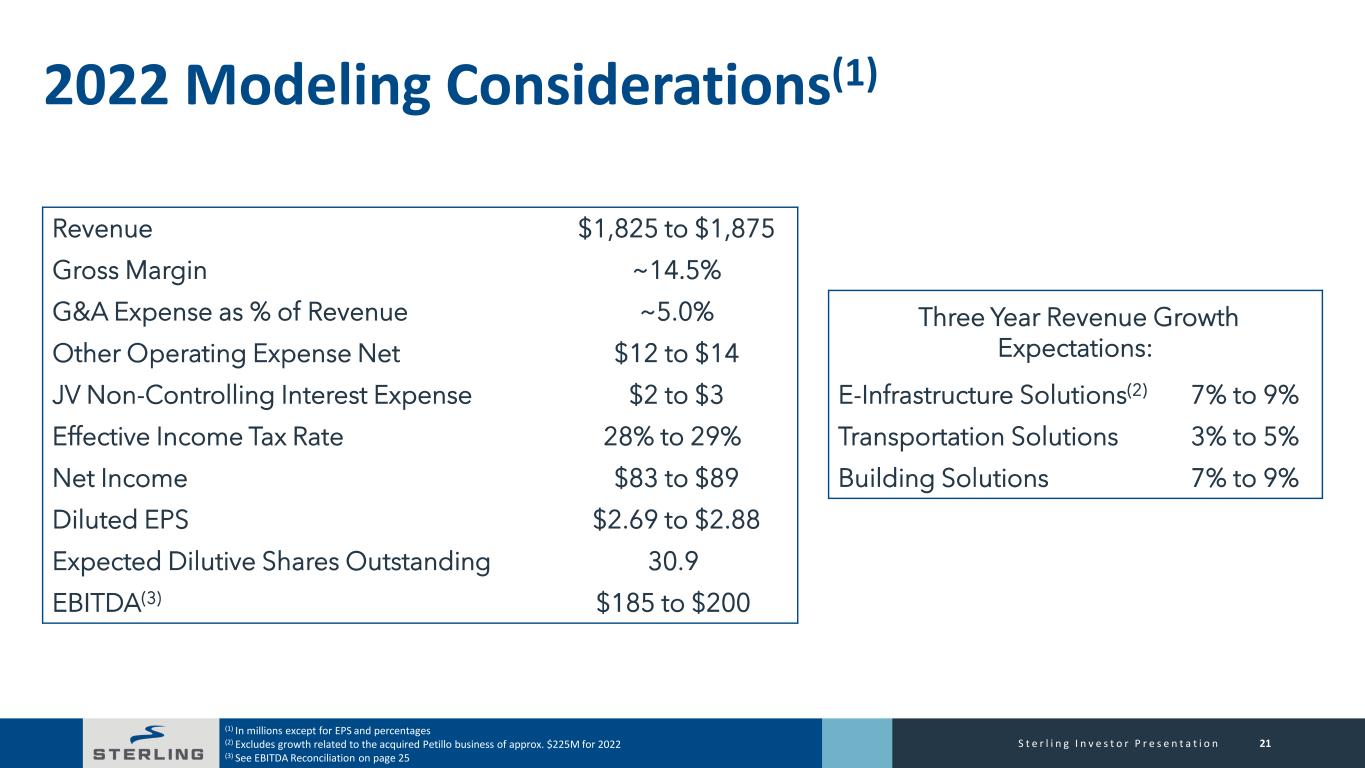
21S t e r l i n g I n v e s t o r P r e s e n t a t i o n 2022 Modeling Considerations(1) (1) In millions except for EPS and percentages (2) Excludes growth related to the acquired Petillo business of approx. $225M for 2022 (3) See EBITDA Reconciliation on page 25 Revenue $1,825 to $1,875 Gross Margin ~14.5% G&A Expense as % of Revenue ~5.0% Three Year Revenue Growth Expectations:Other Operating Expense Net $12 to $14 JV Non-Controlling Interest Expense $2 to $3 E-Infrastructure Solutions(2) 7% to 9% Effective Income Tax Rate 28% to 29% Transportation Solutions 3% to 5% Net Income $83 to $89 Building Solutions 7% to 9% Diluted EPS $2.69 to $2.88 Expected Dilutive Shares Outstanding 30.9 EBITDA(3) $185 to $200
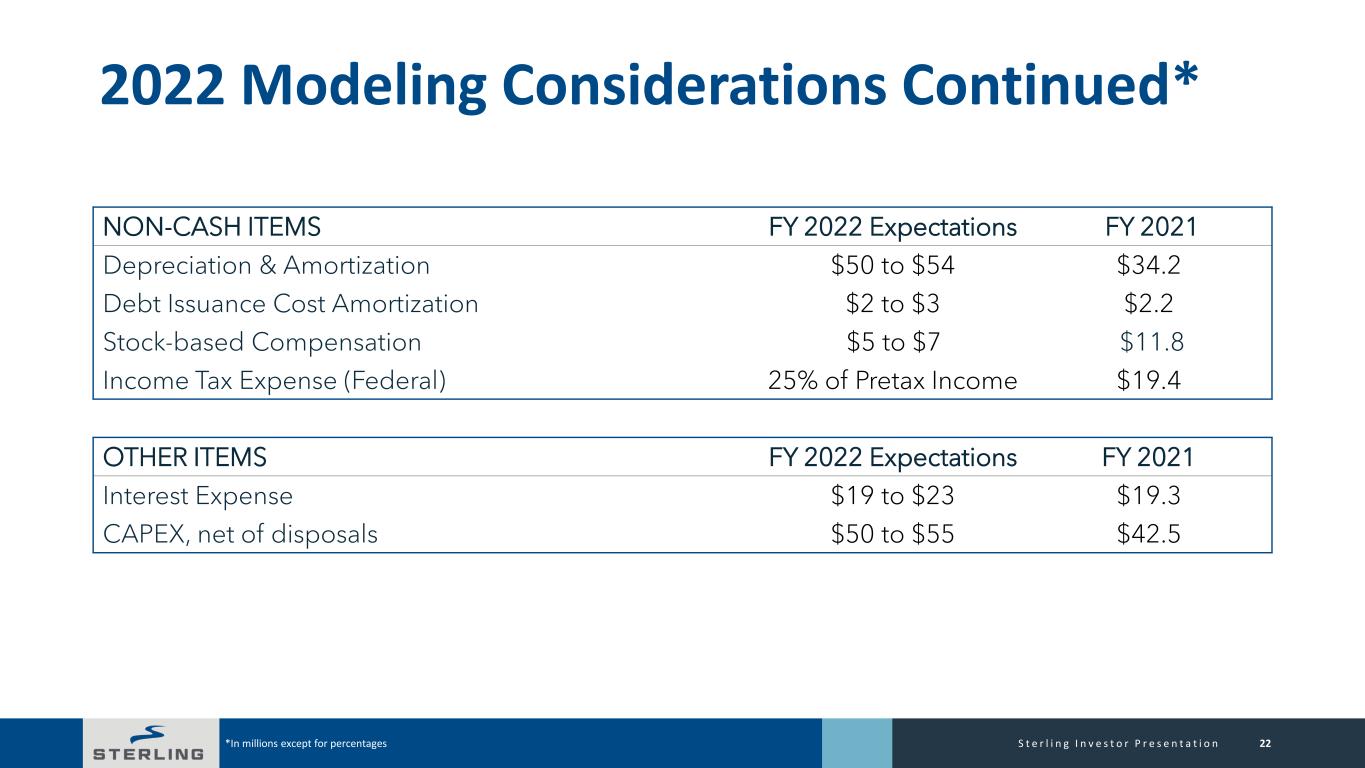
22S t e r l i n g I n v e s t o r P r e s e n t a t i o n 2022 Modeling Considerations Continued* *In millions except for percentages NON-CASH ITEMS FY 2022 Expectations FY 2021 Depreciation & Amortization $50 to $54 $34.2 Debt Issuance Cost Amortization $2 to $3 $2.2 Stock-based Compensation $5 to $7 $11.8 Income Tax Expense (Federal) 25% of Pretax Income $19.4 OTHER ITEMS FY 2022 Expectations FY 2021 Interest Expense $19 to $23 $19.3 CAPEX, net of disposals $50 to $55 $42.5
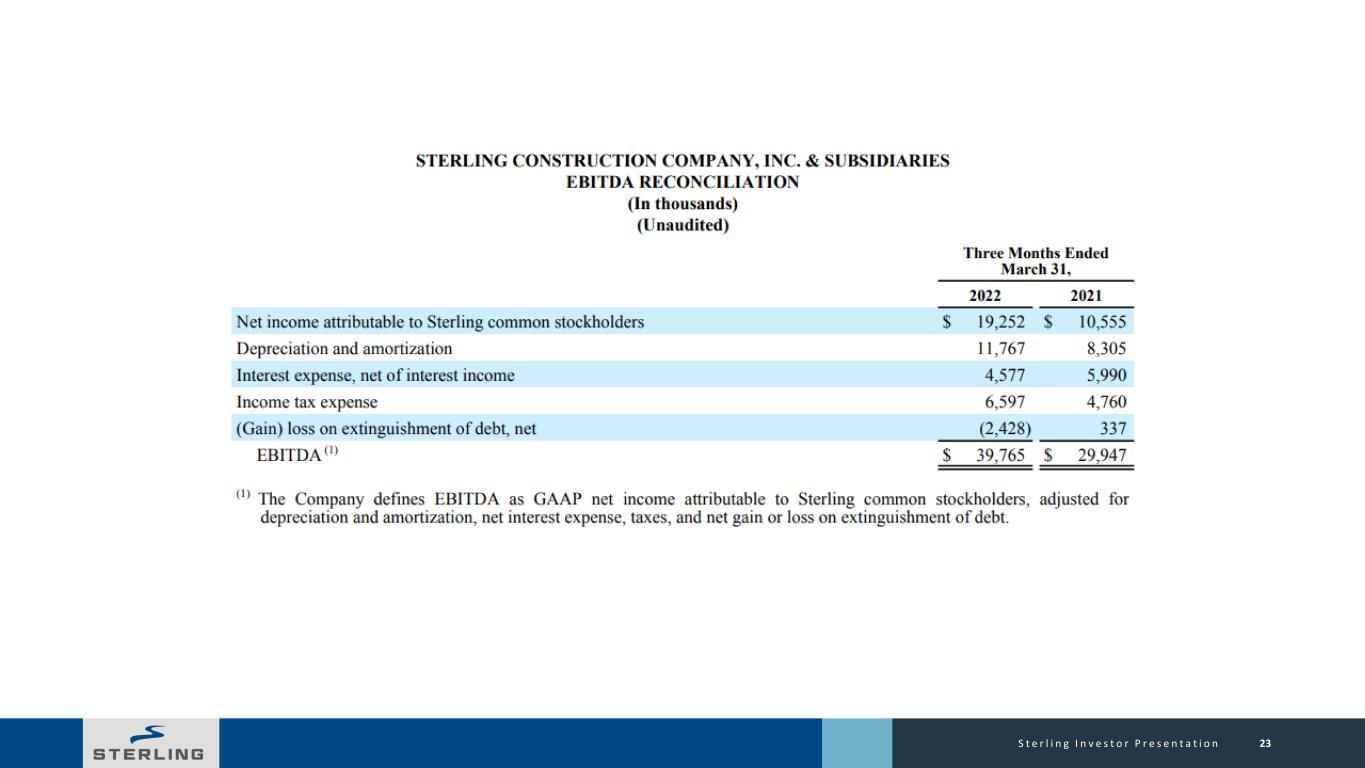
23S t e r l i n g I n v e s t o r P r e s e n t a t i o n
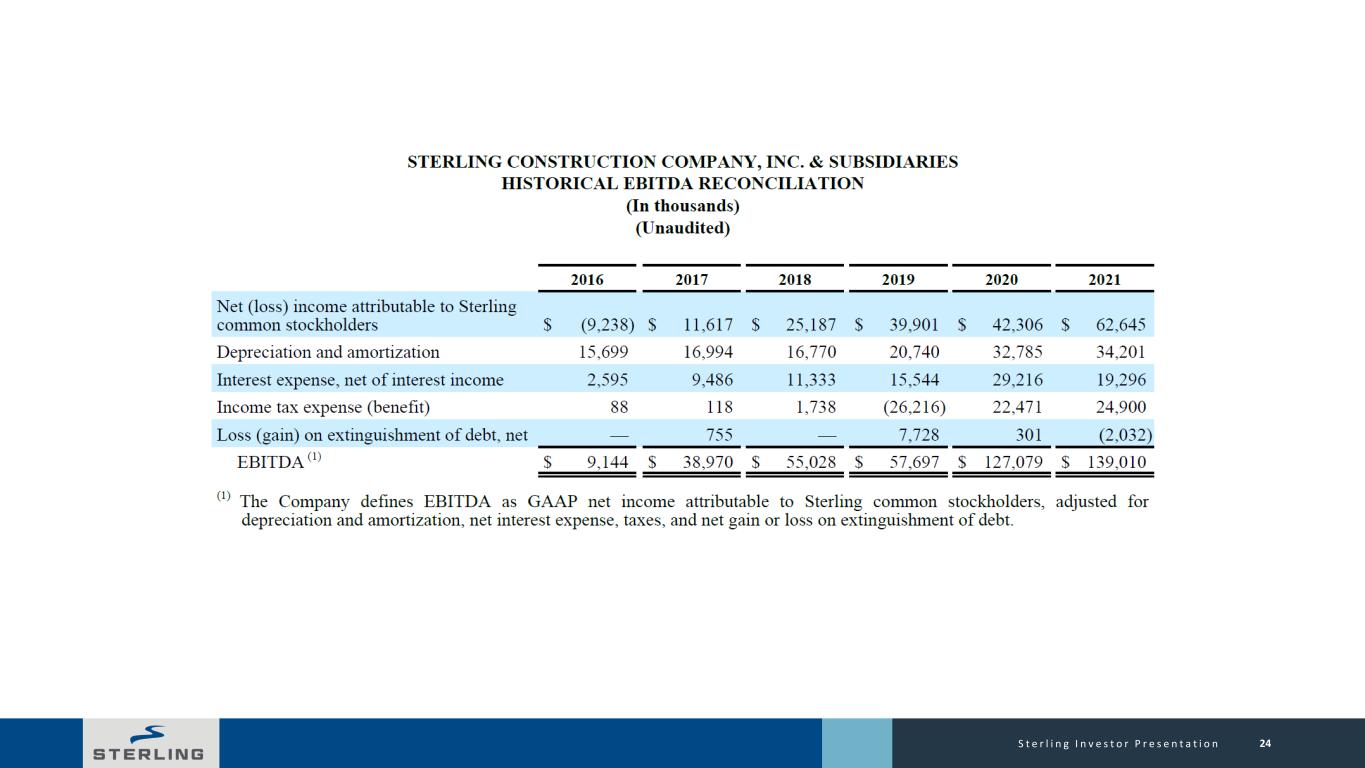
24S t e r l i n g I n v e s t o r P r e s e n t a t i o n

25S t e r l i n g I n v e s t o r P r e s e n t a t i o n
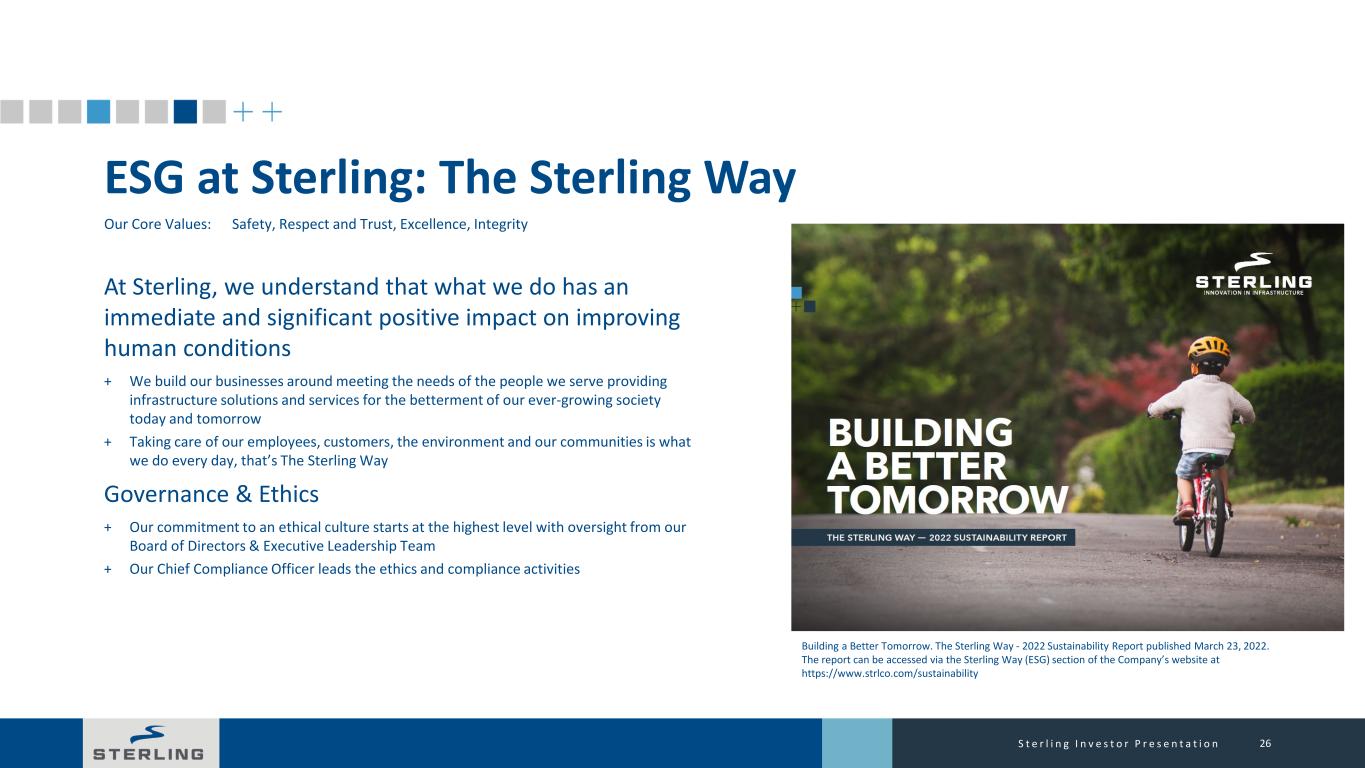
ESG at Sterling: The Sterling Way At Sterling, we understand that what we do has an immediate and significant positive impact on improving human conditions + We build our businesses around meeting the needs of the people we serve providing infrastructure solutions and services for the betterment of our ever-growing society today and tomorrow + Taking care of our employees, customers, the environment and our communities is what we do every day, that’s The Sterling Way Governance & Ethics + Our commitment to an ethical culture starts at the highest level with oversight from our Board of Directors & Executive Leadership Team + Our Chief Compliance Officer leads the ethics and compliance activities 26S t e r l i n g I n v e s t o r P r e s e n t a t i o n Our Core Values: Safety, Respect and Trust, Excellence, Integrity Building a Better Tomorrow. The Sterling Way - 2022 Sustainability Report published March 23, 2022. The report can be accessed via the Sterling Way (ESG) section of the Company’s website at https://www.strlco.com/sustainability
We build and service the infrastructure that enables our economy to run, our people to move, and our country to grow. THANK YOU


