
We build and service the infrastructure that enables our economy to run, our people to move, and our country to grow. Q3 2023 Earnings Call November 7, 2023
2Sterling | STRL: Third Quarter 2023 DISCLOSURE: Forward-Looking Statements This presentation contains, and the officers and directors of the Company may from time to time make, statements that are considered forward- looking statements within the meaning of the Securities Act of 1933 and the Securities Exchange Act of 1934. These forward-looking statements are subject to a number of risks and uncertainties, many of which are beyond our control, which may include statements about: our business strategy; our financial strategy; our industry outlook; our guidance; our expected margin growth; and our plans, objectives, expectations, forecasts, outlook and intentions. All of these types of statements, other than statements of historical fact included in this presentation, are forward-looking statements. In some cases, forward-looking statements can be identified by terminology such as “may,” “will,” “could,” “should,” “expect,” “plan,” “project,” “intend,” “anticipate,” “believe,” “estimate,” “predict,” “potential,” “pursue,” “target,” "guidance," “continue,” the negative of such terms or other comparable terminology. The forward-looking statements contained in this presentation are largely based on our expectations, which reflect estimates and assumptions made by our management. These estimates and assumptions reflect our best judgment based on currently known market conditions and other factors. Although we believe such estimates and assumptions to be reasonable, they are inherently uncertain and involve a number of risks and uncertainties that are beyond our control. In addition, management’s assumptions about future events may prove to be inaccurate. Management cautions all readers that the forward-looking statements contained in this presentation are not guarantees of future performance, and we cannot assure any reader that such statements will be realized or the forward-looking events and circumstances will occur. Actual results may differ materially from those anticipated or implied in the forward-looking statements due to factors listed in the “Risk Factors” section in our filings with the U.S. Securities and Exchange Commission and elsewhere in those filings. Additional factors or risks that we currently deem immaterial, that are not presently known to us or that arise in the future could also cause our actual results to differ materially from our expected results. Given these uncertainties, investors are cautioned that many of the assumptions upon which our forward-looking statements are based are likely to change after the date the forward-looking statements are made. The forward- looking statements speak only as of the date made, and we undertake no obligation to publicly update or revise any forward-looking statements for any reason, whether as a result of new information, future events or developments, changed circumstances, or otherwise, notwithstanding any changes in our assumptions, changes in business plans, actual experience or other changes. These cautionary statements qualify all forward- looking statements attributable to us or persons acting on our behalf. This presentation may contain the financial measures: adjusted net income, EBITDA, adjusted EBITDA, and adjusted EPS, which are not calculated in accordance with U.S. GAAP. If presented, a reconciliation of the non-GAAP financial measures to the most directly comparable GAAP financial measure will be provided in the Appendix to this presentation.
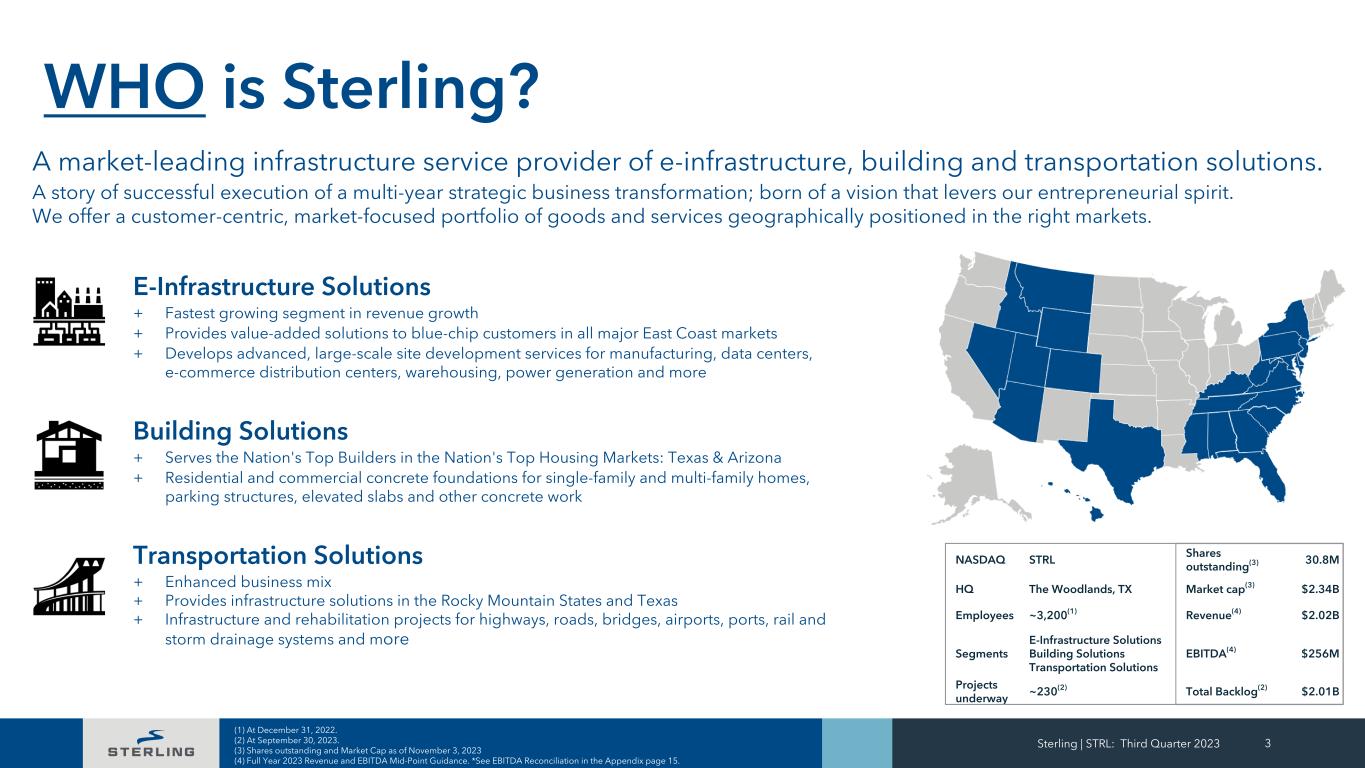
E-Infrastructure Solutions + Fastest growing segment in revenue growth + Provides value-added solutions to blue-chip customers in all major East Coast markets + Develops advanced, large-scale site development services for manufacturing, data centers, e-commerce distribution centers, warehousing, power generation and more Building Solutions + Serves the Nation's Top Builders in the Nation's Top Housing Markets: Texas & Arizona + Residential and commercial concrete foundations for single-family and multi-family homes, parking structures, elevated slabs and other concrete work Transportation Solutions + Enhanced business mix + Provides infrastructure solutions in the Rocky Mountain States and Texas + Infrastructure and rehabilitation projects for highways, roads, bridges, airports, ports, rail and storm drainage systems and more Sterling | STRL: Third Quarter 2023 3 WHO is Sterling? NASDAQ STRL Shares outstanding(3) 30.8M HQ The Woodlands, TX Market cap(3) $2.34B Employees ~3,200(1) Revenue(4) $2.02B Segments E-Infrastructure Solutions Building Solutions Transportation Solutions EBITDA(4) $256M Projects underway ~230(2) Total Backlog(2) $2.01B A market-leading infrastructure service provider of e-infrastructure, building and transportation solutions. A story of successful execution of a multi-year strategic business transformation; born of a vision that levers our entrepreneurial spirit. We offer a customer-centric, market-focused portfolio of goods and services geographically positioned in the right markets. (1) At December 31, 2022. (2) At September 30, 2023. (3) Shares outstanding and Market Cap as of November 3, 2023 (4) Full Year 2023 Revenue and EBITDA Mid-Point Guidance. *See EBITDA Reconciliation in the Appendix page 15.
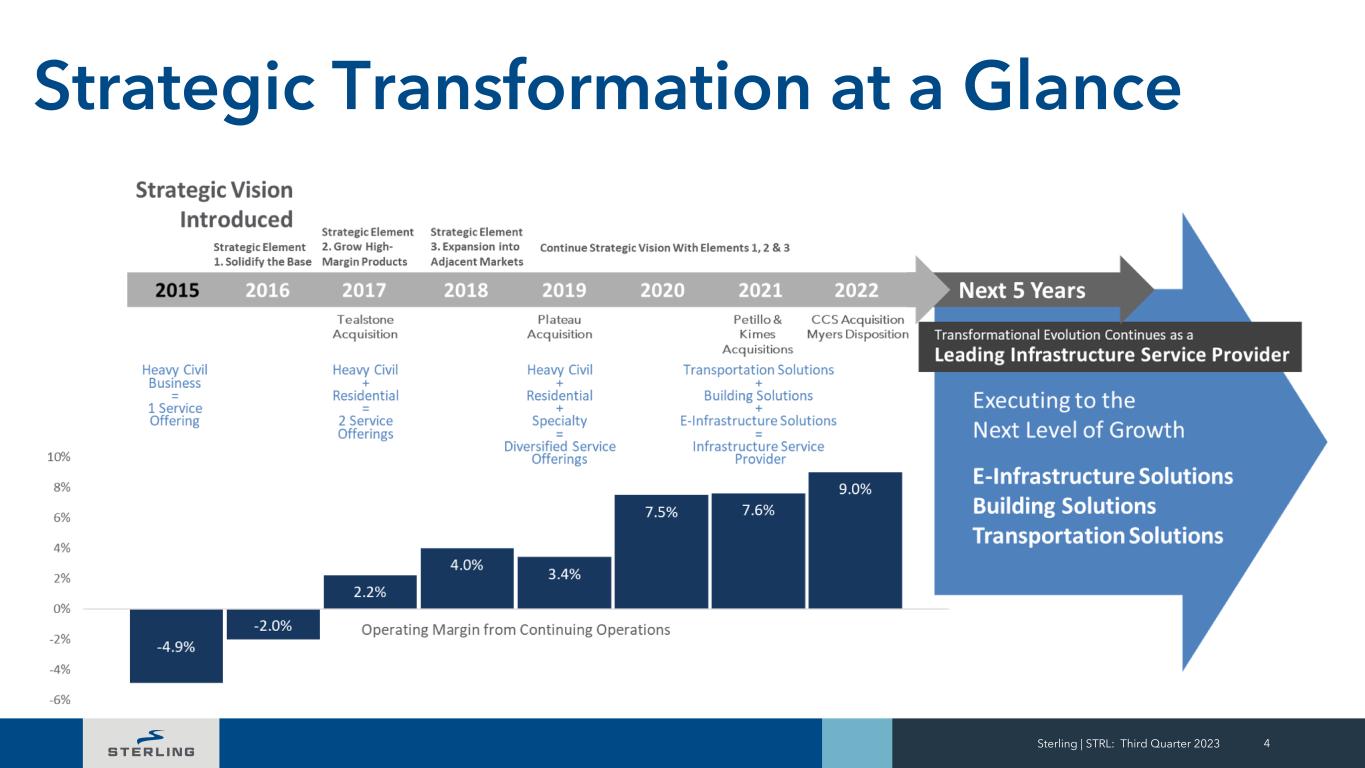
Sterling | STRL: Third Quarter 2023 4 Strategic Transformation at a Glance

+ Third Quarter 2023 Results Sterling | STRL: Third Quarter 2023 5
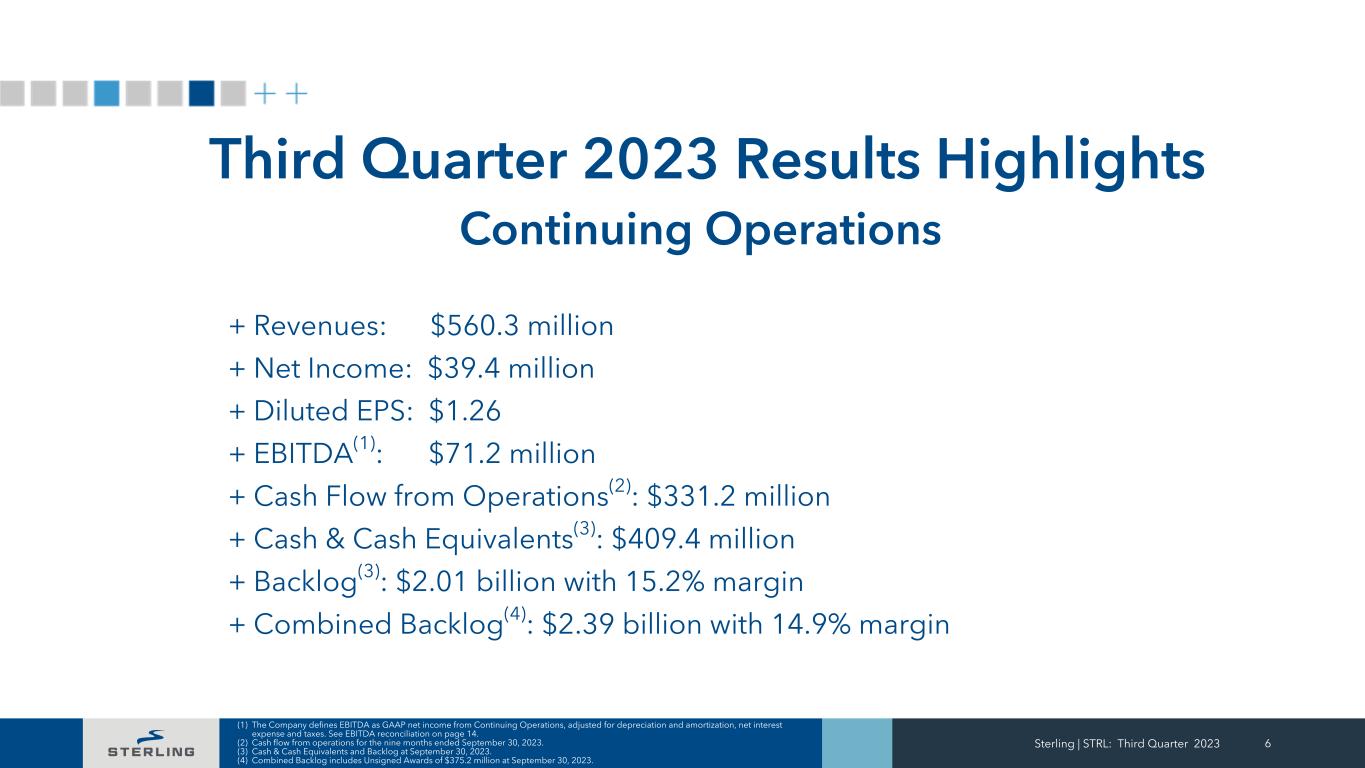
Third Quarter 2023 Results Highlights Continuing Operations + Revenues: $560.3 million + Net Income: $39.4 million + Diluted EPS: $1.26 + EBITDA(1): $71.2 million + Cash Flow from Operations(2): $331.2 million + Cash & Cash Equivalents(3): $409.4 million + Backlog(3): $2.01 billion with 15.2% margin + Combined Backlog(4): $2.39 billion with 14.9% margin Sterling | STRL: Third Quarter 2023 6 (1) The Company defines EBITDA as GAAP net income from Continuing Operations, adjusted for depreciation and amortization, net interest expense and taxes. See EBITDA reconciliation on page 14. (2) Cash flow from operations for the nine months ended September 30, 2023. (3) Cash & Cash Equivalents and Backlog at September 30, 2023. (4) Combined Backlog includes Unsigned Awards of $375.2 million at September 30, 2023.
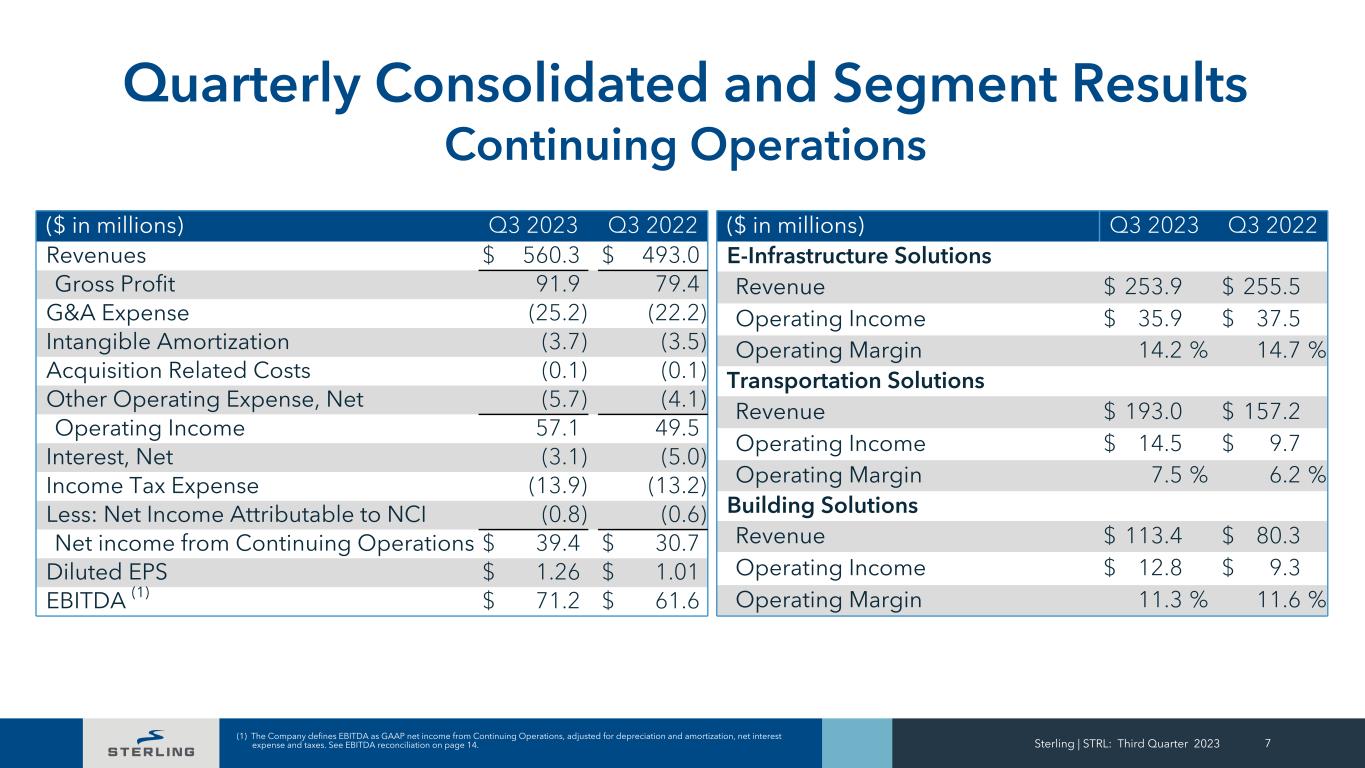
Sterling | STRL: Third Quarter 2023 7 Quarterly Consolidated and Segment Results Continuing Operations ($ in millions) Q3 2023 Q3 2022 Revenues $ 560.3 $ 493.0 Gross Profit 91.9 79.4 G&A Expense (25.2) (22.2) Intangible Amortization (3.7) (3.5) Acquisition Related Costs (0.1) (0.1) Other Operating Expense, Net (5.7) (4.1) Operating Income 57.1 49.5 Interest, Net (3.1) (5.0) Income Tax Expense (13.9) (13.2) Less: Net Income Attributable to NCI (0.8) (0.6) Net income from Continuing Operations $ 39.4 $ 30.7 Diluted EPS $ 1.26 $ 1.01 EBITDA (1) $ 71.2 $ 61.6 ($ in millions) Q3 2023 Q3 2022 E-Infrastructure Solutions Revenue $ 253.9 $ 255.5 Operating Income $ 35.9 $ 37.5 Operating Margin 14.2 % 14.7 % Transportation Solutions Revenue $ 193.0 $ 157.2 Operating Income $ 14.5 $ 9.7 Operating Margin 7.5 % 6.2 % Building Solutions Revenue $ 113.4 $ 80.3 Operating Income $ 12.8 $ 9.3 Operating Margin 11.3 % 11.6 % (1) The Company defines EBITDA as GAAP net income from Continuing Operations, adjusted for depreciation and amortization, net interest expense and taxes. See EBITDA reconciliation on page 14.
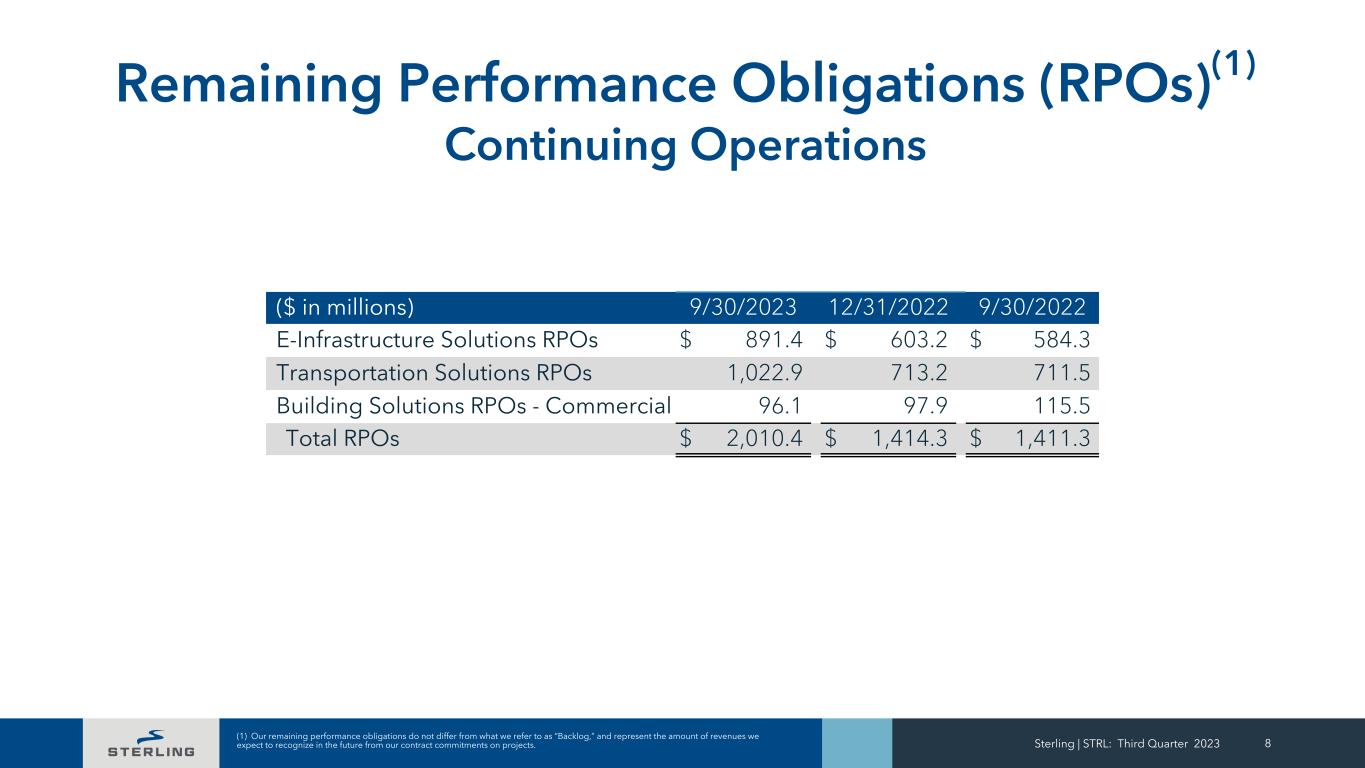
Sterling | STRL: Third Quarter 2023 8 Remaining Performance Obligations (RPOs)(1) Continuing Operations ($ in millions) 9/30/2023 12/31/2022 9/30/2022 E-Infrastructure Solutions RPOs $ 891.4 $ 603.2 $ 584.3 Transportation Solutions RPOs 1,022.9 713.2 711.5 Building Solutions RPOs - Commercial 96.1 97.9 115.5 Total RPOs $ 2,010.4 $ 1,414.3 $ 1,411.3 (1) Our remaining performance obligations do not differ from what we refer to as “Backlog,” and represent the amount of revenues we expect to recognize in the future from our contract commitments on projects.
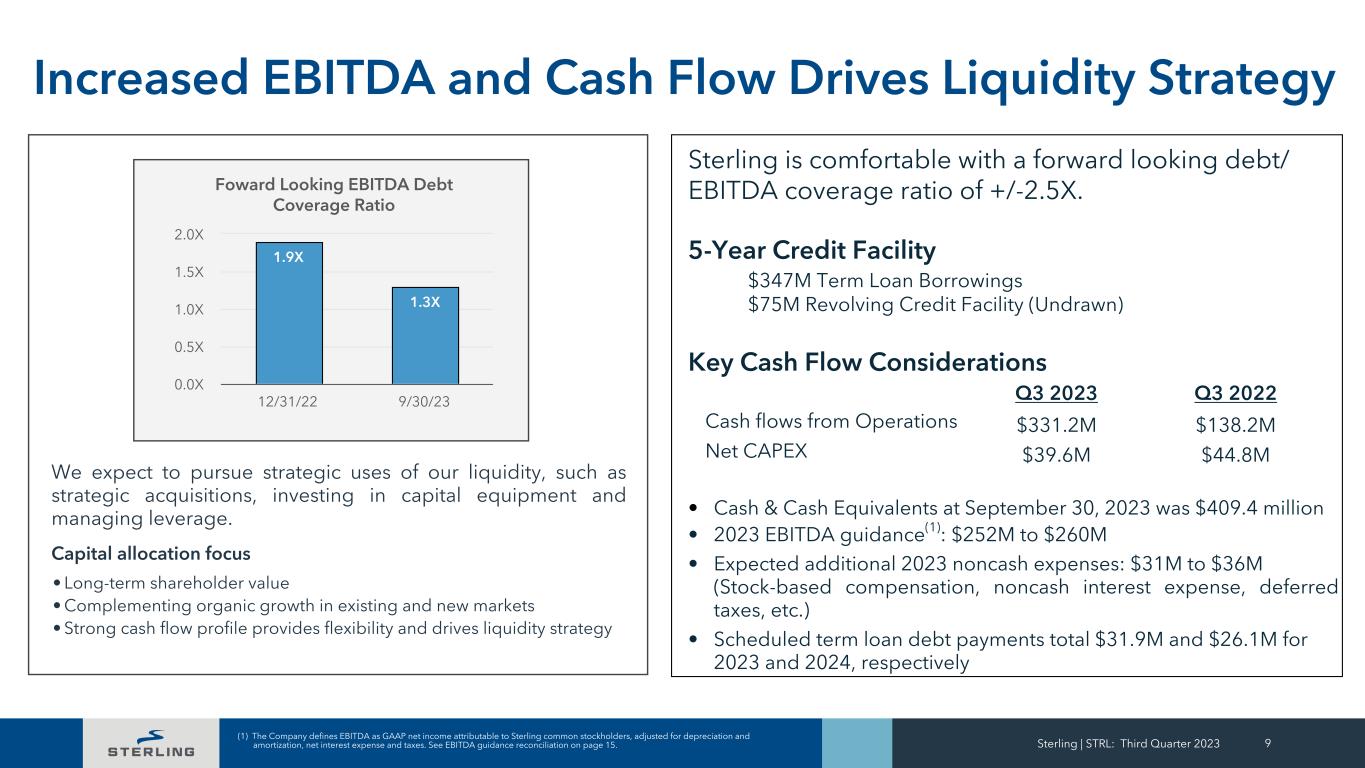
Sterling | STRL: Third Quarter 2023 9 Increased EBITDA and Cash Flow Drives Liquidity Strategy Foward Looking EBITDA Debt Coverage Ratio 1.9X 1.3X 12/31/22 9/30/23 0.0X 0.5X 1.0X 1.5X 2.0X We expect to pursue strategic uses of our liquidity, such as strategic acquisitions, investing in capital equipment and managing leverage. Capital allocation focus • Long-term shareholder value • Complementing organic growth in existing and new markets • Strong cash flow profile provides flexibility and drives liquidity strategy Sterling is comfortable with a forward looking debt/ EBITDA coverage ratio of +/-2.5X. 5-Year Credit Facility $347M Term Loan Borrowings $75M Revolving Credit Facility (Undrawn) Key Cash Flow Considerations Q3 2023 Q3 2022 Cash flows from Operations $331.2M $138.2M Net CAPEX $39.6M $44.8M • Cash & Cash Equivalents at September 30, 2023 was $409.4 million • 2023 EBITDA guidance(1): $252M to $260M • Expected additional 2023 noncash expenses: $31M to $36M (Stock-based compensation, noncash interest expense, deferred taxes, etc.) • Scheduled term loan debt payments total $31.9M and $26.1M for 2023 and 2024, respectively (1) The Company defines EBITDA as GAAP net income attributable to Sterling common stockholders, adjusted for depreciation and amortization, net interest expense and taxes. See EBITDA guidance reconciliation on page 15.
Sterling | STRL: Third Quarter 2023 10 Contact Us Sterling Infrastructure, Inc. Noelle Dilts, VP IR and Corporate Strategy Tel: (281) 214-0795 noelle.dilts@strlco.com
+ Appendix Sterling | STRL: Third Quarter 2023 11
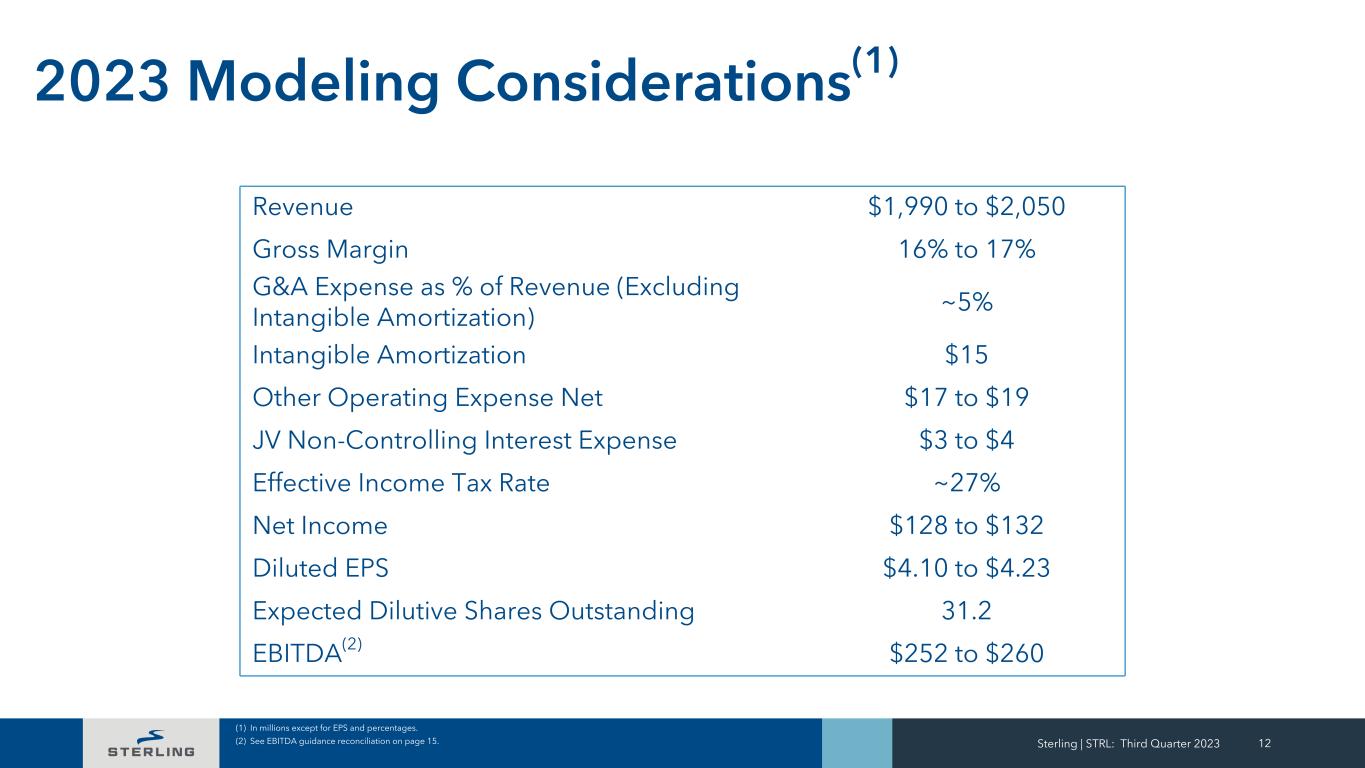
Sterling | STRL: Third Quarter 2023 12 2023 Modeling Considerations(1) (1) In millions except for EPS and percentages. (2) See EBITDA guidance reconciliation on page 15. Revenue $1,990 to $2,050 Gross Margin 16% to 17% G&A Expense as % of Revenue (Excluding Intangible Amortization) ~5% Intangible Amortization $15 Other Operating Expense Net $17 to $19 JV Non-Controlling Interest Expense $3 to $4 Effective Income Tax Rate ~27% Net Income $128 to $132 Diluted EPS $4.10 to $4.23 Expected Dilutive Shares Outstanding 31.2 EBITDA(2) $252 to $260
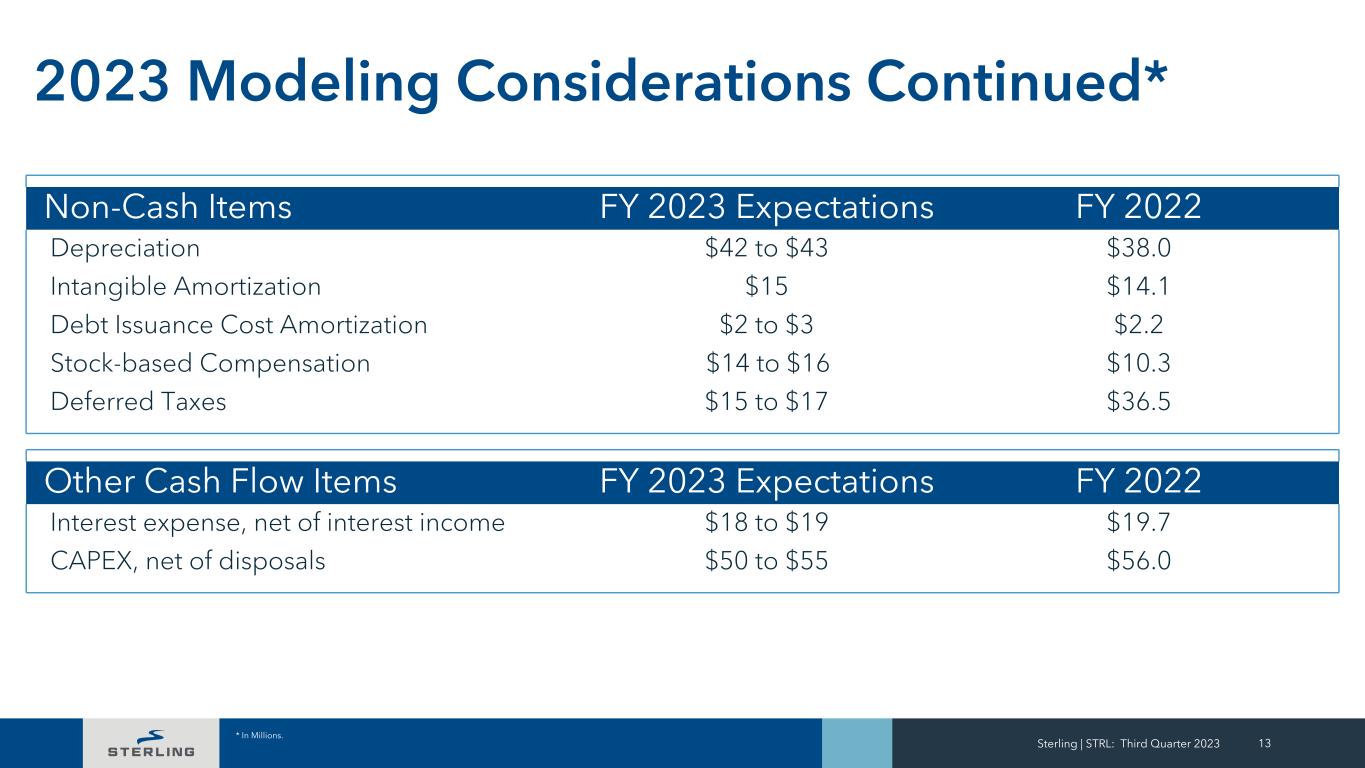
2023 Modeling Considerations Continued* Sterling | STRL: Third Quarter 2023 13 * In Millions. Non-Cash Items FY 2023 Expectations FY 2022 Depreciation $42 to $43 $38.0 Intangible Amortization $15 $14.1 Debt Issuance Cost Amortization $2 to $3 $2.2 Stock-based Compensation $14 to $16 $10.3 Deferred Taxes $15 to $17 $36.5 Other Cash Flow Items FY 2023 Expectations FY 2022 Interest expense, net of interest income $18 to $19 $19.7 CAPEX, net of disposals $50 to $55 $56.0
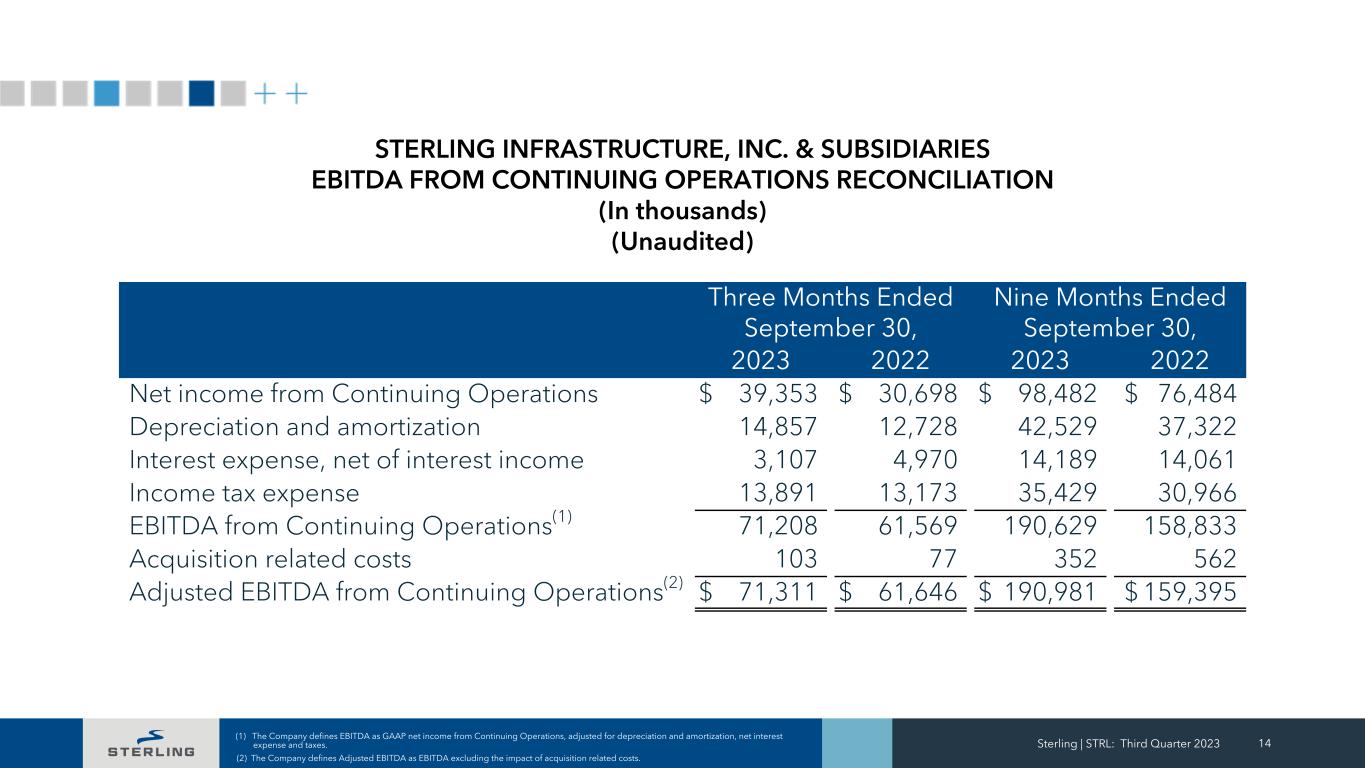
Sterling | STRL: Third Quarter 2023 14 (1) The Company defines EBITDA as GAAP net income from Continuing Operations, adjusted for depreciation and amortization, net interest expense and taxes. (2) The Company defines Adjusted EBITDA as EBITDA excluding the impact of acquisition related costs. Three Months Ended September 30, Nine Months Ended September 30, 2023 2022 2023 2022 Net income from Continuing Operations $ 39,353 $ 30,698 $ 98,482 $ 76,484 Depreciation and amortization 14,857 12,728 42,529 37,322 Interest expense, net of interest income 3,107 4,970 14,189 14,061 Income tax expense 13,891 13,173 35,429 30,966 EBITDA from Continuing Operations(1) 71,208 61,569 190,629 158,833 Acquisition related costs 103 77 352 562 Adjusted EBITDA from Continuing Operations(2) $ 71,311 $ 61,646 $ 190,981 $ 159,395 STERLING INFRASTRUCTURE, INC. & SUBSIDIARIES EBITDA FROM CONTINUING OPERATIONS RECONCILIATION (In thousands) (Unaudited)

Sterling | STRL: Third Quarter 2023 15 (1) The Company defines EBITDA as GAAP net income attributable to Sterling common stockholders, adjusted for depreciation and amortization, net interest expense and taxes. Full Year 2023 Guidance Low High Net income attributable to Sterling common stockholders $ 128 $ 132 Depreciation and amortization 57 58 Interest expense, net of interest income 18 19 Income tax expense 49 51 EBITDA (1) $ 252 $ 260 STERLING INFRASTRUCTURE, INC. & SUBSIDIARIES EBITDA GUIDANCE RECONCILIATION (In millions) (Unaudited)
THANK YOU We build and service the infrastructure that enables our economy to run, our people to move, and our country to grow.


