Searchable text section of graphics shown above
Redefining
Service
[LOGO]
23rd Annual JPMorgan Healthcare Conference
John J. Arlotta, Chairman, President & CEO
January 12, 2005
[LOGO] | Forward-Looking Statements |
Statements made in this presentation, our website and in our other public filings and releases, which are not historical facts contain “forward-looking” statements (as defined in the Private Securities Litigation Reform Act of 1995) that involve risks and uncertainties and are subject to change at any time. These forward-looking statements may include, but are not limited to, statements containing words such as “anticipate,” “believe,” “plan,” “estimate,” “expect,” “intend,” “may”, “target” and similar expressions. Such forward looking statements include, without limitation, statements regarding the effect of the spin-off on our operations, expected changes in reimbursement rates and inflationary increases in state Medicaid rates, expected bed count, expected SG&A expense, anticipated restructuring charges and estimates of timing and costs savings related to cost improvement initiatives. Factors that could cause actual results to differ materially include, but are not limited to, the following: our ability, and the ability of our customers, to comply with Medicare or Medicaid reimbursement regulations or other applicable laws, changes in the reimbursement rates or methods of payment from Medicare and Medicaid, or the implementation of other measures to reduce the reimbursement for our services and the impact of the Medicare Prescription Drug, Improvement and Modernization Act of 2003, changes in pharmacy legislation and payment formulas, the impact of federal and state regulations, competition in our businesses, the impact of Omnicare, Inc.’s unsolicited tender offer to acquire all of our outstanding common stock, competition for qualified management and pharmacy professionals, the impact of investigations and audits relating to alleged violations of federal and/or state regulations, changes in the acuity of patients, payor mix and payment methodologies, further consolidation of managed care organizations and other third party payors, the effect of the expiration or termination of certain service and supply contracts, changes in or our failure to satisfy pharmaceutical manufacturers’ rebate programs, an economic downturn or changes in the laws affecting our business in those markets in which we operate, the impact of acquisitions, and our ability to integrate acquired businesses, on our operations and finances, our ability to control operating costs and generate sufficient cash flow to meet operational and financial requirements, our ability, and the ability of our subsidiary guarantors, to fulfill debt obligations, our covenants and restrictions contained in financing agreements which limit our discretion in the operation of our business, our charter documents and the Pennsylvania Business Corporation Law of 1988, as amended, which could delay or prevent a change of control, availability of financial and other resources to us after the spin-off of GHC, operating inefficiencies and higher costs after the spin-off of GHC, federal income tax liabilities and indemnification obligations related to the spin-off of GHC, conflicts of interest as a result of our continuing relationship with GHC after the spin-off, the ability of GHC, as our largest customer, to operate as a separate entity and acts of God or public authorities, war, civil unrest, terrorism, fire, floods, earthquakes and other matters beyond our control.
The forward-looking statements involve known and unknown risks, uncertainties and other factors that are, in some cases, beyond our control. We caution investors that any forward-looking statements made by us are not guarantees of future performance. We disclaim any obligation to update any such factors or to announce publicly the results of any revisions to any of the forward-looking statements to reflect future events or developments.
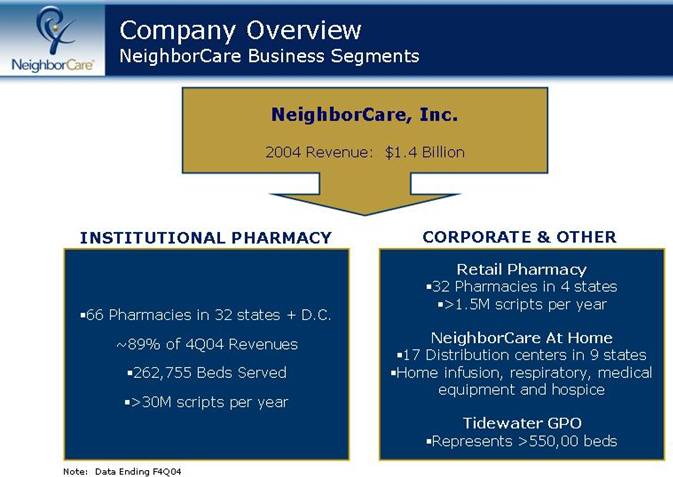
Company Overview
NeighborCare Business Segments
NeighborCare, Inc.
2004 Revenue: $1.4 Billion
INSTITUTIONAL PHARMACY | CORPORATE & OTHER |
| |
| Retail Pharmacy |
| •32 Pharmacies in 4 states |
•66 Pharmacies in 32 states + D.C. | •>1.5M scripts per year |
| |
~89% of 4Q04 Revenues | NeighborCare At Home |
| •17 Distribution centers in 9 states |
•262,755 Beds Served | •Home infusion, respiratory, medical equipment and hospice |
| |
•>30M scripts per year | Tidewater GPO |
| •Represents >550,00 beds |
Note: Data Ending F4Q04
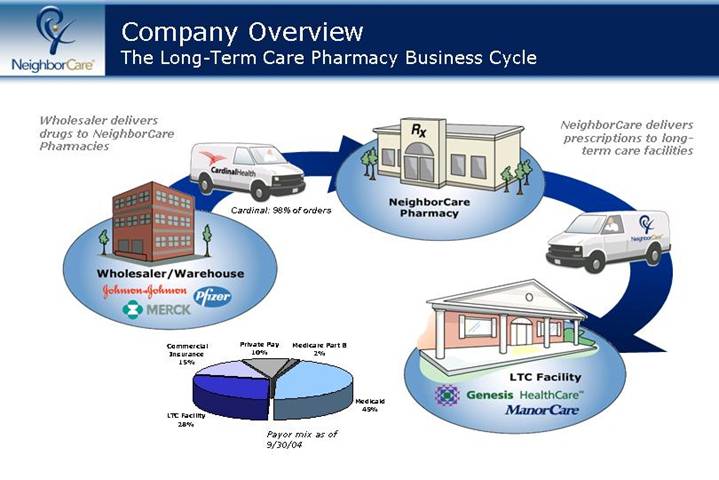
The Long-Term Care Pharmacy Business Cycle
Wholesaler delivers drugs to NeighborCare Pharmacies
[GRAPHIC]
NeighborCare delivers prescriptions to long-term care facilities
[CHART]
Payor mix as of 9/30/04
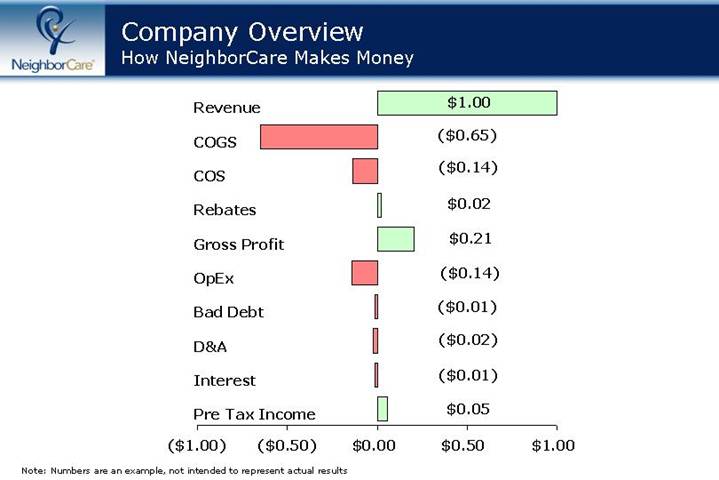
How NeighborCare Makes Money
[CHART]
Revenue | | $ | 1.00 | |
| | | | |
COGS | | $ | (0.65 | ) |
| | | | |
COS | | $ | (0.14 | ) |
| | | | |
Rebates | | $ | 0.02 | |
| | | | |
Gross Profit | | $ | 0.21 | |
| | | | |
OpEx | | $ | (0.14 | ) |
| | | | |
Bad Debt | | $ | (0.01 | ) |
| | | | |
D&A | | $ | (0.02 | ) |
| | | | |
Interest | | $ | (0.01 | ) |
| | | | |
Pre Tax Income | | $ | 0.05 | |
Note: Numbers are an example, not intended to represent actual results
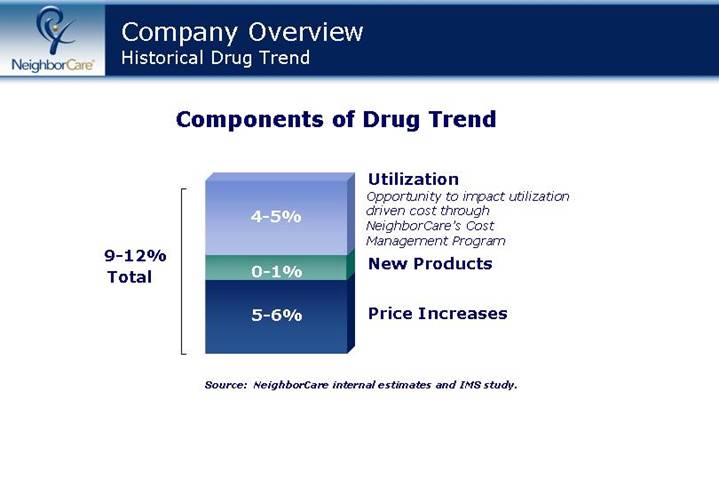
Historical Drug Trend
Components of Drug Trend
[CHART]
Utilization | | 4-5% | |
Opportunity to impact utilization driven cost through NeighborCare’s Cost Management Program | | | |
| | | |
New Products | | 0-1% | |
| | | |
Price Increases | | 5-6% | |
| | | |
Total | | 9-12% | |
Source: NeighborCare internal estimates and IMS study.
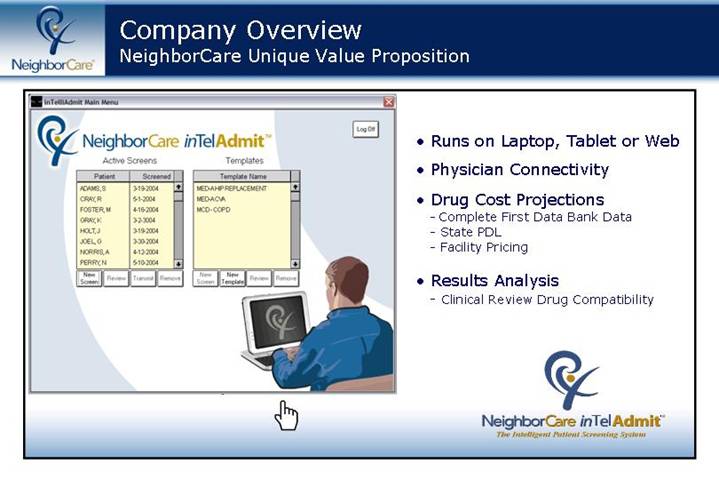
NeighborCare Unique Value Proposition
[GRAPHIC]
• Runs on Laptop, Tablet or Web
• Physician Connectivity
• Drug Cost Projections
• Complete First Data Bank Data
• State PDL
• Facility Pricing
• Results Analysis
• Clinical Review Drug Compatibility
| [LOGO] |
| NeighborCare inTelAdmit™ |
| The Intelligent Patient Screening System |
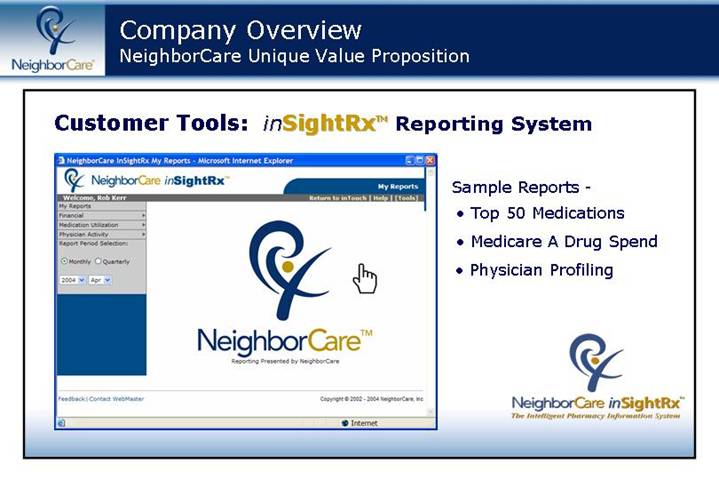
Customer Tools: inSightRx™ Reporting System
[GRAPHIC]
Sample Reports -
• Top 50 Medications
• Medicare A Drug Spend
• Physician Profiling
| [LOGO] |
| NeighborCare inSightRx™ |
| The Intelligent Pharmacy Information System |
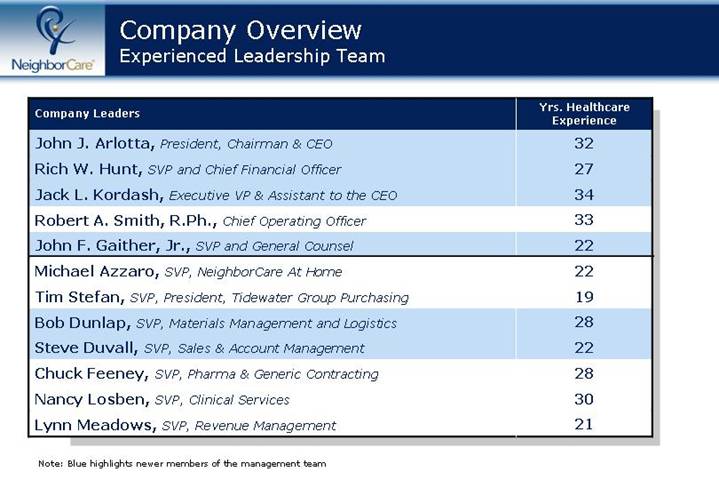
Experienced Leadership Team
Company Leaders | | Yrs. Healthcare
Experience |
| | |
John J. Arlotta, President, Chairman & CEO | | 32 |
| | |
Rich W. Hunt, SVP and Chief Financial Officer | | 27 |
| | |
Jack L. Kordash, Executive VP & Assistant to the CEO | | 34 |
| | |
Robert A. Smith, R.Ph., Chief Operating Officer | | 33 |
| | |
John F. Gaither, Jr., SVP and General Counsel | | 22 |
| | |
Michael Azzaro, SVP, NeighborCare At Home | | 22 |
| | |
Tim Stefan, SVP, President, Tidewater Group Purchasing | | 19 |
| | |
Bob Dunlap, SVP, Materials Management and Logistics | | 28 |
| | |
Steve Duvall, SVP, Sales & Account Management | | 22 |
| | |
Chuck Feeney, SVP, Pharma & Generic Contracting | | 28 |
| | |
Nancy Losben, SVP, Clinical Services | | 30 |
| | |
Lynn Meadows, SVP, Revenue Management | | 21 |
Note: Blue highlights newer members of the management team
Our Business Plan
Capitalizing on the Opportunity
• Reduce service costs while improving customer service
• Reduce product costs through improved formulary management
• Grow sales organically and increase customer retention
• Expand core business through acquisitions, new sites and sales force expansion to gain competitive advantage
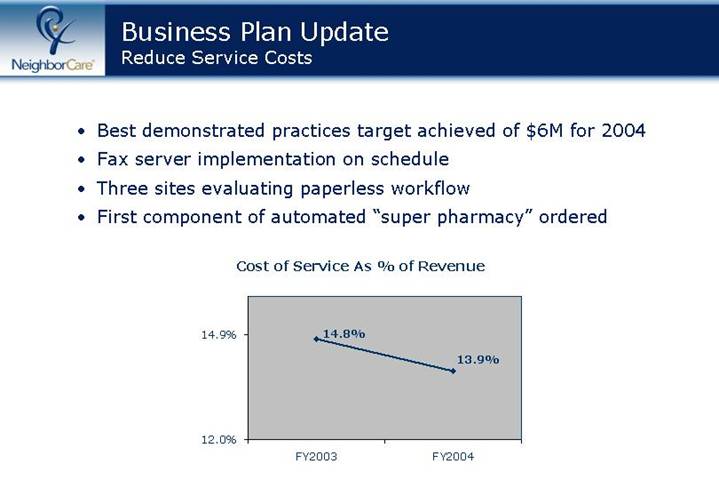
Business Plan Update
Reduce Service Costs
• Best demonstrated practices target achieved of $6M for 2004
• Fax server implementation on schedule
• Three sites evaluating paperless workflow
• First component of automated “super pharmacy” ordered
Cost of Service As % of Revenue
[CHART]
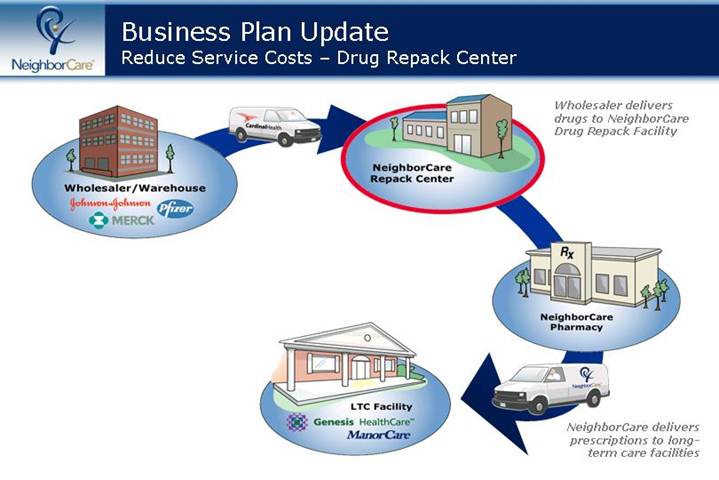
Reduce Service Costs – Drug Repack Center
[GRAPHIC]
Wholesaler delivers drugs to NeighborCare Drug Repack Facility
NeighborCare delivers prescriptions to long-term care facilities
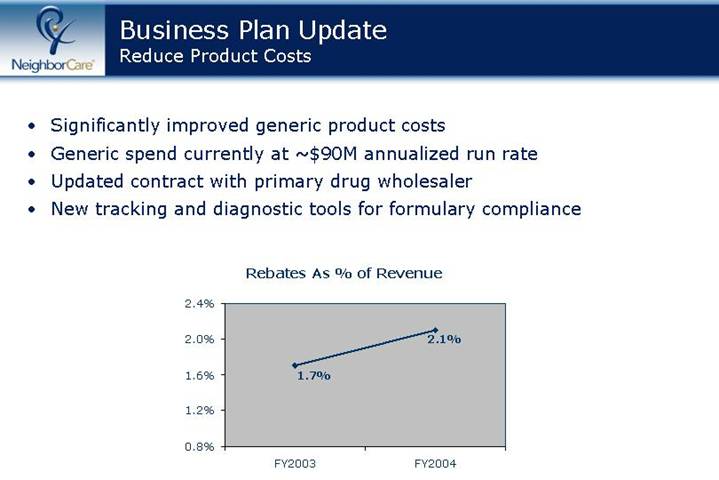
Reduce Product Costs
• Significantly improved generic product costs
• Generic spend currently at ~$90M annualized run rate
• Updated contract with primary drug wholesaler
• New tracking and diagnostic tools for formulary compliance
Rebates As % of Revenue
[CHART]
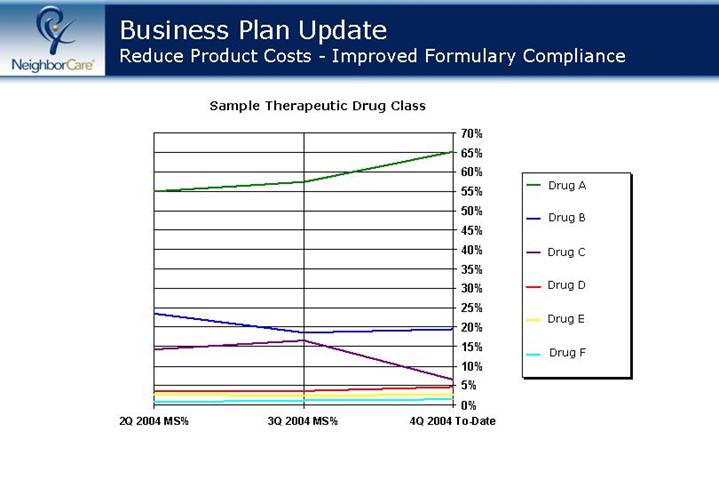
Reduce Product Costs - Improved Formulary Compliance
Sample Therapeutic Drug Class
[CHART]
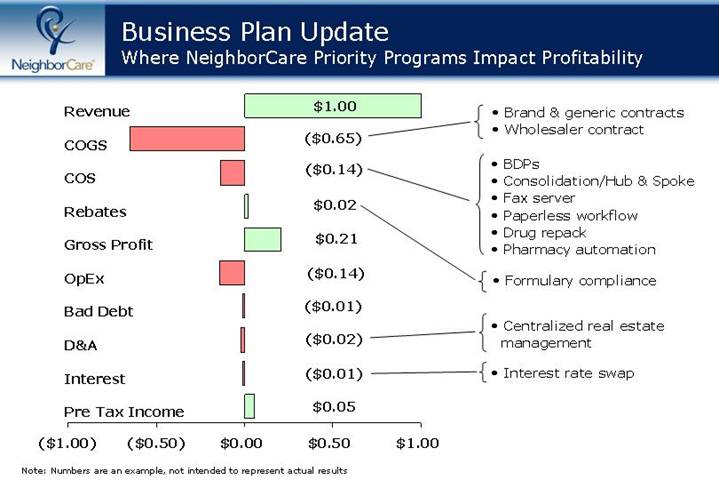
Where NeighborCare Priority Programs Impact Profitability
[CHART]
Revenue | | $ | 1.00 | | | | |
| | | | | | |
COGS | | $ | (0.65 | ) | | | • Brand & generic contracts |
| | | | | | • Wholesaler contract |
| | | | | | |
COS | | $ | (0.14 | ) | | | • BDPs |
| | | | | | • Consolidation/Hub & Spoke |
| | | | | | • Fax server |
| | | | | | • Paperless workflow |
| | | | | | • Drug repack |
| | | | | | • Pharmacy automation |
| | | | | | |
Rebates | | $ | 0.02 | | | | • Formulary compliance |
| | | | | | |
Gross Profit | | $ | 0.21 | | | | |
| | | | | | |
OpEx | | $ | (0.14 | ) | | | |
| | | | | | |
Bad Debt | | $ | (0.01 | ) | | | |
| | | | | | |
D&A | | $ | (0.02 | ) | | | • Centralized real estate management |
| | | | | | |
Interest | | $ | (0.01 | ) | | | • Interest rate swap |
| | | | | | |
Pre Tax Income | | $ | 0.05 | | | | |
Note: Numbers are an example, not intended to represent actual results
Grow Sales Organically and Increase Customer Retention
• Net organic bed growth in FY2004 of 6,521
• First year of positive net organic bed growth in four years
• Reached retention rate goal for the full year
• About 60% of new beds signed for 3 years or greater
Net Organic Bed Growth/Retention Rate
Retention Rate | | 86.0% | | 86.7% | | 87.3% | | 88.3% | | 89.9% | |
[CHART]
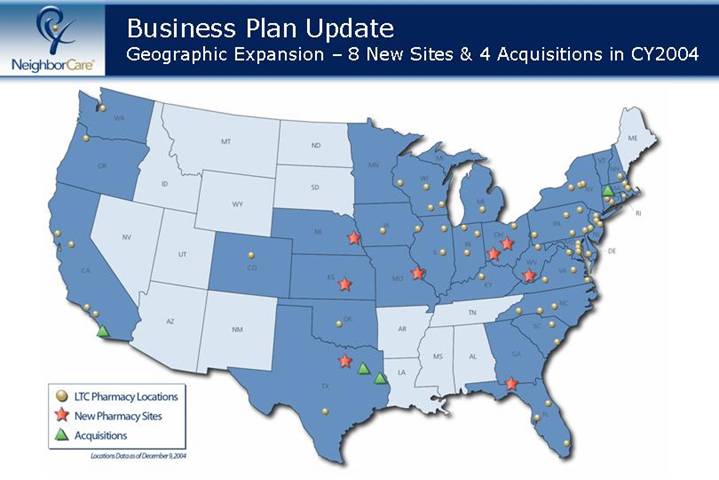
Geographic Expansion – 8 New Sites & 4 Acquisitions in CY2004
[GRAPHIC]
Locations Data as of December 9, 2004
Medicare Modernization Act
Some Implications for Long Term Care
• Comments submitted by NeighborCare and LTCPA to CMS Oct. 2004
• Final MMA rules to be published early in 2005
• CMS has contracted the long term care study which is due Jun. 2005
• CMS recognizes
• Complex needs of LTC residents (dual eligibles)
• Unique services (including costs) provided by LTC providers
• Critical access needs of LTC resident
• One facility – one pharmacy importance
• Potential opportunity for LTC pharmacies to manage medication therapy management program (MTMP) components of MMA
• NeighborCare’s data will be valuable to PDP’s and Health Plans
Financial Highlights
Any reference to non-GAAP financial information provided
herein is reconciled to comparable GAAP financial
information on our web site at
www.neighborcare.com/investor.
[LOGO] | Financial Highlights |
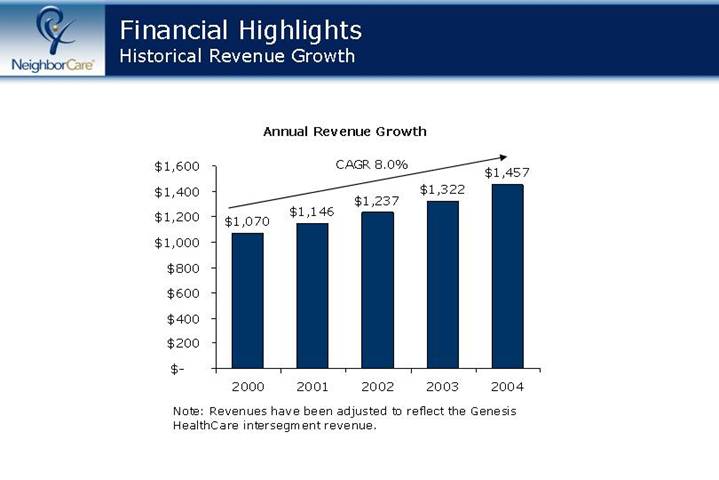
| Historical Revenue Growth |
Annual Revenue Growth
[CHART]
Note: Revenues have been adjusted to reflect the Genesis HealthCare intersegment revenue.
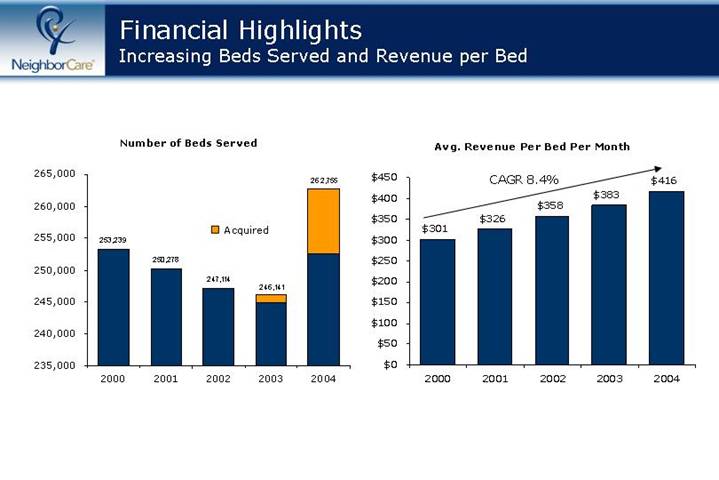
Increasing Beds Served and Revenue per Bed
Number of Beds Served
[CHART]
Avg. Revenue Per Bed Per Month
[CHART]
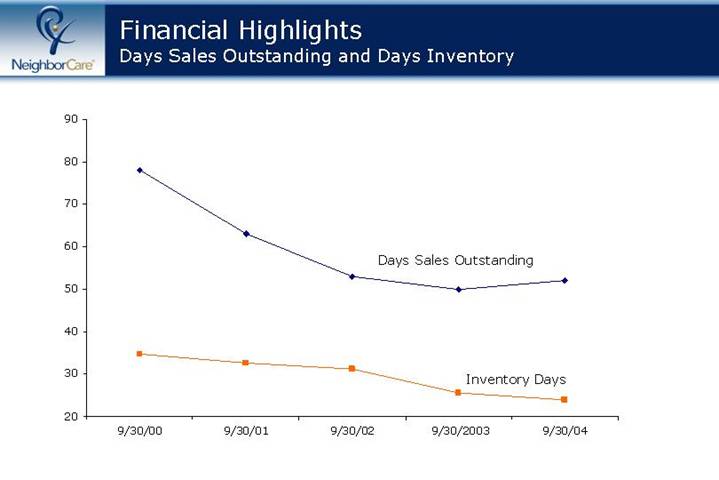
Days Sales Outstanding and Days Inventory
[CHART]
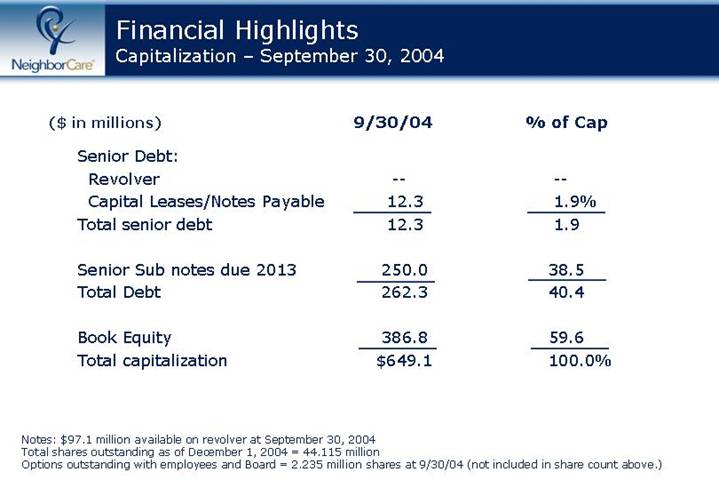
Capitalization – September 30, 2004
($ in millions) | | 9/30/04 | | % of Cap | |
| | | | | |
Senior Debt: | | | | | |
Revolver | | — | | — | |
Capital Leases/Notes Payable | | 12.3 | | 1.9 | % |
Total senior debt | | 12.3 | | 1.9 | |
| | | | | |
Senior Sub notes due 2013 | | 250.0 | | 38.5 | |
Total Debt | | 262.3 | | 40.4 | |
| | | | | |
Book Equity | | 386.8 | | 59.6 | |
Total capitalization | | $ | 649.1 | | 100.0 | % |
| | | | | | |
Notes: $97.1 million available on revolver at September 30, 2004
Total shares outstanding as of December 1, 2004 = 44.115 million
Options outstanding with employees and Board = 2.235 million shares at 9/30/04 (not included in share count above.)
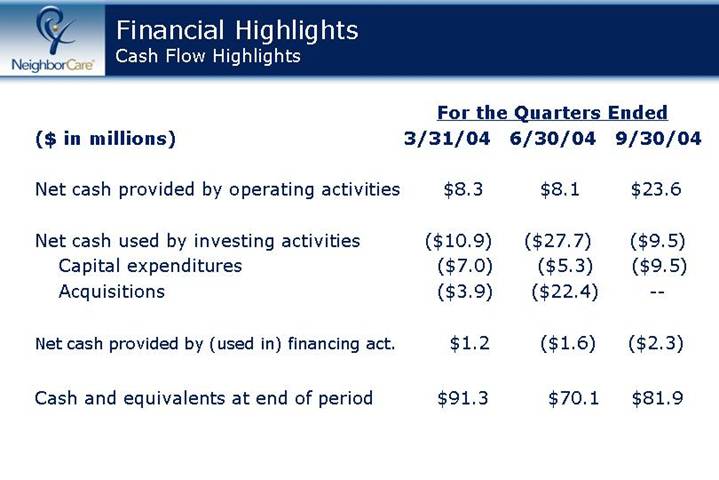
Cash Flow Highlights
| | For the Quarters Ended | |
($ in millions) | | 3/31/04 | | 6/30/04 | | 9/30/04 | |
| | | | | | | |
Net cash provided by operating activities | | $ | 8.3 | | $ | 8.1 | | $ | 23.6 | |
| | | | | | | |
Net cash used by investing activities | | $ | (10.9 | ) | $ | (27.7 | ) | $ | (9.5 | ) |
Capital expenditures | | $ | (7.0 | ) | $ | (5.3 | ) | $ | (9.5 | ) |
Acquisitions | | $ | (3.9 | ) | $ | (22.4 | ) | — | |
| | | | | | | |
Net cash provided by (used in) financing act. | | $ | 1.2 | | $ | (1.6 | ) | $ | (2.3 | ) |
| | | | | | | |
Cash and equivalents at end of period | | $ | 91.3 | | $ | 70.1 | | $ | 81.9 | |
Conclusion
• We remain focused on executing our business plan
• Employees and management have not been distracted
• The plan is working
• Company well positioned for MMA implementation in 2006
Redefining
Service
[LOGO]
23rd Annual JPMorgan Healthcare Conference
John J. Arlotta, Chairman, President & CEO
January 12, 2005