Redefining
Service
[LOGO]
2005 UBS Global Healthcare Services Conference
John J. Arlotta, Chairman, President & CEO
February 16, 2005
[LOGO]
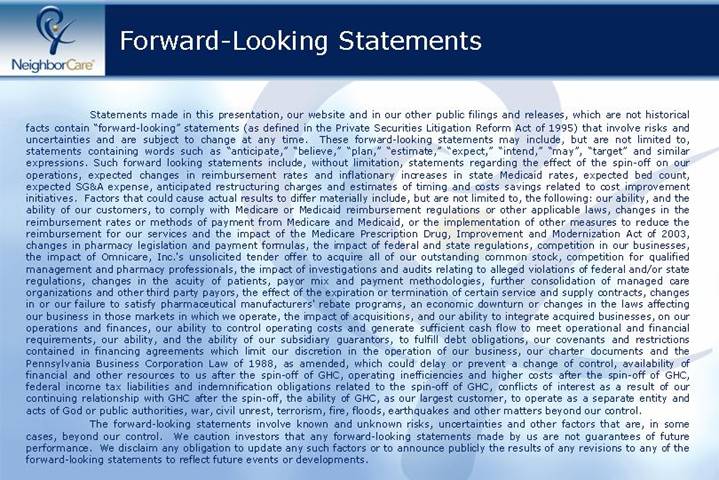
Forward-Looking Statements
Statements made in this presentation, our website and in our other public filings and releases, which are not historical facts contain “forward-looking” statements (as defined in the Private Securities Litigation Reform Act of 1995) that involve risks and uncertainties and are subject to change at any time. These forward-looking statements may include, but are not limited to, statements containing words such as “anticipate,” “believe,” “plan,” “estimate,” “expect,” “intend,” “may”, “target” and similar expressions. Such forward looking statements include, without limitation, statements regarding the effect of the spin-off on our operations, expected changes in reimbursement rates and inflationary increases in state Medicaid rates, expected bed count, expected SG&A expense, anticipated restructuring charges and estimates of timing and costs savings related to cost improvement initiatives. Factors that could cause actual results to differ materially include, but are not limited to, the following: our ability, and the ability of our customers, to comply with Medicare or Medicaid reimbursement regulations or other applicable laws, changes in the reimbursement rates or methods of payment from Medicare and Medicaid, or the implementation of other measures to reduce the reimbursement for our services and the impact of the Medicare Prescription Drug, Improvement and Modernization Act of 2003, changes in pharmacy legislation and payment formulas, the impact of federal and state regulations, competition in our businesses, the impact of Omnicare, Inc.’s unsolicited tender offer to acquire all of our outstanding common stock, competition for qualified management and pharmacy professionals, the impact of investigations and audits relating to alleged violations of federal and/or state regulations, changes in the acuity of patients, payor mix and payment methodologies, further consolidation of managed care organizations and other third party payors, the effect of the expiration or termination of certain service and supply contracts, changes in or our failure to satisfy pharmaceutical manufacturers’ rebate programs, an economic downturn or changes in the laws affecting our business in those markets in which we operate, the impact of acquisitions, and our ability to integrate acquired businesses, on our operations and finances, our ability to control operating costs and generate sufficient cash flow to meet operational and financial requirements, our ability, and the ability of our subsidiary guarantors, to fulfill debt obligations, our covenants and restrictions contained in financing agreements which limit our discretion in the operation of our business, our charter documents and the Pennsylvania Business Corporation Law of 1988, as amended, which could delay or prevent a change of control, availability of financial and other resources to us after the spin-off of GHC, operating inefficiencies and higher costs after the spin-off of GHC, federal income tax liabilities and indemnification obligations related to the spin-off of GHC, conflicts of interest as a result of our continuing relationship with GHC after the spin-off, the ability of GHC, as our largest customer, to operate as a separate entity and acts of God or public authorities, war, civil unrest, terrorism, fire, floods, earthquakes and other matters beyond our control.
The forward-looking statements involve known and unknown risks, uncertainties and other factors that are, in some cases, beyond our control. We caution investors that any forward-looking statements made by us are not guarantees of future performance. We disclaim any obligation to update any such factors or to announce publicly the results of any revisions to any of the forward-looking statements to reflect future events or developments.
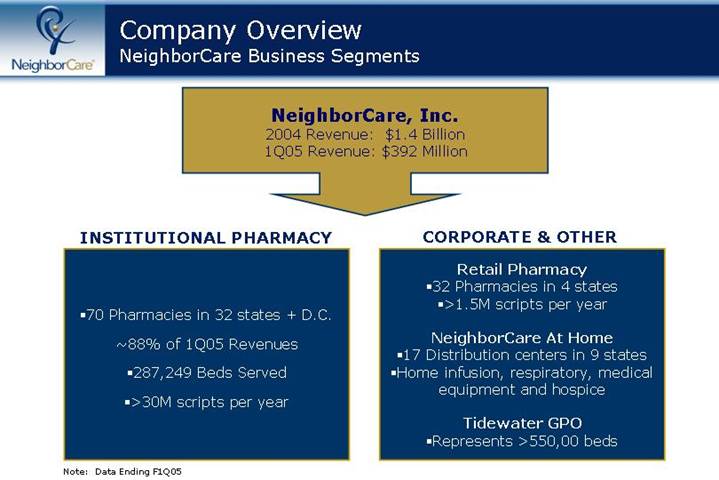
Company Overview
NeighborCare Business Segments
NeighborCare, Inc.
2004 Revenue | | $ | 1.4 | | Billion |
1Q05 Revenue | | $ | 392 | | Million |
INSTITUTIONAL PHARMACY | | CORPORATE & OTHER |
| | | |
| | | Retail Pharmacy |
| | | • 32 Pharmacies in 4 states |
| | | • >1.5M scripts per year |
• 70 Pharmacies in 32 states + D.C. | | |
| | NeighborCare At Home |
~88% of 1Q05 Revenues | | • 17 Distribution centers in 9 states |
| | • Home infusion, respiratory, medical |
• 287,249 Beds Served | | equipment and hospice |
| | |
• >30M scripts per year | | Tidewater GPO |
| | • Represents >550,00 beds |
Note: Data Ending F1Q05
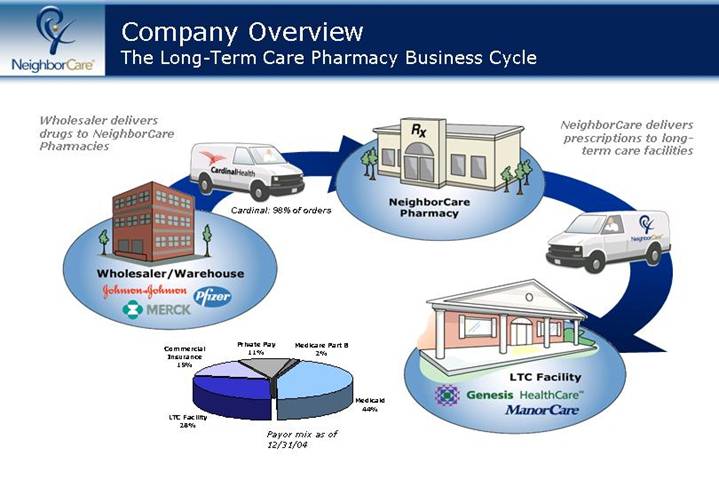
Company Overview
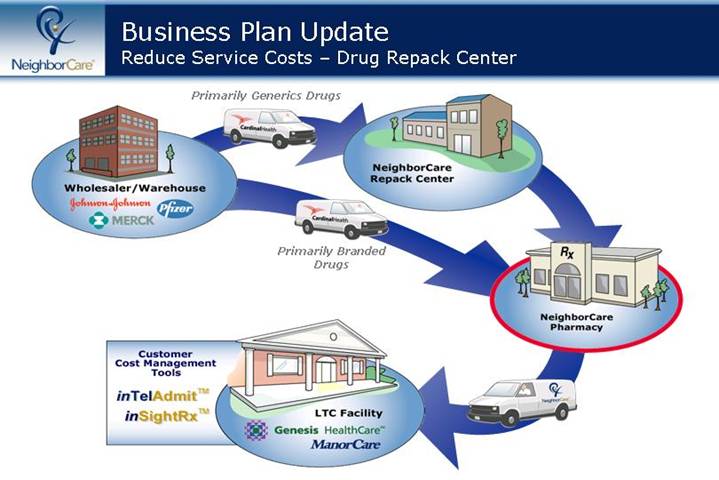
The Long-Term Care Pharmacy Business Cycle
Wholesaler delivers | NeighborCare delivers |
drugs to NeighborCare | prescriptions to long- |
Pharmacies | term care facilities |
[CHART]
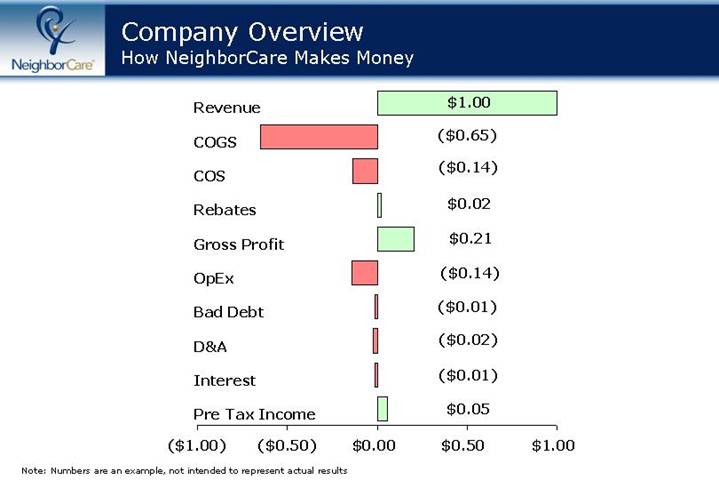
Company Overview
How NeighborCare Makes Money
[CHART]
Note: Numbers are an example, not intended to represent actual results
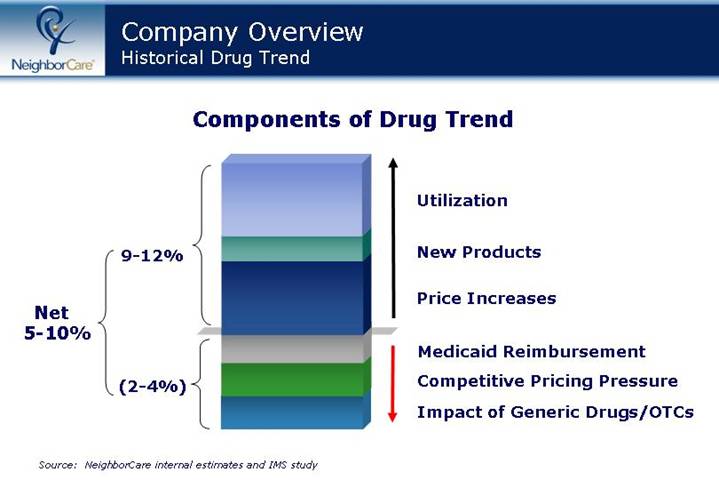
Company Overview
Historical Drug Trend
Components of Drug Trend
[CHART]
Source: NeighborCare internal estimates and IMS study
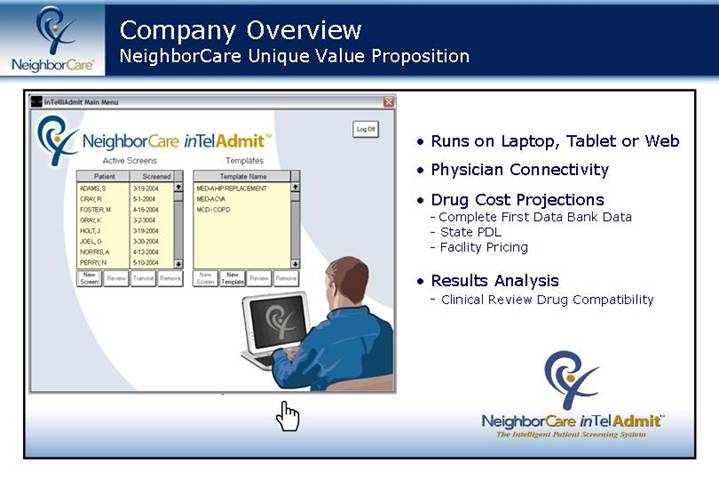
Company Overview
NeighborCare Unique Value Proposition
| | • Runs on Laptop, Tablet or Web |
| | • Physician Connectivity |
| | • Drug Cost Projections |
| | • Complete First Data Bank Data |
[GRAPHIC] | | • State PDL |
| | • Facility Pricing |
| | | |
| | • Results Analysis |
| | • Clinical Review Drug Compatibility |
| | | |
| | | [LOGO] | |
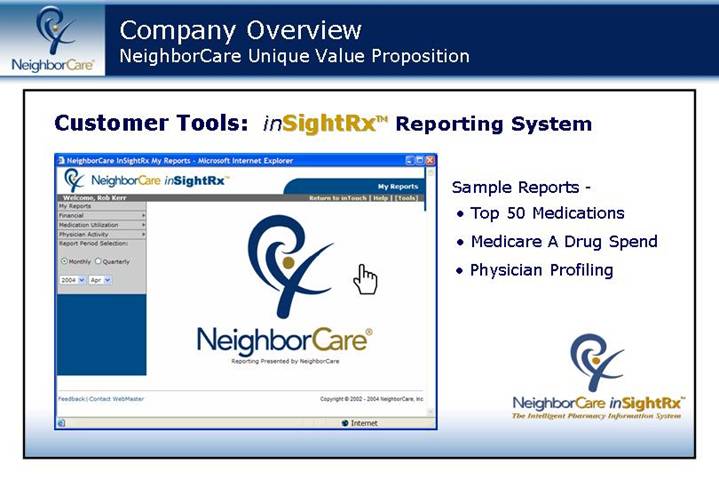
Customer Tools: inSightRxTM Reporting System
| | Sample Reports - |
| | |
| | • Top 50 Medications |
[GRAPHIC] | | |
| | • Medicare A Drug Spend |
| | |
| | • Physician Profiling |
| | |
| | [LOGO] |
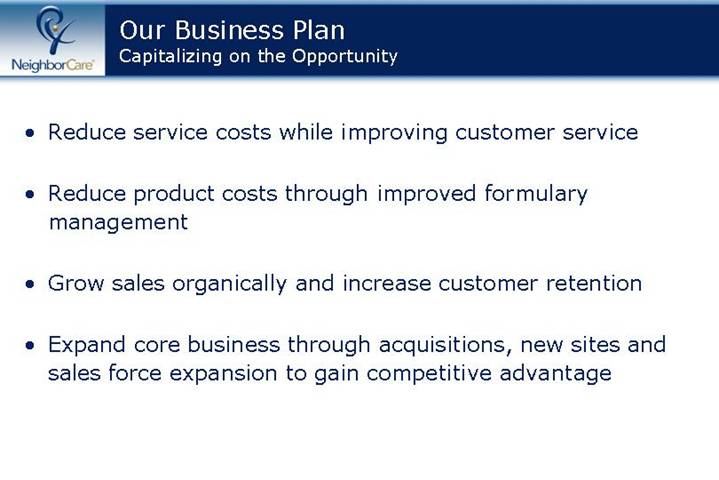
Our Business Plan
Capitalizing on the Opportunity
• Reduce service costs while improving customer service
• Reduce product costs through improved formulary management
• Grow sales organically and increase customer retention
• Expand core business through acquisitions, new sites and sales force expansion to gain competitive advantage
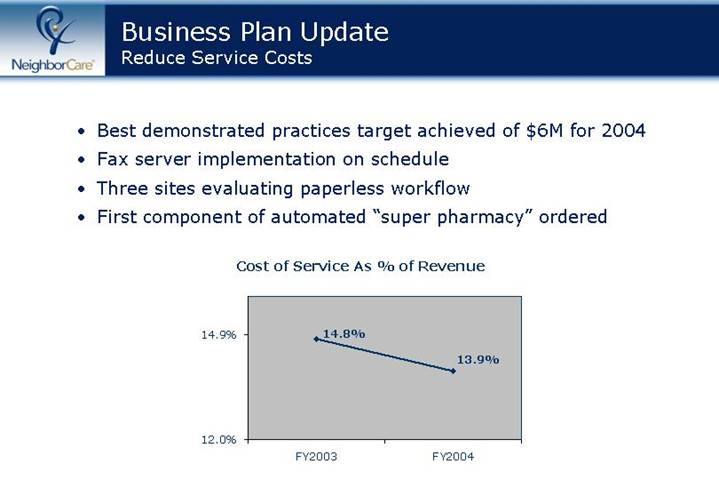
Business Plan Update
Reduce Service Costs
• Best demonstrated practices target achieved of $6M for 2004
• Fax server implementation on schedule
• Three sites evaluating paperless workflow
• First component of automated “super pharmacy” ordered
Cost of Service As % of Revenue
[CHART]
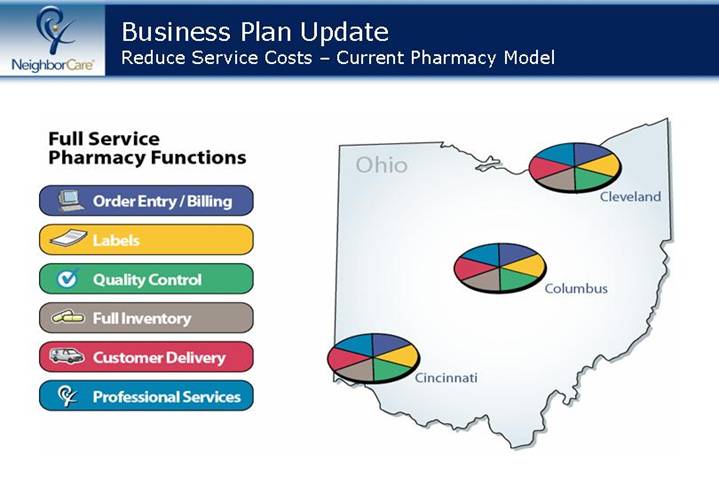
Business Plan Update
Reduce Service Costs – Current Pharmacy Model
Full Service | | [GRAPHIC] |
Pharmacy Functions |
|
[GRAPHIC] | Order Entry/Billing |
| |
[GRAPHIC] | Labels |
| |
[GRAPHIC] | Quality Control |
| |
[GRAPHIC] | Full Inventory |
| |
[GRAPHIC] | Customer Delivery |
| |
[GRAPHIC] | Professional Services |
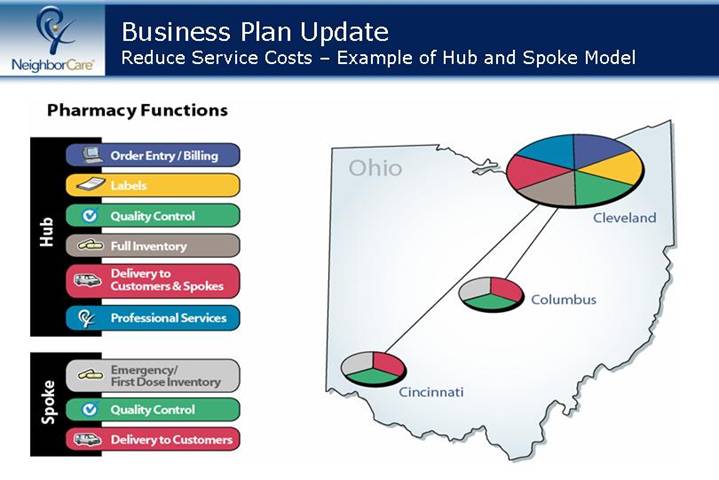
Business Plan Update
Reduce Service Costs – Example of Hub and Spoke Model
Pharmacy Functions | [GRAPHIC] |
|
Hub |
|
[GRAPHIC] | Order Entry/Billing |
| |
[GRAPHIC] | Labels |
| |
[GRAPHIC] | Quality Control |
| |
[GRAPHIC] | Full Inventory |
| |
[GRAPHIC] | Delivery to Customers & Spokes |
| |
[GRAPHIC] | Professional Services |
|
Spoke |
|
[GRAPHIC] | Emergency/First Dose inventory |
| |
[GRAPHIC] | Quality Control |
| |
[GRAPHIC] | Delivery to Customers |
Business Plan Update
Reduce Service Costs – Drug Repack Center
[GRAPHIC]
Business Plan Update
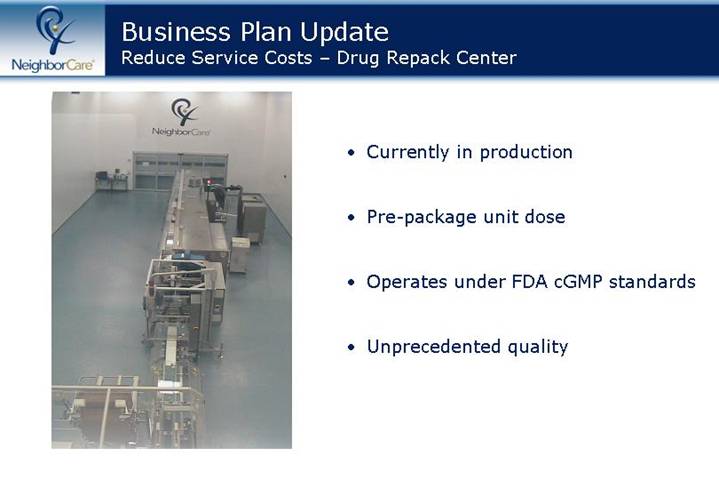
Reduce Service Costs – Drug Repack Center
[GRAPHIC] | • Currently in production • Pre-package unit dose • Operates under FDA cGMP standards • Unprecedented quality |
Business Plan Update
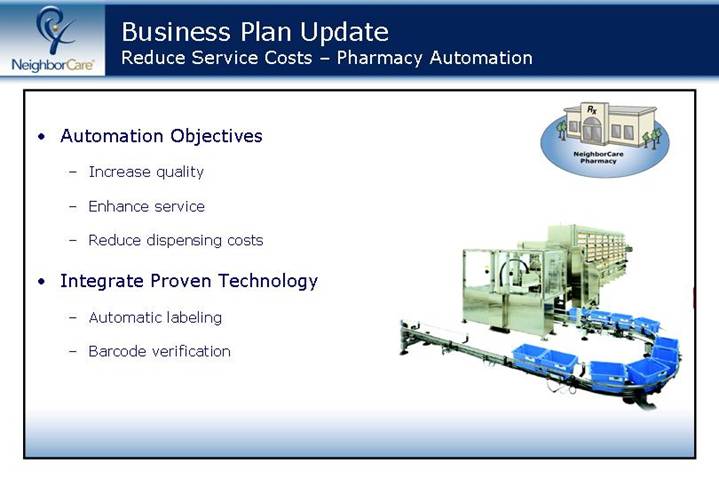
Reduce Service Costs – Pharmacy Automation
• Automation Objectives
• Increase quality
• Enhance service
• Reduce dispensing costs
• Integrate Proven Technology
• Automatic labeling
• Barcode verification
[GRAPHIC]
Business Plan Update
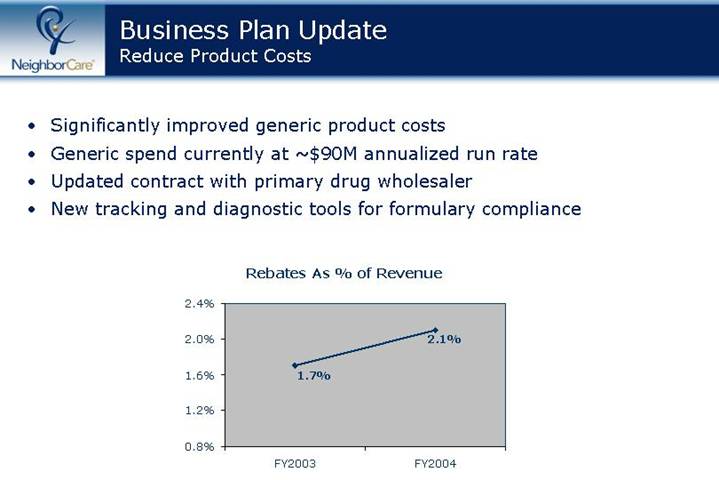
Reduce Product Costs
• Significantly improved generic product costs
• Generic spend currently at ~$90M annualized run rate
• Updated contract with primary drug wholesaler
• New tracking and diagnostic tools for formulary compliance
Rebates As % of Revenue
[CHART]
Business Plan Update
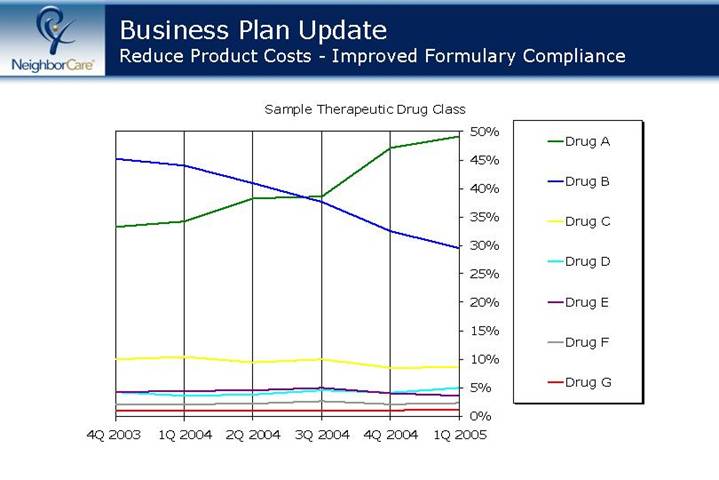
Reduce Product Costs - Improved Formulary Compliance
Sample Therapeutic Drug Class
[CHART]
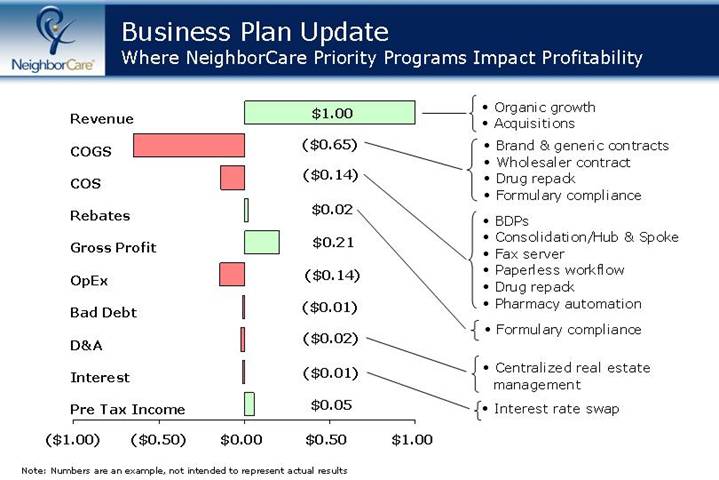
Business Plan Update
Where NeighborCare Priority Programs Impact Profitability
[CHART]
• �� Organic growth
• Acquisitions
• Brand & generic contracts
• Wholesaler contract
• Drug repack
• Formulary compliance
• BDPs
• Consolidation/Hub & Spoke
• Fax server
• Paperless workflow
• Drug repack
• Pharmacy automation
• Formulary compliance
• Centralized real estate management
• Interest rate swap
Note: Numbers are an example, not intended to represent actual results
Business Plan Update
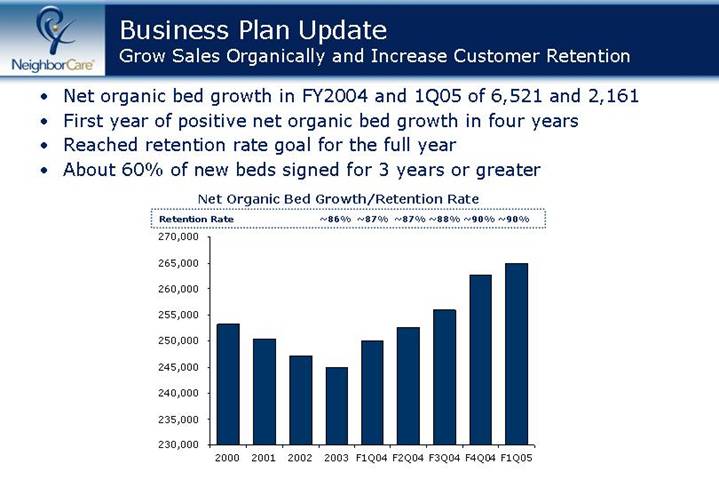
Grow Sales Organically and Increase Customer Retention
• Net organic bed growth in FY2004 and 1Q05 of 6,521 and 2,161
• First year of positive net organic bed growth in four years
• Reached retention rate goal for the full year
• About 60% of new beds signed for 3 years or greater
Net Organic Bed Growth/Retention Rate
Retention Rate | | ~86 | % | ~87 | % | ~87 | % | ~88 | % | ~90 | % | ~90 | % |
[CHART]
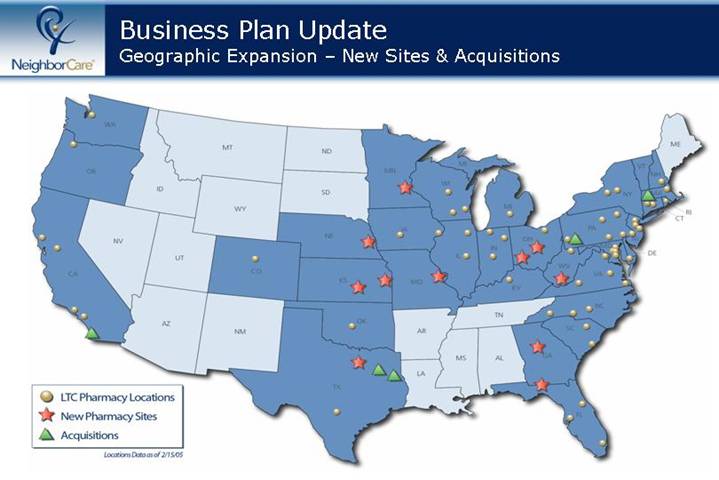
Business Plan Update
Geographic Expansion – New Sites & Acquisitions
[GRAPHIC]
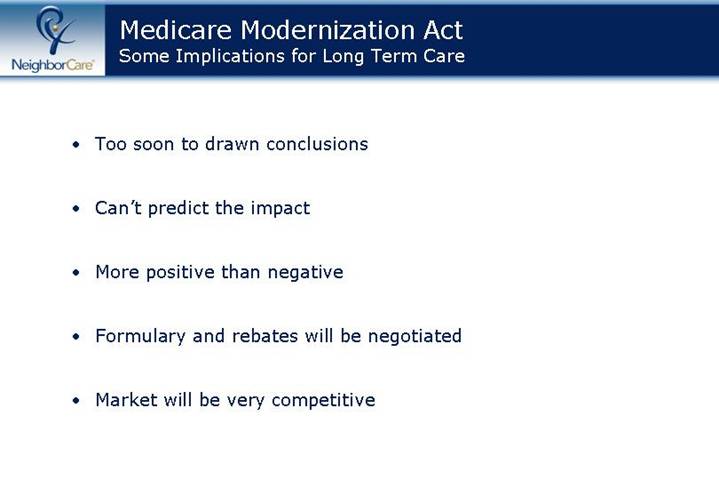
Medicare Modernization Act
Some Implications for Long Term Care
• Too soon to drawn conclusions
• Can’t predict the impact
• More positive than negative
• Formulary and rebates will be negotiated
• Market will be very competitive
Financial Highlights
Any reference to non-GAAP financial information provided
herein is reconciled to comparable GAAP financial
information on our web site at
www.neighborcare.com/investor.
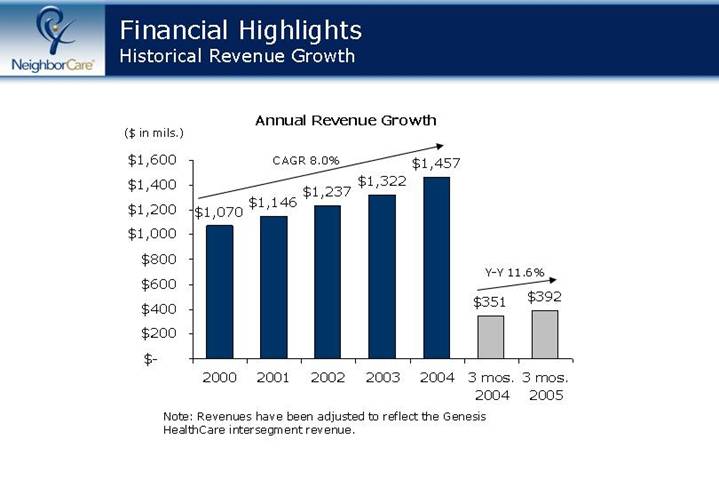
Financial Highlights
Historical Revenue Growth
Annual Revenue Growth
[CHART]
Note: Revenues have been adjusted to reflect the Genesis HealthCare intersegment revenue.
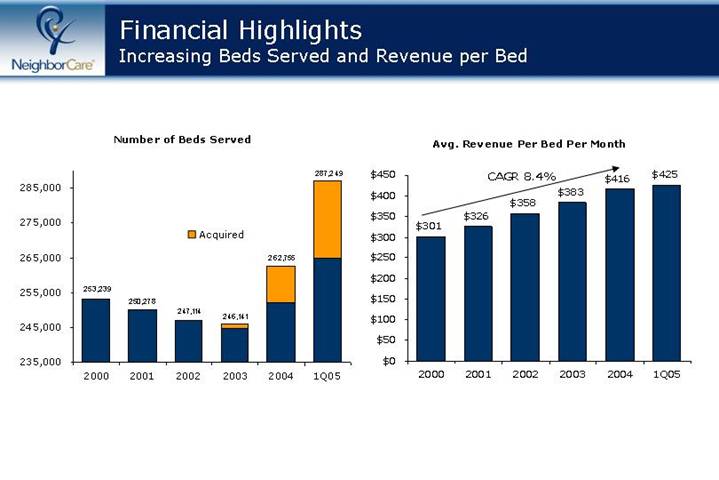
Financial Highlights
Increasing Beds Served and Revenue per Bed
Number of Beds Served
[CHART]
Avg. Revenue Per Bed Per Month
[CHART]
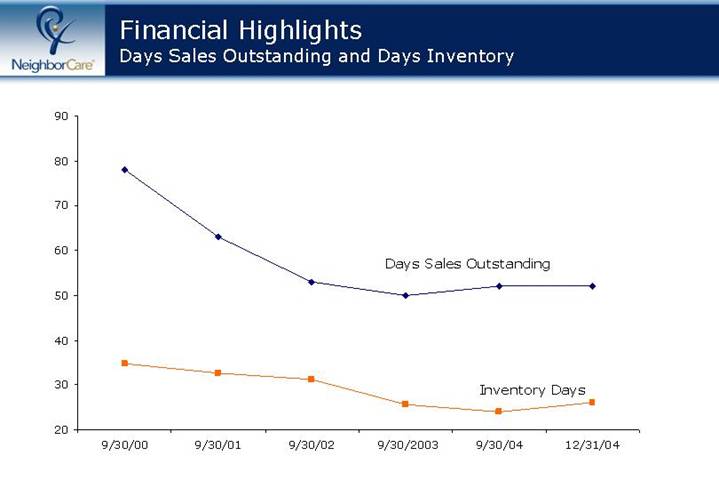
Financial Highlights
Days Sales Outstanding and Days Inventory
[CHART]
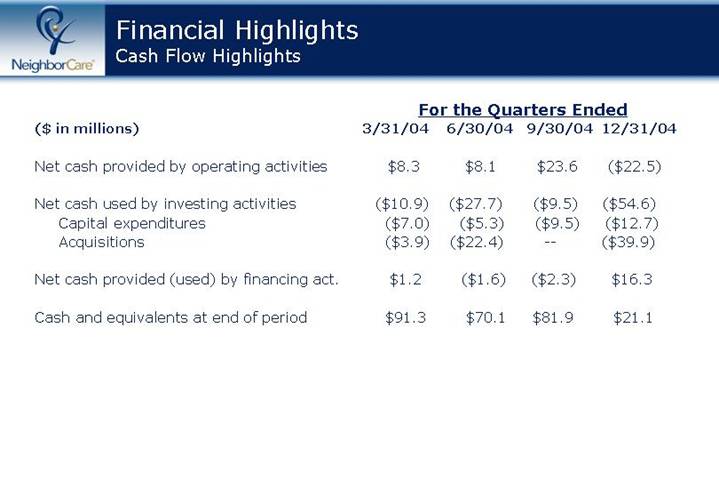
Financial Highlights
Cash Flow Highlights
| | For the Quarters Ended | |
($ in millions) | | 3/31/04 | | 6/30/04 | | 9/30/04 | | 12/31/04 | |
| | | | | | | | | |
Net cash provided by operating activities | | $ | 8.3 | | $ | 8.1 | | $ | 23.6 | | $ | (22.5 | ) |
| | | | | | | | | |
Net cash used by investing activities | | $ | (10.9 | ) | $ | (27.7 | ) | $ | (9.5 | ) | $ | (54.6 | ) |
Capital expenditures | | $ | (7.0 | ) | $ | (5.3 | ) | $ | (9.5 | ) | $ | (12.7 | ) |
Acquisitions | | $ | (3.9 | ) | $ | (22.4 | ) | — | | $ | (39.9 | ) |
| | | | | | | | | |
Net cash provided (used) by financing act. | | $ | 1.2 | | $ | (1.6 | ) | $ | (2.3 | ) | $ | 16.3 | |
| | | | | | | | | |
Cash and equivalents at end of period | | $ | 91.3 | | $ | 70.1 | | $ | 81.9 | | $ | 21.1 | |
Conclusion
• The organization is focused on executing the business plan
• Costs coming down – beds (organic growth & acquisitions) increasing
• Technology initiatives will further improve productivity and efficiency
• Company well positioned for MMA in 2006
• The plan is working
Redefining
Service
[LOGO]
2005 UBS Global Healthcare Services Conference
John J. Arlotta, Chairman, President & CEO
February 16, 2005