4

5
6
Ambac Financial Group, Inc. and Subsidiaries
| | | 2002
| | | 2001
| | | 2000
| |
| | | (Dollars in millions, except per share amounts) | |
STATEMENT OF OPERATIONS HIGHLIGHTS | | | | | | | | | | | | |
Gross premiums written | | $ | 904.0 | | | $ | 683.3 | | | $ | 483.1 | |
Net premiums earned and other credit enhancement fees | | | 500.3 | | | | 400.4 | | | | 323.4 | |
Net investment income | | | 297.3 | | | | 267.8 | | | | 241.0 | |
Interest income from investment and payment agreements | | | 255.0 | | | | 249.9 | | | | 303.2 | |
Financial services—other revenue | | | 30.6 | | | | 37.8 | | | | 42.5 | |
Total revenue | | | 971.8 | | | | 960.4 | | | | 904.3 | |
Losses and loss adjustment expenses | | | 26.7 | | | | 20.0 | | | | 15.0 | |
Financial guarantee underwriting and operating expenses | | | 76.5 | | | | 68.0 | | | | 55.2 | |
Interest expense from investment and payment agreements | | | 231.3 | | | | 235.4 | | | | 283.0 | |
Financial services—other expenses | | | 22.2 | | | | 21.8 | | | | 24.8 | |
Interest expense | | | 43.7 | | | | 40.4 | | | | 37.5 | |
Net income | | | 432.6 | | | | 432.9 | | | | 366.2 | |
Net income per share: | | | | | | | | | | | | |
Basic | | | 4.08 | | | | 4.10 | | | | 3.49 | |
Diluted | | | 3.97 | | | | 3.97 | | | | 3.41 | |
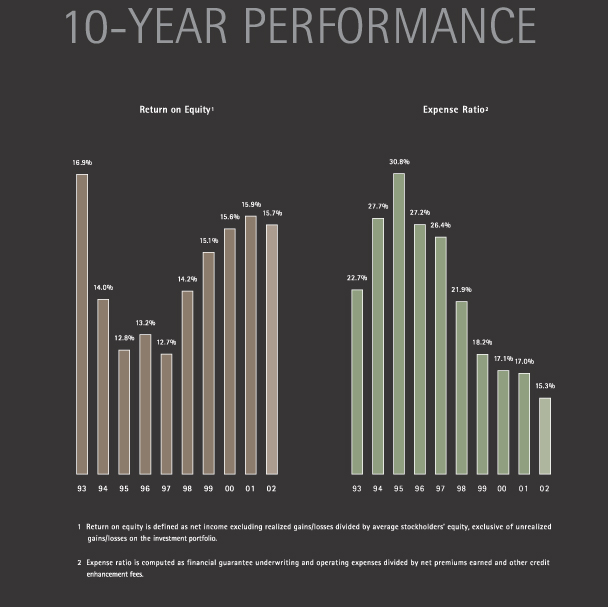
Return on equity1 | | | 13.1 | % | | | 15.5 | % | | | 15.9 | % |
Return on equity2 | | | 15.7 | % | | | 15.9 | % | | | 15.6 | % |
Cash dividends declared per common share | | | 0.380 | | | | 0.340 | | | | 0.307 | |
| | |
|
|
| |
|
|
| |
|
|
|
|
BALANCE SHEET HIGHLIGHTS | | | | | | | | | | | | |
Total investments, at fair value | | $ | 12,539.3 | | | $ | 10,287.9 | | | $ | 8,323.9 | |
Prepaid reinsurance | | | 296.1 | | | | 267.7 | | | | 242.6 | |
Total assets | | | 15,355.5 | | | | 12,339.5 | | | | 10,120.2 | |
Unearned premiums | | | 2,128.8 | | | | 1,780.3 | | | | 1,546.3 | |
Losses and loss adjustment expense reserve | | | 172.1 | | | | 151.1 | | | | 132.4 | |
Obligations under investment agreements, investment repurchase agreements and payment agreements | | | 7,282.9 | | | | 5,511.9 | | | | 4,892.9 | |
Debentures | | | 616.7 | | | | 619.3 | | | | 424.1 | |
Total stockholders’ equity | | | 3,625.2 | | | | 2,983.7 | | | | 2,596.1 | |
| | |
|
|
| |
|
|
| |
|
|
|
| 1 | | Defined as net income divided by average stockholders’ equity. |
| 2 | | Defined as net income excluding realized gains/losses divided by average stockholders’ equity, exclusive of unrealized gains/losses on the investment portfolio. |
7
FINANCIAL HIGHLIGHTS
1999
| | | 1998
| | | 1997
| | | 1996
| | | 1995
| | | 1994
| | | 1993
| |
$ | 445.2 | | | $ | 361.0 | | | $ | 286.2 | | | $ | 247.2 | | | $ | 193.3 | | | $ | 189.9 | | | $ | 318.3 | |
| 268.3 | | | | 213.0 | | | | 154.0 | | | | 136.6 | | | | 111.8 | | | | 117.5 | | | | 152.0 | |
| 209.3 | | | | 186.2 | | | | 159.7 | | | | 144.9 | | | | 131.0 | | | | 117.1 | | | | 104.6 | |
| 323.2 | | | | 281.9 | | | | 200.3 | | | | 165.2 | | | | 137.4 | | | | 106.0 | | | | 51.6 | |
| 28.0 | | | | 31.2 | | | | 21.6 | | | | 11.3 | | | | 3.4 | | | | 2.8 | | | | — | |
| 832.8 | | | | 720.6 | | | | 568.4 | | | | 607.4 | | | | 409.9 | | | | 366.4 | | | | 370.6 | |
| 11.0 | | | | 6.0 | | | | 2.9 | | | | 3.8 | | | | 3.4 | | | | 2.6 | | | | (1.8 | ) |
| 48.8 | | | | 46.7 | | | | 40.7 | | | | 37.2 | | | | 34.5 | | | | 32.8 | | | | 34.5 | |
| 299.5 | | | | 263.6 | | | | 186.7 | | | | 154.5 | | | | 127.7 | | | | 92.4 | | | | 43.0 | |
| 25.8 | | | | 35.5 | | | | 28.0 | | | | 12.0 | | | | 7.8 | | | | 6.1 | | | | 2.0 | |
| 36.5 | | | | 32.8 | | | | 21.3 | | | | 20.9 | | | | 20.9 | | | | 18.8 | | | | 15.8 | |
| 307.9 | | | | 254.0 | | | | 223.0 | | | | 276.3 | | | | 167.6 | | | | 141.1 | | | | 179.3 | |
|
| 2.94 | | | | 2.42 | | | | 2.12 | | | | 2.63 | | | | 1.59 | | | | 1.34 | | | | 1.69 | |
| 2.88 | | | | 2.37 | | | | 2.09 | | | | 2.60 | | | | 1.58 | | | | 1.32 | | | | 1.68 | |
| 15.0 | % | | | 12.8 | % | | | 12.8 | % | | | 18.3 | % | | | 13.8 | % | | | 13.2 | % | | | 18.3 | % |
| 15.1 | % | | | 14.2 | % | | | 12.7 | % | | | 13.2 | % | | | 12.8 | % | | | 14.0 | % | | | 16.9 | % |
| 0.280 | | | | 0.253 | | | | 0.230 | | | | 0.205 | | | | 0.185 | | | | 0.165 | | | | 0.150 | |
|
|
| |
|
|
| |
|
|
| |
|
|
| |
|
|
| |
|
|
| |
|
|
|
|
$ | 8,962.5 | | | $ | 8,748.4 | | | $ | 6,915.1 | | | $ | 5,200.5 | | | $ | 4,441.6 | | | $ | 3,764.2 | | | $ | 3,132.7 | |
| 218.0 | | | | 199.9 | | | | 183.5 | | | | 168.8 | | | | 153.4 | | | | 139.9 | | | | 161.3 | |
| 11,344.6 | | | | 11,212.3 | | | | 8,291.7 | | | | 5,876.4 | | | | 5,309.3 | | | | 4,287.0 | | | | 3,807.2 | |
| 1,431.1 | | | | 1,294.2 | | | | 1,179.0 | | | | 991.2 | | | | 903.0 | | | | 836.6 | | | | 782.8 | |
| 121.0 | | | | 115.8 | | | | 103.3 | | | | 60.6 | | | | 66.0 | | | | 65.7 | | | | 64.0 | |
|
| 6,140.3 | | | | 5,956.8 | | | | 4,321.0 | | | | 2,754.6 | | | | 2,426.9 | | | | 2,025.3 | | | | 1,477.7 | |
| 424.0 | | | | 423.9 | | | | 223.9 | | | | 223.8 | | | | 223.7 | | | | 223.7 | | | | 223.6 | |
| 2,018.5 | | | | 2,096.1 | | | | 1,872.5 | | | | 1,615.0 | | | | 1,404.0 | | | | 1,033.5 | | | | 1,099.7 | |
|
|
| |
|
|
| |
|
|
| |
|
|
| |
|
|
| |
|
|
| |
|
|
|
25
Management’s Discussion and Analysis
of Financial Condition and Results of Operations
GENERAL
Ambac Financial Group, Inc., headquartered in New York City, is a holding company whose subsidiaries provide financial guarantees and financial services to clients in both the public and private sectors around the world.
The following paragraphs describe the consolidated results of operations of Ambac and its subsidiaries for 2002, 2001 and 2000, and its financial condition as of December 31, 2002 and 2001. These results are presented for Ambac’s two reportable segments: Financial Guarantee and Financial Services. Management has identified the accounting for loss and loss adjustment expenses and the valuation of financial instruments as critical accounting policies. These policies are discussed in the applicable sections of this document. This discussion should be read in conjunction with the consolidated financial statements and notes thereon included elsewhere in this report.
Materials in this annual report may contain information that includes or is based upon forward-looking statements within the meaning of the Securities Litigation Reform Act of 1995. Forward-looking statements present Ambac’s expectations or forecasts of future events. You can identify these statements by the fact that they do not relate strictly to historical or current facts and relate to future operating or financial performance.
Any or all of Ambac’s forward-looking statements here or in other publications may turn out to be wrong and are based on current expectations and the current economic environment. Ambac’s actual results may vary materially, and there are no guarantees about the performance of Ambac’s securities. Among factors that could cause actual results to differ materially are: (1) changes in the economic, credit or interest rate environment in the United States and abroad; (2) the level of activity within the national and worldwide debt markets; (3) competitive conditions and pricing levels; (4) legislative and regulatory developments; (5) changes in tax laws; (6) the policies and actions of the United States and other governments and (7) other risks and uncertainties that have not been identified at this time. Ambac is not obligated to publicly correct or update any forward-looking statement if we later become aware that it is not likely to be achieved, except as required by law. You are advised, however, to consult any further disclosures we make on related subjects in Ambac’s reports to the Securities and Exchange Commission.
RESULTS OF OPERATIONS
Consolidated Net Income. Ambac’s net income in 2002 was $432.6 million or $3.97 per diluted share flat, compared to $432.9 million or $3.97 per diluted share in 2001. Ambac’s income before income taxes was $564.2 million in 2002, a 1% decrease from income before income taxes of $568.7 million in 2001. Of the $564.2 million of income before income taxes in 2002, $712.9 million was from Financial Guarantee, $(102.8) million from Financial Services and $(45.9) million from Corporate. Corporate consists primarily of Ambac’s interest expense. That compares to income (loss) before income taxes in 2001 of $583.9 million, $27.4 million and $(42.6) million from Financial Guarantee, Financial Services and Corporate, respectively. Financial guarantee income before income taxes increased as a result of (i) higher net premiums earned and other credit enhancement fees, (ii) higher net investment income and (iii) higher net realized investment gains, offset by (i) higher unrealized losses on credit derivative contracts, (ii) higher operating expenses and (iii) a higher provision for losses and loss adjustment expenses. The Financial Services decline is primarily attributable to net realized investment losses of $134.1 million.
Ambac’s net income in 2001 increased 18% from $366.2 million, and 16% from $3.41 per diluted share, in 2000. This increase was attributable to growth in Financial Guarantee operating income partially offset by a decline in Financial Services net income. Ambac’s 2001 income before income taxes increased 18% from $482.1 million in 2000. Income (loss) before income taxes in 2000 consisted of $495.2 million from Financial Guarantee, $28.7 million from Financial Services and $(41.8) million from Corporate.
FINANCIAL GUARANTEE
Ambac provides financial guarantees for debt obligations through its principal operating subsidiary Ambac Assurance Corporation, as well as credit protection in the form of structured credit derivatives through Ambac Credit Products LLC, a wholly-owned subsidiary of Ambac Assurance. Ambac provides these services in three principal markets: public finance, structured finance and international finance.
Public finance obligations are bonds issued by states, municipalities and other governmental or not-for-profit entities located in the United States (“Public Finance”). Bond proceeds are used to finance or refinance a broad spectrum of
26
Management’s Discussion and Analysis
of Financial Condition and Results of Operations
public purpose initiatives, including education, utility, transportation, health care and other general purpose projects. Although Ambac generally guarantees the full range of Public Finance obligations, Ambac concentrates on those deals that require more structuring skills. Certain projects, which had been financed by the local or U.S. government alone are now being financed through public-private partnerships. In these transactions, debt service on the bonds, rather than being paid solely by tax revenues or other governmental funds, are being paid from a variety of revenue sources, including revenues derived from the project itself. Examples of these deals include stadium financings, student housing and military housing.
Structured finance obligations include the securitization of a variety of asset types such as mortgages, home equity loans, leases and pooled debt obligations originated in the United States (“Structured Finance”). Currently, the largest component of Ambac’s Structured Finance business relates to the securitization of mortgages and home equity loans. Another target area in Structured Finance is the credit enhancement of pooled debt obligations including structured credit derivatives. These transactions involve the securitization of a portfolio of corporate bonds and loan obligations and asset-backed securities (the “Securitized Assets”). Ambac’s exposure to these Securitized Assets is mitigated through first loss protection. Typically, first loss protection is in the form of over-collateralization (i.e., the principal amount of the Securitized Assets exceeds the principal amount of the structured finance obligations guaranteed by Ambac Assurance), which allows the transaction to experience defaults among the Securitized Assets before a default is experienced on the structured finance obligations.
International finance obligations include public purpose infrastructure projects and asset-backed securities originated outside of the United States (“International Finance”). Ambac’s emphasis internationally has been on Western Europe, Japan and Australia. In the United Kingdom, Ambac has participated extensively in the Private Finance Initiative whereby the government has been privatizing certain activities. In Japan, Ambac has an alliance with Sampo Japan Financial Guarantee Insurance Co. Ltd. Ambac also participates in developing markets through certain structures such as pooled debt obligations or future flow transactions. Future flow transactions essentially securitize future revenue streams derived from operating receivables or the sale of commodities.
Gross Par Value Written. Ambac Assurance guaranteed $116.4 billion of par value bonds during 2002, an increase of 29% from $90.1 billion in 2001. Par value written during 2001 increased 17% compared to $77.0 billion written during 2000. Par value written during 2002 comprised $43.7 billion from the guarantee of Public Finance obligations, $47.5 billion from Structured Finance obligations and $25.2 billion from International Finance obligations, versus $33.2 billion, $37.4 billion and $19.5 billion, respectively, in 2001 and $19.6 billion, $33.9 billion and $23.5 billion, respectively, in 2000.The 2002 increase in guaranteed Public Finance obligations was affected by a 25% increase in total Public Finance issuance, an increase in insured market penetration from 47% in 2001 to 49% in 2002, partially offset by a decrease in Ambac’s Public Finance market share during the period from 25% in 2001 to 21% in 2002. The increase in total issuance was largely the result of the lower interest rate environment causing an increase in both the refinancing and new money components of the market during 2002. The increase in guaranteed Structured Finance obligations during 2002 resulted from higher mortgage-backed guarantees and greater penetration into other consumer asset-backed markets (auto rental and credit card securitizations). International Finance obligations guaranteed during 2002 increased primarily due to higher structured credit derivatives written.
The following table provides a breakdown of guaranteed net par outstanding by market sector:
| | | 2002
| | 2001
|
| | | (Dollars in billions) |
Public Finance | | $ | 206.5 | | $ | 185.0 |
Structured Finance | | | 105.0 | | | 88.7 |
International Finance | | | 67.7 | | | 44.3 |
| | |
|
| |
|
|
Total net par outstanding | | $ | 379.2 | | $ | 318.0 |
| | |
|
| |
|
|
27
Gross Premiums Written. Ambac receives insurance premiums either upfront at policy issuance or on an installment basis over the life of the transaction. The collection method is determined at the time of policy issuance. Gross premiums written in 2002 were $904.0 million, an increase of 32% from $683.3 million in 2001. Up-front premiums written in 2002 were $552.6 million, an increase of 25% from $440.8 million. This increase is a result of increased business activity in Public and Structured Finance, partially offset by lower up-front International Finance gross premiums written. Installment premiums written in 2002 were $351.4 million, an increase of 45% from $242.5 million in 2001. The growth in installment premiums is due to the growing book of business in all segments with written premiums of $99.5 million from transactions guaranteed in 2002. Gross premiums written in 2001 increased 41% from $483.1 million in 2000. This is a result of increased business activity in all markets, particularly Public Finance. The following table sets forth the amounts of gross premiums written and related gross par written by type:
| | | 2002
| | 2001
| | 2000
|
| | | Gross Premiums Written
| | Gross Par Written
| | Gross Premiums Written
| | Gross Par Written
| | Gross Premiums Written
| | Gross Par Written
|
| | | (Dollars in millions) |
Public Finance: | | | | | | | | | | | | | | | | | | |
Up-front | | $ | 462.1 | | $ | 39,283 | | $ | 323.7 | | $ | 30,414 | | $ | 160.5 | | $ | 17,536 |
Installment | | | 42.2 | | | 4,448 | | | 25.4 | | | 2,797 | | | 20.1 | | | 2,101 |
| | |
|
| |
|
| |
|
| |
|
| |
|
| |
|
|
Total Public Finance | | | 504.3 | | | 43,731 | | | 349.1 | | | 33,211 | | | 180.6 | | | 19,637 |
| | |
|
| |
|
| |
|
| |
|
| |
|
| |
|
|
Structured Finance: | | | | | | | | | | | | | | | | | | |
Up-front | | | 57.9 | | | 3,498 | | | 40.6 | | | 3,016 | | | 82.8 | | | 3,641 |
Installment | | | 204.6 | | | 43,947 | | | 152.5 | | | 34,437 | | | 116.7 | | | 30,224 |
| | |
|
| |
|
| |
|
| |
|
| |
|
| |
|
|
Total Structured Finance | | | 262.5 | | | 47,445 | | | 193.1 | | | 37,453 | | | 199.5 | | | 33,865 |
| | |
|
| |
|
| |
|
| |
|
| |
|
| |
|
|
International Finance: | | | | | | | | | | | | | | | | | | |
Up-front | | | 32.6 | | | 1,662 | | | 76.5 | | | 2,965 | | | 52.6 | | | 3,103 |
Installment | | | 104.6 | | | 23,539 | | | 64.6 | | | 16,504 | | | 50.4 | | | 20,379 |
| | |
|
| |
|
| |
|
| |
|
| |
|
| |
|
|
Total International Finance | | | 137.2 | | | 25,201 | | | 141.1 | | | 19,469 | | | 103.0 | | | 23,482 |
| | |
|
| |
|
| |
|
| |
|
| |
|
| |
|
|
Total | | $ | 904.0 | | $ | 116,377 | | $ | 683.3 | | $ | 90,133 | | $ | 483.1 | | $ | 76,984 |
| | |
|
| |
|
| |
|
| |
|
| |
|
| |
|
|
Total up-front | | $ | 552.6 | | $ | 44,443 | | $ | 440.8 | | $ | 36,395 | | $ | 295.9 | | $ | 24,280 |
Total installment | | | 351.4 | | | 71,934 | | | 242.5 | | | 53,738 | | | 187.2 | | | 52,704 |
| | |
|
| |
|
| |
|
| |
|
| |
|
| |
|
|
Total | | $ | 904.0 | | $ | 116,377 | | $ | 683.3 | | $ | 90,133 | | $ | 483.1 | | $ | 76,984 |
| | |
|
| |
|
| |
|
| |
|
| |
|
| |
|
|
Adjusted Gross Premiums. Adjusted gross premiums written, which is not promulgated under accounting principles generally accepted in the United States of America (“GAAP”), is used by management, equity analysts and investors to measure the financial results of Ambac. Adjusted gross premiums written, which Ambac reports as analytical data, is defined as gross (direct and assumed) up-front premiums written plus the present value of estimated future installment premiums written on insurance policies and structured credit derivatives issued in the period. The definition of adjusted gross premiums written used by Ambac may differ from definitions of adjusted gross premiums written used by other public holding companies of financial guarantee insurers. Adjusted gross premiums written were $1,299.5 million in 2002, up 33% from $974.3 million in 2001. The increase was due to increased activity in all markets. Public Finance adjusted gross premiums were $552.8 million in 2002, up 51% from $366.9 million in 2001. This increase resulted from higher issuance, and higher insured penetration, partially offset by a decrease in market share, as discussed above under “Gross Par Value Written.” Structured Finance adjusted gross premiums were $441.2 million in 2002, up 39% from $318.5 million in 2001. This increase resulted from strong business activity in pooled debt, investor-owned utility and consumer asset-backed transactions, particularly mortgage, auto and credit card asset types. International Finance adjusted gross premiums were $305.5 million in 2002, up 6% from $288.9 million in 2001.
International Finance business continues to be dominated by large transactions with the top ten deals comprising $149.1 million and $153.3 million in 2002 and 2001, respectively. These deals represent 49% and 53% of total International Finance adjusted gross premiums written for 2002 and 2001, respectively. The activity in 2002 was represented by a broad spectrum of bond types, specifically utilities, commercial asset-backed securitizations, private finance initiatives in the United Kingdom and future flow transactions. Adjusted gross premiums written in 2001 increased 37% from $710.7 million in 2000. The increase in 2001 was due to increased activity in all markets. The aggregate net present value, calculated at a 7% discount rate, of estimated future installment premiums was $1,342.2 million at December 31, 2002, up 36% from $986.8 million at December 31, 2001.
Ceded Premiums Written. Ceded premiums written in 2002 were $113.5 million, up 19% from $95.5 million in 2001. Ceded premiums written as a percentage of gross premiums written were 13% and 14% for 2002 and 2001, respectively. This decline was primarily due to lower ceded premiums of Public Finance transactions. Ceded premiums written in 2001 were up 18% from $80.8 million in 2000. The increase in ceded premiums written in 2001 was largely due to higher cessions of Public Finance premiums pursuant to a reinsurance surplus share treaty that Ambac Assurance implemented during 2001,
28
Management’s Discussion and Analysis
of Financial Condition and Results of Operations
partially offset by lower cessions on International Finance transactions. Ceded premiums written were 17% of gross premiums written in 2000.
The reinsurance of risk does not relieve Ambac of its original liability to its policyholders. In the event that any of Ambac’s reinsurers are unable to meet their obligations under reinsurance contracts, Ambac would be liable for such defaulted amounts. To minimize exposure to significant losses from reinsurers, Ambac (i) evaluates the financial condition of its reinsurers; (ii) has collateral provisions in certain reinsurance contracts and (iii) has certain termination triggers that can be exercised by Ambac in the event of a rating downgrade of a reinsurer. Ambac held letters of credit and collateral amounting to approximately $135.7 million from its reinsurers as of December 31, 2002. The following table provides ceded par outstanding by financial strength rating of Ambac’s reinsurers, on a Standard and Poor’s (“S&P”) basis:
| | | 2002
| | 2001
|
| | | (Dollars in billions) |
AAA | | $ | 23.8 | | $ | 38.3 |
AA | | | 20.4 | | | 0.9 |
| | |
|
| |
|
|
Total | | $ | 44.2 | | $ | 39.2 |
| | |
|
| |
|
|
During 2002, S&P lowered the financial strength rating of a number of Ambac’s reinsurers from AAA to AA. Additionally, on January 13, 2003 S&P lowered the financial strength rating of AXA Re Finance S.A. from AAA to BBB. This downgrade was attributable to AXA Re Finance S.A.’s decision to cease writing new financial guarantee business. At December 31, 2002, par ceded to AXA Re Finance S.A. was $8.3 billion. The downgrade of AXA Re Finance S.A. has triggered Ambac’s ability to terminate all Ambac/AXA Re’s reinsurance agreements. Ambac is currently exploring all options on this book of business.
Net Premiums Earned and Other Credit Enhancement Fees. Net premiums earned and other credit enhancement fees during 2002 were $500.3 million, an increase of 25% from $400.4 million in 2001. This increase was primarily the result of the larger Financial Guarantee book of business, higher refundings, calls, and other accelerations of previously insured obligations (collectively referred to as “refundings”) during the year and higher other credit enhancement fees earned from the structured credit derivatives business.
When an issue insured by Ambac Assurance has been refunded or called, any remaining unearned premium (net of refunding credits, if any) is earned at that time. Earnings on refundings typically relate to transactions where the premium is paid up-front for the life of the policy. Refunding levels vary depending upon a number of conditions, primarily the relationship between current interest rates and interest rates on outstanding debt. Net premiums earned during 2002 included $52.0 million (net income per diluted share effect of $0.27) from refundings of previously insured issues. Net premiums earned in 2001 included $38.6 million (net income per diluted share effect of $0.20) from refundings. The current low interest rate environment has prompted the relatively high level of accelerated earnings. When interest rates rise in the future, accelerated earnings should decline.
Excluding the effect of accelerated earnings related to refundings, normal net premiums earned (which is defined as net premiums earned less refundings) in 2002 were $419.5 million, an increase of 23% from $340.1 million in 2001. Normal net premiums earned for the year ended December 31, 2002 increased 14%, 19% and 56% for Public, Structured and International Finance, respectively, from the year ended December 31, 2001. Public Finance earned premium growth resulted from increased activity in that market over the year, enhanced by the continued focus on structured and innovative municipal transactions. Normal earned premium growth for Structured Finance continues to be driven by strong writings in consumer asset-backed transactions partially offset by the continued high level of pay-downs of the existing mortgage-backed book. International Finance net earned premium growth resulted from strong activity in pooled debt obligations, future flow and asset-backed transactions.
Other credit enhancement fees in 2002, which is primarily comprised of fees received from the structured credit derivatives product, were $28.8 million, an increase of 33% from $21.7 million in 2001. This increase was due to rapid growth in the structured credit derivative business in 2001 and 2002.
Net premiums earned and other credit enhancement fees during 2001 increased 24% from $323.4 million in 2000. This increase was primarily the result of the larger Financial Guarantee book of business, higher refundings and higher other credit enhancement fees earned from the structured credit derivatives business. Net premiums earned in 2000 included $22.2 million (net income per diluted share effect of $0.12) from refundings. Excluding the effect of accelerated earnings related to refundings, normal net premiums earned in 2001 increased 18% from $289.0 million in 2000. Other credit enhancement fees increased 78% from $12.2 million in 2000.
The following table provides a breakdown of net premiums earned by market sector and other credit enhancement fees:
| | | 2002
| | 2001
| | 2000
|
| | | (Dollars in millions) |
Public Finance | | $ | 156.3 | | $ | 137.2 | | $ | 126.4 |
Structured Finance | | | 174.7 | | | 146.3 | | | 119.4 |
International Finance | | | 88.5 | | | 56.6 | | | 43.2 |
| | |
|
| |
|
| |
|
|
Total normal premiums earned | | | 419.5 | | | 340.1 | | | 289.0 |
Refundings | | | 52.0 | | | 38.6 | | | 22.2 |
| | |
|
| |
|
| |
|
|
Total net premiums earned | | | 471.5 | | | 378.7 | | | 311.2 |
Other credit enhancement fees | | | 28.8 | | | 21.7 | | | 12.2 |
| | |
|
| |
|
| |
|
|
Total net premiums earned and other credit enhancement fees | | $ | 500.3 | | $ | 400.4 | | $ | 323.4 |
| | |
|
| |
|
| |
|
|
29
Net Investment Income. Net investment income in 2002 was $297.3 million, an increase of 11% from $267.8 million in 2001. The increase was attributable to: (i) the growth of the investment portfolio resulting from the growth in the Financial Guarantee book of business, partially offset by a lower reinvestment rate due to the current interest rate environment; and (ii) a capital contribution from Ambac Financial Group, Inc. to Ambac Assurance totaling approximately $176 million during the fourth quarter of 2001. The contribution was in the form of taxable investment securities. Investments in tax-exempt securities amounted to 71% of the total fair value of the portfolio as of December 31, 2002, versus 65% and 72% as of December 31, 2001 and December 31, 2000, respectively. The average pre-tax yield-to-maturity on the investment portfolio was 5.18% as of December 31, 2002 compared with 5.74% and 6.20% at December 31, 2001 and 2000, respectively. Net investment income in 2001 increased 11% from $241.0 million in 2000. This increase was primarily attributable to the growth of the investment portfolio resulting from the growth in the Financial Guarantee book of business, partially offset by a lower reinvestment rate due to the interest rate environment, and a capital contribution from Ambac Financial Group, Inc. to Ambac Assurance during the fourth quarter of 2001 as mentioned above.
Net Realized Investment Gains. Net realized investment gains in 2002 were $40.9 million, compared to net realized gains of $2.1 million and $0.7 million in 2001 and 2000, respectively. The following table details amounts included in net realized gains:
| | | 2002
| | 2001
| | | 2000
| |
| | | (Dollars in millions) | |
Net gains on securities sold | | $ | 39.1 | | $ | 5.3 | | | $ | 4.2 | |
Foreign exchange gains (losses) on investments | | | 1.8 | | | (3.2 | ) | | | (3.5 | ) |
| | |
|
| |
|
|
| |
|
|
|
Net realized gains | | $ | 40.9 | | $ | 2.1 | | | $ | 0.7 | |
| | |
|
| |
|
|
| |
|
|
|
Net gains on securities sold are generated as a result of the ongoing management of the investment portfolio. Foreign exchange gains and losses result from investing in short-term foreign currency denominated securities.
Net Unrealized Losses on Credit Derivative Contracts. Net unrealized losses on credit derivative contracts in 2002 were $27.9 million, compared to net unrealized losses of $3.6 million and $4.1 million in 2001 and 2000, respectively. The change in estimated fair value of structured credit derivative contracts reflects net mark-to-market gains and losses due to changes in credit spreads on the underlying obligations. Additionally, realized net losses paid on structured credit derivatives totaled $5.8 million in the year ended December 31, 2002, compared with none in 2001 and 2000.
Other Income. Other income in 2002 was $5.5 million, an increase of 6% from $5.2 million in 2001. Included in other income are deal structuring fees and commitment fees. Other income increased 18% in 2001 from $4.4 million in 2000.
Losses and Loss Adjustment Expenses. Losses and loss adjustment expenses in 2002 were $26.7 million, versus $20.0 million in 2001 and $15.0 million in 2000. Losses and loss adjustment expenses are based upon estimates of the ultimate aggregate losses inherent in the Financial Guarantee portfolio. In most instances, claim payments are forecasted in advance as a result of Ambac’s active surveillance of the insured book of business. Based upon company and industry experience, claim payments become probable and estimable once the issuer’s credit profile has migrated to certain impaired credit levels. The insured party has the right to a claim under Ambac’s financial insurance policy at the first scheduled debt service date of the defaulted obligation. The trustee for the insured obligation notifies Ambac of the payment default so that a claim payment can be made. The trustee reports payment defaults at or prior to the scheduled payment date. Subsequent claims would be paid if payment defaults continue and would be based on the originally scheduled interest and principal payment schedule.
The liability for losses and loss adjustment expenses consists of case basis credit and active credit reserves. Case basis credit reserves are established for losses on guaranteed obligations that have already defaulted. These reserves are established in an amount that is sufficient to cover the present value of the anticipated defaulted debt service payments over the expected period of default and estimated expenses associated with settling the claims, less estimated recoveries under collateral and subrogation rights. As noted above, the payment pattern and ultimate costs are fixed and determinable on an individual claim basis (i.e., the originally scheduled debt service of the insured obligation). Ambac discounts these reserves in accordance with discount rates prescribed or permitted by state regulatory authorities. In addition, we, consistent with industry practice, establish and accrue an active credit reserve, which is separate from the case basis credit reserves noted above. We believe, based on our active surveillance of the insured portfolio, along with historical defaults and related loss data and current economic factors, that additional losses are inherent in our portfolio. Current economic factors considered include estimates of current defaults and recovery values from collateral or subrogation rights. The active credit reserve is established based upon probable debt service defaults from incurred losses, as a result of credit deterioration. Reserve amounts are reasonably estimated based on management’s review of each credit. Active surveillance of the insured portfolio enables Ambac to track credit migration of insured obligations from period to period.
30
Management’s Discussion and Analysis
of Financial Condition and Results of Operations
Our Surveillance group, which is comprised of senior credit professionals, all of whom are independent from transaction execution, is responsible for extensive ongoing review of every credit Ambac has exposure to. At least monthly, Senior Finance and Credit Management meets with Surveillance to review the status of their work. During the monthly review, Senior Management determines the adequacy of Ambac’s loss reserves and makes any necessary adjustments. The following table summarizes Ambac’s loss reserves split between case basis credit loss reserves and active credit reserves at December 31, 2002 and 2001:
| | | 2002
| | 2001
|
| | | (Dollars in millions) |
Net loss and loss adjustment expense reserves: | | | | | | |
Case basis credit reserves* | | $ | 49.0 | | $ | 23.4 |
Active credit reserves | | | 118.6 | | | 126.7 |
| | |
|
| |
|
|
Total | | $ | 167.6 | | $ | 150.1 |
| | |
|
| |
|
|
| * | | After netting reinsurance recoverable on unpaid losses amounting to $4.6 million and $1.0 million in 2002 and 2001, respectively. |
The following table summarizes the changes in the total net loss reserves for the years ended December 31, 2002 and 2001:
| | | 2002
| | | 2001
| |
| | | (Dollars in millions) | |
Beginning balance of net loss reserves | | $ | 150.1 | | | $ | 131.3 | |
Additions to loss reserves | | | 26.7 | | | | 20.0 | |
Losses paid | | | (11.1 | ) | | | (2.6 | ) |
Recoveries of paid losses from reinsurers | | | 1.3 | | | | — | |
Recoveries of previously paid losses | | | 0.6 | | | | 1.4 | |
| | |
|
|
| |
|
|
|
Ending balance of net loss reserves | | $ | 167.6 | | | $ | 150.1 | |
| | |
|
|
| |
|
|
|
At December 31, 2002 case basis credit reserves are sufficient to cover required debt service through 2026 totaling $69.5 million. Annual debt service payments are $17.5 million, $18.9 million, $6.1 million, $3.7 million and $3.6 million for 2003, 2004, 2005, 2006 and 2007, respectively. Additions (reductions) made to the case basis credit reserve totaled $25.6 million, $(0.1) million and $12.7 million in 2002, 2001 and 2000, respectively. The increase in the 2002 case basis credit reserve is primarily attributable to credit deterioration on a mortgage-backed issue. At December 31, 2002, case basis credit reserves were $26.1 million for this issue. Additionally, Ambac paid $3.4 million relating to this issue in 2002.
The following tables provide details of net losses paid for the years ended December 31, 2002, 2001 and 2000 and net case reserves at December 31, 2002 and December 31, 2001:
| | | 2002
| | 2001
| | 2000
|
| | | (Dollars in millions) |
Net losses paid: | | | | | | | | | |
Public Finance | | $ | 6.4 | | $ | 2.6 | | $ | 4.6 |
Structured Finance | | | 3.4 | | | — | | | — |
International Finance | | | — | | | — | | | — |
| | |
|
| |
|
| |
|
|
Total | | $ | 9.8 | | $ | 2.6 | | $ | 4.6 |
| | |
|
| |
|
| |
|
|
| | | 2002
| | 2001
|
| | | (Dollars in millions) |
Net case basis credit reserves: | | | | | | |
Public Finance | | $ | 19.0 | | $ | 23.4 |
Structured Finance | | | 26.1 | | | — |
International Finance | | | 3.9 | | | — |
| | |
|
| |
|
|
Total | | $ | 49.0 | | $ | 23.4 |
| | |
|
| |
|
|
Ambac Assurance’s management believes that the reserves for losses and loss adjustment expenses are adequate to cover the ultimate net cost of claims, but the reserves are necessarily based on estimates and there can be no assurance that the ultimate liability will not exceed such estimates.
Underwriting and Operating Expenses. Underwriting and operating expenses of $76.5 million in 2002 increased by 13% from $68.0 million in 2001. Underwriting and operating expenses in 2001 increased 23% from $55.2 million in 2000. Underwriting and operating expenses consist of gross underwriting and operating expenses, less the deferral to future periods of expenses and reinsurance commissions related to the acquisition of new insurance contracts, plus the amortization of previously deferred expenses and reinsurance commissions. In 2002, gross underwriting and operating expenses were $117.7 million, an increase of 19% from $99.3 million in 2001. During 2001, gross underwriting and operating expenses increased 12% from $88.6 million in 2000. The increases in gross underwriting and operating expenses in both 2002 and 2001 reflect the overall increased business activity in those years and are primarily attributable to higher compensation costs related to the addition of staff and higher premium taxes. Underwriting and operating expenses deferred were $73.1 million, $59.5 million, and $55.8 million in 2002, 2001 and 2000, respectively. The amortization of previously deferred expenses and reinsurance commissions was $32.3 million, $28.2 million, and $22.5 million in 2002, 2001 and 2000, respectively. The high level of refundings contributed to the increase in amortization of previously deferred expenses in 2002 as any deferred costs associated with a refunded issue is fully amortized at the time of refunding.
31
FINANCIAL SERVICES
Through its Financial Services subsidiaries, Ambac provides financial and investment products including investment agreements, interest rate swaps, total return swaps, funding conduits, investment advisory and cash management services, to municipalities and their authorities, school districts, health care organizations and asset-backed issuers.
Financial Services net revenue is defined and analyzed by management as gross interest income less gross interest expense from investment and payment agreements plus other revenue, and excludes net realized and unrealized losses. Net revenues in 2002 increased 4% to $54.3 million from $52.2 million in 2001. This increase is primarily due to higher investment agreement net interest income due to higher interest rate spreads and higher volume, partially offset by lower interest rate swap revenues. Revenues from investment advisory and cash management decreased 3% in 2002 compared to 2001. Net revenues in 2001 decreased 17% from $62.7 million in 2000. This decrease in net revenue from 2000 to 2001 was primarily due to lower revenues from interest rate swaps and lower investment agreement net interest income due to lower interest rate spreads, partially offset by higher volume. Revenues from investment advisory and cash management increased 6% in 2001 compared to 2000.
Net realized investment losses in 2002 were $134.1 million, resulting primarily from a write-down of asset-backed notes issued by National Century Financial Enterprises, Inc. (“NCFE”). These notes, which were rated triple-A until October 25, 2002, have defaulted and NCFE filed for protection under Chapter 11 of the U.S. Bankruptcy Code in November 2002. The NCFE notes, which are backed by health care receivables, have been written down to approximately 20% of par value, which represents Ambac’s best estimate of its future recovery based on existing facts and circumstances.
Financial Services other expenses in 2002 were $22.2 million, an increase of 2% from $21.8 million in 2001. Other expenses in 2001 decreased 12% from $24.8 million in 2000.
CORPORATE ITEMS
Interest Expense. Interest expense was $43.7 million, $40.4 million and $37.5 million in 2002, 2001 and 2000, respectively. The 2002 increase is primarily attributable to Ambac’s issuance of $200 million in debentures in October 2001, partially offset by lower bank fees associated with capital facilities.
Income Taxes. Income taxes for 2002 were at an effective rate of 23.3%, compared to 23.9% and 24.1% for 2001 and 2000, respectively. The decrease in the effective tax rate in 2002 as compared to 2001 is primarily due to the NCFE loss and the related reduction in taxable profits. The decrease in the effective tax rate in 2001 as compared to 2000 is due to a favorable settlement of a state income tax audit, partially offset by increased underwriting profits.
LIQUIDITY AND CAPITAL RESOURCES
Ambac Financial Group, Inc. Liquidity. Ambac’s liquidity, both on a short-term basis (for the next twelve months) and a long-term basis (beyond the next twelve months), is largely dependent upon: (i) Ambac Assurance’s ability to pay dividends or make other payments to Ambac; (ii) external financings; and (iii) investment income from its investment portfolio. Pursuant to Wisconsin insurance laws, Ambac Assurance may declare dividends, provided that, after giving effect to the distribution, it would not violate certain statutory equity, solvency and asset tests. Based upon these tests, without regulatory approval, the maximum amount that will be available during 2003 for payment by Ambac Assurance is approximately $223 million. During 2002, Ambac Assurance paid dividends of $78.0 million on its common stock to Ambac.
Ambac’s principal uses of liquidity are for the payment of its operating expenses, income taxes, interest on its debt, dividends on its shares of common stock, purchases of its common stock in the open market and capital investments in its subsidiaries. Ambac contributed $50 million to Ambac Capital Corporation during 2002. Based on the amount of dividends that it expects to receive from Ambac Assurance and other subsidiaries during 2003, and the income it expects to receive from its investment portfolio, management believes that Ambac will have sufficient liquidity to satisfy its needs over the next twelve months, including the ability to pay dividends on its common stock in accordance with its dividend policy. Beyond the next twelve months, Ambac Assurance’s ability to declare and pay dividends to Ambac may be influenced by a variety of factors including adverse market changes, insurance regulatory changes and changes in general economic conditions. Consequently, although management believes that Ambac will continue to have sufficient liquidity to meet its debt service and other obligations over the long term, no guarantee can be given that Ambac Assurance will be able to dividend amounts sufficient to pay all of Ambac’s operating expenses, debt service obligations and dividends on its common stock.
32
Management’s Discussion and Analysis
of Financial Condition and Results of Operations
Ambac Assurance Liquidity. The principal uses of Ambac Assurance’s liquidity are the payment of operating expenses, claims paid, reinsurance premiums, taxes, dividends to Ambac, and capital investments in its subsidiaries. Management believes that Ambac Assurance’s operating liquidity needs can be funded exclusively from its operating cash flow. The principal sources of Ambac Assurance’s liquidity are gross premiums written, scheduled investment maturities, net investment income and receipts from structured credit derivatives.
Financial Services Liquidity. The principal uses of liquidity by Financial Services subsidiaries are payment of investment agreement obligations pursuant to defined terms, net obligations under interest rate swaps and related hedges, operating expenses, income taxes, and dividends to Ambac. Management believes that its Financial Services liquidity needs can be funded primarily from its operating cash flow and the maturity of its invested assets. The principal sources of this segment’s liquidity are proceeds from issuance of investment agreements, net investment income, maturities of securities from its investment portfolio (which are invested with the objective of matching the maturity schedule of its obligations under the investment agreements), net receipts from interest rate swaps and related hedges, and fees for investment management services. Additionally, from time to time, liquidity needs of the Financial Services subsidiaries are satisfied by short-term intercompany loans from Ambac Assurance. The investment objectives with respect to investment agreements are to achieve the highest after-tax total return, subject to a minimum average quality rating of Aa/AA on invested assets, and to maintain cash flow matching of invested assets to funded liabilities to minimize interest rate and liquidity exposure. Financial Services subsidiaries maintain a portion of their assets in short-term investments and repurchase agreements in order to meet unexpected liquidity needs.
Credit Facilities. Ambac and Ambac Assurance have a revolving credit facility with six major international banks for $300 million, which expires in July 2003 and provides a two-year term loan provision. The facility is available for general corporate purposes, including the payment of claims. As of December 31, 2002 and 2001, no amounts were outstanding under this credit facility. This facility’s financial covenants require that Ambac: (i) maintain as of the end of each fiscal quarter a debt to capital ratio of not more than 30% and (ii) maintain at all times total stockholders’ equity equal to or greater than $1.75 billion.
Capital Support. Ambac Assurance has a series of perpetual put options on its own preferred stock. The counterparty to these put options are trusts established by a major investment bank. The trusts were created as a vehicle for providing capital support to Ambac Assurance by allowing it to obtain immediate access to new capital at its sole discretion at any time through the exercise of the put option. If the put option were exercised, the preferred stock holdings of Ambac Assurance would give investors the rights of an equity investor in Ambac Assurance. Such rights are subordinate to insurance claims, as well as to the general unsecured creditors of Ambac Assurance. If exercised, Ambac Assurance would receive up to $800 million in return for the issuance of its own perpetual preferred stock, the proceeds of which may be used for any purpose including the payment of claims. Dividend payments on the preferred stock are cumulative only if Ambac Assurance pays dividends on its common stock. Each trust is restricted to holding high quality short-term commercial paper investments to ensure that it can meet its obligations under the put option. To fund these investments, each trust has issued its own auction market perpetual preferred stock. Ambac Assurance pays a floating put option fee. Each trust is rated AA/Aa2 by Standard & Poor’s and Moody’s, respectively.
Stock Repurchase Program. The Board of Directors of Ambac has authorized the establishment of a stock repurchase program that permits the repurchase of up to 12,000,000 shares of Ambac’s common stock. During 2002, Ambac acquired approximately 695,000 shares for an aggregate amount of $41.1 million. Since inception of the Stock Repurchase Program, Ambac has acquired approximately 8,967,000 shares for an aggregate amount of $265.9 million.
Balance Sheet. Total assets as of December 31, 2002 were $15.36 billion, an increase of 24% from $12.34 billion at December 31, 2001. This increase was due primarily to cash generated from business written during 2002 and higher volume in the guaranteed investment agreement business. Stockholders’ equity as of December 31, 2002 was $3.63 billion, an increase of 22% from $2.98 billion at year-end 2001. The increase stemmed primarily from net income for the year and an increase in the fair market value of the investment portfolio due to a decline in interest rates during the year.
33
The following table summarizes the composition of the fair value of Ambac’s investment portfolio by segment at December 31, 2002 and 2001:
| | | Financial Guarantee
| | | Financial Services
| | | Corporate
| | | Total
| |
| | | (Dollars in millions) | |
2002: | | | | | | | | | | | | | | | | |
Fixed income securities: | | | | | | | | | | | | | | | | |
Municipal obligations | | $ | 4,470.1 | | | $ | 417.8 | | | $ | — | | | $ | 4,887.9 | |
Corporate obligations | | | 432.5 | | | | 1,136.8 | | | | — | | | | 1,569.3 | |
Foreign government obligations | | | 120.6 | | | | — | | | | — | | | | 120.6 | |
U.S. government obligations | | | 101.6 | | | | 6.6 | | | | — | | | | 108.2 | |
Mortgage and asset-backed securities (includes U.S. government agency obligations) | | | 846.0 | | | | 4,048.0 | | | | 17.6 | | | | 4,911.6 | |
Other | | | 1.7 | | | | — | | | | 0.6 | | | | 2.3 | |
| | |
|
|
| |
|
|
| |
|
|
| |
|
|
|
| | | | 5,972.5 | | | | 5,609.2 | | | | 18.2 | | | | 11,599.9 | |
Short-term | | | 284.3 | | | | 71.6 | | | | 39.9 | | | | 395.8 | |
| | |
|
|
| |
|
|
| |
|
|
| |
|
|
|
| | | | 6,256.8 | | | | 5,680.8 | | | | 58.1 | | | | 11,995.7 | |
| | |
|
|
| |
|
|
| |
|
|
| |
|
|
|
Fixed income securities pledged as collateral: | | | | | | | | | | | | | | | | |
Mortgage and asset-backed securities (includes U.S. government agency obligations) | | | — | | | | 543.6 | | | | — | | | | 543.6 | |
| | |
|
|
| |
|
|
| |
|
|
| |
|
|
|
Total investments | | $ | 6,256.8 | | | $ | 6,224.4 | | | $ | 58.1 | | | $ | 12,539.3 | |
| | |
|
|
| |
|
|
| |
|
|
| |
|
|
|
Percent total | | | 49.9 | % | | | 49.6 | % | | | 0.5 | % | | | 100 | % |
| | |
|
|
| |
|
|
| |
|
|
| |
|
|
|
2001: | | | | | | | | | | | | | | | | |
Fixed income securities: | | | | | | | | | | | | | | | | |
Municipal obligations | | $ | 3,540.3 | | | $ | 144.5 | | | $ | — | | | $ | 3,684.8 | |
Corporate obligations | | | 656.2 | | | | 674.4 | | | | — | | | | 1,330.6 | |
Foreign government obligations | | | 96.6 | | | | — | | | | — | | | | 96.6 | |
U.S. government obligations | | | 54.8 | | | | 6.0 | | | | 17.5 | | | | 78.3 | |
Mortgage and asset-backed securities (including U.S. government agency obligations) | | | 735.2 | | | | 2,530.4 | | | | 13.3 | | | | 3,278.9 | |
Other | | | 1.4 | | | | — | | | | 0.8 | | | | 2.2 | |
| | |
|
|
| |
|
|
| |
|
|
| |
|
|
|
| | | | 5,084.5 | | | | 3,355.3 | | | | 31.6 | | | | 8,471.4 | |
Short-term | | | 170.6 | | | | 225.2 | | | | 19.2 | | | | 415.0 | |
| | |
|
|
| |
|
|
| |
|
|
| |
|
|
|
| | | | 5,255.1 | | | | 3,580.5 | | | | 50.8 | | | | 8,886.4 | |
| | |
|
|
| |
|
|
| |
|
|
| |
|
|
|
Fixed income securities pledged as collateral: | | | | | | | | | | | | | | | | |
Mortgage and asset-backed securities (including U.S. government agency obligations) | | | — | | | | 1,401.5 | | | | — | | | | 1,401.5 | |
| | |
|
|
| |
|
|
| |
|
|
| |
|
|
|
Total investments | | $ | 5,255.1 | | | $ | 4,982.0 | | | $ | 50.8 | | | $ | 10,287.9 | |
| | |
|
|
| |
|
|
| |
|
|
| |
|
|
|
Percent total | | | 51.1 | % | | | 48.4 | % | | | 0.5 | % | | | 100 | % |
| | |
|
|
| |
|
|
| |
|
|
| |
|
|
|
Ambac has a formal review process for all securities in its investment portfolio, including a review for impairment losses. Factors considered when assessing impairment include: (i) securities whose market values have declined by 20% or more below amortized cost for a continuous period of at least six months; (ii) recent credit downgrades by rating agencies; (iii) the financial condition of the issuer; (iv) whether scheduled interest payments are past due; and (v) whether Ambac has the ability and intent to hold the security for a sufficient period of time to allow for anticipated recoveries in fair value. If we believe a decline in the value of a particular investment is temporary, we record the decline as an unrealized loss in Accumulated Other Comprehensive Income in stockholders’ equity on our Consolidated Balance Sheets. If we believe the decline is “other than temporary,” we write-down the carrying value of the investment and record a loss on our Consolidated Statements of Operations. Ambac’s assessment of a decline in value includes management’s current judgment of the factors noted above. If that judgment changes in the future, Ambac may ultimately record a loss after having originally concluded that the decline in value was temporary. The following table summarizes the total pre-tax gross unrealized loss recorded in Accumulated Other Comprehensive Income in stockholders’ equity at December 31, 2002 and 2001 by investment category:
| | | 2002 Gross Unrealized Losses
| | 2001 Gross Unrealized Losses
|
| | | (Dollars in millions) |
Fixed income securities: | | | | | | |
Municipal obligations | | $ | 4.6 | | $ | 29.8 |
Corporate obligations | | | 27.8 | | | 42.6 |
Foreign government obligations | | | — | | | 1.1 |
U.S. government obligations | | | 0.3 | | | 1.2 |
Mortgage and asset-backed securities | | | 4.3 | | | 20.8 |
| | |
|
| |
|
|
Total | | $ | 37.0 | | $ | 95.5 |
| | |
|
| |
|
|
34
Management’s Discussion and Analysis
of Financial Condition and Results of Operations
The following table summarizes, for all securities in an unrealized loss position as of December 31, 2002 and 2001, the aggregate fair value and gross unrealized loss by length of time those securities have been continuously in an unrealized loss position:
| | | 2002
| | 2001
|
| | | Estimated Fair Value
| | Gross Unrealized Losses
| | Estimated Fair Value
| | Gross Unrealized Losses
|
| | | (Dollars in millions) |
Municipal obligations in continuous unrealized loss for: | | | | | | | | | | | | |
0–6 months | | $ | 146.1 | | $ | 2.4 | | $ | 1,010.2 | | $ | 23.6 |
7– 12 months | | | 0.9 | | | 0.3 | | | 0.4 | | | 0.1 |
Greater than 12 months | | | 26.9 | | | 1.9 | | | 91.9 | | | 6.1 |
| | |
|
| |
|
| |
|
| |
|
|
| | | | 173.9 | | | 4.6 | | | 1,102.5 | | | 29.8 |
| | |
|
| |
|
| |
|
| |
|
|
Corporate obligations in continuous unrealized loss for: | | | | | | | | | | | | |
0–6 months | | | 461.1 | | | 7.5 | | | 339.5 | | | 10.4 |
7– 12 months | | | 18.5 | | | 2.2 | | | 4.5 | | | 0.4 |
Greater than 12 months | | | 106.7 | | | 18.1 | | | 258.0 | | | 31.8 |
| | |
|
| |
|
| |
|
| |
|
|
| | | | 586.3 | | | 27.8 | | | 602.0 | | | 42.6 |
| | |
|
| |
|
| |
|
| |
|
|
Foreign government obligations in continuous unrealized loss for: | | | | | | | | | | | | |
0–6 months | | | 1.6 | | | — | | | 44.6 | | | 1.1 |
7– 12 months | | | — | | | — | | | — | | | — |
Greater than 12 months | | | — | | | — | | | — | | | — |
| | |
|
| |
|
| |
|
| |
|
|
| | | | 1.6 | | | — | | | 44.6 | | | 1.1 |
| | |
|
| |
|
| |
|
| |
|
|
U.S. government obligations in continuous unrealized loss for: | | | | | | | | | | | | |
0–6 months | | | 15.9 | | | 0.3 | | | 18.3 | | | 1.2 |
7– 12 months | | | — | | | — | | | — | | | — |
Greater than 12 months | | | — | | | — | | | — | | | — |
| | |
|
| |
|
| |
|
| |
|
|
| | | | 15.9 | | | 0.3 | | | 18.3 | | | 1.2 |
| | |
|
| |
|
| |
|
| |
|
|
Mortgage and asset-backed securities in continuous unrealized loss for: | | | | | | | | | | | | |
0–6 months | | | 576.8 | | | 3.2 | | | 1,348.6 | | | 18.2 |
7– 12 months | | | 11.7 | | | 0.1 | | | — | | | — |
Greater than 12 months | | | 33.1 | | | 1.0 | | | 15.2 | | | 2.6 |
| | |
|
| |
|
| |
|
| |
|
|
| | | | 621.6 | | | 4.3 | | | 1,363.8 | | | 20.8 |
| | |
|
| |
|
| |
|
| |
|
|
Total | | $ | 1,399.3 | | $ | 37.0 | | $ | 3,131.2 | | $ | 95.5 |
| | |
|
| |
|
| |
|
| |
|
|
There were no individual securities with material unrealized losses as of December 31, 2002 and 2001. As of December 31, 2002 below investment grade securities and non-rated securities which were in an unrealized loss position had a fair value of $46.7 million and unrealized loss of $5.0 million, which represented 3% of the total fair value and 14% of total pre-tax unrealized losses shown in the above table. As of December 31, 2001 below investment grade securities and non-rated securities which were in an unrealized loss position had a fair value of $26.9 million and an unrealized loss of $5.3 million, which represented 1% of the total fair value and 6% of total pre-tax unrealized loss as shown in the above table.
35
The following table summarizes amortized cost and fair value for all securities in an unrealized loss position as of December 31, 2002 and 2001, by contractual maturity date:
| | | 2002
| | 2001
|
| | | Amortized Cost
| | Estimated Fair Value
| | Amortized Cost
| | Estimated Fair Value
|
| | | (Dollars in millions) |
Municipal obligations: | | | | | | | | | | | | |
Due in one year or less | | $ | — | | $ | — | | $ | 1.5 | | $ | 1.2 |
Due after one year through five years | | | — | | | — | | | 0.1 | | | 0.1 |
Due after five years through ten years | | | 10.8 | | | 10.6 | | | 298.7 | | | 294.7 |
Due after ten years | | | 167.7 | | | 163.3 | | | 832.0 | | | 806.5 |
| | |
|
| |
|
| |
|
| |
|
|
| | | | 178.5 | | | 173.9 | | | 1,132.3 | | | 1,102.5 |
| | |
|
| |
|
| |
|
| |
|
|
Corporate obligations: | | | | | | | | | | | | |
Due in one year or less | | | — | | | — | | | — | | | — |
Due after one year through five years | | | 228.7 | | | 223.0 | | | 12.7 | | | 12.5 |
Due after five years through ten years | | | 29.6 | | | 29.3 | | | 70.3 | | | 69.3 |
Due after ten years | | | 355.8 | | | 334.0 | | | 561.6 | | | 520.2 |
| | |
|
| |
|
| |
|
| |
|
|
| | | | 614.1 | | | 586.3 | | | 644.6 | | | 602.0 |
| | |
|
| |
|
| |
|
| |
|
|
Foreign government obligations: | | | | | | | | | | | | |
Due in one year or less | | | 1.6 | | | 1.6 | | | — | | | — |
Due after one year through five years | | | — | | | — | | | 45.4 | | | 44.4 |
Due after five years through ten years | | | — | | | — | | | — | | | — |
Due after ten years | | | — | | | — | | | 0.3 | | | 0.2 |
| | |
|
| |
|
| |
|
| |
|
|
| | | | 1.6 | | | 1.6 | | | 45.7 | | | 44.6 |
| | |
|
| |
|
| |
|
| |
|
|
U.S. government obligations: | | | | | | | | | | | | |
Due in one year or less | | | — | | | — | | | 0.8 | | | 0.8 |
Due after one year through five years | | | 16.2 | | | 15.9 | | | — | | | — |
Due after five years through ten years | | | — | | | — | | | — | | | — |
Due after ten years | | | — | | | — | | | 18.7 | | | 17.5 |
| | |
|
| |
|
| |
|
| |
|
|
| | | | 16.2 | | | 15.9 | | | 19.5 | | | 18.3 |
| | |
|
| |
|
| |
|
| |
|
|
Mortgage and asset-backed securities | | | 625.9 | | | 621.6 | | | 1,384.6 | | | 1,363.8 |
| | |
|
| |
|
| |
|
| |
|
|
Total | | $ | 1,436.3 | | $ | 1,399.3 | | $ | 3,226.7 | | $ | 3,131.2 |
| | |
|
| |
|
| |
|
| |
|
|
The investment portfolio includes non-publicly traded securities with a carrying value of $148 million. Fair values for these securities are based on quotes obtained from brokers, if available. For those fixed rate securities where broker quotes were not available, fair values are based on internal valuation models. For floating rate securities where broker quotes were not available, fair values are based on the lower of amortized cost or internal valuation models. Key inputs to the internal valuation models include maturity date, coupon and generic yield curves for industry and credit rating characteristics that closely match those characteristics of the specific investment securities being valued. The valuation results from these models could differ materially from amounts that would actually be realized in the market.
36
Management’s Discussion and Analysis
of Financial Condition and Results of Operations
The following table summarizes, for all securities sold at a loss during 2002 and 2001, the aggregate fair value and realized loss by length of time those securities were continuously in an unrealized loss position prior to the sales date:
| | | 2002
| | 2001
|
| | | Estimated Fair Value
| | Gross Realized Losses
| | Estimated Fair Value
| | Gross Realized Losses
|
| | | (Dollars in millions) |
Municipal obligations in continuous unrealized loss for: | | | | | | | | | | | | |
0–6 months | | $ | 20.2 | | $ | 0.4 | | $ | 38.6 | | $ | 0.4 |
7– 12 months | | | — | | | — | | | 1.0 | | | — |
Greater than 12 months | | | 0.8 | | | — | | | 92.3 | | | 3.3 |
| | |
|
| |
|
| |
|
| |
|
|
| | | | 21.0 | | | 0.4 | | | 131.9 | | | 3.7 |
| | |
|
| |
|
| |
|
| |
|
|
Corporate obligations in continuous unrealized loss for: | | | | | | | | | | | | |
0–6 months | | | 45.9 | | | 0.6 | | | 34.9 | | | 2.4 |
7– 12 months | | | — | | | — | | | — | | | — |
Greater than 12 months | | | 42.1 | | | 9.0 | | | 31.9 | | | 1.9 |
| | |
|
| |
|
| |
|
| |
|
|
| | | | 88.0 | | | 9.6 | | | 66.8 | | | 4.3 |
| | |
|
| |
|
| |
|
| |
|
|
Foreign government obligations in continuous unrealized loss for: | | | | | | | | | | | | |
0–6 months | | | — | | | — | | | 12.4 | | | 1.2 |
7– 12 months | | | 6.8 | | | 0.1 | | | — | | | — |
Greater than 12 months | | | — | | | — | | | — | | | — |
| | |
|
| |
|
| |
|
| |
|
|
| | | | 6.8 | | | 0.1 | | | 12.4 | | | 1.2 |
| | |
|
| |
|
| |
|
| |
|
|
U.S. government obligations in continuous unrealized loss for: | | | | | | | | | | | | |
0–6 months | | | — | | | — | | | 16.6 | | | 1.0 |
7– 12 months | | | 18.0 | | | 0.7 | | | — | | | — |
Greater than 12 months | | | — | | | — | | | — | | | — |
| | |
|
| |
|
| |
|
| |
|
|
| | | | 18.0 | | | 0.7 | | | 16.6 | | | 1.0 |
| | |
|
| |
|
| |
|
| |
|
|
Mortgage and asset-backed securities in continuous unrealized loss for: | | | | | | | | | | | | |
0–6 months | | | 215.3 | | | 1.0 | | | 74.2 | | | 0.7 |
7– 12 months | | | 4.0 | | | — | | | — | | | — |
Greater than 12 months | | | 3.8 | | | — | | | 48.8 | | | 2.2 |
| | |
|
| |
|
| |
|
| |
|
|
| | | | 223.1 | | | 1.0 | | | 123.0 | | | 2.9 |
| | |
|
| |
|
| |
|
| |
|
|
Other securities in continuous unrealized loss for: | | | | | | | | | | | | |
0–6 months | | | 37.0 | | | 1.3 | | | 184.7 | | | 7.7 |
7– 12 months | | | — | | | — | | | — | | | — |
Greater than 12 months | | | — | | | — | | | — | | | — |
| | |
|
| |
|
| |
|
| |
|
|
| | | | 37.0 | | | 1.3 | | | 184.7 | | | 7.7 |
| | |
|
| |
|
| |
|
| |
|
|
Total | | $ | 393.9 | | $ | 13.1 | | $ | 535.4 | | $ | 20.8 |
| | |
|
| |
|
| |
|
| |
|
|
As noted in the “Results of Operations” section, included in 2002 net realized losses was an impairment write-down of $139.7 million, which was excluded from the table above. There were no impairment write-downs during 2001 and 2000. The remaining net realized losses included in the 2002, 2001 and 2000 Consolidated Statements of Operations were the result of security sales made in the usual course of business in order to achieve Ambac’s investment objectives for the Financial Guarantee and Financial Services investment portfolios discussed below.
Ambac’s investment objectives for the Financial Guarantee portfolio are to maintain an investment duration that closely approximates the expected duration of related financial guarantee liabilities and achieve the highest after-tax net investment income, while maintaining a conservative credit risk profile. The Financial Guarantee investment portfolio is subject to internal investment guidelines, which are approved by Ambac’s Board of Directors. Such guidelines set forth minimum credit rating requirements and credit risk concentration limits.
37
The following table provides the ratings distribution of the Financial Guarantee investment portfolio at December 31, 2002 and 2001:
Rating(1):
| | 2002
| | | 2001
| |
AAA(2) | | 73 | % | | 65 | % |
AA | | 16 | | | 19 | |
A | | 7 | | | 11 | |
BBB | | 1 | | | 2 | |
Below investment grade | | 1 | | | <1 | |
Not rated | | 2 | | | 3 | |
| | |
|
| |
|
|
| | | 100 | % | | 100 | % |
| | |
|
| |
|
|
| (1) | | Ratings represent Standard & Poor’s classifications. If unavailable, Moody’s rating is used. |
| (2) | | Includes U.S. Treasury and agency obligations, which comprised approximately 15% and 13% of the Financial Guarantee investment portfolio as of December 31, 2002 and 2001, respectively. |
Approximately 98% and 85% of the mortgage and asset-backed securities in the Financial Guarantee portfolio is composed of securities issued by various U.S. government agencies, as of December 31, 2002 and 2001, respectively.
Short-term investments in the Financial Guarantee portfolio consisted primarily of money market funds, foreign and domestic time deposits, and discount notes.
The Financial Services investment portfolio consists primarily of assets funded with the proceeds from the issuance of investment agreement liabilities. The investment objectives of the portfolio are to match the investment security maturity schedule to the maturity schedule of related liabilities under the investment agreements and achieve the highest after-tax net investment income. The investment portfolio is subject to internal investment guidelines, which are approved by Ambac’s Board of Directors. Such guidelines set forth minimum credit rating requirements and credit risk concentration limits.
The following table provides the ratings distribution of the Financial Services investment portfolio at December 31, 2002 and 2001:
Rating(1):
| | 2002
| | | 2001
| |
AAA(2) | | 88 | % | | 88 | % |
AA | | 2 | | | 4 | |
A | | 6 | | | 6 | |
BBB | | 3 | | | 2 | |
Below investment grade | | 1 | | | <1 | |
Not rated | | — | | | <1 | |
| | |
|
| |
|
|
| | | 100 | % | | 100 | % |
| | |
|
| |
|
|
| (1) | | Ratings represent Standard & Poor’s classifications. If unavailable, Moody’s rating is used. |
| (2) | | Includes U.S. Treasury and agency obligations, which comprised approximately 44% and 34% of the Financial Services investment portfolio as of December 31, 2002 and 2001, respectively. |
Approximately 59% and 69% of the mortgage and asset-backed securities in the Financial Services portfolio is composed of securities issued by various U.S. government agencies, as of December 31, 2002 and 2001, respectively.
Short-term investments in the Financial Services portfolio consisted of money market funds.
Ambac enters into derivative contracts classified as held for trading purposes. Changes in the fair value of derivative contracts classified as held for trading purposes are recognized immediately in net income. In determining fair value, Ambac uses information provided by independent external sources or, when independent information is not available, internal valuation models are used. Internal valuation models include estimates, made by management, which utilize current and historical market data. The valuation results from internal models could differ materially from amounts that would be realized in the market. The net fair value of derivative contracts classified as held for trading purposes was $56 million at December 31, 2002. Of that amount, $(9) million was determined using internal valuation models and $65 million was provided by external sources. Contracts with maturities in excess of 5 years accounted for $83 million of the net fair value. Contracts with maturities of 5 years or less accounted for $(27) million of net fair value.
Special Purpose Entities. Ambac has transferred third-party debt obligations to two special purpose entities. The business purpose of these entities is to provide some of our financial guarantee clients with funding for their debt obligations. These special purpose entities meet the characteristics of Qualifying Special Purpose Entities (“QSPEs”) in accordance with Statement of Financial Accounting Standards 140 “Accounting for Transfers and Servicing of Financial Assets and Extinguishments of Liabilities.” The QSPEs are not consolidated in Ambac’s consolidated financial statements. The QSPEs are legal entities that are demonstrably distinct from Ambac. Ambac, its affiliates or its agents cannot unilaterally dissolve the QSPEs. The QSPEs permitted activities are limited to (i) purchasing assets from Ambac, which are defined in the governing documents of the QSPEs, (ii) issuing Medium Term Notes (“MTNs”) to fund such purchase, (iii) executing derivative hedges and (iv) providing related administrative services. The QSPEs hold only passive debt obligations transferred to it by Ambac, passive derivative financial instruments used for hedging purposes and cash collected from assets that it holds pending distribution to the MTN holders. The QSPEs do not hold equity or other types of securities that would allow for voting rights, significant influence of contractual options such as the right to unconditionally put or call a financial instrument. The legal documents that established the QSPEs or created the beneficial interests in the transferred assets do not permit the sale or other disposal of the transferred financial assets except for disposals in automatic response to the terms of such financial assets (this would include only issuer call provisions). These required disposals are outside the control of Ambac, its affiliates and the QSPEs. Beneficial interest holders do not have the rights to put their beneficial interest back to the QSPEs.
As of December 31, 2002, there have been 12 individual transactions processed through the QSPEs. In each case, Ambac sells fixed income debt obligations issued by third parties to the QSPEs. Ambac receives cash consideration for all assets transferred to the QSPEs. Ambac surrenders control over the transferred debt obligations. There are no agreements that entitle or obligate Ambac to repurchase or redeem assets. The QSPEs are structured as bankruptcy remote entities. Ambac management believes that the assets transferred represent a true sale and the
38
Management’s Discussion and Analysis
of Financial Condition and Results of Operations
assets held by the QSPEs are beyond the reach of Ambac and its creditors, even in bankruptcy or other receivership. Legal counsel has concurred with management’s belief and has provided Ambac true sale and non-substantive consolidation opinions. The purchase by the QSPEs is financed through the issuance of MTNs, which are collateralized by the purchased assets. Derivative contracts may be used for hedging purposes only. Derivative hedges are established at the time MTNs are issued to purchase debt obligations. Ambac Assurance may issue a financial guarantee insurance policy on the assets sold, the MTNs issued and the derivative contracts used. As of December 31, 2002, Ambac Assurance had financial guarantee insurance policies issued for all assets owned, MTNs issued and derivative contracts used by the QSPEs.
Ambac’s exposure under these financial guarantee insurance policies is included in the disclosure in Note 12 “Guarantees in Force” to the consolidated financial statements. Pursuant to the terms of Ambac Assurance’s insurance policy, insurance premiums are paid to Ambac Assurance by the QSPEs and are earned in a manner consistent with other insurance policies, over the risk period. Any losses incurred would be included in Ambac’s Consolidated Statements of Operations. To date, no losses have been recognized. Under the terms of an Administrative Agency Agreement, Ambac provides some administrative services, primarily collecting amounts due on the obligations and making interest payments on the MTNs.
Assets sold to the QSPEs during 2002, 2001 and 2000 were $350.0 million, $793.4 million and $159.9 million, respectively. No gains or losses were recognized on these sales. As of December 31, 2002, the estimated fair value of financial assets, MTN liabilities and derivative hedge liabilities were $1,347.3 million, $1,263.5 million and $91.0 million, respectively. When market quotes are not available, estimated fair value is determined utilizing valuation models. These models include estimates, made by Ambac management, which utilize current market information. The valuation results from these models could differ materially from amounts that would actually be realized in the market. Ambac Assurance received gross premiums and other fees for issuing financial guarantee policies on the assets, MTNs and derivative contracts of $19.3 million, $23.7 million and $3.2 million for the years ended December 31, 2002, 2001 and 2000, respectively. Ambac received fees for providing administrative services amounting to $0.1 million, $0.3 million and $0.2 million for 2002, 2001 and 2000, respectively.
Cash Flows. Net cash provided by operating activities was $805.5 million, $671.8 million and $481.3 million during 2002, 2001 and 2000, respectively. These cash flows were primarily provided by the Financial Guarantee operations. Net cash provided by (used in) financing activities was $1,650.2 million, $760.8 million and $(1,226.0) million during 2002, 2001 and 2000, respectively. Financing activities for the years ended 2002 and 2001 included $1,442.0 million and $621.4 million, respectively, in net investment agreements issued (net of investment agreement draws). Financing activity for the year ended 2000 included $1,217.8 million used by the investment agreement business for net draws paid (net of investment agreements issued). Net cash (used in) provided by investing activities was $(2,506.4) million, $(1,401.4) million and $776.5 million, respectively. These investing activities were primarily net purchases of investment securities during 2002 and 2001, and principally net proceeds from sales and maturities of investment securities during 2000. Total cash (used in) provided by operating, investing and financing activities was $(50.8) million, $31.2 million and $31.8 million during 2002, 2001 and 2000, respectively.
Material Commitments. Ambac has made no commitments for material capital expenditures within the next twelve months.
RISK MANAGEMENT
In the ordinary course of business, Ambac, through its affiliates, manages a variety of risks, principally credit, market, liquidity, operational and legal. These risks are identified, measured and monitored through a variety of control mechanisms, which are in place at different levels throughout the organization.
Credit Risk. Ambac is exposed to credit risk in various capacities including as an issuer of financial guarantees, as counterparty to derivative and other financial contracts and as a holder of investment securities. Ambac’s Portfolio Risk Management Committee (“PRMC”) employs various procedures and controls to monitor and manage credit risk. The PRMC is comprised of senior risk professionals and senior management of Ambac. Its purview is enterprise-wide and its focus is on risk limits and measurement, concentration and correlation of risk, and the attribution of economic and regulatory capital in a portfolio context.
All financial guarantees and structured credit derivatives issued are subject to a formal underwriting process. Various factors affecting the credit worthiness of the underlying obligation are evaluated during the underwriting process. Senior credit personnel approve all transactions prior to issuing a financial guarantee. Subsequent to issuance of a financial guarantee, Ambac periodically performs reviews of exposures according to a schedule based on the risk profile of the guaranteed obligations. Proactive credit remediation can help secure rights and remedies which mitigate losses in the event of default.
Ambac manages credit risk associated with its investment portfolio through adherence to specific investment guidelines. These guidelines establish limits based upon single risk concentration limits and minimum credit rating standards. Additionally, senior credit personnel monitor the portfolio on a continuous basis. Credit risk relating to derivative positions (other than structured credit derivatives discussed below) primarily concern counterparty default. Counterparty default exposure is mitigated through the use of industry standard collateral posting agreements. For counterparties subject to such
39
collateral posting agreements, collateral is posted when a derivative counterparty’s credit exposure exceeds contractual limits.
Market Risk. Market risk represents the potential for losses that may result from changes in the value of a financial instrument as a result of changes in market conditions. The primary market risks that would impact the value of Ambac’s financial instruments are interest rate risk, basis risk (e.g., taxable interest rates relative to tax-exempt interest rates, discussed below) and credit spread risk. Below we discuss each of these risks and the specific types of financial instruments impacted. Senior managers in Ambac’s Risk Analysis and Reporting group are responsible for monitoring risk limits and applying risk measurement methodologies. The estimation of potential losses arising from adverse changes in market conditions is a key element in managing market risk. Ambac utilizes various systems, models and stress test scenarios to monitor and manage market risk. This process includes frequent analyses of both parallel and nonparallel shifts in the yield curve, “Value-at-Risk” (“VaR”) and changes in credit spreads. These models include estimates, made by management, which utilize current and historical market information. The valuation results from these models could differ materially from amounts that would actually be realized in the market.
Financial instruments that may be adversely affected by changes in interest rates consist primarily of investment securities, investment agreement liabilities, debentures, and certain derivative contracts (primarily interest rate swaps and futures) used for hedging purposes. The following table summarizes the estimated change in fair value (based primarily on the valuation models discussed above) on the net balance of Ambac’s investment securities, investment agreement liabilities, debentures and derivative hedges, assuming immediate changes in interest rates at specified levels at December 31, 2002 and 2001:
Change in Interest Rates
| | Estimated Net Fair Value
| | Estimated Change in Net Fair Value
| |
| | | (Dollars in Millions) | |
2002: | | | | | | | |
300 basis point rise | | $ | 4,386 | | $ | (1,116 | ) |
200 basis point rise | | | 4,773 | | | (729 | ) |
100 basis point rise | | | 5,141 | | | (361 | ) |
Base scenario | | | 5,502 | | | — | |
100 basis point decline | | | 5,837 | | | 335 | |
200 basis point decline | | | 6,143 | | | 641 | |
300 basis point decline | | | 6,419 | | | 917 | |
| | |
|
| |
|
|
|
2001: | | | | | | | |
300 basis point rise | | $ | 3,616 | | $ | (1,075 | ) |
200 basis point rise | | | 3,987 | | | (704 | ) |
100 basis point rise | | | 4,344 | | | (347 | ) |
Base scenario | | | 4,691 | | | — | |
100 basis point decline | | | 5,063 | | | 372 | |
200 basis point decline | | | 5,426 | | | 735 | |
300 basis point decline | | | 5,780 | | | 1,089 | |
| | |
|
| |
|
|
|
Ambac, through its affiliate Ambac Financial Services, L.P., is a provider of interest rate swaps to states, municipalities and their authorities and other entities in connection with their financings. Ambac Financial Services manages its business with the goal of being market neutral to changes in overall interest rates, while seeking to profit from retaining some basis risk. Ambac’s municipal interest rate swap portfolio may be adversely affected by changes in basis. If actual or projected tax-exempt interest rates change in relation to taxable interest rates, Ambac will experience a mark-to-market gain or loss. Most municipal interest rate swaps transacted by Ambac Financial Services contain provisions that are designed to protect Ambac against certain forms of tax reform, thus mitigating its basis risk. The estimation of potential losses arising from adverse changes in market relationships, known as VaR, is a key element in management’s monitoring of basis risk for the municipal interest rate swap portfolio. Ambac has developed a VaR methodology to estimate potential losses over a specified holding period and based on certain probabilistic assessments. Ambac’s methodology estimates VaR using a 300-day historical “look back” period. This means that changes in market values are simulated using market inputs from the past 300 days. For the years ended December 31, 2002 and 2001, Ambac’s VaR, for its interest rate swap portfolio, calculated at a ninety-nine percent confidence level, averaged approximately $0.7 million and $0.9 million, respectively. Ambac’s VaR ranged from a high of $1.5 million to a low of $0.3 million in 2002, and from a high of $1.9 million to a low of $0.4 million in 2001. Ambac supplements its VaR methodology, which is a good risk management tool in normal markets, by performing rigorous stress testing to measure the potential for losses in abnormally volatile markets. The stress tests include (i) parallel and non-parallel shifts in the yield curve and (ii) immediate changes in normal basis relationships, such as those between taxable and tax-exempt markets.
Financial instruments that may be adversely affected by changes in credit spreads include Ambac’s outstanding structured credit derivative contracts. Ambac, through its affiliate Ambac Credit Products, enters into structured credit derivative contracts. These contracts require Ambac Credit Products to make payments upon the occurrence of certain defined credit events relating to an underlying obligation (generally a fixed income obligation). If credit spreads of the underlying obligations change, the market value of the related structured credit derivative changes. As such, Ambac Credit Products could experience mark-to-market gains or losses. Market liquidity could also impact valuations. Changes in credit spreads are generally caused by changes in the market’s perception of the credit quality of the underlying obligations. Ambac Credit Product’s structures its contracts with partial hedges from various financial institutions or with first loss protection. Such structuring mitigates Ambac Credit Product’s risk of loss and reduces the price volatility of these financial instruments. Personnel in Ambac’s Structured Finance Surveillance group monitor credit spread risk. Additionally, management models the potential impact of credit spread changes on the value of its contracts. The following table summarizes the estimated change in fair value (based primarily on the valuation models discussed above) on the net
40
Management’s Discussion and Analysis
of Financial Condition and Results of Operations
balance of Ambac’s net structured credit derivative position assuming immediate changes in credit spreads at specified levels at December 31, 2002 and 2001:
Change in Credit Spreads
| | Estimated Net Fair Value
| | | Estimated Gain/(Loss)
| |
| | | (Dollars in Millions) | |
2002: | | | | | | | | |
75 basis point widening | | $ | (60 | ) | | $ | (29 | ) |
50 basis point widening | | | (50 | ) | | | (19 | ) |
25 basis point widening | | | (41 | ) | | | (10 | ) |
Base scenario | | | (31 | ) | | | — | |
25 basis point narrowing | | | (28 | ) | | | 3 | |
50 basis point narrowing | | | (24 | ) | | | 7 | |
75 basis point narrowing | | | (22 | ) | | | 9 | |
| | |
|
|
| |
|
|
|
2001: | | | | | | | | |
75 basis point widening | | $ | (26 | ) | | $ | (18 | ) |
50 basis point widening | | | (19 | ) | | | (11 | ) |
25 basis point widening | | | (13 | ) | | | (5 | ) |
Base scenario | | | (8 | ) | | | — | |
25 basis point narrowing | | | (7 | ) | | | 1 | |
50 basis point narrowing | | | (5 | ) | | | 3 | |
75 basis point narrowing | | | (3 | ) | | | 5 | |
| | |
|
|
| |
|
|
|
Other financial instruments that may be adversely affected by changes in credit spreads include certain total return swap contracts, which are entered into by Ambac through its affiliate, Ambac Capital Services. These contracts require Ambac Capital Services to pay a specified spread in excess of LIBOR in exchange for receiving the total return of an underlying fixed income obligation over a specified period of time. If credit spreads of the underlying obligations change, the market value of the related total return swaps changes and Ambac Capital Services could experience mark-to-market gains or losses. For the year ended December 31, 2002, the estimated unrealized losses for Ambac’s total return swap portfolio for a 25 basis point and 50 basis point widening of credit spreads were $7.3 million and $14.0 million, respectively. For the year ended December 31, 2002 the estimated unrealized gains for Ambac’s total return swap portfolio for a 25 basis point and 50 basis point narrowing were $7.2 million and $11.1 million, respectively.
Liquidity Risk. Liquidity risk relates to the possible inability to satisfy contractual obligations when due. This risk is present in financial guarantee contracts, structured credit derivatives, investment agreements, interest rate swaps and futures contracts. Ambac Assurance manages its liquidity risk by maintaining a comprehensive daily analysis of projected cash flows. Additionally, Ambac Assurance maintains a minimum level of cash and short-term investments at all times. Ambac Credit Products manage the liquidity risk inherent in the structured credit derivative portfolio by holding cash and short-term investments and closely matching the dates that derivative payments are made and received. The investment agreement business manages liquidity risk by matching the maturity schedules of its invested assets, including hedges, with the maturity schedules of its investment agreement liabilities. Additionally, Ambac’s policy is to maintain a minimum level of cash and short-term assets equivalent to a specified percentage of its investment agreement liabilities outstanding. Ambac Financial Services maintains cash and short-term investments, closely matches the dates swap payments are made and received, and limits the amount of risk hedged with futures contracts. See additional discussion in “Liquidity and Capital Resources” section.
Operational Risk. Operational risk relates to the potential for loss caused by a breakdown in information, communication and settlement systems. Ambac mitigates operational risk by maintaining systems (and system backup) and procedures to monitor transactions and positions, documentation and confirmation of transactions, and compliance with regulations.
Legal Risk. Legal risks attendant to Ambac’s businesses include uncertainty with respect to the enforceability of the obligations insured by Ambac Assurance and the security therefore, as well as uncertainty with respect to the enforceability of the obligations of Ambac’s counterparties, including contractual provisions intended to reduce exposure by providing for the offsetting or netting of mutual obligations. Ambac seeks to remove or minimize such uncertainties through continuous consultation with internal and external legal advisers to analyze and understand the nature of legal risk, to improve documentation and to strengthen transaction structure.
41
Report on Management’s Responsibilities
The management of Ambac Financial Group, Inc. is responsible for the integrity and objectivity of the consolidated financial statements and all other financial information presented in this Annual Report and for assuring that such information fairly presents the consolidated financial position and operating results of Ambac Financial Group, Inc. The accompanying consolidated financial statements have been prepared in conformity with accounting principles generally accepted in the United States of America using management’s best estimates and judgment. The financial information presented elsewhere in this Annual Report is consistent with that in the consolidated financial statements.
Ambac Financial Group, Inc. maintains a system of internal accounting controls designed to provide reasonable assurance that assets are safeguarded against loss or unauthorized use and that the financial records are reliable for use in preparing financial statements and maintaining accountability of assets. Qualified and professional financial personnel maintain and monitor these internal controls on a continuous basis. The concept of reasonable assurance is based on the recognition that the cost of a system of internal control should not exceed the related benefits.
Ambac Financial Group, Inc.’s consolidated financial statements have been audited by KPMG LLP, independent auditors, whose audits were made in accordance with auditing standards generally accepted in the United States of America and included a review of internal accounting controls to the extent necessary to express an opinion on the fairness of the consolidated financial statements.
The Audit Committee of the Board of Directors, comprised solely of outside directors, meets regularly with financial and risk management, the independent auditors and the internal auditors to review the work and procedures of each. The independent auditors and the internal auditors have free access to the Audit Committee, without the presence of management, to discuss the results of their work and their considerations of Ambac and its subsidiaries and the quality of Ambac Financial Group, Inc.’s financial reporting. The Board of Directors, upon recommendation of the Audit Committee, appoints the independent auditors, subject to stockholder approval.
/S/ PHILLIP B. LASSITER
Phillip B. Lassiter
Chairman and Chief Executive Officer
/S/ THOMAS J. GANDOLFO
Thomas J. Gandolfo
Senior Vice President and Chief Financial Officer
January 21, 2003
Independent Auditors’ Report
To the Board of Directors and Stockholders
Ambac Financial Group, Inc.
We have audited the accompanying Consolidated Balance Sheets of Ambac Financial Group, Inc. and subsidiaries as of December 31, 2002 and 2001, and the related Consolidated Statements of Operations, Stockholders’ Equity and Cash Flows for each of the years in the three-year period ended December 31, 2002. These consolidated financial statements are the responsibility of Ambac Financial Group, Inc.’s management. Our responsibility is to express an opinion on these consolidated financial statements based on our audits.
We conducted our audits in accordance with auditing standards generally accepted in the United States of America. Those standards require that we plan and perform the audit to obtain reasonable assurance about whether the financial statements are free of material misstatement. An audit includes examining, on a test basis, evidence supporting the amounts and disclosures in the financial statements. An audit also includes assessing the accounting principles used and significant estimates made by management, as well as evaluating the overall financial statement presentation. We believe that our audits provide a reasonable basis for our opinion.
In our opinion, the consolidated financial statements referred to above present fairly, in all material respects, the financial position of Ambac Financial Group, Inc. and subsidiaries as of December 31, 2002 and 2001, and the results of their operations and their cash flows for each of the years in the three-year period ended December 31, 2002 in conformity with accounting principles generally accepted in the United States of America.
/S/ KPMG LLP
KPMG LLP
New York, New York
January 21, 2003
42
Consolidated Balance Sheets
Ambac Financial Group, Inc. and Subsidiaries
| | | December 31,
| |
| | | 2002
| | | 2001
| |
| | | (Dollars in Thousands, Except Share Amounts) | |
ASSETS: | | | | | | | | |
Investments: | | | | | | | | |
Fixed income securities, at fair value (amortized cost of $11,133,313 in 2002 and $8,355,596 in 2001) | | $ | 11,597,623 | | | $ | 8,469,157 | |
Fixed income securities pledged as collateral, at fair value (amortized cost of $537,711 in 2002 and $1,393,193 in 2001) | | | 543,572 | | | | 1,401,528 | |
Short-term investments, at cost (approximates fair value) | | | 395,761 | | | | 415,002 | |
Other, at fair value | | | 2,354 | | | | 2,163 | |
| | |
|
|
| |
|
|
|
Total investments | | | 12,539,310 | | | | 10,287,850 | |
Cash | | | 25,816 | | | | 76,580 | |
Securities purchased under agreements to resell | | | 260,818 | | | | 11,200 | |
Receivable for investment agreements | | | 169 | | | | 4,101 | |
Receivable for securities sold | | | 6,936 | | | | 8,922 | |
Investment income due and accrued | | | 142,406 | | | | 157,408 | |
Reinsurance recoverable on paid and unpaid losses | | | 4,842 | | | | 1,021 | |
Prepaid reinsurance | | | 296,126 | | | | 267,655 | |
Deferred acquisition costs | | | 174,055 | | | | 163,477 | |
Loans | | | 843,809 | | | | 901,194 | |
Derivative product assets | | | 1,010,081 | | | | 383,959 | |
Other assets | | | 51,170 | | | | 76,176 | |
| | |
|
|
| |
|
|
|
Total assets | | $ | 15,355,538 | | | $ | 12,339,543 | |
| | |
|
|
| |
|
|
|
LIABILITIES AND STOCKHOLDERS’ EQUITY: | | | | | | | | |
Liabilities: | | | | | | | | |
Unearned premiums | | $ | 2,128,847 | | | $ | 1,780,272 | |
Losses and loss adjustment expense reserve | | | 172,137 | | | | 151,114 | |
Ceded reinsurance balances payable | | | 16,930 | | | | 10,146 | |
Obligations under investment and payment agreements | | | 6,434,497 | | | | 4,089,777 | |
Obligations under investment repurchase agreements | | | 848,358 | | | | 1,422,151 | |
Securities sold under agreement to repurchase | | | 132,235 | | | | 425,000 | |
Deferred income taxes | | | 185,641 | | | | 123,077 | |
Current income taxes | | | 44,807 | | | | 98,145 | |
Debentures | | | 616,715 | | | | 619,315 | |
Accrued interest payable | | | 81,252 | | | | 84,225 | |
Derivative product liabilities | | | 836,146 | | | | 314,583 | |
Other liabilities | | | 154,640 | | | | 175,135 | |
Payable for securities purchased | | | 78,154 | | | | 62,915 | |
| | |
|
|
| |
|
|
|
Total liabilities | | | 11,730,359 | | | | 9,355,855 | |
| | |
|
|
| |
|
|
|
Stockholders’ equity: | | | | | | | | |
Preferred stock, par value $0.01 per share; authorized shares—4,000,000; issued and outstanding shares—none | | | — | | | | — | |
Common stock, par value $0.01 per share; authorized shares— 200,000,000 at December 31, 2002 and December 31, 2001; issued shares—106,211,467 at December 31, 2002 and 106,020,537 at December 31, 2001 | | | 1,062 | | | | 1,060 | |
Additional paid-in capital | | | 550,289 | | | | 538,135 | |
Accumulated other comprehensive income | | | 265,427 | | | | 62,476 | |
Retained earnings | | | 2,820,281 | | | | 2,403,473 | |
Common stock held in treasury at cost, 220,876 shares at December 31, 2002 and 436,488 at December 31, 2001 | | | (11,880 | ) | | | (21,456 | ) |
| | |
|
|
| |
|
|
|
Total stockholders’ equity | | | 3,625,179 | | | | 2,983,688 | |
| | |
|
|
| |
|
|
|
Total liabilities and stockholders’ equity | | $ | 15,355,538 | | | $ | 12,339,543 | |
| | |
|
|
| |
|
|
|
See accompanying Notes to Consolidated Financial Statements.
43
Consolidated Statements of Operations
Ambac Financial Group, Inc. and Subsidiaries
| | | Years Ended December 31,
| |
| | | 2002
| | | 2001
| | | 2000
| |
| | | (Dollars in Thousands Except Share Amounts) | |
REVENUES: | | | | | | | | | | | | |
Financial Guarantee: | | | | | | | | | | | | |
Gross premiums written | | $ | 904,032 | | | $ | 683,296 | | | $ | 483,082 | |
Ceded premiums written | | | (113,542 | ) | | | (95,534 | ) | | | (80,789 | ) |
| | |
|
|
| |
|
|
| |
|
|
|
Net premiums written | | $ | 790,490 | | | $ | 587,762 | | | $ | 402,293 | |
| | |
|
|
| |
|
|
| |
|
|
|
Net premiums earned | | $ | 471,534 | | | $ | 378,734 | | | $ | 311,276 | |
Other credit enhancement fees | | | 28,775 | | | | 21,661 | | | | 12,157 | |
| | |
|
|
| |
|
|
| |
|
|
|
Net premiums earned and other credit enhancement fees | | | 500,309 | | | | 400,395 | | | | 323,433 | |
Net investment income | | | 297,297 | | | | 267,847 | | | | 241,047 | |
Net realized investment gains | | | 40,918 | | | | 2,124 | | | | 681 | |
Net unrealized losses on credit derivative contracts | | | (27,877 | ) | | | (3,588 | ) | | | (4,111 | ) |
Other income | | | 5,531 | | | | 5,180 | | | | 4,371 | |
Financial Services: | | | | | | | | | | | | |
Interest from investment and payment agreements | | | 255,007 | | | | 249,903 | | | | 303,165 | |
Other revenue | | | 30,550 | | | | 37,770 | | | | 42,513 | |
Net realized investment losses | | | (134,097 | ) | | | (3,026 | ) | | | (9,110 | ) |
Net unrealized losses on derivative hedge contracts | | | (839 | ) | | | — | | | | — | |
Corporate: | | | | | | | | | | | | |
Net investment income | | | 3,537 | | | | 3,426 | | | | 2,137 | |
Other revenue | | | — | | | | 901 | | | | 179 | |
Net realized investment gains (losses) | | | 1,482 | | | | (564 | ) | | | 8 | |
| | |
|
|
| |
|
|
| |
|
|
|
Total revenues | | | 971,818 | | | | 960,368 | | | | 904,313 | |
| | |
|
|
| |
|
|
| |
|
|
|
EXPENSES: | | | | | | | | | | | | |
Financial Guarantee: | | | | | | | | | | | | |
Losses and loss adjustment expenses | | | 26,700 | | | | 20,000 | | | | 15,000 | |
Underwriting and operating expenses | | | 76,548 | | | | 67,989 | | | | 55,235 | |
Financial Services: | | | | | | | | | | | | |
Interest from investment and payment agreements | | | 231,304 | | | | 235,448 | | | | 283,003 | |
Other expenses | | | 22,182 | | | | 21,815 | | | | 24,805 | |
Interest | | | 43,724 | | | | 40,442 | | | | 37,477 | |
Corporate | | | 7,170 | | | | 5,947 | | | | 6,669 | |
| | |
|
|
| |
|
|
| |
|
|
|
Total expenses | | | 407,628 | | | | 391,641 | | | | 422,189 | |
| | |
|
|
| |
|
|
| |
|
|
|
Income before income taxes | | | 564,190 | | | | 568,727 | | | | 482,124 | |
Provision for income taxes | | | 131,596 | | | | 135,821 | | | | 115,952 | |
| | |
|
|
| |
|
|
| |
|
|
|
Net income | | $ | 432,594 | | | $ | 432,906 | | | $ | 366,172 | |
| | |
|
|
| |
|
|
| |
|
|
|
Net income per share: | | | | | | | | | | | | |
Basic | | $ | 4.08 | | | $ | 4.10 | | | $ | 3.49 | |
Diluted | | $ | 3.97 | | | $ | 3.97 | | | $ | 3.41 | |
| | |
|
|
| |
|
|
| |
|
|
|
Weighted average number of common shares outstanding: | | | | | | | | | | | | |
Basic | | | 105,951,603 | | | | 105,705,957 | | | | 105,031,473 | |
Diluted | | | 109,066,046 | | | | 108,948,133 | | | | 107,415,430 | |
| | |
|
|
| |
|
|
| |
|
|
|
See accompanying Notes to Consolidated Financial Statements.
44
Consolidated Statements of Stockholders’ Equity
Ambac Financial Group, Inc. and Subsidiaries
| | | Years Ended December 31,
| |
| | | 2002
| | | | | | 2001
| | | | | | 2000
| | | | |
| | | (Dollars in Thousands) | |
RETAINED EARNINGS: | | | | | | | | | | | | | | | | | | | | | | | | |
Balance at January 1 | | $ | 2,403,473 | | | | | | | $ | 2,035,209 | | | | | | | $ | 1,713,446 | | | | | |
Net income | | | 432,594 | | | $ | 432,594 | | | | 432,906 | | | $ | 432,906 | | | | 366,172 | | | $ | 366,172 | |
| | | | | | |
|
|
| | | | | |
|
|
| | | | | |
|
|
|
Dividends declared—common stock | | | (40,251 | ) | | | | | | | (35,937 | ) | | | | | | | (32,213 | ) | | | | |
Exercise of stock options | | | 24,465 | | | | | | | | (28,705 | ) | | | | | | | (12,196 | ) | | | | |
| | |
|
|
| | | | | |
|
|
| | | | | |
|
|
| | | | |
Balance at December 31 | | $ | 2,820,281 | | | | | | | $ | 2,403,473 | | | | | | | $ | 2,035,209 | | | | | |
| | |
|
|
| | | | | |
|
|
| | | | | |
|
|
| | | | |
ACCUMULATED OTHER COMPREHENSIVE INCOME (LOSS): | | | | | | | | | | | | | | | | | | | | | | | | |
Balance at January 1 | | $ | 62,476 | | | | | | | $ | 45,154 | | | | | | | $ | (187,540 | ) | | | | |
Unrealized gains on securities, $339,039, $39,542, and $373,291, pre-tax in 2002, 2001 and 2000, respectively(1) | | | | | | | 214,943 | | | | | | | | 23,643 | | | | | | | | 234,178 | |
Cumulative effect of accounting change | | | | | | | — | | | | | | | | (880 | ) | | | | | | | — | |
Loss on derivative hedges | | | | | | | (14,171 | ) | | | | | | | (4,371 | ) | | | | | | | — | |
Foreign currency gain (loss) | | | | | | | 2,179 | | | | | | | | (1,070 | ) | | | | | | | (1,484 | ) |
| | | | | | |
|
|
| | | | | |
|
|
| | | | | |
|
|
|
Other comprehensive income | | | 202,951 | | | | 202,951 | | | | 17,322 | | | | 17,322 | | | | 232,694 | | | | 232,694 | |
| | |
|
|
| |
|
|
| |
|
|
| |
|
|
| |
|
|
| |
|
|
|
Total comprehensive income | | | | | | $ | 635,545 | | | | | | | $ | 450,228 | | | | | | | $ | 598,866 | |
| | | | | | |
|
|
| | | | | |
|
|
| | | | | |
|
|
|
Balance at December 31 | | $ | 265,427 | | | | | | | $ | 62,476 | | | | | | | $ | 45,154 | | | | | |
| | |
|
|
| | | | | |
|
|
| | | | | |
|
|
| | | | |
PREFERRED STOCK: | | | | | | | | | | | | | | | | | | | | | | | | |
Balance at January 1 and December 31 | | $ | — | | | | | | | $ | — | | | | | | | $ | — | | | | | |
| | |
|
|
| | | | | |
|
|
| | | | | |
|
|
| | | | |
COMMON STOCK: | | | | | | | | | | | | | | | | | | | | | | | | |
Balance at January 1 | | $ | 1,060 | | | | | | | $ | 1,060 | | | | | | | $ | 707 | | | | | |
Issuance of stock | | | 2 | | | | | | | | — | | | | | | | | — | | | | | |
Stock split effected as dividend | | | — | | | | | | | | — | | | | | | | | 353 | | | | | |
| | |
|
|
| | | | | |
|
|
| | | | | |
|
|
| | | | |
Balance at December 31 | | $ | 1,062 | | | | | | | $ | 1,060 | | | | | | | $ | 1,060 | | | | | |
| | |
|
|
| | | | | |
|
|
| | | | | |
|
|
| | | | |
ADDITIONAL PAID-IN CAPITAL: | | | | | | | | | | | | | | | | | | | | | | | | |
Balance at January 1 | | $ | 538,135 | | | | | | | $ | 533,558 | | | | | | | $ | 525,012 | | | | | |
Exercise of stock options | | | 16,320 | | | | | | | | 13,045 | | | | | | | | 8,899 | | | | | |
Issuance of stock | | | 4,287 | | | | | | | | — | | | | | | | | — | | | | | |
Capital issuance costs | | | (8,453 | ) | | | | | | | (8,468 | ) | | | | | | | — | | | | | |
Stock split effected as dividend | | | — | | | | | | | | — | | | | | | | | (353 | ) | | | | |
| | |
|
|
| | | | | |
|
|
| | | | | |
|
|
| | | | |
Balance at December 31 | | $ | 550,289 | | | | | | | $ | 538,135 | | | | | | | $ | 533,558 | | | | | |
| | |
|
|
| | | | | |
|
|
| | | | | |
|
|
| | | | |
COMMON STOCK HELD IN TREASURY AT COST: | | | | | | | | | | | | | | | | | | | | | | | | |
Balance at January 1 | | $ | (21,456 | ) | | | | | | $ | (18,867 | ) | | | | | | $ | (33,175 | ) | | | | |
Cost of shares acquired | | | (41,101 | ) | | | | | | | (40,876 | ) | | | | | | | (23,618 | ) | | | | |
Shares issued under equity plans | | | 50,677 | | | | | | | | 38,287 | | | | | | | | 37,926 | | | | | |
| | |
|
|
| | | | | |
|
|
| | | | | |
|
|
| | | | |
Balance at December 31 | | $ | (11,880 | ) | | | | | | $ | (21,456 | ) | | | | | | $ | (18,867 | ) | | | | |
| | |
|
|
| | | | | |
|
|
| | | | | |
|
|
| | | | |
TOTAL STOCKHOLDERS’ EQUITY AT DECEMBER 31 | | $ | 3,625,179 | | | | | | | $ | 2,983,688 | | | | | | | $ | 2,596,114 | | | | | |
| | |
|
|
| | | | | |
|
|
| | | | | |
|
|
| | | | |
(1) Disclosure of reclassification amount: | | | | | | | | | | | | | | | | | | | | | | | | |
Unrealized holding gains arising during period | | $ | 154,065 | | | | | | | $ | 25,817 | | | | | | | $ | 230,985 | | | | | |
Less: reclassification adjustment for net (losses) gains included in net income | | | (60,878 | ) | | | | | | | 2,174 | | | | | | | | (3,193 | ) | | | | |
| | |
|
|
| | | | | |
|
|
| | | | | |
|
|
| | | | |
Net unrealized gains on securities | | $ | 214,943 | | | | | | | $ | 23,643 | | | | | | | $ | 234,178 | | | | | |
| | |
|
|
| | | | | |
|
|
| | | | | |
|
|
| | | | |
See accompanying Notes to Consolidated Financial Statements.
45
Consolidated Statements of Cash Flows
Ambac Financial Group, Inc. and Subsidiaries
| | | Years Ended December 31,
| |
| | | 2002
| | | 2001
| | | 2000
| |
| | | (Dollars in Thousands) | |
CASH FLOWS FROM OPERATING ACTIVITIES: | | | | | | | | | | | | |
Net income | | $ | 432,594 | | | $ | 432,906 | | | $ | 366,172 | |
Adjustments to reconcile net income to net cash provided by operating activities: | | | | | | | | | | | | |
Depreciation and amortization | | | 3,466 | | | | 3,479 | | | | 3,614 | |
Amortization of bond premium and discount | | | 8,872 | | | | (15,916 | ) | | | (12,972 | ) |
Current income taxes | | | (53,338 | ) | | | 72,517 | | | | 797 | |
Deferred income taxes | | | (52,110 | ) | | | 4,991 | | | | 24,300 | |
Deferred acquisition costs | | | (10,578 | ) | | | (10,053 | ) | | | (18,100 | ) |
Unearned premiums, net | | | 320,104 | | | | 208,931 | | | | 90,587 | |
Losses and loss adjustment expenses | | | 17,202 | | | | 18,739 | | | | 10,379 | |
Ceded reinsurance balances payable | | | 6,784 | | | | (746 | ) | | | (4,136 | ) |
Investment income due and accrued | | | 15,002 | | | | (26,716 | ) | | | (2,024 | ) |
Accrued interest payable | | | (2,973 | ) | | | (6,350 | ) | | | (567 | ) |
Net realized investment losses | | | 91,697 | | | | 1,466 | | | | 8,421 | |
Net unrealized losses on credit derivative contracts and derivative hedge contracts | | | 28,716 | | | | 3,588 | | | | 4,111 | |
Other, net | | | 50 | | | | (15,005 | ) | | | 10,746 | |
| | |
|
|
| |
|
|
| |
|
|
|
Net cash provided by operating activities | | | 805,488 | | | | 671,831 | | | | 481,328 | |
| | |
|
|
| |
|
|
| |
|
|
|
CASH FLOWS FROM INVESTING ACTIVITIES: | | | | | | | | | | | | |
Proceeds from sales of bonds | | | 3,380,488 | | | | 2,243,276 | | | | 1,636,904 | |
Proceeds from matured bonds | | | 2,204,670 | | | | 2,538,173 | | | | 1,843,482 | |
Purchases of bonds | | | (7,588,477 | ) | | | (6,497,633 | ) | | | (2,502,176 | ) |
Change in short-term investments | | | 19,241 | | | | (161,483 | ) | | | (32,623 | ) |
Securities purchased under agreements to resell | | | (249,618 | ) | | | 244,586 | | | | (152,786 | ) |
Securities sold under agreements to repurchase | | | (292,637 | ) | | | 425,000 | | | | — | |
Loans | | | 57,385 | | | | (205,943 | ) | | | (9,763 | ) |
Other, net | | | (37,456 | ) | | | 12,580 | | | | (6,553 | ) |
| | |
|
|
| |
|
|
| |
|
|
|
Net cash (used in) provided by investing activities | | | (2,506,404 | ) | | | (1,401,444 | ) | | | 776,485 | |
| | |
|
|
| |
|
|
| |
|
|
|
CASH FLOWS FROM FINANCING ACTIVITIES: | | | | | | | | | | | | |
Dividends paid | | | (40,251 | ) | | | (35,937 | ) | | | (32,213 | ) |
Proceeds from issuance of investment agreements | | | 3,585,538 | | | | 3,044,900 | | | | 1,637,935 | |
Payments for investment agreement draws | | | (2,143,557 | ) | | | (2,423,516 | ) | | | (2,855,766 | ) |
Proceeds from issuance of debentures | | | — | | | | 193,700 | | | | — | |
Payment agreements | | | 243,009 | | | | 175 | | | | 9,763 | |
Payment for buyback of debentures | | | — | | | | (7,500 | ) | | | — | |
Capital issuance costs | | | (8,452 | ) | | | (8,468 | ) | | | — | |
Issuance of common stock | | | 4,289 | | | | — | | | | — | |
Purchases of treasury stock | | | (41,101 | ) | | | (40,876 | ) | | | (23,618 | ) |
Proceeds from sale of treasury stock | | | 50,677 | | | | 38,287 | | | | 37,926 | |
| | |
|
|
| |
|
|
| |
|
|
|
Net cash provided by (used in) financing activities | | | 1,650,152 | | | | 760,765 | | | | (1,225,973 | ) |
| | |
|
|
| |
|
|
| |
|
|
|
NET CASH FLOW | | | (50,764 | ) | | | 31,152 | | | | 31,840 | |
Cash and cash pledged as collateral at January 1 | | | 76,580 | | | | 45,428 | | | | 13,588 | |
| | |
|
|
| |
|
|
| |
|
|
|
Cash and cash pledged as collateral at December 31 | | $ | 25,816 | | | $ | 76,580 | | | $ | 45,428 | |
| | |
|
|
| |
|
|
| |
|
|
|
SUPPLEMENTAL DISCLOSURES OF CASH FLOW INFORMATION: | | | | | | | | | | | | |
Cash paid during the year for: | | | | | | | | | | | | |
Income taxes | | $ | 159,500 | | | $ | 45,268 | | | $ | 82,400 | |
| | |
|
|
| |
|
|
| |
|
|
|
Interest expense on debt | | $ | 48,260 | | | $ | 44,632 | | | $ | 34,304 | |
| | |
|
|
| |
|
|
| |
|
|
|
Interest expense on investment agreements | | $ | 218,195 | | | $ | 231,498 | | | $ | 286,589 | |
| | |
|
|
| |
|
|
| |
|
|
|
See accompanying Notes to Consolidated Financial Statements.
46
Notes to Consolidated Financial Statements
(Dollar Amounts in Thousands, Except Share Amounts)
1 BACKGROUND
Ambac Financial Group, Inc. is a holding company whose subsidiaries provide financial guarantees and financial services to clients in both the public and private sectors around the world. Ambac’s principal operating subsidiary, Ambac Assurance Corporation, a leading provider of financial guarantees for public finance and structured finance obligations, has earned triple-A ratings, the highest ratings available from Moody’s Investors Service, Inc., Standard & Poor’s Ratings Services, Fitch Inc., and Rating and Investment Information, Inc. Ambac’s Financial Services segment provides financial and investment products including investment agreements, interest rate swaps, funding conduits, investment advisory and cash management services, principally to its clients which include municipalities and other public entities, school districts, health care organizations and asset-backed issuers.
2 SIGNIFICANT ACCOUNTING POLICIES
The accompanying consolidated financial statements of Ambac and subsidiaries have been prepared on the basis of accounting principles generally accepted in the United States of America (“GAAP”). The preparation of financial statements in conformity with GAAP requires management to make estimates and assumptions that affect the reported amounts of assets and liabilities and disclosures of contingent assets and liabilities at the date of the financial statements and the reported revenues and expenses during the reporting period. Actual results could differ from those estimates. The significant accounting policies of Ambac are described below:
Consolidation:The consolidated financial statements include the accounts of Ambac and its subsidiaries. All significant inter-company balances have been eliminated.
Investments:Ambac’s investment portfolio is accounted for on a trade-date basis and consists primarily of investments in fixed income securities that are considered available-for-sale and are carried at fair value. Fair value is based primarily on quotes obtained from independent market sources. When quotes are not available, valuation models are used to estimate fair value. These models include estimates, made by management, which utilize current market information. The valuation results from these models could differ materially from amounts that would actually be realized in the market. Short-term investments are carried at cost, which approximates fair value. Unrealized gains and losses, net of deferred income taxes, are included as a component of “Accumulated Other Comprehensive Income (Loss)” in stockholders’ equity and are computed using amortized cost as the basis. If management believes that an unrealized loss is “other than temporary,” the carrying value of the investment is reduced and a realized investment loss is recorded in the Consolidated Statement of Operations. For purposes of computing amortized cost, premiums and discounts are accounted for using the interest method. For bonds purchased at a price below par value, discounts are accreted over the remaining term of the securities. For bonds purchased at a price above par value that have call features, premiums are amortized to the most likely call dates as determined by management. For premium bonds that do not have call features, such premiums are amortized over the remaining terms of the securities. Premiums and discounts on mortgage-backed and asset-backed securities are adjusted for the effects of actual and anticipated prepayments. Realized gains and losses on the sale of investments are determined on the basis of specific identification.
Securities Purchased under Agreements to Resell and Securities Sold Under Agreements to Repurchase:Securities purchased under agreements to resell are collateralized investment transactions, and are recorded at their contracted resale amounts, plus accrued interest. Ambac takes possession of the collateral underlying those agreements and monitors its market value on a daily basis and, when necessary, requires prompt transfer of additional collateral to reflect current market value. Securities sold under agreements to repurchase are collateralized financing transactions, and are recorded at their contracted resale amounts, plus accrued interest. Ambac nets securities purchased under agreements to resell and securities sold under agreements to repurchase that are executed with the same counterparty under legally enforceable netting agreements that meet the applicable netting criteria. At December 31, 2002 and 2001, collateral underlying securities purchased under agreements to resell had an average credit rating of triple-A. These agreements have a weighted average maturity of less than 30 days.
Deferred Acquisition Costs:Certain financial guarantee costs incurred, primarily related to the production of business, have been deferred. These costs include direct and indirect expenses related to underwriting, marketing and policy issuance, rating agency fees and premium taxes, net of reinsurance ceding commissions. The deferred acquisition costs are being amortized over the periods in which the related premiums are earned, and such amortization amounted to $32,336, $28,203 and $22,472 for 2002, 2001 and 2000, respectively. Deferred acquisition costs, net of such amortization, amounted to $10,578, $10,053 and $18,100 for 2002, 2001 and 2000, respectively.
47
Loans:Loans are reported at their outstanding unpaid principal balances, net of any deferred fees and fair value hedge adjustments. These fair value hedge adjustments are discussed further in “Derivative Contracts used for Hedging Purposes” below. Interest income is accrued on the unpaid principal balance. Deferred fees are amortized to income over the contractual life of the loan using the interest method or the straight-line method if not materially different.
Losses and Loss Adjustment Expense Reserve:The reserve for losses and loss adjustment expenses consists of the active credit reserve and case basis loss and loss adjustment expense reserves. The active credit reserve is established based upon probable debt service defaults from incurred losses, as a result of credit deterioration. Reserve amounts are reasonably estimated based on managements review of each credit. When defaults occur, case basis credit loss reserves are established in an amount that is sufficient to cover the present value of the anticipated defaulted debt service payments over the expected period of default and estimated expenses associated with settling the claims, less estimated recoveries under salvage or subrogation rights. These reserves are discounted in accordance with discount rates prescribed or permitted by state regulatory authorities. During 2002, 2001 and 2000, paid losses were $11,143, $2,595, and $4,622, respectively. All or parts of case basis loss reserves are allocated from any active credit reserves available. During 2002, 2001 and 2000, salvage amounts received were $553, $1,333 and $0, respectively.
Management believes that the reserves for losses and loss adjustment expenses are adequate to cover the ultimate net cost of claims, but the reserves are necessarily based on estimates and there can be no assurance that the ultimate liability will not exceed such estimates.
Obligations under Investment and Payment Agreements and Investment Repurchase Agreements:Obligations under investment and payment agreements and investment repurchase agreements are recorded as liabilities on the Consolidated Balance Sheets at the face value of the agreement. The carrying value of these obligations is adjusted for draws paid and interest credited to the account as well as any fair value hedge adjustments. These fair value hedge adjustments are discussed further in “Derivative Contracts used for Hedging Purposes” below. Unsettled agreements are accrued on a trade-date basis on the Consolidated Balance Sheets at the time of commitment. Interest expense is computed based upon daily outstanding settled liability balances at rates and periods specified in the agreements. Net interest income relating to investment and payment agreements and investment repurchase agreements is included as a component of Financial Services revenue.
Net Premiums Earned:Up-front insurance premiums written are received for an entire bond issue. A bond issue may contain several maturities. The premium is allocated to each bond maturity proportionally, based on total principal amount guaranteed and is recognized on a straight-line basis over the term of each maturity. Installment insurance premiums written are recognized over each installment period, generally one year or less. When an issue insured by Ambac Assurance has been refunded or called, the remaining unrecognized premium (net of refunding credits, if any) is recognized at that time.
Financial Services Revenue:Ambac’s Financial Services other revenues includes the following products:
Interest rate swaps and total return swaps—Ambac provides interest rate swaps principally to states, municipalities and municipal authorities in connection with their financings. Ambac also enters into total return swaps with various financial institutions. All interest rate swaps and total return swap revenues are accounted for as “Derivative Contracts Held for Trading Purposes,” which is discussed in the Derivatives section below.
Investment advisory and cash management—Ambac provides investment advisory and administrative services for money market funds that are primarily offered to qualified participants including school districts, health care service providers and municipalities. Cash management services include the distribution of money market funds, as well as the brokering of short-term fixed income securities trades on behalf of Ambac clients. Fees from investment advisory and cash management services are based on percentages of the average daily net assets of the money market funds serviced as well as a broker mark-up on short-term fixed income securities trades. Fees from investment advisory and cash management services are recognized when earned, consistent with the accrual basis of accounting.
Depreciation and Amortization:Depreciation of furniture and fixtures and electronic data processing equipment is charged over the estimated useful lives of the respective assets, ranging from three to five years, using the straight-line method. Amortization of leasehold improvements is charged over the lesser of ten years or the remaining term of the operating leases, ranging from four to ten years, using the straight-line method.
48
Notes to Consolidated Financial Statements
(Dollar Amounts in Thousands, Except Share Amounts)
Postretirement and Postemployment Benefits:Ambac provides various postretirement and postemployment benefits, including pension, and health and life benefits covering substantially all employees who meet certain age and service requirements. Ambac accounts for these benefits under the accrual method of accounting. Amounts related to the defined benefit pension plan and postretirement health benefits are charged based on actuarial determinations.
Foreign Currency:Financial statement accounts expressed in foreign currencies are translated into U.S. dollars in accordance with FAS Statement 52, “Foreign Currency Translation” (“SFAS 52”). Under SFAS 52, functional currency assets and liabilities are translated into U.S. dollars using exchange rates in effect at the balance sheet dates and the related translation adjustments are recorded as a separate component of comprehensive income, net of any related taxes. Functional currencies are generally the currencies of the local operating environment. Income statement accounts expressed in functional currencies are translated using average exchange rates. Foreign currency transaction gains and losses, arising primarily from short-term investment securities denominated in foreign currencies, are reflected in net income. The Consolidated Statements of Operations include pre-tax gains (losses) from such foreign exchange items of $1,485, $(3,389) and $(3,748) for 2002, 2001 and 2000, respectively.
Income Taxes:Ambac files a consolidated Federal income tax return with its subsidiaries. Deferred tax assets and liabilities are recognized for the future tax consequences attributable to differences between the financial statement carrying amounts of existing assets and liabilities and their respective tax bases. Deferred tax assets and liabilities are measured using enacted tax rates expected to apply to taxable income in the years in which those temporary differences are expected to be recovered or settled. The effect on deferred tax assets and liabilities of a change in tax rates is recognized in the period that includes the enactment date.
Stock Compensation Plans:In 1997, Ambac adopted the Ambac 1997 Equity Plan. Under this plan, awards are granted to eligible employees of Ambac in the form of non-qualified stock options or other stock-based awards. Ambac accounts for its incentive stock options and stock-based awards under FAS Statement 123, “Accounting for Stock-Based Compensation” (“SFAS 123”). SFAS 123 permits a company to choose either the fair value based method of accounting as defined in the Statement or the intrinsic value based method of accounting as prescribed by APB Opinion No. 25, “Accounting for Stock Issued to Employees” (“APB 25”), for its stock-based compensation plans. Ambac has elected to account for its plans using the intrinsic value based method for all periods presented. Accordingly, since the fair value of the options at grant date equals the exercise price, no compensation cost has been recognized for its fixed stock option plan. Had compensation cost for Ambac’s stock-based compensation plan been determined consistent with the fair value based method of FAS 123, Ambac’s net income, earnings per share and earnings per diluted share for the years ended December 31, 2002, 2001 and 2000, would have been reduced to the pro-forma amounts indicated below:
| | | 2002
| | 2001
| | 2000
|
Net Income: | | | | | | | | | |
As reported | | $ | 432,594 | | $ | 432,906 | | $ | 366,172 |
Compensation expense, net of tax | | $ | 12,599 | | $ | 13,596 | | $ | 8,591 |
Pro-forma | | $ | 419,995 | | $ | 419,310 | | $ | 357,581 |
Earnings per share: | | | | | | | | | |
As reported | | $ | 4.08 | | $ | 4.10 | | $ | 3.49 |
Pro-forma | | $ | 3.96 | | $ | 3.97 | | $ | 3.40 |
Earnings per diluted share: | | | | | | | | | |
As reported | | $ | 3.97 | | $ | 3.97 | | $ | 3.41 |
Pro-forma | | $ | 3.85 | | $ | 3.85 | | $ | 3.33 |
Derivative Contracts:In June 1998 the Financial Accounting Standards Board (FASB) issued Statement of Financial Accounting Standards (SFAS) 133, “Accounting for Derivative Instruments and Certain Hedging Activities.” In June 2000 the FASB issued SFAS 138, “Accounting for Certain Derivative Instruments and Certain Hedging Activities, an amendment of SFAS 133.” SFAS 133 and SFAS 138 require all derivative instruments be recorded on the balance sheet at their respective fair values. SFAS 133 and SFAS 138 are effective for all fiscal quarters of all fiscal years beginning after June 30, 2000; Ambac adopted SFAS 133 and SFAS 138 on January 1, 2001. In accordance with the transition provisions of SFAS 133, Ambac recorded transition adjustment losses of $880 (net of related income tax) in “Accumulated Other Comprehensive Income” and $408 (net of related income tax) in net income in 2001.
All derivative instruments are recognized in the Consolidated Balance Sheets as either assets or liabilities depending on the rights or obligations under the contracts. All derivative instruments are measured at estimated fair value. The fair values of derivative instruments are determined by broker quotes or valuation models when broker quotes are not available. Valuation models include estimates, made by management, which utilize current market information. The valuation results from these models could differ materially from amounts that would actually be realized in the market.
49
Derivative Contracts used for Hedging Purposes:Interest rate and currency swaps are utilized to hedge exposure to changes in fair value of assets or liabilities resulting from changes in interest rates and foreign exchange rates, respectively. These interest rate and currency swap hedges are referred to as “fair value” hedges. Gains and losses on fair value hedges are recognized currently in net income. The gain or loss on the hedged asset or liability attributable to the hedged risk (interest rate or foreign exchange risk) adjusts the carrying amount of the hedged item and is recognized currently in net income. If the fair value hedge is fully effective, the gain or loss on the interest rate or currency swap will exactly offset the gain or loss on the hedged item. If exact offset is not achieved, the difference would be the effect of hedge ineffectiveness, which is recognized currently in net income. During 2002, the net amount of hedge ineffectiveness, reported in “Net unrealized losses on derivative hedge contracts” in the Consolidated Statements of Operations was a loss of $1,020. In addition, a gain of $5,959 representing the time value component of the derivative instruments was excluded from the assessment of hedge effectiveness and reported in “Financial Services Interest Expense from Investment and Payment Agreements” in the Consolidated Statements of Operations. There was no hedge ineffectiveness reported in net income for 2001 and 2000.
Interest rate swaps are also utilized to hedge the exposure to variable interest rates. These interest rate swap hedges are referred to as “cash flow” hedges. Gains and losses on interest rate swaps designated as cash flow hedges are reported in “Accumulated Other Comprehensive Income” in stockholders’ equity, until earnings are affected by the variability in cash flows of the designated hedged item. During 2002, 2001 and 2000, there was no hedge ineffectiveness reported in net income for cash flow hedges.
Ambac discontinues hedge accounting prospectively when it is determined that the derivative is no longer effective in offsetting changes in the fair value or cash flows of the hedged item, the derivative expires, is sold or terminated. When hedge accounting is discontinued because it is determined that the derivative no longer qualifies as an effective fair value hedge, Ambac continues to carry the derivative on the balance sheet at its fair value, and no longer adjusts the hedged asset or liability for changes in fair value. The adjustment of the carrying amount of the hedged asset or liability is accounted for in the same manner as other components of the carrying amount of that asset or liability. When hedge accounting is discontinued because it is determined that the derivative no longer qualifies as an effective cash flow hedge, Ambac continues to carry the derivative on the balance sheet at its fair value. The net derivative gain or loss related to a discontinued cash flow hedge (recognized during the period of hedge effectiveness) will continue to be reported in Accumulated Other Comprehensive Income and amortized into net income as a yield adjustment to the previously designated asset or liability. If the previously designated asset or liability is sold or matures, the net derivative gain or loss related to a discontinued cash flow hedge reported in Accumulated Other Comprehensive Income will be reclassified into net income immediately. All subsequent changes in fair values of derivatives previously designated as cash flow hedges will be recognized currently in net income. As of December 31, 2002, $660 of deferred losses on derivative instruments reported in Accumulated Other Comprehensive Income are expected to be reclassified to net income during the next twelve months. Transactions and events expected to occur over the next twelve months that will necessitate reclassifying these derivative losses include the repricing of a variable-rate investment agreement.
Derivative Contracts Classified as Held for Trading Purposes:Ambac, through its subsidiary Ambac Financial Services, L.P., provides interest rate swaps to states, municipalities and their authorities, and other entities in connection with their financings. Ambac Capital Services enters into total return swaps with professional counterparties. Total return swaps are only used for fixed income obligations which meet Ambac Assurance’s credit underwriting criteria. Ambac, through its subsidiary Ambac Credit Products LLC, enters into structured credit derivative transactions with various financial institutions. Ambac Financial Services’ interest rate swaps and futures contracts, Ambac Capital Services’ total return swaps and Ambac Credit Products’ structured credit derivatives are classified as held for trading purposes. These contracts are recorded on trade date at fair value. Changes in fair value are recorded as a component of “Financial Services Other Revenue” for interest rate swaps, total return swaps and futures contracts in the accompanying Consolidated Statement of Operations. The fee component of structured credit derivatives is reflected in Other Credit Enhancement Fees in the accompanying Consolidated Statements of Operations. The mark-to-market gain or loss associated with credit spread changes on structured credit derivatives is reflected in Net Unrealized Losses on Credit Derivative Contracts in the accompanying Consolidated Statements of Operations.
All derivative contracts used for hedging purposes and classified as held for trading purposes are recorded on the Consolidated Balance Sheets on a gross basis; assets and liabilities are netted by customer only when a legal right of set-off exists. Gross asset and gross liability balances for all derivatives are recorded as Derivative Product Assets or Derivative Product Liabilities on the Consolidated Balance Sheets.
50
Notes to Consolidated Financial Statements
(Dollar Amounts in Thousands, Except Share Amounts)
Special Purpose Entities:Ambac has transferred third-party debt obligations to two special purpose entities. The business purpose of these entities is to provide some of our financial guarantee clients with funding for their debt obligations. These special purpose entities meet the characteristics of Qualifying Special Purpose Entities (“QSPEs”) in accordance with Statement of Financial Accounting Standards 140, “Accounting for Transfers and Servicing of Financial Assets and Extinguishments of Liabilities.” The QSPEs are not consolidated in Ambac’s consolidated financial statements. The QSPEs are legal entities that are demonstrably distinct from Ambac. Ambac, its affiliates or its agents cannot unilaterally dissolve the QSPEs. The QSPEs permitted activities are limited to (i) purchasing assets from Ambac, which are defined in the governing documents of the QSPEs, (ii) issuing Medium Term Notes (“MTNs”) to fund such purchase, (iii) executing derivative hedges and (iv) providing related administrative services. The QSPEs hold only passive debt obligations transferred to it by Ambac, passive derivative financial instruments used for hedging purposes and cash collected from assets that it holds pending distribution to the MTN holders. The QSPEs do not hold equity or other types of securities that would allow for voting rights, significant influence or contractual options such as the right to unconditionally put or call a financial instrument. The legal documents that established the QSPEs or created the beneficial interests in the transferred assets do not permit the sale or other disposal of the transferred financial assets except for disposals in automatic response to the terms of such financial assets (this would include only issuer call provisions). These required disposals are outside the control of Ambac, its affiliates and the QSPEs. Beneficial interest holders do not have the rights to put their beneficial interest back to the QSPEs.
As of December 31, 2002, there have been 12 individual transactions processed through the QSPEs. In each case, Ambac sells fixed income debt obligations issued by third parties to the QSPEs. Ambac receives cash consideration for all assets transferred to the QSPEs. Ambac surrenders control over the transferred debt obligations. There are no agreements that entitle or obligate Ambac to repurchase or redeem assets. The QSPEs are structured as bankruptcy remote entities. Ambac management believes that the assets transferred represent a true sale and the assets held by the QSPEs are beyond the reach of Ambac and its creditors, even in bankruptcy or other receivership. Legal counsel has concurred with management’s belief and has provided Ambac true sale and non-substantive consolidation opinions. The purchase by the QSPEs is financed through the issuance of MTNs, which are collateralized by the purchased assets. Derivative contracts may be used for hedging purposes only. Derivative hedges are established at the time MTNs are issued to purchase debt obligations. Ambac Assurance may issue a financial guarantee insurance policy on the assets sold, the MTNs issued and the derivative contracts used. As of December 31, 2002, Ambac Assurance had financial guarantee insurance policies issued for all assets owned, MTNs issued and derivative contracts used by the QSPEs.
Ambac’s exposure under these financial guarantee insurance policies is included in the disclosure in Note 12 “Guarantees in Force” to the consolidated financial statements. Pursuant to the terms of Ambac Assurance’s insurance policy, insurance premiums are paid to Ambac Assurance by the QSPEs and are earned in a manner consistent with other insurance policies, over the risk period. Any losses incurred would be included in Ambac’s Consolidated Statements of Operations. To date, no losses have been recognized. Under the terms of an Administrative Agency Agreement, Ambac provides some administrative services, primarily collecting amounts due on the obligations and making interest payments on the MTNs.
Assets sold to the QSPEs during 2002, 2001 and 2000 were $350,000, $793,438 and $159,937, respectively. No gains or losses were recognized on these sales. As of December 31, 2002, the estimated fair value of financial assets, MTN liabilities and derivative hedge liabilities were $1,347,287, $1,263,530 and $90,958, respectively. When market quotes are not available, estimated fair value is determined utilizing valuation models. These models include estimates, made by Ambac management, which utilize current market information. The valuation results from these models could differ materially from amounts that would actually be realized in the market. Ambac Assurance received gross premiums written and other fees for issuing financial guarantee policies on the assets, MTNs and derivative contracts of $19,255, $23,682 and $3,204 for the years ended December 31, 2002, 2001 and 2000, respectively. Ambac received fees for providing administrative services amounting to $80, $302 and $180 for 2002, 2001 and 2000, respectively.
Net Income Per Share:Basic net income per share is computed by dividing net income by the weighted-average number of common shares outstanding during the year. Diluted net income per share is computed similar to basic net income per share except that the weighted average shares outstanding are increased to include 3,114,443, 3,242,176 and 2,383,957 additional shares from the assumed conversion of dilutive stock options and restricted stock units at December 31, 2002, 2001 and 2000, respectively. The number of additional shares is calculated by assuming that outstanding stock options were exercised and that the proceeds from such exercises were used to acquire shares of common stock at the average market price during the year.
51
Accounting Standards:In December 2002, the FASB issued FAS Statement 148, “Accounting for Stock-Based Compensation Transition and Disclosure” (“SFAS 148”). SFAS 148 amends FAS Statement 123, “Accounting for Stock-Based Compensation,” to provide alternative methods of transition for a voluntary change to the fair value based method of accounting for stock-based compensation. SFAS148 also requires more prominent disclosures in both annual and interim financial statements about the method used and the effects of the stock-based compensation. Ambac will adopt the fair value based method of accounting for stock-based compensation, using the prospective transition method, on January 1, 2003.
In January 2003, the FASB issued FAS Interpretation No. 46, “Consolidation of Variable Interest Entities” (“FIN 46”). FIN 46 clarifies the consolidation rules to certain entities in which equity investors do not have the characteristics of a controlling financial interest or do not have sufficient equity at risk for the entity to finance its activities without additional subordinated financial support from other parties. FIN 46 requires variable interest entities to be consolidated by their primary beneficiaries if the entities do not effectively disperse risks among parties involved. Variable interest entities that effectively disperse risks will not be consolidated. FIN 46 requires disclosures for entities that have either a primary or significant variable interest in a variable interest entity. Ambac is required to adopt the consolidation provisions of FIN 46 on July 1, 2003. Based upon Ambac’s current assessment, it does not have a significant variable interest in any Variable Interest Entity affected by this Interpretation.
Reclassifications:Certain reclassifications have been made to prior years’ amounts to conform to the current year’s presentation.
3 INVESTMENTS
The amortized cost and estimated fair value of investments in fixed income securities and short-term investments at December 31, 2002 and 2001 were as follows:
| | | Amortized Cost
| | Gross Unrealized Gains
| | Gross Unrealized Losses
| | Estimated Fair Value
|
2002: | | | | | | | | | | | | |
Fixed income securities: | | | | | | | | | | | | |
Municipal obligations | | $ | 4,587,545 | | $ | 304,995 | | $ | 4,638 | | $ | 4,887,902 |
Corporate obligations | | | 1,532,859 | | | 64,219 | | | 27,764 | | | 1,569,314 |
Foreign government obligations | | | 108,071 | | | 12,562 | | | 33 | | | 120,600 |
U.S. government obligations | | | 104,966 | | | 3,563 | | | 336 | | | 108,193 |
Mortgage and asset-backed securities
(includes U.S. government agency obligations) | | | 4,799,872 | | | 115,601 | | | 3,859 | | | 4,911,614 |
Short-term | | | 395,761 | | | — | | | — | | | 395,761 |
| | |
|
| |
|
| |
|
| |
|
|
| | | | 11,529,074 | | | 500,940 | | | 36,630 | | | 11,993,384 |
| | |
|
| |
|
| |
|
| |
|
|
Fixed income securities pledged as collateral: | | | | | | | | | | | | |
Mortgage and asset-backed securities
(includes U.S. government agency obligations) | | | 537,711 | | | 6,260 | | | 399 | | | 543,572 |
| | |
|
| |
|
| |
|
| |
|
|
Total | | $ | 12,066,785 | | $ | 507,200 | | $ | 37,029 | | $ | 12,536,956 |
| | |
|
| |
|
| |
|
| |
|
|
2001: | | | | | | | | | | | | |
Fixed income securities: | | | | | | | | | | | | |
Municipal obligations | | $ | 3,580,822 | | $ | 133,745 | | $ | 29,769 | | $ | 3,684,798 |
Corporate obligations | | | 1,342,990 | | | 30,245 | | | 42,646 | | | 1,330,589 |
Foreign government obligations | | | 97,109 | | | 629 | | | 1,138 | | | 96,600 |
U.S. government obligations | | | 75,703 | | | 3,750 | | | 1,199 | | | 78,254 |
Mortgage and asset-backed securities
(includes U.S. government agency obligations) | | | 3,258,972 | | | 36,643 | | | 16,699 | | | 3,278,916 |
Short-term | | | 415,002 | | | — | | | — | | | 415,002 |
| | |
|
| |
|
| |
|
| |
|
|
| | | | 8,770,598 | | | 205,012 | | | 91,451 | | | 8,884,159 |
| | |
|
| |
|
| |
|
| |
|
|
Fixed income securities pledged as collateral: | | | | | | | | | | | | |
Mortgage and asset-backed securities
(includes U.S. government agency obligations) | | | 1,393,193 | | | 12,417 | | | 4,082 | | | 1,401,528 |
| | |
|
| |
|
| |
|
| |
|
|
Total | | $ | 10,163,791 | | $ | 217,429 | | $ | 95,533 | | $ | 10,285,687 |
| | |
|
| |
|
| |
|
| |
|
|
52
Notes to Consolidated Financial Statements
(Dollar Amounts in Thousands, Except Share Amounts)
The amortized cost and estimated fair value of fixed income securities and short-term investments at December 31, 2002, by contractual maturity, were as follows:
| | | Amortized Cost
| | Estimated Fair Value
|
Due in one year or less | | $ | 479,271 | | $ | 482,008 |
Due after one year through five years | | | 796,429 | | | 824,868 |
Due after five years through ten years | | | 895,574 | | | 960,295 |
Due after ten years | | | 4,557,928 | | | 4,814,599 |
| | |
|
| |
|
|
| | | | 6,729,202 | | | 7,081,770 |
Mortgage and asset-backed securities | | | 5,337,583 | | | 5,455,186 |
| | |
|
| |
|
|
| | | $ | 12,066,785 | | $ | 12,536,956 |
| | |
|
| |
|
|
Expected maturities will differ from contractual maturities because borrowers may have the right to call or prepay obligations with or without call or prepayment penalties.
There were no individual securities with material unrealized losses as of December 31, 2002 and 2001.
Securities carried at $6,240 and $5,964 at December 31, 2002 and 2001, respectively, were deposited by Ambac with governmental authorities or designated custodian banks as required by laws affecting insurance companies.
Net investment income from the Financial Guarantee segment was comprised of the following:
| | | 2002
| | | 2001
| | | 2000
| |
Fixed income securities | | $ | 297,741 | | | $ | 260,302 | | | $ | 232,876 | |
Short-term investments | | | 2,831 | | | | 9,996 | | | | 9,904 | |
| | |
|
|
| |
|
|
| |
|
|
|
Total investment income | | | 300,572 | | | | 270,298 | | | | 242,780 | |
Investment expense | | | (3,275 | ) | | | (2,451 | ) | | | (1,733 | ) |
| | |
|
|
| |
|
|
| |
|
|
|
Net investment income | | $ | 297,297 | | | $ | 267,847 | | | $ | 241,047 | |
| | |
|
|
| |
|
|
| |
|
|
|
The Financial Guarantee segment had gross realized gains of $48,529, $12,100 and $9,633 in 2002, 2001 and 2000, respectively, and gross realized losses of $7,611, $9,975 and $8,952 in 2002, 2001 and 2000, respectively. Included in the above is a net foreign exchange gain of $1,850 in 2002 and net foreign exchange losses of $3,161 and $3,509 in 2001 and 2000, respectively, related to investments in certain high-grade foreign currency denominated securities.
The Financial Services segment had gross realized gains of $10,313, $7,526 and $5,605 in 2002, 2001 and 2000, respectively, and gross realized losses of $144,520, $10,551 and $14,715 in 2002, 2001 and 2000, respectively. Included in 2002 realized losses was an impairment write-down of $139,731 to the carrying value of asset-backed notes issued by National Century Financial Enterprises, Inc. (“NCFE”). These notes, which were rated triple-A until October 25, 2002, have defaulted and NCFE filed for protection under Chapter 11 of the U.S. Bankruptcy Code in November of 2002. The NCFE securities, which are backed by health care receivables, have been written down to approximately 20% of amortized cost, which represents management’s best estimate of its future recovery based on existing facts and circumstances. There were no impairment write-downs during 2001 or 2000.
As of December 31, 2002 and 2001, Ambac held securities purchased under agreements to resell. A portion of the securities obtained under these agreements were then pledged to Ambac’s investment agreement counterparties (including counterparties with agreements structured as investment repurchase agreements). Such securities may not then be repledged by the investment agreement counterparty to another entity. In addition, Ambac sold securities subject to repurchase in the normal course of business. Ambac’s counterparties under these agreements have the right to pledge or rehypothecate the securities, which were sold. The following table presents (i) the carrying value of repurchase agreements, (ii) the fair value of securities underlying these agreements, and (iii) the fair value of securities pledged by Ambac to investment agreement counter-parties from securities purchased under agreements to resell at December 31, 2002 and 2001.
| | | Carrying Value
| | Fair Value of Underlying Securities
| | Fair Value of Securities Pledged to Investment Agreement Counterparties
|
2002: | | | | | | | | | |
Securities purchased under agreements to resell | | $ | 260,818 | | $ | 266,156 | | $ | 100,679 |
Securities sold under agreements to repurchase | | | 132,235 | | | 136,890 | | | n.a. |
| | |
|
| |
|
| |
|
|
2001: | | | | | | | | | |
Securities purchased under agreements to resell | | $ | 11,200 | | $ | 11,566 | | $ | — |
Securities sold under agreements to repurchase | | | 425,000 | | | 446,410 | | | n.a. |
| | |
|
| |
|
| |
|
|
53
In conjunction with its investment agreement business, Ambac routinely enters into security collateral swaps, whereby repurchase and reverse repurchase agreements are entered into simultaneously with the same counterparty. Under the terms of the security collateral swap agreements, both Ambac and the counterparties have identical rights to pledge or rehypothecate the securities sold or purchased under the agreement. Ambac routinely pledges the securities obtained under the security collateral swap agreements to investment agreement counterparties. Such securities may not then be repledged by the investment agreement counterparty to another entity. The fair value of the underlying securities of all collateral swap arrangements and the fair value of securities pledged to investment agreement counterparties under security collateral swap arrangements at December 31, 2002 and 2001 were as follows:
| | | Fair Value of Security Collateral Swaps
| | Fair Value of Securities Pledged to Investment Agreement Counterparties
|
2002: | | | | | | |
Securities purchased under agreements to resell | | $ | 395,370 | | $ | 357,830 |
Securities sold under agreements to repurchase | | | 406,592 | | | n.a. |
| | |
|
| |
|
|
2001: | | | | | | |
Securities purchased under agreements to resell | | $ | 960,335 | | $ | 738,195 |
Securities sold under agreements to repurchase | | | 955,118 | | | n.a. |
| | |
|
| |
|
|
The fair value of securities sold by Ambac under agreements to repurchase in the normal course of business and under security collateral swap arrangements have been classified separately as “Fixed income securities pledged as collateral” on the Consolidated Balance Sheets.
As of December 31, 2002 and 2001, Ambac had pledged securities from its investment portfolio with a fair value of $1,887,710 and $1,544,461 to investment agreement counterparties. Securities pledged to investment and payment agreement counterparties are maintained in either a tri-party collateral account with Ambac’s custodian bank or a segregated trust account.
Under the terms of certain interest rate swap and structured credit derivative agreements, Ambac and its counterparties may be required to pledge collateral to the other resulting from changes in the estimated fair value of those positions. The following amounts were pledged under these agreements at December 31, 2002 and 2001:
| | | Pledged to Ambac from its Counterparties
| | Pledged by Ambac to its Counterparties
|
| | | 2002
| | 2001
| | 2002
| | 2001
|
Cash | | $ | 4,159 | | $ | 34,200 | | $ | — | | $ | — |
Securities | | | 100,323 | | | 5,127 | | | 155,943 | | | — |
| | |
|
| |
|
| |
|
| |
|
|
4 LOANS
In the normal course of business, Ambac extended loans for the following purposes:
Structured municipal transactions:Loans have been extended to customers participating in certain structured municipal transactions. The loans are collateralized with cash in amounts adequate to repay the loan balance. Equipment and other assets underlying the transactions serve as additional collateral for the loans. Ambac acts as the payment custodian and holds the funds posted as collateral. At December 31, 2002 and 2001 the loan balances outstanding and collateral held were $687,901 and $695,426, respectively. As of December 31, 2002 and 2001 the interest rates on these loans ranged from 6.25% to 8.42%. The range of expected final maturity dates of these loans was May 2004 to January 2027 as of December 31, 2002.
Project financing:Ambac has purchased loans which finance an infrastructure project which is secured by the assets underlying that project. As of December 31, 2002 and 2001, the interest rates on these loans ranged from 5.28% to 7.03%. The loan balances outstanding were $145,708 and $181,768 as of December 31, 2002 and 2001, respectively. The range of expected maturity dates of these loans was July 2014 to July 2019 as of December 31, 2002 and 2001.
Investment partnerships:Ambac has senior secured short-term loans outstanding to certain investment partnerships which invest in diversified portfolios of assets, primarily high-yield debt obligations and bank loans. The loans are collateralized with a first priority lien and security interest in the invested assets. As of December 31, 2002, Ambac has an outstanding loan balance of $10,200 with an interest rate of 2.44%. The expected maturity of this loan was January 2003. As of December 31, 2001, Ambac had an outstanding loan balance of $24,000 with interest rates ranging from 2.94% to 4.94%. The range of maturity dates for these loans was January 2002 to March 2002.
54
Notes to Consolidated Financial Statements
(Dollar Amounts in Thousands, Except Share Amounts)
5 REINSURANCE
In the ordinary course of business, Ambac Assurance cedes exposures under various reinsurance contracts primarily designed to minimize losses from large risks and to protect capital and surplus. The effect of reinsurance on premiums written and earned was as follows:
| | | Years Ended December 31,
| |
| | | 2002
| | | 2001
| | | 2000
| |
| | | Written
| | | Earned
| | | Written
| | | Earned
| | | Written
| | | Earned
| |
Direct | | $ | 871,070 | | | $ | 515,119 | | | $ | 632,413 | | | $ | 410,392 | | | $ | 440,111 | | | $ | 334,908 | |
Assumed | | | 32,962 | | | | 41,486 | | | | 50,883 | | | | 38,825 | | | | 42,971 | | | | 32,530 | |
Ceded | | | (113,542 | ) | | | (85,071 | ) | | | (95,534 | ) | | | (70,483 | ) | | | (80,789 | ) | | | (56,162 | ) |
| | |
|
|
| |
|
|
| |
|
|
| |
|
|
| |
|
|
| |
|
|
|
Net premiums | | $ | 790,490 | | | $ | 471,534 | | | $ | 587,762 | | | $ | 378,734 | | | $ | 402,293 | | | $ | 311,276 | |
| | |
|
|
| |
|
|
| |
|
|
| |
|
|
| |
|
|
| |
|
|
|
The reinsurance of risk does not relieve the ceding insurer of its original liability to its policyholders. In the event that all or any of the reinsurers are unable to meet their obligations to Ambac Assurance under the existing reinsurance agreements, Ambac Assurance would be liable for such defaulted amounts. To minimize its exposure to significant losses from reinsurers, Ambac Assurance (i) evaluates the financial condition of its reinsurers; (ii) has collateral provisions in certain reinsurance contracts and (iii) has certain termination triggers that can be exercised by Ambac Assurance in the event of a rating downgrade of a reinsurer. Additionally, as of December 31, 2002, Ambac Assurance held bank letters of credit and collateral amounting to approximately $135,681 from its reinsurers to cover liabilities ceded under the aforementioned reinsurance contracts. For the years ended December 31, 2002, 2001 and 2000, reinsurance recoveries, which reduced loss and loss expenses incurred, amounted to $1,334, $0 and $0, respectively. Reinsurance recoverables on paid losses and loss adjustment expenses as of December 31, 2002 and 2001 were $242 and $0, respectively. As of December 31, 2002, prepaid reinsurance of approximately $181,378 was associated with Ambac Assurance’s three largest reinsurers. Ambac pledged cash and fixed income securities to foreign insurers of $11,166 and $9,295 at December 31, 2002 and 2001, respectively, related to business assumed from those insurers.
6 LOSSES AND LOSS ADJUSTMENT EXPENSE RESERVE
As discussed in note 2, Ambac Assurance’s liability for losses and loss adjustment expenses consists of case basis and active credit reserves. Following is a summary of the activity in the case basis credit and active credit reserve accounts and the components of the liability for loss and loss adjustment expense reserves:
| | | 2002
| | | 2001
| | | 2000
| |
Case basis credit loss and loss adjustment expense reserves: | | | | | | | | | | | | |
Balance at January 1 | | $ | 24,384 | | | $ | 24,466 | | | $ | 10,726 | |
Less: reinsurance recoverables | | | 1,021 | | | | 1,011 | | | | — | |
| | |
|
|
| |
|
|
| |
|
|
|
Net Balance at January 1 | | | 23,363 | | | | 23,455 | | | | 10,726 | |
| | |
|
|
| |
|
|
| |
|
|
|
Incurred related to: | | | | | | | | | | | | |
Current year | | | 36,365 | | | | 38 | | | | 16,000 | |
Prior years | | | (1,480 | ) | | | 1,131 | | | | 1,350 | |
| | |
|
|
| |
|
|
| |
|
|
|
Total incurred | | | 34,885 | | | | 1,169 | | | | 17,350 | |
| | |
|
|
| |
|
|
| |
|
|
|
Paid related to: | | | | | | | | | | | | |
Current year | | | 5,740 | | | | — | | | | — | |
Prior years | | | 3,516 | | | | 1,261 | | | | 4,621 | |
| | |
|
|
| |
|
|
| |
|
|
|
Total paid | | | 9,256 | | | | 1,261 | | | | 4,621 | |
| | |
|
|
| |
|
|
| |
|
|
|
Net balance at December 31 | | | 48,992 | | | | 23,363 | | | | 23,455 | |
Plus reinsurance recoverables | | | 4,600 | | | | 1,021 | | | | 1,011 | |
| | |
|
|
| |
|
|
| |
|
|
|
Balance at December 31 | | | 53,592 | | | | 24,384 | | | | 24,466 | |
| | |
|
|
| |
|
|
| |
|
|
|
Active credit reserve: | | | | | | | | | | | | |
Balance at January 1 | | | 126,730 | | | | 107,899 | | | | 110,249 | |
Net provision for losses | | | 26,700 | | | | 20,000 | | | | 15,000 | |
Transfers (to) from case reserves | | | (34,885 | ) | | | (1,169 | ) | | | (17,350 | ) |
| | |
|
|
| |
|
|
| |
|
|
|
Balance at December 31 | | | 118,545 | | | | 126,730 | | | | 107,899 | |
| | |
|
|
| |
|
|
| |
|
|
|
Total | | $ | 172,137 | | | $ | 151,114 | | | $ | 132,365 | |
| | |
|
|
| |
|
|
| |
|
|
|
55
7 STOCKHOLDERS’ EQUITY
Ambac is authorized to issue 200,000,000 shares of Common Stock, par value $0.01 per share, of which 106,211,467 were issued as of December 31, 2002. Ambac is also authorized to issue 4,000,000 shares of Preferred Stock, $0.01 par value per share, none of which was issued and outstanding as of December 31, 2002.
Dividends declared per share amounted to $0.38, $0.34 and $0.31 in 2002, 2001 and 2000, respectively.
The Board of Directors of Ambac has authorized the establishment of a stock repurchase program that permits the repurchase of up to 12,000,000 shares of Ambac’s Common Stock. As of December 31, 2002, approximately 8,967,000 shares had been repurchased under this program for an aggregate amount of $265,927.
Stockholder Rights Plan:Ambac adopted a Stockholder Rights Plan under which stockholders received (after giving effect to two stock splits since adoption of the Plan) one Right for each three shares of Common Stock owned. Each Right entitles the registered holder to purchase from Ambac one one-hundredth of a share of Series A Junior Participating Preferred Stock, par value $0.01 per share, at a purchase price of $190 per share. The Rights generally detach and become exercisable when any person or group acquires 20% or more (or announces a tender offer for 20% or more) of Ambac’s Common Stock, at which time each Right (other than those held by the acquiring company) will entitle the holder to receive that number of shares of Common Stock of Ambac with a value of two times the exercise price of the Right. If Ambac is acquired in a merger or other business combination transaction in which Ambac is not the surviving corporation or 50% or more of Ambac’s assets, cash flow or earning power is sold or transferred, each Right will entitle the holder to receive that number of shares of stock of the acquiring company having a value equal to two times the exercise price of the Right. The Rights, which expire on January 31, 2006, are redeemable in whole, but not in part, by action of the Board of Directors of Ambac at a price of $0.01 per Right at any time prior to their becoming exercisable.
8 COMMITMENTS AND CONTINGENCIES
Ambac is responsible for leases on the rental of office space. The lease agreements, which expire periodically through September 2019, contain provisions for scheduled periodic rent increases and are accounted for as operating leases. An estimate of future net minimum lease payments in each of the next five years ending December 31, and the periods thereafter, is as follows:
| | | Amount
|
2003 | | $ | 5,990 |
2004 | | | 7,529 |
2005 | | | 7,036 |
2006 | | | 6,882 |
2007 | | | 6,131 |
All later years | | | 88,523 |
| | |
|
|
| | | $ | 122,091 |
| | |
|
|
Rent expense for the aforementioned leases amounted to $6,377, $5,916 and $5,578 for the years ended December 31, 2002, 2001 and 2000, respectively. Total future rental receipts under sublease agreements are estimated at $1,077.
| 9 | | INSURANCE REGULATORY RESTRICTIONS |
Ambac Assurance is subject to insurance regulatory requirements of the States of Wisconsin and New York, and the other jurisdictions in which it is licensed to conduct business.
Ambac Assurance’s ability to pay dividends is generally restricted by law and subject to approval by the Office of the Commissioner of Insurance of the State of Wisconsin. Wisconsin insurance law restricts the payment of dividends in any 12-month period without regulatory approval to the lesser of (a) 10% of policyholders’ surplus as of the preceding December 31 and (b) the greater of (i) statutory net income for the calendar year preceding the date of dividend, minus realized capital gains for that calendar year and (ii) the aggregate of statutory net income for three calendar years preceding the date of the dividend, minus realized capital gains for those calendar years and minus dividends paid or credited within the first two of the three preceding calendar years. Based upon these restrictions, at December 31, 2002, the maximum amount that will be available during 2003 for payment of dividends by Ambac Assurance is approximately $223,000. Ambac Assurance paid cash dividends of $78,000, $68,000 and $59,800 on its common stock in 2002, 2001 and 2000, respectively.
56
Notes to Consolidated Financial Statements
(Dollar Amounts in Thousands, Except Share Amounts)
The New York Financial Guarantee Insurance Law establishes single risk limits applicable to obligations insured by Ambac Assurance. Such limits are specific to the type of insured obligation (for example, municipal or asset-backed). The limits compare the insured net par outstanding and average annual debt service, net of reinsurance and collateral, for a single risk to the insurer’s qualified statutory capital, which is defined as the sum of the insurer’s policyholders’ surplus and contingency reserves. As of December 31, 2002 and 2001, Ambac Assurance and its subsidiaries were in compliance with these regulatory requirements.
Ambac Assurance’s statutory financial statements are prepared on the basis of accounting practices prescribed or permitted by the Wisconsin Insurance Department. Effective January 1, 2001, Wisconsin adopted the National Association of Insurance Commissioners’ statutory accounting practices (“NAIC SAP”) as a component of its prescribed accounting practices. The adoption of the NAIC SAP did not have a material effect on Ambac Assurance’s statutory capital. Wisconsin’s accounting practice for changes to the contingency reserve differ from those practices of NAIC SAP. Under NAIC SAP, contributions to and releases from the contingency reserve are recorded via a direct charge or credit to surplus. Under the Wisconsin Administrative Code, contributions to and release from the contingency reserve are to be recorded through underwriting income. Ambac Assurance received permission of the Wisconsin Insurance Commissioner to record contributions to and release from the contingency reserve in accordance with NAIC SAP. Statutory surplus is the same using each of these accounting practices. Statutory net income is higher than if Ambac Assurance had reported the net contributions in accordance with the Wisconsin Administrative Code by $169,015, $183,269 and $154,175 for 2002, 2001 and 2000, respectively.
Statutory capital and surplus was $2,227,438 and $1,996,284 at December 31, 2002 and 2001, respectively. Qualified statutory capital was $3,736,336 and $3,261,935 at December 31, 2002 and 2001, respectively. Statutory net income for Ambac Assurance was $486,246, $394,559 and $381,328 for 2002, 2001 and 2000, respectively. Statutory capital and surplus differs from stockholders’ equity determined under GAAP principally due to statutory accounting rules that treat loss reserves, premiums earned, policy acquisition costs, and deferred income taxes differently.
10 INCOME TAXES
Ambac’s provision for income taxes is comprised of the following:
| | | 2002
| | | 2001
| | 2000
|
Current taxes | | $ | 182,244 | | | $ | 123,036 | | $ | 91,779 |
Deferred taxes | | | (50,648 | ) | | | 12,785 | | | 24,173 |
| | |
|
|
| |
|
| |
|
|
| | | $ | 131,596 | | | $ | 135,821 | | $ | 115,952 |
| | |
|
|
| |
|
| |
|
|
The total effect of income taxes on income and stockholders’ equity for the years ended December 31, 2002 and 2001 was as follows:
| | | 2002
| | | 2001
| |
Total income taxes charged to income | | $ | 131,596 | | | $ | 135,821 | |
| | |
|
|
| |
|
|
|
Income taxes charged (credited) to stockholders’ equity: | | | | | | | | |
Unrealized gains on investment securities | | | 114,674 | | | | 12,051 | |
Exercise of stock options | | | (16,320 | ) | | | (13,045 | ) |
| | |
|
|
| |
|
|
|
Total charged (credited) to stockholders’ equity | | | 98,354 | | | | (994 | ) |
| | |
|
|
| |
|
|
|
Total effect of income taxes | | $ | 229,950 | | | $ | 134,827 | |
| | |
|
|
| |
|
|
|
The tax provisions in the accompanying Consolidated Statements of Operations reflect effective tax rates differing from prevailing Federal corporate income tax rates. The following is a reconciliation of these differences:
| | | 2002
| | | %
| | | 2001
| | | %
| | | 2000
| | | %
| |
Tax computed at statutory rate | | $ | 197,467 | | | 35.0 | % | | $ | 199,054 | | | 35.0 | % | | $ | 168,743 | | | 35.0 | % |
Reductions in expected tax resulting from: | | | | | | | | | | | | | | | | | | | | | |
Tax-exempt interest | | | (63,211 | ) | | (11.2 | ) | | | (59,644 | ) | | (10.5 | ) | | | (50,479 | ) | | (10.5 | ) |
Other, net | | | (2,660 | ) | | (0.5 | ) | | | (3,589 | ) | | (0.6 | ) | | | (2,312 | ) | | (0.4 | ) |
| | |
|
|
| |
|
| |
|
|
| |
|
| |
|
|
| |
|
|
Income tax expense | | $ | 131,596 | | | 23.3 | % | | $ | 135,821 | | | 23.9 | % | | $ | 115,952 | | | 24.1 | % |
| | |
|
|
| |
|
| |
|
|
| |
|
| |
|
|
| |
|
|
57
The tax effects of temporary differences that give rise to significant portions of the deferred tax liabilities and deferred tax assets at December 31, 2002 and 2001 are presented below:
| | | 2002
| | | 2001
| |
Deferred tax liabilities: | | | | | | | | |
Contingency reserve | | $ | 226,957 | | | $ | 163,957 | |
Unrealized gains on bonds | | | 147,334 | | | | 32,659 | |
Deferred acquisition costs | | | 60,110 | | | | 56,783 | |
Unearned premiums and credit fees | | | 55,404 | | | | 57,419 | |
Investments | | | 7,462 | | | | 6,799 | |
Other | | | 7,198 | | | | 7,148 | |
| | |
|
|
| |
|
|
|
Total deferred tax liabilities | | | 504,465 | | | | 324,765 | |
| | |
|
|
| |
|
|
|
Deferred tax assets: | | | | | | | | |
Tax and loss bonds | | | 191,371 | | | | 128,371 | |
Loss reserves | | | 40,536 | | | | 42,904 | |
Compensation | | | 29,674 | | | | 26,703 | |
Investment impairment loss | | | 48,906 | | | | — | |
Other | | | 8,337 | | | | 3,710 | |
| | |
|
|
| |
|
|
|
Sub-total deferred tax assets | | | 318,824 | | | | 201,688 | |
Valuation allowance | | | — | | | | — | |
| | |
|
|
| |
|
|
|
Total deferred tax assets | | | 318,824 | | | | 201,688 | |
| | |
|
|
| |
|
|
|
Net deferred tax liabilities | | $ | (185,641 | ) | | $ | (123,077 | ) |
| | |
|
|
| |
|
|
|
Ambac believes that no valuation allowance is necessary in connection with the deferred tax assets.
11 EMPLOYEE BENEFITS
Pensions:Ambac has a defined benefit pension plan covering substantially all employees of Ambac. The benefits are based on years of service and the employee’s highest salary during five consecutive years of employment within the last ten years of employment. Ambac’s funding policy is to contribute annually the maximum amount that can be deducted for Federal income tax purposes. Contributions are intended to provide not only for benefits attributed to service-to-date, but also for those expected to be earned in the future.
The table below sets forth a reconciliation of the beginning and ending projected benefit obligation, beginning and ending balances of the fair value of plan assets, and the funded status of the plan as of December 31, 2002 and 2001.
| | | 2002
| | | 2001
| |
Change in Projected Benefit Obligation: | | | | | | | | |
Projected benefit obligation at beginning of year | | $ | 14,360 | | | $ | 12,669 | |
Service cost | | | 1,397 | | | | 1,031 | |
Interest cost | | | 922 | | | | 853 | |
Actuarial loss (gain) | | | 1,605 | | | | (189 | ) |
Benefits paid | | | (254 | ) | | | (254 | ) |
Other | | | — | | | | 250 | |
| | |
|
|
| |
|
|
|
Projected benefit obligation at end of year | | $ | 18,030 | | | $ | 14,360 | |
| | |
|
|
| |
|
|
|
Change in Plan Assets: | | | | | | | | |
Fair value of plan assets at beginning of year | | $ | 12,831 | | | $ | 11,957 | |
Actual return on plan assets | | | (1,556 | ) | | | (872 | ) |
Company contributions | | | 1,500 | | | | 2,000 | |
Benefits paid | | | (254 | ) | | | (254 | ) |
| | |
|
|
| |
|
|
|
Fair value of plan assets at end of year | | $ | 12,521 | | | $ | 12,831 | |
| | |
|
|
| |
|
|
|
Funded status | | $ | (5,509 | ) | | $ | (1,529 | ) |
Unrecognized loss (gain) | | | 5,512 | | | | 1,132 | |
Unrecognized prior service cost | | | (249 | ) | | | (379 | ) |
Unrecognized net transition asset | | | — | | | | — | |
| | |
|
|
| |
|
|
|
Pension liability included in other liabilities | | $ | (246 | ) | | $ | (776 | ) |
| | |
|
|
| |
|
|
|
Net pension costs for 2002, 2001 and 2000 included the following components:
| | | 2002
| | | 2001
| | | 2000
| |
Service cost | | $ | 1,397 | | | $ | 1,031 | | | $ | 892 | |
Interest cost on expected benefit obligation | | | 992 | | | | 853 | | | | 829 | |
Expected return on plan assets | | | (1,289 | ) | | | (1,286 | ) | | | (1,056 | ) |
Amortization of unrecognized transition asset | | | — | | | | — | | | | — | |
Amortization of prior service cost | | | (131 | ) | | | (151 | ) | | | (151 | ) |
Recognized net actuarial (gain) loss | | | — | | | | (78 | ) | | | (12 | ) |
| | |
|
|
| |
|
|
| |
|
|
|
Net periodic pension cost | | $ | 969 | | | $ | 369 | | | $ | 502 | |
| | |
|
|
| |
|
|
| |
|
|
|
58
Notes to Consolidated Financial Statements
(Dollar Amounts in Thousands, Except Share Amounts)
The discount rate used in the determination of the actuarial present value for the projected benefit obligation was 6.5% and 7.0% for 2002 and 2001, respectively. The expected long-term rate of return on assets was 8.75% and 9.25% for 2002 and 2001, respectively. The rate of increase in future compensation levels used in determining the actuarial present value of the projected benefit obligation was 4.5% for both 2002 and 2001.
Substantially all employees of Ambac are covered by a defined contribution plan (the “Savings Incentive Plan”), for which contributions and costs are determined as 6% of each eligible employee’s eligible base salary, plus a matching company contribution of 50% on contributions up to 6% of base salary made by eligible employees to the Savings Incentive Plan. The total cost of the Savings Incentive Plan was $2,565, $3,037 and $2,471 in 2002, 2001 and 2000, respectively.
Annual Incentive Program:Ambac has an annual incentive program that provides for awards to key officers and employees based upon predetermined criteria. The cost of the program for the years ended December 31, 2002, 2001 and 2000 amounted to $33,481, $27,823 and $22,725, respectively.
Postretirement Health Care and Other Benefits:Ambac provides certain medical and life insurance benefits for retired employees and eligible dependents. All plans are contributory. None of the plans are currently funded.
Postretirement benefits expense was $119, $175 and $358 in 2002, 2001 and 2000, respectively. The unfunded accumulated postretirement benefit obligation was $961 and the related accrued postretirement liability was $2,425 as of December 31, 2002.
The assumed health care cost trend rates range from 10.0% in 2003, decreasing ratably to 6.0% in 2009. Increasing the assumed health care cost trend rate by one percentage point in each future year would increase the accumulated postretirement benefit obligation at December 31, 2002 by $175 and the 2002 benefit expense by $55. The discount rate used to measure the accumulated postretirement benefit obligation and 2002 expense was 6.5%.
12 GUARANTEES IN FORCE
The par amount of financial guarantees outstanding, net of reinsurance, was $379,211,000 and $318,043,000 at December 31, 2002 and 2001, respectively. As of December 31, 2002 and 2001, the guarantee portfolio was diversified by type of guaranteed bond as shown in the following table:
| | | Net Par Amount Outstanding
|
| | | 2002
| | 2001
|
| | | (Dollars in Millions) |
Public Finance: | | | | | | |
Lease and tax-backed revenue | | $ | 60,118 | | $ | 52,102 |
General obligation | | | 41,359 | | | 39,664 |
Utility revenue | | | 33,289 | | | 29,513 |
Health care revenue | | | 20,675 | | | 19,003 |
Transportation revenue | | | 15,218 | | | 13,000 |
Higher education | | | 14,138 | | | 11,854 |
Housing revenue | | | 8,345 | | | 7,476 |
Student loans | | | 7,629 | | | 7,249 |
Other | | | 5,723 | | | 5,103 |
| | |
|
| |
|
|
Total Public Finance | | | 206,494 | | | 184,964 |
| | |
|
| |
|
|
Structured Finance: | | | | | | |
Mortgage-backed and home equity | | | 49,262 | | | 42,723 |
Asset-backed and conduits | | | 25,977 | | | 20,687 |
Investor-owned utilities | | | 14,285 | | | 11,642 |
Pooled debt obligations(1) | | | 9,178 | | | 7,068 |
Other | | | 6,290 | | | 6,612 |
| | |
|
| |
|
|
Total Structured Finance | | | 104,992 | | | 88,732 |
| | |
|
| |
|
|
International Finance: | | | | | | |
Pooled debt obligations(1) | | | 45,697 | | | 27,206 |
Asset-backed and conduits | | | 9,232 | | | 6,185 |
Mortgage-backed and home equity | | | 4,828 | | | 2,602 |
Investor-owned and public utilities | | | 3,680 | | | 2,878 |
Sovereign/sub-sovereign | | | 1,916 | | | 1,299 |
Other | | | 2,372 | | | 4,177 |
| | |
|
| |
|
|
Total International Finance | | | 67,725 | | | 44,347 |
| | |
|
| |
|
|
| | | $ | 379,211 | | $ | 318,043 |
| | |
|
| |
|
|
| (1) | | Pooled debt obligations include $43,701 and $26,123 of structured credit derivatives at December 31, 2002 and December 31, 2001, respectively. |
As of December 31, 2002 and 2001, the International Finance guaranteed portfolio is shown in the following table by location of risk:
| | | Net Par Amount Outstanding
|
| | | 2002
| | 2001
|
| | | (Dollars in Millions) |
Germany | | $ | 10,556 | | $ | 5,804 |
United Kingdom | | | 9,289 | | | 6,531 |
Australia | | | 2,486 | | | 1,623 |
Japan | | | 2,393 | | | 1,167 |
France | | | 1,001 | | | 1,155 |
Mexico | | | 668 | | | 654 |
Internationally diversified | | | 36,454 | | | 23,312 |
Other international | | | 4,878 | | | 4,101 |
| | |
|
| |
|
|
Total International Finance | | $ | 67,725 | | $ | 44,347 |
| | |
|
| |
|
|
59
Internationally diversified includes pooled debt obligations. Such obligations represent pools of geographically diversified exposures which includes components of domestic exposure.
Direct financial guarantees in force (principal and interest) was $632,194,000 and $542,458,000 at December 31, 2002 and 2001, respectively. Net financial guarantees in force (after giving effect to reinsurance) was $557,422,000 and $476,190,000 as of December 31, 2002 and 2001, respectively.
In the United States, California and New York were the states with the highest aggregate net par amounts in force, accounting for 8.8% and 5.6% of the total at December 31, 2002. No other state accounted for more than five percent. The highest single insured risk represented less than 1% of aggregate net par amount outstanding.
13 FAIR VALUE OF FINANCIAL INSTRUMENTS
The following fair value amounts were determined by using independent market information when available, and valuation models when market quotes were not available. In cases where specific market quotes are unavailable, interpreting market data and estimating market values require considerable judgment by management. Accordingly, the estimates presented are not necessarily indicative of the amount Ambac could realize in a current market exchange.
The following methods and assumptions were used to estimate the fair value of each class of financial instruments for which it is practicable to estimate that value:
Investments:The fair values of fixed income investments are based primarily on quoted market prices received from a nationally recognized pricing service or dealer quotes. When quotes are not available, fair values are estimated based upon internal valuation models.
Short-term investments and cash:The fair values of short-term investments and cash are assumed to approximate amortized cost.
Other:The fair value of other investments, primarily mutual funds, are based on quoted market prices received from a nationally recognized pricing service.
Securities purchased under agreements to resell:The fair value of securities purchased under agreements to resell is assumed to approximate carrying value.
Investment income due and accrued:The fair value of investment income due and accrued is assumed to approximate carrying value.
Loans:The fair values of loans extended for structured municipal transactions, project financings and investment partnerships are assumed to approximate carrying value.
Derivative contracts used for hedging purposes:The fair values of cash flow hedges and fair value hedges (interest rate and currency swaps), as defined in Note 2, are based on quoted dealer prices, current settlement values, or pricing models.
Derivative contracts held for trading purposes:The fair values of interest rate swaps, total return swaps and structured credit derivative transactions, as discussed in Note 2, are based on quoted dealer prices, current settlement values, or valuation models.
Obligations under investment, repurchase and payment agreements:The fair value of the liability for investment agreements and repurchase agreements is estimated based upon internal valuation models. The fair value of payment agreements is assumed to approximate carrying value.
Securities sold under agreements to repurchase:The fair value of securities sold under agreements to repurchase is assumed to approximate carrying value.
Debentures:The fair value of the debentures is based on quoted market prices.
Accrued interest payable:The fair value of accrued interest payable is assumed to approximate carrying value.
Liability for net financial guarantees written:The fair value of the liability for those financial guarantees written is based on the estimated cost to reinsure those exposures at current market rates, which amount consists of the current unearned premium reserve, less an estimated ceding commission thereon.
Other financial guarantee insurance policies have been written on an installment basis, where the future premiums to be received by Ambac are determined based on the outstanding exposure at the time the premiums are due. The fair value of Ambac Assurance’s liability under its installment premium policies is measured using the present value of estimated future installment premiums, less an estimated ceding commission. The estimate of the amounts and timing of the future installment premiums is based on contractual premium rates, debt service schedules and expected run-off scenarios. This measure is used as an estimate of the cost to reinsure Ambac Assurance’s liability under these policies.
60
Notes to Consolidated Financial Statements
(Dollar Amounts in Thousands, Except Share Amounts)
The carrying amount and estimated fair value of financial instruments are presented below:
| | | As of December 31,
|
| | | 2002
| | 2001
|
| | | Carrying Amount
| | Estimated Fair Value
| | Carrying Amount
| | Estimated Fair Value
|
| | | (Dollars in Millions) |
Financial assets: | | | | | | | | | | | | |
Fixed income securities | | $ | 11,598 | | $ | 11,598 | | $ | 8,469 | | $ | 8,469 |
Fixed income securities pledged as collateral | | | 544 | | | 544 | | | 1,402 | | | 1,402 |
Short-term investments | | | 396 | | | 396 | | | 415 | | | 415 |
Other Investments | | | 2 | | | 2 | | | 2 | | | 2 |
Cash | | | 26 | | | 26 | | | 77 | | | 77 |
Securities purchased under agreements to resell | | | 261 | | | 261 | | | 11 | | | 11 |
Investment income due and accrued | | | 142 | | | 142 | | | 157 | | | 157 |
Loans | | | 844 | | | 844 | | | 901 | | | 889 |
|
Derivative product assets: | | | | | | | | | | | | |
Hedging purposes | | | 118 | | | 118 | | | 12 | | | 12 |
Trading purposes | | | 892 | | | 892 | | | 373 | | | 373 |
|
Financial liabilities: | | | | | | | | | | | | |
Obligations under investment, repurchase and payment agreements | | | 7,283 | | | 7,617 | | | 5,512 | | | 5,597 |
Securities sold under agreements to repurchase | | | 132 | | | 132 | | | 425 | | | 425 |
Debentures | | | 617 | | | 681 | | | 619 | | | 651 |
Accrued interest payable | | | 81 | | | 81 | | | 84 | | | 84 |
|
Derivative product liabilities: | | | | | | | | | | | | |
Hedging purposes | | | — | | | — | | | 3 | | | 3 |
Trading purposes | | | 836 | | | 836 | | | 312 | | | 312 |
|
Liability for financial guarantees written: | | | | | | | | | | | | |
Gross | | | 2,128 | | | 1,490 | | | 1,780 | | | 1,246 |
Net of reinsurance | | | 1,832 | | | 1,282 | | | 1,513 | | | 1,059 |
Gross installment premiums | | | — | | | 1,110 | | | — | | | 818 |
Net installment premiums | | | — | | | 940 | | | — | | | 691 |
| | |
|
| |
|
| |
|
| |
|
|
61
14 LONG-TERM DEBT AND LINES OF CREDIT
The carrying value of long-term debt was as follows:
| | | As of December 31,
|
| | | 2002
| | 2001
|
9 3/8% Debentures, due 2011 | | $ | 142,136 | | $ | 144,757 |
7 1/2% Debentures, due 2023 | | | 74,579 | | | 74,558 |
7.00% Debentures, due 2051 | | | 200,000 | | | 200,000 |
7.08% Debentures, due 2098 | | | 200,000 | | | 200,000 |
| | |
|
| |
|
|
| | | $ | 616,715 | | $ | 619,315 |
| | |
|
| |
|
|
The debentures due on August 1, 2011 were issued on August 8, 1991 in the principal amount of $150,000 and bear interest of 9 3/8%, payable on February 1 and August 1 of each year and are non-callable. In July 2001, Ambac extinguished $7,500, thereby reducing the principal amount of the debt to $142,500.
The debentures due on May 1, 2023 were issued on May 11, 1993 in the principal amount of $75,000 and bear interest of 7 1/2%, payable on May 1 and November 1 of each year and are non-callable.
The debentures due on October 17, 2051 were issued on October 18, 2001 in the principal amount of $200,000 and bear interest of 7.00%, payable on March 31, June 30, September 30 and December 31 of each year. The debentures may not be redeemed prior to October 17, 2006 and were sold at 100% of their principal amount. On or after October 17, 2006, Ambac may redeem the debentures, in whole at any time or in part from time to time, at 100% of their principal amount, plus accrued interest to the date of redemption.
The debentures due on March 31, 2098 were issued on April 1, 1998 in the principal amount of $200,000 and bear interest of 7.08%, payable on March 31, June 30, September 30 and December 31 of each year. The debentures may not be redeemed prior to March 31, 2003 and were sold at 100% of their principal amount. On or after March 31, 2003, Ambac may redeem the debentures, in whole at any time or in part from time to time, at 100% of their principal amount, plus accrued interest to the date of redemption.
Ambac and Ambac Assurance have a revolving credit facility with six major international banks for $300,000, which expires in July 2003 and provides a two-year term loan provision. The facility is available for general corporate purposes, including the payment of claims. As of December 31, 2002 and 2001, no amounts were outstanding under this credit facility. This facility’s financial covenants require that Ambac: (i) maintain as of the end of each fiscal quarter a debt to capital ratio of not more than 30% and (ii) maintain at all times total stockholders’ equity equal to or greater than $1.75 billion.
Ambac Assurance has a series of perpetual put options on its own preferred stock. The counterparty to these put options are trusts established by a major investment bank. The trusts were created as a vehicle for providing capital support to Ambac Assurance by allowing it to obtain immediate access to new capital at its sole discretion at any time through the exercise of the put option. If the put option were exercised, the preferred stock holdings of Ambac Assurance would give investors the rights of an equity investor in Ambac Assurance. Such rights are subordinate to insurance claims, as well as to the general unsecured creditors of Ambac Assurance. If exercised, Ambac Assurance would receive up to $800,000 in return for the issuance of its own perpetual preferred stock, the proceeds of which may be used for any purpose including the payment of claims. Dividend payments on the preferred stock are cumulative only if Ambac Assurance pays dividends on its common stock. Each trust is restricted to holding high quality short-term commercial paper investments to ensure that it can meet its obligations under the put option. To fund these investments, each trust has issued its own auction market perpetual preferred stock. Ambac Assurance pays a floating put option fee. Each trust is rated AA/Aa2 by Standard & Poor’s and Moody’s respectively.
62
Notes to Consolidated Financial Statements
(Dollar Amounts in Thousands, Except Share Amounts)
15 OBLIGATIONS UNDER INVESTMENT AGREEMENTS AND PAYMENT AGREEMENTS
Obligations under investment agreements, including those structured in the form of repurchase contracts, are recorded on a trade-date basis. Certain obligations may be called at various times prior to maturity at the option of the counterparty. As of December 31, 2002, the interest rates on these agreements ranged from 1.25% to 8.14% with an average yield of 4.45%. As of December 31, 2001, the interest rates on these agreements ranged from 2.00% to 8.14% with an average yield of 5.47%. Obligations under investment agreements and investment repurchase agreements, excluding fair value hedge adjustments, were as follows:
| | | As of December 31,
|
| | | 2002
| | 2001
|
Settled | | $ | 6,227,879 | | $ | 4,785,899 |
Unsettled | | | 169 | | | 4,101 |
| | |
|
| |
|
|
| | | $ | 6,228,048 | | $ | 4,790,000 |
| | |
|
| |
|
|
Net payments due under settled investment agreements in each of the next five years ending December 31, and the periods thereafter, based on expected draw dates, are as follows:
| | | Principal Amount
|
2003 | | $ | 1,575,150 |
2004 | | | 1,061,816 |
2005 | | | 415,068 |
2006 | | | 746,924 |
2007 | | | 638,338 |
All later years | | | 1,790,583 |
| | |
|
|
| | | $ | 6,227,879 |
| | |
|
|
Obligations under payment agreements represent funds received by Ambac from certain municipal customers. These funds serve as collateral for loans extended by Ambac in connection with certain structured municipal transactions. In connection with these transactions, Ambac is obligated to make periodic agreed upon payments. As of December 31, 2002 and 2001, the interest rates on these obligations ranged from 6.25% to 8.42%. Net payments due under payment agreements in each of the next five years ending December 31, and the periods thereafter, based on contractual payment dates, are as follows:
| | | Principal Amount
|
2003 | | $ | 15,702 |
2004 | | | 23,568 |
2005 | | | 17,200 |
2006 | | | 21,611 |
2007 | | | 23,425 |
All later years | | | 586,395 |
| | |
|
|
| | | $ | 687,901 |
| | |
|
|
Ambac also has obligations under certain payment agreements that represent funds received from various investors and used by Ambac to purchase high credit quality fixed income municipal investment securities. As of December 31, 2002, the interest rates on these obligations ranged from 0.95% to 1.92%. The balance outstanding at December 31, 2002 was $250,534. These payment agreements are directly secured by the related municipal investment securities. Under the terms of these payment agreements the investors have the contractual right to redeem their investment at any time, within five business days notice to Ambac.
63
16 COMMON STOCK INCENTIVES
The Ambac 1997 Equity Plan (the “Equity Plan”) provides for the granting of stock options, stock appreciation rights, restricted stock units, performance units and other awards that are valued or determined by reference to the Common Stock. Stock options awarded to employees are exercisable and expire as specified at the time of grant. Such options do not have a per share exercise price less than the fair market value of a share of Common Stock on the date of grant or have a term in excess of ten years from the date of the grant. Ambac also maintains the Ambac 1997 Non-Employee Directors Equity Plan, which provides awards of stock options and restricted stock units to non-employee members of the Ambac’s Board of Directors. The number of options and their exercise price, and the number of restricted stock units awarded to each non-employee director under the Directors Equity Plan are determined by formula. As of December 31, 2002, approximately 3,711,000 shares were available for future grant under the Equity Plan and the Directors Equity Plan. A summary of option activity is as follows:
| | | 2002
| | 2001
| | 2000
|
| | | Shares
| | | Weighted Average Exercise Price
| | Shares
| | | Weighted Average Exercise Price
| | Shares
| | | Weighted Average Exercise Price
|
Outstanding at beginning of year | | 6,218,869 | | | $ | 34.70 | | 5,694,711 | | | $ | 27.86 | | 5,490,716 | | | $ | 24.99 |
Granted | | 1,544,254 | | | $ | 59.01 | | 1,763,615 | | | $ | 50.37 | | 1,796,052 | | | $ | 32.57 |
Exercised | | (1,128,095 | ) | | $ | 23.58 | | (1,184,329 | ) | | $ | 25.52 | | (1,327,754 | ) | | $ | 20.87 |
Forfeited | | (116,779 | ) | | $ | 52.66 | | (55,128 | ) | | $ | 40.33 | | (264,303 | ) | | $ | 33.35 |
| | |
|
| | | | |
|
| | | | |
|
| | | |
Outstanding at end of year | | 6,518,249 | | | $ | 42.06 | | 6,218,869 | | | $ | 34.70 | | 5,694,711 | | | $ | 27.86 |
| | |
|
| | | | |
|
| | | | |
|
| | | |
Exercisable | | 4,151,277 | | | | | | 3,786,156 | | | | | | 3,051,448 | | | | |
| | |
|
| | | | |
|
| | | | |
|
| | | |
| | | Options Outstanding
| | Options Exercisable
|
Range of Exercise Prices
| | Number Outstanding at December 31, 2002
| | Weighted Average Remaining Contract Life
| | Weighted Average Exercise Price
| | Number Exercisable at December 31, 2002
| | Weighted Average Exercise Price
|
$13 to 30 | | 1,239,909 | | 1.7 | | $ | 23.77 | | 1,239,909 | | $ | 23.77 |
$31 to 47 | | 2,051,611 | | 3.5 | | $ | 33.65 | | 1,899,973 | | $ | 33.83 |
$48 to 66 | | 3,226,729 | | 5.1 | | $ | 54.44 | | 1,011,395 | | $ | 51.88 |
| | |
| | | | | | |
| | | |
| | | 6,518,249 | | | | | | | 4,151,277 | | | |
| | |
| | | | | | |
| | | |
The weighted-average fair value (determined as of the date of the grants) of options granted in 2002, 2001 and 2000 was $20.61 per share, $17.37 per share, and $11.78 per share, respectively. The fair value of each option grant issued was estimated as of the date of the grant using the Black-Scholes option-pricing model, with the following weighted-average assumptions used for grants in 2002, 2001 and 2000, respectively: (i) dividend yield of 0.61%, 0.65% and 0.92%; (ii) expected volatility of 31.9%, 32.7% and 30.3%; (iii) risk-free interest rates of 4.2%, 4.8% and 6.5%; and (iv) expected lives of approximately five years.
17 SEGMENT INFORMATION
Ambac has two reportable segments, as follows: (1) Financial Guarantee, which provides financial guarantees (including structured credit derivatives) for public finance and structured finance obligations; and (2) Financial Services, which provides investment agreements, interest rate swaps, total return swaps, funding conduits, and investment advisory and cash management services.
Ambac’s reportable segments are strategic business units that offer different products and services. They are managed separately because each business requires different marketing strategies, personnel skill sets and technology.
The accounting policies of the segments are described in Note 2, “Significant Accounting Policies.” Pursuant to insurance and indemnity agreements, Ambac Assurance guarantees the swap and investment agreement obligations of those financial services subsidiaries. Intersegment revenues include the premiums earned under those agreements. Such premiums are determined as if they were premiums to third parties, that is, at current market prices.
Information provided below for “Corporate and Other” relates to Ambac Financial Group, Inc. corporate activities. Corporate and other revenue from unaffiliated customers consists primarily of interest income. Intersegment revenues consist of dividends received.
64
Notes to Consolidated Financial Statements
(Dollar Amounts in Thousands, Except Share Amounts)
The following table is a summary of the financial information by reportable segment as of and for the years ended December 31, 2002, 2001 and 2000:
| | | Financial Guarantee
| | Financial Services
| | | Corporate and Other
| | | Intersegment Eliminations
| | | Total Consolidated
|
2002: | | | | | | | | | | | | | | | | | | |
Revenues: | | | | | | | | | | | | | | | | | | |
Unaffiliated customers | | $ | 816,178 | | $ | 150,621 | | | $ | 5,019 | | | $ | — | | | $ | 971,818 |
Intersegment | | | 7,984 | | | (4,477 | ) | | | 81,500 | | | | (85,007 | ) | | | — |
| | |
|
| |
|
|
| |
|
|
| |
|
|
| |
|
|
Total revenues | | $ | 824,162 | | $ | 146,144 | | | $ | 86,519 | | | $ | (85,007 | ) | | $ | 971,818 |
| | |
|
| |
|
|
| |
|
|
| |
|
|
| |
|
|
Income before income taxes: | | | | | | | | | | | | | | | | | | |
Unaffiliated customers | | $ | 712,930 | | $ | (102,865 | ) | | $ | (45,875 | ) | | $ | — | | | $ | 564,190 |
Intersegment | | | 8,920 | | | (2,489 | ) | | | 80,192 | | | | (86,623 | ) | | | — |
| | |
|
| |
|
|
| |
|
|
| |
|
|
| |
|
|
Total income before income taxes | | $ | 721,850 | | $ | (105,354 | ) | | $ | 34,317 | | | $ | (86,623 | ) | | $ | 564,190 |
| | |
|
| |
|
|
| |
|
|
| |
|
|
| |
|
|
Identifiable assets | | $ | 7,049,290 | | $ | 8,231,967 | | | $ | 74,281 | | | $ | — | | | $ | 15,355,538 |
| | |
|
| |
|
|
| |
|
|
| |
|
|
| |
|
|
2001: | | | | | | | | | | | | | | | | | | |
Revenues: | | | | | | | | | | | | | | | | | | |
Unaffiliated customers | | $ | 671,958 | | $ | 284,647 | | | $ | 3,763 | | | $ | — | | | $ | 960,368 |
Intersegment | | | 5,006 | | | (3,882 | ) | | | 69,000 | | | | (70,124 | ) | | | — |
| | |
|
| |
|
|
| |
|
|
| |
|
|
| |
|
|
Total revenues | | $ | 676,964 | | $ | 280,765 | | | $ | 72,763 | | | $ | (70,124 | ) | | $ | 960,368 |
| | |
|
| |
|
|
| |
|
|
| |
|
|
| |
|
|
Income before income taxes: | | | | | | | | | | | | | | | | | | |
Unaffiliated customers | | $ | 583,969 | | $ | 27,384 | | | $ | (42,626 | ) | | $ | — | | | $ | 568,727 |
Intersegment | | | 5,304 | | | (3,933 | ) | | | 67,612 | | | | (68,983 | ) | | | — |
| | |
|
| |
|
|
| |
|
|
| |
|
|
| |
|
|
Total income before income taxes | | $ | 589,273 | | $ | 23,451 | | | $ | 24,986 | | | $ | (68,983 | ) | | $ | 568,727 |
| | |
|
| |
|
|
| |
|
|
| |
|
|
| |
|
|
Identifiable assets | | $ | 5,960,900 | | $ | 6,306,900 | | | $ | 71,743 | | | $ | — | | | $ | 12,339,543 |
| | |
|
| |
|
|
| |
|
|
| |
|
|
| |
|
|
2000: | | | | | | | | | | | | | | | | | | |
Revenues: | | | | | | | | | | | | | | | | | | |
Unaffiliated customers | | $ | 565,421 | | $ | 336,568 | | | $ | 2,324 | | | $ | — | | | $ | 904,313 |
Intersegment | | | 3,827 | | | (3,259 | ) | | | 63,844 | | | | (64,412 | ) | | | — |
| | |
|
| |
|
|
| |
|
|
| |
|
|
| |
|
|
Total revenues | | $ | 569,248 | | $ | 333,309 | | | $ | 66,168 | | | $ | (64,412 | ) | | $ | 904,313 |
| | |
|
| |
|
|
| |
|
|
| |
|
|
| |
|
|
Income before income taxes: | | | | | | | | | | | | | | | | | | |
Unaffiliated customers | | $ | 495,186 | | $ | 28,760 | | | $ | (41,822 | ) | | $ | — | | | $ | 482,124 |
Intersegment | | | 3,827 | | | (3,201 | ) | | | 63,844 | | | | (64,470 | ) | | | — |
| | |
|
| |
|
|
| |
|
|
| |
|
|
| |
|
|
Total income before income taxes | | $ | 499,013 | | $ | 25,559 | | | $ | 22,022 | | | $ | (64,470 | ) | | $ | 482,124 |
| | |
|
| |
|
|
| |
|
|
| |
|
|
| |
|
|
Identifiable assets | | $ | 4,870,075 | | $ | 5,193,747 | | | $ | 56,398 | | | $ | — | | | $ | 10,120,220 |
| | |
|
| |
|
|
| |
|
|
| |
|
|
| |
|
|
The following tables summarize gross premiums written and net premiums earned and other credit enhancement fees included in the Financial Guarantee segment, by location of risk for the years ended December 31, 2002 2001 and 2000:
| | | 2002
| | 2001
| | 2000
|
Gross premiums written: | | | | | | | | | |
United States | | $ | 766,778 | | $ | 535,725 | | $ | 373,269 |
United Kingdom | | | 38,495 | | | 40,650 | | | 19,325 |
Japan | | | 22,033 | | | 12,204 | | | 7,655 |
Mexico | | | 16,513 | | | 16,285 | | | 16,232 |
Australia | | | 9,379 | | | 7,308 | | | 27,647 |
Germany | | | 1,207 | | | 483 | | | 418 |
France | | | 884 | | | 856 | | | 970 |
Internationally diversified | | | 16,841 | | | 30,615 | | | 14,754 |
Other international | | | 31,902 | | | 39,170 | | | 22,812 |
| | |
|
| |
|
| |
|
|
Total: | | $ | 904,032 | | $ | 683,296 | | $ | 483,082 |
| | |
|
| |
|
| |
|
|
| | | 2002
| | 2001
| | 2000
|
Net premiums earned and other credit enhancement fees: | | | | | | | | | |
United States | | $ | 382,409 | | $ | 318,480 | | $ | 264,445 |
United Kingdom | | | 19,287 | | | 11,043 | | | 7,138 |
Japan | | | 17,941 | | | 8,939 | | | 6,252 |
Mexico | | | 7,720 | | | 7,540 | | | 7,461 |
Australia | | | 4,945 | | | 3,761 | | | 3,058 |
Germany | | | 4,808 | | | 2,092 | | | 1,052 |
France | | | 1,174 | | | 1,116 | | | 1,133 |
Internationally diversified | | | 40,926 | | | 33,706 | | | 24,434 |
Other international | | | 21,099 | | | 13,718 | | | 8,460 |
| | |
|
| |
|
| |
|
|
Total: | | $ | 500,309 | | $ | 400,395 | | $ | 323,433 |
| | |
|
| |
|
| |
|
|
Internationally diversified includes components of domestic exposure.
65
18 QUARTERLY FINANCIAL INFORMATION (unaudited)
| | | First
| | Second
| | Third
| | Fourth
| | Full Year
|
2002: | | | | | | | | | | | | | | | |
Gross premiums written | | $ | 149,361 | | $ | 195,683 | | $ | 205,110 | | $ | 353,878 | | $ | 904,032 |
Net premiums written | | | 129,812 | | | 170,978 | | | 178,256 | | | 311,444 | | | 790,490 |
Net premiums earned and other credit enhancement fees | | | 109,942 | | | 120,206 | | | 129,703 | | | 140,458 | | | 500,309 |
Financial guarantee net investment income | | | 72,547 | | | 73,593 | | | 75,895 | | | 75,262 | | | 297,297 |
Financial services revenue, net | | | 16,591 | | | 10,966 | | | 13,582 | | | 13,114 | | | 54,253 |
Losses and loss adjustment expenses | | | 5,700 | | | 5,900 | | | 6,100 | | | 9,000 | | | 26,700 |
Financial guarantee underwriting and operating expenses | | | 18,561 | | | 18,603 | | | 18,467 | | | 20,917 | | | 76,548 |
Financial services expenses | | | 5,136 | | | 5,699 | | | 5,380 | | | 5,967 | | | 22,182 |
Income before income taxes | | | 155,381 | | | 158,942 | | | 177,796 | | | 72,071 | | | 564,190 |
Net income | | | 116,952 | | | 119,761 | | | 131,691 | | | 64,190 | | | 432,594 |
Net income per share: | | | | | | | | | | | | | | | |
Basic | | | 1.11 | | | 1.13 | | | 1.24 | | | 0.61 | | | 4.08 |
Diluted | | $ | 1.07 | | $ | 1.09 | | $ | 1.21 | | $ | 0.59 | | $ | 3.97 |
| | |
|
| |
|
| |
|
| |
|
| |
|
|
2001: | | | | | | | | | | | | | | | |
Gross premiums written | | $ | 109,667 | | $ | 236,668 | | $ | 152,918 | | $ | 184,043 | | $ | 683,296 |
Net premiums written | | | 96,966 | | | 212,901 | | | 117,044 | | | 160,851 | | | 587,762 |
Net premiums earned and other credit enhancement fees | | | 89,769 | | | 98,407 | | | 103,895 | | | 108,324 | | | 400,395 |
Financial guarantee net investment income | | | 64,476 | | | 65,058 | | | 67,318 | | | 70,995 | | | 267,847 |
Financial services revenue, net | | | 14,459 | | | 11,767 | | | 10,231 | | | 15,768 | | | 52,225 |
Losses and loss adjustment expenses | | | 4,600 | | | 4,800 | | | 5,100 | | | 5,500 | | | 20,000 |
Financial guarantee underwriting and operating expenses | | | 16,643 | | | 17,426 | | | 16,602 | | | 17,318 | | | 67,989 |
Financial services expenses | | | 5,631 | | | 5,973 | | | 5,023 | | | 5,188 | | | 21,815 |
Income before income taxes | | | 128,871 | | | 140,146 | | | 144,322 | | | 155,388 | | | 568,727 |
Net income | | | 97,515 | | | 107,637 | | | 111,008 | | | 116,746 | | | 432,906 |
Net income per share: | | | | | | | | | | | | | | | |
Basic | | | 0.92 | | | 1.02 | | | 1.05 | | | 1.11 | | | 4.10 |
Diluted | | $ | 0.90 | | $ | 0.99 | | $ | 1.02 | | $ | 1.07 | | $ | 3.97 |
| | |
|
| |
|
| |
|
| |
|
| |
|
|
Stockholder Information
CORPORATE HEADQUARTERS: AMBAC FINANCIAL GROUP, INC. One State Street Plaza New York, New York 10004 Tel: 212-668-0340 Fax: 212-509-9190 OTHER LOCATIONS: LONDON Hasilwood House 60 Bishopsgate London EC2N 4BE, England Tel: 44 207 786 4300 Fax: 44 207 786 4343 SYDNEY ABN AMRO Tower, L31 88 Phillip Street Sydney 2000 NSW, Australia Tel: 61 2 8211 0430 Fax: 61 2 8211 0555 Managing Director: Nancy S. Fox
| | TOKYO Otemachi Financial Center 17th Floor 5-4, Otemachi 1-chome, Chiyoda-ku, Tokyo 100-0004 Japan Tel: 03 5219 2127 Fax: 03 5219 2129 Representative Director: Hideshi Amemiya CADRE FINANCIAL SERVICES, INC. AMBAC SECURITIES, INC. 905 Marconi Avenue Ronkonkoma, New York 11779 Tel: 631-467-0200 Fax: 631-580-8806
| | ANNUAL MEETING OF STOCKHOLDERS The Annual Meeting of Stockholders of Ambac Financial Group, Inc. will be held on Tuesday, May 6, 2003, at 11:30 a.m. in New York City. Detailed information about the meeting is contained in the Notice of Annual Meeting and Proxy Statement to be sent to each stockholder of record as of March 11, 2003. The Company estimates that it has approximately 45,000 stockholders. FORM 10-K A copy of the Company’s 2002 Annual Report on Form 10-K for the year ended December 31, 2002, as filed with the Securities and Exchange Commission, may be obtained without charge by writing to: Ambac Financial Group, Inc. Attn: Investor Relations One State Street Plaza New York, New York 10004 |
|
TRANSFER AGENT, REGISTRAR AND DIVIDEND PAYING AGENT Citibank, N.A. 111 Wall Street, 5th Floor New York, New York 10043 212-657-5997
| | INDEPENDENT AUDITORS KPMG LLP New York, New York STOCK LISTING Ambac Financial Group, Inc. common stock is listed on the New York Stock Exchange under the ticker symbol ABK. [ABK LISTED NYSE LOGO] | | INVESTOR RELATIONS Thomas J. Gandolfo Senior Vice President and Chief Financial Officer Peter R. Poillon First Vice President 212-208-3333 1-800-221-1854 ppoillon@ambac.com |
COMMON STOCK DATA
| | | 2002 Market Price
| | 2001 Market Price
|
Three Months Ended
| | High
| | Low
| | Close
| | Dividends Per Share
| | High
| | Low
| | Close
| | Dividends Per Share
|
March 31 | | 63.85 | | 55.05 | | 59.07 | | $ | 0.0900 | | 64.00 | | 44.25 | | 63.43 | | $ | 0.0800 |
June 30 | | 71.25 | | 57.19 | | 67.20 | | $ | 0.0900 | | 63.75 | | 51.91 | | 58.20 | | $ | 0.0800 |
September 30 | | 68.87 | | 49.86 | | 53.89 | | $ | 0.1000 | | 61.80 | | 42.20 | | 54.71 | | $ | 0.0900 |
December 31 | | 65.45 | | 49.90 | | 56.24 | | $ | 0.1000 | | 58.90 | | 47.02 | | 57.86 | | $ | 0.0900 |
“Financial peace of mind” is a trademark of Ambac Financial Group, Inc.
Designed and Produced by Taylor & Ives, Inc. NYC