UNITED STATES
SECURITIES AND EXCHANGE COMMISSION
Washington, D.C. 20549
FORM N-CSR
CERTIFIED SHAREHOLDER REPORT OF REGISTERED
MANAGEMENT INVESTMENT COMPANIES
Investment Company Act file number | 811-6302 |
|
Cohen & Steers Realty Shares, Inc. |
(Exact name of registrant as specified in charter) |
|
280 Park Avenue, New York, NY | | 10017 |
(Address of principal executive offices) | | (Zip code) |
|
Adam M. Derechin
Cohen & Steers Capital Management, Inc.
280 Park Avenue
New York, New York 10017 |
(Name and address of agent for service) |
|
Registrant’s telephone number, including area code: | (212) 832-3232 | |
|
Date of fiscal year end: | December 31 | |
|
Date of reporting period: | December 31, 2007 | |
| | | | | | | | |
Item 1. Reports to Stockholders.
COHEN & STEERS REALTY SHARES, INC.
February 8, 2008
To Our Shareholders:
We are pleased to submit to you our report for the year ended December 31, 2007. The net asset value at that date was $58.80 per share. In addition, a distribution of $12.268 per share which consisted of ordinary income of $0.494 per share, a short-term capital gain of $0.604 per share and a long-term capital gain of $11.170 per share was declared for shareholders of record on December 28, 2007 and was paid on December 31, 2007a.
The total return, including income and change in net asset value, for the fund and the comparative benchmarks were:
| | | Six Months Ended
December 31, 2007 | | Year Ended
December 31, 2007 | |
| Cohen & Steers Realty Shares | | | –13.02 | % | | | –19.19 | % | |
| FTSE NAREIT Equity REIT Indexb | | | –10.42 | % | | | –15.69 | % | |
| S&P 500 Indexb | | | –1.37 | % | | | 5.49 | % | |
The performance data quoted represent past performance. Past performance is no guarantee of future results. The investment return and the principal value of an investment will fluctuate and shares, if redeemed, may be worth more or less than their original cost. Current performance may be lower or higher than the performance data quoted. Total returns of the fund current to the most recent month-end can be obtained by visiting our Web site at cohenandsteers.com.
Investment Review
The year was a turbulent one for REITs, which suffered a decline after four straight years of double-digit gains and seven years of positive total returns. As the year began, real estate securities continued to be buoyed by a number of factors. The economy was strong, driving growth in demand for commercial real estate. New supply of competitive commercial real estate product was relatively muted, despite real estate being in a mature stage of its cycle. Debt markets were highly liquid and accommodative of real estate M&A activity, including leveraged buyouts. This was highlighted in January by a bidding contest for Equity Office Properties, which was acquired by The Blackstone Group in a $41 billion transaction, at a 24% premium to the market price when the offer was first made.
a Please note that distributions paid by the fund to shareholders are subject to recharacterization for tax purposes. The final tax treatment of these distributions is reported to shareholders after the close of the calendar year.
b The FTSE NAREIT Equity REIT Index is an unmanaged, market capitalization weighted index of all publicly traded REITs that invest predominantly in the equity ownership of real estate. The index is designed to reflect the performance of all publicly traded equity REITs as a whole. The S&P 500 Index is an unmanaged index of common stocks that is frequently used as a general measure of stock market performance.
1
COHEN & STEERS REALTY SHARES, INC.
REITs disproportionately hit by credit woes
While real estate fundamentals did stay generally healthy through the year, concerns over subprime mortgages began to mount, resulting in a general re-pricing of risk and a dramatic widening of credit spreads in July. Commercial banks became reluctant to lend in order to preserve capital to deal with losses from a wide variety of financial instruments. Loans to finance LBOs stopped abruptly, removing a positive catalyst for the REIT market (REITs had been a prime target of private equity investors). In addition, the credit crunch increased the possibility of a U.S. economic recession, fueling worries over underlying fundamentals for real estate.
Real estate securities, which had reached an all-time high in February 2007, declined more than 20% from that peak by August. REITs were volatile over the remainder of the year, as investors reacted to monetary news (the Federal Reserve reduced interest rates from 5.25% to 4.25% between September and the end of the year) and the latest unsettling credit news.
Most property sectors declined in the year. Amid the economic and financial uncertainty, the best performers were generally sectors with longer leases such as health care (which had a total return of +2.1% in 2007). The industrial sector (+0.4%) also had a positive total return, benefiting from strong global trade and demand for warehouse space. Apartments (–25.4%) had a sizable decline, reflecting their shorter duration leases and concerns over a rise in single-family homes available for rent. The office sector (–19.0%) also underperformed, amid fears that unemployment would rise, particularly in markets with high concentrations of financial services tenants.
Hindered by overweights in apartments and offices
The fund's performance reflected the poor environment for real estate securities in 2007. Factors that contributed to the fund's underperformance relative to its NAREIT benchmark included our underweight in the health care sector; this was partly mitigated by stock selection. Our overweights in the office, self storage, hotel and apartment sectors (and stock selection in apartments) also hindered performance. Despite recent declines, we believe we own high-quality companies in these sectors with attractive fundamentals and long-term total return potential.
Positive contributors to relative performance included stock selection in the hotel and office sectors. Stock selection in the regional mall and industrial sectors also aided performance, although our underweight in both lessened the influence.
Investment Outlook
Real estate securities, which had factored in a good deal of positive news at the start of the year, ended 2007 with considerable pessimism priced into their shares. Overall, REITs were trading at an 18% discount to their underlying net asset value as of December 31, 2007, compared with a premium of 13% at the end of 2006, and compared with a historical average premium of 5%. The size of this discount suggests to us that the market is expecting at least a mild recession and perhaps a meaningful decline in property values. Our view is that the economy will slow, with some possibility of it dipping into a shallow recession, before reaccelerating as monetary
2
COHEN & STEERS REALTY SHARES, INC.
actions take hold. We have already factored modest declines into property asset values due to higher cap rates, particularly for class B properties and secondary markets; but we do not expect a dramatic downturn.
REITs more attractive vs. stocks generally
At the end of 2006 we anticipated that the stock-multiple expansion phase of the REIT market cycle would end, based on a leveling out of cash-flow growth rates. We expected more normalized total returns, but the sudden and severe emergence of the credit crisis weighed heavily on real estate securities. In the wake of a difficult year, we believe that REITs have improved return prospects for 2008. The group's projected earnings growth is higher than projections for the S&P 500 Index, yet REIT earnings are far less volatile than the average S&P 500 company. In addition, at 14.5 times forward earnings, REITs have a lower P/E ratio than the S&P 500 (16.3x) while their dividend yield is higher (4.9% vs. 2.0%). REIT dividend yields also compared favorably with the 10-year Treasury bond's 4.0% yield at the end of 2007. In an uncertain environment, investors could find these metrics appealing.
With regard to fundamentals, we believe that modest levels of employment growth stand to support demand for sectors such as offices, apartments and hotels, yet new supply is likely to be quite restrained due to the lack of credit for construction loans, which are, by their nature, more risky. Of course, ongoing credit woes could continue to hamper REITs and stocks broadly, but we believe REITs are positioned to perform well once investors sense that the worst of the credit news is behind us. In this environment, where investment opportunities are increasing due to the credit crunch, we remain highly focused on companies with strong managements, compelling long-term business models and properties in the most desirable locations.
3
COHEN & STEERS REALTY SHARES, INC.
 | |  | |
|
| MARTIN COHEN | | ROBERT H. STEERS | |
|
| Co-chairman | | Co-chairman | |
|
 | |  | |
|
| JAMES S. CORL | | JON CHEIGH | |
|
| Portfolio Manager | | Portfolio Manager | |
|
The views and opinions in the preceding commentary are as of the date stated and are subject to change. This material represents an assessment of the market environment at a specific point in time, should not be relied upon as investment advice and is not intended to predict or depict performance of any investment.
Visit Cohen & Steers online at cohenandsteers.com
For more information about any of our funds, visit cohenandsteers.com, where you'll find daily net asset values, fund fact sheets and portfolio highlights. You can also access newsletters, education tools and market updates covering REIT, utility and preferred securities sectors.
In addition, our Web site contains comprehensive information about our firm, including our most recent press releases, profiles of our senior investment professionals, and an overview of our investment approach.
4
COHEN & STEERS REALTY SHARES, INC.
Performance Review (Unaudited)
Growth of a $10,000 Investment

Average Annual Total Returns—For Periods Ended December 31, 2007
| | | 1 Year | | 5 Years | | 10 Years | | Since Inceptionb | |
| Fund | | | -19.19 | % | | | 19.48 | % | | | 10.92 | % | | | 14.09 | % | |
The performance data quoted represent past performance. Past performance is no guarantee of future results. The investment return and principal value of an investment will fluctuate and shares, when redeemed, may be worth more or less than their original cost. Current performance may be lower or higher than the performance data quoted. Performance information current to the most recent month-end can be obtained by visiting our Web site at cohenandsteers.com. The performance graph and table do not reflect the deduction of taxes that a shareholder would pay on fund distributions or the redemption of fund shares.
The annual expense ratio as reported in the prospectus dated May 1, 2007 was 0.96%.
a The comparative indexes are not adjusted to reflect expenses or other fees that the SEC requires to be reflected in the fund's performance. The fund's performance assumes the reinvestment of all dividends and distributions. For more information, including charges and expenses, please read the prospectus carefully before you invest.
b Inception date of July 2, 1991.
5
COHEN & STEERS REALTY SHARES, INC.
Expense Example
(Unaudited)
As a shareholder of the fund, you incur two types of costs: (1) transaction costs, including redemption fees and (2) ongoing costs including management fees and other fund expenses. This example is intended to help you understand your ongoing costs (in dollars) of investing in the fund and to compare these costs with the ongoing costs of investing in other mutual funds.
The example is based on an investment of $1,000 invested at the beginning of the period and held for the entire period July 1, 2007—December 31, 2007.
Actual Expenses
The first line of the table below provides information about actual account values and expenses. You may use the information in this line, together with the amount you invested, to estimate the expenses that you paid over the period. Simply divide your account value by $1,000 (for example, an $8,600 account value divided by $1,000 = 8.6), then multiply the result by the number in the first line under the heading entitled "Expenses Paid During Period" to estimate the expenses you paid on your account during this period.
Hypothetical Example for Comparison Purposes
The second line of the table below provides information about hypothetical account values and hypothetical expenses based on the fund's actual expense ratio and an assumed rate of return of 5% per year before expenses, which is not the fund's actual return. The hypothetical account values and expenses may not be used to estimate the actual ending account balance or expenses you paid for the period. You may use this information to compare the ongoing cost of investing in the fund and other funds. To do so, compare this 5% hypothetical example with the 5% hypothetical examples that appear in the shareholder reports of other funds.
Please note that the expenses shown in the table are meant to highlight your ongoing costs only and do not reflect any transactional costs, such as sales charges (loads) and redemption fees. Therefore, the second line of the table is useful in comparing ongoing costs only, and will not help you determine the relative total costs of owning different funds. In addition, if these transactional costs were included, your costs would have been higher.
| | | Beginning
Account Value
July 1, 2007 | | Ending
Account Value
December 31, 2007 | | Expenses Paid
During Period*
July 1, 2007—
December 31, 2007 | |
| Actual (–13.02% return) | | $ | 1,000.00 | | | $ | 869.80 | | | $ | 4.67 | | |
| Hypothetical (5% annual return before expenses) | | $ | 1,000.00 | | | $ | 1,020.21 | | | $ | 5.04 | | |
* Expenses are equal to the fund's annualized expense ratio of 0.99% multiplied by the average account value over the period, multiplied by 184/365 (to reflect the one-half year period).
6
COHEN & STEERS REALTY SHARES, INC.
DECEMBER 31, 2007
Top Ten Holdings
(Unaudited)
| Security | | Market
Value | | % of
Net
Assets | |
| Simon Property Group | | $ | 182,201,705 | | | | 7.9 | % | |
| Boston Properties | | | 148,769,475 | | | | 6.5 | | |
| Public Storage | | | 144,899,081 | | | | 6.3 | | |
| SL Green Realty Corp. | | | 131,850,284 | | | | 5.7 | | |
| ProLogis | | | 108,580,778 | | | | 4.7 | | |
| Vornado Realty Trust | | | 104,728,573 | | | | 4.6 | | |
| General Growth Properties | | | 102,133,730 | | | | 4.5 | | |
| Host Hotels & Resorts | | | 95,115,917 | | | | 4.1 | | |
| Macerich Co. | | | 93,262,129 | | | | 4.1 | | |
| Federal Realty Investment Trust | | | 77,300,357 | | | | 3.4 | | |
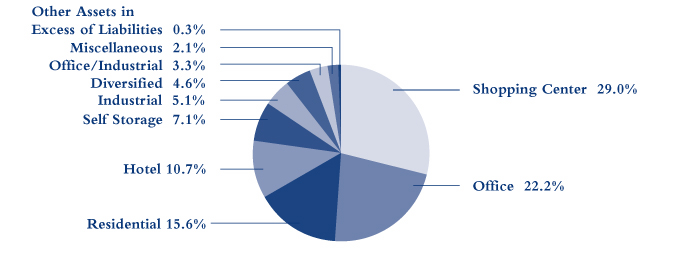
Sector Breakdown
(Based on Net Assets)
(Unaudited)
7
COHEN & STEERS REALTY SHARES, INC.
SCHEDULE OF INVESTMENTS
December 31, 2007
| | | | | Number
of Shares | | Value | |
| COMMON STOCK | | | 99.7 | % | | | | | | | | | |
| DIVERSIFIED | | | 4.6 | % | | | | | | | | | |
| Vornado Realty Trust | | | | | | | 1,190,774 | | | $ | 104,728,573 | | |
| HEALTH CARE | | | 1.3 | % | | | | | | | | | |
| Ventas | | | | | | | 671,837 | | | | 30,400,624 | | |
| HOTEL | | | 10.7 | % | | | | | | | | | |
| Host Hotels & Resorts | | | | | | | 5,581,920 | | | | 95,115,917 | | |
| LaSalle Hotel Properties | | | | | | | 1,065,800 | | | | 33,999,020 | | |
| Starwood Hotels & Resorts Worldwide | | | | | | | 1,487,900 | | | | 65,512,237 | | |
| Strategic Hotels & Resorts | | | | | | | 1,551,600 | | | | 25,958,268 | | |
| Sunstone Hotel Investors | | | | | | | 1,352,209 | | | | 24,731,902 | | |
| | | | | | | | 245,317,344 | | |
| INDUSTRIAL | | | 5.1 | % | | | | | | | | | |
| AMB Property Corp. | | | | | | | 152,600 | | | | 8,783,656 | | |
| ProLogis | | | | | | | 1,713,171 | | | | 108,580,778 | | |
| | | | | | | | 117,364,434 | | |
| OFFICE | | | 22.2 | % | | | | | | | | | |
| Alexandria Real Estate Equities | | | | | | | 64,464 | | | | 6,554,055 | | |
| BioMed Realty Trust | | | | | | | 1,753,033 | | | | 40,617,775 | | |
| Boston Properties | | | | | | | 1,620,406 | | | | 148,769,475 | | |
| Brookfield Properties Corp. | | | | | | | 987,345 | | | | 19,006,391 | | |
| Corporate Office Properties Trust | | | | | | | 155,700 | | | | 4,904,550 | | |
| Douglas Emmett | | | | | | | 1,493,650 | | | | 33,771,426 | | |
| DuPont Fabros Technology | | | | | | | 389,628 | | | | 7,636,709 | | |
| Forest City Enterprises | | | | | | | 647,500 | | | | 28,774,900 | | |
| Kilroy Realty Corp. | | | | | | | 674,124 | | | | 37,049,855 | | |
| Mack-Cali Realty Corp. | | | | | | | 673,023 | | | | 22,882,782 | | |
| Maguire Properties | | | | | | | 929,000 | | | | 27,377,630 | | |
| SL Green Realty Corp. | | | | | | | 1,410,767 | | | | 131,850,284 | | |
| | | | | | | | 509,195,832 | | |
See accompanying notes to financial statements.
8
COHEN & STEERS REALTY SHARES, INC.
SCHEDULE OF INVESTMENTS—(Continued)
December 31, 2007
| | | | | Number
of Shares | | Value | |
| OFFICE/INDUSTRIAL | | | 3.3 | % | | | | | | | | | |
| EastGroup Properties | | | | | | | 285,000 | | | $ | 11,927,250 | | |
| Liberty Property Trust | | | | | | | 1,585,000 | | | | 45,663,850 | | |
| PS Business Parks | | | | | | | 362,400 | | | | 19,044,120 | | |
| | | | | | | | 76,635,220 | | |
| RESIDENTIAL | | | 15.6 | % | | | | | | | | | |
| APARTMENT | | | 14.4 | % | | | | | | | | | |
| Apartment Investment & Management Co. | | | | | | | 1,263,600 | | | | 43,884,828 | | |
| AvalonBay Communities | | | | | | | 779,162 | | | | 73,350,311 | | |
| BRE Properties | | | | | | | 1,427,300 | | | | 57,848,469 | | |
| Camden Property Trust | | | | | | | 345,100 | | | | 16,616,565 | | |
| Equity Residential | | | | | | | 2,025,696 | | | | 73,877,133 | | |
| Essex Property Trust | | | | | | | 173,352 | | | | 16,900,086 | | |
| Home Properties | | | | | | | 178,800 | | | | 8,019,180 | | |
| UDR | | | | | | | 1,994,262 | | | | 39,586,101 | | |
| | | | | | | | 330,082,673 | | |
| MANUFACTURED HOME | | | 1.2 | % | | | | | | | | | |
| Equity Lifestyle Properties | | | | | | | 606,785 | | | | 27,711,871 | | |
| TOTAL RESIDENTIAL | | | | | | | | | | | 357,794,544 | | |
| SELF STORAGE | | | 7.1 | % | | | | | | | | | |
| Extra Space Storage | | | | | | | 903,800 | | | | 12,915,302 | | |
| Public Storage | | | | | | | 1,973,833 | | | | 144,899,081 | | |
| U-Store-It Trust | | | | | | | 566,400 | | | | 5,188,224 | | |
| | | | | | | | 163,002,607 | | |
| SHOPPING CENTER | | | 29.0 | % | | | | | | | | | |
| COMMUNITY CENTER | | | 11.6 | % | | | | | | | | | |
| Developers Diversified Realty Corp. | | | | | | | 1,787,603 | | | | 68,447,319 | | |
| Equity One | | | | | | | 818,390 | | | | 18,847,522 | | |
| Federal Realty Investment Trust | | | | | | | 940,966 | | | | 77,300,357 | | |
| Inland Real Estate Corp. | | | | | | | 368,693 | | | | 5,220,693 | | |
| Kimco Realty Corp. | | | | | | | 693,155 | | | | 25,230,842 | | |
| Regency Centers Corp. | | | | | | | 917,437 | | | | 59,165,512 | | |
| Weingarten Realty Investors | | | | | | | 363,978 | | | | 11,443,468 | | |
| | | | | | | | 265,655,713 | | |
See accompanying notes to financial statements.
9
COHEN & STEERS REALTY SHARES, INC.
SCHEDULE OF INVESTMENTS—(Continued)
December 31, 2007
| | | | | Number
of Shares | | Value | |
| REGIONAL MALL | | | 17.4 | % | | | | | | | | | |
| General Growth Properties | | | | | | | 2,480,178 | | | $ | 102,133,730 | | |
| Macerich Co. | | | | | | | 1,312,442 | | | | 93,262,129 | | |
| Simon Property Group | | | | | | | 2,097,648 | | | | 182,201,705 | | |
| Taubman Centers | | | | | | | 451,754 | | | | 22,221,779 | | |
| | | | | | | | 399,819,343 | | |
| TOTAL SHOPPING CENTER | | | | | | | | | | | 665,475,056 | | |
| SPECIALTY | | | 0.8 | % | | | | | | | | | |
| Plum Creek Timber Co. | | | | | | | 382,458 | | | | 17,608,366 | | |
| TOTAL COMMON STOCK (Identified cost—$1,798,301,855) | | | | | | | | | | | 2,287,522,600 | | |
| | | | | Principal
Amount | | | |
| COMMERCIAL PAPER | | | 0.9 | % | | | | | | | | | |
Prudential Funding Corp., 3.15%, due 1/2/08
(Identified cost—$22,149,062) | | | | | | $ | 22,151,000 | | | | 22,149,062 | | |
| TOTAL INVESTMENTS (Identified cost—$1,820,450,917) | | | 100.6 | % | | | | | | | 2,309,671,662 | | |
| LIABILITIES IN EXCESS OF OTHER ASSETS | | | (0.6 | )% | | | | | | | (14,572,031 | ) | |
NET ASSETS (Equivalent to $58.80 per share based on 39,032,152
shares of common stock outstanding) | | | 100.0 | % | | | | | | $ | 2,295,099,631 | | |
Note: Percentages indicated are based on the net assets of the fund.
See accompanying notes to financial statements.
10
COHEN & STEERS REALTY SHARES, INC.
STATEMENT OF ASSETS AND LIABILITIES
December 31, 2007
| ASSETS: | |
| Investments in securities, at value (Identified cost—$1,820,450,917) | | $ | 2,309,671,662 | | |
| Dividends receivable | | | 26,945,335 | | |
| Receivable for fund shares sold | | | 13,416,989 | | |
| Receivable for investment securities sold | | | 12,347,172 | | |
| Other assets | | | 33,552 | | |
| Total Assets | | | 2,362,414,710 | | |
| LIABILITIES: | |
| Payable for fund shares redeemed | | | 35,389,857 | | |
| Payable for dividends declared | | | 27,629,586 | | |
| Payable for investment advisory fees | | | 1,709,375 | | |
| Payable for investment securities purchased | | | 1,530,065 | | |
| Payable for administration fees | | | 42,186 | | |
| Payable for directors' fees | | | 4,149 | | |
| Other liabilities | | | 1,009,861 | | |
| Total Liabilities | | | 67,315,079 | | |
| NET ASSETS applicable to 39,032,152 shares of $0.001 par value of common stock outstanding | | $ | 2,295,099,631 | | |
| NET ASSET VALUE PER SHARE: | |
| ($2,295,099,631 ÷ 39,032,152 shares outstanding) | | $ | 58.80 | | |
| NET ASSETS consist of: | |
| Paid-in-capital | | $ | 1,823,649,163 | | |
| Accumulated undistributed net investment income | | | 5,839,244 | | |
| Accumulated net realized loss on investments | | | (23,609,521 | ) | |
| Net unrealized appreciation on investments | | | 489,220,745 | | |
| | | $ | 2,295,099,631 | | |
See accompanying notes to financial statements.
11
COHEN & STEERS REALTY SHARES, INC.
STATEMENT OF OPERATIONS
For the Year Ended December 31, 2007
| Investment Income: | |
| Dividend income (net of $298,891 of foreign withholding tax) | | $ | 68,876,241 | | |
| Interest income | | | 1,821,429 | | |
| Total Income | | | 70,697,670 | | |
| Expenses: | |
| Investment advisory fees | | | 26,073,330 | | |
| Transfer agent fees and expenses | | | 2,590,580 | | |
| Administration fees | | | 1,144,691 | | |
| Reports to shareholders | | | 437,462 | | |
| Custodian fees and expenses | | | 279,349 | | |
| Professional fees | | | 147,536 | | |
| Registration and filing fees | | | 101,531 | | |
| Directors' fees and expenses | | | 47,235 | | |
| Line of credit fees | | | 45,611 | | |
| Miscellaneous | | | 128,668 | | |
| Total Expenses | | | 30,995,993 | | |
| Net Investment Income | | | 39,701,677 | | |
| Net Realized and Unrealized Gain (Loss) on Investments: | |
| Net realized gain on investments | | | 468,079,489 | | |
| Net change in unrealized appreciation on investments | | | (1,135,088,153 | ) | |
| Net realized and unrealized loss on investments | | | (667,008,664 | ) | |
| Net Decrease in Net Assets Resulting from Operations | | $ | (627,306,987 | ) | |
See accompanying notes to financial statements.
12
COHEN & STEERS REALTY SHARES, INC.
STATEMENT OF CHANGES IN NET ASSETS
| | | For the
Year Ended
December 31, 2007 | | For the
Year Ended
December 31, 2006 | |
| Change in Net Assets: | |
| From Operations: | |
| Net investment income | | $ | 39,701,677 | | | $ | 32,701,682 | | |
| Net realized gain on investments | | | 468,079,489 | | | | 304,962,659 | | |
| Net change in unrealized appreciation on investments | | | (1,135,088,153 | ) | | | 605,809,054 | | |
Net increase (decrease) in net assets resulting from
operations | | | (627,306,987 | ) | | | 943,473,395 | | |
| Dividends and Distributions to Shareholders from: | |
| Net investment income | | | (36,692,790 | ) | | | (34,076,502 | ) | |
| Net realized gain on investments | | | (424,150,489 | ) | | | (303,898,783 | ) | |
| Tax return of capital | | | — | | | | (19,923,052 | ) | |
| Total dividends and distributions to shareholders | | | (460,843,279 | ) | | | (357,898,337 | ) | |
| Capital Stock Transactions: | |
Increase (decrease) in net assets from fund share
transactions | | | (218,690,650 | ) | | | 550,750,678 | | |
| Total increase (decrease) in net assets | | | (1,306,840,916 | ) | | | 1,136,325,736 | | |
| Net Assets: | |
| Beginning of year | | | 3,601,940,547 | | | | 2,465,614,811 | | |
| End of yeara | | $ | 2,295,099,631 | | | $ | 3,601,940,547 | | |
a Includes undistributed net investment income of $5,839,244 and $0, respectively.
See accompanying notes to financial statements.
13
COHEN & STEERS REALTY SHARES, INC.
FINANCIAL HIGHLIGHTS
The following table includes selected data for a share outstanding throughout each year and other performance information derived from the financial statements. It should be read in conjunction with the financial statements and notes thereto.
| | | For the Year ended December 31, | |
| Per Share Operating Performance: | | 2007 | | 2006 | | 2005 | | 2004 | | 2003 | |
| Net asset value, beginning of year | | $ | 89.45 | | | $ | 72.59 | | | $ | 69.66 | | | $ | 55.64 | | | $ | 43.34 | | |
| Income from investment operations: | |
| Net investment income | | | 1.24 | a | | | 0.91 | | | | 1.04 | | | | 1.21 | | | | 1.47 | | |
Net realized and unrealized gain (loss) on
investments | | | (18.21 | ) | | | 25.52 | | | | 9.17 | | | | 19.71 | | | | 14.63 | | |
Total income (loss) from investment
operations | | | (16.97 | ) | | | 26.43 | | | | 10.21 | | | | 20.92 | | | | 16.10 | | |
| Less dividends and distributions to shareholders from: | |
| Net investment income | | | (1.09 | ) | | | (0.91 | ) | | | (1.04 | ) | | | (1.21 | ) | | | (1.88 | ) | |
| Net realized gain on investments | | | (12.63 | ) | | | (8.14 | ) | | | (5.80 | ) | | | (5.32 | ) | | | (1.93 | ) | |
| Tax return of capital | | | — | | | | (0.53 | ) | | | (0.46 | ) | | | (0.38 | ) | | | — | | |
Total dividends and distributions to
shareholders | | | (13.72 | ) | | | (9.58 | ) | | | (7.30 | ) | | | (6.91 | ) | | | (3.81 | ) | |
| Redemption fees retained by the fund | | | 0.04 | | | | 0.01 | | | | 0.02 | | | | 0.01 | | | | 0.01 | | |
| Net increase (decrease) in net asset value | | | (30.65 | ) | | | 16.86 | | | | 2.93 | | | | 14.02 | | | | 12.30 | | |
| Net asset value, end of year | | $ | 58.80 | | | $ | 89.45 | | | $ | 72.59 | | | $ | 69.66 | | | $ | 55.64 | | |
| Total investment return | | | –19.19 | % | | | 37.13 | % | | | 14.89 | % | | | 38.48 | % | | | 38.09 | % | |
| Ratios/Supplemental Data: | |
| Net assets, end of year (in millions) | | $ | 2,295.1 | | | $ | 3,601.9 | | | $ | 2,466.0 | | | $ | 2,264.7 | | | $ | 1,681.3 | | |
| Ratio of expenses to average daily net assets | | | 0.95 | % | | | 0.96 | % | | | 0.97 | % | | | 1.01 | % | | | 1.07 | % | |
Ratio of net investment income to average daily net
assets | | | 1.21 | % | | | 1.08 | % | | | 1.45 | % | | | 2.00 | % | | | 2.96 | % | |
| Portfolio turnover rate | | | 58 | % | | | 31 | % | | | 28 | % | | | 29 | % | | | 37 | % | |
a 15.1% of net investment income was attributable to a special dividend paid by Boston Properties, Inc.
See accompanying notes to financial statements.
14
COHEN & STEERS REALTY SHARES, INC.
NOTES TO FINANCIAL STATEMENTS
Note 1. Significant Accounting Policies
Cohen & Steers Realty Shares, Inc. (the fund) was incorporated under the laws of the State of Maryland on April 26, 1991 and is registered under the Investment Company Act of 1940, as amended, as a nondiversified, open-end management investment company. The fund's investment objective is total return.
The following is a summary of significant accounting policies consistently followed by the fund in the preparation of its financial statements. The policies are in conformity with accounting principles generally accepted in the United States of America (GAAP). The preparation of the financial statements in accordance with GAAP requires management to make estimates and assumptions that affect the reported amounts of assets and liabilities at the date of the financial statements and the reported amounts of income and expenses during the reporting period. Actual results could differ from those estimates.
Portfolio Valuation: Investments in securities that are listed on the New York Stock Exchange are valued, except as indicated below, at the last sale price reflected at the close of the New York Stock Exchange on the business day as of which such value is being determined. If there has been no sale on such day, the securities are valued at the mean of the closing bid and asked prices for the day or, if no asked price is available, at the bid price.
Securities not listed on the New York Stock Exchange but listed on other domestic or foreign securities exchanges or admitted to trading on the National Association of Securities Dealers Automated Quotations, Inc. (Nasdaq) national market system are valued in a similar manner. Securities traded on more than one securities exchange are valued at the last sale price on the business day as of which such value is being determined as reflected on the tape at the close of the exchange representing the principal market for such securities.
Readily marketable securities traded in the over-the-counter market, including listed securities whose primary market is believed by Cohen & Steers Capital Management, Inc. (the advisor) to be over-the-counter, but excluding securities admitted to trading on the Nasdaq National List, are valued at the official closing prices as reported by Nasdaq, the National Quotation Bureau, or such other comparable sources as the Board of Directors deem appropriate to reflect their fair market value. If there has been no sale on such day, the securities are valued at the mean of the closing bid and asked prices for the day, or if no asked price is available, at the bid price. Where securities are traded on more than one exchange and also over-the-counter, the securities will generally be valued using the quotations the Board of Directors believes most closely reflect the value of such securities.
Securities for which market prices are unavailable, or securities for which the advisor determines that bid and/or asked price does not reflect market value, will be valued at fair value pursuant to procedures approved by the fund's Board of Directors. Circumstances in which market prices may be unavailable include, but are not limited to, when trading in a security is suspended, the exchange on which the security is traded is subject to an unscheduled close or disruption or material events occur after the close of the exchange on which the security is principally traded. In these circumstances, the fund determines fair value in a manner that fairly reflects the market value of the security on the valuation date based on consideration of any information or factors it deems
15
COHEN & STEERS REALTY SHARES, INC.
NOTES TO FINANCIAL STATEMENTS—(Continued)
appropriate. These may include recent transactions in comparable securities, information relating to the specific security and developments in the markets.
The fund's use of fair value pricing may cause the net asset value of fund shares to differ from the net asset value that would be calculated using market quotations. Fair value pricing involves subjective judgments and it is possible that the fair value determined for a security may be materially different than the value that could be realized upon the sale of that security.
Short-term debt securities, which have a maturity date of 60 days or less, are valued at amortized cost, which approximates value.
Security Transactions and Investment Income: Security transactions are recorded on trade date. Realized gains and losses on investments sold are recorded on the basis of identified cost. Interest income is recorded on the accrual basis. Discounts are accreted and premiums are amortized over the life of the respective securities. Dividend income is recorded on the ex-dividend date. The fund records distributions received in excess of income from underlying investments as a reduction of cost of investments and/or realized gain. Such amounts are based on estimates if actual amounts are not available and actual amounts of income, realized gain and return of capital may differ from the estimated amounts. The fund adjusts the estimated amounts of the components of distributions (and consequently its net investment income) as an increase to unrealized appreciation/(depre ciation) and realized gain/(loss) on investments as necessary once the issuers provide information about the actual composition of the distributions.
Dividends and Distributions to Shareholders: Dividends from net investment income and capital gain distributions are determined in accordance with U.S. federal income tax regulations, which may differ from GAAP. Dividends from net investment income are declared and paid quarterly. Net realized capital gains, unless offset by any available capital loss carryforward, are typically distributed to shareholders at least annually. Dividends and distributions to shareholders are recorded on the ex-dividend date and are automatically reinvested in full and fractional shares of the fund based on the net asset value per share at the close of business on the payable date unless the shareholder has elected to have them paid in cash.
Distributions paid by the fund are subject to recharacterization for tax purposes. Based upon the results of operations for the year ended December 31, 2007, a portion of the dividends have been reclassified to distributions of net realized capital gains.
Income Taxes: It is the policy of the fund to continue to qualify as a regulated investment company, if such qualification is in the best interest of the shareholders, by complying with the requirements of Subchapter M of the Internal Revenue Code applicable to regulated investment companies, and by distributing substantially all of its taxable earnings to its shareholders. Accordingly, no provision for federal income or excise tax is necessary.
16
COHEN & STEERS REALTY SHARES, INC.
NOTES TO FINANCIAL STATEMENTS—(Continued)
Note 2. Investment Advisory and Administration Fees and Other Transactions with Affiliates
Investment Advisory Fees: The advisor serves as the fund's investment advisor pursuant to an investment advisory agreement (the advisory agreement). Under the terms of the advisory agreement, the advisor provides the fund with the day-to-day investment decisions and generally manages the fund's investments in accordance with the stated policies of the fund, subject to the supervision of the fund's Board of Directors. For the services provided to the fund, the advisor receives a fee, accrued daily and paid monthly, at the annual rate of 0.85% for the first $1.5 billion and 0.75% thereafter of the average daily net assets of the fund.
Administration Fees: The fund has entered into an administration agreement with the advisor under which the advisor performs certain administrative functions for the fund and receives a fee, accrued daily and paid monthly, at the annual rate of 0.02% of the fund's average daily net assets. For the year ended December 31, 2007, the fund paid the advisor $655,289 in fees under this administration agreement. Additionally, the fund has retained State Street Bank and Trust Company as sub-administrator under a fund accounting and administration agreement.
Directors' and Officers' Fees: Certain directors and officers of the fund are also directors, officers, and/or employees of the advisor. The fund does not pay compensation to any affiliated directors and officers except for the Chief Compliance Officer, who received $33,901 from the fund for the year ended December 31, 2007.
Note 3. Purchases and Sales of Securities
Purchases and sales of securities, excluding short-term investments, for the year ended December 31, 2007, totaled $1,844,902,830 and $2,384,406,900, respectively.
Note 4. Income Tax Information
The tax character of dividends and distributions paid was as follows:
| | | For the Year Ended
December 31, | |
| | | 2007 | | 2006 | |
| Ordinary income | | $ | 75,581,264 | | | $ | 87,029,373 | | |
| Long-term capital gains | | | 385,262,015 | | | | 250,945,912 | | |
| Tax return of capital | | | — | | | | 19,923,052 | | |
| Total dividends and distributions | | $ | 460,843,279 | | | $ | 357,898,337 | | |
17
COHEN & STEERS REALTY SHARES, INC.
NOTES TO FINANCIAL STATEMENTS—(Continued)
As of December 31, 2007, the tax-basis components of accumulated earnings and the federal tax cost were as follows:
| Gross unrealized appreciation | | $ | 600,100,505 | | |
| Gross unrealized depreciation | | | (134,489,278 | ) | |
| Net unrealized appreciation | | $ | 465,611,227 | | |
| Cost for federal income tax purposes | | $ | 1,844,060,435 | | |
As of December 31, 2007, the fund had temporary book/tax differences primarily attributable to wash sales on portfolio securities and permanent book/tax differences primarily attributable to redemptions used as distributions. To reflect reclassifications arising from the permanent differences, paid-in capital was credited $57,449,009, accumulated net realized gain was charged $60,279,366 and accumulated net investment income was credited $2,830,357.
Note 5. Capital Stock
The fund is authorized to issue 200 million shares of capital stock at a par value of $0.001 per share. The Board of Directors of the fund is authorized to reclassify and issue any unissued shares of the fund without shareholder approval. Transactions in fund shares were as follows:
| | | For the
Year Ended
December 31, 2007 | | For the
Year Ended
December 31, 2006 | |
| | | Shares | | Amount | | Shares | | Amount | |
| Sold | | | 10,195,337 | | | $ | 900,518,114 | | | | 11,336,835 | | | $ | 968,664,364 | | |
Issued as reinvestment of
dividends and distributions | | | 7,023,478 | | | | 428,947,952 | | | | 3,848,095 | | | | 332,715,064 | | |
| Redeemed | | | (18,454,343 | ) | | | (1,549,610,014 | ) | | | (8,882,434 | ) | | | (751,084,429 | ) | |
| Redemption fees retained by funda | | | — | | | | 1,453,298 | | | | — | | | | 455,679 | | |
| Net increase (decrease) | | | (1,235,528 | ) | | $ | (218,690,650 | ) | | | 6,302,496 | | | $ | 550,750,678 | | |
a The fund may charge a 2% redemption fee on shares sold within 60 days of the time of purchase. Redemption fees are paid directly to the fund. Prior to September 28, 2007, the redemption fee was charged at a rate of 1% on shares sold within six months of the time of purchase.
18
COHEN & STEERS REALTY SHARES, INC.
NOTES TO FINANCIAL STATEMENTS—(Continued)
Note 6. Borrowings
The fund, in conjunction with other Cohen & Steers funds, is a party to a $200,000,000 syndicated credit agreement (the credit agreement) with State Street Bank and Trust Company, as administrative agent and operations agent, and the lenders identified in the credit agreement, which expires December 2008. The fund pays a commitment fee of 0.10% per annum on its proportionate share of the unused portion of the credit agreement.
During the year ended December 31, 2007, the fund did not utilize the line of credit.
Note 7. Other
In the normal course of business, the fund enters into contracts that provide general indemnifications. The fund's maximum exposure under these arrangements is dependent on claims that may be made against the fund in the future and, therefore, cannot be estimated; however, based on experience, the risk of material loss from such claims is considered remote.
Note 8. New Accounting Pronouncements
In July 2006, the Financial Accounting Standards Board (FASB) issued Interpretation 48, Accounting for Uncertainty in Income Taxes—an interpretation of FASB Statement 109 (FIN 48). FIN 48 clarifies the accounting for income taxes by prescribing the minimum recognition threshold a tax position must meet before being recognized in the financial statements. FIN 48 is effective for fiscal years beginning after December 15, 2006. An assessment of the fund's tax positions has been made and it has been determined that there is no impact to the fund's financial statements.
In September 2006, Statement of Financial Accounting Standards No. 157, Fair Value Measurements (SFAS 157), was issued and is effective for fiscal years beginning after November 15, 2007. SFAS 157 defines fair value, establishes a framework for measuring fair value and expands disclosures about fair value measurements. Management has evaluated the impact of SFAS 157 and it is not expected to have a material impact on the fund's net assets or results of operations.
19
COHEN & STEERS REALTY SHARES, INC.
REPORT OF INDEPENDENT REGISTERED PUBLIC ACCOUNTING FIRM
To the Board of Directors and Shareholders of
Cohen & Steers Realty Shares, Inc.
In our opinion, the accompanying statement of assets and liabilities, including the schedule of investments, and the related statements of operations and of changes in net assets and the financial highlights present fairly, in all material respects, the financial position of Cohen & Steers Realty Shares, Inc. (the "Fund") at December 31, 2007, the results of its operations for the year then ended, the changes in its net assets for each of the two years in the period then ended and the financial highlights for each of the five years in the period then ended, in conformity with accounting principles generally accepted in the United States of America. These financial statements and financial highlights (hereafter referred to as "financial statements") are the responsibility of the Fund's management. Our responsibility is to express an opinion on these financial statements based on our audits. We conducted our audits of these financial state ments in accordance with the standards of the Public Company Accounting Oversight Board (United States). Those standards require that we plan and perform the audit to obtain reasonable assurance about whether the financial statements are free of material misstatement. An audit includes examining, on a test basis, evidence supporting the amounts and disclosures in the financial statements, assessing the accounting principles used and significant estimates made by management, and evaluating the overall financial statement presentation. We believe that our audits, which included confirmation of securities at December 31, 2007 by correspondence with the custodian and brokers, provide a reasonable basis for our opinion.
PricewaterhouseCoopers LLP
New York, New York
February 18, 2008
20
COHEN & STEERS REALTY SHARES, INC.
TAX INFORMATION—2007 (Unaudited)
Pursuant to the Jobs and Growth Relief Reconciliation Act of 2003, the fund designates qualified dividend income of $4,114,322. Also, the fund designates a long-term capital gain distribution of $436,035,689 at the 15% rate and $7,323,771 at the 25% rate or maximum allowable.
OTHER INFORMATION
A description of the policies and procedures that the fund uses to determine how to vote proxies relating to portfolio securities is available (i) without charge, upon request, by calling 800-330-7348, (ii) on our Web site at cohenandsteers.com or (iii) on the Securities and Exchange Commission's Web site at http://www.sec.gov. In addition, the fund's proxy voting record for the most recent 12-month period ended June 30 is available (i) without charge, upon request, by calling 800-330-7348 or (ii) on the SEC's Web site at http://www.sec.gov.
The fund files its complete schedule of portfolio holdings with the SEC for the first and third quarters of each fiscal year on Form N-Q. The fund's Forms N-Q are available (i) without charge, upon request by calling 800-330-7348, or (ii) on the SEC's Web site at http://www.sec.gov. In addition, the Forms N-Q may be reviewed and copied at the SEC's Public Reference Room in Washington, DC. Information on the operation of the Public Reference Room may be obtained by calling 800-SEC-0330.
Please note that the distributions paid by the fund to shareholders are subject to recharacterization for tax purposes. The fund may also pay distributions in excess of the fund's net investment company taxable income and this excess would be a tax-free return of capital distributed from the fund's assets. The final tax treatment of all distributions is reported to shareholders on their 1099-DIV forms, which are mailed after the close of each calendar year.
21
COHEN & STEERS REALTY SHARES, INC.
MANAGEMENT OF THE FUND
The business and affairs of the fund are managed under the direction of the board of directors. The board of directors approves all significant agreements between the fund and persons or companies furnishing services to it, including the fund's agreements with its advisor, administrator, custodian and transfer agent. The management of the fund's day-to-day operations is delegated to its officers, the advisor and the fund's administrator, subject always to the investment objective and policies of the fund and to the general supervision of the board of directors.
The directors and officers of the fund and their principal occupations during the past five years are set forth below. The statement of additional information (SAI) includes additional information about fund directors and is available, without charge, upon request by calling 800-330-7348.
| Name, Address and Age* | | Position(s) Held
with Fund | | Term of
Office | | Principal Occupation
During Past 5 Years
(Including Other
Directorships Held) | | Number of
Funds Within
Fund
Complex
Overseen by
Director
(Including
the Fund) | | Length
of Time
Served** | |
| Interested Directors1 | |
|
Robert H. Steers
Age: 54 | | Director and Co-Chairman | | Until next election of directors | | Co-Chairman and Co-Chief Executive Officer of Cohen & Steers Capital Management, Inc. (CSCM), the fund's investment manager, and its parent company, Cohen & Steers, Inc. (CNS) since 2004. Vice President and Director, Cohen & Steers Securities, LLC (CSSL), the Cohen & Steers open-end funds' distributor. Prior thereto, Chairman of CSCM and the Cohen & Steers funds. | | | 22 | | | | 1991 | to present | |
|
Martin Cohen
Age: 59 | | Director and Co-Chairman | | Until next election of directors | | Co-Chairman and Co-Chief Executive Officer of CSCM and CNS. Vice President and Director of CSSL. Prior thereto, President of the CSCM and the Cohen & Steers funds. | | | 22 | | | | 1991 | to present | |
|
(table continued on next page)
* The address for each director is 280 Park Avenue, New York, NY 10017.
** The length of time served represents the year in which the director was first elected or appointed to any fund in the Cohen & Steers fund complex.
1 "Interested person", as defined in the 1940 Act, of the fund because of affiliation with CSCM.
22
COHEN & STEERS REALTY SHARES, INC.
(table continued from previous page)
| Name, Address and Age* | | Position(s) Held
with Fund | | Term of
Office | | Principal Occupation
During Past 5 Years
(Including Other
Directorships Held) | | Number of
Funds Within
Fund
Complex
Overseen by
Director
(Including
the Fund) | | Length
of Time
Served** | |
| Disinterested Directors | |
|
Bonnie Cohen2
Age: 65 | | Director | | Until next election of directors | | Consultant. Director, Reis, Inc.; Chair of the Board of Global Heritage Fund; Program member, The Moriah Fund; Advisory Committee member, The Posse Foundation; Board member, District of Columbia Public Libraries; Visiting Committee, Harvard Business School. Former Under Secretary of State for Management, United States Department of State, 1996-2000. | | | 22 | | | | 2001 | to present | |
|
George Grossman
Age: 54 | | Director | | Until next election of directors | | Attorney-at-law. | | | 22 | | | | 1993 | to present | |
|
Richard E. Kroon
Age: 65 | | Director | | Until next election of directors | | Member of Investment Committee, Monmouth University; retired Chairman and Managing Partner of the Sprout Group venture capital funds, then an affiliate of Donaldson, Lufkin & Jenrette Securities Corporation; and former Chairman of the National Venture Capital Association. | | | 22 | | | | 2004 | to present | |
|
Richard J. Norman
Age: 64 | | Director | | Until next election of directors | | Private Investor. Board of Directors of Maryland Public Television, Advisory Board Member of the Salvation Army. Prior thereto, Investment Representative of Morgan Stanley Dean Witter. | | | 22 | | | | 2001 | to present | |
|
(table continued on next page)
* The address for each director is 280 Park Avenue, New York, NY 10017.
** The length of time served represents the year in which the director was first elected or appointed to any fund in the Cohen & Steers fund complex.
2 Martin Cohen and Bonnie Cohen are not related.
23
COHEN & STEERS REALTY SHARES, INC.
(table continued from previous page)
| Name, Address and Age* | | Position(s) Held
with Fund | | Term of
Office | | Principal Occupation
During Past 5 Years
(Including Other
Directorships Held) | | Number of
Funds Within
Fund
Complex
Overseen by
Director
(Including
the Fund) | | Length
of Time
Served** | |
Frank K. Ross
Age: 64 | | Director | | Until next election of directors | | Professor of Accounting, Howard University; Board member of Pepco Holdings, Inc. (electric utility). Formerly, Midatlantic Area Managing Partner for Audit and Risk Advisory Services at KPMG LLP and Managing Partner of its Washington, DC office. | | | 22 | | | | 2004 | to present | |
|
Willard H. Smith Jr
Age: 71 | | Director | | Until next election of directors | | Board member of Essex Property Trust Inc., Realty Income Corporation and Crest Net Lease, Inc. Managing Director at Merrill Lynch & Co., Equity Capital Markets Division from 1983 to 1995. | | | 22 | | | | 1996 | to present | |
|
C. Edward Ward Jr.
Age: 61 | | Director | | Until next election of directors | | Member of the Board of Trustees of Directors Manhattan College, Riverdale, New York. Formerly head of closed-end fund listings for the New York Stock Exchange. | | | 22 | | | | 2004 | to present | |
|
* The address for each director is 280 Park Avenue, New York, NY 10017.
** The length of time served represents the year in which the director was first elected or appointed to any fund in the Cohen & Steers fund complex.
24
COHEN & STEERS REALTY SHARES, INC.
The officers of the fund (other than Messrs. Cohen and Steers, whose biographies are provided above), their address, their ages and their principal occupations for at least the past five years are set forth below.
| Name, Address and Age* | | Position(s)
With Fund | | Principal Occupation During Past 5 Years | | Length
of Time
Served** | |
| Adam M. Derechin Age: 43 | | President and Chief Executive Officer | | Chief Operating Officer of CSCM (since 2003) and CNS (since 2004). Prior to that, Senior Vice President of CSCM and Vice President and Assistant Treasurer of the Cohen & Steers funds. | | Since 2005 | |
|
| Joseph M. Harvey Age: 44 | | Vice President | | President of CSCM (since 2003) and CNS (since 2004). Prior to that, Senior Vice President and Director of Investment Research of CSCM. | | Since 2004 | |
|
| James S. Corl Age: 41 | | Vice President | | Executive Vice President of CSCM since 2004. Prior to that, Senior Vice President of CSCM. | | Since 2004 | |
|
| Jon Cheigh Age: 35 | | Vice President | | Senior Vice President of CSCM since 2005. Prior to that, vice president and research analyst for Security Capital. | | Since 2007 | |
|
| Francis C. Poli Age: 45 | | Secretary | | Executive Vice President, Secretary and General Counsel of CSCM and CNS since March 2007. Prior thereto, General Counsel of Allianz Global Investors of America LP. | | Since 2007 | |
|
| James Giallanza Age: 41 | | Treasurer | | Senior Vice President of CSCM since September 2006. Prior thereto, Deputy Head of the US Funds Administration and Treasurer & CFO of various mutual funds within the Legg Mason (formally Citigroup Asset Management) fund complex from August 2004 to September 2006; Director/Controller of the US wholesale business at UBS Global Asset Management (U.S.) from September 2001 to July 2004. | | Since 2006 | |
|
| Lisa Phelan Age: 39 | | Chief Compliance Officer | | Vice President & Director of Compliance of CSCM since January 2006. Chief Compliance Officer of CSSL since 2004. Prior to that, Compliance Officer of CSCM since 2004. Chief Compliance Officer, Avatar Associates & Overture Asset Managers, 2003-2004. First VP, Risk Management, Prudential Securities, Inc. 2000-2003. | | Since 2006 | |
|
* The address of each officer is 280 Park Avenue, New York, NY 10017.
** Officers serve one-year terms. The length of time served represents the year in which the officer was first elected to that position in any fund in the Cohen & Steers fund complex. All of the officers listed above are officers of one or more of the other funds in the complex.
25
COHEN & STEERS REALTY SHARES, INC.
Meet the Cohen & Steers family of open-end funds:
COHEN & STEERS
REALTY SHARES
• Designed for investors seeking maximum total return, investing primarily in REITs
• Symbol: CSRSX
COHEN & STEERS
REALTY INCOME FUND
• Designed for investors seeking maximum total return, investing primarily in real estate securities with an emphasis on both income and capital appreciation
• Symbols: CSEIX, CSBIX, CSCIX, CSDIX
COHEN & STEERS
INTERNATIONAL REALTY FUND
• Designed for investors seeking maximum total return, investing primarily in international real estate securities
• Symbols: IRFAX, IRFCX, IRFIX
COHEN & STEERS
DIVIDEND VALUE FUND
• Designed for investors seeking high current income and long-term growth of income and capital appreciation, investing primarily in dividend paying common stocks and preferred stocks
• Symbols: DVFAX, DVFCX, DVFIX
COHEN & STEERS
INSTITUTIONAL GLOBAL REALTY SHARES
• Designed for investors seeking maximum total return, investing primarily in global real estate securities
• Symbol: GRSIX
COHEN & STEERS
INSTITUTIONAL REALTY SHARES
• Designed for institutional investors seeking maximum total return, investing primarily in REITs
• Symbol: CSRIX
COHEN & STEERS
GLOBAL REALTY SHARES
• Designed for investors seeking maximum total return, investing in global real estate equity securities
• Symbols: CSFAX, CSFBX, CSFCX, CSSPX
COHEN & STEERS
UTILITY FUND
• Designed for investors seeking maximum total return, investing primarily in utilities
• Symbols: CSUAX, CSUBX, CSUCX, CSUIX
COHEN & STEERS
ASIA PACIFIC REALTY SHARES
• Designed for investors seeking maximum total return, investing primarily in real estate securities located in the Asia Pacific region
• Symbols: APFAX, APFCX, APFIX
COHEN & STEERS
EUROPEAN REALTY SHARES
• Designed for investors seeking maximum total return, investing primarily in real estate securities located in Europe
• Symbols: EURAX, EURCX, EURIX
Please consider the investment objectives, risks, charges and expenses of the fund carefully before investing. A prospectus containing this and other information can be obtained by calling 800-330-7348 or by visiting cohenandsteers.com. Please read the prospectus carefully before investing.
Cohen & Steers Securities, LLC, Distributor
26
COHEN & STEERS REALTY SHARES, INC.
OFFICERS AND DIRECTORS
Robert H. Steers
Director and co-chairman
Martin Cohen
Director and co-chairman
Bonnie Cohen
Director
George Grossman
Director
Richard E. Kroon
Director
Richard J. Norman
Director
Frank K. Ross
Director
Willard H. Smith Jr.
Director
C. Edward Ward, Jr.
Director
Adam M. Derechin
President and chief executive officer
Joseph M. Harvey
Vice president
James S. Corl
Vice president
Jon Cheigh
Vice President
Francis C. Poli
Secretary
James Giallanza
Treasurer and chief financial officer
Lisa D. Phelan
Chief compliance officer
KEY INFORMATION
Investment Advisor
Cohen & Steers Capital Management, Inc.
280 Park Avenue
New York, NY 10017
(212) 832-3232
Fund Subadministrator and Custodian
State Street Bank and Trust Company
One Lincoln Street
Boston, MA 02111
Transfer Agent
Boston Financial Data Services, Inc.
2 Heritage Drive
North Quincy, MA 02171
(800) 437-9912
Legal Counsel
Stroock & Stroock & Lavan LLP
180 Maiden Lane
New York, NY 10038
Distributor
Cohen & Steers Securities, LLC
280 Park Avenue
New York, NY 10017
Nasdaq Symbol: CSRSX
Web site: cohenandsteers.com
This report is authorized for delivery only to shareholders of Cohen & Steers Realty Shares, Inc. unless accompanied or preceded by the delivery of a currently effective prospectus setting forth details of the fund. Past performance is of course no guarantee of future results and your investment may be worth more or less at the time you sell.
27
COHEN & STEERS
REALTY SHARES
280 PARK AVENUE
NEW YORK, NY 10017
eDelivery NOW AVAILABLE
Stop traditional mail delivery; receive your shareholder reports and prospectus online.
Sign up at cohenandsteers.com
CSRSXAR

ANNUAL REPORT
DECEMBER 31, 2007
Item 2. Code of Ethics.
The registrant has adopted a Code of Ethics that applies to its Principal Executive Officer and Principal Financial Officer. The registrant undertakes to provide to any person without charge, upon request, a copy of the Code of Ethics. Such request can be made by calling 800-330-7348 or writing to the Secretary of the registrant, 280 Park Avenue, New York, NY 10017.
Item 3. Audit Committee Financial Expert.
The registrant’s board has determined that Frank K. Ross, a member of the board’s audit committee, is an “audit committee financial expert”. Mr. Ross is “independent,” as such term is defined in this Item.
Item 4. Principal Accountant Fees and Services.
(a) – (d) Aggregate fees billed to the registrant for the last two fiscal years for professional services rendered by the registrant’s principal accountant were as follows:
| | 2007 | | 2006 | |
Audit Fees | | $ | 46,000 | | $ | 50,967 | |
Audit-Related Fees | | 8,500 | | — | |
Tax Fees | | 13,300 | | 12,800 | |
All Other Fees | | — | | — | |
| | | | | | | |
Audit-related fees were billed in connection with agreed upon procedures performed by the registrant’s principal accountant relating to after-tax return calculations. Tax fees were billed in connection with the preparation of tax returns, calculation and designation of dividends and other miscellaneous tax services.
Aggregate fees billed by the registrant’s principal accountant for the last two fiscal years for non-audit services provided to the registrant’s investment adviser (not including a sub-adviser whose role is primarily portfolio management and is subcontracted or overseen by another investment adviser) and any entity controlling, controlled by, or under common control with the investment adviser that provides ongoing services to the registered investment company, where the engagement relates directly to the operations and financial reporting of the registrant, were as follows:
| | 2007 | | 2006 | |
Audit-Related Fees | | — | | — | |
Tax Fees | | — | | — | |
All Other Fees | | $ | 109,000 | | $ | 65,000 | |
| | | | | | | |
These other fees were billed in connection with internal control reviews.
(e)(1) The audit committee is required to pre-approve audit and non-audit services performed for the registrant by the principal accountant. The audit committee also is required to pre-approve non-audit services performed by the registrant’s principal accountant for the registrant’s
investment adviser and any sub-adviser (not including any sub-adviser whose role is primarily portfolio management and is subcontracted with or overseen by another investment adviser) and/or to any entity controlling, controlled by or under common control with the registrant’s investment adviser that provides ongoing services to the registrant, if the engagement for services relates directly to the operations and financial reporting of the registrant.
The audit committee may delegate pre-approval authority to one or more of its members who are independent members of the board of directors of the registrant. The member or members to whom such authority is delegated shall report any pre-approval decisions to the audit committee at its next scheduled meeting. The audit committee may not delegate its responsibility to pre-approve services to be performed by the registrant’s principal accountant to the investment adviser.
(e) (2) No services included in (b) – (d) above were approved by the audit committee pursuant to paragraphs (c)(7)(i)(C) of Rule 2-01 of Regulation S-X.
(f) Not applicable.
(g) For the fiscal years ended December 31, 2007 and December 31, 2006, the aggregate fees billed by the registrant’s principal accountant for non-audit services rendered to the registrant and for non-audit services rendered to the registrant’s investment adviser (not including any sub-adviser whose role is primarily portfolio management and is subcontracted with or overseen by another investment adviser) and/or to any entity controlling, controlled by or under common control with the registrant’s investment adviser that provides ongoing services to the registrant were $78,300 and $77,800, respectively.
(h) The registrant’s audit committee considered whether the provision of non-audit services that were rendered to the registrant’s investment adviser (not including any sub-adviser whose role is primarily portfolio management and is subcontracted with or overseen by another investment adviser) and/or to any entity controlling, controlled by or under common control with the registrant’s investment adviser that provides ongoing services to the registrant that were not required to be pre-approved pursuant to paragraph (c)(7)(ii) of Rule 2-01 of Regulation S-X was compatible with maintaining the principal accountant’s independence.
Item 5. Audit Committee of Listed Registrants.
Not applicable.
Item 6. Schedule of Investments.
Included in Item 1 above.
Item 7. Disclosure of Proxy Voting Policies and Procedures for Closed-End Management Investment Companies.
Not applicable.
Item 8. Portfolio Managers of Closed-End Investment Companies.
Not applicable.
Item 9. Purchases of Equity Securities by Closed-End Management Investment Company and Affiliated Purchasers.
Not applicable.
Item 10. Submission of Matters to a Vote of Security Holders.
Not applicable.
Item 11. Controls and Procedures.
(a) The registrant’s principal executive officer and principal financial officer have concluded that the registrant’s disclosure controls and procedures are reasonably designed to ensure that information required to be disclosed by the registrant in this Form N-CSR was recorded, processed, summarized and reported within the time periods specified in the Securities and Exchange Commission’s rules and forms, based upon such officers’ evaluation of these controls and procedures as of a date within 90 days of the filing date of this report.
(b) There were no changes in the registrant’s internal control over financial reporting that occurred during the second fiscal quarter of the period covered by this report that have materially affected, or are reasonably likely to materially affect, the registrant’s internal control over financial reporting.
Item 12. Exhibits.
(a)(1) Not applicable.
(a) (2) Certifications of principal executive officer and principal financial officer as required by Rule 30a-2(a) under the Investment Company Act of 1940.
(b) Certifications of chief executive officer and chief financial officer as required by Rule 30a- 2(b) under the Investment Company Act of 1940.
SIGNATURES
Pursuant to the requirements of the Securities Exchange Act of 1934 and the Investment Company Act of 1940, the registrant has duly caused this report to be signed on its behalf by the undersigned, thereunto duly authorized.
COHEN & STEERS REALTY SHARES, INC.
By: | /s/ Adam M. Derechin | |
| Name: Adam M. Derechin | |
| Title: President and Chief Executive Officer | |
| |
Date: March 3, 2008 | |
| | | |
Pursuant to the requirements of the Securities Exchange Act of 1934 and the Investment Company Act of 1940, this report has been signed below by the following persons on behalf of the registrant and in the capacities and on the dates indicated.
By: | /s/ Adam M. Derechin | |
| Name: | Adam M. Derechin | |
| Title: | President and Chief Executive Officer | |
| | (principal executive officer) | |
| | | |
By: | /s/ James Giallanza | |
| Name: | James Giallanza | |
| Title: | Treasurer | |
| | (principal financial officer) | |
| |
| |
Date: March 3, 2008 | |
| | | | |