UNITED STATES
SECURITIES AND EXCHANGE COMMISSION
Washington, D.C. 20549
FORM N-CSR
CERTIFIED SHAREHOLDER REPORT OF REGISTERED
MANAGEMENT INVESTMENT COMPANIES
Investment Company Act file number | 811-6302 |
|
Cohen & Steers Realty Shares, Inc. |
(Exact name of registrant as specified in charter) |
|
280 Park Avenue, New York, NY | | 10017 |
(Address of principal executive offices) | | (Zip code) |
|
Adam M. Derechin
Cohen & Steers Capital Management, Inc.
280 Park Avenue
New York, New York 10017 |
(Name and address of agent for service) |
|
Registrant’s telephone number, including area code: | (212) 832-3232 | |
|
Date of fiscal year end: | December 31 | |
|
Date of reporting period: | June 30, 2008 | |
| | | | | | | | |
Item 1. Reports to Stockholders.
COHEN & STEERS REALTY SHARES, INC.
August 8, 2008
To Our Shareholders:
We are pleased to submit to you our report for the six months ended June 30, 2008. The net asset value at that date was $56.41 per share. In addition, a regular distribution of $0.452 per share was declared for shareholders of record on June 27, 2008 and was paid on June 30, 2008a.
The total returns, including income and change in net asset value, for the fund and the comparative benchmarks were:
| | | Six Months Ended
June 30, 2008 | |
| Cohen & Steers Realty Shares | | | –2.60 | % | |
| FTSE NAREIT Equity REIT Indexb | | | –3.59 | % | |
| S&P 500 Indexb | | | –11.91 | % | |
The performance data quoted represent past performance. Past performance is no guarantee of future results. The investment return and the principal value of an investment will fluctuate and shares, if redeemed, may be worth more or less than their original cost. Current performance may be lower or higher than the performance data quoted. Total returns of the fund current to the most recent month-end can be obtained by visiting our Web site at cohenandsteers.com.
Investment Review
The six-month period was a negative one for U.S. real estate securities, although they outperformed the broader U.S. stock market by a wide margin. Having underperformed in 2007, REITs entered the period with considerable pessimism priced into their shares. REITs performed well in both absolute and relative terms through May, as fundamentals remained supportive (demand softened only modestly amid limited new supply) and as earnings were generally in line with expectations. Real estate securities also received a boost in a March-April "relief rally," after the Federal Reserve helped arrange the purchase of Bear Stearns by JPMorgan Chase while taking other steps to avert possible failures in the financial system.
a Please note that distributions paid by the fund to shareholders are subject to recharacterization for tax purposes. The final tax treatment of these distributions is reported to shareholders after the close of the calendar year.
b The FTSE NAREIT Equity REIT Index is an unmanaged, market capitalization weighted index of all publicly traded REITs that invest predominantly in the equity ownership of real estate. The index is designed to reflect the performance of all publicly traded equity REITs as a whole. The S&P 500 Index is an unmanaged index of common stocks that is frequently used as a general measure of stock market performance.
1
COHEN & STEERS REALTY SHARES, INC.
However, sentiment toward REITs, and stocks in general, rapidly deteriorated late in the period. Surging oil prices contributed to fears of global stagflation—an unwelcome mix of inflation and slowing economic growth. This in turn reduced the probability that the Federal Reserve would continue to lower interest rates. The Fed in fact kept rates unchanged at 2% at its June meeting, after lowering them from 5.25% beginning in September 2007. In addition, there were heightened concerns over the financial sector, with a new focus on the local and regional banking systems.
Self storage and apartment companies outperformed
Performance during the semiannual period varied by sector. Self storage was the top-performing sector with a total return of 12.2%, aided by favorable earnings and generally strong balance sheets. Apartments (+4.4%) outperformed, with share prices validated by recent property sales, which in most sectors have been scarce. The regional mall (–2.7%) and health care (–2.6%) sectors declined but outperformed the benchmark, aided by their relatively stable earnings.
The hotel sector (–20.8%) was the poorest performer, due to concerns over the economy in general and the rising cost and reduced availability of air travel in particular. The industrial sector (–11.8%) had a sizable decline, reflecting investors' concerns over a slowing global economy and business models driven by transactional income, in contrast to recurring income from long-term leases. The office sector (–4.2%) underperformed amid concerns that employment levels could decline, particularly in areas with high concentrations of financial services tenants.
Performance was helped by self storage overweight
The fund declined in the period, although it outperformed its benchmark. Factors that aided performance included our overweight in the self storage sector, which we believe has the potential to benefit from more resilient fundamentals in a lackluster economy. Stock selection within self storage also added value. Our underweight in the industrial sector—based on valuations and our concerns over earnings stability—helped relative return. Stock selection in the hotel sector was favorable, although our overweight in hotels offset much of the stock selection benefit. The overweight reflected our view that hotel REITs had become oversold on economic worries; however, the rapid rise in oil prices weighed heavily on the group late in the period.
Stock selection in the office sector was the main detractor from performance. Stock selection in the regional mall sector also hindered performance. This was largely due to our overweight in a mall REIT that underperformed as a result of concerns over its exposure to areas with weak housing markets. However, the company also owns a number of malls in some of the strongest markets in the country, in addition to having a compelling development pipeline. We believe that investors have overlooked these characteristics and that the stock is attractively valued.
Investment Outlook
We expect REITs to generate earnings growth in the 4% to 6% area this year and in 2009, with demand and supply for commercial real estate remaining largely in balance. With REITs continuing to trade at
2
COHEN & STEERS REALTY SHARES, INC.
greater-than-average discounts to NAV, we view them as attractive, given their moderate growth, relatively stable earnings and compelling yields. As of June 30, REITs had an average dividend yield of 5.3%, compared with a dividend yield of 2.4% for the S&P 500 Index and a yield of 4.0% for the 10-year Treasury.
High oil and gasoline prices, the specter of rising inflation and a credit crunch that has yet to fully run its course suggest that challenging macroeconomic conditions could persist over the next 12 to 18 months.
Companies we favor in this context include well-managed retail REITs, which typically have inflation pass-through provisions in their leases, and self storage companies, whose short-term leases allow for frequent mark-to-market rent increases. Our focus remains on financially stronger companies whose business models, in our view, can be sustained despite what we expect to be a prolonged consumer recession and moderate corporate slowdown.
 | |  | |
|
| MARTIN COHEN | | ROBERT H. STEERS | |
|
| Co-chairman | | Co-chairman | |
|
 | |  | |
|
| JOSEPH M. HARVEY | | JON CHEIGH | |
|
| Portfolio Manager | | Portfolio Manager | |
|
The views and opinions in the preceding commentary are as of the date stated and are subject to change. This material represents an assessment of the market environment at a specific point in time, should not be relied upon as investment advice and is not intended to predict or depict performance of any investment.
Visit Cohen & Steers online at cohenandsteers.com
For more information about any of our funds, visit cohenandsteers.com, where you will find daily net asset values, fund fact sheets and portfolio highlights. You can also access newsletters, education tools and market updates covering the global real estate, listed infrastructure, utilities, large cap value and preferred securities sectors.
In addition, our Web site contains comprehensive information about our firm, including our most recent press releases, profiles of our senior investment professionals and an overview of our investment approach.
3
COHEN & STEERS REALTY SHARES, INC.
Performance Review (Unaudited)
Average Annual Total Returns—For the Periods Ended June 30, 2008
| | | 1 Year | | 5 Years | | 10 Years | | Since Inceptiona | |
| Fund | | | –15.28 | % | | | 15.75 | % | | | 11.33 | % | | | 13.47 | % | |
The performance data quoted represent past performance. Past performance is no guarantee of future results. The investment return and principal value of an investment will fluctuate and shares, when redeemed, may be worth more or less than their original cost. Current performance may be lower or higher than the performance data quoted. Performance information current to the most recent month-end can be obtained by visiting our Web site at cohenandsteers.com. The performance table does not reflect the deduction of taxes that a shareholder would pay on fund distributions or the redemption of fund shares.
The annual expense ratio as reported in the prospectus dated May 1, 2008 was 0.95%.
a Inception date of July 2, 1991.
4
COHEN & STEERS REALTY SHARES, INC.
Expense Example
(Unaudited)
As a shareholder of the fund, you incur two types of costs: (1) transaction costs, including redemption fees and (2) ongoing costs including management fees and other fund expenses. This example is intended to help you understand your ongoing costs (in dollars) of investing in the fund and to compare these costs with the ongoing costs of investing in other mutual funds.
The example is based on an investment of $1,000 invested at the beginning of the period and held for the entire period January 1, 2008–June 30, 2008.
Actual Expenses
The first line of the table below provides information about actual account values and expenses. You may use the information in this line, together with the amount you invested, to estimate the expenses that you paid over the period. Simply divide your account value by $1,000 (for example, an $8,600 account value divided by $1,000 = 8.6), then multiply the result by the number in the first line under the heading entitled "Expenses Paid During Period" to estimate the expenses you paid on your account during this period.
Hypothetical Example for Comparison Purposes
The second line of the table below provides information about hypothetical account values and hypothetical expenses based on the fund's actual expense ratio and an assumed rate of return of 5% per year before expenses, which is not the fund's actual return. The hypothetical account values and expenses may not be used to estimate the actual ending account balance or expenses you paid for the period. You may use this information to compare the ongoing cost of investing in the fund and other funds. To do so, compare this 5% hypothetical example with the 5% hypothetical examples that appear in the shareholder reports of other funds.
Please note that the expenses shown in the table are meant to highlight your ongoing costs only and do not reflect any transactional costs, such as sales charges (loads) and redemption fees. Therefore, the second line of the table is useful in comparing ongoing costs only, and will not help you determine the relative total costs of owning different funds. In addition, if these transactional costs were included, your costs would have been higher.
| | | Beginning
Account Value
January 1, 2008 | | Ending
Account Value
June 30, 2008 | | Expenses Paid
During Period*
January 1, 2008–
June 30, 2008 | |
| Actual (–2.60% return) | | $ | 1,000.00 | | | $ | 974.00 | | | $ | 4.76 | | |
| Hypothetical (5% annual return before expenses) | | $ | 1,000.00 | | | $ | 1,020.04 | | | $ | 4.87 | | |
* Expenses are equal to the Fund's annualized expense ratio of 0.97% multiplied by the average account value over the period, multiplied by 182/366 (to reflect the one-half year period).
5
COHEN & STEERS REALTY SHARES, INC.
JUNE 30, 2008
Top Ten Holdings
(Unaudited)
| Security | | Market
Value | | % of
Net
Assets | |
| Simon Property Group | | $ | 165,107,165 | | | | 7.4 | % | |
| Public Storage | | | 131,166,847 | | | | 5.9 | | |
| Boston Properties | | | 111,324,533 | | | | 5.0 | | |
| Macerich Co. | | | 106,081,445 | | | | 4.8 | | |
| AvalonBay Communities | | | 98,782,415 | | | | 4.4 | | |
| Vornado Realty Trust | | | 98,196,912 | | | | 4.4 | | |
| ProLogis | | | 96,863,005 | | | | 4.3 | | |
| General Growth Properties | | | 96,805,755 | | | | 4.3 | | |
| Federal Realty Investment Trust | | | 83,738,538 | | | | 3.8 | | |
| Host Hotels & Resorts | | | 78,542,742 | | | | 3.5 | | |
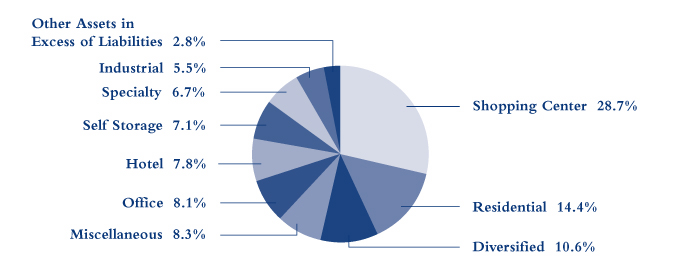
Sector Breakdown
(Based on Net Assets)
(Unaudited)
6
COHEN & STEERS REALTY SHARES, INC.
SCHEDULE OF INVESTMENTS
June 30, 2008 (Unaudited)
| | | | | Number
of Shares | | Value | |
| COMMON STOCK | | | 97.2 | % | | | | | | | | | |
| DIVERSIFIED | | | 10.6 | % | | | | | | | | | |
| Boston Properties | | | | | | | 1,233,923 | | | $ | 111,324,533 | | |
| Colonial Properties Trust | | | | | | | 519,981 | | | | 10,410,020 | | |
| Forest City Enterprises | | | | | | | 502,720 | | | | 16,197,638 | | |
| Vornado Realty Trust | | | | | | | 1,115,874 | | | | 98,196,912 | | |
| | | | | | | | 236,129,103 | | |
| HEALTH CARE | | | 5.1 | % | | | | | | | | | |
| HCP | | | | | | | 730,818 | | | | 23,247,321 | | |
| Health Care REIT | | | | | | | 258,363 | | | | 11,497,153 | | |
| Omega Healthcare Investors | | | | | | | 762,001 | | | | 12,687,317 | | |
| Ventas | | | | | | | 1,584,737 | | | | 67,462,254 | | |
| | | | | | | | 114,894,045 | | |
| HOTEL | | | 7.8 | % | | | | | | | | | |
| Host Hotels & Resorts | | | | | | | 5,754,047 | | | | 78,542,742 | | |
| LaSalle Hotel Properties | | | | | | | 1,153,484 | | | | 28,987,053 | | |
| Starwood Hotels & Resorts Worldwide | | | | | | | 906,599 | | | | 36,327,422 | | |
| Strategic Hotels & Resorts | | | | | | | 1,390,320 | | | | 13,027,298 | | |
| Sunstone Hotel Investors | | | | | | | 1,068,367 | | | | 17,734,892 | | |
| | | | | | | | 174,619,407 | | |
| INDUSTRIAL | | | 5.5 | % | | | | | | | | | |
| EastGroup Properties | | | | | | | 576,263 | | | | 24,721,683 | | |
| ProLogis | | | | | | | 1,782,208 | | | | 96,863,005 | | |
| | | | | | | | 121,584,688 | | |
See accompanying notes to financial statements.
7
COHEN & STEERS REALTY SHARES, INC.
SCHEDULE OF INVESTMENTS—(Continued)
June 30, 2008 (Unaudited)
| | | | | Number
of Shares | | Value | |
| OFFICE | | | 8.1 | % | | | | | | | | | |
| BioMed Realty Trust | | | | | | | 379,336 | | | $ | 9,305,112 | | |
| Brookfield Properties Corp. | | | | | | | 754,529 | | | | 13,423,071 | | |
| Douglas Emmett | | | | | | | 1,527,250 | | | | 33,553,682 | | |
| Highwoods Properties | | | | | | | 278,687 | | | | 8,756,345 | | |
| Kilroy Realty Corp. | | | | | | | 406,308 | | | | 19,108,665 | | |
| Mack-Cali Realty Corp. | | | | | | | 651,322 | | | | 22,255,673 | | |
| Maguire Properties | | | | | | | 1,107,170 | | | | 13,474,259 | | |
| SL Green Realty Corp. | | | | | | | 742,787 | | | | 61,443,341 | | |
| | | | | | | | 181,320,148 | | |
| OFFICE/INDUSTRIAL | | | 3.2 | % | | | | | | | | | |
| Liberty Property Trust | | | | | | | 1,164,901 | | | | 38,616,468 | | |
| PS Business Parks | | | | | | | 620,160 | | | | 32,000,256 | | |
| | | | | | | | 70,616,724 | | |
| RESIDENTIAL | | | 14.4 | % | | | | | | | | | |
| APARTMENT | | | 12.5 | % | | | | | | | | | |
| American Campus Communities | | | | | | | 604,183 | | | | 16,820,455 | | |
| Apartment Investment & Management Co. | | | | | | | 876,525 | | | | 29,854,441 | | |
| AvalonBay Communities | | | | | | | 1,107,923 | | | | 98,782,415 | | |
| BRE Properties | | | | | | | 933,387 | | | | 40,396,989 | | |
| Camden Property Trust | | | | | | | 283,581 | | | | 12,551,295 | | |
| Equity Residential | | | | | | | 1,159,096 | | | | 44,358,604 | | |
| Post Properties | | | | | | | 237,300 | | | | 7,059,675 | | |
| UDR | | | | | | | 1,276,420 | | | | 28,566,280 | | |
| | | | | | | | 278,390,154 | | |
| MANUFACTURED HOME | | | 1.9 | % | | | | | | | | | |
| Equity Lifestyle Properties | | | | | | | 952,905 | | | | 41,927,820 | | |
| TOTAL RESIDENTIAL | | | | | | | | | | | 320,317,974 | | |
See accompanying notes to financial statements.
8
COHEN & STEERS REALTY SHARES, INC.
SCHEDULE OF INVESTMENTS—(Continued)
June 30, 2008 (Unaudited)
| | | | | Number
of Shares | | Value | |
| SELF STORAGE | | | 7.1 | % | | | | | | | | | |
| Extra Space Storage | | | | | | | 942,146 | | | $ | 14,471,362 | | |
| Public Storage | | | | | | | 1,623,553 | | | | 131,166,847 | | |
| U-Store-It Trust | | | | | | | 974,160 | | | | 11,641,212 | | |
| | | | | | | | 157,279,421 | | |
| SHOPPING CENTER | | | 28.7 | % | | | | | | | | | |
| COMMUNITY CENTER | | | 10.9 | % | | | | | | | | | |
| Developers Diversified Realty Corp. | | | | | | | 1,452,300 | | | | 50,409,333 | | |
| Equity One | | | | | | | 713,890 | | | | 14,670,439 | | |
| Federal Realty Investment Trust | | | | | | | 1,213,602 | | | | 83,738,538 | | |
| Kimco Realty Corp. | | | | | | | 647,082 | | | | 22,337,271 | | |
| Regency Centers Corp. | | | | | | | 1,204,497 | | | | 71,209,863 | | |
| | | | | | | | 242,365,444 | | |
| REGIONAL MALL | | | 17.8 | % | | | | | | | | | |
| General Growth Properties | | | | | | | 2,763,510 | | | | 96,805,755 | | |
| Macerich Co. | | | | | | | 1,707,411 | | | | 106,081,445 | | |
| Simon Property Group | | | | | | | 1,836,769 | | | | 165,107,165 | | |
| Taubman Centers | | | | | | | 600,090 | | | | 29,194,379 | | |
| | | | | | | | 397,188,744 | | |
| TOTAL SHOPPING CENTER | | | | | | | | | | | 639,554,188 | | |
| SPECIALTY | | | 6.7 | % | | | | | | | | | |
| Digital Realty Trust | | | | | | | 322,900 | | | | 13,209,839 | | |
| DuPont Fabros Technology | | | | | | | 910,604 | | | | 16,973,659 | | |
| Entertainment Properties Trust | | | | | | | 505,688 | | | | 25,001,215 | | |
| Plum Creek Timber Co. | | | | | | | 1,772,471 | | | | 75,702,236 | | |
| Rayonier | | | | | | | 449,402 | | | | 19,081,609 | | |
| | | | | | | | 149,968,558 | | |
| TOTAL COMMON STOCK (Identified cost—$1,741,362,296) | | | | | | | | | | | 2,166,284,256 | | |
See accompanying notes to financial statements.
9
COHEN & STEERS REALTY SHARES, INC.
SCHEDULE OF INVESTMENTS—(Continued)
June 30, 2008 (Unaudited)
| | | | | Principal
Amount | | Value | |
| COMMERCIAL PAPER | | | 2.8 | % | | | | | | | |
San Paolo US Financial, 1.05%, due 7/1/08
(Identified cost—$62,192,000) | | | | | | $ | 62,192,000 | | | $ | 62,192,000 | | |
| TOTAL INVESTMENTS (Identified cost—$1,803,554,296) | | | 100.0 | % | | | | | 2,228,476,256 | | |
| OTHER ASSETS IN EXCESS OF LIABILITIES | | | 0.0 | % | | | | | 641,865 | | |
NET ASSETS (Equivalent to $56.41 per share based on 39,513,473
shares of common stock outstanding) | | | 100.0 | % | | | | $ | 2,229,118,121 | | |
Glossary of Portfolio Abbreviation
REIT Real Estate Investment Trust
Note: Percentages indicated are based on the net assets of the fund.
See accompanying notes to financial statements.
10
COHEN & STEERS REALTY SHARES, INC.
STATEMENT OF ASSETS AND LIABILITIES
June 30, 2008 (Unaudited)
| ASSETS: | |
| Investments in securities, at value (Identified cost—$1,803,554,296) | | $ | 2,228,476,256 | | |
| Receivable for investment securities sold | | | 14,194,881 | | |
| Receivable for fund shares sold | | | 4,688,454 | | |
| Dividends receivable | | | 9,777,377 | | |
| Other assets | | | 16,646 | | |
| Total Assets | | | 2,257,153,614 | | |
| LIABILITIES: | |
| Payable for investment securities purchased | | | 17,545,457 | | |
| Payable for fund shares redeemed | | | 6,770,504 | | |
| Payable for investment advisory fees | | | 1,595,001 | | |
| Payable for dividends declared | | | 1,446,844 | | |
| Payable for administration fees | | | 39,255 | | |
| Payable for directors' fees | | | 4,530 | | |
| Other liabilities | | | 633,902 | | |
| Total Liabilities | | | 28,035,493 | | |
| NET ASSETS applicable to 39,513,473 shares of $0.001 par value of common stock outstanding | | $ | 2,229,118,121 | | |
| NET ASSET VALUE PER SHARE: | |
| ($2,229,118,121 ÷ 39,513,473 shares outstanding) | | $ | 56.41 | | |
| NET ASSETS consist of: | |
| Paid-in-capital | | $ | 1,860,190,099 | | |
| Dividends in excess of net investment income | | | (13,210,522 | ) | |
| Accumulated net realized loss on investments | | | (42,783,416 | ) | |
| Net unrealized appreciation on investments | | | 424,921,960 | | |
| | | $ | 2,229,118,121 | | |
See accompanying notes to financial statements.
11
COHEN & STEERS REALTY SHARES, INC.
STATEMENT OF OPERATIONS
For the Six Months Ended June 30, 2008 (Unaudited)
| Investment Income: | |
| Dividend income (net of $39,119 of foreign withholding tax) | | $ | 25,798,517 | | |
| Interest income | | | 446,502 | | |
| Total Income | | | 26,245,019 | | |
| Expenses: | |
| Investment advisory fees | | | 9,382,813 | | |
| Transfer agent fees and expenses | | | 966,368 | | |
| Administration fees | | | 368,968 | | |
| Reports to shareholders | | | 96,048 | | |
| Professional fees | | | 80,204 | | |
| Custodian fees and expenses | | | 79,294 | | |
| Registration and filing fees | | | 39,868 | | |
| Directors' fees and expenses | | | 27,188 | | |
| Line of credit fees | | | 26,575 | | |
| Miscellaneous | | | 64,236 | | |
| Total Expenses | | | 11,131,562 | | |
| Net Investment Income | | | 15,113,457 | | |
| Net Realized and Unrealized Loss on Investments: | |
| Net realized loss on investments | | | (19,173,895 | ) | |
| Net change in unrealized appreciation on investments | | | (64,298,785 | ) | |
| Net realized and unrealized loss on investments | | | (83,472,680 | ) | |
| Net Decrease in Net Assets Resulting from Operations | | $ | (68,359,223 | ) | |
See accompanying notes to financial statements.
12
COHEN & STEERS REALTY SHARES, INC.
STATEMENT OF CHANGES IN NET ASSETS (Unaudited)
| | | For the
Six Months Ended
June 30, 2008 | | For the
Year Ended
December 31, 2007 | |
| Change in Net Assets: | |
| From Operations: | |
| Net investment income | | $ | 15,113,457 | | | $ | 39,701,677 | | |
| Net realized gain (loss) on investments | | | (19,173,895 | ) | | | 468,079,489 | | |
| Net change in unrealized appreciation on investments | | | (64,298,785 | ) | | | (1,135,088,153 | ) | |
| Net decrease in net assets resulting from operations | | | (68,359,223 | ) | | | (627,306,987 | ) | |
| Dividends and Distributions to Shareholders from: | |
| Net investment income | | | (34,163,223 | ) | | | (36,692,790 | ) | |
| Net realized gain on investments | | | — | | | | (424,150,489 | ) | |
| Total dividends and distributions to shareholders | | | (34,163,223 | ) | | | (460,843,279 | ) | |
| Capital Stock Transactions: | |
Increase (decrease) in net assets from fund share
transactions | | | 36,540,936 | | | | (218,690,650 | ) | |
| Total decrease in net assets | | | (65,981,510 | ) | | | (1,306,840,916 | ) | |
| Net Assets: | |
| Beginning of period | | | 2,295,099,631 | | | | 3,601,940,547 | | |
| End of perioda | | $ | 2,229,118,121 | | | $ | 2,295,099,631 | | |
a Includes dividends in excess of net investment income and undistributed net investment income of $13,210,522 and $5,839,244, respectively.
See accompanying notes to financial statements.
13
COHEN & STEERS REALTY SHARES, INC.
FINANCIAL HIGHLIGHTS (Unaudited)
The following table includes selected data for a share outstanding throughout each period and other performance information derived from the financial statements. It should be read in conjunction with the financial statements and notes thereto.
| | | For the Six
Months Ended | | For the Year Ended December 31, | |
| Per Share Operating Performance: | | June 30, 2008 | | 2007 | | 2006 | | 2005 | | 2004 | | 2003 | |
| Net asset value, beginning of period | | $ | 58.80 | | | $ | 89.45 | | | $ | 72.59 | | | $ | 69.66 | | | $ | 55.64 | | | $ | 43.34 | | |
| Income from investment operations: | |
| Net investment income | | | 0.40 | | | | 1.24 | a | | | 0.91 | | | | 1.04 | | | | 1.21 | | | | 1.47 | | |
Net realized and unrealized
gain (loss) on investments | | | (1.91 | ) | | | (18.21 | ) | | | 25.52 | | | | 9.17 | | | | 19.71 | | | | 14.63 | | |
Total income (loss) from
investment operations | | | (1.51 | ) | | | (16.97 | ) | | | 26.43 | | | | 10.21 | | | | 20.92 | | | | 16.10 | | |
Less dividends and distributions to
shareholders from: | |
| Net investment income | | | (0.88 | ) | | | (1.09 | ) | | | (0.91 | ) | | | (1.04 | ) | | | (1.21 | ) | | | (1.88 | ) | |
Net realized gain on
investments | | | — | | | | (12.63 | ) | | | (8.14 | ) | | | (5.80 | ) | | | (5.32 | ) | | | (1.93 | ) | |
| Tax return of capital | | | — | | | | — | | | | (0.53 | ) | | | (0.46 | ) | | | (0.38 | ) | | | — | | |
Total dividends and
distributions to
shareholders | | | (0.88 | ) | | | (13.72 | ) | | | (9.58 | ) | | | (7.30 | ) | | | (6.91 | ) | | | (3.81 | ) | |
| Redemption fees retained by the fund | | | 0.00 | b | | | 0.04 | | | | 0.01 | | | | 0.02 | | | | 0.01 | | | | 0.01 | | |
Net increase (decrease) in net asset
value | | | (2.39 | ) | | | (30.65 | ) | | | 16.86 | | | | 2.93 | | | | 14.02 | | | | 12.30 | | |
| Net asset value, end of period | | $ | 56.41 | | | $ | 58.80 | | | $ | 89.45 | | | $ | 72.59 | | | $ | 69.66 | | | $ | 55.64 | | |
| Total investment return | | | –2.60 | %c | | | –19.19 | % | | | 37.13 | % | | | 14.89 | % | | | 38.48 | % | | | 38.09 | % | |
| Ratios/Supplemental Data: | |
| Net assets, end of period (in millions) | | $ | 2,229.1 | | | $ | 2,295.1 | | | $ | 3,601.9 | | | $ | 2,466.0 | | | $ | 2,264.7 | | | $ | 1,681.3 | | |
Ratio of expenses to average daily
net assets | | | 0.97 | %d | | | 0.95 | % | | | 0.96 | % | | | 0.97 | % | | | 1.01 | % | | | 1.07 | % | |
Ratio of net investment income to
average daily net assets | | | 1.31 | %d | | | 1.21 | % | | | 1.08 | % | | | 1.45 | % | | | 2.00 | % | | | 2.96 | % | |
| Portfolio turnover rate | | | 37 | %c | | | 58 | % | | | 31 | % | | | 28 | % | | | 29 | % | | | 37 | % | |
a 15.1% of net investment income was attributable to a special dividend paid by Boston Properties, Inc.
b Amount is less than $0.005.
c Not annualized.
d Annualized.
See accompanying notes to financial statements.
14
COHEN & STEERS REALTY SHARES, INC.
NOTES TO FINANCIAL STATEMENTS (Unaudited)
Note 1. Significant Accounting Policies
Cohen & Steers Realty Shares, Inc. (the fund) was incorporated under the laws of the State of Maryland on April 26, 1991 and is registered under the Investment Company Act of 1940, as amended, as a nondiversified, open-end management investment company. The fund's investment objective is total return.
The following is a summary of significant accounting policies consistently followed by the fund in the preparation of its financial statements. The policies are in conformity with accounting principles generally accepted in the United States of America (GAAP). The preparation of the financial statements in accordance with GAAP requires management to make estimates and assumptions that affect the reported amounts of assets and liabilities at the date of the financial statements and the reported amounts of income and expenses during the reporting period. Actual results could differ from those estimates.
Portfolio Valuation: Investments in securities that are listed on the New York Stock Exchange are valued, except as indicated below, at the last sale price reflected at the close of the New York Stock Exchange on the business day as of which such value is being determined. If there has been no sale on such day, the securities are valued at the mean of the closing bid and asked prices for the day or, if no asked price is available, at the bid price.
Securities not listed on the New York Stock Exchange but listed on other domestic or foreign securities exchanges or admitted to trading on the National Association of Securities Dealers Automated Quotations, Inc. (Nasdaq) national market system are valued in a similar manner. Securities traded on more than one securities exchange are valued at the last sale price on the business day as of which such value is being determined as reflected on the tape at the close of the exchange representing the principal market for such securities.
Readily marketable securities traded in the over-the-counter market, including listed securities whose primary market is believed by Cohen & Steers Capital Management, Inc. (the advisor) to be over-the-counter, but excluding securities admitted to trading on the Nasdaq National List, are valued at the official closing prices as reported by Nasdaq, the National Quotation Bureau, or such other comparable sources as the Board of Directors deem appropriate to reflect their fair market value. If there has been no sale on such day, the securities are valued at the mean of the closing bid and asked prices for the day, or if no asked price is available, at the bid price. Where securities are traded on more than one exchange and also over-the-counter, the securities will generally be valued using the quotations the Board of Directors believes most closely reflect the value of such securities.
Securities for which market prices are unavailable, or securities for which the advisor determines that bid and/or asked price does not reflect market value, will be valued at fair value pursuant to procedures approved by the fund's Board of Directors. Circumstances in which market prices may be unavailable include, but are not limited to, when trading in a security is suspended, the exchange on which the security is traded is subject to an unscheduled close or disruption or material events occur after the close of the exchange on which the security is principally traded. In these circumstances, the fund determines fair value in a manner that fairly reflects the market value of the security on the valuation date based on consideration of any information or factors it deems
15
COHEN & STEERS REALTY SHARES, INC.
NOTES TO FINANCIAL STATEMENTS (Unaudited)—(Continued)
appropriate. These may include recent transactions in comparable securities, information relating to the specific security and developments in the markets.
The fund's use of fair value pricing may cause the net asset value of fund shares to differ from the net asset value that would be calculated using market quotations. Fair value pricing involves subjective judgments and it is possible that the fair value determined for a security may be materially different than the value that could be realized upon the sale of that security.
Short-term debt securities, which have a maturity date of 60 days or less, are valued at amortized cost, which approximates value.
The fund adopted Financial Accounting Standards Board Statement of Financial Accounting Standards No. 157, "Fair Value Measurements" ("FAS 157"), effective January 1, 2008. In accordance with FAS 157, fair value is defined as the price that the fund would receive to sell an investment or pay to transfer a liability in a timely transaction with an independent buyer in the principal market, or in the absence of a principal market the most advantageous market for the investment or liability. FAS 157 establishes a single definition of fair value, creates a three-tier hierarchy as a framework for measuring fair value based on inputs used to value the fund's investments, and requires additional disclosure about fair value. The hierarchy of inputs is summarized below.
• Level 1—quoted prices in active markets for identical investments
• Level 2—other significant observable inputs (including quoted prices for similar investments, interest rates, prepayment speeds, credit risk, etc.)
• Level 3—significant unobservable inputs (including the fund's own assumptions in determining the fair value of investments)
The inputs or methodology used for valuing securities are not necessarily an indication of the risk associated with investing in those securities.
The following is a summary of the inputs used as of June 30, 2008 in valuing the fund's investments carried at value:
| | | | | Fair Value Measurements at June 30, 2008 Using | |
| | | Total | | Quoted Prices In
Active Market for
Identical Assets
(Level 1) | | Significant
Other Observable
Inputs
(Level 2) | | Significant
Unobservable
Inputs
(Level 3) | |
| Investments in Securities | | $ | 2,228,476,256 | | | $ | 2,166,284,256 | | | $ | 62,192,000 | | | $ | — | | |
16
COHEN & STEERS REALTY SHARES, INC.
NOTES TO FINANCIAL STATEMENTS (Unaudited)—(Continued)
Security Transactions and Investment Income: Security transactions are recorded on trade date. Realized gains and losses on investments sold are recorded on the basis of identified cost. Interest income is recorded on the accrual basis. Discounts are accreted and premiums are amortized over the life of the respective securities. Dividend income is recorded on the ex-dividend date. The fund records distributions received in excess of income from underlying investments as a reduction of cost of investments and/or realized gain. Such amounts are based on estimates if actual amounts are not available and actual amounts of income, realized gain and return of capital may differ from the estimated amounts. The fund adjusts the estimated amounts of the components of distributions (and consequently its net investment income) as an increase to unrealized appreciation/(depre ciation) and realized gain/(loss) on investments as necessary once the issuers provide information about the actual composition of the distributions.
Dividends and Distributions to Shareholders: Dividends from net investment income and capital gain distributions are determined in accordance with U.S. federal income tax regulations, which may differ from GAAP. Dividends from net investment income are declared and paid quarterly. Net realized capital gains, unless offset by any available capital loss carryforward, are typically distributed to shareholders at least annually. Dividends and distributions to shareholders are recorded on the ex-dividend date and are automatically reinvested in full and fractional shares of the fund based on the net asset value per share at the close of business on the payable date unless the shareholder has elected to have them paid in cash.
Distributions paid by the fund are subject to recharacterization for tax purposes. Based upon the results of operations for the six months ended June 30, 2008, the advisor considers it likely that a portion of the dividends will be reclassified to return of capital and distributions of net realized capital gains upon the final determination of the fund's taxable income for the year.
Income Taxes: It is the policy of the fund to continue to qualify as a regulated investment company, if such qualification is in the best interest of the shareholders, by complying with the requirements of Subchapter M of the Internal Revenue Code applicable to regulated investment companies, and by distributing substantially all of its taxable earnings to its shareholders. Accordingly, no provision for federal income or excise tax is necessary. The fund has adopted the provisions of FASB Interpretation No. 48, Accounting for Uncertainties in Income Taxes (FIN 48). FIN 48 clarifies the accounting for income taxes by prescribing the minimum recognition threshold a tax position must meet before being recognized in the financial statements. An assessment of the fund's tax positions has been made and it has been determined that there is no impact to the fund's financi al statements. Each of the fund's federal tax returns for the prior three fiscal years remains subject to examination by the Internal Revenue Service.
17
COHEN & STEERS REALTY SHARES, INC.
NOTES TO FINANCIAL STATEMENTS (Unaudited)—(Continued)
Note 2. Investment Advisory and Administration Fees and Other Transactions with Affiliates
Investment Advisory Fees: The advisor serves as the fund's investment advisor pursuant to an investment advisory agreement (the advisory agreement). Under the terms of the advisory agreement, the advisor provides the fund with the day-to-day investment decisions and generally manages the fund's investments in accordance with the stated policies of the fund, subject to the supervision of the fund's Board of Directors. For the services provided to the fund, the advisor receives a fee, accrued daily and paid monthly, at the annual rate of 0.85% for the first $1.5 billion and 0.75% thereafter of the average daily net assets of the fund.
Administration Fees: The fund has entered into an administration agreement with the advisor under which the advisor performs certain administrative functions for the fund and receives a fee, accrued daily and paid monthly, at the annual rate of 0.02% of the fund's average daily net assets. For the six months ended June 30, 2008, the fund paid the advisor $230,318 in fees under this administration agreement. Additionally, the fund has retained State Street Bank and Trust Company as sub-administrator under a fund accounting and administration agreement.
Directors' and Officers' Fees: Certain directors and officers of the fund are also directors, officers, and/or employees of the advisor. The fund does not pay compensation to any affiliated directors and officers except for the Chief Compliance Officer, who received $16,534 from the fund for the six months ended June 30, 2008.
Note 3. Purchases and Sales of Securities
Purchases and sales of securities, excluding short-term investments, for the six months ended June 30, 2008 totaled $829,320,897 and $850,072,788 respectively.
Note 4. Income Tax Information
As of June 30, 2008, the federal tax cost and net unrealized appreciation on securities were as follows:
| Gross unrealized appreciation | | $ | 527,764,281 | | |
| Gross unrealized depreciation | | | (102,842,321 | ) | |
| Net unrealized appreciation | | $ | 424,921,960 | | |
| Cost for federal income tax purposes | | $ | 1,803,554,296 | | |
18
COHEN & STEERS REALTY SHARES, INC.
NOTES TO FINANCIAL STATEMENTS (Unaudited)—(Continued)
Note 5. Capital Stock
The fund is authorized to issue 200 million shares of capital stock at a par value of $0.001 per share. The Board of Directors of the fund is authorized to reclassify and issue any unissued shares of the fund without shareholder approval. Transactions in fund shares were as follows:
| | | For the
Six Months Ended
June 30, 2008 | | For the
Year Ended
December 31, 2007 | |
| | | Shares | | Amount | | Shares | | Amount | |
| Sold | | | 5,925,338 | | | $ | 355,467,055 | | | | 10,195,337 | | | $ | 900,518,114 | | |
Issued as reinvestment of
dividends and distributions | | | 539,673 | | | | 31,333,070 | | | | 7,023,478 | | | | 428,947,952 | | |
| Redeemed | | | (5,983,690 | ) | | | (350,371,101 | ) | | | (18,454,343 | ) | | | (1,549,610,014 | ) | |
| Redemption fees retained by funda | | | — | | | | 111,912 | | | | — | | | | 1,453,298 | | |
| Net increase (decrease) | | | 481,321 | | | $ | 36,540,936 | | | | (1,235,528 | ) | | $ | (218,690,650 | ) | |
a The fund may charge a 2% redemption fee on shares sold within 60 days of the time of purchase. Redemption fees are paid directly to the fund. Prior to September 28, 2007, the redemption fee was charged at a rate of 1% on shares sold within six months of the time of purchase.
Note 6. Borrowings
The fund, in conjunction with other Cohen & Steers funds, is a party to a $200,000,000 syndicated credit agreement (the credit agreement) with State Street Bank and Trust Company, as administrative agent and operations agent, and the lenders identified in the credit agreement, which expires December 2008. The fund pays a commitment fee of 0.10% per annum on its proportionate share of the unused portion of the credit agreement.
During the six months ended June 30, 2008, the fund did not utilize the line of credit.
Note 7. Other
In the normal course of business, the fund enters into contracts that provide general indemnifications. The fund's maximum exposure under these arrangements is dependent on claims that may be made against the fund in the future and, therefore, cannot be estimated; however, based on experience, the risk of material loss from such claims is considered remote.
19
COHEN & STEERS REALTY SHARES, INC.
NOTES TO FINANCIAL STATEMENTS (Unaudited)—(Continued)
Note 8. New Accounting Pronouncement
In March 2008, the Financial Accounting Standards Board issued Statement of Financial Accounting Standards No. 161, Disclosures about Derivative Instruments and Hedging Activities ("FAS 161"), an amendment of FASB Statement No. 133. FAS 161 requires enhanced disclosures about (a) how and why an entity uses derivative instruments, (b) how derivative instruments and related hedged items are accounted for, and (c) how derivative instruments and related hedged items affect the fund's financial position, financial performance, and cash flows. Management is currently evaluating the impact the adoption of this pronouncement will have on the fund's financial statements. FAS 161 is effective for fiscal years beginning after November 15, 2008.
20
COHEN & STEERS REALTY SHARES, INC.
OTHER INFORMATION
A description of the policies and procedures that the fund uses to determine how to vote proxies relating to portfolio securities is available (i) without charge, upon request, by calling 800-330-7348, (ii) on our Web site at cohenandsteers.com or (iii) on the Securities and Exchange Commission's Web site at http://www.sec.gov. In addition, the fund's proxy voting record for the most recent 12-month period ended June 30 is available (i) without charge, upon request, by calling 800-330-7348 or (ii) on the SEC's Web site at http://www.sec.gov.
The fund files its complete schedule of portfolio holdings with the SEC for the first and third quarters of each fiscal year on Form N-Q. The fund's Forms N-Q are available (i) without charge, upon request by calling 800-330-7348, or (ii) on the SEC's Web site at http://www.sec.gov. In addition, the Forms N-Q may be reviewed and copied at the SEC's Public Reference Room in Washington, DC. Information on the operation of the Public Reference Room may be obtained by calling 800-SEC-0330.
Please note that the distributions paid by the fund to shareholders are subject to recharacterization for tax purposes. The fund may also pay distributions in excess of the fund's net investment company taxable income and this excess would be a tax-free return of capital distributed from the fund's assets. The final tax treatment of all distributions is reported to shareholders on their 1099-DIV forms, which are mailed after the close of each calendar year.
APPROVAL OF INVESTMENT ADVISORY AGREEMENT
The board of directors of the fund, including a majority of the directors who are not parties to the fund's Investment Advisory Agreement, or interested persons of any such party ("Independent Directors''), has the responsibility under the 1940 Act to approve the fund's Investment Advisory Agreement for its initial two year term and its continuation annually thereafter at a meeting of the board called for the purpose of voting on the approval or continuation. At a meeting held in person on March 11-12, 2008, the Investment Advisory Agreement was discussed and was unanimously continued for a one-year term by the fund's board, including the Independent Directors. The Independent Directors were represented by independent counsel who assisted them in their deliberations during the meeting and executive session.
In considering whether to continue the Investment Advisory Agreement, the board reviewed materials provided by the fund's investment advisor (the "Advisor'') and fund counsel which included, among other things, fee, expense and performance information compared to peer funds ("Peer Funds") prepared by an independent data provider, supplemental performance and summary information prepared by the Advisor, sales and redemption data for the fund and memoranda outlining the legal duties of the board. The board also spoke directly with representatives of the independent data provider and met with investment advisory personnel. In addition, the board considered information provided from time to time by the Advisor throughout the year at meetings of the
21
COHEN & STEERS REALTY SHARES, INC.
board, including presentations by portfolio managers relating to the investment performance of the fund and the investment strategies used in pursuing the fund's objective. In particular, the board considered the following:
(i) The nature, extent and quality of services to be provided by the Advisor: The board reviewed the services that the Advisor provides to the fund, including, but not limited to, making the day-to-day investment decisions for the fund, and generally managing the fund's investments in accordance with the stated policies of the fund. The board also discussed with officers and portfolio managers of the fund the amount of time the Advisor dedicates to the fund and the types of transactions that were being done on behalf of the fund. Additionally, the board took into account the services provided by the Advisor to its other funds, including those that invest substantially in real estate securities and have investment objectives and strategies similar to the fund.
The board next considered the education, background and experience of the Advisor's personnel, noting particularly that the favorable history and reputation of the portfolio managers for the fund, has had, and would likely continue to have, a favorable impact on the success of the fund. The board further noted the Advisor's ability to attract quality and experienced personnel. After consideration of the above factors, among others, the board concluded that the nature, quality and extent of services provided by the Advisor are adequate and appropriate.
(ii) Investment performance of the fund and the Advisor: The board considered the investment performance of the fund compared to Peer Funds and compared to a relevant benchmark. The board noted that the fund underperformed the Peer Funds' median during the one-, three- and ten-year periods, but outperformed the Peer Funds' median during the five-year period. The board also noted that the fund underperformed the benchmarks for the one- and three-year periods, but outperformed for the five- and ten-year periods. The board engaged in discussions with the Advisor regarding the fund's most recent relative and absolute performance. The board also considered the Advisor's performance in managing other real estate funds. The board then determined that fund performance, in light of all considerations noted above, was satisfactory.
(iii) Cost of the services to be provided and profits to be realized by the Advisor from the relationship with the fund: Next, the board considered the advisory fees and administrative fees payable by the fund, as well as total expense ratios. As part of their analysis, the board gave substantial consideration to the fee and expense analyses provided by the independent data provider. The board noted that the advisory fee was above the median for the Peer Funds and that the total expense ratio (on a gross and net basis) was below the Peer Fund median and in the second quartile versus the Peer Funds. The board further noted that the administrative fees payable by the fund were below the Peer Fund median. In light of the considerations above, the board concluded that the fund's expense structure was competitive in the peer group.
The board also reviewed information regarding the profitability to the Advisor of its relationship with the fund. The board considered the level of the Advisor's profits and whether the profits were reasonable for the Advisor. The board took into consideration other benefits to be derived by the Advisor in connection with the Investment Advisory Agreement, noting particularly the research and related services, within the meaning of Section 28(e) of the Securities Exchange Act of 1934, as amended, that the Advisor receives by allocating the fund's brokerage
22
COHEN & STEERS REALTY SHARES, INC.
transactions. The board also considered the fees received by the Advisor under the Administration Agreement, but noted the significant services received, such as operational services and furnishing office space and facilities for the fund, and providing persons satisfactory to the board to serve as officers of the fund, and that these services were beneficial to the fund. The directors concluded that the profits realized by the Advisor from its administrative relationship with the fund were reasonable and consistent with fiduciary duties.
(iv) The extent to which economies of scale would be realized as the fund grows and whether fee levels would reflect such economies of scale: The board noted the the fund's advisory fee schedule contained a breakpoint of 10 basis points once the fund's assets reached $1.5 billion. The board determined that there were not at this time significant economies of scale that were not being shared with stockholders.
(v) Comparison of services rendered and fees paid to those under other investment advisory contracts, such as contracts of the same and other investment advisers or other clients: As discussed above in (i) and (iii), the board compared both the services rendered and the fees paid under the Investment Advisory Agreement to those under other investment advisory contracts of other investment advisers managing Peer Funds. The board also compared both the services rendered and the fees paid under the Investment Advisory Agreement to the Advisor's other fund advisory agreements as well as the profitability under the Investment Advisory Agreement to the Advisor's other advisory contracts with institutional and other clients with similar mandates. The board determined that on a comparative basis the fees under the Investment Advisory Agreement were reasonable in relation to the services provided.
No single factor was cited as determinative to the decision of the board. Rather, after weighing all of the considerations and conclusions discussed above, the board, including the Independent Directors, unanimously approved the continuation of the Investment Advisory Agreement.
23
COHEN & STEERS REALTY SHARES, INC.
Meet the Cohen & Steers family of open-end funds:
COHEN & STEERS
REALTY SHARES
• Designed for investors seeking total return, investing primarily in REITs
• Symbol: CSRSX
COHEN & STEERS
REALTY INCOME FUND
• Designed for investors seeking maximum total return, investing primarily in real estate securities with an emphasis on both income and capital appreciation
• Symbols: CSEIX, CSBIX, CSCIX, CSDIX
COHEN & STEERS
INTERNATIONAL REALTY FUND
• Designed for investors seeking total return, investing primarily in international real estate securities
• Symbols: IRFAX, IRFCX, IRFIX
COHEN & STEERS
DIVIDEND VALUE FUND
• Designed for investors seeking high current income and long-term growth of income and capital appreciation, investing primarily in dividend paying common stocks and preferred stocks
• Symbols: DVFAX, DVFCX, DVFIX
COHEN & STEERS
INSTITUTIONAL GLOBAL REALTY SHARES
• Designed for institutional investors seeking total return, investing primarily in global real estate securities
• Symbol: GRSIX
COHEN & STEERS
INSTITUTIONAL REALTY SHARES
• Designed for institutional investors seeking total return, investing primarily in REITs
• Symbol: CSRIX
COHEN & STEERS
GLOBAL REALTY SHARES
• Designed for investors seeking total return, investing primarily in global real estate equity securities
• Symbols: CSFAX, CSFBX, CSFCX, CSSPX
COHEN & STEERS
GLOBAL INFRASTRUCTURE FUND
• Designed for investors seeking total return, investing primarily in global infrastructure securities
• Symbols: CSUAX, CSUBX, CSUCX, CSUIX
COHEN & STEERS
ASIA PACIFIC REALTY SHARES
• Designed for investors seeking total return, investing primarily in real estate securities located in the Asia Pacific region
• Symbols: APFAX, APFCX, APFIX
COHEN & STEERS
EUROPEAN REALTY SHARES
• Designed for investors seeking total return, investing primarily in real estate securities located in Europe
• Symbols: EURAX, EURCX, EURIX
Please consider the investment objectives, risks, charges and expenses of the fund carefully before investing. A prospectus containing this and other information can be obtained by calling 800-330-7348 or by visiting cohenandsteers.com. Please read the prospectus carefully before investing.
Cohen & Steers Securities, LLC, Distributor
24
COHEN & STEERS REALTY SHARES, INC.
OFFICERS AND DIRECTORS
Robert H. Steers
Director and co-chairman
Martin Cohen
Director and co-chairman
Bonnie Cohen
Director
George Grossman
Director
Richard E. Kroon
Director
Richard J. Norman
Director
Frank K. Ross
Director
Willard H. Smith Jr.
Director
C. Edward Ward, Jr.
Director
Adam M. Derechin
President and chief executive officer
Joseph M. Harvey
Vice president
Jon Cheigh
Vice President
Francis C. Poli
Secretary
James Giallanza
Treasurer and chief financial officer
Lisa D. Phelan
Chief compliance officer
KEY INFORMATION
Investment Advisor
Cohen & Steers Capital Management, Inc.
280 Park Avenue
New York, NY 10017
(212) 832-3232
Fund Subadministrator and Custodian
State Street Bank and Trust Company
One Lincoln Street
Boston, MA 02111
Transfer Agent
Boston Financial Data Services, Inc.
2 Heritage Drive
North Quincy, MA 02171
(800) 437-9912
Legal Counsel
Stroock & Stroock & Lavan LLP
180 Maiden Lane
New York, NY 10038
Distributor
Cohen & Steers Securities, LLC
280 Park Avenue
New York, NY 10017
Nasdaq Symbol: CSRSX
Web site: cohenandsteers.com
This report is authorized for delivery only to shareholders of Cohen & Steers Realty Shares, Inc. unless accompanied or preceded by the delivery of a currently effective prospectus setting forth details of the fund. Past performance is of course no guarantee of future results and your investment may be worth more or less at the time you sell.
25

eDelivery NOW AVAILABLE
Stop traditional mail delivery; receive your shareholder reports and prospectus online.
Sign up at cohenandsteers.com
COHEN & STEERS
REALTY SHARES
280 PARK AVENUE
NEW YORK, NY 10017
SEMIANNUAL REPORT
JUNE 30, 2008
CSRSXSAR
Item 2. Code of Ethics.
Not applicable.
Item 3. Audit Committee Financial Expert.
Not applicable.
Item 4. Principal Accountant Fees and Services.
Not applicable.
Item 5. Audit Committee of Listed Registrants.
Not applicable.
Item 6. Schedule of Investments.
Included in Item 1 above.
Item 7. Disclosure of Proxy Voting Policies and Procedures for Closed-End Management Investment Companies.
Not applicable.
Item 8. Portfolio Managers of Closed-End Management Investment Companies.
Not applicable.
Item 9. Purchases of Equity Securities by Closed-End Management Investment Company and Affiliated Purchasers.
Not applicable.
Item 10. Submission of Matters to a Vote of Security Holders.
None.
Item 11. Controls and Procedures.
(a) The registrant’s principal executive officer and principal financial officer have concluded, based upon their evaluation of the registrant’s disclosure controls and procedures as conducted within 90 days of the filing date of this report, that these disclosure controls and procedures provide reasonable assurance that material information required to be disclosed by the registrant in the report it files or submits on Form N-CSR is recorded, processed, summarized and reported within the time periods specified in the Securities and Exchange Commission’s rules and forms
and that such material information is accumulated and communicated to the registrant’s management, including its principal executive officer and principal financial officer, as appropriate, in order to allow timely decisions regarding required disclosure.
(b) There were no changes in the registrant’s internal control over financial reporting that occurred during the second fiscal quarter of the period covered by this report that have materially affected, or are reasonably likely to materially affect, the registrant’s internal control over financial reporting.
Item 12. Exhibits.
(a)(1) Not applicable.
(a) (2) Certifications of principal executive officer and principal financial officer as required by Rule 30a-2(a) under the Investment Company Act of 1940.
(a)(3) Not applicable.
(b) Certifications of principal executive officer and principal financial officer as required by Rule 30a- 2(b) under the Investment Company Act of 1940.
SIGNATURES
Pursuant to the requirements of the Securities Exchange Act of 1934 and the Investment Company Act of 1940, the registrant has duly caused this report to be signed on its behalf by the undersigned, thereunto duly authorized.
COHEN & STEERS REALTY SHARES, INC.
| By: | /s/ Adam M. Derechin | |
| | Name: Adam M. Derechin |
| | Title: President and Chief Executive Officer |
| |
| Date: August 26, 2008 |
Pursuant to the requirements of the Securities Exchange Act of 1934 and the Investment Company Act of 1940, this report has been signed below by the following persons on behalf of the registrant and in the capacities and on the dates indicated.
| By: | /s/ Adam M. Derechin | |
| | Name: | Adam M. Derechin |
| | Title: | President and Chief Executive Officer |
| | | (principal executive officer) |
| | |
| By: | /s/ James Giallanza | |
| | Name: | James Giallanza |
| | Title: | Treasurer |
| | | (principal financial officer) |
| | |
| | |
| Date: August 26, 2008 |
| | | | |