UNITED STATES
SECURITIES AND EXCHANGE COMMISSION
Washington, D.C. 20549
FORM N-CSR
CERTIFIED SHAREHOLDER REPORT OF REGISTERED
MANAGEMENT INVESTMENT COMPANIES
Investment Company Act file number | 811-6302 |
|
Cohen & Steers Realty Shares, Inc. |
(Exact name of registrant as specified in charter) |
|
280 Park Avenue, New York, NY | | 10017 |
(Address of principal executive offices) | | (Zip code) |
|
Adam M. Derechin
Cohen & Steers Capital Management, Inc.
280 Park Avenue
New York, New York 10017 |
(Name and address of agent for service) |
|
Registrant’s telephone number, including area code: | (212) 832-3232 | |
|
Date of fiscal year end: | December 31 | |
|
Date of reporting period: | December 31, 2009 | |
| | | | | | | | |
Item 1. Reports to Stockholders.
COHEN & STEERS REALTY SHARES, INC.
To Our Shareholders:
We would like to share with you our report for the year ended December 31, 2009. The net asset value (NAV) at that date was $47.06 per share.
The total returns, including income and change in NAV, for the Fund and the comparative benchmarks were:
| | | Six Months Ended
December 31, 2009 | | Year Ended
December 31, 2009 | |
| Cohen & Steers Realty Shares | | | 47.55 | % | | | 32.50 | % | |
| FTSE NAREIT Equity REIT Indexa | | | 45.80 | % | | | 27.99 | % | |
| S&P 500 Indexa | | | 22.59 | % | | | 26.46 | % | |
The performance data quoted represent past performance. Past performance is no guarantee of future results. The investment return and the principal value of an investment will fluctuate and shares, if redeemed, may be worth more or less than their original cost. Current performance may be lower or higher than the performance data quoted. Current total returns of the Fund can be obtained by visiting our Web site at cohenandsteers.com.
Please note that the distributions paid by the Fund to shareholders are subject to recharacterization for tax purposes. These recharacterizations could result in the Fund paying distributions in excess of its investment company taxable income and this excess would be a tax-free return of capital distributed from the Fund's assets.
Investment Review
REITs were a tale of two markets in 2009. The year's early months were characterized by continued fallout from the post-Lehman Brothers financial panic, a blowout in risk premiums and declining credit availability. The asset class sold off on concerns about REITs' limited access to capital amid near-frozen credit markets and limited transparency on property value estimates.
Broader financial markets, including REITs, began to stabilize and then rebound when the government provided clarity on the means and costs of backstopping the financial system. This broke the vicious negative feedback loop between the capital markets and the real economy, and paved the way for the market rally that followed.
a The FTSE NAREIT Equity REIT Index is an unmanaged, market-capitalization-weighted index of all publicly traded REITs that invest predominantly in the equity ownership of real estate. The index is designed to reflect the performance of all publicly traded equity REITs as a whole. The S&P 500 Index is an unmanaged index of common stocks that is frequently used as a general measure of stock market performance.
1
COHEN & STEERS REALTY SHARES, INC.
REIT recapitalization lifted share prices
REITs began to raise significant new capital in March, which reassured investors that they could strengthen their balance sheets, meet debt maturities and take advantage of buying opportunities. In total, public real estate companies raised $20 billion of new equity during the year, and Cohen & Steers was a cornerstone investor in many of the offerings. Recapitalization revealed the pent-up investor demand in the asset class and drove significant spread tightening in the REIT unsecured bond market.
REITs surged in the third quarter as easing liquidity concerns lifted the asset class to its best-ever quarterly return. With access to multiple sources of capital, companies could extend debt maturities and, in some cases, move into a more offensive (acquisitive) posture. The pace of the rally slowed in the fourth quarter, however, when investors' appetite for risk abated and unease over high unemployment grew.
Hotel companies were top performers
The hotel sector (with a total return of +67.2%)b led all property types in 2009. Their short leases and ability to respond quickly to changing economic conditions began to be discounted amid signs of economic stabilization and likely future economic growth.
Regional malls (+63.0%) turned in a better-than-expected performance, benefiting from recapitalization and stabilization in retail sales and increased consumer confidence. Simon Property Group, the country's largest mall operator, was the first major U.S. REIT to issue new equity. Office REITs (+35.6%) were aided by less-severe job losses in New York and a V-shaped recovery that anticipated a return to profitability by the financial services industry. In both categories, cap rates declined in response to increasing global demand for class-A properties.
Apartment REITs (+30.4%) were hurt early in the year by increased job losses and declines in market rents, but improved in the third quarter on expectations of stabilization in fundamentals in 2010 and growth in 2011.
Shopping centers declined
The shopping center sector (–1.7%) was the only REIT property group to post a negative total return during the year. Typically considered defensive because of their consumer staples anchors (supermarkets and drug stores), shopping centers' smaller retailers proved to be highly sensitive to the economic downturn. In news, shopping center owner Developers Diversified Realty completed the first commercial mortgage-backed securities issuance in more than a year, and it was the first real estate debt offering backed by the Term Asset-Backed Securities Loan Facility.
Health care REITs (+24.6%) and self storage companies (+8.4%) trailed the benchmark, as defensive sectors lagged their more economically sensitive counterparts during the rally. Health care companies suffered additionally from uncertainty about the impact of proposed health care reform.
b Sector returns as measured by the FTSE NAREIT Equity REIT Index.
2
COHEN & STEERS REALTY SHARES, INC.
Fund performance
The Fund had a significant total return during the year and outperformed its benchmark. Factors that contributed to relative performance included our stock selection and overweight position in office REITs. Among the worst performers early in the year, office REITs began to rebound when capital markets reopened and the growth in unemployment slowed. The property sector received an additional boost from yield-hungry foreign investors looking to acquire institutional-quality assets in supply-constrained major U.S. markets.
Stock selection in health care companies and the industrial sector (which had a total return of +12.2% within the index) were also positive contributors to performance, as were our underweight in shopping center REITs and overweight in regional mall operators.
Factors that detracted from relative return included our overweight in hotel companies during periods when they underperformed the index (the full impact was mitigated by stock selection). The Fund's overweight in defensive self storage REITs during a rally that favored higher-risk companies also detracted from total return, as did our stock selection and underweight in the apartment sector.
The Fund's underweight in apartment REITs reflected our view that high unemployment would depress household formation, pressuring rents and occupancies for apartment companies. Furthermore, we believed that the excess supply of single-family housing and condominiums could become a more competitive housing option if the economy recovered.
Investment Outlook
We expect 2010 to be a year of better-than-expected economic growth and continued stabilization in fundamentals. Although there are concerns about the eventual cost of the government stimulus—monetary tightening, higher taxes and the effects of fiscal stimulus—we believe the recovery will prove self-sustaining and continue into 2011.
The new year may well be one in which REITs begin to take advantage of significant acquisition opportunities. While the environment is not so distressed as to create dysfunction, well-capitalized REITs with an operating platform will likely have attractive opportunities to create value and generate above-average cash flow growth. During the latter half of 2010 and into 2011, we expect the benefits of economic recovery and growth to translate into occupancy stabilization and selective rent increases in many commercial real estate markets.
From a portfolio standpoint, we currently favor economically sensitive sectors. On a sector-specific basis, we believe that shopping centers, hotels and self storage REITs will outperform. Office REITs should benefit from low supply and stabilization in jobs, although we believe most of this dynamic is already priced into company valuations. While we expect apartment company fundamentals to improve with job growth and demographic shifts, we remain cautious because of their less favorable valuations.
3
COHEN & STEERS REALTY SHARES, INC.
We expect to maintain our focus on REITs with healthy balance sheets but with a particular focus on entrepreneurial management teams that have the acumen to create, rather than wait for, unique opportunities.
Sincerely,
 | |  | |
|
| MARTIN COHEN | | ROBERT H. STEERS | |
|
| Co-chairman | | Co-chairman | |
|
 | |  | |
|
| JOSEPH M. HARVEY | | JON CHEIGH | |
|
| Portfolio Manager | | Portfolio Manager | |
|
The views and opinions in the preceding commentary are subject to change. This material represents an assessment of the market environment at a specific point in time, should not be relied upon as investment advice and is not intended to predict or depict performance of any investment.
Visit Cohen & Steers online at cohenandsteers.com
For more information about any of our funds, visit cohenandsteers.com, where you will find daily net asset values, fund fact sheets and portfolio highlights. You can also access newsletters, education tools and market updates covering the global real estate, listed infrastructure, utilities, large cap value and preferred securities sectors.
In addition, our Web site contains comprehensive information about our firm, including our most recent press releases, profiles of our senior investment professionals and an overview of our investment approach.
4
COHEN & STEERS REALTY SHARES, INC.
Performance Review (Unaudited)
Growth of a $10,000 Investment
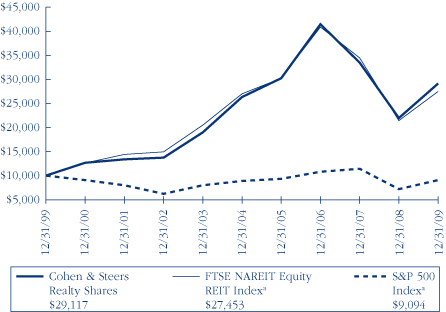
Average Annual Total Returns—For Periods Ended December 31, 2009
| | | 1 Year | | 5 Years | | 10 Years | | Since Inceptionb | |
| Fund | | | 32.50 | % | | | 2.05 | % | | | 11.28 | % | | | 11.63 | % | |
The performance data quoted represent past performance. Past performance is no guarantee of future results. The investment return and principal value of an investment will fluctuate and shares, when redeemed, may be worth more or less than their original cost. Current performance may be lower or higher than the performance data quoted. Current total returns of the Fund can be obtained by visiting our Web site at cohenandsteers.com. The performance graph and table do not reflect the deduction of taxes that a shareholder would pay on Fund distributions or the redemption of Fund shares.
The annual expense ratio as reported in the prospectus dated May 1, 2009 was 1.00%.
a The comparative indices are not adjusted to reflect expenses or other fees that the SEC requires to be reflected in the Fund's performance. The Fund's performance assumes the reinvestment of all dividends and distributions. For more information, including charges and expenses, please read the prospectus carefully before you invest.
b Inception date of July 2, 1991.
5
COHEN & STEERS REALTY SHARES, INC.
Expense Example (Unaudited)
As a shareholder of the Fund, you incur two types of costs: (1) transaction costs, including redemption fees and (2) ongoing costs including management fees and other Fund expenses. This example is intended to help you understand your ongoing costs (in dollars) of investing in the Fund and to compare these costs with the ongoing costs of investing in other mutual funds.
The example is based on an investment of $1,000 invested at the beginning of the period and held for the entire period July 1, 2009—December 31, 2009.
Actual Expenses
The first line of the table below provides information about actual account values and expenses. You may use the information in this line, together with the amount you invested, to estimate the expenses that you paid over the period. Simply divide your account value by $1,000 (for example, an $8,600 account value divided by $1,000 = 8.6), then multiply the result by the number in the first line under the heading entitled "Expenses Paid During Period" to estimate the expenses you paid on your account during this period.
Hypothetical Example for Comparison Purposes
The second line of the table below provides information about hypothetical account values and hypothetical expenses based on the Fund's actual expense ratio and an assumed rate of return of 5% per year before expenses, which is not the Fund's actual return. The hypothetical account values and expenses may not be used to estimate the actual ending account balance or expenses you paid for the period. You may use this information to compare the ongoing cost of investing in the Fund and other funds. To do so, compare this 5% hypothetical example with the 5% hypothetical examples that appear in the shareholder reports of other funds.
Please note that the expenses shown in the table are meant to highlight your ongoing costs only and do not reflect any transactional costs, such as redemption fees. Therefore, the second line of the table is useful in comparing ongoing costs only, and will not help you determine the relative total costs of owning different funds. In addition, if these transactional costs were included, your costs would have been higher.
| | | Beginning
Account Value
July 1, 2009 | | Ending
Account Value
December 31, 2009 | | Expenses Paid
During Period*
July 1, 2009–
December 31, 2009 | |
| Actual (47.55% return) | | $ | 1,000.00 | | | $ | 1,475.50 | | | $ | 6.36 | | |
| Hypothetical (5% annual return before expenses) | | $ | 1,000.00 | | | $ | 1,020.06 | | | $ | 5.19 | | |
* Expenses are equal to the Fund's annualized expense ratio of 1.02% multiplied by the average account value over the period, multiplied by 184/365 (to reflect the one-half year period).
6
COHEN & STEERS REALTY SHARES, INC.
DECEMBER 31, 2009
Top Ten Holdings
(Unaudited)
| Security | | Value | | % of
Net
Assets | |
| Simon Property Group | | $ | 233,320,996 | | | | 10.1 | % | |
| Public Storage | | | 160,949,517 | | | | 7.0 | | |
| ProLogis | | | 106,895,394 | | | | 4.6 | | |
| Equity Residential | | | 100,802,695 | | | | 4.4 | | |
| Vornado Realty Trust | | | 90,063,696 | | | | 3.9 | | |
| Macerich Co. | | | 84,699,422 | | | | 3.7 | | |
| Host Hotels & Resorts | | | 79,793,088 | | | | 3.5 | | |
| Boston Properties | | | 74,363,795 | | | | 3.2 | | |
| Developers Diversified Realty Corp. | | | 70,630,474 | | | | 3.1 | | |
| HCP | | | 68,869,746 | | | | 3.0 | | |
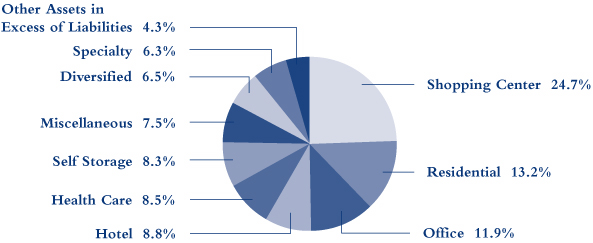
Sector Breakdown
(Based on Net Assets)
(Unaudited)
7
COHEN & STEERS REALTY SHARES, INC.
SCHEDULE OF INVESTMENTS
December 31, 2009
| | | | | Number
of Shares | | Value | |
| COMMON STOCK | | | 95.7 | % | | | | | | | | | |
| DIVERSIFIED | | | 6.5 | % | | | | | | | | | |
| Alexander's | | | | | | | 26,566 | | | $ | 8,087,222 | | |
| Cousins Properties | | | | | | | 2,929,953 | | | | 22,355,541 | | |
| Forest City Enterprisesa | | | | | | | 1,693,525 | | | | 19,949,725 | | |
| Lexington Realty Trust | | | | | | | 1,345,484 | | | | 8,180,543 | | |
| Vornado Realty Trust | | | | | | | 1,287,728 | | | | 90,063,696 | | |
| | | | | | | | 148,636,727 | | |
| HEALTH CARE | | | 8.5 | % | | | | | | | | | |
| Brookdale Senior Livinga | | | | | | | 2,311,770 | | | | 42,051,097 | | |
| HCP | | | | | | | 2,255,067 | | | | 68,869,746 | | |
| Nationwide Health Properties | | | | | | | 1,273,573 | | | | 44,804,298 | | |
| Ventas | | | | | | | 927,858 | | | | 40,584,509 | | |
| | | | | | | | 196,309,650 | | |
| HOTEL | | | 8.8 | % | | | | | | | | | |
| Gaylord Entertainment Co.a | | | | | | | 1,325,256 | | | | 26,173,806 | | |
| Hospitality Properties Trust | | | | | | | 1,623,603 | | | | 38,495,627 | | |
| Host Hotels & Resorts | | | | | | | 6,837,454 | | | | 79,793,088 | | |
| Orient-Express Hotels Ltd.a | | | | | | | 2,171,800 | | | | 22,022,052 | | |
| Pebblebrook Hotel Trust | | | | | | | 459,400 | | | | 10,111,394 | | |
| Starwood Hotels & Resorts Worldwide | | | | | | | 419,657 | | | | 15,346,856 | | |
| Sunstone Hotel Investorsa | | | | | | | 1,247,212 | | | | 11,075,243 | | |
| | | | | | | | 203,018,066 | | |
| INDUSTRIAL | | | 6.2 | % | | | | | | | | | |
| AMB Property Corp. | | | | | | | 533,347 | | | | 13,627,016 | | |
| DCT Industrial Trust | | | | | | | 2,187,790 | | | | 10,982,706 | | |
| EastGroup Properties | | | | | | | 273,273 | | | | 10,460,890 | | |
| ProLogis | | | | | | | 7,808,283 | | | | 106,895,394 | | |
| | | | | | | | 141,966,006 | | |
See accompanying notes to financial statements.
8
COHEN & STEERS REALTY SHARES, INC.
SCHEDULE OF INVESTMENTS—(Continued)
December 31, 2009
| | | | | Number
of Shares | | Value | |
| OFFICE | | | 11.9 | % | | | | | | | | | |
| BioMed Realty Trust | | | | | | | 1,026,142 | | | $ | 16,192,521 | | |
| Boston Properties | | | | | | | 1,108,749 | | | | 74,363,795 | | |
| Brookfield Properties Corp. | | | | | | | 1,879,850 | | | | 22,783,782 | | |
| Douglas Emmett | | | | | | | 789,048 | | | | 11,243,934 | | |
| Kilroy Realty Corp. | | | | | | | 1,243,694 | | | | 38,144,095 | | |
| Liberty Property Trust | | | | | | | 1,164,948 | | | | 37,289,986 | | |
| Mack-Cali Realty Corp. | | | | | | | 840,135 | | | | 29,043,467 | | |
| SL Green Realty Corp. | | | | | | | 898,009 | | | | 45,115,972 | | |
| | | | | | | | 274,177,552 | | |
| OFFICE/INDUSTRIAL | | | 1.3 | % | | | | | | | | | |
| PS Business Parks | | | | | | | 592,336 | | | | 29,646,417 | | |
| RESIDENTIAL | | | 13.2 | % | | | | | | | | | |
| APARTMENT | | | 12.0 | % | | | | | | | | | |
| Apartment Investment & Management Co. | | | | | | | 1,554,052 | | | | 24,740,508 | | |
| AvalonBay Communities | | | | | | | 630,985 | | | | 51,810,178 | | |
| Camden Property Trust | | | | | | | 912,129 | | | | 38,646,906 | | |
| Colonial Properties Trust | | | | | | | 1,392,456 | | | | 16,333,509 | | |
| Education Realty Trust | | | | | | | 1,647,909 | | | | 7,975,880 | | |
| Equity Residential | | | | | | | 2,984,094 | | | | 100,802,695 | | |
| Essex Property Trust | | | | | | | 262,373 | | | | 21,947,501 | | |
| UDR | | | | | | | 838,219 | | | | 13,780,320 | | |
| | | | | | | | 276,037,497 | | |
| MANUFACTURED HOME | | | 1.2 | % | | | | | | | | | |
| Equity Lifestyle Properties | | | | | | | 524,427 | | | | 26,467,831 | | |
| TOTAL RESIDENTIAL | | | | | | | | | | | 302,505,328 | | |
| SELF STORAGE | | | 8.3 | % | | | | | | | | | |
| Public Storage | | | | | | | 1,976,053 | | | | 160,949,517 | | |
| Sovran Self Storage | | | | | | | 451,041 | | | | 16,115,695 | | |
| U-Store-It Trust | | | | | | | 1,710,480 | | | | 12,520,713 | | |
| | | | | | | | 189,585,925 | | |
See accompanying notes to financial statements.
9
COHEN & STEERS REALTY SHARES, INC.
SCHEDULE OF INVESTMENTS—(Continued)
December 31, 2009
| | | | | Number
of Shares | | Value | |
| SHOPPING CENTER | | | 24.7 | % | | | | | | | | | |
| COMMUNITY CENTER | | | 10.2 | % | | | | | | | | | |
| Acadia Realty Trust | | | | | | | 467,026 | | | $ | 7,878,729 | | |
| Developers Diversified Realty Corp. | | | | | | | 7,627,481 | | | | 70,630,474 | | |
| Federal Realty Investment Trust | | | | | | | 328,555 | | | | 22,249,745 | | |
| Inland Real Estate Corp. | | | | | | | 2,059,495 | | | | 16,784,884 | | |
| Kimco Realty Corp. | | | | | | | 3,098,116 | | | | 41,917,509 | | |
| Regency Centers Corp. | | | | | | | 1,124,670 | | | | 39,430,930 | | |
| Weingarten Realty Investors | | | | | | | 1,792,058 | | | | 35,464,828 | | |
| | | | | | | | 234,357,099 | | |
| FREE STANDING | | | 0.7 | % | | | | | | | | | |
| Realty Income Corp. | | | | | | | 638,616 | | | | 16,546,540 | | |
| REGIONAL MALL | | | 13.8 | % | | | | | | | | | |
| Macerich Co. | | | | | | | 2,356,034 | | | | 84,699,422 | | |
| Simon Property Group | | | | | | | 2,923,822 | | | | 233,320,996 | | |
| | | | | | | | 318,020,418 | | |
| TOTAL SHOPPING CENTER | | | | | | | | | | | 568,924,057 | | |
| SPECIALTY | | | 6.3 | % | | | | | | | | | |
| Digital Realty Trust | | | | | | | 586,295 | | | | 29,478,913 | | |
| Plum Creek Timber Co. | | | | | | | 1,506,714 | | | | 56,893,521 | | |
| Rayonier | | | | | | | 1,119,116 | | | | 47,181,930 | | |
| Weyerhaeuser Co. | | | | | | | 284,578 | | | | 12,276,695 | | |
| | | | | | | | 145,831,059 | | |
| TOTAL COMMON STOCK (Identified cost—$1,643,523,881) | | | | | | | | | | | 2,200,600,787 | | |
See accompanying notes to financial statements.
10
COHEN & STEERS REALTY SHARES, INC.
SCHEDULE OF INVESTMENTS
December 31, 2009—(Continued)
| | | | | Principal
Amount | | Value | |
| COMMERCIAL PAPER | | | 2.5 | % | | | | | | | |
American Express Credit Corp., 0.00%, due 1/4/10
(Identified cost—$58,000,000) | | | | | | $ | 58,000,000 | | | $ | 58,000,000 | | |
| TOTAL INVESTMENTS (Identified cost—$1,701,523,881) | | | 98.2 | % | | | | | 2,258,600,787 | | |
| OTHER ASSETS IN EXCESS OF LIABILITIES | | | 1.8 | % | | | | | 40,786,367 | | |
NET ASSETS (Equivalent to $47.06 per share based on 48,862,471
shares of common stock outstanding) | | | 100.0 | % | | | | $ | 2,299,387,154 | | |
Note: Percentages indicated are based on the net assets of the Fund.
a Non-income producing security.
See accompanying notes to financial statements.
11
COHEN & STEERS REALTY SHARES, INC.
STATEMENT OF ASSETS AND LIABILITIES
December 31, 2009
| ASSETS: | |
| Investments in securities, at value (Identified cost—$1,701,523,881) | | $ | 2,258,600,787 | | |
| Cash | | | 9,073,301 | | |
| Receivable for: | |
| Investment securities sold | | | 36,448,538 | | |
| Fund shares sold | | | 7,984,744 | | |
| Dividends | | | 6,546,769 | | |
| Other assets | | | 75,342 | | |
| Total Assets | | | 2,318,729,481 | | |
| LIABILITIES: | |
| Payable for: | |
| Investment securities purchased | | | 12,745,841 | | |
| Fund shares redeemed | | | 4,279,041 | | |
| Investment advisory fees | | | 1,551,258 | | |
| Administration fees | | | 37,970 | | |
| Other liabilities | | | 728,217 | | |
| Total Liabilities | | | 19,342,327 | | |
NET ASSETS applicable to 48,862,471 shares of $0.001 par value of common stock
outstanding | | $ | 2,299,387,154 | | |
| NET ASSET VALUE PER SHARE: | |
| ($2,299,387,154 ÷ 48,862,471 shares outstanding) | | $ | 47.06 | | |
| NET ASSETS consist of: | |
| Paid-in-capital | | $ | 2,143,794,288 | | |
| Accumulated undistributed net investment income | | | 3,917,317 | | |
| Accumulated net realized loss | | | (405,401,357 | ) | |
| Net unrealized appreciation | | | 557,076,906 | | |
| | | $ | 2,299,387,154 | | |
See accompanying notes to financial statements.
12
COHEN & STEERS REALTY SHARES, INC.
STATEMENT OF OPERATIONS
For the Year Ended December 31, 2009
| Investment Income: | |
| Dividend income (net of $155,010 of foreign withholding tax) | | $ | 54,929,929 | | |
| Expenses: | |
| Investment advisory fees | | | 13,061,882 | | |
| Transfer agent fees and expenses | | | 1,746,075 | | |
| Administration fees | | | 750,466 | | |
| Reports to shareholders | | | 340,780 | | |
| Custodian fees and expenses | | | 188,284 | | |
| Professional fees | | | 137,335 | | |
| Line of credit fees | | | 107,330 | | |
| Registration and filing fees | | | 95,183 | | |
| Directors' fees and expenses | | | 52,830 | | |
| Miscellaneous | | | 119,429 | | |
| Total Expenses | | | 16,599,594 | | |
| Net Investment Income | | | 38,330,335 | | |
| Net Realized and Unrealized Gain: | |
| Net realized gain on investments | | | 1,796,955 | | |
| Net change in unrealized appreciation | | | 530,994,525 | | |
| Net realized and unrealized gain | | | 532,791,480 | | |
| Net Increase in Net Assets Resulting from Operations | | $ | 571,121,815 | | |
See accompanying notes to financial statements.
13
COHEN & STEERS REALTY SHARES, INC.
STATEMENT OF CHANGES IN NET ASSETS
| | | For the
Year Ended
December 31, 2009 | | For the
Year Ended
December 31, 2008 | |
| Change in Net Assets: | |
| From Operations: | |
| Net investment income | | $ | 38,330,335 | | | $ | 43,068,646 | | |
| Net realized gain (loss) | | | 1,796,955 | | | | (381,976,408 | ) | |
| Net change in unrealized appreciation (depreciation) | | | 530,994,525 | | | | (463,138,364 | ) | |
Net increase (decrease) in net assets resulting from
operations | | | 571,121,815 | | | | (802,046,126 | ) | |
| Dividends and Distributions to Shareholders from: | |
| Net investment income | | | (39,042,174 | ) | | | (46,900,374 | ) | |
| Tax return of capital | | | (22,345,501 | ) | | | (30,926,409 | ) | |
| Total dividends and distributions to shareholders | | | (61,387,675 | ) | | | (77,826,783 | ) | |
| Capital Stock Transactions: | |
Increase (decrease) in net assets from Fund share
transactions | | | 397,564,522 | | | | (23,138,230 | ) | |
| Total increase (decrease) in net assets | | | 907,298,662 | | | | (903,011,139 | ) | |
| Net Assets: | |
| Beginning of year | | | 1,392,088,492 | | | | 2,295,099,631 | | |
| End of yeara | | $ | 2,299,387,154 | | | $ | 1,392,088,492 | | |
a Includes undistributed net investment income of $3,917,317 and $3,104,314, respectively.
See accompanying notes to financial statements.
14
COHEN & STEERS REALTY SHARES, INC.
FINANCIAL HIGHLIGHTS
The following table includes selected data for a share outstanding throughout each year and other performance information derived from the financial statements. It should be read in conjunction with the financial statements and notes thereto.
| | | For the Year Ended December 31, | |
| Per Share Operating Performance: | | 2009 | | 2008 | | 2007 | | 2006 | | 2005 | |
| Net asset value, beginning of year | | $ | 37.01 | | | $ | 58.80 | | | $ | 89.45 | | | $ | 72.59 | | | $ | 69.66 | | |
| Income from investment operations: | |
| Net investment income | | | 0.89 | | | | 1.15 | | | | 1.24 | a | | | 0.91 | | | | 1.04 | | |
| Net realized and unrealized gain (loss) | | | 10.55 | | | | (20.93 | ) | | | (18.21 | ) | | | 25.52 | | | | 9.17 | | |
Total income (loss) from investment
operations | | | 11.44 | | | | (19.78 | ) | | | (16.97 | ) | | | 26.43 | | | | 10.21 | | |
| Less dividends and distributions to shareholders from: | |
| Net investment income | | | (0.89 | ) | | | (1.22 | ) | | | (1.09 | ) | | | (0.91 | ) | | | (1.04 | ) | |
| Net realized gain | | | — | | | | — | | | | (12.63 | ) | | | (8.14 | ) | | | (5.80 | ) | |
| Tax return of capital | | | (0.51 | ) | | | (0.80 | ) | | | — | | | | (0.53 | ) | | | (0.46 | ) | |
Total dividends and distributions to
shareholders | | | (1.40 | ) | | | (2.02 | ) | | | (13.72 | ) | | | (9.58 | ) | | | (7.30 | ) | |
| Redemption fees retained by the Fund | | | 0.01 | | | | 0.01 | | | | 0.04 | | | | 0.01 | | | | 0.02 | | |
| Net increase (decrease) in net asset value | | | 10.05 | | | | (21.79 | ) | | | (30.65 | ) | | | 16.86 | | | | 2.93 | | |
| Net asset value, end of year | | $ | 47.06 | | | $ | 37.01 | | | $ | 58.80 | | | $ | 89.45 | | | $ | 72.59 | | |
| Total investment return | | | 32.50 | % | | | –34.40 | % | | | –19.19 | % | | | 37.13 | % | | | 14.89 | % | |
| Ratios/Supplemental Data: | |
| Net assets, end of year (in millions) | | $ | 2,299.4 | | | $ | 1,392.1 | | | $ | 2,295.1 | | | $ | 3,601.9 | | | $ | 2,466.0 | | |
| Ratio of expenses to average daily net assets | | | 1.06 | % | | | 1.00 | % | | | 0.95 | % | | | 0.96 | % | | | 0.97 | % | |
| Ratio of net investment income to average daily net assets | | | 2.45 | % | | | 2.06 | % | | | 1.21 | % | | | 1.08 | % | | | 1.45 | % | |
| Portfolio turnover rate | | | 119 | % | | | 99 | % | | | 58 | % | | | 31 | % | | | 28 | % | |
a 15.1% of net investment income was attributable to a special dividend paid by Boston Properties, Inc.
See accompanying notes to financial statements.
15
COHEN & STEERS REALTY SHARES, INC.
NOTES TO FINANCIAL STATEMENTS
Note 1. Significant Accounting Policies
Cohen & Steers Realty Shares, Inc. (the Fund) was incorporated under the laws of the State of Maryland on April 26, 1991 and is registered under the Investment Company Act of 1940, as amended, as a nondiversified, open-end management investment company. The Fund's investment objective is total return.
The following is a summary of significant accounting policies consistently followed by the Fund in the preparation of its financial statements. The policies are in conformity with accounting principles generally accepted in the United States of America (GAAP). The preparation of the financial statements in accordance with GAAP requires management to make estimates and assumptions that affect the reported amounts of assets and liabilities at the date of the financial statements and the reported amounts of income and expenses during the reporting period. Actual results could differ from those estimates.
Portfolio Valuation: Investments in securities that are listed on the New York Stock Exchange are valued, except as indicated below, at the last sale price reflected at the close of the New York Stock Exchange on the business day as of which such value is being determined. If there has been no sale on such day, the securities are valued at the mean of the closing bid and asked prices for the day or, if no asked price is available, at the bid price.
Securities not listed on the New York Stock Exchange but listed on other domestic or foreign securities exchanges are valued in a similar manner. Securities traded on more than one securities exchange are valued at the last sale price on the business day as of which such value is being determined as reflected on the tape at the close of the exchange representing the principal market for such securities. If after the close of a foreign market, but prior to the close of business on the day the securities are being valued, market conditions change significantly, certain foreign securities may be fair valued pursuant to procedures established by the Board of Directors.
Readily marketable securities traded in the over-the-counter market, including listed securities whose primary market is believed by Cohen & Steers Capital Management, Inc. (the advisor) to be over-the-counter, are valued at the official closing prices as reported by sources as the Board of Directors deem appropriate to reflect their fair market value. If there has been no sale on such day, the securities are valued at the mean of the closing bid and asked prices for the day, or if no asked price is available, at the bid price. However, certain fixed-income securities may be valued on the basis of prices provided by a pricing service when such prices are believed by the Board of Directors to reflect the fair market value of such securities.
Securities for which market prices are unavailable, or securities for which the advisor determines that bid and/or asked price does not reflect market value, will be valued at fair value pursuant to procedures approved by the Fund's Board of Directors. Circumstances in which market prices may be unavailable include, but are not limited to, when trading in a security is suspended, the exchange on which the security is traded is subject to an unscheduled close or disruption or material events occur after the close of the exchange on which the security is principally traded. In these circumstances, the Fund determines fair value in a manner that fairly reflects the market value of the security on the valuation date based on consideration of any information or factors it deems
16
COHEN & STEERS REALTY SHARES, INC.
NOTES TO FINANCIAL STATEMENTS—(Continued)
appropriate. These may include, but are not limited to, recent transactions in comparable securities, information relating to the specific security and developments in the markets.
The Fund's use of fair value pricing may cause the net asset value of Fund shares to differ from the net asset value that would be calculated using market quotations. Fair value pricing involves subjective judgments and it is possible that the fair value determined for a security may be materially different than the value that could be realized upon the sale of that security.
Short-term debt securities with a maturity date of 60 days or less are valued at amortized cost, which approximates value.
Fair value is defined as the price that the Fund would receive to sell an investment or pay to transfer a liability in an orderly transaction with an independent buyer in the principal market, or in the absence of a principal market the most advantageous market for the investment or liability. The hierarchy of inputs that are used in determining the fair value of the Fund's investments is summarized below.
• Level 1—quoted prices in active markets for identical investments
• Level 2—other significant observable inputs (including quoted prices for similar investments, interest rates, credit risk, etc.)
• Level 3—significant unobservable inputs (including the Fund's own assumptions in determining the fair value of investments)
The inputs or methodology used for valuing securities are not necessarily an indication of the risk associated with investing in those securities.
The following is a summary of the inputs used as of December 31, 2009 in valuing the Fund's investments carried at value:
| | | Total | | Quoted Prices In
Active Market for
Identical Assets
(Level 1) | | Significant
Other Observable
Inputs
(Level 2) | | Significant
Unobservable
Inputs
(Level 3) | |
| Common Stock | | $ | 2,200,600,787 | | | $ | 2,200,600,787 | | | $ | — | | | | — | | |
| Commercial Paper | | | 58,000,000 | | | | — | | | | 58,000,000 | | | | — | | |
| Total Investments | | $ | 2,258,600,787 | | | $ | 2,200,600,787 | | | $ | 58,000,000 | | | | — | | |
Security Transactions and Investment Income: Security transactions are recorded on trade date. Realized gains and losses on investments sold are recorded on the basis of identified cost. Interest income is recorded on the accrual basis. Discounts are accreted and premiums are amortized over the life of the respective securities. Dividend income is recorded on the ex-dividend date. The Fund records distributions received in excess of income from underlying investments as a reduction of cost of investments and/or realized gain. Such amounts are based on
17
COHEN & STEERS REALTY SHARES, INC.
NOTES TO FINANCIAL STATEMENTS—(Continued)
estimates if actual amounts are not available, and actual amounts of income, realized gain and return of capital may differ from the estimated amounts. The Fund adjusts the estimated amounts of the components of distributions (and consequently its net investment income) as an increase to unrealized appreciation/(depreciation) and realized gain/(loss) on investments as necessary once the issuers provide information about the actual composition of the distributions.
Dividends and Distributions to Shareholders: Dividends from net investment income and capital gain distributions are determined in accordance with U.S. federal income tax regulations, which may differ from GAAP. Dividends from net investment income are declared and paid quarterly. Net realized capital gains, unless offset by any available capital loss carryforward, are distributed to shareholders at least annually. Dividends and distributions to shareholders are recorded on the ex-dividend date and are automatically reinvested in full and fractional shares of the Fund based on the net asset value per share at the close of business on the payable date unless the shareholder has elected to have them paid in cash.
Distributions paid by the Fund are subject to recharacterization for tax purposes. Based upon the results of operations for the year ended December 31, 2009, a portion of the dividends have been reclassified to return of capital.
Income Taxes: It is the policy of the Fund to continue to qualify as a regulated investment company, if such qualification is in the best interest of the shareholders, by complying with the requirements of Subchapter M of the Internal Revenue Code applicable to regulated investment companies, and by distributing substantially all of its taxable earnings to its shareholders. Accordingly, no provision for federal income or excise tax is necessary. Management has analyzed the Fund's tax positions taken on federal income tax returns for all open tax years and has concluded that as of December 31, 2009, no provisions for income tax would be required in the Fund's financial statements. The Fund's federal and state income and federal excise tax returns for the tax years for which the applicable statutes of limitations have not expired are subject to examination by the In ternal Revenue Service and state departments of revenue.
Note 2. Investment Advisory and Administration Fees and Other Transactions with Affiliates
Investment Advisory Fees: The advisor serves as the Fund's investment advisor pursuant to an investment advisory agreement (the advisory agreement). Under the terms of the advisory agreement, the advisor provides the Fund with the day-to-day investment decisions and generally manages the Fund's investments in accordance with the stated policies of the Fund, subject to the supervision of the Fund's Board of Directors. For the services provided to the Fund, the advisor receives a fee, accrued daily and paid monthly, at the annual rate of 0.85% for the first $1.5 billion and 0.75% thereafter of the average daily net assets of the Fund.
18
COHEN & STEERS REALTY SHARES, INC.
NOTES TO FINANCIAL STATEMENTS—(Continued)
Administration Fees: The Fund has entered into an administration agreement with the advisor under which the advisor performs certain administrative functions for the Fund and receives a fee, accrued daily and paid monthly, at the annual rate of 0.02% of the Fund's average daily net assets. For the year ended December 31, 2009, the Fund paid the advisor $312,636 in fees under this administration agreement. Additionally, the Fund has retained State Street Bank and Trust Company as sub-administrator under a fund accounting and administration agreement.
Directors' and Officers' Fees: Certain directors and officers of the Fund are also directors, officers, and/or employees of the advisor. The Fund does not pay compensation to any affiliated directors and officers except for the Chief Compliance Officer, who received $31,388 from the Fund for the year ended December 31, 2009.
Note 3. Purchases and Sales of Securities
Purchases and sales of securities, excluding short-term investments, for the year ended December 31, 2009, totaled $2,170,541,863 and $1,822,798,636, respectively.
Note 4. Income Tax Information
The tax character of dividends and distributions paid was as follows:
| | | For the Year Ended
December 31, | |
| | | 2009 | | 2008 | |
| Ordinary income | | $ | 39,042,174 | | | $ | 46,900,374 | | |
| Tax return of capital | | | 22,345,501 | | | | 30,926,409 | | |
| Total dividends and distributions | | $ | 61,387,675 | | | $ | 77,826,783 | | |
As of December 31, 2009, the tax-basis components of accumulated earnings and the federal tax cost were as follows:
| Gross unrealized appreciation | | $ | 444,494,621 | | |
| Gross unrealized depreciation | | | (11,912,301 | ) | |
| Net unrealized appreciation | | $ | 432,582,320 | | |
| Cost for federal income tax purposes | | $ | 1,826,018,467 | | |
At December 31, 2009, the Fund had a net capital loss carryforward of $280,906,766 of which $261,982,621 will expire on December 31, 2016 and $18,924,145 will expire on December 31, 2017. These carryforwards may be used to offset future capital gains to the extent provided by regulations.
19
COHEN & STEERS REALTY SHARES, INC.
NOTES TO FINANCIAL STATEMENTS—(Continued)
As of December 31, 2009, the Fund had temporary book/tax differences primarily attributable to wash sales on portfolio securities and permanent book/tax differences primarily attributable to income redesignations. To reflect reclassifications arising from the permanent differences, paid-in capital was charged $1,524,845, accumulated net realized gain was credited $3 and accumulated net investment income was credited $1,524,842.
Note 5. Capital Stock
The Fund is authorized to issue 200 million shares of capital stock, at a par value of $0.001 per share. The Board of Directors of the Fund may increase or decrease the aggregate number of shares of common stock that the Fund has authority to issue. Transactions in Fund shares were as follows:
| | | For the
Year Ended
December 31, 2009 | | For the
Year Ended
December 31, 2008 | |
| | | Shares | | Amount | | Shares | | Amount | |
| Sold | | | 23,241,581 | | | $ | 825,160,337 | | | | 12,427,856 | | | $ | 650,183,964 | | |
Issued as reinvestment of dividends
and distributions | | | 1,631,762 | | | | 56,484,547 | | | | 1,461,207 | | | | 71,362,810 | | |
| Redeemed | | | (13,627,032 | ) | | | (484,431,526 | ) | | | (15,305,055 | ) | | | (745,004,459 | ) | |
| Redemption fees retained by Funda | | | — | | | | 351,164 | | | | — | | | | 319,455 | | |
| Net increase (decrease) | | | 11,246,311 | | | $ | 397,564,522 | | | | (1,415,992 | ) | | $ | (23,138,230 | ) | |
a The Fund may charge a 2% redemption fee on shares sold within 60 days of the time of purchase. Redemption fees are paid directly to the Fund.
Note 6. Borrowings
The Fund, in conjunction with other Cohen & Steers open-end funds, is a party to a $200,000,000 syndicated credit agreement (the credit agreement) with State Street Bank and Trust Company, as administrative agent and operations agent, and the lenders identified in the credit agreement, which expires January 29, 2010. (The credit agreement was subsequently renewed under similar terms and expires January 28, 2011). The Fund pays a commitment fee of 0.15% per annum on its proportionate share of the unused portion of the credit agreement.
During the year ended December 31, 2009, the Fund did not borrow under the credit agreement.
20
COHEN & STEERS REALTY SHARES, INC.
NOTES TO FINANCIAL STATEMENTS—(Continued)
Note 7. Other
In the normal course of business, the Fund enters into contracts that provide general indemnifications. The Fund's maximum exposure under these arrangements is dependent on claims that may be made against the Fund in the future and, therefore, cannot be estimated; however, based on experience, the risk of material loss from such claims is considered remote.
Note 8. Subsequent Events
Events and transactions occurring after December 31, 2009 and through the date that the financial statements were issued, February 16, 2010, have been evaluated in the preparation of the financial statements.
21
COHEN & STEERS REALTY SHARES, INC.
REPORT OF INDEPENDENT REGISTERED PUBLIC ACCOUNTING FIRM
To the Board of Directors and Shareholders of
Cohen & Steers Realty Shares, Inc.
In our opinion, the accompanying statement of assets and liabilities, including the schedule of investments, and the related statements of operations and of changes in net assets and the financial highlights present fairly, in all material respects, the financial position of Cohen & Steers Realty Shares, Inc. (the "Fund") at December 31, 2009, the results of its operations for the year then ended, the changes in its net assets for each of the two years in the period then ended and the financial highlights for each of the five years in the period then ended, in conformity with accounting principles generally accepted in the United States of America. These financial statements and financial highlights (hereafter referred to as "financial statements") are the responsibility of the Fund's management. Our responsibility is to express an opinion on these financial statements based on our audits. We conducted our audits of these financial state ments in accordance with the standards of the Public Company Accounting Oversight Board (United States). Those standards require that we plan and perform the audit to obtain reasonable assurance about whether the financial statements are free of material misstatement. An audit includes examining, on a test basis, evidence supporting the amounts and disclosures in the financial statements, assessing the accounting principles used and significant estimates made by management, and evaluating the overall financial statement presentation. We believe that our audits, which included confirmation of securities at December 31, 2009 by correspondence with the custodian and brokers, provide a reasonable basis for our opinion.
PricewaterhouseCoopers LLP
New York, New York
February 16, 2010
22
COHEN & STEERS REALTY SHARES, INC.
TAX INFORMATION—2009 (Unaudited)
Pursuant to the Jobs and Growth Relief Reconciliation Act of 2003, the Fund designates qualified dividend income of $1,263,749.
OTHER INFORMATION
A description of the policies and procedures that the Fund uses to determine how to vote proxies relating to portfolio securities is available (i) without charge, upon request, by calling 800-330-7348, (ii) on our Web site at cohenandsteers.com or (iii) on the Securities and Exchange Commission's Web site at http://www.sec.gov. In addition, the Fund's proxy voting record for the most recent 12-month period ended June 30 is available (i) without charge, upon request, by calling 800-330-7348 or (ii) on the SEC's Web site at http://www.sec.gov.
The Fund files its complete schedule of portfolio holdings with the SEC for the first and third quarters of each fiscal year on Form N-Q. The Fund's Forms N-Q are available (i) without charge, upon request by calling 800-330-7348, or (ii) on the SEC's Web site at http://www.sec.gov. In addition, the Forms N-Q may be reviewed and copied at the SEC's Public Reference Room in Washington, DC. Information on the operation of the Public Reference Room may be obtained by calling 800-SEC-0330.
Please note that the distributions paid by the Fund to shareholders are subject to recharacterization for tax purposes. The Fund may also pay distributions in excess of the Fund's net investment company taxable income and this excess would be a tax-free return of capital distributed from the Fund's assets. The final tax treatment of all distributions is reported to shareholders on their 1099-DIV forms, which are mailed after the close of each calendar year.
23
COHEN & STEERS REALTY SHARES, INC.
APPROVAL OF INVESTMENT ADVISORY AGREEMENT
The Board of Directors of the Fund, including a majority of the directors who are not parties to the Fund's investment advisory agreement (the "Advisory Agreement"), or interested persons of any such party ("Independent Directors"), has the responsibility under the 1940 Act to approve the Fund's Advisory Agreement for its initial two year term and its continuation annually thereafter at a meeting of the Board of Directors called for the purpose of voting on the approval or continuation. At a meeting held in person on September 22-23, 2009, the Advisory Agreement was discussed and was unanimously continued for a term ending June 30, 2010 by the Fund's Board of Directors, including the Independent Directors. It was further noted that the Board of Directors had considered the Fund's Advisory Agreement at its March 2009 meeting and reconsidered the Advisory Agreement in September 2009 in order to annually consider the renewal of such Agreement a t its June meeting. The Independent Directors were represented by independent counsel who assisted them in their deliberations during the meeting and executive session.
In considering whether to continue the Advisory Agreement, the Board of Directors reviewed materials provided by the Fund's investment advisor (the "Investment Advisor") and Fund counsel which included, among other things, fee, expense and performance information compared to peer funds ("Peer Funds") and performance comparisons to a larger category universe, prepared by an independent data provider; supplemental performance and summary information prepared by the Investment Advisor; and memoranda outlining the legal duties of the Board of Directors. The Board of Directors also spoke directly with representatives of the independent data provider and met with investment advisory personnel. In addition, the Board of Directors considered information provided from time to time by the Investment Advisor throughout the year at meetings of the Board of Directors, including presentations by portfolio managers relating to the investment performance of the Fund and the investment strategies used in pursuing the Fund's objective. In particular, the Board of Directors considered the following:
(i) The nature, extent and quality of services provided by the Investment Advisor: The Board of Directors reviewed the services that the Investment Advisor provides to the Fund, including, but not limited to, making the day-to-day investment decisions for the Fund, and generally managing the Fund's investments in accordance with the stated policies of the Fund. The Board of Directors also discussed with officers and portfolio managers of the Fund the types of transactions that were being done on behalf of the Fund. Additionally, the Board of Directors took into account the services provided by the Investment Advisor to its other funds, including those that invest substantially in real estate securities and have investment objectives and strategies similar to the Fund. The Board of Directors next considered the education, background and experience of the Investment Advisor's personnel, noting particularly that the favorable history and reputation of the portfolio managers for the Fund has had, and would likely continue to have, a favorable impact on the Fund. The Board of Directors further noted the Investment Advisor's ability to attract quality and experienced personnel. After consideration of the above factors, among others, the Board of Directors concluded that the nature, quality and extent of services provided by the Investment Advisor are adequate and appropriate.
24
COHEN & STEERS REALTY SHARES, INC.
(ii) Investment performance of the Fund and the Investment Advisor: The Board of Directors considered the investment performance of the Fund compared to Peer Funds and compared to a relevant benchmark. The Board of Directors considered that the Fund underperformed the median of the Peer Funds for the year-to-date period ended June 30, 2009, ranking in the third quintile, and outperformed the medians of the Peer Funds for the one-, three-, five- and ten-year periods, ranking in the first, second, second and third quintiles, respectively. The Board of Directors noted that the quintile rankings of the Fund remained unchanged for the one-, three-, five- and ten-year periods from the March 2009 report. The Board of Directors noted that the Fund had outperformed its benchmark for the year-to-date and one-, three-, five- and ten-year periods ended June 30, 2009. The Boar d of Directors engaged in discussions with the Investment Advisor regarding the contributors and detractors to the Fund's performance during the periods. The Board of Directors also considered supplemental performance data provided by the Advisor, including a narrative summary of various factors affecting performance, and the Investment Advisor's performance in managing other real estate funds. The Board of Directors then determined that Fund performance, in light of all the considerations noted above, was satisfactory.
(iii) Cost of the services provided and profits realized by the Investment Advisor from the relationship with the Fund: Next, the Board of Directors considered the advisory fees and administrative fees payable by the Fund as well as total expense ratios. The Board of Directors noted that the Fund's actual and contractual advisory fees were higher than the Peer Funds' medians, ranking the Fund in the fourth quintile. The Board of Directors further noted that the Fund's overall total expense ratio was lower than the Peer Funds' median, ranking the Fund in the second quintile. The Board of Directors noted that the Fund has a breakpoint of 10 basis points on assets over $1.5 billion; and as a result of asset size, the Fund is currently benefitting from the reduced fee. The Board of Directors further noted that the Fund charges an administration fee payable to the Inve stment Advisor. The Board of Directors then considered the administrative services provided by the Investment Advisor, including compliance and accounting services. In light of the considerations above, the Board of Directors concluded that the Fund's expense structure was satisfactory.
The Board of Directors also reviewed information regarding the profitability to the Investment Advisor of its relationship with the Fund. The Board of Directors considered the level of the Investment Advisor's profits and whether the profits were reasonable for the Investment Advisor. The Board of Directors took into consideration other benefits to be derived by the Investment Advisor in connection with the Advisory Agreement, noting particularly the research and related services, within the meaning of Section 28(e) of the Securities Exchange Act of 1934, as amended, that the Investment Advisor receives by allocating the Fund's brokerage transactions. The Board of Directors also considered the fees received by the Investment Advisor under the Administration Agreement, and noted the significant services received, such as operational services and furnishing office space and facilities for the Fund, and providing persons satisfactory to the Boa rd of Directors to serve as officers of the Fund, and that these services were beneficial to the Fund. The Board of Directors concluded that the profits realized by the Investment Advisor from its relationship with the Fund were reasonable and consistent with fiduciary duties.
25
COHEN & STEERS REALTY SHARES, INC.
(iv) The extent to which economies of scale would be realized as the Fund grows and whether fee levels would reflect such economies of scale: The Board of Directors noted that the Fund's advisory fee schedule contains a breakpoint of 10 basis points once the Fund's assets reached $1.5 billion. The Board of Directors considered the Fund's asset size and determined that there were not at this time significant economies of scale that were not being shared with shareholders.
(v) Comparison of services rendered and fees paid to those under other investment advisory contracts, such as contracts of the same and other investment advisers or other clients: As discussed above in (i) and (iii), the Board of Directors compared both the services rendered and the fees paid under the Advisory Agreement to those under other investment advisory contracts of other investment advisers managing Peer Funds. The Board of Directors also considered the services rendered, fees paid and profitability under the Advisory Agreement to the Investment Advisor's other fund advisory agreements, as well as the profitability under the Advisory Agreement to the Investment Advisor's other advisory contracts with institutional and other clients with similar investment mandates. The Board of Directors determined that on a comparative basis the fees under the Advisory A greement were reasonable in relation to the services provided.
No single factor was cited as determinative to the decision of the Board of Directors. Rather, after weighing all of the considerations and conclusions discussed above, the Board of Directors, including the Independent Directors, unanimously approved the continuation of the Advisory Agreement.
26
COHEN & STEERS REALTY SHARES, INC.
MANAGEMENT OF THE FUND
The business and affairs of the Fund are managed under the direction of the Board of Directors. The Board of Directors approves all significant agreements between the Fund and persons or companies furnishing services to it, including the Fund's agreements with its advisor, administrator, sub-administrator, custodian and transfer agent. The management of the Fund's day-to-day operations is delegated to its officers, the advisor, administrator and sub-administrator, subject always to the investment objective and policies of the Fund and to the general supervision of the Board of Directors.
The Board of Directors and officers of the Fund and their principal occupations during at least the past five years are set forth below. The statement of additional information (SAI) includes additional information about Fund directors and is available, without charge, upon request by calling 800-330-7348.
| Name, Address1 and Age | | Position(s) Held
with Fund | | Term of
Office2 | | Principal Occupation
During At Least
The Past 5 Years
(Including Other
Directorships Held) | | Number of
Funds Within
Fund
Complex
Overseen by
Director
(Including
the Fund) | | Length
of Time
Served3 | |
| Interested Directors4 | |
|
| Robert H. Steers Age: 56 | | Director and Co-Chairman | | Until next election of directors | | Co-Chairman and Co-Chief Executive Officer of Cohen & Steers Capital Management, Inc. (the Advisor) since 2003 and its parent, Cohen & Steers, Inc. (CNS) since 2004. Vice President of Cohen & Steers Securities, LLC, the Fund's Distributor. | | | 18 | | | 1991 to present | |
|
| Martin Cohen Age: 61 | | Director and Co-Chairman | | Until next election of directors | | Co-Chairman and Co-Chief Executive Officer of the Advisor since 2003 and CNS since 2004. Prior to that, President of the Advisor; Vice President of the Distributor. | | | 18 | | | 1991 to present | |
|
(table continued on next page)
27
COHEN & STEERS REALTY SHARES, INC.
(table continued from previous page)
| Name, Address1 and Age | | Position(s) Held
with Fund | | Term of
Office2 | | Principal Occupation
During At Least
The Past 5 Years
(Including Other
Directorships Held) | | Number of
Funds Within
Fund
Complex
Overseen by
Director
(Including
the Fund) | | Length
of Time
Served3 | |
| Disinterested Directors | |
|
| Bonnie Cohen5 Age: 67 | | Director | | Until next election of directors | | Consultant. Board Member United States Department of Defense Business Board; Vice-chair Global Heritage Fund; Chair of the Advisory Committee, The Posse Foundation, DC; Finance Chair, District of Columbia Public Libraries. Government service: former Undersecretary of State for Management, US Department of State; previously Assistant Secretary of Interior for Policy Management and Budget, US Department of Interior. Private employment includes Senior Vice President National Trust for Historic Preservation, Treasurer UMWA Health and Retirement Funds. | | | 18 | | | 2001 to present | |
|
| George Grossman Age: 56 | | Director | | Until next election of directors | | Attorney-at-law | | | 18 | | | 1993 to present | |
|
| Richard E. Kroon Age: 67 | | Director | | Until next election of directors | | Member of Investment Committee, Monmouth University. Retired Chairman and Managing Partner of Sprout Group venture capital funds, then an affiliate of Donaldson, Lufkin and Jenrette Securities Corporation; and former chairman of the National Venture Capital Association. | | | 18 | | | 2004 to present | |
|
(table continued on next page)
28
COHEN & STEERS REALTY SHARES, INC.
(table continued from previous page)
| Name, Address1 and Age | | Position(s) Held
with Fund | | Term of
Office2 | | Principal Occupation
During At Least
The Past 5 Years
(Including Other
Directorships Held) | | Number of
Funds Within
Fund
Complex
Overseen by
Director
(Including
the Fund) | | Length
of Time
Served3 | |
| Richard J. Norman Age: 66 | | Director | | Until next election of directors | | Private Investor. Advisory Board Member of the Salvation Army, Member: DC Dept. of Corrections Chaplain's Corps. Prior thereto, Investment Representative of Morgan Stanley Dean Witter. | | | 18 | | | 2001 to present | |
|
| Frank K. Ross Age: 66 | | Director | | Until next election of directors | | Professor of Accounting, Howard University. Board member of Pepco Holdings, Inc. (electric utility). Formerly, Midatlantic Area Managing Partner for Audit and Risk Advisory Services at KPMG LLP and Managing Partner of its Washington DC office. | | | 18 | | | 2004 to present | |
|
| Willard H. Smith Jr. Age: 73 | | Director | | Until next election of directors | | Board member of Essex Property Trust Inc. Managing Director at Merrill Lynch & Co., Equity Capital Markets Division from 1983 to 1995. | | | 18 | | | 1996 to present | |
|
| C. Edward Ward Jr. Age: 63 | | Director | | Until next election of directors | | Member of the Board of Trustees of Directors Manhattan College, Riverdale, New York. Formerly head of closed-end fund listings for the New York Stock Exchange. | | | 18 | | | 2004 to present | |
|
1 The address for each director is 280 Park Avenue, New York, NY 10017.
2 On March 12, 2008, the Board of Directors adopted a mandatory retirement policy stating a Director must retire from the Board on December 31st of the year in which he or she turns 75 years of age.
3 The length of time served represents the year in which the director was first elected or appointed to any fund in the Cohen & Steers fund complex.
4 "Interested person", as defined in the 1940 Act, of the fund because of affiliation with the advisor (Interested Directors).
5 Martin Cohen and Bonnie Cohen are not related.
29
COHEN & STEERS REALTY SHARES, INC.
The officers of the Fund (other than Messrs. Cohen and Steers, whose biographies are provided above), their address, their ages and their principal occupations for at least the past five years are set forth below.
| Name, Address and Age1 | | Position(s) Held
with Fund | | Principal Occupation During At Least The Past 5 Years | | Length
of Time
Served2 | |
| Adam M. Derechin Age: 45 | | President and Chief Executive Officer | | Chief Operating Officer of CSCM (since 2003) and CNS (since 2004). Prior to that, Senior Vice President of CSCM and Vice President and Assistant Treasurer of the Cohen & Steers funds. | | Since 2005 | |
|
| Joseph M. Harvey Age: 46 | | Vice President | | President and Chief Investment Officer of CSCM (since 2003) and President of CNS (since 2004). Prior to that, Senior Vice President and Director of Investment Research of CSCM. | | Since 2004 | |
|
| Jon Cheigh Age: 37 | | Vice President | | Senior Vice President of CSCM since 2005. Prior to that, vice president and research analyst for Security Capital. | | Since 2007 | |
|
| Francis C. Poli Age: 47 | | Secretary | | Executive Vice President, Secretary and General Counsel of CSCM and CNS since March 2007. Prior thereto, General Counsel of Allianz Global Investors of America LP. | | Since 2007 | |
|
| James Giallanza Age: 43 | | Treasurer and Chief Financial Officer | | Senior Vice President of CSCM since September 2006. Prior thereto, Deputy Head of the US Funds Administration and Treasurer & CFO of various mutual funds within the Legg Mason (formally Citigroup Asset Management) fund complex from August 2004 to September 2006; Director/Controller of the US wholesale business at UBS Global Asset Management (U.S.) from September 2001 to July 2004. | | Since 2006 | |
|
| Lisa D. Phelan Age: 41 | | Chief Compliance Officer | | Senior Vice President and Director of Compliance of CSCM since 2007 and prior to that, Vice President since 2006. Chief Compliance Officer of CSSL since 2004. Prior to that, Compliance Officer of CSCM since 2004. Chief Compliance Officer, Avatar Associates & Overture Asset Managers, 2003-2004. | | Since 2006 | |
|
1 The address of each officer is 280 Park Avenue, New York, NY 10017.
2 Officers serve one-year terms. The length of time served represents the year in which the officer was first elected to that position in any fund in the Cohen & Steers fund complex. All of the officers listed above are officers of one or more of the other funds in the complex.
30
COHEN & STEERS REALTY SHARES, INC.
Meet the Cohen & Steers family of open-end funds:
COHEN & STEERS
GLOBAL REALTY SHARES
• Designed for investors seeking total return, investing primarily in global real estate equity securities
• Symbols: CSFAX, CSFBX, CSFCX, CSSPX
COHEN & STEERS
INSTITUTIONAL GLOBAL REALTY SHARES
• Designed for institutional investors seeking total return, investing primarily in global real estate securities
• Symbol: GRSIX
COHEN & STEERS
REALTY SHARES
• Designed for investors seeking total return, investing primarily in REITs
• Symbol: CSRSX
COHEN & STEERS
INSTITUTIONAL REALTY SHARES
• Designed for institutional investors seeking total return, investing primarily in REITs
• Symbol: CSRIX
COHEN & STEERS
REALTY INCOME FUND
• Designed for investors seeking maximum total return, investing primarily in real estate securities with an emphasis on both income and capital appreciation
• Symbols: CSEIX, CSBIX, CSCIX, CSDIX
COHEN & STEERS
INTERNATIONAL REALTY FUND
• Designed for investors seeking total return, investing primarily in international real estate securities
• Symbols: IRFAX, IRFCX, IRFIX
COHEN & STEERS
ASIA PACIFIC REALTY SHARES
• Designed for investors seeking total return, investing primarily in real estate securities located in the Asia Pacific region
• Symbols: APFAX, APFCX, APFIX
COHEN & STEERS
GLOBAL INFRASTRUCTURE FUND
• Designed for investors seeking total return, investing primarily in global infrastructure securities
• Symbols: CSUAX, CSUBX, CSUCX, CSUIX
COHEN & STEERS
DIVIDEND VALUE FUND
• Designed for investors seeking high current income and long-term growth of income and capital appreciation, investing primarily in dividend paying common stocks and preferred stocks
• Symbols: DVFAX, DVFCX, DVFIX
Please consider the investment objectives, risks, charges and expenses of the fund carefully before investing. A prospectus containing this and other information can be obtained by calling 800-330-7348 or by visiting cohenandsteers.com. Please read the prospectus carefully before investing.
Cohen & Steers Securities, LLC, Distributor
31
COHEN & STEERS REALTY SHARES, INC.
OFFICERS AND DIRECTORS
Robert H. Steers
Director and co-chairman
Martin Cohen
Director and co-chairman
Bonnie Cohen
Director
George Grossman
Director
Richard E. Kroon
Director
Richard J. Norman
Director
Frank K. Ross
Director
Willard H. Smith Jr.
Director
C. Edward Ward, Jr.
Director
Adam M. Derechin
President and chief executive officer
Joseph M. Harvey
Vice president
Jon Cheigh
Vice president
Francis C. Poli
Secretary
James Giallanza
Treasurer and chief financial officer
Lisa D. Phelan
Chief compliance officer
KEY INFORMATION
Investment Advisor
Cohen & Steers Capital Management, Inc.
280 Park Avenue
New York, NY 10017
(212) 832-3232
Fund Subadministrator and Custodian
State Street Bank and Trust Company
One Lincoln Street
Boston, MA 02111
Transfer Agent
Boston Financial Data Services, Inc.
30 Dan Road
Canton, MA 02021
(800) 437-9912
Legal Counsel
Stroock & Stroock & Lavan LLP
180 Maiden Lane
New York, NY 10038
Distributor
Cohen & Steers Securities, LLC
280 Park Avenue
New York, NY 10017
Nasdaq Symbol: CSRSX
Web site: cohenandsteers.com
This report is authorized for delivery only to shareholders of Cohen & Steers Realty Shares, Inc. unless accompanied or preceded by the delivery of a currently effective prospectus setting forth details of the Fund. Past performance is of course no guarantee of future results and your investment may be worth more or less at the time you sell.
32

eDelivery NOW AVAILABLE
Stop traditional mail delivery; receive your shareholder reports and prospectus online.
Sign up at cohenandsteers.com
COHEN & STEERS
REALTY SHARES
280 PARK AVENUE
NEW YORK, NY 10017
ANNUAL REPORT
DECEMBER 31, 2009
CSRSXAR
Item 2. Code of Ethics.
On October 1, 2009, the registrant has adopted an Amended and Restated Code of Ethics that applies to its Principal Executive Officer and Principal Financial Officer. The material changes to the Code of Ethics that apply to the registrant’s principal executive officer, principal financial officer, principal accounting officer or controller, or persons performing similar functions were (i) a shortened preclearance window, (ii) the implementation of a 30-day holding period to sell securities at a profit, (iii) limitations on the frequency of trading, and (iv) a preclearance requirement for exchange traded funds. The registrant undertakes to provide to any person without charge, upon request, a copy of the Code of Ethics. Such request can be made by calling 800-330-7348 or writing to the Secretary of the registrant, 280 Park Avenue, New York, NY 10017.
Item 3. Audit Committee Financial Expert.
The registrant’s board has determined that Frank K. Ross, a member of the board’s audit committee, is an “audit committee financial expert”. Mr. Ross is “independent,” as such term is defined in Form N-CSR.
Item 4. Principal Accountant Fees and Services.
(a) – (d) Aggregate fees billed to the registrant for the last two fiscal years for professional services rendered by the registrant’s principal accountant were as follows:
| | 2009 | | 2008 | |
Audit Fees | | $ | 48,000 | | $ | 48,000 | |
Audit-Related Fees | | 0 | | 0 | |
Tax Fees | | 6,000 | | 19,635 | |
All Other Fees | | — | | — | |
| | | | | | | |
Audit-related fees were billed in connection with agreed upon procedures performed by the registrant’s principal accountant relating to after-tax return calculations. Tax fees were billed in connection with the preparation of tax returns, calculation and designation of dividends and other miscellaneous tax services.
Aggregate fees billed by the registrant’s principal accountant for the last two fiscal years for non-audit services provided to the registrant’s investment advisor (not including any sub-advisor whose role is primarily portfolio management and is subcontracted or overseen by another investment advisor) and any entity controlling, controlled by, or under common control with the investment advisor that provides ongoing services to the registered investment company, where the engagement relates directly to the operations and financial reporting of the registrant, were as follows:
| | 2009 | | 2008 | |
Audit-Related Fees | | — | | — | |
Tax Fees | | — | | — | |
All Other Fees | | — | | $ | 110,000 | |
| | | | | | |
These other fees were billed in connection with internal control reviews.
(e)(1) The audit committee is required to pre-approve audit and non-audit services performed for the registrant by the principal accountant. The audit committee also is required to pre-approve non-audit services performed by the registrant’s principal accountant for the registrant’s investment advisor and any sub-advisor (not including any sub-advisor whose role is primarily portfolio management and is subcontracted with or overseen by another investment advisor) and/or to any entity controlling, controlled by or under common control with the registrant’s investment advisor that provides ongoing services to the registrant, if the engagement for services relates directly to the operations and financial reporting of the registrant.
The audit committee may delegate pre-approval authority to one or more of its members who are independent members of the board of directors of the registrant. The member or members to whom such authority is delegated shall report any pre-approval decisions to the audit committee at its next scheduled meeting. The audit committee may not delegate its responsibility to pre-approve services to be performed by the registrant’s principal accountant to the investment advisor.
(e) (2) No services included in (b) – (d) above were approved by the audit committee pursuant to paragraphs (c)(7)(i)(C) of Rule 2-01 of Regulation S-X.
(f) Not applicable.
(g) For the fiscal years ended December 31, 2009 and December 31, 2008, the aggregate fees billed by the registrant’s principal accountant for non-audit services rendered to the registrant and for non-audit services rendered to the registrant’s investment advisor (not including any sub-advisor whose role is primarily portfolio management and is subcontracted with or overseen by another investment advisor) and/or to any entity controlling, controlled by or under common control with the registrant’s investment advisor that provides ongoing services to the registrant were $6,000 and $129,635, respectively.
(h) The registrant’s audit committee considered whether the provision of non-audit services that were rendered to the registrant’s investment advisor (not including any sub-advisor whose role is primarily portfolio management and is subcontracted with or overseen by another investment advisor) and/or to any entity controlling, controlled by or under common control with the registrant’s investment advisor that provides ongoing services to the registrant that were not required to be pre-approved pursuant to paragraph (c)(7)(ii) of Rule 2-01 of Regulation S-X was compatible with maintaining the principal accountant’s independence.
Item 5. Audit Committee of Listed Registrants.
Not applicable.
Item 6. Schedule of Investments.
Included in Item 1 above.
Item 7. Disclosure of Proxy Voting Policies and Procedures for Closed-End Management Investment Companies.
Not applicable.
Item 8. Portfolio Managers of Closed-End Investment Companies.
Not applicable.
Item 9. Purchases of Equity Securities by Closed-End Management Investment Company and Affiliated Purchasers.
Not applicable.
Item 10. Submission of Matters to a Vote of Security Holders.
Not applicable.
Item 11. Controls and Procedures.
(a) The registrant’s principal executive officer and principal financial officer have concluded that the registrant’s disclosure controls and procedures are reasonably designed to ensure that information required to be disclosed by the registrant in this Form N-CSR was recorded, processed, summarized and reported within the time periods specified in the Securities and Exchange Commission’s rules and forms, based upon such officers’ evaluation of these controls and procedures as of a date within 90 days of the filing date of this report.
(b) There were no changes in the registrant’s internal control over financial reporting that occurred during the second fiscal quarter of the period covered by this report that have materially affected, or are reasonably likely to materially affect, the registrant’s internal control over financial reporting.
Item 12. Exhibits.
(a)(1) Amended and Restated Code of Ethics.
(a) (2) Certifications of principal executive officer and principal financial officer as required by Rule 30a-2(a) under the Investment Company Act of 1940.
(b) Certifications of chief executive officer and chief financial officer as required by Rule 30a- 2(b) under the Investment Company Act of 1940.
SIGNATURES
Pursuant to the requirements of the Securities Exchange Act of 1934 and the Investment Company Act of 1940, the registrant has duly caused this report to be signed on its behalf by the undersigned, thereunto duly authorized.
COHEN & STEERS REALTY SHARES, INC. |
|
|
| By: | /s/ Adam M. Derechin | |
| | Name: Adam M. Derechin |
| | Title: President and Chief Executive Officer |
| | |
| Date: March 1, 2010 |
Pursuant to the requirements of the Securities Exchange Act of 1934 and the Investment Company Act of 1940, this report has been signed below by the following persons on behalf of the registrant and in the capacities and on the dates indicated.
| By: | /s/ Adam M. Derechin | |
| | Name: | Adam M. Derechin |
| | Title: | President and Chief Executive Officer |
| | | (principal executive officer) |
| | |
| By: | /s/ James Giallanza | |
| | Name: | James Giallanza |
| | Title: | Treasurer |
| | | (principal financial officer) |
| | | |
| Date: March 1, 2010 |
| | | | |