UNITED STATES
SECURITIES AND EXCHANGE COMMISSION
Washington, D.C. 20549
FORM N-CSR
CERTIFIED SHAREHOLDER REPORT OF REGISTERED
MANAGEMENT INVESTMENT COMPANIES
Investment Company Act file number | 811-06302 |
|
Cohen & Steers Realty Shares, Inc. |
(Exact name of registrant as specified in charter) |
|
280 Park Avenue, New York, NY | | 10017 |
(Address of principal executive offices) | | (Zip code) |
|
Tina M. Payne
Cohen & Steers Capital Management, Inc.
280 Park Avenue
New York, New York 10017 |
(Name and address of agent for service) |
|
Registrant’s telephone number, including area code: | (212) 832-3232 | |
|
Date of fiscal year end: | December 31 | |
|
Date of reporting period: | December 31, 2013 | |
| | | | | | | | |
Item 1. Reports to Stockholders.
COHEN & STEERS REALTY SHARES, INC.
To Our Shareholders:
We would like to share with you our report for the year ended December 31, 2013. The net asset value (NAV) at that date was $62.82 per share.
The total returns, including income and change in NAV, for the Fund and its comparative benchmarks were:
| | | Six Months Ended
December 31, 2013 | | Year Ended
December 31, 2013 | |
Cohen & Steers Realty Shares | | | –2.70 | % | | | 3.09 | % | |
FTSE NAREIT Equity REIT Indexa | | | –3.78 | % | | | 2.47 | % | |
S&P 500 Indexa | | | 16.31 | % | | | 32.39 | % | |
The performance data quoted represent past performance. Past performance is no guarantee of future results. The investment return and the principal value of an investment will fluctuate and shares, if redeemed, may be worth more or less than their original cost. Current performance may be lower or higher than the performance data quoted. Current total returns of the Fund can be obtained by visiting our website at cohenandsteers.com. The Fund's returns assume the reinvestment of all dividends and distributions at NAV. Index performance does not reflect the deduction of any fees, taxes or expenses. An investor cannot invest directly in an index. Performance figures for periods shorter than one year are not annualized.
Please note that distributions paid by the Fund to shareholders are subject to recharacterization for tax purposes and are taxable up to the amount of the Fund's investment company taxable income and net realized gains. Distributions in excess of the Fund's investment company taxable income and realized gains are a return of capital distributed from the Fund's assets.
Investment Review
In 2013, U.S. commercial real estate continued to see strengthening demand across all property sectors, driven by an improving labor market, a housing recovery, increased corporate spending and a stronger global economy. At the same time, new supply remained at a multi-decade low, giving many commercial landlords the leverage to raise rents as existing space was absorbed. As a result, REITs reported generally strong growth in cash flows and, as of the third quarter, had raised dividend payouts by an average of 9% from the prior year.
a The FTSE NAREIT Equity REIT Index is an unmanaged, market-capitalization-weighted index of all publicly traded REITs that invest predominantly in the equity ownership of real estate. The index is designed to reflect the performance of all publicly traded equity REITs as a whole. The Standard and Poor's 500 Composite Stock Index (S&P 500 Index) is an unmanaged index of 500 large capitalization, publicly traded stocks representing a variety of industries that is frequently used as a general measure of stock market performance.
1
COHEN & STEERS REALTY SHARES, INC.
Against this positive fundamental backdrop, REIT shares were negatively affected by a sharp rise in Treasury yields and concerns of higher interest rates in the near term. On May 22, 2013, the Federal Reserve said it could begin to taper its quantitative-easing (QE) program if economic data continued to show improvements in employment and broader economic growth. Investors responded by selling any asset they perceived as being sensitive to interest rates, including REITs. After rising 19.9% year-to-date through May 21, 2013, REITs fell 14.5% through the remainder of the year. And while they managed to produce a fifth straight year of positive total returns, their 2.5% gain versus 32.4% for the S&P 500 Index was the widest margin of underperformance in 15 years.
Among the headwinds facing REITs were concerns about the negative effects of rising Treasury yields on capital costs and property values. However, REIT bond yields were largely unchanged, and transactions in the private market indicated that real estate values were relatively stable, supported by continued cash flow growth and strong investment demand for the types of high-quality properties that REITs typically own. As a result of the divergence between public and private sentiment, most REITs ended the year trading for less than the combined value of their underlying properties.
Short-Lease Property Sectors Generally Outperformed
Returns diverged broadly across the REIT universe, depending largely on a company's ability to grow cash flows in a rising-rate environment. This generally favored short-lease property types such as hotel REITs (27.2% total returnb), which meaningfully outperformed all other sectors. Hotel companies are typically viewed as the least vulnerable to rising Treasury yields since they can raise room rates on a nightly basis, enabling them to quickly capture increasing economic activity. The sector also benefited from relatively modest revenue expectations coming out of 2012, which most companies easily exceeded as bookings accelerated.
The self storage sector (9.5%) experienced exceptionally strong cash flow growth, driven by accretive acquisitions and reduced promotional activity. Industrial REITs (7.4%) also did well, as a strengthening economy led to increased global trade, manufacturing and shipping volumes. In the shopping center sector (5.0%), expansion by anchor tenants such as Target helped offset headwinds from retailers under pressure from e-commerce. By contrast, investors viewed regional mall REITs (-1.0%) as more at risk to slowing retail sales, even punishing those with the best-quality properties, where tenant demand remained strong.
The apartment sector (-6.2%) underperformed for a second straight year. Apartments were the only property sector to see meaningful supply growth, which, together with the overhang of a recovery in the "for-sale" housing market, threatened to slow the pace of income growth. Health care REITs (-7.1%) also struggled, affected more than others by interest-rate concerns due to their relatively "bond-like" cash flows. Free standing REITs (7.3%) also have long-term lease structures, but outperformed amid consolidation within the sector, including the notable merger of American Realty Capital Properties and Cole Real Estate.
b Sector returns are measured by the FTSE NAREIT Equity REIT Index.
2
COHEN & STEERS REALTY SHARES, INC.
Fund Performance
The Fund had a positive total return in 2013 and outperformed its benchmark. Stock selection in the apartment sector was the largest contributor to relative performance, as we had underweight positions or did not invest in several securities that underperformed. We were also overweight BRE Properties, which received a takeover bid from Essex Property Trust in December. Stock selection was also a positive factor in the diversified sector (4.3% total return in the index), due largely to our overweight in Vornado. In the hotel sector, our stock selection and overweight contributed to relative performance, helped by out-of-index allocations to several non-REIT lodging corporations, which were relatively unaffected by interest-rate concerns. Among these were two notable IPOs from the fourth quarter—Hilton Worldwide and Extended Stay America—which performed well after their debuts.
Factors that detracted from relative performance included our underweights in both free standing REITs and the relatively small manufactured home sector (10.5%). Stock selection in the health care sector also detracted from returns, although this was more than offset by the benefit of our underweight. By contrast, the positive effect from our overweight in shopping center REITs only partially compensated for the negative impact of stock selection.
Investment Outlook
Although it wasn't apparent in 2013, REITs have historically performed well in periods of rising Treasury yields. Rising yields are often accompanied by an improving economy, benefiting REITs, in our view, in the form of lower vacancies, higher rents and stronger investment demand for real estate. While there may be periods of volatility as QE tapering commences, we expect REITs' performance profile to improve in 2014, as strengthening real estate fundamentals should outweigh further headwinds from rising Treasury yields. Furthermore, if the public market continues to price REIT properties below what they are worth to private investors, we believe more REITs could look for strategic alternatives to realize the value of their assets, potentially providing a backstop to REIT valuations.
The Federal Reserve's decision to begin tapering QE in January 2014 gives us greater confidence that the economy is strong and sustainable. Our economic view is modestly more positive than the consensus, as we expect job growth and recent gains in household wealth (due to strong stock-market returns and rising home values) to drive increased consumer spending. According to our estimates, this additional spending, plus a stronger global economy, should contribute to the creation of 2.7 million new jobs in 2014, accelerating from 2.2 million in 2013.
While we expect all property sectors to benefit from rising employment, our focus is on those we believe are the most attractively valued in the context of rising employment and consumer spending. In particular, we favor owners of high-quality retail assets, many of which trade at compelling valuations and continue to see healthy demand from national and regional retailers. We also see attractive value in offices located in urban markets benefiting from job growth in technology, media and life sciences. In the apartment sector, we expect household formation to accelerate as new jobs are added to the economy, releasing pent up demand for all forms of housing. By contrast, we have become more cautious toward industrial REITs, as we believe the market has underestimated the potential for increased supply. We remain cautious toward companies that own health care facilities and suburban offices.
3
COHEN & STEERS REALTY SHARES, INC.
Sincerely,
| | | | | 
| | 
| |
| | | | | MARTIN COHEN | | ROBERT H. STEERS | |
| | | | | Co-chairman | | Co-chairman | |
| | | | | 
| | 
| |
| | | | | JOSEPH M. HARVEY | | THOMAS N. BOHJALIAN | |
| | | | | Portfolio Manager | | Portfolio Manager | |
| | | | | 
| | 
| |
| | | | | JON CHEIGH | | JASON A. YABLON | |
| | | | | Portfolio Manager | | Portfolio Manager | |
The views and opinions in the preceding commentary are subject to change without notice and are as of the date of publication. There is no guarantee that any market forecast set forth in the commentary will be realized. This material represents an assessment of the market environment at a specific point in time, should not be relied upon as investment advice and is not intended to predict or depict performance of any investment.
Visit Cohen & Steers online at cohenandsteers.com
For more information about any of our funds, visit cohenandsteers.com, where you will find net asset values, fund fact sheets and portfolio highlights. You can also access newsletters, education tools and market updates covering real assets including real estate, listed infrastructure, MLPs and commodities, as well as large cap value and preferred securities.
In addition, our website contains comprehensive information about our firm, including our most recent press releases, profiles of our senior investment professionals and an overview of our investment approach.
4
COHEN & STEERS REALTY SHARES, INC.
Performance Review (Unaudited)
Growth of $10,000 Investment
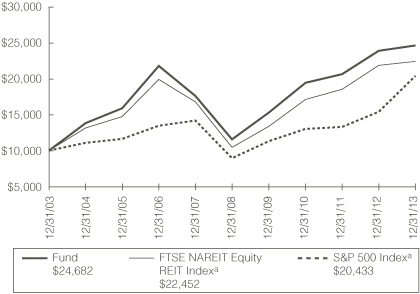
Average Annual Total Returns—For Periods Ended December 31, 2013
| | | 1 Year | | 5 Years | | 10 Years | | Since Inceptionb | |
Fund | | | 3.09 | % | | | 16.37 | % | | | 9.45 | % | | | 11.81 | % | |
The performance data quoted represent past performance. Past performance is no guarantee of future results. The investment return and principal value of an investment will fluctuate and shares, if redeemed, may be worth more or less than their original cost. Current performance may be lower or higher than the performance data quoted. Performance information current to the most recent month end can be obtained by visiting our website at cohenandsteers.com. Total return assumes the reinvestment of all dividends and distributions at NAV. The performance graph and table do not reflect the deduction of taxes that a shareholder would pay on Fund distributions or the redemption of Fund shares.
The annualized expense ratio as disclosed in the prospectus dated May 1, 2013, as amended June 24, 2013, was 1.00%.
a The comparative indexes are not adjusted to reflect expenses or other fees that the SEC requires to be reflected in the Fund's performance. Index performance does not reflect the deduction of any fees, taxes or expenses. An investor cannot invest directly in an index. The Fund's performance assumes the reinvestment of all dividends and distributions at NAV. For more information, including charges and expenses, please read the prospectus carefully before you invest.
b Inception date of July 2, 1991.
5
COHEN & STEERS REALTY SHARES, INC.
Expense Example (Unaudited)
As a shareholder of the Fund, you incur two types of costs: (1) transaction costs and (2) ongoing costs including investment advisory fees and other Fund expenses. This example is intended to help you understand your ongoing costs (in dollars) of investing in the Fund and to compare these costs with the ongoing costs of investing in other mutual funds.
The example is based on an investment of $1,000 invested at the beginning of the period and held for the entire period July 1, 2013—December 31, 2013.
Actual Expenses
The first line of the following table provides information about actual account values and expenses. You may use the information in this line, together with the amount you invested, to estimate the expenses that you paid over the period. Simply divide your account value by $1,000 (for example, an $8,600 account value divided by $1,000 = 8.6), then multiply the result by the number in the first line under the heading entitled "Expenses Paid During Period" to estimate the expenses you paid on your account during this period.
Hypothetical Example for Comparison Purposes
The second line of the following table provides information about hypothetical account values and hypothetical expenses based on the Fund's actual expense ratio and an assumed rate of return of 5% per year before expenses, which is not the Fund's actual return. The hypothetical account values and expenses may not be used to estimate the actual ending account balance or expenses you paid for the period. You may use this information to compare the ongoing cost of investing in the Fund and other funds. To do so, compare this 5% hypothetical example with the 5% hypothetical examples that appear in the shareholder reports of other funds.
Please note that the expenses shown in the table are meant to highlight your ongoing costs only and do not reflect any transaction costs. Therefore, the second line of the table is useful in comparing ongoing costs only, and will not help you determine the relative total costs of owning different funds. In addition, if these transactional costs were included, your costs would have been higher.
| | | Beginning
Account Value
July 1, 2013 | | Ending
Account Value
December 31, 2013 | | Expenses Paid
During Perioda
July 1, 2013–
December 31, 2013 | |
Actual (–2.70% return) | | $ | 1,000.00 | | | $ | 973.00 | | | $ | 4.82 | | |
Hypothetical (5% annual return
before expenses) | | $ | 1,000.00 | | | $ | 1,020.32 | | | $ | 4.94 | | |
a Expenses are equal to the Fund's annualized expense ratio of 0.97% multiplied by the average account value over the period, multiplied by 184/365 (to reflect the one-half year period).
6
COHEN & STEERS REALTY SHARES, INC.
December 31, 2013
Top Ten Holdings
(Unaudited)
Security | | Value | | % of
Net
Assets | |
Simon Property Group | | $ | 580,686,991 | | | | 11.3 | | |
Vornado Realty Trust | | | 279,737,157 | | | | 5.5 | | |
Equity Residential | | | 271,997,929 | | | | 5.3 | | |
Prologis | | | 265,995,439 | | | | 5.2 | | |
Ventas | | | 231,056,121 | | | | 4.5 | | |
SL Green Realty Corp. | | | 215,093,250 | | | | 4.2 | | |
Boston Properties | | | 191,460,392 | | | | 3.7 | | |
UDR | | | 186,565,939 | | | | 3.6 | | |
Public Storage | | | 182,471,332 | | | | 3.6 | | |
General Growth Properties | | | 135,741,659 | | | | 2.7 | | |
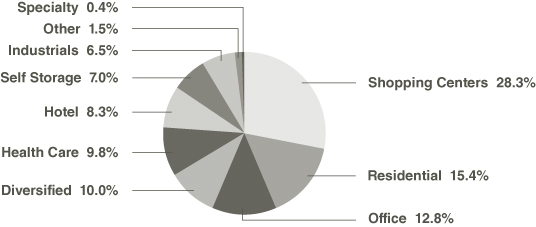
Sector Breakdown
(Based on Net Assets)
(Unaudited)
7
COHEN & STEERS REALTY SHARES, INC.
SCHEDULE OF INVESTMENTS
December 31, 2013
| | | | | Number
of Shares | | Value | |
COMMON STOCK | | 98.7% | | | | | | | | | |
FINANCIAL—BANKS | | 0.2% | | | | | | | |
Bond Street Holdings, Class A, 144Aa,b,c,d | | | | | 662,947 | | | $ | 11,429,206 | | |
REAL ESTATE | | 98.5% | | | | | | | | | |
DIVERSIFIED | | 10.0% | | | | | | | | | |
American Assets Trust | | | | | 1,636,237 | | | | 51,426,929 | | |
Cousins Properties | | | | | 5,036,215 | | | | 51,873,015 | | |
Duke Realty Corp. | | | | | 2,557,957 | | | | 38,471,673 | | |
Forest City Enterprises, Class Ad | | | | | 2,765,343 | | | | 52,818,051 | | |
Vornado Realty Trust | | | | | 3,150,548 | | | | 279,737,157 | | |
WP Carey | | | | | 628,852 | | | | 38,580,070 | | |
| | | | | | | | 512,906,895 | | |
HEALTH CARE | | 9.8% | | | | | | | | | |
HCP | | | | | 2,116,206 | | | | 76,860,602 | | |
Health Care REIT | | | | | 1,868,862 | | | | 100,114,938 | | |
Healthcare Trust of America, Class A | | | | | 4,936,761 | | | | 48,577,728 | | |
Omega Healthcare Investors | | | | | 1,421,126 | | | | 42,349,555 | | |
Ventas | | | | | 4,033,801 | | | | 231,056,121 | | |
| | | | | | | | 498,958,944 | | |
HOTEL | | 8.3% | | | | | | | | | |
DiamondRock Hospitality Co. | | | | | 4,724,059 | | | | 54,562,881 | | |
Hersha Hospitality Trust | | | | | 4,699,759 | | | | 26,177,658 | | |
Hilton Worldwide Holdingsd | | | | | 1,282,776 | | | | 28,541,766 | | |
Host Hotels & Resorts | | | | | 6,369,649 | | | | 123,825,976 | | |
Hyatt Hotels Corp., Class Ad | | | | | 593,363 | | | | 29,347,734 | | |
Orient-Express Hotels Ltd., Class A (Bermuda)d | | | | | 3,366,400 | | | | 50,866,304 | | |
Strategic Hotels & Resortsd | | | | | 7,041,816 | | | | 66,545,161 | | |
Sunstone Hotel Investors | | | | | 3,218,199 | | | | 43,123,867 | | |
| | | | | | | | 422,991,347 | | |
INDUSTRIALS | | 6.5% | | | | | | | | | |
First Industrial Realty Trust | | | | | 2,265,089 | | | | 39,525,803 | | |
Prologis | | | | | 7,198,794 | | | | 265,995,439 | | |
QTS Realty Trust, Class A | | | | | 1,111,026 | | | | 27,531,224 | | |
| | | | | | | | 333,052,466 | | |
See accompanying notes to financial statements.
8
COHEN & STEERS REALTY SHARES, INC.
SCHEDULE OF INVESTMENTS—(Continued)
December 31, 2013
| | | | | Number
of Shares | | Value | |
OFFICE | | 12.8% | | | | | | | | | |
Boston Properties | | | | | 1,907,546 | | | $ | 191,460,392 | | |
Corporate Office Properties Trust | | | | | 2,611,883 | | | | 61,875,508 | | |
Douglas Emmett | | | | | 3,263,011 | | | | 75,995,526 | | |
Empire State Realty Trust, Class A | | | | | 2,832,484 | | | | 43,337,005 | | |
Hudson Pacific Properties | | | | | 1,882,566 | | | | 41,171,719 | | |
PS Business Parks | | | | | 331,471 | | | | 25,331,014 | | |
SL Green Realty Corp. | | | | | 2,328,353 | | | | 215,093,250 | | |
| | | | | | | | 654,264,414 | | |
RESIDENTIAL | | 15.4% | | | | | | | | | |
APARTMENT | | 14.8% | | | | | | | | | |
Apartment Investment & Management Co. | | | | | 3,471,522 | | | | 89,947,135 | | |
| BRE Properties | | | | | 1,136,632 | | | | 62,185,137 | | |
Equity Residential | | | | | 5,243,839 | | | | 271,997,929 | | |
Essex Property Trust | | | | | 355,966 | | | | 51,084,681 | | |
Home Properties | | | | | 1,769,436 | | | | 94,877,158 | | |
UDR | | | | | 7,989,976 | | | | 186,565,939 | | |
| | | | | | | | 756,657,979 | | |
MANUFACTURED HOME | | 0.6% | | | | | | | | | |
Toll Brothersd | | | | | 779,878 | | | | 28,855,486 | | |
TOTAL RESIDENTIAL | | | | | | | 785,513,465 | | |
SELF STORAGE | | 7.0% | | | | | | | | | |
CubeSmart | | | | | 4,549,436 | | | | 72,518,010 | | |
Extra Space Storage | | | | | 1,392,684 | | | | 58,673,777 | | |
Public Storage | | | | | 1,212,273 | | | | 182,471,332 | | |
Sovran Self Storage | | | | | 695,036 | | | | 45,295,496 | | |
| | | | | | | | 358,958,615 | | |
See accompanying notes to financial statements.
9
COHEN & STEERS REALTY SHARES, INC.
SCHEDULE OF INVESTMENTS—(Continued)
December 31, 2013
| | | | | Number
of Shares | | Value | |
SHOPPING CENTERS | | 28.3% | | | | | | | | | |
COMMUNITY CENTER | | 9.8% | | | | | | | | | |
DDR Corp. | | | | | 5,887,640 | | | $ | 90,493,027 | | |
Federal Realty Investment Trust | | | | | 998,161 | | | | 101,223,507 | | |
Ramco-Gershenson Properties Trust | | | | | 2,407,269 | | | | 37,890,414 | | |
Regency Centers Corp. | | | | | 2,342,591 | | | | 108,461,963 | | |
Retail Properties of America, Class A | | | | | 2,276,023 | | | | 28,951,012 | | |
Tanger Factory Outlet Centers | | | | | 1,541,833 | | | | 49,369,493 | | |
Weingarten Realty Investors | | | | | 3,038,428 | | | | 83,313,696 | | |
| | | | | | | | 499,703,112 | | |
FREE STANDING | | 2.0% | | | | | | | | | |
National Retail Properties | | | | | 1,791,807 | | | | 54,345,506 | | |
Spirit Realty Capital | | | | | 5,004,780 | | | | 49,196,988 | | |
| | | | | | | | 103,542,494 | | |
REGIONAL MALL | | 16.5% | | | | | | | | | |
General Growth Properties | | | | | 6,763,411 | | | | 135,741,659 | | |
Glimcher Realty Trust | | | | | 6,026,078 | | | | 56,404,090 | | |
Simon Property Group | | | | | 3,816,292 | | | | 580,686,991 | | |
Taubman Centers | | | | | 1,140,087 | | | | 72,874,361 | | |
| | | | | | | | 845,707,101 | | |
TOTAL SHOPPING CENTERS | | | | | | | 1,448,952,707 | | |
See accompanying notes to financial statements.
10
COHEN & STEERS REALTY SHARES, INC.
SCHEDULE OF INVESTMENTS—(Continued)
December 31, 2013
| | | | | Number
of Shares | | Value | |
SPECIALTY | | | 0.4% | | | | | | | | | | |
Digital Realty Trust | | | | | 440,112 | | | $ | 21,618,301 | | |
TOTAL REAL ESTATE | | | | | | | 5,037,217,154 | | |
TOTAL INVESTMENTS (Identified cost—$4,076,967,732) | | | 98.7 | % | | | | | | | 5,048,646,360 | | |
OTHER ASSETS IN EXCESS OF LIABILITIES | | | 1.3 | | | | | | | | 68,717,783 | | |
NET ASSETS (Equivalent to $62.82 per share based
on 81,455,077 shares of common stock outstanding) | | | 100.0 | % | | | | | | $ | 5,117,364,143 | | |
Glossary of Portfolio Abbreviations
REIT Real Estate Investment Trust
Note: Percentages indicated are based on the net assets of the Fund.
a Fair valued security. This security has been valued at its fair value as determined in good faith under procedures established by and under the general supervision of the Fund's Board of Directors. Aggregate fair valued securities represent 0.2% of the net assets of the Fund.
b Illiquid security. Aggregate holdings equal 0.2% of the net assets of the Fund.
c Resale is restricted to qualified institutional investors. Aggregate holdings equal 0.2% of the net assets of the Fund, all of which are illiquid.
d Non-income producing security.
See accompanying notes to financial statements.
11
COHEN & STEERS REALTY SHARES, INC.
STATEMENT OF ASSETS AND LIABILITIES
December 31, 2013
ASSETS: | |
Investments in securities, at value (Identified cost — $4,076,967,732) | | $ | 5,048,646,360 | | |
Cash | | | 59,390,406 | | |
Receivable for: | |
Dividends | | | 21,081,722 | | |
Fund shares sold | | | 13,126,555 | | |
Investment securities sold | | | 763,546 | | |
Other assets | | | 61,146 | | |
Total Assets | | | 5,143,069,735 | | |
LIABILITIES: | |
Payable for: | |
Fund shares redeemed | | | 20,614,918 | | |
Investment advisory fees | | | 3,380,264 | | |
Shareholder servicing fees | | | 625,526 | | |
Administration fees | | | 86,743 | | |
Directors' fees | | | 18,035 | | |
Other liabilities | | | 980,106 | | |
Total Liabilities | | | 25,705,592 | | |
NET ASSETS applicable to 81,455,077 shares of $0.001 par value of common stock
outstanding | | $ | 5,117,364,143 | | |
NET ASSET VALUE PER SHARE: | |
($5,117,364,143 ÷ 81,455,077 shares outstanding) | | $ | 62.82 | | |
NET ASSETS consist of: | |
Paid-in capital | | $ | 4,202,701,980 | | |
| Accumulated undistributed net investment income | | | 6,432,285 | | |
Accumulated net realized loss | | | (63,448,750 | ) | |
| Net unrealized appreciation | | | 971,678,628 | | |
| | | $ | 5,117,364,143 | | |
See accompanying notes to financial statements.
12
COHEN & STEERS REALTY SHARES, INC.
STATEMENT OF OPERATIONS
For the Year Ended December 31, 2013
Investment Income: | |
Dividend income | | $ | 126,509,862 | | |
Expenses: | |
Investment advisory fees | | | 41,550,134 | | |
Shareholder servicing fees | | | 4,837,686 | | |
Transfer agent fees and expenses | | | 1,827,095 | | |
Administration fees | | | 1,757,042 | | |
Reports to shareholders | | | 587,669 | | |
Custodian fees and expenses | | | 345,106 | | |
Directors' fees and expenses | | | 316,456 | | |
Registration and filing fees | | | 285,466 | | |
Professional fees | | | 103,185 | | |
Line of credit fees | | | 81,581 | | |
Miscellaneous | | | 211,704 | | |
Total Expenses | | | 51,903,124 | | |
| Net Investment Income | | | 74,606,738 | | |
Net Realized and Unrealized Gain (Loss): | |
| Net realized gain on investments | | | 294,137,551 | | |
Net change in unrealized appreciation (depreciation) on investments | | | (226,493,273 | ) | |
| Net realized and unrealized gain | | | 67,644,278 | | |
Net Increase in Net Assets Resulting from Operations | | $ | 142,251,016 | | |
See accompanying notes to financial statements.
13
COHEN & STEERS REALTY SHARES, INC.
STATEMENT OF CHANGES IN NET ASSETS
| | | For the
Year Ended
December 31, 2013 | | For the
Year Ended
December 31, 2012 | |
Change in Net Assets: | |
From Operations: | |
Net investment income | | $ | 74,606,738 | | | $ | 54,492,852 | | |
| Net realized gain | | | 294,137,551 | | | | 375,194,282 | | |
Net change in unrealized appreciation
(depreciation) | | | (226,493,273 | ) | | | 198,980,062 | | |
Net increase in net assets resulting
from operations | | | 142,251,016 | | | | 628,667,196 | | |
Dividends and Distributions to Shareholders from: | |
Net investment income | | | (75,531,904 | ) | | | (51,418,747 | ) | |
Net realized gain | | | (217,070,683 | ) | | | (349,256,556 | ) | |
Total dividends and distributions
to shareholders | | | (292,602,587 | ) | | | (400,675,303 | ) | |
Capital Stock Transactions: | |
Increase in net assets from Fund share
transactions | | | 388,921,995 | | | | 816,905,288 | | |
Total increase in net assets | | | 238,570,424 | | | | 1,044,897,181 | | |
Net Assets: | |
Beginning of year | | | 4,878,793,719 | | | | 3,833,896,538 | | |
End of yeara | | $ | 5,117,364,143 | | | $ | 4,878,793,719 | | |
a Includes accumulated undistributed net investment income of $6,432,285 and $10,169,428, respectively.
See accompanying notes to financial statements.
14
COHEN & STEERS REALTY SHARES, INC.
FINANCIAL HIGHLIGHTS
The following table includes selected data for a share outstanding throughout each year and other performance information derived from the financial statements. It should be read in conjunction with the financial statements and notes thereto.
| | | For the Year Ended December 31, | |
Per Share Operating Performance: | | 2013 | | 2012 | | 2011 | | 2010 | | 2009 | |
Net asset value, beginning of year | | $ | 64.57 | | | $ | 60.83 | | | $ | 58.46 | | | $ | 47.06 | | | $ | 37.01 | | |
Income (loss) from investment operations: | |
| Net investment income | | | 0.95 | a | | | 0.74 | | | | 0.63 | b | | | 1.22 | | | | 0.89 | | |
| Net realized and unrealized gain | | | 1.01 | | | | 8.65 | | | | 2.93 | | | | 11.39 | | | | 10.55 | | |
Total from investment operations | | | 1.96 | | | | 9.39 | | | | 3.56 | | | | 12.61 | | | | 11.44 | | |
Less dividends and distributions to
shareholders from: | |
Net investment income | | | (0.96 | ) | | | (0.73 | ) | | | (0.58 | ) | | | (1.22 | ) | | | (0.89 | ) | |
Net realized gain | | | (2.75 | ) | | | (4.92 | ) | | | (0.61 | ) | | | — | | | | — | | |
Tax return of capital | | | — | | | | — | | | | — | | | | — | | | | (0.51 | ) | |
Total dividends and distributions to
shareholders | | | (3.71 | ) | | | (5.65 | ) | | | (1.19 | ) | | | (1.22 | ) | | | (1.40 | ) | |
Redemption fees retained by the Fund | | | — | | | | — | | | | 0.00 | c | | | 0.01 | | | | 0.01 | | |
Net increase (decrease) in net asset value | | | (1.75 | ) | | | 3.74 | | | | 2.37 | | | | 11.40 | | | | 10.05 | | |
Net asset value, end of year | | $ | 62.82 | | | $ | 64.57 | | | $ | 60.83 | | | $ | 58.46 | | | $ | 47.06 | | |
Total investment returnd | | | 3.09 | % | | | 15.72 | % | | | 6.18 | % | | | 27.14 | % | | | 32.50 | % | |
Ratios/Supplemental Data: | |
Net assets, end of year (in millions) | | $ | 5,117.4 | | | $ | 4,878.8 | | | $ | 3,833.9 | | | $ | 3,165.1 | | | $ | 2,299.4 | | |
Ratio of expenses to average daily net assets | | | 0.97 | % | | | 0.98 | % | | | 0.96 | % | | | 0.99 | % | | | 1.06 | % | |
Ratio of net investment income to average daily
net assets | | | 1.40 | % | | | 1.19 | % | | | 0.98 | % | | | 1.10 | % | | | 2.45 | % | |
Portfolio turnover rate | | | 73 | % | | | 85 | % | | | 90 | % | | | 106 | % | | | 119 | % | |
a Calculation based on average shares outstanding.
b 17.0% of gross income was attributable to dividends paid by Simon Property Group.
c Amount is less than $0.005.
d Return assumes the reinvestment of all dividends and distributions at NAV.
See accompanying notes to financial statements.
15
COHEN & STEERS REALTY SHARES, INC.
NOTES TO FINANCIAL STATEMENTS
Note 1. Organization and Significant Accounting Policies
Cohen & Steers Realty Shares, Inc. (the Fund) was incorporated under the laws of the State of Maryland on April 26, 1991 and is registered under the Investment Company Act of 1940, as amended (the 1940 Act), as a non-diversified, open-end management investment company. The Fund's investment objective is total return.
The following is a summary of significant accounting policies consistently followed by the Fund in the preparation of its financial statements. The policies are in conformity with accounting principles generally accepted in the United States of America (GAAP). The preparation of the financial statements in accordance with GAAP requires management to make estimates and assumptions that affect the reported amounts of assets and liabilities at the date of the financial statements and the reported amounts of income and expenses during the reporting period. Actual results could differ from those estimates.
Portfolio Valuation: Investments in securities that are listed on the New York Stock Exchange (NYSE) are valued, except as indicated below, at the last sale price reflected at the close of the NYSE on the business day as of which such value is being determined. If there has been no sale on such day, the securities are valued at the mean of the closing bid and ask prices on such day or, if no ask price is available, at the bid price.
Securities not listed on the NYSE but listed on other domestic or foreign securities exchanges are valued in a similar manner. Securities traded on more than one securities exchange are valued at the last sale price reflected at the close of the exchange representing the principal market for such securities on the business day as of which such value is being determined. If after the close of a foreign market, but prior to the close of business on the day the securities are being valued, market conditions change significantly, certain non-U.S. equity holdings may be fair valued pursuant to procedures established by the Board of Directors.
Readily marketable securities traded in the over-the-counter market, including listed securities whose primary market is believed by Cohen & Steers Capital Management, Inc. (the advisor) to be over-the-counter, are valued at the last sale price on the valuation date as reported by sources deemed appropriate by the Board of Directors to reflect their fair market value. If there has been no sale on such day, the securities are valued at the mean of the closing bid and ask prices on such day or, if no ask price is available, at the bid price.
Short-term debt securities with a maturity date of 60 days or less are valued at amortized cost, which approximates fair value.
The policies and procedures approved by the Fund's Board of Directors delegate authority to make fair value determinations to the advisor, subject to the oversight of the Board of Directors. The advisor has established a valuation committee (Valuation Committee) to administer, implement and oversee the fair valuation process according to the policies and procedures approved annually by the Board of Directors. Among other things, these procedures allow the Fund to utilize independent pricing services, quotations from securities and financial instrument dealers and other market sources to determine fair value.
16
COHEN & STEERS REALTY SHARES, INC.
NOTES TO FINANCIAL STATEMENTS—(Continued)
Securities for which market prices are unavailable, or securities for which the advisor determines that the bid and/or ask price or a counterparty valuation does not reflect market value, will be valued at fair value, as determined in good faith by the Valuation Committee, pursuant to procedures approved by the Fund's Board of Directors. Circumstances in which market prices may be unavailable include, but are not limited to, when trading in a security is suspended, the exchange on which the security is traded is subject to an unscheduled close or disruption or material events occur after the close of the exchange on which the security is principally traded. In these circumstances, the Fund determines fair value in a manner that fairly reflects the market value of the security on the valuation date based on consideration of any information or factors it deems appropriate. These may include, but are not limited to, recent transactions in comparable securities, information relating to the specific security and developments in the markets.
The Fund's use of fair value pricing may cause the net asset value of Fund shares to differ from the net asset value that would be calculated using market quotations. Fair value pricing involves subjective judgments and it is possible that the fair value determined for a security may be materially different than the value that could be realized upon the sale of that security.
Fair value is defined as the price that the Fund would expect to receive upon the sale of an investment or expect to pay to transfer a liability in an orderly transaction with an independent buyer in the principal market or, in the absence of a principal market, the most advantageous market for the investment or liability. The hierarchy of inputs that are used in determining the fair value of the Fund's investments is summarized below.
• Level 1—quoted prices in active markets for identical investments
• Level 2—other significant observable inputs (including quoted prices for similar investments, interest rates, credit risk, etc.)
• Level 3—significant unobservable inputs (including the Fund's own assumptions in determining the fair value of investments)
The inputs or methodology used for valuing securities are not necessarily an indication of the risk associated with investing in those securities.
For movements between the levels within the fair value hierarchy, the Fund has adopted a policy of recognizing the transfer at the end of the period in which the underlying event causing the movement occurred. Changes in valuation techniques may result in transfers into or out of an assigned level within the disclosure hierarchy. There were no transfers between Level 1 and Level 2 securities as of December 31, 2013.
17
COHEN & STEERS REALTY SHARES, INC.
NOTES TO FINANCIAL STATEMENTS—(Continued)
The following is a summary of the inputs used as of December 31, 2013 in valuing the Fund's investments carried at value:
| | | Total | | Quoted Prices
In Active
Markets for
Identical
Investments
(Level 1) | | Other
Significant
Observable
Inputs
(Level 2) | | Significant
Unobservable
Inputs
(Level 3) | |
Common Stock—
Financial—Banks | | $ | 11,429,206 | | | $ | — | | | $ | — | | | $ | 11,429,206 | a | |
Common Stock—
Other Industries | | | 5,037,217,154 | | | | 5,037,217,154 | | | | — | | | | — | | |
Total Investmentsb | | $ | 5,048,646,360 | | | $ | 5,037,217,154 | | | $ | — | | | $ | 11,429,206 | | |
a Fair valued, pursuant to the Fund's fair value procedures, utilizing significant unobservable inputs and assumptions.
b Portfolio holdings are disclosed individually on the Schedule of Investments.
Following is a reconciliation of investments for which significant unobservable inputs (Level 3) were used in determining fair value:
| | | Investments
in Securities | |
Balance as of December 31, 2012 | | $ | 13,583,784 | | |
Change in unrealized appreciation (depreciation) | | | (2,154,578 | ) | |
Balance as of December 31, 2013 | | $ | 11,429,206 | | |
The change in unrealized appreciation (depreciation) attributable to securities owned on December 31, 2013 which were valued using significant unobservable inputs (Level 3) amounted to $(2,154,578).
The following table summarizes the quantitative inputs and assumptions used for investments categorized in Level 3 of the fair value hierarchy.
| | | Fair Value at
December 31, 2013 | | Valuation
Technique | | Unobservable
Inputs | | Range | |
Common Stock—
Financial—Banks | | $ | 11,429,206 | | | Market Comparable
Companies | | Price/Book Ratio
Liquidity Discount | | | 1.19
33% | x – 2.10x | |
The significant unobservable inputs utilized in the fair value measurement of the Fund's Level 3 equity investment in Common Stock—Financial—Banks are the price-to-book ratio and discount for
18
COHEN & STEERS REALTY SHARES, INC.
NOTES TO FINANCIAL STATEMENTS—(Continued)
lack of liquidity. Significant changes in these inputs may result in a materially higher or lower fair value measurement.
Cash: As of December 31, 2013, the balance of cash was held at the Fund's custodian in a non-interest bearing demand deposit account.
Security Transactions and Investment Income: Security transactions are recorded on trade date. Realized gains and losses on investments sold are recorded on the basis of identified cost. Interest income is recorded on the accrual basis. Discounts are accreted and premiums are amortized over the life of the respective securities. Dividend income is recorded on the ex-dividend date. Distributions from Real Estate Investment Trusts (REITs) are recorded as ordinary income, net realized capital gain or return of capital based on information reported by the REITs and management's estimates of such amounts based on historical information. These estimates are adjusted when the actual source of distributions is disclosed by the REITs and actual amounts may differ from the estimated amounts.
Dividends and Distributions to Shareholders: Dividends from net investment income and capital gain distributions are determined in accordance with U.S. federal income tax regulations, which may differ from GAAP. Dividends from net investment income, if any, are declared and paid quarterly. Net realized capital gains, unless offset by any available capital loss carryforward, are typically distributed to shareholders at least annually. Dividends and distributions to shareholders are recorded on the ex-dividend date and are automatically reinvested in full and fractional shares of the Fund based on the net asset value per share at the close of business on the payable date, unless the shareholder has elected to have them paid in cash. Distributions paid by the Fund are subject to recharacterization for tax purposes. Based upon the results of operations for the year ended December 31, 2013, a portion of the dividends have been reclassified to distributions from net realized capital gains.
Income Taxes: It is the policy of the Fund to continue to qualify as a regulated investment company, if such qualification is in the best interest of the shareholders, by complying with the requirements of Subchapter M of the Internal Revenue Code applicable to regulated investment companies, and by distributing substantially all of its taxable earnings to its shareholders. Accordingly, no provision for federal income or excise tax is necessary. Dividend and interest income from holdings in non-U.S. securities is recorded net of non-U.S. taxes paid. Management has analyzed the Fund's tax positions taken on federal income tax returns as well as its tax positions in non-U.S. jurisdictions in which it trades for all open tax years and has concluded that as of December 31, 2013, no additional provisions for income tax are required in the Fund's financial statements. The Fund's tax positions for the tax years for which the applicable statutes of limitations have not expired are subject to examination by the Internal Revenue Service, state departments of revenue and by foreign tax authorities.
Note 2. Investment Advisory, Administration Fees and Other Transactions with Affiliates
Investment Advisory Fees: The advisor serves as the Fund's investment advisor pursuant to an investment advisory agreement (the investment advisory agreement). Under the terms of the investment advisory agreement, the advisor provides the Fund with day-to-day investment decisions and generally
19
COHEN & STEERS REALTY SHARES, INC.
NOTES TO FINANCIAL STATEMENTS—(Continued)
manages the Fund's investments in accordance with the stated policies of the Fund, subject to the supervision of the Board of Directors.
For the services provided to the Fund, the advisor receives a fee, accrued daily and paid monthly, at the annual rate of 0.85% of the average daily net assets of the Fund up to and including $1.5 billion and 0.75% of the average daily net assets above $1.5 billion.
Administration Fees: The Fund has entered into an administration agreement with the advisor under which the advisor performs certain administrative functions for the Fund and receives a fee, accrued daily and paid monthly, at the annual rate of 0.02% of the average daily net assets of the Fund. For the year ended December 31, 2013, the Fund incurred $1,068,004 in fees under this administration agreement. Additionally, the Fund pays State Street Bank and Trust Company as co-administrator under a fund accounting and administration agreement.
Shareholder Servicing Fees: For shareholder services, the Fund pays the distributor or its affiliates a fee, accrued daily and paid monthly, at an annual rate of up to 0.10% of the average daily net assets of the Fund's shares. The distributor is responsible for paying qualified financial institutions for shareholder services.
Directors' and Officers' Fees: Certain directors and officers of the Fund are also directors, officers and/or employees of the advisor. The Fund does not pay compensation to directors and officers affiliated with the advisor except for the Chief Compliance Officer, who received compensation from the advisor, which was reimbursed by the Fund, in the amount of $64,877 for the year ended December 31, 2013.
Note 3. Purchases and Sales of Securities
Purchases and sales of securities, excluding short-term investments, for the year ended December 31, 2013, totaled $4,063,278,084 and $3,801,260,519, respectively.
Note 4. Income Tax Information
The tax character of dividends and distributions paid was as follows:
| | | For the Year Ended
December 31, | |
| | | 2013 | | 2012 | |
Ordinary income | | $ | 115,342,234 | | | $ | 200,300,323 | | |
| Long-term capital gain | | | 177,260,353 | | | | 200,374,980 | | |
Total dividends and distributions | | $ | 292,602,587 | | | $ | 400,675,303 | | |
20
COHEN & STEERS REALTY SHARES, INC.
NOTES TO FINANCIAL STATEMENTS—(Continued)
As of December 31, 2013, the tax-basis components of accumulated earnings and the federal tax cost were as follows:
Cost for federal income tax purposes | | $ | 4,177,139,442 | | |
Gross unrealized appreciation | | $ | 952,718,774 | | |
Gross unrealized depreciation | | | (81,211,856 | ) | |
Net unrealized appreciation | | $ | 871,506,918 | | |
Undistributed long-term capital gains | | $ | 36,722,960 | | |
As of December 31, 2013, the Fund had temporary book/tax differences primarily attributable to wash sales on portfolio securities and permanent book/tax differences primarily attributable to Fund redemptions used as distributions and prior year REIT distribution adjustments. To reflect reclassifications arising from the permanent differences, paid-in capital was credited $32,151,132, accumulated net realized loss was charged $29,339,155 and accumulated undistributed net investment income was charged $2,811,977. Net assets were not affected by this reclassification.
Note 5. Capital Stock
The Fund is authorized to issue 200 million shares of capital stock, at a par value of $0.001 per share. The Board of Directors of the Fund may increase or decrease the aggregate number of shares of common stock that the Fund has authority to issue. Transactions in Fund shares were as follows:
| | | For the
Year Ended
December 31, 2013 | | For the
Year Ended
December 31, 2012 | |
| | | Shares | | Amount | | Shares | | Amount | |
Sold | | | 22,770,402 | | | $ | 1,544,599,071 | | | | 24,041,507 | | | $ | 1,597,741,965 | | |
Issued as reinvestment
of dividends and
distributions | | | 4,187,735 | | | | 264,336,003 | | | | 5,770,732 | | | | 366,749,494 | | |
Redeemed | | | (21,055,829 | ) | | | (1,420,013,079 | ) | | | (17,285,543 | ) | | | (1,147,586,171 | ) | |
Net Increase | | | 5,902,308 | | | $ | 388,921,995 | | | | 12,526,696 | | | $ | 816,905,288 | | |
21
COHEN & STEERS REALTY SHARES, INC.
NOTES TO FINANCIAL STATEMENTS—(Continued)
Note 6. Borrowings
The Fund, in conjunction with other Cohen & Steers open-end funds, is a party to a $200,000,000 syndicated credit agreement (the credit agreement) with State Street Bank and Trust Company, as administrative agent and operations agent, and the lenders identified in the credit agreement, which expires January 24, 2014. The Fund pays a commitment fee of 0.10% per annum on its proportionate share of the unused portion of the credit agreement. Effective January 24, 2014, the credit agreement was renewed under similar terms and expires January 23, 2015.
During the year ended December 31, 2013, the Fund did not borrow under the credit agreement.
Note 7. Other
In the normal course of business, the Fund enters into contracts that provide general indemnifications. The Fund's maximum exposure under these arrangements is dependent on claims that may be made against the Fund in the future and, therefore, cannot be estimated; however, based on experience, the risk of material loss from such claims is considered remote.
Note 8. Subsequent Events
Management has evaluated events and transactions occurring after December 31, 2013 through the date that the financial statements were issued, and has determined that no additional disclosure in the financial statements is required.
22
COHEN & STEERS REALTY SHARES, INC.
REPORT OF INDEPENDENT REGISTERED PUBLIC ACCOUNTING FIRM
To the Board of Directors and Shareholders of
Cohen & Steers Realty Shares, Inc.
In our opinion, the accompanying statement of assets and liabilities, including the schedule of investments, and the related statements of operations and of changes in net assets and the financial highlights present fairly, in all material respects, the financial position of Cohen & Steers Realty Shares, Inc. (the "Fund") at December 31, 2013, the results of its operations for the year then ended, the changes in its net assets for each of the two years in the period then ended and the financial highlights for each of the five years in the period then ended, in conformity with accounting principles generally accepted in the United States of America. These financial statements and financial highlights (hereafter referred to as "financial statements") are the responsibility of the Fund's management. Our responsibility is to express an opinion on these financial statements based on our audits. We conducted our audits of these financial statements in accordance with the standards of the Public Company Accounting Oversight Board (United States). Those standards require that we plan and perform the audit to obtain reasonable assurance about whether the financial statements are free of material misstatement. An audit includes examining, on a test basis, evidence supporting the amounts and disclosures in the financial statements, assessing the accounting principles used and significant estimates made by management, and evaluating the overall financial statement presentation. We believe that our audits, which included confirmation of securities at December 31, 2013 by correspondence with the custodian, provide a reasonable basis for our opinion.
PricewaterhouseCoopers LLP
New York, New York
February 18, 2014
23
COHEN & STEERS REALTY SHARES, INC.
TAX INFORMATION—2013 (Unaudited)
Pursuant to the Jobs and Growth Relief Reconciliation Act of 2003, the Fund designates qualified dividend income of $3,052,534. Also, the Fund designates a long-term capital gain distribution of $193,356,914 at the 20% maximum rate and $10,977,591 at the 25% maximum rate.
OTHER INFORMATION
A description of the policies and procedures that the Fund uses to determine how to vote proxies relating to portfolio securities is available (i) without charge, upon request, by calling 800-330-7348, (ii) on our website at cohenandsteers.com or (iii) on the Securities and Exchange Commission's (the SEC) website at http://www.sec.gov. In addition, the Fund's proxy voting record for the most recent 12-month period ended June 30 is available by August 31 of each year (i) without charge, upon request, by calling 800-330-7348 or (ii) on the SEC's website at http://www.sec.gov.
The Fund files its complete schedule of portfolio holdings with the SEC for the first and third quarters of each fiscal year on Form N-Q. The Fund's Forms N-Q are available (i) without charge, upon request, by calling 800-330-7348 or (ii) on the SEC's website at http://www.sec.gov. In addition, the Forms N-Q may be reviewed and copied at the SEC's Public Reference Room in Washington, DC. Information on the operation of the Public Reference Room may be obtained by calling 800-SEC-0330.
Please note that distributions paid by the Fund to shareholders are subject to recharacterization for tax purposes. The Fund may also pay distributions in excess of the Fund's net investment company taxable income and this excess could be a tax free return of capital distributed from the Fund's assets. The final tax treatment of all distributions is reported to shareholders on their 1099-DIV forms, which are mailed after the close of each calendar year.
24
COHEN & STEERS REALTY SHARES, INC.
MANAGEMENT OF THE FUND
The business and affairs of the Fund are managed under the direction of the Board of Directors. The Board of Directors approves all significant agreements between the Fund and persons or companies furnishing services to it, including the Fund's agreements with its advisor, administrator, co-administrator, custodian and transfer agent. The management of the Fund's day-to-day operations is delegated to its officers, the advisor, administrator and co-administrator, subject always to the investment objective and policies of the Fund and to the general supervision of the Board of Directors.
The Board of Directors and officers of the Fund and their principal occupations during at least the past five years are set forth below. The statement of additional information (SAI) includes additional information about fund directors and is available, without charge, upon request by calling 800-330-7348.
Name, Address1 and Age | | Position(s) Held
With Fund | | Term of
Office2 | | Principal Occupation
During At Least
The Past 5 Years
(Including Other
Directorships Held) | | Number of
Funds Within
Fund
Complex
Overseen by
Director
(Including
the Fund) | | Length
of Time
Served3 | |
Interested Directors4 | |
Robert H. Steers5
Age: 60 | | Director and Co-Chairman | | Until next election of directors | | Co-Chairman and Co-Chief Executive Officer of Cohen & Steers Capital Management, Inc. (CSCM or the Advisor) since 2003 and its parent, Cohen & Steers, Inc. (CNS) since 2004. Prior to that, Chairman of the Advisor; Vice President of Cohen & Steers Securities, LLC. | | | 22 | | | 1991 to present | |
Martin Cohen5,6
Age: 65 | | Director and Co-Chairman | | Until next election of directors | | Co-Chairman and Co-Chief Executive Officer of the Advisor since 2003 and CNS since 2004. Prior to that, President of the Advisor; Vice President of Cohen & Steers Securities, LLC. | | | 22 | | | 1991 to present | |
Disinterested Directors | |
Michael G. Clark
Age: 48 | | Director | | Until next election of directors | | From May 2006 to June 2011, President and Chief Executive Officer of DWS Funds and Managing Director of Deutsche Asset Management. | | | 22 | | | 2011 to present | |
(table continued on next page)
25
COHEN & STEERS REALTY SHARES, INC.
(table continued from previous page)
Name, Address1 and Age | | Position(s) Held
With Fund | | Term of
Office2 | | Principal Occupation
During At Least
The Past 5 Years
(Including Other
Directorships Held) | | Number of
Funds Within
Fund
Complex
Overseen by
Director
(Including
the Fund) | | Length
of Time
Served3 | |
Bonnie Cohen6
Age: 71 | | Director | | Until next election of directors | | Consultant. Board Member DC Public Library Foundation since 2012, President since 2014; Board Member, United States Department of Defense Business Board, 2010-2014; Board Member, Teluride Mountain Film Festival since 2010; Advisory Board Member, Posse Foundation, 2004-2013; Trustee, H. Rubenstein Foundation since 1996; Trustee, District of Columbia Public Libraries since 2004. | | | 22 | | | 2001 to present | |
George Grossman
Age: 60 | | Director | | Until next election of directors | | Attorney-at-law | | | 22 | | | 1993 to present | |
Richard E. Kroon
Age: 71 | | Director | | Until next election of directors | | Member of Investment Committee, Monmouth University since 2004; Former Director, Retired Chairman and Managing Partner of Sprout Group venture capital funds, then an affiliate of Donaldson, Lufkin and Jenrette Securities Corporation from 1981 to 2001. Former chairman of the National Venture Capital Association for the year 2000. | | | 22 | | | 2004 to present | |
(table continued on next page)
26
COHEN & STEERS REALTY SHARES, INC.
(table continued from previous page)
Name, Address1 and Age | | Position(s) Held
With Fund | | Term of
Office2 | | Principal Occupation
During At Least
The Past 5 Years
(Including Other
Directorships Held) | | Number of
Funds Within
Fund
Complex
Overseen by
Director
(Including
the Fund) | | Length
of Time
Served3 | |
Richard J. Norman
Age: 70 | | Director | | Until next election of directors | | Private Investor. Member, District of Columbia Department of Corrections Chaplains Corps from 2008 to February 2010; Member, Montgomery County, Maryland Department of Corrections Volunteer Corps since February 2010; Liason for Business Leadership, Salvation Army World Service Organization (SAWSO) since 2010; Advisory Board Member, The Salvation Army since 1985; Financial Education Fund Chair, The Foundation Board of Maryland Public Television since 2009; Former President, Executive Committee, Chair of Investment Committee, The Foundation Board of Maryland Public Television from 1997 to 2008. Prior thereto, Investment Representative of Morgan Stanley Dean Witter from 1966 to 2000. | | | 22 | | | 2001 to present | |
Frank K. Ross
Age: 70 | | Director | | Until next election of directors | | Visiting Professor of Accounting, Howard University School of Business since 2004; Board member and Audit Committee Chair and Human Resources and Compensation Committee Member, Pepco Holdings, Inc. (electric utility) since 2004. Formerly, Midatlantic Area Managing Partner for Assurance Services at KPMG LLP and Managing Partner of its Washington, DC offices from 1977 to 2003. | | | 22 | | | 2004 to present | |
(table continued on next page)
27
COHEN & STEERS REALTY SHARES, INC.
(table continued from previous page)
Name, Address1 and Age | | Position(s) Held
With Fund | | Term of
Office2 | | Principal Occupation
During At Least
The Past 5 Years
(Including Other
Directorships Held) | | Number of
Funds Within
Fund
Complex
Overseen by
Director
(Including
the Fund) | | Length
of Time
Served3 | |
C. Edward Ward Jr.
Age: 67 | | Director | | Until next election of directors | | Member of The Board of Trustees of Manhattan College, Riverdale, New York since 2004. Formerly Director of closed-end fund management for the New York Stock Exchange, where he worked from 1979 to 2004. | | | 22 | | | 2004 to present | |
1 The address for each director is 280 Park Avenue, New York, NY 10017.
2 On March 12, 2008, the Board of Directors adopted a mandatory retirement policy stating a Director must retire from the Board on December 31st of the year in which he or she turns 75 years of age.
3 The length of time served represents the year in which the director was first elected or appointed to any fund in the Cohen & Steers fund complex.
4 "Interested person", as defined in the 1940 Act, of the Fund because of affiliation with CSCM (Interested Directors).
5 Effective January 1, 2014, Martin Cohen, currently co-Chairman and co-CEO, became Executive Chairman of the Advisor. Robert Steers, currently co-Chairman and co-CEO, became the sole CEO responsible for day-to-day leadership and management of the Advisor.
6 Martin Cohen and Bonnie Cohen are not related.
28
COHEN & STEERS REALTY SHARES, INC.
The officers of the Fund (other than Messrs. Cohen and Steers, whose biographies are provided above), their address, their ages and their principal occupations for at least the past five years are set forth below.
| Name, Address and Age1 | | Position(s) Held
With Fund | | Principal Occupation During At Least the Past 5 Years | | Length
of Time
Served2 | |
Adam M. Derechin
Age: 49 | | President and Chief Executive Officer | | Chief Operating Officer of CSCM (since 2003) and CNS (since 2004). Prior to that, Senior Vice President of CSCM and Vice President and Assistant Treasurer of the Cohen & Steers funds. | | Since 2005 | |
Joseph M. Harvey
Age: 50 | | Vice President | | President and Chief Investment Officer of CSCM (since 2003) and President of CNS (since 2004). Prior to that, Senior Vice President and Director of Investment Research of CSCM. | | Since 2004 | |
Jon Cheigh
Age: 41 | | Vice President | | Executive Vice President of CSCM (since 2012). Prior to that, Senior Vice President of the Advisor. | | Since 2007 | |
Thomas N. Bohjalian
Age: 48 | | Vice President | | Executive Vice President of CSCM (since 2012). Prior to that, Senior Vice President of the CSCM. | | Since 2006 | |
Francis C. Poli
Age: 51 | | Secretary | | Executive Vice President, Secretary and General Counsel of CSCM and CNS since March 2007. Prior thereto, General Counsel of Allianz Global Investors of America LP. | | Since 2007 | |
James Giallanza
Age: 47 | | Treasurer and Chief Financial Officer | | Senior Vice President of CSCM since September 2006. | | Since 2006 | |
Lisa D. Phelan
Age: 45 | | Chief Compliance Officer | | Senior Vice President of CSCM since 2008, Chief Compliance Officer of CSCM, the Cohen & Steers funds, Cohen & Steers Asia Limited and CSSL since 2007, 2006, 2005 and 2004, respectively. Vice President of CSCM from 2006-2008. | | Since 2006 | |
(table continued on next page)
29
COHEN & STEERS REALTY SHARES, INC.
(table continued from previous page)
| Name, Address and Age1 | | Position(s) Held
With Fund | | Principal Occupation During At Least the Past 5 Years | | Length
of Time
Served2 | |
Tina M. Payne
Age: 39 | | Assistant Secretary | | Senior Vice President and Associate General Counsel of the Advisor since 2010 and prior to that Vice President and Associate General Counsel since July 2007. Prior thereto, Vice President and Counsel at PFPC Inc, (financial services company) from 2003 to 2007. Associate at Stradley, Ronon, Stevens & Young, LLP (law firm) from 2001 to 2003. | | Since 2007 | |
Neil Bloom
Age: 43 | | Assistant Treasurer | | Vice President of the Investment Manager since August 2008. Prior thereto, Senior Tax Manager at KPMG, LLP (accounting firm) since 2004. | | Since 2009 | |
1 The address of each officer is 280 Park Avenue, New York, NY 10017.
2 Officers serve one-year terms. The length of time served represents the year in which the officer was first elected to that position in any fund in the Cohen & Steers fund complex. All of the officers listed above are officers of one or more of the other funds in the complex.
30
COHEN & STEERS REALTY SHARES, INC.
Cohen & Steers Privacy Policy
Facts | | What Does Cohen & Steers Do With Your Personal Information? | |
Why? | | Financial companies choose how they share your personal information. Federal law gives consumers the right to limit some but not all sharing. Federal law also requires us to tell you how we collect, share, and protect your personal information. Please read this notice carefully to understand what we do. | |
What? | | The types of personal information we collect and share depend on the product or service you have with us. This information can include:
• Social Security number and account balances
• Transaction history and account transactions
• Purchase history and wire transfer instructions | |
How? | | All financial companies need to share customers' personal information to run their everyday business. In the section below, we list the reasons financial companies can share their customers' personal information; the reasons Cohen & Steers chooses to share; and whether you can limit this sharing. | |
Reasons we can share your personal information | | Does Cohen & Steers
share? | | Can you limit this
sharing? | |
For our everyday business purposes—
such as to process your transactions, maintain your account(s), respond to court orders and legal investigations, or reports to credit bureaus | | Yes | | No | |
For our marketing purposes—
to offer our products and services to you | | Yes | | No | |
For joint marketing with other financial companies— | | No | | We don't share | |
For our affiliates' everyday business purposes—
information about your transactions and experiences | | No | | We don't share | |
For our affiliates' everyday business purposes—
information about your creditworthiness | | No | | We don't share | |
For our affiliates to market to you— | | No | | We don't share | |
For non-affiliates to market to you— | | No | | We don't share | |
Questions? Call 800-330-7348
31
COHEN & STEERS REALTY SHARES, INC.
Cohen & Steers Privacy Policy—(Continued)
Who we are | | | |
Who is providing this notice? | | Cohen & Steers Capital Management, Inc., Cohen & Steers Asia Limited, Cohen & Steers UK Limited, Cohen & Steers Securities, LLC, Cohen & Steers Private Funds and Cohen & Steers Open- and Closed-End Funds (collectively, Cohen & Steers). | |
What we do | | | |
How does Cohen & Steers protect my personal information? | | To protect your personal information from unauthorized access and use, we use security measures that comply with federal law. These measures include computer safeguards and secured files and buildings. We restrict access to your information to those employees who need it to perform their jobs, and also require companies that provide services on our behalf to protect your information. | |
How does Cohen & Steers collect my personal information? | | We collect your personal information, for example, when you:
• Open an account or buy securities from us
• Provide account information or give us your contact information
• Make deposits or withdrawals from your account
We also collect your personal information from other companies. | |
Why can't I limit all sharing? | | Federal law gives you the right to limit only:
• sharing for affiliates' everyday business purposes—information about your creditworthiness
• affiliates from using your information to market to you
• sharing for non-affiliates to market to you
State law and individual companies may give you additional rights to limit sharing. | |
Definitions | | | |
Affiliates | | Companies related by common ownership or control. They can be financial and nonfinancial companies.
• Cohen & Steers does not share with affiliates. | |
Non-affiliates | | Companies not related by common ownership or control. They can be financial and nonfinancial companies.
• Cohen & Steers does not share with non-affiliates. | |
Joint marketing | | A formal agreement between non-affiliated financial companies that together market financial products or services to you.
• Cohen & Steers does not jointly market. | |
32
COHEN & STEERS REALTY SHARES, INC.
Cohen & Steers Investment Solutions
COHEN & STEERS GLOBAL REALTY SHARES
• Designed for investors seeking total return, investing primarily in global real estate equity securities
• Symbols: CSFAX, CSFBX*, CSFCX, CSSPX
COHEN & STEERS INSTITUTIONAL REALTY SHARES
• Designed for institutional investors seeking total return, investing primarily in REITs
• Symbol: CSRIX
COHEN & STEERS REALTY INCOME FUND
• Designed for investors seeking total return, investing primarily in real estate securities with an emphasis on both income and capital appreciation
• Symbols: CSEIX, CSBIX*, CSCIX, CSDIX
COHEN & STEERS INTERNATIONAL REALTY FUND
• Designed for investors seeking total return, investing primarily in international real estate securities
• Symbols: IRFAX, IRFCX, IRFIX
COHEN & STEERS
EMERGING MARKETS REAL ESTATE FUND
• Designed for investors seeking total return, investing primarily in emerging market real estate securities
• Symbols: APFAX, APFCX, APFIX
COHEN & STEERS REALTY SHARES
• Designed for investors seeking total return, investing primarily in REITs
• Symbol: CSRSX
COHEN & STEERS
INSTITUTIONAL GLOBAL REALTY SHARES
• Designed for institutional investors seeking total return, investing primarily in global real estate securities
• Symbol: GRSIX
COHEN & STEERS GLOBAL INFRASTRUCTURE FUND
• Designed for investors seeking total return, investing primarily in global infrastructure securities
• Symbols: CSUAX, CSUBX*, CSUCX, CSUIX
COHEN & STEERS DIVIDEND VALUE FUND
• Designed for investors seeking long-term growth of income and capital appreciation, investing primarily in dividend paying common stocks and preferred stocks
• Symbols: DVFAX, DVFCX, DVFIX
COHEN & STEERS
PREFERRED SECURITIES AND INCOME FUND
• Designed for investors seeking total return (high current income and capital appreciation), investing primarily in preferred and debt securities
• Symbols: CPXAX, CPXCX, CPXIX
COHEN & STEERS REAL ASSETS FUND
• Designed for investors seeking total return and the maximization of real returns during inflationary environments by investing primarily in real assets
• Symbols: RAPAX, RAPCX, RAPIX, RAPRX, RAPZX
COHEN & STEERS
MLP & ENERGY OPPORTUNITY FUND
• Designed for investors seeking total return, investing primarily in midstream energy master limited partnership (MLP) units and related stocks
• Symbols: MLOAX, MLOCX, MLOIX, MLOZX
Distributed by Cohen & Steers Securities, LLC.
COHEN & STEERS GLOBAL REALTY MAJORS ETF
• Designed for investors who seek a relatively low-cost "passive" approach for investing in a portfolio of real estate equity securities of companies in a specified index
• Symbol: GRI
Distributed by ALPS Distributors, Inc.
ISHARES COHEN & STEERS
REALTY MAJORS INDEX FUND
• Designed for investors who seek a relatively low-cost "passive" approach for investing in a portfolio of real estate equity securities of companies in a specified index
• Symbol: ICF
Distributed by SEI Investments Distribution Co.
* Class B shares are no longer offered except through dividend reinvestment and permitted exchanges by existing Class B shareholders.
Please consider the investment objectives, risks, charges and expenses of the fund carefully before investing. A summary prospectus and prospectus containing this and other information can be obtained by calling 800-330-7348 or by visiting cohenandsteers.com. Please read the summary prospectus and prospectus carefully before investing.
33
COHEN & STEERS REALTY SHARES, INC.
OFFICERS AND DIRECTORS
Robert H. Steers
Director and Co-Chairman
Martin Cohen
Director and Co-Chairman
Michael G. Clark
Director
Bonnie Cohen
Director
George Grossman
Director
Richard E. Kroon
Director
Richard J. Norman
Director
Frank K. Ross
Director
C. Edward Ward, Jr.
Director
Adam M. Derechin
President and Chief Executive Officer
Joseph M. Harvey
Vice President
Thomas N. Bohjalian
Vice President
Jon Cheigh
Vice President
Francis C. Poli
Secretary
James Giallanza
Treasurer and Chief Financial Officer
Lisa D. Phelan
Chief Compliance Officer
Tina M. Payne
Assistant Secretary
Neil Bloom
Assistant Treasurer
KEY INFORMATION
Investment Advisor
Cohen & Steers Capital Management, Inc.
280 Park Avenue
New York, NY 10017
(212) 832-3232
Co-administrator and Custodian
State Street Bank and Trust Company
One Lincoln Street
Boston, MA 02111
Transfer Agent
Boston Financial Data Services, Inc.
30 Dan Road
Canton, MA 02021
(800) 437-9912
Legal Counsel
Ropes & Gray LLP
1211 Avenue of the Americas
New York, NY 10036
Distributor
Cohen & Steers Securities, LLC
280 Park Avenue
New York, NY 10017
Nasdaq Symbol: CSRSX
Website: cohenandsteers.com
This report is authorized for delivery only to shareholders of Cohen & Steers Realty Shares, Inc. unless accompanied or preceded by the delivery of a currently effective prospectus setting forth details of the Fund. Performance data quoted represent past performance. Past performance is no guarantee of future results and your investment may be worth more or less at the time you sell your shares.
34
COHEN & STEERS
REALTY SHARES
280 PARK AVENUE
NEW YORK, NY 10017
eDelivery NOW AVAILABLE
Stop traditional mail delivery; receive your shareholder reports and prospectus online.
Sign up at cohenandsteers.com

Annual Report December 31, 2013
Cohen & Steers Realty Shares
Item 2. Code of Ethics.
The Registrant has adopted an Amended and Restated Code of Ethics that applies to its Principal Executive Officer and Principal Financial Officer. The Code of Ethics was in effect during the reporting period. The Registrant has not amended the Code of Ethics as described in Form N-CSR during the reporting period. The Registrant has not granted any waiver, including an implicit waiver, from a provision of the Code of Ethics as described in Form N-CSR during the reporting period. A current copy of the Code of Ethics is available on the Registrant’s website at www.cohenandsteers.com/assets/content/uploads/code_of_ethics_exec_and_senior.pdf. Upon request, a copy of the Code of Ethics can be obtained free of charge by calling 800-330-7348 or writing to the Secretary of the Registrant, 280 Park Avenue, 10th floor, New York, NY 10017.
Item 3. Audit Committee Financial Expert.
The registrant’s board has determined that Michael G. Clark and Frank K. Ross, each a member of the board’s audit committee, are each an “audit committee financial expert”. Mr. Clark and Mr. Ross are each “independent,” as such term is defined in Form N-CSR.
Item 4. Principal Accountant Fees and Services.
(a) — (d) Aggregate fees billed to the registrant for the last two fiscal years for professional services rendered by the registrant’s principal accountant were as follows:
| | 2013 | | 2012 | |
Audit Fees | | $ | 49,400 | | $ | 49,400 | |
Audit-Related Fees | | $ | 0 | | $ | 0 | |
Tax Fees | | $ | 6,200 | | $ | 6,200 | |
All Other Fees | | $ | 0 | | $ | 0 | |
Tax fees were billed in connection with the preparation of tax returns, calculation and designation of dividends and other miscellaneous tax services.
(e)(1) The audit committee is required to pre-approve audit and non-audit services performed for the registrant by the principal accountant. The audit committee also is required to pre-approve non-audit services performed by the registrant’s principal accountant for the registrant’s investment advisor and any sub-advisor (not including any sub-advisor whose role is primarily portfolio management and is subcontracted with or overseen by another investment advisor) and/or to any entity controlling, controlled by or under common control with the registrant’s investment advisor that provides ongoing services to the registrant, if the engagement for services relates directly to the operations and financial reporting of the registrant.
The audit committee may delegate pre-approval authority to one or more of its members who are independent members of the board of directors of the registrant. The member or members to whom such authority is delegated shall report any pre-approval decisions to the audit committee at its next scheduled meeting. The audit committee may not delegate its responsibility to pre-
approve services to be performed by the registrant’s principal accountant to the investment advisor.
(e) (2) No services included in (b) — (d) above were approved by the audit committee pursuant to paragraphs (c)(7)(i)(C) of Rule 2-01 of Regulation S-X.
(f) Not applicable.
(g) For the fiscal years ended December 31, 2013 and December 31, 2012, the aggregate fees billed by the registrant’s principal accountant for non-audit services rendered to the registrant and for non-audit services rendered to the registrant’s investment advisor (not including any sub-advisor whose role is primarily portfolio management and is subcontracted with or overseen by another investment advisor) and/or to any entity controlling, controlled by or under common control with the registrant’s investment advisor that provides ongoing services to the registrant were:
| | 2013 | | 2012 | |
Registrant | | $ | 6,200 | | $ | 6,200 | |
Investment Advisor | | $ | 15,000 | | $ | 15,000 | |
(h) The registrant’s audit committee considered whether the provision of non-audit services that were rendered to the registrant’s investment advisor (not including any sub-advisor whose role is primarily portfolio management and is subcontracted with or overseen by another investment advisor) and/or to any entity controlling, controlled by or under common control with the registrant’s investment advisor that provides ongoing services to the registrant that were not required to be pre-approved pursuant to paragraph (c)(7)(ii) of Rule 2-01 of Regulation S-X was compatible with maintaining the principal accountant’s independence.
Item 5. Audit Committee of Listed Registrants.
Not applicable.
Item 6. Schedule of Investments.
Included in Item 1 above.
Item 7. Disclosure of Proxy Voting Policies and Procedures for Closed-End Management Investment Companies.
Not applicable.
Item 8. Portfolio Managers of Closed-End Investment Companies.
Not applicable.
Item 9. Purchases of Equity Securities by Closed-End Management Investment Company and Affiliated Purchasers.
Not applicable.
Item 10. Submission of Matters to a Vote of Security Holders.
None.
Item 11. Controls and Procedures.
(a) The registrant’s principal executive officer and principal financial officer have concluded that the registrant’s disclosure controls and procedures are reasonably designed to ensure that information required to be disclosed by the registrant in this Form N-CSR was recorded, processed, summarized and reported within the time periods specified in the Securities and Exchange Commission’s rules and forms, based upon such officers’ evaluation of these controls and procedures as of a date within 90 days of the filing date of this report.
(b) There were no changes in the registrant’s internal control over financial reporting that occurred during the second fiscal quarter of the period covered by this report that have materially affected, or are reasonably likely to materially affect, the registrant’s internal control over financial reporting.
Item 12. Exhibits.
(a)(1) Not Applicable.
(a)(2) Certifications of principal executive officer and principal financial officer as required by Rule 30a-2(a) under the Investment Company Act of 1940.
(a)(3) Not applicable.
(b) Certifications of chief executive officer and chief financial officer as required by Rule 30a- 2(b) under the Investment Company Act of 1940.
SIGNATURES
Pursuant to the requirements of the Securities Exchange Act of 1934 and the Investment Company Act of 1940, the registrant has duly caused this report to be signed on its behalf by the undersigned, thereunto duly authorized.
COHEN & STEERS REALTY SHARES, INC. | |
| |
| |
| By: | /s/ Adam M. Derechin | |
| | | Name: | Adam M. Derechin | |
| | | Title: | President and Chief Executive Officer |
| | |
| Date: February 28, 2014 | |
| |
Pursuant to the requirements of the Securities Exchange Act of 1934 and the Investment Company Act of 1940, this report has been signed below by the following persons on behalf of the registrant and in the capacities and on the dates indicated. |
|
| |
| By: | /s/ Adam M. Derechin | |
| | | Name: | Adam M. Derechin | |
| | | Title: | President and Chief Executive Officer |
| | | | (Principal Executive Officer) |
| | | |
| By: | /s/ James Giallanza | |
| | | Name: | James Giallanza | |
| | | Title: | Treasurer and Chief Financial Officer |
| | | (Principal Financial Officer) |
| | | |
| | | |
| Date: February 28, 2014 | |