UNITED STATES
SECURITIES AND EXCHANGE COMMISSION
Washington, D.C. 20549
FORM N-CSR
CERTIFIED SHAREHOLDER REPORT OF REGISTERED
MANAGEMENT INVESTMENT COMPANIES
Investment Company Act File Number: 811-06302
Cohen & Steers Realty Shares, Inc.
(Exact name of Registrant as specified in charter)
1166 Avenue of the Americas, 30th Floor, New York, New York 10036
(Address of principal executive offices) (Zip code)
Dana A. DeVivo
Cohen & Steers Capital Management, Inc.
1166 Avenue of the Americas, 30th Floor
New York, New York 10036
(Name and address of agent for service)
Registrant’s telephone number, including area code: (212) 832-3232
Date of fiscal year end: December 31
Date of reporting period: June 30, 2024
Item 1. Reports to Stockholders.
(a)
This semi-annual shareholder report contains important information about Cohen & Steers Realty Shares, Inc. (Fund) for the period of January 1, 2024 to June 30, 2024. You can find additional information about the Fund, by scanning the QR code or visiting www.cohenandsteers.com/fund-literature. You can also request this information by contacting us at 1-800-330-7348.
The share class had a 0.00% total return in the six months ended June 30, 2024, compared with the Linked Index,1 which returned -2.19%.
Stock selection in the data center sector contributed to relative performance in the period. An overweight position in Digital Realty Trust aided performance, outperforming the index amid strong demand for the company's services, including Cloud and Artificial Intelligence capabilities. Stock selection and an overweight in specialty REITs also helped performance, due primarily to an overweight position in Iron Mountain. The stock had a large gain, benefiting from strong pricing power and the company's continued expansion into data center operations. Stock selection and an underweight in offices further aided performance. An overweight in Highwoods Properties, the portfolio's sole office allocation in the period, performed well.
An underweight allocation to apartment owners detracted from relative performance. The sector outperformed broader REITs amid better-than-expected fundamentals, particularly in coastal markets. Stock selection in the free-standing retail sectors also hindered performance, due mainly to an overweight in Realty Income. The holding, which tends to be sensitive to moves in interest rates, declined amid a rise in bond yields in the period. Stock selection in shopping centers was a modest detractor from relative returns; an overweight position in Kimco Realty underperformed.
Top contributors | Top detractors |
Data Centers | Apartment |
Specialty | Free Standing |
Office | Shopping Center |
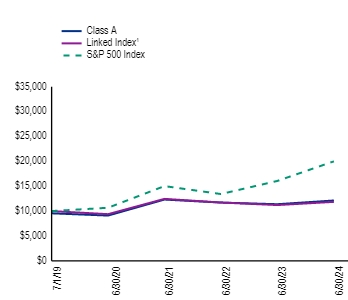
The chart below shows the performance of a hypothetical $10,000 investment in the share class noted over the period reflected, as compared to the performance of the Fund's benchmarks, and assumes the maximum sales charge, if applicable, and the reinvestment of dividends and distributions.
| 07/01/2019 | 9550 | 10000 | 10000 |
| 06/30/2020 | 9097 | 9378 | 10669 |
| 06/30/2021 | 12316 | 12454 | 15021 |
| 06/30/2022 | 11711 | 11721 | 13426 |
| 06/30/2023 | 11379 | 11207 | 16057 |
| 06/30/2024 | 12128 | 11854 | 20000 |
| With sales charge2 | 1.78% | 3.93% |
| Without sales charge | 6.58% | 4.90% |
| Linked Index1 | 5.78% | 3.46% |
| S&P 500 Index | 24.56% | 14.87% |
* Data quoted represents past performance, which is no guarantee of future results. Performance does not reflect the deduction of taxes that a shareholder would pay on Fund distributions or the redemption of Fund shares. Unless otherwise noted, index performance does not reflect the deductions of any fees, taxes or expenses.
| Net assets | $5,508,078,237 |
| Number of portfolio holdings (excluding derivatives) | 34 |
| Portfolio turnover rate | 18% |
| American Tower Corp. | 9.7% |
| Welltower, Inc. | 9.0% |
| Prologis, Inc. | 8.2% |
| Digital Realty Trust, Inc. | 7.7% |
| Simon Property Group, Inc. | 6.4% |
| Crown Castle, Inc. | 5.6% |
| Iron Mountain, Inc. | 4.8% |
| Invitation Homes, Inc. | 4.7% |
| Equinix, Inc. | 3.9% |
| VICI Properties, Inc., Class A | 3.2% |
| Telecommunications | 15.8% |
| Health Care | 12.7% |
| Data Centers | 11.6% |
| Industrials | 10.7% |
| Apartment | 6.9% |
| Regional Mall | 6.4% |
| Single Family Homes | 6.3% |
| Self Storage | 4.8% |
| Specialty | 4.8% |
| Other (includes short-term investments) | 20.0% |
| United States | 98.6% |
| Other (includes short-term investments) | 1.4% |
There have been no material changes to the Fund since the beginning of the reporting period that are required to be disclosed in this report. For more complete information about other changes to the Fund, you may review the Fund's current prospectus, which is available upon request by calling 1-800-330-7348 or visiting www.cohenandsteers.com/fund-literature.
Additional information is available on the Fund's website address included at the beginning of this report, including the Fund's prospectus, financial information, holdings and proxy voting information.
| |
1 | The Linked Index consists of the FTSE Nareit Equity REITs Index through 3/31/2019, and the FTSE Nareit All Equity REITs Index thereafter. |
| |
2 | Reflects a 4.50% front-end sales charge. |
3 | Based on net assets. |
4 | Determined on the basis of the value of individual securities held, excluding short-term investments and derivative instruments, if any. |
5 | Excludes derivative instruments, if any. |
This semi-annual shareholder report contains important information about Cohen & Steers Realty Shares, Inc. (Fund) for the period of January 1, 2024 to June 30, 2024. You can find additional information about the Fund, by scanning the QR code or visiting www.cohenandsteers.com/fund-literature. You can also request this information by contacting us at 1-800-330-7348.
The share class had a -0.33% total return in the six months ended June 30, 2024, compared with the Linked Index,1 which returned -2.19%.
Stock selection in the data center sector contributed to relative performance in the period. An overweight position in Digital Realty Trust aided performance, outperforming the index amid strong demand for the company's services, including Cloud and Artificial Intelligence capabilities. Stock selection and an overweight in specialty REITs also helped performance, due primarily to an overweight position in Iron Mountain. The stock had a large gain, benefiting from strong pricing power and the company's continued expansion into data center operations. Stock selection and an underweight in offices further aided performance. An overweight in Highwoods Properties, the portfolio's sole office allocation in the period, performed well.
An underweight allocation to apartment owners detracted from relative performance. The sector outperformed broader REITs amid better-than-expected fundamentals, particularly in coastal markets. Stock selection in the free-standing retail sectors also hindered performance, due mainly to an overweight in Realty Income. The holding, which tends to be sensitive to moves in interest rates, declined amid a rise in bond yields in the period. Stock selection in shopping centers was a modest detractor from relative returns; an overweight position in Kimco Realty underperformed.
Top contributors | Top detractors |
Data Centers | Apartment |
Specialty | Free Standing |
Office | Shopping Center |
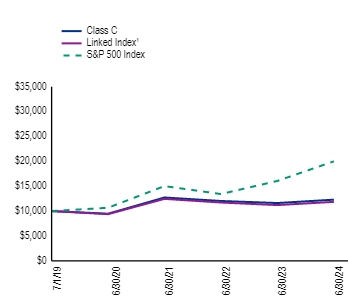
The chart below shows the performance of a hypothetical $10,000 investment in the share class noted over the period reflected, as compared to the performance of the Fund's benchmarks, and assumes the maximum sales charge, if applicable, and the reinvestment of dividends and distributions.
| 07/01/2019 | 10000 | 10000 | 10000 |
| 06/30/2020 | 9466 | 9378 | 10669 |
| 06/30/2021 | 12732 | 12454 | 15021 |
| 06/30/2022 | 12030 | 11721 | 13426 |
| 06/30/2023 | 11615 | 11207 | 16057 |
| 06/30/2024 | 12296 | 11854 | 20000 |
| With sales charge | 4.87%2 | 4.22% |
| Without sales charge | 5.87% | 4.22% |
| Linked Index1 | 5.78% | 3.46% |
| S&P 500 Index | 24.56% | 14.87% |
* Data quoted represents past performance, which is no guarantee of future results. Performance does not reflect the deduction of taxes that a shareholder would pay on Fund distributions or the redemption of Fund shares. Unless otherwise noted, index performance does not reflect the deductions of any fees, taxes or expenses.
| Net assets | $5,508,078,237 |
| Number of portfolio holdings (excluding derivatives) | 34 |
| Portfolio turnover rate | 18% |
| American Tower Corp. | 9.7% |
| Welltower, Inc. | 9.0% |
| Prologis, Inc. | 8.2% |
| Digital Realty Trust, Inc. | 7.7% |
| Simon Property Group, Inc. | 6.4% |
| Crown Castle, Inc. | 5.6% |
| Iron Mountain, Inc. | 4.8% |
| Invitation Homes, Inc. | 4.7% |
| Equinix, Inc. | 3.9% |
| VICI Properties, Inc., Class A | 3.2% |
| Telecommunications | 15.8% |
| Health Care | 12.7% |
| Data Centers | 11.6% |
| Industrials | 10.7% |
| Apartment | 6.9% |
| Regional Mall | 6.4% |
| Single Family Homes | 6.3% |
| Self Storage | 4.8% |
| Specialty | 4.8% |
| Other (includes short-term investments) | 20.0% |
| United States | 98.6% |
| Other (includes short-term investments) | 1.4% |
There have been no material changes to the Fund since the beginning of the reporting period that are required to be disclosed in this report. For more complete information about other changes to the Fund, you may review the Fund's current prospectus, which is available upon request by calling 1-800-330-7348 or visiting www.cohenandsteers.com/fund-literature.
Additional information is available on the Fund's website address included at the beginning of this report, including the Fund's prospectus, financial information, holdings and proxy voting information.
| |
1 | The Linked Index consists of the FTSE Nareit Equity REITs Index through 3/31/2019, and the FTSE Nareit All Equity REITs Index thereafter. |
| |
2 | Reflects a contingent deferred sales charge of 1.00%. |
3 | Based on net assets. |
4 | Determined on the basis of the value of individual securities held, excluding short-term investments and derivative instruments, if any. |
5 | Excludes derivative instruments, if any. |
This semi-annual shareholder report contains important information about Cohen & Steers Realty Shares, Inc. (Fund) for the period of January 1, 2024 to June 30, 2024. You can find additional information about the Fund, by scanning the QR code or visiting www.cohenandsteers.com/fund-literature. You can also request this information by contacting us at 1-800-330-7348.
The share class had a 0.13% total return in the six months ended June 30, 2024, compared with the Linked Index,1 which returned -2.19%.
Stock selection in the data center sector contributed to relative performance in the period. An overweight position in Digital Realty Trust aided performance, outperforming the index amid strong demand for the company's services, including Cloud and Artificial Intelligence capabilities. Stock selection and an overweight in specialty REITs also helped performance, due primarily to an overweight position in Iron Mountain. The stock had a large gain, benefiting from strong pricing power and the company's continued expansion into data center operations. Stock selection and an underweight in offices further aided performance. An overweight in Highwoods Properties, the portfolio's sole office allocation in the period, performed well.
An underweight allocation to apartment owners detracted from relative performance. The sector outperformed broader REITs amid better-than-expected fundamentals, particularly in coastal markets. Stock selection in the free-standing retail sectors also hindered performance, due mainly to an overweight in Realty Income. The holding, which tends to be sensitive to moves in interest rates, declined amid a rise in bond yields in the period. Stock selection in shopping centers was a modest detractor from relative returns; an overweight position in Kimco Realty underperformed.
Top contributors | Top detractors |
Data Centers | Apartment |
Specialty | Free Standing |
Office | Shopping Center |
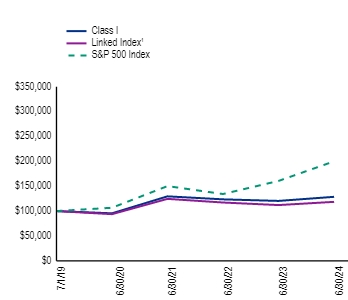
The chart below shows the performance of a hypothetical $100,000 investment in the share class noted over the period reflected, as compared to the performance of the Fund's benchmarks, and assumes the maximum sales charge, if applicable, and the reinvestment of dividends and distributions.
| 07/01/2019 | 100000 | 100000 | 100000 |
| 06/30/2020 | 95490 | 93784 | 106686 |
| 06/30/2021 | 129618 | 124540 | 150207 |
| 06/30/2022 | 123585 | 117208 | 134262 |
| 06/30/2023 | 120414 | 112066 | 160569 |
| 06/30/2024 | 128663 | 118540 | 199998 |
| Class I2 | 6.85% | 5.17% |
| Linked Index1 | 5.78% | 3.46% |
| S&P 500 Index | 24.56% | 14.87% |
* Data quoted represents past performance, which is no guarantee of future results. Performance does not reflect the deduction of taxes that a shareholder would pay on Fund distributions or the redemption of Fund shares. Unless otherwise noted, index performance does not reflect the deductions of any fees, taxes or expenses.
| Net assets | $5,508,078,237 |
| Number of portfolio holdings (excluding derivatives) | 34 |
| Portfolio turnover rate | 18% |
| American Tower Corp. | 9.7% |
| Welltower, Inc. | 9.0% |
| Prologis, Inc. | 8.2% |
| Digital Realty Trust, Inc. | 7.7% |
| Simon Property Group, Inc. | 6.4% |
| Crown Castle, Inc. | 5.6% |
| Iron Mountain, Inc. | 4.8% |
| Invitation Homes, Inc. | 4.7% |
| Equinix, Inc. | 3.9% |
| VICI Properties, Inc., Class A | 3.2% |
| Telecommunications | 15.8% |
| Health Care | 12.7% |
| Data Centers | 11.6% |
| Industrials | 10.7% |
| Apartment | 6.9% |
| Regional Mall | 6.4% |
| Single Family Homes | 6.3% |
| Self Storage | 4.8% |
| Specialty | 4.8% |
| Other (includes short-term investments) | 20.0% |
| United States | 98.6% |
| Other (includes short-term investments) | 1.4% |
There have been no material changes to the Fund since the beginning of the reporting period that are required to be disclosed in this report. For more complete information about other changes to the Fund, you may review the Fund's current prospectus, which is available upon request by calling 1-800-330-7348 or visiting www.cohenandsteers.com/fund-literature.
Additional information is available on the Fund's website address included at the beginning of this report, including the Fund's prospectus, financial information, holdings and proxy voting information.
| |
1 | The Linked Index consists of the FTSE Nareit Equity REITs Index through 3/31/2019, and the FTSE Nareit All Equity REITs Index thereafter. |
| |
2 | This share class does not impose a sales charge. |
3 | Based on net assets. |
4 | Determined on the basis of the value of individual securities held, excluding short-term investments and derivative instruments, if any. |
5 | Excludes derivative instruments, if any. |
This semi-annual shareholder report contains important information about Cohen & Steers Realty Shares, Inc. (Fund) for the period of January 1, 2024 to June 30, 2024. You can find additional information about the Fund, by scanning the QR code or visiting www.cohenandsteers.com/fund-literature. You can also request this information by contacting us at 1-800-330-7348.
The share class had a 0.11% total return in the six months ended June 30, 2024, compared with the Linked Index,1 which returned -2.19%.
Stock selection in the data center sector contributed to relative performance in the period. An overweight position in Digital Realty Trust aided performance, outperforming the index amid strong demand for the company's services, including Cloud and Artificial Intelligence capabilities. Stock selection and an overweight in specialty REITs also helped performance, due primarily to an overweight position in Iron Mountain. The stock had a large gain, benefiting from strong pricing power and the company's continued expansion into data center operations. Stock selection and an underweight in offices further aided performance. An overweight in Highwoods Properties, the portfolio's sole office allocation in the period, performed well.
An underweight allocation to apartment owners detracted from relative performance. The sector outperformed broader REITs amid better-than-expected fundamentals, particularly in coastal markets. Stock selection in the free-standing retail sectors also hindered performance, due mainly to an overweight in Realty Income. The holding, which tends to be sensitive to moves in interest rates, declined amid a rise in bond yields in the period. Stock selection in shopping centers was a modest detractor from relative returns; an overweight position in Kimco Realty underperformed.
Top contributors | Top detractors |
Data Centers | Apartment |
Specialty | Free Standing |
Office | Shopping Center |
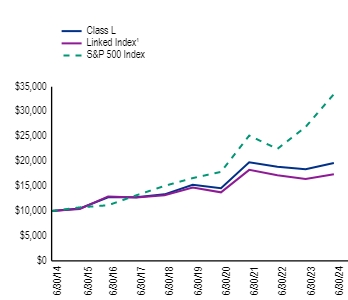
The chart below shows the performance of a hypothetical $10,000 investment in the share class noted over the period reflected, as compared to the performance of the Fund's benchmarks, and assumes the maximum sales charge, if applicable, and the reinvestment of dividends and distributions.
| 06/30/2014 | 10000 | 10000 | 10000 |
| 06/30/2015 | 10532 | 10433 | 10742 |
| 06/30/2016 | 12776 | 12942 | 11171 |
| 06/30/2017 | 12801 | 12722 | 13170 |
| 06/30/2018 | 13360 | 13167 | 15064 |
| 06/30/2019 | 15306 | 14721 | 16633 |
| 06/30/2020 | 14600 | 13768 | 17881 |
| 06/30/2021 | 19819 | 18283 | 25175 |
| 06/30/2022 | 18896 | 17207 | 22503 |
| 06/30/2023 | 18410 | 16452 | 26912 |
| 06/30/2024 | 19671 | 17403 | 33521 |
| Class L2 | 6.85% | 5.14% | 7.00% |
| Linked Index1 | 5.78% | 3.40% | 5.70% |
| S&P 500 Index | 24.56% | 15.04% | 12.86% |
* Data quoted represents past performance, which is no guarantee of future results. Performance does not reflect the deduction of taxes that a shareholder would pay on Fund distributions or the redemption of Fund shares. Unless otherwise noted, index performance does not reflect the deductions of any fees, taxes or expenses.
| Net assets | $5,508,078,237 |
| Number of portfolio holdings (excluding derivatives) | 34 |
| Portfolio turnover rate | 18% |
| American Tower Corp. | 9.7% |
| Welltower, Inc. | 9.0% |
| Prologis, Inc. | 8.2% |
| Digital Realty Trust, Inc. | 7.7% |
| Simon Property Group, Inc. | 6.4% |
| Crown Castle, Inc. | 5.6% |
| Iron Mountain, Inc. | 4.8% |
| Invitation Homes, Inc. | 4.7% |
| Equinix, Inc. | 3.9% |
| VICI Properties, Inc., Class A | 3.2% |
| Telecommunications | 15.8% |
| Health Care | 12.7% |
| Data Centers | 11.6% |
| Industrials | 10.7% |
| Apartment | 6.9% |
| Regional Mall | 6.4% |
| Single Family Homes | 6.3% |
| Self Storage | 4.8% |
| Specialty | 4.8% |
| Other (includes short-term investments) | 20.0% |
| United States | 98.6% |
| Other (includes short-term investments) | 1.4% |
There have been no material changes to the Fund since the beginning of the reporting period that are required to be disclosed in this report. For more complete information about other changes to the Fund, you may review the Fund's current prospectus, which is available upon request by calling 1-800-330-7348 or visiting www.cohenandsteers.com/fund-literature.
Additional information is available on the Fund's website address included at the beginning of this report, including the Fund's prospectus, financial information, holdings and proxy voting information.
| |
1 | The Linked Index consists of the FTSE Nareit Equity REITs Index through 3/31/2019, and the FTSE Nareit All Equity REITs Index thereafter. |
| |
2 | This share class does not impose a sales charge. |
3 | Based on net assets. |
4 | Determined on the basis of the value of individual securities held, excluding short-term investments and derivative instruments, if any. |
5 | Excludes derivative instruments, if any. |
This semi-annual shareholder report contains important information about Cohen & Steers Realty Shares, Inc. (Fund) for the period of January 1, 2024 to June 30, 2024. You can find additional information about the Fund, by scanning the QR code or visiting www.cohenandsteers.com/fund-literature. You can also request this information by contacting us at 1-800-330-7348.
The share class had a -0.08% total return in the six months ended June 30, 2024, compared with the Linked Index,1 which returned -2.19%.
Stock selection in the data center sector contributed to relative performance in the period. An overweight position in Digital Realty Trust aided performance, outperforming the index amid strong demand for the company's services, including Cloud and Artificial Intelligence capabilities. Stock selection and an overweight in specialty REITs also helped performance, due primarily to an overweight position in Iron Mountain. The stock had a large gain, benefiting from strong pricing power and the company's continued expansion into data center operations. Stock selection and an underweight in offices further aided performance. An overweight in Highwoods Properties, the portfolio's sole office allocation in the period, performed well.
An underweight allocation to apartment owners detracted from relative performance. The sector outperformed broader REITs amid better-than-expected fundamentals, particularly in coastal markets. Stock selection in the free-standing retail sectors also hindered performance, due mainly to an overweight in Realty Income. The holding, which tends to be sensitive to moves in interest rates, declined amid a rise in bond yields in the period. Stock selection in shopping centers was a modest detractor from relative returns; an overweight position in Kimco Realty underperformed.
Top contributors | Top detractors |
Data Centers | Apartment |
Specialty | Free Standing |
Office | Shopping Center |
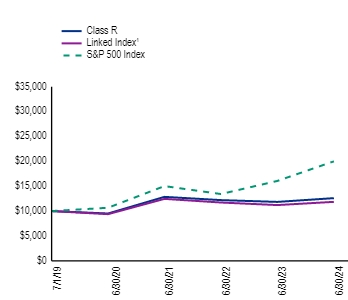
The chart below shows the performance of a hypothetical $10,000 investment in the share class noted over the period reflected, as compared to the performance of the Fund's benchmarks, and assumes the maximum sales charge, if applicable, and the reinvestment of dividends and distributions.
| 07/01/2019 | 10000 | 10000 | 10000 |
| 06/30/2020 | 9511 | 9378 | 10669 |
| 06/30/2021 | 12857 | 12454 | 15021 |
| 06/30/2022 | 12205 | 11721 | 13426 |
| 06/30/2023 | 11844 | 11207 | 16057 |
| 06/30/2024 | 12601 | 11854 | 20000 |
| Class R2 | 6.39% | 4.73% |
| Linked Index1 | 5.78% | 3.46% |
| S&P 500 Index | 24.56% | 14.87% |
* Data quoted represents past performance, which is no guarantee of future results. Performance does not reflect the deduction of taxes that a shareholder would pay on Fund distributions or the redemption of Fund shares. Unless otherwise noted, index performance does not reflect the deductions of any fees, taxes or expenses.
| Net assets | $5,508,078,237 |
| Number of portfolio holdings (excluding derivatives) | 34 |
| Portfolio turnover rate | 18% |
| American Tower Corp. | 9.7% |
| Welltower, Inc. | 9.0% |
| Prologis, Inc. | 8.2% |
| Digital Realty Trust, Inc. | 7.7% |
| Simon Property Group, Inc. | 6.4% |
| Crown Castle, Inc. | 5.6% |
| Iron Mountain, Inc. | 4.8% |
| Invitation Homes, Inc. | 4.7% |
| Equinix, Inc. | 3.9% |
| VICI Properties, Inc., Class A | 3.2% |
| Telecommunications | 15.8% |
| Health Care | 12.7% |
| Data Centers | 11.6% |
| Industrials | 10.7% |
| Apartment | 6.9% |
| Regional Mall | 6.4% |
| Single Family Homes | 6.3% |
| Self Storage | 4.8% |
| Specialty | 4.8% |
| Other (includes short-term investments) | 20.0% |
| United States | 98.6% |
| Other (includes short-term investments) | 1.4% |
There have been no material changes to the Fund since the beginning of the reporting period that are required to be disclosed in this report. For more complete information about other changes to the Fund, you may review the Fund's current prospectus, which is available upon request by calling 1-800-330-7348 or visiting www.cohenandsteers.com/fund-literature.
Additional information is available on the Fund's website address included at the beginning of this report, including the Fund's prospectus, financial information, holdings and proxy voting information.
| |
1 | The Linked Index consists of the FTSE Nareit Equity REITs Index through 3/31/2019, and the FTSE Nareit All Equity REITs Index thereafter. |
| |
2 | This share class does not impose a sales charge. |
3 | Based on net assets. |
4 | Determined on the basis of the value of individual securities held, excluding short-term investments and derivative instruments, if any. |
5 | Excludes derivative instruments, if any. |
This semi-annual shareholder report contains important information about Cohen & Steers Realty Shares, Inc. (Fund) for the period of January 1, 2024 to June 30, 2024. You can find additional information about the Fund, by scanning the QR code or visiting www.cohenandsteers.com/fund-literature. You can also request this information by contacting us at 1-800-330-7348.
The share class had a 0.17% total return in the six months ended June 30, 2024, compared with the Linked Index,1 which returned -2.19%.
Stock selection in the data center sector contributed to relative performance in the period. An overweight position in Digital Realty Trust aided performance, outperforming the index amid strong demand for the company's services, including Cloud and Artificial Intelligence capabilities. Stock selection and an overweight in specialty REITs also helped performance, due primarily to an overweight position in Iron Mountain. The stock had a large gain, benefiting from strong pricing power and the company's continued expansion into data center operations. Stock selection and an underweight in offices further aided performance. An overweight in Highwoods Properties, the portfolio's sole office allocation in the period, performed well.
An underweight allocation to apartment owners detracted from relative performance. The sector outperformed broader REITs amid better-than-expected fundamentals, particularly in coastal markets. Stock selection in the free-standing retail sectors also hindered performance, due mainly to an overweight in Realty Income. The holding, which tends to be sensitive to moves in interest rates, declined amid a rise in bond yields in the period. Stock selection in shopping centers was a modest detractor from relative returns; an overweight position in Kimco Realty underperformed.
Top contributors | Top detractors |
Data Centers | Apartment |
Specialty | Free Standing |
Office | Shopping Center |
The chart below shows the performance of a hypothetical $10,000 investment in the share class noted over the period reflected, as compared to the performance of the Fund's benchmarks, and assumes the maximum sales charge, if applicable, and the reinvestment of dividends and distributions.
| 07/01/2019 | 10000 | 10000 | 10000 |
| 06/30/2020 | 9511 | 9378 | 10669 |
| 06/30/2021 | 12857 | 12454 | 15021 |
| 06/30/2022 | 12205 | 11721 | 13426 |
| 06/30/2023 | 11844 | 11207 | 16057 |
| 06/30/2024 | 12601 | 11854 | 20000 |
| Class Z2 | 6.94% | 5.26% |
| Linked Index1 | 5.78% | 3.46% |
| S&P 500 Index | 24.56% | 14.87% |
* Data quoted represents past performance, which is no guarantee of future results. Performance does not reflect the deduction of taxes that a shareholder would pay on Fund distributions or the redemption of Fund shares. Unless otherwise noted, index performance does not reflect the deductions of any fees, taxes or expenses.
| Net assets | $5,508,078,237 |
| Number of portfolio holdings (excluding derivatives) | 34 |
| Portfolio turnover rate | 18% |
| American Tower Corp. | 9.7% |
| Welltower, Inc. | 9.0% |
| Prologis, Inc. | 8.2% |
| Digital Realty Trust, Inc. | 7.7% |
| Simon Property Group, Inc. | 6.4% |
| Crown Castle, Inc. | 5.6% |
| Iron Mountain, Inc. | 4.8% |
| Invitation Homes, Inc. | 4.7% |
| Equinix, Inc. | 3.9% |
| VICI Properties, Inc., Class A | 3.2% |
| Telecommunications | 15.8% |
| Health Care | 12.7% |
| Data Centers | 11.6% |
| Industrials | 10.7% |
| Apartment | 6.9% |
| Regional Mall | 6.4% |
| Single Family Homes | 6.3% |
| Self Storage | 4.8% |
| Specialty | 4.8% |
| Other (includes short-term investments) | 20.0% |
| United States | 98.6% |
| Other (includes short-term investments) | 1.4% |
There have been no material changes to the Fund since the beginning of the reporting period that are required to be disclosed in this report. For more complete information about other changes to the Fund, you may review the Fund's current prospectus, which is available upon request by calling 1-800-330-7348 or visiting www.cohenandsteers.com/fund-literature.
Additional information is available on the Fund's website address included at the beginning of this report, including the Fund's prospectus, financial information, holdings and proxy voting information.
| |
1 | The Linked Index consists of the FTSE Nareit Equity REITs Index through 3/31/2019, and the FTSE Nareit All Equity REITs Index thereafter. |
| |
2 | This share class does not impose a sales charge. |
3 | Based on net assets. |
4 | Determined on the basis of the value of individual securities held, excluding short-term investments and derivative instruments, if any. |
5 | Excludes derivative instruments, if any. |
Linked IndexLinked Index
Linked Index
Linked Index
Linked Index
Linked Index
S&P 500 Index
S&P 500 Index
S&P 500 Index
S&P 500 Index
S&P 500 Index
S&P 500 Index
Item 2. Code of Ethics.
Not applicable.
Item 3. Audit Committee Financial Expert.
Not applicable.
Item 4. Principal Accountant Fees and Services.
Not applicable.
Item 5. Audit Committee of Listed Registrants.
Not applicable.
Item 6. Investments.
| (a) | Included in Item 7 below. |
Item 7. Financial Statements and Financial Highlights for Open-End Management Investment Companies.
(a)
COHEN & STEERS REALTY SHARES, INC.
We would like to share with you our report for the six months ended June 30, 2024. The total returns for Cohen & Steers Realty Shares, Inc. (the Fund) and its comparative benchmarks were:
| | | | |
| | | Six Months Ended
June 30, 2024 | |
Cohen & Steers Realty Shares: | | | | |
Class A | | | 0.00 | %(a) |
Class C | | | –0.33 | % |
Class I | | | 0.13 | % |
Class L | | | 0.11 | % |
Class R | | | –0.08 | % |
Class Z | | | 0.17 | % |
FTSE Nareit All Equity REITs Index(b) | | | –2.19 | % |
S&P 500 Index(b) | | | 15.29 | % |
The performance data quoted represents past performance. Past performance is no guarantee of future results. The investment return and the principal value of an investment will fluctuate and shares, if redeemed, may be worth more or less than their original cost. Current performance may be lower or higher than the performance data quoted. Current total returns of the Fund can be obtained by visiting our website at cohenandsteers.com. All share class returns assume the reinvestment of all dividends and distributions at net asset value (NAV). Fund performance figures reflect fee waivers and/or expense reimbursements, without which the performance would have been lower. Performance quoted does not reflect the deduction of the maximum 4.50% initial sales charge on Class A shares or the 1.00% maximum contingent deferred sales charge on Class C shares. The 1.00% maximum contingent deferred sales charge on Class C applies if redemption occurs on or before the one year anniversary date of their purchase. If such charges were included, returns would have been lower. Index performance does not reflect the deduction of any fees, taxes or expenses. An investor cannot invest directly in any index. Performance figures for periods shorter than one year are not annualized.
Please note that distributions paid by the Fund to shareholders are subject to recharacterization for tax purposes and are taxable up to the amount of the Fund’s investment company taxable income and net realized gains. Distributions in excess of the Fund’s investment company taxable income and net realized gains are a return of capital distributed from the Fund’s assets.
| (a) | The returns shown are based on NAVs calculated for shareholder transactions and may differ from the returns shown in the Financial Highlights, which reflect adjustments made to the NAVs in accordance with accounting principles generally accepted in the United States of America (GAAP). |
| (b) | The FTSE Nareit All Equity REITs Index contains all tax-qualified REITs with more than 50% of total assets in qualifying real estate assets other than mortgages secured by real property that also meet minimum size and liquidity criteria. The S&P 500 Index is an unmanaged index of 500 large-capitalization stocks that is frequently used as a general measure of U.S. stock market performance. |
1
COHEN & STEERS REALTY SHARES, INC.
SCHEDULE OF INVESTMENTS
June 30, 2024 (Unaudited)
| | | | | | | | | | | | |
| | | | | | Shares | | | Value | |
COMMON STOCK—REAL ESTATE | | | 98.6% | | | | | | | | | |
APARTMENT | | | 6.9% | | | | | | | | | |
Camden Property Trust | | | | 805,736 | | | $ | 87,913,855 | |
Essex Property Trust, Inc. | | | | 631,516 | | | | 171,898,655 | |
UDR, Inc. | | | | 2,988,283 | | | | 122,967,846 | |
| | | | | | | | | | | | |
| | | | | | | | | | | 382,780,356 | |
| | | | | | | | | | | | |
DATA CENTERS | | | 11.6% | | | | | | | | | |
Digital Realty Trust, Inc. | | | | 2,785,648 | | | | 423,557,779 | |
Equinix, Inc. | | | | 286,684 | | | | 216,905,114 | |
| | | | | | | | | | | | |
| | | | | | | | | | | 640,462,893 | |
| | | | | | | | | | | | |
DIVERSIFIED | | | 0.2% | | | | | | | | | |
WP Carey, Inc. | | | | 243,907 | | | | 13,427,080 | |
| | | | | | | | | | | | |
FREE STANDING | | | 3.2% | | | | | | | | | |
Realty Income Corp. | | | | 3,312,177 | | | | 174,949,189 | |
| | | | | | | | | | | | |
GAMING | | | 3.2% | | | | | | | | | |
VICI Properties, Inc., Class A | | | | 6,185,662 | | | | 177,157,360 | |
| | | | | | | | | | | | |
HEALTH CARE | | | 12.7% | | | | | | | | | |
Healthcare Realty Trust, Inc., Class A | | | | 7,146,723 | | | | 117,777,995 | |
Healthpeak Properties, Inc. | | | | 3,006,923 | | | | 58,935,691 | |
Omega Healthcare Investors, Inc. | | | | 636,700 | | | | 21,806,975 | |
Welltower, Inc. | | | | 4,780,509 | | | | 498,368,063 | |
| | | | | | | | | | | | |
| | | | | | | | | | | 696,888,724 | |
| | | | | | | | | | | | |
HOTEL | | | 3.1% | | | | | | | | | |
Boyd Gaming Corp. | | | | 1,138,163 | | | | 62,712,781 | |
Caesars Entertainment, Inc.(a) | | | | 1,528,393 | | | | 60,738,338 | |
Host Hotels & Resorts, Inc. | | | | 2,561,839 | | | | 46,061,865 | |
| | | | | | | | | | | | |
| | | | | | | | | | | 169,512,984 | |
| | | | | | | | | | | | |
INDUSTRIALS | | | 10.7% | | | | | | | | | |
Americold Realty Trust, Inc. | | | | 3,581,985 | | | | 91,483,897 | |
BG LLH, LLC (Lineage Logistics)(b) | | | | 484,807 | | | | 47,370,443 | |
Prologis, Inc. | | | | 4,023,116 | | | | 451,836,158 | |
| | | | | | | | | | | | |
| | | | | | | | | | | 590,690,498 | |
| | | | | | | | | | | | |
See accompanying notes to financial statements.
2
COHEN & STEERS REALTY SHARES, INC.
SCHEDULE OF INVESTMENTS—(Continued)
June 30, 2024 (Unaudited)
| | | | | | | | | | | | |
| | | | | | Shares | | | Value | |
MANUFACTURED HOME | | | 3.6% | | | | | | | | | |
Equity LifeStyle Properties, Inc. | | | | 308,618 | | | $ | 20,100,290 | |
Sun Communities, Inc. | | | | 1,467,588 | | | | 176,609,540 | |
| | | | | | | | | | | | |
| | | | | | | | | | | 196,709,830 | |
| | | | | | | | | | | | |
OFFICE | | | 1.8% | | | | | | | | | |
Highwoods Properties, Inc. | | | | 3,755,713 | | | | 98,662,580 | |
| | | | | | | | | | | | |
REGIONAL MALL | | | 6.4% | | | | | | | | | |
Simon Property Group, Inc. | | | | 2,310,377 | | | | 350,715,229 | |
| | | | | | | | | | | | |
SELF STORAGE | | | 4.8% | | | | | | | | | |
Extra Space Storage, Inc. | | | | 1,096,790 | | | | 170,452,134 | |
Public Storage | | | | 322,095 | | | | 92,650,627 | |
| | | | | | | | | | | | |
| | | | | | | | | | | 263,102,761 | |
| | | | | | | | | | | | |
SHOPPING CENTER | | | 1.9% | | | | | | | | | |
Kimco Realty Corp. | | | | 5,365,417 | | | | 104,411,015 | |
| | | | | | | | | | | | |
SINGLE FAMILY HOMES | | | 6.3% | | | | | | | | | |
American Homes 4 Rent, Class A | | | | 2,288,634 | | | | 85,045,640 | |
Invitation Homes, Inc. | | | | 7,227,178 | | | | 259,383,418 | |
| | | | | | | | | | | | |
| | | | | | | | | | | 344,429,058 | |
| | | | | | | | | | | | |
SPECIALTY | | | 4.8% | | | | | | | | | |
Iron Mountain, Inc. | | | | 2,925,349 | | | | 262,169,777 | |
| | | | | | | | | | | | |
TELECOMMUNICATIONS | | | 15.8% | | | | | | | | | |
American Tower Corp. | | | | 2,746,189 | | | | 533,804,218 | |
Crown Castle, Inc. | | | | 3,134,147 | | | | 306,206,162 | |
SBA Communications Corp., Class A | | | | 167,425 | | | | 32,865,527 | |
| | | | | | | | | | | | |
| | | | | | | | | | | 872,875,907 | |
| | | | | | | | | | | | |
TIMBERLAND | | | 1.6% | | | | | | | | | |
Weyerhaeuser Co. | | | | 3,203,295 | | | | 90,941,545 | |
| | | | | | | | | | | | |
TOTAL COMMON STOCK
(Identified cost—$4,566,559,133) | | | | | | | | 5,429,886,786 | |
| | | | | | | | | | | | |
See accompanying notes to financial statements.
3
COHEN & STEERS REALTY SHARES, INC.
SCHEDULE OF INVESTMENTS—(Continued)
June 30, 2024 (Unaudited)
| | | | | | | | | | | | |
| | | | | | Shares | | | Value | |
SHORT-TERM INVESTMENTS | | | 1.4% | | | | | | | | | |
MONEY MARKET FUNDS | | | | | | | | | |
State Street Institutional Treasury Plus Money Market Fund, Premier Class, 5.25%(c) | | | | 47,781,943 | | | $ | 47,781,943 | |
State Street Institutional U.S. Government Money Market Fund, Premier Class, 5.25%(c) | | | | 28,594,000 | | | | 28,594,000 | |
| | | | | | | | | | | | |
TOTAL SHORT-TERM INVESTMENTS
(Identified cost—$76,375,943) | | | | | | | | 76,375,943 | |
| | | | | | | | | | | | |
TOTAL INVESTMENTS IN SECURITIES
(Identified cost—$4,642,935,076) | | | 100.0% | | | | | | | | 5,506,262,729 | |
OTHER ASSETS IN EXCESS OF LIABILITIES | | | 0.0 | | | | | | | | 1,815,508 | |
| | | | | | | | | | | | |
NET ASSETS | | | 100.0% | | | | | | | $ | 5,508,078,237 | |
| | | | | | | | | | | | |
Note: Percentages indicated are based on the net assets of the Fund.
| (a) | Non–income producing security. |
| (b) | Restricted security. Aggregate holdings equal 0.9% of the net assets of the Fund. This security was acquired on August 3, 2020, at a cost of $29,791,406. Security value is determined based on significant unobservable inputs (Level 3). |
| (c) | Rate quoted represents the annualized seven–day yield. |
See accompanying notes to financial statements.
4
COHEN & STEERS REALTY SHARES, INC.
STATEMENT OF ASSETS AND LIABILITIES
June 30, 2024 (Unaudited)
| | | | |
ASSETS: | |
Investments in securities, at value (Identified cost—$4,642,935,076) | | $ | 5,506,262,729 | |
Receivable for: | | | | |
Dividends | | | 17,440,448 | |
Fund shares sold | | | 8,969,513 | |
Investment securities sold | | | 6,539,777 | |
Other assets | | | 58,224 | |
| | | | |
Total Assets | | | 5,539,270,691 | |
| | | | |
LIABILITIES: | |
Payable for: | | | | |
Fund shares redeemed | | | 15,305,802 | |
Investment securities purchased | | | 8,765,542 | |
Investment advisory fees | | | 3,125,617 | |
Dividends and distributions declared | | | 2,351,629 | |
Shareholder servicing fees | | | 715,193 | |
Administration fees | | | 178,431 | |
Distribution fees | | | 31,447 | |
Directors’ fees | | | 1,709 | |
Other liabilities | | | 717,084 | |
| | | | |
Total Liabilities | | | 31,192,454 | |
| | | | |
NET ASSETS | | $ | 5,508,078,237 | |
| | | | |
NET ASSETS consist of: | |
Paid-in capital | | $ | 4,830,910,113 | |
Total distributable earnings/(accumulated loss) | | | 677,168,124 | |
| | | | |
| | $ | 5,508,078,237 | |
| | | | |
See accompanying notes to financial statements.
5
COHEN & STEERS REALTY SHARES, INC.
STATEMENT OF ASSETS AND LIABILITIES—(Continued)
June 30, 2024 (Unaudited)
| | | | |
CLASS A SHARES: | |
NET ASSETS | | $ | 102,308,513 | |
Shares issued and outstanding ($0.001 par value common stock outstanding) | | | 1,634,191 | |
| | | | |
Net asset value and redemption price per share | | $ | 62.60 | |
| | | | |
Maximum offering price per share ($62.60 ÷ 0.955)(a) | | $ | 65.55 | |
| | | | |
CLASS C SHARES: | |
NET ASSETS | | $ | 17,339,639 | |
Shares issued and outstanding ($0.001 par value common stock outstanding) | | | 278,062 | |
| | | | |
Net asset value and offering price per share(b) | | $ | 62.36 | |
| | | | |
CLASS I SHARES: | |
NET ASSETS | | $ | 1,824,009,906 | |
Shares issued and outstanding ($0.001 par value common stock outstanding) | | | 29,155,767 | |
| | | | |
Net asset value, offering and redemption price per share | | $ | 62.56 | |
| | | | |
CLASS L SHARES: | |
NET ASSETS | | $ | 3,374,880,976 | |
Shares issued and outstanding ($0.001 par value common stock outstanding) | | | 53,925,549 | |
| | | | |
Net asset value, offering and redemption price per share | | $ | 62.58 | |
| | | | |
CLASS R SHARES: | |
NET ASSETS | | $ | 613,201 | |
Shares issued and outstanding ($0.001 par value common stock outstanding) | | | 9,771 | |
| | | | |
Net asset value, offering and redemption price per share | | $ | 62.76 | |
| | | | |
CLASS Z SHARES: | |
NET ASSETS | | $ | 188,926,002 | |
Shares issued and outstanding ($0.001 par value common stock outstanding) | | | 3,013,025 | |
| | | | |
Net asset value, offering and redemption price per share | | $ | 62.70 | |
| | | | |
| (a) | On investments of $100,000 or more, the offering price is reduced. |
| (b) | Redemption price per share is equal to the net asset value per share less any applicable contingent deferred sales charge of 1.00% on shares held for less than one year. |
See accompanying notes to financial statements.
6
COHEN & STEERS REALTY SHARES, INC.
STATEMENT OF OPERATIONS
For the Six Months Ended June 30, 2024 (Unaudited)
| | | | |
Investment Income: | | | | |
Dividend income | | $ | 86,035,813 | |
| | | | |
Expenses: | | | | |
Investment advisory fees | | | 20,158,783 | |
Distribution fees—Class A | | | 123,377 | |
Distribution fees—Class C | | | 65,161 | |
Distribution fees—Class R | | | 4,947 | |
Shareholder servicing fees—Class A | | | 49,351 | |
Shareholder servicing fees—Class C | | | 21,721 | |
Shareholder servicing fees—Class I | | | 732,103 | |
Shareholder servicing fees—Class L | | | 1,604,250 | |
Administration fees | | | 1,251,235 | |
Transfer agent fees and expenses | | | 442,744 | |
Shareholder reporting expenses | | | 220,931 | |
Directors’ fees and expenses | | | 118,125 | |
Registration and filing fees | | | 79,151 | |
Professional fees | | | 57,639 | |
Custodian fees and expenses | | | 20,740 | |
Miscellaneous | | | 79,418 | |
| | | | |
Total Expenses | | | 25,029,676 | |
Reduction of Expenses (See Note 2) | | | (1,232,173 | ) |
| | | | |
Net Expenses | | | 23,797,503 | |
| | | | |
Net Investment Income (Loss) | | | 62,238,310 | |
| | | | |
Net Realized and Unrealized Gain (Loss): | | | | |
Net realized gain (loss) on investments in securities | | | (27,867,861 | ) |
Net change in unrealized appreciation (depreciation) on investments in securities | | | (32,185,344 | ) |
| | | | |
Net Realized and Unrealized Gain (Loss) | | | (60,053,205 | ) |
| | | | |
Net Increase (Decrease) in Net Assets Resulting from Operations | | $ | 2,185,105 | |
| | | | |
See accompanying notes to financial statements.
7
COHEN & STEERS REALTY SHARES, INC.
STATEMENT OF CHANGES IN NET ASSETS (Unaudited)
| | | | | | | | |
| | | For the
Six Months Ended
June 30, 2024 | | | For the
Year Ended
December 31, 2023 | |
Change in Net Assets: | |
From Operations: | |
Net investment income (loss) | | $ | 62,238,310 | | | $ | 121,167,453 | |
Net realized gain (loss) | | | (27,867,861 | ) | | | 160,386 | |
Net change in unrealized appreciation (depreciation) | | | (32,185,344 | ) | | | 505,280,802 | |
| | | | | | | | |
Net increase (decrease) in net assets resulting from operations | | | 2,185,105 | | | | 626,608,641 | |
| | | | | | | | |
Distributions to Shareholders: | |
Class A | | | (1,385,515 | ) | | | (3,096,544 | ) |
Class C | | | (182,834 | ) | | | (525,776 | ) |
Class I | | | (27,382,589 | ) | | | (57,245,620 | ) |
Class L | | | (51,281,584 | ) | | | (128,591,913 | ) |
Class R | | | (15,283 | ) | | | (128,283 | ) |
Class Z | | | (2,849,781 | ) | | | (6,365,457 | ) |
| | | | | | | | |
Total distributions | | | (83,097,586 | ) | | | (195,953,593 | ) |
| | | | | | | | |
Capital Stock Transactions: | |
Increase (decrease) in net assets from Fund share transactions | | | 2,451,769 | | | | (455,549 | ) |
| | | | | | | | |
Total increase (decrease) in net assets | | | (78,460,712 | ) | | | 430,199,499 | |
Net Assets: | |
Beginning of period | | | 5,586,538,949 | | | | 5,156,339,450 | |
| | | | | | | | |
End of period | | $ | 5,508,078,237 | | | $ | 5,586,538,949 | |
| | | | | | | | |
See accompanying notes to financial statements.
8
COHEN & STEERS REALTY SHARES, INC.
FINANCIAL HIGHLIGHTS (Unaudited)
The following tables include selected data for a share outstanding throughout each period and other performance information derived from the financial statements. They should be read in conjunction with the financial statements and notes thereto.
| | | | | | | | | | | | | | | | | | | | | | | | |
| | | Class A | |
| | | For the Six
Months Ended
June 30, 2024 | | | For the Year Ended December 31, | | | For the Period
July 1, 2019(a)
through
December 31, 2019 | |
Per Share Operating Data: | | 2023 | | | 2022 | | | 2021 | | | 2020 | |
Net asset value, beginning of period | | | $63.47 | | | | $58.45 | | | | $83.43 | | | | $60.99 | | | | $66.10 | | | | $65.57 | |
| | | | | | | | | | | | | | | | | | | | | | | | |
Income (loss) from investment operations: | | | | | | | | | | | | | | | | | | | | | | | | |
| | | | | | |
Net investment income (loss)(b) | | | 0.63 | | | | 1.21 | | | | 0.98 | | | | 0.44 | | | | 1.03 | | | | 1.11 | |
Net realized and unrealized gain (loss) | | | (0.64 | ) | | | 5.85 | | | | (21.76 | ) | | | 25.02 | | | | (3.41 | ) | | | 5.10 | |
| | | | | | | | | | | | | | | | | | | | | | | | |
Total from investment operations | | | (0.01 | ) | | | 7.06 | | | | (20.78 | ) | | | 25.46 | | | | (2.38 | ) | | | 6.21 | |
| | | | | | | | | | | | | | | | | | | | | | | | |
Less dividends and distributions to shareholders from: | | | | | | | | | | | | | | | | | | | | | | | | |
| | | | | | |
Net investment income | | | (0.86 | ) | | | (1.27 | ) | | | (0.87 | ) | | | (0.49 | ) | | | (1.06 | ) | | | (0.81 | ) |
Net realized gain | | | — | | | | (0.77 | ) | | | (3.33 | ) | | | (2.53 | ) | | | (1.56 | ) | | | (4.87 | ) |
Tax return of capital | | | — | | | | — | | | | — | | | | — | | | | (0.11 | ) | | | — | |
| | | | | | | | | | | | | | | | | | | | | | | | |
Total dividends and distributions to shareholders | | | (0.86 | ) | | | (2.04 | ) | | | (4.20 | ) | | | (3.02 | ) | | | (2.73 | ) | | | (5.68 | ) |
| | | | | | | | | | | | | | | | | | | | | | | | |
Net increase (decrease) in net asset value | | | (0.87 | ) | | | 5.02 | | | | (24.98 | ) | | | 22.44 | | | | (5.11 | ) | | | 0.53 | |
| | | | | | | | | | | | | | | | | | | | | | | | |
Net asset value, end of period | | | $62.60 | | | | $63.47 | | | | $58.45 | | | | $83.43 | | | | $60.99 | | | | $66.10 | |
| | | | | | | | | | | | | | | | | | | | | | | | |
| | | | | | |
| | | | | | | | | | | | | | | | | | | | | | | | | |
Total return(c)(d) | | | –0.02 | %(e) | | | 12.38 | % | | | –25.17 | % | | | 42.22 | % | | | –3.14 | % | | | 9.63 | %(e) |
| | | | | | | | | | | | | | | | | | | | | | | | |
| | | | | | |
| | | | | | | | | | | | | | | | | | | | | | | | | |
See accompanying notes to financial statements.
9
COHEN & STEERS REALTY SHARES, INC.
FINANCIAL HIGHLIGHTS (Unaudited)—(Continued)
| | | | | | | | | | | | | | | | | | | | | | | | |
| | | Class A | |
| | | For the Six
Months Ended
June 30, 2024 | | | For the Year Ended December 31, | | | For the Period
July 1, 2019(a)
through
December 31, 2019 | |
Per Share Operating Data: | | 2023 | | | 2022 | | | 2021 | | | 2020 | |
| | | | | | |
Net assets, end of period (in millions) | | | $102.3 | | | | $102.5 | | | | $95.0 | | | | $88.8 | | | | $16.6 | | | | $5.8 | |
| | | | | | | | | | | | | | | | | | | | | | | | |
Ratios to average daily net assets: | | | | | | | | | | | | | | | | | | | | | | | | |
| | | | | | |
Expenses (before expense reduction) | | | 1.18 | %(f) | | | 1.19 | % | | | 1.18 | % | | | 1.18 | % | | | 1.22 | % | | | 1.20 | %(f) |
| | | | | | | | | | | | | | | | | | | | | | | | |
Expenses (net of expense reduction) | | | 1.15 | %(f) | | | 1.15 | % | | | 1.15 | % | | | 1.15 | % | | | 1.15 | % | | | 1.15 | %(f) |
| | | | | | | | | | | | | | | | | | | | | | | | |
Net investment income (loss)
(before expense reduction) | | | 2.02 | %(f) | | | 2.00 | % | | | 1.40 | % | | | 0.56 | % | | | 1.72 | % | | | 3.39 | %(f)(g) |
| | | | | | | | | | | | | | | | | | | | | | | | |
Net investment income (loss)
(net of expense reduction) | | | 2.05 | %(f) | | | 2.04 | % | | | 1.43 | % | | | 0.59 | % | | | 1.79 | % | | | 3.44 | %(f)(g) |
| | | | | | | | | | | | | | | | | | | | | | | | |
Portfolio turnover rate | | | 18 | %(e) | | | 35 | % | | | 32 | % | | | 41 | % | | | 62 | % | | | 91 | %(e) |
| | | | | | | | | | | | | | | | | | | | | | | | |
| (b) | Calculation based on average shares outstanding. |
| (c) | Return assumes the reinvestment of all dividends and distributions at net asset value. |
| (d) | Does not reflect sales charges, which would reduce return. |
| (g) | The annualized ratios of net investment income to average daily net assets may not be indicative of operating results for a full year. |
See accompanying notes to financial statements.
10
COHEN & STEERS REALTY SHARES, INC.
FINANCIAL HIGHLIGHTS (Unaudited)—(Continued)
| | | | | | | | | | | | | | | | | | | | | | | | |
| | | Class C | |
| | | For the Six
Months Ended
June 30, 2024 | | | For the Year Ended December 31, | | | For the Period
July 1, 2019(a)
through
December 31, 2019 | |
Per Share Operating Data: | | 2023 | | | 2022 | | | 2021 | | | 2020 | |
Net asset value, beginning of period | | | $63.22 | | | | $58.23 | | | | $83.10 | | | | $60.82 | | | | $65.98 | | | | $65.57 | |
| | | | | | | | | | | | | | | | | | | | | | | | |
Income (loss) from investment operations: | | | | | | | | | | | | | | | | | | | | | | | | |
| | | | | | |
Net investment income (loss)(b) | | | 0.41 | | | | 0.79 | | | | 0.48 | | | | (0.03 | ) | | | 0.73 | | | | 0.91 | |
Net realized and unrealized gain (loss) | | | (0.62 | ) | | | 5.85 | | | | (21.61 | ) | | | 24.95 | | | | (3.48 | ) | | | 5.09 | |
| | | | | | | | | | | | | | | | | | | | | | | | |
Total from investment operations | | | (0.21 | ) | | | 6.64 | | | | (21.13 | ) | | | 24.92 | | | | (2.75 | ) | | | 6.00 | |
| | | | | | | | | | | | | | | | | | | | | | | | |
Less dividends and distributions to shareholders from: | | | | | | | | | | | | | | | | | | | | | | | | |
| | | | | | |
Net investment income | | | (0.65 | ) | | | (0.88 | ) | | | (0.41 | ) | | | (0.11 | ) | | | (0.74 | ) | | | (0.72 | ) |
Net realized gain | | | — | | | | (0.77 | ) | | | (3.33 | ) | | | (2.53 | ) | | | (1.56 | ) | | | (4.87 | ) |
Tax return of capital | | | — | | | | — | | | | — | | | | — | | | | (0.11 | ) | | | — | |
| | | | | | | | | | | | | | | | | | | | | | | | |
Total dividends and distributions to shareholders | | | (0.65 | ) | | | (1.65 | ) | | | (3.74 | ) | | | (2.64 | ) | | | (2.41 | ) | | | (5.59 | ) |
| | | | | | | | | | | | | | | | | | | | | | | | |
Net increase (decrease) in net asset value | | | (0.86 | ) | | | 4.99 | | | | (24.87 | ) | | | 22.28 | | | | (5.16 | ) | | | 0.41 | |
| | | | | | | | | | | | | | | | | | | | | | | | |
Net asset value, end of period | | | $62.36 | | | | $63.22 | | | | $58.23 | | | | $83.10 | | | | $60.82 | | | | $65.98 | |
| | | | | | | | | | | | | | | | | | | | | | | | |
| | | | | | |
| | | | | | | | | | | | | | | | | | | | | | | | | |
Total return(c)(d) | | | –0.33 | %(e) | | | 11.63 | % | | | –25.65 | % | | | 41.34 | % | | | –3.78 | % | | | 9.28 | %(e) |
| | | | | | | | | | | | | | | | | | | | | | | | |
| | | | | | |
| | | | | | | | | | | | | | | | | | | | | | | | | |
See accompanying notes to financial statements.
11
COHEN & STEERS REALTY SHARES, INC.
FINANCIAL HIGHLIGHTS (Unaudited)—(Continued)
| | | | | | | | | | | | | | | | | | | | | | | | |
| | | Class C | |
| | | For the Six
Months Ended
June 30, 2024 | | | For the Year Ended December 31, | | | For the Period
July 1, 2019(a)
through
December 31, 2019 | |
Per Share Operating Data: | | 2023 | | | 2022 | | | 2021 | | | 2020 | |
| | | | | | |
Net assets, end of period (in millions) | | | $17.3 | | | | $19.2 | | | | $20.3 | | | | $25.3 | | | | $6.1 | | | | $1.6 | |
| | | | | | | | | | | | | | | | | | | | | | | | |
Ratios to average daily net assets: | | | | | | | | | | | | | | | | | | | | | | | | |
| | | | | | |
Expenses (before expense reduction) | | | 1.83 | %(f) | | | 1.84 | % | | | 1.83 | % | | | 1.83 | % | | | 1.87 | % | | | 1.85 | %(f) |
| | | | | | | | | | | | | | | | | | | | | | | | |
Expenses (net of expense reduction) | | | 1.80 | %(f) | | | 1.80 | % | | | 1.80 | % | | | 1.80 | % | | | 1.80 | % | | | 1.80 | %(f) |
| | | | | | | | | | | | | | | | | | | | | | | | |
Net investment income (loss)
(before expense reduction) | | | 1.33 | %(f) | | | 1.30 | % | | | 0.66 | % | | | (0.08 | )% | | | 1.20 | % | | | 2.79 | %(f)(g) |
| | | | | | | | | | | | | | | | | | | | | | | | |
Net investment income (loss)
(net of expense reduction) | | | 1.36 | %(f) | | | 1.34 | % | | | 0.69 | % | | | (0.05 | )% | | | 1.27 | % | | | 2.84 | %(f)(g) |
| | | | | | | | | | | | | | | | | | | | | | | | |
Portfolio turnover rate | | | 18 | %(e) | | | 35 | % | | | 32 | % | | | 41 | % | | | 62 | % | | | 91 | %(e) |
| | | | | | | | | | | | | | | | | | | | | | | | |
| (b) | Calculation based on average shares outstanding. |
| (c) | Return assumes the reinvestment of all dividends and distributions at net asset value. |
| (d) | Does not reflect sales charges, which would reduce return. |
| (g) | The annualized ratios of net investment income to average daily net assets may not be indicative of operating results for a full year. |
See accompanying notes to financial statements.
12
COHEN & STEERS REALTY SHARES, INC.
FINANCIAL HIGHLIGHTS (Unaudited)—(Continued)
| | | | | | | | | | | | | | | | | | | | | | | | |
| | | Class I | |
| | | For the Six
Months Ended
June 30, 2024 | | | For the Year Ended December 31, | | | For the Period
July 1, 2019(a)
through
December 31, 2019 | |
Per Share Operating Data: | | 2023 | | | 2022 | | | 2021 | | | 2020 | |
Net asset value, beginning of period | | | $63.43 | | | | $58.45 | | | | $83.45 | | | | $61.01 | | | | $66.15 | | | | $65.57 | |
| | | | | | | | | | | | | | | | | | | | | | | | |
Income (loss) from investment operations: | | | | | | | | | | | | | | | | | | | | | | | | |
| | | | | | |
Net investment income (loss)(b) | | | 0.72 | | | | 1.40 | | | | 1.13 | | | | 0.55 | | | | 1.21 | | | | 0.84 | |
Net realized and unrealized gain (loss) | | | (0.64 | ) | | | 5.80 | | | | (21.73 | ) | | | 25.12 | | | | (3.46 | ) | | | 5.45 | |
| | | | | | | | | | | | | | | | | | | | | | | | |
Total from investment operations | | | 0.08 | | | | 7.20 | | | | (20.60 | ) | | | 25.67 | | | | (2.25 | ) | | | 6.29 | |
| | | | | | | | | | | | | | | | | | | | | | | | |
Less dividends and distributions to shareholders from: | | | | | | | | | | | | | | | | | | | | | | | | |
| | | | | | |
Net investment income | | | (0.95 | ) | | | (1.45 | ) | | | (1.07 | ) | | | (0.70 | ) | | | (1.22 | ) | | | (0.84 | ) |
Net realized gain | | | — | | | | (0.77 | ) | | | (3.33 | ) | | | (2.53 | ) | | | (1.56 | ) | | | (4.87 | ) |
Tax return of capital | | | — | | | | — | | | | — | | | | — | | | | (0.11 | ) | | | — | |
| | | | | | | | | | | | | | | | | | | | | | | | |
Total dividends and distributions to shareholders | | | (0.95 | ) | | | (2.22 | ) | | | (4.40 | ) | | | (3.23 | ) | | | (2.89 | ) | | | (5.71 | ) |
| | | | | | | | | | | | | | | | | | | | | | | | |
Net increase (decrease) in net asset value | | | (0.87 | ) | | | 4.98 | | | | (25.00 | ) | | | 22.44 | | | | (5.14 | ) | | | 0.58 | |
| | | | | | | | | | | | | | | | | | | | | | | | |
Net asset value, end of period | | | $62.56 | | | | $63.43 | | | | $58.45 | | | | $83.45 | | | | $61.01 | | | | $66.15 | |
| | | | | | | | | | | | | | | | | | | | | | | | |
| | | | | | |
| | | | | | | | | | | | | | | | | | | | | | | | | |
Total return(c) | | | 0.13 | %(d) | | | 12.66 | % | | | –24.96 | % | | | 42.62 | % | | | –2.90 | % | | | 9.75 | %(d) |
| | | | | | | | | | | | | | | | | | | | | | | | |
| | | | | | |
| | | | | | | | | | | | | | | | | | | | | | | | | |
See accompanying notes to financial statements.
13
COHEN & STEERS REALTY SHARES, INC.
FINANCIAL HIGHLIGHTS (Unaudited)—(Continued)
| | | | | | | | | | | | | | | | | | | | | | | | |
| | | Class I | |
| | | For the Six
Months Ended
June 30, 2024 | | | For the Year Ended December 31, | | | For the Period
July 1, 2019(a)
through
December 31, 2019 | |
Per Share Operating Data: | | 2023 | | | 2022 | | | 2021 | | | 2020 | |
| | | | | | |
Net assets, end of period
(in millions) | | | $1,824.0 | | | | $1,727.8 | | | | $1,335.1 | | | | $1,507.4 | | | | $753.4 | | | | $302.0 | |
| | | | | | | | | | | | | | | | | | | | | | | | |
Ratios to average daily net assets: | | | | | | | | | | | | | | | | | | | | | | | | |
| | | | | | |
Expenses (before expense reduction) | | | 0.92 | %(e) | | | 0.92 | % | | | 0.92 | % | | | 0.91 | % | | | 0.95 | % | | | 0.93 | %(e) |
| | | | | | | | | | | | | | | | | | | | | | | | |
Expenses (net of expense reduction) | | | 0.88 | %(e) | | | 0.88 | % | | | 0.88 | % | | | 0.88 | % | | | 0.88 | % | | | 0.88 | %(e) |
| | | | | | | | | | | | | | | | | | | | | | | | |
Net investment income (loss)
(before expense reduction) | | | 2.31 | %(e) | | | 2.31 | % | | | 1.61 | % | | | 0.71 | % | | | 2.03 | % | | | 2.43 | %(e)(f) |
| | | | | | | | | | | | | | | | | | | | | | | | |
Net investment income (loss)
(net of expense reduction) | | | 2.35 | %(e) | | | 2.35 | % | | | 1.65 | %(e) | | | 0.74 | %(e) | | | 2.10 | %(e) | | | 2.48 | %(e)(f) |
| | | | | | | | | | | | | | | | | | | | | | | | |
Portfolio turnover rate | | | 18 | %(d) | | | 35 | % | | | 32 | % | | | 41 | % | | | 62 | % | | | 91 | %(d) |
| | | | | | | | | | | | | | | | | | | | | | | | |
| (b) | Calculation based on average shares outstanding. |
| (c) | Return assumes the reinvestment of all dividends and distributions at net asset value. |
| (f) | The annualized ratios of net investment income to average daily net assets may not be indicative of operating results for a full year. |
See accompanying notes to financial statements.
14
COHEN & STEERS REALTY SHARES, INC.
FINANCIAL HIGHLIGHTS (Unaudited)—(Continued)
| | | | | | | | | | | | | | | | | | | | | | | | |
| | | Class L | |
| | | For the Six
Months Ended
June 30, 2024 | | | For the Year Ended December 31, | |
Per Share Operating Data: | | 2023 | | | 2022 | | | 2021 | | | 2020 | | | 2019 | |
Net asset value, beginning of period | | | $63.46 | | | | $58.47 | | | | $83.48 | | | | $61.03 | | | | $66.16 | | | | $58.20 | |
| | | | | | | | | | | | | | | | | | | | | | | | |
Income (loss) from investment operations: | | | | | | | | | | | | | | | | | | | | | | | | |
| | | | | | |
Net investment income (loss)(a) | | | 0.70 | | | | 1.35 | | | | 1.07 | | | | 0.49 | | | | 1.08 | | | | 1.08 | |
Net realized and unrealized gain (loss) | | | (0.63 | ) | | | 5.86 | | | | (21.69 | ) | | | 25.19 | | | | (3.32 | ) | | | 17.48 | |
| | | | | | | | | | | | | | | | | | | | | | | | |
Total from investment operations | | | 0.07 | | | | 7.21 | | | | (20.62 | ) | | | 25.68 | | | | (2.24 | ) | | | 18.56 | |
| | | | | | | | | | | | | | | | | | | | | | | | |
Less dividends and distributions to shareholders from: | | | | | | | | | | | | | | | | | | | | | | | | |
| | | | | | |
Net investment income | | | (0.95 | ) | | | (1.45 | ) | | | (1.06 | ) | | | (0.70 | ) | | | (1.22 | ) | | | (0.83 | ) |
Net realized gain | | | — | | | | (0.77 | ) | | | (3.33 | ) | | | (2.53 | ) | | | (1.56 | ) | | | (9.77 | ) |
Tax return of capital | | | — | | | | — | | | | — | | | | — | | | | (0.11 | ) | | | — | |
| | | | | | | | | | | | | | | | | | | | | | | | |
Total dividends and distributions to shareholders | | | (0.95 | ) | | | (2.22 | ) | | | (4.39 | ) | | | (3.23 | ) | | | (2.89 | ) | | | (10.60 | ) |
| | | | | | | | | | | | | | | | | | | | | | | | |
Net increase (decrease) in net asset value | | | (0.88 | ) | | | 4.99 | | | | (25.01 | ) | | | 22.45 | | | | (5.13 | ) | | | 7.96 | |
| | | | | | | | | | | | | | | | | | | | | | | | |
Net asset value, end of period | | | $62.58 | | | | $63.46 | | | | $ 58.47 | | | | $83.48 | | | | $61.03 | | | | $ 66.16 | |
| | | | | | | | | | | | | | | | | | | | | | | | |
| | | | | | |
| | | | | | | | | | | | | | | | | | | | | | | | | |
Total return(b) | | | 0.11 | %(c) | | | 12.67 | % | | | –24.96 | % | | | 42.61 | % | | | –2.88 | % | | | 32.90 | % |
| | | | | | | | | | | | | | | | | | | | | | | | |
| | | | | | |
| | | | | | | | | | | | | | | | | | | | | | | | | |
See accompanying notes to financial statements.
15
COHEN & STEERS REALTY SHARES, INC.
FINANCIAL HIGHLIGHTS (Unaudited)—(Continued)
| | | | | | | | | | | | | | | | | | | | | | | | |
| | | Class L | |
| | | For the Six
Months Ended
June 30, 2024 | | | For the Year Ended December 31, | |
Ratios/Supplemental Data: | | 2023 | | | 2022 | | | 2021 | | | 2020 | | | 2019 | |
| | | | | | |
Net assets, end of period (in billions) | | | $ 3.4 | | | | $ 3.6 | | | | $ 3.5 | | | | $ 7.4 | | | | $ 5.4 | | | | $ 4.0 | |
| | | | | | | | | | | | | | | | | | | | | | | | |
Ratios to average daily net assets: | | | | | | | | | | | | | | | | | | | | | | | | |
| | | | | | |
Expenses (before expense reduction) | | | 0.93 | %(d) | | | 0.94 | % | | | 0.93 | % | | | 0.93 | % | | | 0.97 | % | | | 0.95 | % |
| | | | | | | | | | | | | | | | | | | | | | | | |
| | | | | | |
Expenses (net of expense reduction) | | | 0.88 | %(d) | | | 0.88 | % | | | 0.88 | % | | | 0.88 | % | | | 0.88 | % | | | 0.92 | % |
| | | | | | | | | | | | | | | | | | | | | | | | |
| | | | | | |
Net investment income (loss)
(before expense reduction) | | | 2.25 | %(d) | | | 2.22 | % | | | 1.47 | % | | | 0.62 | % | | | 1.76 | % | | | 1.56 | % |
| | | | | | | | | | | | | | | | | | | | | | | | |
| | | | | | |
Net investment income (loss)
(net of expense reduction) | | | 2.30 | %(d) | | | 2.28 | % | | | 1.52 | % | | | 0.67 | % | | | 1.85 | % | | | 1.59 | % |
| | | | | | | | | | | | | | | | | | | | | | | | |
Portfolio turnover rate | | | 18 | %(c) | | | 35 | % | | | 32 | % | | | 41 | % | | | 62 | % | | | 91 | % |
| | | | | | | | | | | | | | | | | | | | | | | | |
| (a) | Calculation based on average shares outstanding. |
| (b) | Return assumes the reinvestment of all dividends and distributions at net asset value. |
See accompanying notes to financial statements.
16
COHEN & STEERS REALTY SHARES, INC.
FINANCIAL HIGHLIGHTS (Unaudited)—(Continued)
| | | | | | | | | | | | | | | | | | | | | | | | |
| | | Class R | |
| | | For the Six
Months Ended
June 30, 2024 | | | For the Year Ended December 31, | | | For the Period
July 1, 2019(a)
through
December 31, 2019 | |
Per Share Operating Data: | | 2023 | | | 2022 | | | 2021 | | | 2020 | |
Net asset value, beginning of period | | | $63.52 | | | | $58.49 | | | | $83.47 | | | | $61.03 | | | | $66.13 | | | | $65.57 | |
| | | | | | | | | | | | | | | | | | | | | | | | |
Income (loss) from investment operations: | | | | | | | | | | | | | | | | | | | | | | | | |
| | | | | | |
Net investment income (loss)(b) | | | 0.39 | | | | 1.07 | | | | 0.82 | | | | 0.24 | | | | 0.80 | | | | 0.96 | |
| | | | | | |
Net realized and unrealized gain (loss) | | | (0.44 | ) | | | 5.90 | | | | (21.72 | ) | | | 25.13 | | | | (3.28 | ) | | | 5.20 | |
| | | | | | | | | | | | | | | | | | | | | | | | |
Total from investment operations | | | (0.05 | ) | | | 6.97 | | | | (20.90 | ) | | | 25.37 | | | | (2.48 | ) | | | 6.16 | |
| | | | | | | | | | | | | | | | | | | | | | | | |
Less dividends and distributions to shareholders from: | | | | | | | | | | | | | | | | | | | | | | | | |
| | | | | | |
Net investment income | | | (0.71 | ) | | | (1.17 | ) | | | (0.75 | ) | | | (0.40 | ) | | | (0.95 | ) | | | (0.73 | ) |
Net realized gain | | | — | | | | (0.77 | ) | | | (3.33 | ) | | | (2.53 | ) | | | (1.56 | ) | | | (4.87 | ) |
Tax return of capital | | | — | | | | — | | | | — | | | | — | | | | (0.11 | ) | | | — | |
| | | | | | | | | | | | | | | | | | | | | | | | |
Total dividends and distributions to shareholders | | | (0.71 | ) | | | (1.94 | ) | | | (4.08 | ) | | | (2.93 | ) | | | (2.62 | ) | | | (5.60 | ) |
| | | | | | | | | | | | | | | | | | | | | | | | |
Net increase (decrease) in net asset value | | | (0.76 | ) | | | 5.03 | | | | (24.98 | ) | | | 22.44 | | | | (5.10 | ) | | | 0.56 | |
| | | | | | | | | | | | | | | | | | | | | | | | |
Net asset value, end of period | | | $62.76 | | | | $63.52 | | | | $58.49 | | | | $83.47 | | | | $61.03 | | | | $66.13 | |
| | | | | | | | | | | | | | | | | | | | | | | | |
|
| | |
Total return(c) | | | –0.08 | %(d) | | | 12.20 | % | | | –25.28 | % | | | 42.02 | % | | | –3.31 | % | | | 9.55 | %(d) |
| | | | | | | | | | | | | | | | | | | | | | | | |
|
| | |
See accompanying notes to financial statements.
17
COHEN & STEERS REALTY SHARES, INC.
FINANCIAL HIGHLIGHTS (Unaudited)—(Continued)
| | | | | | | | | | | | | | | | | | | | | | | | |
| | | Class R | |
| | | For the Six
Months Ended
June 30, 2024 | | | For the Year Ended December 31, | | | For the Period
July 1, 2019(a)
through
December 31, 2019 | |
| | | 2023 | | | 2022 | | | 2021 | | | 2020 | |
Ratios/Supplemental Data: | | | | | | | | | | | | | | | | | | |
Net assets, end of period (in millions) | | | $0.6 | | | | $3.1 | | | | $5.2 | | | | $6.7 | | | | $2.5 | | | | $2.0 | |
| | | | | | | | | | | | | | | | | | | | | | | | |
Ratios to average daily net assets: | |
| | | | | | |
Expenses (before expense reduction) | | | 1.33 | %(e) | | | 1.34 | % | | | 1.33 | % | | | 1.33 | % | | | 1.37 | % | | | 1.35 | %(e) |
| | | | | | | | | | | | | | | | | | | | | | | | |
Expenses (net of expense reduction) | | | 1.30 | %(e) | | | 1.30 | % | | | 1.30 | % | | | 1.30 | % | | | 1.30 | % | | | 1.30 | %(e) |
| | | | | | | | | | | | | | | | | | | | | | | | |
Net investment income (loss) (before expense reduction) | | | 1.25 | %(e) | | | 1.75 | % | | | 1.16 | % | | | 0.30 | % | | | 1.31 | % | | | 3.10 | %(e)(f) |
| | | | | | | | | | | | | | | | | | | | | | | | |
Net investment income (loss) (net of expense reduction) | | | 1.28 | %(e) | | | 1.79 | % | | | 1.19 | % | | | 0.33 | % | | | 1.38 | % | | | 3.15 | %(e)(f) |
| | | | | | | | | | | | | | | | | | | | | | | | |
Portfolio turnover rate | | | 18 | %(d) | | | 35 | % | | | 32 | % | | | 41 | % | | | 62 | % | | | 91 | %(d) |
| | | | | | | | | | | | | | | | | | | | | | | | |
| (b) | Calculation based on average shares outstanding. |
| (c) | Return assumes the reinvestment of all dividends and distributions at net asset value. |
| (f) | The annualized ratios of net investment income to average daily net assets may not be indicative of operating results for a full year. |
See accompanying notes to financial statements.
18
COHEN & STEERS REALTY SHARES, INC.
FINANCIAL HIGHLIGHTS (Unaudited)—(Continued)
| | | | | | | | | | | | | | | | | | | | | | | | |
| | | Class Z | |
| | | For the Six
Months Ended
June 30, 2024 | | | For the Year Ended December 31, | | | For the Period
July 1, 2019(a)
through
December 31, 2019 | |
Per Share Operating Data: | | 2023 | | | 2022 | | | 2021 | | | 2020 | |
Net asset value, beginning of period | | | $63.56 | | | | $58.54 | | | | $83.55 | | | | $61.06 | | | | $66.17 | | | | $65.57 | |
| | | | | | | | | | | | | | | | | | | | | | | | |
Income (loss) from investment operations: | | | | | | | | | | | | | | | | | | | | | | | | |
| | | | | | |
Net investment income (loss)(b) | | | 0.74 | | | | 1.43 | | | | 1.24 | | | | 0.73 | | | | 1.84 | | | | 1.62 | |
| | | | | | |
Net realized and unrealized gain (loss) | | | (0.64 | ) | | | 5.84 | | | | (21.82 | ) | | | 25.03 | | | | (4.04 | ) | | | 4.70 | |
| | | | | | | | | | | | | | | | | | | | | | | | |
Total from investment operations | | | 0.10 | | | | 7.27 | | | | (20.58 | ) | | | 25.76 | | | | (2.20 | ) | | | 6.32 | |
| | | | | | | | | | | | | | | | | | | | | | | | |
Less dividends and distributions to shareholders from: | | | | | | | | | | | | | | | | | | | | | | | | |
| | | | | | |
Net investment income | | | (0.96 | ) | | | (1.48 | ) | | | (1.10 | ) | | | (0.74 | ) | | | (1.24 | ) | | | (0.85 | ) |
Net realized gain | | | — | | | | (0.77 | ) | | | (3.33 | ) | | | (2.53 | ) | | | (1.56 | ) | | | (4.87 | ) |
Tax return of capital | | | — | | | | — | | | | — | | | | — | | | | (0.11 | ) | | | — | |
| | | | | | | | | | | | | | | | | | | | | | | | |
Total dividends and distributions to shareholders | | | (0.96 | ) | | | (2.25 | ) | | | (4.43 | ) | | | (3.27 | ) | | | (2.91 | ) | | | (5.72 | ) |
| | | | | | | | | | | | | | | | | | | | | | | | |
Net increase (decrease) in net asset value | | | (0.86 | ) | | | 5.02 | | | | (25.01 | ) | | | 22.49 | | | | (5.11 | ) | | | 0.60 | |
| | | | | | | | | | | | | | | | | | | | | | | | |
Net asset value, end of period | | | $62.70 | | | | $63.56 | | | | $58.54 | | | | $83.55 | | | | $61.06 | | | | $66.17 | |
| | | | | | | | | | | | | | | | | | | | | | | | |
| | | | | | |
| | | | | | | | | | | | | | | | | | | | | | | | | |
Total return(c) | | | 0.17 | %(d) | | | 12.76 | % | | | –24.90 | % | | | 42.73 | % | | | –2.81 | % | | | 9.80 | %(d) |
| | | | | | | | | | | | | | | | | | | | | | | | |
| | | | | | |
| | | | | | | | | | | | | | | | | | | | | | | | | |
See accompanying notes to financial statements.
19
COHEN & STEERS REALTY SHARES, INC.
FINANCIAL HIGHLIGHTS (Unaudited)—(Continued)
| | | | | | | | | | | | | | | | | | | | | | | | |
| | | Class Z | |
| | | For the Six
Months Ended
June 30, 2024 | | | For the Year Ended December 31, | | | For the Period
July 1, 2019(a)
through
December 31, 2019 | |
| | | 2023 | | | 2022 | | | 2021 | | | 2020 | |
Ratios/Supplemental Data: | | | | | | | | | | | | | | | | | | |
Net assets, end of period (in millions) | | | $188.9 | | | | $179.4 | | | | $139.6 | | | | $112.4 | | | | $39.4 | | | | $0.5 | |
| | | | | | | | | | | | | | | | | | | | | | | | |
Ratios to average daily net assets: | |
| | | | | | |
Expenses (before expense reduction) | | | 0.83 | %(e) | | | 0.84 | % | | | 0.83 | % | | | 0.83 | % | | | 0.87 | % | | | 0.85 | %(e) |
| | | | | | | | | | | | | | | | | | | | | | | | |
Expenses (net of expense reduction) | | | 0.80 | %(e) | | | 0.80 | % | | | 0.80 | % | | | 0.80 | % | | | 0.80 | % | | | 0.80 | %(e) |
| | | | | | | | | | | | | | | | | | | | | | | | |
Net investment income (loss) (before expense reduction) | | | 2.41 | %(e) | | | 2.37 | % | | | 1.78 | % | | | 0.96 | % | | | 3.13 | % | | | 5.09 | %(e)(f) |
| | | | | | | | | | | | | | | | | | | | | | | | |
Net investment income (loss) (net of expense reduction) | | | 2.44 | %(e) | | | 2.41 | % | | | 1.81 | % | | | 0.99 | % | | | 3.20 | % | | | 5.14 | %(e)(f) |
| | | | | | | | | | | | | | | | | | | | | | | | |
Portfolio turnover rate | | | 18 | %(d) | | | 35 | % | | | 32 | % | | | 41 | % | | | 62 | % | | | 91 | %(d) |
| | | | | | | | | | | | | | | | | | | | | | | | |
| (b) | Calculation based on average shares outstanding. |
| (c) | Return assumes the reinvestment of all dividends and distributions at net asset value. |
| (f) | The annualized ratios of net investment income to average daily net assets may not be indicative of operating results for a full year. |
See accompanying notes to financial statements.
20
COHEN & STEERS REALTY SHARES, INC.
NOTES TO FINANCIAL STATEMENTS (Unaudited)
Note 1. Organization and Significant Accounting Policies
Cohen & Steers Realty Shares, Inc. (the Fund) was incorporated under the laws of the State of Maryland on April 26, 1991 and is registered under the Investment Company Act of 1940 (the 1940 Act) as a non-diversified, open-end management investment company. The Fund’s investment objective is total return through investment in real estate securities. The authorized shares of the Fund are divided into seven classes designated Class A, C, F, I, L, R and Z shares. Each of the Fund’s shares has equal dividend, liquidation and voting rights (except for matters relating to distribution and shareholder servicing of such shares). Class F shares are currently not available for purchase.
The following is a summary of significant accounting policies consistently followed by the Fund in the preparation of its financial statements. The Fund is an investment company and, accordingly, follows the investment company accounting and reporting guidance of the Financial Accounting Standards Board Accounting Standards Codification (ASC) Topic 946—Investment Companies. The accounting policies of the Fund are in conformity with accounting principles generally accepted in the United States of America (GAAP). The preparation of the financial statements in accordance with GAAP requires management to make estimates and assumptions that affect the reported amounts of assets and liabilities at the date of the financial statements and the reported amounts of income and expenses during the reporting period. Actual results could differ from those estimates.
Portfolio Valuation: Investments in securities that are listed on the New York Stock Exchange (NYSE) are valued, except as indicated below, at the last sale price reflected at the close of the NYSE on the business day as of which such value is being determined. If there has been no sale on such day, the securities are valued at the mean of the closing bid and ask prices on such day or, if no ask price is available, at the bid price.
Securities not listed on the NYSE but listed on other domestic or foreign securities exchanges are valued in a similar manner. Securities traded on more than one securities exchange are valued at the last sale price reflected at the close of the exchange representing the principal market for such securities on the business day as of which such value is being determined.
Readily marketable securities traded in the over-the-counter (OTC) market, including listed securities whose primary market is believed by Cohen & Steers Capital Management, Inc. (the investment advisor) to be OTC, are valued on the basis of prices provided by a third-party pricing service or third-party broker-dealers when such prices are believed by the investment advisor, pursuant to delegation by the Board of Directors, to reflect the fair value of such securities.
Short-term debt securities with a maturity date of 60 days or less are valued at amortized cost, which approximates fair value. Investments in open-end mutual funds are valued at net asset value (NAV).
The Board of Directors has designated the investment advisor as the Fund’s “Valuation Designee” under Rule 2a-5 under the 1940 Act. As Valuation Designee, the investment advisor is authorized to make fair valuation determinations, subject to the oversight of the Board of Directors. The investment advisor has established a valuation committee (Valuation Committee) to administer, implement and oversee the fair valuation process according to the policies and procedures approved annually by the Board of Directors. Among other things, these procedures allow the Fund to utilize independent pricing
21
COHEN & STEERS REALTY SHARES, INC.
NOTES TO FINANCIAL STATEMENTS (Unaudited)—(Continued)
services, quotations from securities and financial instrument dealers and other market sources to determine fair value.
Securities for which market prices are unavailable, or securities for which the investment advisor determines that the bid and/or ask price or a counterparty valuation does not reflect market value, will be valued at fair value, as determined in good faith by the Valuation Committee, pursuant to procedures approved by the Fund’s Board of Directors. Circumstances in which market prices may be unavailable include, but are not limited to, when trading in a security is suspended, the exchange on which the security is traded is subject to an unscheduled close or disruption or material events occur after the close of the exchange on which the security is principally traded. In these circumstances, the Fund determines fair value in a manner that fairly reflects the market value of the security on the valuation date based on consideration of any information or factors it deems appropriate. These may include, but are not limited to, recent transactions in comparable securities, information relating to the specific security and developments in the markets.
For equity securities, including restricted securities, where observable inputs are limited, assumptions about market activity and risk are used and these securities are categorized as Level 2 or 3 in the hierarchy, depending on the relative significance of the valuation inputs. Securities, including private placements or other restricted securities, for which observable inputs are not available are valued using alternate valuation approaches, including the market approach, the income approach and cost approach, and are categorized as Level 3 in the hierarchy. The market approach considers factors including the price of recent investments in the same or a similar security or financial metrics of comparable securities. The income approach considers factors including expected future cash flows, security specific risks and corresponding discount rates. The cost approach considers factors including the value of the security’s underlying assets and liabilities.
The Fund’s use of fair value pricing may cause the NAV of Fund shares to differ from the NAV that would be calculated using market quotations. Fair value pricing involves subjective judgments and it is possible that the fair value determined for a security may be materially different than the value that could be realized upon the sale of that security.
Fair value is defined as the price that the Fund would expect to receive upon the sale of an investment or expect to pay to transfer a liability in an orderly transaction with an independent buyer in the principal market or, in the absence of a principal market, the most advantageous market for the investment or liability. The hierarchy of inputs that are used in determining the fair value of the Fund’s investments is summarized below.
| | • | | Level 1—quoted prices in active markets for identical investments |
| | • | | Level 2—other significant observable inputs (including quoted prices for similar investments, interest rates, credit risk, etc.) |
| | • | | Level 3—significant unobservable inputs (including the Fund’s own assumptions in determining the fair value of investments) |
The inputs or methodology used for valuing investments may or may not be an indication of the risk associated with those investments. Changes in valuation techniques may result in transfers into or out of an assigned level within the disclosure hierarchy.
22
COHEN & STEERS REALTY SHARES, INC.
NOTES TO FINANCIAL STATEMENTS (Unaudited)—(Continued)
The following is a summary of the inputs used as of June 30, 2024 in valuing the Fund’s investments carried at value:
| | | | | | | | | | | | | | | | |
| | | Quoted Prices
in Active
Markets for
Identical
Investments
(Level 1) | | | Other
Significant
Observable
Inputs
(Level 2) | | | Significant
Unobservable
Inputs
(Level 3) | | | Total | |
Common Stock—Real Estate: | | | | | | | | | | | | | | | | |
Industrials | | $ | 543,320,055 | | | $ | — | | | $ | 47,370,443 | (a) | | $ | 590,690,498 | |
Other Industries | | | 4,839,196,288 | | | | — | | | | — | | | | 4,839,196,288 | |
Short-Term Investments | | | — | | | | 76,375,943 | | | | — | | | | 76,375,943 | |
| | | | | | | | | | | | | | | | |
Total Investments in Securities(b) | | $ | 5,382,516,343 | | | $ | 76,375,943 | | | $ | 47,370,443 | | | $ | 5,506,262,729 | |
| | | | | | | | | | | | | | | | |
| (a) | Restricted security, where observable inputs are limited, has been fair valued by the Valuation Committee, pursuant to the Fund’s fair value procedures and classified as Level 3 security. |
| (b) | Portfolio holdings are disclosed individually on the Schedule of Investments. |
The following is a reconciliation of investments for which significant unobservable inputs (Level 3) were used in determining fair value:
| | | | | | | | | | | | |
| | | Balance
as of
December 31, 2023 | | | Change in
unrealized
appreciation
(depreciation) | | | Balance
as of
June 30, 2024 | |
Common Stock—Real Estate—Industrials | | $ | 52,713,011 | | | $ | (5,342,568 | ) | | $ | 47,370,443 | |
The change in unrealized appreciation (depreciation) attributable to securities owned on June 30, 2024 which were valued using significant unobservable inputs (Level 3) amounted to $(5,342,568).
The following table summarizes the quantitative inputs and assumptions used for investments categorized in Level 3 of the fair value hierarchy.
| | | | | | | | | | | | | | |
| | | Fair Value at
June 30, 2024 | | | Valuation
Technique | | Unobservable
Inputs | | Amount | | | Valuation Impact
from an Increase
in Input(a) |
Common Stock—
Real Estate—
Industrials | | $ | 47,370,443 | | | Market
Comparable
Companies | | Enterprise Value/
EBITDA(b) Multiple | | | 19.3x | | | Increase |
| (a) | Represents the directional change in the fair value of the Level 3 investments that could have resulted from an increase in the corresponding input as of period end. A decrease to the unobservable input would have had the opposite effect. Significant changes in these inputs may result in a materially higher or lower fair value measurement. |
| (b) | Earnings Before Interest, Taxes, Depreciation and Amortization. |
23
COHEN & STEERS REALTY SHARES, INC.
NOTES TO FINANCIAL STATEMENTS (Unaudited)—(Continued)
Security Transactions, Investment Income and Expense Allocations: Security transactions are recorded on trade date. Realized gains and losses on investments sold are recorded on the basis of identified cost. Interest income, which includes the amortization of premiums and accretion of discounts, is recorded on the accrual basis. Dividend income is recorded on the ex-dividend date. Distributions from REITs are recorded as ordinary income, net realized capital gain or return of capital based on information reported by the REITs and management’s estimates of such amounts based on historical information. These estimates are adjusted when the actual source of distributions is disclosed by the REITs and actual amounts may differ from the estimated amounts. Income, expenses (other than expenses attributable to a specific class) and realized and unrealized gains or losses on investments are allocated to each class of shares based on its relative net assets.
Dividends and Distributions to Shareholders: Dividends from net investment income and capital gain distributions are determined in accordance with U.S. federal income tax regulations, which may differ from GAAP. Dividends from net investment income, if any, are declared and paid quarterly. Net realized capital gains, unless offset by any available capital loss carryforward, are typically distributed to shareholders at least annually. Dividends and distributions to shareholders are recorded on the ex-dividend date and are automatically reinvested in full and fractional shares of the Fund based on the NAV per share at the close of business on the payable date, unless the shareholder has elected to have them paid in cash.
Dividends from net investment income are subject to recharacterization for tax purposes. Based upon the results of operations for the six months ended June 30, 2024, the investment advisor considers it likely that, a portion of the dividends will be reclassified to distributions from tax return of capital upon the final determination of the Fund’s taxable income after December 31, 2024, the Fund’s fiscal year end.
Income Taxes: It is the policy of the Fund to continue to qualify as a regulated investment company (RIC), if such qualification is in the best interest of the shareholders, by complying with the requirements of Subchapter M of the Internal Revenue Code applicable to RICs, and by distributing substantially all of its taxable earnings to its shareholders. Also, in order to avoid the payment of any federal excise taxes, the Fund will distribute substantially all of its net investment income and net realized gains on a calendar year basis. Accordingly, no provision for federal income or excise tax is necessary. Management has analyzed the Fund’s tax positions taken on federal and applicable state income tax returns as well as its tax positions in non-U.S. jurisdictions in which it trades for all open tax year and has concluded that as of June 30, 2024, no additional provisions for income tax are required in the Fund’s financial statements. The Fund’s tax positions for the tax year for which the applicable statutes of limitations have not expired are subject to examination by the Internal Revenue Service, state departments of revenue and by foreign tax authorities.
Note 2. Investment Advisory, Administration Fees and Other Transactions with Affiliates
Investment Advisory Fees: Cohen & Steers Capital Management, Inc. serves as the Fund’s investment advisor pursuant to an investment advisory agreement (the investment advisory agreement). Under the terms of the investment advisory agreement, the investment advisor provides the Fund with day-to-day investment decisions and generally manages the Fund’s investments in accordance with the stated policies of the Fund, subject to the supervision of the Board of Directors.
24
COHEN & STEERS REALTY SHARES, INC.
NOTES TO FINANCIAL STATEMENTS (Unaudited)—(Continued)
For the services provided to the Fund, the investment advisor receives a fee, accrued daily and paid monthly, at the annual rate of 0.75% of the average daily net assets of the Fund up to $8.5 billion and 0.70% of such assets in excess of $8.5 billion.
For the six months ended June 30, 2024 and through June 30, 2026, the investment advisor has contractually agreed to waive its fee and/or reimburse expenses so that the Fund’s total annual operating expenses (excluding acquired fund fees and expenses, taxes and extraordinary expenses), do not exceed 1.15% for Class A shares, 1.80% for Class C shares, 0.88% for Class I shares, 0.88% for Class L shares, 1.30% for Class R shares and 0.80% for Class Z shares. This contractual agreement can only be amended or terminated by agreement of the Fund’s Board of Directors and the investment advisor and will terminate automatically in the event of termination of the investment advisory agreement between the investment advisor and the Fund. For the six months ended June 30, 2024, fees waived and/or expenses reimbursed totaled $1,232,173.
Administration Fees: The Fund has entered into an administration agreement with the investment advisor under which the investment advisor performs certain administrative functions for the Fund and receives a fee, accrued daily and paid monthly, at the annual rate of 0.04% of the average daily net assets of the Fund. For the six months ended June 30, 2024, the Fund incurred $1,075,135 in fees under this administration agreement. Additionally, the Fund pays State Street Bank and Trust Company as co-administrator under a fund accounting and administration agreement.
Distribution Fees: Shares of the Fund are distributed by Cohen & Steers Securities, LLC (the distributor), an affiliated entity of the investment advisor. The Fund has adopted a distribution and service plan (the plan) pursuant to Rule 12b-1 under the 1940 Act, which allows the Fund to pay distribution fees for the sale and distribution of its shares. The plan provides that the Fund will pay the distributor a fee, accrued daily and paid monthly, at an annual rate of up to 0.25% of the average daily net assets attributable to Class A shares, up to 0.75% of the average daily net assets attributable to Class C shares and up to 0.50% of the average daily net assets attributable to Class R shares. In addition, with respect to Class R shares, such amounts may also be used to pay for services to Fund shareholders or services related to the maintenance of shareholder accounts.
There is a maximum initial sales charge of 4.50% for Class A shares. There is a maximum contingent deferred sales charge (CDSC) of 1.00% on purchases of $1 million or more of Class A shares, which applies if redemption occurs within one year from purchase. There is a CDSC of 1.00% on Class C shares, which applies if redemption occurs within one year from purchase. For the six months ended June 30, 2024, the Fund has been advised that the distributor received $6,932, which represents a portion of the sales commissions paid by shareholders from the sale of Class A shares, and $1,255 of CDSC relating to redemptions of Class C shares. The distributor has advised the Fund that proceeds from the CDSC on these classes will be used by the distributor to defray its expenses related to providing distribution-related services to the Fund in connection with the sale of these classes, including payments to dealers and other financial intermediaries for selling these classes. The payment of a CDSC may result in the distributor receiving amounts greater or less than the upfront commission paid by the distributor to the financial intermediary.
25
COHEN & STEERS REALTY SHARES, INC.
NOTES TO FINANCIAL STATEMENTS (Unaudited)—(Continued)
Shareholder Servicing Fees: For shareholder services, the Fund pays the distributor or its affiliates a fee, accrued daily, at an annual rate of up to 0.10%, 0.25%, 0.10% and 0.10% of the average daily net assets attributable to the Fund’s Class A, Class C, Class I and Class L shares, respectively. The distributor is responsible for paying qualified financial institutions for shareholder services.
Directors’ and Officers’ Fees: Certain directors and officers of the Fund are also directors, officers and/or employees of the investment advisor. The Fund does not pay compensation to directors and officers affiliated with the investment advisor except for the Chief Compliance Officer, who received compensation from the investment advisor, which was reimbursed by the Fund, in the amount of $14,059 for the six months ended June 30, 2024.
Note 3. Purchases and Sales of Securities
Purchases and sales of securities, excluding short-term investments, for the six months ended June 30, 2024, totaled $947,114,400 and $957,138,375, respectively.
Note 4. Income Tax Information
As of June 30, 2024, the federal tax cost and net unrealized appreciation (depreciation) in value of investments held were as follows:
| | | | |
Cost of investments in securities for federal income tax purposes | | $ | 4,642,935,076 | |
| | | | |
Gross unrealized appreciation on investments | | $ | 1,116,947,637 | |
Gross unrealized depreciation on investments | | | (253,619,984 | ) |
| | | | |
Net unrealized appreciation (depreciation) on investments | | $ | 863,327,653 | |
| | | | |
The Fund incurred short-term capital loss of $15,399,448 and long-term capital loss of $43,754,383 after October 31, 2023 that it has elected to defer to the following year.
Note 5. Capital Stock
The Fund is authorized to issue 700 million shares of capital stock, at a par value of $0.001 per share, classified in seven classes as follows: 100 million of Class A capital stock, 50 million of Class C capital stock, 50 million of Class F capital stock, 200 million of Class I capital stock, 200 million of Class L capital stock, 50 million of Class R capital stock and 50 million of Class Z capital stock. Class F shares are currently not available for purchase. The Board of Directors of the Fund may increase or decrease the aggregate number of shares of common stock that the Fund has authority to issue. With
26
COHEN & STEERS REALTY SHARES, INC.
NOTES TO FINANCIAL STATEMENTS (Unaudited)—(Continued)
the exception of Class C shares held through certain intermediaries, Class C shares will automatically convert into Class A shares on a monthly basis approximately eight years after the original date of purchase. Transactions in Fund shares were as follows:
| | | | | | | | | | | | | | | | |
| | | For the
Six Months Ended
June 30, 2024 | | | For the
Year Ended
December 31, 2023 | |
| | | Shares | | | Amount | | | Shares | | | Amount | |
Class A: | |
Sold | | | 231,080 | | | $ | 14,140,132 | | | | 994,576 | | | $ | 57,696,626 | |
Issued as reinvestment of dividends and distributions | | | 16,031 | | | | 1,004,596 | | | | 43,234 | | | | 2,559,221 | |
Redeemed | | | (228,017 | ) | | | (13,958,258 | ) | | | (1,047,403 | ) | | | (61,604,261 | ) |
| | | | | | | | | | | | | | | | |
Net increase (decrease) | | | 19,094 | | | $ | 1,186,470 | | | | (9,593 | ) | | $ | (1,348,414 | ) |
| | | | | | | | | | | | | | | | |
| | | | |
Class C: | | | | | | | | | | | | | | | | |
Sold | | | 18,836 | | | $ | 1,141,215 | | | | 55,684 | | | $ | 3,336,566 | |
Issued as reinvestment of dividends and distributions | | | 2,563 | | | | 159,994 | | | | 7,949 | | | | 469,206 | |
Redeemed | | | (46,328 | ) | | | (2,827,937 | ) | | | (108,416 | ) | | | (6,445,286 | ) |
| | | | | | | | | | | | | | | | |
Net increase (decrease) | | | (24,929 | ) | | $ | (1,526,728 | ) | | | (44,783 | ) | | $ | (2,639,514 | ) |
| | | | | | | | | | | | | | | | |
| | | | |
Class I: | | | | | | | | | | | | | | | | |
Sold | | | 6,139,776 | | | $ | 376,130,852 | | | | 13,667,872 | | | $ | 806,716,256 | |
Issued as reinvestment of dividends and distributions | | | 402,071 | | | | 25,175,693 | | | | 882,189 | | | | 52,144,941 | |
Redeemed | | | (4,624,532 | ) | | | (281,353,977 | ) | | | (10,154,526 | ) | | | (594,282,097 | ) |
| | | | | | | | | | | | | | | | |
Net increase (decrease) | | | 1,917,315 | | | $ | 119,952,568 | | | | 4,395,535 | | | $ | 264,579,100 | |
| | | | | | | | | | | | | | | | |
| | | | |
Class L: | | | | | | | | | | | | | | | | |
Sold | | | 4,559,986 | | | $ | 279,000,886 | | | | 9,106,713 | | | $ | 540,454,082 | |
Issued as reinvestment of dividends and distributions | | | 792,237 | | | | 49,626,240 | | | | 2,108,789 | | | | 124,629,361 | |
Redeemed | | | (7,443,863 | ) | | | (455,537,706 | ) | | | (16,108,155 | ) | | | (950,380,045 | ) |
| | | | | | | | | | | | | | | | |
Net increase (decrease) | | | (2,091,640 | ) | | $ | (126,910,580 | ) | | | (4,892,653 | ) | | $ | (285,296,602 | ) |
| | | | | | | | | | | | | | | | |
27
COHEN & STEERS REALTY SHARES, INC.
NOTES TO FINANCIAL STATEMENTS (Unaudited)—(Continued)
| | | | | | | | | | | | | | | | |
| | | For the
Six Months Ended
June 30, 2024 | | | For the
Year Ended
December 31, 2023 | |
| | | Shares | | | Amount | | | Shares | | | Amount | |
| | | | |
Class R: | | | | | | | | | | | | | | | | |
Sold | | | 2,066 | | | $ | 126,243 | | | | 13,959 | | | $ | 837,205 | |
Issued as reinvestment of dividends and distributions | | | 240 | | | | 15,068 | | | | 2,068 | | | | 122,995 | |
Redeemed | | | (40,861 | ) | | | (2,482,625 | ) | | | (56,842 | ) | | | (3,496,162 | ) |
| | | | | | | | | | | | | | | | |
Net increase (decrease) | | | (38,555 | ) | | $ | (2,341,314 | ) | | | (40,815 | ) | | $ | (2,535,962 | ) |
| | | | | | | | | | | | | | | | |
| | | | |
Class Z: | | | | | | | | | | | | | | | | |
Sold | | | 729,664 | | | $ | 45,011,303 | | | | 1,457,154 | | | $ | 87,083,969 | |
Issued as reinvestment of dividends and distributions | | | 44,179 | | | | 2,772,448 | | | | 104,409 | | | | 6,179,988 | |
Redeemed | | | (582,534 | ) | | | (35,692,398 | ) | | | (1,123,960 | ) | | | (66,478,114 | ) |
| | | | | | | | | | | | | | | | |
Net increase (decrease) | | | 191,309 | | | $ | 12,091,353 | | | | 437,603 | | | $ | 26,785,843 | |
| | | | | | | | | | | | | | | | |
Note 6. Other Risks
Common Stock Risk: While common stocks have historically generated higher average returns than fixed-income securities over the long-term, common stocks have also experienced significantly more volatility in those returns, although under certain market conditions, fixed-income investments may have comparable or greater price volatility. The value of common stocks and other equity securities will fluctuate in response to developments concerning the company, political and regulatory circumstances, the stock market, and the economy. In the short term, stock prices can fluctuate dramatically in response to these developments. Different parts of the market and different types of equity securities can react differently to these developments. For example, stocks of large companies can react differently than stocks of smaller companies, and value stocks (stocks of companies that are undervalued by various measures and have potential for long-term capital appreciation), can react differently from growth stocks (stocks of companies with attractive cash flow returns on invested capital and earnings that are expected to grow). These developments can affect a single company, all companies within the same industry, economic sector or geographic region, or the stock market as a whole.
Real Estate Market Risk: Since the Fund concentrates its assets in companies engaged in the real estate industry, an investment in the Fund will be closely linked to the performance of the real estate markets. Risks of investing in real estate securities include falling property values due to increasing vacancies, declining rents resulting from economic, legal, tax, political or technological developments, lack of liquidity, limited diversification, and sensitivity to certain economic factors such as interest-rate changes and market recessions. Real estate company prices also may drop because of the failure of borrowers to pay their loans and poor management, and residential developers, in particular, could be
28
COHEN & STEERS REALTY SHARES, INC.
NOTES TO FINANCIAL STATEMENTS (Unaudited)—(Continued)
negatively impacted by falling home prices, slower mortgage origination and rising construction costs. The risks of investing in REITs are similar to those associated with direct investments in real estate securities.
REIT Risk: In addition to the risks of securities linked to the real estate industry, REITs are subject to certain other risks related to their structure and focus. REITs are dependent upon management skills and generally may not be diversified. REITs are also subject to heavy cash flow dependency, defaults by borrowers and self-liquidation. In addition, REITs could possibly fail to (i) qualify for pass-through of income under applicable tax law, or (ii) maintain their exemptions from registration under the 1940 Act. The above factors may also adversely affect a borrower’s or a lessee’s ability to meet its obligations to the REIT. In the event of a default by a borrower or lessee, the REIT may experience delays in enforcing its rights as a mortgagee or lessor and may incur substantial costs associated with protecting its investments.
Small- and Medium-Sized Companies Risk: Real estate companies in the industry tend to be small- to medium-sized companies in relation to the equity markets as a whole. There may be less trading in a smaller company’s stock, which means that buy and sell transactions in that stock could have a larger impact on the stock’s price than is the case with larger company stocks. Smaller companies also may have fewer lines of business so that changes in any one line of business may have a greater impact on a smaller company’s stock price than is the case for a larger company. Further, smaller company stocks may perform differently in different cycles than larger company stocks. Accordingly, real estate company shares can, and at times will, perform differently than large company stocks.
Non-Diversification Risk: As a “non-diversified” investment company, the Fund can invest in fewer individual companies than a diversified investment company. As a result, the Fund is more susceptible to any single political, regulatory or economic occurrence and to the financial condition of individual issuers in which it invests. The Fund’s relative lack of diversity may subject investors to greater risk of loss than a fund that has a diversified portfolio.
Geopolitical Risk: Geopolitical events, such as war (including Russia’s military invasion of Ukraine), terrorist attacks, natural or environmental disasters, country instability, public health emergencies (including epidemics and pandemics), market instability, debt crises and downgrades, embargoes, tariffs, sanctions and other trade barriers and other governmental trade or market control programs, the potential exit of a country from its respective union (such as Brexit) and related geopolitical events, have led and may in the future lead to market volatility and have long-lasting impacts on U.S. and global economies and financial markets. Supply chain disruptions or significant changes in the supply or prices of commodities or other economic inputs may have material and unexpected effects on both global securities markets and individual countries, regions, sectors, companies or industries. Events occurring in one region of the world may negatively impact industries and regions that are not otherwise directly impacted by the events. Additionally, those events, as well as other changes in foreign and domestic political and economic conditions, could adversely affect individual issuers or related groups of issuers, securities markets, interest rates, secondary trading, credit ratings, inflation, investor sentiment and other factors affecting the value of the Fund’s investments.
29
COHEN & STEERS REALTY SHARES, INC.
NOTES TO FINANCIAL STATEMENTS (Unaudited)—(Continued)
Russia’s military invasion of Ukraine has significantly amplified already existing geopolitical tensions. The United States and many other countries have instituted various economic sanctions against Russia, Russian individuals and entities and Belarus. The extent and duration of the military action, sanctions imposed and other punitive actions taken (including any Russian retaliatory responses to such sanctions and actions), and resulting disruptions in Europe and globally cannot be predicted, but could be significant and have a severe adverse effect on the global economy, securities markets and commodities markets globally, including through global supply chain disruptions, increased inflationary pressures and reduced economic activity. Ongoing conflicts in the Middle East could have similar negative impacts.
Systemic risk events in the financial sectors and/or resulting government actions can negatively impact the Fund. For example, issues with certain regional U.S. banks and other financial institutions in March 2023 raised economic concerns over disruption in the U.S. banking system. These risks also may adversely affect financial intermediaries, such as clearing agencies, clearing houses, banks, securities firms, and exchanges, with which the Fund interacts. There can be no certainty that any actions taken by the U.S. government to strengthen public confidence in the U.S. banking system or financial markets will be effective in mitigating the effects of financial institution failures on the economy and restoring or maintaining public confidence. The strengthening or weakening of the U.S. dollar relative to other currencies may, among other things, adversely affect the Fund’s investments denominated in non-U.S. dollar currencies. It is difficult to predict when similar events affecting the U.S. or global financial markets may occur, the effects that such events may have, and the duration of those effects.
The rapid development and increasingly widespread use and regulation of artificial intelligence, including machine learning technology and generative artificial intelligence such as ChatGPT (collectively, AI Technologies), may pose risks to the Fund. For instance, the global economy may be significantly disrupted or otherwise adversely impacted by the rapid advanced development of AI Technologies and by efforts to regulate or control its use and advancement. The legal and regulatory frameworks within which AI Technologies operate continue to rapidly evolve, and it is not possible to predict the full extent of current or future risks related thereto.
Some political leaders around the world (including in the U.S. and certain European nations) have been elected on protectionist platforms, raising questions about the future of global free trade. Global trade disruption, significant introductions of trade barriers and bilateral trade frictions, together with any future downturns in the global economy resulting therefrom, could adversely affect the financial performance of the Fund and its investments.
Regulatory Risk: Legal and regulatory developments may adversely affect the Fund. The regulatory environment for the Fund is evolving, and changes in the regulation of investment funds and other financial institutions or products (such as banking or insurance products), and their trading activities and capital markets, or a regulator’s disagreement with the Fund’s interpretation of the application of certain regulations, may adversely affect the ability of the Fund to pursue its investment strategy, its ability to obtain leverage and financing, and the value of investments held by the Fund. The U.S. government has proposed and adopted multiple regulations that could have a long-lasting impact on the Fund and on the fund industry in general.
30
COHEN & STEERS REALTY SHARES, INC.
NOTES TO FINANCIAL STATEMENTS (Unaudited)—(Continued)
New rules and rule amendments proposed by the U.S. Securities and Exchange Commission (SEC) could restrict the Fund’s ability to engage in transactions, impact flows into the Fund, and/or increase overall expenses of the Fund. For example, recent regulations intended to modernize shareholder reporting by open-end funds and proposed rule amendments to improve cybersecurity risk management may increase administrative costs and operational burdens in the near or long term. In addition, the SEC has proposed amendments to Rule 22e-4 under the 1940 Act, that, if adopted as proposed, would, among other things, cause more investments to be treated as illiquid and could prevent the Fund from investing in securities that the investment advisor believes are appropriate or desirable.
In May 2024, the standard settlement cycle for numerous types of U.S. securities, including Fund shares and many of the securities the Fund invests in, moved from two business days after the transaction date (T+2) to the next business day after the transaction date (T+1). This reduced settlement cycle may result in additional risks and costs to the Fund, including increased operational risks associated with the resolution of trade breaks and exceptions. These risks will be heightened in light of certain Fund investments (such as certain non-U.S. securities) that have longer settlement cycles than is expected of Fund shares.
Additional legislative or regulatory actions to address perceived liquidity or other issues in markets generally, or in particular markets such as the fixed income securities markets and municipal securities markets, may alter or impair certain market participants’ ability to utilize certain investment strategies and techniques.
The Fund and the instruments in which it invests may be subject to new or additional regulatory constraints in the future. While the full extent of all of these regulations is still unclear, these regulations and actions may adversely affect both the Fund and the instruments in which the Fund invests and its ability to execute its investment strategy. For example, climate change regulation (such as decarbonization legislation, other mandatory controls to reduce emissions of greenhouse gases, or related disclosure requirements) could significantly affect the Fund or its investments by, among other things, increasing compliance costs or underlying companies’ operating costs and capital expenditures. Similarly, regulatory developments in other countries may have an unpredictable and adverse impact on the Fund.
Large Shareholder Risk: The Fund may have one or more large shareholders or a group of shareholders investing in Fund shares indirectly through an account, platform or program sponsored by a financial institution. Investment and asset allocation decisions by such financial institutions regarding the account, platform or program through which multiple shareholders invest may result in subscription and redemption decisions that have a significant impact on the assets, expenses and trading activities of the Fund. Such a decision may cause the Fund to sell assets (or invest cash) at disadvantageous times or prices, increase or accelerate taxable gains or transaction costs and may negatively affect the Fund’s NAV, performance, or ability to satisfy redemptions in a timely manner.
This is not a complete list of the risks of investing in the Fund. For additional information concerning the risks of investing in the Fund, please consult the Fund’s prospectus.
31
COHEN & STEERS REALTY SHARES, INC.
NOTES TO FINANCIAL STATEMENTS (Unaudited)—(Continued)
Note 7. Other
In the normal course of business, the Fund enters into contracts that provide general indemnifications. The Fund’s maximum exposure under these arrangements is dependent on claims that may be made against the Fund in the future and, therefore, cannot be estimated; however, based on experience, the risk of material loss from such claims is considered remote.
Note 8. Subsequent Events
Management has evaluated events and transactions occurring after June 30, 2024 through the date that the financial statements were issued, and has determined that no additional disclosure in the financial statements is required.
32
COHEN & STEERS REALTY SHARES, INC.
(The following pages are unaudited)
OTHER INFORMATION
A description of the policies and procedures that the Fund uses to determine how to vote proxies relating to portfolio securities is available (i) without charge, upon request, by calling 800-330-7348, (ii) on our website at cohenandsteers.com or (iii) on the SEC’s website at http://www.sec.gov. In addition, the Fund’s proxy voting record for the most recent 12-month period ended June 30 is available by August 31 of each year (i) without charge, upon request, by calling 800-330-7348 or (ii) on the SEC’s website at http://www.sec.gov.
Disclosures of the Fund’s complete holdings are required to be made monthly on Form N-PORT, with every third month made available to the public by the SEC 60 days after the end of the Fund’s fiscal quarter. The Fund’s Form N-PORT is available (i) without charge, upon request, by calling 800-330-7348 or (ii) on the SEC’s website at http://www.sec.gov.
Please note that distributions paid by the Fund to shareholders are subject to recharacterization for tax purposes and are taxable up to the amount of the Fund’s investment company taxable income and net realized gains. Distributions in excess of the Fund’s net investment company taxable income and realized gains are a return of capital distributed from the Fund’s assets. The final tax treatment of all distributions is reported to shareholders on their 1099-DIV forms, which are mailed after the close of each calendar year.
Changes to Portfolio Management Team
Effective January 1, 2024, Ji Zhang was added as a portfolio manager of the Fund. Jon Cheigh, Jason Yablon and Mathew Kirschner continue to serve as portfolio managers of the Fund.
33
COHEN & STEERS REALTY SHARES, INC.
APPROVAL OF INVESTMENT ADVISORY AGREEMENT
The Board of Directors of the Fund, including a majority of the directors who are not parties to the Fund’s investment advisory agreement (the Advisory Agreement), or interested persons of any such party (the Independent Directors), has the responsibility under the Investment Company Act of 1940 to approve the Fund’s Advisory Agreement for its initial two year term and its continuation annually thereafter at a meeting of the Board of Directors called for the purpose of voting on the approval or continuation. The Advisory Agreement was discussed at a meeting of the Independent Directors, in their capacity as the Contract Review Committee, held on June 4, 2024 and at a meeting of the full Board of Directors held on June 18, 2024. The Independent Directors, in their capacity as the Contract Review Committee, also discussed the Advisory Agreement in executive sessions on June 17, 2024 and June 18, 2024. At the meeting of the full Board of Directors on June 18, 2024, the Advisory Agreement was unanimously continued for a term ending June 30, 2025 by the Fund’s Board of Directors, including the Independent Directors. The Independent Directors were represented by independent counsel who assisted them in their deliberations during the meetings and executive session.
In considering whether to continue the Advisory Agreement, the Board of Directors reviewed materials provided by an independent data provider, which included, among other items, fee, expense and performance information compared to peer funds (the Peer Funds and, collectively with the Fund, the Peer Group) and performance comparisons to a larger category universe; summary information prepared by the Fund’s investment advisor (the Investment Advisor); and a memorandum from counsel to the Independent Directors outlining the legal duties of the Board of Directors. The Board of Directors also spoke directly with representatives of the independent data provider and met with investment advisory personnel. In addition, the Board of Directors considered information provided from time to time by the Investment Advisor throughout the year at meetings of the Board of Directors, including presentations by portfolio managers relating to the investment performance of the Fund and the investment strategies used in pursuing the Fund’s objective. The Board of Directors also considered information provided by the Investment Advisor in response to a request for information submitted by counsel to the Independent Directors, on behalf of the Independent Directors, as well as information provided by the Investment Advisor in response to a supplemental request. In particular, the Board of Directors considered the following:
(i) The nature, extent and quality of services to be provided by the Investment Advisor: The Board of Directors reviewed the services that the Investment Advisor provides to the Fund, including, but not limited to, making the day-to-day investment decisions for the Fund, placing orders for the investment and reinvestment of the Fund’s assets, furnishing information to the Board of Directors of the Fund regarding the Fund’s portfolio, providing individuals to serve as Fund officers, and generally managing the Fund’s investments in accordance with the stated policies of the Fund. The Board of Directors also discussed with officers and portfolio managers of the Fund the types of transactions conducted on behalf of the Fund. Additionally, the Board of Directors took into account the services provided by the Investment Advisor to its other funds and accounts, including those that have investment objectives and strategies similar to those of the Fund. The Board of Directors also considered the education, background and experience of the Investment Advisor’s personnel, particularly noting the potential benefit that the portfolio managers’ work experience and favorable reputation can have on the Fund. The Board of Directors further noted the Investment Advisor’s ability to attract qualified and experienced personnel. The Board of Directors also considered the administrative services provided by the
34
COHEN & STEERS REALTY SHARES, INC.
Investment Advisor, including compliance and accounting services. After consideration of the above factors, among others, the Board of Directors concluded that the nature, extent and quality of services provided by the Investment Advisor are satisfactory and appropriate.
(ii) Investment performance of the Fund and the Investment Advisor: The Board of Directors considered the investment performance of the Fund compared to Peer Funds and compared to a relevant linked benchmark. The Board of Directors noted that the Fund outperformed the Peer Group medians for the one-, three-, five- and ten-year periods ended March 31, 2024, ranking two out of nine peers, one out of nine peers, one out of nine peers, and one out of nine peers, respectively. The Board of Directors also noted that the Fund outperformed its linked benchmark for the one-, three-, five- and ten-year periods ended March 31, 2024. The Board of Directors engaged in discussions with the Investment Advisor regarding the contributors to and detractors from the Fund’s performance during the period. The Board of Directors also considered supplemental information provided by the Investment Advisor, including a narrative summary of various factors affecting performance and the Investment Advisor’s performance in managing similarly managed funds and accounts. The Board of Directors determined that Fund performance, in light of all the considerations noted above, supported the continuation of the Advisory Agreement.
(iii) Cost of the services to be provided and profits to be realized by the Investment Advisor from the relationship with the Fund: The Board of Directors considered the contractual and actual management fees paid by the Fund as well as the Fund’s total expense ratio. As part of its analysis, the Board of Directors gave consideration to the fee and expense analyses provided by the independent data provider. The Board of Directors noted that the Fund’s actual management fee was in-line with the Peer Group median, ranking six out of nine peers. The Board of Directors also noted that the Fund’s total expense ratio represented the Peer Group median, ranking five out of nine peers. The Board of Directors considered that the Fund has a breakpoint of 0.05% on assets under management over $8.5 billion, though the Fund is not benefitting from the fee reduction of the breakpoint based on its current assets. The Board of Directors further considered that the Investment Advisor continues to waive a portion of its fees and/or reimburse expenses to limit the overall operating expenses of the Fund. In light of the considerations above, the Board of Directors concluded that the Fund’s current expense structure was satisfactory.
The Board of Directors also reviewed information regarding the profitability to the Investment Advisor of its relationship with the Fund. The Board of Directors considered the level of the Investment Advisor’s profits and whether the profits were reasonable for the Investment Advisor. The Board of Directors noted that the Investment Advisor is currently waiving a portion of its fee and/or reimbursing expenses of the Fund. The Board of Directors took into consideration other benefits to be derived by the Investment Advisor in connection with the Advisory Agreement, noting particularly the research and related services, within the meaning of Section 28(e) of the Securities Exchange Act of 1934, that the Investment Advisor receives by allocating the Fund’s brokerage transactions. The Board of Directors further considered that the Investment Advisor continues to reinvest profits back in the business, including upgrading and/or implementing new trading, compliance and accounting systems, and by adding investment personnel to the portfolio management teams. The Board of Directors also considered the administrative services provided by the Investment Advisor and the associated administration fee paid to the Investment Advisor for such services under the Administration Agreement. The Board of Directors determined that the services received under the Administration Agreement are
35
COHEN & STEERS REALTY SHARES, INC.
beneficial to the Fund. The Board of Directors concluded that the profits realized by the Investment Advisor from its relationship with the Fund were reasonable and consistent with the Investment Advisor’s fiduciary duties.
(iv) The extent to which economies of scale would be realized as the Fund grows and whether fee levels would reflect such economies of scale: The Board of Directors noted that the Fund’s advisory fee schedule contains a breakpoint of 0.05% on assets under management over $8.5 billion and, as discussed above, the Investment Advisor is currently waiving a portion of its fee or reimbursing expenses to limit the overall operating expenses of the Fund. In light of the considerations above, the Board of Directors determined that economies of scale are being and will continue to be shared with shareholders, concluding that the Fund’s expense structure was satisfactory. In considering economies of scale, the Board of Directors also noted, as discussed above in (iii), that the Investment Advisor continues to reinvest profits back in the business.
(v) Comparison of services to be rendered and fees to be paid to those under other investment advisory contracts, such as contracts of the same and other investment advisors or other clients: As discussed above in (iii), the Board of Directors compared the fees paid under the Advisory Agreement to those under other investment advisory contracts of other investment advisors managing Peer Funds. The Board of Directors also compared the services rendered and fees paid under the Advisory Agreement to fees paid, including the ranges of such fees, under the Investment Advisor’s other fund advisory agreements and advisory contracts with institutional and other clients with similar investment mandates, noting that the Investment Advisor provides more services to the Fund than it does for institutional or subadvised accounts. The Board of Directors also considered the entrepreneurial risk and financial exposure assumed by the Investment Advisor in developing and managing the Fund that the Investment Advisor does not have with institutional and other clients and other differences in the management of registered investment companies and institutional accounts. The Board of Directors determined that on a comparative basis the fees under the Advisory Agreement were reasonable in relation to the services provided.
No single factor was cited as determinative to the decision of the Board of Directors, and each Director may have assigned different weights to the various factors. Rather, after weighing all of the considerations and conclusions discussed above, the Board of Directors, including the Independent Directors, unanimously approved the continuation of the Advisory Agreement.
36
COHEN & STEERS REALTY SHARES, INC.
Cohen & Steers Privacy Policy
| | |
| | |
| Facts | | What Does Cohen & Steers Do With Your Personal Information? |
| |
| Why? | | Financial companies choose how they share your personal information. Federal law gives consumers the right to limit some but not all sharing. Federal law also requires us to tell you how we collect, share, and protect your personal information. Please read this notice carefully to understand what we do. |
| |
| What? | | The types of personal information we collect and share depend on the product or service you have with us. This information can include: • Social Security number and account balances • Transaction history and account transactions • Purchase history and wire transfer instructions |
| |
| How? | | All financial companies need to share customers’ personal information to run their everyday business. In the section below, we list the reasons financial companies can share their customers’ personal information; the reasons Cohen & Steers chooses to share; and whether you can limit this sharing. |
| | | | |
| Reasons we can share your personal information | | Does Cohen & Steers share? | | Can you limit this sharing? |
| | |
For our everyday business purposes— such as to process your transactions, maintain your account(s), respond to court orders and legal investigations, or reports to credit bureaus | | Yes | | No |
| | |
For our marketing purposes— to offer our products and services to you | | Yes | | No |
| | |
| For joint marketing with other financial companies— | | No | | We don’t share |
| | |
For our affiliates’ everyday business purposes— information about your transactions and experiences | | No | | We don’t share |
| | |
For our affiliates’ everyday business purposes— information about your creditworthiness | | No | | We don’t share |
| | |
| For our affiliates to market to you— | | No | | We don’t share |
| | |
| For non-affiliates to market to you— | | No | | We don’t share |
| | |
| | | | |
| | | |
| Questions? Call 800-330-7348 | | | | |
37
COHEN & STEERS REALTY SHARES, INC.
Cohen & Steers Privacy Policy—(Continued)
| | |
| | |
| Who we are | | |
| |
| Who is providing this notice? | | Cohen & Steers Capital Management, Inc., Cohen & Steers Asia Limited, Cohen & Steers Japan Limited, Cohen & Steers UK Limited, Cohen & Steers Ireland Limited, Cohen & Steers Singapore Private Limited, Cohen & Steers Securities, LLC, Cohen & Steers Private Funds and Cohen & Steers Open and Closed-End Funds (collectively, Cohen & Steers). |
| |
| What we do | | |
| |
| How does Cohen & Steers protect my personal information? | | To protect your personal information from unauthorized access and use, we use security measures that comply with federal law. These measures include computer safeguards and secured files and buildings. We restrict access to your information to those employees who need it to perform their jobs, and also require companies that provide services on our behalf to protect your information. |
| |
| How does Cohen & Steers collect my personal information? | | We collect your personal information, for example, when you: • Open an account or buy securities from us • Provide account information or give us your contact information • Make deposits or withdrawals from your account We also collect your personal information from other companies. |
| |
| Why can’t I limit all sharing? | | Federal law gives you the right to limit only: • sharing for affiliates’ everyday business purposes—information about your creditworthiness • affiliates from using your information to market to you • sharing for non-affiliates to market to you State law and individual companies may give you additional rights to limit sharing. |
| |
| Definitions | | |
| |
| Affiliates | | Companies related by common ownership or control. They can be financial and nonfinancial companies. • Cohen & Steers does not share with affiliates. |
| |
| Non-affiliates | | Companies not related by common ownership or control. They can be financial and nonfinancial companies. • Cohen & Steers does not share with non-affiliates. |
| |
| Joint marketing | | A formal agreement between non-affiliated financial companies that together market financial products or services to you. • Cohen & Steers does not jointly market. |
38
COHEN & STEERS REALTY SHARES, INC.
Cohen & Steers Open-End Mutual Funds
COHEN & STEERS REALTY SHARES
| • | | Designed for investors seeking total return, investing primarily in U.S. real estate securities |
| • | | Symbols: CSJAX, CSJCX, CSJIX, CSRSX, CSJRX, CSJZX |
COHEN & STEERS REAL ESTATE SECURITIES FUND
| • | | Designed for investors seeking total return, investing primarily in U.S. real estate securities |
| • | | Symbols: CSEIX, CSCIX, CREFX, CSDIX, CIRRX, CSZIX |
COHEN & STEERS INSTITUTIONAL REALTY SHARES
| • | | Designed for institutional investors seeking total return, investing primarily in U.S. real estate securities |
COHEN & STEERS GLOBAL REALTY SHARES
| • | | Designed for investors seeking total return, investing primarily in global real estate equity securities |
| • | | Symbols: CSFAX, CSFCX, CSSPX, GRSRX, CSFZX |
COHEN & STEERS INTERNATIONAL REALTY FUND
| • | | Designed for investors seeking total return, investing primarily in international (non-U.S.) real estate securities |
| • | | Symbols: IRFAX, IRFCX, IRFIX, IRFRX, IRFZX |
COHEN & STEERS REAL ASSETS FUND
| • | | Designed for investors seeking total return and the maximization of real returns during inflationary environments by investing primarily in real assets |
| • | | Symbols: RAPAX, RAPCX, RAPIX, RAPRX, RAPZX |
COHEN & STEERS PREFERRED SECURITIES
AND INCOME FUND
| • | | Designed for investors seeking total return (high current income and capital appreciation), investing primarily in preferred and debt securities issued by U.S. and non-U.S. companies |
| • | | Symbols: CPXAX, CPXCX, CPXFX, CPXIX, CPRRX, CPXZX |
COHEN & STEERS LOW DURATION PREFERRED
AND INCOME FUND
| • | | Designed for investors seeking high current income and capital preservation by investing in low-duration preferred and other income securities issued by U.S. and non-U.S. companies |
| • | | Symbols: LPXAX, LPXCX, LPXFX, LPXIX, LPXRX, LPXZX |
COHEN & STEERS FUTURE OF ENERGY FUND
| • | | Designed for investors seeking total return, investing primarily in securities of traditional and alternative energy companies |
| • | | Symbols: MLOAX, MLOCX, MLOIX, MLORX, MLOZX |
COHEN & STEERS GLOBAL INFRASTRUCTURE FUND
| • | | Designed for investors seeking total return, investing primarily in global infrastructure securities |
| • | | Symbols: CSUAX, CSUCX, CSUIX, CSURX, CSUZX |
Distributed by Cohen & Steers Securities, LLC.
Please consider the investment objectives, risks, charges and expenses of any Cohen & Steers U.S. registered open-end fund carefully before investing. A summary prospectus and prospectus containing this and other information can be obtained by calling 800-330-7348 or by visiting cohenandsteers.com. Please read the summary prospectus and prospectus carefully before investing.
39
COHEN & STEERS REALTY SHARES, INC.
OFFICERS AND DIRECTORS
Joseph M. Harvey
Director, Chair and Vice President
Adam M. Derechin
Director
Michael G. Clark
Director
George Grossman
Director
Dean A. Junkans
Director
Gerald J. Maginnis
Director
Jane F. Magpiong
Director
Daphne L. Richards
Director
Ramona Rogers-Windsor
Director
James Giallanza
President and Chief Executive Officer
Albert Laskaj
Treasurer and Chief Financial Officer
Dana A. DeVivo
Secretary and Chief Legal Officer
Stephen Murphy
Chief Compliance Officer and Vice President
Jon Cheigh
Vice President
Jason A. Yablon
Vice President
Mathew Kirschner
Vice President
KEY INFORMATION
Investment Advisor and Administrator
Cohen & Steers Capital Management, Inc.
1166 Avenue of the Americas, 30th Floor
New York, NY 10036
(212) 832-3232
Co-administrator and Custodian
State Street Bank and Trust Company
One Congress Street, Suite 1
Boston, MA 02114-2016
Transfer Agent
SS&C GIDS, Inc.
P.O. Box 219953
Kansas City, MO 64121-9953
(800) 437-9912
Legal Counsel
Ropes & Gray LLP
1211 Avenue of the Americas
New York, NY 10036
Distributor
Cohen & Steers Securities, LLC
1166 Avenue of the Americas, 30th Floor
New York, NY 10036
| | |
| NASDAQ Symbol: | | Class A—CSJAX |
| | Class C—CSJCX |
| | Class F—CSJFX* |
| | Class I—CSJIX |
| | Class L—CSRSX |
| | Class R—CSJRX |
| | Class Z—CSJZX |
Website: cohenandsteers.com
This report is authorized for delivery only to shareholders of Cohen & Steers Realty Shares, Inc. unless accompanied or preceded by the delivery of a currently effective prospectus setting forth details of the Fund. Performance data quoted represent past performance. Past performance is no guarantee of future results and your investment may be worth more or less at the time you sell your shares.
| * | Class F shares are currently not available for purchase. |
40
eDelivery AVAILABLE
Stop traditional mail delivery;
receive your shareholder reports
and prospectus online.
Sign up at cohenandsteers.com

Semi-Annual Financial Statements June 30, 2024
Cohen & Steers
Realty Shares
The U.S. Securities and Exchange Commission has adopted new regulations that have resulted in changes to the design and delivery of annual and semi-annual reports.
If you have previously elected to receive shareholder reports electronically, you will continue to do so and need not take any action.
Otherwise, you will now receive in the mail paper copies of the Fund’s new, streamlined reports. If you would like to receive shareholder reports and other communications from the Fund electronically instead of by mail, you may make that request at any time by contacting your financial intermediary (such as a broker-dealer or bank) or, if you are a direct investor, you can call (800) 330-7348.
CSJAXSAR
(b) Included in paragraph (a) above.
Item 8. Changes in and Disagreements with Accountants for Open-End Management Investment Companies.
Not applicable.
Item 9. Proxy Disclosures for Open-End Management Investment Companies.
Not applicable.
Item 10. Remuneration Paid to Directors, Officers, and Others of Open-End Management Investment Companies.
Included in Item 7 above.
Item 11. Statement Regarding Basis for Approval of Investment Advisory Contract.
Included in Item 7 above.
Item 12. Disclosure of Proxy Voting Policies and Procedures for Closed-End Management Investment Companies.
Not applicable.
Item 13. Portfolio Managers of Closed-End Management Investment Companies.
Not applicable.
Item 14. Purchases of Equity Securities by Closed-End Management Investment Company and Affiliated Purchasers.
Not applicable.
Item 15. Submission of Matters to a Vote of Security Holders.
None.
Item 16. Controls and Procedures.
| (a) | The Registrant’s principal executive officer and principal financial officer have concluded that the Registrant’s disclosure controls and procedures are reasonably designed to ensure that information required to be disclosed by the Registrant in this Form N-CSR was recorded, processed, summarized and reported within the time periods specified in the Securities and Exchange Commission’s rules and forms, based upon such officers’ evaluation of these controls and procedures as of a date within 90 days of the filing date of this report. |
SIGNATURES
Pursuant to the requirements of the Securities Exchange Act of 1934 and the Investment Company Act of 1940, the Registrant has duly caused this report to be signed on its behalf by the undersigned, thereunto duly authorized.
COHEN & STEERS REALTY SHARES, INC.
| | | | | | |
| | |
| | By: | | /s/ James Giallanza |
| | | | Name: | | James Giallanza |
| | | | Title: | | Principal Executive Officer |
| | | | | | (President and Chief Executive Officer) |
| |
| | Date: September 3, 2024 |
Pursuant to the requirements of the Securities Exchange Act of 1934 and the Investment Company Act of 1940, this report has been signed below by the following persons on behalf of the Registrant and in the capacities and on the dates indicated.
| | | | | | |
| | |
| | By: | | /s/ James Giallanza |
| | | | Name: | | James Giallanza |
| | | | Title: | | Principal Executive Officer |
| | | | | | (President and Chief Executive Officer) |
| | |
| | By: | | /s/ Albert Laskaj |
| | | | Name: | | Albert Laskaj |
| | | | Title: | | Principal Financial Officer |
| | | | | | (Treasurer and Chief Financial Officer) |
| |
| | Date: September 3, 2024 |