ITEM 1. REPORTS TO STOCKHOLDERS.
INVESTMENT ADVISER NAME CHANGE
Effective January 1, 2011, Nuveen Asset Management, the Funds’ investment adviser, changed its name to Nuveen Fund Advisors, Inc. (“Nuveen Fund Advisors”). Concurrently, Nuveen Fund Advisors formed a wholly-owned subsidiary, Nuveen Asset Management, LLC, to house its portfolio management capabilities.
NUVEEN INVESTMENTS COMPLETES STRATEGIC COMBINATION WITH FAF ADVISORS
On December 31, 2010, Nuveen Investments completed the strategic combination between Nuveen Asset Management, LLC, the largest investment affiliate of Nuveen Investments, and FAF Advisors. As part of this transaction, U.S. Bancorp – the parent of FAF Advisors – received cash consideration and a 9.5% stake in Nuveen Investments in exchange for the long-term investment business of FAF Advisors, including investment management responsibilities for the non-money market mutual funds of the First American Funds family.
The approximately $27 billion of mutual fund and institutional assets managed by FAF Advisors, along with the investment professionals managing these assets and other key personnel, have become part of Nuveen Asset Management, LLC. With these additions to Nuveen Asset Management, LLC, this affiliate now manages more than $100 billion of assets across a broad range of strategies from municipal and taxable fixed income to traditional and specialized equity investments.
This combination does not affect the investment objectives or strategies of the Funds in this report. Over time, Nuveen Investments expects that the combination will provide even more ways to meet the needs of investors who work with financial advisors and consultants by enhancing the multi-boutique model of Nuveen Investments, which also includes highly respected investment teams at HydePark, NWQ Investment Management, Santa Barbara Asset Management, Symphony Asset Management, Tradewinds Global Investors and Winslow Capital. Nuveen Investments managed approximately $206 billion of assets as of March 31, 2011.
Table of Contents
| Chairman’s Letter to Shareholders | 4 |
| Portfolio Managers’ Comments | 5 |
| Common Share Dividend and Share Price Information | 13 |
| Performance Overviews | 15 |
| Portfolios of Investments | 21 |
| Statement of Assets and Liabilities | 89 |
| Statement of Operations | 91 |
| Statement of Changes in Net Assets | 93 |
| Statement of Cash Flows | 96 |
| Financial Highlights | 98 |
| Notes to Financial Statements | 104 |
| Board Approval of Sub-Advisory Arrangements | 118 |
| Reinvest Automatically, Easily and Conveniently | 119 |
| Glossary of Terms Used in this Report | 121 |
| Other Useful Information | 123 |
Chairman’s
Letter to Shareholders
Dear Shareholders,
In 2010, the global economy recorded another year of recovery from the financial and economic crises of 2008, but many of the factors that caused the downturn still weigh on the prospects for continued improvement. In the U.S., ongoing weakness in housing values has put pressure on homeowners and mortgage lenders. Similarly, the strong earnings recovery for corporations and banks is only slowly being translated into increased hiring or more active lending. Globally, deleveraging by private and public borrowers has inhibited economic growth and that process is far from complete.
Encouragingly, constructive actions are being taken by governments around the world to deal with economic issues. In the U.S., the recent passage of a stimulatory tax bill relieved some of the pressure on the Federal Reserve to promote economic expansion through quantitative easing and offers the promise of sustained economic growth. A number of European governments are undertaking programs that could significantly reduce their budget deficits. Governments across the emerging markets are implementing various steps to deal with global capital flows without undermining international trade and investment.
The success of these government actions could determine whether 2011 brings further economic recovery and financial market progress. One risk associated with the extraordinary efforts to strengthen U.S. economic growth is that the debt of the U.S. government will continue to grow to unprecedented levels. Another risk is that over time there could be inflationary pressures on asset values in the U.S. and abroad, because what happens in the U.S. impacts the rest of the world economy. Also, these various actions are being taken in a setting of heightened global economic uncertainty, primarily about the supplies of energy and other critical commodities. In this challenging environment, your Nuveen investment team continues to seek sustainable investment opportunities and to remain alert to potential risks in a recovery still facing many headwinds. On your behalf, we monitor their activities to assure they maintain their investment disciplines.
As you will note elsewhere in this report, on December 31, 2010, Nuveen Investments completed a strategic combination with FAF Advisors, Inc., the manager of the First American Funds. The combination adds highly respected and distinct investment teams to meet the needs of investors and their advisors and is designed to benefit all fund shareholders by creating a fund organization with the potential for further economies of scale and the ability to draw from even greater talent and expertise to meet those investor needs.
As of the end of May 2011, Nuveen Investments had completed the refinancing of all of the Auction Rate Preferred Securities issued by its taxable closed-end funds and 91% of the MuniPreferred shares issued by its tax-exempt closed-end funds. Please consult the Nuveen Investments web site, www.Nuveen.com, for the current status of this important refinancing program.
As always, I encourage you to contact your financial consultant if you have any questions about your investment in a Nuveen Fund. On behalf of the other members of your Fund Board, we look forward to continuing to earn your trust in the months and years ahead.
Sincerely,
Robert P. Bremner
Chairman of the Board
June 21, 2011
Portfolio Managers’ Comments
Nuveen Investment Quality Municipal Fund, Inc. (NQM)
Nuveen Select Quality Municipal Fund, Inc. (NQS)
Nuveen Quality Income Municipal Fund, Inc. (NQU)
Nuveen Premier Municipal Income Fund, Inc. (NPF)
Nuveen Municipal High Income Opportunity Fund (NMZ)
Nuveen Municipal High Income Opportunity Fund 2 (NMD)
Portfolio managers Chris Drahn, Tom Spalding, Daniel Close and John Miller review key investment strategies and the six-month performance of these six national Funds. Chris, who has 31 years of financial industry experience, assumed portfolio management responsibility for NQM in January 2011. A 34-year veteran of Nuveen, Tom has managed NQS and NQU since 2003. Dan, who joined Nuveen in 2000, assumed portfolio management responsibility for NPF in January 2011. John, who has 16 years of municipal market experience, has managed NMZ since its inception in 2003 and has been involved in the management of NMD since its inception in 2007. He assumed full portfolio management responsibility for NMD in December 2010.
What key strategies were used to manage these Funds during the six-month reporting period ended April 30, 2011?
After rallying through most of 2010, municipal bond prices declined during this six-month period, impacted by investor concerns about inflation, the federal deficit, and the deficit’s impact on demand for U.S. Treasury securities. Adding to this market pressure was media coverage of the strained finances of many state and local governments. As a result, money began to flow out of municipal bond funds, yields rose and valuations declined. Toward the end of this period, we saw the environment in the municipal market improve, as some buyers were attracted by municipal bond valuations and yields, resulting in declining yields and rising valuations.
The municipal bond market also was affected by a significant decline in new tax-exempt issuance during this period. One reason for this decrease was the heavy issuance of taxable municipal debt at the end of 2010 under the Build America Bond (BAB) program. During November and December 2010, taxable BABs issuance nationwide totaled $31.5 billion, accounting for 34.5% of new bonds in the municipal market. Since interest payments from BABs represent taxable income, we did not view these bonds as appropriate investment opportunities for these Funds. The BAB program expired December 31, 2010, after Congress failed to include legislation extending the program
Certain statements in this report are forward-looking statements. Discussions of specific investments are for illustration only and are not intended as recommendations of individual investments. The forward-looking statements and other views expressed herein are those of the portfolio managers as of the date of this report. Actual future results or occurrences may differ significantly from those anticipated in any forward-looking statements, and the views expressed herein are subject to change at any time, due to numerous market and other factors. The Funds disclaim any obligation to update publicly or revise any forward-looking statements or views expressed herein. |
| Any reference to credit ratings for portfolio holdings denotes the highest rating assigned by a Nationally Recognized Statistical Rating Organization (NRSRO) such as Standard & Poor’s (S&P), Moody’s or Fitch. AAA, AA, A and BBB ratings are investment grade; BB, B, CCC, CC, C and D ratings are below investment grade. Holdings and ratings may change over time. |
in the tax bill it passed earlier that month. In addition to the BAB program’s impact on tax-exempt issuance during the November-December period, borrowers trying to take advantage of the program’s favorable terms before its termination at year end accelerated issuance that potentially would have come to market as tax-exempt bonds in 2011, choosing instead to issue taxable BABs during the last two months of 2010. Due in part to this, national tax-exempt municipal issuance was down 49% for the first four months of 2011 compared with the same period in 2010.
Because of the constrained tax-exempt municipal bond issuance, we continued to take a bottom-up approach to discovering undervalued sectors and individual credits with the potential to perform well over the long term. During this period, NQM, NQS, NQU and NPF found value in a diverse array of sectors, including health care, transportation (specifically tollroads and airports), higher education and tax-supported bonds. NQS and NQU also purchased some industrial development revenue bonds (IDRs) with good call protection. In NQM and NPF, we added redevelopment agency bonds. The proposed elimination of redevelopment district programs in California, suggested as part of efforts to close gaps in the California state budget, prompted issuers to come to market with their remaining authorizations of redevelopment district bonds. This resulted in heavier supply of these bonds and higher yields at attractive prices. In general, our purchases during this period were sector-based rather than geographically focused, although we continued to keep our holdings well diversified by state. For the most part, these Funds focused on purchasing longer bonds to take advantage of attractive yields at the longer end of the municipal yield curve.
During what turned out to be a tumultuous period in the high-yield bond market, NMZ and NMD focused on their ability to take advantage of individual situations to add value to the Funds. During this period, we emphasized credits that, in our opinion, had favorable fundamental outlooks, offered higher yields and strong potential for income generation, and were prospective candidates for credit improvement. We discovered many of these purchases in the transportation, health care, higher education, and “other revenue” sectors. Among the additions to NMZ during this period were bonds issued for the expansion of the LBJ tollroad in Texas, the Mid-Bay Bridge in northwest Florida, the Colorado Regional Transportation District’s extension of the passenger railway between downtown Denver and the airport, the Ochsner Clinic Foundation in Louisiana and the Vermont Law School. Like NQM and NPF, both NMZ and NMD also purchased California redevelopment agency bonds as well as community development district bonds (land-secured bonds that finance public infrastructure costs for new developments) in Florida. The majority of our purchases in both Funds were longer maturity bonds offering both attractive yields and pricing.
Cash for new purchases was generated largely by the proceeds from bond calls and maturing bonds, which we worked to redeploy to keep the Funds as fully invested as possible. In NQM, NMZ and NMD we also took advantage of strong bids to sell some holdings at attractive prices, mainly from the health care and IDR sectors. During this period, we saw strong demand for bonds in these sectors, especially bonds with maturities of less than 30 years or issued in smaller states.
As of April 30, 2011, all six of these Funds continued to use inverse floating rate securities. We employ inverse floaters as a form of leverage for a variety of reasons, including duration management, income enhancement and total return enhancement. During this period, NPF took advantage of opportunities to reduce its leverage exposure by unwinding a few of its smaller inverse floater positions. We accomplished this by using cash and proceeds from matured and called bonds to buy back the inverse floaters, terminating the trusts that had held the securities, and placing the bonds involved back on the Fund’s balance sheet. NMZ and NMD also continued to invest in additional types of derivative instruments1 designed to help shorten duration and moderate interest rate risk. These derivative positions remained in place at period end.
During the six months ended April 30, 2011, we entered into forward interest rate swap contracts to reduce the duration of NMZ’s and NMD’s portfolio. NMD also entered into Treasury futures contracts to reduce duration of the Fund’s portfolio.
How did the Funds perform?
Individual results for these Funds, as well as relevant index and peer group information, are presented in the accompanying table.
Average Annual Total Returns on Common Share Net Asset Value*
For periods ended 4/30/11
| Fund | 6-Month | | 1-Year | | 5-Year | | 10-Year |
| NQM | -5.07% | | 0.86% | | 4.02% | | 5.47% |
| NQS | -6.44% | | -0.72% | | 3.60% | | 5.48% |
| NQU | -6.81% | | -2.21% | | 3.23% | | 5.15% |
| NPF | -4.25% | | 1.36% | | 3.72% | | 5.34% |
| | | | | | | | |
Standard & Poor’s (S&P) National Municipal Bond Index2 | -1.99% | | 1.98% | | 4.18% | | 4.94% |
Lipper General Leveraged Municipal Debt Funds Average3 | - 5.81% | | 0.10% | | 3.04% | | 5.25% |
| | | | | | | | |
| NMZ | -7.76% | | -0.81% | | 0.98% | | N/A |
| NMD | -8.06% | | -1.08% | | NA | | N/A |
| | | | | | | | |
Standard & Poor’s (S&P) High-Yield Municipal Bond Index4 | -3.28% | | 2.28% | | 1.91% | | 4.80% |
Lipper High-Yield Municipal Debt Funds Average3 | -5.21% | | 1.40% | | 2.49% | | 4.66% |
| * | Six-month returns are cumulative; all other returns are annualized. |
| | |
| | Past performance is not predictive of future results. Current performance may be higher or lower than the data shown. Returns do not reflect the deduction of taxes that shareholders may have to pay on Fund distributions or upon the sale of Fund shares. |
| | |
| | For additional information, see the individual Performance Overview for your Fund in this report. |
| | |
| 1 | Each Fund may invest in derivative instruments such as forwards, futures, options, and swap transactions. For additional information on the derivative instruments in which each Fund was invested during and at the end of the reporting period, see the Portfolios of Investments, Financial Statements, and Notes to Financial Statements sections of this report. |
| | |
| 2 | The Standard & Poor’s (S&P) National Municipal Bond Index is an unleveraged, market value-weighted index designed to measure the performance of the tax-exempt, investment-grade U.S. municipal bond market. This index does not reflect any initial or ongoing expenses and is not available for direct investment. |
| | |
| 3 | The Lipper General Leveraged Municipal Debt Funds Average is calculated using the returns of all closed-end funds in this category for each period as follows: 6-month, 74 funds; 1-year, 73 funds; 5-year, 70 funds; and 10-year, 51 funds. The Lipper High-Yield Municipal Debt Funds Average is calculated using the returns of all closed-end funds in this category for each period as follows: 6-month, 14 funds; 1-year, 14 funds; 5-year, 13 funds; and 10-year, 10 funds. Lipper returns account for the effects of management fees and assume reinvestment of dividends, but do not reflect any applicable sales charges. The Lipper averages are not available for direct investment. |
| | |
| 4 | The Standard & Poor’s (S&P) High-Yield Municipal Bond Index comprises all of the bonds in the S&P National Municipal Bond Index that are non-rated or rated BB+ by S&P and/or Ba1 or lower by Moody’s. The index does not contain bonds that are pre-refunded or escrowed to maturity. This index does not reflect any initial or ongoing expenses and is not available for direct investment. |
For the six months ended April 30, 2011, the cumulative returns on common share net asset value (NAV) for NQM, NQS, NQU and NPF underperformed the return for the Standard & Poor’s (S&P) National Municipal Bond Index. NQM and NPF exceeded the average return for the Lipper General Leveraged Municipal Debt Funds Average, while NQS and NQU trailed this Lipper average. For the same period, NMZ and NMD under-performed the Standard & Poor’s (S&P) High-Yield Municipal Bond Index and the Lipper High-Yield Municipal Debt Funds Average.
Key management factors that influenced the Funds’ returns during this period included duration and yield curve positioning, credit exposure and sector allocation. In addition, the use of leverage had an impact on the Funds’ performance. Leverage is discussed in more detail on page nine.
During this period, municipal bonds with shorter maturities generally outperformed other maturity categories, with credits at the longest end of the yield curve posting the weakest returns. The underperformance of longer bonds was due in part to the rise in municipal yields at the longer end of the curve. Among these Funds, NPF was the most advantageously situated in terms of duration and yield curve positioning, with the shortest duration among the six Funds. The longer durations of the other five Funds—and their greater exposure to the underperforming long part of the curve—detracted from their performance for this period. Overall, variations in duration and yield curve positioning among the Funds accounted for the majority of the differences in performance.
As previously mentioned, NMZ and NMD used derivative positions to synthetically reduce duration and moderate interest rate risk during this period. These derivatives had a positive impact on NMZ and NMD’s total return performance for the period.
Credit exposure also played a role in performance during these six months. During the market reversal of late 2010, as the redemption activity in high-yield funds increased and risk aversion mounted, lower-rated credits were negatively impacted. For the period as a whole, bonds rated BBB generally underperformed those rated AAA. All of these Funds tended to be overweighted in bonds rated BBB, which negatively impacted their performance, with the two high-income Funds—NMZ and NMD—having the heaviest exposures to BBB rated bonds. These two Funds were also hurt by their small allocations to bonds rated AAA. Among the four other Funds, NPF held the fewest bonds rated BBB.
Holdings that generally helped the Funds’ returns included housing, resource recovery, and general obligation (GOs) and other tax-supported bonds. In general, these Funds tended to have relatively light exposures to housing (with the exception of NMZ) and
were underweighted in GOs, which limited their participation in the performance of these sectors. During this period, pre-refunded bonds, which are often backed by U.S. Treasury securities, also were among the strongest performers, primarily due to their shorter effective maturities and higher credit quality. As of April 30, 2011, NQU had the heaviest weighting of pre-refunded bonds, while NQS had the smallest allocation. Because of the shorter, high-quality nature of pre-refunded bonds, NMZ and NMD—as longer-term, higher-yielding Funds—had little to no exposure to these credits.
In contrast, the health care and transportation sectors turned in relatively weaker performance. All of these Funds had double-digit weightings in the health care sector, with NQM and NMZ holding the largest health care allocation and NPF the smallest. Zero coupon bonds were among the poorest performers, due largely to their longer maturities.
IMPACT OF THE FUNDS’ LEVERAGE STRATEGIES ON PERFORMANCE
One important factor impacting the returns of all these Funds relative to the comparative indexes was the Funds’ use of leverage. The Funds use leverage because their managers believe that, over time, leveraging provides opportunities for additional income and total return for common shareholders. However, use of leverage also can expose common shareholders to additional volatility. For example, as the prices of securities held by a Fund decline, the negative impact of these valuation changes on common share net asset value and common shareholder total return is magnified by the use of leverage. This is what happened in these Funds during the period, and the use of structural leverage hurt their overall performance.
RECENT DEVELOPMENTS REGARDING THE FUNDS’ REDEMPTION OF AUCTION RATE PREFERRED SHARES
Shortly after their respective inceptions, each of the Funds (with the exception of NMD) issued auction rate preferred shares (ARPS) to create structural leverage. As noted in past shareholder reports, the ARPS issued by many closed-end funds, including these Funds, have been hampered by a lack of liquidity since February 2008. Since that time, more ARPS have been submitted for sale in each of their regularly scheduled auctions than there have been offers to buy. In fact, offers to buy have been almost completely nonexistent since late February 2008. This means that these auctions have “failed to clear,” and that many, or all, of the ARPS shareholders who wanted to sell their shares in these auctions were unable to do so. This lack of liquidity in ARPS did not lower the credit quality of these shares, and ARPS shareholders unable to sell their shares continued to receive distributions at the “maximum rate” applicable to failed auctions, as
calculated in accordance with the pre-established terms of the ARPS. In the recent market, with short term rates at multi-generational lows, those maximum rates also have been low.
One continuing implication for common shareholders from the auction failures is that each Fund’s cost of leverage likely has been incrementally higher at times than it otherwise might have been had the auctions continued to be successful. As a result, each Fund’s common share earnings likely have been incrementally lower at times than they otherwise might have been.
As noted in past shareholder reports, the Nuveen funds’ Board of Directors/Trustees authorized several methods that can be used separately or in combination to refinance a portion of the Nuveen funds’ outstanding ARPS. Some funds have utilized tender option bonds (TOBs), also known as inverse floating rate securities, for leverage purposes. The amount of TOBs that a fund may use varies according to the composition of each fund’s portfolio. Some funds have a greater ability to use TOBs than others. Some funds have issued Variable Rate Demand Preferred (VRDP) Shares or Variable MuniFund Term Preferred (VMTP) Shares, which are a floating rate form of preferred stock with a mandatory term redemption. Some funds have issued MuniFund Term Preferred (MTP) Shares, a fixed rate form of preferred stock with a mandatory redemption period of three to five years.
While all these efforts have reduced the total amount of outstanding ARPS issued by the Nuveen funds, the funds cannot provide any assurance on when the remaining outstanding ARPS might be redeemed.
During 2010 and 2011, certain Nuveen leveraged closed-end funds (including NQM, NQS, NQU, NPF and NMZ) received a demand letter from a law firm on behalf of purported holders of common shares of each such fund, alleging that Nuveen and the funds’ officers and Board of Directors/Trustees breached their fiduciary duties related to the redemption at par of the funds’ ARPS. In response, the Board established an ad hoc Demand Committee consisting of certain of its disinterested and independent Board members to investigate the claims. The Demand Committee retained independent counsel to assist it in conducting an extensive investigation. Based upon its investigation, the Demand Committee found that it was not in the best interests of each fund or its shareholders to take the actions suggested in the demand letters, and recommended that the full Board reject the demands made in the demand letters. After reviewing the
findings and recommendation of the Demand Committee, the full Board of each fund unanimously adopted the Demand Committee’s recommendation.
Subsequently, the funds that received demand letters (including NQM and NMZ) were named in a consolidated complaint as nominal defendants in a putative shareholder derivative action captioned Martin Safier, et al. v. Nuveen Asset Management, et al. that was filed in the Circuit Court of Cook County, Illinois, Chancery Division (the “Cook County Chancery Court”) on February 18, 2011 (the “Complaint”). The Complaint, filed on behalf of purported holders of each fund’s common shares, also name Nuveen Fund Advisors, Inc. as a defendant, together with current and former Officers and interested Director/Trustees of each of the funds (together with the nominal defendants, collectively, the “Defendants”). The Complaint contains the same basic allegations contained in the demand letters. The suits seek a declaration that the Defendants have breached their fiduciary duties, an order directing the Defendants not to redeem any ARPS at their liquidation value using fund assets, indeterminate monetary damages in favor of the funds and an award of plaintiffs’ costs and disbursements in pursuing the action. Nuveen Fund Advisors, Inc. believes that the Complaint is without merit, and is defending vigorously against these charges.
As of April 30, 2011, the amount of ARPS redeemed at par by the Funds is as shown in the accompanying table.
| Fund | | ARPS Redeemed | | % of ARPS |
| NQM | | $ | 90,300,000 | | | 30.0 | % |
| NQS | | $ | 27,725,000 | | | 9.9 | % |
| NQU | | $ | 452,000,000 | | | 100.0 | % |
| NPF | | $ | 38,150,000 | | | 23.1 | % |
| NMZ | | $ | 60,000,000 | | | 38.7 | % |
VRDP Shares
During the current reporting period, the following Fund completed the issuance of VRDP Shares as shown in the accompanying table. The net proceeds from this offerings was used to refinance the Fund’s remaining outstanding ARPS at par.
| Fund | | VRDP Shares Issued at Liquidation Value |
| NQU | | $ | 388,400,000 |
Subsequent to the reporting period, the following Funds completed the issuance of VRDP Shares as shown in the accompanying table. The net proceeds from these offerings were used to refinance the Funds’ remaining outstanding ARPS at par.
| Fund | | VRDP Shares Issued at Liquidation Value |
| NQM | | $ | 211,800,000 |
| NQS | | $ | 252,500,000 |
| NPF | | $ | 127,700,000 |
(Refer to Notes to Financial Statements, Footnote 1 – General Information and Significant Accounting Policies and Footnote 4 – Fund Shares for further details on VRDP Shares.)
At the time this report was prepared, all 84 of the Nuveen closed-end municipal funds that had issued ARPS have redeemed at par all or a portion of these shares. These redemptions bring the total amount of Nuveen’s municipal closed-end funds’ ARPS redemptions to approximately $10.0 billion of the approximately $11.0 billion originally outstanding.
For up-to-date information, please visit the Nuveen CEF Auction Rate Preferred Resource Center at: http://www.nuveen.com/arps.
Regulatory Matters
During May 2011, Nuveen Securities, LLC entered into a settlement with the Financial Industry Regulatory Authority (FINRA) with respect to certain allegations regarding Nuveen-sponsored closed-end fund ARPS marketing brochures. As part of this settlement, Nuveen Securities, LLC neither admitted to nor denied FINRA’s allegations. Nuveen Securities, LLC is the broker-dealer subsidiary of Nuveen Investments.
The settlement with FINRA concludes an investigation that followed the widespread failure of auctions for ARPS and other auction rate securities, which generally began in mid-February 2008. In the settlement, FINRA alleged that certain marketing materials provided by Nuveen Securities, LLC were false and misleading. Nuveen Securities, LLC agreed to a censure and the payment of a $3 million fine.
Common Share Dividend
and Share Price Information
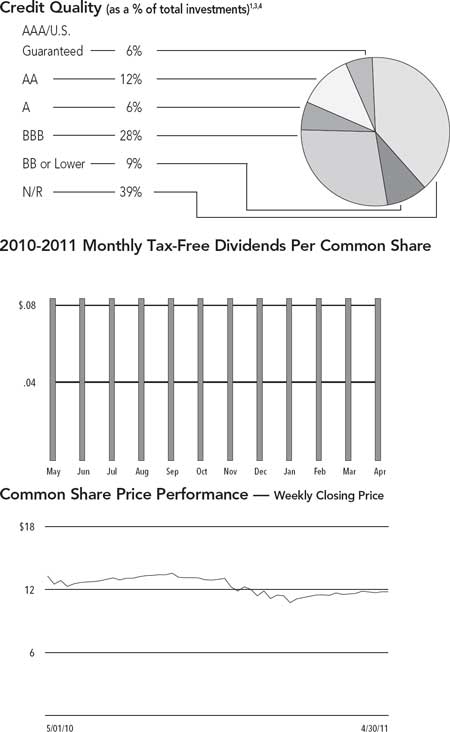
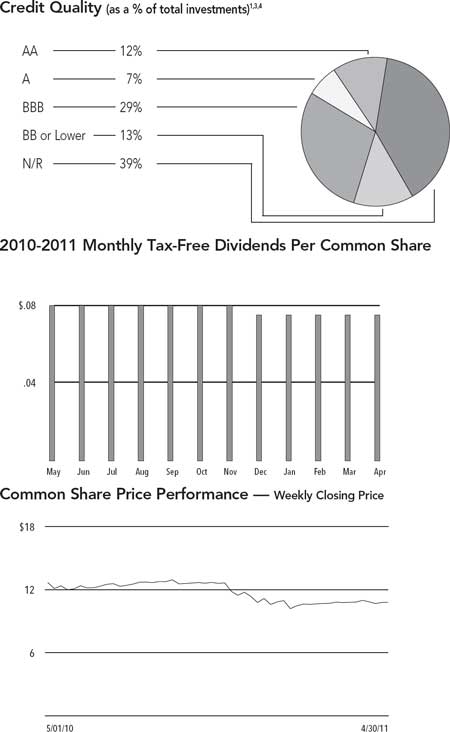
The monthly dividends of NQM, NQS, NQU, NPF and NMZ remained stable throughout the six-month reporting period ended April 30, 2011, while the monthly dividend of NMD was reduced effective December 2010.
Due to normal portfolio activity, common shareholders of the following Funds received capital gains and/or net ordinary income distributions in December 2010 as follows:
| Fund | | Long-Term Capital Gains (per share) | | Short-Term Capital Gains and/or Ordinary Income (per share) |
| NQM | | | — | | $ | 0.0028 |
| NQS | | $ | 0.0809 | | $ | 0.0078 |
All of the Funds in this report seek to pay stable dividends at rates that reflect each Fund’s past results and projected future performance. During certain periods, each Fund may pay dividends at a rate that may be more or less than the amount of net investment income actually earned by the Fund during the period. If a Fund has cumulatively earned more than it has paid in dividends, it holds the excess in reserve as undistributed net investment income (UNII) as part of the Fund’s NAV. Conversely, if a Fund has cumulatively paid dividends in excess of its earnings, the excess constitutes negative UNII that is likewise reflected in the Fund’s NAV. Each Fund will, over time, pay all of its net investment income as dividends to shareholders. As of April 30, 2011, NQM, NQS, NQU, NPF and NMZ had positive UNII balances, based upon our best estimate, for tax purposes and positive UNII balances for financial reporting purposes, while NMD had a positive UNII balance, based upon our best estimate, for tax purposes and a negative UNII balance for financial reporting purposes.
COMMON SHARE REPURCHASES AND SHARE PRICE INFORMATION
As of April 30, 2011, and since the inception of the Funds’ repurchase program, NPF has cumulatively repurchased and retired its outstanding common shares as shown in the accompanying table. Since the inception of the Funds’ repurchase program, NQM, NQS, NQU, NMZ and NMD have not repurchased any of their outstanding common shares.
| Fund | | | Common Shares Repurchased and Retired | | | % of Outstanding Common Shares |
| NPF | | | 202,500 | | | 1.0 | % |
During the six-month reporting period, NPF did not repurchase any of its outstanding common shares.
SHELF EQUITY PROGRAMS
Prior to the reporting period, NMZ and NMD filed registration statements with the Securities and Exchange Commission (SEC) authorizing the Funds to issue 2.5 million and 2.6 million common shares, respectively, through a shelf offering. Under these equity shelf programs, the Funds, subject to market conditions, may raise additional capital from time to time in varying amounts and offering methods at a net price at or above each Fund’s NAV per common share.
As of April 30, 2011, NMZ and NMD had cumulatively sold 3,948,380 and 1,600,219 common shares, respectively, through their shelf equity programs.
During the six-month reporting period, NMZ and NMD sold common shares through their shelf equity programs at an average premium to NAV per common share as shown in the accompanying table.
| Fund | | | Common Shares Sold through Shelf Offering | | | Premium to NAV Per Share Sold |
| NMZ | | | 701,414 | | | 7.87 | % |
| NMD | | | 457,354 | | | 3.65 | % |
As of April 30, 2011, and during the six-month reporting period, the Funds’ common share prices were trading at (+) premiums or (-) discounts to their common share NAVs as shown in the accompanying table.
| Fund | | 4/30/11 (+)Premium/(-)Discount | | Six-Month Average (+)Premium/(-)Discount |
| NQM | | (-)3.10 | % | | (-)4.08 | % |
| NQS | | (+)1.66 | % | | (+)0.63 | % |
| NQU | | (-)2.25 | % | | (-)1.39 | % |
| NPF | | (-)6.37 | % | | (-)6.53 | % |
| NMZ | | (+)10.21 | % | | (+)6.46 | % |
| NMD | | (+)2.76 | % | | (+)1.45 | % |
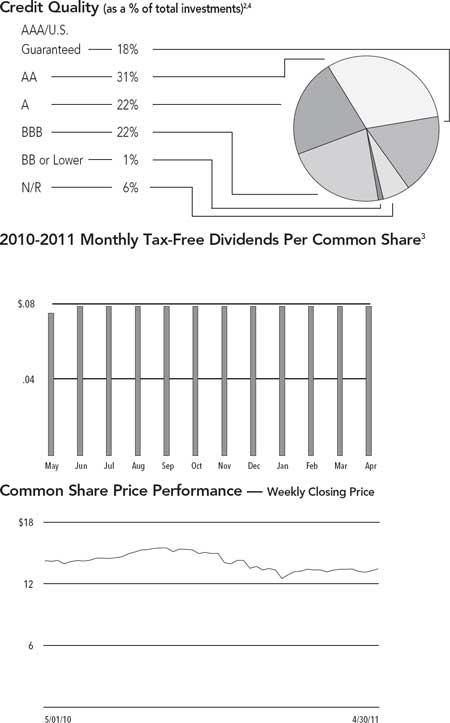
| NQM | | Nuveen Investment |
| Performance | | Quality Municipal |
| OVERVIEW | | Fund, Inc. |
as of April 30, 2011
| Fund Snapshot | | | | |
| Common Share Price | | $ | 13.45 | |
| Common Share Net Asset Value (NAV) | | $ | 13.88 | |
| Premium/(Discount) to NAV | | | -3.10 | % |
| Market Yield | | | 7.00 | % |
Taxable-Equivalent Yield1 | | | 9.72 | % |
| Net Assets Applicable to Common Shares ($000) | | $ | 497,785 | |
Leverage (as a % of managed assets) | | | | |
| Structural Leverage | | | 26.38 | % |
| Effective Leverage | | | 37.68 | % |
Average Annual Total Return (Inception 6/21/90) | | | | | | | |
| | | | On Share Price | | On NAV |
| 6-Month (Cumulative) | | | -6.83 | % | | -5.07 | % |
| 1-Year | | | 1.16 | % | | 0.86 | % |
| 5-Year | | | 4.35 | % | | 4.02 | % |
| 10-Year | | | 6.13 | % | | 5.47 | % |
States4 (as a % of total investments) | | | | |
| California | | | 15.7 | % |
| New York | | | 11.6 | % |
| Illinois | | | 8.5 | % |
| Texas | | | 7.5 | % |
| Florida | | | 5.0 | % |
| District of Columbia | | | 4.2 | % |
| Michigan | | | 3.2 | % |
| Wisconsin | | | 2.8 | % |
| Minnesota | | | 2.6 | % |
| Ohio | | | 2.5 | % |
| Pennsylvania | | | 2.5 | % |
| Massachusetts | | | 2.4 | % |
| Georgia | | | 2.0 | % |
| New Jersey | | | 1.9 | % |
| Washington | | | 1.8 | % |
| Tennessee | | | 1.7 | % |
| South Carolina | | | 1.7 | % |
| Colorado | | | 1.5 | % |
| Indiana | | | 1.4 | % |
| Kentucky | | | 1.4 | % |
| Nebraska | | | 1.4 | % |
| Puerto Rico | | | 1.3 | % |
| Arizona | | | 1.3 | % |
| Other | | | 14.1 | % |
Portfolio Composition4 (as a % of total investments) | | | | |
| Health Care | | | 21.4 | % |
| Tax Obligation/Limited | | | 17.8 | % |
| U.S. Guaranteed | | | 12.3 | % |
| Transportation | | | 10.8 | % |
| Tax Obligation/General | | | 9.4 | % |
| Water and Sewer | | | 8.1 | % |
| Education and Civic Organizations | | | 5.4 | % |
| Utilities | | | 5.3 | % |
| Other | | | 9.5 | % |
| | Refer to the Glossary of Terms Used in this Report for further definition of the terms used within this Fund’s Performance Overview page. |
| 1 | Taxable-Equivalent Yield represents the yield that must be earned on a fully taxable investment in order to equal the yield of the Fund on an after-tax basis. It is based on a federal income tax rate of 28%. When comparing this Fund to investments that generate qualified dividend income, the Taxable-Equivalent Yield is lower. |
| 2 | Ratings shown are the highest of Standard & Poor’s Group, Moody’s Investor Service, Inc. or Fitch, Inc. AAA includes bonds with an implied AAA rating since they are backed by U.S. Government or agency securities. AAA, AA, A and BBB ratings are investment grade; BB, B, CCC, CC, C and D ratings are below-investment grade. Holdings designated N/R are not rated by any of these national rating agencies. |
| 3 | The Fund paid shareholders a net ordinary income distribution in December 2010 of $0.0028 per share. |
| 4 | Holdings are subject to change. |
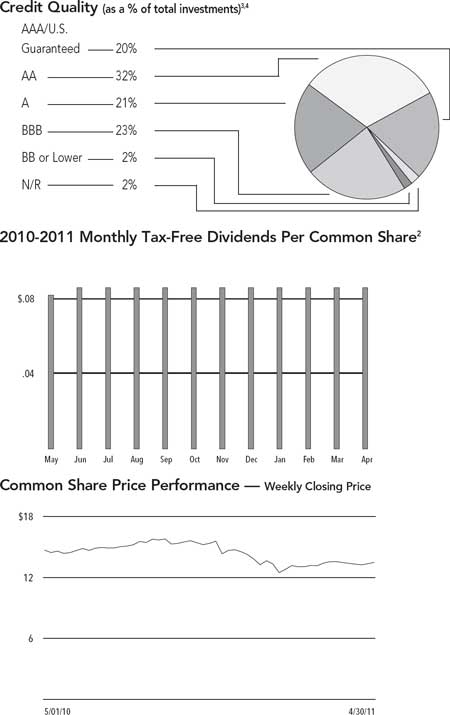
| NQS | | Nuveen Select |
| Performance | | Quality Municipal |
| OVERVIEW | | Fund, Inc. |
as of April 30, 2011
| Fund Snapshot | | | | |
| Common Share Price | | $ | 13.47 | |
| Common Share Net Asset Value (NAV) | | $ | 13.25 | |
| Premium/(Discount) to NAV | | | 1.66 | % |
| Market Yield | | | 7.66 | % |
Taxable-Equivalent Yield1 | | | 10.64 | % |
Net Assets Applicable to Common Shares ($000) | | $ | 453,908 | |
Leverage (as a % of managed assets) | | | | |
| Structural Leverage | | | 34.28 | % |
| Effective Leverage | | | 38.07 | % |
Average Annual Total Return (Inception 3/21/91) | | | | | | | |
| | | | On Share Price | | On NAV |
| 6-Month (Cumulative) | | | -8.19 | % | | -6.44 | % |
| 1-Year | | | -0.68 | % | | -0.72 | % |
| 5-Year | | | 4.37 | % | | 3.60 | % |
| 10-Year | | | 6.37 | % | | 5.48 | % |
States4 (as a % of total investments) | | | | |
| Illinois | | | 14.7 | % |
| Texas | | | 12.5 | % |
| California | | | 5.8 | % |
| Michigan | | | 5.2 | % |
| Colorado | | | 5.0 | % |
| New Jersey | | | 5.0 | % |
| South Carolina | | | 4.8 | % |
| Ohio | | | 3.5 | % |
| Washington | | | 3.4 | % |
| Tennessee | | | 3.4 | % |
| New York | | | 2.5 | % |
| Puerto Rico | | | 2.2 | % |
| Arizona | | | 2.1 | % |
| New Mexico | | | 2.1 | % |
| Nevada | | | 2.0 | % |
| Pennsylvania | | | 2.0 | % |
| District of Columbia | | | 2.0 | % |
| Florida | | | 1.9 | % |
| Wisconsin | | | 1.7 | % |
| Indiana | | | 1.5 | % |
| Alaska | | | 1.5 | % |
| North Carolina | | | 1.5 | % |
| Other | | | 13.7 | % |
Portfolio Composition4 | | | | |
| (as a % of total investments) | | | | |
| Health Care | | | 19.1 | % |
| Tax Obligation/Limited | | | 13.7 | % |
| U.S. Guaranteed | | | 12.8 | % |
| Transportation | | | 12.4 | % |
| Utilities | | | 11.7 | % |
| Tax Obligation/General | | | 11.4 | % |
| Consumer Staples | | | 6.5 | % |
| Housing/Single Family | | | 5.2 | % |
| Other | | | 7.2 | % |
| | Refer to the Glossary of Terms Used in this Report for further definition of the terms used within this Fund’s Performance Overview page. |
| 1 | Taxable-Equivalent Yield represents the yield that must be earned on a fully taxable investment in order to equal the yield of the Fund on an after-tax basis. It is based on a federal income tax rate of 28%. When comparing this Fund to investments that generate qualified dividend income, the Taxable-Equivalent Yield is lower. |
| 2 | The Fund paid shareholders capital gains and net ordinary income distributions in December 2010 of $0.0887 per share. |
| 3 | Ratings shown are the highest of Standard & Poor’s Group, Moody’s Investor Service, Inc. or Fitch, Inc. AAA includes bonds with an implied AAA rating since they are backed by U.S. Government or agency securities. AAA, AA, A and BBB ratings are investment grade; BB, B, CCC, CC, C and D ratings are below-investment grade. Holdings designated N/R are not rated by any of these national rating agencies. |
| 4 | Holdings are subject to change. |
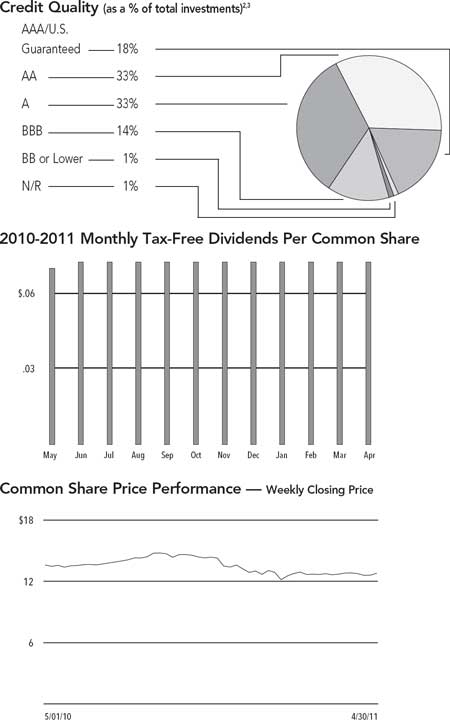
| NQU | | Nuveen Quality |
| Performance | | Income Municipal |
| OVERVIEW | | Fund, Inc. |
as of April 30, 2011

| Fund Snapshot | | | | |
| Common Share Price | | $ | 13.04 | |
| Common Share Net Asset Value (NAV) | | $ | 13.34 | |
| Premium/(Discount) to NAV | | | -2.25 | % |
| Market Yield | | | 7.27 | % |
Taxable-Equivalent Yield1 | | | 10.10 | % |
| Net Assets Applicable to Common Shares ($000) | | $ | 725,089 | |
Leverage (as a % of managed assets) | | | | |
| Structural Leverage | | | 32.95 | % |
| Effective Leverage | | | 38.48 | % |
| | | | | | | | |
Average Annual Total Return (Inception 6/19/91) | | | | | | | |
| | | | On Share Price | | On NAV |
| 6-Month (Cumulative) | | | -8.65 | % | | -6.81 | % |
| 1-Year | | | -3.00 | % | | -2.21 | % |
| 5-Year | | | 3.15 | % | | 3.23 | % |
| 10-Year | | | 5.32 | % | | 5.15 | % |
States3 (as a % of total investments) | | | | |
| California | | | 12.4 | % |
| Illinois | | | 9.6 | % |
| Texas | | | 7.9 | % |
| New York | | | 6.6 | % |
| Puerto Rico | | | 5.6 | % |
| South Carolina | | | 5.5 | % |
| Washington | | | 5.1 | % |
| Nevada | | | 4.6 | % |
| Ohio | | | 4.1 | % |
| New Jersey | | | 3.4 | % |
| Pennsylvania | | | 3.3 | % |
| Louisiana | | | 3.1 | % |
| Michigan | | | 2.9 | % |
| Colorado | | | 2.9 | % |
| Virginia | | | 2.6 | % |
| Arizona | | | 2.3 | % |
| North Carolina | | | 2.2 | % |
| Massachusetts | | | 1.8 | % |
| Other | | | 14.1 | % |
Portfolio Composition3 (as a % of total investments) | | | | |
| U.S. Guaranteed | | | 22.2 | % |
| Health Care | | | 15.5 | % |
| Transportation | | | 13.3 | % |
| Tax Obligation/General | | | 12.6 | % |
| Tax Obligation/Limited | | | 11.5 | % |
| Utilities | | | 9.7 | % |
| Consumer Staples | | | 6.4 | % |
| Education and Civic Organizations | | | 5.1 | % |
| Other | | | 3.7 | % |
| | Refer to the Glossary of Terms Used in this Report for further definition of the terms used within this Fund’s Performance Overview page. |
| 1 | Taxable-Equivalent Yield represents the yield that must be earned on a fully taxable investment in order to equal the yield of the Fund on an after-tax basis. It is based on a federal income tax rate of 28%. When comparing this Fund to investments that generate qualified dividend income, the Taxable-Equivalent Yield is lower. |
| 2 | Ratings shown are the highest of Standard & Poor’s Group, Moody’s Investor Service, Inc. or Fitch, Inc. AAA includes bonds with an implied AAA rating since they are backed by U.S. Government or agency securities. AAA, AA, A and BBB ratings are investment grade; BB, B, CCC, CC, C and D ratings are below-investment grade. Holdings designated N/R are not rated by any of these national rating agencies. |
| 3 | Holdings are subject to change. |
| NPF | | Nuveen Premier |
| Performance | | Municipal Income |
| OVERVIEW | | Fund, Inc. |
as of April 30, 2011
| Fund Snapshot | | | | |
| Common Share Price | | $ | 12.78 | |
| Common Share Net Asset Value (NAV) | | $ | 13.65 | |
| Premium/(Discount) to NAV | | | -6.37 | % |
| Market Yield | | | 6.81 | % |
Taxable-Equivalent Yield1 | | | 9.46 | % |
| Net Assets Applicable to Common Shares ($000) | | $ | 271,385 | |
Leverage (as a % of managed assets) | | | | |
| Structural Leverage | | | 29.07 | % |
| Effective Leverage | | | 37.81 | % |
Average Annual Total Return (Inception 12/19/91) | | | | | | | |
| | | | On Share Price | | On NAV |
| 6-Month (Cumulative) | | | -7.96 | % | | -4.25 | % |
| 1-Year | | | 1.00 | % | | 1.36 | % |
| 5-Year | | | 5.01 | % | | 3.72 | % |
| 10-Year | | | 4.94 | % | | 5.34 | % |
States3 (as a % of total investments) | | | | |
| California | | | 12.4 | % |
| New York | | | 10.4 | % |
| Colorado | | | 7.1 | % |
| Illinois | | | 7.1 | % |
| South Carolina | | | 5.1 | % |
| Arizona | | | 4.8 | % |
| Texas | | | 4.0 | % |
| Louisiana | | | 4.0 | % |
| Wisconsin | | | 3.8 | % |
| New Jersey | | | 3.3 | % |
| Washington | | | 3.1 | % |
| Minnesota | | | 3.1 | % |
| Georgia | | | 2.8 | % |
| North Carolina | | | 2.7 | % |
| Massachusetts | | | 2.6 | % |
| Michigan | | | 2.4 | % |
| Indiana | | | 2.0 | % |
| Ohio | | | 1.7 | % |
| Florida | | | 1.6 | % |
| New Hampshire | | | 1.4 | % |
| Other | | | 14.6 | % |
Portfolio Composition3 (as a % of total investments) | | | | |
| Tax Obligation/Limited | | | 18.9 | % |
| Transportation | | | 15.5 | % |
| Utilities | | | 14.4 | % |
| U.S. Guaranteed | | | 13.3 | % |
| Health Care | | | 11.9 | % |
| Tax Obligation/General | | | 8.6 | % |
| Water and Sewer | | | 5.1 | % |
| Other | | | 12.3 | % |
| | Refer to the Glossary of Terms Used in this Report for further definition of the terms used within this Fund’s Performance Overview page. |
| 1 | Taxable-Equivalent Yield represents the yield that must be earned on a fully taxable investment in order to equal the yield of the Fund on an after-tax basis. It is based on a federal income tax rate of 28%. When comparing this Fund to investments that generate qualified dividend income, the Taxable-Equivalent Yield is lower. |
| 2 | Ratings shown are the highest of Standard & Poor’s Group, Moody’s Investor Service, Inc. or Fitch, Inc. AAA includes bonds with an implied AAA rating since they are backed by U.S. Government or agency securities. AAA, AA, A and BBB ratings are investment grade; BB, B, CCC, CC, C and D ratings are below-investment grade. Holdings designated N/R are not rated by any of these national rating agencies. |
| 3 | Holdings are subject to change. |
| NMZ | | Nuveen Municipal |
| Performance | | High Income |
| OVERVIEW | | Opportunity Fund |
as of April 30, 2011
| Fund Snapshot | | | | |
| Common Share Price | | $ | 11.77 | |
| Common Share Net Asset Value (NAV) | | $ | 10.68 | |
| Premium/(Discount) to NAV | | | 10.21 | % |
| Market Yield | | | 8.51 | % |
Taxable-Equivalent Yield2 | | | 11.82 | % |
| Net Assets Applicable to Common Shares ($000) | | $ | 293,521 | |
Leverage (as a % of managed assets) | | | | |
| Structural Leverage | | | 24.45 | % |
| Effective Leverage | | | 24.45 | % |
Average Annual Total Return (Inception 11/19/03) | | | | | | | |
| | | | On Share Price | | On NAV |
| 6-Month (Cumulative) | | | -4.96 | % | | -7.76 | % |
| 1-Year | | | -2.77 | % | | -0.81 | % |
| 5-Year | | | 0.77 | % | | 0.98 | % |
| Since Inception | | | 4.40 | % | | 4.03 | % |
States4 (as a % of total investments)1 | | | | |
| California | | | 12.1 | % |
| Texas | | | 10.6 | % |
| Florida | | | 9.1 | % |
| Illinois | | | 6.8 | % |
| Colorado | | | 5.7 | % |
| Arizona | | | 5.0 | % |
| Wisconsin | | | 4.1 | % |
| Louisiana | | | 4.1 | % |
| Ohio | | | 3.3 | % |
| Indiana | | | 3.1 | % |
| Tennessee | | | 2.9 | % |
| Michigan | | | 2.8 | % |
| New Jersey | | | 2.4 | % |
| Nebraska | | | 2.1 | % |
| Washington | | | 2.0 | % |
| Missouri | | | 1.9 | % |
| North Carolina | | | 1.8 | % |
| Virgin Islands | | | 1.7 | % |
| New York | | | 1.6 | % |
| National | | | 1.3 | % |
| Maryland | | | 1.3 | % |
| Other | | | 14.3 | % |
Portfolio Composition4 | | | | |
(as a % of total investments)1 | | | | |
| Tax Obligation/Limited | | | 22.5 | % |
| Health Care | | | 21.4 | % |
| Education and Civic Organizations | | | 11.4 | % |
| Utilities | | | 8.0 | % |
| Transportation | | | 7.3 | % |
| Housing/Multifamily | | | 6.4 | % |
| Materials | | | 3.8 | % |
| Consumer Staples | | | 3.5 | % |
| Industrials | | | 3.3 | % |
| Other | | | 12.4 | % |
| | Refer to the Glossary of Terms Used in this Report for further definition of the terms used within this Fund’s Performance Overview page. |
| 1 | Excluding investments in derivatives. |
| 2 | Taxable-Equivalent Yield represents the yield that must be earned on a fully taxable investment in order to equal the yield of the Fund on an after-tax basis. It is based on a federal income tax rate of 28%. When comparing this Fund to investments that generate qualified dividend income, the Taxable-Equivalent Yield is lower. |
| 3 | Ratings shown are the highest of Standard & Poor’s Group, Moody’s Investor Service, Inc. or Fitch, Inc. AAA includes bonds with an implied AAA rating since they are backed by U.S. Government or agency securities. AAA, AA, A and BBB ratings are investment grade; BB, B, CCC, CC, C and D ratings are below-investment grade. Holdings designated N/R are not rated by any of these national rating agencies. |
| 4 | Holdings are subject to change. |
| NMD | | Nuveen Municipal |
| Performance | | High Income |
| OVERVIEW | | Opportunity Fund 2 |
as of April 30, 2011
| Fund Snapshot | | | | |
| Common Share Price | | $ | 10.79 | |
| Common Share Net Asset Value (NAV) | | $ | 10.50 | |
| Premium/(Discount) to NAV | | | 2.76 | % |
| Market Yield | | | 8.34 | % |
Taxable-Equivalent Yield2 | | | 11.58 | % |
| Net Assets Applicable to Common Shares ($000) | | $ | 187,062 | |
Leverage (as a % of managed assets) | | | | |
| Structural Leverage | | | 11.83 | % |
| Effective Leverage | | | 36.75 | % |
Average Annual Total Return
(Inception 11/15/07) | | | | | | | |
| | | | On Share Price | | On NAV |
| 6-Month (Cumulative) | | | -10.56 | % | | -8.06 | % |
| 1-Year | | | -7.54 | % | | -1.08 | % |
| Since Inception | | | -1.19 | % | | -0.46 | % |
States4 (as a % of total investments)1 | | | | |
| California | | | 11.8 | % |
| Illinois | | | 11.7 | % |
| Florida | | | 10.6 | % |
| Colorado | | | 7.6 | % |
| Texas | | | 7.3 | % |
| Washington | | | 5.0 | % |
| Arizona | | | 4.1 | % |
| Louisiana | | | 3.2 | % |
| Ohio | | | 3.2 | % |
| Indiana | | | 3.1 | % |
| Missouri | | | 2.9 | % |
| Utah | | | 2.8 | % |
| New Jersey | | | 2.8 | % |
| New York | | | 2.2 | % |
| Tennessee | | | 2.1 | % |
| Pennsylvania | | | 2.1 | % |
| Georgia | | | 2.0 | % |
| North Carolina | | | 2.0 | % |
| Other | | | 13.5 | % |
Portfolio Composition4 (as a % of total investments)1 | | | | |
| Health Care | | | 20.5 | % |
| Tax Obligation/Limited | | | 20.3 | % |
| Education and Civic Organizations | | | 14.2 | % |
| Transportation | | | 7.8 | % |
| Utilities | | | 6.5 | % |
| Consumer Discretionary | | | 5.9 | % |
| Long-Term Care | | | 4.8 | % |
| Materials | | | 4.7 | % |
| Consumer Staples | | | 4.4 | % |
| Other | | | 10.9 | % |
| | Refer to the Glossary of Terms Used in this Report for further definition of the terms used within this Fund’s Performance Overview page. |
| 1 | Excluding investments in derivatives. |
| 2 | Taxable-Equivalent Yield represents the yield that must be earned on a fully taxable investment in order to equal the yield of the Fund on an after-tax basis. It is based on a federal income tax rate of 28%. When comparing this Fund to investments that generate qualified dividend income, the Taxable-Equivalent Yield is lower. |
| 3 | Ratings shown are the highest of Standard & Poor’s Group, Moody’s Investor Service, Inc. or Fitch, Inc. AAA includes bonds with an implied AAA rating since they are backed by U.S. Government or agency securities. AAA, AA, A and BBB ratings are investment grade; BB, B, CCC, CC, C and D ratings are below-investment grade. Holdings designated N/R are not rated by any of these national rating agencies. |
| 4 | Holdings are subject to change. |
| | | Nuveen Investment Quality Municipal Fund, Inc. |
| NQM | | Portfolio of Investments |
| | | April 30, 2011 (Unaudited) |
| | Principal Amount (000) | | Description (1) | Optional Call Provisions (2) | Ratings (3) | | Value | |
| | | | Alabama – 1.6% (1.0% of Total Investments) | | | | | |
| $ | 3,800 | | Alabama Special Care Facilities Financing Authority, Revenue Bonds, Ascension Health, Series 2006C-2, 5.000%, 11/15/36 (UB) | 11/16 at 100.00 | AA+ | $ | 3,674,866 | |
| | | | Birmingham Special Care Facilities Financing Authority, Alabama, Revenue Bonds, Baptist Health System Inc., Series 2005A: | | | | | |
| | 1,200 | | 5.250%, 11/15/20 | 11/15 at 100.00 | Baa2 | | 1,184,040 | |
| | 800 | | 5.000%, 11/15/30 | 11/15 at 100.00 | Baa2 | | 680,816 | |
| | 1,650 | | Courtland Industrial Development Board, Alabama, Pollution Control Revenue Bonds, International Paper Company, Series 2005A, 5.000%, 6/01/25 | 6/15 at 100.00 | BBB | | 1,552,023 | |
| | 1,000 | | Jefferson County, Alabama, Limited Obligation School Warrants, Education Tax Revenue Bonds, Series 2004A, 5.250%, 1/01/23 – AGM Insured | 1/14 at 100.00 | AA+ | | 943,540 | |
| | 8,450 | | Total Alabama | | | | 8,035,285 | |
| | | | Alaska – 0.6% (0.4% of Total Investments) | | | | | |
| | | | Northern Tobacco Securitization Corporation, Alaska, Tobacco Settlement Asset-Backed Bonds, Series 2006A: | | | | | |
| | 4,000 | | 5.000%, 6/01/32 | 6/14 at 100.00 | Baa3 | | 2,774,159 | |
| | 500 | | 5.000%, 6/01/46 | 6/14 at 100.00 | Baa3 | | 297,680 | |
| | 4,500 | | Total Alaska | | | | 3,071,839 | |
| | | | Arizona – 2.0% (1.3% of Total Investments) | | | | | |
| | | | Glendale Industrial Development Authority, Arizona, Revenue Bonds, John C. Lincoln Health Network, Series 2005B: | | | | | |
| | 200 | | 5.250%, 12/01/24 | 12/15 at 100.00 | BBB | | 187,846 | |
| | 265 | | 5.250%, 12/01/25 | 12/15 at 100.00 | BBB | | 244,198 | |
| | 2,500 | | Mesa, Arizona, Utility System Revenue Bonds, Reset Option Longs, Series 11032- 11034, 14.835%, 7/01/26 – AGM Insured (IF) | 7/17 at 100.00 | AA+ | | 1,459,500 | |
| | 5,000 | | Phoenix, Arizona, Civic Improvement Corporation, Senior Lien Airport Revenue Bonds, Series 2008, Trust 1132, 9.155%, 1/01/32 (IF) | 7/18 at 100.00 | AA– | | 4,597,599 | |
| | 3,450 | | Salt Verde Financial Corporation, Arizona, Senior Gas Revenue Bonds, Citigroup Energy Inc Prepay Contract Obligations, Series 2007, 5.000%, 12/01/37 | No Opt. Call | A | | 2,870,849 | |
| | 965 | | Watson Road Community Facilities District, Arizona, Special Assessment Revenue Bonds, Series 2005, 6.000%, 7/01/30 | 7/16 at 100.00 | N/R | | 753,694 | |
| | 12,380 | | Total Arizona | | | | 10,113,686 | |
| | | | Arkansas – 0.7% (0.4% of Total Investments) | | | | | |
| | 3,290 | | University of Arkansas, Pine Bluff Campus, Revenue Bonds, Series 2005A, 5.000%, 12/01/30 – AMBAC Insured | 12/15 at 100.00 | Aa2 | | 3,368,334 | |
| | | | California – 24.5% (15.7% of Total Investments) | | | | | |
| | 1,500 | | ABAG Finance Authority for Non-Profit Corporations, California, Cal-Mortgage Insured Revenue Bonds, Channing House, Series 2010, 6.000%, 5/15/30 | 5/20 at 100.00 | A– | | 1,461,780 | |
| | 2,250 | | California Educational Facilities Authority, Revenue Bonds, University of Southern California, Series 2005, 4.750%, 10/01/28 (UB) | 10/15 at 100.00 | AA+ | | 2,282,625 | |
| | 1,000 | | California Educational Facilities Authority, Revenue Bonds, University of the Pacific, Series 2006, 5.000%, 11/01/30 | 11/15 at 100.00 | A2 | | 983,490 | |
| | 2,500 | | California Health Facilities Financing Authority, Revenue Bonds, Cedars-Sinai Medical Center, Series 2005, 5.000%, 11/15/27 | 11/15 at 100.00 | AAA | | 2,380,925 | |
| | 4,285 | | California Health Facilities Financing Authority, Revenue Bonds, Kaiser Permanante System, Series 2006, 5.000%, 4/01/37 | 4/16 at 100.00 | A+ | | 3,664,961 | |
| | 5,500 | | California Health Facilities Financing Authority, Revenue Bonds, Sutter Health, Series 2007A, 5.000%, 11/15/42 (UB) | 11/16 at 100.00 | AA– | | 4,732,090 | |
| | 810 | | California State Public Works Board, Lease Revenue Bonds, Various Capital Projects, Series 2009I-1, 6.375%, 11/01/34 | 11/19 at 100.00 | A2 | | 838,172 | |
| | 1,500 | | California State Public Works Board, Lease Revenue Bonds, Various Capital Projects, Series 2010A-1, 5.750%, 3/01/30 | 3/20 at 100.00 | A2 | | 1,492,185 | |
| | | Nuveen Investment Quality Municipal Fund, Inc. (continued) |
| NQM | | Portfolio of Investments |
April 30, 2011 (Unaudited)
| | Principal Amount (000) | | Description (1) | Optional Call Provisions (2) | Ratings (3) | | Value | |
| | | | California (continued) | | | | | |
| | | | California State, General Obligation Bonds, Various Purpose Series 2010: | | | | | |
| $ | 2,100 | | 5.250%, 3/01/30 | 3/20 at 100.00 | A1 | $ | 2,127,258 | |
| | 3,000 | | 5.500%, 3/01/40 | 3/20 at 100.00 | A1 | | 3,007,050 | |
| | | | California Statewide Communities Development Authority, Revenue Bonds, American Baptist Homes of the West, Series 2010: | | | | | |
| | 900 | | 6.000%, 10/01/29 | 10/19 at 100.00 | BBB | | 862,254 | |
| | 1,030 | | 6.250%, 10/01/39 | 10/19 at 100.00 | BBB | | 977,625 | |
| | 1,055 | | California Statewide Communities Development Authority, School Facility Revenue Bonds, Aspire Public Schools, Series 2010, 6.000%, 7/01/40 | 1/19 at 100.00 | N/R | | 925,594 | |
| | | | California Statewide Community Development Authority, Revenue Bonds, Daughters of Charity Health System, Series 2005A: | | | | | |
| | 1,000 | | 5.250%, 7/01/30 | 7/15 at 100.00 | BBB | | 812,210 | |
| | 2,000 | | 5.000%, 7/01/39 | 7/15 at 100.00 | BBB | | 1,444,940 | |
| | 1,390 | | California Statewide Community Development Authority, Revenue Bonds, Sutter Health, Tender Option Bond Trust 3175, 13.619%, 5/15/14 (IF) | No Opt. Call | AA– | | 1,280,843 | |
| | 1,900 | | Chula Vista, California, Industrial Development Revenue Bonds, San Diego Gas and Electric Company, Series 1996A, 5.300%, 7/01/21 | 6/14 at 102.00 | A | | 1,971,896 | |
| | 2,530 | | Commerce Joint Power Financing Authority, California, Tax Allocation Refunding Bonds, Redevelopment Projects 2 and 3, Series 2003A, 5.000%, 8/01/28 – RAAI Insured | 8/13 at 100.00 | BBB | | 2,146,503 | |
| | 145 | | Commerce Joint Power Financing Authority, California, Tax Allocation Refunding Bonds, Redevelopment Projects 2 and 3, Series 2003A, 5.000%, 8/01/28 (Pre-refunded 8/01/13) – RAAI Insured | 8/13 at 100.00 | N/R (4) | | 159,219 | |
| | 730 | | Davis Redevelopment Agency, California, Tax Allocation Bonds, Davis Redevelopment Project, Subordinate Series 2011A, 7.000%, 12/01/36 | 12/21 at 100.00 | A+ | | 742,206 | |
| | 1,500 | | Gavilan Loiont Community College District, Counties of Santa Clara and San Benito, California, General Obligation Bonds, Series 2011D, 5.750%, 8/01/35 (WI/DD, Settling 5/12/11) | 8/21 at 100.00 | Aa2 | | 1,545,420 | |
| | 2,000 | | Glendale Redevelopment Agency, California, Central Glendale Redevelopment Project, Tax Allocation Bonds, Series 2010, 5.500%, 12/01/24 | 12/16 at 100.00 | A | | 1,885,000 | |
| | | | Golden State Tobacco Securitization Corporation, California, Tobacco Settlement Asset-Backed Bonds, Series 2007A-1: | | | | | |
| | 3,000 | | 5.000%, 6/01/33 | 6/17 at 100.00 | Baa3 | | 2,002,650 | |
| | 1,000 | | 5.750%, 6/01/47 | 6/17 at 100.00 | Baa3 | | 678,860 | |
| | 610 | | 5.125%, 6/01/47 | 6/17 at 100.00 | Baa3 | | 372,192 | |
| | 9,740 | | Huntington Park Redevelopment Agency, California, Single Family Residential Mortgage Revenue Refunding Bonds, Series 1986A, 8.000%, 12/01/19 (ETM) | No Opt. Call | AAA | | 13,796,223 | |
| | 400 | | Jurupa Public Financing Authority, California, Superior Lien Revenue Bonds, Series 2010A, 5.000%, 9/01/33 | 9/20 at 100.00 | AA+ | | 374,184 | |
| | 500 | | Madera County, California, Certificates of Participation, Children’s Hospital Central California, Series 2010, 5.375%, 3/15/36 | 3/20 at 100.00 | A | | 456,245 | |
| | 2,700 | | M-S-R Energy Authority, California, Gas Revenue Bonds, Series 2009A, 7.000%, 11/01/34 | No Opt. Call | A | | 3,002,049 | |
| | 1,030 | | Natomas Union School District, Sacramento County, California, General Obligation Refunding Bonds, Series 1999, 5.950%, 9/01/21 – NPFG Insured | No Opt. Call | BBB+ | | 1,102,759 | |
| | 15,770 | | Ontario Redevelopment Financing Authority, San Bernardino County, California, Revenue Refunding Bonds, Redevelopment Project 1, Series 1995, 7.400%,
8/01/25 – NPFG Insured | No Opt. Call | Baa1 | | 17,843,755 | |
| | 1,265 | | Palomar Pomerado Health Care District, California, Certificates of Participation, Series 2009, 6.750%, 11/01/39 | 11/19 at 100.00 | Baa3 | | 1,227,986 | |
| | 1,875 | | Palomar Pomerado Health Care District, California, Certificates of Participation, Series 2010, 5.250%, 11/01/21 | 11/20 at 100.00 | Baa3 | | 1,823,400 | |
| | 13,145 | | Perris, California, GNMA Mortgage-Backed Securities Program Single Family Mortgage Revenue Bonds, Series 1988B, 8.200%, 9/01/23 (Alternative Minimum Tax) (ETM) | No Opt. Call | AAA | | 18,922,228 | |
| | 2,500 | | Petaluma, Sonoma County, California, Wastewater Revenue Bonds, Refunding Series 2011, 5.500%, 5/01/32 | 5/21 at 100.00 | AA– | | 2,521,050 | |
| | 3,415 | | Rancho Mirage Joint Powers Financing Authority, California, Revenue Bonds, Eisenhower Medical Center, Series 2004, 5.875%, 7/01/26 (Pre-refunded 7/01/14) | 7/14 at 100.00 | Baa1 (4) | | 3,945,691 | |
| | Principal Amount (000) | | Description (1) | Optional Call Provisions (2) | Ratings (3) | | Value | |
| | | | California (continued) | | | | | |
| $ | 5,000 | | Riverside Unified School District, Riverside County, California, General Obligation Bonds, Series 2002A, 5.000%, 2/01/27 – FGIC Insured | 2/12 at 101.00 | Aa2 | $ | 5,017,950 | |
| | | | San Diego County, California, Certificates of Participation, Burnham Institute, Series 2006: | | | | | |
| | 250 | | 5.000%, 9/01/21 | 9/15 at 102.00 | Baa3 | | 222,065 | |
| | 275 | | 5.000%, 9/01/23 | 9/15 at 102.00 | Baa3 | | 237,600 | |
| | 660 | | San Francisco Redevelopment Finance Authority, California, Tax Allocation Revenue Bonds, Mission Bay North Redevelopment Project, Series 2009C, 6.500%, 8/01/39 | 8/19 at 100.00 | A– | | 650,265 | |
| | | | San Joaquin Hills Transportation Corridor Agency, Orange County, California, Toll Road Revenue Refunding Bonds, Series 1997A: | | | | | |
| | 6,175 | | 0.000%, 1/15/28 – NPFG Insured | No Opt. Call | Baa1 | | 1,290,637 | |
| | 8,135 | | 0.000%, 1/15/34 – NPFG Insured | No Opt. Call | Baa1 | | 918,197 | |
| | 17,195 | | 0.000%, 1/15/35 – NPFG Insured | No Opt. Call | Baa1 | | 1,763,003 | |
| | 660 | | Santee Community Development Commission, California, Santee Redevelopment Project Tax Allocation Bonds, Series 2011A, 7.000%, 8/01/31 | 2/21 at 100.00 | A | | 677,008 | |
| | 1,000 | | Union City Community Redevelopment Agency, California, Tax Allocation Revenue Bonds, Redevelopment Project, Subordinate Lien Series 2011, 6.375%, 12/01/23 | No Opt. Call | A | | 1,026,720 | |
| | 3,185 | | University of California, General Revenue Bonds, Series 2005G, 4.750%, 5/15/31 – NPFG Insured | 5/13 at 101.00 | Aa1 | | 3,063,397 | |
| | 3,750 | | Wiseburn School District, Los Angeles County, California, General Obligation Bonds, Series 2011B, 0.000%, 8/01/36 (WI/DD, Settling 5/04/11) – AGM Insured | 8/31 at 100.00 | AA+ | | 1,300,688 | |
| | 143,860 | | Total California | | | | 121,961,048 | |
| | | | Colorado – 2.4% (1.5% of Total Investments) | | | | | |
| | 1,465 | | Colorado Health Facilities Authority, Colorado, Revenue Bonds, American Baptist Homes Project, Series 2009A, 7.750%, 8/01/39 | No Opt. Call | N/R | | 1,424,727 | |
| | 625 | | Colorado Health Facilities Authority, Colorado, Revenue Bonds, Total Longterm Care National Obligated Group Project, Series 2010A, 6.000%, 11/15/30 | 11/20 at 100.00 | N/R | | 590,013 | |
| | 14,500 | | E-470 Public Highway Authority, Colorado, Toll Revenue Bonds, Series 2004B, 0.000%, 3/01/36 – NPFG Insured | 9/20 at 41.72 | Baa1 | | 2,014,195 | |
| | 1,765 | | Park Creek Metropolitan District, Colorado, Senior Limited Property Tax Supported Revenue Refunding Bonds, Series 2011, 6.125%, 12/01/41 (WI/DD, Settling 5/12/11) – AGM Insured | 12/20 at 100.00 | AA+ | | 1,750,651 | |
| | 3,000 | | Park Creek Metropolitan District, Colorado, Senior Property Tax Supported Revenue Bonds, Series 2009, 6.250%, 12/01/30 – AGC Insured | 12/19 at 100.00 | AA+ | | 3,279,900 | |
| | 650 | | Public Authority for Colorado Energy, Natural Gas Purchase Revenue Bonds, Colorado Springs Utilities, Series 2008, 6.500%, 11/15/38 | No Opt. Call | A | | 667,732 | |
| | 2,365 | | Regional Transportation District, Colorado, Denver Transit Partners Eagle P3 Project Private Activity Bonds, Series 2010, 6.000%, 1/15/41 | 7/20 at 100.00 | Baa3 | | 2,166,646 | |
| | 24,370 | | Total Colorado | | | | 11,893,864 | |
| | | | Connecticut – 0.5% (0.3% of Total Investments) | | | | | |
| | 2,500 | | Harbor Point Infrastructure Improvement District, Connecticut, Special Obligation Revenue Bonds, Harbor Point Project, Series 2010A, 7.875%, 4/01/39 | 4/20 at 100.00 | N/R | | 2,621,699 | |
| | | | District of Columbia – 6.6% (4.2% of Total Investments) | | | | | |
| | 23,745 | | District of Columbia Water and Sewerage Authority, Public Utility Revenue Bonds, Series 1998, 5.500%, 10/01/23 – AGM Insured (UB) | 4/09 at 160.00 | AA+ | | 28,244,203 | |
| | 3,000 | | District of Columbia, General Obligation Bonds, Series 1998B, 6.000%, 6/01/16 – NPFG Insured | No Opt. Call | Aa2 | | 3,569,820 | |
| | 1,200 | | Washington Convention Center Authority, District of Columbia, Dedicated Tax Revenue Bonds, Tender Option Bond Trust 1606, 11.376%, 10/01/30 – AMBAC Insured (IF) | 10/16 at 100.00 | AA+ | | 995,771 | |
| | 27,945 | | Total District of Columbia | | | | 32,809,794 | |
| | | Nuveen Investment Quality Municipal Fund, Inc. (continued) |
| NQM | | Portfolio of Investments |
April 30, 2011 (Unaudited)
| | Principal Amount (000) | | Description (1) | Optional Call Provisions (2) | Ratings (3) | | Value | |
| | | | Florida – 7.8% (5.0% of Total Investments) | | | | | |
| $ | 1,000 | | Board of Regents, Florida State University, Housing Facility Revenue Bonds, Series 2005A, 5.000%, 5/01/27 – NPFG Insured | 5/15 at 101.00 | AA– | $ | 1,008,800 | |
| | 3,730 | | Brevard County Health Facilities Authority, Florida, Revenue Bonds, Health First Inc. Project, Series 2005, 5.000%, 4/01/24 | 4/16 at 100.00 | A– | | 3,697,661 | |
| | 250 | | Brevard County Health Facilities Authority, Florida, Revenue Bonds, Health First Inc. Project, Series 2009B, 7.000%, 4/01/39 | 4/19 at 100.00 | A– | | 268,333 | |
| | 1,150 | | Florida Higher Educational Facilities Financing Authority, Revenue Bonds, Nova Southeastern University, Refunding Series 2011, 6.375%, 4/01/31 | 4/21 at 100.00 | BBB | | 1,162,133 | |
| | 1,000 | | Habitat Community Development District, Florida, Capital Improvement Revenue Bonds, Series 2004, 5.850%, 5/01/35 | No Opt. Call | N/R | | 867,210 | |
| | 1,200 | | Hillsborough County Industrial Development Authority, Florida, Exempt Facilities Remarketed Revenue Bonds, National Gypsum Company, Apollo Beach Project, Series 2000B, 7.125%, 4/01/30 (Alternative Minimum Tax) | 4/12 at 100.00 | N/R | | 1,055,724 | |
| | 14,000 | | Miami-Dade County, Florida, Aviation Revenue Bonds, Miami International Airport Hub, Series 2007B, 4.500%, 10/01/31 – NPFG Insured | 10/17 at 100.00 | A2 | | 12,387,059 | |
| | 4,000 | | North Sumter County Utility Dependent District, Florida, Utility Revenue Bonds, Series 2010, 5.375%, 10/01/40 | 10/20 at 100.00 | AA+ | | 3,692,520 | |
| | 3,000 | | Northern Palm Beach County Improvement District, Florida, Revenue Bonds, Water Control and Improvement Development Unit 46B, Series 2007A, 5.350%, 8/01/41 | 8/17 at 100.00 | N/R | | 2,393,250 | |
| | 2,945 | | Old Palm Community Development District, Florida, Special Assessment Bonds, Palm Beach Gardens, Series 2004A, 5.900%, 5/01/35 | 5/15 at 101.00 | N/R | | 2,555,642 | |
| | 5,895 | | South Miami Health Facilities Authority, Florida, Hospital Revenue, Baptist Health System Obligation Group, Series 2007, 5.000%, 8/15/42 (UB) | 8/17 at 100.00 | AA | | 5,256,041 | |
| | 1,435 | | Tolomato Community Development District, Florida, Special Assessment Bonds, Series 2006, 5.400%, 5/01/37 | 5/14 at 101.00 | N/R | | 1,014,846 | |
| | 1,000 | | Tolomato Community Development District, Florida, Special Assessment Bonds, Series 2007, 6.650%, 5/01/40 | 5/18 at 100.00 | N/R | | 668,830 | |
| | 1,805 | | Westchester Community Development District 1, Florida, Special Assessment Bonds, Series 2003, 6.000%, 5/01/23 | 5/13 at 101.00 | N/R | | 1,631,503 | |
| | 1,250 | | Wyndam Park Community Development District, Florida, Special Assessment Bonds, Series 2003, 6.375%, 5/01/34 | 5/13 at 101.00 | A | | 1,254,213 | |
| | 43,660 | | Total Florida | | | | 38,913,765 | |
| | | | Georgia – 3.1% (2.0% of Total Investments) | | | | | |
| | 1,000 | | Atlanta, Georgia, Tax Allocation Bonds, Beltline Project Series 2008A. Remarketed, 7.500%, 1/01/31 | 1/19 at 100.00 | N/R | | 1,014,360 | |
| | 1,500 | | Atlanta, Georgia, Water and Wastewater Revenue Bonds, Series 2009B, 5.250%, 11/01/34 – AGM Insured | 11/19 at 100.00 | AA+ | | 1,511,250 | |
| | 2,000 | | Dalton Development Authority, Georgia, Revenue Certificates, Hamilton Health Care System Inc., Series 1996, 5.500%, 8/15/26 – NPFG Insured | No Opt. Call | Baa1 | | 1,916,820 | |
| | 5,980 | | Fulton County Development Authority, Georgia, Revenue Bonds, Georgia State University – TUFF/Atlanta Housing LLC, Series 2001A, 5.500%, 9/01/22 – AMBAC Insured | 9/11 at 102.00 | N/R | | 6,096,968 | |
| | 2,500 | | Gainesville and Hall County Hospital Authority, Georgia, Revenue Anticipation Certificates, Northeast Georgia Health Services Inc., Series 2010A, 5.000%, 2/15/30 | 2/20 at 100.00 | A– | | 2,346,150 | |
| | 2,250 | | Georgia Municipal Electric Authority, Project One Special Obligation Bonds, Fourth Crossover Series 1997E, 6.500%, 1/01/20 | No Opt. Call | A+ | | 2,634,323 | |
| | 15,230 | | Total Georgia | | | | 15,519,871 | |
| | | | Guam – 0.3% (0.2% of Total Investments) | | | | | |
| | 1,770 | | Guam Government Waterworks Authority, Water and Wastewater System Revenue Bonds, Series 2010, 5.625%, 7/01/40 | 7/20 at 100.00 | Ba2 | | 1,527,350 | |
| | | | | | | | | |
| | Principal Amount (000) | | Description (1) | Optional Call Provisions (2) | Ratings (3) | | Value | |
| | | | Idaho – 1.5% (1.0% of Total Investments) | | | | | |
| $ | 4,810 | | Boise City, Idaho, Revenue Refunding Bonds, Series 2001A, 5.375%, 12/01/31 – NPFG Insured | 12/11 at 100.00 | Aa2 | $ | 4,896,771 | |
| | 2,680 | | Idaho Housing and Finance Association, Single Family Mortgage Revenue Bonds, Series 2009BI, 5.650%, 7/01/26 | No Opt. Call | Aa3 | | 2,716,502 | |
| | 7,490 | | Total Idaho | | | | 7,613,273 | |
| | | | Illinois – 13.3% (8.5% of Total Investments) | | | | | |
| | 4,775 | | Chicago Public Building Commission, Illinois, General Obligation Lease Bonds, Chicago Transit Authority, Series 2003, 5.250%, 3/01/23 (Pre-refunded | 3/13 at 100.00 | N/R (4) | | 5,174,429 | |
| | | | 3/01/13) – AMBAC Insured | | | | | |
| | 510 | | Illinois Finance Authority, Revenue and Refunding Bonds, Roosevelt University Project, Series 2009, 6.500%, 4/01/44 | 10/19 at 100.00 | Baa2 | | 510,617 | |
| | 500 | | Illinois Finance Authority, Revenue Bonds, Admiral at Lake Project, Series 2010A, 7.750%, 5/15/30 | 5/20 at 100.00 | N/R | | 476,165 | |
| | 500 | | Illinois Finance Authority, Revenue Bonds, Admiral at Lake Project, Temps 75 Series 2010D-1, 7.000%, 5/15/18 | 11/12 at 100.00 | N/R | | 483,315 | |
| | 1,125 | | Illinois Finance Authority, Revenue Bonds, Central DuPage Health, Series 2009B, 5.500%, 11/01/39 | 11/19 at 100.00 | AA | | 1,075,196 | |
| | 1,000 | | Illinois Finance Authority, Revenue Bonds, Elmhurst Memorial Healthcare, Series 2008A, 5.625%, 1/01/37 | 1/18 at 100.00 | Baa1 | | 865,720 | |
| | 1,000 | | Illinois Finance Authority, Revenue Bonds, Little Company of Mary Hospital and Health Care Centers, Series 2010, 5.375%, 8/15/40 | No Opt. Call | A+ | | 876,930 | |
| | 990 | | Illinois Finance Authority, Revenue Bonds, OSF Healthcare System, Refunding Series 2010A, 6.000%, 5/15/39 | 5/20 at 100.00 | A | | 962,508 | |
| | | | Illinois Finance Authority, Revenue Bonds, OSF Healthcare System, Series 2004: | | | | | |
| | 2,500 | | 5.250%, 11/15/21 | 5/14 at 100.00 | A | | 2,507,250 | |
| | 1,000 | | 5.250%, 11/15/22 | 5/14 at 100.00 | A | | 992,120 | |
| | 2,000 | | Illinois Finance Authority, Revenue Bonds, Palos Community Hospital, Series 2010C, 5.125%, 5/15/35 | 5/20 at 100.00 | N/R | | 1,835,740 | |
| | 395 | | Illinois Finance Authority, Revenue Bonds, Proctor Hospital, Series 2006, 5.125%, 1/01/25 | 1/16 at 100.00 | BB+ | | 324,101 | |
| | 1,000 | | Illinois Finance Authority, Revenue Bonds, Provena Health, Series 2009A, 7.750%, 8/15/34 | 8/19 at 100.00 | BBB+ | | 1,077,700 | |
| | 1,120 | | Illinois Finance Authority, Revenue Bonds, Rush University Medical Center Obligated Group, Series 2009C, 6.625%, 11/01/39 | 5/19 at 100.00 | A2 | | 1,153,230 | |
| | 1,000 | | Illinois Finance Authority, Revenue Bonds, Sherman Health Systems, Series 2007A, 5.500%, 8/01/37 | 8/17 at 100.00 | BBB | | 861,300 | |
| | | | Illinois Finance Authority, Revenue Bonds, Silver Cross Hospital and Medical Centers, Series 2009: | | | | | |
| | 2,000 | | 6.875%, 8/15/38 | 8/19 at 100.00 | BBB | | 1,991,180 | |
| | 3,000 | | 7.000%, 8/15/44 | 8/19 at 100.00 | BBB | | 3,005,160 | |
| | 1,000 | | Illinois Finance Authority, Revenue Bonds, Southern Illinois Healthcare Enterprises, Inc., Series 2005 Remarketed, 5.250%, 3/01/30 – AGM Insured | 3/20 at 100.00 | AA+ | | 956,700 | |
| | 1,400 | | Illinois Finance Authority, Revenue Bonds, The University of Chicago Medical Center, Series 2009B, 5.000%, 8/15/26 | 8/20 at 100.00 | AA– | | 1,400,924 | |
| | 3,000 | | Illinois Finance Authority, Revenue Refunding Bonds, Resurrection Health Care Corporation, Series 2009, 6.125%, 5/15/25 | 5/19 at 100.00 | BBB+ | | 3,005,160 | |
| | | | Illinois Health Facilities Authority, Revenue Refunding Bonds, Elmhurst Memorial Healthcare, Series 2002: | | | | | |
| | 4,000 | | 5.500%, 1/01/22 | 1/13 at 100.00 | Baa1 | | 3,964,680 | |
| | 750 | | 5.625%, 1/01/28 | 1/13 at 100.00 | Baa1 | | 701,070 | |
| | 12,725 | | Kane, Cook and DuPage Counties School District 46, Elgin, Illinois, General Obligation School Bonds, Series 1997, 7.800%, 1/01/12 – AGM Insured | No Opt. Call | Aa3 | | 13,332,745 | |
| | 3,495 | | Madison County Community Unit School District 7, Edwardsville, Illinois, School Building Bonds, Series 1994, 5.850%, 2/01/13 – FGIC Insured (ETM) | No Opt. Call | N/R (4) | | 3,701,415 | |
| | 1,000 | | Metropolitan Pier and Exposition Authority, Illinois, Revenue Bonds, McCormick Place Expansion Project, Capital Appreciation Refunding Series 2010B-1, 5.000%, 6/15/50 | 6/20 at 100.00 | AAA | | 877,420 | |
| | | Nuveen Investment Quality Municipal Fund, Inc. (continued) |
| NQM | | Portfolio of Investments |
April 30, 2011 (Unaudited)
| | Principal Amount (000) | | Description (1) | Optional Call Provisions (2) | Ratings (3) | | Value | |
| | | | Illinois (continued) | | | | | |
| $ | 6,015 | | Metropolitan Pier and Exposition Authority, Illinois, Revenue Refunding Bonds, McCormick Place Expansion Project, Series 1996A, 0.000%, 12/15/21 – NPFG Insured | No Opt. Call | A2 | $ | 3,458,384 | |
| | | | Railsplitter Tobacco Settlement Authority, Illinois, Tobacco Settlement Revenue Bonds, Series 2010: | | | | | |
| | 1,550 | | 5.250%, 6/01/21 | No Opt. Call | A | | 1,537,957 | |
| | 4,000 | | 6.250%, 6/01/24 | No Opt. Call | A– | | 4,020,440 | |
| | 800 | | 6.000%, 6/01/28 | No Opt. Call | A– | | 772,616 | |
| | | | Will County High School District 204, Joliet, Illinois, General Obligation Bonds, Series 2001: | | | | | |
| | 1,145 | | 8.700%, 12/01/13 – AGM Insured | No Opt. Call | AA+ | | 1,335,620 | |
| | 1,300 | | 8.700%, 12/01/14 – AGM Insured | No Opt. Call | AA+ | | 1,581,528 | |
| | 1,180 | | Will County School District 17, Channahon, Illinois, General Obligation School Building Bonds, Series 2001, 8.400%, 12/01/13 – AMBAC Insured | No Opt. Call | Aa3 | | 1,360,446 | |
| | 67,775 | | Total Illinois | | | | 66,179,766 | |
| | | | Indiana – 2.2% (1.4% of Total Investments) | | | | | |
| | 1,050 | | Indiana Finance Authority, Educational Facilities Revenue Bonds, Drexel Foundation For Educational Excellence, Inc., Series 2009A, 7.000%, 10/01/39 | 10/19 at 100.00 | BBB– | | 1,001,543 | |
| | 1,500 | | Indiana Finance Authority, Hospital Refunding Revenue Bonds, Floyd Memorial Hospital and Health Services Project, Series 2010, 5.125%, 3/01/30 | 3/20 at 100.00 | A– | | 1,404,345 | |
| | 1,880 | | Indianapolis, Indiana, GNMA Collateralized Multifamily Housing Mortgage Revenue Bonds, Cloverleaf Apartments Project Phase I, Series 2000, 6.000%, 1/20/31 | 7/12 at 100.00 | Aaa | | 1,899,890 | |
| | 2,495 | | Shelbyville, Indiana, GNMA Collateralized Multifamily Housing Revenue Bonds, Blueridge Terrace Project, Series 2000, 6.050%, 1/20/36 | 7/11 at 101.00 | Aaa | | 2,520,972 | |
| | | | St. Joseph County Hospital Authority, Indiana, Revenue Bonds, Madison Center Inc., Series 2005: | | | | | |
| | 1,550 | | 5.250%, 2/15/23 (5) | 2/15 at 100.00 | N/R | | 402,690 | |
| | 2,500 | | 5.375%, 2/15/34 (5) | 2/15 at 100.00 | N/R | | 649,500 | |
| | 2,765 | | Wayne County Jail Holding Corporation, Indiana, First Mortgage Bonds, Series 2001, 5.750%, 7/15/14 (Pre-refunded 1/15/13) – AMBAC Insured | 1/13 at 101.00 | A1 (4) | | 3,036,910 | |
| | 13,740 | | Total Indiana | | | | 10,915,850 | |
| | | | Iowa – 1.7% (1.1% of Total Investments) | | | | | |
| | 3,000 | | Iowa Student Loan Liquidity Corporation, Student Loan Revenue Bonds, Refunding Series 2009-2, 5.500%, 12/01/25 | 12/19 at 100.00 | A1 | | 3,017,160 | |
| | 8,000 | | Iowa Tobacco Settlement Authority, Asset Backed Settlement Revenue Bonds, Series 2005C, 5.500%, 6/01/42 | 6/15 at 100.00 | BBB | | 5,477,039 | |
| | 11,000 | | Total Iowa | | | | 8,494,199 | |
| | | | Kansas – 1.4% (0.9% of Total Investments) | | | | | |
| | 1,000 | | Kansas Development Finance Authority, Health Facilities Revenue Bonds, Hays Medical Center Inc., Series 2005L, 5.000%, 11/15/22 | 11/15 at 100.00 | A2 | | 1,019,420 | |
| | 600 | | Overland Park Transportation Development District, Kansas, Sales Tax Revenue Bonds, Oak Park Mall Project, Series 2010, 5.900%, 4/01/32 | 4/20 at 100.00 | BBB | | 604,518 | |
| | 290 | | Sedgwick and Shawnee Counties, Kansas, GNMA Mortgage-Backed Securities Program Single Family Revenue Bonds, Series 1997A-1, 6.950%, 6/01/29 (Alternative Minimum Tax) | No Opt. Call | Aaa | | 303,552 | |
| | 2,560 | | Topeka, Kansas, Industrial Revenue Refunding Bonds, Sunwest Hotel Corporation, Series 1988, 9.500%, 10/01/16 (Pre-refunded 8/15/16) (Alternative Minimum Tax) | 8/16 at 100.00 | AAA | | 3,151,871 | |
| | 2,980 | | Wyandotte County-Kansas City Unified Government, Kansas, Sales Tax Special Obligation Capital Appreciation Revenue Bonds Redevelopment Project Area | No Opt. Call | N/R | | 1,650,831 | |
| | | | B – Major Multi-Sport Athletic Complex Project, Subordinate Lien Series 2010B, | | | | | |
| | | | 0.000%, 6/01/21 | | | | | |
| | 7,430 | | Total Kansas | | | | 6,730,192 | |
| | | | Kentucky – 2.2% (1.4% of Total Investments) | | | | | |
| | 2,000 | | Jefferson County, Kentucky, Health Facilities Revenue Refunding Bonds, Jewish Hospital HealthCare Services Inc., Series 1996, 5.700%, 1/01/21 – AMBAC Insured | 7/11 at 100.00 | A– | | 2,001,940 | |
| | 2,000 | | Kentucky Economic Development Finance Authority, Hospital Facilities Revenue Bonds, Owensboro Medical Health System, Series 2010A, 6.000%, 6/01/30 | 6/20 at 100.00 | Baa2 | | 1,889,300 | |
| | Principal Amount (000) | | Description (1) | Optional Call Provisions (2) | Ratings (3) | | Value | |
| | | | Kentucky (continued) | | | | | |
| $ | 2,010 | | Louisville and Jefferson County Metropolitan Government, Kentucky, Industrial Building Revenue Bonds, Sisters of Mercy of the Americas, Series 2006, 5.000%, 10/01/35 | 10/16 at 100.00 | N/R | $ | 1,850,446 | |
| | 5,000 | | Pikeville, Kentucky, Hospital Revenue Bonds, Pikeville Medical Center, Inc. Project, Improvement and Refunding Series 2011, 6.250%, 3/01/31 | 3/21 at 100.00 | A3 | | 5,025,000 | |
| | 11,010 | | Total Kentucky | | | | 10,766,686 | |
| | | | Louisiana – 1.6% (1.0% of Total Investments) | | | | | |
| | 440 | | East Baton Rouge Mortgage Finance Authority, Louisiana, GNMA/FNMA Mortgage-Backed Securities Program Family Mortgage Revenue Refunding Bonds, Series 1997D, 5.900%, 10/01/30 (Alternative Minimum Tax) | 10/11 at 100.00 | Aaa | | 457,811 | |
| | 1,380 | | Louisiana Local Government Environment Facilities and Community Development Authority, Revenue Bonds, Westlake Chemical Corporation Projects, Series 2009A, 6.500%, 8/01/29 (Mandatory put 8/01/20) | 8/20 at 100.00 | BBB– | | 1,405,737 | |
| | 1,000 | | Louisiana Local Government Environmental Facilities & Community Development Authority, Revenue Bonds, Westlake Chemical Corporation Project, Series 2007, 6.750%, 11/01/32 | 11/17 at 100.00 | BBB– | | 1,021,360 | |
| | 3,000 | | Louisiana Public Facilities Authority, Hospital Revenue Bonds, Franciscan Missionaries of Our Lady Health System, Series 2005A, 5.250%, 8/15/31 | 8/15 at 100.00 | A+ | | 2,731,140 | |
| | 2,500 | | Louisiana Public Facilities Authority, Revenue Bonds, Ochsner Clinic Foundation Project, Series 2007A, 5.500%, 5/15/47 | 5/17 at 100.00 | Baa1 | | 2,081,275 | |
| | 8,320 | | Total Louisiana | | | | 7,697,323 | |
| | | | Maine – 0.3% (0.2% of Total Investments) | | | | | |
| | 1,665 | | Maine Health and Higher Educational Facilities Authority Revenue Bonds, Series 2010A, 5.000%, 7/01/40 | 7/20 at 100.00 | A1 | | 1,598,283 | |
| | | | Maryland – 0.6% (0.4% of Total Investments) | | | | | |
| | 515 | | Maryland Health and Higher Educational Facilities Authority, Revenue Bonds, Patterson Park Public Charter School Issue, Series 2010, 6.000%, 7/01/40 | 7/20 at 100.00 | BBB– | | 451,830 | |
| | 2,500 | | Maryland Health and Higher Educational Facilities Authority, Revenue Bonds, MedStar Health, Series 2004, 5.375%, 8/15/24 | 8/14 at 100.00 | A2 | | 2,521,825 | |
| | 3,015 | | Total Maryland | | | | 2,973,655 | |
| | | | Massachusetts – 3.7% (2.4% of Total Investments) | | | | | |
| | 4,700 | | Massachusetts Development Financing Authority, Assisted Living Revenue Bonds, Prospect House Apartments, Series 1999, 7.000%, 12/01/31 | 6/11 at 101.00 | N/R | | 4,303,790 | |
| | 1,875 | | Massachusetts Health and Educational Facilities Authority, Revenue Bonds, UMass Memorial Health Care, Series 2001C, 6.500%, 7/01/21 | 7/11 at 100.00 | BBB+ | | 1,881,038 | |
| | 1,900 | | Massachusetts Health and Educational Facilities Authority, Revenue Refunding Bonds, Suffolk University Issue, Series 2009A, 5.750%, 7/01/39 | 7/19 at 100.00 | BBB | | 1,802,302 | |
| | 2,030 | | Massachusetts Industrial Finance Agency, Resource Recovery Revenue Refunding Bonds, Ogden Haverhill Project, Series 1998A, 5.600%, 12/01/19 (Alternative Minimum Tax) | 6/11 at 100.00 | A– | | 2,035,298 | |
| | 5,100 | | Massachusetts School Building Authority, Dedicated Sales Tax Revenue Bonds, Series 2005A, 5.000%, 8/15/23 – AGM Insured (UB) | 8/15 at 100.00 | AA+ | | 5,459,244 | |
| | 3,120 | | Massachusetts Water Resources Authority, General Revenue Bonds, Series 2007A, 4.500%, 8/01/46 – AGM Insured (UB) (7) | 2/17 at 100.00 | AA+ | | 2,851,430 | |
| | 18,725 | | Total Massachusetts | | | | 18,333,102 | |
| | | | Michigan – 5.0% (3.2% of Total Investments) | | | | | |
| | 4,250 | | Detroit City School District, Wayne County, Michigan, Unlimited Tax School Building and Site Improvement Bonds, Series 2001A, 5.500%, 5/01/20 (Pre-refunded 5/01/12) – AGM Insured | 5/12 at 100.00 | AA+ (4) | | 4,465,943 | |
| | 2,500 | | Detroit, Michigan, Distributable State Aid General Obligation Bonds, Limited Tax Series 2010, 5.000%, 11/01/30 | 11/20 at 100.00 | AA | | 2,448,150 | |
| | 10,215 | | Detroit, Michigan, Water Supply System Revenue Refunding Bonds, Series 1993, 6.500%, 7/01/15 – FGIC Insured | No Opt. Call | A+ | | 11,314,134 | |
| | 1,350 | | Michigan State Building Authority, Revenue Bonds, Facilities Program, Series 2005II, 5.000%, 10/15/22 – AMBAC Insured | 10/15 at 100.00 | Aa3 | | 1,378,620 | |
| | | Nuveen Investment Quality Municipal Fund, Inc. (continued) |
| NQM | | Portfolio of Investments |
April 30, 2011 (Unaudited)
| | | | | | | | | |
| | Principal Amount (000) | | Description (1) | Optional Call Provisions (2) | Ratings (3) | | Value | |
| | | | Michigan (continued) | | | | | |
| $ | 3,240 | | Michigan State Hospital Finance Authority, Hospital Revenue Bonds, Henry Ford Health System, Refunding Series 2009, 5.750%, 11/15/39 | 11/19 at 100.00 | A1 | $ | 3,037,662 | |
| | 2,000 | | Michigan State Hospital Finance Authority, Revenue Bonds, Trinity Health Care Group, Series 2006A, 5.000%, 12/01/31 (UB) | 12/16 at 100.00 | AA | | 1,875,240 | |
| | 340 | | Monroe County Hospital Finance Authority, Michigan, Mercy Memorial Hospital Corporation Revenue Bonds, Series 2006, 5.500%, 6/01/35 | 6/16 at 100.00 | BBB– | | 283,067 | |
| | 23,895 | | Total Michigan | | | | 24,802,816 | |
| | | | Minnesota – 4.1% (2.6% of Total Investments) | | | | | |
| | 2,750 | | Cohasset, Minnesota, Pollution Control Revenue Bonds, Allete Inc., Series 2004, 4.950%, 7/01/22 | 7/14 at 100.00 | A2 | | 2,779,865 | |
| | 5,000 | | Dakota and Washington Counties Housing and Redevelopment Authority, Minnesota, GNMA Mortgage-Backed Securities Program Single Family Residential Mortgage Revenue Bonds, Series 1988, 8.450%, 9/01/19 (Alternative Minimum Tax) (ETM) | No Opt. Call | AAA | | 6,685,700 | |
| | 2,000 | | Duluth Housing & Redevelopment Authority, Minnesota, Lease Revenue Bonds, Duluth Public Schools Academy, Series 2010A, 5.875%, 11/01/40 | 11/20 at 100.00 | BBB– | | 1,658,720 | |
| | 620 | | Minnesota Agricultural and Economic Development Board, Healthcare System Revenue Bonds, Fairview Hospital and Healthcare Services, Series 2000A, 6.375%, 11/15/29 | 11/11 at 100.00 | A | | 621,959 | |
| | 1,000 | | St. Paul Housing and Redevelopment Authority, Minnesota, Revenue Bonds, Healtheast Inc., Series 2005, 6.000%, 11/15/25 | 11/15 at 100.00 | BB+ | | 930,280 | |
| | 2,000 | | Washington County Housing & Redevelopment Authority, Minnesota, Hospital Facility Revenue Bonds, Healtheast Project, Series 1998, 5.500%, 11/15/27 | 7/11 at 100.00 | BB+ | | 1,722,680 | |
| | 6,280 | | Washington County, Minnesota, General Obligation Bonds, Capital Improvement Plan, Series 2007A, 3.500%, 2/01/28 | 8/17 at 100.00 | AAA | | 5,758,195 | |
| | 19,650 | | Total Minnesota | | | | 20,157,399 | |
| | | | Mississippi – 0.7% (0.4% of Total Investments) | | | | | |
| | 1,000 | | Mississippi Business Finance Corporation, Pollution Control Revenue Refunding Bonds, System Energy Resources Inc. Project, Series 1998, 5.875%, 4/01/22 | 10/11 at 100.00 | BBB | | 980,240 | |
| | 2,275 | | Mississippi Hospital Equipment and Facilities Authority, Revenue Bonds, Baptist Memorial Healthcare, Series 2004B-1, 5.000%, 9/01/24 (UB) | 9/14 at 100.00 | AA | | 2,308,352 | |
| | 3,275 | | Total Mississippi | | | | 3,288,592 | |
| | | | Missouri – 1.7% (1.1% of Total Investments) | | | | | |
| | 2,000 | | Hanley Road Corridor Transportation Development District, Brentwood and Maplewood, Missouri, Transportation Sales Revenue Bonds, Refunding Series 2009A, 5.875%, 10/01/36 | 10/19 at 100.00 | A– | | 1,953,480 | |
| | 200 | | Hannibal Industrial Development Authority, Missouri, Health Facilities Revenue Bonds, Hannibal Regional Hospital, Series 2006, 5.000%, 3/01/22 | 3/16 at 100.00 | BBB+ | | 195,248 | |
| | 1,000 | | Jackson County Reorganized School District R-7, Lees Summit, Missouri, General Obligation Bonds, Series 2006, 5.250%, 3/01/26 – NPFG Insured | 3/16 at 100.00 | Aa1 | | 1,072,900 | |
| | | | Missouri Development Finance Board, Infrastructure Facilities Revenue Bonds, Branson Landing Project, Series 2005A: | | | | | |
| | 780 | | 6.000%, 6/01/20 | No Opt. Call | A | | 846,994 | |
| | 1,525 | | 5.000%, 6/01/35 | 6/15 at 100.00 | A | | 1,364,006 | |
| | 2,985 | | Missouri Development Finance Board. Infrastructure Facilities Revenue Bonds, City of Independence, Missouri – Events Center Project, Series 2009F, 6.250%, 4/01/38 | 4/14 at 100.00 | A– | | 3,039,685 | |
| | 8,490 | | Total Missouri | | | | 8,472,313 | |
| | | | Nebraska – 2.1% (1.4% of Total Investments) | | | | | |
| | 11,215 | | Lincoln, Nebraska, Electric System Revenue Bonds, Series 2007A, 4.500%, 9/01/37 – FGIC Insured (UB) | 9/17 at 100.00 | AA | | 10,494,773 | |
| | | | Nevada – 1.6 (1.0% of Total Investments) | | | | | |
| | 4,000 | | Clark County, Nevada, Airport Revenue Bonds, Subordinate Lien Series 2010B, 5.750%, 7/01/42 | 1/20 at 100.00 | Aa3 | | 4,043,160 | |
| | 7,530 | | Director of Nevada State Department of Business and Industry, Revenue Bonds, Las Vegas Monorail Project, First Tier, Series 2000, 5.625%, 1/01/34 – AMBAC Insured (5) | 1/12 at 100.00 | N/R | | 1,888,675 | |
| | | | | | | | | |
| | Principal Amount (000) | | Description (1) | Optional Call Provisions (2) | Ratings (3) | | Value | |
| | | | Nevada (continued) | | | | | |
| $ | 1,600 | | Las Vegas Redevelopment Agency, Nevada, Tax Increment Revenue Bonds, Series 2009A, 8.000%, 6/15/30 | 6/19 at 100.00 | A | $ | 1,777,216 | |
| | 13,130 | | Total Nevada | | | | 7,709,051 | |
| | | | New Hampshire – 0.1% (0.1% of Total Investments) | | | | | |
| | 695 | | New Hampshire Housing Finance Authority, Single Family Mortgage Acquisition Bonds, Series 2007-E, 5.750%, 1/01/37 (Alternative Minimum Tax) | 7/17 at 100.00 | Aa2 | | 725,406 | |
| | | | New Jersey – 3.0% (1.9% of Total Investments) | | | | | |
| | 1,760 | | New Jersey Economic Development Authority, Cigarette Tax Revenue Bonds, Series 2004, 5.500%, 6/15/24 | 6/12 at 100.00 | BBB | | 1,642,802 | |
| | | | New Jersey Economic Development Authority, School Facilities Construction Bonds, Series 2005P: | | | | | |
| | 1,325 | | 5.250%, 9/01/24 | 9/15 at 100.00 | A+ | | 1,349,208 | |
| | 1,000 | | 5.250%, 9/01/26 | 9/15 at 100.00 | A+ | | 1,014,630 | |
| | 555 | | New Jersey Economic Development Authority, Student Housing Revenue Bonds, Provident Group-Montclair Properties LLC, Montclair State University Student Housing Project, Series 2010A, 5.750%, 6/01/31 | 6/20 at 100.00 | Baa3 | | 516,866 | |
| | 600 | | New Jersey Educational Facilities Authority, Revenue Refunding Bonds, University of Medicine and Dentistry of New Jersey, Series 2009B, 7.500%, 12/01/32 | 6/19 at 100.00 | Baa1 | | 664,950 | |
| | 680 | | New Jersey Health Care Facilities Financing Authority, New Jersey, Revenue Bonds, Saint Peters University Hospital, Series 2007, 5.750%, 7/01/37 | 7/18 at 100.00 | BBB– | | 582,882 | |
| | 665 | | New Jersey Higher Education Assistance Authority, Student Loan Revenue Bonds, Tender Option Bond Trust PA-4643, 19.550%, 6/01/30 (IF) (7) | 6/19 at 100.00 | AA | | 743,151 | |
| | 3,425 | | New Jersey Transportation Trust Fund Authority, Transportation System Bonds, Refunding Series 2006A, 5.250%, 12/15/20 | No Opt. Call | A+ | | 3,702,699 | |
| | 700 | | New Jersey Turnpike Authority, Revenue Bonds, Series 2009E, 5.250%, 1/01/40 | 1/19 at 100.00 | A+ | | 701,701 | |
| | 1,225 | | Tobacco Settlement Financing Corporation, New Jersey, Tobacco Settlement Asset-Backed Bonds, Series 2002, 5.750%, 6/01/32 (Pre-refunded 6/01/12) | 6/12 at 100.00 | AAA | | 1,275,850 | |
| | 4,250 | | Tobacco Settlement Financing Corporation, New Jersey, Tobacco Settlement Asset-Backed Bonds, Series 2007-1A, 4.750%, 6/01/34 | 6/17 at 100.00 | Baa3 | | 2,640,058 | |
| | 16,185 | | Total New Jersey | | | | 14,834,797 | |
| | | | New Mexico – 0.8% (0.5% of Total Investments) | | | | | |
| | | | Farmington, New Mexico, Hospital Revenue Bonds, San Juan Regional Medical Center Inc., Series 2004A: | | | | | |
| | 880 | | 5.125%, 6/01/17 | 6/14 at 100.00 | A3 | | 918,738 | |
| | 1,295 | | 5.125%, 6/01/19 | 6/14 at 100.00 | A3 | | 1,333,591 | |
| | 2,000 | | Farmington, New Mexico, Pollution Control Revenue Refunding Bonds, Public Service Company of New Mexico San Juan Project, Series 2010D, 5.900%, 6/01/40 | 6/20 at 100.00 | Baa3 | | 1,878,880 | |
| | 4,175 | | Total New Mexico | | | | 4,131,209 | |
| | | | New York – 18.0% (11.6% of Total Investments) | | | | | |
| | | | Brooklyn Areba Local Development Corporation, New York, Payment in Lieu of Taxes Revenue Bonds, Barclays Center Project, Series 2009: | | | | | |
| | 1,945 | | 6.000%, 7/15/30 | 1/20 at 100.00 | BBB– | | 1,886,611 | |
| | 3,065 | | 6.250%, 7/15/40 | No Opt. Call | BBB– | | 3,020,527 | |
| | 1,665 | | Dormitory Authority of the State of New York, State Personal Income Tax Revenue Bonds, Series 2005F, 5.000%, 3/15/24 – AMBAC Insured | 3/15 at 100.00 | AAA | | 1,772,609 | |
| | 4,055 | | Hudson Yards Infrastructure Corporation, New York, Revenue Bonds, Series 2006A, 4.500%, 2/15/47 – NPFG Insured | 2/17 at 100.00 | A | | 3,086,017 | |
| | 1,000 | | Metropolitan Transportation Authority, New York, Dedicated Tax Fund Bonds, Series 2009B, 5.000%, 11/15/34 | 11/19 at 100.00 | AA | | 1,002,040 | |
| | 2,250 | | Metropolitan Transportation Authority, New York, Transportation Revenue Bonds, Series 2005B, 5.000%, 11/15/30 – AMBAC Insured | 11/15 at 100.00 | A | | 2,237,445 | |
| | 3,200 | | Metropolitan Transportation Authority, New York, Transportation Revenue Bonds, Series 2005F, 5.000%, 11/15/30 | 11/15 at 100.00 | A | | 3,182,144 | |
| | | Nuveen Investment Quality Municipal Fund, Inc. (continued) |
| NQM | | Portfolio of Investments |
April 30, 2011 (Unaudited)
| | Principal Amount (000) | | Description (1) | Optional Call Provisions (2) | Ratings (3) | | Value | |
| | | | New York (continued) | | | | | |
| | | | New York City Industrial Development Agency, New York, Civic Facility Revenue Bonds, Bronx Parking Development Company, LLC Project, Series 2007: | | | | | |
| $ | 500 | | 5.750%, 10/01/37 | 10/17 at 100.00 | N/R | $ | 312,305 | |
| | 1,000 | | 5.875%, 10/01/46 | 10/17 at 102.00 | N/R | | 624,710 | |
| | 7,800 | | New York City Municipal Water Finance Authority, New York, Water and Sewerage System Revenue Bonds, Fiscal Series 2005B, 5.000%, 6/15/28 – AMBAC Insured | 12/14 at 100.00 | AAA | | 8,030,022 | |
| | 500 | | New York City Municipal Water Finance Authority, New York, Water and Sewerage System Revenue Bonds, Tender Option Bond Trust 3484, 17.712%, 6/15/33 (IF) | 6/19 at 100.00 | AA+ | | 501,860 | |
| | 5,570 | | New York City Transitional Finance Authority, New York, Future Tax Secured Bonds, Fiscal Series 2004C, 5.000%, 2/01/22 (UB) | 2/14 at 100.00 | AAA | | 5,939,904 | |
| | 5,000 | | New York City, New York, General Obligation Bonds, Fiscal Series 2003J, 5.500%, 6/01/20 (Pre-refunded 6/01/13) | 6/13 at 100.00 | AA (4) | | 5,504,250 | |
| | 4,200 | | New York City, New York, General Obligation Bonds, Fiscal Series 2005J, 5.000%, 3/01/25 | 3/15 at 100.00 | AA | | 4,366,068 | |
| | 7,000 | | New York City, New York, General Obligation Bonds, Fiscal Series 2005M, 5.000%, 4/01/24 (UB) | 4/15 at 100.00 | AA | | 7,347,690 | |
| | 5,000 | | New York City, New York, General Obligation Bonds, Series 2004C-1, 5.250%, 18.773%, 8/15/20 (UB) | 8/14 at 100.00 | AA | | 5,495,950 | |
| | 5,000 | | New York State Municipal Bond Bank Agency, Special School Purpose Revenue Bonds, Series 2003C, 5.250%, 12/01/19 | 6/13 at 100.00 | A+ | | 5,304,100 | |
| | 5,400 | | New York State Tobacco Settlement Financing Corporation, Tobacco Settlement Asset-Backed and State Contingency Contract-Backed Bonds, Series 2003A-1, 5.500%, 6/01/16 | 7/11 at 100.00 | AA– | | 5,417,604 | |
| | 4,205 | | New York State Urban Development Corporation, State Personal Income Tax Revenue Bonds, Series 2004A-1, 5.000%, 3/15/23 – FGIC Insured | 3/14 at 100.00 | AAA | | 4,467,939 | |
| | | | Port Authority of New York and New Jersey, Special Project Bonds, JFK International Air Terminal LLC Project, Eigth Series 2010: | | | | | |
| | 590 | | 5.500%, 12/01/31 | 12/20 at 100.00 | BBB– | | 567,964 | |
| | 1,325 | | 6.000%, 12/01/42 | 12/20 at 100.00 | BBB– | | 1,274,915 | |
| | 16,445 | | Port Authority of New York and New Jersey, Special Project Bonds, JFK International Air Terminal LLC, Sixth Series 1997, 7.000%, 12/01/12 – NPFG Insured (Alternative Minimum Tax) | No Opt. Call | Baa1 | | 17,186,012 | |
| | 1,170 | | Suffolk County Economic Development Corporation, New York, Revenue Refunding Bonds, Peconic Landing At Southold, Inc. Project, Series 2010, 5.875%, 12/01/30 | 12/20 at 100.00 | N/R | | 1,140,071 | |
| | 87,885 | | Total New York | | | | 89,668,757 | |
| | | | North Carolina – 1.5% (1.0% of Total Investments) | | | | | |
| | 7,420 | | North Carolina Medical Care Commission, Health System Revenue Bonds, Mission St. Joseph’s Health System, Series 2001, 5.250%, 10/01/26 (Pre-refunded 10/01/11) | 10/11 at 101.00 | AA (4) | | 7,649,426 | |
| | | | North Dakota – 0.5% (0.3% of Total Investments) | | | | | |
| | 2,190 | | Fargo, North Dakota, Health System Revenue Bonds, Sanford Series 2011, 6.250%, 11/01/31 | 11/21 at 100.00 | AA– | | 2,285,988 | |
| | | | Ohio – 3.9% (2.5% of Total Investments) | | | | | |
| | | | Buckeye Tobacco Settlement Financing Authority, Ohio, Tobacco Settlement Asset-Backed Revenue Bonds, Senior Lien, Series 2007A-2: | | | | | |
| | 3,120 | | 5.125%, 6/01/24 | 6/17 at 100.00 | Baa3 | | 2,410,699 | |
| | 530 | | 5.875%, 6/01/30 | 6/17 at 100.00 | Baa3 | | 382,469 | |
| | 525 | | 5.750%, 6/01/34 | 6/17 at 100.00 | Baa3 | | 361,725 | |
| | 1,000 | | 6.500%, 6/01/47 | 6/17 at 100.00 | Baa3 | | 741,880 | |
| | 1,180 | | 5.875%, 6/01/47 | 6/17 at 100.00 | Baa3 | | 796,134 | |
| | | | Butler County, Ohio, Hospital Facilities Revenue Bonds, UC Health, Series 2010: | | | | | |
| | 1,000 | | 5.250%, 11/01/29 | 11/20 at 100.00 | BBB+ | | 860,780 | |
| | 1,000 | | 5.750%, 11/01/40 | 11/20 at 100.00 | BBB+ | | 863,670 | |
| | 5,000 | | 5.500%, 11/01/40 | 11/20 at 100.00 | BBB+ | | 4,160,550 | |
| | 760 | | Franklin County, Ohio, Healthcare Facilities Revenue Bonds, Ohio Presbyterian Retirement Services, Improvement Series 2010A, 5.625%, 7/01/26 | 7/21 at 100.00 | BBB | | 740,278 | |
| | 1,400 | | Lorain County Port Authority, Ohio, Recovery Zone Facility Economic Development Revenue Bonds, United State Steel Corporation Project, Series 2010, 6.750%, 12/01/40 | 12/20 at 100.00 | BB | | 1,424,570 | |
| | 5,765 | | Lucas County, Ohio, Hospital Revenue Bonds, ProMedica Healthcare Obligated Group, Series 2011A, 6.000%, 11/15/41 | 11/21 at 100.00 | AA– | | 5,782,641 | |
| | Principal Amount (000) | | Description (1) | Optional Call Provisions (2) | Ratings (3) | | Value | |
| | | | Ohio (continued) | | | | | |
| $ | 800 | | Ohio Air Quality Development Authority, Ohio, Revenue Bonds, Ohio Valley Electric Corporation Project, Series 2009E, 5.625%, 10/01/19 | No Opt. Call | BBB– | $ | 806,632 | |
| | 250 | | Port of Greater Cincinnati Development Authority, Ohio, Economic Development Revenue Bonds, Sisters of Mercy of the Americas, Series 2006, 5.000%, 10/01/25 | 10/16 at 100.00 | N/R | | 239,695 | |
| | 22,330 | | Total Ohio | | | | 19,571,723 | |
| | | | Oklahoma – 1.2% (0.8% of Total Investments) | | | | | |
| | 750 | | Norman Regional Hospital Authority, Oklahoma, Hospital Revenue Bonds, Series 2005, 5.375%, 9/01/36 | 9/16 at 100.00 | BB+ | | 601,035 | |
| | 5,280 | | Tulsa County Industrial Authority, Oklahoma, Health Care Revenue Bonds, Saint Francis Health System, Series 2006, 5.000%, 12/15/36 (UB) | 12/16 at 100.00 | AA+ | | 5,073,288 | |
| | 88 | | Tulsa County Industrial Authority, Oklahoma, Health Care Revenue Bonds, Saint Francis Health System, Series 2008, Trust 3500, 8.356%, 12/15/30 (IF) | 12/16 at 100.00 | AA+ | | 81,729 | |
| | 6,118 | | Total Oklahoma | | | | 5,756,052 | |
| | | | Pennsylvania – 3.9% (2.5% of Total Investments) | | | | | |
| | 1,000 | | Allegheny Country Industrial Development Authority, Allegheny County, Pennsylvania, Environmental Improvement Revenue Bonds, United States Steel Corporation Project, Refunding Series 2009, 6.750%, 11/01/24 | No Opt. Call | BB | | 1,057,300 | |
| | 2,000 | | Allegheny County Hospital Development Authority, Pennsylvania, University of Pittsburgh Medical Center Revenue Bonds, Series 2009A, 5.375%, 8/15/29 | 8/19 at 100.00 | Aa3 | | 1,984,880 | |
| | 500 | | Bucks County Industrial Development Authority, Pennsylvania, Charter School Revenue Bonds, School Lane Charter School, Series 2007A, 5.000%, 3/15/37 | 3/17 at 100.00 | BBB | | 381,185 | |
| | 3,000 | | Commonwealth Financing Authority, Pennsylvania, State Appropriation Lease Bonds, Series 2006A, 5.000%, 6/01/26 – AGM Insured (UB) | 6/16 at 100.00 | AA+ | | 3,095,640 | |
| | 1,000 | | Cumberland County Municipal Authority Revenue Bonds, Pennsylvania, Diakon Lutheran Social Ministries Project, Series 2009, 6.125%, 1/01/29 | 1/19 at 100.00 | N/R | | 990,850 | |
| | 400 | | Pennsylvania Higher Educational Facilities Authority, Revenue Bonds, Edinboro University Foundation Student Housing Project, Series 2010, 6.000%, 7/01/43 | No Opt. Call | BBB– | | 376,700 | |
| | 5,125 | | Pennsylvania Public School Building Authority, Lease Revenue Bonds, School District of Philadelphia, Series 2006B, 4.500%, 6/01/32 – AGM Insured (UB) | 12/16 at 100.00 | AA+ | | 4,812,221 | |
| | 1,595 | | Philadelphia Hospitals and Higher Education Facilities Authority, Pennsylvania, Health System Revenue Bonds, Jefferson Health System, Series 2010B, 5.000%, 5/15/40 | 5/20 at 100.00 | AA | | 1,477,768 | |
| | 1,425 | | Philadelphia, Pennsylvania, General Obligation Bonds, Refunding Series 2011, 6.500%, 8/01/41 | 8/20 at 100.00 | A2 | | 1,483,596 | |
| | 1,000 | | St. Mary Hospital Authority, Pennsylvania, Health System Revenue Bonds, Catholic Health East, Series 2004B, 5.500%, 11/15/24 (Pre-refunded 11/15/14) | 11/14 at 100.00 | A1 (4) | | 1,145,210 | |
| | 2,350 | | Union County Hospital Authority, Pennsylvania, Hospital Revenue Bonds, Evangelical Community Hospital Project, Refunding and Improvement Series 2011, 5.500%, 8/01/20 | No Opt. Call | BBB+ | | 2,384,005 | |
| | 19,395 | | Total Pennsylvania | | | | 19,189,355 | |
| | | | Puerto Rico – 2.0% (1.3% of Total Investments) | | | | | |
| | 1,225 | | Puerto Rico Municipal Finance Agency, Series 2005C, 5.250%, 8/01/21 – CIFG Insured | No Opt. Call | A3 | | 1,235,633 | |
| | | | Puerto Rico Sales Tax Financing Corporation, Sales Tax Revenue Bonds, First Subordinate Series 2009A: | | | | | |
| | 1,100 | | 6.375%, 8/01/39 | 8/19 at 100.00 | A+ | | 1,143,098 | |
| | 6,000 | | 6.000%, 8/01/42 | 8/19 at 100.00 | A+ | | 6,010,920 | |
| | 14,000 | | Puerto Rico Sales Tax Financing Corporation, Sales Tax Revenue Bonds, Series 2007A, 0.000%, 8/01/42 – FGIC Insured | No Opt. Call | Aa2 | | 1,762,180 | |
| | 22,325 | | Total Puerto Rico | | | | 10,151,831 | |
| | | | Rhode Island – 0.7% (0.5% of Total Investments) | | | | | |
| | 3,615 | | Rhode Island Tobacco Settlement Financing Corporation, Tobacco Settlement Asset-Backed Bonds, Series 2002A, 6.000%, 6/01/23 | 6/12 at 100.00 | BBB | | 3,616,301 | |
| | | | South Carolina – 2.6% (1.7% of Total Investments) | | | | | |
| | 2,000 | | Berkeley County School District, South Carolina, Installment Purchase Revenue Bonds, Securing Assets for Education, Series 2003, 5.250%, 12/01/24 | 12/13 at 100.00 | A1 | | 2,035,020 | |
| | | Nuveen Investment Quality Municipal Fund, Inc. (continued) |
| NQM | | Portfolio of Investments |
April 30, 2011 (Unaudited)
| | Principal Amount (000) | | Description (1) | Optional Call Provisions (2) | Ratings (3) | | Value | |
| | | | South Carolina (continued) | | | | | |
| $ | 4,405 | | Dorchester County School District 2, South Carolina, Installment Purchase Revenue Bonds, GROWTH, Series 2004, 5.250%, 12/01/23 | 12/14 at 100.00 | AA– | $ | 4,616,176 | |
| | 1,355 | | South Carolina JOBS Economic Development Authority, Economic Development Revenue Bonds, Bon Secours Health System Inc., Series 2002A, 5.625%, 11/15/30 (Pre-refunded 11/15/12) | 11/12 at 100.00 | A3 (4) | | 1,460,284 | |
| | 5,145 | | South Carolina JOBS Economic Development Authority, Economic Development Revenue Bonds, Bon Secours Health System Inc., Series 2002B, 5.625%, 11/15/30 | 11/12 at 100.00 | A– | | 4,918,826 | |
| | 12,905 | | Total South Carolina | | | | 13,030,306 | |
| | | | South Dakota – 0.4% (0.2% of Total Investments) | | | | | |
| | 1,750 | | South Dakota Health and Educational Facilities Authority, Revenue Bonds, Sioux Valley Hospitals, Series 2004A, 5.500%, 11/01/31 | 11/14 at 100.00 | AA– | | 1,750,543 | |
| | | | Tennessee – 2.6% (1.7% of Total Investments) | | | | | |
| | 3,200 | | Johnson City Health and Educational Facilities Board, Tennessee, Revenue Bonds, Mountain States Health Alliance, Series 2006A, 5.500%, 7/01/36 | 7/16 at 100.00 | BBB+ | | 2,766,848 | |
| | 5,000 | | Knox County Health, Educational and Housing Facilities Board, Tennessee, Hospital Revenue Bonds, Baptist Health System of East Tennessee Inc., Series 2002, 6.500%, 4/15/31 | 4/12 at 101.00 | A1 | | 5,187,150 | |
| | 5,000 | | Metropolitan Government of Nashville-Davidson County Health and Educational Facilities Board, Tennessee, Revenue Refunding Bonds, Vanderbilt University, Series 2009B, 5.000%, 10/01/39 | 10/19 at 100.00 | AA | | 5,084,000 | |
| | | | Sumner County Health, Educational, and Housing Facilities Board, Tennessee, Revenue Refunding Bonds, Sumner Regional Health System Inc., Series 2007: | | | | | |
| | 700 | | 5.500%, 11/01/37 (5), (6) | 11/17 at 100.00 | N/R | | 35,070 | |
| | 1,200 | | 5.500%, 11/01/46 (5), (6) | 11/17 at 100.00 | N/R | | 60,120 | |
| | 15,100 | | Total Tennessee | | | | 13,133,188 | |
| | | | Texas – 11.7% (7.5% of Total Investments) | | | | | |
| | 5,000 | | Board of Regents, University of Texas System, Financing System Revenue Bonds, Series 2006F, 4.250%, 8/15/36 (UB) | 2/17 at 100.00 | AAA | | 4,672,300 | |
| | 1,250 | | Central Texas Regional Mobility Authority, Senior Lien Revenue Bonds, Series 2010, 5.750%, 1/01/25 | 1/20 at 100.00 | BBB– | | 1,239,388 | |
| | 11,950 | | Houston, Texas, Junior Lien Water and Sewerage System Revenue Refunding Bonds, Series 1998A, 0.000%, 12/01/22 – AGM Insured (ETM) | No Opt. Call | AA+ (4) | | 7,908,391 | |
| | 4,680 | | Houston, Texas, Junior Lien Water and Sewerage System Revenue Refunding Bonds, Series 1998A, 0.000%, 12/01/22 – AGM Insured | No Opt. Call | AA+ | | 2,863,598 | |
| | | | Kerrville Health Facilities Development Corporation, Texas, Revenue Bonds, Sid Peterson Memorial Hospital Project, Series 2005: | | | | | |
| | 800 | | 5.250%, 8/15/21 | No Opt. Call | BBB– | | 795,224 | |
| | 1,220 | | 5.125%, 8/15/26 | No Opt. Call | BBB– | | 1,100,879 | |
| | 1,100 | | North Texas Tollway Authority, First Tier System Revenue Refunding Bonds, Series 2008A, 5.750%, 1/01/40 – AGC Insured | 1/18 at 100.00 | AA+ | | 1,112,034 | |
| | 3,150 | | North Texas Tollway Authority, Second Tier System Revenue Refunding Bonds, Series 2008F, 5.750%, 1/01/38 | 1/18 at 100.00 | A3 | | 3,065,990 | |
| | 1,960 | | North Texas Tollway Authority, Special Projects System Revenue Bonds, Series 2011A, 0.000%, 9/01/43 | 9/31 at 100.00 | AA | | 919,573 | |
| | 1,100 | | North Texas Tollway Authority, System Revenue Bonds, First Tier Series 2009A, 6.250%, 1/01/39 | 1/19 at 100.00 | A2 | | 1,123,375 | |
| | 1,000 | | Sabine River Authority, Texas, Pollution Control Revenue Bonds, TXU Electric Company, Series 2001C, 5.200%, 5/01/28 | 11/15 at 100.00 | CCC | | 331,380 | |
| | 3,960 | | Stafford Economic Development Corporation, Texas, Sales Tax Revenue Bonds, Series 2000, 5.500%, 9/01/30 – FGIC Insured | 9/15 at 100.00 | A+ | | 4,035,319 | |
| | 7,500 | | Tarrant County Cultural & Educational Facilities Financing Corporation, Texas, Revenue Bonds, Texas Health Resources, Series 2007A, 5.000%, 2/15/36 (UB) | 2/17 at 100.00 | AA– | | 6,853,275 | |
| | 1,910 | | Tarrant County Cultural Education Facilities Finance Corporation, Texas, Hospital Revenue Bonds, Scott & White HealthCare Project, Series 2010, 5.500%, 8/15/45 | 8/20 at 100.00 | A1 | | 1,819,485 | |
| | 2,825 | | Tarrant County Health Facilities Development Corporation, Texas, GNMA Collateralized Mortgage Loan Revenue Bonds, Eastview Nursing Home, Ebony Lake Nursing Center, Ft. Stockton Nursing Center, Lynnhaven Nursing Center and Mission Oaks Manor, Series 2000A-1, 7.500%, 12/20/22 | 6/11 at 105.00 | Aaa | | 2,969,923 | |
| | Principal Amount (000) | | Description (1) | Optional Call Provisions (2) | Ratings (3) | | Value | |
| | | | Texas (continued) | | | | | |
| $ | 650 | | Texas Municipal Gas Acquisition and Supply Corporation I, Gas Supply Revenue Bonds, Senior Lien Series 2008D, 6.250%, 12/15/26 | No Opt. Call | A | $ | 666,939 | |
| | 1,620 | | Texas Private Activity Bond Surface Transportation Corporation, Senior Lien Revenue Bonds, NTE Mobility Partners LLC North Tarrant Express Managed Lanes Project, Series 2009, 6.875%, 12/31/39 | 12/19 at 100.00 | Baa2 | | 1,667,369 | |
| | | | Texas Private Activity Bond Surface Transportation Corporation, Senior Lien Revenue Bonds, LBJ Infrastructure Group LLC IH-635 Managed Lanes Project, Series 2010: | | | | | |
| | 1,000 | | 7.000%, 6/30/34 | 6/20 at 100.00 | Baa3 | | 1,032,960 | |
| | 1,000 | | 7.000%, 6/30/40 | 6/20 at 100.00 | Baa3 | | 1,022,310 | |
| | 1,000 | | Texas Public Finance Authority, Charter School Finance Corporation Revenue Bonds, Idea Public School Project, Series 2007A, 5.000%, 8/15/37 – ACA Insured | 8/17 at 100.00 | BBB | | 776,780 | |
| | | | Texas Turnpike Authority, Central Texas Turnpike System Revenue Bonds, First Tier Series 2002A: | | | | | |
| | 10,000 | | 0.000%, 8/15/21 – AMBAC Insured | No Opt. Call | BBB+ | | 5,634,000 | |
| | 12,000 | | 0.000%, 8/15/23 – AMBAC Insured | No Opt. Call | BBB+ | | 5,666,520 | |
| | 1,125 | | Travis County Health Facilities Development Corporation, Texas, Revenue Bonds, Westminster Manor, Series 2010, 7.000%, 11/01/30 | No Opt. Call | N/R | | 1,106,224 | |
| | 77,800 | | Total Texas | | | | 58,383,236 | |
| | | | Virgin Islands – 0.2% (0.1% of Total Investments) | | | | | |
| | 250 | | Virgin Islands Public Finance Authority, Matching Fund Loan Notes Revenue Bonds, Subordinate Lien Series 2009A, 6.000%, 10/01/39 | 10/19 at 100.00 | Baa3 | | 244,323 | |
| | 820 | | Virgin Islands Public Finance Authority, Matching Fund Revenue Loan Note – Diageo Project, Series 2009A, 6.750%, 10/01/37 | 10/19 at 100.00 | BBB | | 849,955 | |
| | 1,070 | | Total Virgin Islands | | | | 1,094,278 | |
| | | | Virginia – 0.5% (0.4% of Total Investments) | | | | | |
| | 1,000 | | Amherst Industrial Development Authority, Virginia, Revenue Bonds, Sweet Briar College, Series 2006, 5.000%, 9/01/26 | 9/16 at 100.00 | BBB | | 944,610 | |
| | 1,850 | | Virginia Beach Development Authority, Virginia, Multifamily Residential Rental Housing Revenue Bonds, Hamptons and Hampton Court Apartments, Series 1999, 7.500%, 10/01/39 (Alternative Minimum Tax) | 10/14 at 102.00 | N/R | | 1,752,561 | |
| | 2,850 | | Total Virginia | | | | 2,697,171 | |
| | | | Washington – 2.8% (1.8% of Total Investments) | | | | | |
| | 11,345 | | Chelan County Public Utility District 1, Washington, Columbia River-Rock Island Hydro-Electric System Revenue Refunding Bonds, Series 1997A, 0.000%, 6/01/19 – NPFG Insured | No Opt. Call | AA | | 8,205,839 | |
| | 5,000 | | Port of Seattle, Washington, Revenue Bonds, Series 2001B, 5.625%, 4/01/17 – FGIC Insured (Alternative Minimum Tax) (UB) | 10/11 at 100.00 | Aa2 | | 5,084,450 | |
| | 1,000 | | Washington State Health Care Facilities Authority, Revenue Bonds, Northwest Hospital and Medical Center of Seattle, Series 2007, 5.700%, 12/01/32 | No Opt. Call | N/R | | 773,550 | |
| | 17,345 | | Total Washington | | | | 14,063,839 | |
| | | | West Virginia – 1.3% (0.8% of Total Investments) | | | | | |
| | 3,550 | | Mason County, West Virginia, Pollution Control Revenue Bonds, Appalachian Power Company, Series 2003L, 5.500%, 10/01/22 (Mandatory put 10/01/11) | 10/11 at 100.00 | BBB (4) | | 3,564,200 | |
| | 1,950 | | West Virginia Hospital Finance Authority, Hospital Revenue Bonds, Charleston Area Medical Center, Series 2009A, 5.625%, 9/01/32 | 9/19 at 100.00 | A3 | | 1,878,357 | |
| | 1,000 | | West Virginia Hospital Finance Authority, Hospital Revenue Bonds, Thomas Health System, Inc., Series 2008, 6.500%, 10/01/38 | 10/18 at 100.00 | N/R | | 895,950 | |
| | 6,500 | | Total West Virginia | | | | 6,338,507 | |
| | | | Wisconsin – 4.3% (2.8% of Total Investments) | | | | | |
| | 3,935 | | Badger Tobacco Asset Securitization Corporation, Wisconsin, Tobacco Settlement Asset-Backed Bonds, Series 2002, 6.125%, 6/01/27 (Pre-refunded 6/01/12) | 6/12 at 100.00 | AAA | | 4,085,238 | |
| | 815 | | Monroe Redevelopment Authority, Wisconsin, Development Revenue Bonds, The Monroe Clinic, Inc., Series 2009, 5.875%, 2/15/39 | 2/19 at 100.00 | A3 | | 809,947 | |
| | 1,000 | | Wisconsin Health and Educational Facilities Authority, Revenue Bonds, Beloit Health System, Inc., Series 2010B, 5.125%, 4/01/36 | 4/20 at 100.00 | N/R | | 840,000 | |
| | | Nuveen Investment Quality Municipal Fund, Inc. (continued) |
| NQM | | Portfolio of Investments |
April 30, 2011 (Unaudited)
| | | | | | | | | |
| | Principal Amount (000) | | Description (1) | Optional Call Provisions (2) | Ratings (3) | | Value | |
| | | | Wisconsin (continued) | | | | | |
| | | | Wisconsin Health and Educational Facilities Authority, Revenue Bonds, Eagle River Memorial Hospital Inc., Series 2000: | | | | | |
| $ | 1,000 | | 5.750%, 8/15/20 – RAAI Insured | 8/11 at 100.50 | N/R | $ | 1,006,080 | |
| | 3,000 | | 5.875%, 8/15/30 – RAAI Insured | 8/11 at 100.50 | N/R | | 2,848,830 | |
| | 1,150 | | Wisconsin Health and Educational Facilities Authority, Revenue Bonds, Fort Healthcare Inc., Series 2004, 5.750%, 5/01/24 | 5/14 at 100.00 | BBB+ | | 1,134,786 | |
| | | | Wisconsin Health and Educational Facilities Authority, Revenue Bonds, Wheaton Franciscan Healthcare System, Series 2006: | | | | | |
| | 3,500 | | 5.250%, 8/15/21 | 8/16 at 100.00 | BBB+ | | 3,465,455 | |
| | 1,780 | | 5.250%, 8/15/26 | 8/16 at 100.00 | BBB+ | | 1,623,146 | |
| | 1,000 | | 5.250%, 8/15/34 | 8/16 at 100.00 | BBB+ | | 860,550 | |
| | 4,600 | | Wisconsin State, General Obligation Bonds, Series 2006A, 4.750%, 5/01/25 – FGIC Insured (UB) | 5/16 at 100.00 | AA | | 4,769,463 | |
| | 21,780 | | Total Wisconsin | | | | 21,443,495 | |
| $ | 867,213 | | Total Investments (cost $787,058,828) – 155.8% | | | | 775,579,216 | |
| | | | Floating Rate Obligations – (16.2)% | | | | (80,492,000 | ) |
| | | | Other Assets Less Liabilities – 2.7% | | | | 13,397,801 | |
| | | | Auction Rate Preferred Shares, at Liquidation Value – (42.3)% (8) | | | | (210,700,000 | ) |
| | | | Net Assets Applicable to Common Shares – 100% | | | $ | 497,785,017 | |
| (1) | | All percentages shown in the Portfolio of Investments are based on net assets applicable to Common shares unless otherwise noted. |
| (2) | | Optional Call Provisions: Dates (month and year) and prices of the earliest optional call or redemption. There may be other call provisions at varying prices at later dates. Certain mortgage-backed securities may be subject to periodic principal paydowns. |
| (3) | | Ratings: Using the highest of Standard & Poor’s Group (“Standard & Poor’s”), Moody’s Investor Service, Inc. (“Moody’s”) or Fitch, Inc. (“Fitch”) rating. Ratings below BBB by Standard & Poor’s, Baa by Moody’s or BBB by Fitch are considered to be below investment grade. Holdings designated N/R are not rated by any of these national rating agencies. |
| (4) | | Backed by an escrow or trust containing sufficient U.S. Government or U.S. Government agency securities, which ensure the timely payment of principal and interest. Such investments are normally considered to be equivalent to AAA rated securities. |
| (5) | | At or subsequent to the end of the reporting period, this security is non-income producing. Non-income producing security, in the case of a bond, generally denotes that the issuer has (1) defaulted on the payment of principal or interest, (2) is under the protection of the Federal Bankruptcy Court or (3) the Fund’s Adviser has concluded that the issue is not likely to meet its future interest payment obligations and has directed the Fund’s custodian to cease accruing additional income on the Fund’s records. |
| (6) | | For fair value measurement disclosure purposes, investment categorized as Level 3. See Notes to Financial Statements, Footnote 1 – General Information and Significant Accounting Policies, Investment Valuation for more information. |
| (7) | | Investment, or portion of investment, has been pledged to collateralize the net payment obligations for investments in derivatives and/or inverse floating rate transactions. |
| (8) | | Auction Rate Preferred Shares, at Liquidation Value as a percentage of Total Investments are 27.2%. |
| N/R | | Not rated. |
| WI/DD | | Purchased on a when-issued or delayed delivery basis. |
| (ETM) | | Escrowed to maturity. |
| (IF) | | Inverse floating rate investment. |
| (UB) | | Underlying bond of an inverse floating rate trust reflected as a financing transaction. See Notes to Financial Statements, Footnote 1 – General Information and Significant Accounting Policies, Inverse Floating Rate Securities for more information. |
See accompanying notes to financial statements.
| | | Nuveen Select Quality Municipal Fund, Inc. |
| NQS | | Portfolio of Investments |
| | | April 30, 2011 (Unaudited) |
| | Principal Amount (000) | | Description (1) | Optional Call Provisions (2) | Ratings (3) | | Value | |
| | | | Alabama – 1.1% (0.7% of Total Investments) | | | | | |
| $ | 5,155 | | Phenix City Industrial Development Board, Alabama, Environmental Improvement Revenue Bonds, MeadWestvaco Corporation, Series 2002A, 6.350%, 5/15/35 (Alternative Minimum Tax) | 5/12 at 100.00 | BBB | $ | 4,971,636 | |
| | | | Alaska – 2.3% (1.5% of Total Investments) | | | | | |
| | 500 | | Alaska Housing Finance Corporation, General Housing Purpose Bonds, Series 2005A, 5.000%, 12/01/26 – FGIC Insured (UB) | 12/14 at 100.00 | AA+ | | 506,195 | |
| | 6,000 | | Alaska Housing Finance Corporation, General Housing Purpose Bonds, Series 2005B-2, 5.250%, 12/01/30 – NPFG Insured | 6/15 at 100.00 | AA+ | | 6,039,119 | |
| | 2,000 | | Kenai Peninsula Borough, Alaska, Revenue Bonds, Central Kenai Peninsula Hospital Service Area, Series 2003, 5.000%, 8/01/23 – FGIC Insured | 8/13 at 100.00 | A1 | | 2,048,160 | |
| | 2,135 | | Northern Tobacco Securitization Corporation, Alaska, Tobacco Settlement Asset-Backed Bonds, Series 2006A, 4.625%, 6/01/23 | 6/14 at 100.00 | Baa3 | | 1,875,000 | |
| | 10,635 | | Total Alaska | | | | 10,468,474 | |
| | | | Arizona – 3.2% (2.1% of Total Investments) | | | | | |
| | 2,300 | | Phoenix Civic Improvement Corporation, Arizona, Senior Lien Airport Revenue Bonds, Series 2008A, 5.000%, 7/01/33 | 7/18 at 100.00 | AA– | | 2,284,613 | |
| | 1,000 | | Pima County Industrial Development Authority, Arizona, Revenue Bonds, Tucson Electric Power Company, Series 2010A, 5.250%, 10/01/40 | 10/20 at 100.00 | BBB– | | 878,230 | |
| | 3,750 | | Salt River Project Agricultural Improvement and Power District, Arizona, Electric System Revenue Bonds, Series 2003, 5.000%, 12/01/18 – NPFG Insured | 12/13 at 100.00 | Aa2 | | 4,019,438 | |
| | 8,000 | | Salt Verde Financial Corporation, Arizona, Senior Gas Revenue Bonds, Citigroup Energy Inc Prepay Contract Obligations, Series 2007, 5.000%, 12/01/37 | No Opt. Call | A | | 6,657,039 | |
| | 750 | | Scottsdale Industrial Development Authority, Arizona, Hospital Revenue Bonds, Scottsdale Healthcare, Series 2008A, 5.250%, 9/01/30 | 9/13 at 100.00 | A– | | 714,923 | |
| | 15,800 | | Total Arizona | | | | 14,554,243 | |
| | | | Arkansas – 1.0% (0.6% of Total Investments) | | | | | |
| | 3,875 | | Little Rock, Arkansas, Hotel and Restaurant Gross Receipts Tax Refunding Bonds, Series 1993, 7.375%, 8/01/15 | No Opt. Call | A2 | | 4,321,554 | |
| | | | California – 8.9% (5.8% of Total Investments) | | | | | |
| | | | Calexico Unified School District, Imperial County, California, General Obligation Bonds, Series 2005B: | | | | | |
| | 3,685 | | 0.000%, 8/01/31 – FGIC Insured | No Opt. Call | A | | 880,641 | |
| | 4,505 | | 0.000%, 8/01/33 – FGIC Insured | No Opt. Call | A | | 920,732 | |
| | 1,110 | | California County Tobacco Securitization Agency, Tobacco Settlement Asset-Backed Bonds, Sonoma County Tobacco Securitization Corporation, Series 2005, 5.000%, 6/01/26 | 6/15 at 100.00 | BBB | | 865,955 | |
| | 550 | | California Pollution Control Financing Authority, Remarketed Revenue Bonds, Pacific Gas and Electric Company, Series 1996A, 5.350%, 12/01/16 – NPFG Insured (Alternative Minimum Tax) | 10/11 at 102.00 | A3 | | 561,440 | |
| | 1,550 | | California Statewide Community Development Authority, Revenue Bonds, St. Joseph Health System, Series 2007A, 5.750%, 7/01/47 – FGIC Insured | 7/18 at 100.00 | AA– | | 1,453,079 | |
| | 1,000 | | Coachella Valley Unified School District, Riverside County, California, General Obligation Bonds, Series 2005A, 0.000%, 8/01/30 – FGIC Insured | No Opt. Call | A1 | | 247,580 | |
| | | | Colton Joint Unified School District, San Bernardino County, California, General Obligation Bonds, Series 2006C: | | | | | |
| | 3,200 | | 0.000%, 2/01/30 – FGIC Insured | 2/15 at 45.69 | Aa3 | | 876,672 | |
| | 6,800 | | 0.000%, 2/01/35 – FGIC Insured | 2/15 at 34.85 | Aa3 | | 1,266,636 | |
| | | | Cupertino Union School District, Santa Clara County, California, General Obligation Bonds, Series 2003B: | | | | | |
| | 8,100 | | 0.000%, 8/01/24 – FGIC Insured | 8/13 at 58.68 | Aa1 | | 3,806,919 | |
| | 11,430 | | 0.000%, 8/01/27 – FGIC Insured | 8/13 at 49.98 | Aa1 | | 4,150,462 | |
| | | Nuveen Select Quality Municipal Fund, Inc. (continued) |
| NQS | | Portfolio of Investments |
April 30, 2011 (Unaudited)
| | | | | | | | | |
| | Principal Amount (000) | | Description (1) | Optional Call Provisions (2) | Ratings (3) | | Value | |
| | | | California (continued) | | | | | |
| $ | 7,000 | | Golden State Tobacco Securitization Corporation, California, Enhanced Tobacco Settlement Revenue Bonds, Tender Option Bonds Trust 2040, 10.395%, | 6/15 at 100.00 | A2 | $ | 3,263,680 | |
| | | | 6/01/45 – FGIC Insured (IF) | | | | | |
| | 4,500 | | Hemet Unified School District, Riverside County, California, General Obligation Bonds, Series 2008B, 5.125%, 8/01/37 – AGC Insured | 8/16 at 102.00 | AA+ | | 4,339,260 | |
| | 1,045 | | Lake Tahoe Unified School District, El Dorado County, California, General Obligation Bonds, Series 2001B, 0.000%, 8/01/31 – NPFG Insured | No Opt. Call | Aa3 | | 282,683 | |
| | 2,350 | | Palomar Pomerado Health Care District, California, Certificates of Participation, Series 2009, 6.750%, 11/01/39 | 11/19 at 100.00 | Baa3 | | 2,281,239 | |
| | 6,195 | | Peralta Community College District, Alameda County, California, General Obligation Bonds, Election of 2006, Series 2007B, 5.000%, 8/01/37 – AGM Insured | 8/17 at 100.00 | AA+ | | 5,819,954 | |
| | 6,000 | | Placentia-Yorba Linda Unified School District, Orange County, California, Certificates of Participation, Series 2006, 0.000%, 10/01/34 – FGIC Insured | No Opt. Call | A+ | | 1,112,160 | |
| | 5,000 | | Riverside County Asset Leasing Corporation, California, Leasehold Revenue Bonds, Riverside County Hospital Project, Series 1997, 0.000%, 6/01/25 – NPFG Insured | No Opt. Call | A1 | | 1,846,200 | |
| | 3,205 | | San Diego Community College District, California, General Obligation Bonds, Series 2005, 5.000%, 5/01/25 – AGM Insured | 5/15 at 100.00 | AA+ | | 3,336,501 | |
| | 5,000 | | Santa Monica Community College District, Los Angeles County, California, General Obligation Bonds, Series 2005C, 0.000%, 8/01/26 – NPFG Insured | 8/15 at 58.09 | Aa1 | | 1,964,050 | |
| | 2,460 | | Santee School District, County, California, General Obligation Bonds, Capital Appreciation, Election 2006, Series 2008D, 0.000%, 8/01/33 – AGC Insured | No Opt. Call | AA+ | | 547,104 | |
| | 2,000 | | Yuma Community College District, California, General Obligation Bonds, Series 2007B, 0.000%, 8/01/33 – AMBAC Insured | 8/17 at 45.45 | Aa2 | | 423,160 | |
| | 86,685 | | Total California | | | | 40,246,107 | |
| | | | Colorado – 7.6% (5.0% of Total Investments) | | | | | |
| | 3,335 | | Colorado Health Facilities Authority, Colorado, Revenue Bonds, Catholic Health Initiatives, Series 2009A, 5.500%, 7/01/34 | 7/19 at 100.00 | AA | | 3,347,773 | |
| | 5,000 | | Colorado Health Facilities Authority, Health Facilities Revenue Bonds, Sisters of Charity of Leavenworth Health Services Corporation, Series 2010A, 5.000%, 1/01/40 | No Opt. Call | AA | | 4,593,850 | |
| | 1,150 | | Colorado Health Facilities Authority, Revenue Bonds, Poudre Valley Health System, Series 2005C, 5.250%, 3/01/40 – AGM Insured | 9/18 at 102.00 | AA+ | | 1,080,471 | |
| | 4,500 | | Denver City and County, Colorado, Airport System Revenue Refunding Bonds, Series 2001A, 5.500%, 11/15/16 – FGIC Insured (Alternative Minimum Tax) | 11/11 at 100.00 | A+ | | 4,586,895 | |
| | 1,500 | | Denver Convention Center Hotel Authority, Colorado, Senior Revenue Bonds, Convention Center Hotel, Series 2006, 4.625%, 12/01/30 – SYNCORA GTY Insured | 11/16 at 100.00 | BBB– | | 1,158,360 | |
| | | | E-470 Public Highway Authority, Colorado, Senior Revenue Bonds, Series 1997B: | | | | | |
| | 1,420 | | 0.000%, 9/01/23 – NPFG Insured | No Opt. Call | Baa1 | | 608,285 | |
| | 9,390 | | 0.000%, 9/01/25 – NPFG Insured | No Opt. Call | Baa1 | | 3,313,919 | |
| | 13,000 | | E-470 Public Highway Authority, Colorado, Toll Revenue Bonds, Series 2004B, 0.000%, 9/01/34 – NPFG Insured | 9/20 at 45.40 | Baa1 | | 2,059,720 | |
| | 5,000 | | Ebert Metropolitan District, Colorado, Limited Tax General Obligation Bonds, Series 2007, 5.350%, 12/01/37 – RAAI Insured | 12/17 at 100.00 | N/R | | 3,491,250 | |
| | 12,355 | | Northwest Parkway Public Highway Authority, Colorado, Senior Lien Revenue Bonds, Series 2001B, 0.000%, 6/15/26 (Pre-refunded 6/15/11) – AGM Insured | 6/11 at 40.52 | AA+ (4) | | 4,998,338 | |
| | | | Regional Transportation District, Colorado, Denver Transit Partners Eagle P3 Project Private Activity Bonds, Series 2010: | | | | | |
| | 2,500 | | 6.500%, 1/15/30 | 7/20 at 100.00 | Baa3 | | 2,527,275 | |
| | 3,115 | | 6.000%, 1/15/34 | 7/20 at 100.00 | Baa3 | | 2,910,095 | |
| | 62,265 | | Total Colorado | | | | 34,676,231 | |
| | | | | | | | | |
| | Principal Amount (000) | | Description (1) | Optional Call Provisions (2) | Ratings (3) | | Value | |
| | | | District of Columbia – 3.0% (2.0% of Total Investments) | | | | | |
| | | | District of Columbia Tobacco Settlement Corporation, Tobacco Settlement Asset-Backed Bonds, Series 2001: | | | | | |
| $ | 2,255 | | 6.250%, 5/15/24 | 5/11 at 101.00 | BBB | $ | 2,161,891 | |
| | 5,485 | | 6.500%, 5/15/33 | No Opt. Call | BBB | | 5,384,075 | |
| | 5,000 | | District of Columbia, General Obligation Bonds, Series 1998B, 6.000%, 6/01/19 – NPFG Insured | No Opt. Call | Aa2 | | 6,024,650 | |
| | 12,740 | | Total District of Columbia | | | | 13,570,616 | |
| | | | Florida – 2.8% (1.9% of Total Investments) | | | | | |
| | 4,000 | | Miami-Dade County, Florida, Aviation Revenue Bonds, Miami International Airport, Series 2010B, 5.000%, 10/01/28 | 10/20 at 100.00 | A2 | | 3,924,600 | |
| | 9,250 | | Port Saint Lucie, Florida, Special Assessment Revenue Bonds, Southwest Annexation District 1B, Series 2007, 5.000%, 7/01/40 – NPFG Insured | 7/17 at 100.00 | Baa1 | | 7,394,172 | |
| | 2,500 | | South Miami Health Facilities Authority, Florida, Revenue Bonds, Baptist Health Systems of South Florida, Tender Option Bond Trust 11151, 17.808%, 2/15/15 (IF) | 8/17 at 100.00 | AA | | 1,416,100 | |
| | 15,750 | | Total Florida | | | | 12,734,872 | |
| | | | Georgia – 0.8% (0.6% of Total Investments) | | | | | |
| | 3,750 | | Atlanta, Georgia, Airport General Revenue Bonds, Series 2000B, 5.625%, 1/01/30 – FGIC Insured (Alternative Minimum Tax) | 7/11 at 100.50 | A+ | | 3,756,037 | |
| | | | Illinois – 22.2% (14.7% of Total Investments) | | | | | |
| | | | Chicago Board of Education, Illinois, Unlimited Tax General Obligation Bonds, Dedicated Tax Revenues, Series 1998B-1: | | | | | |
| | 3,855 | | 0.000%, 12/01/25 – FGIC Insured | No Opt. Call | Aa2 | | 1,564,475 | |
| | 3,025 | | 0.000%, 12/01/31 – FGIC Insured | No Opt. Call | Aa2 | | 744,725 | |
| | 1,500 | | Chicago Board of Education, Illinois, Unlimited Tax General Obligation Bonds, Dedicated Tax Revenues, Series 1999A, 5.500%, 12/01/26 – FGIC Insured | No Opt. Call | Aa2 | | 1,516,230 | |
| | 15,000 | | Chicago, Illinois, Second Lien Passenger Facility Charge Revenue Bonds, O’Hare International Airport, Series 2001A, 5.375%, 1/01/32 – AMBAC Insured (Alternative Minimum Tax) | 7/11 at 101.00 | A2 | | 13,904,850 | |
| | | | Chicago, Illinois, Second Lien Passenger Facility Charge Revenue Bonds, O’Hare International Airport, Series 2001C: | | | | | |
| | 3,770 | | 5.100%, 1/01/26 – AMBAC Insured (Alternative Minimum Tax) | 7/11 at 101.00 | A2 | | 3,606,420 | |
| | 5,460 | | 5.250%, 1/01/32 – AMBAC Insured (Alternative Minimum Tax) | 7/11 at 101.00 | A2 | | 4,981,103 | |
| | 5,000 | | Illinois Educational Facilities Authority, Revenue Bonds, University of Chicago, Refunding Series 2003A, 5.000%, 7/01/33 | 7/13 at 100.00 | Aa1 | | 5,017,500 | |
| | 1,500 | | Illinois Finance Authority, Revenue Bonds, Central DuPage Health, Series 2009B, 5.500%, 11/01/39 | 11/19 at 100.00 | AA | | 1,433,595 | |
| | 2,000 | | Illinois Finance Authority, Revenue Bonds, Children’s Memorial Hospital, Series 2008A, 5.250%, 8/15/47 – AGC Insured (UB) | 8/18 at 100.00 | AA+ | | 1,759,680 | |
| | 1,000 | | Illinois Finance Authority, Revenue Bonds, Edward Health Services Corporation, Series 2008A, 5.500%, 2/01/40 – AMBAC Insured | 2/18 at 100.00 | A+ | | 935,680 | |
| | 10,000 | | Illinois Finance Authority, Revenue Bonds, Palos Community Hospital, Series 2010C, 5.125%, 5/15/35 | 5/20 at 100.00 | N/R | | 9,178,700 | |
| | 3,975 | | Illinois Finance Authority, Revenue Bonds, Sherman Health Systems, Series 2007A, 5.500%, 8/01/37 | 8/17 at 100.00 | BBB | | 3,423,668 | |
| | 5,000 | | Illinois Finance Authority, Revenue Refunding Bonds, Silver Cross Hospital and Medical Centers, Series 2008A, 5.500%, 8/15/30 | 8/18 at 100.00 | BBB | | 4,287,500 | |
| | 10,000 | | Illinois Health Facilities Authority, Revenue Bonds, Condell Medical Center, Series 2002, 5.750%, 5/15/22 (Pre-refunded 5/15/12) | 5/12 at 100.00 | Aaa | | 10,542,000 | |
| | 2,000 | | Illinois Health Facilities Authority, Revenue Bonds, Midwest Care Center I Inc., Series 2001, 5.950%, 2/20/36 | 8/11 at 102.00 | Aaa | | 2,013,500 | |
| | 4,605 | | Illinois Health Facilities Authority, Revenue Bonds, Sherman Health Systems,
Series 1997, 5.250%, 8/01/17 – AMBAC Insured | 7/11 at 100.00 | BBB | | 4,605,553 | |
| | | Nuveen Select Quality Municipal Fund, Inc. (continued) |
| NQS | | Portfolio of Investments |
April 30, 2011 (Unaudited)
| | | | | | | | | |
| | Principal Amount (000) | | Description (1) | Optional Call Provisions (2) | Ratings (3) | | Value | |
| | | | Illinois (continued) | | | | | |
| $ | 8,945 | | Lake and McHenry Counties Community Unit School District 118, Wauconda, Illinois, General Obligation Bonds, Series 2005B, 0.000%, 1/01/21 – AGM Insured | 1/15 at 74.44 | Aa3 | $ | 5,418,702 | |
| | 9,000 | | McHenry County Community Unit School District 200, Woodstock, Illinois, General Obligation Bonds, Series 2006B, 0.000%, 1/15/23 – FGIC Insured | No Opt. Call | Aa2 | | 4,804,560 | |
| | 2,335 | | Metropolitan Pier and Exposition Authority, Illinois, Revenue Bonds, McCormick Place Expansion Project, Refunding Series 2010B-2, 5.000%, 6/15/50 | No Opt. Call | AAA | | 2,001,165 | |
| | | | Metropolitan Pier and Exposition Authority, Illinois, Revenue Bonds, McCormick Place Expansion Project, Series 2002A: | | | | | |
| | 6,700 | | 0.000%, 12/15/23 – NPFG Insured | No Opt. Call | AAA | | 3,332,379 | |
| | 2,920 | | 5.000%, 12/15/28 – NPFG Insured | 6/12 at 101.00 | AAA | | 2,921,869 | |
| | 1,100 | | 0.000%, 12/15/35 – NPFG Insured | No Opt. Call | AAA | | 215,996 | |
| | 3,455 | | 0.000%, 6/15/41 – NPFG Insured | No Opt. Call | AAA | | 459,446 | |
| | 8,910 | | University of Illinois, Auxiliary Facilities Systems Revenue Bonds, Series 2006, 5.000%, 4/01/27 – NPFG Insured | 4/16 at 100.00 | Aa2 | | 9,010,327 | |
| | 7,500 | | Valley View Public Schools, Community Unit School District 365U of Will County, Illinois, General Obligation Bonds, Series 2005, 0.000%, 11/01/25 – NPFG Insured | No Opt. Call | AA | | 3,241,725 | |
| | 128,555 | | Total Illinois | | | | 100,921,348 | |
| | | | Indiana – 2.3% (1.5% of Total Investments) | | | | | |
| | 2,000 | | Hospital Authority of Delaware County, Indiana, Hospital Revenue Bonds, Cardinal Health System, Series 2006, 5.250%, 8/01/36 | 8/16 at 100.00 | Baa3 | | 1,709,200 | |
| | 2,000 | | Indiana Health Facility Financing Authority, Revenue Bonds, Community Foundation of Northwest Indiana, Series 2007, 5.500%, 3/01/37 | 3/17 at 100.00 | BBB+ | | 1,804,020 | |
| | 2,225 | | Indiana Municipal Power Agency, Power Supply Revenue Bonds, Series 2007A, 5.000%, 1/01/42 – NPFG Insured | 1/17 at 100.00 | A+ | | 2,070,185 | |
| | 5,000 | | Marion County Convention and Recreational Facilities Authority, Indiana, Excise Taxes Lease Rental Revenue Subordinate Bonds, Series 1997A, 5.000%, 6/01/22 – NPFG Insured | 7/11 at 100.00 | Baa1 | | 5,010,850 | |
| | 11,225 | | Total Indiana | | | | 10,594,255 | |
| | | | Iowa – 0.5% (0.3% of Total Investments) | | | | | |
| | 3,100 | | Iowa Tobacco Settlement Authority, Asset Backed Settlement Revenue Bonds, Series 2005C, 5.625%, 6/01/46 | 6/15 at 100.00 | BBB | | 2,090,515 | |
| | | | Kansas – 1.7% (1.1% of Total Investments) | | | | | |
| | 3,790 | | Kansas Department of Transportation, Highway Revenue Bonds, Series 2004A, 5.000%, 3/01/23 (UB) | 3/14 at 100.00 | AAA | | 4,081,489 | |
| | 3,710 | | Overland Park Development Corporation, Kansas, First Tier Revenue Bonds, Overland Park Convention Center, Series 2007A, 5.125%, 1/01/22 – AMBAC Insured | 1/17 at 100.00 | Baa3 | | 3,411,753 | |
| | 7,500 | | Total Kansas | | | | 7,493,242 | |
| | | | Kentucky – 0.2% (0.2% of Total Investments) | | | | | |
| | 1,000 | | Kentucky Economic Development Finance Authority, Louisville Arena Project Revenue Bonds, Louisville Arena Authority, Inc., Series 2008-A1, 6.000%, 12/01/33 – AGC Insured | 6/18 at 100.00 | AA+ | | 1,025,719 | |
| | | | Louisiana – 1.2% (0.8% of Total Investments) | | | | | |
| | 5,000 | | Louisiana Public Facilities Authority, Revenue Bonds, Ochsner Clinic Foundation Project, Series 2007A, 5.375%, 5/15/43 | 5/17 at 100.00 | Baa1 | | 4,125,050 | |
| | 1,505 | | Tobacco Settlement Financing Corporation, Louisiana, Tobacco Settlement Asset-Backed Bonds, Series 2001B, 5.500%, 5/15/30 | 5/11 at 101.00 | A | | 1,485,736 | |
| | 6,505 | | Total Louisiana | | | | 5,610,786 | |
| | | | Massachusetts – 1.5% (1.0% of Total Investments) | | | | | |
| | 4,410 | | Massachusetts Department of Transportation, Metropolitan Highway System Revenue Bonds, Senior Lien Series 2010B, 5.000%, 1/01/32 | 1/20 at 100.00 | A | | 4,404,047 | |
| | 500 | | Massachusetts Health and Educational Facilities Authority, Revenue Bonds, CareGroup Inc., Series 2008E-1 &2, 5.125%, 7/01/38 | 7/18 at 100.00 | A3 | | 435,060 | |
| | 2,300 | | Massachusetts Health and Educational Facilities Authority, Revenue Refunding Bonds, Suffolk University Issue, Series 2009A, 5.750%, 7/01/39 | 7/19 at 100.00 | BBB | | 2,181,734 | |
| | 7,210 | | Total Massachusetts | | | | 7,020,841 | |
| | Principal Amount (000) | | Description (1) | Optional Call Provisions (2) | Ratings (3) | | Value | |
| | | | Michigan – 7.9% (5.2% of Total Investments) | | | | | |
| $ | 540 | | Detroit, Michigan, General Obligation Bonds, Series 2003A, 5.250%, 4/01/19 – SYNCORA GTY Insured | 4/13 at 100.00 | BB | $ | 463,153 | |
| | 7,745 | | Detroit, Michigan, Senior Lien Sewerage Disposal System Revenue Bonds, Series 1998A, 5.250%, 7/01/21 – NPFG Insured | 7/17 at 100.00 | A+ | | 7,966,197 | |
| | 8,125 | | Michigan State Building Authority, Revenue Bonds, Facilities Program, Series 2005II, 5.000%, 10/15/29 – AMBAC Insured | 10/15 at 100.00 | Aa3 | | 8,137,675 | |
| | 2,000 | | Michigan State Building Authority, Revenue Bonds, Refunding Series 2006IA, 0.000%, 10/15/21 – FGIC Insured | 10/16 at 79.00 | Aa3 | | 1,143,160 | |
| | 6,000 | | Michigan Strategic Fund, Collateralized Limited Obligation Pollution Control Revenue Refunding Bonds, Fixed Rate Conversion, Detroit Edison Company, Series 1999C, 5.650%, 9/01/29 – SYNCORA GTY Insured (Alternative Minimum Tax) | 9/11 at 100.00 | A | | 6,003,300 | |
| | 7,500 | | Michigan Strategic Fund, Limited Obligation Revenue Refunding Bonds, Detroit Edison Company, Series 2002C, 5.450%, 12/15/32 – SYNCORA GTY Insured (Alternative Minimum Tax) | 12/12 at 100.00 | BBB+ | | 7,086,525 | |
| | 5,900 | | Royal Oak Hospital Finance Authority, Michigan, Hospital Revenue Bonds, William Beaumont Hospital, Series 2001M, 5.250%, 11/15/35 – NPFG Insured | 11/11 at 100.00 | A1 | | 5,104,680 | |
| | 37,810 | | Total Michigan | | | | 35,904,690 | |
| | | | Mississippi – 0.6% (0.4% of Total Investments) | | | | | |
| | 2,475 | | Mississippi Hospital Equipment and Facilities Authority, Revenue Bonds, Baptist Memorial Healthcare, Series 2004B-1, 5.000%, 9/01/24 (UB) | 9/14 at 100.00 | AA | | 2,511,284 | |
| | | | Missouri – 0.7% (0.5% of Total Investments) | | | | | |
| | 1,500 | | Bi-State Development Agency of the Missouri-Illinois Metropolitan District, Mass Transit Sales Tax Appropriation Bonds, Metrolink Cross County Extension Project, Series 2002B, 5.000%, 10/01/32 – AGM Insured | 10/13 at 100.00 | AA+ | | 1,505,700 | |
| | 5,000 | | Kansas City Municipal Assistance Corporation, Missouri, Leasehold Revenue Bonds, Series 2004B-1, 0.000%, 4/15/28 – AMBAC Insured | No Opt. Call | AA– | | 1,831,400 | |
| | 6,500 | | Total Missouri | | | | 3,337,100 | |
| | | | Nebraska – 1.3% (0.8% of Total Investments) | | | | | |
| | 6,100 | | Omaha Convention Hotel Corporation, Nebraska, Convention Center Revenue Bonds, Series 2007, 5.000%, 2/01/35 – AMBAC Insured | 2/17 at 100.00 | Aa3 | | 5,810,372 | |
| | | | Nevada – 3.0% (2.0% of Total Investments) | | | | | |
| | 1,950 | | Director of Nevada State Department of Business and Industry, Revenue Bonds, Las Vegas Monorail Project, First Tier, Series 2000, 5.625%, 1/01/32 – AMBAC Insured (5) | 1/12 at 100.00 | N/R | | 489,197 | |
| | 2,500 | | Reno, Nevada, Health Facilities Revenue Bonds, Catholic Healthcare West, Series 2007A, Trust 2634, 18.488%, 7/01/31 – BHAC Insured (IF) | 7/17 at 100.00 | AA+ | | 2,493,100 | |
| | 10,750 | | Truckee Meadows Water Authority, Nevada, Water Revenue Bonds, Series 2001A, 5.250%, 7/01/34 (Pre-refunded 7/01/11) – AGM Insured | 7/11 at 100.00 | AAA | | 10,842,773 | |
| | 15,200 | | Total Nevada | | | | 13,825,070 | |
| | | | New Hampshire – 1.1% (0.7% of Total Investments) | | | | | |
| | 5,000 | | New Hampshire Business Finance Authority, Revenue Bonds, Elliot Hospital Obligated Group Issue, Series 2009A, 6.125%, 10/01/39 | 10/19 at 100.00 | BBB+ | | 4,930,150 | |
| | | | New Jersey – 7.6% (5.0% of Total Investments) | | | | | |
| | 16,840 | | New Jersey Health Care Facilities Financing Authority, Revenue Bonds, Saint Barnabas Health Care System, Series 2006A, 0.000%, 7/01/35 | 1/17 at 39.39 | BBB– | | 2,612,221 | |
| | 14,865 | | New Jersey Housing and Mortgage Finance Agency, Home Buyer Program Revenue Bonds, Series 2000CC, 5.850%, 10/01/25 – NPFG Insured (Alternative Minimum Tax) | 10/11 at 100.00 | Aaa | | 15,451,424 | |
| | 1,905 | | New Jersey Housing and Mortgage Finance Agency, Multifamily Housing Revenue Bonds, Series 1997A, 5.550%, 5/01/27 – AMBAC Insured (Alternative Minimum Tax) | 11/11 at 100.00 | A+ | | 1,842,287 | |
| | | Nuveen Select Quality Municipal Fund, Inc. (continued) |
| NQS | | Portfolio of Investments |
April 30, 2011 (Unaudited)
| | | | | | | | | |
| | Principal Amount (000) | | Description (1) | Optional Call Provisions (2) | Ratings (3) | | Value | |
| | | | New Jersey (continued) | | | | | |
| $ | 20,000 | | New Jersey Transportation Trust Fund Authority, Transportation System Bonds, Series 2006C, 0.000%, 12/15/33 – AGM Insured | No Opt. Call | AA+ | $ | 4,326,200 | |
| | 5,740 | | Tobacco Settlement Financing Corporation, New Jersey, Tobacco Settlement Asset-Backed Bonds, Series 2002, 5.750%, 6/01/32 (Pre-refunded 6/01/12) | 6/12 at 100.00 | AAA | | 5,978,267 | |
| | 6,500 | | Tobacco Settlement Financing Corporation, New Jersey, Tobacco Settlement Asset-Backed Bonds, Series 2007-1A, 5.000%, 6/01/41 | 6/17 at 100.00 | Baa3 | | 4,056,000 | |
| | 65,850 | | Total New Jersey | | | | 34,266,399 | |
| | | | New Mexico – 3.2% (2.1% of Total Investments) | | | | | |
| | | | New Mexico Hospital Equipment Loan Council, Hospital Revenue Bonds, Presbyterian Healthcare Services, Series 2001A: | | | | | |
| | 8,000 | | 5.500%, 8/01/25 (Pre-refunded 8/01/11) | 8/11 at 101.00 | AA– (4) | | 8,187,440 | |
| | 6,200 | | 5.500%, 8/01/30 (Pre-refunded 8/01/11) | 8/11 at 101.00 | AA– (4) | | 6,345,266 | |
| | 14,200 | | Total New Mexico | | | | 14,532,706 | |
| | | | New York – 3.7% (2.5% of Total Investments) | | | | | |
| | 5,005 | | Dormitory Authority of the State of New York, Revenue Bonds, Non State Supported Debt, Vassar College, Series 2007, 5.000%, 7/01/46 | 7/17 at 100.00 | AA | | 4,887,232 | |
| | 7,000 | | Metropolitan Transportation Authority, New York, State Service Contract Refunding Bonds, Series 2002A, 5.125%, 1/01/29 | 7/12 at 100.00 | AA– | | 7,018,830 | |
| | 5,060 | | New York State Mortgage Agency, Homeowner Mortgage Revenue Bonds, Series 79, 5.300%, 4/01/29 (Alternative Minimum Tax) | 9/11 at 100.00 | Aa1 | | 5,025,086 | |
| | 17,065 | | Total New York | | | | 16,931,148 | |
| | | | North Carolina – 2.3% (1.5% of Total Investments) | | | | | |
| | 3,000 | | Charlotte-Mecklenberg Hospital Authority, North Carolina, Carolinas HealthCare System Revenue Bonds, Series 2008A, 5.000%, 1/15/47 | 1/18 at 100.00 | AA– | | 2,783,910 | |
| | 5,535 | | North Carolina Eastern Municipal Power Agency, Power System Revenue Refunding Bonds, Series 1993B, 5.500%, 1/01/17 – FGIC Insured | 7/11 at 100.00 | Baa1 | | 5,545,517 | |
| | 1,900 | | North Carolina Turnpike Authority, Triangle Expressway System Revenue Bonds,
Series 2009A, 5.750%, 1/01/39 – AGC Insured | 1/19 at 100.00 | AA+ | | 1,931,027 | |
| | 10,435 | | Total North Carolina | | | | 10,260,454 | |
| | | | Ohio – 5.4% (3.5% of Total Investments) | | | | | |
| | | | Buckeye Tobacco Settlement Financing Authority, Ohio, Tobacco Settlement Asset-Backed Revenue Bonds, Senior Lien, Series 2007A-2: | | | | | |
| | 3,045 | | 5.375%, 6/01/24 | 6/17 at 100.00 | Baa3 | | 2,388,924 | |
| | 1,180 | | 5.125%, 6/01/24 | 6/17 at 100.00 | Baa3 | | 911,739 | |
| | 2,700 | | 5.875%, 6/01/30 | 6/17 at 100.00 | Baa3 | | 1,948,428 | |
| | 2,755 | | 5.750%, 6/01/34 | 6/17 at 100.00 | Baa3 | | 1,898,195 | |
| | 7,995 | | 5.875%, 6/01/47 | 6/17 at 100.00 | Baa3 | | 5,394,147 | |
| | 14,800 | | Buckeye Tobacco Settlement Financing Authority, Ohio, Tobacco Settlement Asset-Backed Revenue Bonds, Senior Lien, Series 2007A-3, 0.000%, 6/01/37 | 6/22 at 100.00 | Baa3 | | 9,417,092 | |
| | 1,730 | | Lucas County, Ohio, Hospital Revenue Bonds, ProMedica Healthcare Obligated Group, Series 2011A, 6.000%, 11/15/41 | 11/21 at 100.00 | AA– | | 1,735,294 | |
| | 3,750 | | Ohio Higher Educational Facilities Commission, Revenue Bonds, University Hospitals Health System Inc., Series 2007A, Trust 2812, 12.574%, 1/15/46 – AMBAC Insured (IF) | 1/17 at 100.00 | A | | 609,000 | |
| | 37,955 | | Total Ohio | | | | 24,302,819 | |
| | | | Oklahoma – 0.9% (0.6% of Total Investments) | | | | | |
| | 1,675 | | Oklahoma Development Finance Authority, Health System Revenue Bonds, Integris Baptist Medical Center, Series 2008B, 5.250%, 8/15/38 | 8/18 at 100.00 | AA– | | 1,665,235 | |
| | 2,235 | | Oklahoma Development Finance Authority, Revenue Bonds, St. John Health System, Series 2004, 5.000%, 2/15/24 | 2/14 at 100.00 | A | | 2,250,109 | |
| | 3,910 | | Total Oklahoma | | | | 3,915,344 | |
| | Principal Amount (000) | | Description (1) | Optional Call Provisions (2) | Ratings (3) | | Value | |
| | | | Pennsylvania – 3.0% (2.0% of Total Investments) | | | | | |
| $ | 1,250 | | Erie Water Authority, Pennsylvania, Water Revenue Bonds, Series 2008, 5.000%, 12/01/43 – AGM Insured | 12/18 at 100.00 | AA+ | $ | 1,225,313 | |
| | 3,250 | | Pennsylvania Housing Finance Agency, Single Family Mortgage Revenue Bonds, Series 2006-96A, 4.650%, 10/01/31 (Alternative Minimum Tax) (UB) | 10/16 at 100.00 | AA+ | | 2,958,020 | |
| | 8,200 | | Pennsylvania Turnpike Commission, Turnpike Revenue Bonds, Capital Appreciation Series 2009E, 0.000%, 12/01/38 | 12/27 at 100.00 | A– | | 5,670,792 | |
| | 5,000 | | Pennsylvania Turnpike Commission, Turnpike Subordinate Revenue Bonds, Series 2009C, 0.000%, 6/01/33 – AGM Insured | 6/26 at 100.00 | AA+ | | 3,960,950 | |
| | 17,700 | | Total Pennsylvania | | | | 13,815,075 | |
| | | | Puerto Rico – 3.3% (2.2% of Total Investments) | | | | | |
| | 800 | | Puerto Rico Public Buildings Authority, Guaranteed Government Facilities Revenue Refunding Bonds, Series 2002D, 0.000%, 7/01/31 – AMBAC Insured | No Opt. Call | A3 | | 655,432 | |
| | 2,200 | | Puerto Rico Public Buildings Authority, Guaranteed Government Facilities Revenue Refunding Bonds, Series 2002D, 0.000%, 7/01/31 (Pre-refunded 7/01/17) – AMBAC Insured | 7/17 at 100.00 | A3 (4) | | 2,400,178 | |
| | | | Puerto Rico Sales Tax Financing Corporation, Sales Tax Revenue Bonds, First Subordinate Series 2009A: | | | | | |
| | 12,000 | | 0.000%, 8/01/32 | 8/26 at 100.00 | A+ | | 9,795,480 | |
| | 1,000 | | 6.000%, 8/01/42 | 8/19 at 100.00 | A+ | | 1,001,820 | |
| | 23,890 | | Puerto Rico Sales Tax Financing Corporation, Sales Tax Revenue Bonds, Series 2007A, 0.000%, 8/01/54 – AMBAC Insured | No Opt. Call | Aa2 | | 1,243,952 | |
| | 39,890 | | Total Puerto Rico | | | | 15,096,862 | |
| | | | Rhode Island – 1.7% (1.1% of Total Investments) | | | | | |
| | | | Rhode Island Housing & Mortgage Finance Corporation, Homeownership Opportunity 57-B Bond Program, Series 2008, Trust 1177: | | | | | |
| | 1,500 | | 9.479%, 4/01/23 (Alternative Minimum Tax) (IF) | 4/17 at 100.00 | AA+ | | 1,501,380 | |
| | 1,000 | | 9.579%, 4/01/23 (Alternative Minimum Tax) (IF) | 4/17 at 100.00 | AA+ | | 968,460 | |
| | 5,440 | | Rhode Island Tobacco Settlement Financing Corporation, Tobacco Settlement Asset-Backed Bonds, Series 2002A, 6.125%, 6/01/32 | 6/12 at 100.00 | BBB | | 5,213,206 | |
| | 7,940 | | Total Rhode Island | | | | 7,683,046 | |
| | | | South Carolina – 7.3% (4.8% of Total Investments) | | | | | |
| | | | Greenville County School District, South Carolina, Installment Purchase Revenue Bonds, Series 2002: | | | | | |
| | 5,500 | | 6.000%, 12/01/21 (Pre-refunded 12/01/12) | 12/12 at 101.00 | AA (4) | | 6,036,580 | |
| | 4,500 | | 6.000%, 12/01/21 (Pre-refunded 12/01/12) | 12/12 at 101.00 | Aaa | | 4,939,020 | |
| | 3,750 | | Greenwood County, South Carolina, Hospital Revenue Bonds, Self Memorial Hospital, Series 2001, 5.500%, 10/01/31 | 10/11 at 100.00 | A+ | | 3,718,050 | |
| | 2,500 | | Lexington County Health Service District, South Carolina, Hospital Revenue Refunding and Improvement Bonds, Series 2003, 5.750%, 11/01/28 (Pre-refunded 11/01/13) | 11/13 at 100.00 | AA– (4) | | 2,816,025 | |
| | 2,950 | | Medical University Hospital Authority, South Carolina, FHA-Insured Mortgage Revenue Bonds, Series 2004A, 5.250%, 2/15/22 – NPFG Insured | 8/14 at 100.00 | Baa1 | | 3,075,995 | |
| | 21,565 | | Piedmont Municipal Power Agency, South Carolina, Electric Revenue Bonds, Series 2004A-2, 0.000%, 1/01/30 – AMBAC Insured | No Opt. Call | A– | | 6,933,794 | |
| | 950 | | South Carolina Housing Finance and Development Authority, Mortgage Revenue Bonds, Series 2000A-2, 6.000%, 7/01/20 – AGM Insured (Alternative Minimum Tax) | 6/11 at 100.00 | Aa1 | | 977,607 | |
| | 4,565 | | Tobacco Settlement Revenue Management Authority, South Carolina, Tobacco Settlement Asset-Backed Bonds, Series 2001B, 6.000%, 5/15/22 (Pre-refunded 5/15/11) | 5/11 at 101.00 | BBB (4) | | 4,618,000 | |
| | 46,280 | | Total South Carolina | | | | 33,115,071 | |
| | | Nuveen Select Quality Municipal Fund, Inc. (continued) |
| NQS | | Portfolio of Investments |
April 30, 2011 (Unaudited)
| | | | | | | | | |
| | Principal Amount (000) | | Description (1) | Optional Call Provisions (2) | Ratings (3) | | Value | |
| | | | South Dakota – 1.6% (1.1% of Total Investments) | | | | | |
| $ | 3,905 | | Sioux Falls, South Dakota, Industrial Revenue Refunding Bonds, Great Plains Hotel Corporation, Series 1989, 8.500%, 11/01/16 (Pre-refunded 10/15/14) (Alternative Minimum Tax) | 10/14 at 100.00 | AAA | $ | 4,581,424 | |
| | 1,280 | | South Dakota Education Loans Inc., Revenue Bonds, Subordinate Series 1998-1K, 5.600%, 6/01/20 (Alternative Minimum Tax) | 7/11 at 100.00 | B3 | | 1,038,298 | |
| | 1,750 | | South Dakota Health and Educational Facilities Authority, Revenue Bonds, Sioux Valley Hospitals, Series 2004A, 5.500%, 11/01/31 | 11/14 at 100.00 | AA– | | 1,750,543 | |
| | 6,935 | | Total South Dakota | | | | 7,370,265 | |
| | | | Tennessee – 5.1% (3.4% of Total Investments) | | | | | |
| | 3,125 | | Johnson City Health and Educational Facilities Board, Tennessee, Hospital Revenue Bonds, Mountain States Health Alliance, Refunding Series 2010A, 6.000%, 7/01/38 | 7/20 at 100.00 | BBB+ | | 2,878,188 | |
| | 5,000 | | Knox County Health, Educational and Housing Facilities Board, Tennessee, Hospital Revenue Bonds, Baptist Health System of East Tennessee Inc., Series 2002, 6.500%, 4/15/31 | 4/12 at 101.00 | A1 | | 5,187,150 | |
| | 20,060 | | Knox County Health, Educational and Housing Facilities Board, Tennessee, Hospital Revenue Refunding Bonds, Covenant Health, Series 2002A, 0.000%, 1/01/17 – AGM Insured | 1/13 at 80.49 | AA+ | | 15,301,367 | |
| | 28,185 | | Total Tennessee | | | | 23,366,705 | |
| | | | Texas – 18.9% (12.5% of Total Investments) | | | | | |
| | 5,110 | | Brazos River Authority, Texas, Pollution Control Revenue Refunding Bonds, TXU Electric Company, Series 1999C, 7.700%, 3/01/32 (Alternative Minimum Tax) | 4/13 at 101.00 | Ca | | 2,154,938 | |
| | 7,925 | | Brazos River Authority, Texas, Pollution Control Revenue Refunding Bonds, TXU Electric Company, Series 2001C, 5.750%, 5/01/36 (Mandatory put 11/01/11) (Alternative Minimum Tax) | No Opt. Call | CC | | 7,763,251 | |
| | 1,000 | | Capital Area Cultural Education Facilities Finance Corporation, Texas, Revenue Bonds, The Roman Catholic Diocese of Austin, Series 2005B. Remarketed, 6.125%, 4/01/45 | 4/20 at 100.00 | Baa2 | | 960,700 | |
| | 4,080 | | Central Texas Regional Mobility Authority, Travis and Williamson Counties, Toll Road Revenue Bonds, Series 2005, 5.000%, 1/01/35 – FGIC Insured | 1/15 at 100.00 | BBB | | 3,324,098 | |
| | 5,500 | | Dallas Area Rapid Transit, Texas, Senior Lien Sales Tax Revenue Bonds, Series 2001, 5.000%, 12/01/31 (Pre-refunded 12/01/11) – AMBAC Insured | 12/11 at 100.00 | AA+ (4) | | 5,653,010 | |
| | 2,000 | | Ennis Independent School District, Ellis County, Texas, General Obligation Bonds, Series 2006, 0.000%, 8/15/28 | 8/16 at 54.64 | Aaa | | 838,820 | |
| | 1,550 | | Gulf Coast Waste Disposal Authority, Texas, Waste Disposal Revenue Bonds, Valero Energy Corporation, Series 2001, 6.650%, 4/01/32 (Alternative Minimum Tax) | 10/11 at 101.00 | BBB | | 1,554,681 | |
| | 1,000 | | Harris County, Texas, Toll Road Senior Lien Revenue Refunding Bonds, Series 2004A, 5.000%, 8/15/27 – FGIC Insured | 8/14 at 100.00 | AA– | | 1,011,970 | |
| | 7,570 | | Harris County-Houston Sports Authority, Texas, Junior Lien Revenue Bonds, Series 2001H, 0.000%, 11/15/31 – NPFG Insured | No Opt. Call | Baa1 | | 1,252,835 | |
| | 5,000 | | Houston Community College System, Texas, Limited Tax General Obligation Bonds, Series 2003, 5.000%, 2/15/26 – AMBAC Insured (UB) | 2/13 at 100.00 | AA+ | | 5,181,200 | |
| | 5,000 | | Houston, Texas, First Lien Combined Utility System Revenue Bonds, Series 2005, 5.000%, 11/15/35 – AGM Insured | 11/15 at 100.00 | AA+ | | 5,023,050 | |
| | 4,130 | | Houston, Texas, Hotel Occupancy Tax and Special Revenue Bonds, Convention and Entertainment Project, Series 2001B, 0.000%, 9/01/26 – AMBAC Insured | No Opt. Call | AA+ | | 1,744,016 | |
| | 9,000 | | Matagorda County Navigation District 1, Texas, Collateralized Revenue Refunding Bonds, Houston Light and Power Company, Series 1997, 5.125%, 11/01/28 – AMBAC Insured (Alternative Minimum Tax) | No Opt. Call | A3 | | 8,594,460 | |
| | 5,000 | | Midland Independent School District, Midland County, Texas, General Obligation Bonds, School Building Series 2007, 5.000%, 2/15/32 | 2/17 at 100.00 | AAA | | 5,176,200 | |
| | 7,000 | | North Texas Tollway Authority, First Tier System Revenue Refunding Bonds, Capital Appreciation Series 2008I, 0.000%, 1/01/43 | 1/25 at 100.00 | A2 | | 5,577,670 | |
| | 340 | | Panhandle Regional Housing Finance Corporation, Texas, GNMA Mortgage-Backed Securities Program Single Family Mortgage Revenue Bonds, Series 1991A, 7.500%, 5/01/24 (Alternative Minimum Tax) | 11/11 at 100.00 | N/R | | 343,825 | |
| | 2,210 | | Richardson Hospital Authority, Texas, Revenue Bonds, Richardson Regional Medical Center, Series 2004, 6.000%, 12/01/19 | 12/13 at 100.00 | Baa2 | | 2,234,244 | |
| | Principal Amount (000) | | Description (1) | Optional Call Provisions (2) | Ratings (3) | | Value | |
| | | | Texas (continued) | | | | | |
| $ | 4,700 | | Sam Rayburn Municipal Power Agency, Texas, Power Supply System Revenue Refunding Bonds, Series 2002A, 6.000%, 10/01/21 | 10/12 at 100.00 | Baa2 | $ | 4,769,325 | |
| | 5,500 | | Spring Independent School District, Harris County, Texas, Unlimited Tax Schoolhouse Bonds, Series 2001, 5.000%, 8/15/26 | 8/11 at 100.00 | AAA | | 5,548,785 | |
| | 4,375 | | Tarrant County Cultural & Educational Facilities Financing Corporation, Texas, Revenue Bonds, Texas Health Resources Tender Option Bond Trust 1197, 9.155%, 11/15/39 (IF) | 11/17 at 100.00 | AA– | | 3,378,463 | |
| | 2,890 | | Tarrant County Cultural Education Facilities Finance Corporation, Texas, Hospital Revenue Bonds, Scott & White HealthCare Project, Series 2010, 5.500%, 8/15/45 | 8/20 at 100.00 | A1 | | 2,753,043 | |
| | 3,335 | | Texas State, General Obligation Bonds, Water Financial Assistance, Tender Option Bond Trust 3479, 13.320%, 2/01/17 (IF) | No Opt. Call | Aaa | | 3,610,037 | |
| | | | White Settlement Independent School District, Tarrant County, Texas, General Obligation Bonds, Series 2006: | | | | | |
| | 9,110 | | 0.000%, 8/15/36 | 8/15 at 33.75 | AAA | | 2,219,105 | |
| | 9,110 | | 0.000%, 8/15/41 | 8/15 at 25.73 | AAA | | 1,627,410 | |
| | 7,110 | | 0.000%, 8/15/45 | 8/15 at 20.76 | AAA | | 988,788 | |
| | 1,565 | | Winter Garden Housing Finance Corporation, Texas, GNMA/FNMA Mortgage-Backed Securities Program Single Family Mortgage Revenue Bonds, Series 1994, 6.950%, 10/01/27 (Alternative Minimum Tax) | 10/11 at 100.00 | AA+ | | 1,566,941 | |
| | 2,000 | | Wylie Independent School District, Collin County, Texas, General Obligation Bonds, Series 2005, 0.000%, 8/15/26 | 8/15 at 57.10 | AAA | | 931,880 | |
| | 123,110 | | Total Texas | | | | 85,782,745 | |
| | | | Utah – 0.8% (0.5% of Total Investments) | | | | | |
| | 3,565 | | Utah Associated Municipal Power Systems, Revenue Bonds, Payson Power Project, Series 2003A, 5.000%, 4/01/24 – AGM Insured (UB) | 4/13 at 100.00 | AA+ | | 3,745,603 | |
| | | | Vermont – 2.0% (1.3% of Total Investments) | | | | | |
| | | | Vermont Educational and Health Buildings Financing Agency, Revenue Bonds, Fletcher Allen Health Care Inc., Series 2000A: | | | | | |
| | 3,720 | | 6.125%, 12/01/15 – AMBAC Insured | 6/11 at 101.00 | Baa1 | | 3,764,082 | |
| | 4,265 | | 6.250%, 12/01/16 – AMBAC Insured | 6/11 at 101.00 | Baa1 | | 4,314,602 | |
| | 765 | | Vermont Housing Finance Agency, Single Family Housing Bonds, Series 2000-13A, 5.950%, 11/01/25 – AGM Insured (Alternative Minimum Tax) | 11/11 at 100.00 | AA+ | | 786,015 | |
| | 8,750 | | Total Vermont | | | | 8,864,699 | |
| | | | Virginia – 1.1% (0.7% of Total Investments) | | | | | |
| | 1,500 | | Fairfax County Economic Development Authority, Virginia, Residential Care Facilities Mortgage Revenue Bonds, Goodwin House, Inc., Series 2007A, 5.125%, 10/01/42 | 10/17 at 100.00 | N/R | | 1,267,155 | |
| | 5,000 | | Metropolitan Washington DC Airports Authority, Virginia, Dulles Toll Road Revenue Bonds, Series 2009C, 0.000%, 10/01/41 – AGC Insured | 10/26 at 100.00 | AA+ | | 3,633,900 | |
| | 6,500 | | Total Virginia | | | | 4,901,055 | |
| | | | Washington – 5.2% (3.4% of Total Investments) | | | | | |
| | 8,810 | | Chelan County Public Utility District 1, Washington, Hydro Consolidated System Revenue Bonds, Series 2001A, 5.600%, 1/01/36 – NPFG Insured (Alternative Minimum Tax) (UB) | 7/11 at 101.00 | AA | | 8,676,088 | |
| | 3,750 | | FYI Properties, Washington, Lease Revenue Bonds, Washington State Department of Information Services Project, Series 2009, 5.500%, 6/01/39 | 6/19 at 100.00 | AA | | 3,788,813 | |
| | 7,225 | | Port of Seattle, Washington, Special Facility Revenue Bonds, Terminal 18, Series 1999B, 6.000%, 9/01/20 – NPFG Insured (Alternative Minimum Tax) | 9/11 at 100.00 | Baa1 | | 7,231,358 | |
| | 2,000 | | Washington State Health Care Facilities Authority, Revenue Bonds, Fred Hutchinson Cancer Research Center, Series 2009A, 6.000%, 1/01/33 | 7/19 at 100.00 | A | | 2,007,480 | |
| | 2,500 | | Washington State Health Care Facilities Authority, Revenue Bonds, Northwest Hospital and Medical Center of Seattle, Series 2007, 5.700%, 12/01/32 | No Opt. Call | N/R | | 1,933,875 | |
| | 24,285 | | Total Washington | | | | 23,637,614 | |
| | | Nuveen Select Quality Municipal Fund, Inc. (continued) |
| NQS | | Portfolio of Investments |
April 30, 2011 (Unaudited)
| | | | | | | | | |
| | Principal Amount (000) | | Description (1) | Optional Call Provisions (2) | Ratings (3) | | Value | |
| | | | West Virginia – 1.1% (0.7% of Total Investments) | | | | | |
| $ | 5,000 | | Mason County, West Virginia, Pollution Control Revenue Bonds, Appalachian Power Company, Series 2003L, 5.500%, 10/01/22 (Mandatory put 10/01/11) | 10/11 at 100.00 | BBB | $ | 5,020,000 | |
| | | | Wisconsin – 2.6% (1.7% of Total Investments) | | | | | |
| | 4,845 | | Badger Tobacco Asset Securitization Corporation, Wisconsin, Tobacco Settlement Asset-Backed Bonds, Series 2002, 6.125%, 6/01/27 (Pre-refunded 6/01/12) | 6/12 at 100.00 | AAA | | 5,029,982 | |
| | 5,000 | | Madison, Wisconsin, Industrial Development Revenue Refunding Bonds, Madison Gas and Electric Company Projects, Series 2002A, 5.875%, 10/01/34 (Alternative Minimum Tax) | 4/12 at 100.00 | AA– | | 5,005,950 | |
| | 2,100 | | Wisconsin Health and Educational Facilities Authority, Revenue Bonds, Wheaton Franciscan Services Inc., Series 2003A, 5.125%, 8/15/33 | 8/13 at 100.00 | BBB+ | | 1,781,934 | |
| | 11,945 | | Total Wisconsin | | | | 11,817,866 | |
| $ | 934,335 | | Total Investments (cost $722,353,339) – 151.7% | | | | 688,800,618 | |
| | | | Floating Rate Obligations – (4.1)% | | | | (18,540,000 | ) |
| | | | Other Assets Less Liabilities – 7.8% | | | | 34,921,962 | |
| | | | Auction Rate Preferred Shares, at Liquidation Value – (55.4)% (6) | | | | (251,275,000 | ) |
| | | | Net Assets Applicable to Common Shares – 100% | | | $ | 453,907,580 | |
| (1) | | All percentages shown in the Portfolio of Investments are based on net assets applicable to Common shares unless otherwise noted. |
| (2) | | Optional Call Provisions: Dates (month and year) and prices of the earliest optional call or redemption. There may be other call provisions at varying prices at later dates. Certain mortgage-backed securities may be subject to periodic principal paydowns. |
| (3) | | Ratings: Using the highest of Standard & Poor’s Group (“Standard & Poor’s”), Moody’s Investor Service, Inc. (“Moody’s”) or Fitch, Inc. (“Fitch”) rating. Ratings below BBB by Standard & Poor’s, Baa by Moody’s or BBB by Fitch are considered to be below investment grade. Holdings designated N/R are not rated by any of these national rating agencies. |
| (4) | | Backed by an escrow or trust containing sufficient U.S. Government or U.S. Government agency securities, which ensure the timely payment of principal and interest. Such investments are normally considered to be equivalent to AAA rated securities. |
| (5) | | At or subsequent to the end of the reporting period, this security is non-income producing. Non-income producing security, in the case of a bond, generally denotes that the issuer has (1) defaulted on the payment of principal or interest, (2) is under the protection of the Federal Bankruptcy Court or (3) the Fund’s Adviser has concluded that the issue is not likely to meet its future interest payment obligations and has directed the Fund’s custodian to cease accruing additional income on the Fund’s records. |
| (6) | | Auction Rate Preferred Shares, at Liquidation Value as a percentage of Total Investments are 36.5%. |
| N/R | | Not rated. |
| (IF) | | Inverse floating rate investment. |
| (UB) | | Underlying bond of an inverse floating rate trust reflected as a financing transaction. See Notes to Financial Statements, Footnote 1 – General Information and Significant Accounting Policies, Inverse Floating Rate Securities for more information. |
See accompanying notes to financial statements.
| | | Nuveen Quality Income Municipal Fund, Inc. |
| NQU | | Portfolio of Investments |
| | | April 30, 2011 (Unaudited) |
| | Principal Amount (000) | | Description (1) | Optional Call Provisions (2) | Ratings (3) | | Value | |
| | | | Alaska – 2.0% (1.3% of Total Investments) | | | | | |
| $ | 6,110 | | Alaska Housing Finance Corporation, General Housing Purpose Bonds, Series 2005A, 5.000%, 12/01/27 – FGIC Insured (UB) | 12/14 at 100.00 | AA+ | $ | 6,207,943 | |
| | 13,835 | | Northern Tobacco Securitization Corporation, Alaska, Tobacco Settlement Asset-Backed Bonds, Series 2006A, 5.000%, 6/01/46 | 6/14 at 100.00 | Baa3 | | 8,236,805 | |
| | 19,945 | | Total Alaska | | | | 14,444,748 | |
| | | | Arizona – 3.6% (2.3% of Total Investments) | | | | | |
| | 5,350 | | Arizona Tourism and Sports Authority, Tax Revenue Bonds, Multipurpose Stadium Facility Project, Series 2003A, 5.000%, 7/01/28 – NPFG Insured | 7/13 at 100.00 | A1 | | 5,167,190 | |
| | 1,190 | | Maricopa County Industrial Development Authority, Arizona, Health Facility Revenue Bonds, Catholic Healthcare West, Series 2007A, 5.250%, 7/01/32 | 7/17 at 100.00 | A | | 1,107,950 | |
| | 1,000 | | Mesa, Arizona, Utility System Revenue Refunding Bonds, Series 2002, 5.250%, 7/01/17 – FGIC Insured | No Opt. Call | Aa2 | | 1,148,030 | |
| | 7,780 | | Phoenix Civic Improvement Corporation, Arizona, Junior Lien Airport Revenue Bonds, Series 2010A, 5.000%, 7/01/40 | No Opt. Call | A+ | | 7,133,093 | |
| | 2,350 | | Phoenix Civic Improvement Corporation, Arizona, Senior Lien Airport Revenue Bonds, Series 2008A, 5.000%, 7/01/33 | 7/18 at 100.00 | AA– | | 2,334,279 | |
| | 1,000 | | Pima County Industrial Development Authority, Arizona, Revenue Bonds, Tucson Electric Power Company, Series 2010A, 5.250%, 10/01/40 | 10/20 at 100.00 | BBB– | | 878,230 | |
| | 2,725 | | Salt River Project Agricultural Improvement and Power District, Arizona, Electric System Revenue Refunding Bonds, Series 2002A, 5.125%, 1/01/27 (Pre-refunded 1/01/12) | 1/12 at 101.00 | N/R (4) | | 2,841,085 | |
| | 5,615 | | Salt River Project Agricultural Improvement and Power District, Arizona, Electric System Revenue Refunding Bonds, Series 2002A, 5.125%, 1/01/27 | 1/12 at 101.00 | Aa1 | | 5,705,570 | |
| | 27,010 | | Total Arizona | | | | 26,315,427 | |
| | | | Arkansas – 1.0% (0.6% of Total Investments) | | | | | |
| | | | Arkansas Development Finance Authority, Tobacco Settlement Revenue Bonds, Arkansas Cancer Research Center Project, Series 2006: | | | | | |
| | 2,500 | | 0.000%, 7/01/36 – AMBAC Insured | No Opt. Call | Aa2 | | 592,350 | |
| | 19,800 | | 0.000%, 7/01/46 – AMBAC Insured | No Opt. Call | Aa2 | | 2,451,833 | |
| | 4,000 | | University of Arkansas, Fayetteville, Revenue Bonds, Medical Sciences Campus, Series 2004B, 5.000%, 11/01/34 – NPFG Insured | 11/14 at 100.00 | Aa2 | | 4,035,800 | |
| | 26,300 | | Total Arkansas | | | | 7,079,983 | |
| | | | California – 19.6% (12.4% of Total Investments) | | | | | |
| | 12,500 | | Anaheim Public Finance Authority, California, Subordinate Lease Revenue Bonds, Public Improvement Project, Series 1997C, 0.000%, 9/01/35 – AGM Insured | No Opt. Call | AA+ | | 1,927,750 | |
| | 1,000 | | California Department of Water Resources, Power Supply Revenue Bonds, Series 2002A, 5.750%, 5/01/17 (Pre-refunded 5/01/12) | 5/12 at 101.00 | Aaa | | 1,062,980 | |
| | 6,000 | | California Health Facilities Financing Authority, Health Facility Revenue Bonds, Adventist Health System/West, Series 2003A, 5.000%, 3/01/33 | 3/13 at 100.00 | A | | 5,361,600 | |
| | 2,675 | | California Health Facilities Financing Authority, Insured Revenue Bonds, Cedars-Sinai Medical Center, Series 1997B, 5.125%, 8/01/27 – NPFG Insured | 7/11 at 100.00 | A2 | | 2,601,464 | |
| | 3,450 | | California Infrastructure Economic Development Bank, Revenue Bonds, J. David Gladstone Institutes, Series 2001, 5.250%, 10/01/34 | 10/11 at 101.00 | A– | | 3,028,410 | |
| | 2,335 | | California Municipal Finance Authority, Revenue Bonds, Eisenhower Medical Center, Series 2010A, 5.750%, 7/01/40 | 7/20 at 100.00 | Baa1 | | 2,101,430 | |
| | 14,600 | | California State, General Obligation Bonds, Series 2003, 5.250%, 2/01/28 | 8/13 at 100.00 | A1 | | 14,702,054 | |
| | 25,000 | | California State, General Obligation Bonds, Series 2005, 4.750%, 3/01/35 – NPFG Insured | 3/16 at 100.00 | A1 | | 22,539,750 | |
| | | | California State, General Obligation Bonds, Various Purpose Series 2010: | | | | | |
| | 3,500 | | 5.250%, 3/01/30 | 3/20 at 100.00 | A1 | | 3,545,430 | |
| | 10,000 | | 5.500%, 11/01/35 | 11/20 at 100.00 | A1 | | 10,062,500 | |
| | | Nuveen Quality Income Municipal Fund, Inc. (continued) |
| NQU | | Portfolio of Investments |
April 30, 2011 (Unaudited)
| | Principal | | | Optional Call | | | | |
| | Amount (000) | | Description (1) | Provisions (2) | Ratings (3) | | Value | |
| | | | California (continued) | | | | | |
| $ | 16,000 | | California State, Various Purpose General Obligation Bonds, Series 2007, 5.000%, 6/01/37 | 6/17 at 100.00 | A1 | $ | 14,971,360 | |
| | 1,360 | | California Statewide Community Development Authority, Revenue Bonds, Daughters of Charity Health System, Series 2005A, 5.250%, 7/01/30 | 7/15 at 100.00 | BBB | | 1,104,606 | |
| | 3,600 | | California Statewide Community Development Authority, Revenue Bonds, St. Joseph Health System, Series 2007A, 5.750%, 7/01/47 – FGIC Insured | 7/18 at 100.00 | AA– | | 3,374,892 | |
| | 10,000 | | California, Various Purpose General Obligation Bonds, Series 1999, 4.750%, 4/01/29 – NPFG Insured | 10/11 at 100.00 | A1 | | 9,552,000 | |
| | 2,710 | | Chula Vista Elementary School District, San Diego County, California, Certificates of Participation, Series 2004, 5.000%, 9/01/29 – NPFG Insured | 9/12 at 102.00 | Baa1 | | 2,257,538 | |
| | 8,500 | | Foothill/Eastern Transportation Corridor Agency, California, Toll Road Revenue Bonds, Series 1995A, 5.000%, 1/01/35 – NPFG Insured | 7/11 at 100.00 | Baa1 | | 6,396,505 | |
| | | | Golden State Tobacco Securitization Corporation, California, Tobacco Settlement Asset-Backed Bonds, Series 2007A-1: | | | | | |
| | 2,500 | | 4.500%, 6/01/27 | 6/17 at 100.00 | BBB– | | 1,876,425 | |
| | 10,595 | | 5.000%, 6/01/33 | 6/17 at 100.00 | Baa3 | | 7,072,692 | |
| | 1,500 | | 5.125%, 6/01/47 | 6/17 at 100.00 | Baa3 | | 915,225 | |
| | 2,000 | | Los Angeles Department of Water and Power, California, Power System Revenue Bonds, Series 2005A-2, 5.000%, 7/01/22 – AGM Insured | No Opt. Call | AA+ | | 2,132,220 | |
| | 5,000 | | Los Angeles Unified School District, California, General Obligation Bonds, Series 2006F, 5.000%, 7/01/30 – FGIC Insured | 7/16 at 100.00 | Aa2 | | 4,984,400 | |
| | 3,300 | | M-S-R Energy Authority, California, Gas Revenue Bonds, Series 2009B, 6.500%, 11/01/39 | No Opt. Call | A | | 3,404,676 | |
| | 5,000 | | Palomar Pomerado Health Care District, California, Certificates of Participation, Series 2010, 6.000%, 11/01/30 | 11/20 at 100.00 | Baa3 | | 4,571,350 | |
| | 1,830 | | San Diego Public Facilities Financing Authority, California, Water Utility Revenue Bonds, Tender Option Bond Trust 3504, 19.580%, 2/01/33 (IF) | 8/19 at 100.00 | Aa2 | | 2,032,105 | |
| | | | San Joaquin Hills Transportation Corridor Agency, Orange County, California, Toll Road Revenue Refunding Bonds, Series 1997A: | | | | | |
| | 7,210 | | 0.000%, 1/15/23 – NPFG Insured | No Opt. Call | Baa1 | | 2,816,370 | |
| | 30,000 | | 0.000%, 1/15/35 – NPFG Insured | No Opt. Call | Baa1 | | 3,075,900 | |
| | 3,000 | | San Mateo County Community College District, California, General Obligation Bonds, Series 2006C, 0.000%, 9/01/30 – NPFG Insured | No Opt. Call | Aaa | | 925,590 | |
| | 4,495 | | Stockton-East Water District, California, Certificates of Participation, Refunding
Series 2002B, 0.000%, 4/01/28 – FGIC Insured | 4/12 at 38.12 | A | | 1,380,325 | |
| | 1,500 | | Tobacco Securitization Authority of Northern California, Tobacco Settlement Asset-Backed Bonds, Series 2005A-1, 5.500%, 6/01/45 | 6/15 at 100.00 | Baa3 | | 919,635 | |
| | 1,860 | | Tobacco Securitization Authority of Southern California, Tobacco Settlement Asset-Backed Bonds, San Diego County Tobacco Asset Securitization Corporation, Senior Series 2001A, 4.750%, 6/01/25 | 6/14 at 100.00 | BBB | | 1,557,936 | |
| | 203,020 | | Total California | | | | 142,255,118 | |
| | | | Colorado – 4.6% (2.9% of Total Investments) | | | | | |
| | 11,830 | | Colorado Health Facilities Authority, Health Facilities Revenue Bonds, Sisters of Charity of Leavenworth Health Services Corporation, Series 2010A, 5.000%, 1/01/40 | No Opt. Call | AA | | 10,869,049 | |
| | 1,000 | | Colorado Health Facilities Authority, Revenue Bonds, Poudre Valley Health System, Series 2005C, 5.250%, 3/01/40 – AGM Insured | 9/18 at 102.00 | AA+ | | 939,540 | |
| | 6,390 | | E-470 Public Highway Authority, Colorado, Senior Revenue Bonds, Series 1997B, 0.000%, 9/01/26 – NPFG Insured | No Opt. Call | Baa1 | | 2,056,366 | |
| | 43,000 | | E-470 Public Highway Authority, Colorado, Senior Revenue Bonds, Series 2000B, 0.000%, 9/01/33 – NPFG Insured | No Opt. Call | Baa1 | | 7,584,340 | |
| | 7,000 | | E-470 Public Highway Authority, Colorado, Toll Revenue Bonds, Series 2004A, 0.000%, 9/01/34 – NPFG Insured | No Opt. Call | Baa1 | | 1,131,410 | |
| | 680 | | Regional Transportation District, Colorado, Certificates of Participation, Series 2010A, 5.375%, 6/01/31 | 6/20 at 100.00 | Aa3 | | 691,703 | |
| | Principal | | | Optional Call | | | | |
| | Amount (000) | | Description (1) | Provisions (2) | Ratings (3) | | Value | |
| | | | Colorado (continued) | | | | | |
| | | | Regional Transportation District, Colorado, Denver Transit Partners Eagle P3 Project Private Activity Bonds, Series 2010: | | | | | |
| $ | 6,500 | | 6.500%, 1/15/30 | 7/20 at 100.00 | Baa3 | $ | 6,570,915 | |
| | 3,750 | | 6.000%, 1/15/41 | 7/20 at 100.00 | Baa3 | | 3,435,488 | |
| | 80,150 | | Total Colorado | | | | 33,278,811 | |
| | | | Connecticut – 0.6% (0.4% of Total Investments) | | | | | |
| | 4,395 | | Bridgeport, Connecticut, General Obligation Bonds, Series 2001C, 5.375%, 8/15/17 (Pre-refunded 8/15/11) – FGIC Insured | 8/11 at 100.00 | A1 (4) | | 4,458,507 | |
| | | | Florida – 0.9% (0.6% of Total Investments) | | | | | |
| | 2,500 | | Miami-Dade County, Florida, Aviation Revenue Bonds, Miami International Airport, Series 2010A-1, 5.375%, 10/01/41 | 10/20 at 100.00 | A2 | | 2,382,074 | |
| | 2,500 | | Miami-Dade County, Florida, Aviation Revenue Bonds, Miami International Airport, Series 2010B, 5.000%, 10/01/30 | 10/20 at 100.00 | A2 | | 2,408,150 | |
| | 2,000 | | Port Saint Lucie, Florida, Special Assessment Revenue Bonds, Southwest Annexation District 1B, Series 2007, 5.000%, 7/01/33 – NPFG Insured | 7/17 at 100.00 | Baa1 | | 1,650,040 | |
| | 7,000 | | Total Florida | | | | 6,440,264 | |
| | | | Georgia – 1.7% (1.1% of Total Investments) | | | | | |
| | 1,250 | | DeKalb County Hospital Authority, Georgia, Anticipation Certificates Revenue Bonds, DeKalb Medical Center, Inc. Project, Series 2010, 6.000%, 9/01/30 | 9/20 at 100.00 | N/R | | 1,172,487 | |
| | 2,500 | | Franklin County Industrial Building Authority, Georgia, Revenue Bonds, Ty Cobb Regional Medical Center Project, Series 2010, 7.625%, 12/01/30 | 12/20 at 100.00 | N/R | | 2,452,500 | |
| | 4,050 | | Gainesville and Hall County Hospital Authority, Georgia, Revenue Anticipation Certificates, Northeast Georgia Health Services Inc., Series 2010B, 5.125%, 2/15/40 | No Opt. Call | A+ | | 3,716,726 | |
| | 5,000 | | Medical Center Hospital Authority, Georgia, Revenue Anticipation Certificates, Columbus Regional Healthcare System, Inc. Project, Series 2008, 6.500%, 8/01/38 – AGC Insured | 8/18 at 100.00 | AA+ | | 5,205,800 | |
| | 12,800 | | Total Georgia | | | | 12,547,513 | |
| | | | Illinois – 15.2% (9.6% of Total Investments) | | | | | |
| | | | Chicago Board of Education, Illinois, Unlimited Tax General Obligation Bonds, Dedicated Revenues, Series 2001C: | | | | | |
| | 1,000 | | 5.500%, 12/01/18 (Pre-refunded 12/01/11) – AGM Insured | 12/11 at 100.00 | AA+ (4) | | 1,030,760 | |
| | 3,000 | | 5.000%, 12/01/20 (Pre-refunded 12/01/11) – AGM Insured | 12/11 at 100.00 | AA+ (4) | | 3,083,460 | |
| | 2,000 | | 5.000%, 12/01/21 (Pre-refunded 12/01/11) – AGM Insured | 12/11 at 100.00 | AA+ (4) | | 2,055,640 | |
| | | | Chicago Board of Education, Illinois, Unlimited Tax General Obligation Bonds, Dedicated Tax Revenues, Series 1998B-1: | | | | | |
| | 9,400 | | 0.000%, 12/01/14 – FGIC Insured | No Opt. Call | Aa2 | | 8,403,506 | |
| | 4,400 | | 0.000%, 12/01/15 – FGIC Insured | No Opt. Call | Aa2 | | 3,726,404 | |
| | 32,670 | | Chicago, Illinois, General Obligation Bonds, City Colleges, Series 1999, 0.000%, 1/01/32 – FGIC Insured | No Opt. Call | Aa3 | | 8,134,503 | |
| | 190 | | Chicago, Illinois, General Obligation Bonds, Series 2002A, 5.000%, 1/01/18 – AMBAC Insured | 7/12 at 100.00 | Aa3 | | 195,816 | |
| | | | Chicago, Illinois, General Obligation Bonds, Series 2002A: | | | | | |
| | 70 | | 5.000%, 1/01/18 (Pre-refunded 7/01/12) – AMBAC Insured | 7/12 at 100.00 | Aa3 (4) | | 73,791 | |
| | 6,190 | | 5.000%, 1/01/18 (Pre-refunded 7/01/12) – AMBAC Insured | 7/12 at 100.00 | Aa3 (4) | | 6,525,250 | |
| | 13,400 | | Chicago, Illinois, Revenue Bonds, Midway Airport, Series 1998A, 5.125%, | 7/11 at 100.00 | A | | 11,675,286 | |
| | | | 1/01/35 – NPFG Insured (Alternative Minimum Tax) | | | | | |
| | 2,000 | | Chicago, Illinois, Third Lien General Airport Revenue Bonds, O’Hare International Airport, Series 2003C-2, 5.250%, 1/01/30 – AGM Insured (Alternative Minimum Tax) | 1/14 at 100.00 | AA+ | | 1,943,080 | |
| | 5,000 | | Illinois Educational Facilities Authority, Revenue Bonds, University of Chicago, Refunding Series 2003A, 5.000%, 7/01/33 | 7/13 at 100.00 | Aa1 | | 5,017,500 | |
| | | | Illinois Educational Facilities Authority, Student Housing Revenue Bonds, Educational Advancement Foundation Fund, University Center Project, Series 2002: | | | | | |
| | 3,000 | | 6.625%, 5/01/17 (Pre-refunded 5/01/12) | 5/12 at 101.00 | Aaa | | 3,217,710 | |
| | 1,800 | | 6.000%, 5/01/22 (Pre-refunded 5/01/12) | 5/12 at 101.00 | Aaa | | 1,919,340 | |
| | 1,050 | | Illinois Finance Authority, General Obligation Debt Certificates, Local Government Program – Kankakee County, Series 2005B, 5.000%, 12/01/20 – AMBAC Insured | 12/14 at 100.00 | A2 | | 1,072,659 | |
| | | Nuveen Quality Income Municipal Fund, Inc. (continued) |
| NQU | | Portfolio of Investments |
April 30, 2011 (Unaudited)
| | Principal | | | Optional Call | | | | |
| | Amount (000) | | Description (1) | Provisions (2) | Ratings (3) | | Value | |
| | | | Illinois (continued) | | | | | |
| $ | 15,000 | | Illinois Finance Authority, Illinois, Northwestern University, Revenue Bonds, Series 2006, 5.000%, 12/01/42 (UB) | 12/15 at 100.00 | AAA | $ | 14,940,300 | |
| | 2,000 | | Illinois Finance Authority, Revenue Bonds, Children’s Memorial Hospital, Series 2008A, 5.250%, 8/15/47 – AGC Insured (UB) | 8/18 at 100.00 | AA+ | | 1,759,680 | |
| | 1,000 | | Illinois Finance Authority, Revenue Bonds, Edward Health Services Corporation, Series 2008A, 5.500%, 2/01/40 – AMBAC Insured | 2/18 at 100.00 | A+ | | 935,680 | |
| | 4,000 | | Illinois Finance Authority, Revenue Bonds, Memorial Health System, Series 2009, 5.500%, 4/01/34 | No Opt. Call | A+ | | 3,771,400 | |
| | 5,000 | | Illinois Finance Authority, Revenue Bonds, Northwestern Memorial Hospital, Series 2004A, 5.500%, 8/15/43 (Pre-refunded 8/15/14) | 8/14 at 100.00 | N/R (4) | | 5,715,900 | |
| | 5,725 | | Illinois Finance Authority, Revenue Bonds, Silver Cross Hospital and Medical Centers, Series 2009, 7.000%, 8/15/44 | 8/19 at 100.00 | BBB | | 5,734,847 | |
| | 4,115 | | Illinois Finance Authority, Student Housing Revenue Bonds, Educational Advancement Fund Inc., Refunding Series 2007A, 5.250%, 5/01/34 | 5/17 at 100.00 | Baa3 | | 3,349,775 | |
| | 2,335 | | Metropolitan Pier and Exposition Authority, Illinois, Revenue Bonds, McCormick Place Expansion Project, Refunding Series 2010B-2, 5.000%, 6/15/50 | No Opt. Call | AAA | | 2,001,165 | |
| | 8,750 | | Metropolitan Pier and Exposition Authority, Illinois, Revenue Bonds, McCormick Place Expansion Project, Series 1994B, 0.000%, 6/15/28 – NPFG Insured | No Opt. Call | AAA | | 3,115,963 | |
| | 2,370 | | Metropolitan Pier and Exposition Authority, Illinois, Revenue Bonds, McCormick Place Expansion Project, Series 2002A, 5.000%, 12/15/28 – NPFG Insured | 6/12 at 101.00 | AAA | | 2,371,517 | |
| | 919 | | Montgomery, Illinois, Lakewood Creek Project Special Assessment Bonds, Series 2007, 4.700%, 3/01/30 – RAAI Insured | 3/16 at 100.00 | N/R | | 738,481 | |
| | 3,500 | | Northfield Township High School District 225, Cook County, Illinois, Glenbrook, General Obligation School Bonds, Series 2007B, 0.000%, 12/01/23 | 12/16 at 72.44 | AAA | | 1,912,925 | |
| | 12,780 | | Will County School District 122, New Lenox, Illinois, General Obligation Bonds, Capital Appreciation School Series 2004D, 0.000%, 11/01/24 – AGM Insured | No Opt. Call | Aa3 | | 5,994,203 | |
| | 152,664 | | Total Illinois | | | | 110,416,541 | |
| | | | Indiana – 2.0% (1.3% of Total Investments) | | | | | |
| | 2,600 | | Crown Point Multi-School Building Corporation, Indiana, First Mortgage Bonds, Crown Point Community School Corporation, Series 2000, 0.000%, 1/15/24 – NPFG Insured | No Opt. Call | A | | 1,307,592 | |
| | 2,000 | | Indiana Health Facility Financing Authority, Hospital Revenue Bonds, Deaconess Hospital Inc., Series 2004A, 5.375%, 3/01/34 – AMBAC Insured | 3/14 at 100.00 | A | | 1,947,260 | |
| | 3,240 | | Indiana Health Facility Financing Authority, Hospital Revenue Bonds, Marion General Hospital, Series 2002, 5.625%, 7/01/19 – AMBAC Insured | 7/12 at 100.00 | A+ | | 3,292,067 | |
| | 2,400 | | Indiana Health Facility Financing Authority, Revenue Bonds, Community Hospitals of Indiana, Series 2005A, 5.000%, 5/01/35 – AMBAC Insured | 5/15 at 100.00 | A | | 2,102,280 | |
| | 6,420 | | St. Joseph County Hospital Authority, Indiana, Revenue Bonds, Memorial Health System, Series 1998A, 4.625%, 8/15/28 – NPFG Insured | 8/11 at 100.00 | AA– | | 6,071,843 | |
| | 16,660 | | Total Indiana | | | | 14,721,042 | |
| | | | Iowa – 1.1% (0.7% of Total Investments) | | | | | |
| | | | Iowa Tobacco Settlement Authority, Asset Backed Settlement Revenue Bonds, Series 2005C: | | | | | |
| | 4,000 | | 5.375%, 6/01/38 | 6/15 at 100.00 | BBB | | 2,837,240 | |
| | 7,000 | | 5.625%, 6/01/46 | 6/15 at 100.00 | BBB | | 4,720,520 | |
| | 11,000 | | Total Iowa | | | | 7,557,760 | |
| | | | Kansas – 0.5% (0.3% of Total Investments) | | | | | |
| | 1,750 | | Wamego, Kansas, Pollution Control Revenue Bonds, Kansas Gas and Electric Company, Series 2004, 5.300%, 6/01/31 – NPFG Insured | 6/14 at 100.00 | BBB+ | | 1,755,583 | |
| | 3,730 | | Wyandotte County-Kansas City Unified Government, Kansas, Sales Tax Special Obligation Capital Appreciation Revenue Bonds Redevelopment Project Area | No Opt. Call | N/R | | 2,066,308 | |
| | | | B – Major Multi-Sport Athletic Complex Project, Subordinate Lien Series 2010B, | | | | | |
| | | | 0.000%, 6/01/21 | | | | | |
| | 5,480 | | Total Kansas | | | | 3,821,891 | |
| | Principal | | | Optional Call | | | | |
| | Amount (000) | | Description (1) | Provisions (2) | Ratings (3) | | Value | |
| | | | Kentucky – 1.3% (0.8% of Total Investments) | | | | | |
| $ | 6,015 | | Kentucky Economic Development Finance Authority, Hospital Facilities Revenue Bonds, Owensboro Medical Health System, Series 2010B, 6.375%, 3/01/40 | 6/20 at 100.00 | Baa2 | $ | 5,707,513 | |
| | 1,000 | | Kentucky Economic Development Finance Authority, Louisville Arena Project Revenue Bonds, Louisville Arena Authority, Inc., Series 2008-A1, 6.000%, 12/01/33 – AGC Insured | 6/18 at 100.00 | AA+ | | 1,025,720 | |
| | 2,500 | | Kentucky State Property and Buildings Commission, Revenue Refunding Bonds, Project 74, Series 2002, 5.375%, 2/01/18 (Pre-refunded 2/01/12) – AGM Insured | 2/12 at 100.00 | AAA | | 2,595,625 | |
| | 9,515 | | Total Kentucky | | | | 9,328,858 | |
| | | | Louisiana – 4.9% (3.1% of Total Investments) | | | | | |
| | 10,000 | | Louisiana Public Facilities Authority, Hospital Revenue Bonds, Franciscan Missionaries of Our Lady Health System, Series 1998A, 5.750%, 7/01/25 – AGM Insured (UB) | No Opt. Call | AA+ | | 10,609,900 | |
| | 4,095 | | Louisiana Public Facilities Authority, Revenue Bonds, Baton Rouge General Hospital, Series 2004, 5.250%, 7/01/33 – NPFG Insured | 7/14 at 100.00 | Baa1 | | 4,036,646 | |
| | 9,000 | | Louisiana Public Facilities Authority, Revenue Bonds, Ochsner Clinic Foundation Project, Series 2007A, 5.500%, 5/15/47 | 5/17 at 100.00 | Baa1 | | 7,492,590 | |
| | 5,500 | | Louisiana Public Facilities Authority, Revenue Bonds, Tulane University, Series 2002A, 5.000%, 7/01/32 (Pre-refunded 7/01/12) – AMBAC Insured | 7/12 at 100.00 | N/R (4) | | 5,791,225 | |
| | 8,305 | | Tobacco Settlement Financing Corporation, Louisiana, Tobacco Settlement Asset-Backed Bonds, Series 2001B, 5.875%, 5/15/39 | 5/11 at 101.00 | A– | | 7,579,392 | |
| | 36,900 | | Total Louisiana | | | | 35,509,753 | |
| | | | Massachusetts – 2.9% (1.8% of Total Investments) | | | | | |
| | 3,125 | | Massachusetts Department of Transportation, Metropolitan Highway System Revenue Bonds, Senior Lien Series 2010B, 5.000%, 1/01/37 | 1/20 at 100.00 | A | | 2,985,625 | |
| | 500 | | Massachusetts Health and Educational Facilities Authority, Revenue Bonds, CareGroup Inc., Series 2008E-1 &2, 5.125%, 7/01/38 | 7/18 at 100.00 | A3 | | 435,060 | |
| | 7,405 | | Massachusetts Health and Educational Facilities Authority, Revenue Bonds, Massachusetts Institute of Technology, Series 2002K, 5.500%, 7/01/32 (UB) | No Opt. Call | AAA | | 8,659,851 | |
| | 2,300 | | Massachusetts Health and Educational Facilities Authority, Revenue Refunding Bonds, Suffolk University Issue, Series 2009A, 5.750%, 7/01/39 | 7/19 at 100.00 | BBB | | 2,181,734 | |
| | 6,000 | | Massachusetts Industrial Finance Agency, Resource Recovery Revenue Refunding Bonds, Ogden Haverhill Project, Series 1998A, 5.600%, 12/01/19 (Alternative Minimum Tax) | 6/11 at 100.00 | A– | | 6,015,660 | |
| | 425 | | Massachusetts Water Pollution Abatement Trust, Revenue Bonds, MWRA Loan Program, Subordinate Series 1999A, 5.750%, 8/01/29 | 7/11 at 100.00 | AAA | | 426,169 | |
| | 19,755 | | Total Massachusetts | | | | 20,704,099 | |
| | | | Michigan – 4.6% (2.9% of Total Investments) | | | | | |
| | 2,000 | | Kalamazoo Hospital Finance Authority, Michigan, Hospital Revenue Refunding Bonds, Bronson Methodist Hospital, Series 2010, 5.250%, 5/15/36 – AGM Insured | 5/20 at 100.00 | Aa3 | | 1,869,340 | |
| | 3,790 | | Michigan Municipal Bond Authority, General Obligation Bonds, Detroit City School District, Series 2005, 5.000%, 6/01/20 – AGM Insured | 6/15 at 100.00 | AA+ | | 3,806,373 | |
| | | | Michigan State Building Authority, Revenue Bonds, Facilities Program, Series 2005II: | | | | | |
| | 7,975 | | 5.000%, 10/15/25 – AMBAC Insured | 10/15 at 100.00 | Aa3 | | 8,079,712 | |
| | 10,470 | | 5.000%, 10/15/26 – AMBAC Insured | 10/15 at 100.00 | Aa3 | | 10,565,486 | |
| | 5,500 | | Michigan State Hospital Finance Authority, Hospital Revenue Bonds, Henry Ford Health System, Refunding Series 2009, 5.625%, 11/15/29 | 11/19 at 100.00 | A1 | | 5,300,680 | |
| | 3,050 | | Michigan Tobacco Settlement Finance Authority, Tobacco Settlement Asset-Backed Revenue Bonds, Series 2008A, 6.875%, 6/01/42 | 6/18 at 100.00 | Baa3 | | 2,689,551 | |
| | 1,150 | | Royal Oak Hospital Finance Authority, Michigan, Hospital Revenue Bonds, William Beaumont Hospital, Refunding Series 2009V, 8.250%, 9/01/39 | 9/18 at 100.00 | A1 | | 1,307,493 | |
| | 33,935 | | Total Michigan | | | | 33,618,635 | |
| | | Nuveen Quality Income Municipal Fund, Inc. (continued) |
| NQU | | Portfolio of Investments |
April 30, 2011 (Unaudited)
| | Principal | | | Optional Call | | | | |
| | Amount (000) | | Description (1) | Provisions (2) | Ratings (3) | | Value | |
| | | | Minnesota – 0.7% (0.4% of Total Investments) | | | | | |
| $ | 3,655 | | Dakota and Washington Counties Housing and Redevelopment Authority, Minnesota, GNMA Mortgage-Backed Securities Program Single Family Residential Mortgage Revenue Bonds, Series 1988, 8.450%, 9/01/19 (Alternative Minimum Tax) (ETM) | No Opt. Call | AAA | $ | 4,887,247 | |
| | | | Mississippi – 0.3% (0.2% of Total Investments) | | | | | |
| | 1,875 | | Mississippi Hospital Equipment and Facilities Authority, Revenue Bonds, Baptist Memorial Healthcare, Series 2004B-1, 5.000%, 9/01/24 (UB) | 9/14 at 100.00 | AA | | 1,902,488 | |
| | | | Missouri – 1.7% (1.1% of Total Investments) | | | | | |
| | 2,400 | | Bi-State Development Agency of the Missouri-Illinois Metropolitan District, Mass Transit Sales Tax Appropriation Bonds, Metrolink Cross County Extension Project, Series 2002B, 5.000%, 10/01/23 – AGM Insured | 10/13 at 100.00 | AA+ | | 2,519,544 | |
| | 15,000 | | Kansas City Municipal Assistance Corporation, Missouri, Leasehold Revenue Bonds, Series 2004B-1, 0.000%, 4/15/28 – AMBAC Insured | No Opt. Call | AA– | | 5,494,200 | |
| | 15,350 | | Springfield Public Building Corporation, Missouri, Lease Revenue Bonds, Jordan Valley Park Projects, Series 2000A, 0.000%, 6/01/30 – AMBAC Insured | No Opt. Call | N/R | | 4,444,132 | |
| | 32,750 | | Total Missouri | | | | 12,457,876 | |
| | | | Nevada – 7.3% (4.6% of Total Investments) | | | | | |
| | 34,470 | | Clark County School District, Nevada, General Obligation Bonds, Series 2002C, 5.000%, 6/15/20 (Pre-refunded 6/15/12) – NPFG Insured | 6/12 at 100.00 | AA (4) | | 36,270,023 | |
| | 14,515 | | Clark County, Nevada, Passenger Facility Charge Revenue Bonds, Las Vegas-McCarran International Airport, Series 2010A, 5.250%, 7/01/42 | 1/20 at 100.00 | Aa3 | | 13,526,674 | |
| | 6,845 | | Director of Nevada State Department of Business and Industry, Revenue Bonds, Las Vegas Monorail Project, First Tier, Series 2000, 0.000%, 1/01/23 – AMBAC Insured | No Opt. Call | N/R | | 843,372 | |
| | 2,500 | | Reno, Nevada, Health Facilities Revenue Bonds, Catholic Healthcare West, Series 2007A, Trust 2634, 18.488%, 7/01/31 – BHAC Insured (IF) | 7/17 at 100.00 | AA+ | | 2,493,100 | |
| | 58,330 | | Total Nevada | | | | 53,133,169 | |
| | | | New Hampshire – 0.7% (0.4% of Total Investments) | | | | | |
| | 5,000 | | New Hampshire Business Finance Authority, Revenue Bonds, Elliot Hospital Obligated Group Issue, Series 2009A, 6.125%, 10/01/39 | 10/19 at 100.00 | BBB+ | | 4,930,150 | |
| | | | New Jersey – 5.5% (3.4% of Total Investments) | | | | | |
| | 1,000 | | New Jersey Building Authority, State Building Revenue Bonds, Series 2002A, 5.000%, 12/15/21 (Pre-refunded 12/15/12) – AGM Insured | 12/12 at 100.00 | AA+ (4) | | 1,073,130 | |
| | 1,500 | | New Jersey Health Care Facilities Financing Authority, New Jersey, Revenue Bonds, Saint Peters University Hospital, Series 2007, 5.750%, 7/01/37 | 7/18 at 100.00 | BBB– | | 1,285,770 | |
| | 10,000 | | New Jersey Health Care Facilities Financing Authority, Revenue Bonds, Saint Barnabas Health Care System, Series 2006A, 0.000%, 7/01/36 | 1/17 at 37.38 | BBB– | | 1,418,800 | |
| | 2,025 | | New Jersey Transportation Trust Fund Authority, Transportation System Bonds, Series 2001B, 6.000%, 12/15/19 (Pre-refunded 12/15/11) – NPFG Insured | 12/11 at 100.00 | A+ (4) | | 2,097,313 | |
| | 3,200 | | New Jersey Transportation Trust Fund Authority, Transportation System Bonds, Series 2003C, 5.500%, 6/15/22 (Pre-refunded 6/15/13) | 6/13 at 100.00 | AAA | | 3,531,648 | |
| | | | New Jersey Transportation Trust Fund Authority, Transportation System Bonds, Series 2006C: | | | | | |
| | 20,000 | | 0.000%, 12/15/33 – AGM Insured | No Opt. Call | AA+ | | 4,326,200 | |
| | 20,000 | | 0.000%, 12/15/35 – AMBAC Insured | No Opt. Call | A+ | | 3,716,200 | |
| | 20,000 | | 0.000%, 12/15/36 – AMBAC Insured | No Opt. Call | A+ | | 3,439,800 | |
| | | | Tobacco Settlement Financing Corporation, New Jersey, Tobacco Settlement Asset-Backed Bonds, Series 2002: | | | | | |
| | 1,745 | | 5.750%, 6/01/32 (Pre-refunded 6/01/12) | 6/12 at 100.00 | AAA | | 1,817,435 | |
| | 1,000 | | 6.125%, 6/01/42 (Pre-refunded 6/01/12) | 6/12 at 100.00 | AAA | | 1,062,880 | |
| | | | Tobacco Settlement Financing Corporation, New Jersey, Tobacco Settlement Asset-Backed Bonds, Series 2003: | | | | | |
| | 9,420 | | 6.750%, 6/01/39 (Pre-refunded 6/01/13) | 6/13 at 100.00 | AAA | | 10,599,290 | |
| | 1,850 | | 6.250%, 6/01/43 (Pre-refunded 6/01/13) | 6/13 at 100.00 | AAA | | 2,062,454 | |
| | Principal | | | Optional Call | | | | |
| | Amount (000) | | Description (1) | Provisions (2) | Ratings (3) | | Value | |
| | | | New Jersey (continued) | | | | | |
| $ | 5,000 | | Tobacco Settlement Financing Corporation, New Jersey, Tobacco Settlement Asset-Backed Bonds, Series 2007-1A, 4.750%, 6/01/34 | 6/17 at 100.00 | Baa3 | $ | 3,105,950 | |
| | 96,740 | | Total New Jersey | | | | 39,536,870 | |
| | | | New Mexico – 0.8% (0.5% of Total Investments) | | | | | |
| | 5,925 | | New Mexico Hospital Equipment Loan Council, Hospital Revenue Bonds, Presbyterian Healthcare Services, Series 2001A, 5.500%, 8/01/21 (Pre-refunded 8/01/11) | 8/11 at 101.00 | AA– (4) | | 6,063,823 | |
| | | | New York – 10.4% (6.6% of Total Investments) | | | | | |
| | 275 | | Dormitory Authority of the State of New York, Insured Revenue Bonds, Fordham University, Series 1998, 5.000%, 7/01/28 – NPFG Insured | 7/11 at 100.00 | A2 | | 275,055 | |
| | 2,250 | | Dormitory Authority of the State of New York, Insured Revenue Bonds, Mount Sinai School of Medicine, Series 1994A, 5.150%, 7/01/24 – NPFG Insured | No Opt. Call | A– | | 2,279,520 | |
| | 5,005 | | Dormitory Authority of the State of New York, Revenue Bonds, Non State Supported Debt, Vassar College, Series 2007, 5.000%, 7/01/46 | 7/17 at 100.00 | AA | | 4,887,232 | |
| | 1,320 | | Hudson Yards Infrastructure Corporation, New York, Revenue Bonds, Series 2006A, 4.500%, 2/15/47 – NPFG Insured | 2/17 at 100.00 | A | | 1,004,573 | |
| | 1,130 | | Long Island Power Authority, New York, Electric System General Revenue Bonds, Series 2001A, 5.375%, 9/01/25 (Pre-refunded 9/01/11) | 9/11 at 100.00 | AAA | | 1,149,662 | |
| | 13,600 | | Metropolitan Transportation Authority, New York, Transportation Revenue Bonds, Series 2006B, 4.500%, 11/15/32 – AGM Insured (UB) | 11/16 at 100.00 | AA+ | | 12,692,064 | |
| | 4,865 | | New York City, New York, General Obligation Bonds, Fiscal Series 2002A, 5.750%, 8/01/16 | 8/12 at 100.00 | AA | | 5,130,921 | |
| | 135 | | New York City, New York, General Obligation Bonds, Fiscal Series 2002A, 5.750%, 8/01/16 (Pre-refunded 8/01/12) | 8/12 at 100.00 | Aa2 (4) | | 144,115 | |
| | | | New York City, New York, General Obligation Bonds, Fiscal Series 2002G: | | | | | |
| | 695 | | 5.000%, 8/01/17 | 8/12 at 100.00 | AA | | 726,080 | |
| | 5,430 | | 5.750%, 8/01/18 | 8/12 at 100.00 | AA | | 5,718,442 | |
| | | | New York City, New York, General Obligation Bonds, Fiscal Series 2002G: | | | | | |
| | 255 | | 5.000%, 8/01/17 (Pre-refunded 8/01/12) | 8/12 at 100.00 | Aa2 (4) | | 269,823 | |
| | 5,115 | | 5.750%, 8/01/18 (Pre-refunded 8/01/12) | 8/12 at 100.00 | AA (4) | | 5,460,365 | |
| | | | New York State Environmental Facilities Corporation, State Clean Water and Drinking Water Revolving Funds Revenue Bonds, New York City Municipal Water Finance Authority Projects, Second Resolution Bonds, Series 2001C: | | | | | |
| | 6,035 | | 5.000%, 6/15/20 | 6/11 at 100.00 | AAA | | 6,067,770 | |
| | 6,575 | | 5.000%, 6/15/22 | 6/11 at 100.00 | AAA | | 6,604,062 | |
| | 11,540 | | Port Authority of New York and New Jersey, Consolidated Revenue Bonds, One Hundred Twenty-Eighth Series 2002, 5.000%, 11/01/20 – AGM Insured | 11/12 at 101.00 | AA+ | | 12,256,403 | |
| | | | Port Authority of New York and New Jersey, Special Project Bonds, JFK International Air Terminal LLC Project, Eigth Series 2010: | | | | | |
| | 8,550 | | 5.500%, 12/01/31 | 12/20 at 100.00 | BBB– | | 8,230,658 | |
| | 2,755 | | 6.000%, 12/01/36 | 12/20 at 100.00 | BBB– | | 2,675,987 | |
| | 75,530 | | Total New York | | | | 75,572,732 | |
| | | | North Carolina – 3.4% (2.2% of Total Investments) | | | | | |
| | 3,000 | | Charlotte-Mecklenberg Hospital Authority, North Carolina, Carolinas HealthCare System Revenue Bonds, Series 2008A, 5.000%, 1/15/47 | 1/18 at 100.00 | AA– | | 2,783,910 | |
| | 8,960 | | North Carolina Capital Facilities Financing Agency, Revenue Bonds, Duke University, Series 2005A, 5.000%, 10/01/41 | 10/15 at 100.00 | AA+ | | 9,024,960 | |
| | 4,000 | | North Carolina Medical Care Commission, Health System Revenue Bonds, Mission St. Joseph’s Health System, Series 2007, 4.500%, 10/01/31 (UB) | 10/17 at 100.00 | AA | | 3,472,840 | |
| | 1,000 | | North Carolina Medical Care Commission, Healthcare Facilities Revenue Bonds, Duke University Health System, Series 2009A, 5.000%, 6/01/39 | 6/19 at 100.00 | AA | | 966,290 | |
| | 665 | | North Carolina Medical Care Commission, Hospital Revenue Bonds, Pitt County Memorial Hospital, Series 1998A, 4.750%, 12/01/28 – NPFG Insured | 7/11 at 100.00 | A1 | | 616,275 | |
| | | Nuveen Quality Income Municipal Fund, Inc. (continued) |
| NQU | | Portfolio of Investments |
April 30, 2011 (Unaudited)
| | Principal | | | Optional Call | | | | |
| | Amount (000) | | Description (1) | Provisions (2) | Ratings (3) | | Value | |
| | | | North Carolina (continued) | | | | | |
| $ | 7,500 | | North Carolina Municipal Power Agency 1, Catawba Electric Revenue Bonds,
Series 2003A, 5.250%, 1/01/19 – NPFG Insured | 1/13 at 100.00 | A | $ | 7,928,025 | |
| | 25,125 | | Total North Carolina | | | | 24,792,300 | |
| | | | Ohio – 6.5% (4.1% of Total Investments) | | | | | |
| | 10,000 | | American Municipal Power Ohio Inc., General Revenue Bonds, Prairie State Energy Campus Project Series 2008A, 5.250%, 2/15/43 | 2/18 at 100.00 | A1 | | 9,742,800 | |
| | | | Buckeye Tobacco Settlement Financing Authority, Ohio, Tobacco Settlement Asset-Backed Revenue Bonds, Senior Lien, Series 2007A-2: | | | | | |
| | 205 | | 5.125%, 6/01/24 | 6/17 at 100.00 | Baa3 | | 158,395 | |
| | 2,925 | | 5.875%, 6/01/30 | 6/17 at 100.00 | Baa3 | | 2,110,797 | |
| | 5,040 | | 5.750%, 6/01/34 | 6/17 at 100.00 | Baa3 | | 3,472,560 | |
| | 2,400 | | 6.000%, 6/01/42 | 6/17 at 100.00 | Baa3 | | 1,666,224 | |
| | 5,730 | | 5.875%, 6/01/47 | 6/17 at 100.00 | Baa3 | | 3,865,974 | |
| | 10,000 | | Buckeye Tobacco Settlement Financing Authority, Ohio, Tobacco Settlement Asset-Backed Revenue Bonds, Senior Lien, Series 2007A-3, 0.000%, 6/01/37 | 6/22 at 100.00 | Baa3 | | 6,362,900 | |
| | | | Cincinnati City School District, Hamilton County, Ohio, General Obligation Bonds, Series 2002: | | | | | |
| | 2,165 | | 5.250%, 6/01/19 (Pre-refunded 12/01/12) – AGM Insured | 12/12 at 100.00 | AA+ (4) | | 2,329,518 | |
| | 2,600 | | 5.250%, 6/01/21 (Pre-refunded 12/01/12) ��� AGM Insured | 12/12 at 100.00 | AA+ (4) | | 2,797,574 | |
| | 2,000 | | 5.000%, 12/01/22 (Pre-refunded 12/01/12) – AGM Insured | 12/12 at 100.00 | AA+ (4) | | 2,144,060 | |
| | 10,000 | | Columbus City School District, Franklin County, Ohio, General Obligation Bonds, Series 2006, 4.250%, 12/01/32 – AGM Insured (UB) | 12/16 at 100.00 | AA+ | | 9,348,300 | |
| | 2,885 | | Lucas County, Ohio, Hospital Revenue Bonds, ProMedica Healthcare Obligated Group, Series 2011A, 6.000%, 11/15/41 | 11/21 at 100.00 | AA– | | 2,893,828 | |
| | 55,950 | | Total Ohio | | | | 46,892,930 | |
| | | | Oklahoma – 1.7% (1.1% of Total Investments) | | | | | |
| | 3,500 | | Grand River Dam Authority, Oklahoma, Revenue Bonds, Series 2010A, 5.250%, 6/01/40 | 6/20 at 100.00 | A | | 3,527,510 | |
| | 1,675 | | Oklahoma Development Finance Authority, Health System Revenue Bonds, Integris Baptist Medical Center, Series 2008B, 5.250%, 8/15/38 | 8/18 at 100.00 | AA– | | 1,665,235 | |
| | 6,040 | | Oklahoma Development Finance Authority, Revenue Bonds, Saint John Health System, Series 2007, 5.000%, 2/15/42 | 2/17 at 100.00 | A | | 5,585,309 | |
| | 2,000 | | Oklahoma Municipal Power Authority, Power Supply System Revenue Bonds, Series 2007, 4.500%, 1/01/47 – FGIC Insured | 1/17 at 100.00 | A | | 1,738,960 | |
| | 13,215 | | Total Oklahoma | | | | 12,517,014 | |
| | | | Oregon – 0.4% (0.3% of Total Investments) | | | | | |
| | 3,000 | | Deschutes County School District 1, Bend-La Pine, Oregon, General Obligation Bonds, Series 2001A, 5.500%, 6/15/18 (Pre-refunded 6/15/11) – AGM Insured | 6/11 at 100.00 | Aa1 (4) | | 3,020,160 | |
| | 100 | | Oregon Housing and Community Services Department, Single Family Mortgage Revenue Bonds, Series 2004H, 5.125%, 1/01/29 (Alternative Minimum Tax) | 1/14 at 100.00 | Aa2 | | 103,987 | |
| | 3,100 | | Total Oregon | | | | 3,124,147 | |
| | | | Pennsylvania – 5.3% (3.3% of Total Investments) | | | | | |
| | 2,000 | | Allegheny County Hospital Development Authority, Pennsylvania, University of Pittsburgh Medical Center Revenue Bonds, Series 2009A, 5.625%, 8/15/39 | No Opt. Call | Aa3 | | 1,976,080 | |
| | 220 | | Allentown, Pennsylvania, General Obligation Bonds, Series 2003, 5.500%, 10/01/19 – FGIC Insured | 10/13 at 100.00 | A1 | | 237,138 | |
| | 8,000 | | Montgomery County Industrial Development Authority, Pennsylvania, FHA Insured Mortgage Revenue Bonds, New Regional Medical Center Project, Series 2010, 5.250%, 8/01/33 | 8/20 at 100.00 | AA | | 8,010,960 | |
| | 1,500 | | Pennsylvania Housing Finance Agency, Single Family Mortgage Revenue Bonds, Series 2006-96A, 4.650%, 10/01/31 (Alternative Minimum Tax) (UB) | 10/16 at 100.00 | AA+ | | 1,365,240 | |
| | 2,600 | | Pennsylvania Turnpike Commission, Turnpike Revenue Bonds, Series 2004A, 5.500%, 12/01/31 – AMBAC Insured | 12/14 at 100.00 | Aa3 | | 2,628,496 | |
| | Principal | | | Optional Call | | | | |
| | Amount (000) | | Description (1) | Provisions (2) | Ratings (3) | | Value | |
| | | | Pennsylvania (continued) | | | | | |
| $ | 5,000 | | Pennsylvania Turnpike Commission, Turnpike Subordinate Revenue Bonds, Series 2009C, 0.000%, 6/01/33 – AGM Insured | 6/26 at 100.00 | AA+ | $ | 3,960,950 | |
| | 7,800 | | Philadelphia Gas Works, Pennsylvania, Revenue Bonds, General Ordinance,
Fourth Series 1998, 5.000%, 8/01/32 – AGM Insured | 8/13 at 100.00 | AA+ | | 7,751,952 | |
| | | | Philadelphia School District, Pennsylvania, General Obligation Bonds, Series 2002B: | | | | | |
| | 6,000 | | 5.625%, 8/01/19 (Pre-refunded 8/01/12) – FGIC Insured | 8/12 at 100.00 | Aa2 (4) | | 6,389,160 | |
| | 5,500 | | 5.625%, 8/01/20 (Pre-refunded 8/01/12) – FGIC Insured | 8/12 at 100.00 | Aa2 (4) | | 5,856,730 | |
| | 38,620 | | Total Pennsylvania | | | | 38,176,706 | |
| | | | Puerto Rico – 8.8% (5.6% of Total Investments) | | | | | |
| | 2,500 | | Puerto Rico Aqueduct and Sewerage Authority, Revenue Bonds, Senior Lien Series 2008A, 6.000%, 7/01/44 | 7/18 at 100.00 | Baa1 | | 2,356,275 | |
| | 7,000 | | Puerto Rico Electric Power Authority, Power Revenue Bonds, Series 2010XX, 5.750%, 7/01/36 | 7/20 at 100.00 | A3 | | 6,773,550 | |
| | 5,000 | | Puerto Rico Infrastructure Financing Authority, Special Tax Revenue Bonds, Series 2005A, 0.000%, 7/01/42 – FGIC Insured | No Opt. Call | A3 | | 489,550 | |
| | 5,000 | | Puerto Rico Municipal Finance Agency, Series 2002A, 5.000%, 8/01/27 – AGM Insured | 8/12 at 100.00 | AA+ | | 4,885,400 | |
| | 1,500 | | Puerto Rico Public Buildings Authority, Guaranteed Government Facilities Revenue Refunding Bonds, Series 2002D, 5.125%, 7/01/20 | 7/12 at 100.00 | A3 | | 1,500,990 | |
| | 8,000 | | Puerto Rico Sales Tax Financing Corporation, Sales Tax Revenue Bonds, First Subordinate Series 2009A, 0.000%, 8/01/32 | 8/26 at 100.00 | A+ | | 6,530,320 | |
| | 13,125 | | Puerto Rico Sales Tax Financing Corporation, Sales Tax Revenue Bonds, First Subordinate Series 2010A, 0.000%, 8/01/33 | 8/29 at 100.00 | A+ | | 9,312,056 | |
| | 4,310 | | Puerto Rico Sales Tax Financing Corporation, Sales Tax Revenue Bonds, First Subordinate Series 2010C, 5.250%, 8/01/41 | 8/20 at 100.00 | A+ | | 3,894,128 | |
| | | | Puerto Rico Sales Tax Financing Corporation, Sales Tax Revenue Bonds, Series 2007A: | | | | | |
| | 50,000 | | 0.000%, 8/01/47 – AMBAC Insured | No Opt. Call | Aa2 | | 4,333,000 | |
| | 86,250 | | 0.000%, 8/01/54 – AMBAC Insured | No Opt. Call | Aa2 | | 4,491,038 | |
| | 15,000 | | 5.250%, 8/01/57 (UB) (5) | 8/17 at 100.00 | Aa2 | | 14,528,400 | |
| | 1,500 | | Puerto Rico, General Obligation and Public Improvement Bonds, Series 2002A, 5.500%, 7/01/29 | No Opt. Call | A3 | | 1,454,640 | |
| | 3,460 | | Puerto Rico, The Children’s Trust Fund, Tobacco Settlement Asset-Backed Refunding Bonds, Series 2002, 5.375%, 5/15/33 | 5/12 at 100.00 | BBB | | 3,040,233 | |
| | 202,645 | | Total Puerto Rico | | | | 63,589,580 | |
| | | | Rhode Island – 0.6% (0.4% of Total Investments) | | | | | |
| | | | Rhode Island Tobacco Settlement Financing Corporation, Tobacco Settlement Asset-Backed Bonds, Series 2002A: | | | | | |
| | 2,765 | | 6.125%, 6/01/32 | 6/12 at 100.00 | BBB | | 2,649,727 | |
| | 2,065 | | 6.250%, 6/01/42 | 6/12 at 100.00 | BBB | | 1,786,308 | |
| | 4,830 | | Total Rhode Island | | | | 4,436,035 | |
| | | | South Carolina – 8.7% (5.5% of Total Investments) | | | | | |
| | 24,725 | | Greenville County School District, South Carolina, Installment Purchase Revenue Bonds, Series 2002, 5.500%, 12/01/22 (Pre-refunded 12/01/12) | 12/12 at 101.00 | Aaa | | 26,941,596 | |
| | | | Horry County School District, South Carolina, General Obligation Bonds, Series 2001A: | | | | | |
| | 5,840 | | 5.000%, 3/01/20 (Pre-refunded 3/01/12) | 3/12 at 100.00 | Aa1 (4) | | 6,069,862 | |
| | 5,140 | | 5.000%, 3/01/21 (Pre-refunded 3/01/12) | 3/12 at 100.00 | Aa1 (4) | | 5,342,310 | |
| | | | Medical University Hospital Authority, South Carolina, FHA-Insured Mortgage Revenue Bonds, Series 2004A: | | | | | |
| | 5,240 | | 5.250%, 8/15/20 – NPFG Insured | 8/14 at 100.00 | Baa1 | | 5,429,007 | |
| | 3,000 | | 5.250%, 2/15/24 – NPFG Insured | 8/14 at 100.00 | Baa1 | | 3,081,360 | |
| | 7,600 | | Piedmont Municipal Power Agency, South Carolina, Electric Revenue Bonds, Series 2004A-2, 0.000%, 1/01/31 – AMBAC Insured | No Opt. Call | A– | | 2,282,052 | |
| | 13,615 | | South Carolina Transportation Infrastructure Bank, Junior Lien Revenue Bonds, Series 2001B, 5.125%, 10/01/21 (Pre-refunded 10/01/11) – AMBAC Insured | 10/11 at 100.00 | N/R (4) | | 13,886,347 | |
| | 65,160 | | Total South Carolina | | | | 63,032,534 | |
| | | Nuveen Quality Income Municipal Fund, Inc. (continued) |
| NQU | | Portfolio of Investments |
April 30, 2011 (Unaudited)
| | Principal | | | Optional Call | | | | |
| | Amount (000) | | Description (1) | Provisions (2) | Ratings (3) | | Value | |
| | | | South Dakota – 0.2% (0.1% of Total Investments) | | | | | |
| $ | 1,325 | | South Dakota Health and Educational Facilities Authority, Revenue Bonds, Sioux Valley Hospitals, Series 2004A, 5.250%, 11/01/34 | 11/14 at 100.00 | AA– | $ | 1,264,792 | |
| | | | Tennessee – 0.6% (0.4% of Total Investments) | | | | | |
| | 4,000 | | Knox County Health, Educational and Housing Facilities Board, Tennessee, Hospital Revenue Bonds, Baptist Health System of East Tennessee Inc., Series 2002, 6.375%, 4/15/22 | 4/12 at 101.00 | A1 | | 4,178,240 | |
| | | | Texas – 12.4% (7.9% of Total Investments) | | | | | |
| | 535 | | Alamo Community College District, Bexar County, Texas, Combined Fee Revenue Refunding Bonds, Series 2001, 5.375%, 11/01/16 – AGM Insured | 11/11 at 100.00 | AA+ | | 548,043 | |
| | 465 | | Alamo Community College District, Bexar County, Texas, Combined Fee Revenue Refunding Bonds, Series 2001, 5.375%, 11/01/16 (Pre-refunded 11/01/11) – AGM Insured | 11/11 at 100.00 | AA+ (4) | | 477,053 | |
| | 11,255 | | Brazos River Authority, Texas, Pollution Control Revenue Refunding Bonds, TXU Electric Company, Series 2001C, 5.750%, 5/01/36 (Mandatory put 11/01/11) (Alternative Minimum Tax) | No Opt. Call | CC | | 11,025,285 | |
| | 5,500 | | Central Texas Regional Mobility Authority, Travis and Williamson Counties, Toll Road Revenue Bonds, Series 2005, 5.000%, 1/01/45 – FGIC Insured | 1/15 at 100.00 | BBB | | 4,285,600 | |
| | 3,570 | | Dallas-Forth Worth International Airport, Texas, Joint Revenue Bonds, Series 2007, 5.000%, 11/01/22 – SYNCORA GTY Insured (Alternative Minimum Tax) | 11/14 at 100.00 | A+ | | 3,596,204 | |
| | 5,000 | | Dallas-Ft. Worth International Airport, Texas, Joint Revenue Refunding and Improvement Bonds, Series 2001A, 5.625%, 11/01/21 – NPFG Insured (Alternative Minimum Tax) | 11/11 at 100.00 | A+ | | 5,047,700 | |
| | 3,140 | | Harris County-Houston Sports Authority, Texas, Junior Lien Revenue Refunding Bonds, Series 2001B, 5.250%, 11/15/40 – NPFG Insured | 11/11 at 100.00 | Baa1 | | 2,276,123 | |
| | 15,680 | | Harris County-Houston Sports Authority, Texas, Revenue Bonds, Third Lien Series 2004-A3, 0.000%, 11/15/34 – NPFG Insured | 11/24 at 55.69 | Baa1 | | 1,995,594 | |
| | 2,700 | | Harris County-Houston Sports Authority, Texas, Senior Lien Revenue Bonds, Series 2001G, 5.250%, 11/15/30 – NPFG Insured | 11/11 at 100.00 | Baa1 | | 2,059,317 | |
| | | | Houston, Texas, Hotel Occupancy Tax and Special Revenue Bonds, Convention and Entertainment Project, Series 2001B: | | | | | |
| | 4,130 | | 0.000%, 9/01/26 – AMBAC Insured | No Opt. Call | AA+ | | 1,744,016 | |
| | 4,865 | | 0.000%, 9/01/27 – AMBAC Insured | No Opt. Call | AA+ | | 1,905,426 | |
| | 4,735 | | Houston, Texas, Subordinate Lien Airport System Revenue Bonds, Series 2000A, 5.625%, 7/01/30 – AGM Insured (Alternative Minimum Tax) | 7/11 at 100.00 | AA+ | | 4,735,095 | |
| | 6,000 | | Leander Independent School District, Williamson and Travis Counties, Texas, General Obligation Bonds, Series 2006, 0.000%, 8/15/34 | 8/14 at 33.33 | AAA | | 1,668,660 | |
| | 17,655 | | Matagorda County Navigation District 1, Texas, Revenue Refunding Bonds, Houston Industries Inc., Series 1998B, 5.150%, 11/01/29 – NPFG Insured | 11/11 at 100.00 | Baa1 | | 16,382,075 | |
| | 2,500 | | Sam Rayburn Municipal Power Agency, Texas, Power Supply System Revenue Refunding Bonds, Series 2002A, 5.750%, 10/01/21 – RAAI Insured | 10/12 at 100.00 | BBB | | 2,530,800 | |
| | 11,300 | | San Antonio, Texas, Electric and Gas System Revenue Refunding Bonds, New Series 1992, 5.000%, 2/01/17 (ETM) | 2/17 at 100.00 | AAA | | 12,537,011 | |
| | 4,375 | | Tarrant County Cultural & Educational Facilities Financing Corporation, Texas, Revenue Bonds, Texas Health Resources Tender Option Bond Trust 1197, 9.155%, 5/15/39 (IF) | 11/17 at 100.00 | AA– | | 3,378,463 | |
| | 2,890 | | Tarrant County Cultural Education Facilities Finance Corporation, Texas, Hospital Revenue Bonds, Scott & White HealthCare Project, Series 2010, 5.500%, 8/15/45 | 8/20 at 100.00 | A1 | | 2,753,043 | |
| | | | White Settlement Independent School District, Tarrant County, Texas, General Obligation Bonds, Series 2006: | | | | | |
| | 9,110 | | 0.000%, 8/15/38 | 8/15 at 30.30 | AAA | | 1,950,724 | |
| | 9,110 | | 0.000%, 8/15/39 | 8/15 at 28.63 | AAA | | 1,842,042 | |
| | 6,610 | | 0.000%, 8/15/42 | 8/15 at 24.42 | AAA | | 1,115,570 | |
| | 7,110 | | 0.000%, 8/15/43 | 8/15 at 23.11 | AAA | | 1,126,153 | |
| | 5,000 | | Wichita Falls, Wichita County, Texas, Priority Lien Water and Sewerage System Revenue Bonds, Series 2001, 5.000%, 8/01/22 (Pre-refunded 8/01/11) – AMBAC Insured | 8/11 at 100.00 | AA– (4) | | 5,060,800 | |
| | 143,235 | | Total Texas | | | | 90,040,797 | |
| | Principal | | | Optional Call | | | | |
| | Amount (000) | | Description (1) | Provisions (2) | Ratings (3) | | Value | |
| | | | Utah – 1.0% (0.7% of Total Investments) | | | | | |
| $ | 7,155 | | Utah Associated Municipal Power Systems, Revenue Bonds, Payson Power Project, Series 2003A, 5.000%, 4/01/25 – AGM Insured (UB) | 4/13 at 100.00 | AA+ | $ | 7,473,183 | |
| | | | Virginia – 4.1% (2.6% of Total Investments) | | | | | |
| | 11,000 | | Metropolitan Washington DC Airports Authority, Virginia, Dulles Toll Road Revenue Bonds, Series 2009C, 0.000%, 10/01/41 – AGC Insured | 10/26 at 100.00 | AA+ | | 7,994,580 | |
| | 10,000 | | Metropolitan Washington DC Airports Authority, Virginia, Dulles Toll Road Revenue Bonds, Dulles Metrorail Capital Appreciation, Series 2010B, 0.000%, 10/01/44 | 10/28 at 100.00 | BBB+ | | 5,901,800 | |
| | 4,000 | | Norfolk Airport Authority, Virginia, Airport Revenue Refunding Bonds, Series 2001B, 5.125%, 7/01/31 (Pre-refunded 7/01/11) – FGIC Insured (Alternative Minimum Tax) | 7/11 at 100.00 | A3 (4) | | 3,643,440 | |
| | 11,040 | | Suffolk Redevelopment and Housing Authority, Virginia, FNMA Multifamily Housing Revenue Refunding Bonds, Windsor at Potomac Vista L.P. Project, Series 2001, 4.850%, 7/01/31 (Mandatory put 7/01/11) | 7/31 at 100.00 | Aaa | | 11,113,085 | |
| | | | Virginia Resources Authority, Water System Revenue Refunding Bonds, Series 2002: | | | | | |
| | 500 | | 5.000%, 4/01/18 | 4/12 at 102.00 | AA | | 526,820 | |
| | 500 | | 5.000%, 4/01/19 | 4/12 at 102.00 | AA | | 526,820 | |
| | 37,040 | | Total Virginia | | | | 29,706,545 | |
| | | | Washington – 8.1% (5.1% of Total Investments) | | | | | |
| | 3,305 | | Energy Northwest, Washington, Electric Revenue Refunding Bonds, Columbia Generating Station – Nuclear Project 2, Series 2002B, 5.350%, 7/01/18 (Pre-refunded 7/01/12) – AGM Insured | 7/12 at 100.00 | AA+ (4) | | 3,496,723 | |
| | 3,445 | | Energy Northwest, Washington, Electric Revenue Refunding Bonds, Columbia Generating Station – Nuclear Project 2, Series 2002B, 5.350%, 7/01/18 – AGM Insured | 7/12 at 100.00 | AA+ | | 3,615,390 | |
| | 2,500 | | Energy Northwest, Washington, Electric Revenue Refunding Bonds, Columbia Generating Station, Series 2002A, 5.750%, 7/01/17 – NPFG Insured | 7/12 at 100.00 | Aaa | | 2,637,550 | |
| | 3,750 | | FYI Properties, Washington, Lease Revenue Bonds, Washington State Department of Information Services Project, Series 2009, 5.500%, 6/01/39 | 6/19 at 100.00 | AA | | 3,788,813 | |
| | 5,000 | | Washington State Health Care Facilities Authority, Revenue Bonds, Providence Health Care Services, Series 2006A, 4.625%, 10/01/34 – FGIC Insured (UB) | 10/16 at 100.00 | AA | | 4,260,850 | |
| | 7,050 | | Washington State Tobacco Settlement Authority, Tobacco Settlement Asset-Backed Revenue Bonds, Series 2002, 6.500%, 6/01/26 | 6/13 at 100.00 | BBB | | 7,107,740 | |
| | | | Washington State, Motor Vehicle Fuel Tax General Obligation Bonds, Series 2002C: | | | | | |
| | 7,000 | | 5.000%, 1/01/21 (Pre-refunded 1/01/12) – AGM Insured | 1/12 at 100.00 | AA+ (4) | | 7,221,480 | |
| | 7,960 | | 5.000%, 1/01/22 (Pre-refunded 1/01/12) – AGM Insured | 1/12 at 100.00 | AA+ (4) | | 8,211,854 | |
| | 18,145 | | Washington, General Obligation Bonds, Series 2001-02A, 5.000%, 7/01/23 (Pre-refunded 7/01/11) – AGM Insured | 7/11 at 100.00 | AA+ (4) | | 18,293,063 | |
| | 58,155 | | Total Washington | | | | 58,633,463 | |
| | | | Wisconsin – 1.5% (0.9% of Total Investments) | | | | | |
| | | | Badger Tobacco Asset Securitization Corporation, Wisconsin, Tobacco Settlement Asset-Backed Bonds, Series 2002: | | | | | |
| | 105 | | 6.125%, 6/01/27 (Pre-refunded 6/01/12) | 6/12 at 100.00 | AAA | | 109,009 | |
| | 3,380 | | 6.375%, 6/01/32 (Pre-refunded 6/01/12) | 6/12 at 100.00 | AAA | | 3,597,300 | |
| | 2,175 | | Wisconsin Health and Educational Facilities Authority, Revenue Bonds, Aurora Health Care Inc., Series 1999A, 5.600%, 2/15/29 | 7/11 at 100.00 | A3 | | 2,136,372 | |
| | 3,000 | | Wisconsin Health and Educational Facilities Authority, Revenue Bonds, Fort Healthcare Inc., Series 2004, 5.750%, 5/01/29 | 5/14 at 100.00 | BBB+ | | 2,823,810 | |
| | 2,100 | | Wisconsin Health and Educational Facilities Authority, Revenue Bonds, Wheaton Franciscan Services Inc., Series 2003A, 5.125%, 8/15/33 | 8/13 at 100.00 | BBB+ | | 1,781,934 | |
| | 10,760 | | Total Wisconsin | | | | 10,448,425 | |
| | | Nuveen Quality Income Municipal Fund, Inc. (continued) |
| NQU | | Portfolio of Investments |
April 30, 2011 (Unaudited)
| | Principal | | | Optional Call | | | | |
| | Amount (000) | | Description (1) | Provisions (2) | Ratings (3) | | Value | |
| | | | Wyoming – 0.8% (0.5% of Total Investments) | | | | | |
| $ | 2,035 | | Campbell County, Wyoming Solid Waste Facilities Revenue Bonds, Basin Electric Power Cooperative – Dry Fork Station Facilities, Series 2009A, 5.750%, 7/15/39 | 7/19 at 100.00 | A1 | $ | 2,085,610 | |
| | 4,000 | | Wyoming Municipal Power Agency Power Supply System Revenue Bonds, 2008 Series A, 5.375%, 1/01/42 | 1/18 at 100.00 | A2 | | 4,011,920 | |
| | 6,035 | | Total Wyoming | | | | 6,097,530 | |
| $ | 1,622,684 | | Total Investments (cost $1,182,425,502) – 158.0% | | | | 1,145,387,526 | |
| | | | Floating Rate Obligations – (8.5)% | | | | (61,410,000 | ) |
| | | | Variable Rate Demand Preferred Shares, at Liquidation Value (53.6)% (6) | | | | (388,400,000 | ) |
| | | | Other Assets Less Liabilities – 4.1% | | | | 29,511,186 | |
| | | | Net Assets Applicable to Common Shares – 100% | | | $ | 725,088,712 | |
| (1) | | All percentages shown in the Portfolio of Investments are based on net assets applicable to Common shares unless otherwise noted. |
| (2) | | Optional Call Provisions: Dates (month and year) and prices of the earliest optional call or redemption. There may be other call provisions at varying prices at later dates. Certain mortgage-backed securities may be subject to periodic principal paydowns. |
| (3) | | Ratings: Using the highest of Standard & Poor’s Group (“Standard & Poor’s”), Moody’s Investor Service, Inc. (“Moody’s”) or Fitch, Inc. (“Fitch”) rating. Ratings below BBB by Standard & Poor’s, Baa by Moody’s or BBB by Fitch are considered to be below investment grade. Holdings designated N/R are not rated by any of these national rating agencies. |
| (4) | | Backed by an escrow or trust containing sufficient U.S. Government or U.S. Government agency securities, which ensure the timely payment of principal and interest. Such investments are normally considered to be equivalent to AAA rated securities. |
| (5) | | Investment, or portion of investment, has been pledged to collateralize the net payment obligations for investments in derivatives and/or inverse floating rate transactions. |
| (6) | | Variable Rate Preferred Shares, at Liquidation Value as a percentage of Total Investments are 33.9%. |
| N/R | | Not rated. |
| (ETM) | | Escrowed to maturity. |
| (IF) | | Inverse floating rate investment. |
| (UB) | | Underlying bond of an inverse floating rate trust reflected as a financing transaction. See Notes to Financial Statements, Footnote 1 – General Information and Significant Accounting Policies, Inverse Floating Rate Securities for more information. |
See accompanying notes to financial statements.
| | | Nuveen Premier Municipal Income Fund, Inc. |
NPF | | Portfolio of Investments |
| | | April 30, 2011 (Unaudited) |
| | Principal | | | Optional Call | | | | |
| | Amount (000) | | Description (1) | Provisions (2) | Ratings (3) | | Value | |
| | | | Alabama – 1.7% (1.0% of Total Investments) | | | | | |
| $ | 2,010 | | Alabama Special Care Facilities Financing Authority, Revenue Bonds, Ascension Health, Series 2006C-2, 5.000%, 11/15/39 | 11/16 at 100.00 | AA+ | $ | 1,879,752 | |
| | | | Birmingham Special Care Facilities Financing Authority, Alabama, Revenue Bonds, Baptist Health System Inc., Series 2005A: | | | | | |
| | 1,200 | | 5.250%, 11/15/20 | 11/15 at 100.00 | Baa2 | | 1,184,040 | |
| | 400 | | 5.000%, 11/15/30 | 11/15 at 100.00 | Baa2 | | 340,408 | |
| | 1,000 | | Montgomery BMC Special Care Facilities Financing Authority, Alabama, Revenue Bonds, Baptist Medical Center, Series 2004C, 5.250%, 11/15/29 (Pre-refunded 11/15/14) | 11/14 at 100.00 | A3 (4) | | 1,147,820 | |
| | 4,610 | | Total Alabama | | | | 4,552,020 | |
| | | | Alaska – 0.2% (0.1% of Total Investments) | | | | | |
| | 1,000 | | Northern Tobacco Securitization Corporation, Alaska, Tobacco Settlement Asset-Backed Bonds, Series 2006A, 5.000%, 6/01/46 | 6/14 at 100.00 | Baa3 | | 595,360 | |
| | | | Arizona – 7.8% (4.8% of Total Investments) | | | | | |
| | | | Glendale Industrial Development Authority, Arizona, Revenue Bonds, John C. Lincoln Health Network, Series 2005B: | | | | | |
| | 100 | | 5.250%, 12/01/24 | 12/15 at 100.00 | BBB | | 93,923 | |
| | 135 | | 5.250%, 12/01/25 | 12/15 at 100.00 | BBB | | 124,403 | |
| | 7,000 | | Phoenix, Arizona, Civic Improvement Revenue Bonds, Civic Plaza, Series 2005B, 0.000%, 7/01/39 – FGIC Insured | No Opt. Call | AA | | 5,923,470 | |
| | 7,500 | | Salt River Project Agricultural Improvement and Power District, Arizona, Electric System Revenue Bonds, Series 2002B, 5.000%, 1/01/25 (UB) | 1/13 at 100.00 | Aa1 | | 7,812,975 | |
| | 2,045 | | Salt River Project Agricultural Improvement and Power District, Arizona, Electric System Revenue Refunding Bonds, Series 2002A, 5.250%, 1/01/15 (Pre-refunded 1/01/12) | 1/12 at 101.00 | N/R (4) | | 2,133,835 | |
| | 3,955 | | Salt River Project Agricultural Improvement and Power District, Arizona, Electric System Revenue Refunding Bonds, Series 2002A, 5.250%, 1/01/15 | 1/12 at 101.00 | Aa1 | | 4,108,770 | |
| | 1,200 | | Salt Verde Financial Corporation, Arizona, Senior Gas Revenue Bonds, Citigroup Energy Inc Prepay Contract Obligations, Series 2007, 5.000%, 12/01/37 | No Opt. Call | A | | 998,556 | |
| | 21,935 | | Total Arizona | | | | 21,195,932 | |
| | | | Arkansas – 0.8% (0.5% of Total Investments) | | | | | |
| | 2,155 | | Arkansas Development Finance Authority, State Facility Revenue Bonds, Department of Correction Special Needs Unit Project, Series 2005B, 5.000%, 11/01/25 – AGM Insured | 11/15 at 100.00 | AA+ | | 2,246,480 | |
| | | | California – 20.3% (12.4% of Total Investments) | | | | | |
| | 10,000 | | Anaheim Public Finance Authority, California, Public Improvement Project Lease Bonds, Series 2007A-1, 4.375%, 3/01/37 – FGIC Insured | 9/17 at 100.00 | A1 | | 8,056,500 | |
| | 1,350 | | California Educational Facilities Authority, Revenue Bonds, University of Southern California, Series 2005, 4.750%, 10/01/28 (UB) | 10/15 at 100.00 | AA+ | | 1,369,575 | |
| | 1,975 | | California Health Facilities Financing Authority, Revenue Bonds, Catholic Healthcare West, Series 2004I, 4.950%, 7/01/26 (Mandatory put 7/01/14) | No Opt. Call | A | | 2,125,693 | |
| | 1,700 | | California Health Facilities Financing Authority, Revenue Bonds, Providence Health & Services, Series 2009B, 5.500%, 10/01/39 | 10/19 at 100.00 | AA | | 1,695,070 | |
| | 4,900 | | California State, General Obligation Bonds, Series 2004, 5.000%, 6/01/23 – AMBAC Insured | 12/14 at 100.00 | A1 | | 5,021,275 | |
| | 500 | | California Statewide Community Development Authority, Revenue Bonds, Daughters of Charity Health System, Series 2005A, 5.000%, 7/01/39 | 7/15 at 100.00 | BBB | | 361,235 | |
| | 1,600 | | California Statewide Community Development Authority, Revenue Bonds, Kaiser Permanente System, Series 2001C, 5.250%, 8/01/31 | 8/16 at 100.00 | A+ | | 1,465,488 | |
| | 1,025 | | California Statewide Community Development Authority, Revenue Bonds, Sutter Health, Tender Option Bond Trust 3175, 13.619%, 5/15/14 (IF) | 5/18 at 100.00 | AA– | | 944,507 | |
| | 1,000 | | Chula Vista, California, Industrial Development Revenue Bonds, San Diego Gas and Electric Company, Series 1996A, 5.300%, 7/01/21 | 6/14 at 102.00 | A | | 1,037,840 | |
| | | Nuveen Premier Municipal Income Fund, Inc. (continued) |
| NPF | | Portfolio of Investments |
April 30, 2011 (Unaudited)
| | Principal | | | Optional Call | | | | |
| | Amount (000) | | Description (1) | Provisions (2) | Ratings (3) | | Value | |
| | | | California (continued) | | | | | |
| $ | 5,045 | | Culver City Redevelopment Agency, California, Tax Allocation Revenue Bonds, Redevelopment Project, Capital Appreciation Series 2011A, 0.000%, 11/01/27 | 11/21 at 61.42 | A | $ | 1,337,480 | |
| | 25,000 | | Foothill/Eastern Transportation Corridor Agency, California, Toll Road Revenue Bonds, Series 1995A, 0.000%, 1/01/17 (ETM) (7) | No Opt. Call | AAA | | 22,069,750 | |
| | 450 | | Golden State Tobacco Securitization Corporation, California, Tobacco Settlement Asset-Backed Bonds, Series 2003A-1, 6.750%, 6/01/39 (Pre-refunded 6/01/13) | 6/13 at 100.00 | AAA | | 505,431 | |
| | 3,500 | | Golden State Tobacco Securitization Corporation, California, Tobacco Settlement Asset-Backed Bonds, Series 2007A-1, 5.125%, 6/01/47 | 6/17 at 100.00 | Baa3 | | 2,135,525 | |
| | 6,005 | | Los Angeles Unified School District, California, General Obligation Bonds, Series 2005E, 5.000%, 7/01/22 – AMBAC Insured | 7/15 at 100.00 | Aa2 | | 6,300,146 | |
| | 4,615 | | Riverside County Redevelopment Agency Jurupa Valley Project Area 2011, California, Tax Allocation Bonds Series B, 0.000%, 10/01/38 | No Opt. Call | A– | | 410,643 | |
| | | | San Diego County, California, Certificates of Participation, Burnham Institute, Series 2006: | | | | | |
| | 100 | | 5.000%, 9/01/21 | 9/15 at 102.00 | Baa3 | | 88,826 | |
| | 110 | | 5.000%, 9/01/23 | 9/15 at 102.00 | Baa3 | | 95,040 | |
| | 68,875 | | Total California | | | | 55,020,024 | |
| | | | Colorado – 11.7% (7.1% of Total Investments) | | | | | |
| | 1,000 | | Colorado Health Facilities Authority, Revenue Bonds, Evangelical Lutheran Good Samaritan Society, Series 2005, 5.000%, 6/01/29 | 6/16 at 100.00 | A– | | 901,720 | |
| | 1,150 | | Colorado Health Facilities Authority, Revenue Bonds, Parkview Medical Center, Series 2004, 5.000%, 9/01/25 | 9/14 at 100.00 | A3 | | 1,116,351 | |
| | 400 | | Colorado Health Facilities Authority, Revenue Bonds, Poudre Valley Health Care, Series 2005F, 5.000%, 3/01/25 | 3/15 at 100.00 | A | | 385,536 | |
| | 750 | | Colorado Health Facilities Authority, Revenue Bonds, Vail Valley Medical Center, Series 2004, 5.000%, 1/15/17 | 1/15 at 100.00 | A– | | 776,055 | |
| | | | Denver City and County, Colorado, Airport Revenue Bonds, Series 2006A: | | | | | |
| | 4,170 | | 5.000%, 11/15/23 – FGIC Insured | 11/16 at 100.00 | A+ | | 4,348,268 | |
| | 6,890 | | 5.000%, 11/15/23 – FGIC Insured (UB) | 11/16 at 100.00 | A+ | | 7,184,547 | |
| | 6,800 | | 5.000%, 11/15/24 – FGIC Insured | 11/16 at 100.00 | A+ | | 7,042,284 | |
| | 8,940 | | 5.000%, 11/15/25 – FGIC Insured (UB) | 11/16 at 100.00 | A+ | | 9,196,757 | |
| | 660 | | Park Creek Metropolitan District, Colorado, Senior Limited Property Tax Supported Revenue Refunding Bonds, Series 2011, 6.125%, 12/01/41 (WI/DD, Settling 5/12/11) – AGM Insured | 12/20 at 100.00 | AA+ | | 654,634 | |
| | 30,760 | | Total Colorado | | | | 31,606,152 | |
| | | | Connecticut – 0.7% (0.5% of Total Investments) | | | | | |
| | 2,020 | | Connecticut Development Authority, Pollution Control Revenue Refunding Bonds, Connecticut Light and Power Company, Series 1993A, 5.850%, 9/01/28 | 10/11 at 100.50 | BBB+ | | 2,022,040 | |
| | | | Florida – 2.6% (1.6% of Total Investments) | | | | | |
| | 1,700 | | Hillsborough County Industrial Development Authority, Florida, Exempt Facilities Remarketed Revenue Bonds, National Gypsum Company, Apollo Beach Project, Series 2000B, 7.125%, 4/01/30 (Alternative Minimum Tax) | 4/12 at 100.00 | N/R | | 1,495,609 | |
| | 2,500 | | Hillsborough County Industrial Development Authority, Florida, Pollution Control Revenue Bonds, Tampa Electric Company Project, Series 2002, 5.100%, 10/01/13 | 10/12 at 100.00 | BBB+ | | 2,604,150 | |
| | 105 | | Marion County Hospital District, Florida, Revenue Bonds, Munroe Regional Medical Center, Series 2007, 5.000%, 10/01/34 | 10/17 at 100.00 | A3 | | 92,596 | |
| | 1,000 | | South Miami Health Facilities Authority, Florida, Hospital Revenue, Baptist Health System Obligation Group, Series 2007, 5.000%, 8/15/42 | 8/17 at 100.00 | AA | | 891,610 | |
| | 2,150 | | Sumter County, Florida, Capital Improvement Revenue Bonds, Series 2006, 5.000%, 6/01/30 – AMBAC Insured | 6/16 at 100.00 | A | | 2,085,586 | |
| | 7,455 | | Total Florida | | | | 7,169,551 | |
| | Principal | | | Optional Call | | | | |
| | Amount (000) | | Description (1) | Provisions (2) | Ratings (3) | | Value | |
| | | | Georgia – 4.6% (2.8% of Total Investments) | | | | | |
| $ | 8,050 | | George L. Smith II World Congress Center Authority, Atlanta, Georgia, Revenue Refunding Bonds, Domed Stadium Project, Series 2000, 5.500%, 7/01/20 – NPFG Insured (Alternative Minimum Tax) | 7/11 at 100.00 | Baa1 | $ | 8,068,676 | |
| | 4,105 | | Municipal Electric Authority of Georgia, Combustion Turbine Revenue Bonds, Series 2003A, 5.125%, 11/01/17 – NPFG Insured | 11/13 at 100.00 | A1 | | 4,419,689 | |
| | 12,155 | | Total Georgia | | | | 12,488,365 | |
| | | | Hawaii – 0.8% (0.5% of Total Investments) | | | | | |
| | 2,250 | | Hawaii Department of Budget and Finance, Special Purpose Revenue Bonds, Hawaiian Electric Company Inc., Series 1999D, 6.150%, 1/01/20 – AMBAC Insured (Alternative Minimum Tax) | 7/11 at 100.00 | Baa1 | | 2,252,385 | |
| | | | Idaho – 0.2% (0.1% of Total Investments) | | | | | |
| | 40 | | Idaho Housing and Finance Association, Single Family Mortgage Bonds, Series 1996E, 6.350%, 7/01/14 (Alternative Minimum Tax) | 7/11 at 100.00 | Aa1 | | 40,086 | |
| | | | Madison County, Idaho, Hospital Revenue Certificates of Participation, Madison Memorial Hospital, Series 2006: | | | | | |
| | 500 | | 5.250%, 9/01/26 | 9/16 at 100.00 | BBB– | | 446,225 | |
| | 200 | | 5.250%, 9/01/37 | 9/16 at 100.00 | BBB– | | 162,642 | |
| | 740 | | Total Idaho | | | | 648,953 | |
| | | | Illinois – 11.6% (7.1% of Total Investments) | | | | | |
| | 415 | | Chicago Public Building Commission, Illinois, General Obligation Lease Certificates, Chicago Board of Education, Series 1990B, 7.000%, 1/01/15 – NPFG Insured (ETM) | No Opt. Call | BBB (4) | | 463,074 | |
| | 8,670 | | Chicago, Illinois, General Obligation Bonds, City Colleges, Series 1999, 0.000%, 1/01/24 – FGIC Insured | No Opt. Call | Aa3 | | 4,058,774 | |
| | 2,000 | | Chicago, Illinois, Revenue Bonds, Midway Airport, Series 1996A, 5.500%, | 7/11 at 100.00 | A | | 2,000,300 | |
| | | | 1/01/29 – NPFG Insured | | | | | |
| | 785 | | Chicago, Illinois, Revenue Bonds, Midway Airport, Series 1998B, 5.000%, | 7/11 at 100.00 | A | | 709,302 | |
| | | | 1/01/35 – NPFG Insured | | | | | |
| | 8,500 | | Chicago, Illinois, Senior Lien Water Revenue Bonds, Series 2001, 5.750%, 11/01/30 – AMBAC Insured | No Opt. Call | Aa3 | | 9,314,130 | |
| | 200 | | Illinois Finance Authority, Revenue Bonds, Proctor Hospital, Series 2006, 5.125%, 1/01/25 | 1/16 at 100.00 | BB+ | | 164,102 | |
| | 1,000 | | Illinois Health Facilities Authority, Revenue Bonds, Condell Medical Center, Series 2002, 5.500%, 5/15/32 (Pre-refunded 5/15/12) | 5/12 at 100.00 | Aaa | | 1,051,600 | |
| | 1,500 | | Illinois, General Obligation Bonds, Illinois FIRST Program, Series 2002, 5.500%, 2/01/17 (Pre-refunded 2/01/12) – FGIC Insured | 2/12 at 100.00 | A+ (4) | | 1,559,025 | |
| | | | Lombard Public Facilities Corporation, Illinois, Second Tier Conference Center and Hotel Revenue Bonds, Series 2005B: | | | | | |
| | 850 | | 5.250%, 1/01/25 | 1/16 at 100.00 | B– | | 582,505 | |
| | 1,750 | | 5.250%, 1/01/30 | 1/16 at 100.00 | B– | | 1,199,380 | |
| | | | Metropolitan Pier and Exposition Authority, Illinois, Revenue Refunding Bonds, McCormick Place Expansion Project, Series 1996A: | | | | | |
| | 10,575 | | 0.000%, 12/15/23 – NPFG Insured | No Opt. Call | A2 | | 5,259,688 | |
| | 10,775 | | 0.000%, 12/15/24 – NPFG Insured | No Opt. Call | A2 | | 5,010,052 | |
| | 47,020 | | Total Illinois | | | | 31,371,932 | |
| | | | Indiana – 3.3% (2.0% of Total Investments) | | | | | |
| | 2,275 | | Anderson School Building Corporation, Madison County, Indiana, First Mortgage Bonds, Series 2003, 5.500%, 7/15/23 (Pre-refunded 1/15/14) – AGM Insured | 1/14 at 100.00 | AA+ (4) | | 2,552,664 | |
| | 6,180 | | Crown Point Multi-School Building Corporation, Indiana, First Mortgage Bonds, Crown Point Community School Corporation, Series 2000, 0.000%, 1/15/23 – NPFG Insured | No Opt. Call | A | | 3,336,953 | |
| | 1,250 | | Portage, Indiana, Revenue Bonds, Series 2006, 5.000%, 7/15/23 | 7/16 at 100.00 | A | | 1,201,288 | |
| | 1,700 | | Saint Joseph County, Indiana, Educational Facilities Revenue Bonds, University of Notre Dame du Lac Project, Refunding Series 2009, 5.000%, 3/01/36 | 3/18 at 100.00 | Aaa | | 1,724,956 | |
| | 1,000 | | St. Joseph County Hospital Authority, Indiana, Revenue Bonds, Madison Center Inc., Series 2005, 5.250%, 2/15/28 (5) | 2/15 at 100.00 | N/R | | 259,800 | |
| | 12,405 | | Total Indiana | | | | 9,075,661 | |
| | | Nuveen Premier Municipal Income Fund, Inc. (continued) |
| NPF | | Portfolio of Investments |
April 30, 2011 (Unaudited)
| | Principal | | | Optional Call | | | | |
| | Amount (000) | | Description (1) | Provisions (2) | Ratings (3) | | Value | |
| | | | Iowa – 1.0% (0.6% of Total Investments) | | | | | |
| $ | 4,000 | | Iowa Tobacco Settlement Authority, Asset Backed Settlement Revenue Bonds, Series 2005C, 5.500%, 6/01/42 | 6/15 at 100.00 | BBB | $ | 2,738,519 | |
| | | | Kentucky – 0.8% (0.5% of Total Investments) | | | | | |
| | 1,700 | | Kentucky Economic Development Finance Authority, Hospital Facilities Revenue Bonds, Owensboro Medical Health System, Series 2010A, 6.500%, 3/01/45 | No Opt. Call | Baa2 | | 1,636,947 | |
| | 510 | | Louisville and Jefferson County Metropolitan Government, Kentucky, Industrial Building Revenue Bonds, Sisters of Mercy of the Americas, Series 2006, 5.000%, 10/01/35 | 10/16 at 100.00 | N/R | | 469,516 | |
| | 2,210 | | Total Kentucky | | | | 2,106,463 | |
| | | | Louisiana – 6.5% (4.0% of Total Investments) | | | | | |
| | 1,310 | | Louisiana Housing Finance Agency, GNMA Collateralized Mortgage Revenue Bonds, St. Dominic Assisted Care Facility, Series 1995, 6.850%, 9/01/25 | 9/11 at 100.00 | AA+ | | 1,311,795 | |
| | 1,500 | | Louisiana Public Facilities Authority, Revenue Bonds, Ochsner Clinic Foundation Project, Series 2007A, 5.500%, 5/15/47 | 5/17 at 100.00 | Baa1 | | 1,248,765 | |
| | | | Louisiana State, Gasoline and Fuels Tax Revenue Bonds, Series 2006A: | | | | | |
| | 825 | | 4.750%, 5/01/39 – AGM Insured (UB) | 5/16 at 100.00 | AA+ | | 797,107 | |
| | 8,880 | | 4.500%, 5/01/41 – FGIC Insured (UB) | 5/16 at 100.00 | Aa1 | | 8,122,980 | |
| | 5 | | Louisiana State, Gasoline and Fuels Tax Revenue Bonds, Series 2006A, Trust 660, 16.646%, 5/01/34 – FGIC Insured (IF) | 5/16 at 100.00 | Aa1 | | 3,299 | |
| | 3,950 | | Morehouse Parish, Louisiana, Pollution Control Revenue Bonds, International Paper Company, Series 2002A, 5.700%, 4/01/14 | No Opt. Call | BBB | | 4,239,851 | |
| | 2,090 | | Tobacco Settlement Financing Corporation, Louisiana, Tobacco Settlement Asset-Backed Bonds, Series 2001B, 5.875%, 5/15/39 | 5/11 at 101.00 | A– | | 1,907,397 | |
| | 18,560 | | Total Louisiana | | | | 17,631,194 | |
| | | | Maine – 0.5% (0.3% of Total Investments) | | | | | |
| | 1,235 | | Maine State Housing Authority, Single Family Mortgage Purchase Bonds, Series 2004A-2, 5.000%, 11/15/21 (Alternative Minimum Tax) | 5/13 at 100.00 | AA+ | | 1,263,936 | |
| | | | Maryland – 1.2% (0.8% of Total Investments) | | | | | |
| | 2,000 | | Maryland Health and Higher Educational Facilities Authority, Revenue Bonds, MedStar Health, Series 2004, 5.375%, 8/15/24 | 8/14 at 100.00 | A2 | | 2,017,460 | |
| | 1,500 | | Maryland Health and Higher Educational Facilities Authority, Revenue Bonds, Western Maryland Health, Series 2006A, 4.750%, 7/01/36 – NPFG Insured | 7/16 at 100.00 | Baa1 | | 1,344,720 | |
| | 3,500 | | Total Maryland | | | | 3,362,180 | |
| | | | Massachusetts – 4.2% (2.6% of Total Investments) | | | | | |
| | 7,500 | | Massachusetts Department of Transportation, Metropolitan Highway System Revenue Bonds, Senior Lien Series 2010B, 5.000%, 1/01/37 | 1/20 at 100.00 | A | | 7,165,500 | |
| | 1,000 | | Massachusetts Development Finance Authority, Revenue Bonds, Hampshire College, Series 2004, 5.625%, 10/01/24 | 10/14 at 100.00 | BBB | | 981,960 | |
| | 3,000 | | Massachusetts State, Special Obligation Dedicated Tax Revenue Bonds, Series 2004, 5.250%, 1/01/24 (Pre-refunded 1/01/14) – FGIC Insured | 1/14 at 100.00 | A1 (4) | | 3,339,120 | |
| | 11,500 | | Total Massachusetts | | | | 11,486,580 | |
| | | | Michigan – 4.0% (2.4% of Total Investments) | | | | | |
| | 2,925 | | Detroit, Michigan, General Obligation Bonds, Series 2003A, 5.250%, 4/01/17 – SYNCORA GTY Insured | 4/13 at 100.00 | BB | | 2,610,826 | |
| | 4,600 | | Detroit, Michigan, Sewer Disposal System Revenue Bonds, Second Lien, Series 2006B, 4.625%, 7/01/34 – FGIC Insured | 7/16 at 100.00 | A | | 3,912,898 | |
| | 1,000 | | Michigan State Hospital Finance Authority, Revenue Bonds, Trinity Health Care Group, Series 2006A, 5.000%, 12/01/31 | 12/16 at 100.00 | AA | | 937,620 | |
| | 170 | | Monroe County Hospital Finance Authority, Michigan, Mercy Memorial Hospital Corporation Revenue Bonds, Series 2006, 5.500%, 6/01/35 | 6/16 at 100.00 | BBB– | | 141,534 | |
| | 3,025 | | Wayne County, Michigan, Airport Revenue Refunding Bonds, Detroit Metropolitan Airport, Series 2002C, 5.375%, 12/01/19 – FGIC Insured | 12/12 at 100.00 | A2 | | 3,178,670 | |
| | 11,720 | | Total Michigan | | | | 10,781,548 | |
| | Principal | | | Optional Call | | | | |
| | Amount (000) | | Description (1) | Provisions (2) | Ratings (3) | | Value | |
| | | | Minnesota – 5.1% (3.1% of Total Investments) | | | | | |
| $ | 4,350 | | Cohasset, Minnesota, Pollution Control Revenue Bonds, Allete Inc., Series 2004, 4.950%, 7/01/22 | 7/14 at 100.00 | A2 | $ | 4,397,241 | |
| | 1,000 | | Duluth Economic Development Authority, Minnesota, Healthcare Facilities Revenue Bonds, Benedictine Health System – St. Mary’s Duluth Clinic, Series 2004, 5.250%, 2/15/21 (Pre-refunded 2/15/14) | 2/14 at 100.00 | N/R (4) | | 1,118,670 | |
| | 2,290 | | Minneapolis-St. Paul Housing and Redevelopment Authority, Minnesota, Revenue Bonds, HealthPartners Inc., Series 2003, 6.000%, 12/01/20 | 12/13 at 100.00 | A3 | | 2,367,517 | |
| | 530 | | Minnesota Higher Education Facilities Authority, Revenue Bonds, University of St. Thomas, Series 2004-5Y, 5.250%, 10/01/19 | 10/14 at 100.00 | A2 | | 561,180 | |
| | 1,000 | | Minnesota Municipal Power Agency, Electric Revenue Bonds, Series 2004A, 5.250%, 10/01/19 | 10/14 at 100.00 | A3 | | 1,063,020 | |
| | 1,000 | | Minnesota State, General Obligation Bonds, Various Purpose, Refunding Series 2010D, 5.000%, 8/01/18 | No Opt. Call | AAA | | 1,188,190 | |
| | 3,000 | | St. Paul Port Authority, Minnesota, Lease Revenue Bonds, Office Building at Cedar Street, Series 2003, 5.250%, 12/01/20 | 12/13 at 100.00 | AA+ | | 3,208,950 | |
| | 13,170 | | Total Minnesota | | | | 13,904,768 | |
| | | | Mississippi – 0.9% (0.5% of Total Investments) | | | | | |
| | 2,325 | | Mississippi Hospital Equipment and Facilities Authority, Revenue Bonds, Baptist Memorial Healthcare, Series 2004B-1, 5.000%, 9/01/24 | 9/14 at 100.00 | AA | | 2,359,084 | |
| | | | Missouri – 1.1% (0.7% of Total Investments) | | | | | |
| | 100 | | Hannibal Industrial Development Authority, Missouri, Health Facilities Revenue Bonds, Hannibal Regional Hospital, Series 2006, 5.000%, 3/01/22 | 3/16 at 100.00 | BBB+ | | 97,624 | |
| | 2,880 | | Joplin Industrial Development Authority, Missouri, Health Facilities Revenue Bonds, Freeman Health System, Series 2004, 5.500%, 2/15/24 | 2/15 at 102.00 | BBB+ | | 2,826,374 | |
| | 2,980 | | Total Missouri | | | | 2,923,998 | |
| | | | Nebraska – 1.2% (0.7% of Total Investments) | | | | | |
| | 1,580 | | Douglas County Hospital Authority 2, Nebraska, Health Facilities Revenue Bonds, Nebraska Medical Center, Series 2003, 5.000%, 11/15/16 | No Opt. Call | Aa3 | | 1,704,251 | |
| | 755 | | Grand Island, Nebraska, Electric System Revenue Bonds, Series 1977, 6.100%, 9/01/12 (ETM) | 7/11 at 100.00 | A1 (4) | | 786,431 | |
| | 515 | | Omaha Public Power District, Nebraska, Separate Electric System Revenue Bonds, Nebraska City 2, Series 2006A, 19.815%, 8/01/40 – AMBAC Insured (IF) | 2/17 at 100.00 | AA+ | | 680,882 | |
| | 2,850 | | Total Nebraska | | | | 3,171,564 | |
| | | | Nevada – 1.5% (0.9% of Total Investments) | | | | | |
| | 4,000 | | Clark County, Nevada, Airport Revenue Bonds, Subordinate Lien Series 2010B, 5.750%, 7/01/42 | 1/20 at 100.00 | Aa3 | | 4,043,160 | |
| | | | New Hampshire – 2.3% (1.4% of Total Investments) | | | | | |
| | 1,110 | | New Hampshire Health and Education Facilities Authority, Revenue Bonds, Dartmouth College, Tender Option Bond Trust 09-7W, 13.891%, 6/01/39 (IF) (7) | 6/19 at 100.00 | AA+ | | 1,235,308 | |
| | 5,000 | | New Hampshire Housing Finance Authority, FHLMC Multifamily Housing Remarketed Revenue Bonds, Countryside LP, Series 1994, 6.100%, 7/01/24 (Alternative Minimum Tax) | 7/11 at 100.50 | Aaa | | 5,053,500 | |
| | 6,110 | | Total New Hampshire | | | | 6,288,808 | |
| | | | New Jersey – 5.5% (3.3% of Total Investments) | | | | | |
| | 1,000 | | New Jersey Economic Development Authority, School Facilities Construction Bonds, Series 2005P, 5.250%, 9/01/24 | 9/15 at 100.00 | A+ | | 1,018,270 | |
| | 3,000 | | New Jersey Transportation Trust Fund Authority, Transportation System Bonds, Series 2003C, 5.500%, 6/15/24 (Pre-refunded 6/15/13) | 6/13 at 100.00 | AAA | | 3,310,920 | |
| | | | New Jersey Transportation Trust Fund Authority, Transportation System Bonds, Series 2006C: | | | | | |
| | 25,000 | | 0.000%, 12/15/35 – AMBAC Insured | No Opt. Call | A+ | | 4,645,250 | |
| | 10,000 | | 0.000%, 12/15/36 – AMBAC Insured | No Opt. Call | A+ | | 1,719,900 | |
| | 1,500 | | New Jersey Turnpike Authority, Revenue Bonds, Series 2003A, 5.000%, 1/01/19 – FGIC Insured | 7/13 at 100.00 | A+ | | 1,589,385 | |
| | 2,500 | | New Jersey Turnpike Authority, Revenue Bonds, Series 2005A, 5.000%, 1/01/25 – AGM Insured | 1/15 at 100.00 | AA+ | | 2,566,400 | |
| | 43,000 | | Total New Jersey | | | | 14,850,125 | |
| | | Nuveen Premier Municipal Income Fund, Inc. (continued) |
| NPF | | Portfolio of Investments |
April 30, 2011 (Unaudited)
| | Principal | | | Optional Call | | | | |
| | Amount (000) | | Description (1) | Provisions (2) | Ratings (3) | | Value | |
| | | | New York – 17.1% (10.4% of Total Investments) | | | | | |
| | | | Brooklyn Areba Local Development Corporation, New York, Payment in Lieu of Taxes Revenue Bonds, Barclays Center Project, Series 2009: | | | | | |
| $ | 660 | | 6.000%, 7/15/30 | 1/20 at 100.00 | BBB– | $ | 640,187 | |
| | 1,600 | | 0.000%, 7/15/44 | No Opt. Call | BBB– | | 156,432 | |
| | 1,500 | | Dormitory Authority of the State of New York, State and Local Appropriation Lease Bonds, Upstate Community Colleges, Series 2004B, 5.250%, 7/01/19 | 7/14 at 100.00 | AA– | | 1,602,045 | |
| | 2,200 | | Hudson Yards Infrastructure Corporation, New York, Revenue Bonds, Series 2006A, 4.500%, 2/15/47 – NPFG Insured | 2/17 at 100.00 | A | | 1,674,288 | |
| | 7,500 | | Long Island Power Authority, New York, Electric System General Revenue Bonds, Series 2006A, 5.000%, 12/01/25 – FGIC Insured (UB) | 6/16 at 100.00 | AA+ | | 7,758,150 | |
| | 5,000 | | Metropolitan Transportation Authority, New York, Transportation Revenue Refunding Bonds, Series 2002A, 5.125%, 11/15/21 – FGIC Insured | 11/12 at 100.00 | A | | 5,210,650 | |
| | 2,000 | | New York City Municipal Water Finance Authority, New York, Water and Sewerage System Revenue Bonds, Fiscal Series 2005B, 5.000%, 6/15/23 – AMBAC Insured | 12/14 at 100.00 | AAA | | 2,119,640 | |
| | 4,265 | | New York City, New York, General Obligation Bonds, Fiscal Series 2003D, 5.250%, 10/15/22 (UB) | 10/13 at 100.00 | AA | | 4,546,362 | |
| | 1,050 | | New York City, New York, General Obligation Bonds, Fiscal Series 2004B, 5.250%, 8/01/15 | 8/14 at 100.00 | AA | | 1,165,952 | |
| | 4,000 | | New York City, New York, General Obligation Bonds, Series 2004C-1, 5.250%, 8/15/20 (UB) | 8/14 at 100.00 | AA | | 4,396,760 | |
| | 910 | | New York Convention Center Development Corporation, Hotel Unit Fee Revenue Bonds, Series 2005, Trust 2364, 17.016%, 11/15/44 – AMBAC Insured (IF) | 11/15 at 100.00 | AA+ | | 919,428 | |
| | 3,250 | | New York State Municipal Bond Bank Agency, Special School Purpose Revenue Bonds, Series 2003C, 5.250%, 6/01/22 | 6/13 at 100.00 | A+ | | 3,396,445 | |
| | | | New York State Thruway Authority, General Revenue Bonds, Residual Series 2005G: | | | | | |
| | 6,460 | | 5.000%, 1/01/25 – AGM Insured (UB) | 7/15 at 100.00 | AA+ | | 6,671,759 | |
| | 2,580 | | 5.000%, 1/01/26 – AGM Insured (UB) | 7/15 at 100.00 | AA+ | | 2,651,621 | |
| | 1,850 | | New York State Urban Development Corporation, Service Contract Revenue Bonds, Series 2005B, 5.000%, 3/15/24 – AGM Insured (UB) | 3/15 at 100.00 | AAA | | 1,969,566 | |
| | 1,000 | | New York State Urban Development Corporation, Subordinate Lien Corporate Purpose Bonds, Series 2004A, 5.125%, 1/01/22 | 7/14 at 100.00 | A | | 1,041,470 | |
| | 395 | | Port Authority of New York and New Jersey, Special Project Bonds, JFK International Air Terminal LLC Project, Eigth Series 2010, 6.000%, 12/01/42 | 12/20 at 100.00 | BBB– | | 380,069 | |
| | 46,220 | | Total New York | | | | 46,300,824 | |
| | | | North Carolina – 4.4% (2.7% of Total Investments) | | | | | |
| | 10,300 | | North Carolina Eastern Municipal Power Agency, Power System Revenue Refunding Bonds, Series 1993B, 6.000%, 1/01/22 – CAPMAC Insured | No Opt. Call | A | | 11,957,887 | |
| | | | Ohio – 2.8% (1.7% of Total Investments) | | | | | |
| | | | Buckeye Tobacco Settlement Financing Authority, Ohio, Tobacco Settlement Asset-Backed Revenue Bonds, Senior Lien, Series 2007A-2: | | | | | |
| | 100 | | 5.125%, 6/01/24 | 6/17 at 100.00 | Baa3 | | 77,266 | |
| | 1,050 | | 5.875%, 6/01/30 | 6/17 at 100.00 | Baa3 | | 757,722 | |
| | 1,055 | | 5.750%, 6/01/34 | 6/17 at 100.00 | Baa3 | | 726,895 | |
| | 2,355 | | 5.875%, 6/01/47 | 6/17 at 100.00 | Baa3 | | 1,588,895 | |
| | 4,000 | | Ohio, Solid Waste Revenue Bonds, Republic Services Inc., Series 2004, 4.250%, 4/01/33 (Mandatory put 4/01/14) (Alternative Minimum Tax) | No Opt. Call | BBB | | 4,086,560 | |
| | 250 | | Port of Greater Cincinnati Development Authority, Ohio, Economic Development Revenue Bonds, Sisters of Mercy of the Americas, Series 2006, 5.000%, 10/01/25 | 10/16 at 100.00 | N/R | | 239,695 | |
| | 8,810 | | Total Ohio | | | | 7,477,033 | |
| | | | Oklahoma – 1.1% (0.7% of Total Investments) | | | | | |
| | 450 | | Norman Regional Hospital Authority, Oklahoma, Hospital Revenue Bonds, Series 2005, 5.375%, 9/01/36 | 9/16 at 100.00 | BB+ | | 360,621 | |
| | 2,725 | | Tulsa County Industrial Authority, Oklahoma, Health Care Revenue Bonds, Saint Francis Health System, Series 2006, 5.000%, 12/15/36 (UB) | 12/16 at 100.00 | AA+ | | 2,618,317 | |
| | 44 | | Tulsa County Industrial Authority, Oklahoma, Health Care Revenue Bonds, Saint Francis Health System, Series 2008, Trust 3500, 8.356%, 6/15/30 (IF) | 12/16 at 100.00 | AA+ | | 40,865 | |
| | 3,219 | | Total Oklahoma | | | | 3,019,803 | |
| | Principal | | | Optional Call | | | | |
| | Amount (000) | | Description (1) | Provisions (2) | Ratings (3) | | Value | |
| | | | Oregon – 1.2% (0.7% of Total Investments) | | | | | |
| | | | Oregon State, General Obligation Bonds, State Board of Higher Education, Series 2004A: | | | | | |
| $ | 1,795 | | 5.000%, 8/01/21 | 8/14 at 100.00 | AA+ | $ | 1,940,126 | |
| | 1,240 | | 5.000%, 8/01/23 | 8/14 at 100.00 | AA+ | | 1,301,839 | |
| | 3,035 | | Total Oregon | | | | 3,241,965 | |
| | | | Pennsylvania – 2.1% (1.3% of Total Investments) | | | | | |
| | 2,000 | | Allegheny County Sanitary Authority, Pennsylvania, Sewerage Revenue Bonds, Series 2005A, 5.000%, 12/01/23 – NPFG Insured | 12/15 at 100.00 | A1 | | 2,069,200 | |
| | 4,500 | | Pennsylvania Turnpike Commission, Turnpike Subordinate Revenue Bonds, Series 2009C, 0.000%, 6/01/33 – AGM Insured | 6/26 at 100.00 | AA+ | | 3,564,854 | |
| | 6,500 | | Total Pennsylvania | | | | 5,634,054 | |
| | | | Puerto Rico – 0.9% (0.5% of Total Investments) | | | | | |
| | 3,000 | | Puerto Rico Sales Tax Financing Corporation, Sales Tax Revenue Bonds, First Subordinate Series 2009A, 0.000%, 8/01/32 | 8/26 at 100.00 | A+ | | 2,448,869 | |
| | | | Rhode Island – 1.8% (1.1% of Total Investments) | | | | | |
| | 4,935 | | Rhode Island Tobacco Settlement Financing Corporation, Tobacco Settlement Asset-Backed Bonds, Series 2002A, 6.000%, 6/01/23 | 6/12 at 100.00 | BBB | | 4,936,776 | |
| | | | South Carolina – 8.3% (5.1% of Total Investments) | | | | | |
| | 2,500 | | Berkeley County School District, South Carolina, Installment Purchase Revenue Bonds, Securing Assets for Education, Series 2003, 5.250%, 12/01/24 | 12/13 at 100.00 | A1 | | 2,543,775 | |
| | 4,405 | | Dorchester County School District 2, South Carolina, Installment Purchase Revenue Bonds, GROWTH, Series 2004, 5.250%, 12/01/23 | 12/14 at 100.00 | AA– | | 4,616,176 | |
| | 3,340 | | Greenville County School District, South Carolina, Installment Purchase Revenue Bonds, Series 2003, 5.250%, 12/01/19 (UB) | 12/13 at 100.00 | AA | | 3,592,304 | |
| | 3,620 | | Greenville, South Carolina, Hospital Facilities Revenue Refunding Bonds, Series 2003A, 5.250%, 5/01/21 – AMBAC Insured | 5/13 at 100.00 | AA– | | 3,684,002 | |
| | 310 | | South Carolina JOBS Economic Development Authority, Economic Development Revenue Bonds, Bon Secours Health System Inc., Series 2002A, 5.625%, 11/15/30 (Pre-refunded 11/15/12) | 11/12 at 100.00 | A3 (4) | | 334,087 | |
| | 1,190 | | South Carolina JOBS Economic Development Authority, Economic Development Revenue Bonds, Bon Secours Health System Inc., Series 2002B, 5.625%, 11/15/30 | 11/12 at 100.00 | A– | | 1,137,688 | |
| | | | South Carolina JOBS Economic Development Authority, Hospital Refunding and Improvement Revenue Bonds, Palmetto Health Alliance, Series 2003C: | | | | | |
| | 4,895 | | 6.375%, 8/01/34 (Pre-refunded 8/01/13) | 8/13 at 100.00 | BBB+ (4) | | 5,484,015 | |
| | 605 | | 6.375%, 8/01/34 (Pre-refunded 8/01/13) | 8/13 at 100.00 | BBB+ (4) | | 680,558 | |
| | 455 | | Tobacco Settlement Revenue Management Authority, South Carolina, Tobacco Settlement Asset-Backed Bonds, Series 2001B, 6.000%, 5/15/22 (Pre-refunded 5/15/11) | 5/11 at 101.00 | BBB (4) | | 460,283 | |
| | 21,320 | | Total South Carolina | | | | 22,532,888 | |
| | | | South Dakota – 0.6% (0.4% of Total Investments) | | | | | |
| | 1,750 | | South Dakota Health and Educational Facilities Authority, Revenue Bonds, Sioux Valley Hospitals, Series 2004A, 5.500%, 11/01/31 | 11/14 at 100.00 | AA– | | 1,750,542 | |
| | | | Tennessee – 1.3% (0.8% of Total Investments) | | | | | |
| | 2,060 | | Johnson City Health and Educational Facilities Board, Tennessee, Hospital Revenue Refunding and Improvement Bonds, Johnson City Medical Center, Series 1998C, 5.125%, 7/01/25 (Pre-refunded 7/01/23) – NPFG Insured | 7/23 at 100.00 | Baa1 (4) | | 2,066,221 | |
| | 1,600 | | Johnson City Health and Educational Facilities Board, Tennessee, Revenue Bonds, Mountain States Health Alliance, Series 2006A, 5.500%, 7/01/36 | 7/16 at 100.00 | BBB+ | | 1,383,424 | |
| | 400 | | Sumner County Health, Educational, and Housing Facilities Board, Tennessee, Revenue Refunding Bonds, Sumner Regional Health System Inc., Series 2007, 5.500%, 11/01/37 (5), (6) | 11/17 at 100.00 | N/R | | 20,040 | |
| | 4,060 | | Total Tennessee | | | | 3,469,685 | |
| | | Nuveen Premier Municipal Income Fund, Inc. (continued) |
| NPF | | Portfolio of Investments |
April 30, 2011 (Unaudited)
| | Principal | | | Optional Call | | | | |
| | Amount (000) | | Description (1) | Provisions (2) | Ratings (3) | | Value | |
| | | | Texas – 6.6% (4.0% of Total Investments) | | | | | |
| $ | 1,075 | | Brazos River Authority, Texas, Pollution Control Revenue Bonds, TXU Energy Company LLC Project, Series 2003C, 6.750%, 10/01/38 (Alternative Minimum Tax) | 10/13 at 101.00 | CC | $ | 377,562 | |
| | 3,000 | | Houston, Texas, First Lien Combined Utility System Revenue Bonds, Series 2004A, 5.250%, 5/15/25 – NPFG Insured | 5/14 at 100.00 | AA | | 3,180,420 | |
| | | | Kerrville Health Facilities Development Corporation, Texas, Revenue Bonds, Sid Peterson Memorial Hospital Project, Series 2005: | | | | | |
| | 400 | | 5.250%, 8/15/21 | No Opt. Call | BBB– | | 397,612 | |
| | 600 | | 5.125%, 8/15/26 | No Opt. Call | BBB– | | 541,416 | |
| | 800 | | Love Field Airport Modernization Corporation, Texas, Special Facilities Revenue Bonds, Southwest Airlines Company, Series 2010, 5.250%, 11/01/40 | 11/20 at 100.00 | BBB– | | 701,544 | |
| | 2,265 | | Lower Colorado River Authority, Texas, Contract Revenue Refunding Bonds, Transmission Services Corporation, Series 2003C, 5.250%, 5/15/25 – AMBAC Insured | 5/13 at 100.00 | A | | 2,339,111 | |
| | 950 | | North Texas Tollway Authority, Second Tier System Revenue Refunding Bonds, Series 2008F, 5.750%, 1/01/38 | 1/18 at 100.00 | A3 | | 924,664 | |
| | 1,000 | | Sabine River Authority, Texas, Pollution Control Revenue Bonds, TXU Electric Company, Series 2001C, 5.200%, 5/01/28 | 11/15 at 100.00 | CCC | | 331,380 | |
| | 3,000 | | Tarrant County Cultural & Educational Facilities Financing Corporation, Texas, Revenue Bonds, Texas Health Resources, Series 2007A, 5.000%, 2/15/36 (UB) | 2/17 at 100.00 | AA– | | 2,741,310 | |
| | 125 | | Tarrant County Cultural and Educational Facilities Finance Corporation, Texas, Revenue Bonds, Texas Health Resources Project, Trust 1031, 17.466%, 2/15/30 (IF) | 2/17 at 100.00 | AA– | | 81,899 | |
| | | | Texas Tech University, Financing System Revenue Bonds, 9th Series 2003: | | | | | |
| | 3,525 | | 5.250%, 2/15/18 – AMBAC Insured | 8/13 at 100.00 | AA | | 3,813,873 | |
| | 2,250 | | 5.250%, 2/15/19 – AMBAC Insured | 8/13 at 100.00 | AA | | 2,431,215 | |
| | 18,990 | | Total Texas | | | | 17,862,006 | |
| | | | Utah – 0.1% (0.1% of Total Investments) | | | | | |
| | 315 | | Utah Housing Corporation, Single Family Mortgage Bonds, Series 2001D, 5.500%, 1/01/21 (Alternative Minimum Tax) | 7/11 at 100.00 | Aaa | | 315,479 | |
| | 20 | | Utah Housing Finance Agency, Single Family Mortgage Bonds, Series 1996C, 6.450%, 7/01/14 (Alternative Minimum Tax) | 7/11 at 100.00 | Aaa | | 20,044 | |
| | 335 | | Total Utah | | | | 335,523 | |
| | | | Washington – 5.1% (3.1% of Total Investments) | | | | | |
| | 2,000 | | Energy Northwest, Washington, Electric Revenue Refunding Bonds, Columbia Generating Station, Series 2002A, 5.750%, 7/01/17 – NPFG Insured | 7/12 at 100.00 | Aaa | | 2,110,039 | |
| | 7,000 | | Energy Northwest, Washington, Electric Revenue Refunding Bonds, Nuclear Project 1, Series 2003A, 5.500%, 7/01/16 (UB) | 7/13 at 100.00 | Aaa | | 7,645,120 | |
| | 3,160 | | King County Public Hospital District 2, Washington, Limited Tax General Obligation Bonds, Evergreen Hospital Medical Center, Series 2001A, 5.250%, 12/01/24 – AMBAC Insured | 6/11 at 101.00 | AA– | | 3,189,040 | |
| | 1,000 | | Skagit County Public Hospital District 1, Washington, Revenue Bonds, Skagit Valley Hospital, Series 2003, 6.000%, 12/01/23 | No Opt. Call | Baa2 | | 1,014,740 | |
| | 13,160 | | Total Washington | | | | 13,958,939 | |
| | | | West Virginia – 1.7% (1.0% of Total Investments) | | | | | |
| | 2,000 | | West Virginia Water Development Authority, Infrastructure Revenue Bonds, Series 2003A, 5.500%, 10/01/23 (Pre-refunded 10/01/13) – AMBAC Insured | 10/13 at 101.00 | AAA | | 2,253,200 | |
| | 2,150 | | West Virginia Water Development Authority, Loan Program II Revenue Bonds, Series 2003B, 5.250%, 11/01/23 – AMBAC Insured | 11/13 at 101.00 | A | | 2,232,667 | |
| | 4,150 | | Total West Virginia | | | | 4,485,867 | |
| | Principal | | | Optional Call | | | | |
| | Amount (000) | | Description (1) | Provisions (2) | Ratings (3) | | Value | |
| | | | Wisconsin – 6.2% (3.8% of Total Investments) | | | | | |
| $ | 5,670 | | Wisconsin Health and Educational Facilities Authority, Revenue Bonds, Agnesian Healthcare Inc., Series 2001, 6.000%, 7/01/30 (Pre-refunded 7/01/11) | 7/11 at 100.00 | A– (4) | $ | 5,726,019 | |
| | 160 | | Wisconsin Health and Educational Facilities Authority, Revenue Bonds, Divine Savior Healthcare, Series 2006, 5.000%, 5/01/32 | 5/16 at 100.00 | BBB | | 131,442 | |
| | 1,000 | | Wisconsin Health and Educational Facilities Authority, Revenue Bonds, Fort Healthcare Inc., Series 2004, 5.375%, 5/01/18 | 5/14 at 100.00 | BBB+ | | 1,012,290 | |
| | 205 | | Wisconsin Health and Educational Facilities Authority, Revenue Bonds, Froedtert and Community Health Obligated Group, Series 2001, 5.375%, 10/01/30 | 10/11 at 101.00 | AA– | | 205,170 | |
| | 2,145 | | Wisconsin Health and Educational Facilities Authority, Revenue Bonds, Froedtert and Community Health Obligated Group, Series 2001, 5.375%, 10/01/30 (Pre-refunded 10/01/11) | 10/11 at 101.00 | AA– (4) | | 2,211,431 | |
| | 5,000 | | Wisconsin Health and Educational Facilities Authority, Revenue Bonds, Marshfield Clinic, Series 1999, 6.250%, 2/15/18 – RAAI Insured | 8/11 at 100.00 | BBB+ | | 5,005,450 | |
| | 2,500 | | Wisconsin State, General Obligation Bonds, Series 2006A, 4.750%, 5/01/25 – FGIC Insured (UB) | 5/16 at 100.00 | AA | | 2,592,100 | |
| | 16,680 | | Total Wisconsin | | | | 16,883,902 | |
| | | | Wyoming – 0.5% (0.3% of Total Investments) | | | | | |
| | 1,350 | | Sweetwater County, Wyoming, Solid Waste Disposal Revenue Bonds, FMC Corporation, Series 2005, 5.600%, 12/01/35 (Alternative Minimum Tax) | 12/15 at 100.00 | BBB+ | | 1,292,813 | |
| $ | 508,354 | | Total Investments (cost $440,537,988) – 163.9% | | | | 444,746,158 | |
| | | | Floating Rate Obligations – (20.7)% | | | | (56,256,000 | ) |
| | | | Other Assets Less Liabilities – 3.5% | | | | 9,744,873 | |
| | | | Auction Rate Preferred Shares, at Liquidation Value – (46.7)% (8) | | | | (126,850,000 | ) |
| | | | Net Assets Applicable to Common Shares – 100% | | | $ | 271,385,031 | |
| (1) | | All percentages shown in the Portfolio of Investments are based on net assets applicable to Common shares unless otherwise noted. |
| (2) | | Optional Call Provisions: Dates (month and year) and prices of the earliest optional call or redemption. There may be other call provisions at varying prices at later dates. Certain mortgage-backed securities may be subject to periodic principal paydowns. |
| (3) | | Ratings: Using the highest of Standard & Poor’s Group (“Standard & Poor’s”), Moody’s Investor Service, Inc. (“Moody’s”) or Fitch, Inc. (“Fitch”) rating. Ratings below BBB by Standard & Poor’s, Baa by Moody’s or BBB by Fitch are considered to be below investment grade. Holdings designated N/R are not rated by any of these national rating agencies. |
| (4) | | Backed by an escrow or trust containing sufficient U.S. Government or U.S. Government agency securities, which ensure the timely payment of principal and interest. Such investments are normally considered to be equivalent to AAA rated securities. |
| (5) | | At or subsequent to the end of the reporting period, this security is non-income producing. Non-income producing security, in the case of a bond, generally denotes that the issuer has (1) defaulted on the payment of principal or interest, (2) is under the protection of the Federal Bankruptcy Court or (3) the Fund’s Adviser has concluded that the issue is not likely to meet its future interest payment obligations and has directed the Fund’s custodian to cease accruing additional income on the Fund’s records. |
| (6) | | For fair value measurement disclosure purposes, investment categorized as Level 3. See Notes to Financial Statements, Footnote 1 – General Information and Significant Accounting Policies, Investment Valuation for more information. |
| (7) | | Investment, or portion of investment, has been pledged to collateralize the net payment obligations for investments in derivatives and/or inverse floating rate transactions. |
| (8) | | Auction Rate Preferred Shares, at Liquidation Value as a percentage of Total Investments are 28.5%. |
| N/R | | Not rated. |
| WI/DD | | Purchased on a when-issued or delayed delivery basis. |
| (ETM) | | Escrowed to maturity. |
| (IF) | | Inverse floating rate investment. |
| (UB) | | Underlying bond of an inverse floating rate trust reflected as a financing transaction. See Notes to Financial Statements, Footnote 1 – General Information and Significant Accounting Policies, Inverse Floating Rate Securities for more information. |
See accompanying notes to financial statements.
| | | Nuveen Municipal High Income Opportunity Fund |
| NMZ | | Portfolio of Investments |
| | | April 30, 2011 (Unaudited) |
| | Principal | | | Optional Call | | | | |
| | Amount (000) | | Description (1) | Provisions (2) | Ratings (3) | | Value | |
| | | | National – 1.8% (1.3% of Total Investments) | | | | | |
| $ | 5,000 | | Charter Mac Equity Issuer Trust, Preferred Shares, Series 2004A-4, 6.000%, 12/31/45 (Mandatory put 4/30/19) (Alternative Minimum Tax) | 4/19 at 100.00 | Aaa | $ | 5,243,750 | |
| | | | Alabama – 1.7% (1.2% of Total Investments) | | | | | |
| | 1,000 | | Adamsville Solid Waste Disposal Authority, Alabama, Solid Waste Disposal Revenue Bonds, Green Mountain Management LLC Project, Series 2010, 8.750%, 8/01/30 | 8/20 at 100.00 | N/R | | 951,480 | |
| | 1,945 | | Bessemer, Alabama, General Obligation Warrants, Series 2007, 6.500%, 2/01/37 | 2/17 at 102.00 | N/R | | 1,331,041 | |
| | 2,000 | | Birmingham Special Care Facilities Financing Authority, Alabama, Revenue Bonds, Baptist Health System Inc., Series 2005A, 5.000%, 11/15/30 | 11/15 at 100.00 | Baa2 | | 1,702,040 | |
| | 1,000 | | Jefferson County, Alabama, Limited Obligation School Warrants, Education Tax Revenue Bonds, Series 2004A, 5.250%, 1/01/14 | No Opt. Call | BBB– | | 952,830 | |
| | 5,945 | | Total Alabama | | | | 4,937,391 | |
| | | | Arizona – 6.8% (5.0% of Total Investments) | | | | | |
| | 1,760 | | Arizona Health Facilities Authority, Hospital Revenue Bonds, Banner Health Systems, Tender Option Bond Trust 4695, 19.014%, 1/01/32 (IF) (7) | 1/18 at 100.00 | AA– | | 1,534,333 | |
| | 394 | | Estrella Mountain Ranch Community Facilities District, Goodyear, Arizona, Special Assessment Lien Bonds, Series 2001A, 7.875%, 7/01/25 | 7/12 at 100.00 | N/R | | 397,243 | |
| | 2,000 | | Maricopa County Industrial Development Authority, Arizona, Multifamily Housing Revenue Bonds, Privado Park Apartments Project, Series 2006A, 5.000%, 11/01/46 (Mandatory put 11/01/15) | 7/20 at 100.00 | N/R | | 1,909,160 | |
| | 6,720 | | Maricopa County Industrial Development Authority, Arizona, Senior Living Facility Revenue Bonds, Christian Care Mesa II Inc., Series 2004A, 6.625%, 1/01/34 (Alternative Minimum Tax) | 1/14 at 100.00 | CC | | 5,017,018 | |
| | | | Phoenix Industrial Development Authority, Arizona, Educational Revenue Bonds, Keystone Montessori School, Series 2004A: | | | | | |
| | 150 | | 6.375%, 11/01/13 | 11/11 at 103.00 | N/R | | 151,533 | |
| | 790 | | 7.250%, 11/01/23 | 11/11 at 103.00 | N/R | | 749,963 | |
| | 1,715 | | 7.500%, 11/01/33 | 11/11 at 103.00 | N/R | | 1,558,472 | |
| | 550 | | Pima County Industrial Development Authority, Arizona, Charter School Revenue Bonds, Noah Webster Basic Schools Inc., Series 2004, 6.125%, 12/15/34 | 12/14 at 100.00 | BBB– | | 472,203 | |
| | 355 | | Pima County Industrial Development Authority, Arizona, Charter School Revenue Bonds, Pointe Educational Services Charter School, Series 2004, 6.250%, 7/01/14 (ETM) | No Opt. Call | N/R (4) | | 415,904 | |
| | 500 | | Pima County Industrial Development Authority, Arizona, Education Revenue Bonds, Paradise Education Center Project, Series 2010, 6.100%, 6/01/45 | 6/19 at 100.00 | BBB– | | 408,015 | |
| | 1,150 | | Pinal County Industrial Development Authority, Arizona, Correctional Facilities Contract Revenue Bonds, Florence West Prison LLC, Series 2002A, 5.250%, 10/01/22 – ACA Insured | 10/12 at 100.00 | BBB– | | 1,052,641 | |
| | 1,000 | | Quechan Indian Tribe of the Fort Yuma Reservation, Arizona, Government Project Bonds, Series 2008, 7.000%, 12/01/27 | 12/17 at 102.00 | N/R | | 923,890 | |
| | | | Salt Verde Financial Corporation, Arizona, Senior Gas Revenue Bonds, Citigroup Energy Inc Prepay Contract Obligations, Series 2007: | | | | | |
| | 1,000 | | 5.500%, 12/01/29 | No Opt. Call | A | | 944,380 | |
| | 3,000 | | 5.000%, 12/01/37 (7) | No Opt. Call | A | | 2,496,390 | |
| | 1,000 | | Surprise Municipal Property Corporation, Arizona, Wastewater System Revenue Bonds, Series 2007, 4.700%, 4/01/22 | 4/14 at 100.00 | N/R | | 999,990 | |
| | 1,000 | | Tucson Industrial Development Authority, Arizona, Charter School Revenue Bonds, Arizona Agribusiness and Equine Center Charter School, Series 2004A, 5.850%, 9/01/24 | 9/14 at 100.00 | BB+ | | 853,260 | |
| | 23,084 | | Total Arizona | | | | 19,884,395 | |
| | | | California – 12.9% (9.5% of Total Investments) | | | | | |
| | 1,810 | | California County Tobacco Securitization Agency, Tobacco Settlement Asset-Backed Bonds, Sonoma County Tobacco Securitization Corporation, Series 2005, 5.125%, 6/01/38 | 6/15 at 100.00 | BBB | | 1,202,401 | |
| | 545 | | California Health Facilities Financing Authority, Hospital Revenue Bonds, Downey Community Hospital, Series 1993, 5.750%, 5/15/15 (5) | 5/11 at 100.00 | N/R | | 444,889 | |
| | Principal | | | Optional Call | | | | |
| | Amount (000) | | Description (1) | Provisions (2) | Ratings (3) | | Value | |
| | | | California (continued) | | | | | |
| $ | 500 | | California Municipal Financing Authority, Certificates of Participation, Community Hospitals of Central California, Series 2007, 5.250%, 2/01/27 | 2/17 at 100.00 | Baa2 | $ | 434,880 | |
| | 3,425 | | California State University, Systemwide Revenue Bonds, Tender Option Bond Trust 4696: 17.760%, 11/01/35 – AMBAC Insured (IF) (7) | 5/15 at 100.00 | Aa2 | | 2,302,936 | |
| | 4,000 | | California Statewide Communities Development Authority, Revenue Bonds, EnerTech Regional Biosolids Project, Series 2007A, 5.500%, 12/01/33 (Alternative Minimum Tax) (6) | No Opt. Call | CCC+ | | 892,840 | |
| | 2,925 | | California Statewide Community Development Authority, Revenue Bonds, Epidaurus Project, Series 2004A, 7.750%, 3/01/34 | 3/14 at 102.00 | N/R | | 2,854,332 | |
| | 1,825 | | California Statewide Community Development Authority, Revenue Bonds, Sutter Health, Tender Option Bond Trust 3048, 17.237%, 11/15/38 (IF) | 5/18 at 100.00 | AA– | | 1,046,291 | |
| | | | California Statewide Community Development Authority, Revenue Bonds, Sutter Health, Tender Option Bond Trust 3102: | | | | | |
| | 745 | | 17.396%, 11/15/38 (IF) | 5/18 at 100.00 | AA– | | 428,070 | |
| | 1,000 | | 18.486%, 11/15/48 (IF) | 5/18 at 100.00 | AA– | | 616,080 | |
| | 1,005 | | California Statewide Community Development Authority, Subordinate Lien Multifamily Housing Revenue Bonds, Corona Park Apartments, Series 2004I-S, 7.750%, 1/01/34 (Alternative Minimum Tax) | 1/14 at 100.00 | N/R | | 909,615 | |
| | 1,000 | | Golden State Tobacco Securitization Corporation, California, Enhanced Tobacco Settlement Asset-Backed Revenue Bonds, Tender Option Bonds Trust 3107, 17.373%, 6/01/45 – AMBAC Insured (IF) | 6/15 at 100.00 | AA+ | | 458,040 | |
| | 500 | | Golden State Tobacco Securitization Corporation, California, Tobacco Settlement Asset-Backed Bonds, Series 2007A-1, 5.750%, 6/01/47 | 6/17 at 100.00 | Baa3 | | 339,430 | |
| | 1,500 | | Grossmont Healthcare District, California, General Obligation Bonds, Tender Option Bond Trust 3253, 22.321%, 1/15/19 (IF) (7) | No Opt. Call | Aa2 | | 1,820,580 | |
| | 1,200 | | Lake Elsinore, California, Special Tax Bonds, Community Facilities District 2003-2 Improvement Area A, Canyon Hills, Series 2004A, 5.950%, 9/01/34 | 9/13 at 102.00 | N/R | | 1,051,032 | |
| | 335 | | Lancaster Redevelopment Agency, California, Combined Project Areas Housing Programs, Tax Allocation Bonds, Series 2009, 6.875%, 8/01/39 | 8/19 at 100.00 | BBB+ | | 307,017 | |
| | 3,400 | | Lee Lake Water District, Riverside County, California, Special Tax Bonds, Community Facilities District 3, Series 2004, 5.950%, 9/01/34 | 9/13 at 102.00 | N/R | | 2,794,052 | |
| | 1,125 | | Los Angeles Department of Airports, California, Revenue Bonds, Los Angeles International Airport, Tender Option Bond Trust 10-27B, 17.832%, 5/15/40 (IF) (7) | 5/20 at 100.00 | AA | | 958,185 | |
| | 3,190 | | Los Angeles Regional Airports Improvement Corporation, California, Sublease Revenue Bonds, Los Angeles International Airport, American Airlines Inc. Terminal 4 Project, Series 2002C, 7.500%, 12/01/24 (Alternative Minimum Tax) | 12/12 at 102.00 | B– | | 3,193,828 | |
| | 1,000 | | Lynwood Redevelopment Agency, California, Project A Revenue Bonds, Subordinate Lien Series 2011A, 7.000%, 9/01/31 | 9/21 at 100.00 | A– | | 1,007,910 | |
| | | | March Joint Powers Redevelopment Agency March Air Force Base Redevelopment Project, California, Series 2011A: | | | | | |
| | 1,000 | | 7.000%, 8/01/26 | 8/21 at 100.00 | BBB+ | | 1,010,780 | |
| | 1,000 | | 7.500%, 8/01/41 | 8/21 at 100.00 | BBB+ | | 1,025,700 | |
| | 800 | | Moreno Valley Unified School District, Riverside County, California, Special Tax Bonds, Community Facilities District, Series 2004, 5.550%, 9/01/29 | 9/14 at 100.00 | N/R | | 733,920 | |
| | 1,000 | | M-S-R Energy Authority, California, Gas Revenue Bonds, Series 2009B, 6.500%, 11/01/39 | No Opt. Call | A | | 1,031,720 | |
| | 500 | | National City Community Development Commission, San Diego County, California, Redevelopment Project Tax Allocation Bonds, Series 2011, 7.000%, 8/01/32 | 8/21 at 100.00 | A– | | 509,815 | |
| | 330 | | Novato Redevelopment Agency, California, Tax Allocation Bonds, Hamilton Field Redevelopment Project, Series 2011, 6.750%, 9/01/40 | 9/21 at 100.00 | A– | | 329,122 | |
| | 1,000 | | Palomar Pomerado Health Care District, California, Certificates of Participation, Series 2010, 6.000%, 11/01/41 | 11/20 at 100.00 | Baa3 | | 865,720 | |
| | 250 | | Palomar Pomerado Health, California, General Obligation Bonds, Tender Option Bond Trust 4683, 16.618%, 8/01/37 – NPFG Insured (IF) (7) | 8/17 at 100.00 | A+ | | 160,090 | |
| | | Nuveen Municipal High Income Opportunity Fund (continued) |
| NMZ | | Portfolio of Investments |
April 30, 2011 (Unaudited)
| | Principal | | | Optional Call | | | | |
| | Amount (000) | | Description (1) | Provisions (2) | Ratings (3) | | Value | |
| | | | California (continued) | | | | | |
| $ | 1,200 | | Riverside County Redevelopment Agency Jurupa Valley Project Area 2011, California, Tax Allocation Bonds Series B, 6.750%, 10/01/30 | 10/21 at 100.00 | A– | $ | 1,180,812 | |
| | 1,250 | | San Diego County, California, Certificates of Participation, San Diego-Imperial Counties Developmental Services Foundation Project, Series 2002, 5.500%, 9/01/27 | 9/12 at 100.00 | Baa1 | | 1,155,963 | |
| | 1,000 | | Santee Community Development Commission, California, Santee Redevelopment Project Tax Allocation Bonds, Series 2011A, 7.000%, 8/01/41 | 2/21 at 100.00 | A | | 1,013,590 | |
| | | | Tahoe Forest Hospital District, Placer and Nevada Counties, California, General Obligation Bonds, Tender Option Bond Trust 11863: | | | | | |
| | 1,500 | | 17.193%, 8/01/34 (IF) | 8/18 at 100.00 | Aa3 | | 1,000,500 | |
| | 500 | | 17.193%, 8/01/34 (IF) | 8/18 at 100.00 | Aa3 | | 333,500 | |
| | 1,000 | | Temecula Redevelopment Agency, California, Tax Allocation Revenue Bonds, Redevelopment Project 1, Series 2002, 5.250%, 8/01/36 – NPFG Insured | 7/11 at 100.00 | A– | | 816,640 | |
| | 650 | | Twentynine Palms Redevelopment Agency, California, Tax Allocation Bonds, Four Corners Project Area, Series 2011A, 7.650%, 9/01/42 | 9/21 at 100.00 | BBB+ | | 643,039 | |
| | 3,895 | | West Patterson Financing Authority, California, Special Tax Bonds, Community Facilities District 2001-1, Series 2004A, 6.125%, 9/01/39 | 9/13 at 103.00 | N/R | | 3,062,561 | |
| | 47,905 | | Total California | | | | 37,935,880 | |
| | | | Colorado – 7.8% (5.7% of Total Investments) | | | | | |
| | 1,015 | | Bradburn Metropolitan District 3, Westminster, Adams County, Colorado, General Obligation Limited Tax Refunding Bonds, Series 2010, 7.500%, 12/01/39 | 12/13 at 102.00 | N/R | | 964,717 | |
| | 6 | | Buffalo Ridge Metropolitan District, Colorado, Limited Obligation Assessment Bonds, Series 2003, 7.500%, 12/01/33 (Pre-refunded 12/01/13) | 12/13 at 101.00 | N/R (4) | | 6,819 | |
| | 650 | | Colorado Educational and Cultural Facilities Authority, Charter School Revenue Bonds, Bromley East Charter School, Series 2000A, 7.250%, 9/15/30 (Pre-refunded 9/15/11) | 9/11 at 100.00 | Ba1 (4) | | 666,751 | |
| | 3,500 | | Colorado Educational and Cultural Facilities Authority, Charter School Revenue Bonds, Cesar Chavez Academy, Series 2003, 8.000%, 5/01/34 | 5/14 at 101.00 | N/R | | 2,829,155 | |
| | 410 | | Colorado Educational and Cultural Facilities Authority, Charter School Revenue Bonds, Excel Academy Charter School, Series 2003, 7.300%, 12/01/23 (Pre-refunded 12/01/11) | 12/11 at 100.00 | AAA | | 426,289 | |
| | 1,000 | | Colorado Educational and Cultural Facilities Authority, Charter School Revenue Bonds, Jefferson County School District R-1 – Compass Montessori Secondary School, Series 2006, 5.625%, 2/15/36 | 2/16 at 101.00 | N/R | | 754,070 | |
| | 1,200 | | Colorado Health Facilities Authority, Colorado, Revenue Bonds, Catholic Health Initiatives, Series 2006C-1, Trust 1090, 14.832%, 10/01/41 – AGM Insured (IF) (7) | 4/18 at 100.00 | AA+ | | 962,148 | |
| | 1,000 | | E-470 Public Highway Authority, Colorado, Revenue Bonds, Senior Series 2007D-1, 5.500%, 9/01/24 – NPFG Insured | 9/15 at 100.00 | Baa1 | | 951,810 | |
| | 3,145 | | Kit Carson County Health Service District, Colorado, Health Care Facility Revenue Bonds, Series 2007, 6.750%, 1/01/34 | No Opt. Call | N/R | | 2,821,883 | |
| | 1,250 | | Mesa County, Colorado, Residential Care Facilities Mortgage Revenue Bonds, Hilltop Community Resources Inc. Obligated Group, Series 2001A, 5.250%, 12/01/21 – RAAI Insured | 12/11 at 101.00 | N/R | | 1,178,450 | |
| | 1,000 | | Mountain Shadows Metropolitan District, Colorado, General Obligation Limited Tax Bonds, Series 2007, 5.500%, 12/01/27 | 12/16 at 100.00 | N/R | | 734,980 | |
| | 1,990 | | Park Creek Metropolitan District, Colorado, Limited Tax Obligation Revenue Bonds, Series 2003CR-2, 7.875%, 12/01/32 (Mandatory put 12/01/13) | 12/13 at 100.00 | N/R | | 2,015,412 | |
| | 1,500 | | Plaza Metropolitan District 1, Lakewood, Colorado, Tax Increment Revenue Bonds, Series 2003, 8.000%, 12/01/25 | 6/14 at 101.00 | N/R | | 1,477,320 | |
| | 3,565 | | Public Authority for Colorado Energy, Natural Gas Purchase Revenue Bonds, Colorado Springs Utilities, Series 2008, 6.500%, 11/15/38 | No Opt. Call | A | | 3,662,253 | |
| | | | Regional Transportation District, Colorado, Denver Transit Partners Eagle P3 Project Private Activity Bonds, Series 2010: | | | | | |
| | 500 | | 6.500%, 1/15/30 | 7/20 at 100.00 | Baa3 | | 505,455 | |
| | 2,000 | | 6.000%, 1/15/41 | 7/20 at 100.00 | Baa3 | | 1,832,260 | |
| | 1,000 | | Tallyn’s Reach Metropolitan District 3, Aurora, Colorado, Limited Tax General Obligation Bonds, Series 2004, 6.750%, 12/01/33 | 12/13 at 100.00 | N/R | | 1,010,990 | |
| | 24,731 | | Total Colorado | | | | 22,800,762 | |
| | Principal | | | Optional Call | | | | |
| | Amount (000) | | Description (1) | Provisions (2) | Ratings (3) | | Value | |
| | | | Connecticut – 0.4% (0.3% of Total Investments) | | | | | |
| $ | 1,000 | | Harbor Point Infrastructure Improvement District, Connecticut, Special Obligation Revenue Bonds, Harbor Point Project, Series 2010A, 7.875%, 4/01/39 | 4/20 at 100.00 | N/R | $ | 1,048,680 | |
| | | | District of Columbia – 0.4% (0.3% of Total Investments) | | | | | |
| | 225 | | District of Columbia Tobacco Settlement Corporation, Tobacco Settlement Asset-Backed Bonds, Series 2001, 6.500%, 5/15/33 | No Opt. Call | BBB | | 220,860 | |
| | 1,000 | | District of Columbia, Revenue Bonds, Cesar Chavez Public Charter Schools for Public Policy, Series 2011, 7.500%, 11/15/31 | 11/20 at 100.00 | BBB– | | 978,460 | |
| | 1,225 | | Total District of Columbia | | | | 1,199,320 | |
| | | | Florida – 12.3% (9.1% of Total Investments) | | | | | |
| | 1,440 | | Aberdeen Community Development District, Florida, Special Assessment Bonds, Series 2005, 5.500%, 5/01/36 | 5/14 at 100.00 | N/R | | 705,413 | |
| | 5,075 | | Beacon Lakes Community Development District, Florida, Special Assessment Bonds, Series 2003A, 6.900%, 5/01/35 | 5/13 at 101.00 | N/R | | 4,754,311 | |
| | 700 | | Broward County, Florida, Airport Facility Revenue Bonds, Learjet Inc., Series 2000, 7.500%, 11/01/20 (Alternative Minimum Tax) | 11/14 at 101.00 | Ba2 | | 720,587 | |
| | 980 | | Colonial Country Club Community Development District, Florida, Capital Improvement Revenue Bonds, Series 2003, 6.400%, 5/01/33 | 5/13 at 101.00 | A+ | | 987,154 | |
| | 8,030 | | Harmony Community Development District, Florida, Special Assessment Bonds, Series 2001, 7.250%, 5/01/32 | 5/14 at 103.25 | N/R | | 7,835,835 | |
| | 3,000 | | Jacksonville, Florida, Economic Development Commission Health Care Facilities Revenue Bonds, The Florida Proton Therapy Institute Project, Series 2007, 6.250%, 9/01/27 | 9/17 at 100.00 | N/R | | 2,786,790 | |
| | 2,000 | | Martin County Industrial Development Authority, Florida, Industrial Development Revenue Bonds, Indiantown Cogeneration LP, Series 1994A, 7.875%, 12/15/25 (Alternative Minimum Tax) | 6/11 at 100.00 | BB+ | | 2,010,000 | |
| | 1,370 | | Miami-Dade County Health Facility Authority, Florida, Hospital Revenue Bonds, Miami Children’s Hospital, Series 2010A, 6.000%, 8/01/30 | 8/20 at 100.00 | A | | 1,377,576 | |
| | 1,000 | | Miami-Dade County, Florida, Aviation Revenue Bonds, Series 2008, Trust 1145, 17.920%, 4/01/32 – AGC Insured (Alternative Minimum Tax) (IF) (7) | 10/18 at 100.00 | AA+ | | 666,320 | |
| | 1,250 | | Miami-Dade County, Florida, Water and Sewer System Revenue Bonds, Tender Option Bond Trust 11834, 17.135%, 10/01/33 – AGM Insured (IF) | 10/20 at 100.00 | AA+ | | 1,123,900 | |
| | 1,000 | | Mid-Bay Bridge Authority, Florida, Springing Lien Revenue Bonds, Series 2011, 7.250%, 10/01/34 | No Opt. Call | BBB– | | 1,008,490 | |
| | 3,585 | | Palm Beach County Housing Finance Authority, Florida, Multifamily Housing Revenue Bonds, Lake Delray Apartments, Series 1999A, 6.400%, 1/01/31 (Alternative Minimum Tax) | 7/12 at 100.00 | N/R | | 3,048,254 | |
| | 3,885 | | Pine Island Community Development District, Florida, Special Assessment Bonds, Bella Collina, Series 2004, 5.750%, 5/01/35 | 5/12 at 101.00 | N/R | | 2,637,565 | |
| | 1,000 | | Sarasota County Health Facility Authority, Florida, Revenue Bonds, Sarasota-Manatee Jewish Housing Council, Inc., Series 2007, 5.750%, 7/01/45 | 7/17 at 100.00 | N/R | | 754,410 | |
| | 490 | | South Village Community Development District, Clay County, Florida, Capital Improvement Revenue Bonds, Series 2005A, 5.700%, 5/01/35 | 5/13 at 100.00 | N/R | | 371,817 | |
| | 930 | | Tolomato Community Development District, Florida, Special Assessment Bonds, Series 2006, 5.400%, 5/01/37 | 5/14 at 101.00 | N/R | | 657,705 | |
| | 1,715 | | Tolomato Community Development District, Florida, Special Assessment Bonds, Series 2007, 6.650%, 5/01/40 | 5/18 at 100.00 | N/R | | 1,147,043 | |
| | 4,485 | | Westchester Community Development District 1, Florida, Special Assessment Bonds, Series 2003, 6.125%, 5/01/35 | 5/13 at 101.00 | N/R | | 3,671,152 | |
| | 41,935 | | Total Florida | | | | 36,264,322 | |
| | | | Georgia – 1.5% (1.1% of Total Investments) | | | | | |
| | 1,000 | | Fulton County Residential Care Facilities Authority, Georgia, Revenue Bonds, Elderly Care, Lenbrook Square Project, Series 2006A, 5.125%, 7/01/37 | 7/17 at 100.00 | N/R | | 620,320 | |
| | 1,840 | | Fulton County Residential Care Facilities Authority, Georgia, Revenue Bonds, St. Anne’s Terrace, Series 2003, 7.625%, 12/01/33 | 12/13 at 102.00 | N/R | | 1,801,084 | |
| | | Nuveen Municipal High Income Opportunity Fund (continued) |
| NMZ | | Portfolio of Investments |
April 30, 2011 (Unaudited)
| | Principal | | | Optional Call | | | | |
| | Amount (000) | | Description (1) | Provisions (2) | Ratings (3) | | Value | |
| | | | Georgia (continued) | | | | | |
| $ | 2,000 | | Lavonia Hospital Authority, Georgia, Revenue Anticpation Certificates, Ty Cobb Regional Medical Center, Series 2010, 6.000%, 12/01/40 – AGM Insured (7) | 12/20 at 100.00 | AA+ | $ | 2,026,040 | |
| | 4,840 | | Total Georgia | | | | 4,447,444 | |
| | | | Guam – 0.5% (0.4% of Total Investments) | | | | | |
| | 1,445 | | Guam Government, General Obligation Bonds, 2009 Series A, 7.000%, 11/15/39 | No Opt. Call | B+ | | 1,481,284 | |
| | | | Hawaii – 0.8% (0.6% of Total Investments) | | | | | |
| | 960 | | Hawaii State Department of Budget and Finance, Private School Revenue Bonds, Montessori of Maui, Series 2007, 5.500%, 1/01/37 | 2/17 at 100.00 | N/R | | 756,134 | |
| | 1,655 | | Hawaii State Department of Budget and Finance, Special Purpose Revenue Bonds, Hawaiian Electric Company, Inc. and Subsidiary Projects, Series 2009, 6.500%, 7/01/39 | 7/19 at 100.00 | Baa1 | | 1,656,887 | |
| | 2,615 | | Total Hawaii | | | | 2,413,021 | |
| | | | Illinois – 9.3% (6.8% of Total Investments) | | | | | |
| | 1,000 | | Bolingbrook, DuPage & Will Counties, Illinois, Special Tax Revenue Bonds, Special Service Areas 2001-1, 2001-2, 2001-3, and 2002-1, Refunding Series 2007, 4.500%, 3/01/32 – NPFG Insured | 4/21 at 100.00 | Baa1 | | 767,700 | |
| | 1,000 | | CenterPoint Intermodal Center Program, Illinois, Trust Series 2004 Class A Certificates, 8.500%, 6/15/23 | 7/11 at 100.00 | N/R | | 999,480 | |
| | 900 | | Chicago, Illinois, Certificates of Participation Tax Increment Revenue Notes, Chicago/Kingsbury Redevelopment Project, Series 2004A, 6.570%, 2/15/13 | 7/11 at 100.00 | N/R | | 899,253 | |
| | 960 | | Chicago, Illinois, Certificates of Participation, Tax Increment Allocation Revenue Bonds, Diversey-Narragansett Project, Series 2006, 7.460%, 2/15/26 | 7/11 at 100.00 | N/R | | 922,656 | |
| | 1,875 | | Illinois Finance Authority, Revenue Bonds, Admiral at Lake Project, Series 2010A, 8.000%, 5/15/46 | 5/20 at 100.00 | N/R | | 1,774,519 | |
| | 1,000 | | Illinois Finance Authority, Revenue Bonds, Elmhurst Memorial Healthcare, Series 2008A, 5.625%, 1/01/37 | 1/18 at 100.00 | Baa1 | | 865,720 | |
| | 1,000 | | Illinois Finance Authority, Revenue Bonds, Midwest Regional Medical Center Galena-Stauss Hospital, Series 2006, 6.750%, 10/01/46 (5), (6) | 10/16 at 100.00 | N/R | | 656,690 | |
| | 1,000 | | Illinois Finance Authority, Revenue Bonds, Montgomery Place Project, Series 2006A, 5.750%, 5/15/38 | 5/17 at 100.00 | N/R | | 798,480 | |
| | 1,000 | | Illinois Finance Authority, Revenue Bonds, Provena Health, Series 2009A, 7.750%, 8/15/34 | 8/19 at 100.00 | BBB+ | | 1,077,700 | |
| | 2,000 | | Illinois Finance Authority, Revenue Bonds, Sherman Health Systems, Series 2007A, 5.500%, 8/01/37 | 8/17 at 100.00 | BBB | | 1,722,600 | |
| | 3,850 | | Illinois Finance Authority, Revenue Bonds, Silver Cross Hospital and Medical Centers, Series 2009, 7.000%, 8/15/44 | 8/19 at 100.00 | BBB | | 3,856,622 | |
| | 7,800 | | Illinois Health Facilities Authority, Revenue Bonds, Lake Forest Hospital, Series 2002A, 5.750%, 7/01/29 (UB) | 7/12 at 100.00 | AA+ | | 7,877,610 | |
| | 1,150 | | Lombard Public Facilities Corporation, Illinois, First Tier Conference Center and Hotel Revenue Bonds, Series 2005A-1, 7.125%, 1/01/36 | 1/16 at 100.00 | N/R | | 769,603 | |
| | 1,431 | | Lombard Public Facilities Corporation, Illinois, Third Tier Conference Center and Hotel Revenue Bonds, Series 2005C-3, 12.000%, 1/01/36 (6) | 7/18 at 100.00 | N/R | | 343,516 | |
| | 1,969 | | Plano Special Service Area 1, Illinois, Special Tax Bonds, Lakewood Springs Project, Series 2004A, 6.200%, 3/01/34 | 3/14 at 102.00 | N/R | | 1,837,077 | |
| | 996 | | Volo Village, Illinois, Special Service Area 3 Special Tax Bonds, Symphony Meadows Project 1, Series 2006, 6.000%, 3/01/36 (Mandatory put 2/29/16) | 3/16 at 102.00 | N/R | | 761,552 | |
| | 995 | | Yorkville United City Business District, Illinois, Storm Water and Water Improvement Project Revenue Bonds, Series 2007, 6.000%, 1/01/26 | 1/17 at 102.00 | N/R | | 576,304 | |
| | 950 | | Yorkville, Illinois, Special Service Area 2005-108 Assessment Bonds, Autumn Creek Project, Series 2006, 6.000%, 3/01/36 | 3/16 at 102.00 | N/R | | 702,715 | |
| | 30,876 | | Total Illinois | | | | 27,209,797 | |
| | Principal | | | Optional Call | | | | |
| | Amount (000) | | Description (1) | Provisions (2) | Ratings (3) | | Value | |
| | | | Indiana – 4.3% (3.1% of Total Investments) | | | | | |
| $ | 1,000 | | Anderson, Indiana, Multifamily Housing Revenue Bonds, Cross Lakes and Giant Oaks Apartments, Series 2011A, 7.250%, 12/01/45 | 12/20 at 100.00 | A– | $ | 1,006,420 | |
| | 6,360 | | Carmel Redevelopment District, Indiana, Tax Increment Revenue Bonds, Series 2004A, 6.650%, 1/15/24 | 7/12 at 103.00 | N/R | | 5,472,844 | |
| | 1,000 | | Indiana Bond Bank, Special Program Bonds, Hendricks Regional Health Project, Tender Option Bond Trust 10-77W, 18.453%, 4/01/30 – AMBAC Insured (IF) (7) | No Opt. Call | AA | | 865,070 | |
| | 1,290 | | Indiana Finance Authority, Revenue Bonds, Trinity Health Care Group, Tender Option Bond Trust 3611, 17.691%, 6/01/17 (IF) (7) | No Opt. Call | AA | | 727,250 | |
| | 1,250 | | Indiana Health and Educational Facilities Financing Authority, Revenue Bonds, Ascension Health, Series 2009, Trust 3301, 14.318%, 11/15/30 (IF) (7) | 11/16 at 100.00 | AA+ | | 909,875 | |
| | 2,500 | | Indiana Health Facility Financing Authority, Hospital Revenue Bonds, Community Foundation of Northwest Indiana, Series 2004A, 6.000%, 3/01/34 | 3/14 at 101.00 | BBB+ | | 2,481,325 | |
| | 200 | | Jasper County, Indiana, Economic Development Revenue Refunding Bonds, Georgia Pacific Corporation Project, Series 2000, 6.700%, 4/01/29 (Alternative Minimum Tax) | 7/11 at 100.00 | Ba2 | | 199,996 | |
| | 1,000 | | St. Joseph County, Indiana, Economic Development Revenue Bonds, Chicago Trail Village Apartments, Series 2005A, 7.500%, 7/01/35 | 7/15 at 103.00 | N/R | | 903,550 | |
| | 14,600 | | Total Indiana | | | | 12,566,330 | |
| | | | Iowa – 0.3% (0.2% of Total Investments) | | | | | |
| | 1,000 | | Iowa Finance Authority, Health Facility Revenue Bonds, Care Initiatives Project, Series 2006A, 5.500%, 7/01/25 | 7/16 at 100.00 | BB+ | | 816,570 | |
| | | | Louisiana – 5.6% (4.1% of Total Investments) | | | | | |
| | 5,000 | | Louisiana Local Government Environmental Facilities & Community Development Authority, Revenue Bonds, Westlake Chemical Corporation Project, Series 2007, 6.750%, 11/01/32 | 11/17 at 100.00 | BBB– | | 5,106,800 | |
| | 1,000 | | Louisiana Local Government Environmental Facilities and Community Development Authority, Carter Plantation Hotel Project Revenue Bonds, Series 2006A, 6.000%, 9/01/36 (6) | 9/16 at 100.00 | N/R | | 190,000 | |
| | 1,000 | | Louisiana Local Government Environmental Facilities and Community Development Authority, Revenue Bonds, CDF Healthcare of Louisiana LLC, Series 2006A, 7.000%, 6/01/36 | 6/16 at 101.00 | N/R | | 824,950 | |
| | 3,000 | | Louisiana Local Government Environmental Facilities and Community Development Authority, Revenue Bonds, Southgate Suites Hotel LLC Project, Series 2007A, 6.750%, 12/15/37 (6) | 12/17 at 100.00 | N/R | | 1,810,770 | |
| | 2,500 | | Louisiana Public Facilities Authority, Revenue Bonds, Ochsner Clinic Foundation Project, Series 2007A, 5.250%, 5/15/38 | 5/17 at 100.00 | Baa1 | | 2,063,325 | |
| | 1,590 | | Louisiana Public Facilities Authority, Revenue Bonds, Ochsner Clinic Foundation, Series 2007B, 5.500%, 5/15/47 | 5/17 at 100.00 | Baa1 | | 1,323,691 | |
| | 5,125 | | St. James Parish, Louisiana, Solid Waste Disposal Revenue Bonds, Freeport McMoran Project, Series 1992, 7.700%, 10/01/22 (Alternative Minimum Tax) | 7/11 at 100.00 | N/R | | 5,124,898 | |
| | 19,215 | | Total Louisiana | | | | 16,444,434 | |
| | | | Maine – 1.0% (0.7% of Total Investments) | | | | | |
| | 3,155 | | Portland Housing Development Corporation, Maine, Section 8 Assisted Senior Living Revenue Bonds, Avesta Housing Development Corporation, Series 2004A, 6.000%, 2/01/34 | 2/14 at 102.00 | Baa2 | | 2,898,562 | |
| | | | Maryland – 1.7% (1.3% of Total Investments) | | | | | |
| | 1,000 | | Baltimore, Maryland, Senior Lien Convention Center Hotel Revenue Bonds, Series 2006A, 5.250%, 9/01/39 – SYNCORA GTY Insured | 9/16 at 100.00 | Baa3 | | 801,480 | |
| | 2,500 | | Maryland Economic Development Corporation, Revenue Bonds, Chesapeake Bay Hyatt Conference Center, Series 2006B, 5.250%, 12/01/31 | 12/16 at 100.00 | N/R | | 1,562,750 | |
| | 2,000 | | Maryland Energy Financing Administration, Revenue Bonds, AES Warrior Run Project, Series 1995, 7.400%, 9/01/19 (Alternative Minimum Tax) | 7/11 at 100.00 | N/R | | 1,999,740 | |
| | 350 | | Maryland Health and Higher Educational Facilities Authority, Revenue Bonds, MedStar Health, Series 2004, 5.500%, 8/15/33 | 8/14 at 100.00 | A2 | | 338,622 | |
| | 435 | | Prince George’s County, Maryland, Revenue Bonds, Dimensions Health Corporation, Series 1994, 5.300%, 7/01/24 (5) | 7/11 at 100.00 | B3 | | 300,520 | |
| | 6,285 | | Total Maryland | | | | 5,003,112 | |
| | | Nuveen Municipal High Income Opportunity Fund (continued) |
| NMZ | | Portfolio of Investments |
April 30, 2011 (Unaudited)
| | Principal | | | Optional Call | | | | |
| | Amount (000) | | Description (1) | Provisions (2) | Ratings (3) | | Value | |
| | | | Massachusetts – 0.3% (0.3% of Total Investments) | | | | | |
| $ | 400 | | Massachusetts Development Finance Agency, Pioneer Valley Resource Recovery Revenue Bonds, Eco/Springfield LLC, Series 2006, 5.875%, 7/01/14 (Alternative Minimum Tax) | No Opt. Call | N/R | $ | 380,712 | |
| | 1,350 | | Massachusetts Health and Educational Facilities Authority, Revenue Bonds, Northern Berkshire Community Services Inc., Series 2004B, 6.375%, 7/01/34 (6) | 7/14 at 100.00 | CCC | | 661,095 | |
| | 1,750 | | Total Massachusetts | | | | 1,041,807 | |
| | | | Michigan – 3.8% (2.8% of Total Investments) | | | | | |
| | 1,145 | | Countryside Charter School, Berrien County, Michigan, Charter School Revenue Bonds, Series 1999, 7.000%, 4/01/29 | 7/11 at 100.00 | N/R | | 987,345 | |
| | 815 | | Countryside Charter School, Berrien County, Michigan, Charter School Revenue Bonds, Series 2000, 8.000%, 4/01/29 | 7/11 at 100.00 | N/R | | 782,808 | |
| | | | Detroit Local Development Finance Authority, Michigan, Tax Increment Bonds, Series 1998A: | | | | | |
| | 1,300 | | 5.500%, 5/01/21 | 11/11 at 100.00 | B– | | 785,408 | |
| | 15 | | 5.500%, 5/01/21 – ACA Insured | 5/21 at 100.00 | B– | | 9,062 | |
| | 1,000 | | Detroit, Michigan, Distributable State Aid General Obligation Bonds, Tender Option Bond Trust 3789, 18.649%, 5/01/18 (IF) (7) | No Opt. Call | AA | | 804,360 | |
| | | | Garden City Hospital Finance Authority, Michigan, Revenue Bonds, Garden City Hospital Obligated Group, Series 2007A: | | | | | |
| | 1,000 | | 4.875%, 8/15/27 | 8/17 at 100.00 | N/R | | 700,850 | |
| | 1,000 | | 5.000%, 8/15/38 | 8/17 at 100.00 | N/R | | 627,640 | |
| | 1,000 | | Michigan Finance Authority, Public School Academy Limited Obligation Revenue Bonds, Hope Academy Project, Series 2011, 8.125%, 4/01/41 | 4/21 at 100.00 | N/R | | 1,009,370 | |
| | 1,000 | | Michigan Public Educational Facilities Authority, Limited Obligation Revenue Bonds, Chandler Park Academy Project, Series 2008, 6.500%, 11/01/35 | 11/15 at 100.00 | BBB | | 899,900 | |
| | 1,000 | | Michigan Public Educational Facilities Authority, Limited Obligation Revenue Bonds, Richfield Public School Academy, Series 2007, 5.000%, 9/01/36 | 9/17 at 100.00 | BBB– | | 698,410 | |
| | 500 | | Michigan State Hospital Finance Authority, Revenue Bonds, Chelsea Community Hospital, Series 2005, 5.000%, 5/15/30 (Pre-refunded 5/15/15) | 5/15 at 100.00 | AAA | | 573,400 | |
| | 1,500 | | Michigan State Hospital Finance Authority, Revenue Bonds, Hills and Dales General Hospital, Series 2005A, 6.750%, 11/15/38 | 11/15 at 102.00 | N/R | | 1,253,100 | |
| | 1,000 | | Royal Oak Hospital Finance Authority, Michigan, Hospital Revenue Bonds, William Beaumont Hospital, Refunding Series 2009V, 8.250%, 9/01/39 | 9/18 at 100.00 | A1 | | 1,136,950 | |
| | 1,000 | | Summit Academy North, Michigan, Revenue Bonds, Public School Academy Series 2005, 5.500%, 11/01/30 | 11/15 at 100.00 | BB+ | | 755,960 | |
| | 13,275 | | Total Michigan | | | | 11,024,563 | |
| | | | Minnesota – 1.4% (1.1% of Total Investments) | | | | | |
| | 1,325 | | Ramsey, Anoka County, Minnesota, Charter School Lease Revenue Bonds, PACT Charter School, Series 2004A, 6.750%, 12/01/33 | 6/14 at 102.00 | N/R | | 1,198,251 | |
| | 1,275 | | St. Paul Housing and Redevelopment Authority, Minnesota, Charter School Revenue Bonds, Higher Ground Academy Charter School, Series 2004A, 6.625%, 12/01/23 | 6/14 at 102.00 | N/R | | 1,238,624 | |
| | 1,100 | | St. Paul Housing and Redevelopment Authority, Minnesota, Charter School Revenue Bonds, HOPE Community Academy Charter School, Series 2004A, 6.750%, 12/01/33 | 6/14 at 102.00 | N/R | | 932,591 | |
| | 1,000 | | St. Paul Port Authority, Minnesota, Lease Revenue Bonds, HealthEast Midway Campus, Series 2005B, 6.000%, 5/01/30 | 5/15 at 100.00 | N/R | | 890,970 | |
| | 4,700 | | Total Minnesota | | | | 4,260,436 | |
| | | | Mississippi – 0.6% (0.4% of Total Investments) | | | | | |
| | 885 | | Mississippi Home Corporation, Multifamily Housing Revenue Bonds, Tupelo Personal Care Apartments, Series 2004-2, 6.125%, 9/01/34 (Alternative Minimum Tax) | 10/19 at 101.00 | N/R | | 619,025 | |
| | 1,000 | | Warren County, Mississippi, Gulf Opportunity Zone Revenue Bonds, International Paper Company Project, Series 2008A, 6.500%, 9/01/32 | 9/18 at 100.00 | BBB | | 1,036,670 | |
| | 1,885 | | Total Mississippi | | | | 1,655,695 | |
| | Principal | | | Optional Call | | | | |
| | Amount (000) | | Description (1) | Provisions (2) | Ratings (3) | | Value | |
| | | | Missouri – 2.6% (1.9% of Total Investments) | | | | | |
| $ | 2,000 | | Branson Regional Airport Transportation Development District, Missouri, Project Revenue Bonds, Series 2007B, 6.000%, 7/01/37 (Alternative Minimum Tax) | 7/17 at 100.00 | N/R | $ | 863,200 | |
| | 1,000 | | Hanley Road Corridor Transportation Development District, Brentwood and Maplewood, Missouri, Transportation Sales Revenue Bonds, Refunding Series 2009A, 5.875%, 10/01/36 | 10/19 at 100.00 | A– | | 976,740 | |
| | 5,935 | | Missouri Environmental Improvement and Energy Resources Authority, Water Facility Revenue Bonds, Missouri-American Water Company, Series 2006, 4.600%, 12/01/36 – AMBAC Insured (Alternative Minimum Tax) (UB) | 12/16 at 100.00 | AA+ | | 5,077,571 | |
| | 795 | | Saint Louis, Missouri, Tax Increment Financing Revenue Bonds, Grace Lofts Redevelopment Projects, Series 2007A, 6.000%, 3/27/26 | 12/11 at 100.00 | N/R | | 630,387 | |
| | 9,730 | | Total Missouri | | | | 7,547,898 | |
| | | | Montana – 1.7% (1.3% of Total Investments) | | | | | |
| | 2,700 | | Montana Board of Investments, Exempt Facility Revenue Bonds, Stillwater Mining Company, Series 2000, 8.000%, 7/01/20 (Alternative Minimum Tax) | 7/11 at 100.50 | B+ | | 2,704,671 | |
| | 2,600 | | Montana Board of Investments, Resource Recovery Revenue Bonds, Yellowstone Energy LP, Series 1993, 7.000%, 12/31/19 (Alternative Minimum Tax) | No Opt. Call | N/R | | 2,436,018 | |
| | 5,300 | | Total Montana | | | | 5,140,689 | |
| | | | Nebraska – 2.9% (2.1% of Total Investments) | | | | | |
| | 6,485 | | Omaha Public Power District, Nebraska, Separate Electric System Revenue Bonds, Nebraska City 2, Series 2006A, 19.815%, 8/01/40 – AMBAC Insured (IF) | 2/17 at 100.00 | AA+ | | 8,573,819 | |
| | | | Nevada – 0.5% (0.4% of Total Investments) | | | | | |
| | 1,410 | | Clark County, Nevada, Local Improvement Bonds, Mountain’s Edge Special Improvement District 142, Series 2003, 6.375%, 8/01/23 | 8/16 at 100.00 | N/R | | 1,403,317 | |
| | 4,500 | | Director of Nevada State Department of Business and Industry, Revenue Bonds, Las Vegas Monorail Project, Second Tier, Series 2000, 7.375%, 1/01/40 (6) | 1/12 at 100.00 | N/R | | 7,875 | |
| | 5,910 | | Total Nevada | | | | 1,411,192 | |
| | | | New Jersey – 3.3% (2.4% of Total Investments) | | | | | |
| | 1,500 | | New Jersey Economic Development Authority, Cigarette Tax Revenue Bonds, Series 2004, 5.750%, 6/15/29 | 6/14 at 100.00 | BBB | | 1,369,170 | |
| | 1,660 | | New Jersey Economic Development Authority, Special Facilities Revenue Bonds, Continental Airlines Inc., Series 1999, 6.250%, 9/15/29 (Alternative Minimum Tax) | 9/11 at 100.00 | B | | 1,521,008 | |
| | 500 | | New Jersey Economic Development Authority, Special Facilities Revenue Bonds, Continental Airlines Inc., Series 2000, 7.000%, 11/15/30 (Alternative Minimum Tax) | 5/11 at 101.00 | B | | 489,830 | |
| | 1,000 | | New Jersey Economic Development Authority, Student Housing Revenue Bonds, Provident Group-Montclair Properties LLC, Montclair State University Student Housing Project, Series 2010A, 5.875%, 6/01/42 | 6/20 at 100.00 | Baa3 | | 898,640 | |
| | 600 | | New Jersey Educational Facilities Authority, Revenue Refunding Bonds, University of Medicine and Dentistry of New Jersey, Series 2009B, 7.500%, 12/01/32 | 6/19 at 100.00 | Baa1 | | 664,950 | |
| | 2,000 | | New Jersey Health Care Facilities Financing Authority, New Jersey, Revenue Bonds, Saint Peters University Hospital, Series 2007, 5.750%, 7/01/37 | 7/18 at 100.00 | BBB– | | 1,714,360 | |
| | 2,000 | | New Jersey Health Care Facilities Financing Authority, Revenue Bonds, Saint Joseph’s Healthcare System Obligated Group Issue, Series 2008, 6.625%, 7/01/38 | 7/18 at 100.00 | BBB– | | 1,961,500 | |
| | 1,000 | | New Jersey Higher Education Assistance Authority, Student Loan Revenue Bonds, Series 2008A, 6.125%, 6/01/30 – AGC Insured (Alternative Minimum Tax) | 6/18 at 100.00 | AA+ | | 1,034,150 | |
| | 10,260 | | Total New Jersey | | | | 9,653,608 | |
| | | Nuveen Municipal High Income Opportunity Fund (continued) |
| NMZ | | Portfolio of Investments |
April 30, 2011 (Unaudited)
| | Principal | | | Optional Call | | | | |
| | Amount (000) | | Description (1) | Provisions (2) | Ratings (3) | | Value | |
| | | | New York – 2.2% (1.6% of Total Investments) | | | | | |
| $ | 1,000 | | Brooklyn Areba Local Development Corporation, New York, Payment in Lieu of Taxes Revenue Bonds, Barclays Center Project, Series 2009, 6.375%, 7/15/43 | No Opt. Call | BBB– | $ | 995,000 | |
| | | | New York City Industrial Development Agency, New York, Civic Facility Revenue Bonds, Bronx Parking Development Company, LLC Project, Series 2007: | | | | | |
| | 1,000 | | 5.750%, 10/01/37 | 10/17 at 100.00 | N/R | | 624,610 | |
| | 3,000 | | 5.875%, 10/01/46 | 10/17 at 102.00 | N/R | | 1,874,130 | |
| | 1,700 | | New York City Industrial Development Agency, New York, Special Facilities Revenue Bonds, American Airlines Inc., Series 1994, 6.900%, 8/01/24 (Alternative Minimum Tax) | 7/11 at 100.00 | CCC+ | | 1,434,613 | |
| | 1,375 | | New York Liberty Development Corporation, Second Priority Liberty Revenue Refunding Bonds, Bank of America Tower at One Bryant Park Project, Series 2010, 6.375%, 7/15/49 | 1/20 at 100.00 | BBB | | 1,380,844 | |
| | 265 | | Port Authority of New York and New Jersey, Special Project Bonds, JFK International Air Terminal LLC Project, Eigth Series 2010, 6.000%, 12/01/42 | 12/20 at 100.00 | BBB– | | 254,983 | |
| | 8,340 | | Total New York | | | | 6,564,180 | |
| | | | North Carolina – 2.4% (1.8% of Total Investments) | | | | | |
| | 1,260 | | Charlotte-Mecklenberg Hospital Authority, North Carolina, Carolinas HealthCare System Revenue Bonds, Series 2008, Trust 1149, 13.283%, 7/15/32 (IF) | 1/18 at 100.00 | AA– | | 987,727 | |
| | 5,500 | | North Carolina Capital Facilities Finance Agency, Solid Waste Facilities Revenue Bonds, Liberty Tire Services of North Carolina LLC, Series 2004A, 6.750%, 7/01/29 | 7/12 at 106.00 | N/R | | 4,710,914 | |
| | 960 | | North Carolina Capital Facilities Financing Agency, Revenue Bonds, Duke University, Series 2008, Tender Option Bonds Trust 3248, 26.629%, 10/01/21 (IF) | 10/16 at 100.00 | AA+ | | 1,481,587 | |
| | 7,720 | | Total North Carolina | | | | 7,180,228 | |
| | | | Ohio – 4.5% (3.3% of Total Investments) | | | | | |
| | | | Buckeye Tobacco Settlement Financing Authority, Ohio, Tobacco Settlement Asset-Backed Revenue Bonds, Senior Lien, Series 2007A-2: | | | | | |
| | 315 | | 5.125%, 6/01/24 | 6/17 at 100.00 | Baa3 | | 243,388 | |
| | 4,375 | | 5.750%, 6/01/34 | 6/17 at 100.00 | Baa3 | | 3,014,374 | |
| | 1,855 | | 5.875%, 6/01/47 | 6/17 at 100.00 | Baa3 | | 1,251,550 | |
| | 5,000 | | Buckeye Tobacco Settlement Financing Authority, Ohio, Tobacco Settlement Asset-Backed Revenue Bonds, Senior Lien, Series 2007A-3, 0.000%, 6/01/37 | 6/22 at 100.00 | Baa3 | | 3,181,450 | |
| | 2,850 | | Cleveland-Cuyahoga County Port Authority, Ohio, Development Revenue Bonds, Bond Fund Program – Garfield Heights Project, Series 2004D, 5.250%, 5/15/23 | 5/14 at 102.00 | BBB– | | 2,304,596 | |
| | 1,270 | | Medina County Port Authority, Ohio, Development Revenue Bond, Fiber Network Project, Series 2010B, 6.000%, 12/01/30 | 12/20 at 100.00 | A+ | | 1,288,872 | |
| | 500 | | Ohio, Environmental Facilities Revenue Bonds, Ford Motor Company, Series 2005, 5.750%, 4/01/35 (Alternative Minimum Tax) | 4/15 at 100.00 | Ba3 | | 463,260 | |
| | 1,000 | | State of Ohio, Solid Waste Disposal Revenue Bonds (USG Corporation Project) Series 1997 Remarketed, 5.600%, 8/01/32 (Alternative Minimum Tax) | 8/11 at 100.00 | B | | 792,830 | |
| | 4,000 | | Western Reserve Port Authority, Ohio, Solid Waste Facility Revenue Bonds, Central Waste Inc., Series 2007A, 6.350%, 7/01/27 (Alternative Minimum Tax) (5), (6) | 7/17 at 102.00 | N/R | | 728,000 | |
| | 21,165 | | Total Ohio | | | | 13,268,320 | |
| | | | Oklahoma – 0.8% (0.6% of Total Investments) | | | | | |
| | 940 | | Okeene Municipal Hospital and Schallmo Authority, Oklahoma, Revenue Bonds, Series 2006, 7.000%, 1/01/35 | 1/16 at 101.00 | N/R | | 783,058 | |
| | 1,500 | | Tulsa Municipal Airport Trust, Oklahoma, Revenue Refunding Bonds, American Airlines Inc., Series 2004A, 7.750%, 6/01/35 (Mandatory put 12/01/14) | No Opt. Call | Caa2 | | 1,543,845 | |
| | 2,440 | | Total Oklahoma | | | | 2,326,903 | |
| | | | Pennsylvania – 1.6% (1.2% of Total Investments) | | | | | |
| | 800 | | Allegheny Country Industrial Development Authority, Allegheny County, Pennsylvania, Environmental Improvement Revenue Bonds, United States Steel Corporation Project, Refunding Series 2009, 6.875%, 5/01/30 | 11/19 at 100.00 | BB | | 824,624 | |
| | 375 | | Allentown Area Hospital Authority, Pennsylvania, Revenue Bonds, Sacred Heart Hospital, Series 2005, 6.000%, 11/15/16 | No Opt. Call | Ca | | 351,619 | |
| | Principal | | | Optional Call | | | | |
| | Amount (000) | | Description (1) | Provisions (2) | Ratings (3) | | Value | |
| | | | Pennsylvania (continued) | | | | | |
| $ | 965 | | Berks County Industrial Development Authority, Pennsylvania, First Mortgage Revenue Bonds, One Douglassville Properties Project, Series 2007A, 6.125%, 11/01/34 (Alternative Minimum Tax) | 11/17 at 101.00 | N/R | $ | 769,481 | |
| | 2,000 | | Chester County Health and Education Facilities Authority, Pennsylvania, Revenue Bonds, Immaculata University, Series 2005, 5.750%, 10/15/37 | 10/15 at 102.00 | N/R | | 1,700,620 | |
| | 400 | | Chester County Industrial Development Authority, Pennsylvania, Avon Grove Charter School Revenue Bonds, Series 2007A, 6.375%, 12/15/37 | 12/17 at 100.00 | BB+ | | 332,740 | |
| | 1,000 | | Pennsylvania Economic Development Finance Authority, Solid Waste Disposal Revenue Bonds (USG Corporation Project) Series 1999, 6.000%, 6/01/31 (Alternative Minimum Tax) | 6/11 at 100.00 | B | | 844,120 | |
| | 5,540 | | Total Pennsylvania | | | | 4,823,204 | |
| | | | Puerto Rico – 1.3% (1.0% of Total Investments) | | | | | |
| | 4,000 | | Puerto Rico Aqueduct and Sewerage Authority, Revenue Bonds, Senior Lien Series 2008A, 6.000%, 7/01/38 | 7/18 at 100.00 | Baa1 | | 3,826,920 | |
| | | | Rhode Island – 1.8% (1.3% of Total Investments) | | | | | |
| | 1,000 | | Rhode Island Student Loan Authority, Student Loan Program Revenue Bonds, Series 2008A, 6.750%, 12/01/28 (Alternative Minimum Tax) | 12/17 at 100.00 | A | | 1,033,120 | |
| | 4,835 | | Rhode Island Tobacco Settlement Financing Corporation, Tobacco Settlement Asset-Backed Bonds, Series 2002A, 6.250%, 6/01/42 | 6/12 at 100.00 | BBB | | 4,182,467 | |
| | 5,835 | | Total Rhode Island | | | | 5,215,587 | |
| | | | South Carolina – 1.0% (0.8% of Total Investments) | | | | | |
| | 4,000 | | Lancaster County, South Carolina, Assessment Bonds, Edgewater II Improvement District, Series 2007A, 7.750%, 11/01/39 (5), (6) | 11/17 at 100.00 | N/R | | 2,395,320 | |
| | 625 | | South Carolina Jobs-Economic Development Authority, Hospital Revenue Bonds, Palmetto Health, Refunding Series 2011A, 6.500%, 8/01/39 (WI/DD, Settling
5/02/11) – AGM Insured | 8/21 at 100.00 | AA+ | | 636,625 | |
| | 4,625 | | Total South Carolina | | | | 3,031,945 | |
| | | | Tennessee – 4.0% (2.9% of Total Investments) | | | | | |
| | 2,500 | | Johnson City Health and Educational Facilities Board, Tennessee, Hospital Revenue Bonds, Mountain States Health Alliance, Refunding Series 2010A, 6.500%, 7/01/38 | 7/20 at 100.00 | BBB+ | | 2,459,000 | |
| | 2,000 | | Sullivan County Health Educational and Housing Facilities Board, Tennessee, Revenue Bonds, Wellmont Health System, Series 2006C, 5.250%, 9/01/26 | 9/16 at 100.00 | BBB+ | | 1,895,500 | |
| | | | Sumner County Health, Educational, and Housing Facilities Board, Tennessee, Revenue Refunding Bonds, Sumner Regional Health System Inc., Series 2007: | | | | | |
| | 2,000 | | 5.500%, 11/01/37 (5), (6) | 11/17 at 100.00 | N/R | | 100,200 | |
| | 500 | | 5.500%, 11/01/46 (5), (6) | 11/17 at 100.00 | N/R | | 25,050 | |
| | 1,000 | | The Tennessee Energy Acquisition Corporation, Gas Revenue Bonds, Series 2006A, 5.250%, 9/01/23 | No Opt. Call | Ba3 | | 962,400 | |
| | 6,101 | | The Tennessee Energy Acquisition Corporation, Gas Revenue Bonds, Series 2006B, 5.625%, 9/01/26 | No Opt. Call | N/R | | 5,601,389 | |
| | 965 | | Wilson County Health and Educational Facilities Board, Tennessee, Senior Living Revenue Bonds, Rutland Place, Series 2007A, 6.300%, 7/01/37 (5) | 7/17 at 100.00 | N/R | | 608,828 | |
| | 15,066 | | Total Tennessee | | | | 11,652,367 | |
| | | | Texas – 12.2% (8.9% of Total Investments) | | | | | |
| | 2,000 | | Austin Convention Enterprises Inc., Texas, Convention Center Hotel Revenue Bonds, Second Tier Series 2006B, 5.750%, 1/01/34 | 1/17 at 100.00 | Ba2 | | 1,663,480 | |
| | 1,800 | | Austin Convention Enterprises Inc., Texas, Convention Center Hotel Revenue Bonds, Third Tier Series 2001C, 9.750%, 1/01/26 | 7/11 at 100.00 | N/R | | 1,790,802 | |
| | 10 | | Brazos River Authority, Texas, Pollution Control Revenue Refunding Bonds, TXU Electric Company, Series 2001C, 5.750%, 5/01/36 (Mandatory put 11/01/11) (Alternative Minimum Tax) | No Opt. Call | CC | | 9,796 | |
| | 700 | | Brazos River Authority, Texas, Pollution Control Revenue Refunding Bonds, TXU Electric Company, Series 2001D, 8.250%, 5/01/33 (Alternative Minimum Tax) | 7/18 at 100.00 | CCC | | 302,281 | |
| | 1,000 | | Clifton Higher Education Finance Corporation, Texas, Education Revenue Bonds, Uplift Education Charter School, Series 2010A, 6.000%, 12/01/30 | 12/20 at 100.00 | BBB– | | 865,560 | |
| | | Nuveen Municipal High Income Opportunity Fund (continued) |
| NMZ | | Portfolio of Investments |
April 30, 2011 (Unaudited)
| | Principal | | | Optional Call | | | | |
| | Amount (000) | | Description (1) | Provisions (2) | Ratings (3) | | Value | |
| | | | Texas (continued) | | | | | |
| $ | 2,000 | | Clifton Higher Education Finance Corporation, Texas, Education Revenue Bonds, Tejano Center for Community Concerns, Inc.-Raul Yzaguirre School for Success, Refunding Series 2009A, 9.000%, 2/15/38 | No Opt. Call | BBB– | $ | 2,149,360 | |
| | 1,750 | | Dallas-Ft. Worth International Airport Facility Improvement Corporation, Texas, Revenue Bonds, American Airlines Inc., Series 2007, 5.500%, 11/01/30 (Alternative Minimum Tax) | 11/12 at 100.00 | CCC+ | | 1,184,453 | |
| | | | Decatur Hospital Authority, Texas, Revenue Bonds, Wise Regional Health System, Series 2004A: | | | | | |
| | 1,840 | | 7.000%, 9/01/25 | 9/14 at 100.00 | N/R | | 1,794,368 | |
| | 6,600 | | 7.125%, 9/01/34 | 9/14 at 100.00 | N/R | | 6,240,366 | |
| | 585 | | Gulf Coast Industrial Development Authority, Texas, Solid Waste Disposal Revenue Bonds, Citgo Petroleum Corporation Project, Series 1998, 8.000%, 4/01/28 (Alternative Minimum Tax) | 4/12 at 100.00 | Ba2 | | 588,726 | |
| | 2,045 | | Harris County-Houston Sports Authority, Texas, Senior Lien Revenue Bonds, Series 2001G, 5.250%, 11/15/30 – NPFG Insured | 11/11 at 100.00 | Baa1 | | 1,559,742 | |
| | 1,000 | | Heart of Texas Education Finance Corporation, Texas, Gateway Charter Academy, Series 2006A, 6.000%, 2/15/36 | 8/16 at 100.00 | N/R | | 800,030 | |
| | | | Houston, Texas, Airport System Special Facilities Revenue Bonds, Continental Air Lines Inc., Series 2001E: | | | | | |
| | 600 | | 7.375%, 7/01/22 (Alternative Minimum Tax) | 7/11 at 101.00 | B3 | | 602,538 | |
| | 975 | | 6.750%, 7/01/29 (Alternative Minimum Tax) | 7/11 at 101.00 | B3 | | 951,980 | |
| | 1,000 | | La Vernia Education Financing Corporation, Texas, Charter School Revenue Bonds, Riverwalk Education Foundation, Series 2007A, 5.450%, 8/15/36 | 8/11 at 100.00 | N/R | | 747,350 | |
| | 2,250 | | North Texas Tollway Authority, Special Projects System Revenue Bonds, Tender Option Bond Trust 11946, 19.470%, 3/01/19 (IF) | 9/21 at 100.00 | AA | | 2,441,520 | |
| | 2,000 | | Richardson Hospital Authority, Texas, Revenue Bonds, Richardson Regional Medical Center, Series 2004, 5.875%, 12/01/24 | 12/13 at 100.00 | Baa2 | | 1,949,700 | |
| | 590 | | Rio Grande Valley Health Facilities Development Corporation, Texas, Hospital Revenue Bonds, Valley Baptist Medical Center Project, Series 1992A, 6.375%, 8/01/22 – NPFG Insured | 8/11 at 100.00 | Baa1 | | 571,769 | |
| | 2,000 | | Tarrant County Cultural and Educational Facilities Finance Corporation, Texas, Revenue Bonds, Texas Health Resources Project, Trust 1031, 17.466%, 2/15/30 (IF) | 2/17 at 100.00 | AA– | | 1,310,380 | |
| | 810 | | Texas Private Activity Bond Surface Transportation Corporation, Senior Lien Revenue Bonds, NTE Mobility Partners LLC North Tarrant Express Managed Lanes Project, Series 2009, 6.875%, 12/31/39 | 12/19 at 100.00 | Baa2 | | 833,684 | |
| | 5,500 | | Texas Private Activity Bond Surface Transportation Corporation, Senior Lien Revenue Bonds, LBJ Infrastructure Group LLC IH-635 Managed Lanes Project, Series 2010, 7.000%, 6/30/40 | 6/20 at 100.00 | Baa3 | | 5,622,704 | |
| | 1,000 | | Texas Public Finance Authority, Charter School Finance Corporation Revenue Bonds, Cosmos Foundation Inc., Series 2007A, 5.375%, 2/15/37 | 2/15 at 100.00 | BBB | | 813,190 | |
| | 340 | | Trinity River Authority of Texas, Pollution Control Revenue Refunding Bonds, TXU Electric Company, Series 2003, 6.250%, 5/01/28 (Alternative Minimum Tax) | 5/13 at 101.00 | CC | | 117,858 | |
| | 1,000 | | Tyler Health Facilities Development Corporation, Texas, Hospital Revenue Bonds, East Texas Medical Center Regional Healthcare System, Series 2007A, 5.250%, 11/01/32 | 11/17 at 100.00 | Baa2 | | 833,050 | |
| | 39,395 | | Total Texas | | | | 35,744,687 | |
| | | | Vermont – 0.4% (0.3% of Total Investments) | | | | | |
| | 1,155 | | Vermont Educational and Health Buildings Financing Agency, Revenue Bonds, Vermont Law School Project, Series 2011A, 6.250%, 1/01/41 | 1/21 at 100.00 | Baa2 | | 1,134,983 | |
| | | | Virgin Islands – 2.4% (1.7% of Total Investments) | | | | | |
| | 420 | | Virgin Islands Public Finance Authority, Matching Fund Revenue Loan Note – Diageo Project, Series 2009A, 6.750%, 10/01/37 | 10/19 at 100.00 | BBB | | 435,343 | |
| | 5,000 | | Virgin Islands Public Finance Authority, Revenue Bonds, Refinery Project – Hovensa LLC, Series 2003, 6.125%, 7/01/22 (Alternative Minimum Tax) | 1/14 at 100.00 | Baa3 | | 4,669,650 | |
| | 2,000 | | Virgin Islands Public Finance Authority, Senior Secured Lien Revenue Bonds, Refinery Project – Hovensa LLC, Series 2004, 5.875%, 7/01/22 | 7/14 at 100.00 | Baa3 | | 1,829,540 | |
| | 7,420 | | Total Virgin Islands | | | | 6,934,533 | |
| | Principal | | | Optional Call | | | | |
| | Amount (000) | | Description (1) | Provisions (2) | Ratings (3) | | Value | |
| | | | Virginia – 0.8% (0.6% of Total Investments) | | | | | |
| $ | 1,000 | | Giles County Industrial Development Authority, Virginia, Exempt Facility Revenue Bonds, Hoechst Celanese Project, Series 1996, 6.450%, 5/01/26 | 7/11 at 100.00 | B+ | $ | 999,900 | |
| | 9,400 | | Metropolitan Washington Airports Authority, Virginia, Dulles Toll Road Revenue Bonds, Capital Appriciation Series 2009B-2, 0.000%, 10/01/38 – AGC Insured | No Opt. Call | BBB+ | | 1,405,958 | |
| | 10,400 | | Total Virginia | | | | 2,405,858 | |
| | | | Washington – 2.8% (2.0% of Total Investments) | | | | | |
| | 500 | | FYI Properties, Washington, Lease Revenue Bonds, Washington State Department of Information Services Project, Tender Option Bond Trust 11-14W-B, 18.924%, 6/01/39 (IF), (7) | 6/19 at 100.00 | AA | | 520,700 | |
| | | | Vancouver Downtown Redevelopment Authority, Washington, Revenue Bonds, Conference Center Project, Series 2003A: | | | | | |
| | 1,780 | | 6.000%, 1/01/28 – ACA Insured | 1/14 at 100.00 | N/R | | 1,220,706 | |
| | 4,745 | | 6.000%, 1/01/34 – ACA Insured | 1/14 at 100.00 | N/R | | 3,090,085 | |
| | 2,660 | | 5.250%, 1/01/34 – ACA Insured | 1/14 at 100.00 | N/R | | 1,553,094 | |
| | 1,000 | | Washington State Economic Development Finance Authority, Revenue Bonds, Coeur D’Alene Fiber Project, Series 2007G, 7.000%, 12/01/27 (Alternative Minimum Tax) (5), (6) | 12/17 at 100.00 | N/R | | 250,000 | |
| | 2,000 | | Washington State Health Care Facilities Authority, Revenue Bonds, Northwest Hospital and Medical Center of Seattle, Series 2007, 5.700%, 12/01/32 | No Opt. Call | N/R | | 1,547,100 | |
| | 12,685 | | Total Washington | | | | 8,181,685 | |
| | | | West Virginia – 0.3% (0.2% of Total Investments) | | | | | |
| | 500 | | Ohio County Commission, West Virginia, Special District Excise Tax Revenue Bonds, Fort Henry Economic Development, Series 2006B, 5.625%, 3/01/36 | 3/16 at 100.00 | BBB | | 464,950 | |
| | 500 | | Ohio County Commission, West Virginia, Tax Increment Revenue Bonds, Fort Henry Centre Financing District, Series 2007A, 5.850%, 6/01/34 | No Opt. Call | N/R | | 431,030 | |
| | 1,000 | | Total West Virginia | | | | 895,980 | |
| | | | Wisconsin – 5.6% (4.1% of Total Investments) | | | | | |
| | 550 | | Lac Courte Oreilles Band of Lake Superior Chippewa Indians, Wisconsin, Revenue Bonds, Series 2003A, 7.750%, 6/01/16 (Pre-refunded 12/01/14) | 12/14 at 101.00 | N/R (4) | | 683,375 | |
| | 1,000 | | Lac Courte Oreilles Band of Lake Superior Chippewa Indians, Wisconsin, Revenue Bonds, Series 2006, 7.000%, 12/01/26 | 12/18 at 102.00 | N/R | | 900,550 | |
| | 2,210 | | Wisconsin Health and Educational Facilities Authority, Revenue Bonds, Aurora Health Care Inc., Series 1999A, 5.600%, 2/15/29 – ACA Insured | 7/11 at 100.00 | A3 | | 2,199,944 | |
| | 1,500 | | Wisconsin Health and Educational Facilities Authority, Revenue Bonds, Marshfield Clinic, Series 1997, 5.750%, 2/15/27 – NPFG Insured | 8/11 at 100.00 | Baa1 | | 1,461,915 | |
| | 1,000 | | Wisconsin Health and Educational Facilities Authority, Revenue Bonds, Southwest Health Center Inc., Series 2004A, 6.250%, 4/01/34 | 4/14 at 100.00 | N/R | | 903,880 | |
| | 1,000 | | Wisconsin Health and Educational Facilities Authority, Revenue Bonds, ThedaCare, Inc., Series 2009A, 5.500%, 12/15/38 | 12/19 at 100.00 | A1 | | 961,520 | |
| | | | Wisconsin Health and Educational Facilities Authority, Revenue Bonds, Wheaton Franciscan Healthcare System, Series 2006: | | | | | |
| | 5,995 | | 5.250%, 8/15/26 (UB) | 8/16 at 100.00 | BBB+ | | 5,466,721 | |
| | 4,500 | | 5.250%, 8/15/34 (UB) | 8/16 at 100.00 | BBB+ | | 3,872,475 | |
| | 17,755 | | Total Wisconsin | | | | 16,450,380 | |
| | 458,692 | | Total Long-Term Investments (cost $416,907,668) – 130.3% (95.7% of Total Investments) | | | | 382,542,521 | |
| | | | Short-Term Investments – 5.8% (4.3% of Total Investments) | | | | | |
| | | | California – 3.5% (2.6% of Total Investments) | | | | | |
| | 10,245 | | California State University, Systemwide Revenue Bonds, Tender Option Bond Trust 4696, Variable Rate Demand Revenue Obligations, 0.380%, 11/01/35 – AMBAC Insured (8) | 5/15 at 100.00 | A-1 | | 10,245,000 | |
| | | Nuveen Municipal High Income Opportunity Fund (continued) |
| NMZ | | Portfolio of Investments |
April 30, 2011 (Unaudited)
| | Principal Amount (000) | | Description (1) | Optional Call Provisions (2) | Ratings (3) | | Value | |
| | | | Short-Term Investments (continued) | | | | | |
| | | | Texas – 2.3% (1.7% of Total Investments) | | | | | |
| $ | 6,750 | | North Texas Tollway Authority, Special Projects System Revenue Bonds, Tender Option Bond Trust 11946, Variable Rate Demand Revenue Obligations, 0.260%, 9/01/41 (8) | 9/38 at 100.00 | A-1 | $ | 6,750,000 | |
| | 16,995 | | Total Short-Term Investments (cost $16,995,000) | | | | 16,995,000 | |
| $ | 475,687 | | Total Investments (cost $433,902,668) – 136.1% | | | | 399,537,521 | |
| | | | Floating Rate Obligations – (6.2)% | | | | (18,170,000 | ) |
| | | | Other Assets Less Liabilities – 2.5% (9) | | | | 7,153,061 | |
| | | | Auction Rate Preferred Shares, at Liquidation Value – (32.4)% (10) | | | | (95,000,000 | ) |
| | | | Net Assets Applicable to Common Shares – 100% | | | $ | 293,520,582 | |
Investments in Derivatives
Swaps outstanding at April 30, 2011:
| | | | Fund | | | | | | Fixed Rate | | | | | | Unrealized | |
| | Notional | | Pay/Receive | | Floating Rate | | Fixed Rate | | Payment | | Effective | | Termination | | Appreciation | |
| Counterparty | Amount | | Floating Rate | | Index | | (Annualized | ) | Frequency | | Date (11 | ) | Date | | (Depreciation | ) |
| Barclays Bank PLC | $50,000,000 | | Receive | | 1-Month USD-LIBOR | | 1.333 | % | Monthly | | 4/25/11 | | 4/25/14 | $ | (207,614 | ) |
| Barclays Bank PLC | 2,500,000 | | Receive | | 3-Month USD-LIBOR | | 4.720 | | Semi-Annually | | 5/25/11 | | 5/25/40 | | (233,089 | ) |
| JPMorgan | 4,000,000 | | Receive | | 3-Month USD-LIBOR | | 4.783 | | Semi-Annually | | 5/05/11 | | 5/05/40 | | (426,076 | ) |
| | | | | | | | | | | | | | | $ | (866,779 | ) |
| (1) | | All percentages shown in the Portfolio of Investments are based on net assets applicable to Common shares unless otherwise noted. |
| (2) | | Optional Call Provisions: Dates (month and year) and prices of the earliest optional call or redemption. There may be other call provisions at varying prices at later dates. Certain mortgage-backed securities may be subject to periodic principal paydowns. |
| (3) | | Ratings: Using the highest of Standard & Poor’s Group (“Standard & Poor’s”), Moody’s Investor Service, Inc. (“Moody’s”) or Fitch, Inc. (“Fitch”) rating. |
| | | Ratings below BBB by Standard & Poor’s, Baa by Moody’s or BBB by Fitch are considered to be below investment grade. Holdings designated N/R are not rated by any of these national rating agencies. |
| (4) | | Backed by an escrow or trust containing sufficient U.S. Government or U.S. Government agency securities, which ensure the timely payment of principal and interest. Such investments are normally considered to be equivalent to AAA rated securities. |
| (5) | | For fair value measurement disclosure purposes, investment categorized as Level 3. See Notes to Financial Statements, Footnote 1 – General Information and Significant Accounting Policies, Investment Valuation for more information. |
| (6) | | At or subsequent to the end of the reporting period, this security is non-income producing. Non-income producing security, in the case of a bond, generally denotes that the issuer has (1) defaulted on the payment of principal or interest, (2) is under the protection of the Federal Bankruptcy Court or (3) the Fund’s Adviser has concluded that the issue is not likely to meet its future interest payment obligations and has directed the Fund’s custodian to cease accruing additional income on the Fund’s records. |
| (7) | | Investment, or portion of investment, has been pledged to collateralize the net payment obligations for investments in derivatives and/or inverse floating rate transactions. |
| (8) | | Investment has a maturity of more than one year, but has variable rate and demand features which qualify it as a short-term investment. The rate disclosed is that in effect at the end of the reporting period. This rate changes periodically based on market conditions or a specified market index. |
| (9) | | Other Assets Less Liabilities include the Value and/or the Unrealized Appreciation/Depreciation of derivative instruments as listed within Investments in Derivatives. |
| (10) | | Auction Rate Preferred Shares, at Liquidation Value as a percentage of Total Investments are 23.8%. |
| (11) | | Effective date represents the date on which both the Fund and Counterparty commence interest payment accruals on each forward interest rate swap contract. |
| N/R | | Not rated. |
| WI/DD | | Purchased on a when-issued or delayed delivery basis. |
| (ETM) | | Escrowed to maturity. |
| (IF) | | Inverse floating rate investment. |
| (UB) | | Underlying bond of an inverse floating rate trust reflected as a financing transaction. See Notes to Financial Statements, Footnote 1 – General Information and Significant Accounting Policies, Inverse Floating Rate Securities for more information. |
| USD-LIBOR | | United States Dollar-London Inter-Bank Offered Rate |
See accompanying notes to financial statements.
| | | Nuveen Municipal High Income Opportunity Fund 2 |
| NMD | | Portfolio of Investments |
| | | April 30, 2011 (Unaudited) |
| | Principal | | | Optional Call | | | | |
| | Amount (000) | | Description (1) | Provisions (2) | Ratings (3) | | Value | |
| | | | Alabama – 1.7% (1.5% of Total Investments) | | | | | |
| $ | 2,290 | | Birmingham Special Care Facilities Financing Authority, Alabama, Revenue Bonds, Baptist Health System Inc., Series 2005A, 5.250%, 11/15/20 | 11/15 at 100.00 | Baa2 | $ | 2,259,543 | |
| | 1,000 | | Phenix City Industrial Development Board, Alabama, Environmental Improvement Revenue Bonds, MeadWestvaco Corporation, Series 2002A, 6.350%, 5/15/35 (Alternative Minimum Tax) | 5/12 at 100.00 | BBB | | 964,430 | |
| | 3,290 | | Total Alabama | | | | 3,223,973 | |
| | | | Arizona – 4.8% (4.1% of Total Investments) | | | | | |
| | 1,000 | | Estrella Mountain Ranch Community Facilities District, Goodyear, Arizona, General Obligation Bonds, Series 2007, 6.200%, 7/15/32 | 7/17 at 100.00 | N/R | | 888,990 | |
| | 85 | | Pima County Industrial Development Authority, Arizona, Choice Education and Development Charter School Revenue Bonds, Series 2006, 6.000%, 6/01/16 | No Opt. Call | N/R | | 82,677 | |
| | 500 | | Pima County Industrial Development Authority, Arizona, Education Revenue Bonds Legacy Traditional School Project, Series 2009, 8.500%, 7/01/39 | No Opt. Call | N/R | | 516,510 | |
| | 825 | | Pima County Industrial Development Authority, Arizona, Education Revenue Bonds, Paradise Education Center Project, Series 2010, 6.000%, 6/01/40 | 6/19 at 100.00 | BBB– | | 676,005 | |
| | 2,575 | | Quechan Indian Tribe of the Fort Yuma Reservation, Arizona, Government Project Bonds, Series 2008, 7.000%, 12/01/27 | 12/17 at 102.00 | N/R | | 2,379,017 | |
| | 4,325 | | Salt Verde Financial Corporation, Arizona, Senior Gas Revenue Bonds, Citigroup Energy Inc Prepay Contract Obligations, Series 2007, 5.000%, 12/01/37 | No Opt. Call | A | | 3,598,961 | |
| | 1,000 | | Yuma County Industrial Development Authority, Arizona, Exempt Revenue Bonds, Far West Water & Sewer Inc. Refunding, Series 2007A, 6.375%, 12/01/37 (Alternative Minimum Tax) | 12/17 at 100.00 | N/R | | 858,290 | |
| | 10,310 | | Total Arizona | | | | 9,000,450 | |
| | | | California – 13.8% (11.8% of Total Investments) | | | | | |
| | 1,470 | | Bay Area Toll Authority, California, Revenue Bonds, San Francisco Bay Area Toll Bridge, Tender Option Bond Trust 2985, 17.267%, 4/01/16 (IF) | No Opt. Call | AA | | 1,434,103 | |
| | 2,000 | | California Educational Facilities Authority, Revenue Bonds, Dominican University, Series 2006, 5.000%, 12/01/36 | 12/16 at 100.00 | Baa3 | | 1,548,180 | |
| | 565 | | California Housing Finance Agency, California, Home Mortgage Revenue Bonds, Series 2008B, 5.000%, 2/01/28 (Alternative Minimum Tax) | 8/17 at 100.00 | A3 | | 530,750 | |
| | 1,000 | | California Municipal Finance Authority, Mobile Home Park Revenue Bonds, Caritas Projects Series 2010B, 7.250%, 8/15/45 | 8/20 at 100.00 | N/R | | 927,190 | |
| | 1,000 | | California Municipal Finance Authority, Revenue Bonds, Harbor Regional Center Project, Series 2009, 8.500%, 11/01/39 | 11/19 at 100.00 | Baa1 | | 1,077,010 | |
| | 795 | | California State Public Works Board, Lease Revenue Bonds, Various Capital Projects, Series 2010A-1, 5.750%, 3/01/30 | 3/20 at 100.00 | A2 | | 790,858 | |
| | 1,300 | | California State, General Obligation Bonds, Tender Option Bond Trust 3162, 19.170%, 3/01/18 – AGM Insured (IF) | No Opt. Call | AA+ | | 1,344,824 | |
| | 520 | | California Statewide Communities Development Authority, Revenue Bonds, American Baptist Homes of the West, Series 2010, 6.250%, 10/01/39 | 10/19 at 100.00 | BBB | | 493,558 | |
| | 1,825 | | California Statewide Community Development Authority, Revenue Bonds, Daughters of Charity Health System, Series 2005A, 5.250%, 7/01/35 | 7/15 at 100.00 | BBB | | 1,401,199 | |
| | 500 | | California Statewide Community Development Authority, Revenue Bonds, Kaiser Permanente System, Series 2007A, 5.000%, 4/01/31 – BHAC Insured | 4/17 at 100.00 | AA+ | | 491,620 | |
| | 2,000 | | California Statewide Community Development Authority, Revenue Bonds, St. Joseph Health System, Series 2007C, 5.750%, 7/01/47 – FGIC Insured (7) | 7/18 at 100.00 | AA– | | 1,874,940 | |
| | 1,125 | | California Statewide Community Development Authority, Revenue Bonds, Sutter Health, Tender Option Bond Trust 3048, 18.276%, 11/15/48 (IF) | 11/16 at 100.00 | AA– | | 612,045 | |
| | | | Daly City Housing Development Finance Agency, California, Mobile Home Park Revenue Bonds, Franciscan Mobile Home Park Refunding, Series 2007A: | | | | | |
| | 2,000 | | 5.000%, 12/15/37 | 12/17 at 100.00 | A | | 1,670,780 | |
| | 1,960 | | 6.500%, 12/15/47 | 12/17 at 100.00 | N/R | | 1,605,260 | |
| | | Nuveen Municipal High Income Opportunity Fund 2 (continued) |
| NMD | | Portfolio of Investments |
April 30, 2011 (Unaudited)
| | Principal | | | Optional Call | | | | |
| | Amount (000) | | Description (1) | Provisions (2) | Ratings (3) | | Value | |
| | | | California (continued) | | | | | |
| $ | 1,370 | | Elk Grove Community Facilities District 2005-1, California, Special Tax Bonds, Series 2007, 5.250%, 9/01/37 | 9/15 at 102.00 | N/R | $ | 859,894 | |
| | 1,000 | | Fontana, California, Special Tax Bonds, Community Facilities District 31 Citrus Heights North Special Tax Bonds, Series 2006, 5.000%, 9/01/26 | 9/14 at 102.00 | N/R | | 804,760 | |
| | | | Golden State Tobacco Securitization Corporation, California, Tobacco Settlement Asset-Backed Bonds, Series 2007A-1: | | | | | |
| | 1,000 | | 5.750%, 6/01/47 | 6/17 at 100.00 | Baa3 | | 678,860 | |
| | 2,500 | | 5.125%, 6/01/47 | 6/17 at 100.00 | Baa3 | | 1,525,374 | |
| | 1,000 | | Hercules Redevelopment Agency, California, Tax Allocation Bonds, Merged Project Area, Series 2005, 5.000%, 8/01/25 – AMBAC Insured | 8/15 at 100.00 | CCC | | 651,340 | |
| | 1,000 | | Lathrop Financing Authority, California, Revenue Bonds, Water Supply Project Series 2003, 6.000%, 6/01/35 | 6/13 at 100.00 | N/R | | 905,780 | |
| | 700 | | Los Angeles Department of Airports, California, Revenue Bonds, Los Angeles International Airport, Tender Option Bond Trust 10-27B, 17.832%, 5/15/40 (IF) (7) | 5/20 at 100.00 | AA | | 596,204 | |
| | 500 | | Los Angeles Regional Airports Improvement Corporation, California, Sublease Revenue Bonds, Los Angeles International Airport, American Airlines Inc. Terminal 4 Project, Series 2002C, 7.500%, 12/01/24 (Alternative Minimum Tax) | 12/12 at 102.00 | B– | | 500,600 | |
| | 500 | | March Joint Powers Redevelopment Agency March Air Force Base Redevelopment Project, California, Series 2011A, 7.500%, 8/01/41 | 8/21 at 100.00 | BBB+ | | 512,850 | |
| | 625 | | Palomar Pomerado Health Care District, California, Certificates of Participation, Series 2010, 5.250%, 11/01/21 | 11/20 at 100.00 | Baa3 | | 607,800 | |
| | 2,500 | | San Bernardino Community College District, California, General Obligation Bonds, Tender Option Bond Trust 11780-1, 17.636%, 2/01/27 – AGM Insured (IF) | 8/16 at 100.00 | AA+ | | 2,293,500 | |
| | 30,755 | | Total California | | | | 25,739,279 | |
| | | | Colorado – 8.9% (7.6% of Total Investments) | | | | | |
| | 1,500 | | Arista Metropolitan District, Colorado, Special Revenue Bonds, Series 2008, 9.250%, 12/01/37 | 12/15 at 100.00 | N/R | | 1,348,755 | |
| | 1,475 | | Colorado Educational and Cultural Facilities Authority, Charter School Revenue Bonds, Windsor Academy, Series 2007A, 5.700%, 5/01/37 | 5/17 at 100.00 | BB+ | | 1,104,790 | |
| | 1,975 | | Colorado Educational and Cultural Facilities Authority, Revenue Bonds, Pikes Peak School of Expeditionary Learning Charter School, Series 2008, 6.625%, 6/01/38 | 6/18 at 102.00 | N/R | | 1,715,130 | |
| | 750 | | Colorado Health Facilities Authority, Health Facilities Revenue Bonds, Sisters of Charity of Leavenworth Health Services Corporation, Tender Option Bond Trust 3702, 18.799%, 1/01/18 (IF) (7) | No Opt. Call | AA | | 721,590 | |
| | 1,000 | | Colorado Health Facilities Authority, Revenue Bonds, Evangelical Lutheran Good Samaritan Society, Series 2006, 5.250%, 6/01/36 | 6/16 at 100.00 | A– | | 855,030 | |
| | | | Colorado Housing and Finance Authority, Revenue Bonds, Confluence Energy LLC Project, Series 2007: | | | | | |
| | 218 | | 0.000%, 4/21/14 (Alternative Minimum Tax) | No Opt. Call | N/R | | – | |
| | 5,045 | | 6.750%, 4/01/27 (Alternative Minimum Tax) (5), (6) | 4/17 at 100.00 | N/R | | 3,029,724 | |
| | 993 | | Colorado Housing and Finance Authority, Revenue Bonds, Confluence Energy LLC Project, Series 2007, 0.000%, 4/21/14 (Alternative Minimum Tax) (5), (10) | No Opt. Call | N/R | | 722,021 | |
| | 1,000 | | Confluence Metropolitan District, Colorado, General Obligation Limited Tax Bonds, Series 2007, 5.400%, 12/01/27 | 12/17 at 100.00 | N/R | | 732,550 | |
| | 1,070 | | Fitzsimons Village Metropolitan District 1, Aurora, Arapahoe County, Colorado, Tax Increment Public Improvement Fee Supported Revenue Bonds, Series 2010A, 7.500%, 3/01/40 | 3/20 at 100.00 | N/R | | 1,022,620 | |
| | 5 | | Maher Ranch Metropolitan District 4, Colorado, General Obligation Limited Tax Bonds, Series 2007, 5.250%, 12/01/36 – RAAI Insured | 12/17 at 100.00 | N/R | | 3,810 | |
| | 500 | | Pinery West Metropolitan District 2, Colorado, General Obligation Limited Tax Bonds, Series 2007, 5.000%, 12/01/27 – RAAI Insured | 12/17 at 100.00 | N/R | | 403,160 | |
| | 1,000 | | Plaza Metropolitan District 1, Lakewood, Colorado, Tax Increment Revenue Bonds, Series 2003, 8.000%, 12/01/25 | 6/14 at 101.00 | N/R | | 984,880 | |
| | 1,700 | | Public Authority for Colorado Energy, Natural Gas Purchase Revenue Bonds, Colorado Springs Utilities, Series 2008, 6.500%, 11/15/38 | No Opt. Call | A | | 1,746,375 | |
| | Principal | | | Optional Call | | | | |
| | Amount (000) | | Description (1) | Provisions (2) | Ratings (3) | | Value | |
| | | | Colorado (continued) | | | | | |
| | | | Regional Transportation District, Colorado, Denver Transit Partners Eagle P3 Project Private Activity Bonds, Series 2010: | | | | | |
| $ | 500 | | 6.500%, 1/15/30 | 7/20 at 100.00 | Baa3 | $ | 505,455 | |
| | 1,000 | | 6.000%, 1/15/41 | 7/20 at 100.00 | Baa3 | | 916,130 | |
| | 815 | | Three Springs Metropolitan District 3, Durango, La Plata County, Colorado, Property Tax Supported Revenue Bonds, Series 2010, 7.750%, 12/01/39 | 12/20 at 100.00 | N/R | | 769,140 | |
| | 20,546 | | Total Colorado | | | | 16,581,160 | |
| | | | Connecticut – 0.6% (0.5% of Total Investments) | | | | | |
| | 1,000 | | Harbor Point Infrastructure Improvement District, Connecticut, Special Obligation Revenue Bonds, Harbor Point Project, Series 2010A, 7.875%, 4/01/39 | 4/20 at 100.00 | N/R | | 1,048,680 | |
| | | | Florida – 12.3% (10.6% of Total Investments) | | | | | |
| | 965 | | Ave Maria Stewardship Community Development District, Florida, Capital Improvement Revenue Bonds, Series 2006A, 5.125%, 5/01/38 | 5/16 at 100.00 | N/R | | 710,018 | |
| | 1,000 | | Beacon Lakes Community Development District, Florida, Special Assessment Bonds, Series 2003A, 6.900%, 5/01/35 | 5/13 at 101.00 | N/R | | 936,810 | |
| | 995 | | Beeline Community Development District, Palm Beach County, Florida, Special Assessment Bonds, Series 2008A, 7.000%, 5/01/37 | 5/18 at 100.00 | N/R | | 946,046 | |
| | 970 | | Colonial Country Club Community Development District, Florida, Capital Improvement Revenue Bonds, Series 2003, 6.400%, 5/01/33 | 5/13 at 101.00 | A+ | | 977,081 | |
| | 2,000 | | Escambia County, Florida, Environmental Improvement Revenue Bonds, International Paper Company Projects, Series 2006B, 5.000%, 8/01/26 (Alternative Minimum Tax) | 8/11 at 100.00 | BBB | | 1,826,960 | |
| | 1,000 | | Martin County Industrial Development Authority, Florida, Industrial Development Revenue Bonds, Indiantown Cogeneration LP, Series 1994A, 7.875%, 12/15/25 (Alternative Minimum Tax) | 6/11 at 100.00 | BB+ | | 1,005,000 | |
| | 2,320 | | Old Palm Community Development District, Florida, Special Assessment Bonds, Palm Beach Gardens, Series 2004A, 5.900%, 5/01/35 | 5/15 at 101.00 | N/R | | 2,013,272 | |
| | 1,000 | | Orange County Housing Finance Authority, Florida, Multifamily Housing Bonds, Buena Vista Place II, Series 1999-I, 6.900%, 7/01/39 (Alternative Minimum Tax) | 7/11 at 100.00 | N/R | | 877,230 | |
| | 1,140 | | Pine Island Community Development District, Florida, Special Assessment Bonds, Bella Collina, Series 2004, 5.750%, 5/01/35 | 5/12 at 101.00 | N/R | | 773,957 | |
| | 995 | | Poinciana West Community Development District, Florida, Special Assessment Bonds, Series 2007, 6.000%, 5/01/37 | 5/17 at 100.00 | N/R | | 814,666 | |
| | 1,000 | | Port Saint Lucie, Florida, Special Assessment Revenue Bonds, Southwest Annexation District 1B, Series 2007, 5.000%, 7/01/33 – NPFG Insured | 7/17 at 100.00 | Baa1 | | 825,020 | |
| | 3,255 | | South Miami Health Facilities Authority, Florida, Revenue Bonds, Baptist Health Systems of South Florida, Trust 1030, 15.393%, 2/01/31 (IF) | 8/17 at 100.00 | AA | | 2,188,760 | |
| | 490 | | South Village Community Development District, Clay County, Florida, Capital Improvement Revenue Bonds, Series 2005A, 5.700%, 5/01/35 | 5/13 at 100.00 | N/R | | 371,817 | |
| | 1,345 | | Stoneybrook Venice Community Development District, Florida, Capital Improvement Revenue Bonds, Series 2007, 6.750%, 5/01/38 | 5/18 at 100.00 | N/R | | 1,273,379 | |
| | 2,835 | | Tolomato Community Development District, Florida, Special Assessment Bonds, Series 2006, 5.400%, 5/01/37 | 5/14 at 101.00 | N/R | | 2,004,940 | |
| | 5,820 | | Tolomato Community Development District, Florida, Special Assessment Bonds, Series 2007, 5.250%, 5/01/39 | No Opt. Call | N/R | | 3,678,473 | |
| | | | Westchester Community Development District 1, Florida, Special Assessment Bonds, Series 2003: | | | | | |
| | 475 | | 6.000%, 5/01/23 | 5/13 at 101.00 | N/R | | 429,343 | |
| | 1,750 | | 6.125%, 5/01/35 | 5/13 at 101.00 | N/R | | 1,432,445 | |
| | 29,355 | | Total Florida | | | | 23,085,217 | |
| | | | Georgia – 2.4% (2.0% of Total Investments) | | | | | |
| | 1,000 | | Atlanta, Georgia, Tax Allocation Bonds, Beltline Project Series 2008A. Remarketed, 7.500%, 1/01/31 | 1/19 at 100.00 | N/R | | 1,014,360 | |
| | 1,250 | | Clayton County Development Authority, Georgia, Special Facilities Revenue Bonds, Delta Air Lines, Inc. Project, Series 2009A, 8.750%, 6/01/29 | 6/20 at 100.00 | CCC+ | | 1,381,774 | |
| | | Nuveen Municipal High Income Opportunity Fund 2 (continued) |
| NMD | | Portfolio of Investments |
April 30, 2011 (Unaudited)
| | Principal | | | Optional Call | | | | |
| | Amount (000) | | Description (1) | Provisions (2) | Ratings (3) | | Value | |
| | | | Georgia (continued) | | | | | |
| $ | 1,170 | | Clayton County Development Authority, Georgia, Special Facilities Revenue Bonds, Delta Air Lines, Inc. Project, Series 2009B, 9.000%, 6/01/35 (Alternative Minimum Tax) | 6/15 at 100.00 | CCC+ | $ | 1,237,111 | |
| | 855 | | Effingham County Development Authority, Georgia, Solid Waste Disposal Revenue Bonds, Ft. James Project, Series 1998, 5.625%, 7/01/18 (Alternative Minimum Tax) | 7/11 at 100.00 | BBB– | | 841,132 | |
| | 4,275 | | Total Georgia | | | | 4,474,377 | |
| | | | Illinois – 13.7% (11.7% of Total Investments) | | | | | |
| | 1,000 | | Bolingbrook, DuPage & Will Counties, Illinois, Special Tax Revenue Bonds, Special Service Areas 2001-1, 2001-2, 2001-3, and 2002-1, Refunding Series 2007, 4.500%, 3/01/32 – NPFG Insured | 4/21 at 100.00 | Baa1 | | 767,700 | |
| | 1,000 | | Cook County, Illinois, Recovery Zone Facility Revenue Bonds, Navistar International Corporation Project, Series 2010, 6.500%, 10/15/40 | 10/20 at 100.00 | BB– | | 1,007,900 | |
| | 1,100 | | Hillside, Cook County, Illinois, Senior Lien Tax Increment Revenue Bonds, Mannheim Redevelopment Project, Series 2008, 7.000%, 1/01/28 | 1/18 at 102.00 | N/R | | 968,341 | |
| | 1,000 | | Illinois Finance Authority Revenue Bonds, Christian Homes, Inc., Refunding Series 2010, 5.500%, 5/15/23 | 5/15 at 100.00 | N/R | | 957,690 | |
| | 5,620 | | Illinois Finance Authority, Charter School Revenue Bonds, Chicago Charter School Foundation, Series 2007, 5.000%, 12/01/36 | No Opt. Call | BBB+ | | 4,480,882 | |
| | 500 | | Illinois Finance Authority, Revenue Bonds, Admiral at Lake Project, Series 2010A, 7.750%, 5/15/30 | 5/20 at 100.00 | N/R | | 476,165 | |
| | 500 | | Illinois Finance Authority, Revenue Bonds, Admiral at Lake Project, Temps 75 Series 2010D-1, 7.000%, 5/15/18 | 11/12 at 100.00 | N/R | | 483,315 | |
| | 1,900 | | Illinois Finance Authority, Revenue Bonds, Provena Health, Series 2009A, 7.750%, 8/15/34 | 8/19 at 100.00 | BBB+ | | 2,047,630 | |
| | 1,500 | | Illinois Finance Authority, Revenue Bonds, Roosevelt University, Series 2007, 5.500%, 4/01/37 | 4/17 at 100.00 | Baa2 | | 1,330,184 | |
| | 2,500 | | Illinois Finance Authority, Revenue Bonds, Sherman Health Systems, Series 2007A, 5.500%, 8/01/37 | 8/17 at 100.00 | BBB | | 2,153,250 | |
| | 2,000 | | Illinois Finance Authority, Revenue Bonds, Silver Cross Hospital and Medical Centers, Series 2009, 6.875%, 8/15/38 | 8/19 at 100.00 | BBB | | 1,991,180 | |
| | 500 | | Illinois Finance Authority, Revenue Bonds, Southern Illinois Healthcare Enterprises, Inc., Series 2005 Remarketed, 5.250%, 3/01/30 – AGM Insured (7) | 3/20 at 100.00 | AA+ | | 478,350 | |
| | 500 | | Illinois Health Facilities Authority, Revenue Refunding Bonds, Elmhurst Memorial Healthcare, Series 2002, 5.500%, 1/01/22 | 1/13 at 100.00 | Baa1 | | 495,585 | |
| | 2,000 | | Lombard Public Facilities Corporation, Illinois, First Tier Conference Center and Hotel Revenue Bonds, Series 2005A-2, 5.500%, 1/01/36 – ACA Insured | 1/16 at 100.00 | B– | | 1,340,500 | |
| | | | Lombard Public Facilities Corporation, Illinois, Second Tier Conference Center and Hotel Revenue Bonds, Series 2005B: | | | | | |
| | 285 | | 5.250%, 1/01/25 | 1/16 at 100.00 | B– | | 195,311 | |
| | 200 | | 5.250%, 1/01/36 | 1/16 at 100.00 | B– | | 137,114 | |
| | 800 | | Railsplitter Tobacco Settlement Authority, Illinois, Tobacco Settlement Revenue Bonds, Series 2010, 6.000%, 6/01/28 | No Opt. Call | A– | | 772,616 | |
| | | | Southwestern Illinois Development Authority, Illinois, Saint Clair County Comprehensive Mental Health Center, Series 2007: | | | | | |
| | 1,170 | | 6.200%, 6/01/17 | No Opt. Call | N/R | | 1,121,913 | |
| | 3,020 | | 6.625%, 6/01/37 | 6/17 at 103.00 | N/R | | 2,650,141 | |
| | 1,000 | | Southwestern Illinois Development Authority, Local Government Program Revenue Bonds, Granite City Project, Series 2009B, 7.750%, 3/01/22 | 3/14 at 100.00 | N/R | | 1,000,470 | |
| | 750 | | Springfield, Sangamon County, Illinois, Special Service Area, Legacy Pointe, Special Assessment Bonds, Series 2009, 7.875%, 3/01/32 | 3/17 at 102.00 | N/R | | 750,090 | |
| | 28,845 | | Total Illinois | | | | 25,606,327 | |
| | | | Indiana – 3.6% (3.1% of Total Investments) | | | | | |
| | 3,100 | | Hospital Authority of Delaware County, Indiana, Hospital Revenue Bonds, Cardinal Health System, Series 2006, 5.125%, 8/01/29 | 8/16 at 100.00 | Baa3 | | 2,766,501 | |
| | 1,250 | | Indiana Bond Bank, Special Program Gas Revenue Bonds, JP Morgan Ventures Energy Corporation Guaranteed, Series 2007A, 17.820%, 4/15/17 (IF) | No Opt. Call | Aa3 | | 1,562,800 | |
| | Principal | | | Optional Call | | | | |
| | Amount (000) | | Description (1) | Provisions (2) | Ratings (3) | | Value | |
| | | | Indiana (continued) | | | | | |
| $ | 1,000 | | Indianapolis, Indiana, Multifamily Housing Revenue Bonds, GMF-Berkley Commons Apartments, Series 2010A, 6.000%, 7/01/40 | 7/20 at 100.00 | A+ | $ | 960,070 | |
| | | | Vigo County Hospital Authority, Indiana, Revenue Bonds, Union Hospital, Series 2007: | | | | | |
| | 250 | | 5.700%, 9/01/37 | 9/17 at 100.00 | N/R | | 190,688 | |
| | 1,800 | | 5.800%, 9/01/47 | 9/17 at 100.00 | N/R | | 1,338,660 | |
| | 7,400 | | Total Indiana | | | | 6,818,719 | |
| | | | Kentucky – 0.5% (0.4% of Total Investments) | | | | | |
| | | | Kentucky Economic Development Finance Authority, Hospital Facilities Revenue Bonds, Owensboro Medical Health System, Series 2010A: | | | | | |
| | 500 | | 6.000%, 6/01/30 | 6/20 at 100.00 | Baa2 | | 472,325 | |
| | 500 | | 6.500%, 3/01/45 | No Opt. Call | Baa2 | | 481,455 | |
| | 1,000 | | Total Kentucky | | | | 953,780 | |
| | | | Louisiana – 3.7% (3.2% of Total Investments) | | | | | |
| | 500 | | Louisiana Local Government Environment Facilities and Community Development Authority, Revenue Bonds, Westlake Chemical Corporation Projects, Series 2010A-1, 6.500%, 11/01/35 | 11/20 at 100.00 | BBB– | | 503,695 | |
| | 3,500 | | Louisiana Local Government Environmental Facilities & Community Development Authority, Revenue Bonds, Westlake Chemical Corporation Project, Series 2007, 6.750%, 11/01/32 | 11/17 at 100.00 | BBB– | | 3,574,760 | |
| | 4,000 | | Louisiana Local Government Environmental Facilities and Community Development Authority, Revenue Bonds, Southgate Suites Hotel LLC Project, Series 2007A, 6.750%, 12/15/37 (6) | 12/17 at 100.00 | N/R | | 2,414,360 | |
| | 555 | | Tobacco Settlement Financing Corporation, Louisiana, Tobacco Settlement Asset-Backed Bonds, Series 2001B, 5.875%, 5/15/39 | 5/11 at 101.00 | A– | | 506,510 | |
| | 8,555 | | Total Louisiana | | | | 6,999,325 | |
| | | | Maryland – 0.3% (0.3% of Total Investments) | | | | | |
| | 1,000 | | Maryland Economic Development Corporation, Revenue Bonds, Chesapeake Bay Hyatt Conference Center, Series 2006A, 5.000%, 12/01/31 | 12/16 at 100.00 | N/R | | 605,070 | |
| | | | Massachusetts – 0.0% (0.0% of Total Investments) | | | | | |
| | 90 | | Boston Industrial Development Financing Authority, Massachusetts, Senior Revenue Bonds, Crosstown Center Project, Series 2002, 6.500%, 9/01/35 (Alternative Minimum Tax) | 9/12 at 102.00 | Caa3 | | 43,898 | |
| | | | Michigan – 1.2% (1.0% of Total Investments) | | | | | |
| | 1,750 | | Michigan Public Educational Facilities Authority, Charter School Revenue Bonds, American Montessori Academy, Series 2007, 6.500%, 12/01/37 | 12/17 at 100.00 | N/R | | 1,460,813 | |
| | 980 | | Michigan Public Educational Facilities Authority, Limited Obligation Revenue Bonds, David Ellis Academy-West Charter School Project, Series 2007, 5.875%, 6/01/37 | 6/17 at 100.00 | N/R | | 749,778 | |
| | 2,730 | | Total Michigan | | | | 2,210,591 | |
| | | | Minnesota – 1.4% (1.2% of Total Investments) | | | | | |
| | 3,000 | | St. Paul Housing and Redevelopment Authority, Minnesota, Revenue Bonds, Healtheast Inc., Series 2005, 6.000%, 11/15/35 | 11/15 at 100.00 | BB+ | | 2,548,530 | |
| | | | Mississippi – 1.0% (0.9% of Total Investments) | | | | | |
| | 975 | | Mississippi Business Finance Corporation, Gulf Opportunity Zone Revenue Bonds, Roberts Hotel of Jackson, LLC Project, Series 2010, 8.500%, 2/01/30 (6) | 2/21 at 102.00 | NA | | 925,187 | |
| | 1,000 | | Mississippi Business Finance Corporation, Pollution Control Revenue Refunding Bonds, System Energy Resources Inc. Project, Series 1998, 5.875%, 4/01/22 | 10/11 at 100.00 | BBB | | 980,240 | |
| | 1,975 | | Total Mississippi | | | | 1,905,427 | |
| | | | Missouri – 3.4% (2.9% of Total Investments) | | | | | |
| | 1,000 | | Hanley Road Corridor Transportation Development District, Brentwood and Maplewood, Missouri, Transportation Sales Revenue Bonds, Refunding Series 2009A, 5.875%, 10/01/36 | 10/19 at 100.00 | A– | | 976,740 | |
| | 1,000 | | Missouri Development Finance Board. Infrastructure Facilities Revenue Bonds, City of Independence, Missouri – Events Center Project, Series 2009F, 6.250%, 4/01/38 | 4/14 at 100.00 | A– | | 1,018,320 | |
| | 1,100 | | Saint Louis Industrial Development Authority, Missouri, Confluence Academy Project, Series 2007A, 5.350%, 6/15/32 | 6/15 at 103.00 | N/R | | 836,880 | |
| | | Nuveen Municipal High Income Opportunity Fund 2 (continued) |
| NMD | | Portfolio of Investments |
April 30, 2011 (Unaudited)
| | Principal | | | Optional Call | | | | |
| | Amount (000) | | Description (1) | Provisions (2) | Ratings (3) | | Value | |
| | | | Missouri (continued) | | | | | |
| $ | 1,000 | | Saint Louis Land Clearance for Redevelopment Authority, Missouri, Tax-Exempt Recovery Zone Facilities Improvement, Special Revenue Bonds, Kiel Opera House Project, Series 2010B, 7.000%, 9/01/35 | 9/20 at 100.00 | N/R | $ | 930,220 | |
| | 990 | | Saint Louis, Missouri, Orpheum Theater Community Improvement District, Saint Louis, Missouri, Property and Sales Tax Revenue Bonds, Series 2009, 9.000%, 3/01/29 | No Opt. Call | N/R | | 967,517 | |
| | 1,894 | | Saint Louis, Missouri, Tax Increment Financing Revenue Bonds, Fashion Square Redevelopment Project, Series 2008A, 6.300%, 8/22/26 | 7/11 at 100.00 | N/R | | 1,558,743 | |
| | 6,984 | | Total Missouri | | | | 6,288,420 | |
| | | | Nevada – 2.0% (1.7% of Total Investments) | | | | | |
| | 2,500 | | Clark County, Nevada, General Obligation Bank Bonds, Southern Nevada Water Authority Loan, Tender Option Bond Trust Series 2010-11836, 17.535%, 6/01/16 (IF) | No Opt. Call | AA+ | | 2,529,100 | |
| | 1,200 | | Director of Nevada State Department of Business and Industry, Revenue Bonds, Las Vegas Monorail Project, First Tier, Series 2000, 5.375%, 1/01/40 – AMBAC Insured (6) | 7/11 at 100.00 | N/R | | 300,936 | |
| | 980 | | Sparks Tourism Improvement District 1, Legends at Sparks Marina, Nevada, Senior Sales Tax Revenue Bonds Series 2008A, 6.500%, 6/15/20 | 6/18 at 100.00 | B2 | | 890,056 | |
| | 4,680 | | Total Nevada | | | | 3,720,092 | |
| | | | New Jersey – 3.2% (2.8% of Total Investments) | | | | | |
| | | | New Jersey Economic Development Authority, Special Facilities Revenue Bonds, Continental Airlines Inc., Series 1999: | | | | | |
| | 2,000 | | 6.250%, 9/15/19 (Alternative Minimum Tax) | 9/11 at 100.00 | B | | 1,897,440 | |
| | 55 | | 6.400%, 9/15/23 (Alternative Minimum Tax) | 9/11 at 100.00 | B | | 52,070 | |
| | 25 | | New Jersey Economic Development Authority, Special Facilities Revenue Bonds, Continental Airlines Inc., Series 2000, 7.000%, 11/15/30 (Alternative Minimum Tax) | 5/11 at 101.00 | B | | 24,492 | |
| | 3,200 | | New Jersey Health Care Facilities Financing Authority, New Jersey, Revenue Bonds, Saint Peters University Hospital, Series 2007, 5.750%, 7/01/37 | 7/18 at 100.00 | BBB– | | 2,742,976 | |
| | 1,000 | | New Jersey Health Care Facilities Financing Authority, Revenue Bonds, Saint Joseph’s Healthcare System Obligated Group Issue, Series 2008, 6.000%, 7/01/18 | No Opt. Call | BBB– | | 1,053,110 | |
| | 500 | | Tobacco Settlement Financing Corporation, New Jersey, Tobacco Settlement Asset-Backed Bonds, Series 2007-1A, 4.750%, 6/01/34 | 6/17 at 100.00 | Baa3 | | 310,595 | |
| | 6,780 | | Total New Jersey | | | | 6,080,683 | |
| | | | New Mexico – 0.7% (0.6% of Total Investments) | | | | | |
| | 495 | | Montecito Estates Public Improvement District, New Mexico, Special Levee Revenue Bonds, Series 2007, 7.000%, 10/01/37 | 10/17 at 100.00 | N/R | | 418,186 | |
| | 965 | | New Mexico Hospital Equipment Loan Council, First Mortgage Revenue Bonds, La Vida LLena Project, Series 2010A, 5.875%, 7/01/30 | 7/20 at 100.00 | N/R | | 898,328 | |
| | 1,460 | | Total New Mexico | | | | 1,316,514 | |
| | | | New York – 2.5% (2.2% of Total Investments) | | | | | |
| | | | New York City Industrial Development Agency, New York, American Airlines-JFK International Airport Special Facility Revenue Bonds, Series 2005: | | | | | |
| | 1,000 | | 7.625%, 8/01/25 (Mandatory put 8/01/16) (Alternative Minimum Tax) | 8/16 at 101.00 | B– | | 1,011,900 | |
| | 1,000 | | 8.000%, 8/01/28 | No Opt. Call | B– | | 1,028,080 | |
| | | | New York City Industrial Development Agency, New York, Civic Facility Revenue Bonds, Bronx Parking Development Company, LLC Project, Series 2007: | | | | | |
| | 500 | | 5.750%, 10/01/37 | 10/17 at 100.00 | N/R | | 312,305 | |
| | 2,000 | | 5.875%, 10/01/46 | 10/17 at 102.00 | N/R | | 1,249,420 | |
| | 1,030 | | New York City Industrial Development Agency, New York, Civic Facility Revenue Bonds, Special Needs Facilities Pooled Program, Series 2008A-1, 5.800%, 7/01/23 | 7/16 at 101.00 | N/R | | 892,876 | |
| | 265 | | Port Authority of New York and New Jersey, Special Project Bonds, JFK International Air Terminal LLC Project, Eigth Series 2010, 6.000%, 12/01/42 | 12/20 at 100.00 | BBB– | | 254,983 | |
| | 5,795 | | Total New York | | | | 4,749,564 | |
| | Principal | | | Optional Call | | | | |
| | Amount (000) | | Description (1) | Provisions (2) | Ratings (3) | | Value | |
| | | | North Carolina – 2.3% (2.0% of Total Investments) | | | | | |
| $ | 1,970 | | Albemarle Hospital Authority, North Carolina, Health Care Facilities Revenue Bonds, Series 2007, 5.250%, 10/01/38 | 10/17 at 100.00 | N/R | $ | 1,428,959 | |
| | 1,260 | | Charlotte-Mecklenberg Hospital Authority, North Carolina, Carolinas HealthCare System Revenue Bonds, Series 2008, Trust 1149, 13.283%, 7/15/32 (IF) | 1/18 at 100.00 | AA– | | 987,727 | |
| | | | North Carolina Capital Facilities Financing Agency, Educational Facilities Revenue Bond, Meredith College, Series 2008A: | | | | | |
| | 1,000 | | 6.000%, 6/01/31 | 6/18 at 100.00 | BBB | | 993,020 | |
| | 1,000 | | 6.125%, 6/01/35 | 6/18 at 100.00 | BBB | | 982,030 | |
| | 5,230 | | Total North Carolina | | | | 4,391,736 | |
| | | | Ohio – 3.7% (3.2% of Total Investments) | | | | | |
| | | | Buckeye Tobacco Settlement Financing Authority, Ohio, Tobacco Settlement Asset-Backed Revenue Bonds, Senior Lien, Series 2007A-2: | | | | | |
| | 500 | | 5.750%, 6/01/34 | 6/17 at 100.00 | Baa3 | | 344,500 | |
| | 4,845 | | 5.875%, 6/01/47 | 6/17 at 100.00 | Baa3 | | 3,268,873 | |
| | 1,700 | | Lorain County Port Authority, Ohio, Recovery Zone Facility Economic Development Revenue Bonds, United State Steel Corporation Project, Series 2010, 6.750%, 12/01/40 | 12/20 at 100.00 | BB | | 1,729,835 | |
| | 1,250 | | Ohio State, Hospital Facility Revenue Refunding Bonds, Cleveland Clinic Health System Obligated Group, Tender Option Bond Trust 3551, 19.735%, 1/01/17 (IF) | No Opt. Call | Aa2 | | 1,235,500 | |
| | 2,000 | | Western Reserve Port Authority, Ohio, Solid Waste Facility Revenue Bonds, Central Waste Inc., Series 2007A, 6.350%, 7/01/27 (Alternative Minimum Tax) (5), (6) | 7/17 at 102.00 | N/R | | 364,000 | |
| | 10,295 | | Total Ohio | | | | 6,942,708 | |
| | | | Oklahoma – 0.3% (0.2% of Total Investments) | | | | | |
| | 45 | | Tulsa Municipal Airport Trust, Oklahoma, Revenue Bonds, American Airlines Inc., Series 1995, 6.250%, 6/01/20 | 6/11 at 100.00 | B– | | 42,973 | |
| | 500 | | Tulsa Municipal Airport Trust, Oklahoma, Revenue Refunding Bonds, American Airlines Inc., Series 2004A, 7.750%, 6/01/35 (Mandatory put 12/01/14) | No Opt. Call | Caa2 | | 514,615 | |
| | 545 | | Total Oklahoma | | | | 557,588 | |
| | | | Oregon – 0.2% (0.1% of Total Investments) | | | | | |
| | 190 | | Oregon, Economic Development Revenue Bonds, Georgia Pacific Corp., Series 1995CLVII, 6.350%, 8/01/25 (Alternative Minimum Tax) | 7/11 at 100.00 | BBB– | | 188,484 | |
| | 125 | | Oregon, Economic Development Revenue Refunding Bonds, Georgia Pacific Corp., Series 1997-183, 5.700%, 12/01/25 | 7/11 at 100.00 | Ba2 | | 117,303 | |
| | 315 | | Total Oregon | | | | 305,787 | |
| | | | Pennsylvania – 2.4% (2.1% of Total Investments) | | | | | |
| | 500 | | Allegheny Country Industrial Development Authority, Allegheny County, Pennsylvania, Environmental Improvement Revenue Bonds, United States Steel Corporation Project, Refunding Series 2009, 6.750%, 11/01/24 | No Opt. Call | BB | | 528,650 | |
| | 1,010 | | Chester County Industrial Development Authority, Pennsylvania, Avon Grove Charter School Revenue Bonds, Series 2007A, 6.375%, 12/15/37 | 12/17 at 100.00 | BB+ | | 840,169 | |
| | 185 | | Montgomery County Industrial Development Authority, Pennsylvania, FHA Insured Mortgage Revenue Bonds, New Regional Medical Center Project, Tender Option Bond Trust 62B, 18.911%, 8/01/38 (IF) (7) | 8/20 at 100.00 | AA | | 189,484 | |
| | 2,115 | | Pennsylvania Economic Development Finance Authority, Solid Waste Disposal Revenue Bonds (USG Corporation Project) Series 1999, 6.000%, 6/01/31 (Alternative Minimum Tax) | 6/11 at 100.00 | B | | 1,785,314 | |
| | 1,000 | | Pennsylvania Housing Finance Agency, Single Family Mortgage Revenue Bonds, Tender Option Bond Trust 4657, 15.917%, 10/01/29 (IF) (7) | 4/19 at 100.00 | AA+ | | 790,640 | |
| | 395 | | Philadelphia Hospitals and Higher Education Facilities Authority, Pennsylvania, Health System Revenue Bonds, Jefferson Health System, Series 2010B, 5.000%, 5/15/40 | 5/20 at 100.00 | AA | | 365,968 | |
| | 5,205 | | Total Pennsylvania | | | | 4,500,225 | |
| | | | Puerto Rico – 0.0% (0.0% of Total Investments) | | | | | |
| | 20 | | Puerto Rico Ports Authority, Special Facilities Revenue Bonds, American Airlines Inc., Series 1996A, 6.250%, 6/01/26 (Alternative Minimum Tax) | 6/11 at 100.00 | CCC+ | | 15,839 | |
| | | Nuveen Municipal High Income Opportunity Fund 2 (continued) |
| NMD | | Portfolio of Investments |
April 30, 2011 (Unaudited)
| | Principal | | | Optional Call | | | | |
| | Amount (000) | | Description (1) | Provisions (2) | Ratings (3) | | Value | |
| | | | Rhode Island – 0.2% (0.2% of Total Investments) | | | | | |
| $ | 500 | | Rhode Island Tobacco Settlement Financing Corporation, Tobacco Settlement Asset-Backed Bonds, Series 2002A, 6.250%, 6/01/42 | 6/12 at 100.00 | BBB | $ | 432,520 | |
| | | | South Carolina – 1.5% (1.2% of Total Investments) | | | | | |
| | 3,477 | | Lancaster County, South Carolina, Special Assessment Bonds, Edgewater II Improvement District, Series 2007B, 7.700%, 11/01/17 (5), (6) | No Opt. Call | N/R | | 2,096,596 | |
| | 625 | | South Carolina Jobs-Economic Development Authority, Hospital Revenue Bonds, Palmetto Health, Refunding Series 2011A, 6.500%, 8/01/39 (WI/DD, Settling
5/02/11) – AGM Insured | 8/21 at 100.00 | AA+ | | 636,625 | |
| | 4,102 | | Total South Carolina | | | | 2,733,221 | |
| | | | Tennessee – 2.5% (2.1% of Total Investments) | | | | | |
| | 500 | | Johnson City Health and Educational Facilities Board, Tennessee, Hospital Revenue Bonds, Mountain States Health Alliance, Refunding Series 2010A, 6.500%, 7/01/38 | 7/20 at 100.00 | BBB+ | | 491,800 | |
| | 1,000 | | Maury County Industrial Development Board, Tennessee, Multi-Modal Interchangeable Rate Pollution Control Revenue Refunding Bonds, Saturn Corporation, Series 1994, 6.500%, 9/01/24 | 9/11 at 100.00 | C | | 975,550 | |
| | | | Sumner County Health, Educational, and Housing Facilities Board, Tennessee, Revenue Refunding Bonds, Sumner Regional Health System Inc., Series 2007: | | | | | |
| | 1,500 | | 5.500%, 11/01/37 (5), (6) | 11/17 at 100.00 | N/R | | 75,150 | |
| | 1,000 | | 5.500%, 11/01/46 (5), (6) | 11/17 at 100.00 | N/R | | 50,100 | |
| | 3,261 | | The Tennessee Energy Acquisition Corporation, Gas Revenue Bonds, Series 2006B, 5.625%, 9/01/26 | No Opt. Call | N/R | | 2,993,957 | |
| | 7,261 | | Total Tennessee | | | | 4,586,557 | |
| | | | Texas – 8.6% (7.3% of Total Investments) | | | | | |
| | 1,000 | | Alliance Airport Authority, Texas, Special Facilities Revenue Bonds, American Airlines Inc., Series 2007, 5.750%, 12/01/29 (Alternative Minimum Tax) | 7/11 at 100.00 | CCC+ | | 701,490 | |
| | 940 | | Brazos River Authority, Texas, Pollution Control Revenue Refunding Bonds, TXU Electric Company, Series 2001C, 5.750%, 5/01/36 (Mandatory put 11/01/11) (Alternative Minimum Tax) | No Opt. Call | CC | | 920,815 | |
| | 2,100 | | Clifton Higher Education Finance Corporation, Texas, Education Revenue Bonds, Tejano Center for Community Concerns, Inc.-Raul Yzaguirre School for Success, Refunding Series 2009A, 8.750%, 2/15/28 | No Opt. Call | BBB– | | 2,266,866 | |
| | 10 | | Dallas-Ft. Worth International Airport Facility Improvement Corporation, Texas, Revenue Bonds, American Airlines Inc., Series 1999, 6.375%, 5/01/35 (Alternative Minimum Tax) | 11/11 at 100.00 | CCC+ | | 7,314 | |
| | 3,000 | | Danbury Higher Education Authority Inc., Texas, Golden Rule Charter School Revenue Bonds, Series 2008A, 6.500%, 8/15/38 | 2/18 at 100.00 | BB+ | | 2,491,740 | |
| | 980 | | Hidalgo Willacy Housing Finance Corporation, Texas, Multifamily Housing Revenue Bonds, Heritage Square Apartments Project, Series 2003A, 7.000%, 1/01/39 | 1/14 at 102.00 | N/R | | 882,294 | |
| | 1,330 | | La Vernia Higher Education Financing Corporation, Texas, Education Revenue Bonds, Amigos Por Vida Friends For Life Public Charter School, Series 2008, 6.375%, 2/15/37 | 2/16 at 100.00 | N/R | | 1,109,752 | |
| | 335 | | North Texas Tollway Authority, Second Tier System Revenue Refunding Bonds, Series 2008F, 5.750%, 1/01/38 | 1/18 at 100.00 | A3 | | 326,066 | |
| | 385 | | Sabine River Authority, Texas, Pollution Control Revenue Refunding Bonds, TXU Electric Company, Series 2001A, 5.500%, 5/01/22 (Mandatory put 11/01/11) | No Opt. Call | CC | | 377,142 | |
| | 2,000 | | Sabine River Authority, Texas, Pollution Control Revenue Refunding Bonds, TXU Energy Company LLC Project, Series 2003B, 6.150%, 8/01/22 | 8/13 at 101.00 | CC | | 693,960 | |
| | 2,875 | | Tarrant County Cultural and Educational Facilities Finance Corporation, Texas, Revenue Bonds, Texas Health Resources Project, Trust 1031, 17.472%, 2/15/36 (IF) | 2/17 at 100.00 | AA– | | 1,883,355 | |
| | 250 | | Texas Municipal Gas Acquisition and Supply Corporation I, Gas Supply Revenue Bonds, Senior Lien Series 2008D, 6.250%, 12/15/26 | No Opt. Call | A | | 256,515 | |
| | 1,000 | | Texas Private Activity Bond Surface Transportation Corporation, Senior Lien Revenue Bonds, LBJ Infrastructure Group LLC IH-635 Managed Lanes Project, Series 2010, 7.000%, 6/30/34 | 6/20 at 100.00 | Baa3 | | 1,032,960 | |
| | 970 | | Texas Public Finance Authority, Charter School Revenue Bonds, School of Excellence Charter School, Series 2004A, 7.000%, 12/01/34 | 12/14 at 100.00 | BB+ | | 862,117 | |
| | Principal | | | Optional Call | | | | |
| | Amount (000) | | Description (1) | Provisions (2) | Ratings (3) | | Value | |
| | | | Texas (continued) | | | | | |
| $ | 2,000 | | Texas Turnpike Authority, Central Texas Turnpike System Revenue Bonds, First Tier Series 2002A, 5.000%, 8/15/42 – AMBAC Insured | 8/12 at 100.00 | BBB+ | $ | 1,718,640 | |
| | 550 | | Travis County Health Facilities Development Corporation, Texas, Revenue Bonds, Westminster Manor, Series 2010, 7.000%, 11/01/30 | No Opt. Call | N/R | | 540,821 | |
| | 19,725 | | Total Texas | | | | 16,071,847 | |
| | | | Utah – 3.3% (2.8% of Total Investments) | | | | | |
| | | | Utah State Charter School Finance Authority, Charter School Revenue Bonds, Noah Webster Academy, Series 2008A: | | | | | |
| | 500 | | 6.250%, 6/15/28 | 6/17 at 100.00 | N/R | | 419,105 | |
| | 1,430 | | 6.500%, 6/15/38 | 6/17 at 100.00 | N/R | | 1,153,853 | |
| | 5,550 | | Utah State Charter School Finance Authority, Revenue Bonds, Summit Academy Project, Series 2007A, 5.800%, 6/15/38 | 12/17 at 100.00 | BBB– | | 4,533,129 | |
| | 7,480 | | Total Utah | | | | 6,106,087 | |
| | | | Virgin Islands – 0.9% (0.8% of Total Investments) | | | | | |
| | 1,000 | | Virgin Islands Public Finance Authority, Revenue Bonds, Refinery Project – Hovensa LLC, Series 2003, 6.125%, 7/01/22 (Alternative Minimum Tax) | 1/14 at 100.00 | Baa3 | | 933,930 | |
| | 1,000 | | Virgin Islands Public Finance Authority, Revenue Bonds, Refinery Project Hovensa LLC, Series 2007, 4.700%, 7/01/22 (Alternative Minimum Tax) | 1/15 at 100.00 | Baa3 | | 819,540 | |
| | 2,000 | | Total Virgin Islands | | | | 1,753,470 | |
| | | | Virginia – 1.5% (1.3% of Total Investments) | | | | | |
| | 50 | | Goochland County Industrial Development Authority, Virginia, Industrial Development Revenue Refunding Bonds, Nekoosa Packaging Corporation Project, Series 1998, 5.650%, 12/01/25 (Alternative Minimum Tax) | 6/11 at 100.00 | Ba2 | | 46,591 | |
| | 3,000 | | Tobacco Settlement Financing Corporation of Virginia, Tobacco Settlement Asset Backed Bonds, Series 2007B1, 5.000%, 6/01/47 | 6/17 at 100.00 | Baa3 | | 1,741,920 | |
| | 1,000 | | Virginia Small Business Financing Authority, Revenue Bonds Hampton Roads Proton Beam Therapy Institute at Hampton University, LLC Project, Series 2009, 9.000%, 7/01/39 | 7/14 at 102.00 | N/R | | 1,044,490 | |
| | 4,050 | | Total Virginia | | | | 2,833,001 | |
| | | | Washington – 5.9% (5.0% of Total Investments) | | | | | |
| | 2,415 | | FYI Properties, Washington, Lease Revenue Bonds, Washington State Department of Information Services Project, Tender Option Bond Trust 2009-14A&B, 19.194%, 6/01/34 (IF) (7) | 6/19 at 100.00 | AA | | 2,610,229 | |
| | 3,500 | | Kalispel Indian Tribe, Washington, Priority Distribution Bonds, Series 2008, 6.750%, 1/01/38 | No Opt. Call | N/R | | 2,920,855 | |
| | 7,000 | | Washington State Health Care Facilities Authority, Revenue Bonds, Northwest Hospital and Medical Center of Seattle, Series 2007, 5.700%, 12/01/32 | No Opt. Call | N/R | | 5,414,850 | |
| | 15 | | Washington State Health Care Facilities Authority, Revenue Bonds, Virginia Mason Medical Center, Series 2007B, 5.750%, 8/15/37 – ACA Insured | 8/17 at 100.00 | BBB | | 13,485 | |
| | 12,930 | | Total Washington | | | | 10,959,419 | |
| | | | West Virginia – 0.2% (0.2% of Total Investments) | | | | | |
| | 400 | | Ohio County Commission, West Virginia, Special District Excise Tax Revenue Bonds, Fort Henry Economic Development, Series 2006B, 5.625%, 3/01/36 | 3/16 at 100.00 | BBB | | 371,960 | |
| | | | Wisconsin – 1.6% (1.4% of Total Investments) | | | | | |
| | 30 | | Green Bay Redevelopment Authority, Wisconsin, Industrial Development Revenue Bonds, Fort James Project, Series 1999, 5.600%, 5/01/19 (Alternative Minimum Tax) | No Opt. Call | N/R | | 29,089 | |
| | 1,000 | | Lac Courte Oreilles Band of Lake Superior Chippewa Indians, Wisconsin, Revenue Bonds, Series 2006, 7.000%, 12/01/26 | 12/18 at 102.00 | N/R | | 900,550 | |
| | 1,000 | | Wisconsin Health and Educational Facilities Authority, Revenue Bonds, Froedtert Community Health, Inc. Obligated Group, Tender Option Bond Trust 3592, 18.585%, 4/01/17 (IF) (7) | No Opt. Call | AA– | | 681,840 | |
| | | Nuveen Municipal High Income Opportunity Fund 2 (continued) |
| NMD | | Portfolio of Investments |
April 30, 2011 (Unaudited)
| | Principal Amount (000) | | Description (1) | Provisions (2) Optional Call | Ratings (3) | | Value | |
| | | | Wisconsin (continued) | | | | | |
| $ | 1,000 | | Wisconsin Health and Educational Facilities Authority, Revenue Bonds, Ministry Healthcare Inc., Tender Option Bond Trust 09-3114, 15.864%, 2/15/26 – NPFG Insured (IF) | 2/12 at 101.00 | A+ | $ | 699,480 | |
| | 1,500 | | Wisconsin Health and Educational Facilities Authority, Revenue Bonds, Wheaton Franciscan Healthcare System, Series 2006, Trust 2187, 14.585%, 8/15/34 (IF) | 8/16 at 100.00 | BBB+ | | 663,300 | |
| | 4,530 | | Total Wisconsin | | | | 2,974,259 | |
| $ | 264,413 | | Total Investments (cost $243,136,002) – 116.8% | | | | 218,536,300 | |
| | | | Borrowings – (18.7)% (9) | | | | (35,000,000 | ) |
| | | | Other Assets Less Liabilities – 1.9% (11) | | | | 3,526,098 | |
| | | | Net Assets Applicable to Common Shares – 100% | | | $ | 187,062,398 | |
Investments in Derivatives
Swaps outstanding at April 30, 2011:
| | | | Fund | | | | | | Fixed Rate | | | | | | Unrealized | |
| | Notional | | Pay/Receive | | Floating Rate | | Fixed Rate | | Payment | | Effective | | Termination | | Appreciation | |
| Counterparty | Amount | | Floating Rate | | Index | | (Annualized | ) | Frequency | | Date (12 | ) | Date | | (Depreciation | ) |
| Barclays Bank PLC | $35,000,000 | | Receive | | 1-Month USD-LIBOR | | 1.333% | | Monthly | | 4/25/11 | | 4/25/14 | $ | (145,330 | ) |
| Barclays Bank PLC | 6,000,000 | | Receive | | 3-Month USD-LIBOR | | 4.098 | | Semi-Annually | | 12/23/11 | | 12/23/35 | | 167,766 | |
| Barclays Bank PLC | 3,500,000 | | Receive | | 3-Month USD-LIBOR | | 4.720 | | Semi-Annually | | 5/25/11 | | 5/25/40 | | (326,324 | ) |
| JPMorgan | 5,000,000 | | Receive | | 3-Month USD-LIBOR | | 4.783 | | Semi-Annually | | 5/05/11 | | 5/05/40 | | (532,595 | ) |
| | | | | | | | | | | | | | | $ | (836,483 | ) |
| (1) | | All percentages shown in the Portfolio of Investments are based on net assets applicable to Common shares unless otherwise noted. |
| (2) | | Optional Call Provisions: Dates (month and year) and prices of the earliest optional call or redemption. There may be other call provisions at varying prices at later dates. Certain mortgage-backed securities may be subject to periodic principal paydowns. |
| (3) | | Ratings: Using the highest of Standard & Poor’s Group (“Standard & Poor’s”), Moody’s Investor Service, Inc. (“Moody’s”) or Fitch, Inc. (“Fitch”) rating. Ratings below BBB by Standard & Poor’s, Baa by Moody’s or BBB by Fitch are considered to be below investment grade. Holdings designated N/R are not rated by any of these national rating agencies. |
| (4) | | Backed by an escrow or trust containing sufficient U.S. Government or U.S. Government agency securities, which ensure the timely payment of principal and interest. Such investments are normally considered to be equivalent to AAA rated securities. |
| (5) | | For fair value measurement disclosure purposes, investment categorized as Level 3. See Notes to Financial Statements, Footnote 1 – General Information and Significant Accounting Policies, Investment Valuation for more information. |
| (6) | | At or subsequent to the end of the reporting period, this security is non-income producing. Non-income producing security, in the case of a bond, generally denotes that the issuer has (1) defaulted on the payment of principal or interest, (2) is under the protection of the Federal Bankruptcy Court or (3) the Fund’s Adviser has concluded that the issue is not likely to meet its future interest payment obligations and has directed the Fund’s custodian to cease accruing additional income on the Fund’s records. |
| (7) | | Investment, or portion of investment, has been pledged to collateralize the net payment obligations for investments in derivatives and/or inverse floating rate transactions. |
| (9) | | Borrowings as a percentage of Total Investments is 16.0%. |
| (10) | | Investment valued at fair value using methods determined in good faith by, or at the discretion of, the Board of Directors/Trustees. |
| (11) | | Other Assets Less Liabilities include the Value and/or the Unrealized Appreciation/Depreciation of derivative instruments as listed within Investments in Derivatives. |
| (12) | | Effective date represents the date on which both the Fund and Counterparty commence interest payment accruals on each forward interest rate swap contract. |
| N/R | | Not rated. |
| WI/DD | | Purchased on a when-issued or delayed delivery basis. |
| (IF) | | Inverse floating rate investment. |
| USD-LIBOR | | United States Dollar-London Inter-Bank Offered Rate. |
See accompanying notes to financial statements.
| | | Statement of |
| | | Assets & Liabilities |
April 30, 2011 (Unaudited)
| | | | Investment Quality (NQM | ) | | Select Quality (NQS | ) | | Quality Income (NQU | ) |
| Assets | | | | | | | | | | |
| Investments, at value (cost $787,058,828, $722,353,339 and $1,182,425,502, respectively) | | $ | 775,579,216 | | $ | 688,800,618 | | $ | 1,145,387,526 | |
| Cash | | | 4,739,793 | | | 10,014,993 | | | 5,498,653 | |
| Receivables: | | | | | | | | | | |
| Interest | | | 12,636,061 | | | 10,908,725 | | | 18,028,313 | |
| Investments sold | | | 3,390,000 | | | 17,050,000 | | | 10,010,000 | |
| Deferred offering costs | | | — | | | — | | | 1,482,308 | |
| Other assets | | | 208,468 | | | 187,972 | | | 580,136 | |
| Total assets | | | 796,553,538 | | | 726,962,308 | | | 1,180,986,936 | |
| Liabilities | | | | | | | | | | |
| Borrowings | | | — | | | — | | | — | |
| Cash overdraft | | | — | | | — | | | — | |
| Floating rate obligations | | | 80,492,000 | | | 18,540,000 | | | 61,410,000 | |
| Unrealized depreciation on swaps | | | — | | | — | | | — | |
| Payables: | | | | | | | | | | |
| Auction Rate Preferred share dividends | | | 9,206 | | | 11,232 | | | 26,475 | |
| Common share dividends | | | 2,508,462 | | | 2,640,084 | | | 3,904,907 | |
| Investments purchased | | | 4,525,940 | | | — | | | — | |
| Variable Rate Demand Preferred (VRDP) shares, at liquidation value | | | — | | | — | | | 388,400,000 | |
| Accrued expenses: | | | | | | | | | | |
| Interest on borrowings | | | — | | | — | | | — | |
| Management fees | | | 393,071 | | | 361,531 | | | 574,943 | |
| Offering costs | | | — | | | — | | | 1,279,683 | |
| Shelf offering costs | | | — | | | — | | | — | |
| Other | | | 139,842 | | | 226,881 | | | 302,216 | |
| Total liabilities | | | 88,068,521 | | | 21,779,728 | | | 455,898,224 | |
| Auction Rate Preferred Shares (ARPS), at liquidation value | | | 210,700,000 | | | 251,275,000 | | | — | |
| Net assets applicable to Common shares | | $ | 497,785,017 | | $ | 453,907,580 | | $ | 725,088,712 | |
| Common shares outstanding | | | 35,857,259 | | | 34,264,874 | | | 54,366,717 | |
| Net asset value per Common share outstanding (net assets applicable to Common shares, divided by Common shares outstanding) | | $ | 13.88 | | $ | 13.25 | | $ | 13.34 | |
| Net assets applicable to Common shares consist of: | | | | | | | | | | |
| Common shares, $.01 par value per share | | $ | 358,573 | | $ | 342,649 | | $ | 543,667 | |
| Paid-in surplus | | | 499,970,653 | | | 477,394,246 | | | 757,263,759 | |
| Undistributed (Over-distribution of) net investment income | | | 10,576,210 | | | 9,465,169 | | | 13,980,453 | |
| Accumulated net realized gain (loss) | | | (1,640,807 | ) | | 258,237 | | | (9,661,191 | ) |
| Net unrealized appreciation (depreciation) | | | (11,479,612 | ) | | (33,552,721 | ) | | (37,037,976 | ) |
| Net assets applicable to Common shares | | $ | 497,785,017 | | $ | 453,907,580 | | $ | 725,088,712 | |
| Authorized shares: | | | | | | | | | | |
| Common | | | 200,000,000 | | | 200,000,000 | | | 200,000,000 | |
| ARPS | | | 1,000,000 | | | 1,000,000 | | | 1,000,000 | |
| VRDP | | | — | | | — | | | Unlimited | |
See accompanying notes to financial statements.
| | | Statement of |
| | | Assets & Liabilities (continued) |
April 30, 2011 (Unaudited)
| | | | Premier Income (NPF | ) | | High Income Opportunity (NMZ | ) | | High Income Opportunity 2 (NMD | ) |
| Assets | | | | | | | | | | |
| Investments, at value (cost $440,537,988, $433,902,668 and $243,136,002, respectively) | | $ | 444,746,158 | | $ | 399,537,521 | | $ | 218,536,300 | |
| Cash | | | 1,347,992 | | | — | | | — | |
| Receivables: | | | | | | | | | | |
| Interest | | | 6,826,628 | | | 10,002,773 | | | 6,173,264 | |
| Investments sold | | | 3,711,345 | | | 10,082,550 | | | 475,000 | |
| Deferred offering costs | | | — | | | 84,579 | | | 57,275 | |
| Other assets | | | 133,737 | | | 94,289 | | | 25,022 | |
| Total assets | | | 456,765,860 | | | 419,801,712 | | | 225,266,861 | |
| Liabilities | | | | | | | | | | |
| Borrowings | | | — | | | — | | | 35,000,000 | |
| Cash overdraft | | | — | | | 3,103,176 | | | 243,551 | |
| Floating rate obligations | | | 56,256,000 | | | 18,170,000 | | | — | |
| Unrealized depreciation on swaps | | | — | | | 866,779 | | | 836,483 | |
| Payables: | | | | | | | | | | |
| Auction Rate Preferred share dividends | | | 4,292 | | | 9,411 | | | — | |
| Common share dividends | | | 1,278,664 | | | 2,214,600 | | | 1,204,998 | |
| Investments purchased | | | 644,391 | | | 6,594,584 | | | 614,994 | |
| Variable Rate Demand Preferred (VRDP) shares, at liquidation value | | | — | | | — | | | — | |
| Accrued expenses: | | | | | | | | | | |
| Interest on borrowings | | | — | | | — | | | 38,689 | |
| Management fees | | | 218,476 | | | 200,432 | | | 172,485 | |
| Offering costs | | | — | | | — | | | — | |
| Shelf offering costs | | | — | | | — | | | 45,875 | |
| Other | | | 129,006 | | | 122,148 | | | 47,388 | |
| Total liabilities | | | 58,530,829 | | | 31,281,130 | | | 38,204,463 | |
| Auction Rate Preferred Shares (ARPS), at liquidation value | | | 126,850,000 | | | 95,000,000 | | | — | |
| Net assets applicable to Common shares | | $ | 271,385,031 | | $ | 293,520,582 | | $ | 187,062,398 | |
| Common shares outstanding | | | 19,888,518 | | | 27,475,648 | | | 17,820,744 | |
Net asset value per Common share outstanding (net assets applicable to Common shares, divided by Common shares outstanding) | | $ | 13.65 | | $ | 10.68 | | $ | 10.50 | |
| Net assets applicable to Common shares consist of: | | | | | | | | | | |
| Common shares, $.01 par value per share | | $ | 198,885 | | $ | 274,756 | | $ | 178,207 | |
| Paid-in surplus | | | 276,696,989 | | | 379,058,928 | | | 248,554,334 | |
| Undistributed (Over-distribution of) net investment income | | | 5,469,666 | | | 1,105,604 | | | (253,294 | ) |
| Accumulated net realized gain (loss) | | | (15,188,679 | ) | | (51,686,780 | ) | | (35,980,664 | ) |
| Net unrealized appreciation (depreciation) | | | 4,208,170 | | | (35,231,926 | ) | | (25,436,185 | ) |
| Net assets applicable to Common shares | | $ | 271,385,031 | | $ | 293,520,582 | | $ | 187,062,398 | |
| Authorized shares: | | | | | | | | | | |
| Common | | | 200,000,000 | | | Unlimited | | | Unlimited | |
| ARPS | | | 1,000,000 | | | Unlimited | | | Unlimited | |
| VRDP | | | — | | | — | | | — | |
See accompanying notes to financial statements.
Six Months Ended April 30, 2011 (Unaudited)
| | | | Investment Quality (NQM | ) | | Select Quality (NQS | ) | | Quality Income (NQU | ) |
| Investment Income | | $ | 21,713,280 | | $ | 21,516,458 | | $ | 32,600,894 | |
| Expenses | | | | | | | | | | |
| Management fees | | | 2,399,351 | | | 2,213,857 | | | 3,519,817 | |
| Auction fees | | | 156,726 | | | 186,908 | | | 228,870 | |
| Dividend disbursing agent fees | | | 24,795 | | | 24,795 | | | 49,890 | |
| Shareholders’ servicing agent fees and expenses | | | 19,906 | | | 17,584 | | | 28,567 | |
| Interest expense and amortization of offering costs | | | 292,504 | | | 75,871 | | | 886,600 | |
| Liquidity fees on VRDP shares | | | — | | | — | | | 1,771,892 | |
| Custodian’s fees and expenses | | | 64,276 | | | 63,028 | | | 102,303 | |
| Directors’/Trustees’ fees and expenses | | | 9,680 | | | 9,492 | | | 16,820 | |
| Professional fees | | | 90,942 | | | 27,042 | | | 36,247 | |
| Shareholders’ reports – printing and mailing expenses | | | 35,337 | | | 35,213 | | | 58,807 | |
| Stock exchange listing fees | | | 6,006 | | | 5,750 | | | 9,091 | |
| Investor relations expense | | | 16,782 | | | 17,174 | | | 27,593 | |
| Other expenses | | | 28,866 | | | 29,241 | | | 40,855 | |
| Total expenses before custodian fee credit and expense reimbursement | | | 3,145,171 | | | 2,705,955 | | | 6,777,352 | |
| Custodian fee credit | | | (8,845 | ) | | (6,042 | ) | | (8,500 | ) |
| Expense reimbursement | | | — | | | — | | | — | |
| Net expenses | | | 3,136,326 | | | 2,699,913 | | | 6,768,852 | |
| Net investment income (loss) | | | 18,576,954 | | | 18,816,545 | | | 25,832,042 | |
| Realized and Unrealized Gain(Loss) | | | | | | | | | | |
| Net realized gain (loss) from: | | | | | | | | | | |
| Investments | | | 285,792 | | | 1,260,980 | | | 1,886,909 | |
| Futures | | | — | | | — | | | — | |
| Change in net unrealized appreciation (depreciation) of: | | | | | | | | | | |
| Investments | | | (46,234,039 | ) | | (52,466,822 | ) | | (82,612,012 | ) |
| Futures | | | — | | | — | | | — | |
| Swaps | | | — | | | — | | | — | |
| Net realized and unrealized gain (loss) | | | (45,948,247 | ) | | (51,205,842 | ) | | (80,725,103 | ) |
| Distributions to Auction Rate Preferred Shareholders | | | | | | | | | | |
| From net investment income | | | (436,610 | ) | | (480,427 | ) | | (371,388 | ) |
| From accumulated net realized gains | | | — | | | (50,852 | ) | | — | |
Decrease in net assets applicable to Common shares from distributions to Action Rate Preferred shareholders | | | (436,610 | ) | | (531,279 | ) | | (371,388 | ) |
Net increase (decrease) in net assets applicable to Common shares from operations | | $ | (27,807,903 | ) | $ | (32,920,576 | ) | $ | (55,264,449 | ) |
See accompanying notes to financial statements.
| | | Statement of |
| | | Operations (continued) |
Six Months Ended April 30, 2011 (Unaudited)
| | | | Premier Income (NPF | ) | | High Income Opportunity (NMZ | ) | | High Income Opportunity 2 (NMD | ) |
| Investment Income | | $ | 11,529,856 | | $ | 15,220,403 | | $ | 9,254,303 | |
| Expenses | | | | | | | | | | |
| Management fees | | | 1,330,513 | | | 1,378,687 | | | 1,054,360 | |
| Auction fees | | | 94,355 | | | 70,664 | | | — | |
| Dividend disbursing agent fees | | | 14,877 | | | 14,877 | | | — | |
| Shareholders’ servicing agent fees and expenses | | | 10,519 | | | 1,049 | | | 254 | |
| Interest expense and amortization of offering costs | | | 164,921 | | | 61,430 | | | 266,268 | |
| Liquidity fees on VRDP shares | | | — | | | — | | | — | |
| Custodian’s fees and expenses | | | 38,065 | | | 42,858 | | | 25,582 | |
| Directors’/Trustees’ fees and expenses | | | 5,437 | | | 5,306 | | | 3,169 | |
| Professional fees | | | 22,306 | | | 430,670 | | | 35,977 | |
| Shareholders’ reports – printing and mailing expenses | | | 18,677 | | | 27,695 | | | 18,477 | |
| Stock exchange listing fees | | | 4,507 | | | 1,678 | | | 4,507 | |
| Investor relations expense | | | 9,613 | | | 11,273 | | | 5,812 | |
| Other expenses | | | 21,809 | | | 15,920 | | | 6,791 | |
| Total expenses before custodian fee credit and expense reimbursement | | | 1,735,599 | | | 2,062,107 | | | 1,421,157 | |
| Custodian fee credit | | | (3,132 | ) | | (2,237 | ) | | (1,291 | ) |
| Expense reimbursement | | | — | | | (180,338 | ) | | — | |
| Net expenses | | | 1,732,467 | | | 1,879,532 | | | 1,419,866 | |
| Net investment income (loss) | | | 9,797,389 | | | 13,340,871 | | | 7,834,437 | |
| Realized and Unrealized Gain(Loss) | | | | | | | | | | |
| Net realized gain (loss) from: | | | | | | | | | | |
| Investments | | | (371,844 | ) | | (544,217 | ) | | 1,085,020 | |
| Futures | | | — | | | — | | | 288,859 | |
| Change in net unrealized appreciation (depreciation) of: | | | | | | | | | | |
| Investments | | | (21,559,231 | ) | | (38,492,214 | ) | | (26,601,669 | ) |
| Futures | | | — | | | — | | | (137,711 | ) |
| Swaps | | | — | | | 332,613 | | | 728,797 | |
| Net realized and unrealized gain (loss) | | | (21,931,075 | ) | | (39,703,818 | ) | | (24,636,704 | ) |
| Distributions to Auction Rate Preferred Shareholders | | | | | | | | | | |
| From net investment income | | | (257,235 | ) | | (193,001 | ) | | — | |
| From accumulated net realized gains | | | — | | | — | | | — | |
| Decrease in net assets applicable to Common shares from distributions to Action Rate Preferred shareholders | | | (257,235 | ) | | (193,001 | ) | | — | |
| Net increase (decrease) in net assets applicable to Common shares from operations | | $ | (12,390,921 | ) | $ | (25,555,948 | ) | $ | (16,802,267 | ) |
See accompanying notes to financial statements.
| | | Statement of |
| | | Changes in Net Assets (Unaudited) |
| | | Investment Quality (NQM) | | Select Quality (NQS) | |
| | | | Six Months Ended 4/30/11 | | | Year Ended 10/31/10 | | | Six Months Ended 4/30/11 | | | Year Ended 10/31/10 | |
| Operations | | | | | | | | | | | | | |
| Net investment income | | $ | 18,576,954 | | $ | 37,351,012 | | $ | 18,816,545 | | $ | 38,257,499 | |
| Net realized gain (loss) from: | | | | | | | | | | | | | |
| Investments | | | 285,792 | | | 947,158 | | | 1,260,980 | | | 2,821,341 | |
| Futures contracts | | | — | | | — | | | — | | | — | |
| Swaps | | | — | | | — | | | — | | | — | |
| Change in net unrealized appreciation (depreciation) of: | | | | | | | | | | | | | |
| Investments | | | (46,234,039 | ) | | 26,362,174 | | | (52,466,822 | ) | | 17,430,280 | |
| Futures contracts | | | — | | | — | | | — | | | — | |
| Swaps | | | — | | | — | | | — | | | — | |
| Distributions to Auction Rate Preferred Shareholders: | | | | | | | | | | | | | |
| From net investment income | | | (436,610 | ) | | (848,746 | ) | | (480,427 | ) | | (996,049 | ) |
| From accumulated net realized gains | | | — | | | — | | | (50,852 | ) | | (36,384 | ) |
| Net increase (decrease) in net assets applicable to Common shares from operations | | | (27,807,903 | ) | | 63,811,598 | | | (32,920,576 | ) | | 57,476,687 | |
| Distributions to Common Shareholders | | | | | | | | | | | | | |
| From net investment income | | | (16,989,170 | ) | | (32,692,194 | ) | | (17,916,611 | ) | | (33,998,327 | ) |
| From accumulated net realized gains | | | — | | | — | | | (2,776,673 | ) | | (517,408 | ) |
Decrease in net assets applicable to Common shares from distributions to Common shareholders | | | (16,989,170 | ) | | (32,692,194 | ) | | (20,693,284 | ) | | (34,515,735 | ) |
| Capital Share Transactions | | | | | | | | | | | | | |
| Common shares: | | | | | | | | | | | | | |
| Proceeds from shelf offering, net of offering costs | | | — | | | — | | | — | | | — | |
| Net proceeds issued to shareholders due to reinvestment of distributions | | | — | | | 552,466 | | | 1,284,682 | | | 2,042,496 | |
| Net increase (decrease) in net assets applicable to Common shares from capital share transactions | | | — | | | 552,466 | | | 1,284,682 | | | 2,042,496 | |
| Net increase (decrease) in net assets applicable to Common shares | | | (44,797,073 | ) | | 31,671,870 | | | (52,329,178 | ) | | 25,003,448 | |
| Net assets applicable to Common shares at the beginning of period | | | 542,582,090 | | | 510,910,220 | | | 506,236,758 | | | 481,233,310 | |
| Net assets applicable to Common shares at the end of period | | $ | 497,785,017 | | $ | 542,582,090 | | $ | 453,907,580 | | $ | 506,236,758 | |
Undistributed (Over-distribution of) net investment income at the end of
period | | $ | 10,576,210 | | $ | 9,425,036 | | $ | 9,465,169 | | $ | 9,045,662 | |
See accompanying notes to financial statements.
| | | Statement of |
| | | Changes in Net Assets (Unaudited) (continued) |
| | | Quality Income (NQU) | | Premier Income (NPF) | |
| | | | Six Months Ended 4/30/11 | | | Year Ended 10/31/10 | | | Six Months Ended 4/30/11 | | | Year Ended 10/31/10 | |
| Operations | | | | | | | | | | | | | |
| Net investment income | | $ | 25,832,042 | | $ | 56,492,682 | | $ | 9,797,389 | | $ | 19,411,057 | |
| Net realized gain (loss) from: | | | | | | | | | | | | | |
| Investments | | | 1,886,909 | | | 6,430,768 | | | (371,844 | ) | | 335,044 | |
| Futures contracts | | | — | | | — | | | — | | | — | |
| Swaps | | | — | | | — | | | — | | | — | |
| Change in net unrealized appreciation (depreciation) of: | | | | | | | | | | | | | |
| Investments | | | (82,612,012 | ) | | 17,854,653 | | | (21,559,231 | ) | | 14,395,425 | |
| Futures contracts | | | — | | | — | | | — | | | — | |
| Swaps | | | — | | | — | | | — | | | — | |
| Distributions to Auction Rate Preferred Shareholders: | | | | | | | | | | | | | |
| From net investment income | | | (371,388 | ) | | (1,577,043 | ) | | (257,235 | ) | | (509,782 | ) |
| From accumulated net realized gains | | | — | | | — | | | — | | | — | |
| Net increase (decrease) in net assets applicable to Common shares from operations | | | (55,264,449 | ) | | 79,201,060 | | | (12,390,921 | ) | | 33,631,744 | |
| Distributions to Common Shareholders | | | | | | | | | | | | | |
| From net investment income | | | (25,749,887 | ) | | (50,138,547 | ) | | (8,651,506 | ) | | (16,875,409 | ) |
| From accumulated net realized gains | | | — | | | — | | | — | | | — | |
| Decrease in net assets applicable to Common shares from distributions to Common shareholders | | | (25,749,887 | ) | | (50,138,547 | ) | | (8,651,506 | ) | | (16,875,409 | ) |
| Capital Share Transactions | | | | | | | | | | | | | |
| Common shares: | | | | | | | | | | | | | |
| Proceeds from shelf offering, net of offering costs | | | — | | | — | | | — | | | — | |
| Net proceeds issued to shareholders due to reinvestment of distributions | | | 1,118,231 | | | 940,368 | | | — | | | — | |
Net increase (decrease) in net assets applicable to Common shares from capital share transactions | | | 1,118,231 | | | 940,368 | | | — | | | — | |
| Net increase (decrease) in net assets applicable to Common shares | | | (79,896,105 | ) | | 30,002,881 | | | (21,042,427 | ) | | 16,756,335 | |
| Net assets applicable to Common shares at the beginning of period | | | 804,984,817 | | | 774,981,936 | | | 292,427,458 | | | 275,671,123 | |
| Net assets applicable to Common shares at the end of period | | $ | 725,088,712 | | $ | 804,984,817 | | $ | 271,385,031 | | $ | 292,427,458 | |
| Undistributed (Over-distribution of) net investment income at the end of period | | $ | 13,980,453 | | $ | 14,269,686 | | $ | 5,469,666 | | $ | 4,581,018 | |
See accompanying notes to financial statements.
| | | High Income Opportunity (NMZ) | | High Income Opportunity 2 (NMD) | |
| | | | Six Months Ended 4/30/11 | | | Year Ended 10/31/10 | | | Six Months Ended 4/30/11 | | | Year Ended 10/31/10 | |
| Operations | | | | | | | | | | | | | |
| Net investment income | | $ | 13,340,871 | | $ | 27,087,396 | | $ | 7,834,437 | | $ | 15,205,247 | |
| Net realized gain (loss) from: | | | | | | | | | | | | | |
| Investments | | | (544,217 | ) | | 1,319,922 | | | 1,085,020 | | | (279,287 | ) |
| Futures contracts | | | — | | | — | | | 288,859 | | | (1,405,412 | ) |
| Swaps | | | — | | | (1,298,571 | ) | | — | | | 1,632,857 | |
| Change in net unrealized appreciation (depreciation) of: | | | | | | | | | | | | | |
| Investments | | | (38,492,214 | ) | | 25,270,695 | | | (26,601,669 | ) | | 20,548,303 | |
| Futures contracts | | | — | | | — | | | (137,711 | ) | | 219,495 | |
| Swaps | | | 332,613 | | | (1,494,192 | ) | | 728,797 | | | (2,890,080 | ) |
| Distributions to Auction Rate Preferred Shareholders: | | | | | | | | | | | | | |
| From net investment income | | | (193,001 | ) | | (387,616 | ) | | — | | | — | |
| From accumulated net realized gains | | | — | | | — | | | — | | | — | |
Net increase (decrease) in net assets applicable to Common shares from operations | | | (25,555,948 | ) | | 50,497,634 | | | (16,802,267 | ) | | 33,031,123 | |
| Distributions to Common Shareholders | | | | | | | | | | | | | |
| From net investment income | | | (13,595,171 | ) | | (26,241,516 | ) | | (7,992,382 | ) | | (16,075,462 | ) |
| From accumulated net realized gains | | | — | | | — | | | — | | | — | |
| Decrease in net assets applicable to Common shares from distributions to Common shareholders | | | (13,595,171 | ) | | (26,241,516 | ) | | (7,992,382 | ) | | (16,075,462 | ) |
| Capital Share Transactions | | | | | | | | | | | | | |
| Common shares: | | | | | | | | | | | | | |
| Proceeds from shelf offering, net of offering costs | | | 7,898,357 | | | 10,694,912 | | | 4,908,594 | | | 13,463,181 | |
| Net proceeds issued to shareholders due to reinvestment of distributions | | | 323,392 | | | 535,553 | | | 609,546 | | | 1,567,367 | |
| Net increase (decrease) in net assets applicable to Common shares from capital share transactions | | | 8,221,749 | | | 11,230,465 | | | 5,518,140 | | | 15,030,548 | |
| Net increase (decrease) in net assets applicable to Common shares | | | (30,929,370 | ) | | 35,486,583 | | | (19,276,509 | ) | | 31,986,209 | |
| Net assets applicable to Common shares at the beginning of period | | | 324,449,952 | | | 288,963,369 | | | 206,338,907 | | | 174,352,698 | |
| Net assets applicable to Common shares at the end of period | | $ | 293,520,582 | | $ | 324,449,952 | | $ | 187,062,398 | | $ | 206,338,907 | |
| Undistributed (Over-distribution of) net investment income at the end of period | | $ | 1,105,604 | | $ | 1,552,905 | | $ | (253,294 | ) | $ | (95,349 | ) |
See accompanying notes to financial statements.
Six months Ended April 30, 2011 (Unaudited)
| | | | | ) | | | ) |
| Cash Flows from Operating Activities: | | | | | | | |
| Net Increase (Decrease) in Net Assets Applicable to Common Shares from Operations | | $ | (27,807,903 | ) | $ | (55,264,449 | ) |
| Adjustments to reconcile the net increase (decrease) in net assets applicable to Common shares from operations to net cash provided by (used in) operating activities: | | | | | | | |
| Purchases of investments | | | (69,782,182 | ) | | (97,308,044 | ) |
| Proceeds from sales and maturities of investments | | | 52,377,415 | | | 104,648,139 | |
| Proceeds from (Payments for) closed/expired futures contracts | | | — | | | — | |
| Amortization (Accretion) of premiums and discounts, net | | | (565,717 | ) | | (4,720,865 | ) |
| (Increase) Decrease in: | | | | | | | |
| Receivable for interest | | | 353,205 | | | 87,408 | |
| Receivable for investments sold | | | 26,586,493 | | | 8,934,252 | |
| Receivable for shares sold | | | — | | | — | |
| Other assets | | | (29,015 | ) | | (311,135 | ) |
| Increase (Decrease) in: | | | | | | | |
| Payable for Auction Rate Preferred share dividends | | | (3,639 | ) | | 4,340 | |
| Payable for investments purchased | | | 2,549,430 | | | — | |
| Payable for variation margin on futures contracts | | | — | | | — | |
| Accrued interest on borrowings | | | — | | | — | |
| Accrued management fees | | | (43,443 | ) | | (68,116 | ) |
| Accrued other expenses | | | (38,408 | ) | | (110,583 | ) |
| Net realized (gain) loss from: | | | | | | | |
| Investments | | | (285,792 | ) | | (1,886,909 | ) |
| Futures contracts | | | — | | | — | |
| Net unrealized (appreciation) depreciation of: | | | | | | | |
| Investments | | | 46,234,039 | | | 82,612,012 | |
| Swaps | | | — | | | — | |
| Taxes paid on undistributed capital gains | | | — | | | (1,563 | ) |
| Net cash provided by (used in) operating activities | | | 29,544,483 | | | 36,614,487 | |
| Cash Flows from Financing Activities: | | | | | | | |
| (Increase) Decrease in: | | | | | | | |
| Deposits with brokers for open futures contracts | | | — | | | — | |
| Deferred offering costs | | | — | | | (1,482,308 | ) |
| Increase (Decrease) in: | | | | | | | |
| Cash overdraft balance | | | — | | | (7,829,422 | ) |
| Floating rate obligations | | | (12,805,000 | ) | | — | |
| Accrued offering costs | | | — | | | 1,279,683 | |
| Accrued shelf offering costs | | | — | | | — | |
| VRDP shares, at liquidation value | | | — | | | 388,400,000 | |
| ARPS, at liquidation value | | | — | | | (386,875,000 | ) |
| Cash distributions paid to Common shareholders | | | (16,990,077 | ) | | (24,608,787 | ) |
| Proceeds from shelf offering, net of offering costs | | | — | | | — | |
| Net cash provided by (used in) financing activities | | | (29,795,077 | ) | | (31,115,834 | ) |
| Net Increase (Decrease) in Cash | | | (250,594 | ) | | 5,498,653 | |
| Cash at the beginning of period | | | 4,990,387 | | | — | |
| Cash at the End of Period | | $ | 4,739,793 | | $ | 5,498,653 | |
| Supplemental Disclosure of Cash Flow Information | | | | | | | |
| Non-cash financing activities not included herein consists of reinvestments of Common share distributions of $1,118,231 for Quality Income (NQU). | |
| | | | | ) | | | ) |
| Cash paid for interest (excluding amortization of offering costs, where applicable) | | $ | 292,504 | | $ | 868,908 | |
See accompanying notes to financial statements
| | | | Premier Income (NPF | ) | | High Income Opportunity 2 (NMD | ) |
| Cash Flows from Operating Activities: | | | | | | | |
| Net Increase (Decrease) in Net Assets Applicable to Common Shares from Operations | | $ | (12,390,921 | ) | $ | (16,802,267 | ) |
| Adjustments to reconcile the net increase (decrease) in net assets applicable to Common shares from operations to net cash provided by (used in) operating activities: | | | | | | | |
| Purchases of investments | | | (18,115,543 | ) | | (19,736,586 | ) |
| Proceeds from sales and maturities of investments | | | 16,454,758 | | | 12,773,892 | |
| Proceeds from (Payments for) closed/expired futures contracts | | | — | | | 288,529 | |
| Amortization (Accretion) of premiums and discounts, net | | | (1,164,266 | ) | | (2,629 | ) |
| (Increase) Decrease in: | | | | | | | |
| Receivable for interest | | | (33,246 | ) | | 40,406 | |
| Receivable for investments sold | | | 2,491,559 | | | (14,837 | ) |
| Receivable for shares sold | | | — | | | 134,238 | |
| Other assets | | | 1,040 | | | 33,492 | |
| Increase (Decrease) in: | | | | | | | |
| Payable for Auction Rate Preferred share dividends | | | (2,257 | ) | | — | |
| Payable for investments purchased | | | 644,391 | | | (170,820 | ) |
| Payable for variation margin on futures contracts | | | — | | | (28,750 | ) |
| Accrued interest on borrowings | | | — | | | (508 | ) |
| Accrued management fees | | | (22,319 | ) | | (23,556 | ) |
| Accrued other expenses | | | (26,668 | ) | | (2,340 | ) |
| Net realized (gain) loss from: | | | | | | | |
| Investments | | | 371,844 | | | (1,085,020 | ) |
| Futures contracts | | | — | | | (288,529 | ) |
| Net unrealized (appreciation) depreciation of: | | | | | | | |
| Investments | | | 21,559,231 | | | 26,601,669 | |
| Swaps | | | — | | | (728,797 | ) |
| Taxes paid on undistributed capital gains | | | (20 | ) | | (8,747 | ) |
| Net cash provided by (used in) operating activities | | | 9,767,583 | | | 978,840 | |
| Cash Flows from Financing Activities: | | | | | | | |
| (Increase) Decrease in: | | | | | | | |
| Deposits with brokers for open futures contracts | | | — | | | 100,000 | |
| Deferred offering costs | | | — | | | (36,675 | ) |
| Increase (Decrease) in: | | | | | | | |
| Cash overdraft balance | | | — | | | 243,551 | |
| Floating rate obligations | | | (4,117,400 | ) | | — | |
| Accrued offering costs | | | — | | | — | |
| Accrued shelf offering costs | | | — | | | (55,098 | ) |
| VRDP shares, at liquidation value | | | — | | | — | |
| ARPS, at liquidation value | | | — | | | — | |
| Cash distributions paid to Common shareholders | | | (8,655,960 | ) | | (7,428,755 | ) |
| Proceeds from shelf offering, net of offering costs | | | — | | | 4,908,594 | |
| Net cash provided by (used in) financing activities | | | (12,773,360 | ) | | (2,268,383 | ) |
| Net Increase (Decrease) in Cash | | | (3,005,777 | ) | | (1,289,543 | ) |
| Cash at the beginning of period | | | 4,353,769 | | | 1,289,543 | |
| Cash at the End of Period | | $ | 1,347,992 | | $ | — | |
| Supplemental Disclosure of Cash Flow Information | | | | | | | |
| Non-cash financing activities not included herein consists of reinvestments of Common share distributions of $609,546 for High Income Opportunity 2 (NMD). |
| | | | | ) | | | ) |
| Cash paid for interest (excluding amortization of offering costs, where applicable) | | $ | 164,921 | | $ | 229,584 | |
See accompanying notes to financial statements.
| | | Financial |
| | | Highlights (Unaudited) |
| | | |
| | | Selected data for a Common share outstanding throughout each period: |
| | | | | | | Investment Operations | | | Less Distributions | | | | | | | | | | |
| | | Beginning Common Share Net Asset Value | | Net Investment Income (Loss | ) | Net Realized/ Unrealized Gain (Loss | ) | Distributions from Net Investment Income to Auction Rate Preferred Shareholders | (a) | Distributions from Capital Gains to Auction Rate Preferred Shareholders | (a) | Total | | Net Investment Income to Common Share- holders | | Capital Gains to Common Share- holders | | Total | | Discount from Common Shares Repur- chased and Retired | | Ending Common Share Net Asset Value | | Ending Market Value | |
| Investment Quality (NQM) | | | | | | | | | | | | | | | | | | | | | | | | | | | | | | | |
| Year Ended 10/31: | | | | | | | | | | | | | | | | | | | | | | | | | | | | | | | | | | |
| 2011(f) | | $ | 15.13 | | $ | .52 | | $ | (1.29 | ) | $ | (.01 | ) | $ | — | | $ | (.78 | ) | $ | (.47 | ) | $ | — | | $ | (.47 | ) | $ | — | | $ | 13.88 | | $ | 13.45 | |
| 2010 | | | 14.26 | | | 1.04 | | | .76 | | | (.02 | ) | | — | | | 1.78 | | | (.91 | ) | | — | | | (.91 | ) | | — | | | 15.13 | | | 14.95 | |
| 2009 | | | 12.18 | | | 1.02 | | | 1.91 | | | (.04 | ) | | (.01 | ) | | 2.88 | | | (.77 | ) | | (.03 | ) | | (.80 | ) | | — | | | 14.26 | | | 13.13 | |
| 2008 | | | 15.03 | | | 1.01 | | | (2.80 | ) | | (.29 | ) | | — | | | (2.08 | ) | | (.77 | ) | | — | | | (.77 | ) | | — | | | 12.18 | | | 10.64 | |
| 2007 | | | 15.71 | | | 1.02 | | | (.60 | ) | | (.30 | ) | | — | | | .12 | | | (.80 | ) | | — | | | (.80 | ) | | — | | | 15.03 | | | 13.88 | |
| 2006 | | | 15.49 | | | 1.05 | | | .42 | | | (.24 | ) | | (.03 | ) | | 1.20 | | | (.84 | ) | | (.14 | ) | | (.98 | ) | | — | | | 15.71 | | | 15.60 | |
| | | | | | | | | | | | | | | | | | | | | | | | | | | | | | | | | | | | | | |
| Select Quality (NQS) | | | | | | | | | | | | | | | | | | | | | | | | | | | | | | | |
| Year Ended 10/31: | | | | | | | | | | | | | | | | | | | | | | | | | | | | | | | | | | |
| 2011(f) | | | 14.82 | | | .55 | | | (1.51 | ) | | (.01 | ) | | — | * | | (.97 | ) | | (.52 | ) | | (.08 | ) | | (.60 | ) | | — | | | 13.25 | | | 13.47 | |
| 2010 | | | 14.14 | | | 1.12 | | | .61 | | | (.03 | ) | | — | * | | 1.70 | | | (1.00 | ) | | (.02 | ) | | (1.02 | ) | | — | | | 14.82 | | | 15.35 | |
| 2009 | | | 12.01 | | | 1.12 | | | 1.92 | | | (.06 | ) | | — | | | 2.98 | | | (.85 | ) | | — | | | (.85 | ) | | — | | | 14.14 | | | 13.77 | |
| 2008 | | | 15.05 | | | 1.08 | | | (3.02 | ) | | (.30 | ) | | — | | | (2.24 | ) | | (.80 | ) | | — | | | (.80 | ) | | — | | | 12.01 | | | 10.99 | |
| 2007 | | | 15.62 | | | 1.07 | | | (.52 | ) | | (.29 | ) | | — | | | .26 | | | (.83 | ) | | — | | | (.83 | ) | | — | | | 15.05 | | | 15.00 | |
| 2006 | | | 15.46 | | | 1.07 | | | .23 | | | (.26 | ) | | — | | | 1.04 | | | (.88 | ) | | — | | | (.88 | ) | | — | | | 15.62 | | | 15.47 | |
| | | | ARPS at End of Period | |
| | | | Aggregate Amount Outstanding (000 | ) | | Liquidation Value Per Share | | | Asset Coverage Per Share | |
| Investment Quality (NQM) | | | | | | | | | | |
| Year Ended 10/31: | | | | | | | | | | |
| 2011(f) | | $ | 210,700 | | $ | 25,000 | | $ | 84,063 | |
| 2010 | | | 210,700 | | | 25,000 | | | 89,379 | |
| 2009 | | | 210,700 | | | 25,000 | | | 85,621 | |
| 2008 | | | 229,450 | | | 25,000 | | | 72,545 | |
| 2007 | | | 301,000 | | | 25,000 | | | 69,706 | |
| 2006 | | | 301,000 | | | 25,000 | | | 71,634 | |
| | | | | | | | | | | |
| Select Quality (NQS) | | | | | | | | | | |
| Year Ended 10/31: | | | | | | | | | | |
| 2011(f) | | | 251,275 | | | 25,000 | | | 70,160 | |
| 2010 | | | 251,275 | | | 25,000 | | | 75,367 | |
| 2009 | | | 251,275 | | | 25,000 | | | 72,879 | |
| 2008 | | | 267,575 | | | 25,000 | | | 63,171 | |
| 2007 | | | 279,000 | | | 25,000 | | | 70,849 | |
| 2006 | | | 279,000 | | | 25,000 | | | 72,491 | |
| | | | | Ratios/Supplemental Data | |
| | Total Returns | | | | | | Ratios to Average Net Assets Applicable to Common Shares(c)(d) | | | | |
| | Based on Market Value | (b) | | Based on Common Share Net Asset Value | (b) | | Ending Net Assets Applicable to Common Shares (000 | ) | | Expenses Including Interest | (e) | | Expenses Excluding Interest | | | Net Investment Income | | | Portfolio Turnover Rate | |
| | | | | | | | | | | | | | | | | | | | | |
| | (6.83 | )% | | (5.07 | )% | $ | 497,785 | | | 1.28 | %** | | 1.16 | %** | | 7.56 | %** | | 7 | % |
| | 21.33 | | | 12.85 | | | 542,582 | | | 1.24 | | | 1.12 | | | 7.08 | | | 14 | |
| | 31.77 | | | 24.35 | | | 510,910 | | | 1.34 | | | 1.17 | | | 7.66 | | | 8 | |
| | (18.72 | ) | | (14.43 | ) | | 436,370 | | | 1.46 | | | 1.20 | | | 7.07 | | | 9 | |
| | (6.17 | ) | | .82 | | | 538,266 | | | 1.35 | | | 1.19 | | | 6.67 | | | 11 | |
| | 15.33 | | | 8.09 | | | 561,471 | | | 1.20 | | | 1.20 | | | 6.79 | | | 10 | |
| | | | | | | | | | | | | | | | | | | | | |
| | | | | | | | | | | | | | | | | | | | | |
| | (8.19 | ) | | (6.44 | ) | | 453,908 | | | 1.20 | ** | | 1.17 | ** | | 8.35 | ** | | 1 | |
| | 19.50 | | | 12.38 | | | 506,237 | | | 1.16 | | | 1.13 | | | 7.77 | | | 20 | |
| | 34.19 | | | 25.67 | | | 481,233 | | | 1.29 | | | 1.25 | | | 8.66 | | | 8 | |
| | (22.19 | ) | | (15.50 | ) | | 408,541 | | | 1.27 | | | 1.22 | | | 7.54 | | | 10 | |
| | 2.31 | | | 1.70 | | | 511,670 | | | 1.21 | | | 1.18 | | | 6.95 | | | 8 | |
| | 10.47 | | | 6.94 | | | 529,996 | | | 1.18 | | | 1.18 | | | 6.91 | | | 5 | |
| (a) | The amounts shown are based on Common share equivalents. |
| (b) | Total Return Based on Market Value is the combination of changes in the market price per share and the effect of reinvested dividend income and reinvested capital gains distributions, if any, at the average price paid per share at the time of reinvestment. The last dividend declared in the period, which is typically paid on the first business day of the following month, is assumed to be reinvested at the ending market price. The actual reinvestment for the last dividend declared in the period may take place over several days, and in some instances may not be based on the market price, so the actual reinvestment price may be different from the price used in the calculation. |
| | Total returns are not annualized. |
| | Total Return Based on Common Share Net Asset Value is the combination of changes in Common share net asset value, reinvested dividend income at net asset value and reinvested capital gains distributions at net asset value, if any. The last dividend declared in the period, which is typically paid on the first business day of the following month, is assumed to be reinvested at the ending net asset value. The actual reinvest price for the last dividend declared in the period may often be based on the Fund’s market price (and not its net asset value), and therefore may be different from the price used in the calculation. Total returns are not annualized. |
| (c) | Ratios do not reflect the effect of dividend payments to Auction Rate Preferred shareholders, where applicable; Net Investment Income ratios reflect income earned and expenses incurred on assets attributable to ARPS, where applicable. |
| (d) | Ratios do not reflect the effect of custodian fee credits earned on the Fund’s net cash on deposit with the custodian bank, where applicable. |
| (e) | The expense ratios reflect, among other things, the interest expense deemed to have been paid by the Fund on the floating rate certificates issued by the special purpose trusts for the self-deposited inverse floaters held by the Fund, where applicable, as described in Footnote 1 – General Information and Significant Accounting Policies, Inverse Floating Rate Securities. |
| (f) | For the six months ended April 30, 2011. |
| * | Rounds to less than $.01 per share. |
| ** | Annualized. |
See accompanying notes to financial statements.
| | | Financial |
| | | Highlights (Unaudited) (continued) |
| | | |
| | | Selected data for a Common share outstanding throughout each period: |
| | | | | | | Investment Operations | | | Less Distributions | | | | | | | | | | |
| | | Beginning Common Share Net Asset Value | | Net Investment Income (Loss | ) | Net Realized/ Unrealized Gain (Loss | ) | Distributions from Net Investment Income to Auction Rate Preferred Shareholders | (a) | Distributions from Capital Gains to Auction Rate Preferred Shareholders | (a) | Total | | Net Investment Income to Common Share- holders | | Capital Gains to Common Share- holders | | Total | | Discount from Common Shares Repur- chased and Retired | | Ending Common Share Net Asset Value | | Ending Market Value | |
| Quality Income (NQU) | | | | | | | | | | | | | | | | | | | | | | | | | | | | | | |
| Year Ended 10/31: | | | | | | | | | | | | | | | | | | | | | | | | | | | | | | | | | | |
| 2011(f) | | $ | 14.83 | | $ | .48 | | $ | (1.49 | ) | $ | (.01 | ) | $ | — | | $ | (1.02 | ) | $ | (.47 | ) | $ | — | | $ | (.47 | ) | $ | — | | $ | 13.34 | | $ | 13.04 | |
| 2010 | | | 14.29 | | | 1.04 | | | .45 | | | (.03 | ) | | — | | | 1.46 | | | (.92 | ) | | — | | | (.92 | ) | | — | | | 14.83 | | | 14.79 | |
| 2009 | | | 12.68 | | | 1.05 | | | 1.42 | | | (.06 | ) | | — | | | 2.41 | | | (.80 | ) | | — | | | (.80 | ) | | — | | | 14.29 | | | 13.26 | |
| 2008 | | | 14.94 | | | 1.03 | | | (2.26 | ) | | (.30 | ) | | — | | | (1.53 | ) | | (.73 | ) | | — | | | (.73 | ) | | — | | | 12.68 | | | 11.67 | |
| 2007 | | | 15.49 | | | 1.01 | | | (.51 | ) | | (.30 | ) | | — | | | .20 | | | (.75 | ) | | — | | | (.75 | ) | | — | | | 14.94 | | | 13.64 | |
| 2006 | | | 15.26 | | | 1.01 | | | .30 | | | (.26 | ) | | — | | | 1.05 | | | (.82 | ) | | — | | | (.82 | ) | | — | | | 15.49 | | | 14.73 | |
| | | | | | | | | | | | | | | | | | | | | | | | | | | | | | | | | �� | | | | | |
| Premier Income (NPF) | | | | | | | | | | | | | | | | | | | | | | | | | | | | | | | |
| Year Ended 10/31: | | | | | | | | | | | | | | | | | | | | | | | | | | | | | | | | | | |
| 2011(f) | | | 14.70 | | | .49 | | | (1.09 | ) | | (.01 | ) | | — | | | (.61 | ) | | (.44 | ) | | — | | | (.44 | ) | | — | | | 13.65 | | | 12.78 | |
| 2010 | | | 13.86 | | | .98 | | | .74 | | | (.03 | ) | | — | | | 1.69 | | | (.85 | ) | | — | | | (.85 | ) | | — | | | 14.70 | | | 14.36 | |
| 2009 | | | 11.68 | | | .96 | | | 2.00 | | | (.05 | ) | | — | | | 2.91 | | | (.73 | ) | | — | | | (.73 | ) | | — | * | | 13.86 | | | 12.40 | |
| 2008 | | | 14.79 | | | .94 | | | (3.09 | ) | | (.28 | ) | | — | | | (2.43 | ) | | (.68 | ) | | — | | | (.68 | ) | | — | * | | 11.68 | | | 10.07 | |
| 2007 | | | 15.39 | | | .95 | | | (.59 | ) | | (.29 | ) | | — | | | .07 | | | (.67 | ) | | — | | | (.67 | ) | | — | * | | 14.79 | | | 13.30 | |
| 2006 | | | 14.90 | | | .94 | | | .51 | | | (.26 | ) | | — | | | 1.19 | | | (.70 | ) | | — | | | (.70 | ) | | — | | | 15.39 | | | 13.65 | |
| | | ARPS at End of Period | | VRDP Shares at End of Period | |
| | | Aggregate Amount Outstanding (000 | ) | Liquidation Value Per Share | | Asset Coverage Per Share | | Aggregate Amount Outstanding (000 | ) | Liquidation Value Per Share | | Asset
Coverage Per Share | |
| Quality Income (NQU) | | | | | | | | | | | | | | | | | | | |
| Year Ended 10/31: | | | | | | | | | | | | | | | | | | | |
| 2011(f) | | $ | — | | $ | — | | $ | — | | $ | 388,400 | | $ | 100,000 | | $ | 286,686 | |
| 2010 | | | 386,875 | | | 25,000 | | | 77,018 | | | — | | | — | | | — | |
| 2009 | | | 386,875 | | | 25,000 | | | 75,080 | | | — | | | — | | | — | |
| 2008 | | | 416,375 | | | 25,000 | | | 66,284 | | | — | | | — | | | — | |
| 2007 | | | 452,000 | | | 25,000 | | | 69,806 | | | — | | | — | | | — | |
| 2006 | | | 452,000 | | | 25,000 | | | 71,446 | | | — | | | — | | | — | |
| | | | | | | | | | | | | | | | | | | | |
| Premier Income (NPF) | | | | | | | | | | | | | | | | | | | |
| Year Ended 10/31: | | | | | | | | | | | | | | | | | | | |
| 2011(f) | | | 126,850 | | | 25,000 | | | 78,485 | | | — | | | — | | | — | |
| 2010 | | | 126,850 | | | 25,000 | | | 82,633 | | | — | | | — | | | — | |
| 2009 | | | 126,850 | | | 25,000 | | | 79,330 | | | — | | | — | | | — | |
| 2008 | | | 126,850 | | | 25,000 | | | 70,825 | | | — | | | — | | | — | |
| 2007 | | | 165,000 | | | 25,000 | | | 69,603 | | | — | | | — | | | — | |
| 2006 | | | 165,000 | | | 25,000 | | | 71,839 | | | — | | | — | | | — | |
| | | | | | | | Ratios/Supplemental Data | |
| | Total Returns | | | | | | Ratios to Average Net Assets Applicable to Common Shares(c)(d) | | | | |
| | Based on Market Value | (b) | | Based on Common Share Net Asset Value | (b) | | Ending Net Assets Applicable to Common Shares (000 | ) | | Expenses Including Interest | (e) | | Expenses Excluding Interest | | | Net Investment Income | | | Portfolio Turnover Rate | |
| | | | | | | | | | | | | | | | | | | | | |
| | (8.65 | )% | | (6.81 | )% | $ | 725,089 | | | 1.88 | %** | | 1.64 | %** | | 7.16 | %** | | 8 | % |
| | 18.94 | | | 10.56 | | | 804,985 | | | 1.18 | | | 1.12 | | | 7.16 | | | 17 | |
| | 21.10 | | | 19.58 | | | 774,982 | | | 1.28 | | | 1.20 | | | 7.80 | | | 8 | |
| | (9.55 | ) | | (10.67 | ) | | 687,593 | | | 1.38 | | | 1.19 | | | 7.15 | | | 9 | |
| | (2.54 | ) | | 1.31 | | | 810,086 | | | 1.38 | | | 1.17 | | | 6.65 | | | 5 | |
| | 8.55 | | | 7.07 | | | 839,751 | | | 1.18 | | | 1.18 | | | 6.62 | | | 11 | |
| | | | | | | | | | | | | | | | | | | | | |
| | | | | | | | | | | | | | | | | | | | | |
| | (7.96 | ) | | (4.25 | ) | | 271,385 | | | 1.30 | ** | | 1.17 | ** | | 7.32 | ** | | 4 | |
| | 23.21 | | | 12.65 | | | 292,427 | | | 1.29 | | | 1.17 | | | 6.80 | | | 4 | |
| | 31.11 | | | 25.53 | | | 275,671 | | | 1.43 | | | 1.21 | | | 7.47 | | | 7 | |
| | (19.97 | ) | | (17.03 | ) | | 232,517 | | | 1.78 | | | 1.23 | | | 6.74 | | | 7 | |
| | 2.28 | | | .48 | | | 294,378 | | | 1.84 | | | 1.20 | | | 6.30 | | | 10 | |
| | 5.93 | | | 8.20 | | | 309,140 | | | 1.24 | | | 1.24 | | | 6.27 | | | 35 | |
| (a) | The amounts shown are based on Common share equivalents. |
| (b) | Total Return Based on Market Value is the combination of changes in the market price per share and the effect of reinvested dividend income and reinvested capital gains distributions, if any, at the average price paid per share at the time of reinvestment. The last dividend declared in the period, which is typically paid on the first business day of the following month, is assumed to be reinvested at the ending market price. The actual reinvestment for the last dividend declared in the period may take place over several days, and in some instances may not be based on the market price, so the actual reinvestment price may be different from the price used in the calculation. |
| | Total returns are not annualized. |
| | Total Return Based on Common Share Net Asset Value is the combination of changes in Common share net asset value, reinvested dividend income at net asset value and reinvested capital gains distributions at net asset value, if any. The last dividend declared in the period, which is typically paid on the first business day of the following month, is assumed to be reinvested at the ending net asset value. The actual reinvest price for the last dividend declared in the period may often be based on the Fund’s market price (and not its net asset value), and therefore may be different from the price used in the calculation. Total returns are not annualized. |
| (c) | Ratios do not reflect the effect of dividend payments to Auction Rate Preferred shareholders, where applicable; Net Investment Income ratios reflect income earned and expenses incurred on assets attributable to ARPS and/or VRDP shares, where applicable. |
| (d) | Ratios do not reflect the effect of custodian fee credits earned on the Fund’s net cash on deposit with the custodian bank, where applicable. |
| (e) | The expense ratios reflect, among other things, payments to VRDP shareholders and/or the interest expense deemed to have been paid by the Fund on the floating rate certificates issued by the special purpose trusts for the self-deposited inverse floaters held by the Fund, where applicable, both as described in Footnote 1 – General Information and Significant Accounting Policies, Variable Rate Demand Preferred Shares and Inverse Floating Rate Securities, respectively. |
| (f) | For the six months ended April 30, 2011. |
| * | Rounds to less than $.01 per share. |
| ** | Annualized. |
See accompanying notes to financial statements.
| | | Financial |
| | | Highlights (Unaudited) (continued) |
| | | |
| | | Selected data for a Common share outstanding throughout each period: |
| | | | | | | Investment Operations | | | Less Distributions | | | | | | | | | | | | | | | | |
| | | Beginning Common Share Net Asset Value | | Net Investment Income (Loss | ) | Net Realized/ Unrealized Gain (Loss | ) | Distributions from Net Investment Income to Auction Rate Preferred Share- holders | (a) | Distributions from Capital Gains to Auction Rate Preferred Share- holders | (a) | Total | | Net Investment Income to Common Share- holders | | Capital Gains to Common Share- holders | | Total | | Discount from Common Shares Repur- chased and Retired | | Premium from Common Shares Sold through Shelf Offering | | Offering Costs and Auction Rate Preferred Share Under- writing Discounts | | Ending Common Share Net Asset Value | | Ending Market Value | |
| High Income Opportunity (NMZ ) | | | | | | | | | | | | | | | | | | | | | | | |
| Year Ended 10/31: | | | | | | | | | | | | | | | | | | | | | | | | | | | | | | | | | | | | | | | | |
| 2011(h) | | $ | 12.13 | | $ | .49 | | $ | (1.46 | ) | $ | (.01 | ) | $ | — | | $ | (.98 | ) | $ | (.50 | ) | $ | — | | $ | (.50 | ) | $ | — | | $ | .03 | | $ | — | * | $ | 10.68 | | $ | 11.77 | |
| 2010 | | | 11.18 | | | 1.04 | | | .89 | | | (.01 | ) | | — | | | 1.92 | | | (1.01 | ) | | — | | | (1.01 | ) | | — | | | .04 | | | — | * | | 12.13 | | | 12.95 | |
| 2009 | | | 9.63 | | | 1.06 | | | 1.48 | | | (.04 | ) | | — | | | 2.50 | | | (1.04 | ) | | — | | | (1.04 | ) | | — | | | .09 | | | — | * | | 11.18 | | | 11.92 | |
| 2008 | | | 15.36 | | | 1.29 | | | (5.71 | ) | | (.23 | ) | | (.02 | ) | | (4.67 | ) | | (.98 | ) | | (.09 | ) | | (1.07 | ) | | — | | | .01 | | | — | * | | 9.63 | | | 11.02 | |
| 2007 | | | 16.00 | | | 1.23 | | | (.66 | ) | | (.24 | ) | | — | * | | .33 | | | (.98 | ) | | — | * | | (.98 | ) | | — | | | .01 | | | — | | | 15.36 | | | 15.82 | |
| 2006 | | | 15.36 | | | 1.21 | | | .65 | | | (.19 | ) | | — | | | 1.67 | | | (1.04 | ) | | — | | | (1.04 | ) | | — | | | — | | | .01 | | | 16.00 | | | 17.25 | |
| | | | | | | | | | | | | | | | | | | | | | | | | | | | | | | | | | | | | | | | | | | | |
| High Income Opportunity 2 (NMD) | | | | | | | | | | | | | | | | | | | | | | | | | | | | | | | | | | |
| Year Ended 10/31: | | | | | | | | | | | | | | | | | | | | | | | | | | | | | | | | | | | | | | | | |
| 2011(h) | | | 11.92 | | | .45 | | | (1.44 | ) | | — | | | — | | | (.99 | ) | | (.46 | ) | | — | | | (.46 | ) | | — | | | .03 | | | — | * | | 10.50 | | | 10.79 | |
| 2010 | | | 10.88 | | | .91 | | | 1.04 | | | — | | | — | | | 1.95 | | | (.96 | ) | | — | | | (.96 | ) | | — | | | .07 | | | (.02 | ) | | 11.92 | | | 12.59 | |
| 2009 | | | 9.13 | | | .92 | | | 1.79 | | | — | | | — | | | 2.71 | | | (.96 | ) | | — | | | (.96 | ) | | — | | | — | | | — | | | 10.88 | | | 11.39 | |
| 2008(g) | | | 14.33 | | | .89 | | | (5.27 | ) | | — | | | — | | | (4.38 | ) | | (.79 | ) | | — | | | (.79 | ) | | — | | | — | | | (.03 | ) | | 9.13 | | | 10.04 | |
| | | | ARPS at End of Period | | | Borrowings at End of Period | |
| | | | Aggregate Amount Outstanding (000 | ) | | Liquidation Value Per Share | | | Asset Coverage Per Share | | | Aggregate Amount Outstanding (000 | ) | | Asset Coverage Per $1,000 | |
| High Income Opportunity (NMZ) | | | | | | | | | | | | | | | | |
| Year Ended 10/31: | | | | | | | | | | | | | | | | |
| 2011(h) | | $ | 95,000 | | $ | 25,000 | | $ | 102,262 | | $ | — | | $ | — | |
| 2010 | | | 95,000 | | | 25,000 | | | 110,382 | | | — | | | — | |
| 2009 | | | 95,000 | | | 25,000 | | | 101,043 | | | — | | | — | |
| 2008 | | | 155,000 | | | 25,000 | | | 62,117 | | | — | | | — | |
| 2007 | | | 155,000 | | | 25,000 | | | 83,304 | | | — | | | — | |
| 2006 | | | 155,000 | | | 25,000 | | | 85,113 | | | — | | | — | |
| | | | | | | | | | | | | | | | | |
| High Income Opportunity 2 (NMD) | | | | | | | | | | | | | | | | |
| Year Ended 10/31: | | | | | | | | | | | | | | | | |
| 2011(h) | | | — | | | — | | | — | | | 35,000 | | | 6,347 | |
| 2010 | | | — | | | — | | | — | | | 35,000 | | | 6,895 | |
| 2009 | | | — | | | — | | | — | | | 35,000 | | | 5,982 | |
| 2008(g) | | | — | | | — | | | — | | | 40,000 | | | 4,619 | |
| | | | | | | | Ratios/Supplemental Data | |
| | Total Returns | | | | | | Ratios to Average Net Assets Applicable to Common Shares Before Reimbursement(c) | | | Ratios to Average Net Assets Applicable to Common Shares After Reimbursement(c)(d) | | | | |
| | Based on Market Value | (b) | | Based on Common Share Net Asset Value | (b) | | Ending Net Assets Applicable to Common Shares (000 | ) | | Expenses Including Interest | (e)(f) | | Expenses Excluding Interest | | | Net Investment Income | (f) | | Expenses Including Interest | (e)(f) | | Expenses Excluding Interest | | | Net Investment Income | (f) | | Portfolio Turnover Rate | |
| | | | | | | | | | | | | | | | | | | | | | | | | | | | | | |
| | (4.96 | )% | | (7.76 | )% | $ | 293,521 | | | 1.42 | %** | | 1.38 | %** | | 9.09 | %** | | 1.30 | %** | | 1.26 | %** | | 9.21 | %** | | 19 | % |
| | 17.90 | | | 18.18 | | | 324,450 | | | 1.22 | | | 1.20 | | | 8.66 | | | 1.00 | | | .99 | | | 8.88 | | | 7 | |
| | 20.00 | | | 30.90 | | | 288,963 | | | 1.53 | | | 1.50 | | | 10.88 | | | 1.17 | | | 1.14 | | | 11.24 | | | 28 | |
| | (24.77 | ) | | (32.63 | ) | | 230,123 | | | 1.56 | | | 1.36 | | | 8.95 | | | 1.08 | | | .88 | | | 9.43 | | | 23 | |
| | (2.68 | ) | | 2.14 | | | 361,484 | | | 1.50 | | | 1.28 | | | 7.31 | | | 1.05 | | | .83 | | | 7.76 | | | 12 | |
| | 14.79 | | | 11.34 | | | 372,700 | | | 1.21 | | | 1.21 | | | 7.31 | | | .75 | | | .75 | | | 7.77 | | | 9 | |
| | | | | | | | | | | | | | | | | | | | | | | | | | | | | | |
| | | | | | | | | | | | | | | | | | | | | | | | | | | | | | |
| | (10.56 | ) | | (8.06 | ) | | 187,062 | | | 1.54 | ** | | 1.29 | ** | | 8.47 | ** | | N/A | | | N/A | | | N/A | | | 6 | |
| | 20.03 | | | 19.12 | | | 206,339 | | | 1.50 | | | 1.26 | | | 7.95 | | | N/A | | | N/A | | | N/A | | | 19 | |
| | 25.45 | | | 32.43 | | | 174,353 | | | 1.50 | | | 1.24 | | | 10.07 | | | N/A | | | N/A | | | N/A | | | 45 | |
| | (28.82 | ) | | (32.15 | ) | | 144,745 | | | 1.19 | ** | | .89 | ** | | 6.69 | ** | | .82 | ** | | .52 | ** | | 7.06 | ** | | 22 | |
| (a) | The amounts shown are based on Common share equivalents. |
| (b) | Total Return Based on Market Value is the combination of changes in the market price per share and the effect of reinvested dividend income and reinvested capital gains distributions, if any, at the average price paid per share at the time of reinvestment. The last dividend declared in the period, which is typically paid on the first business day of the following month, is assumed to be reinvested at the ending market price. The actual reinvestment for the last dividend declared in the period may take place over several days, and in some instances may not be based on the market price, so the actual reinvestment price may be different from the price used in the calculation. |
| | Total returns are not annualized. |
| | Total Return Based on Common Share Net Asset Value is the combination of changes in Common share net asset value, reinvested dividend income at net asset value and reinvested capital gains distributions at net asset value, if any. The last dividend declared in the period, which is typically paid on the first business day of the following month, is assumed to be reinvested at the ending net asset value. The actual reinvest price for the last dividend declared in the period may often be based on the Fund’s market price (and not its net asset value), and therefore may be different from the price used in the calculation. Total returns are not annualized. |
| (c) | Ratios do not reflect the effect of dividend payments to Auction Rate Preferred shareholders, where applicable; Net Investment Income ratios reflect income earned and expenses incurred on assets attributable to ARPS and/or Borrowings, where applicable. |
| (d) | After expense reimbursement from the Adviser, where applicable. Ratios do not reflect the effect of custodian fee credits earned on the Fund’s net cash on deposit with the custodian bank, where applicable. As of August 31, 2008, the Adviser is no longer reimbursing High Income Opportunity 2 (NMD) for any fees and expenses. |
| (e) | The expense ratios reflect, among other things, the interest expense deemed to have been paid by the Fund on the floating rate certificates issued by the special purpose trusts for the self-deposited inverse floaters held by the Fund, where applicable, as described in Footnote 1 – General Information and Significant Accounting Policies, Inverse Floating Rate Securities. |
| (f) | Each ratio for High Income Opportunity 2 (NMD) includes the effect of the interest expense paid on borrowings, as described in Footnote 8 – Borrowing Arrangements as follows: |
| | | | Ratios of Borrowings Interest Expense to Average Net Assets Applicable to Common Shares |
| High Income Opportunity 2 (NMD) | | | | |
| Year Ended 10/31: | | | | |
| 2011(h) | | | .25 | %** |
| 2010 | | | .24 | |
| 2009 | | | .26 | |
| 2008(g) | | | .30 | ** |
| (g) | For the period November 15, 2007 (commencement of operations) through October 31, 2008. |
| (h) | For the six months ended April 30, 2011. |
| * | Rounds to less than $.01 per share. |
| ** | Annualized. |
| N/A | Fund does not have a contractual reimbursement agreement with the Adviser. |
See accompanying notes to financial statements.
| | | Notes to |
| | | Financial Statements (Unaudited) |
1. General Information and Significant Accounting Policies
General Information
The funds covered in this report and their corresponding Common share stock exchange symbols are Nuveen Investment Quality Municipal Fund, Inc. (NQM), Nuveen Select Quality Municipal Fund, Inc. (NQS), Nuveen Quality Income Municipal Fund, Inc. (NQU), Nuveen Premier Municipal Income Fund, Inc. (NPF), Nuveen Municipal High Income Opportunity Fund (NMZ) and Nuveen Municipal High Income Opportunity Fund 2 (NMD) (collectively, the “Funds”). Common shares of Investment Quality (NQM), Select Quality (NQS), Quality Income (NQU), Premier Income (NPF) and High Income Opportunity 2 (NMD) are traded on the New York Stock Exchange (“NYSE”) while Common shares of High Income Opportunity (NMZ) are traded on the NYSE Amex. The Funds are registered under the Investment Company Act of 1940, as amended, as closed-end registered investment companies.
Effective January 1, 2011, the Funds’ adviser, Nuveen Asset Management, a wholly-owned subsidiary of Nuveen Investments, Inc. (“Nuveen”), changed its name to Nuveen Fund Advisors, Inc. (the “Adviser”). Concurrently, the Adviser formed a wholly-owned subsidiary, Nuveen Asset Management, LLC (the “Sub-Adviser”), to house its portfolio management capabilities and to serve as the Funds’ sub-adviser, and the Funds’ portfolio managers became employees of the Sub-Adviser. This allocation of responsibilities between the Adviser and the Sub-Adviser affects each of the Funds. The Adviser will compensate the Sub-Adviser for the portfolio management services it provides to the Funds from each Fund’s management fee.
Each Fund seeks to provide current income exempt from regular federal income tax by investing primarily in a portfolio of municipal obligations issued by state and local government authorities or certain U.S. territories.
Significant Accounting Policies
The following is a summary of significant accounting policies followed by the Funds in the preparation of their financial statements in accordance with U.S. generally accepted accounting principles (“U.S. GAAP”).
Investment Valuation
Prices of municipal bonds and forward interest rate swap contracts are provided by a pricing service approved by the Funds’ Board of Directors/Trustees. These securities are generally classified as Level 2 for fair value measurement purposes. When price quotes are not readily available (which is usually the case for municipal bonds) the pricing service establishes a security’s fair value using methods that may include consideration of the following: yields or prices of investments of comparable quality, type of issue, coupon, maturity and rating, market quotes or indications of value from security dealers, evaluations of anticipated cash flows or collateral, general market conditions and other information and analysis, including the obligor’s credit characteristics considered relevant. In pricing certain securities, particularly less liquid and lower quality securities, the pricing service may consider information about a security, its issuer, or market activity provided by the Adviser. These securities are generally classified as Level 2 or Level 3 depending on the priority of the significant inputs.
Futures contracts are valued using the closing settlement price or, in the absence of such a price, the last traded price. Futures contracts are generally classified as Level 1.
Certain securities may not be able to be priced by the pre-established pricing methods as described above. Such securities may be valued by the Funds’ Board of Directors/Trustees or its designee at fair value. These securities generally include, but are not limited to, restricted securities (securities which may not be publicly sold without registration under the Securities Act of 1933, as amended) for which a pricing service is unable to provide a market price; securities whose trading has been formally suspended; debt securities that have gone into default and for which there is no current market quotation; a security whose market price is not available from a pre-established pricing source; a security with respect to which an event has occurred that is likely to materially affect the value of the security after the market has closed but before the calculation of a Fund’s net asset value (as may be the case in non-U.S. markets on which the security is primarily traded) or make it difficult or impossible to obtain a reliable market quotation; and a security whose price, as provided by the pricing service, is not deemed to reflect the security’s fair value. As a general principle, the fair value of a security would appear to be the amount that the owner might reasonably expect to receive for it in a current sale. A variety of factors may be considered in determining the fair value of these securities, which may include consideration of the following: yields or prices of investments of comparable quality, type of issue, coupon, maturity and rating, market quotes or indications of value from security dealers, evaluations of anticipated cash flows or collateral, general market conditions and other information and analysis, including the obligor’s credit characteristics considered relevant. These securities are generally classified as Level 2 or Level 3 depending on the priority of the significant inputs. Regardless of the method employed to value a particular security, all valuations are subject to review by the Funds’ Board of Directors/Trustees or its designee.
Refer to Footnote 2 – Fair Value Measurements for further details on the leveling of securities held by the Funds as of the end of the reporting period.
Investment Transactions
Investment transactions are recorded on a trade date basis. Realized gains and losses from transactions are determined on the specific identification method, which is the same basis used for federal income tax purposes. Investments purchased on a when-issued/delayed delivery basis may have extended settlement periods. Any investments so purchased are subject to market fluctuation during this period. The Funds have instructed the custodian to segregate assets with a current value at least equal to the amount of the when-issued/delayed delivery purchase commitments. At April 30, 2011, Investment Quality (NQM), Premier Income (NPF), High Income Opportunity (NMZ) and High Income Opportunity 2 (NMD) had outstanding when-issued/delayed delivery purchase commitments of $4,525,940, $644,391, $614,994 and $614,994, respectively. There were no such outstanding purchase commitments in any of the other Funds.
Investment Income
Investment income, which reflects the amortization of premiums and includes accretion of discounts for financial reporting purposes, is recorded on an accrual basis. Investment income also reflects paydown gains and losses, if any.
Professional Fees
Professional fees presented on the Statement of Operations consist of legal fees incurred in the normal course of operations, audit fees, tax consulting fees and, in some cases, workout expenditures. Workout expenditures are incurred in an attempt to protect or enhance an investment, or to pursue other claims or legal actions on behalf of Fund shareholders.
Income Taxes
Each Fund is a separate taxpayer for federal income tax purposes. Each Fund intends to distribute substantially all of its net investment income and net capital gains to shareholders and to otherwise comply with the requirements of Subchapter M of the Internal Revenue Code applicable to regulated investment companies. Therefore, no federal income tax provision is required. Furthermore, each Fund intends to satisfy conditions that will enable interest from municipal securities, which is exempt from regular federal income tax, to retain such tax-exempt status when distributed to shareholders of the Funds. Net realized capital gains and ordinary income distributions paid by the Funds are subject to federal taxation.
For all open tax years and all major taxing jurisdictions, management of the Funds has concluded that there are no significant uncertain tax positions that would require recognition in the financial statements. Open tax years are those that are open for examination by taxing authorities (i.e., generally the last four tax year ends and the interim tax period since then). Furthermore, management of the Funds is also not aware of any tax positions for which it is reasonably possible that the total amounts of unrecognized tax benefits will significantly change in the next twelve months.
Dividends and Distributions to Common Shareholders
Dividends from net investment income are declared monthly. Net realized capital gains and/or market discount from investment transactions, if any, are distributed to shareholders at least annually. Furthermore, capital gains are distributed only to the extent they exceed available capital loss carryforwards.
Distributions to Common shareholders of net investment income, net realized capital gains and/or market discount, if any, are recorded on the ex-dividend date. The amount and timing of distributions are determined in accordance with federal income tax regulations, which may differ from U.S. GAAP.
Auction Rate Preferred Shares
Each Fund is authorized to issue Auction Rate Preferred Shares (“ARPS”). Although authorized, High Income Opportunity 2 (NMD) has not issued ARPS, since its commencement of operations on November 17, 2007. The following Funds have issued and outstanding ARPS, $25,000 stated value per share, which approximates market value, as a means of effecting financial leverage. Each Fund’s ARPS are issued in more than one Series. The dividend rate paid by the Funds on each Series is determined every seven days, pursuant to a dutch auction process overseen by the auction agent, and is payable at the end of each rate period. As of April 30, 2011, the number of ARPS outstanding, by Series and in total, for each Fund is as follows:
| | | | Investment Quality (NQM | ) | | Select Quality (NQS | ) | | Premier Income (NPF | ) | | High Income Opportunity (NMZ | ) |
| Number of shares: | | | | | | | | | | | | | |
| Series M | | | 1,750 | | | 1,801 | | | 769 | | | 1,826 | |
| Series T | | | 1,750 | | | 1,801 | | | 2,153 | | | 987 | |
| Series W | | | 1,749 | | | 2,522 | | | — | | | 987 | |
| Series TH | | | 1,429 | | | 1,405 | | | 2,152 | | | — | |
| Series F | | | 1,750 | | | 2,522 | | | — | | | — | |
| Total | | | 8,428 | | | 10,051 | | | 5,074 | | | 3,800 | |
| | | Notes to |
| | | Financial Statements (Unaudited) (continued) |
Beginning in February 2008, more shares for sale were submitted in the regularly scheduled auctions for the ARPS issued by the Funds than there were offers to buy. This meant that these auctions “failed to clear,” and that many ARPS shareholders who wanted to sell their shares in these auctions were unable to do so. ARPS shareholders unable to sell their shares received distributions at the “maximum rate” applicable to failed auctions as calculated in accordance with the pre-established terms of the ARPS. As of April 30, 2011, the aggregate amount of outstanding ARPS redeemed by each Fund is as follows:
| | | | Investment Quality (NQM | ) | | Select Quality (NQS | ) | | Quality Income (NQU | ) | | Premier Income (NPF | ) | | High Income Opportunity (NMZ | ) |
| ARPS redeemed, at liquidation value | | $ | 90,300,000 | | $ | 27,725,000 | | $ | 452,000,000 | | $ | 38,150,000 | | $ | 60,000,000 | |
During the fiscal year ended October 31, 2010, lawsuits pursuing claims made in a demand letter alleging that Investment Quality (NQM) and High Income Opportunity’s (NMZ) Board of Directors/Trustees breached their fiduciary duties related to the redemption at par of their ARPS had been filed on behalf of shareholders of Investment Quality (NQM) and High Income Opportunity (NMZ), against the Adviser together with current and former officers and interested director/trustees of Investment Quality (NQM) and High Income Opportunity (NMZ). Nuveen and the other named defendants believe these lawsuits to be without merit, and all named parties intend to defend themselves vigorously. Investment Quality (NQM) and High Income Opportunity (NMZ) believe that these lawsuits will not have a material effect on them or on the Adviser’s ability to serve as investment adviser to them.
Common Shares Shelf Offering
During the fiscal year ended October 31, 2010, the Fund filed a registration statement with the SEC to register an additional 2,600,000 Common shares and issued 852,801 common shares, receiving offering proceeds, net of offering costs of $10,694,912. During the six months ended April 30, 2011, the Fund issued 701,414 common shares, receiving offering proceeds, net of offering costs of $7,898,357. Under this new equity shelf program, the Fund, subject to market conditions, may raise additional equity capital from time to time in varying amounts and offering methods at a net price at or above the Fund’s NAV per Common share.
On October 30, 2009, a registration statement filed by High Income Opportunity 2 (NMD) with the SEC became effective authorizing the Fund to issue 1,600,000 Common shares through a shelf offering. During the fiscal year ended October 31, 2010, High Income Opportunity 2 (NMD) filed a registration statement with the SEC to register additional 1.9 million Common shares and issued 1,142,865 Common shares, receiving offering proceeds, net of offering costs of $13,463,181. During the six months ended April 30, 2011, the Fund issued 457,354 common shares, receiving offering proceeds, net of offering costs of $4,908,594. Under this equity shelf program, the Fund, subject to market conditions, may raise additional equity capital from time to time in varying amounts and offering methods at a net price at or above the Fund’s NAV per Common share.
Shelf Offering Costs
Costs incurred by High Income Opportunity (NMZ) and High Income Opportunity 2 (NMD) in connection with the shelf offerings of their Common shares are recorded as a deferred charge which are amortized over the period such additional Common shares are sold not to exceed the one-year life of the shelf offering period.
Variable Rate Demand Preferred Shares
Quality Income (NQU) has issued and outstanding 3,884 Series 1 Variable Rate Demand Preferred (“VRDP”) Shares, with a maturity date of December 1, 2040 and a $100,000 liquidation value per share. The Fund issued its VRDP Shares in a privately negotiated offering in December 2010. Proceeds of the Fund’s offering were used to redeem all of the Fund’s outstanding ARPS. The VRDP Shares were offered to qualified institutional buyers pursuant to Rule 144A under the Securities Act of 1933.
VRDP Shares include a liquidity feature that allows VRDP shareholders to have their shares purchased by a liquidity provider with whom the Fund has contracted in the event that purchase orders for VRDP Shares in a remarketing are not sufficient in number to be matched with the sale orders in that remarketing. The Fund is required to redeem any VRDP Shares that are still owned by the liquidity provider after six months of continuous, unsuccessful remarketing.
Dividends on the VRDP Shares (which are treated as interest payments for financial reporting purposes) are set weekly at a rate established by a remarketing agent; therefore, the market value of the VRDP Shares is expected to approximate its liquidation value. If remarketings for VRDP Shares are continuously unsuccessful for six months, the maximum rate is designed to escalate according to a specified schedule in order to enhance the remarketing agent’s ability to successfully remarket the VRDP Shares.
Subject to certain conditions, VRDP Shares may be redeemed, in whole or in part, at any time at the option of the Fund. The Fund may also redeem certain of the VRDP Shares if the Fund fails to maintain certain asset coverage requirements and such failures are not cured by the applicable cure date. The redemption price per share is equal to the sum of the liquidation value per share plus any accumulated but unpaid dividends.
Quality Income’s (NQU) average liquidation value outstanding and annualized dividend rate of VRDP Shares for the period December 23, 2010 (issuance date of shares) through April 30, 2011, was $388,400,000 and 0.47%, respectively.
For financial reporting purposes only, the liquidation value of VRDP Shares is recognized as a liability on the Statement of Assets and Liabilities. Unpaid dividends on VRDP Shares are recognized as a component of “Interest payable” on the Statement of Assets and Liabilities. Dividends paid on the VRDP Shares are recognized as a component of “Interest expense and amortization of offering costs” on the Statement of Operations. In addition to interest expense, the Fund also pays a per annum liquidity fee to the liquidity provider, which is recognized as “Liquidity fees on VRDP shares” on the Statement of Operations.
Inverse Floating Rate Securities
Each Fund is authorized to invest in inverse floating rate securities. An inverse floating rate security is created by depositing a municipal bond, typically with a fixed interest rate, into a special purpose trust created by a broker-dealer. In turn, this trust (a) issues floating rate certificates, in face amounts equal to some fraction of the deposited bond’s par amount or market value, that typically pay short-term tax-exempt interest rates to third parties, and (b) issues to a long-term investor (such as one of the Funds) an inverse floating rate certificate (sometimes referred to as an “inverse floater”) that represents all remaining or residual interest in the trust. The income received by the inverse floater holder varies inversely with the short-term rate paid to the floating rate certificates’ holders, and in most circumstances the inverse floater holder bears substantially all of the underlying bond’s downside investment risk and also benefits disproportionately from any potential appreciation of the underlying bond’s value. The price of an inverse floating rate security will be more volatile than that of the underlying bond because the interest rate is dependent on not only the fixed coupon rate of the underlying bond but also on the short-term interest paid on the floating rate certificates, and because the inverse floating rate security essentially bears the risk of loss of the greater face value of the underlying bond.
A Fund may purchase an inverse floating rate security in a secondary market transaction without first owning the underlying bond (referred to as an “externally-deposited inverse floater”), or instead by first selling a fixed-rate bond to a broker-dealer for deposit into the special purpose trust and receiving in turn the residual interest in the trust (referred to as a “self-deposited inverse floater”). The inverse floater held by a Fund gives the Fund the right (a) to cause the holders of the floating rate certificates to tender their notes at par, and (b) to have the broker transfer the fixed-rate bond held by the trust to the Fund, thereby collapsing the trust. An investment in an externally-deposited inverse floater is identified in the Portfolio of Investments as “(IF) – Inverse floating rate investment.” An investment in a self-deposited inverse floater is accounted for as a financing transaction. In such instances, a fixed-rate bond deposited into a special purpose trust is identified in the Portfolio of Investments as “(UB) – Underlying bond of an inverse floating rate trust reflected as a financing transaction,” with the Fund accounting for the short-term floating rate certificates issued by the trust as “Floating rate obligations” on the Statement of Assets and Liabilities. In addition, the Fund reflects in “Investment Income” the entire earnings of the underlying bond and recognizes the related interest paid to the holders of the short-term floating rate certificates as a component of “Interest expense and amortization of offering costs” on the Statement of Operations.
During the six months ended April 30, 2011, each Fund invested in externally-deposited inverse floaters and/or self-deposited inverse floaters.
Each Fund may also enter into shortfall and forbearance agreements (sometimes referred to as a “recourse trust” or “credit recovery swap”) (such agreements referred to herein as “Recourse Trusts”) with a broker-dealer by which a Fund agrees to reimburse the broker-dealer, in certain circumstances, for the difference between the liquidation value of the fixed-rate bond held by the trust and the liquidation value of the floating rate certificates issued by the trust plus any shortfalls in interest cash flows. Under these agreements, a Fund’s potential exposure to losses related to or on inverse floaters may increase beyond the value of a Fund’s inverse floater investments as a Fund may potentially be liable to fulfill all amounts owed to holders of the floating rate certificates. At period end, any such shortfall is recognized as “Unrealized depreciation on Recourse Trusts” on the Statement of Assets and Liabilities.
At April 30, 2011, each Fund’s maximum exposure to externally-deposited Recourse Trusts, is as follows:
| | | | Investment Quality (NQM | ) | | Select Quality (NQS | ) | | Quality Income (NQU | ) | | Premier Income (NPF | ) | | High Income Opportunity (NMZ | ) | | High Income Opportunity 2 (NMD | ) |
| Maximum exposure to Recourse Trusts | | $ | 4,330,000 | | $ | 18,750,000 | | $ | — | | $ | 4,955,000 | | $ | 61,935,000 | | $ | 56,080,000 | |
| | | Notes to |
| | | Financial Statements (Unaudited) (continued) |
The average floating rate obligations outstanding and average annual interest rate and fees related to self-deposited inverse floaters during the six months ended April 30, 2011, were as follows:
| | | | Investment Quality (NQM | ) | | Select Quality (NQS | ) | | Quality Income (NQU | ) | | Premier Income (NPF | ) | | High Income Opportunity (NMZ | ) |
| Average floating rate obligations outstanding | | $ | 88,627,773 | | $ | 18,540,000 | | $ | 61,410,000 | | $ | 58,574,387 | | $ | 17,778,674 | |
| Average annual interest rate and fees | | | 0.67 | % | | 0.83 | % | | 0.75 | % | | 0.57 | % | | 0.70 | % |
Swap Contracts
Each Fund is authorized to enter into interest rate swap and forward interest rate swap contracts consistent with their investment objectives and policies to reduce, increase or otherwise alter its risk profile or to alter its portfolio characteristics (i.e. duration, yield curve positioning and credit quality), and is subject to interest rate risk in the normal course of pursuing its investment objectives. Each Fund’s use of interest rate swap and forward interest rate swap transactions is intended to help the Fund manage its overall interest rate sensitivity, either shorter or longer, generally to more closely align the Fund’s interest rate sensitivity with that of the broader market.
Interest rate swap contracts involve each Fund’s agreement with the counterparty to pay or receive a fixed rate payment in exchange for the counterparty receiving or paying a variable rate payment. Forward interest rate swap transactions involve a Fund’s agreement with a counterparty to pay, in the future, a fixed or variable rate payment in exchange for the counterparty paying a Fund a variable or fixed rate payment, the accruals for which would begin at a specified date in the future (the “effective date”). The amount of the payment obligation on a swap contract is based on the notional amount and the termination date of the swap (which is akin to a bond’s maturity). The value of a Fund’s swap commitment will increase or decrease based primarily on the extent to which long-term interest rates for bonds having a maturity of the swap’s termination date increase or decrease. Interest rate swap and forward interest rate swap contracts are valued daily. Upon entering into an interest rate swap (and beginning on the effective date for a forward interest rate swap), each Fund accrues the fixed rate payment expected to be paid or received and the variable rate payment expected to be received or paid on a daily basis, and recognizes the daily change in the market value of the Fund’s contractual rights and obligations under the contracts. The net amount recorded on these transactions, for each counterparty is recognized on the Statement of Assets and Liabilities as a component of “Unrealized appreciation or depreciation on swaps” with the change during the fiscal period recognized on the Statement of Operations as a component of “Net unrealized appreciation (depreciation) of swaps.”
When an interest rate swap or forward interest rate swap contract is terminated, it ordinarily does not involve the delivery of securities or other underlying assets or principal, but rather is settled in cash on a net basis. Once periodic payments are settled in cash, they are combined with the net realized gain or loss recorded upon the termination of the swap contracts. For tax purposes, periodic payments are treated as ordinary income or expense. Net realized gains and losses on swap contracts during the fiscal period are recognized on the Statement of Operations as a component of “Net realized gain (loss) from swaps.”
High Income Opportunity (NMZ) and High Income Opportunity 2 (NMD) entered into interest rate and forward interest rate swap contracts to reduce the duration of the Funds’ portfolio. The average notional amount of swap contracts outstanding during the six months ended April 30, 2011, was as follows:
| | | | High Income Opportunity (NMZ | ) | | High Income Opportunity 2 (NMD | ) |
| Average notional amount of forward interest rate swap contracts outstanding* | | $ | 23,166,667 | | $ | 24,166,667 | |
| * | The average notional amount is calculated based on the outstanding notional at the beginning of the fiscal year and at the end of each fiscal quarter within the current fiscal year. |
Refer to Footnote 3 – Derivative Instruments and Hedging Activities for further details on forward interest rate swap contract activity.
Futures Contracts
Each Fund is authorized to invest in futures contracts. Upon entering into a futures contract, a Fund is required to deposit with the broker an amount of cash or liquid securities equal to a specified percentage of the contract amount. This is known as the “initial margin.” Cash held by the broker to cover initial margin requirements on open futures contracts, if any, is recognized as “Deposits with brokers for open futures contracts” on the Statement of Assets and Liabilities. Subsequent payments (“variation margin”) are made or received by a Fund each day, depending on the daily fluctuation of the value of the contract. Variation margin is recognized as a receivable or payable for “Variation margin on futures contracts” on the Statement of Assets and Liabilities, when applicable.
During the period the futures contract is open, changes in the value of the contract are recorded as an unrealized gain or loss by “marking-to-market” on a daily basis to reflect the changes in market value of the contract and is recognized as a component of “Change in net unrealized appreciation (depreciation) of futures contracts” on the Statement of Operations. When the contract is closed or expired, a Fund records a realized gain or loss equal to the difference between the value of the contract on the closing date and value of the contract when originally entered into, which is recognized as a component of “Net realized gain (loss) from futures contracts” on the Statement of Operations.
Risks of investments in futures contracts include the possible adverse movement in the price of the securities or indices underlying the contracts, the possibility that there may not be a liquid secondary market for the contracts and/or that a change in the value of the contract may not correlate with a change in the value of the underlying securities or indices.
High Income Opportunity 2 (NMD) entered into Treasury futures contracts to reduce the duration of the Fund’s portfolio. The average number of futures contracts outstanding during the six months ended April 30, 2011, was as follows:
| | | | High Income Opportunity 2 (NMD | ) |
| Average number of futures contracts outstanding* | | | 13 | |
| * | The average number of contracts outstanding is calculated based on the outstanding contracts at the beginning of the fiscal year and at the end of each fiscal quarter within the current fiscal year. |
Refer to Footnote 3 – Derivative Instruments and Hedging Activities for further details on futures contract activity.
Market and Counterparty Credit Risk
In the normal course of business each Fund may invest in financial instruments and enter into financial transactions where risk of potential loss exists due to changes in the market (market risk) or failure of the other party to the transaction to perform (counterparty credit risk). The potential loss could exceed the value of the financial assets recorded on the financial statements. Financial assets, which potentially expose each Fund to counterparty credit risk, consist principally of cash due from counterparties on forward, option and swap transactions, when applicable. The extent of each Fund’s exposure to counterparty credit risk in respect to these financial assets approximates their carrying value as recorded on the Statement of Assets and Liabilities. Futures contracts, when applicable, expose a Fund to minimal counterparty credit risk as they are exchange traded and the exchange’s clearinghouse, which is counterparty to all exchange traded futures, guarantees the futures contracts against default.
Each Fund helps manage counterparty credit risk by entering into agreements only with counterparties the Adviser believes have the financial resources to honor their obligations and by having the Adviser monitor the financial stability of the counterparties. Additionally, counterparties may be required to pledge collateral daily (based on the daily valuation of the financial asset) on behalf of each Fund with a value approximately equal to the amount of any unrealized gain above a pre-determined threshold. Reciprocally, when each Fund has an unrealized loss, the Funds have instructed the custodian to pledge assets of the Funds as collateral with a value approximately equal to the amount of the unrealized loss above a pre-determined threshold. Collateral pledges are monitored and subsequently adjusted if and when the valuations fluctuate, either up or down, by at least the pre-determined threshold amount.
Zero Coupon Securities
Each Fund is authorized to invest in zero coupon securities. A zero coupon security does not pay a regular interest coupon to its holders during the life of the security. Tax-exempt income to the holder of the security comes from accretion of the difference between the original purchase price of the security at issuance and the par value of the security at maturity and is effectively paid at maturity. The market prices of zero coupon securities generally are more volatile than the market prices of securities that pay interest periodically.
Offering Costs
Costs incurred by Quality Income (NQU) in connection with its offering of VRDP Shares ($1,500,000) were recorded as a deferred charge and will be amortized over the life of the shares. The Fund’s amortized deferred charges are recognized as a component of “Interest expense and amortization of offering costs” on the Statement of Operations.
Custodian Fee Credit
Each Fund has an arrangement with the custodian bank whereby certain custodian fees and expenses are reduced by net credits earned on each Fund’s cash on deposit with the bank. Such deposit arrangements are an alternative to overnight investments. Credits for cash balances may be offset by charges for any days on which a Fund overdraws its account at the custodian bank.
Indemnifications
Under the Funds’ organizational documents, their officers and directors/trustees are indemnified against certain liabilities arising out of the performance of their duties to the Funds. In addition, in the normal course of business, the Funds enter into contracts that provide general indemnifications to other parties. The Funds’ maximum exposure under these arrangements is unknown as this would involve future claims that may be made against the Funds that have not yet occurred. However, the Funds have not had prior claims or losses pursuant to these contracts and expect the risk of loss to be remote.
Use of Estimates
The preparation of financial statements in conformity with U.S. GAAP requires management to make estimates and assumptions that affect the reported amounts of assets and liabilities at the date of the financial statements and the reported amounts of increases and decreases in net assets applicable to Common shares from operations during the reporting period. Actual results may differ from those estimates.
| | | Notes to |
| | | Financial Statements (Unaudited) (continued) |
2. Fair Value Measurements
Fair value is defined as the price that the Funds would receive upon selling an investment or transferring a liability in an orderly transaction to an independent buyer in the principal or most advantageous market of the investment. A three-tier hierarchy is used to maximize the use of observable market data and minimize the use of unobservable inputs and to establish classification of fair value measurements for disclosure purposes. Observable inputs reflect the assumptions market participants would use in pricing the asset or liability. Observable inputs are based on market data obtained from sources independent of the reporting entity. Unobservable inputs reflect the reporting entity’s own assumptions about the assumptions market participants would use in pricing the asset or liability. Unobservable inputs are based on the best information available in the circumstances. The three-tier hierarchy of inputs is summarized in the three broad levels listed below:
| | Level 1 – Quoted prices in active markets for identical securities. |
| | Level 2 – Other significant observable inputs (including quoted prices for similar securities, interest rates, prepayment speeds, credit risk, etc.). |
| | Level 3 – Significant unobservable inputs (including management’s assumptions in determining the fair value of investments). |
The inputs or methodologies used for valuing securities are not an indication of the risk associated with investing in those securities. The following is a summary of each Fund’s fair value measurements as of April 30, 2011:
| Investment Quality (NQM) | | Level 1 | | | Level 2 | | | Level 3 | | | Total | |
| Investments: | | | | | | | | | | | | |
| Municipal Bonds | | $ | — | | | $ | 775,484,026 | | | $ | 95,190 | | | $ | 775,579,216 | |
| | | | | | | | | | | | | | | | | |
| Select Quality (NQS) | | Level 1 | | | Level 2 | | | Level 3 | | | Total | |
| Investments: | | | | | | | | | | | | | | | | |
| Municipal Bonds | | $ | — | | | $ | 688,800,618 | | | $ | — | | | $ | 688,800,618 | |
| | | | | | | | | | | | | | | | | |
| Quality Income (NQU) | | Level 1 | | | Level 2 | | | Level 3 | | | Total | |
| Investments: | | | | | | | | | | | | | | | | |
| Municipal Bonds | | $ | — | | | $ | 1,145,387,526 | | | $ | — | | | $ | 1,145,387,526 | |
| | | | | | | | | | | | | | | | | |
| Premier Income (NPF) | | Level 1 | | | Level 2 | | | Level 3 | | | Total | |
| Investments: | | | | | | | | | | | | | | | | |
| Municipal Bonds | | $ | — | | | $ | 444,726,118 | | | $ | 20,040 | | | $ | 444,746,158 | |
| | | | | | | | | | | | | | | | | |
| High Income Opportunity (NMZ) | | Level 1 | | | Level 2 | | | Level 3 | | | Total | |
| Investments: | | | | | | | | | | | | | | | | |
| Municipal Bonds | | $ | — | | | $ | 377,033,024 | | | $ | 5,509,497 | | | $ | 382,542,521 | |
| Short-Term Investments | | | — | | | | 16,995,000 | | | | — | | | | 16,995,000 | |
| Derivatives: | | | | | | | | | | | | | | | | |
| Swaps* | | | — | | | | (866,779 | ) | | | — | | | | (866,779 | ) |
| Total | | $ | — | | | $ | 393,161,245 | | | $ | 5,509,497 | | | $ | 398,670,742 | |
| | | | | | | | | | | | | | | | | |
| High Income Opportunity 2 (NMD) | | Level 1 | | | Level 2 | | | Level 3 | | | Total | |
| Investments: | | | | | | | | | | | | | | | | |
| Municipal Bonds | | $ | — | | | $ | 212,198,709 | | | $ | 6,337,591 | | | $ | 218,536,300 | |
| Derivatives: | | | | | | | | | | | | | | | | |
| Swaps* | | | — | | | | (836,483 | ) | | | — | | | | (836,483 | ) |
| Total | | $ | — | | | $ | 211,355,693 | | | $ | 6,337,591 | | | $ | 217,693,284 | |
| * | Represents net unrealized appreciation (depreciation). |
The following is a reconciliation of the Funds’ Level 3 investments held at the beginning and end of the measurement period:
| | | Investmen Quality (NQM | ) | | Premier Income (NPF | ) | | High Income Opportunity (NMZ | ) | | High Income Opportunity 2 (NMD | ) |
| | | Level 3 Municipal Bonds | | | Level 3 Municipal Bonds | | | Level 3 Municipal Bonds | | | Level 3 Municipal Bonds | |
| Balance at the beginning of period | | $ | 1,648,004 | | | $ | 403,317 | | | $ | 6,926,205 | | | $ | 3,970,170 | |
| Gains (losses): | | | | | | | | | | | | | | | | |
| Net realized gains (losses) | | | (20,664 | ) | | | (14,916 | ) | | | (61,860 | ) | | | (54,786 | ) |
| Net change in unrealized appreciation (depreciation) | | | (479,960 | ) | | | (108,472 | ) | | | (1,290,730 | ) | | | (396,410 | ) |
| Purchases at cost | | | — | | | | — | | | | — | | | | 722,021 | |
| Sales at proceeds | | | — | | | | — | | | | (140,000 | ) | | | — | |
| Net discounts (premiums) | | | — | | | | (89 | ) | | | 570 | | | | — | |
| Transfers in to | | | — | | | | — | | | | 608,828 | | | | 2,096,596 | |
| Transfers out of | | | (1,052,190 | ) | | | (259,800 | ) | | | (533,516 | ) | | | — | |
| Balance at the end of period | | $ | 95,190 | | | $ | 20,040 | | | $ | 5,509,497 | | | $ | 6,337,591 | |
Net change in unrealized appreciation (depreciation) during the period of Level 3 securities held as of April 30, 2011 | | $ | 16,975 | | | $ | 14,140 | | | $ | (1,220,419 | ) | | $ | (396,410 | ) |
During the six months ended April 30, 2011, the Funds recognized no significant transfers to/from Level 1 or Level 2. Transfers in and/or out of Level 3 are shown using end of period values.
3. Derivative Instruments and Hedging Activities
The Funds record derivative instruments at fair value, with changes in fair value recognized on the Statement of Operations, when applicable. Even though the Funds’ investments in derivatives may represent economic hedges, they are not considered to be hedge transactions for financial reporting purposes. For additional information on the derivative instruments in which each Fund was invested during and at the end of the reporting period, refer to the Portfolios of Investments, Financial Statements and Footnote 1 - General Information and Significant Accounting Policies.
The following tables present the fair value of all derivative instruments held by the Funds as of April 30, 2011, the location of these instruments on the Statement of Assets and Liabilities, and the primary underlying risk exposure.
High Income Opportunity (NMZ)
| | Location on the Statement of Assets and Liabilities | |
| Underlying | Derivative | Asset Derivatives | | Liability Derivatives | |
| Risk Exposure | Instrument | Location | | Value | | Location | | Value | |
| Interest Rate | Swaps | Unrealized appreciation on swaps* | | $ | — | | Unrealized depreciation on swaps* | | $ | 866,779 | |
High Income Opportunity 2 (NMD)
| | | Location on the Statement of Assets and Liabilities | |
| Underlying | Derivative | Asset Derivatives | | Liability Derivatives | |
| Risk Exposure | Instrument | Location | | Value | | Location | | Value | |
| Interest Rate | Swaps | Unrealized appreciation on swaps* | | $ | — | | Unrealized depreciation on swaps* | | $ | 836,483 | |
| * | Value represents cumulative unrealized appreciation (depreciation) of swap contracts as reported in the Portfolio of Investments. |
The following tables present the amount of net realized gain (loss) and change in net unrealized appreciation (depreciation) recognized for the six months ended April 30, 2011, on derivative instruments, as well as the primary risk exposure associated with each.
| Net Realized Gain (Loss) from Futures Contracts | | High Income Opportunity 2 (NMD | ) |
| Risk Exposure | | | |
| Interest Rate | | $ | 288,859 | |
| Change in Net Unrealized Appreciation (Depreciation) of Swaps | | High Income Opportunity (NMZ | ) | | High Income Opportunity 2 (NMD | ) |
| Risk Exposure | | | | | | |
| Interest Rate | | $ | 332,613 | | | $ | 728,797 | |
| | | Notes to |
| | | Financial Statements (Unaudited) (continued) |
| Change in Net Unrealized Appreciation (Depreciation) of Futures Contracts | | High Income Opportunity 2 (NMD | ) |
| Risk Exposure | | | |
| Interest Rate | | $ | (137,711 | ) |
4. Fund Shares
Common Shares
Transactions in Common shares were as follows:
| | | Investment Quality (NQM) | | | Select Quality (NQS) | | | Quality Income (NQU) | |
| | | Six Months Ended 4/30/11 | | | Year Ended 10/31/10 | | | Six Months Ended 4/30/11 | | | Year Ended 10/31/10 | | | Six Months Ended 4/30/11 | | | Year Ended 10/31/10 | |
| Common shares: | | | | | | | | | | | | | | | | | | |
| Issued to shareholders due to reinvestment of distributions | | | — | | | | 36,492 | | | | 95,444 | | | | 141,399 | | | | 83,558 | | | | 63,785 | |
| Repurchased and retired | | | — | | | | — | | | | — | | | | — | | | | — | | | | — | |
| | | | | | | | | | | | | | | | | | | | | | | | | |
| Weighted average Common share: | | | | | | | | | | | | | | | | | | | | | | | | |
| Price per share repurchased and retired | | | — | | | | — | | | | — | | | | — | | | | — | | | | — | |
| Discount per share repurchased and retired | | | — | | | | — | | | | — | | | | — | | | | — | | | | — | |
| | | Premier Income (NPF) | | High Income Opportunity (NMZ) | | High Income Opportunity 2 (NMD) | |
| | | Six Months Ended 4/30/11 | | Year Ended 10/31/10 | | Six Months Ended 4/30/11 | | Year Ended 10/31/10 | | Six Months Ended 4/30/11 | | Year Ended 10/31/10 | |
| Common shares: | | | | | | | | | | | | | | | | | | | |
| Sold through shelf offering* | | | — | | | — | | | 701,414 | | | 852,801 | | | 457,354 | | | 1,142,865 | |
Issued to shareholders due to reinvestment of
distributions | | | — | | | — | | | 28,823 | | | 44,223 | | | 56,213 | | | 136,122 | |
| Repurchased and retired | | | — | | | — | | | — | | | — | | | — | | | — | |
| | | | — | | | — | | | 730,237 | | | 897,024 | | | 513,567 | | | 1,297,987 | |
| | | | | | | | | | | | | | | | | | | | |
| Weighted average Common share: | | | | | | | | | | | | | | | | | | | |
| Price per share repurchased and retired | | | — | | | — | | | — | | | — | | | — | | | — | |
| Discount per share repurchased and retired | | | — | | | — | | | — | | | — | | | — | | | — | |
| Premium per shelf offering share sold* | | | — | | | — | | | 7.87 | % | | 8.72 | % | | 3.65 | % | | 6.19 | % |
| * | High Income Opportunity (NMZ) and High Income Opportunity 2 (NMD) are the only Funds authorized to issue additional shares of their Common stock through a shelf offering. |
Preferred Shares
High Income Opportunity 2 (NMD) has not issued ARPS since commencement of operations on November 15, 2007. Transactions in ARPS were as follows:
| | | Investment Quality (NQM) | | | Select Quality (NQS) | |
| | | Six Months Ended 4/30/11 | | | Year Ended 10/31/10 | | | Six Months Ended 4/30/11 | | | Year Ended 10/31/10 | |
| | | Shares | | | Amount | | | Shares | | | Amount | | | Shares | | | Amount | | | Shares | | | Amount | |
| ARPS redeemed: | | | | | | | | | | | | | | | | | | | | | | | | |
| Series M | | | — | | | $ | — | | | | — | | | $ | — | | | | — | | | $ | — | | | | — | | | $ | — | |
| Series T | | | — | | | | — | | | | — | | | | — | | | | — | | | | — | | | | — | | | | — | |
| Series W | | | — | | | | — | | | | — | | | | — | | | | — | | | | — | | | | — | | | | — | |
| Series TH | | | — | | | | — | | | | — | | | | — | | | | — | | | | — | | | | — | | | | — | |
| Series F | | | — | | | | — | | | | — | | | | — | | | | — | | | | — | | | | — | | | | — | |
| Total | | | — | | | $ | — | | | | — | | | $ | — | | | | — | | | $ | — | | | | — | | | $ | — | |
| | | Quality Income (NQU) | | | Premier Income (NPF) | |
| | | Six Months Ended 4/30/11 | | | Year Ended 10/31/10 | | | Six Months Ended 4/30/11 | | | Year Ended 10/31/10 | |
| | | Shares | | | Amount | | | Shares | | | Amount | | | Shares | | | Amount | | | Shares | | | Amount | |
| ARPS redeemed: | | | | | | | | | | | | | | | | | | | | | | | | |
| Series M | | | 2,567 | | | $ | 64,175,000 | | | | — | | | $ | — | | | | — | | | $ | — | | | | — | | | $ | — | |
| Series T | | | 2,569 | | | | 64,225,000 | | | | — | | | | — | | | | — | | | | — | | | | — | | | | — | |
| Series W | | | 2,568 | | | | 64,200,000 | | | | — | | | | — | | | | — | | | | — | | | | — | | | | — | |
| Series W2 | | | 1,780 | | | | 44,500,000 | | | | — | | | | — | | | | — | | | | — | | | | — | | | | — | |
| Series TH | | | 3,423 | | | | 85,575,000 | | | | — | | | | — | | | | — | | | | — | | | | — | | | | — | |
| Series F | | | 2,568 | | | | 64,200,000 | | | | — | | | | — | | | | — | | | | — | | | | — | | | | — | |
| Total | | | 15,475 | | | $ | 386,875,000 | | | | — | | | $ | — | | | | — | | | $ | — | | | | — | | | $ | — | |
| | | High Income Opportunity (NMZ) | |
| | | Six Months Ended 4/30/11 | | | Year Ended 10/31/10 | |
| | | Shares | | | Amount | | | Shares | | | Amount | |
| ARPS redeemed: | | | | | | | | | | | | |
| Series M | | | — | | | $ | — | | | | — | | | $ | — | |
| Series T | | | — | | | | — | | | | — | | | | — | |
| Series W | | | — | | | | — | | | | — | | | | — | |
| Total | | | — | | | $ | — | | | | — | | | $ | — | |
Transactions in VRDP Shares were as follows:
| | | Quality Income (NQU) |
| | | Six Months Ended 4/30/11 | | | Year Ended 10/31/10 | |
| | | Shares | | | Amount | | | Shares | | | Amount | |
| VRDP Shares issued: | | | | | | | | | | | | |
| Series 1 | | | 3,884 | | | $ | 388,400,000 | | | | — | | | $ | — | |
5. Investment Transactions
Purchases and sales (including maturities but excluding short-term investments and derivative transactions, when applicable) during the six months ended April 30, 2011, were as follows:
| | | Investment Quality | | | Select Quality | | | Quality Income | | | Premier Income | | | High Income Opportunity | | | High Income Opportunity 2 | |
| | | (NQM | ) | | (NQS | ) | | (NQU | ) | | (NPF | ) | | (NMZ | ) | | (NMD | ) |
| Purchases | | $ | 69,782,182 | | | $ | 10,147,498 | | | $ | 97,308,044 | | | $ | 18,115,543 | | | $ | 75,870,658 | | | $ | 19,736,586 | |
| Sales and maturities | | | 52,377,415 | | | | 37,584,395 | | | | 104,648,139 | | | | 16,454,758 | | | | 78,132,159 | | | | 12,773,892 | |
6. Income Tax Information
The following information is presented on an income tax basis. Differences between amounts for financial statement and federal income tax purposes are primarily due to timing differences in recognizing taxable market discount, timing differences in recognizing certain gains and losses on investment transactions and the treatment of investments in inverse floating rate securities reflected as financing transactions, if any. To the extent that differences arise that are permanent in nature, such amounts are reclassified within the capital accounts as detailed below. Temporary differences do not require reclassification. Temporary and permanent differences do not impact the net asset values of the Funds.
| | | Notes to |
| | | Financial Statements (Unaudited) (continued) |
At April 30, 2011, the cost and unrealized appreciation (depreciation) of investments (excluding investments in derivatives, when applicable), as determined on a federal income tax basis, were as follows:
| | | Investment Quality | | | Select Quality | | | Quality Income | | | Premier Income | | | High Income Opportunity | | | High Income Opportunity 2 | |
| | | | (NQM | ) | | | (NQS | ) | | | (NQU | ) | | | (NPF | ) | | | (NMZ | ) | | | (NMD | ) |
| Cost of investments | | $ | 706,873,414 | | | $ | 704,119,131 | | | $ | 1,128,570,933 | | | $ | 390,364,377 | | | $ | 418,485,104 | | | $ | 246,189,933 | |
| Gross unrealized: | | | | | | | | | | | | | | | | | | | | | | | | |
| Appreciation | | $ | 28,583,080 | | | $ | 18,696,036 | | | $ | 34,224,127 | | | $ | 18,306,221 | | | $ | 16,788,673 | | | $ | 5,682,878 | |
| Depreciation | | | (40,275,484 | ) | | | (52,555,209 | ) | | | (78,814,245 | ) | | | (20,178,218 | ) | | | (53,906,985 | ) | | | (33,336,511 | ) |
Net unrealized appreciation (depreciation) of investments | | $ | (11,692,404 | ) | | $ | (33,859,173 | ) | | $ | (44,590,118 | ) | | $ | (1,871,997 | ) | | $ | (37,118,312 | ) | | $ | (27,653,633 | ) |
Permanent differences, primarily due to federal taxes paid, taxable market discount and distribution character reclassifications, resulted in reclassifications among the Funds’ components of Common share net assets at October 31, 2010, the Funds’ last tax year end, as follows:
| | | Investment Quality (NQM | ) | | Select Quality (NQS | ) | | Quality Income (NQU | ) | | Premier Income (NPF | ) | | High Income Opportunity (NMZ | ) | | High Income Opportunity 2
(NMD | ) |
| Paid-in-surplus | | $ | (655,963 | ) | | $ | 1,468 | | | $ | — | | | $ | — | | | $ | — | | | $ | — | |
| Undistributed (Over-distribution of) net investment income | | | (43,269 | ) | | | (3,447 | ) | | | (188,527 | ) | | | (18,343 | ) | | | (20,202 | ) | | | (41,911 | ) |
| Accumulated net realized gain (loss) | | | 699,232 | | | | 1,979 | | | | 188,527 | | | | 18,343 | | | | 20,202 | | | | 41,911 | |
The tax components of undistributed net tax-exempt income, net ordinary income and net long-term capital gains at October 31, 2010, the Funds’ last tax year end, were as follows:
| | | Investment Quality (NQM | ) | | Select Quality (NQS | ) | | Quality Income (NQU | ) | | Premier Income (NPF | ) | | High Income Opportunity (NMZ | ) | | High Income Opportunity 2 (NMD | ) |
| Undistributed net tax-exempt income * | | $ | 11,488,544 | | | $ | 11,137,570 | | | $ | 16,901,476 | | | $ | 5,656,853 | | | $ | 2,493,462 | | | $ | 799,184 | |
| Undistributed net ordinary income ** | | | 102,586 | | | | 272,207 | | | | 10,420 | | | | 130 | | | | 34,062 | | | | 54,612 | |
| Undistributed net long-term capital gains | | | — | | | | 2,814,859 | | | | — | | | | — | | | | — | | | | — | |
| * | Undistributed net tax-exempt income (on a tax basis) has not been reduced for the dividend declared on October 1, 2010, paid on November 1, 2010. |
| ** | Net ordinary income consists of taxable market discount income and net short-term capital gains, if any. |
| | |
The tax character of distributions paid during the Funds’ last tax year ended October 31, 2010, was designated for purposes of the dividends paid deduction as follows:
| | | | Investment Quality (NQM | ) | Select Quality (NQS | ) | Quality Income (NQU | ) | Premier Income (NPF | ) | High Income Opportunity (NMZ | ) | High Income Opportunity 2 (NMD | ) |
| Distributions from net tax-exempt income | | $ | 33,230,782 | | $ | 34,604,555 | | $ | 51,239,274 | | $ | 17,254,226 | | $ | 26,446,536 | | $ | 15,919,411 | |
| Distributions from net ordinary income ** | | | — | | | — | | | 86,633 | | | — | | | 113,586 | | | 59,721 | |
| Distributions from net long-term capital gains | | | — | | | 553,792 | | | — | | | — | | | — | | | — | |
| ** | Net ordinary income consists of taxable market discount income and net short-term capital gains, if any. |
| |
At October 31, 2010, the Funds’ last tax year end, the following Funds had unused capital loss carryforwards available for federal income tax purposes to be applied against future capital gains, if any. If not applied, the carryforwards will expire as follows:
| | | | Investment Quality (NQM | ) | | Quality Income (NQU | ) | | Premier Income (NPF | ) | | High Income Opportunity (NMZ | ) | | High Income Opportunity 2 (NMD | ) |
| Expiration: | | | | | | | | | | | | | | | | |
| October 31, 2011 | | $ | — | | $ | 2,119,216 | | $ | — | | $ | — | | $ | — | |
| October 31, 2016 | | | — | | | — | | | 3,248,618 | | | 12,880,924 | | | 4,564,842 | |
| October 31, 2017 | | | 930,020 | | | — | | | 4,764,079 | | | 34,412,364 | | | 28,536,506 | |
| October 31, 2018 | | | — | | | — | | | — | | | 209,148 | | | 541,658 | |
| Total | | $ | 930,020 | | $ | 2,119,216 | | $ | 8,012,697 | | $ | 47,502,436 | | $ | 33,643,006 | |
During the Fund’s last tax year ended October 31, 2010, the following Funds utilized capital loss carryforwards as follows:
| | | | Investment Quality (NQM | ) | | Quality Income (NQU | ) | | Premier Income (NPF | ) |
| Utilized capital loss carryforwards | | $ | 985,749 | | $ | 5,877,825 | | $ | 353,387 | |
7. Management Fees and Other Transactions with Affiliates
Each Fund’s management fee is separated into two components – a fund-level fee, based only on the amount of assets within the Fund, and a complex-level fee, based on the aggregate amount of all eligible fund assets managed by the Adviser. This pricing structure enables Fund shareholders to benefit from growth in the assets within their Fund as well as from growth in the amount of complex-wide assets managed by the Adviser.
The annual fund-level fee for each Fund, payable monthly, is calculated according to the following schedule:
| Average Daily Managed Assets* | Investment Quality (NQM) Select Quality (NQS) Quality Income (NQU) Premier Income (NPF) Fund-Level Fee Rate |
| For the first $125 million | .4500 | % |
| For the next $125 million | .4375 | |
| For the next $250 million | .4250 | |
| For the next $500 million | .4125 | |
| For the next $1 billion | .4000 | |
| For the next $3 billion | .3875 | |
| For managed assets over $5 billion | .3750 | |
| | High Income Opportunity (NMZ) |
| | High Income Opportunity Fund 2 (NMD) |
| Average Daily Managed Assets* | Fund-Level Fee Rate |
| For the first $125 million | .5500 | % |
| For the next $125 million | .5375 | |
| For the next $250 million | .5250 | |
| For the next $500 million | .5125 | |
| For the next $1 billion | .5000 | |
| For managed assets over $2 billion | .4750 | |
The annual complex-level fee for each Fund, payable monthly, is calculated according to the following schedule:
| Complex-Level Managed Asset Breakpoint Level* | Effective Rate at Breakpoint Level |
| $55 billion | .2000 | % |
| $56 billion | .1996 | |
| $57 billion | .1989 | |
| $60 billion | .1961 | |
| $63 billion | .1931 | |
| $66 billion | .1900 | |
| $71 billion | .1851 | |
| $76 billion | .1806 | |
| $80 billion | .1773 | |
| $91 billion | .1691 | |
| $125 billion | .1599 | |
| $200 billion | .1505 | |
| $250 billion | .1469 | |
| $300 billion | .1445 | |
| * | For the fund-level and complex-level fees, managed assets include closed-end fund assets managed by the Adviser that are attributable to financial leverage. For these purposes, financial leverage includes the funds’ use of preferred stock and borrowings and certain investments in the residual interest certificates (also called inverse floating rate securities) in tender option bond (TOB) trusts, including the portion of assets held by a TOB trust that has been effectively financed by the trust’s issuance of floating rate securities, subject to an agreement by the Adviser as to certain funds to limit the amount of such assets for determining managed assets in certain circumstances. The complex-level fee is calculated based upon the aggregate daily managed assets of all Nuveen funds that constitute “eligible assets.” Eligible assets do not include assets attributable to investments in other Nuveen funds or assets in excess of $2 billion added to the Nuveen fund complex in connection with the Adviser’s assumption of the management of the former First American Funds effective January 1, 2011. As of April 30, 2011, the complex-level fee rate for these Funds was .1785%. |
| | | Notes to |
| | | Financial Statements (Unaudited) (continued) |
The management fee compensates the Adviser for overall investment advisory and administrative services and general office facilities. The Adviser has entered into Sub-Advisory Agreements with the Sub-Adviser under which the Sub-Adviser manages the investment portfolios of the Funds. The Sub-Adviser is compensated for its services to the Funds from the management fees paid to the Adviser.
The Funds pay no compensation directly to those of its directors/trustees who are affiliated with the Adviser or to its officers, all of whom receive remuneration for their services to the Funds from the Adviser or its affiliates. The Board of Directors/Trustees has adopted a deferred compensation plan for independent directors/trustees that enables directors/trustees to elect to defer receipt of all or a portion of the annual compensation they are entitled to receive from certain Nuveen-advised funds. Under the plan, deferred amounts are treated as though equal dollar amounts had been invested in shares of select Nuveen-advised funds.
For the first eight years of High Income Opportunity’s (NMZ) operations, the Adviser has agreed to reimburse the Fund, as a percentage of average daily managed assets for fees and expenses in the amounts, and for the time periods set forth below:
| Year Ending | | | Year Ending | | |
| November 30, | | | November 30, | | |
| 2003* | .32 | % | 2009 | .24 | % |
| 2004 | .32 | | 2010 | .16 | |
| 2005 | .32 | | 2011 | .08 | |
| 2006 | .32 | | | | |
| 2007 | .32 | | | | |
| 2008 | .32 | | | | |
| * | From the commencement of operations. |
The Adviser has not agreed to reimburse High Income Opportunity (NMZ) for any portion of its fees and expenses beyond November 30, 2011.
During the six months ended April 30, 2011, Nuveen Securities, LLC, (“Nuveen Securities”) a wholly-owned subsidiary of Nuveen, received commissions of $46,902 and $10,033, related to the sale of Common shares as a result of the High Income Opportunity (NMZ) and High Income Opportunity 2 (NMD) shelf offerings, respectively.
8. Borrowing Arrangements
During January 2008, credit issues associated with sub-prime mortgages and municipal bond insurers caused High Income Opportunity 2 (NMD) to postpone its ARPS offering, and subsequent failed auctions of the ARPS issued by other closed-end funds have postponed the issuance of the Fund’s ARPS indefinitely. Management determined that leveraging the Fund with debt as a replacement for the ARPS continued to benefit the Fund’s shareholders. As a result, the Fund entered into a $50 million senior committed secured 364-day revolving line of credit with its custodian bank. During the fiscal year ended October 31, 2010, the Fund extended the maturity date of its line of credit to July 28, 2011. Amounts drawn on the line of credit are recognized as “Borrowings” on the Statement of Assets and Liabilities.
During the six months ended April 30, 2011, the average daily balance outstanding on the line of credit and average annual interest rate were $35,000,000 and 1.32%, respectively. Interest on the line of credit is calculated at a rate per annum equal to the higher of the overnight Federal Funds Rate or the overnight London Inter-bank Offered Rate (LIBOR) plus 1.00%. Interest expense incurred on the line of credit is recognized as a component of “Interest expense and amortization of offering costs” on the Statement of Operations. In addition to interest expense, the Fund accrued a commitment fee of .15% per annum on the unused portion of the line of credit which is recognized as a component of “Interest expense and amortization of offering costs” on the Statement of Operations.
9. New Accounting Standards
Fair Value Measurements and Disclosures
On May 12, 2011, the Financial Accounting Standards Board (“FASB”) issued an Accounting Standard Update (“ASU”) modifying Topic 820, Fair Value Measurements and Disclosures. At the same time, the International Accounting Standards Board (“IASB”) issued International Financial Reporting Standard (“IFRS”) 13, Fair Value Measurement. The objective by the FASB and IASB is convergence of their guidance on fair value measurements and disclosures. Specifically, the ASU requires reporting entities to disclose i) the amounts of any transfers between Level 1 and Level 2, and the reasons for the transfers, ii) for Level 3 fair value measurements, a) quantitative information about significant unobservable inputs used, b) a description of the valuation processes used by the reporting entity and c) a narrative description of the sensitivity of the fair value measurement to changes in unobservable inputs if a change in those inputs might result in a significantly higher or lower fair value measurement. The effective date of the ASU is for interim and annual periods beginning after December 15, 2011. At this time, management is evaluating the implications of this guidance and the impact it will have on the financial statement amounts and footnote disclosures, if any.
10. Subsequent Events
Preferred Shares
Subsequent to the reporting, Investment Quality (NQM), Select Quality (NQS) and Premier Income (NPF) issued $211,800,000, $252,500,000 and $127,700,000 of VRDP shares, respectively. Immediately following their VRDP issuance, Investment Quality (NQM), Select Quality (NQS) and Premier Income (NPF) noticed for redemption at par their remaining $210,700,000, $251,275,000 and $126,850,000, respectively, ARPS using VRDP proceeds.
Regulatory Matters
Subsequent to the reporting period, Nuveen Securities entered into a settlement with the Financial Industry Regulatory Authority (“FINRA”) with respect to certain allegations regarding Nuveen-sponsored closed-end fund ARPS marketing brochures. As part of this settlement, Nuveen Securities neither admitted to nor denied FINRA’s allegations. Nuveen Securities is the broker-dealer subsidiary of Nuveen.
The settlement with FINRA concludes an investigation that followed the widespread failure of auctions for ARPS and other auction rate securities, which generally began in mid-February 2008. In the settlement, FINRA alleged that certain marketing materials provided by Nuveen Securities were false and misleading. Nuveen Securities agreed to a censure and the payment of a $3 million fine.
Board Approval of Sub-Advisory Arrangements (Unaudited)
At a meeting held on May 25-26, 2010 (the “May Meeting”), the Boards of Trustees or Directors (as the case may be) (each, a “Board” and each Trustee or Director, a “Board Member”) of the Funds, including a majority of the Board Members who are not parties to the advisory agreements or “interested persons” of any parties (the “Independent Board Members”), considered and approved the advisory agreements (each, an “Advisory Agreement”) between each Fund and Nuveen Asset Management (the “Adviser”). Since the May Meeting, Nuveen has engaged in an internal restructuring (the “Restructuring”) pursuant to which the portfolio management services provided by the Adviser to the Funds were transferred to Nuveen Asset Management, LLC (“NAM LLC”), a newly-organized wholly-owned subsidiary of the Adviser and the Adviser changed its name to Nuveen Fund Advisors, Inc. (“NFA”). The Adviser, under its new name NFA, continues to serve as investment adviser to the Funds and, in that capacity, will continue to provide various oversight, administrative, compliance and other services. To effectuate the foregoing, NFA entered into sub-advisory agreements with NAM LLC on behalf of the Funds (each, a “Sub-Advisory Agreement”). Under each Sub-Advisory Agreement, NAM LLC, subject to the oversight of NFA and the Board, will furnish an investment program, make investment decisions for, and place all orders for the purchase and sale of securities for the portion of the respective Fund’s investment portfolio allocated to it by NFA. There have been no changes to the advisory fees paid by the Funds; rather, NFA will pay a portion of the investment advisory fee it receives to NAM LLC for its sub-advisory services. The Independent Board Members reviewed the allocation of fees between NFA and NAM LLC. NFA and NAM LLC do not anticipate any reduction in the nature or level of services provided to the Funds following the Restructuring. The personnel of NFA who engaged in portfolio management activities prior to the spinoff of NAM LLC are not expected to materially change as a result of the spinoff. In light of the foregoing, at a meeting held on November 16-18, 2010, the Board Members, including a majority of the Independent Board Members, approved the Sub-Advisory Agreements on behalf of the Funds. Given that the Restructuring was not expected to reduce the level or nature of services provided and the advisory fees paid by the Funds were the same, the factors considered and determinations made at the May Meeting in approving the Advisory Agreements were equally applicable to the approval of the Sub-Advisory Agreements. For a discussion of these considerations, please see the shareholder report of the Funds that was first issued after the May Meeting for the period including May 2010.
Reinvest Automatically,
Easily and Conveniently
Nuveen makes reinvesting easy. A phone call is all it takes to set up your reinvestment account.
Nuveen Closed-End Funds Automatic Reinvestment Plan
Your Nuveen Closed-End Fund allows you to conveniently reinvest distributions in additional Fund shares.
By choosing to reinvest, you’ll be able to invest money regularly and automatically, and watch your investment grow through the power of compounding. Just like distributions in cash, there may be times when income or capital gains taxes may be payable on distributions that are reinvested.
It is important to note that an automatic reinvestment plan does not ensure a profit, nor does it protect you against loss in a declining market.
Easy and convenient
To make recordkeeping easy and convenient, each month you’ll receive a statement showing your total distributions, the date of investment, the shares acquired and the price per share, and the total number of shares you own.
How shares are purchased
The shares you acquire by reinvesting will either be purchased on the open market or newly issued by the Fund. If the shares are trading at or above net asset value at the time of valuation, the Fund will issue new shares at the greater of the net asset value or 95% of the then-current market price. If the shares are trading at less than net asset value, shares for your account will be purchased on the open market. If the Plan Agent begins purchasing Fund shares on the open market while shares are trading below net asset value, but the Fund’s shares subsequently trade at or above their net asset value before the Plan Agent is able to complete its purchases, the Plan Agent may cease open-market purchases and may invest the uninvested portion of the distribution in newly-issued Fund shares at a price equal to the greater of the shares’ net asset value or 95% of the shares’ market value on the last business day immediately prior to the purchase date. Distributions received to purchase shares in the open market will normally be invested shortly after the distribution payment date. No interest will be paid on distributions awaiting reinvestment. Because the market price of the shares may increase before purchases are completed, the average purchase price per share may
Reinvest Automatically,
Easily and Conveniently (continued)
exceed the market price at the time of valuation, resulting in the acquisition of fewer shares than if the distribution had been paid in shares issued by the Fund. A pro rata portion of any applicable brokerage commissions on open market purchases will be paid by Plan participants. These commissions usually will be lower than those charged on individual transactions.
Flexible
You may change your distribution option or withdraw from the Plan at any time, should your needs or situation change.
You can reinvest whether your shares are registered in your name, or in the name of a brokerage firm, bank, or other nominee. Ask your investment advisor if his or her firm will participate on your behalf. Participants whose shares are registered in the name of one firm may not be able to transfer the shares to another firm and continue to participate in the Plan.
The Fund reserves the right to amend or terminate the Plan at any time. Although the Fund reserves the right to amend the Plan to include a service charge payable by the participants, there is no direct service charge to participants in the Plan at this time.
Call today to start reinvesting distributions
For more information on the Nuveen Automatic Reinvestment Plan or to enroll in or withdraw from the Plan, speak with your financial advisor or call us at (800) 257-8787.
| ■ | Auction Rate Bond: An auction rate bond is a security whose interest payments are adjusted periodically through an auction process, which process typically also serves as a means for buying and selling the bond. Auctions that fail to attract enough buyers for all the shares offered for sale are deemed to have “failed,” with current holders receiving a formula-based interest rate until the next scheduled auction. |
| | |
| ■ | Average Annual Total Return: This is a commonly used method to express an investment’s performance over a particular, usually multi-year time period. It expresses the return that would have been necessary each year to equal the investment’s actual cumulative performance (including change in NAV or market price and reinvested dividends and capital gains distributions, if any) over the time period being considered. |
| | |
| ■ | Average Effective Maturity: The market-value-weighted average of the effective maturity dates of the individual securities including cash. In the case of a bond that has been advance-refunded to a call date, the effective maturity is the date on which the bond is scheduled to be redeemed using the proceeds of an escrow account. In most other cases the effective maturity is the stated maturity date of the security. |
| | |
| ■ | Inverse Floaters: Inverse floating rate securities, also known as inverse floaters, are created by depositing a municipal bond, typically with a fixed interest rate, into a special purpose trust created by a broker-dealer. This trust, in turn, (a) issues floating rate certificates typically paying short-term tax-exempt interest rates to third parties in amounts equal to some fraction of the deposited bond’s par amount or market value, and (b) issues an inverse floating rate certificate (sometimes referred to as an “inverse floater”) to an investor (such as a Fund) interested in gaining investment exposure to a long-term municipal bond. The income received by the holder of the inverse floater varies inversely with the short-term rate paid to the floating rate certificates’ holders, and in most circumstances the holder of the inverse floater bears substantially all of the underlying bond’s downside investment risk. The holder of the inverse floater typically also benefits disproportionately from any potential appreciation of the underlying bond’s value. Hence, an inverse floater essentially represents an investment in the underlying bond on a leveraged basis. |
| | |
| ■ | Leverage: Using borrowed money to invest in securities or other assets. |
Glossary of Terms
Used in this Report (continued)
| ■ | Leverage-Adjusted Duration: Duration is a measure of the expected period over which a bond’s principal and interest will be paid, and consequently is a measure of the sensitivity of a bond’s or bond Fund’s value to changes when market interest rates change. Generally, the longer a bond’s or Fund’s duration, the more the price of the bond or Fund will change as interest rates change. Leverage-adjusted duration takes into account the leveraging process for a Fund and therefore is longer than the duration of the Fund’s portfolio of bonds. |
| | |
| ■ | Market Yield (also known as Dividend Yield or Current Yield): An investment’s current annualized dividend divided by its current market price. |
| | |
| ■ | Net Asset Value (NAV): A Fund’s NAV per common share is calculated by subtracting the liabilities of the Fund (including any Preferred shares issued in order to leverage the Fund) from its total assets and then dividing the remainder by the number of common shares outstanding. Fund NAVs are calculated at the end of each business day. |
| | |
| ■ | Pre-Refunding: Pre-Refunding, also known as advanced refundings or refinancings, is a procedure used by state and local governments to refinance municipal bonds to lower interest expenses. The issuer sells new bonds with a lower yield and uses the proceeds to buy U.S. Treasury securities, the interest from which is used to make payments on the higher-yielding bonds. Because of this collateral, pre-refunding generally raises a bond’s credit rating and thus its value. |
| | |
| ■ | Structural Leverage: Structural Leverage consists of preferred shares or debt issued by the fund. Both of these are part of a fund’s capital structure. Structural leverage is sometimes referred to as “40 Act Leverage” and is subject to asset coverage limits set in the Investment Company Act of 1940. |
| | |
| ■ | Taxable-Equivalent Yield: The yield necessary from a fully taxable investment to equal, on an after-tax basis, the yield of a municipal bond investment. |
| | |
| ■ | Zero Coupon Bond: A zero coupon bond does not pay a regular interest coupon to its holders during the life of the bond. Tax-exempt income to the holder of the bond comes from accretion of the difference between the original purchase price of the bond at issuance and the par value of the bond at maturity and is effectively paid at maturity. The market prices of zero coupon bonds generally are more volatile than the market prices of bonds that pay interest periodically. |
Other Useful Information
Board of
Directors/Trustees
John P. Amboian
Robert P. Bremner
Jack B. Evans
William C. Hunter
David J. Kundert
William J. Schneider
Judith M. Stockdale
Carole E. Stone
Virginia L. Stringer
Terence J. Toth
Fund Manager
Nuveen Fund Advisors, Inc.
333 West Wacker Drive
Chicago, IL 60606
Custodian
State Street Bank
& Trust Company
Boston, MA
Transfer Agent and
Shareholder Services
State Street Bank & Trust
Company
Nuveen Funds
P.O. Box 43071
Providence, RI 02940-3071
(800) 257-8787
Legal Counsel
Chapman and Cutler LLP
Chicago, IL
Independent Registered
Public Accounting Firm
Ernst & Young LLP
Chicago, IL
Quarterly Portfolio of Investments and Proxy Voting Information
You may obtain (i) each Fund’s quarterly portfolio of investments, (ii) information regarding how the Funds voted proxies relating to portfolio securities held during the most recent twelve-month period ended June 30, and (iii) a description of the policies and procedures that the Funds used to determine how to vote proxies relating to portfolio securities without charge, upon request, by calling Nuveen Investments toll-free at (800) 257-8787 or on Nuveen’s website at www.nuveen.com.
You may also obtain this and other Fund information directly from the Securities and Exchange Commission (SEC). The SEC may charge a copying fee for this information. Visit the SEC on-line at http://www.sec.gov or in person at the SEC’s Public Reference Room in Washington, D.C. Call the SEC at (202) 942-8090 for room hours and operation. You may also request Fund information by sending an e-mail request to publicinfo@sec.gov or by writing to the SEC’s Public References Section at 100 F Street NE, Washington, D.C. 20549.
CEO Certification Disclosure
Each Fund’s Chief Executive Officer (CEO) has submitted to the New York Stock Exchange (NYSE) the annual CEO certification as required by Section 303A.12(a) of the NYSE Listed Company Manual.
Each Fund has filed with the SEC the certification of its Chief Executive Officer and Chief Financial Officer required by Section 302 of the Sarbanes-Oxley Act.
Common and Preferred Share Information
Each Fund intends to repurchase and/or redeem shares of its own common and/or auction rate preferred stock in the future at such times and in such amounts as is deemed advisable. During the period covered by this report, the Funds repurchased and/or redeemed shares of their common and/or auction rate preferred stock as shown in the accompanying table.
| Fund | | | Common Shares Repurchased | | | Auction Rate Preferred Shares Redeemed | |
| NQM | | | — | | | — | |
| NQS | | | — | | | — | |
| NQU | | | — | | | 15,475 | |
| NPF | | | — | | | — | |
| NMZ | | | — | | | — | |
| NMD | | | — | | | — | |
Any future repurchases and/or redemptions will be reported to shareholders in the next annual or semi-annual report.
| Nuveen Investments: |
| Serving Investors for Generations |
Since 1898, financial advisors and their clients have relied on Nuveen Investments to provide dependable investment solutions through continued adherence to proven, long-term investing principles. Today, we offer a range of high quality equity and fixed-income solutions designed to be integral components of a well-diversified core portfolio.
Focused on meeting investor needs.
Nuveen Investments is a global investment management firm that seeks to help secure the long-term goals of institutions and high net worth investors as well as the consultants and financial advisors who serve them. We market our growing range of specialized investment solutions under the high-quality brands of HydePark, NWQ, Nuveen Asset Management, Santa Barbara, Symphony, Tradewinds and Winslow Capital. In total, Nuveen Investments managed approximately $206 billion of assets as of March 31, 2011.
Find out how we can help you.
To learn more about how the products and services of Nuveen Investments may be able to help you meet your financial goals, talk to your financial advisor, or call us at (800) 257-8787. Please read the information provided carefully before you invest. Investors should consider the investment objective and policies, risk considerations, charges and expenses of any investment carefully. Where applicable, be sure to obtain a prospectus, which contains this and other relevant information. To obtain a prospectus, please contact your securities representative or Nuveen Investments, 333 W. Wacker Dr., Chicago, IL 60606. Please read the prospectus carefully before you invest or send money.
Learn more about Nuveen Funds at: www.nuveen.com/cef
Nuveen makes things e-simple. | |
| It only takes a minute to sign up for e-Reports. Once enrolled, you’ll receive an e-mail as soon as your Nuveen Fund information is ready - no more waiting for delivery by regular mail. Just click on the link within the e-mail to see the report and save it on your computer if you wish. | |
| | |
Free e-Reports right to your e-mail! www.investordelivery.com | |
| | |
| If you receive your Nuveen Fund distributions and statements from your financial advisor or brokerage account. | |
| | |
| OR | |
| | |
www.nuveen.com/accountaccess | |
| If you receive your Nuveen Fund distributions and statements directly from Nuveen. | |
Distributed by
Nuveen Securities,
LLC 333 West Wacker Drive
Chicago, IL 60606
www.nuveen.com
ESA-C-0411D