AES Corporation
April 5-6, 2005
Barry Sharp
Executive Vice President and
Chief Financial Officer
[LOGO]
[GRAPHIC]
www.aes.com
[LOGO] | Safe Harbor Disclosure |
Certain statements in the following presentation regarding AES’s business operations may constitute “forward looking statements.” Such forward-looking statements include, but are not limited to, those related to future earnings, growth and financial and operating performance. Forward-looking statements are not intended to be a guarantee of future results, but instead constitute AES’s current expectations based on reasonable assumptions. Forecasted financial information is based on certain material assumptions. These assumptions include, but are not limited to continued normal levels of operating performance and electricity demand at our distribution companies and operational performance at our contract generation businesses consistent with historical levels, as well as achievements of planned productivity improvements and incremental growth from investments at investment levels and rates of return consistent with prior experience. Actual results could differ materially from those projected in our forward-looking statements due to risks, uncertainties and other factors. Important factors that could affect actual results are discussed in AES’s filings with the Securities and Exchange Commission, including, but not limited to the risks discussed under the caption “Cautionary Statements and Risk Factors” in AES’s most recent annual report on Form 10-K. Readers are encouraged to read AES’s filings to learn more about the risk factors associated with AES’s business. AES undertakes no obligation to update or revise any forward-looking statements, whether as a result of new information, future events or otherwise.
We urge investors to read our descriptions and discussions of these risks that are contained under the section “Cautionary Statements and Risk Factors” in the Company’s Annual Report on Form 10K for the year ended December 31, 2004 as well as our other SEC filings.
2
One of the Largest Global Power
Companies
Contains Forward Looking Statements
[GRAPHIC]
• Operations in 27 countries on 5 continents
• Capacity to serve 100 million people
• $9.5 billion in revenues
• $30 billion in assets
3
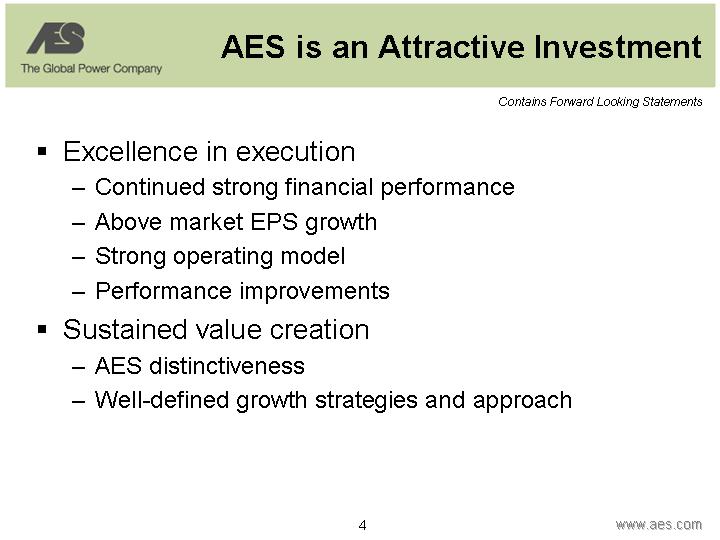
AES is an Attractive Investment
Contains Forward Looking Statements
• Excellence in execution
• Continued strong financial performance
• Above market EPS growth
• Strong operating model
• Performance improvements
• Sustained value creation
• AES distinctiveness
• Well-defined growth strategies and approach
4
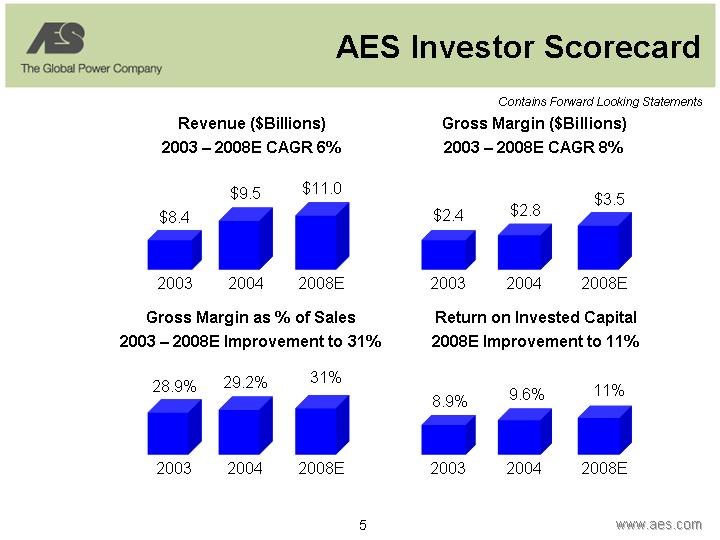
AES Investor Scorecard
Contains Forward Looking Statements
Revenue ($Billions) | Gross Margin ($Billions) |
2003 – 2008E CAGR 6% | 2003 – 2008E CAGR 8% |
| |
[CHART] | [CHART] |
| |
Gross Margin as % of Sales | Return on Invested Capital |
2003 – 2008E Improvement to 31% | 2008E Improvement to 11% |
| |
[CHART] | [CHART] |
5
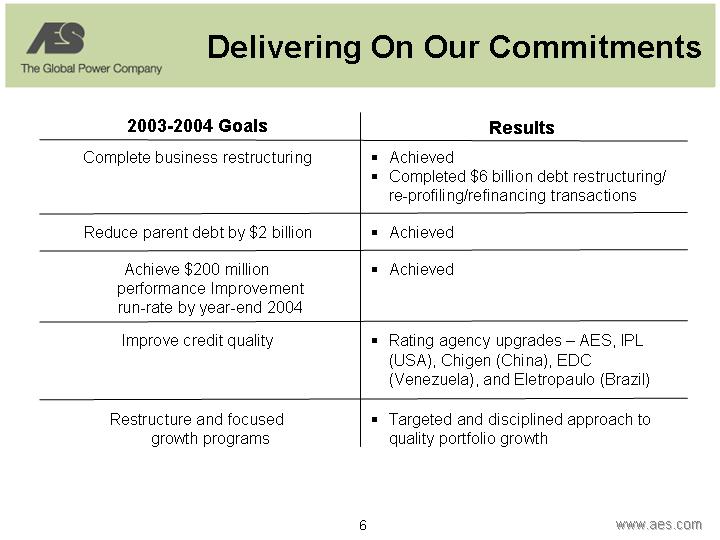
Delivering On Our Commitments
2003-2004 Goals | | Results |
| | |
Complete business restructuring | | • Achieved |
| | • Completed $6 billion debt restructuring/re-profiling/refinancing transactions |
| | |
Reduce parent debt by $2 billion | | • Achieved |
| | |
Achieve $200 million performance Improvement run-rate by year-end 2004 | | • Achieved |
| | |
Improve credit quality | | • Rating agency upgrades – AES, IPL (USA), Chigen (China), EDC (Venezuela), and Eletropaulo (Brazil) |
| | |
Restructure and focused growth programs | | • Targeted and disciplined approach to quality portfolio growth |
6
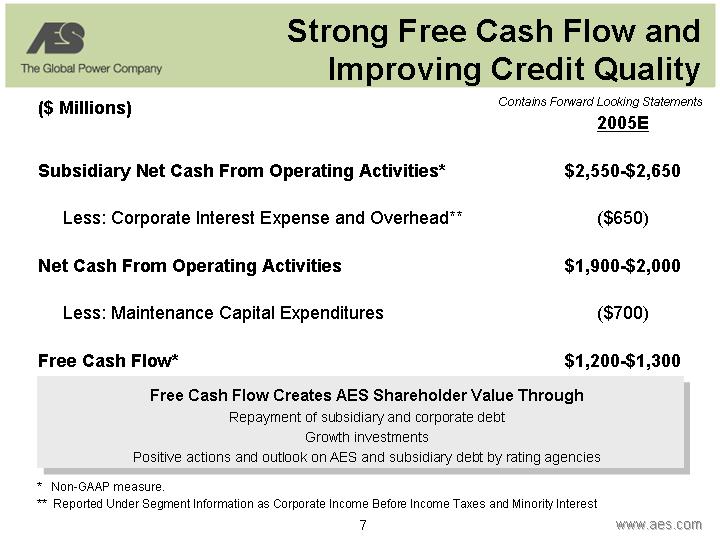
Strong Free Cash Flow and
Improving Credit Quality
($ Millions) | Contains Forward Looking Statements |
| | 2005E | |
| | | |
Subsidiary Net Cash From Operating Activities* | | $2,550-$2,650 | |
| | | |
Less: Corporate Interest Expense and Overhead** | | $(650) | |
| | | |
Net Cash From Operating Activities | | $1,900-$2,000 | |
| | | |
Less: Maintenance Capital Expenditures | | $(700) | |
| | | |
Free Cash Flow* | | $1,200-$1,300 | |
Free Cash Flow Creates AES Shareholder Value Through
Repayment of subsidiary and corporate debt
Growth investments
Positive actions and outlook on AES and subsidiary debt by rating agencies
* Non-GAAP measure.
** Reported Under Segment Information as Corporate Income Before Income Taxes and Minority Interest
7
Double-Digit EPS Growth Outlook
Contains Forward Looking Statements
Projected EPS Growth Rate 2004-2008*
[CHART]
Base Case
Organic growth, deleveraging and performance improvements
Reinvestment Case
New investments using internally generated funds after achieving BB credit ratios
Growth Case
Additional new investments with external financing
* Growth in diluted EPS from continuing operations from 2003 base of $0.56 per share. See appendix for further information on assumptions.
8
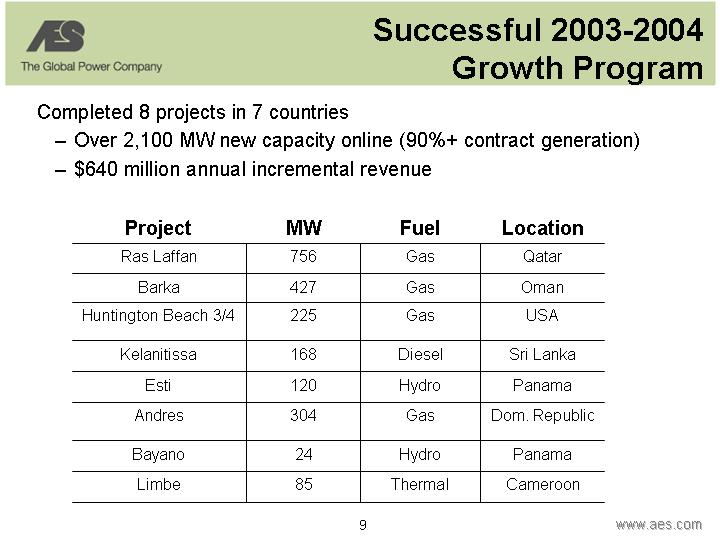
Successful 2003-2004
Growth Program
Completed 8 projects in 7 countries
• Over 2,100 MW new capacity online (90%+ contract generation)
• $640 million annual incremental revenue
Project | | MW | | Fuel | | Location | |
Ras Laffan | | 756 | | Gas | | Qatar | |
| | | | | | | |
Barka | | 427 | | Gas | | Oman | |
| | | | | | | |
Huntington Beach 3/4 | | 225 | | Gas | | USA | |
| | | | | | | |
Kelanitissa | | 168 | | Diesel | | Sri Lanka | |
| | | | | | | |
Esti | | 120 | | Hydro | | Panama | |
| | | | | | | |
Andres | | 304 | | Gas | | Dom. Republic | |
| | | | | | | |
Bayano | | 24 | | Hydro | | Panama | |
| | | | | | | |
Limbe | | 85 | | Thermal | | Cameroon | |
9
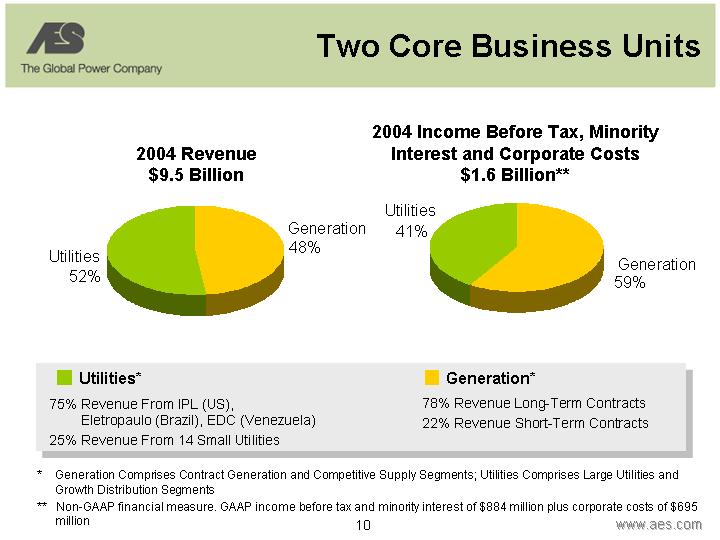
Two Core Business Units
2004 Revenue
$9.5 Billion | 2004 Income Before Tax, Minority
Interest and Corporate Costs
$1.6 Billion** |
| |
[CHART] | [CHART] |
• Utilities* | |
| | | | • Generation* |
75% | | Revenue From IPL (US), | |
| | Eletropaulo (Brazil), EDC (Venezuela) | 78% | | Revenue Long-Term Contracts |
| | | |
25% | | Revenue From 14 Small Utilities | 22% | | Revenue Short-Term Contracts |
| | | | | | | |
* Generation Comprises Contract Generation and Competitive Supply Segments; Utilities Comprises Large Utilities and Growth Distribution Segments
** Non-GAAP financial measure. GAAP income before tax and minority interest of $884 million plus corporate costs of $695 million
10
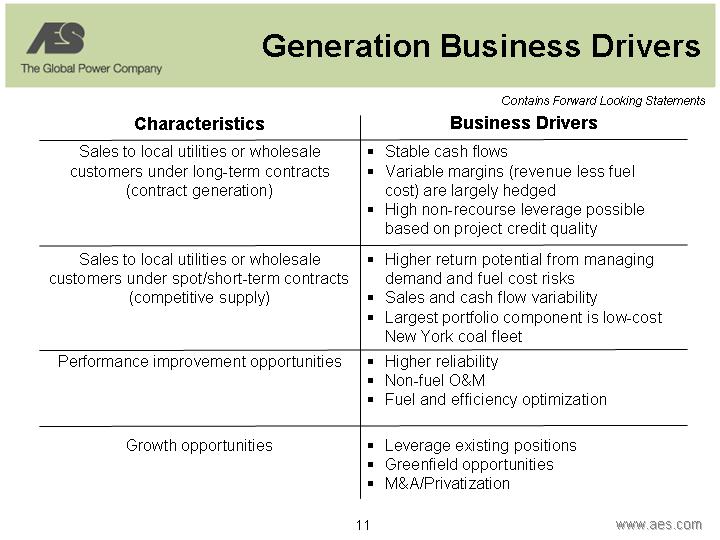
Generation Business Drivers
Contains Forward Looking Statements
Characteristics | | Business Drivers |
| | |
Sales to local utilities or wholesale customers under long-term contracts (contract generation) | | • Stable cash flows • Variable margins (revenue less fuel cost) are largely hedged • High non-recourse leverage possible based on project credit quality |
| | |
Sales to local utilities or wholesale customers under spot/short-term contracts (competitive supply) | | • Higher return potential from managing demand and fuel cost risks • Sales and cash flow variability • Largest portfolio component is low-cost New York coal fleet |
| | |
Performance improvement opportunities | | • Higher reliability |
| | • Non-fuel O&M |
| | • Fuel and efficiency optimization |
| | |
Growth opportunities | | • Leverage existing positions |
| | • Greenfield opportunities |
| | • M&A/Privatization |
11
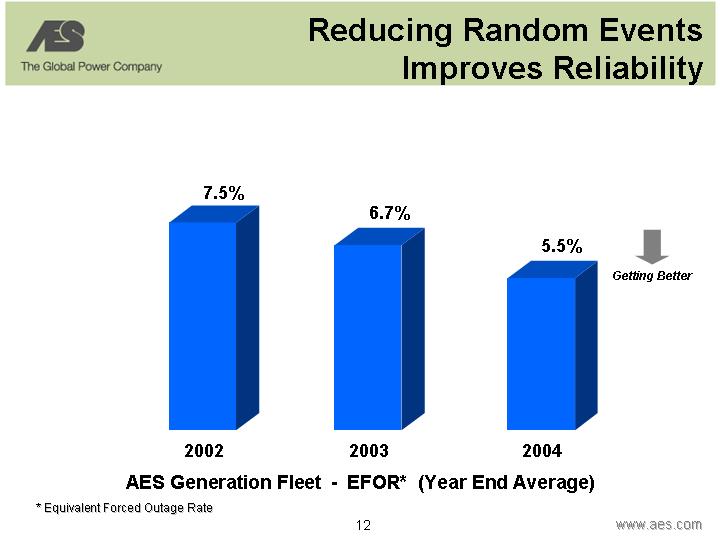
Reducing Random Events
Improves Reliability
[CHART]
AES Generation Fleet - - EFOR* (Year End Average)
* Equivalent Forced Outage Rate
12
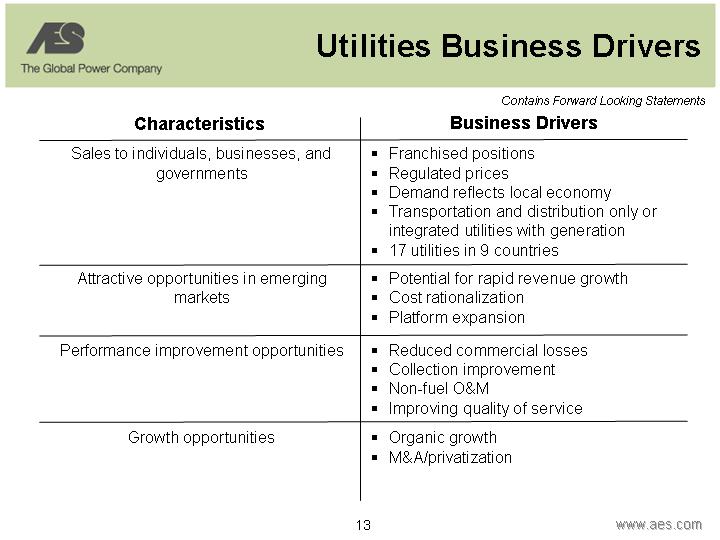
Utilities Business Drivers
Contains Forward Looking Statements
Characteristics | | Business Drivers |
| | |
Sales to individuals, businesses, and governments | | • Franchised positions |
| | • Regulated prices |
| | • Demand reflects local economy |
| | • Transportation and distribution only or integrated utilities with generation |
| | • 17 utilities in 9 countries |
| | |
Attractive opportunities in emerging markets | | • Potential for rapid revenue growth |
| | • Cost rationalization |
| | • Platform expansion |
| | |
Performance improvement opportunities | | • Reduced commercial losses |
| | • Collection improvement |
| | • Non-fuel O&M |
| | • Improving quality of service |
| | |
Growth opportunities | | • Organic growth |
| | • M&A/privatization |
13
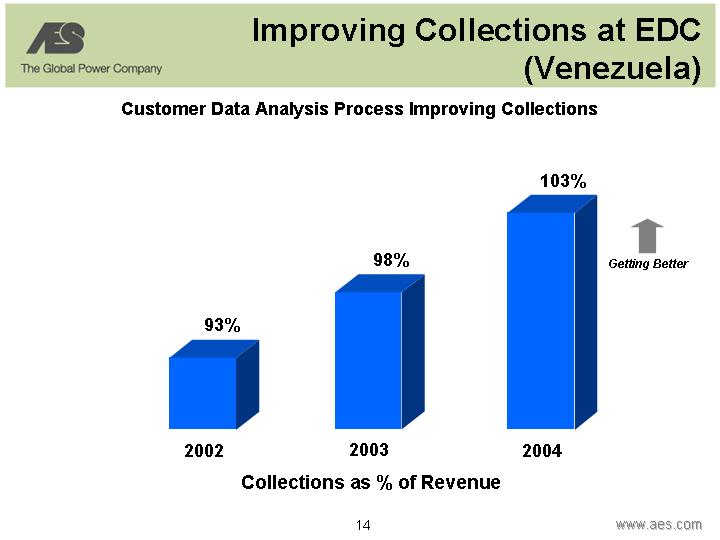
Improving Collections at EDC
(Venezuela)
Customer Data Analysis Process Improving Collections
[CHART]
Collections as % of Revenue
14
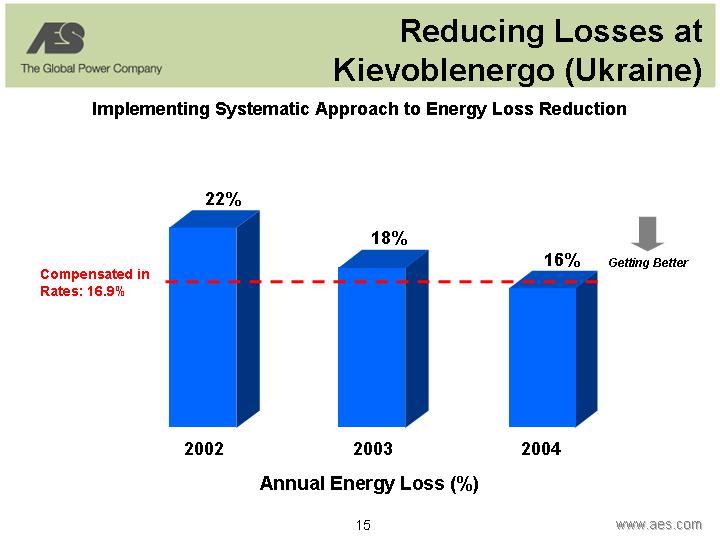
Reducing Losses at
Kievoblenergo (Ukraine)
Implementing Systematic Approach to Energy Loss Reduction
[CHART]
Annual Energy Loss (%)
15
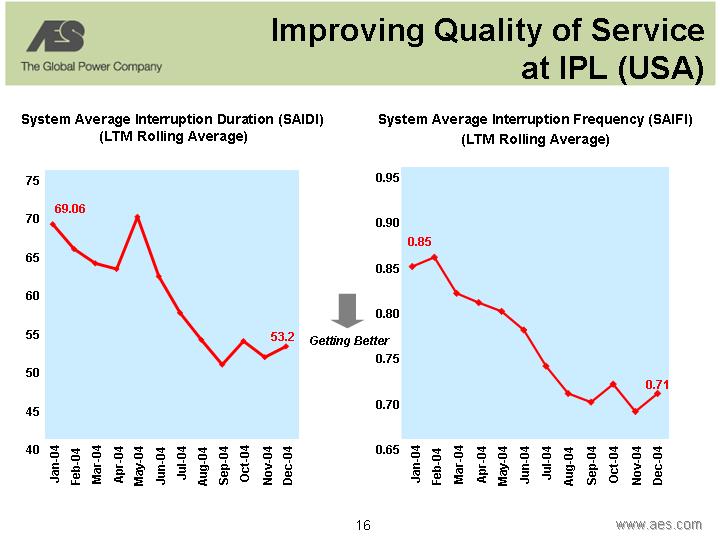
Improving Quality of Service
at IPL (USA)
System Average Interruption Duration (SAIDI)
(LTM Rolling Average)
[CHART]
System Average Interruption Frequency (SAIFI)
(LTM Rolling Average)
[CHART]
16
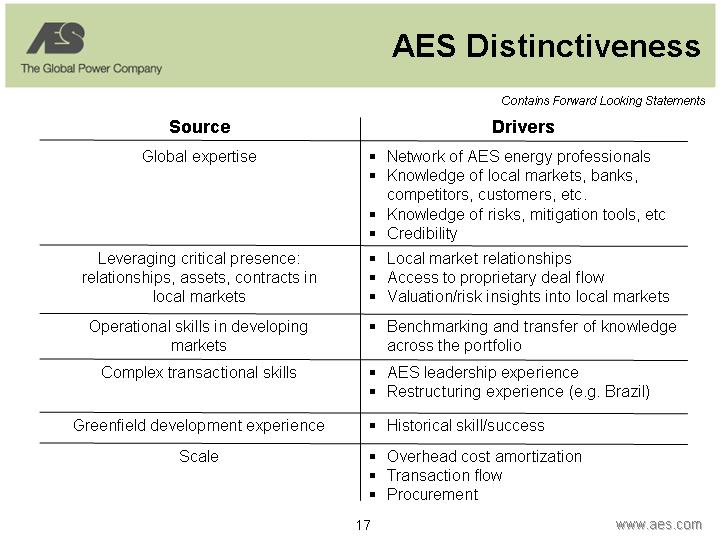
AES Distinctiveness
Contains Forward Looking Statements
Source | | Drivers |
Global expertise | | • Network of AES energy professionals |
| | • Knowledge of local markets, banks, competitors, customers, etc. |
| | • Knowledge of risks, mitigation tools, etc |
| | • Credibility |
| | |
Leveraging critical presence:
relationships, assets, contracts in local markets | | • Local market relationships • Access to proprietary deal flow • Valuation/risk insights into local markets |
| | |
Operational skills in developing markets | | • Benchmarking and transfer of knowledge across the portfolio |
| | |
Complex transactional skills | | • AES leadership experience • Restructuring experience (e.g. Brazil) |
| | |
Greenfield development experience | | • Historical skill/success |
| | |
Scale | | • Overhead cost amortization • Transaction flow • Procurement |
17
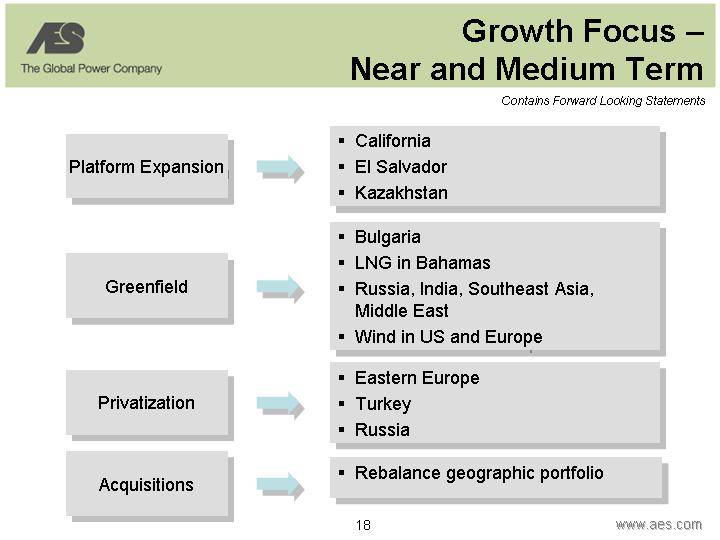
Growth Focus –
Near and Medium Term
Contains Forward Looking Statements
Platform Expansion | • | California |
| • | El Salvador |
| • | Kazakhstan |
| | |
Greenfield | • | Bulgaria |
| • | LNG in Bahamas |
| • | Russia, India, Southeast Asia, Middle East |
| • | Wind in US and Europe |
| | |
Privatization | • | Eastern Europe |
| • | Turkey |
| • | Russia |
| | |
Acquisitions | • | Rebalance geographic portfolio |
18
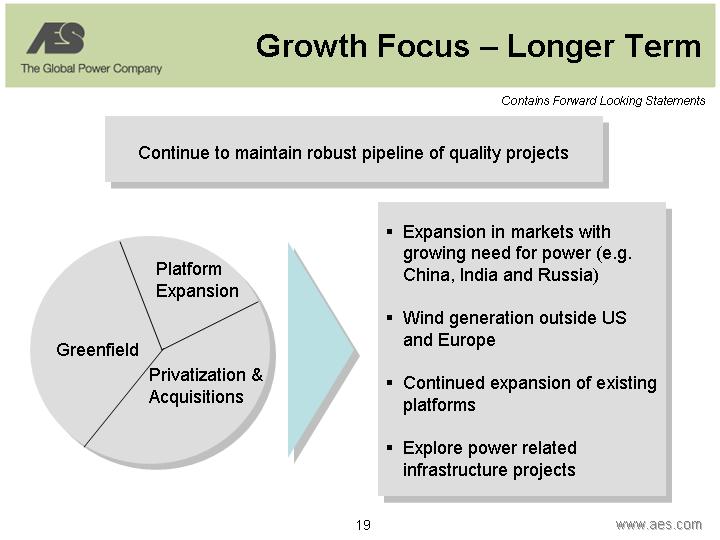
Growth Focus – Longer Term
Contains Forward Looking Statements
Continue to maintain robust pipeline of quality projects
[CHART] | • | Expansion in markets with growing need for power (e.g. China, India and Russia) |
| |
• | Wind generation outside US and Europe |
| |
• | Continued expansion of existing platforms |
| |
• | Explore power related infrastructure projects |
19
Why Invest in AES?
Contains Forward Looking Statements
• | Diversified portfolio | [GRAPHIC] |
| |
• | Above average earnings growth outlook |
| |
• | Strong free cash flow |
| |
• | Financial discipline |
| |
• | Improving credit quality |
| |
• | Long-term growth potential |
| |
• | Incentives aligned with shareholders |
20
Appendix – Reconciliation of
Adjusted Earnings Per Share
($ Per Share)
| | 2004 | | 2003 | |
Adjusted Earnings Per Share* | | $ | 0.73 | | $ | 0.56 | |
FAS 133 Mark-to-Market Gains/(Losses)** | | (0.06 | ) | (0.07 | ) |
Currency Transaction Gains/(Losses) | | (0.02 | ) | 0.19 | |
Net Asset Gains/(Losses and Impairments) | | (0.05 | ) | (0.24 | ) |
Debt Retirement Gains/(Losses) | | (0.03 | ) | 0.12 | |
Diluted EPS from Continuing Operations | | $ | 0.57 | | $ | 0.56 | |
* Adjusted earnings per share (a non-GAAP financial measure) is defined as diluted earnings per share from continuing operations excluding gains or losses associated with (a) mark-to-market amounts related to FAS 133 derivative transactions, (b) foreign currency transaction impacts on the net monetary position related to Brazil, Venezuela, and Argentina, (c) significant asset gains or losses due to disposition transactions and impairments, and (d) early retirement of recourse debt. AES believes that adjusted earnings per share better reflects the underlying business performance of the Company, and are considered in the Company’s internal evaluation of financial performance. Factors in this determination include the variability associated with mark-to-market gains or losses related to certain derivative transactions, and periodic strategic decisions to dispose of certain assets which may influence results in a given period. Certain reclassifications have been made to prior-period amounts to conform to the 2004 presentation.
** The year ended December 31, 2004 includes $(0.03) related to Chile debt restructuring costs included in interest expense in the first quarter of 2004.
21
Appendix - Assumptions
Forecasted financial information is based on certain material assumptions. Such assumptions include, but are not limited to (a) we assume continued normal levels of operating performance and electricity demand at our distribution companies, (b) we assume operational performance at our contract generation businesses consistent with historical levels and in accordance with the provisions of the relevant contracts, (c) we assume achievements of planned productivity improvements, and (d) we assume incremental growth investments at investment levels and rates of return consistent with prior experience.
In addition, benefits from global sourcing include avoided cost savings, reduction in capital project costs versus budgetary estimates, and projected savings based on assumed spend volume which may or may not actually be achieved. These benefits will not be fully reflected in the Company’s consolidated financial results.
22
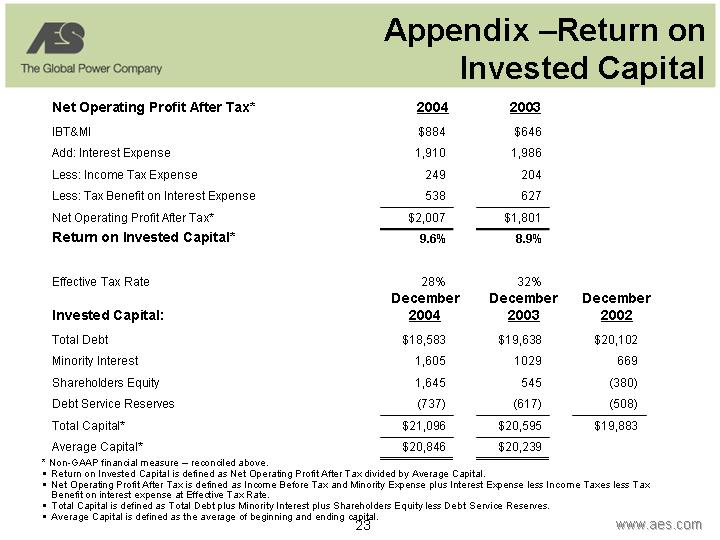
Appendix –Return on
Invested Capital
| | 2004 | | 2003 | |
Net Operating Profit After Tax* | | | | | |
IBT&MI | | $ | 884 | | $ | 646 | |
Add: Interest Expense | | 1,910 | | 1,986 | |
Less: Income Tax Expense | | 249 | | 204 | |
Less: Tax Benefit on Interest Expense | | 538 | | 627 | |
Net Operating Profit After Tax* | | $ | 2,007 | | $ | 1,801 | |
Return on Invested Capital* | | 9.6 | % | 8.9 | % |
| | | | | |
Effective Tax Rate | | 28 | % | 32 | % |
| | December | | December | | December | |
Invested Capital: | | 2004 | | 2003 | | 2002 | |
Total Debt | | $ | 18,583 | | $ | 19,638 | | $ | 20,102 | |
Minority Interest | | 1,605 | | 1029 | | 669 | |
Shareholders Equity | | 1,645 | | 545 | | (380 | ) |
Debt Service Reserves | | (737 | ) | (617 | ) | (508 | ) |
Total Capital* | | $ | 21,096 | | $ | 20,595 | | $ | 19,883 | |
Average Capital* | | $ | 20,846 | | $ | 20,239 | | | |
* Non-GAAP financial measure – reconciled above.
• Return on Invested Capital is defined as Net Operating Profit After Tax divided by Average Capital.
• Net Operating Profit After Tax is defined as Income Before Tax and Minority Expense plus Interest Expense less Income Taxes less Tax Benefit on interest expense at Effective Tax Rate.
• Total Capital is defined as Total Debt plus Minority Interest plus Shareholders Equity less Debt Service Reserves.
• Average Capital is defined as the average of beginning and ending capital.
23