Searchable text section of graphics shown above
AES CORPORATION | | 2006 AES Investor Conference Series |
| | Scott Cunningham |
| | Vice President, Investor Relations |
[GRAPHIC]
March 22, 2006
Safe Harbor Disclosure
Certain statements in the following presentation regarding AES’s business operations may constitute “forward looking statements.”
Such forward-looking statements include, but are not limited to, those related to future earnings, growth and financial and operating performance. Forward-looking statements are not intended to be a guarantee of future results, but instead constitute AES’s current expectations based on reasonable assumptions. Forecasted financial information is based on certain material assumptions. These assumptions include, but are not limited to continued normal or better levels of operating performance and electricity demand at our distribution companies and operational performance at our contract generation businesses consistent with historical levels, as well as achievements of planned productivity improvements and incremental growth from investments at investment levels and rates of return consistent with prior experience. For additional assumptions see the Appendix to this presentation. Actual results could differ materially from those projected in our forward-looking statements due to risks, uncertainties and other factors. Important factors that could affect actual results are discussed in AES’s filings with the Securities and Exchange Commission, including, but not limited to the risks discussed under the caption “Cautionary Statements and Risk Factors” in the Company’s 2004 Annual Report on
Form 10-K/A, as well as our other SEC filings. AES undertakes no obligation to update or revise any forward-looking statements, whether as a result of new information, future events or otherwise.
www.aes.com
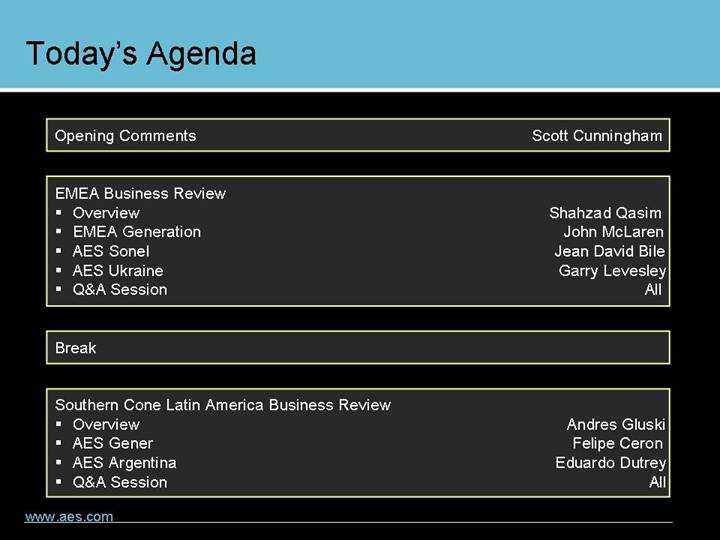
Today’s Agenda
Opening Comments | | Scott Cunningham |
| | |
EMEA Business Review | | |
• Overview | | Shahzad Qasim |
• EMEA Generation | | John McLaren |
• AES Sonel | | Jean David Bile |
• AES Ukraine | | Garry Levesley |
• Q&A Session | | All |
| | |
Break | | |
| | |
Southern Cone Latin America Business Review | | |
• Overview | | Andres Gluski |
• AES Gener | | Felipe Ceron |
• AES Argentina | | Eduardo Dutrey |
• Q&A Session | | All |
Appendix - Assumptions
Forecasted financial information is based on certain material assumptions. Such assumptions include, but are not limited to: 1) no unforeseen external events such as wars, depressions, or economic or political disruptions occur; 2 ) businesses continue to operate in a manner consistent with or better than prior operating performance, including achievement of planned productivity improvements including benefits of global sourcing, and in accordance with the provisions of their relevant contracts or concessions; 3) new business opportunities are available to AES in sufficient quantity so that AES can capture its historical market share; 4) no major disruptions or discontinuities occur in GDP, foreign exchange rates, inflation or interest rates during the forecast period; 5) negative factors do not combine to create highly negative low-probability business situations; 6) business-specific risks as described in the Company’s SEC filings do not occur.
In addition, benefits from global sourcing include avoided costs, reduction in capital project costs versus budgetary estimates, and projected savings based on assumed spend volume which may or may not actually be achieved. These benefits will not be fully reflected in the Company’s consolidated financial results.
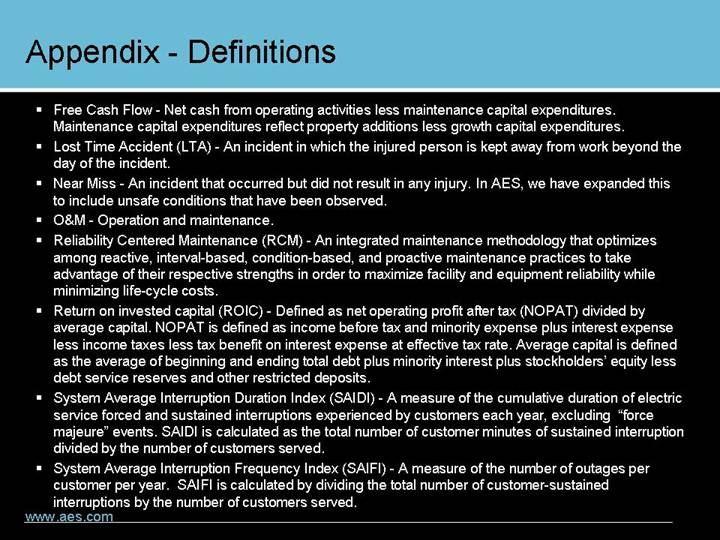
Appendix - Definitions
• Free Cash Flow - Net cash from operating activities less maintenance capital expenditures. Maintenance capital expenditures reflect property additions less growth capital expenditures.
• Lost Time Accident (LTA) - An incident in which the injured person is kept away from work beyond the day of the incident.
• Near Miss - An incident that occurred but did not result in any injury. In AES, we have expanded this to include unsafe conditions that have been observed.
• O&M - - Operation and maintenance.
• Reliability Centered Maintenance (RCM) - An integrated maintenance methodology that optimizes among reactive, interval-based, condition-based, and proactive maintenance practices to take advantage of their respective strengths in order to maximize facility and equipment reliability while minimizing life-cycle costs.
• Return on invested capital (ROIC) - Defined as net operating profit after tax (NOPAT) divided by average capital. NOPAT is defined as income before tax and minority expense plus interest expense less income taxes less tax benefit on interest expense at effective tax rate. Average capital is defined as the average of beginning and ending total debt plus minority interest plus stockholders’ equity less debt service reserves and other restricted deposits.
• System Average Interruption Duration Index (SAIDI) - A measure of the cumulative duration of electric service forced and sustained interruptions experienced by customers each year, excluding “force majeure” events. SAIDI is calculated as the total number of customer minutes of sustained interruption divided by the number of customers served.
• System Average Interruption Frequency Index (SAIFI) - A measure of the number of outages per customer per year. SAIFI is calculated by dividing the total number of customer-sustained interruptions by the number of customers served.
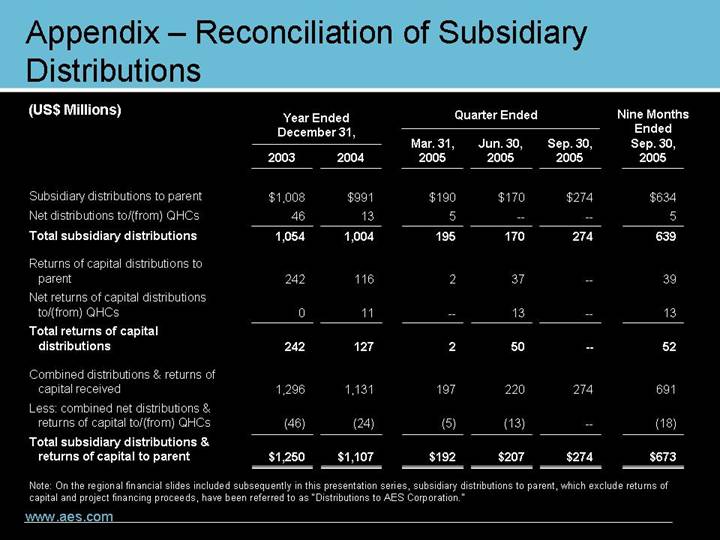
Appendix – Reconciliation of Subsidiary Distributions
| | | | | | Nine Months | |
| | Year Ended | | Quarter Ended | | Ended | |
| | December 31, | | Mar. 31, | | Jun. 30, | | Sep. 30, | | Sep. 30, | |
(US$ Millions) | | 2003 | | 2004 | | 2005 | | 2005 | | 2005 | | 2005 | |
| | | | | | | | | | | | | |
Subsidiary distributions to parent | | $ | 1,008 | | $ | 991 | | $ | 190 | | $ | 170 | | $ | 274 | | $ | 634 | |
Net distributions to/(from) QHCs | | 46 | | 13 | | 5 | | — | | — | | 5 | |
Total subsidiary distributions | | 1,054 | | 1,004 | | 195 | | 170 | | 274 | | 639 | |
| | | | | | | | | | | | | |
Returns of capital distributions to parent | | 242 | | 116 | | 2 | | 37 | | — | | 39 | |
Net returns of capital distributions to/(from) QHCs | | 0 | | 11 | | — | | 13 | | — | | 13 | |
Total returns of capital distributions | | 242 | | 127 | | 2 | | 50 | | — | | 52 | |
| | | | | | | | | | | | | |
Combined distributions & returns of capital received | | 1,296 | | 1,131 | | 197 | | 220 | | 274 | | 691 | |
Less: combined net distributions & returns of capital to/(from) QHCs | | (46 | ) | (24 | ) | (5 | ) | (13 | ) | — | | (18 | ) |
Total subsidiary distributions & returns of capital to parent | | $ | 1,250 | | $ | 1,107 | | $ | 192 | | $ | 207 | | $ | 274 | | $ | 673 | |
| | | | | | | | | | | | | | | | | | | | |
Note: On the regional financial slides included subsequently in this presentation series, subsidiary distributions to parent, which exclude returns of capital and project financing proceeds, have been referred to as “Distributions to AES Corporation.”
| AES EMEA Business Review |
AES CORPORATION | |
| Shahzad Qasim |
| President, Europe and Africa |
[GRAPHIC]
March 22, 2006
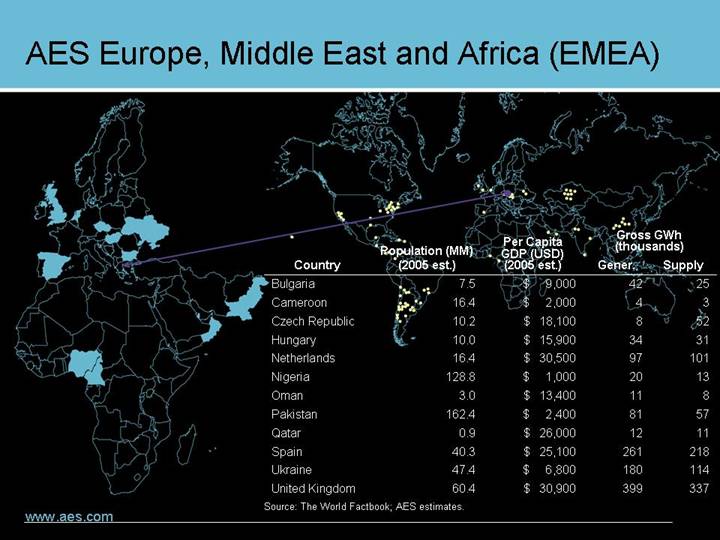
AES Europe, Middle East and Africa (EMEA)
[GRAPHIC]
| | Population (MM) | | Per Capita
GDP (USD) | | Gross GWh
(thousands) | |
Country | | (2005 est.) | | (2005 est.) | | Gener. | | Supply | |
Bulgaria | | 7.5 | | $ | 9,000 | | 42 | | 25 | |
Cameroon | | 16.4 | | $ | 2,000 | | 4 | | 3 | |
Czech Republic | | 10.2 | | $ | 18,100 | | 8 | | 52 | |
Hungary | | 10.0 | | $ | 15,900 | | 34 | | 31 | |
Netherlands | | 16.4 | | $ | 30,500 | | 97 | | 101 | |
Nigeria | | 128.8 | | $ | 1,000 | | 20 | | 13 | |
Oman | | 3.0 | | $ | 13,400 | | 11 | | 8 | |
Pakistan | | 162.4 | | $ | 2,400 | | 81 | | 57 | |
Qatar | | 0.9 | | $ | 26,000 | | 12 | | 11 | |
Spain | | 40.3 | | $ | 25,100 | | 261 | | 218 | |
Ukraine | | 47.4 | | $ | 6,800 | | 180 | | 114 | |
United Kingdom | | 60.4 | | $ | 30,900 | | 399 | | 337 | |
Source: The World Factbook; AES estimates.
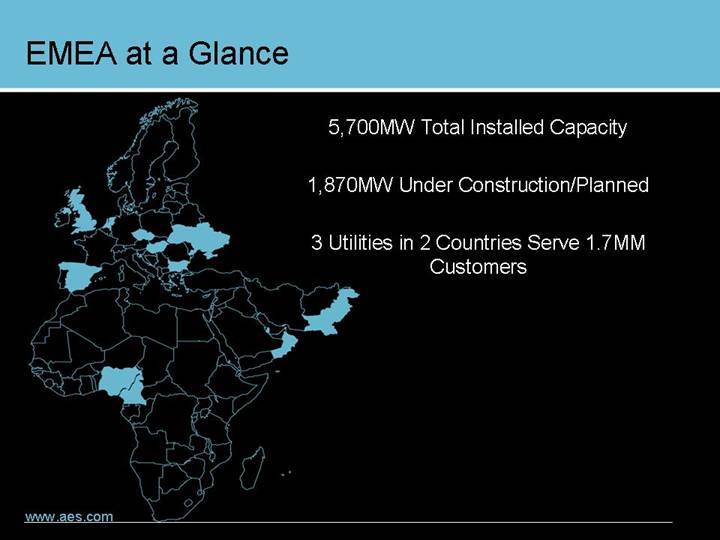
EMEA at a Glance
[GRAPHIC]
5,700MW Total Installed Capacity
1,870MW Under Construction/Planned
3 Utilities in 2 Countries Serve 1.7MM Customers
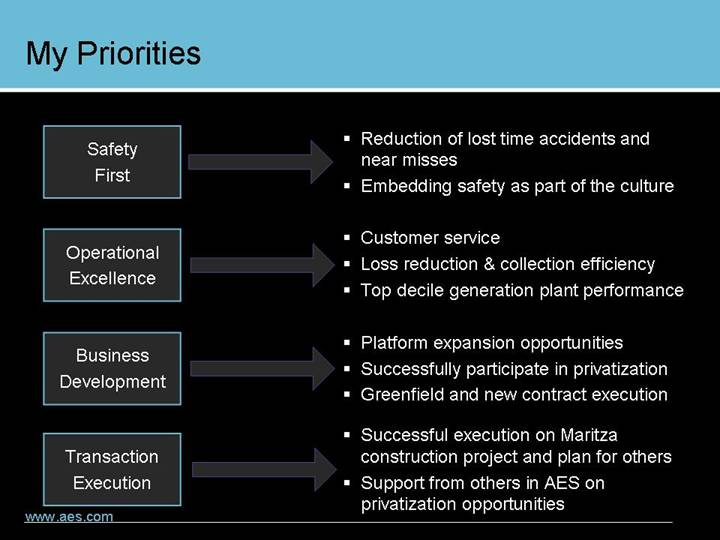
My Priorities
Safety | | • Reduction of lost time accidents and near misses |
First | | • Embedding safety as part of the culture |
| | |
Operational | | • Customer service |
Excellence | | • Loss reduction & collection efficiency |
| | • Top decile generation plant performance |
| | |
Business | | • Platform expansion opportunities |
Development | | • Successfully participate in privatization |
| | • Greenfield and new contract execution |
| | |
Transaction
Execution | | • Successful execution on Maritza construction project and plan for others |
| | • Support from others in AES on privatization opportunities |
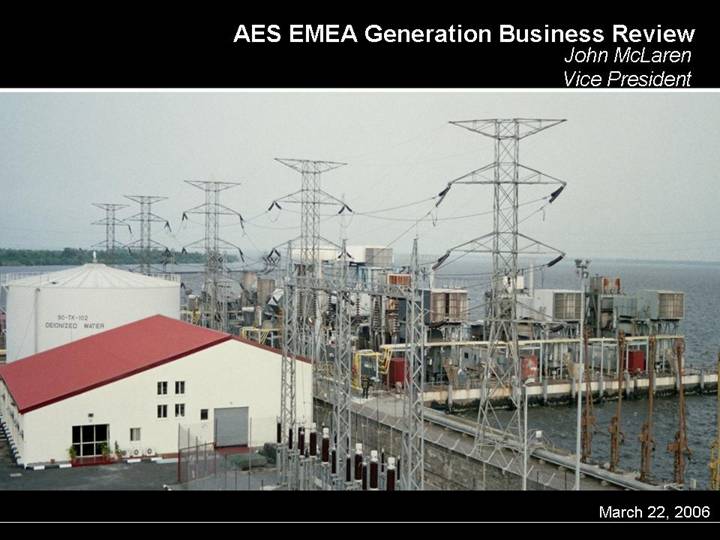
AES EMEA Generation Business Review
John McLaren
Vice President
[GRAPHIC]
March 22, 2006
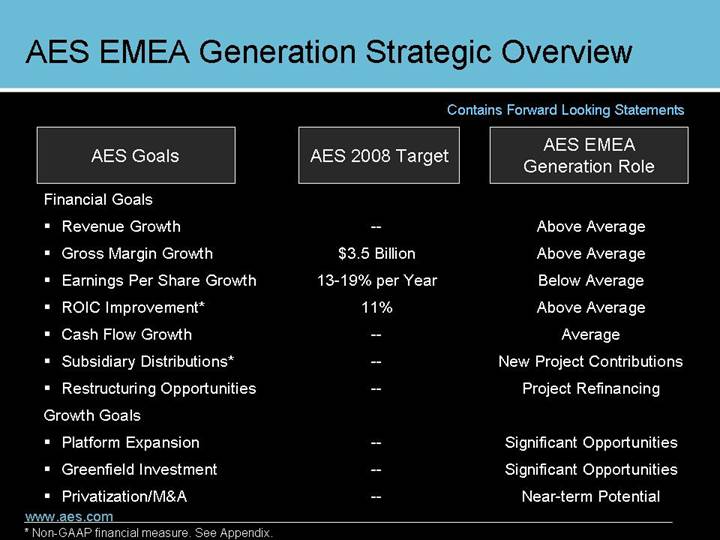
AES EMEA Generation Strategic Overview
Contains Forward Looking Statements
AES Goals | | AES 2008 Target | | AES EMEA
Generation Role | |
| | | | | |
Financial Goals | | | | | |
• Revenue Growth | | — | | Above Average | |
• Gross Margin Growth | | $3.5 Billion | | Above Average | |
• Earnings Per Share Growth | | 13-19% per Year | | Below Average | |
• ROIC Improvement* | | 11% | | Above Average | |
• Cash Flow Growth | | — | | Average | |
• Subsidiary Distributions* | | — | | New Project Contributions | |
• Restructuring Opportunities | | — | | Project Refinancing | |
Growth Goals | | | | | |
• Platform Expansion | | — | | Significant Opportunities | |
• Greenfield Investment | | — | | Significant Opportunities | |
• Privatization/M&A | | — | | Near-term Potential | |
* Non-GAAP financial measure. See Appendix.
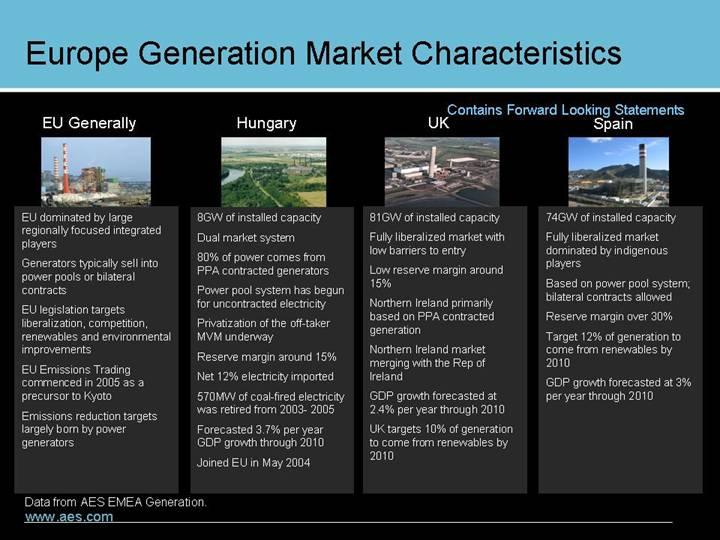
Europe Generation Market Characteristics
Contains Forward Looking Statements
EU Generally | | Hungary | | UK | | Spain |
| | | | | | |
[GRAPHIC] | | [GRAPHIC] | | [GRAPHIC] | | [GRAPHIC] |
| | | | | | |
EU dominated by large regionally focused integrated players
Generators typically sell into power pools or bilateral contracts
EU legislation targets liberalization, competition, renewables and environmental improvements
EU Emissions Trading commenced in 2005 as a precursor to Kyoto
Emissions reduction targets largely born by power generators | | 8GW of installed capacity
Dual market system
80% of power comes from PPA contracted generators
Power pool system has begun for uncontracted electricity
Privatization of the off-taker MVM underway
Reserve margin around 15%
Net 12% electricity imported
570MW of coal-fired electricity was retired from 2003- 2005
Forecasted 3.7% per year GDP growth through 2010
Joined EU in May 2004 | | 81GW of installed capacity
Fully liberalized market with low barriers to entry
Low reserve margin around 15%
Northern Ireland primarily based on PPA contracted generation
Northern Ireland market merging with the Rep of Ireland
GDP growth forecasted at 2.4% per year through 2010
UK targets 10% of generation to come from renewables by 2010 | | 74GW of installed capacity
Fully liberalized market dominated by indigenous players
Based on power pool system; bilateral contracts allowed
Reserve margin over 30%
Target 12% of generation to come from renewables by 2010
GDP growth forecasted at 3% per year through 2010 |
Data from AES EMEA Generation.
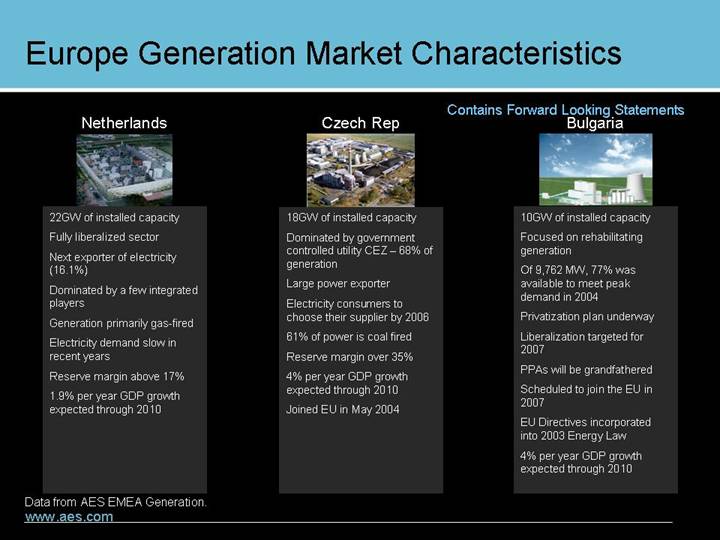
Netherlands | | Czech Rep | | Bulgaria |
| | | | |
[GRAPHIC] | | [GRAPHIC] | | [GRAPHIC] |
| | | | |
22GW of installed capacity
Fully liberalized sector
Next exporter of electricity (16.1%)
Dominated by a few integrated players
Generation primarily gas-fired
Electricity demand slow in recent years
Reserve margin above 17%
1.9% per year GDP growth expected through 2010 | | 18GW of installed capacity
Dominated by government controlled utility CEZ – 68% of generation
Large power exporter
Electricity consumers to choose their supplier by 2006
61% of power is coal fired
Reserve margin over 35%
4% per year GDP growth expected through 2010
Joined EU in May 2004 | | 10GW of installed capacity
Focused on rehabilitating generation
Of 9,762 MW, 77% was available to meet peak demand in 2004
Privatization plan underway
Liberalization targeted for 2007
PPAs will be grandfathered
Scheduled to join the EU in 2007
EU Directives incorporated into 2003 Energy Law
4% per year GDP growth expected through 2010 |
Dependable Reserve Margin in 2004
[CHART]
Source: Cambridge Energy Research Associates.
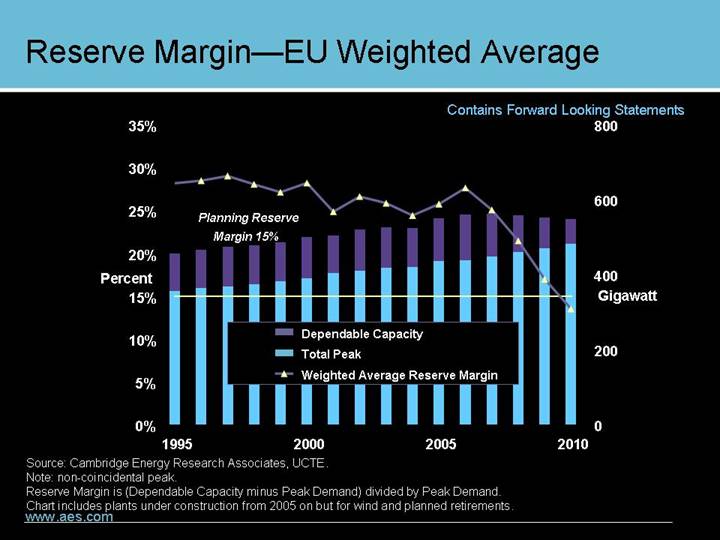
Reserve Margin—EU Weighted Average
Contains Forward Looking Statements
[CHART]
Source: Cambridge Energy Research Associates, UCTE.
Note: non-coincidental peak.
Reserve Margin is (Dependable Capacity minus Peak Demand) divided by Peak Demand.
Chart includes plants under construction from 2005 on but for wind and planned retirements.
Capacity Additions—EU
[CHART]
Source: Cambridge Energy Research Associates, Platts.
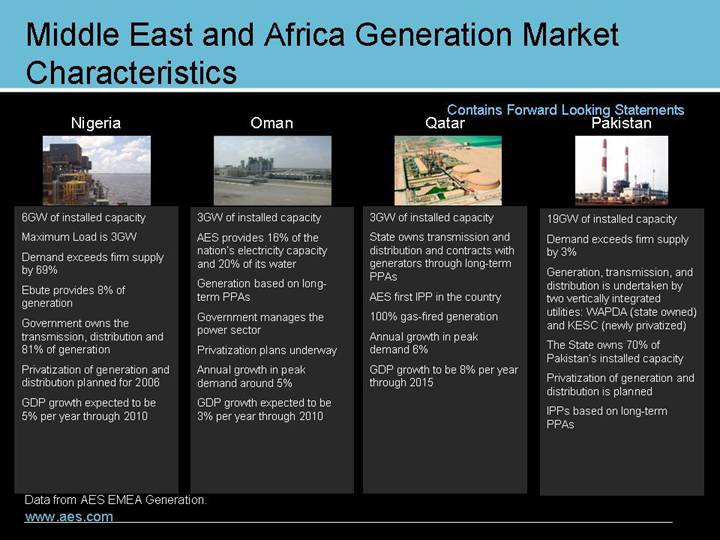
Middle East and Africa Generation Market Characteristics
Nigeria | | Oman | | Qatar | | Pakistan |
| | | | | | |
[GRAPHIC] | | [GRAPHIC] | | [GRAPHIC] | | [GRAPHIC] |
| | | | | | |
6GW of installed capacity
Maximum Load is 3GW
Demand exceeds firm supply by 69%
Ebute provides 8% of generation
Government owns the transmission, distribution and 81% of generation
Privatization of generation and distribution planned for 2006
GDP growth expected to be 5% per year through 2010 | | 3GW of installed capacity
AES provides 16% of the nation’s electricity capacity and 20% of its water
Generation based on long-term PPAs
Government manages the power sector
Privatization plans underway
Annual growth in peak demand around 5%
GDP growth expected to be 3% per year through 2010 | | 3GW of installed capacity
State owns transmission and distribution and contracts with generators through long-term PPAs
AES first IPP in the country
100% gas-fired generation
Annual growth in peak demand 6%
GDP growth to be 8% per year through 2015 | | 19GW of installed capacity
Demand exceeds firm supply by 3%
Generation, transmission, and distribution is undertaken by two vertically integrated
utilities: WAPDA (state owned) and KESC (newly privatized)
The State owns 70% of Pakistan’s installed capacity
Privatization of generation and distribution is planned
IPPs based on long-term PPAs |
Data from AES EMEA Generation.
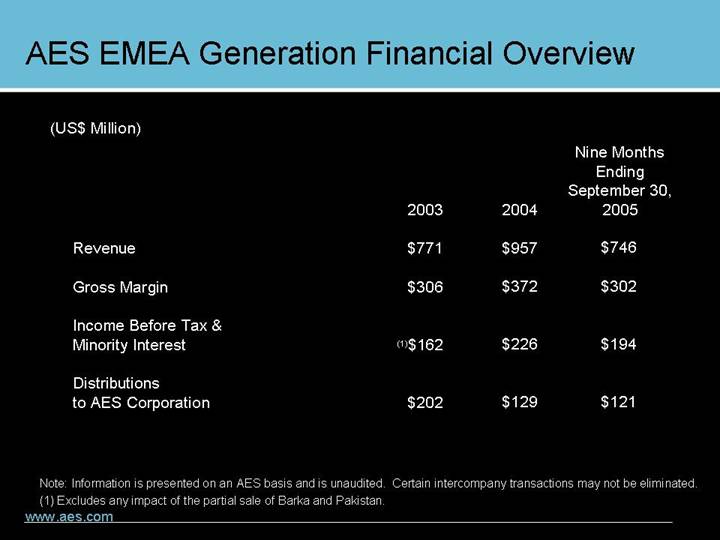
AES EMEA Generation Financial Overview
(US$ Million)
| | | | | | Nine Months
Ending
September 30, | |
| | 2003 | | 2004 | | 2005 | |
| | | | | | | |
Revenue | | $ | 771 | | $ | 957 | | $ | 746 | |
| | | | | | | |
Gross Margin | | $ | 306 | | $ | 372 | | $ | 302 | |
| | | | | | | |
Income Before Tax &Minority Interest | | $ | 162 | (1) | $ | 226 | | $ | 194 | |
| | | | | | | |
Distributions to AES Corporation | | $ | 202 | | $ | 129 | | $ | 121 | |
| | | | | | | | | | | |
Note: Information is presented on an AES basis and is unaudited. Certain intercompany transactions may not be eliminated.
(1) Excludes any impact of the partial sale of Barka and Pakistan.
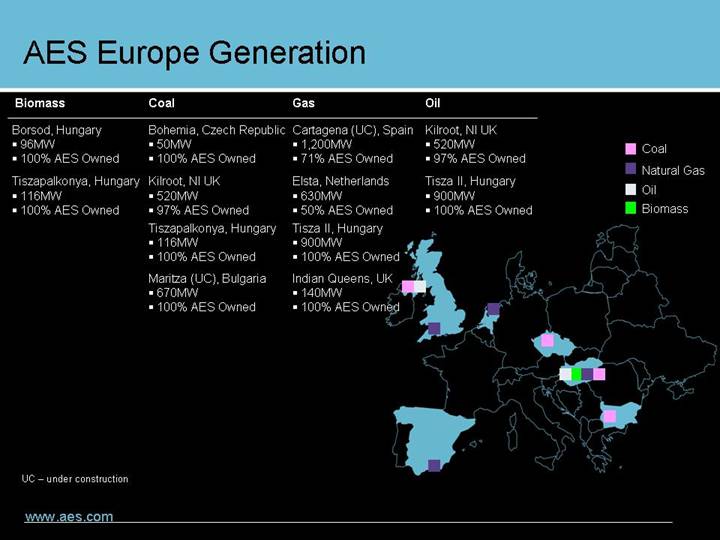
AES Europe Generation
Biomass | | Coal | | Gas | | Oil |
| | | | | | |
Borsod, Hungary | | Bohemia, Czech Republic | | Cartagena (UC), Spain | | Kilroot, NI UK |
• 96MW | | • 50MW | | • 1,200MW | | • 520MW |
• 100% AES Owned | | • 100% AES Owned | | • 71% AES Owned | | • 97% AES Owned |
| | | | | | |
Tiszapalkonya, Hungary | | Kilroot, NI UK | | Elsta, Netherlands | | Tisza II, Hungary |
• 116MW | | • 520MW | | • 630MW | | • 900MW |
• 100% AES Owned | | • 97% AES Owned | | • 50% AES Owned | | • 100% AES Owned |
| | | | | | |
| | Tiszapalkonya, Hungary | | Tisza II, Hungary | | |
| | • 116MW | | • 900MW | | |
| | • 100% AES Owned | | • 100% AES Owned | | |
| | | | | | |
| | Maritza (UC), Bulgaria | | Indian Queens, UK | | |
| | • 670MW | | • 140MW | | |
| | • 100% AES Owned | | • 100% AES Owned | | |
[GRAPHIC]
UC – under construction
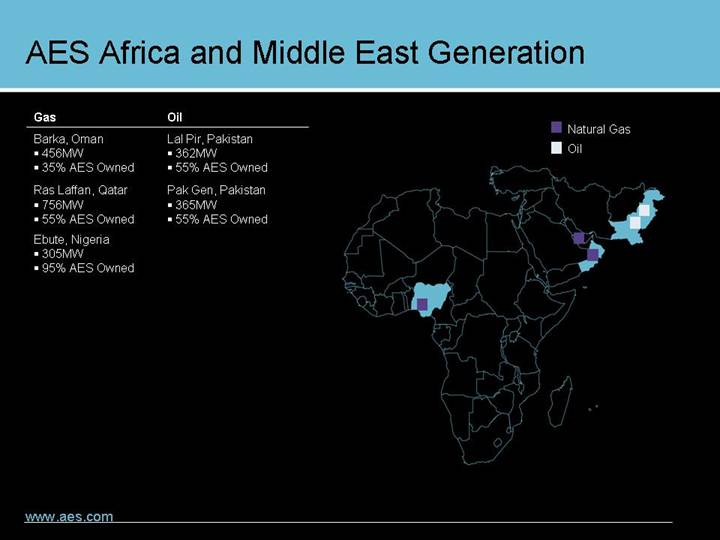
AES Africa and Middle East Generation
Gas | | Oil |
| | |
Barka, Oman • 456MW • 35% AES Owned Ras Laffan, Qatar • 756MW • 55% AES Owned Ebute, Nigeria • 305MW • 95% AES Owned | | Lal Pir, Pakistan • 362MW • 55% AES Owned Pak Gen, Pakistan • 365MW • 55% AES Owned | |
[GRAPHIC]
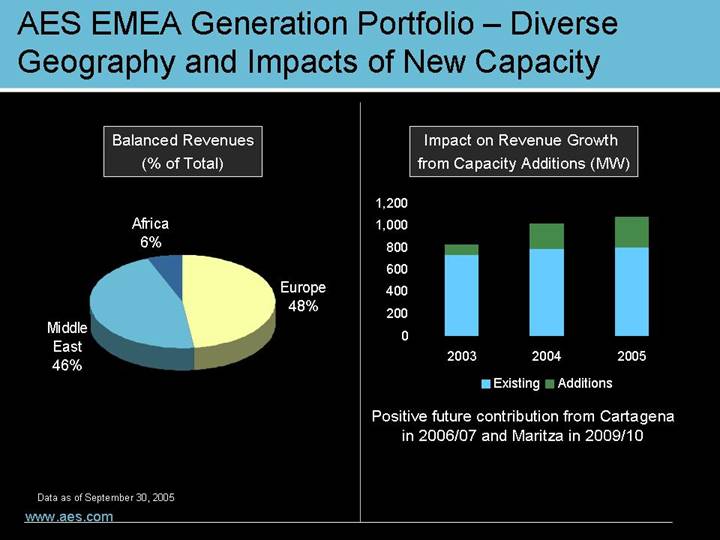
AES EMEA Generation Portfolio – Diverse Geography and Impacts of New Capacity
Balanced Revenues |
(% of Total) |
|
[CHART] |
|
Data as of September 30, 2005 |
Impact on Revenue Growth from Capacity Additions (MW) |
|
[CHART] |
|
Positive future contribution from Cartagena in 2006/07 and Maritza in 2009/10 |
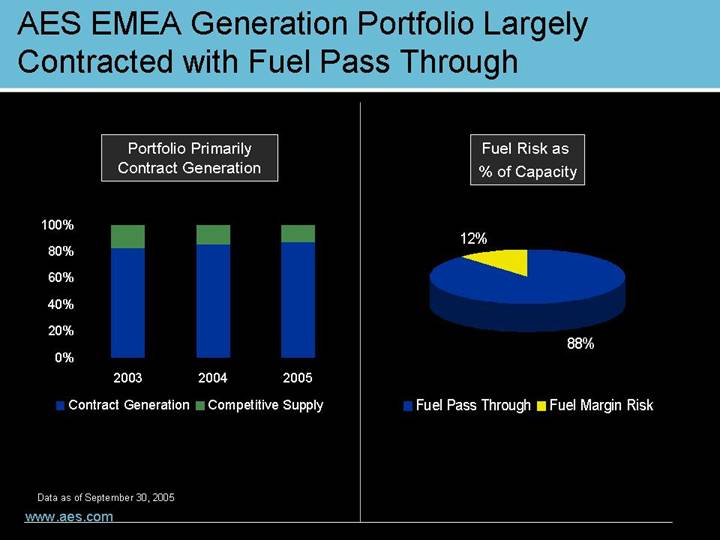
AES EMEA Generation Portfolio Largely Contracted with Fuel Pass Through
Portfolio Primarily Contract Generation |
|
[CHART] |
|
Data as of September 30, 2005 |
Fuel Risk as % of Capacity |
|
[CHART] |
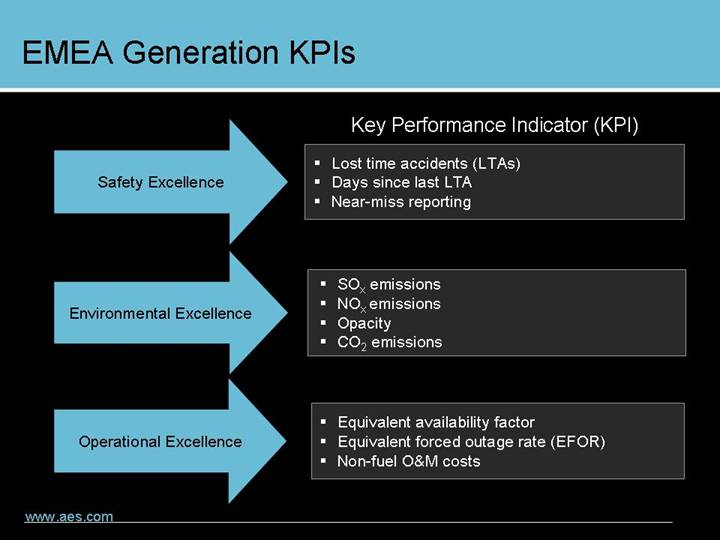
EMEA Generation KPIs
Key Performance Indicator (KPI)
Safety Excellence | • Lost time accidents (LTAs) • Days since last LTA • Near-miss reporting |
| |
Environmental Excellence | • SOx emissions • NOx emissions • Opacity • CO2 emissions |
| |
Operational Excellence | • Equivalent availability factor • Equivalent forced outage rate (EFOR) • Non-fuel O&M costs |
Implementing KPIs in EMEA Generation
Safety | Environment | Operational Excellence |
| | |
• Implementation of a Safety Management System • Regular Safety Audits • Online Safety System • Safety Task Force • Safety Walkdowns | • Regular Environmental Audits • Standardized auditing protocols based on ISO 14001 • Online Environmental System • Environmental Task Force | • Best practice implementation initiative • Heat Rate Task Force • Global sourcing • Strategic Asset Risk Reviews • Peer to peer reviews |
Safety, protecting the environment and operational excellence are the prime focus of the KPIs within the EMEA group.
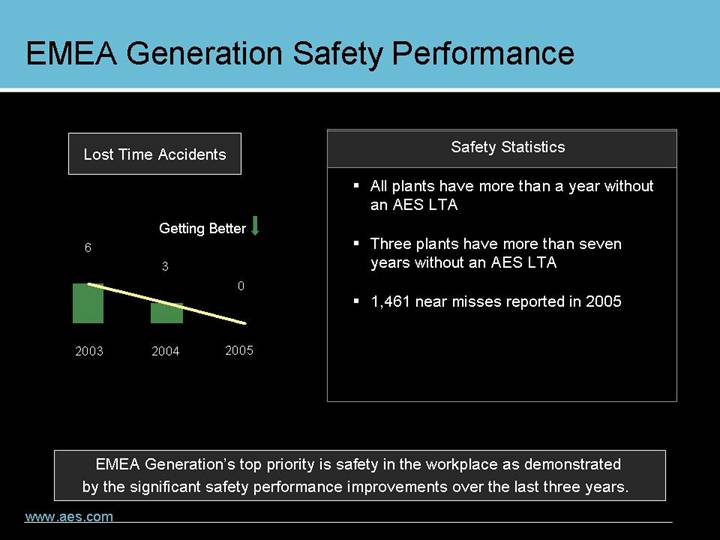
EMEA Generation Safety Performance
Lost Time Accidents |
|
[CHART] |
|
Safety Statistics |
|
• All plants have more than a year without an AES LTA |
|
• Three plants have more than seven years without an AES LTA |
|
• 1,461 near misses reported in 2005 |
EMEA Generation’s top priority is safety in the workplace as demonstrated by the significant safety performance improvements over the last three years.
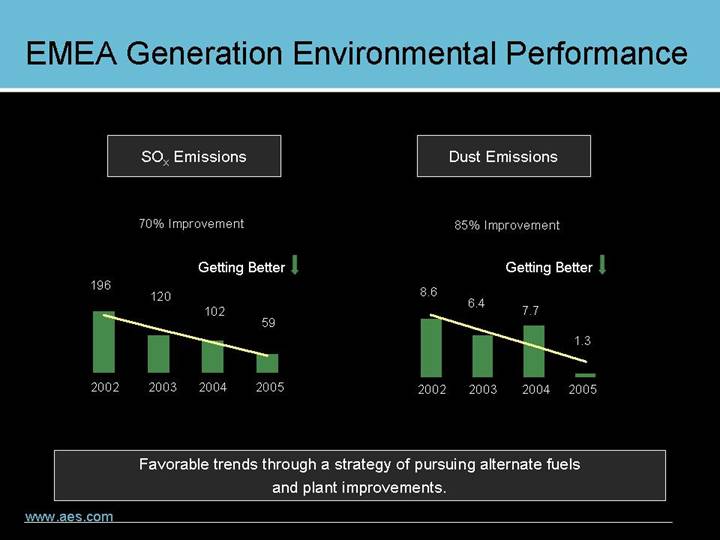
EMEA Generation Environmental Performance
SOx Emissions
[CHART]
Dust Emissions
[CHART]
Favorable trends through a strategy of pursuing alternate fuels and plant improvements.
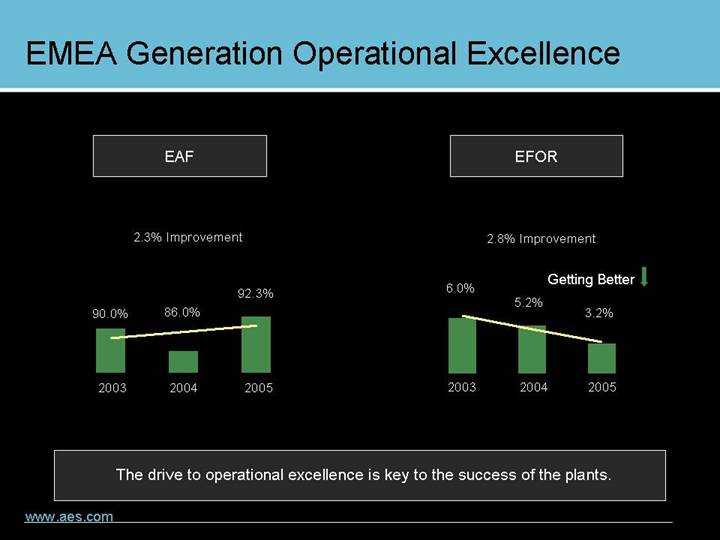
EMEA Generation Operational Excellence
EAF
[CHART]
EFOR
[CHART]
The drive to operational excellence is key to the success of the plants.
Ebute Performance Improvement
EFOR
[CHART]
Performance Initiatives
• Hot Gas Path management
• Staff training and performance
• LTSA management
Plant Challenges
• Nine barge mounted Frame 6 CTs
• Unknown maintenance history
• Poor availability of technical support
• Poor local infrastructure
Ebute has significantly improved its availability while working in a difficult environment but real benefits are still to be gained.
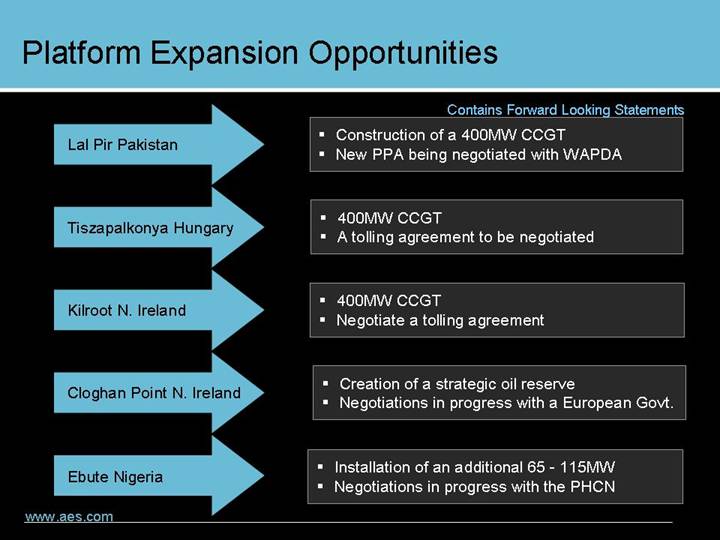
Platform Expansion Opportunities
Contains Forward Looking Statements
Lal Pir Pakistan | • Construction of a 400MW CCGT • New PPA being negotiated with WAPDA |
| |
Tiszapalkonya Hungary | • 400MW CCGT • A tolling agreement to be negotiated |
| |
Kilroot N. Ireland | • 400MW CCGT • Negotiate a tolling agreement |
| |
Cloghan Point N. Ireland | • Creation of a strategic oil reserve • Negotiations in progress with a European Govt. |
| |
Ebute Nigeria | • Installation of an additional 65 - 115MW • Negotiations in progress with the PHCN |
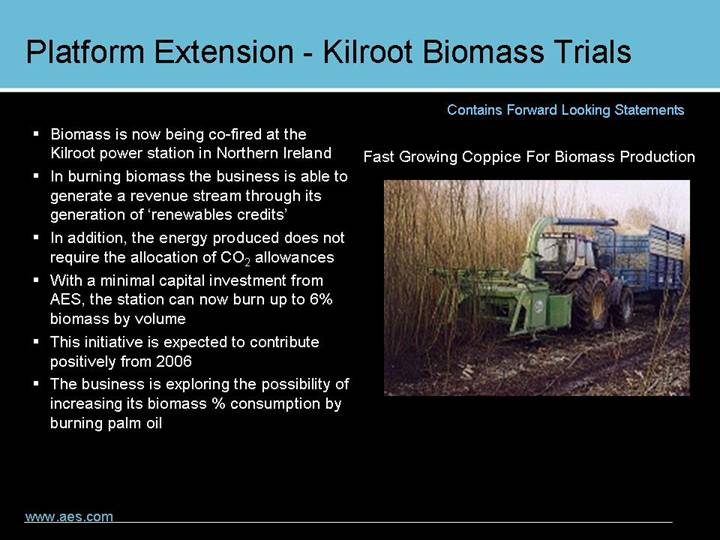
Platform Extension - Kilroot Biomass Trials
Contains Forward Looking Statements
• Biomass is now being co-fired at the Kilroot power station in Northern Ireland
• In burning biomass the business is able to generate a revenue stream through its generation of ‘renewables credits’
• In addition, the energy produced does not require the allocation of CO2 allowances
• With a minimal capital investment from AES, the station can now burn up to 6% biomass by volume
• This initiative is expected to contribute positively from 2006
• The business is exploring the possibility of increasing its biomass % consumption by burning palm oil
Fast Growing Coppice For Biomass Production
[GRAPHIC]
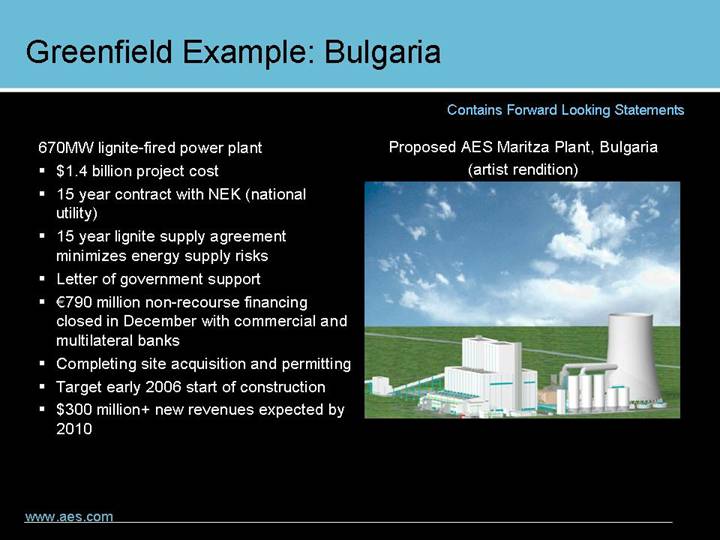
Greenfield Example: Bulgaria
Contains Forward Looking Statements
670MW lignite-fired power plant
• $1.4 billion project cost
• 15 year contract with NEK (national utility)
• 15 year lignite supply agreement minimizes energy supply risks
• Letter of government support
• €790 million non-recourse financing closed in December with commercial and multilateral banks
• Completing site acquisition and permitting
• Target early 2006 start of construction
• $300 million+ new revenues expected by 2010
Proposed AES Maritza Plant, Bulgaria
(artist rendition)
[GRAPHIC]
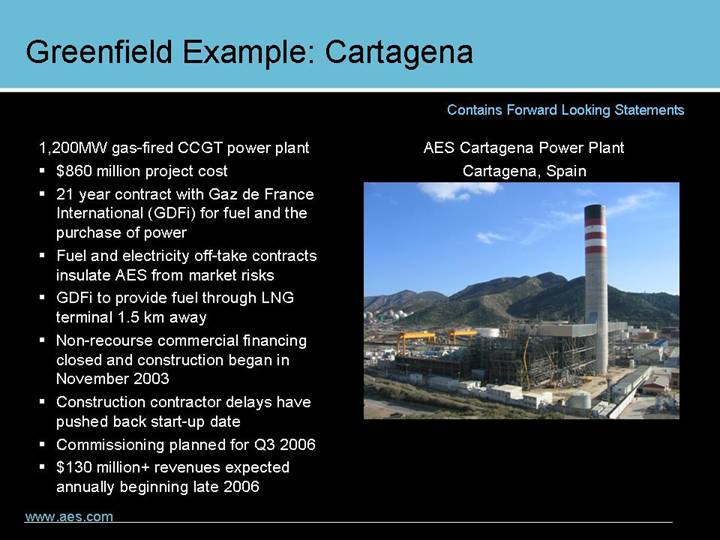
Greenfield Example: Cartagena
Contains Forward Looking Statements
1,200MW gas-fired CCGT power plant
• $860 million project cost
• 21 year contract with Gaz de France International (GDFi) for fuel and the purchase of power
• Fuel and electricity off-take contracts insulate AES from market risks
• GDFi to provide fuel through LNG terminal 1.5 km away
• Non-recourse commercial financing closed and construction began in November 2003
• Construction contractor delays have pushed back start-up date
• Commissioning planned for Q3 2006
• $130 million+ revenues expected annually beginning late 2006
AES Cartagena Power Plant
Cartagena, Spain
[GRAPHIC]
| | AES Sonel Business Review |
AES CORPORATION | | Jean David Bile |
| | Vice President and AES Sonel General Manager |
| | |
[GRAPHIC] |
|
| | March 22, 2006 |
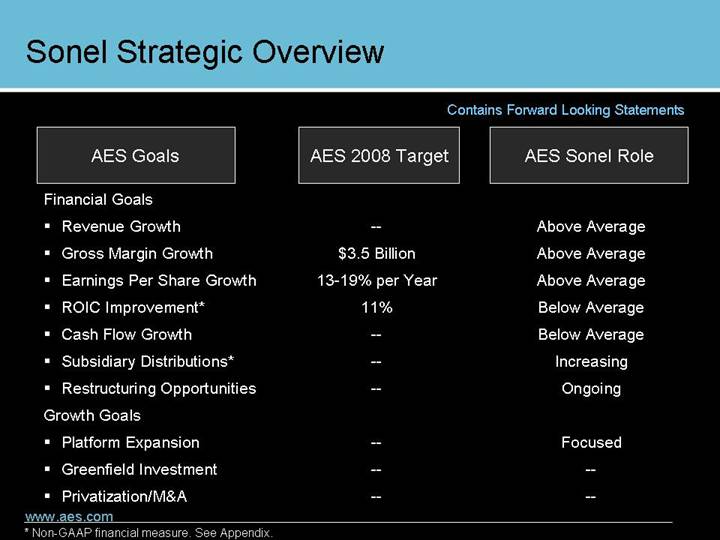
Sonel Strategic Overview
Contains Forward Looking Statements
AES Goals | | AES 2008 Target | | AES Sonel Role | |
| | | | | |
Financial Goals | | | | | |
• Revenue Growth | | — | | Above Average | |
• Gross Margin Growth | | $3.5 Billion | | Above Average | |
• Earnings Per Share Growth | | 13-19% per Year | | Above Average | |
• ROIC Improvement* | | 11% | | Below Average | |
• Cash Flow Growth | | — | | Below Average | |
• Subsidiary Distributions* | | — | | Increasing | |
• Restructuring Opportunities | | — | | Ongoing | |
Growth Goals | | | | | |
• Platform Expansion | | — | | Focused | |
• Greenfield Investment | | — | | — | |
• Privatization/M&A | | — | | — | |
* Non-GAAP financial measure. See Appendix.
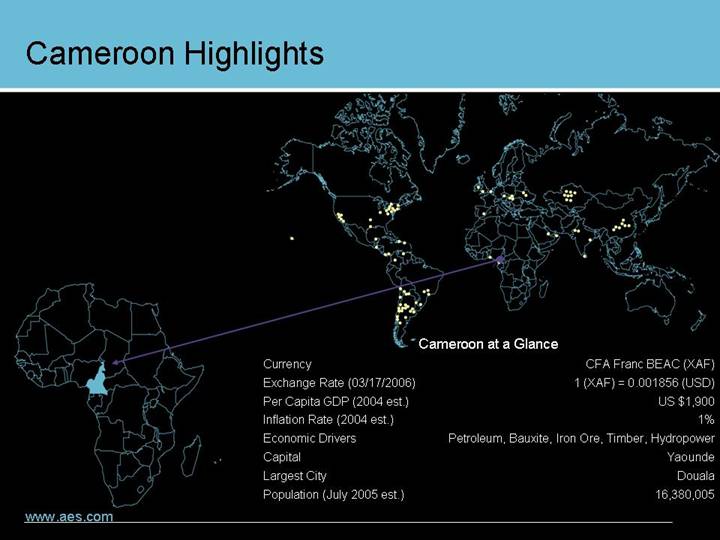
Cameroon Highlights
[GRAPHIC]
Cameroon at a Glance |
Currency | | CFA Franc BEAC (XAF) |
Exchange Rate (03/17/2006) | | 1 (XAF) = 0.001856 (USD) |
Per Capita GDP (2004 est.) | | US $1,900 |
Inflation Rate (2004 est.) | | 1% |
Economic Drivers | | Petroleum, Bauxite, Iron Ore, Timber, Hydropower |
Capital | | Yaounde |
Largest City | | Douala |
Population (July 2005 est.) | | 16,380,005 |
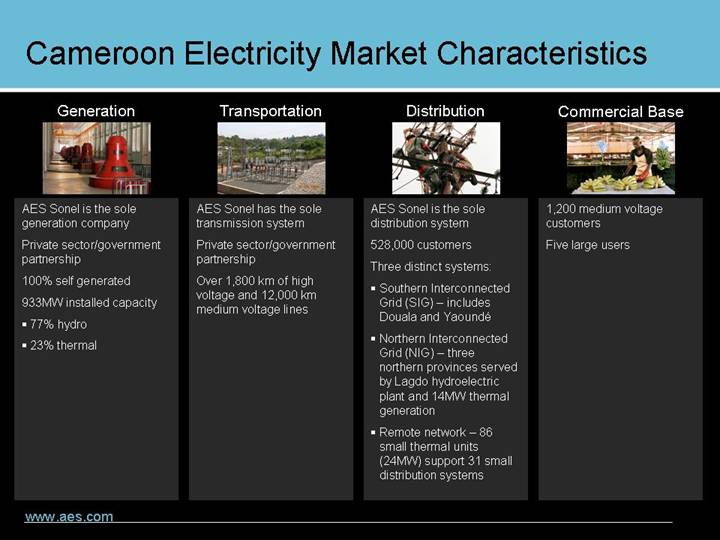
Cameroon Electricity Market Characteristics
Generation
[GRAPHIC]
AES Sonel is the sole generation company
Private sector/government partnership
100% self generated
933MW installed capacity
• 77% hydro
• 23% thermal
Transportation
[GRAPHIC]
AES Sonel has the sole transmission system
Private sector/government partnership
Over 1,800 km of high voltage and 12,000 km medium voltage lines
Distribution
[GRAPHIC]
AES Sonel is the sole distribution system
528,000 customers
Three distinct systems:
• Southern Interconnected Grid (SIG) – includes Douala and Yaoundé
• Northern Interconnected Grid (NIG) – three northern provinces served by Lagdo hydroelectric plant and 14MW thermal generation
• Remote network – 86 small thermal units (24MW) support 31 small distribution systems
Commercial Base
[GRAPHIC]
1,200 medium voltage customers
Five large users
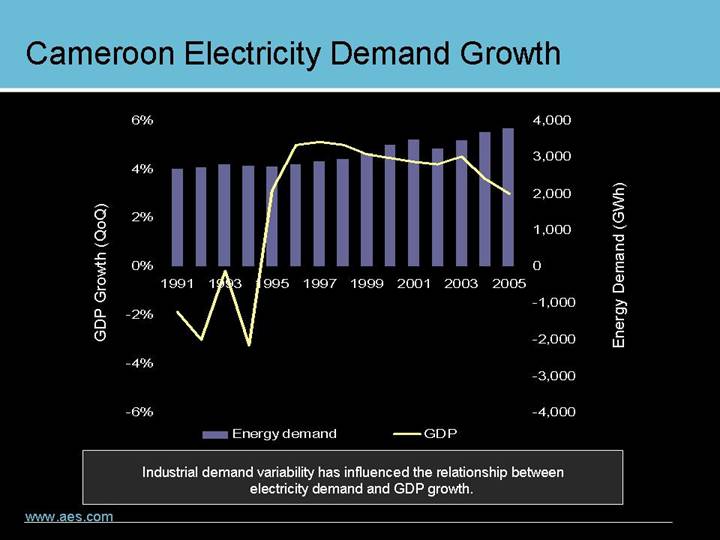
Cameroon Electricity Demand Growth
[CHART]
Industrial demand variability has influenced the relationship between electricity demand and GDP growth.
Cameroon Electricity Demand Growth
[CHART]
Historically, there has been a high correlation between public sector electricity demand and GDP growth.
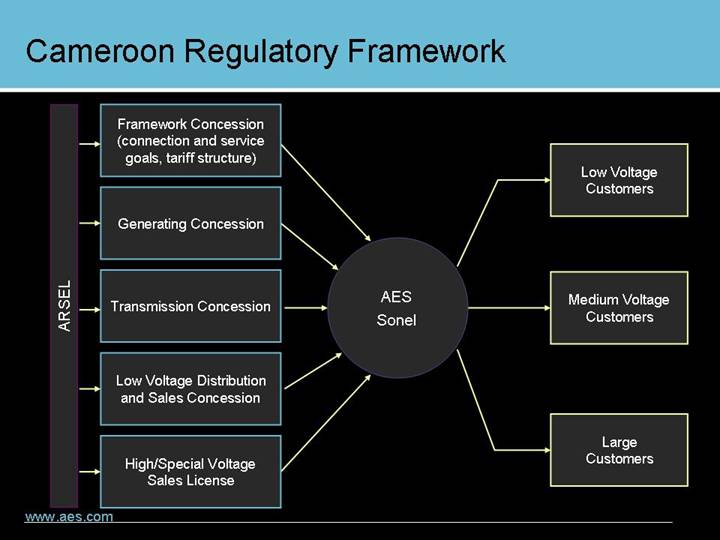
Cameroon Regulatory Framework
| | Framework Concession (connection and service goals, tariff structure) | | | | Low Voltage
Customers |
| | | | | | |
| | Generating Concession | | | | |
| | | | | | |
ARSEL | | Transmission Concession | | AES
Sonel | | Medium Voltage
Customers |
| | | | | | |
| | Low Voltage Distribution and Sales Concession | | | | |
| | | | | | |
| | High/Special Voltage Sales License | | | | Large
Customers |
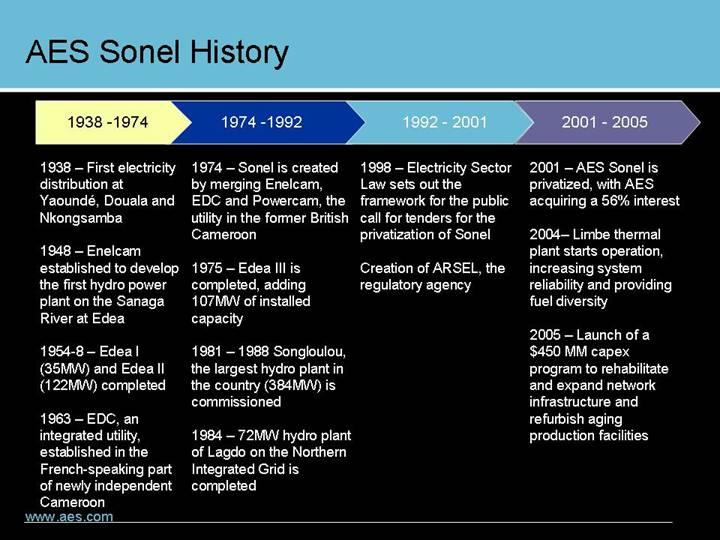
AES Sonel History
1938 - 1974 |
|
1938 – First electricity distribution at Yaoundé, Douala and Nkongsamba |
|
1948 – Enelcam established to develop the first hydro power plant on the Sanaga River at Edea |
|
1954-8 – Edea I (35MW) and Edea II (122MW) completed |
|
1963 – EDC, an integrated utility, established in the French-speaking part of newly independent Cameroon |
|
1974 - 1992 |
|
1974 – Sonel is created by merging Enelcam, EDC and Powercam, the utility in the former British Cameroon |
|
1975 – Edea III is completed, adding 107MW of installed capacity |
|
1981 – 1988 Songloulou, the largest hydro plant in the country (384MW) is commissioned |
|
1984 – 72MW hydro plant of Lagdo on the Northern Integrated Grid is completed |
|
1992 - 2001 |
|
1998 – Electricity Sector Law sets out the framework for the public call for tenders for the privatization of Sonel |
|
Creation of ARSEL, the regulatory agency |
|
2001 - 2005 |
|
2001 – AES Sonel is privatized, with AES acquiring a 56% interest |
|
2004– Limbe thermal plant starts operation, increasing system reliability and providing fuel diversity |
|
2005 – Launch of a $450 MM capex program to rehabilitate and expand network infrastructure and refurbish aging production facilities |
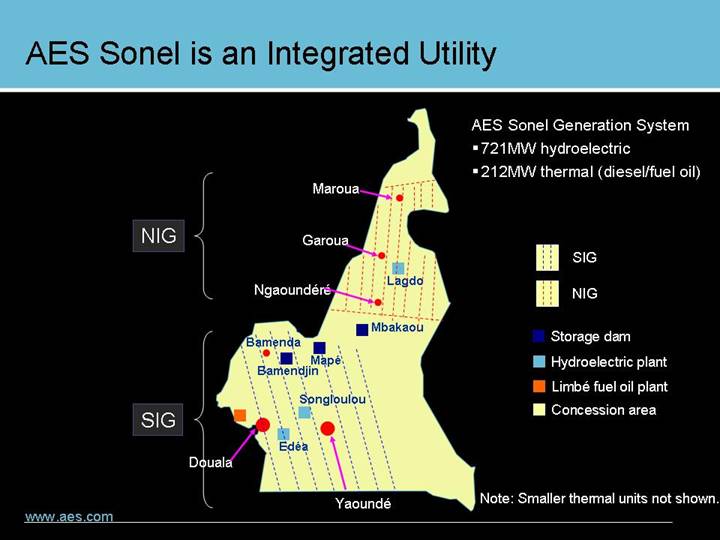
AES Sonel is an Integrated Utility
[GRAPHIC]
AES Sonel Generation System
• 721MW hydroelectric
• 212MW thermal (diesel/fuel oil)
Note: Smaller thermal units not shown.
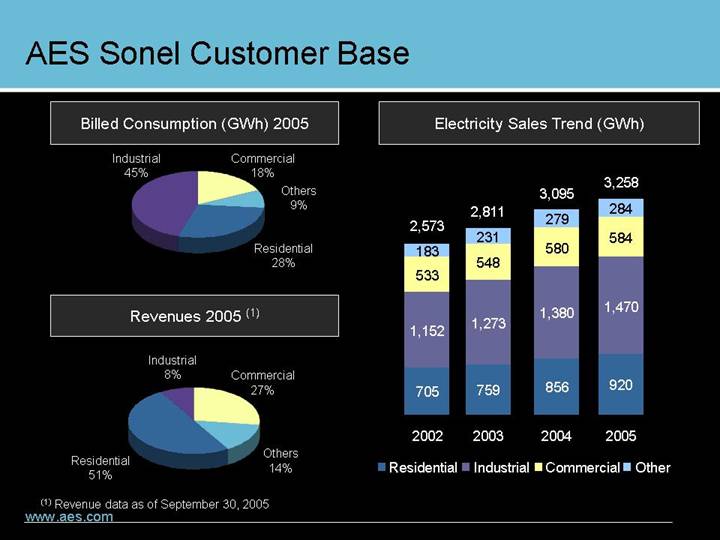
AES Sonel Customer Base
Billed Consumption (GWh) 2005
[CHART]
Revenues 2005 (1)
[CHART]
Electricity Sales Trend (GWh)
[CHART]
(1) Revenue data as of September 30, 2005
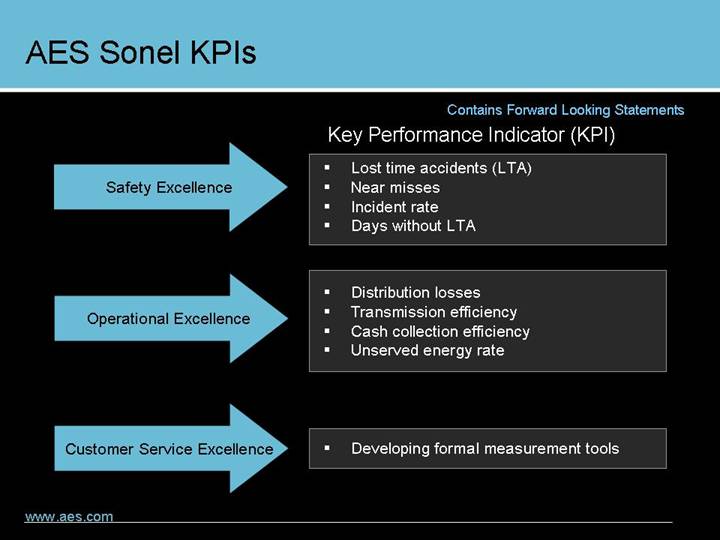
AES Sonel KPIs
Contains Forward Looking Statements
Key Performance Indicator (KPI)
Safety Excellence
• Lost time accidents (LTA)
• Near misses
• Incident rate
• Days without LTA
Operational Excellence
• Distribution losses
• Transmission efficiency
• Cash collection efficiency
• Unserved energy rate
Customer Service Excellence
• Developing formal measurement tools
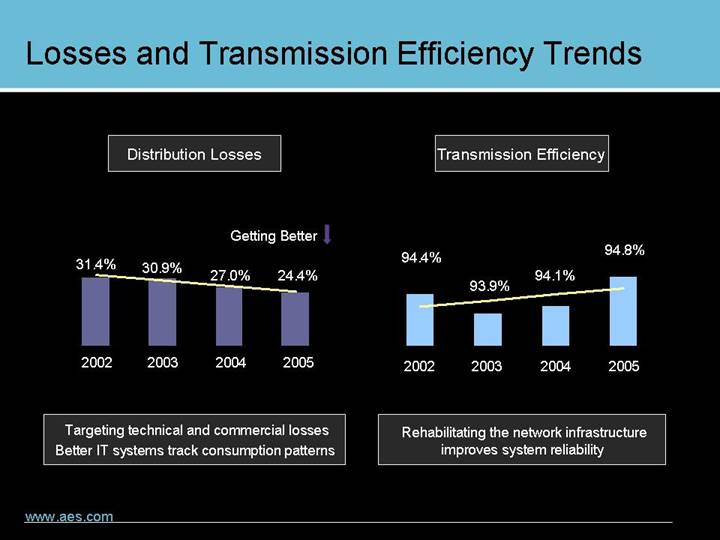
Losses and Transmission Efficiency Trends
Distribution Losses
[CHART]
Targeting technical and commercial losses
Better IT systems track consumption patterns
Transmission Efficiency
[CHART]
Rehabilitating the network infrastructure improves system reliability
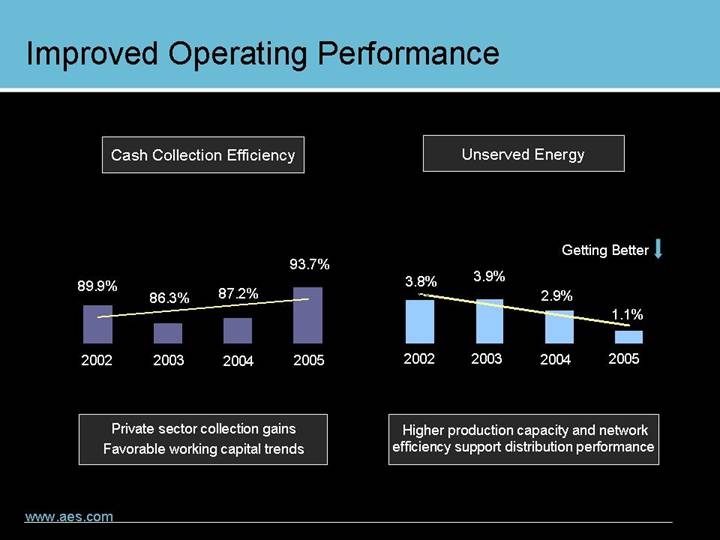
Improved Operating Performance
Cash Collection Efficiency
[CHART]
Private sector collection gains
Favorable working capital trends
Unserved Energy
[CHART]
Higher production capacity and network efficiency support distribution performance
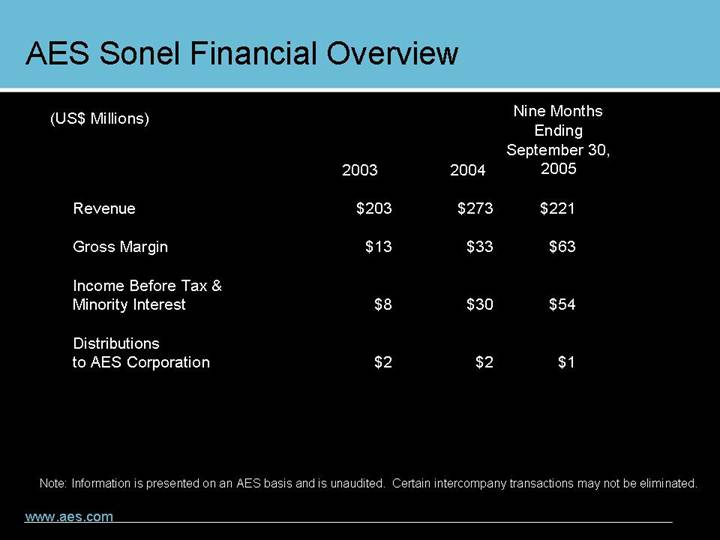
AES Sonel Financial Overview
(US$ Millions) | | 2003 | | 2004 | | Nine Months
Ending
September 30,
2005 | |
| | | | | | | | | | |
Revenue | | $ | 203 | | $ | 273 | | $ | 221 | |
| | | | | | | |
Gross Margin | | $ | 13 | | $ | 33 | | $ | 63 | |
| | | | | | | |
Income Before Tax & Minority Interest | | $ | 8 | | $ | 30 | | $ | 54 | |
| | | | | | | |
Distributions to AES Corporation | | $ | 2 | | $ | 2 | | $ | 1 | |
Note: Information is presented on an AES basis and is unaudited. Certain intercompany transactions may not be eliminated.
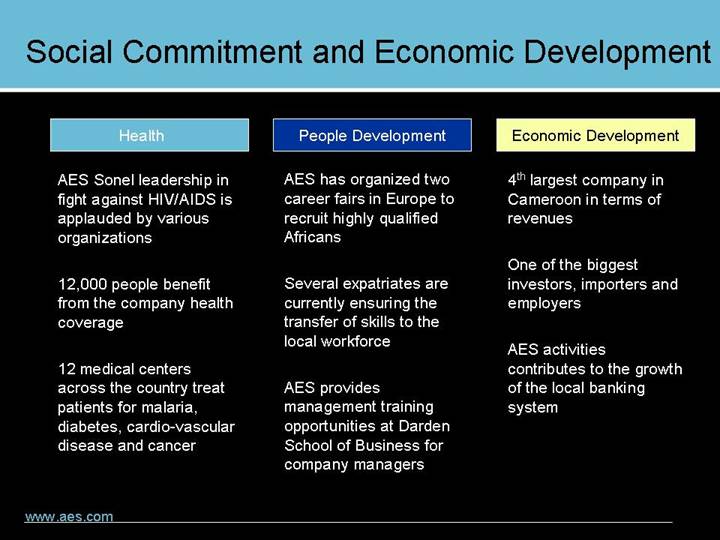
Social Commitment and Economic Development
Health
AES Sonel leadership in fight against HIV/AIDS is applauded by various organizations
12,000 people benefit from the company health coverage
12 medical centers across the country treat patients for malaria, diabetes, cardio-vascular disease and cancer
People Development
AES has organized two career fairs in Europe to recruit highly qualified Africans
Several expatriates are currently ensuring the transfer of skills to the local workforce
AES provides management training opportunities at Darden School of Business for company managers
Economic Development
4th largest company in Cameroon in terms of revenues
One of the biggest investors, importers and employers
AES activities contributes to the growth of the local banking system
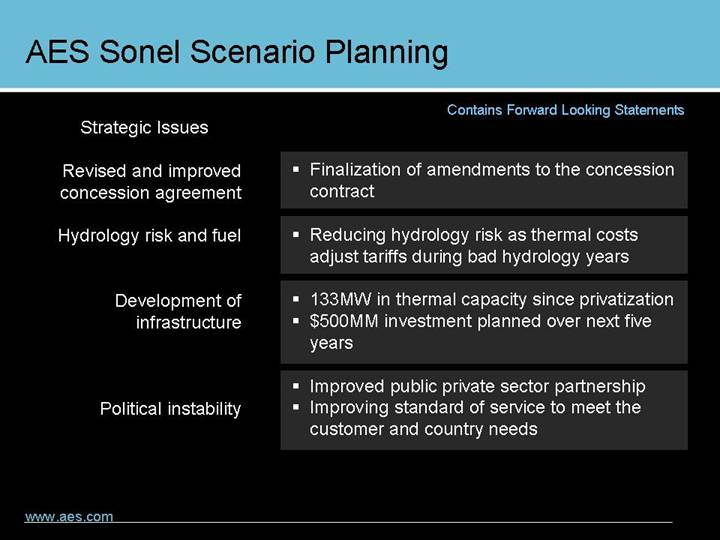
AES Sonel Scenario Planning
Contains Forward Looking Statements
Strategic Issues
Revised and improved concession agreement
• Finalization of amendments to the concession contract
Hydrology risk and fuel
• Reducing hydrology risk as thermal costs adjust tariffs during bad hydrology years
Development of infrastructure
• 133MW in thermal capacity since privatization
• $500MM investment planned over next five years
Political instability
• Improved public private sector partnership
• Improving standard of service to meet the customer and country needs
Strategic Opportunities
Value Enhancement Program
• Asset management
• Maintenance work management
• Reconstruction project management
• Revenue management
Demand Growth Projects
• Proposed Alucam expansion will require new plant and infrastructure investment
• Expansion could result in 69% demand increase by 2010
| | AES Ukraine Business Review |
AES CORPORATION | | Garry Levesley |
| | AES Vice President, Director AES Ukraine |
| | |
[GRAPHIC] |
| | |
| | March 22, 2006 |
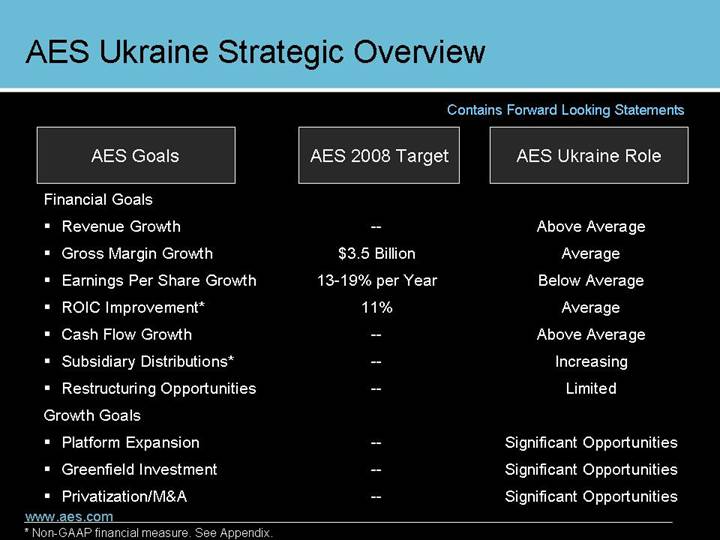
AES Ukraine Strategic Overview
Contains Forward Looking Statements
AES Goals | | AES 2008 Target | | AES Ukraine Role |
Financial Goals | | | | |
• Revenue Growth | | — | | Above Average |
• Gross Margin Growth | | $3.5 Billion | | Average |
• Earnings Per Share Growth | | 13-19% per Year | | Below Average |
• ROIC Improvement* | | 11% | | Average |
• Cash Flow Growth | | — | | Above Average |
• Subsidiary Distributions* | | — | | Increasing |
• Restructuring Opportunities | | — | | Limited |
| | | | |
Growth Goals | | | | |
• Platform Expansion | | — | | Significant Opportunities |
• Greenfield Investment | | — | | Significant Opportunities |
• Privatization/M&A | | — | | Significant Opportunities |
* Non-GAAP financial measure. See Appendix.
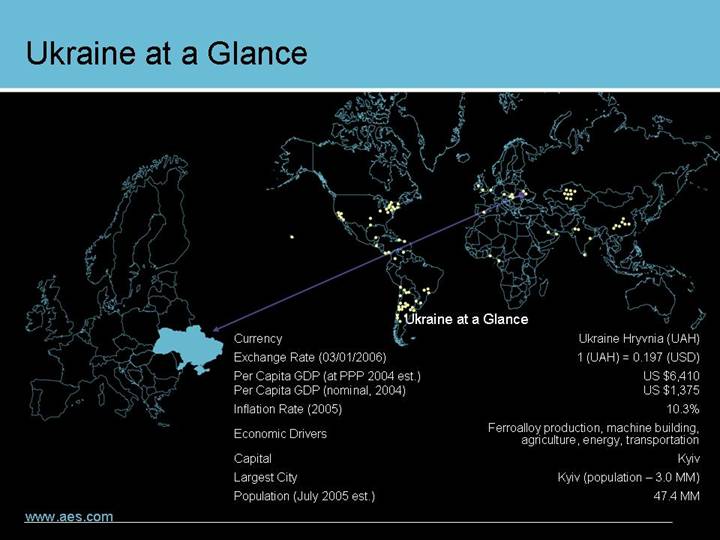
Ukraine at a Glance
[GRAPHIC]
Ukraine at a Glance |
|
Currency | | Ukraine Hryvnia (UAH) |
Exchange Rate (03/01/2006) | | 1 (UAH) = 0.197 (USD) |
Per Capita GDP (at PPP 2004 est.) | | US $6,410 |
Per Capita GDP (nominal, 2004) | | US $1,375 |
Inflation Rate (2005) | | 10.3% |
Economic Drivers | | Ferroalloy production, machine building,
agriculture, energy, transportation |
Capital | | Kyiv |
Largest City | | Kyiv (population – 3.0 MM) |
Population (July 2005 est.) | | 47.4 MM |
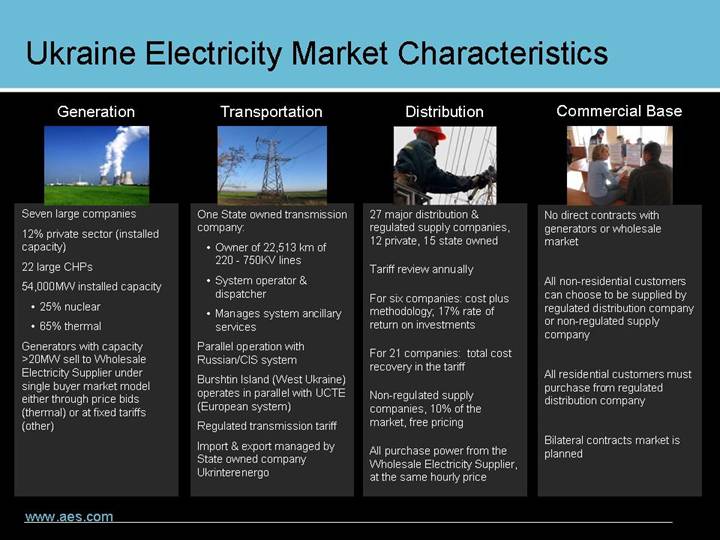
Ukraine Electricity Market Characteristics
Generation
[GRAPHIC]
Seven large companies
12% private sector (installed capacity)
22 large CHPs
54,000MW installed capacity
• 25% nuclear
• 65% thermal
Generators with capacity >20MW sell to Wholesale Electricity Supplier under single buyer market model either through price bids (thermal) or at fixed tariffs (other)
Transportation
[GRAPHIC]
One State owned transmission company:
• Owner of 22,513 km of 220 - 750KV lines
• System operator & dispatcher
• Manages system ancillary services
Parallel operation with Russian/CIS system
Burshtin Island (West Ukraine) operates in parallel with UCTE (European system)
Regulated transmission tariff
Import & export managed by State owned company Ukrinterenergo
Distribution
[GRAPHIC]
27 major distribution & regulated supply companies, 12 private, 15 state owned
Tariff review annually
For six companies: cost plus methodology; 17% rate of return on investments
For 21 companies: total cost recovery in the tariff
Non-regulated supply companies, 10% of the market, free pricing
All purchase power from the Wholesale Electricity Supplier, at the same hourly price
Commercial Base
[GRAPHIC]
No direct contracts with generators or wholesale market
All non-residential customers can choose to be supplied by regulated distribution company or non-regulated supply company
All residential customers must purchase from regulated distribution company
Bilateral contracts market is planned
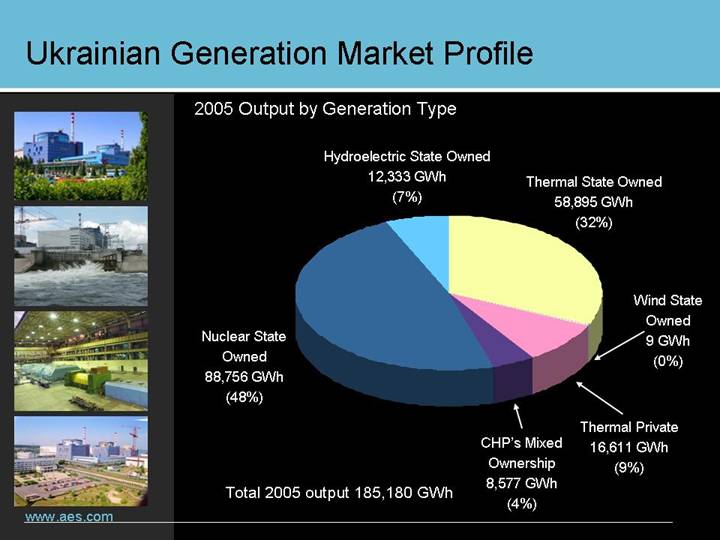
Ukrainian Generation Market Profile
[GRAPHIC]
2005 Output by Generation Type
[CHART]
Total 2005 output 185,180 GWh
Ukraine Electricity Demand Growth
[CHART]
• Correlation between electricity demand and GDP growth has increased in recent years
• Electricity demand is expected to continue growing by more than 4% per year
Ukraine Electricity Market History
Contains Forward Looking Statements
1995 | | 1996-2000 | | 2001-2005 | | 2006 and future | |
| | | | | | | |
Electricity sector functions as a single vertically integrated system operated by the Ministry of Energy | | 1996
Creation of the Wholesale Electricity Market modeled on the early version of the British power pool with a single buyer model | | 2001
Privatization of six distribution companies in a competitive tender procedure, of which AES acquired two companies | | Implementation of sector debt restructuring | |
| | | | | | | |
Functional vertical unbundling of generation, transmission and distribution | | 1997 – 1998
Private investors acquire 20-45% shares in nine distribution companies | | 2001
New distribution tariff method in line with the international practices and implementation thereof for distribution companies privatized in 2001 | | Streamlining of legal, technical and economic bases for further electricity market functioning | |
| | | | | | | |
Creation of a regulatory body to form electricity market and ensure its effective functioning | | 2000
Cash collections throughout the supply chain improved from 30% to 70% | | 2002
Governmental Program on further electricity market development | | Gradual supply market opening | |
| | | | | | | |
| | | | 2004
Cash collections above 97% | | Transition to bilateral contracts and balancing market model | |
| | | | | | | |
| | | | 2005
Law on comprehensive sector debt restructuring | | Integration with adjacent energy systems, including the European system “Union for the Co-ordination of Transmission of Electricity” (UCTE) in next five to 10 years | |
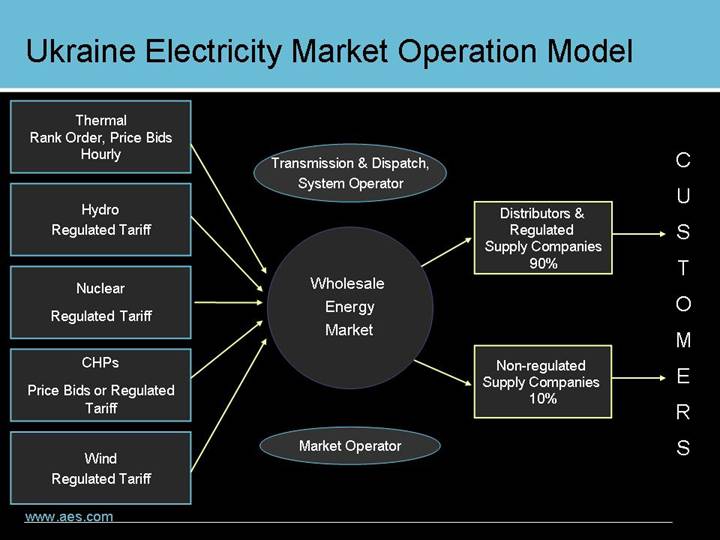
Ukraine Electricity Market Operation Model
Thermal Rank Order, Price Bids Hourly | | | | | | |
| | Transmission & Dispatch, System Operator | | | | |
Hydro Regulated Tariff | | | | Distributors & Regulated Supply Companies 90% | | |
| | | | | | |
Nuclear Regulated Tariff | | Wholesale Energy Market | | Large Users | | CUSTOMERS |
| | | | | | |
CHPs Price Bids or Regulated Tariff | | | | Non-regulated Supply Companies 10% | | |
| | | | | | |
Wind Regulated Tariff | | Market Operator | | | | |
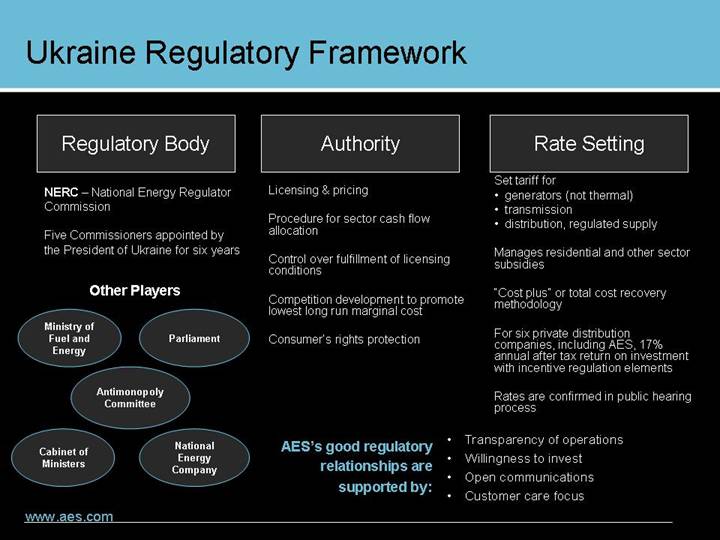
Ukraine Regulatory Framework
Regulatory Body | | Authority | | Rate Setting | |
| | | | | |
NERC – National Energy Regulator Commission | | Licensing & pricing | | Set tariff for | |
| | | | | |
Five Commissioners appointed by the President of Ukraine for six years | | Procedure for sector cash flow allocation Control over fulfillment of licensing conditions Competition development to promote lowest long run marginal cost Consumer’s rights protection | | • generators (not thermal) • transmission • distribution, regulated supply Manages residential and other sector subsidies “Cost plus” or total cost recovery methodology For six private distribution companies, including AES, 17% annual after tax return on investment with incentive regulation elements Rates are confirmed in public hearing process | |
AES’s good regulatory relationships are supported by: |
|
• Transparency of operations |
• Willingness to invest |
• Open communications |
• Customer care focus |
Other Players
Ministry of Fuel and Energy | | | | Parliament | |
| | | | | |
| | Antimonopoly Committee | | | |
| | | | | |
Cabinet of Ministers | | | | National Energy Company | |
AES Ukraine: Distribution
KYIVOBLENERGO
• Service area 28,000 km2
• 818,000 customers
• 3,000 employees
• 2005 revenues $100 MM (9 months)
• 90% AES-owned
RIVNEENERGO
• Service area 20,000 km2
• 404,000 customers
• 1,500 employees
• 2005 revenues $52MM (9 months)
• 80% AES-owned
[GRAPHIC]
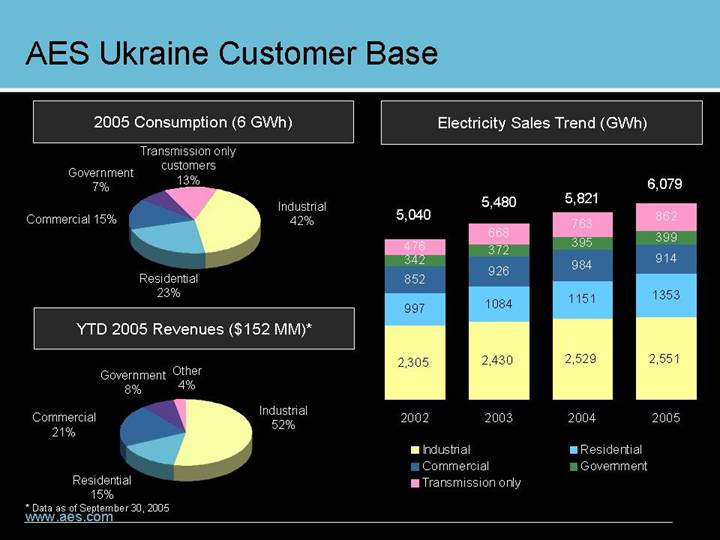
AES Ukraine Customer Base
2005 Consumption (6 GWh)
[CHART]
Electricity Sales Trend (GWh)
[CHART]
YTD 2005 Revenues ($152 MM)*
[CHART]
* Data as of September 30, 2005
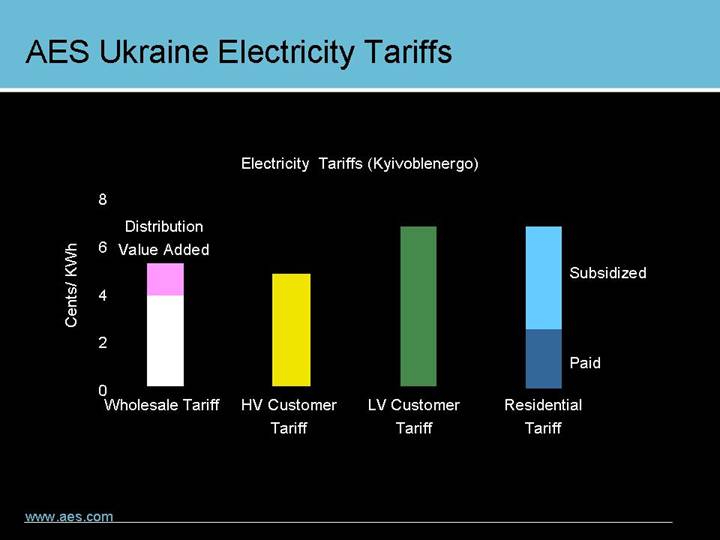
AES Ukraine Electricity Tariffs
Electricity Tariffs (Kyivoblenergo)
[CHART]
AES Ukraine Safety Performance
LTA
[CHART]
2005 Safety Activity
Conducted 2,500 safety walks/inspections
Introduced unsafe conditions reporting and analysis
Identified 750 unsafe conditions
Live line working training of personnel and equipment procurement and certification is in progress
Started public safety educational campaign
[GRAPHIC]
Safety poster – be careful, father
Safety is defined as the top priority in AES Ukraine.
AES Ukraine Operational Performance
Collections
[CHART]
Losses
[CHART]
AES Ukraine demonstrated considerable operational improvements.
AES Ukraine Financial Overview
(US$ Million)
| | 2003 | | 2004 | | Nine Months
Ending
September 30,
2005 | |
| | | | | | | |
Revenue | | $ | 164 | | $ | 190 | | $ | 152 | |
| | | | | | | |
Gross Margin | | $ | 21 | | $ | 26 | | $ | 19 | |
| | | | | | | |
Income Before Tax & Minority Interest | | $ | 16 | | $ | 16 | | $ | 13 | |
| | | | | | | |
Distributions to AES Corporation | | $ | 1 | | $ | 18 | | — | |
Note: Information is presented on an AES basis and is unaudited. Certain intercompany transactions may not be eliminated.
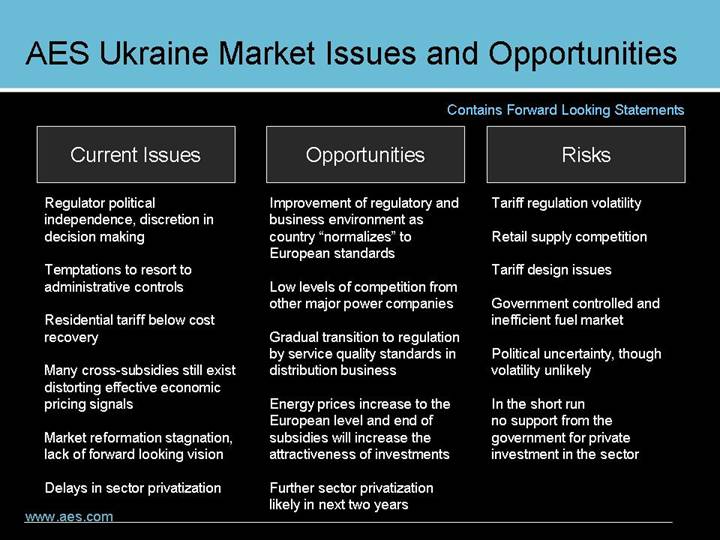
AES Ukraine Market Issues and Opportunities
Contains Forward Looking Statements
Current Issues | | Opportunities | | Risks | |
| | | | | |
Regulator political independence, discretion in decision making | | Improvement of regulatory and business environment as country “normalizes” to European standards | | Tariff regulation volatility | |
| | | | | |
Temptations to resort to administrative controls | | Low levels of competition from other major power companies | | Retail supply competition | |
| | | | | |
Residential tariff below cost recovery | | Gradual transition to regulation by service quality standards in distribution business | | Tariff design issues | |
| | | | | |
Many cross-subsidies still exist distorting effective economic pricing signals | | Energy prices increase to the European level and end of subsidies will increase the attractiveness of investments | | Government controlled and inefficient fuel market | |
| | | | | |
Market reformation stagnation, lack of forward looking vision | | Further sector privatization likely in next two years | | Political uncertainty, though volatility unlikely | |
| | | | | |
Delays in sector privatization | | | | In the short run no support from the government for private investment in the sector | |
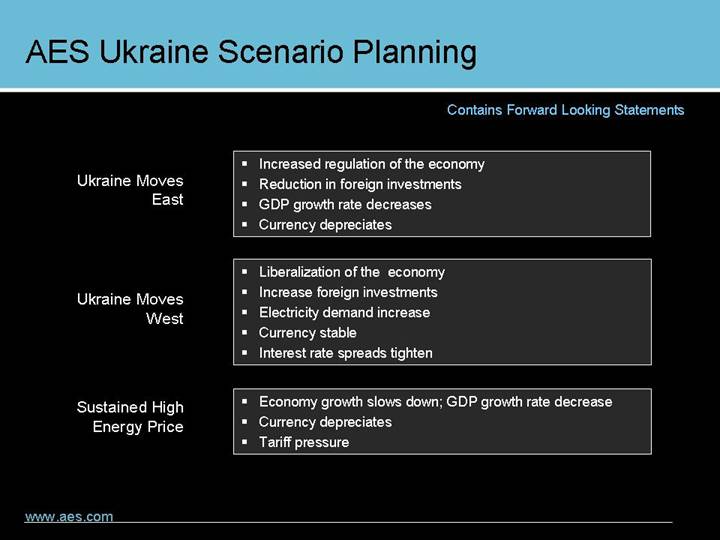
AES Ukraine Scenario Planning
Contains Forward Looking Statements
Ukraine Moves East
• Increased regulation of the economy
• Reduction in foreign investments
• GDP growth rate decreases
• Currency depreciates
Ukraine Moves West
• Liberalization of the economy
• Increase foreign investments
• Electricity demand increase
• Currency stable
• Interest rate spreads tighten
Sustained High Energy Price
• Economy growth slows down; GDP growth rate decrease
• Currency depreciates
• Tariff pressure
Ukraine Platform Expansion Opportunities
Contains Forward Looking Statements
Areas | | Description of Selected Projects |
| | |
Distribution | | • Five companies owned by VSE (Russians) |
| • Six companies owned by three conflicting shareholders |
| • Four with different industrial groups |
| • 12 state owned to be privatized |
| | |
Generation | | • Dniester Pump Storage |
| • Burstyn power plant (connected to UCTE System) |
| • Early wind opportunities |
| • Privatization of thermal generation companies |
| | |
Fuel Supply | | • Coal privatization |
| • Acquisition of privately owned coal mines |
| | |
Gas
Transmission/
Distribution | | • Major gas transit country |
| • Gas distribution companies |
| |
| | |
Non-Power
But Related | | • Water companies |
| • Heat networks |
AES Southern Cone Latin America Business Review
AES CORPORATION
Andres Gluski
President, Latin America
[GRAPHIC]
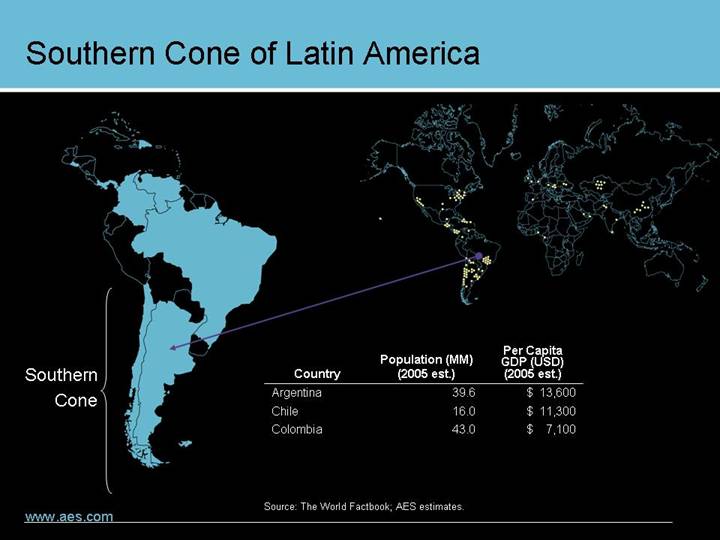
Southern Cone of Latin America
[GRAPHIC]
Country | | Population (MM)
(2005 est.) | | Per Capita
GDP (USD)
(2005 est.) | |
Argentina | | 39.6 | | $ | 13,600 | |
Chile | | 16.0 | | $ | 11,300 | |
Colombia | | 43.0 | | $ | 7,100 | |
Source: The World Factbook; AES estimates.
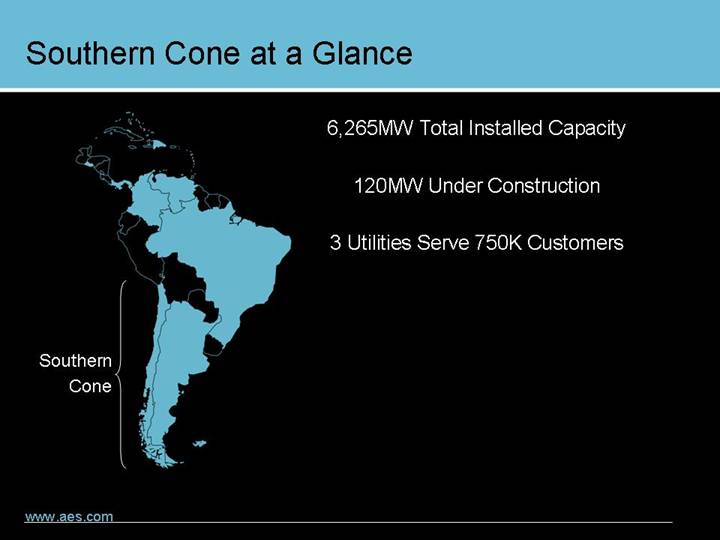
Southern Cone at a Glance
6,265MW Total Installed Capacity
120MW Under Construction
3 Utilities Serve 750K Customers
[GRAPHIC]
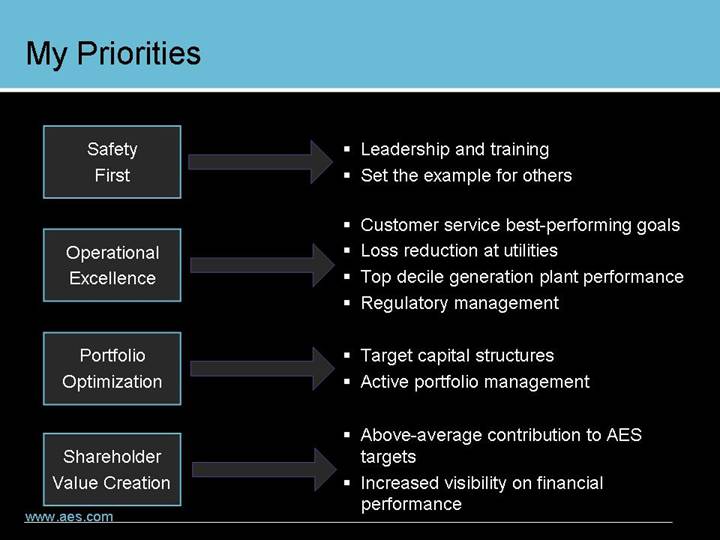
My Priorities
| | | | |
Safety | | | | • Leadership and training |
First | | | | • Set the example for others |
| | | | |
| | | | • Customer service best-performing goals |
Operational | | | | • Loss reduction at utilities |
Excellence | | | | • Top decile generation plant performance |
| | | | • Regulatory management |
| | | | |
Portfolio | | | | • Target capital structures |
Optimization | | | | • Active portfolio management |
| | | | |
Shareholder | | | | • Above-average contribution to AES targets |
Value Creation | | | | • Increased visibility on financial performance |
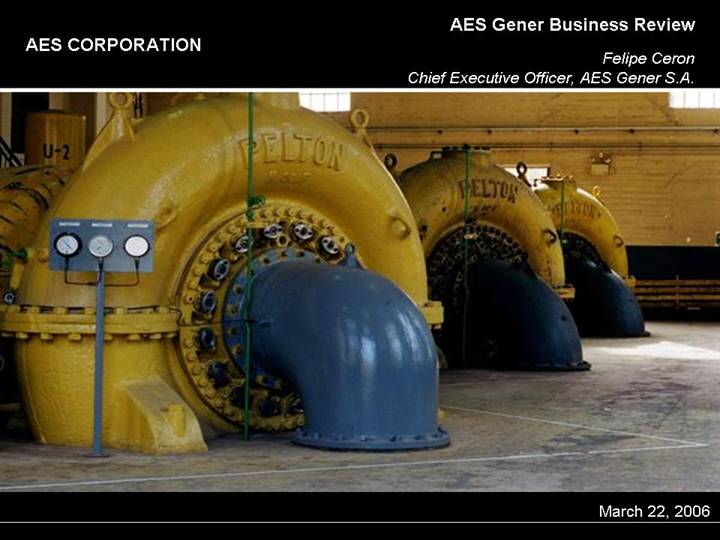
AES Gener Business Review
AES CORPORATION
Felipe Ceron
Chief Executive Officer, AES Gener S.A.
[GRAPHIC]
March 22, 2006
AES Gener Strategic Overview
Contains Forward Looking Statements
AES Goals | | AES 2008 Target | | AES Gener Role |
| | | | |
Financial Goals | | | | |
• Revenue Growth | | — | | Above Average |
• Gross Margin Growth | | $3.5 Billion | | Below Average |
• Earnings Per Share Growth | | 13-19% per Year | | Above Average |
• ROIC Improvement* | | 11% | | Average |
• Cash Flow Growth | | — | | Above Average |
• Subsidiary Distributions* | | — | | Increasing |
• Restructuring Opportunities | | — | | Limited |
Growth Goals | | | | |
• Platform Expansion | | — | | Significant Opportunities |
• Greenfield Investment | | — | | Significant Opportunities |
• Privatization/M&A | | — | | Longer-Term Potential |
* Non-GAAP financial measure. See Appendix.
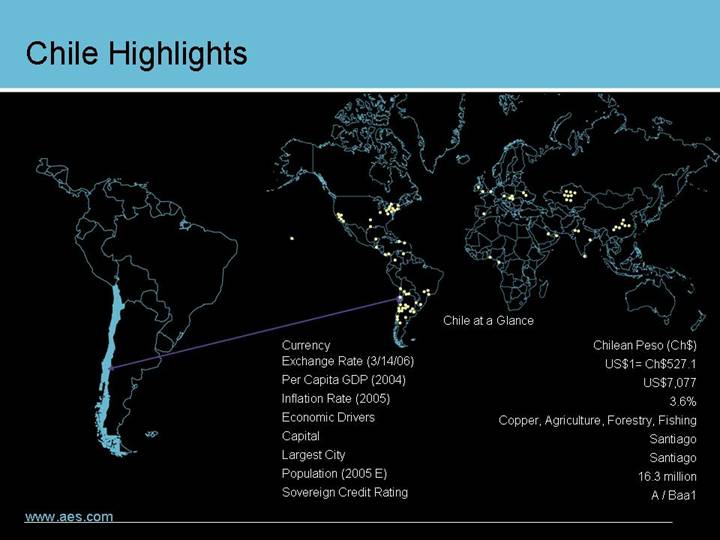
Chile Highlights
[GRAPHIC]
Chile at a Glance |
|
Currency | | Chilean Peso (Ch$) |
Exchange Rate (3/14/06) | | US$1= Ch$527.1 |
Per Capita GDP (2004) | | US$7,077 |
Inflation Rate (2005) | | 3.6% |
Economic Drivers | | Copper, Agriculture, Forestry, Fishing |
Capital | | Santiago |
Largest City | | Santiago |
Population (2005 E) | | 16.3 million |
Sovereign Credit Rating | | A / Baa1 |
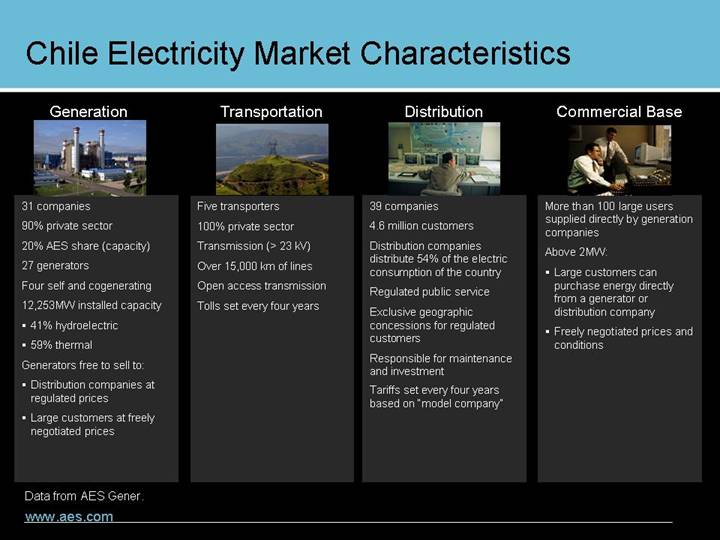
Chile Electricity Market Characteristics
Generation | | Transportation | | Distribution | | Commerical Base |
| | | | | | |
[GRAPHIC] | | [GRAPHIC] | | [GRAPHIC] | | [GRAPHIC] |
| | | | | | |
31 companies | | Five transporters | | 39 companies | | More than 100 large users supplied directly by generation companies |
| | | | | | |
90% private sector | | 100% private sector | | 4.6 million customers | | Above 2MW: |
20% AES share (capacity) | | Transmission (> 23 kV) | | Distribution companies distribute 54% of the electric consumption of the country | | • Large customers can purchase energy directly from a generator or distribution company |
| | | | | | |
27 generators | | Over 15,000 km of lines | | Regulated public service | | • Freely negotiated prices and conditions |
Four self and cogenerating | | Open access transmission | | Exclusive geographic concessions for regulated customers | | |
| | | | | | |
12,253MW installed capacity | | Tolls set every four years | | Responsible for maintenance and investment | | |
• 41% hydroelectric | | | | Tariffs set every four years based on “model company” | | |
• 59% thermal | | | | | | |
Generators free to sell to: | | | | | | |
• Distribution companies at regulated prices | | | | | | |
• Large customers at freely negotiated prices | | | | | | |
Data from AES Gener.
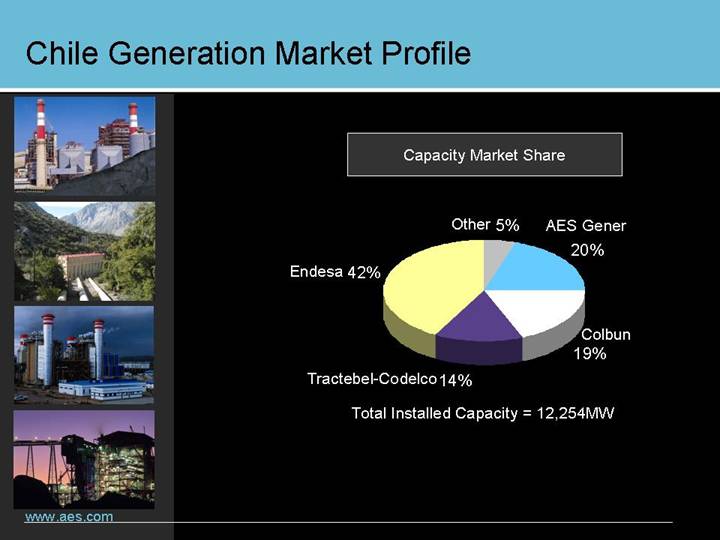
Chile Generation Market Profile
[GRAPHIC] | | Capacity Market Share |
[GRAPHIC] | | |
[GRAPHIC] | | [CHART] |
[GRAPHIC] | | |
| | Total Installed Capacity = 12,254MW |
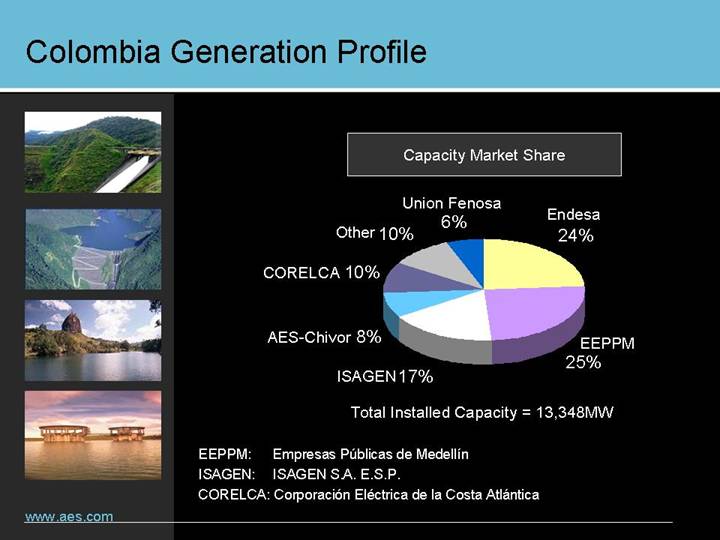
Colombia Generation Profile
[GRAPHIC] | | Capacity Market Share |
[GRAPHIC] | | |
[GRAPHIC] | | [CHART] |
[GRAPHIC] | | |
| | Total Installed Capacity = 13,348MW |
EEPPM: | | Empresas Públicas de Medellín |
ISAGEN: | | ISAGEN S.A. E.S.P. |
CORELCA: | | Corporación Eléctrica de la Costa Atlántica |
Chile Grid Overview
Central Interconnected | | | | Northern Interconnected | |
System (SIC) 2005 | | | | System (SING) 2005 | |
| | | | | | | | | |
Installed Capacity | | 8,629MW | | | | Installed Capacity | | 3,625MW | |
Maximum Demand | | 5,764MW | | [GRAPHIC] | | Maximum Demand | | 1,533MW | |
Gross Production | | 36,344 GWh | | | | Gross Production | | 12,657 GWh | |
Load Factor | | 76% | | | | Load Factor | | 86% | |
% Hydroelectric | | 57% | | | | % Hydroelectric | | 1% | |
% Thermal | | 43% | | | | % Thermal | | 99% | |
% Population | | 93% | | | | % Population | | 6% | |
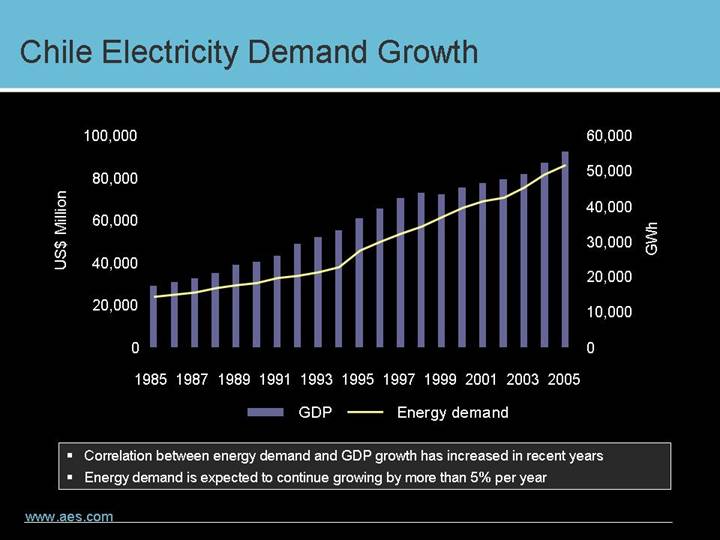
Chile Electricity Demand Growth
[CHART]
• Correlation between energy demand and GDP growth has increased in recent years
• Energy demand is expected to continue growing by more than 5% per year
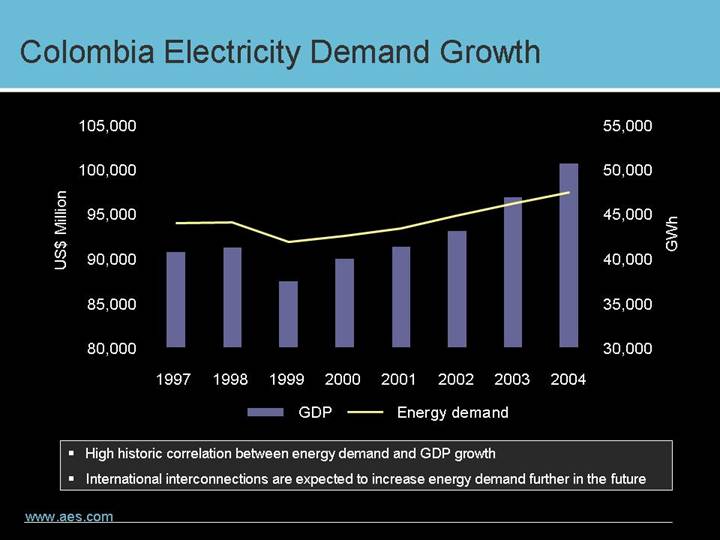
Colombia Electricity Demand Growth
[CHART]
• High historic correlation between energy demand and GDP growth
• International interconnections are expected to increase energy demand further in the future
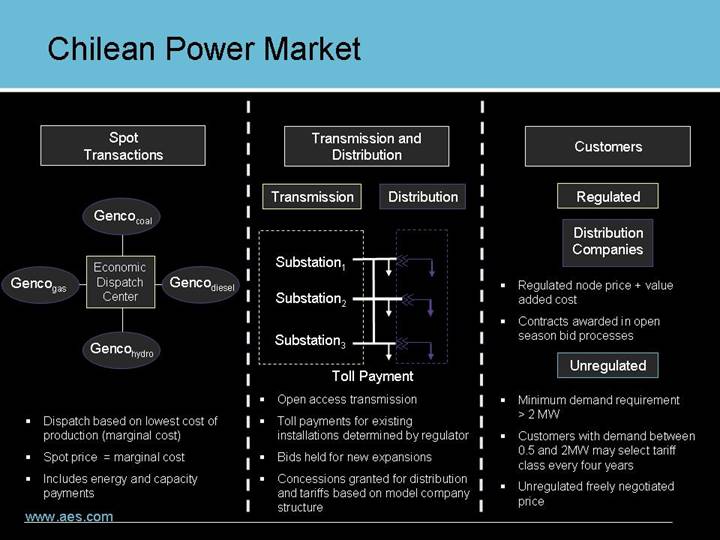
Chilean Power Market
| | Spot
Transactions | | |
| | | | |
| | Gencocoal | | |
| | | | |
Gencogas | | Economic Dispatch Center | | Gencodiesel |
| | | | |
| | Gencohydro | | |
• Dispatch based on lowest cost of production (marginal cost)
• Spot price = marginal cost
• Includes energy and capacity payments
Transmission and Distribution | |
| | | |
Transmission | | Distribution | |
| | | |
Substation(1) | | | |
| | | |
Substation(2) | | | |
| | | |
Substation(3) | | | |
Toll Payment
• Open access transmission
• Toll payments for existing installations determined by regulator
• Bids held for new expansions
• Concessions granted for distribution and tariffs based on model company structure
Customers
Regulated
Distribution Companies
• Regulated node price + value added cost
• Contracts awarded in open season bid processes
Unregulated
• Minimum demand requirement > 2 MW
• Customers with demand between 0.5 and 2MW may select tariff class every four years
• Unregulated freely negotiated price
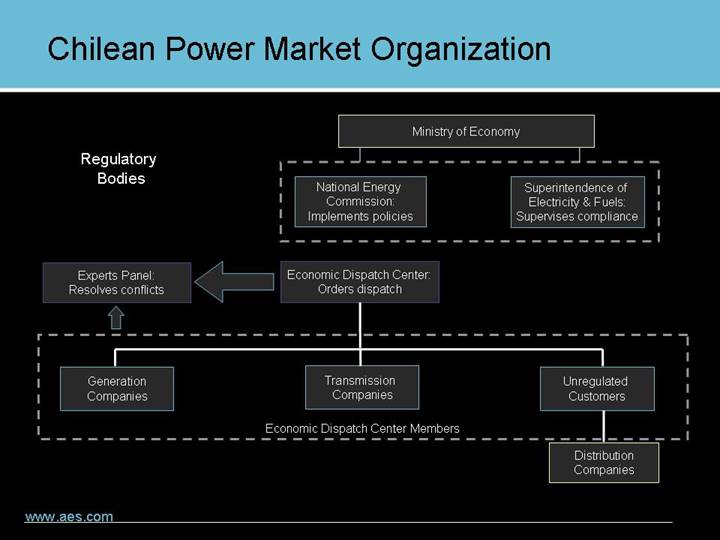
Chilean Power Market Organization
| | Ministry of Economy |
| | |
Regulatory
Bodies | | National Energy
Commission:
Implements policies | | Superintendence of
Electricity & Fuels:
Supervises compliance |
| | | | |
Experts Panel:
Resolves conflicts | | Economic Dispatch Center:
Orders dispatch | | |
| | | | |
Generation
Companies | | Transmission
Companies | | Unregulated
Customers |
| | | | |
| | Economic Dispatch Center Members | | |
| | | | Distribution
Companies |
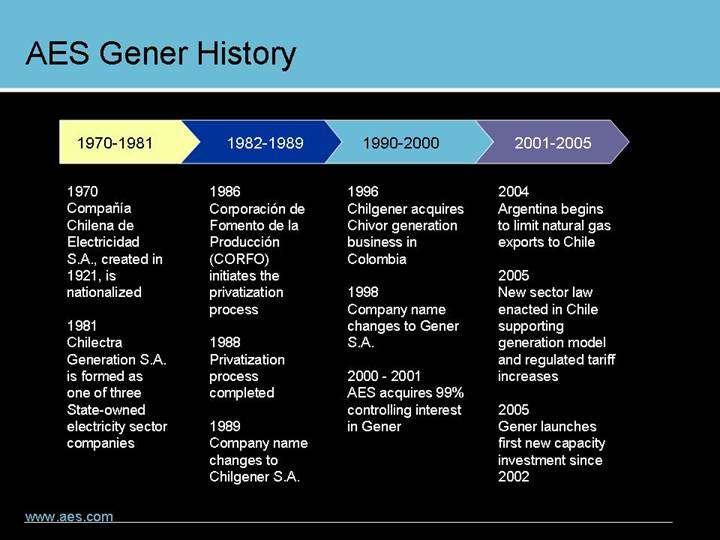
AES Gener History
1970-1981 | | 1982-1989 | | 1990-2000 | | 2001-2005 |
| | | | | | |
1970 | | 1986 | | 1996 | | 2004 |
Companía Chilena de Electricidad S.A., created in 1921, is nationalized 1981 Chilectra Generation S.A. is formed as one of three State-owned electricity sector companies | | Corporación de Fomento de la Producción (CORFO) initiates the privatization process 1988 Privatization process completed 1989 Company name changes to Chilgener S.A. | | Chilgener acquires Chivor generation business in Colombia 1998 Company name changes to Gener S.A. 2000 - 2001 AES acquires 99% controlling interest in Gener | | Argentina begins to limit natural gas exports to Chile 2005 New sector law enacted in Chile supporting generation model and regulated tariff increases 2005 Gener launches first new capacity investment since 2002 |
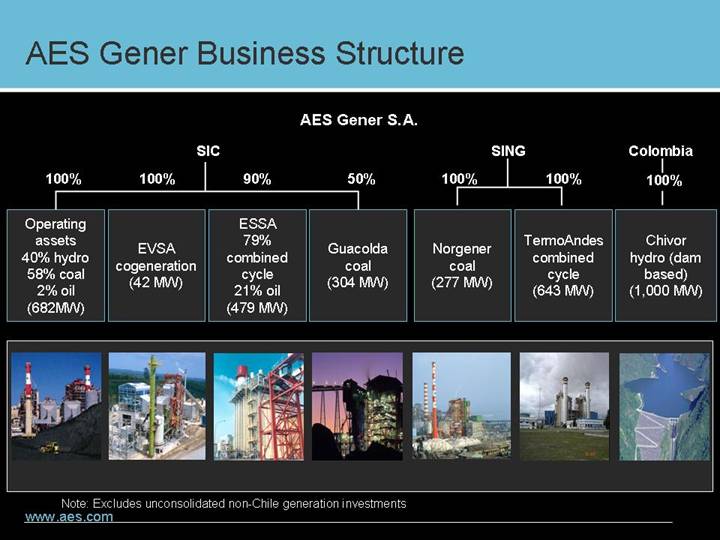
AES Gener Business Structure
AES Gener S.A.
SIC | | SING | | Colombia | |
| | | | | | | | | | | | | |
100% | | 100% | | 90% | | 50% | | 100% | | 100% | | 100% | |
| | | | | | | | | | | | | |
Operating
assets
40% hydro
58% coal
2% oil (682MW) | |
EVSA
cogeneration
(42 MW)
| | ESSA
79%
combined
cycle
21% oil
(479 MW) | |
Guacolda
coal
(304 MW)
| |
Norgener
coal
(277 MW)
| |
TermoAndes
combined
cycle
(643 MW)
| |
Chivor
hydro (dam
based)
(1,000 MW)
| |
| | | | | | | | | | | | | |
[GRAPHIC] | | [GRAPHIC] | | [GRAPHIC] | | [GRAPHIC] | | [GRAPHIC] | | [GRAPHIC] | | [GRAPHIC] | |
Note: Excludes unconsolidated non-Chile generation investments
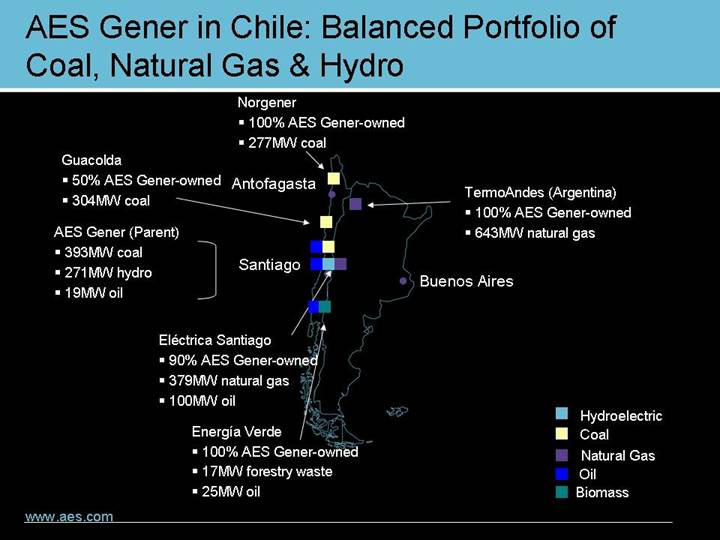
AES Gener in Chile: Balanced Portfolio of Coal, Natural Gas & Hydro
[GRAPHIC]
Norgener
•100% AES Gener-owned
•277MW coal
TermoAndes (Argentina)
•100% AES Gener-owned
•643MW natural gas
Buenos Aires
Energía Verde
•100% AES Gener-owned
•17MW forestry waste
•25MW oil
Eléctrica Santiago
•90% AES Gener-owned
•379MW natural gas
•100MW oil
Santiago
AES Gener (Parent)
•393MW coal
•271MW hydro
•19MW oil
Guacolda
•50% AES Gener-owned
•304MW coal
Antofagasta
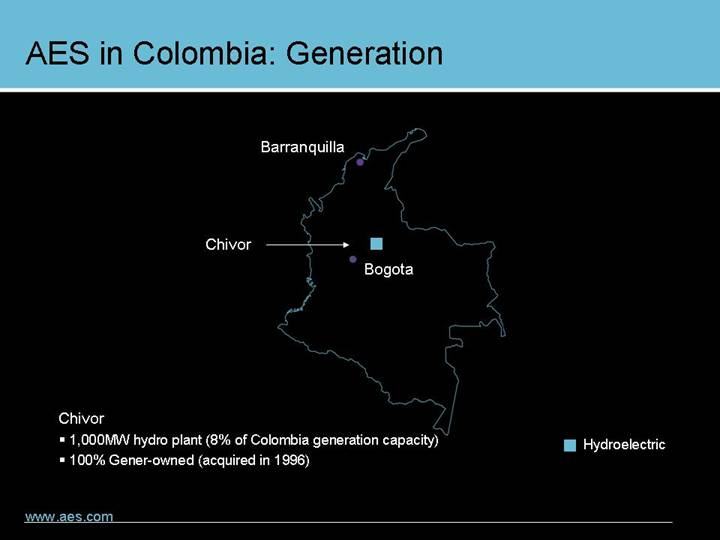
AES in Colombia: Generation
[GRAPHIC]
Chivor
• 1,000MW hydro plant (8% of Colombia generation capacity)
• 100% Gener-owned (acquired in 1996)
AES Gener SIC Asset Diversity
SIC Capacity Dependent on Hydro... |
|
[CHART] |
|
...Resulting in Volatile Spot Prices |
|
[CHART] |
|
Gener Balanced Portfolio |
|
[CHART] |
|
...Leads to |
|
• Lower risk profile than competitors |
• Asset portfolio complementary to the system provides assurance of output |
• Competitive advantage to capture long-term contracts |
• All the upside of high hydrology years with limited downside |
(1) Includes 100% of Electrica Santiago and Guacolda’s capacity.
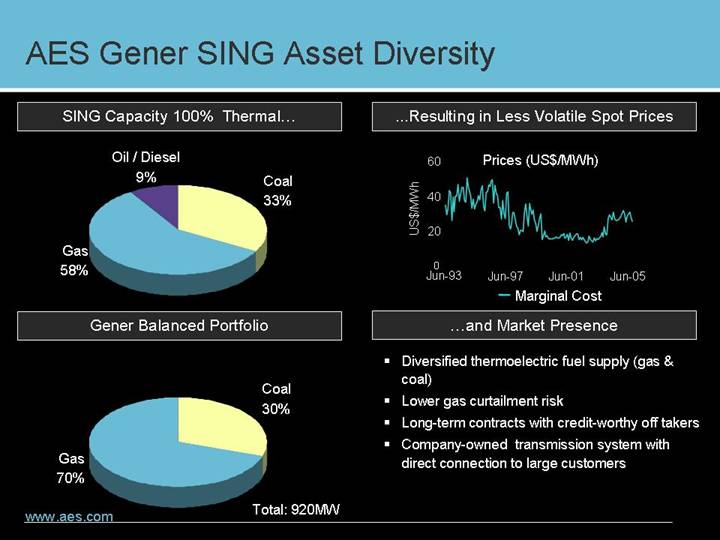
AES Gener SING Asset Diversity
SING Capacity 100% Thermal... |
|
[CHART] |
|
...Resulting in Less Volatile Spot Prices |
|
[CHART] |
|
Gener Balanced Portfolio |
|
[CHART] |
|
...and Market Presence |
|
• Diversified thermoelectric fuel supply (gas & coal) |
• Lower gas curtailment risk |
• Long-term contracts with credit-worthy off takers |
• Company-owned transmission system with direct connection to large customers |
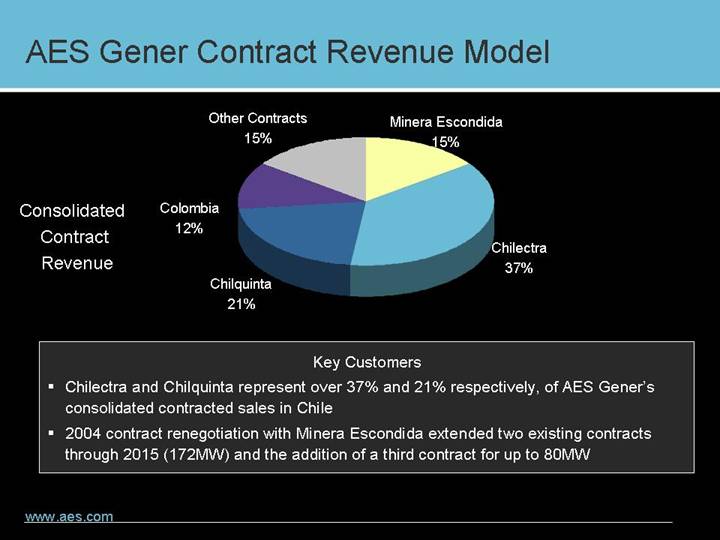
AES Gener Contract Revenue Model
[CHART]
Key Customers
• Chilectra and Chilquinta represent over 37% and 21% respectively, of AES Gener’s consolidated contracted sales in Chile
• 2004 contract renegotiation with Minera Escondida extended two existing contracts through 2015 (172MW) and the addition of a third contract for up to 80MW
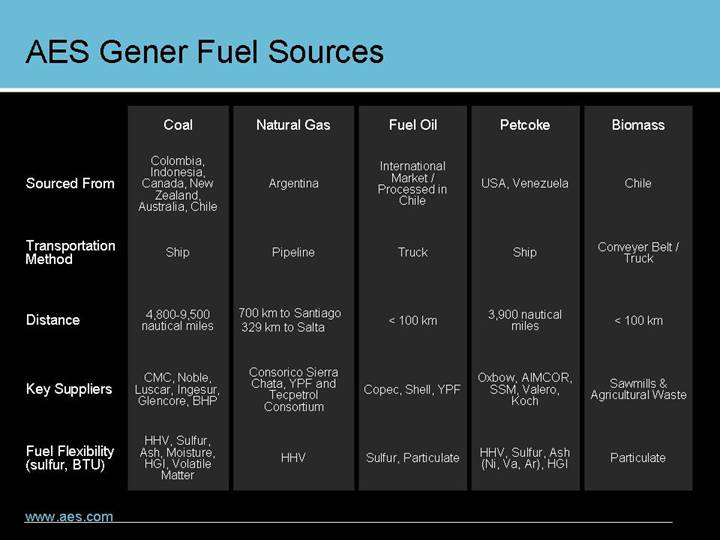
AES Gener Fuel Sources
| | Coal | | Natural Gas | | Fuel Oil | | Petcoke | | Biomass | |
Sourced From | | Colombia, Indonesia, Canada, New Zealand, Australia, Chile | | Argentina | | International Market / Processed in Chile | | USA, Venezuela | | Chile | |
| | | | | | | | | | | |
Transportation Method | | Ship | | Pipeline | | Truck | | Ship | | Conveyer Belt / Truck | |
| | | | | | | | | | | |
Distance | | 4,800-9,500 nautical miles | | 700 km to Santiago 329 km to Salta | | < 100 km | | 3,900 nautical miles | | < 100 km | |
| | | | | | | | | | | |
Key Suppliers | | CMC, Noble, Luscar, Ingesur, Glencore, BHP | | Consorico Sierra Chata, YPF and Tecpetrol Consortium | | Copec, Shell, YPF | | Oxbow, AIMCOR, SSM, Valero, Koch | | Sawmills & Agricultural Waste | |
| | | | | | | | | | | |
Fuel Flexibility (sulfur, BTU) | | HHV, Sulfur, Ash, Moisture, HGI, Volatile Matter | | HHV | | Sulfur, Particulate | | HHV, Sulfur, Ash (Ni, Va, Ar, HGI | ) | Particulate | |
AES Gener Generation KPIs
Contains Forward Looking Statements
Key Performance Indicator (KPI)
Safety Excellence |
|
• OSHA rate |
• Lost time accidents (LTA) |
|
Operational Excellence |
|
• Equivalent availability factor (EAF) |
• Non-fuel O&M (NFOM) cost per megawatt hour |
• Equivalent net plant heat rate Btu/kWh (ENPHR) – Thermal plants |
• Equivalent forced outage rate (EFOR) |
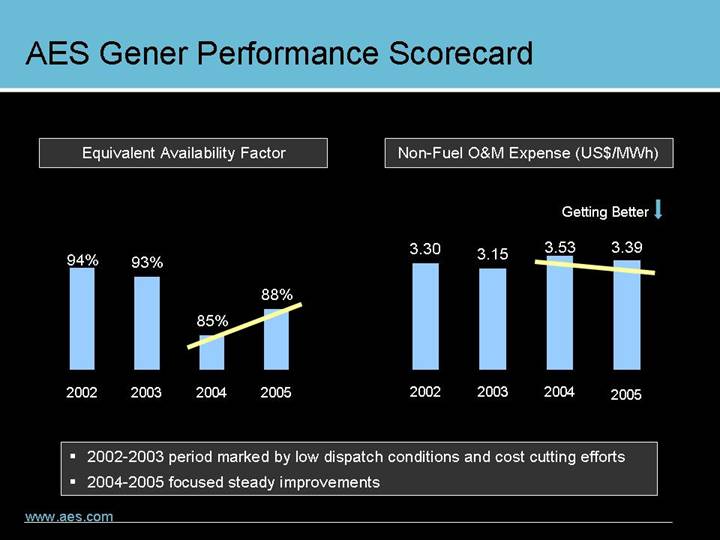
AES Gener Performance Scorecard
Equivalent Availability Factor |
|
[CHART] |
|
Non-Fuel O&M Expense (US$/MWh) |
|
[CHART] |
• 2002-2003 period marked by low dispatch conditions and cost cutting efforts
• 2004-2005 focused steady improvements
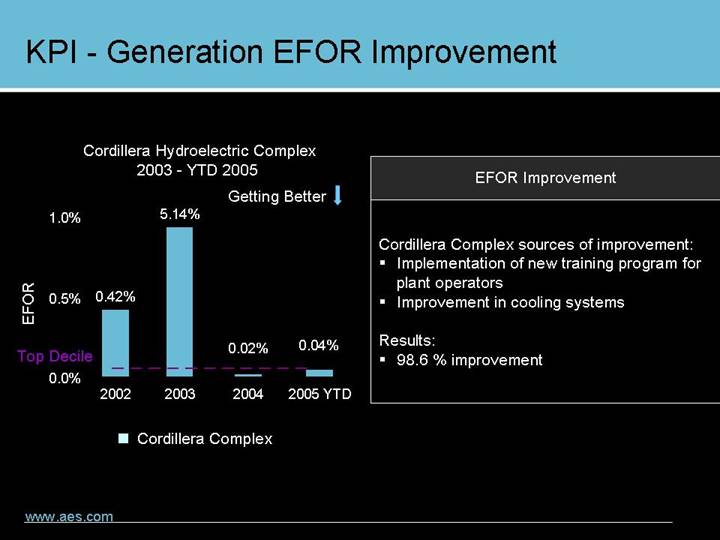
KPI - Generation EFOR Improvement
Cordillera Hydroelectric Complex |
2003 - YTD 2005 |
|
[CHART] |
|
EFOR Improvement |
|
Cordillera Complex sources of improvement: |
• Implementation of new training program for plant operators |
• Improvement in cooling systems |
|
Results: |
• 98.6% improvement |
AES Gener Capital Structure Objectives
Contains Forward Looking Statements
Capital Structure Elements | | Target |
| | |
Financial Debt to Capital Ratio | | 50% to 55% |
Credit Rating Objectives | | |
• S&P | | BB+ to Investment Grade |
• Fitch | | BB to Investment Grade |
• Moody’s | | Ba3 to Investment Grade |
Interest Coverage | | > 3.0 x |
Fixed to Floating Rate | | 85% fixed rate/15% floating rate |
Average Maturity | | 7 years |
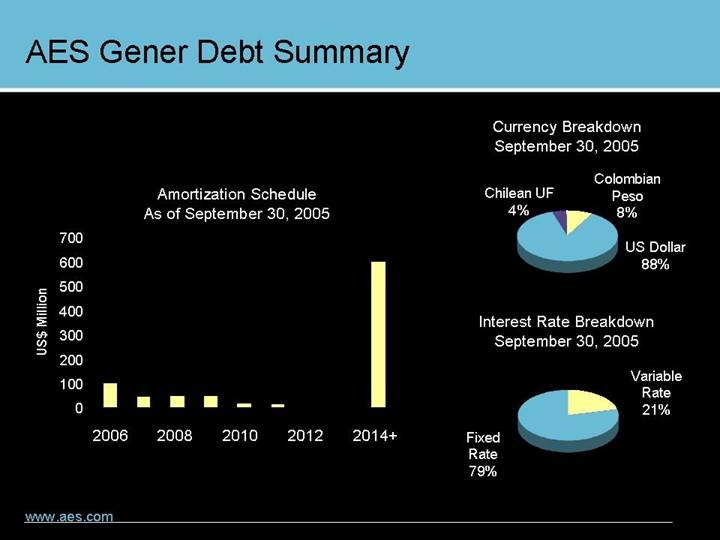
AES Gener Debt Summary
Amortization Schedule As of September 30, 2005 |
|
[CHART] |
|
Currency Breakdown September 30, 2005 |
|
[CHART] |
|
Interest Rate Breakdown September 30, 2005 |
|
[CHART] |
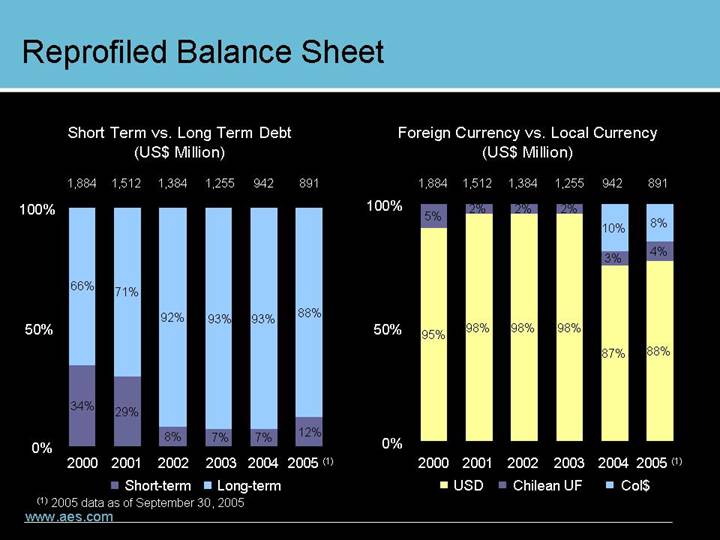
Reprofiled Balance Sheet
Short Term vs. Long Term Debt |
(US$ Million) |
|
[CHART] |
|
Foreign Currency vs. Local Currency |
(US$ Million) |
|
[CHART] |
(1) 2005 data as of September 30, 2005
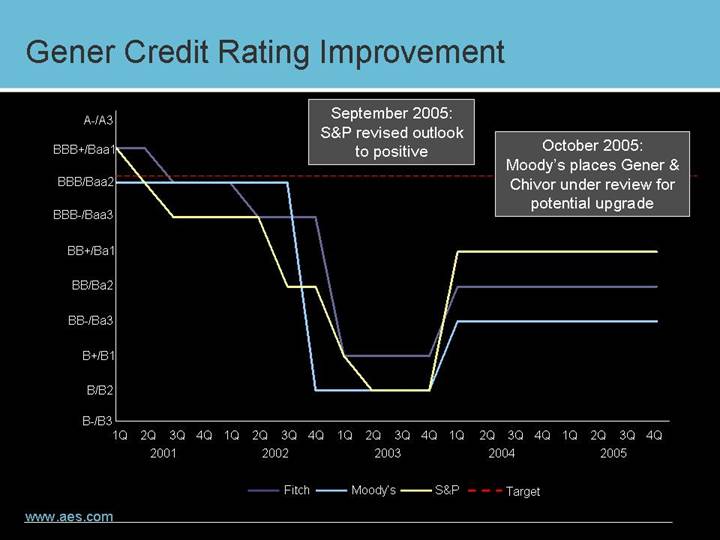
Gener Credit Rating Improvement
[CHART]
AES Gener Portfolio Diversified by Geography
Revenue Trend |
|
[CHART] |
|
Balanced Revenues (1) |
|
[CHART] |
(1) 2005 data as of September 30, 2005
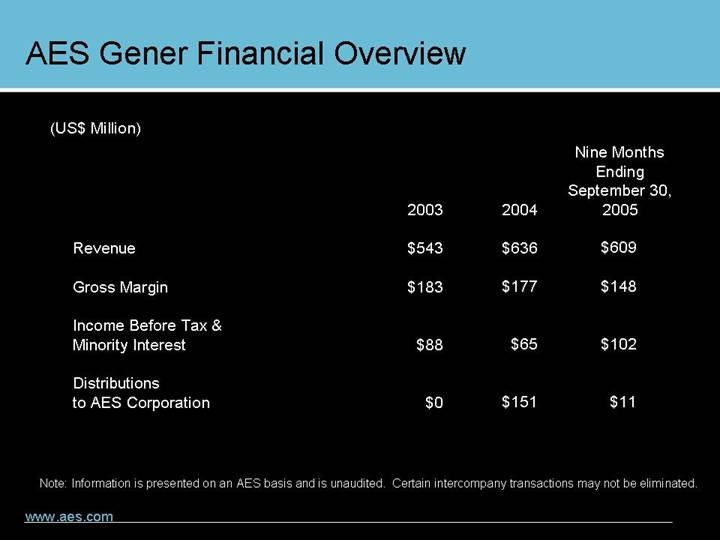
AES Gener Financial Overview
(US$ Million)
| | 2003 | | 2004 | | Nine Months
Ending
September 30,
2005 | |
| | | | | | | |
Revenue | | $ | 543 | | $ | 636 | | $ | 609 | |
| | | | | | | |
Gross Margin | | $ | 183 | | $ | 177 | | $ | 148 | |
| | | | | | | |
Income Before Tax & Minority Interest | | $ | 88 | | $ | 65 | | $ | 102 | |
| | | | | | | |
Distributions to AES Corporation | | $ | 0 | | $ | 151 | | $ | 11 | |
Note: Information is presented on an AES basis and is unaudited. Certain intercompany transactions may not be eliminated.
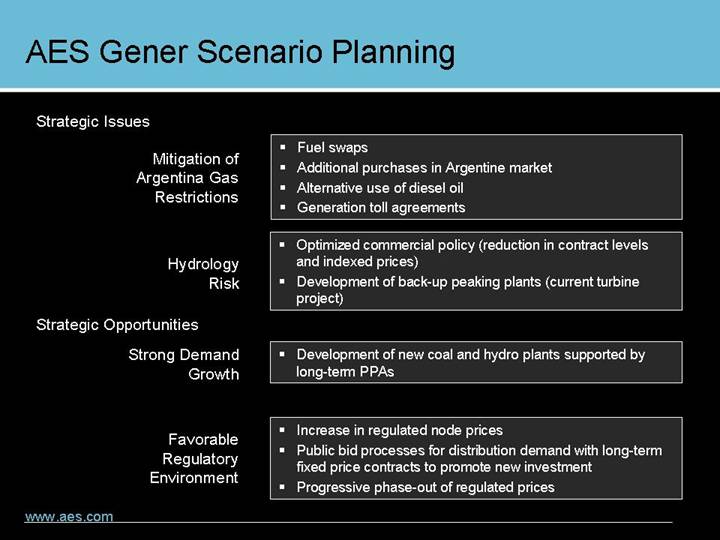
AES Gener Scenario Planning
Strategic Issues |
|
Mitigation of Argentina Gas Restrictions |
• Fuel swaps |
• Additional purchases in Argentine market |
• Alternative use of diesel oil |
• Generation toll agreements |
|
Hydrology Risk |
• Optimized commercial policy (reduction in contract levels and indexed prices) |
• Development of back-up peaking plants (current turbine project) |
|
Strategic Opportunities |
|
Strong Demand Growth |
• Development of new coal and hydro plants supported by long-term PPAs |
|
Favorable Regulatory Environment |
• Increase in regulated node prices |
• Public bid processes for distribution demand with long-term fixed price contracts to promote new investment |
• Progressive phase-out of regulated prices |
ESSA Gas Supply Restrictions
Contains Forward Looking Statements
ESSA Fuel Supply 2004 – YTD 2006
[CHART]
Proactive Response
• Fuel swap agreements
• Gas purchase agreements
• Utilization of diesel oil
• Generation toll agreements
Chile Platform Expansion Opportunities
Ventanas Plant, Chile
[GRAPHIC]
Contains Forward Looking Statements |
|
|
120MW diesel-fired power plant |
• $37 million capital cost |
• Start-up second quarter 2006 |
• Supports peaking, fuel diversification and hydrology risk management strategies |
• Fits existing generation tariff structure |
|
Proposed coal-fired power plants |
• 200-250MW plants at existing Guacolda and Ventanas sites |
• 2009 Start-Up |
• Combined capital costs $600 million |
• Participating in Chilean RFP process |
|
Platform expansion revenue potential $175 million by 2010 (combined basis) |
|
Strong subsidiary dividends can continue |
| | AES Argentina Business Review |
AES CORPORATION | | |
| | Eduardo Dutrey |
| | President, AES Argentina |
| | |
[GRAPHIC] |
| | |
| | March 22, 2006 |
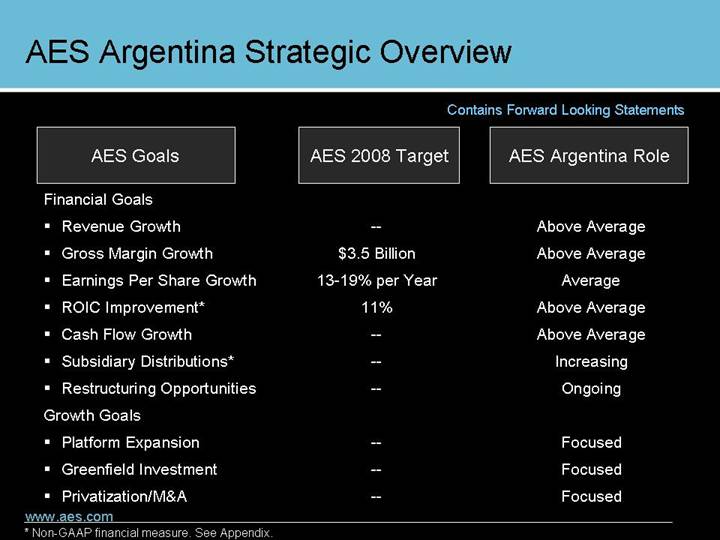
AES Argentina Strategic Overview
Contains Forward Looking Statements
AES Goals | | AES 2008 Target | | AES Argentina Role | |
| | | | | |
Financial Goals | | | | | |
• Revenue Growth | | — | | Above Average | |
• Gross Margin Growth | | $3.5 Billion | | Above Average | |
• Earnings Per Share Growth | | 13-19% per Year | | Average | |
• ROIC Improvement* | | 11% | | Above Average | |
• Cash Flow Growth | | — | | Above Average | |
• Subsidiary Distributions* | | — | | Increasing | |
• Restructuring Opportunities | | — | | Ongoing | |
| | | | | |
Growth Goals | | | | | |
• Platform Expansion | | — | | Focused | |
• Greenfield Investment | | — | | Focused | |
• Privatization/M&A | | — | | Focused | |
* Non-GAAP financial measure. See Appendix.
Argentina Highlights
[GRAPHIC] | | |
| | |
Argentina at a Glance |
| | |
Currency | | Argentina Peso (Ar$) |
Exchange Rate (3/14/06) | | US$1=AR$3.076 |
Per Capita GDP (2004) | | US$4,048 |
Inflation Rate (2005) | | 12% |
Economic Drivers | | Agriculture, Manufacturing, Mining |
Capital | | Buenos Aires |
Largest City | | Buenos Aires |
Population (2004) | | 36.2 MM |
Country Credit Rating (S&P) | | B- / Stable |
Argentina Electricity Market Characteristics
Generation | | Transport | | Distribution | | Commercial Base | |
| | | | | | | |
[GRAPHIC] | | [GRAPHIC] | | [GRAPHIC] | | [GRAPHIC] | |
| | | | | | | |
59 companies 84% private sector 12% AES share (capacity) 44 generators 15 self and cogenerating 20,719MW installed capacity • 43% hydroelectric • 52% thermal • 5% nuclear Freedom to access and leave the market Energy sales include contract and spot business models | | 16 transporters 90% private sector National (Transener) Six regional participants High voltage transmission (500/220 kV) • 9,400 km of lines • 16,000 towers • 29 substations Regulated public service with open access Not responsible for expansion Tariffs updated every five years | | 38 companies 11.5 million customers Distribute 90% of the electric consumption of the country 315,000 km of networks 26,000 people employed Regulated public service Exclusive geographic area Responsible for maintenance and investment Seasonal energy price pass-through Tariffs updated every five years | | 2,100 Large users Above 30 kW: • Industrial (41%) • Residential (32%) • Commercial (17%) • Services (10%) Large customers can purchase energy directly from a generator or trader Unregulated prices and conditions | |
Data from ADEERA, ATEERA, AGEERA, AES.
Argentina Electricity Demand Growth
Contains Forward Looking Statements
Energy Demand
[CHART]
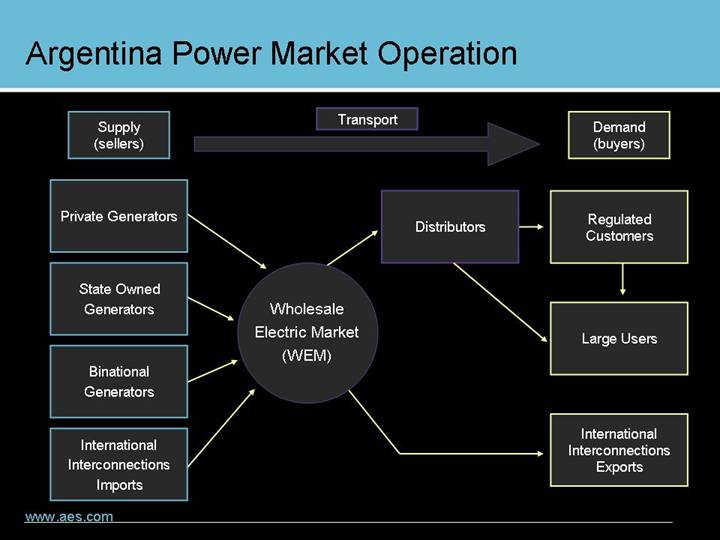
Argentina Power Market Operation
Supply (sellers) | | Transport | | Demand (buyers) |
| | | | |
Private Generators | | | Distributors | | Regulated Customers |
| | | | |
State Owned Generators | | Wholesale | | | Large Users |
| | Electric Market | | | |
| | (WEM) | | | |
| | | | |
Binational | | | | |
Generators | | | | |
| | | | |
International | | | | International |
Interconnections | | | | Interconnections |
Imports | | | | Exports |
| | | | | | |
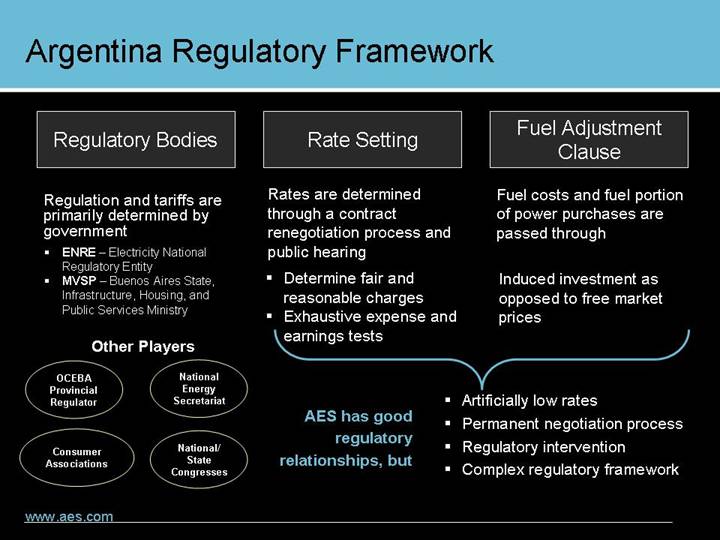
Argentina Regulatory Framework
Regulatory Bodies | | Rate Setting | | Fuel Adjustment Clause | |
| | | | | |
Regulation and tariffs are primarily determined by government • ENRE – Electricity National Regulatory Entity • MVSP – Buenos Aires State, Infrastructure, Housing, and Public Services Ministry | | Rates are determined through a contract renegotiation process and public hearing • Determine fair and reasonable charges • Exhaustive expense and earnings tests | | Fuel costs and fuel portion of power purchases are passed through Induced investment as opposed to free market prices | |
AES has good regulatory relationships, but |
|
• Artificially low rates |
• Permanent negotiation process |
• Regulatory intervention |
• Complex regulatory framework |
Other Players |
| | |
OCEBA Provincial Regulator | | National Energy Secretariat |
| | |
Consumer Associations | | National/State Congresses |
AES Argentina Business Structure
AES Argentina
Regulated Utilities | | Competitive Supply | |
| | | | | | | | | | | | | |
Edelap
296,000 customers
2.364 GWh
sold | | Eden
300,000
customers
2.107 GWh
sold | | Edes
154,000
customers
722 GWh
sold | |
Paraná
gas
845MW
| | Central
Termica San
Nicolas
(CTSN)
coal/gas/oil
650MW | |
Alicura
hydroelectric
1,040MW
| | Juramento &
Central
Dique
hydroelectric
& thermal
213MW | |
| | | | | | | | | | | | | |
[GRAPHIC] | | [GRAPHIC] | | [GRAPHIC] | | [GRAPHIC] | | [GRAPHIC] | | [GRAPHIC] | | [GRAPHIC] | |
AES Argentina: Generation
[GRAPHIC]
Rio Juramento
(Salta)
• 112MW
• Hydroelectric
• 98% AES-owned
Rio Juramento
(San Juan)
• 33MW
• Natural Gas/Diesel
• 98% AES-owned
Alicura
• 1,040MW
• 96% AES-owned
CTSN
• 650MW
• Coal/Gas/Fuel Oil
• 96% AES-owned
AES Paraná
• 845MW
• Natural Gas/Gas Oil
• 100% AES-owned
Central Dique
• 68MW
• Natural Gas
• 51% AES-owned
Portfolio Balanced Between Generation and Distribution
Revenues Trend |
|
[CHART] |
|
Generation Spot Prices |
|
[CHART] |
|
Balanced Revenues |
|
[CHART] |
|
Revenue by Fuel |
|
[CHART] |
Note: 2005 revenues as of September 30, 2005
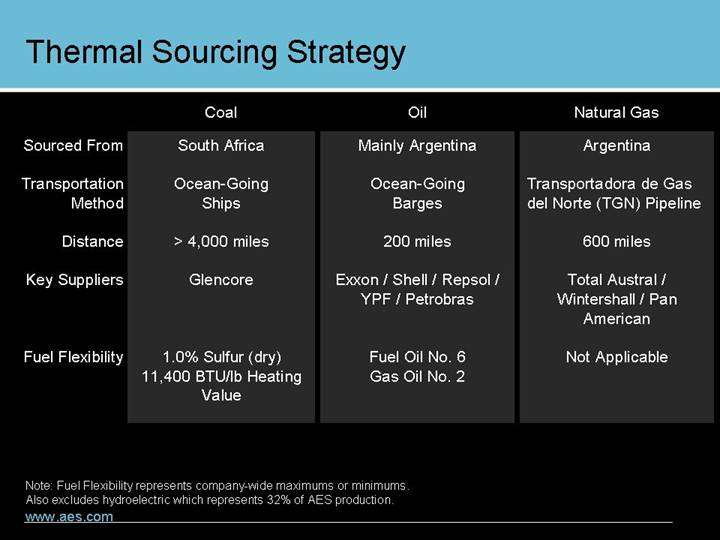
Thermal Sourcing Strategy
| | Coal | | Oil | | Natural Gas | |
| | | | | | | |
Sourced From | | South Africa | | Mainly Argentina | | Argentina | |
| | | | | | | |
Transportation Method | | Ocean-Going Ships | | Ocean-Going Barges | | Transportadora de Gas del Norte (TGN) Pipeline | |
| | | | | | | |
| | | | | | | |
Distance | | > 4,000 miles | | 200 miles | | 600 miles | |
| | | | | | | |
Key Suppliers | | Glencore | | Exxon / Shell / Repsol / YPF / Petrobras | | Total Austral / Wintershall / Pan American | |
| | | | | | | |
Fuel Flexibility | | 1.0% Sulfur (dry) | | Fuel Oil No. 6 | | Not Applicable | |
| | 11,400 BTU/lb Heating Value | | Gas Oil No. 2 | | | |
Note: Fuel Flexibility represents company-wide maximums or minimums.
Also excludes hydroelectric which represents 32% of AES production.
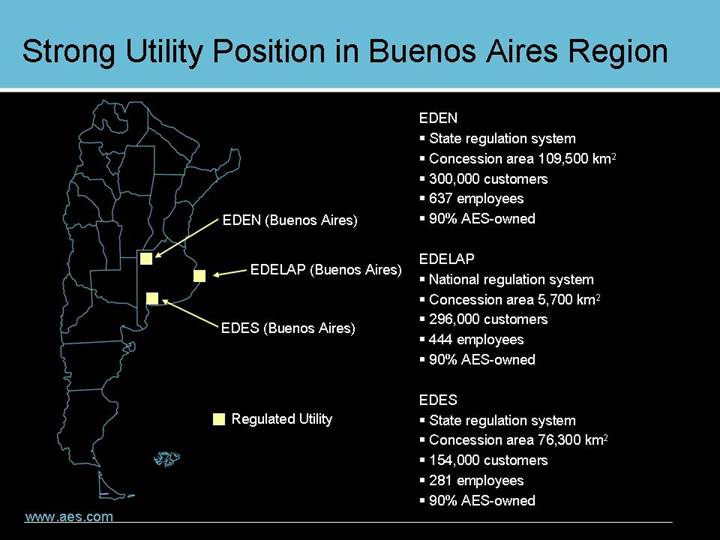
Strong Utility Position in Buenos Aires Region
[GRAPHIC]
EDEN
• State regulation system
• Concession area 109,500 km2
• 300,000 customers
• 637 employees
• 90% AES-owned
EDELAP
• National regulation system
• Concession area 5,700 km2
• 296,000 customers
• 444 employees
• 90% AES-owned
EDES
• State regulation system
• Concession area 76,300 km2
• 154,000 customers
• 281 employees
• 90% AES-owned
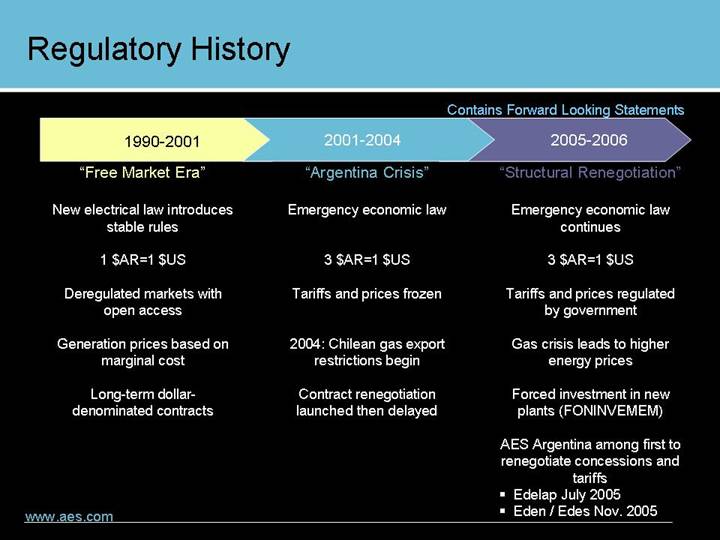
Regulatory History
Contains Forward Looking Statements
1990-2001 | | 2001-2004 | | 2005-2006 | |
| | | | | |
“Free Market Era” | | “Argentina Crisis” | | “Structural Renegotiation” | |
| | | | | |
New electrical law introduces stable rules | | Emergency economic law | | Emergency economic law continues | |
| | | | | |
1 $AR=1 $US | | 3 $AR=1 $US | | 3 $AR=1 $US | |
| | | | | |
Deregulated markets with open access | | Tariffs and prices frozen | | Tariffs and prices regulated by government | |
| | | | | |
Generation prices based on marginal cost | | 2004: Chilean gas export restrictions begin | | Gas crisis leads to higher energy prices | |
| | | | | |
Long-term dollar-denominated contracts | | Contract renegotiation launched then delayed | | Forced investment in new plants (FONINVEMEM) | |
| | | | | |
| | | | AES Argentina among first to renegotiate concessions and tariffs | |
| | | | • Edelap July 2005 | |
| | | | • Eden / Edes Nov. 2005 | |
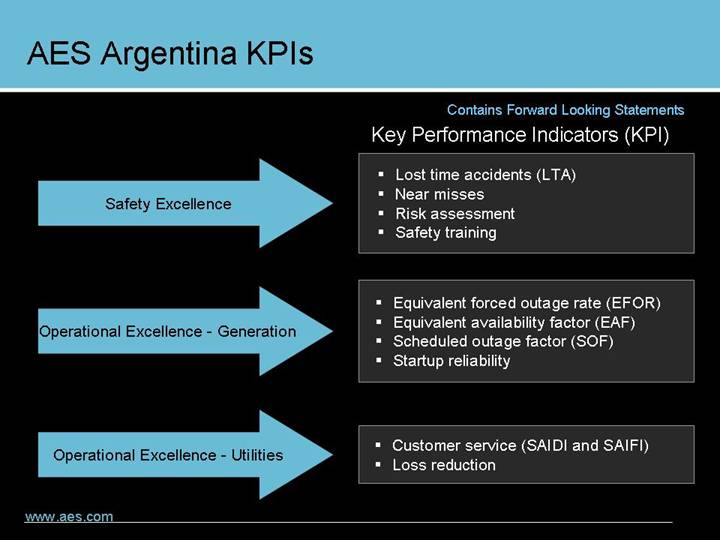
AES Argentina KPIs
Contains Forward Looking Statements
Key Performance Indicators (KPI)
Safety Excellence
• Lost time accidents (LTA)
• Near misses
• Risk assessment
• Safety training
Operational Excellence - Generation
• Equivalent forced outage rate (EFOR)
• Equivalent availability factor (EAF)
• Scheduled outage factor (SOF)
• Startup reliability
Operational Excellence - Utilities
• Customer service (SAIDI and SAIFI)
• Loss reduction
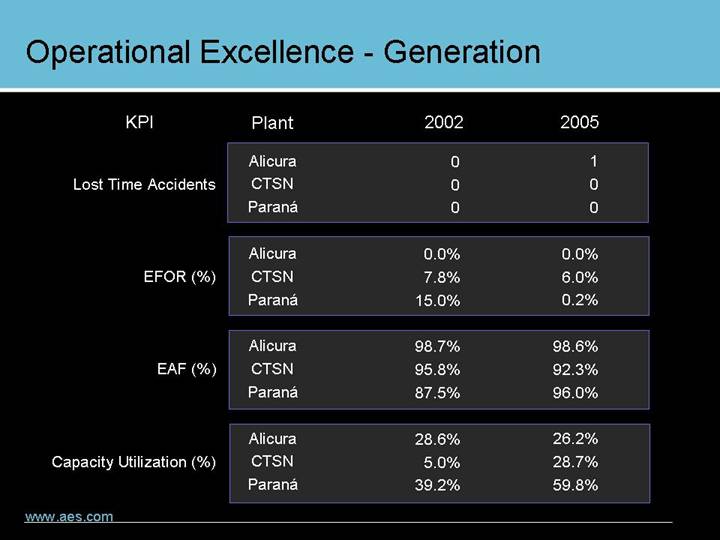
Operational Excellence - Generation
KPI | | Plant | | 2002 | | 2005 | |
| | | | | | | |
| | Alicura | | 0 | | 1 | |
Lost Time Accidents | | CTSN | | 0 | | 0 | |
| | Paraná | | 0 | | 0 | |
| | | | | | | |
| | Alicura | | 0.0 | % | 0.0 | % |
EFOR (%) | | CTSN | | 7.8 | % | 6.0 | % |
| | Paraná | | 15.0 | % | 0.2 | % |
| | | | | | | |
| | Alicura | | 98.7 | % | 98.6 | % |
EAF (%) | | CTSN | | 95.8 | % | 92.3 | % |
| | Paraná | | 87.5 | % | 96.0 | % |
| | | | | | | |
| | Alicura | | 28.6 | % | 26.2 | % |
Capacity Utilization (%) | | CTSN | | 5.0 | % | 28.7 | % |
| | Paraná | | 39.2 | % | 59.8 | % |
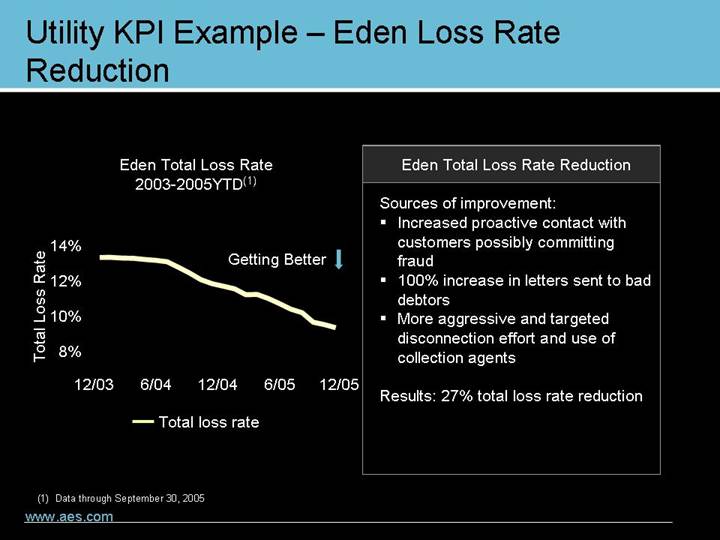
Utility KPI Example – Eden Loss Rate Reduction
Eden Total Loss Rate 2003-2005YTD(1)
[CHART]
Eden Total Loss Rate Reduction
Sources of improvement:
• Increased proactive contact with customers possibly committing fraud
• 100% increase in letters sent to bad debtors
• More aggressive and targeted disconnection effort and use of collection agents
Results: 27% total loss rate reduction
(1) Data through September 30, 2005
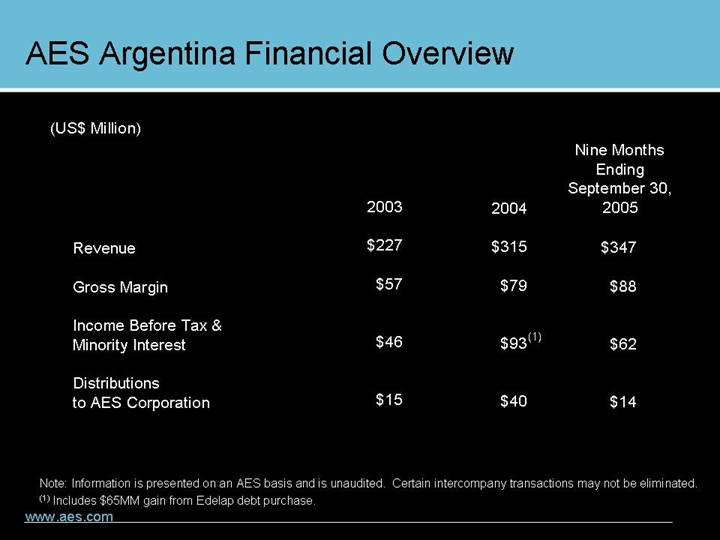
AES Argentina Financial Overview
(US$ Million)
| | 2003 | | 2004 | | Nine Months
Ending
September 30,
2005 | |
| | | | | | | |
Revenue | | $ | 227 | | $ | 315 | | $ | 347 | |
| | | | | | | |
Gross Margin | | $ | 57 | | $ | 79 | | $ | 88 | |
| | | | | | | |
Income Before Tax & Minority Interest | | $ | 46 | | $ | 93 | (1) | $ | 62 | |
| | | | | | | |
Distributions to AES Corporation | | $ | 15 | | $ | 40 | | $ | 14 | |
Note: Information is presented on an AES basis and is unaudited. Certain intercompany transactions may not be eliminated.
(1) Includes $65MM gain from Edelap debt purchase.
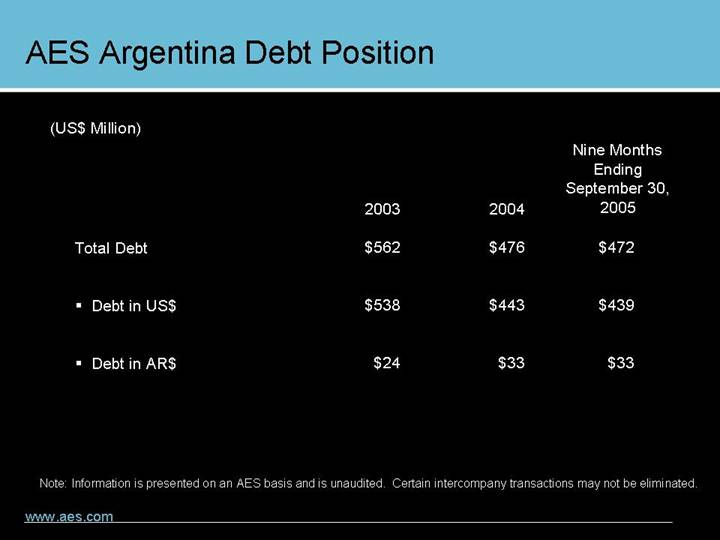
AES Argentina Debt Position
(US$ Million)
| | 2003 | | 2004 | | Nine Months
Ending
September 30,
2005 | |
| | | | | | | |
Total Debt | | $ | 562 | | $ | 476 | | $ | 472 | |
| | | | | | | |
• Debt in US$ | | $ | 538 | | $ | 443 | | $ | 439 | |
| | | | | | | |
• Debt in AR$ | | $ | 24 | | $ | 33 | | $ | 33 | |
Note: Information is presented on an AES basis and is unaudited. Certain intercompany transactions may not be eliminated.
AES Argentina Challenges
Contains Forward Looking Statements
Macroeconomic (Argentina) Challenges
• Maintain a 4-5% GDP annual avergage increase
• Maintain inflation under control (10-15%)
AES Argentina Regulatory
• Achieve forecasted tariff and prices increases
• Avoid new forced investments
• Improve relationship with regulators
AES Argentina Financial
• Restructuring AES Paraná, Eden and Edes debt
AES Argentina Opportunities
Contains Forward Looking Statements
Growing Market
• Capitalize on new demand (6% annual average increase) with utility and competitive supply position
Regional Operational Synergies
• Gas crisis (CTSN/Paraná): If restrictions of gas exports continue AES Argentina should get additional generation demand helping mitigate impacts on other regional AES businesses
Potential Return to Growth Investments