EXHIBIT 99.1
Overview
We are a global power company. We own a portfolio of electricity generation and distribution businesses on five continents in 29 countries, with generation capacity totaling approximately 43,000 Megawatts (“MW”) and distribution networks serving over 11 million people as of December 31, 2008. In addition, we have more than 3,000 MW under construction in ten countries. Our global workforce of 25,000 people provides electricity to people in diverse markets ranging from urban centers in the United States to remote villages in India. We were incorporated in Delaware in 1981 and for almost three decades we have been committed to providing safe and reliable energy.
We own and operate two primary types of businesses. The first is our Generation business, where we own and/or operate power plants to generate and sell power to wholesale customers such as utilities and other intermediaries. The second is our Utilities business, where we own and/or operate utilities to distribute, transmit and sell electricity to end-user customers in the residential, commercial, industrial and governmental sectors in a defined service area.
Our assets are diverse with respect to fuel source and type of market, which helps reduce certain types of operating risk. Our portfolio employs a broad range of fuels, including coal, gas, fuel oil, biomass and renewable sources such as hydroelectric power, wind and solar, which reduces the risks associated with dependence on any one fuel source. Our presence in mature markets helps reduce the volatility associated with our businesses in faster-growing emerging markets. In addition, our Generation portfolio is largely contracted, which reduces the risk related to the market prices of electricity and fuel. We also attempt to limit risk by hedging much of our currency and commodity risk, and by matching the currency of most of our subsidiary debt to the revenue of the business that issued that debt. However, our business is still subject to these and other risks, which are further disclosed in Item 1A. Risk Factors of the Company’s Annual Report on Form 10-K for the year ended December 31, 2008 (“the 2008 Form 10-K”) filed with the Securities and Exchange Commission (“SEC”) on February 26, 2009.
Our goal is to maximize value for our shareholders through continued focus on increasing the profitability of our existing portfolio and increasing free cash flow while managing our risk and employing rigorous capital allocation. We will continue to seek prudent expansion of our traditional Generation and Utilities lines of business, along with new investments in wind, solar, climate solutions and energy storage. Portfolio management has become an increased area of focus through which we have sold and will continue to sell or monetize a portion of certain businesses or assets when market values appear attractive. Furthermore, we will continue to focus on improving our business operations and management processes, including our internal controls over financial reporting.
Key Lines of Business
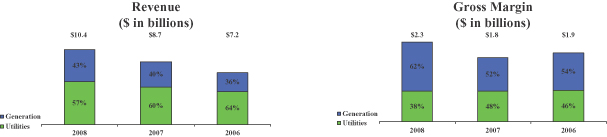
AES’s primary sources of revenue and gross margin today are from Generation and Utilities. These businesses are distinguished by the nature of the customers, operational differences, cost structure, regulatory environment and risk exposure. The breakout of revenue and gross margin between Generation and Utilities for the years ended December 31, 2008, 2007 and 2006, respectively is shown below.
Revenue
($ in billions)
Gross Margin
($ in billions)
| (1) | Utilities gross margin includes the margin from generation businesses owned by the Company and from whom the utility purchases energy. |
2
Generation
We currently own or operate a portfolio of approximately 38,000 MW, consisting of 93 Generation facilities in 26 countries on five continents at our generation businesses. We also have approximately 2,900 MW of capacity currently under construction in six countries. We are a major power source in many countries, such as Panama where we are the largest generator of electricity, and Chile, where AES Gener (“Gener”) is the second largest electricity generation company in terms of capacity. Our Generation business uses a wide range of technologies and fuel types including coal, combined-cycle gas turbines, hydroelectric power and biomass. Generation revenues were $8.3 billion, $6.6 billion and $5.4 billion for the years ended December 31, 2008, 2007 and 2006, respectively.
Performance drivers for our Generation businesses include, among other factors, plant reliability, fuel costs and fixed-cost management. Growth in the Generation business is largely tied to securing new power purchase agreements (“PPAs”), expanding capacity in our existing facilities and building new power plants.
The majority of the electricity produced by our Generation businesses is sold under long-term contracts, or PPAs, to wholesale customers. In 2008, approximately 61% of the revenue from our Generation business was from plants that operate under PPAs of five years or longer for 75% or more of their output capacity. These businesses often reduce their exposure to fuel supply risks by entering into long-term fuel supply contracts or fuel tolling contracts where the customer assumes full responsibility for purchasing and supplying the fuel to the power plant. These long-term contractual agreements result in relatively predictable cash flow and earnings and reduce exposure to volatility in the market price for electricity and fuel; however, the amount of earnings and cash flow predictability varies from business to business based on the degree to which its exposure is limited by the contracts it has negotiated.
Our Generation businesses with long-term contracts face most of their competition from other utilities and independent power producers (“IPPs”) prior to the execution of a power sales agreement during the development phase of a project or upon expiration of an existing agreement. Once a project is operational, we traditionally have faced limited competition due to the long-term nature of the generation contracts. However, as our existing contracts expire, the introduction of new competitive power markets has increased competition to attract new customers and maintain our current customer base.
The balance of our Generation business sells power through competitive markets under short-term contracts or directly in the spot market. As a result, the cash flows and earnings associated with these businesses are more sensitive to fluctuations in the market price for electricity, natural gas, coal and other fuels. However, for a number of these facilities, including our plants in New York, which include a fleet of coal fired plants, we have hedged the majority of our exposure to fuel, energy and emissions pricing for 2009. Competitive factors for these facilities include price, reliability, operational cost and third party credit requirements.
Utilities
AES utility businesses distribute power to over 11 million people in seven countries on five continents and consists primarily of 14 companies owned or operated under management agreements, each of which operate in defined service areas. These businesses also include 15 generation plants in two countries totaling approximately 4,400 MW. In addition, we have one generation plant under construction totaling 86 MW. These businesses have a variety of structures ranging from pure distribution businesses to fully integrated utilities, which generate, transmit and distribute power. Indianapolis Power & Light (“IPL”) has the exclusive right to provide retail services to approximately 470,000 customers in Indianapolis, Indiana. Eletropaulo Metropolitana Electricidad de São Paulo S.A (“AES Eletropaulo” or “Eletropaulo”), serving the São Paulo metropolitan region for over 100 years, has approximately six million customers and is the largest electricity distribution company in Brazil in terms of revenues and electricity distributed. In Cameroon, we are the primary generator and distributor of electricity and in El Salvador we provide distribution services to serve more than 80% of the country’s electricity customers. Utilities revenues were $7.8 billion, $6.9 billion and $6.2 billion for the years ended December 31, 2008, 2007 and 2006, respectively.
3
Performance drivers for Utilities include, but are not limited to, reliability of service; management of working capital; negotiation of tariff adjustments; compliance with extensive regulatory requirements; and in developing countries, reduction of commercial and technical losses. The results of operations of our Utilities businesses are sensitive to changes in economic growth and regulation and abnormal weather conditions in the area in which they operate.
Utilities face relatively little direct competition due to significant barriers to entry which are present in these markets. Where we do face competition is in our efforts to acquire existing businesses and develop new ones. In this arena, we compete against a number of other market participants, some of which have greater financial resources, have been engaged in distribution related businesses for longer periods of time and/or have accumulated more significant portfolios. Relevant competitive factors for our power distribution businesses include financial resources, governmental assistance, regulatory restrictions and access to non-recourse financing. In certain locations, our distribution businesses face increased competition as a result of changes in laws and regulations which allow wholesale and retail services to be provided on a competitive basis.
Renewables and Other Initiatives
In recent years, as demand for renewable sources of energy has grown, we have placed increasing emphasis on developing projects in wind, solar and other renewable initiatives including climate solutions projects In 2005, we started a wind generation business (“AES Wind Generation”), which currently has 16 plants in operation in three countries totaling over 1,200 MW and is one of the largest producers of wind power in the U.S. In addition, over 400 MW are under construction in four countries outside the U.S. In March 2008, we formed AES Solar Energy LLC (“AES Solar”), a joint venture with Riverstone Holdings, LLC (“Riverstone”), a private equity firm, which has since commenced commercial operations of eight plants totaling 24 MW of solar projects in Spain and has development potential in three other countries. In the area of climate solutions, we are developing and implementing projects to produce GHG credits and are currently developing projects in Asia, Europe and Latin America. In the U.S., we formed Greenhouse Gas Services, LLC as a joint venture with GE Energy Financial Services to create high quality verifiable emissions offsets for the voluntary U.S. market. We also formed a line of business to develop and implement utility scale energy storage systems (such as batteries), which store and release power when needed. While none of these initiatives are currently material to our operations, we believe that in the future, they may become a material contributor to our revenue and gross margin. However, there are risks associated with these initiatives, which are further disclosed in Item 1A—Risk Factors of the 2008 Form 10-K. As further described in “Our Organization and Segments” below, some of these projects are managed and reported within the region where they are located, while others are managed as separate business units and reported as set forth below.
Risks
We routinely encounter and address risks, some of which may cause our future results to be different, sometimes materially different, than we presently anticipate. The categories of risk we have identified in Item 1A—Risk Factors of the 2008 Form 10-K include the following:
| | • | | Risks associated with our operations in areas with extensive current and future governmental and environmental regulation; |
| | • | | Risks associated with our exposure to material litigation and regulatory proceedings; |
| | • | | Risks associated with our disclosure controls and internal controls over financial reporting; |
| | • | | Risks associated with our high levels of debt; |
| | • | | Risks associated with the operation of power plants; |
| | • | | Risks associated with revenue and earnings volatility; and |
| | • | | Risks associated with our ability to raise needed capital. |
4
The categories of risk identified above are discussed and explained in greater detail in Item 1A—Risk Factors of the 2008 Form 10-K. These risk factors should be read in conjunction with Management’s Discussion and Analysis of Financial Condition and Results of Operations (“MD&A”), and the Consolidated Financial Statements and related notes included elsewhere in this report.
Our Organization and Segments
We believe our broad geographic footprint allows us to focus development in targeted markets with opportunities for new investment, and provides stability through our presence in more developed regions. In addition, our presence in each region affords us important relationships and helps us identify local markets with attractive opportunities for new investment. As a result, we have structured our organization into geographic regions, and each region is led by a regional president responsible for managing existing businesses. The regional presidents report to our Chief Operating Officer (“COO”), who in turn reports to our Chief Executive Officer (“CEO”). Both our CEO and COO are based in Arlington, Virginia.
Through the end of 2008, and as reflected in the 2008 Form 10-K, we organized our operations for management and external reporting purposes along two primary lines of business—the generation of electricity (“Generation”) and the distribution of electricity (“Utilities”) within four geographic regions: Latin America; North America; Europe & Africa; and Asia & the Middle East (“Asia”). Three regions, North America, Latin America and Europe & Africa, engage in both Generation and Utility businesses. Our Asia region only has Generation. This regional management structure resulted in the Company reporting seven segments. The reportable segments included Latin America Generation, Latin America Utilities, North America Generation, North America Utilities, Europe & Africa Generation, Europe & Africa Utilities and Asia Generation.
In 2008, AES Wind Generation, solar, climate solutions and certain other renewable initiatives were managed by our alternative energy group. The associated revenue, development and operational costs were reported under “Corporate and Other” since the results were not material to the presentation of our reportable segments. “Corporate and Other” also included corporate overhead costs which were not directly associated with the operations of our seven reportable segments; interest income and expense and other intercompany charges such as self-insurance premiums which are fully eliminated in consolidation.
In early 2009, we implemented certain internal organizational changes in an effort to streamline the organization. These changes affected how results are reported internally for management review. The new management reporting structure continues to be organized along our two lines of business, but there are now three regions: (1) Latin America & Africa; (2) North America and AES Wind; and (3) Europe, Middle East & Asia (collectively “EMEA”), each managed by a regional president. The Company no longer has a separate alternative energy group. Instead, AES Wind Generation is managed within our North America region while climate solutions projects are now managed and reported within the region in which they are located. Key climate solutions initiatives include investments in GHG initiatives, projects to create emissions offsets for the voluntary U.S. market, projects that produce certified emission reduction credits (“CERs”) and initiatives related to utility-scale energy storage systems (such as batteries) which store and release power when needed. AES Solar is accounted for using the equity method and will continue to be reflected in “Corporate and Other.” In addition to the change in regional management structure, with the exception of AES Wind Development, the Company now manages all development efforts centrally through a development group.
The new segment reporting structure uses the Company’s management reporting structure as its foundation. The Company’s segment reporting structure is organized along our two lines of business and three regions to reflect how the Company manages the business internally. The Company applied the guidance in SFAS No. 131,Disclosures about Segments of an Enterprise and Related Information (“SFAS No. 131”), which provides certain quantitative thresholds and aggregation criteria, and the Company concluded that it now has six reportable segments. This new segment structure is reflected in this Current Report on Form 8-K. The operating segments comprising the former Europe & Africa Generation and Utilities reportable segments are no longer managed together. Under the new management structure Africa is managed with the Latin America region and Europe is
5
managed with the Asia region. Only Europe—Generation was determined to be a reportable segment based on the Company’s application of SFAS No. 131. As described below, our Europe Utilities, Africa Utilities and Africa Generation operating segments are now reported within “Corporate and Other” because they do not meet the criteria to allow for aggregation with another operating segment or the quantitative thresholds that would require separate disclosure under SFAS No. 131.
Therefore, as a result of this analysis, the Company now reports six segments, which include:
| | • | | Latin America—Generation; |
| | • | | Latin America—Utilities; |
| | • | | North America—Generation; |
| | • | | North America—Utilities; |
“Corporate and Other” now includes corporate overhead costs which are not directly associated with the operations of our six reportable segments, other intercompany charges such as self-insurance premiums which are fully eliminated in consolidation. In addition, “Corporate and Other” includes the operating results of the Company’s Europe Utilities, Africa Utilities and Africa Generation businesses, AES Wind and development and operational costs related to the development group. AES Solar is accounted for under the equity method of accounting, therefore its operating results are included in “Net Equity in Earnings of Affiliates,” not in “Corporate and Other.” None of these operating segments are currently material to our presentation of reportable segments, individually or in the aggregate.
Latin America
Our Latin America operations accounted for 65%, 64% and 62% of consolidated AES revenues in 2008, 2007 and 2006, respectively. The following table provides highlights of our Latin America operations:
| | |
Countries | | Argentina, Brazil, Chile, Colombia, Dominican Republic, El Salvador and Panama |
Generation Capacity | | 11,054 Gross MW |
Utilities Penetration | | 8.5 million customers (47,782 Gigawatt Hours (“GWh”)) |
Generation Facilities | | 53 (including 7 under construction) |
Utilities Businesses | | 8 |
Key Generation Businesses | | Gener, Tietê and Alicura |
Key Utilities Businesses | | Eletropaulo and Sul |
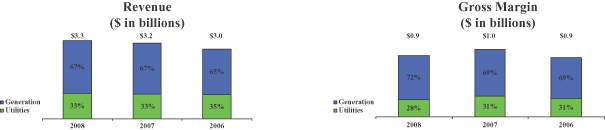
The graph below shows the breakdown between our Latin America Generation and Utilities segments as a percentage of total Latin America revenue and gross margin for the years ended December 31, 2008, 2007, and 2006. See Note 15—Segment and Geographic Information in the Consolidated Financial Statements in Item 8 of this Form 8-K for information on revenue from external customers, gross margin and total assets by segment.
6
Latin America Generation. Our largest generation business in Latin America, AES Tietê (“Tietê”), located in Brazil, represents approximately 15% of the total generation capacity in the state of São Paulo and is the ninth largest generator in Brazil. AES holds a 24% economic interest in Tietê. In Argentina, we are one of the largest private power generators contributing 12% of the country’s total power generation capacity. In Chile, we are the second largest generator of power. We currently have seven new generation plants under construction—five coal plants and one diesel plant in Chile and one hydro plant in Panama with a combined generation capacity of 1,715 MW.
Set forth below is a list of our Latin America Generation facilities:
Generation
| | | | | | | | | | | |
Business | | Location | | Fuel | | Gross MW | | AES Equity Interest
(Percent, Rounded) | | | Year
Acquired
or Began
Operation |
Alicura | | Argentina | | Hydro | | 1,050 | | 99 | % | | 2000 |
Central Dique | | Argentina | | Gas / Diesel | | 68 | | 51 | % | | 1998 |
Gener—TermoAndes | | Argentina | | Gas / Diesel | | 643 | | 71 | % | | 2000 |
Paraná-GT | | Argentina | | Gas | | 845 | | 99 | % | | 2001 |
Quebrada de Ullum (1) | | Argentina | | Hydro | | 45 | | 0 | % | | 2004 |
Rio Juramento—Cabra Corral | | Argentina | | Hydro | | 102 | | 99 | % | | 1995 |
Rio Juramento—El Tunal | | Argentina | | Hydro | | 10 | | 99 | % | | 1995 |
San Juan—Sarmiento | | Argentina | | Gas | | 33 | | 99 | % | | 1996 |
San Juan—Ullum | | Argentina | | Hydro | | 45 | | 99 | % | | 1996 |
San Nicolás | | Argentina | | Coal / Gas / Oil | | 675 | | 99 | % | | 1993 |
Tietê (2) | | Brazil | | Hydro | | 2,651 | | 24 | % | | 1999 |
Uruguaiana | | Brazil | | Gas | | 639 | | 46 | % | | 2000 |
Gener—Electrica Santiago (3) | | Chile | | Gas / Diesel | | 479 | | 64 | % | | 2000 |
Gener—Energía Verde (4) | | Chile | | Biomass / Diesel | | 49 | | 71 | % | | 2000 |
Gener—Gener (5) | | Chile | | Hydro / Coal / Diesel | | 807 | | 71 | % | | 2000 |
Gener—Guacolda | | Chile | | Coal / Pet Coke | | 304 | | 35 | % | | 2000 |
Gener—Norgener | | Chile | | Coal / Pet Coke | | 277 | | 71 | % | | 2000 |
Chivor | | Colombia | | Hydro | | 1,000 | | 71 | % | | 2000 |
Andres | | Dominican Republic | | Gas | | 319 | | 100 | % | | 2003 |
Itabo (6) | | Dominican Republic | | Coal | | 295 | | 50 | % | | 2000 |
Los Mina | | Dominican Republic | | Gas | | 236 | | 100 | % | | 1996 |
Bayano | | Panama | | Hydro | | 260 | | 49 | % | | 1999 |
Chiriqui—Esti | | Panama | | Hydro | | 120 | | 49 | % | | 2003 |
Chiriqui—La Estrella | | Panama | | Hydro | | 48 | | 49 | % | | 1999 |
Chiriqui—Los Valles | | Panama | | Hydro | | 54 | | 49 | % | | 1999 |
| | | | | | | | | | | |
| | | | | | 11,054 | | | | | |
| | | | | | | | | | | |
| (1) | AES operates this facility through management or operations and maintenance agreements and owns no equity interest in this facility |
| (2) | Tietê plants: Água Vermelha, Bariri, Barra Bonita, Caconde, Euclides da Cunha, Ibitinga, Limoeiro, Mog-Guaçu, Nova Avanhandava and Promissão |
| (3) | Gener—Electrica Santiago plants: Renca and Nueva Renca |
| (4) | Gener—Energia Verde Plants: Constitución, Laja and San Francisco de Mostazal |
| (5) | Gener—Gener plants: Ventanas, Laguna Verde, Laguna Verde Turbogas, Alfalfal, Maitenas, Queltehues, Volcán and Los Vientos |
| (6) | Itabo plants: Itabo complex (two coal-fired steam turbines and one gas-fired steam turbine) |
7
Generation under construction
| | | | | | | | | | | |
Business | | Location | | Fuel | | Gross MW | | AES Equity Interest
(Percent, Rounded) | | | Expected
Year of
Commercial
Operation |
Angamos | | Chile | | Coal | | 518 | | 71 | % | | 2011 |
Campiche | | Chile | | Coal | | 270 | | 71 | % | | 2011 |
Guacolda 3 | | Chile | | Coal | | 152 | | 35 | % | | 2009 |
Guacolda 4 | | Chile | | Coal | | 152 | | 35 | % | | 2010 |
Santa Lidia | | Chile | | Diesel | | 130 | | 71 | % | | 2009 |
Nueva Ventanas | | Chile | | Coal | | 270 | | 71 | % | | 2010 |
Changuinola I | | Panama | | Hydro | | 223 | | 83 | % | | 2011 |
| | | | | | | | | | | |
| | | | | | 1,715 | | | | | |
| | | | | | | | | | | |
Latin America Utilities. Each of our Utilities businesses in Latin America sells electricity under regulated tariff agreements and has transmission and distribution capabilities but none of them has generation capability. AES Eletropaulo, a consolidated subsidiary of which AES owns a 16% economic interest and which has served the São Paulo, Brazil area for over 100 years, has approximately six million customers and is the largest electricity distribution company in Brazil in terms of revenues and electricity distributed. Pursuant to its concession contract, AES Eletropaulo is entitled to distribute electricity in its service area until 2028. AES Eletropaulo’s service territory consists of 24 municipalities in the greater São Paulo metropolitan area and adjacent regions that account for approximately 15% of Brazil’s GDP and 44% of the population in the State of São Paulo, Brazil. AES Sul (“Sul”), a wholly owned subsidiary, serves over one million customers. In El Salvador, our Utilities businesses provide electricity to over 80% of the country, serving approximately one million customers.
Set forth below is a list of our Latin America Utilities facilities:
Distribution
| | | | | | | | | | | |
Business | | Location | | Approximate Number
of Customers Served
as of 12/31/2008 | | GWh Sold in
2008 | | AES Equity Interest
(Percent, Rounded) | | | Year
Acquired |
Edelap | | Argentina | | 311,000 | | 2,363 | | 90 | % | | 1998 |
Edes | | Argentina | | 163,000 | | 721 | | 90 | % | | 1997 |
Eletropaulo | | Brazil | | 5,832,000 | | 33,860 | | 16 | % | | 1998 |
Sul | | Brazil | | 1,128,000 | | 7,574 | | 100 | % | | 1997 |
CAESS | | El Salvador | | 507,000 | | 1,942 | | 75 | % | | 2000 |
CLESA | | El Salvador | | 292,000 | | 793 | | 64 | % | | 1998 |
DEUSEM | | El Salvador | | 59,000 | | 105 | | 74 | % | | 2000 |
EEO | | El Salvador | | 217,000 | | 424 | | 89 | % | | 2000 |
| | | | | | | | | | | |
| | | | 8,509,000 | | 47,782 | | | | | |
| | | | | | | | | | | |
In addition to the facilities identified in the table above, our Latin America Utilities segment includes AgCert and Nejapa, climate solutions projects that produce CER and GHG credits.
8
North America
Our North America operations accounted for 21%, 24% and 26% of consolidated revenues in 2008, 2007 and 2006, respectively. The following table provides highlights of our North America operations:
| | |
Countries | | U.S., Puerto Rico and Mexico |
Generation Capacity | | 13,368 Gross MW |
Utilities Penetration | | 470,000 customers (16,192 GWh) |
Generation Facilities | | 20 |
Utilities Businesses | | 1 Integrated Utility (includes 4 generation plants) |
Key Generation Businesses | | Eastern Energy (NY), Southland and TEG/TEP |
Key Utilities Businesses | | IPL |
The graph below shows the breakdown between our North America Generation and Utilities segments as a percentage of total North America revenue and gross margin for the years ended December 31, 2008, 2007, and 2006. See Note 15—Segment and Geographic Information in the Consolidated Financial Statements in Item 8 of this Form 8-K for information on revenue from external customers, gross margin and total assets by segment.
North America Generation. Approximately 60% of the generation capacity sold to third parties is supported by long-term power purchase or tolling agreements. Our North America Generation businesses consist of seven gas-fired, ten coal-fired and three petroleum coke-fired plants in the United States, Puerto Rico and Mexico.
Four of our coal-fired plants, Cayuga, Greenridge, Somerset and Westover, representing capacity of 1,268 MW, operate together as one business, AES Eastern Energy. This business provides power to the Western New York power market under short-term contracts, as well as in the spot electricity market. We also operate three gas-fired plants, representing capacity of 4,327 MW, in the Los Angeles basin under a long-term tolling agreement. These plants are also operated as one business, AES Southland.
9
Set forth below is a list of our North America Generation facilities:
Generation
| | | | | | | | | | | |
Business | | Location | | Fuel | | Gross MW | | AES Equity Interest
(Percent, Rounded) | | | Year
Acquired
or Began
Operation |
Mérida III | | Mexico | | Gas | | 484 | | 55 | % | | 2000 |
Termoelectrica del Golfo (TEG) | | Mexico | | Pet Coke | | 230 | | 99 | % | | 2007 |
Termoelectrica del Peñoles (TEP) | | Mexico | | Pet Coke | | 230 | | 99 | % | | 2007 |
Placerita | | USA - CA | | Gas | | 120 | | 100 | % | | 1989 |
Southland—Alamitos | | USA - CA | | Gas | | 2,047 | | 100 | % | | 1998 |
Southland—Huntington Beach | | USA - CA | | Gas | | 904 | | 100 | % | | 1998 |
Southland—Redondo Beach | | USA - CA | | Gas | | 1,376 | | 100 | % | | 1998 |
Thames | | USA - CT | | Coal | | 208 | | 100 | % | | 1990 |
Hawaii | | USA - HI | | Coal | | 203 | | 100 | % | | 1992 |
Warrior Run | | USA - MD | | Coal | | 205 | | 100 | % | | 2000 |
Red Oak | | USA - NJ | | Gas | | 832 | | 100 | % | | 2002 |
Cayuga | | USA - NY | | Coal | | 306 | | 100 | % | | 1999 |
Greenidge | | USA - NY | | Coal | | 161 | | 100 | % | | 1999 |
Somerset | | USA - NY | | Coal | | 675 | | 100 | % | | 1999 |
Westover | | USA - NY | | Coal | | 126 | | 100 | % | | 1999 |
Shady Point | | USA - OK | | Coal | | 320 | | 100 | % | | 1991 |
Beaver Valley | | USA - PA | | Coal | | 125 | | 100 | % | | 1985 |
Ironwood | | USA - PA | | Gas | | 710 | | 100 | % | | 2001 |
Puerto Rico | | USA - PR | | Coal | | 454 | | 100 | % | | 2002 |
Deepwater | | USA - TX | | Pet Coke | | 160 | | 100 | % | | 1986 |
| | | | | | | | | | | |
| | | | | | 9,876 | | | | | |
| | | | | | | | | | | |
In addition to the facilities identified in the table above, our North America Generation segment also includes climate solutions projects including Greenhouse Gas Services, LLC, a joint venture formed with GE Energy Financial Services to create high quality verifiable emissions offsets for the voluntary U.S. market, and a line of business formed to develop and implement utility-scale energy storage systems (such as batteries), which store and release power when needed.
North America Utilities. AES has one integrated utility in North America, IPL, which it owns through IPALCO Enterprises Inc. (“IPALCO”), the parent holding company of IPL. IPL generates, transmits, distributes and sells electricity to approximately 470,000 customers in the city of Indianapolis and neighboring areas within the state of Indiana. IPL owns and operates four generation facilities that provide essentially all of the electricity it distributes. The two largest generation facilities are primarily coal-fired plants. The third facility has a combination of units that use coal (base load capacity) and natural gas and/or oil (peaking capacity). The fourth facility is a small peaking station that uses gas-fired combustion turbine technology. IPL’s gross generation capability is 3,492 MW. More than half of IPL’s coal is provided by one supplier with which IPL has long-term contracts. A key driver for the business is tariff recovery for environmental projects through the rate adjustment process. IPL’s customers include residential, industrial, commercial and all other which made up 36%, 40%, 16% and 8%, respectively, of North America Utilities revenue for 2008.
10
IPL’s generation facilities
| | | | | | | | | | | |
Business | | Location | | Fuel | | Gross MW | | AES Equity Interest
(Percent, Rounded) | | | Year
Acquired
or Began
Operation |
IPL (1) | | USA - IN | | Coal/Gas/Oil | | 3,492 | | 100 | % | | 2001 |
| (1) | IPL plants: Eagle Valley, Georgetown, Harding Street and Petersburg |
Distribution
| | | | | | | | | | | |
Business | | Location | | Approximate Number
of Customers Served
as of 12/31/2008 | | GWh Sold in
2008 | | AES Equity Interest
(Percent, Rounded) | | | Year
Acquired |
IPL | | USA - IN | | 470,000 | | 16,192 | | 100 | % | | 2001 |
Europe
The following table provides highlights of our Europe operations:
| | |
Countries | | Czech Republic, Hungary, Kazakhstan, Netherlands, Spain, U.K., Turkey and Ukraine |
Generation Capacity | | 10,185 Gross MW |
Utilities Penetration | | 1.8 million customers (9,296 GWh) |
Generation Facilities | | 19 (including 5 under construction) |
Utilities Businesses | | 4 |
Key Generation Businesses | | Kilroot, Tisza II |
Key Utilities Businesses | | Kyivoblenergo and Rivneenergo |
Our Utilities operations in Europe are discussed further under Corporate and Other below.
Europe Generation. Our Generation operations in Europe accounted for 7%, 7% and 7% of our consolidated revenues in 2008, 2007 and 2006, respectively. In 2006, we began commercial operation of AES Cartagena (“Cartagena”), our first power plant in Spain, with 1,199 MW capacity. The results of operations for Cartagena, an unconsolidated entity, are included in the Equity in Earnings of Affiliates line item on the Consolidated Statements of Operations and therefore not reflected in these segment operating results. Today, AES operates five power plants in Kazakhstan which account for almost 30% of the country’s total installed generation capacity. In 2008, we completed the sale of a generation plant and a coal mine in Kazakhstan, which we continue to operate under a management agreement through 2010. See Note 15—Segment and Geographic Information in the Consolidated Financial Statements in Item 8 of this Form 8-K for revenue, gross margin and total assets by segment. Key business drivers of this segment are: foreign currency exchange rates, new legislation and regulations including those related to the environment.
11
Set forth below is a list of our Europe Generation facilities:
Generation
| | | | | | | | | | | |
Business(1)(3) | | Location | | Fuel | | Gross MW | | AES Equity Interest
(Percent, Rounded) | | | Year
Acquired
or Began
Operation |
Bohemia | | Czech Republic | | Coal/Biomass | | 50 | | 100 | % | | 2001 |
Borsod | | Hungary | | Biomass/Coal | | 56 | | 100 | % | | 1996 |
Tisza II | | Hungary | | Gas/Oil | | 900 | | 100 | % | | 1996 |
Tiszapalkonya | | Hungary | | Coal/Biomass | | 116 | | 100 | % | | 1996 |
Ekibastuz (2)(3) | | Kazakhstan | | Coal | | 4,000 | | 0 | % | | 1996 |
Shulbinsk HPP (2)(4) | | Kazakhstan | | Hydro | | 702 | | 0 | % | | 1997 |
Sogrinsk CHP | | Kazakhstan | | Coal | | 301 | | 100 | % | | 1997 |
Ust—Kamenogorsk HPP (2)(4) | | Kazakhstan | | Hydro | | 331 | | 0 | % | | 1997 |
Ust—Kamenogorsk CHP | | Kazakhstan | | Coal | | 1,354 | | 100 | % | | 1997 |
Elsta | | Netherlands | | Gas | | 630 | | 50 | % | | 1998 |
Cartagena | | Spain | | Gas | | 1,199 | | 71 | % | | 2006 |
Girlevik II-Mercan | | Turkey | | Hydro | | 12 | | 51 | % | | 2007 |
Yukari-Mercan | | Turkey | | Hydro | | 14 | | 51 | % | | 2007 |
Kilroot | | United Kingdom | | Coal / Oil | | 520 | | 99 | % | | 1992 |
| | | | | | | | | | | |
| | | | | | 10,185 | | | | | |
| | | | | | | | | | | |
| (1) | AES additionally manages the Maikuben West coal mine in Kazakhstan, supplying coal to AES businesses and third parties. |
| (2) | AES manages these facilities through management or O&M agreements and owns no equity interest in these businesses. |
| (3) | AES completed the sale of its indirect wholly-owned subsidiaries, the Ekibastuz generation plant and the Maikuben West coal mine in May 2008. AES now operates the facilities under a management agreement through 2010. |
| (4) | AES operates these facilities under concession agreements until 2017. |
Generation under construction
| | | | | | | | | | | |
Business | | Location | | Fuel | | Gross MW | | AES Equity Interest
(Percent, Rounded) | | | Expected
Year of
Commercial
Operation |
I.C. Energy (1) | | Turkey | | Hydro | | 62 | | 51 | % | | 2010 |
Maritza East I | | Bulgaria | | Coal | | 670 | | 100 | % | | 2010 |
Kilroot OCGT | | United Kingdom | | Diesel | | 80 | | 99 | % | | 2009 |
| | | | | | | | | | | |
| | | | | | 812 | | | | | |
| | | | | | | | | | | |
| (1) | Joint Venture with I.C. Energy. I.C. Energy Plants: Damlapinar Konya, Kepezkaya Konya, and Kumkoy Samsun. The joint venture is an unconsolidated entity and accounted for under the equity method of accounting. |
12
Asia
Our Asia operations accounted for 8%, 6% and 6% of consolidated revenues in 2008, 2007 and 2006, respectively. Asia’s Generation business operates 13 power plants with a total capacity of 5,664 MW in eight countries and has one power plant under construction. In Asia, AES operates generation facilities only. See Note 15—Segment and Geographic Information in the Consolidated Financial Statements in Item 8 of this Form 8-K for revenue, gross margin and total assets by segment. The following table provides highlights of our Asia operations:
| | |
Countries | | China, Qatar, Pakistan, Oman, India, the Philippines, Sri Lanka and Jordan |
Generation Capacity | | 5,664 Gross MW |
Utilities Penetration | | N/A |
Generation Facilities | | 13 (including 1 under construction) |
Utilities Facilities | | None |
Key Businesses | | Yangcheng, Masinloc, Pak Gen and Lal Pir |
Asia Generation. Almost half of our generation capacity in Asia is located in China. In 1996, AES joined with Chinese partners to build Yangcheng, the first “coal-by-wire” power plant with the capacity of 2,100 MW. In 2003, AES started commercial operations of its combined power and desalination water facility in Oman, the first of its kind. We also have a combined power and desalination water facility, the first such facility to be awarded to the private sector, in Qatar. This facility generates over 18% of the country’s peak system capacity and 23% of the country’s water supply. In April 2008, the Company completed the purchase of a 92% interest in a 660 MW coal-fired thermal power generation facility in Masinloc, Philippines (“Masinloc”). AES Amman East (“Amman East”) is a 380 MW combined-cycle gas power plant under construction in Jordan. Amman East achieved simple cycle commercial operation in 2008 and is expected to achieve combined cycle operation in 2009.
Set forth below is a list of our generation facilities in Asia:
Generation
| | | | | | | | | | | |
Business | | Location | | Fuel | | Gross MW | | AES Equity Interest
(Percent, Rounded) | | | Year
Acquired
or Began
Operation |
Aixi | | China | | Coal | | 51 | | 71 | % | | 1998 |
Chengdu | | China | | Gas | | 50 | | 35 | % | | 1997 |
Cili | | China | | Hydro | | 26 | | 51 | % | | 1994 |
Wuhu | | China | | Coal | | 250 | | 25 | % | | 1996 |
Yangcheng | | China | | Coal | | 2,100 | | 25 | % | | 2001 |
OPGC | | India | | Coal | | 420 | | 49 | % | | 1998 |
Barka | | Oman | | Gas | | 456 | | 35 | % | | 2003 |
Lal Pir | | Pakistan | | Oil | | 362 | | 55 | % | | 1997 |
Pak Gen | | Pakistan | | Oil | | 365 | | 55 | % | | 1998 |
Masinloc | | Philippines | | Coal | | 660 | | 92 | % | | 2008 |
Ras Laffan | | Qatar | | Gas | | 756 | | 55 | % | | 2003 |
Kelanitissa | | Sri Lanka | | Diesel | | 168 | | 90 | % | | 2003 |
| | | | | | | | | | | |
| | | | | | 5,664 | | | | | |
| | | | | | | | | | | |
13
Generation under construction
| | | | | | | | | | | |
Business | | Location | | Fuel | | Gross MW | | AES Equity Interest
(Rounded) | | | Expected
Year of
Commercial
Operation |
Amman East(1) | | Jordan | | Gas | | 380 | | 37 | % | | 2009 |
| (1) | Construction of the Amman East power plant commenced in May 2007. |
Corporate and Other
“Corporate and Other” includes general and administrative expenses related to corporate staff functions and initiatives, executive management, finance, legal, human resources and information systems which are not allocable to our business segments and the effects of eliminating transactions, such as self insurance charges, between the operating segments and corporate. In addition, this category includes the net operating results from our Generation and Utilities businesses in Africa, Utilities businesses in Europe and AES Wind and other renewables projects and costs associated with our development group. These operations are immaterial for the purposes of separate segment disclosure. See Note 15—Segment and Geographic Information in the Consolidated Financial Statements in Item 8 of this Form 8-K for information on revenue from external customers, gross margin and total assets by segment.
In March 2008, we formed a joint venture called AES Solar LLC with Riverstone, a private equity firm to develop, own and operate solar installations. The joint venture is an unconsolidated entity and accounted for under the equity method of accounting. Since its launch, AES Solar has commenced commercial operations of 24 MW of solar projects in Spain and has development potential in three other countries.
Europe Utilities.Our distribution businesses in the Ukraine and Kazakhstan together serve approximately 1.8 million customers.
Distribution
| | | | | | | | | | | |
Business | | Location | | Approximate
Number of
Customers
Served as of
12/31/2008 | | GWh Sold in
2008 | | AES Equity Interest
(Percent, Rounded) | | | Year
Acquired |
Kievoblenergo | | Ukraine | | 835,000 | | 4,161 | | 89 | % | | 2001 |
Rivneenergo | | Ukraine | | 405,000 | | 1,791 | | 81 | % | | 2001 |
Eastern Kazakhstan REC(1)(2) | | Kazakhstan | | 459,000 | | 3,444 | | 0 | % | | |
Ust-Kamenogorsk Heat Nets(1)(3) | | Kazakhstan | | 96,000 | | — | | 0 | % | | |
| | | | | | | | | | | |
| | | | 1,795,000 | | 9,396 | | | | | |
| | | | | | | | | | | |
| (1) | AES operates these facilities through management agreements and owns no equity interest in these businesses. |
| (2) | Shygys Energo Trade, a retail electricity company, is 100% owned by Eastern Kazakhstan REC (“EK REC”) and purchases distribution service from EK REC and electricity in the wholesale electricity market and resells to the distributions customers of EK REC. |
| (3) | Ust-Kamenogorsk Heat Nets provide transmission and distribution of heat with a total heat generating capacity of 224 Gcal. |
Africa Generation.Generation capacity in Africa consists of Ebute, a 304 MW plant in Nigeria.
14
Generation
| | | | | | | | | | | |
Business | | Location | | Fuel | | Gross MW | | AES Equity Interest
(Percent, Rounded) | | | Year
Acquired or
Began
Operation |
Ebute | | Nigeria | | Gas | | 304 | | 95 | % | | 2001 |
Generation under construction
| | | | | | | | | | | |
Business | | Location | | Fuel | | Gross MW | | AES Equity Interest
(Percent, Rounded) | | | Expected
Year of
Commercial
Operation |
Dibamba | | Cameroon | | Heavy Fuel Oil | | 86 | | 56 | % | | 2009 |
Africa Utilities.AES acquired a 56% interest in an integrated utility Société Nationale d’Electricité (“Sonel”) in 2001. Sonel generates, transmits and distributes electricity to over half a million people and is the sole source of electricity in Cameroon.
Set forth below is a list of the generation facilities and distribution businesses in Africa:
Sonel’s generation facilities
| | | | | | | | | | | |
Business | | Location | | Fuel | | Gross MW | | AES Equity Interest
(Percent, Rounded) | | | Year
Acquired or
Began
Operation |
Sonel(1) | | Cameroon | | Hydro/Diesel/Heavy
Fuel Oil | | 927 | | 56 | % | | 2001 |
| (1) | Sonel plants: Bafoussam, Bassa, Djamboutou, Edéa, Lagdo, Logbaba I, Limbé, Mefou, Oyomabang I, Oyomabang II and Song Loulou, and other small remote network units |
Distribution
| | | | | | | | | | | |
Business | | Location | | Approximate
Number of
Customers
Served as of
12/31/2008 | | GWh Sold in
2008 | | AES Equity Interest
(Percent, Rounded) | | | Year
Acquired |
Sonel | | Cameroon | | 571,000 | | 3,360 | | 56 | % | | 2001 |
Wind Generation. We own and operate 1,060 MW of wind generation capacity and operate an additional 215 MW capacity through operating and management agreements. Our wind business is located primarily in North America where we operate wind generation facilities that have generation capacity of 1,174 MW. Buffalo Gap III, a 170 MW capacity wind farm, commenced commercial operations in August 2008.
15
Set forth below is a list of AES Wind Generation facilities:
Generation
| | | | | | | | | | | |
Business | | Location | | Fuel | | Gross MW | | AES Equity Interest
(Percent, Rounded) | | | Year
Acquired or
Began
Operation |
Hulunbeier(1) | | China | | Wind | | 50 | | 49 | % | | 2008 |
InnoVent | | France | | Wind | | 30 | | 40 | % | | 2007 |
Hargicourt | | France | | Wind | | 12 | | 40 | % | | 2008 |
Hescamps | | France | | Wind | | 5 | | 40 | % | | 2008 |
Plechatel | | France | | Wind | | 4 | | 40 | % | | 2008 |
Altamont | | USA - CA | | Wind | | 43 | | 100 | % | | 2005 |
Mountain View I & II(2) | | USA - CA | | Wind | | 67 | | 100 | % | | 2008 |
Palm Springs | | USA - CA | | Wind | | 30 | | 100 | % | | 2006 |
Tehachapi | | USA - CA | | Wind | | 58 | | 100 | % | | 2006 |
Storm Lake II(2) | | USA - IA | | Wind | | 80 | | 100 | % | | 2007 |
Lake Benton I(2) | | USA - MN | | Wind | | 107 | | 100 | % | | 2007 |
Condon(2) | | USA - OR | | Wind | | 50 | | 100 | % | | 2005 |
Buffalo Gap I(2) | | USA - TX | | Wind | | 121 | | 100 | % | | 2006 |
Buffalo Gap II(2) | | USA - TX | | Wind | | 233 | | 100 | % | | 2007 |
Buffalo Gap III (2) | | USA - TX | | Wind | | 170 | | 100 | % | | 2008 |
Wind generation facilities(3) | | USA | | Wind | | 215 | | 0 | % | | 2005 |
| | | | | | | | | | | |
| | | | | | 1,275 | | | | | |
| | | | | | | | | | | |
| (1) | Joint Venture with Guohua Energy Investment Co. Ltd. |
| (2) | AES owns these assets together with third party tax equity investors with variable ownership interests. The tax equity investors receive a portion of the economic attributes of the facilities, including tax attributes, that vary over the life of the projects. The proceeds from the issuance of tax equity are recorded as Noncontrolling Interest in the Company’s consolidated balance sheet. |
| (3) | AES operates these facilities through management or O&M agreements and owns no equity interest in these businesses. |
AES Wind Generation projects under construction
| | | | | | | | | | | |
Business | | Location | | Fuel | | Gross MW | | AES Equity Interest
(Percent, Rounded) | | | Expected
Year of
Commercial
Operation |
St. Nikolas | | Bulgaria | | Wind | | 156 | | 89 | % | | 2009 |
Guohua Energ Investment Co. Ltd.(1) | | China | | Wind | | 198 | | 49 | % | | 2009-2010 |
InnoVent(2) | | France | | Wind | | 34 | | 40 | % | | 2009 |
North Rhins | | Scotland | | Wind | | 22 | | 51 | % | | 2009 |
| | | | | | | | | | | |
| | | | | | 410 | | | | | |
| | | | | | | | | | | |
| (1) | Joint Ventures with Guohua Energy Investment Co. Ltd. Huanghua I & II, Chenbáerhe and Xinaèrhue. |
| (2) | InnoVent plants: Frenouville, Audrieu, Boisbergues, Gapree and Croixrault-Moyencourt. |
16
Financial Data by Country
The table below presents information about our consolidated operations and long-lived assets, by country, for each of the three years ended December 31, 2008, 2007 and 2006, respectively. Revenues are recognized in the country in which they are earned and assets are reflected in the country in which they are located.
| | | | | | | | | | | | | | | |
| | | Revenues | | Property, Plant &
Equipment, net |
| | | 2008 | | 2007 | | 2006 | | 2008 | | 2007 |
| | | (in millions) |
United States | | $ | 2,745 | | $ | 2,641 | | $ | 2,573 | | $ | 6,936 | | $ | 6,448 |
| | | | | | | | | | | | | | | |
Non-U.S. | | | | | | | | | | | | | | | |
Brazil | | | 5,501 | | | 4,748 | | | 4,119 | | | 4,206 | | | 5,369 |
Chile | | | 1,349 | | | 1,011 | | | 594 | | | 1,540 | | | 968 |
Argentina | | | 949 | | | 678 | | | 542 | | | 446 | | | 450 |
Pakistan | | | 607 | | | 396 | | | 318 | | | 204 | | | 265 |
Dominican Republic | | | 601 | | | 476 | | | 357 | | | 634 | | | 651 |
El Salvador | | | 484 | | | 479 | | | 437 | | | 255 | | | 249 |
Hungary | | | 466 | | | 344 | | | 304 | | | 211 | | | 241 |
Mexico | | | 463 | | | 399 | | | 185 | | | 819 | | | 838 |
Ukraine | | | 403 | | | 330 | | | 269 | | | 78 | | | 104 |
Cameroon | | | 379 | | | 330 | | | 300 | | | 579 | | | 504 |
United Kingdom | | | 342 | | | 235 | | | 222 | | | 308 | | | 383 |
Colombia | | | 291 | | | 213 | | | 184 | | | 395 | | | 393 |
Puerto Rico | | | 251 | | | 245 | | | 234 | | | 622 | | | 620 |
Kazakhstan | | | 234 | | | 284 | | | 215 | | | 56 | | | 52 |
Panama | | | 210 | | | 175 | | | 144 | | | 715 | | | 582 |
Sri Lanka | | | 184 | | | 123 | | | 92 | | | 79 | | | 83 |
Qatar | | | 161 | | | 178 | | | 169 | | | 526 | | | 552 |
Philippines(1) | | | 148 | | | — | | | — | | | 731 | | | — |
Oman | | | 105 | | | 105 | | | 114 | | | 321 | | | 331 |
Bulgaria(2) | | | — | | | — | | | 1 | | | 1,329 | | | 542 |
Other Non-U.S. | | | 197 | | | 126 | | | 136 | | | 413 | | | 349 |
| | | | | | | | | | | | | | | |
Total Non-U.S. | | | 13,325 | | | 10,875 | | | 8,936 | | | 14,467 | | | 13,526 |
| | | | | | | | | | | | | | | |
Total | | $ | 16,070 | | $ | 13,516 | | $ | 11,509 | | $ | 21,403 | | $ | 19,974 |
| | | | | | | | | | | | | | | |
| (1) | Acquired in May 2008, revenues represent results for a partial year. |
| (2) | Currently under development, facility is not operational at this time. |
17
| ITEM 6. | SELECTED FINANCIAL DATA |
The following table sets forth our selected financial data as of the dates and for the periods indicated. You should read this data together with Item 7 Management’s Discussion and Analysis of Financial Condition and Results of Operations and the Consolidated Financial Statements and the notes thereto included in Item 8 in this Form 8-K. The selected financial data for each of the years in the five year period ended December 31, 2008 have been derived from our audited Consolidated Financial Statements. Our historical results are not necessarily indicative of our future results.
Acquisitions, disposals, reclassifications and changes in accounting principles affect the comparability of information included in the tables below. Please refer to the Notes to the Consolidated Financial Statements included in Item 8 Financial Statements and Supplementary Data of this Form 8-K for further explanation of the effect of such activities. Please also refer to Item 1A Risk Factors of the 2008 Form 10-K and Note 24—Risks and Uncertainties to the Consolidated Financial Statements included in Item 8 of this Form 8-K for certain risks and uncertainties that may cause the data reflected herein not to be indicative of our future financial condition or results of operations.
SELECTED FINANCIAL DATA
| | | | | | | | | | | | | | | | | | | | |
| | | Year Ended December 31, | |
| Statement of Operations Data | | 2008 | | | 2007 | | | 2006 | | | 2005 | | | 2004 | |
| | | (in millions, except per share amounts) | |
Revenues | | $ | 16,070 | | | $ | 13,516 | | | $ | 11,509 | | | $ | 10,183 | | | $ | 8,667 | |
Income from continuing operations attributable to The AES Corporation | | | 1,216 | | | | 487 | | | | 168 | | | | 355 | | | | 172 | |
Discontinued operations, net of tax | | | 18 | | | | (582 | ) | | | 58 | | | | 198 | | | | 143 | |
Extraordinary items, net of tax | | | — | | | | — | | | | 21 | | | | — | | | | — | |
Cumulative effect of change in accounting principle, net of tax | | | — | | | | — | | | | — | | | | (4 | ) | | | — | |
| | | | | | | | | | | | | | | | | | | | |
Net income (loss) attributable to The AES Corporation | | $ | 1,234 | | | $ | (95 | ) | | $ | 247 | | | $ | 549 | | | $ | 315 | |
| | | | | | | | | | | | | | | | | | | | |
Basic (loss) earnings per share: | | | | | | | | | | | | | | | | | | | | |
Income from continuing operations attributable to The AES Corporation, net of tax | | $ | 1.82 | | | $ | 0.73 | | | $ | 0.25 | | | $ | 0.54 | | | $ | 0.27 | |
Discontinued operations, net of tax | | | 0.02 | | | | (0.87 | ) | | | 0.09 | | | | 0.31 | | | | 0.22 | |
Extraordinary items, net of tax | | | — | | | | — | | | | 0.03 | | | | — | | | | — | |
Cumulative effect of change in accounting principle, net of tax | | | — | | | | — | | | | — | | | | (0.01 | ) | | | — | |
| | | | | | | | | | | | | | | | | | | | |
Basic earnings (loss) per share | | $ | 1.84 | | | $ | (0.14 | ) | | $ | 0.37 | | | $ | 0.84 | | | $ | 0.49 | |
| | | | | | | | | | | | | | | | | | | | |
Diluted (loss) earnings per share: | | | | | | | | | | | | | | | | | | | | |
Income from continuing operations attributable to The AES Corporation, net of tax | | $ | 1.80 | | | $ | 0.72 | | | $ | 0.25 | | | $ | 0.53 | | | $ | 0.27 | |
Discontinued operations, net of tax | | | 0.02 | | | | (0.86 | ) | | | 0.09 | | | | 0.31 | | | | 0.22 | |
Extraordinary items, net of tax | | | — | | | | — | | | | 0.03 | | | | — | | | | — | |
Cumulative effect of change in accounting principle, net of tax | | | — | | | | — | | | | — | | | | (0.01 | ) | | | — | |
| | | | | | | | | | | | | | | | | | | | |
Diluted earnings (loss) per share | | $ | 1.82 | | | $ | (0.14 | ) | | $ | 0.37 | | | $ | 0.83 | | | $ | 0.49 | |
| | | | | | | | | | | | | | | | | | | | |
| |
| | | December 31, | |
| Balance Sheet Data: | | 2008 | | | 2007 | | | 2006 | | | 2005 | | | 2004 | |
| | | (in millions) | |
Total assets | | $ | 34,806 | | | $ | 34,453 | | | $ | 31,274 | | | $ | 29,025 | | | $ | 28,449 | |
Non-recourse debt (long-term) | | $ | 11,869 | | | $ | 11,293 | | | $ | 9,840 | | | $ | 10,308 | | | $ | 10,563 | |
Non-recourse debt (long-term)-Discontinued operations | | $ | — | | | $ | 37 | | | $ | 342 | | | $ | 467 | | | $ | 750 | |
Recourse debt (long-term) | | $ | 4,994 | | | $ | 5,332 | | | $ | 4,790 | | | $ | 4,682 | | | $ | 5,010 | |
Accumulated deficit | | $ | (8 | ) | | $ | (1,241 | ) | | $ | (1,093 | ) | | $ | (1,340 | ) | | $ | (1,889 | ) |
The AES Corporation stockholders’ equity | | $ | 3,669 | | | $ | 3,164 | | | $ | 2,979 | | | $ | 1,583 | | | $ | 997 | |
18
| ITEM 7. | MANAGEMENT’S DISCUSSION AND ANALYSIS OF FINANCIAL CONDITION AND RESULTS OF OPERATIONS |
Overview of Our Business
AES is a global power company. We own or operate a portfolio of electricity generation and distribution businesses with generation capacity totaling approximately 43,000 MW and distribution networks serving over 11 million people. In addition, we have more than 3,000 MW under construction in ten countries. Our global footprint includes operations in 29 countries on five continents with 83% of our revenue in 2008 generated outside the United States.
We operate two primary lines of business. The first is our Generation business, where we own and/or operate power plants to generate and sell power to wholesale customers such as utilities and other intermediaries. The second is our Utilities business, where we own and/or operate utilities to distribute, transmit and sell electricity to end-user customers in the residential, commercial, industrial and governmental sectors within a defined service area. Each of our primary lines of business generates approximately half of our revenues.
We are also continuing to expand our wind generation business and are pursuing additional renewables projects in solar, climate solutions, biomass and energy storage. These initiatives are not material contributors to our revenue, gross margin or income, but we believe that they may become material in the future.
Generation. We currently own or operate a portfolio of approximately 38,000 MW, consisting of 93 facilities in 26 countries on five continents at our generation businesses. We also have approximately 2,900 MW of capacity currently under construction in six countries. Our core Generation businesses use a wide range of technologies and fuel types including coal, combined-cycle gas turbines, hydroelectric power and biomass.
The majority of the electricity produced by our Generation businesses is sold under long-term contracts, or PPAs, to wholesale customers. Approximately 61% of the revenues from our Generation businesses during 2008 was derived from plants that operate under PPAs of five years or longer for 75% or more of their output capacity. These businesses often reduce their exposure to fuel supply risks by entering into long-term fuel supply contracts or fuel tolling contracts where the customer assumes full responsibility for purchasing and supplying the fuel to the power plant. These long-term contractual agreements result in relatively predictable cash flow and earnings and reduce exposure to volatility in the market price for electricity and fuel; however, the amount of earnings and cash flow predictability varies from business to business based on the degree to which its exposure is limited by the contracts that it has negotiated.
The balance of our Generation businesses sell power through competitive markets under short-term contracts or directly in the spot market. As a result, the cash flows and earnings associated with these businesses are more sensitive to fluctuations in the market price for electricity, natural gas, coal and other fuels. However, for a number of these facilities, including our plants in New York, which include a fleet of coal fired plants, we have hedged the majority of our exposure to fuel, energy and emissions pricing for 2009.
Utilities. Our Utilities businesses distribute power to more than 11 million people in seven countries on five continents. Our Utilities business consists primarily of 14 companies owned and/or operated under management agreements, all of which operate in a defined service area. These businesses also include 15 generation plants in two countries totaling approximately 4,400 MW. In addition, we have one generation plant under construction totaling 86 MW. These businesses have a variety of structures ranging from pure distribution businesses to fully integrated utilities, which generate, transmit and distribute power.
Renewables and Other Initiatives. In recent years, as demand for renewable sources of energy has grown, we have placed increasing emphasis on developing projects in wind, solar, energy storage and the creation of carbon offsets. AES Wind Generation, which is one of the largest producers of wind power in the U.S., has
19
16 wind generation facilities in three countries with over 1,200 MW in operation and 11 wind generation facilities under construction in four countries. AES Solar, our joint venture with Riverstone Holdings, was formed to develop, own and operate utility-scale photo voltaic (PV) solar installations. Since its launch, AES Solar has developed eight plants totaling 24 MW of solar projects in Spain. In climate solutions, we have developed and are implementing projects to produce GHG Credits. In the U.S., we formed Greenhouse Gas Services, LLC as a joint venture with GE Energy Financial Services to create high quality verifiable offsets for the voluntary U.S. market. We also have formed an initiative to develop and implement utility scale energy systems (such as batteries), which store and release power when needed. Climate solutions projects are managed within the regions and included in the operating results of the applicable reportable segments. While these renewables and other initiatives are not currently material to our operations, we believe that in the future, they may become a material contributor to our revenue and gross margin. However, there are risks associated with these initiatives, which are further disclosed in Item 1A—Risk Factors of the 2008 Form 10-K.
Our Organization and Segments. Through the end of 2008, and as reflected in the 2008 Form 10-K, the Company organized its operations for management and external reporting purposes along two primary lines of business—the generation of electricity (“Generation”) and the distribution of electricity (“Utilities”) within four defined geographic regions: Latin America; North America; Europe & Africa; and Asia and the Middle East (“Asia”). Three regions, North America, Latin America and Europe & Africa, are engaged in both Generation and Utility businesses. Our Asia region only has Generation businesses. This regional management structure resulted in the Company reporting seven segments. The reportable segments included Latin America Generation, Latin America Utilities, North America Generation, North America Utilities, Europe & Africa Generation, Europe & Africa Utilities and Asia Generation. In addition, the Company reported certain activities in “Corporate and Other” including corporate overhead costs which were not directly associated with the operations of our seven reportable segments; and other intercompany charges such as self-insurance premiums which were fully eliminated in consolidation. AES Wind Generation, solar, climate solutions and certain other initiatives were managed by our alternative energy group and the associated revenue, development and operational costs were reported under “Corporate and Other” since the results were not material to the presentation of the Company’s reportable segments.
In early 2009, we implemented certain internal organizational changes in an effort to streamline the organization. These changes affected how results are reported internally for management review. The new management reporting structure continues to be organized along our two lines of business, but there are now three regions: (1) Latin America & Africa; (2) North America and AES Wind; and (3) Europe, Middle East & Asia (collectively “EMEA”), each managed by a regional president. The Company no longer has an alternative energy group. Instead, AES Wind Generation is managed within our North America region while climate solutions projects are now managed and reported within the region in which they are located. Key climate solutions initiatives include investments in GHG initiatives, projects to create emissions offsets for the voluntary U.S. market, projects that produce certified emission reduction credits (“CERs”) and initiatives related to utility-scale energy storage systems (such as batteries) which store and release power when needed. AES Solar is accounted for using the equity method and will continue to be reflected in “Corporate and Other.” In addition to the change in regional management structure, with the exception of AES Wind Development, the Company now manages all development efforts centrally through a development group.
The new segment reporting structure uses the Company’s management reporting structure as its foundation. The Company’s segment reporting structure is organized along our two lines of business and three regions to reflect how the Company manages the business internally. The Company applied the guidance in SFAS No. 131, which provides certain quantitative thresholds and aggregation criteria, and the Company concluded that it now has six reportable segments. This new segment structure is reflected in this Current Report on Form 8-K. The operating segments comprising the former Europe & Africa Generation and Utilities reportable segments are no longer managed together. Under the new management structure, Africa is managed with the Latin America region and Europe is managed with the Asia region. Only Europe—Generation was determined to be a reportable segment based on the Company’s application of SFAS No. 131. As described below, our Europe Utilities, Africa
20
Utilities and Africa Generation operating segments are now reported within “Corporate and Other” because they do not meet the criteria to allow for aggregation with another operating segment or the quantitative thresholds that would require separate disclosure under SFAS No. 131.
Therefore, as a result of this analysis, the Company now reports six segments, which include:
| | • | | Latin America—Generation; |
| | • | | Latin America—Utilities; |
| | • | | North America—Generation; |
| | • | | North America—Utilities; |
“Corporate and Other” now includes corporate overhead costs which are not directly associated with the operations of our six reportable segments, other intercompany charges such as self-insurance premiums which are fully eliminated in consolidation. In addition, “Corporate and Other” includes the operating results of the Company’s Europe Utilities, Africa Utilities and Africa Generation businesses, AES Wind and development and operational costs related to the development group. AES Solar is accounted for under the equity method of accounting, therefore its operating results are included in “Net Equity in Earnings of Affiliates,” not in “Corporate and Other.” None of these operating segments are currently material to our presentation of reportable segments, individually or in the aggregate.
Key Drivers of Our Results of Operations. Our Utilities and Generation businesses are distinguished by the nature of their customers, operational differences, cost structure, regulatory environment and risk exposure. As a result, each line of business has slightly different drivers which affect operating results. Performance drivers for our Generation businesses include, among other things, plant availability and reliability, management of fixed and operational costs and the extent to which our plants have hedged their exposure to fuel cost volatility. For our Generation businesses which sell power under short-term contract or in the spot market one of the most crucial factors is the market price of electricity and the plant’s ability to generate electricity at a cost below that price. Growth in our Generation business is largely tied to securing new PPAs, expanding capacity in our existing facilities and building new power plants. Performance drivers for our Utilities businesses include, but are not limited to, reliability of service; negotiation of tariff adjustments; compliance with extensive regulatory requirements; management of working capital; and in developing countries, reduction of commercial and technical losses. The results of operations of our Utilities businesses are sensitive to changes in economic growth and weather conditions in the area in which they operate.
One of the key factors which affect both our revenue and costs of sales is changes in the cost of fuel. When fuel costs increase, many of our Generation businesses with long-term contracts and our Utilities are able to pass these costs on to the customer through fuel pass-through or fuel indexing arrangements in their contracts or through increases in tariff rates. Therefore, in a rising fuel cost environment as was the case in 2007 and much of 2008, increases in fuel costs for these businesses often resulted in increases in revenue (though not necessarily on a one-for-one basis). While these circumstances may not have a large impact on gross margin, they can significantly affect gross margin as a percentage of revenue. Other factors that can affect gross margin include our ability to expand the number of facilities we own; and in our existing plants, to sign up new customers and/or purchasing parties, collect receivables from existing customers and operate our plants more efficiently.
Another key driver of our results is the management of risk. Our assets are diverse with respect to fuel source and type of market, which helps reduce certain types of operating risk. Our portfolio employs a broad range of fuels, including coal, gas, fuel oil and renewable sources such as hydroelectric power, wind and solar, which reduces the risks associated with dependence on any one fuel source. For additional information regarding
21
our facilities see Item 1—Our Organization and Segments. Our presence in mature markets helps reduce the volatility associated with our businesses in faster-growing emerging markets. In addition, as noted above, our Generation portfolio is largely contracted, which reduces the risk related to the market prices of electricity and fuel. We also attempt to limit risk by hedging much of our currency and commodity risk, and by matching the currency of most of our subsidiary debt to the revenue of the business that issued that debt. However, our businesses are still subject to these risks, as further described in Item 1A—Risk Factors in the 2008 Form 10-K, “We may not be adequately hedged against our exposure to changes in commodity prices or interest rates.”
Highlights of 2008
Results of Operations. In 2008, management continued to focus its efforts on increasing shareholder value by improving operations, executing our growth strategy and strategically managing our portfolio of businesses. Our 2008 results of operations were positively impacted by a number of factors including the gain on the sale of Ekibastuz and Maikuben in Kazakhstan, higher generation rates, utilities tariffs and favorable foreign currency translation.
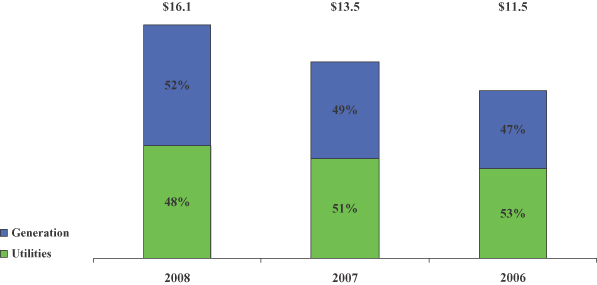
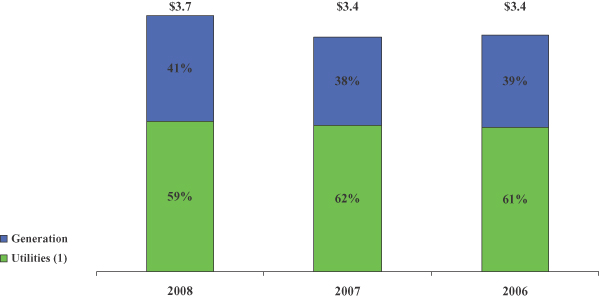
| | • | | revenues of $16.1 billion and gross margin of $3.7 billion, or 23% of revenue; |
| | • | | income from continuing operations attributable to The AES Corporation of $1.2 billion, or $1.80 per diluted share; and |
| | • | | cash flow from operating activities of $2.2 billion. |
Our results were negatively impacted by higher fuel costs in Asia and the unfavorable impact of mark-to-market adjustments on derivative instruments. We also saw an increase in fixed costs, primarily in Brazil and Cameroon, related to maintenance, higher provisions for bad debt, contractor services and higher purchased energy costs.
In the fourth quarter of 2008, and in response to the financial market crisis, we reviewed and prioritized projects in our development pipeline. As a result, we recognized an impairment charge of approximately $75 million ($34 million, net of noncontrolling interests and income taxes). The projects determined to be impaired primarily included two liquefied natural gas projects in North America and a non-power development project at one of our facilities in North America. As the Company continues to review and streamline its project pipeline, it is possible that further impairments could be identified in the future, some of which could be material. During 2008, we also recognized additional impairment charges of $36 million related to long-lived assets at Uruguaiana, our gas-powered generation plant in Brazil. The impairment was triggered by the combination of gas curtailments and increases in the spot market price of energy in 2007 that continued in 2008. Following an initial impairment charge in the fourth quarter of 2007, further charges were incurred in 2008 due to fixed asset purchase agreements in place. During the first half of 2008, we withdrew from projects in South Africa and Israel which resulted in impairment charges of $36 million. We also recognized an impairment of $18 million related to the shutdown of the Hefei plant in China.
Investment and Financing Activities. In addition to the financial results presented above, the additional highlights for the year ended December 31, 2008 include the following:
Financing activities
| | • | | We were able to refinance recourse debt at lower interest rates and with extended maturities, reducing our 2009 recourse debt maturities from $467 million at December 31, 2007 to $154 million at December 31, 2008. |
| | • | | Our consolidated subsidiaries raised approximately $2.7 billion in 2008 for the purposes of refinancing existing debt and to fund acquisitions and construction. For example, in October, the Company obtained approximately $1 billion in non-recourse financing to support the development of Angamos, a 518 MW coal-fired generation facility in Chile. Angamos is expected to begin commercial operations in 2011. |
22
| | • | | We reduced outstanding recourse debt by $360 million and repurchased 10.7 million shares of our common stock at a total cost of $143 million. |
Acquisitions
| | • | | In April, the Company completed the purchase of a 92% interest in Masinloc, a 660 gross MW coal-fired thermal power generation facility in Masinloc, Philippines. The purchase price was $930 million in cash (excluding anticipated improvements). Non-recourse financing of $665 million was obtained to fund the acquisition and improve the facilities. |
Investments in Renewable Energy and Related Projects
| | • | | Wind Generation—Highlights from AES Wind Generation include the following: |
| | • | | The Company expanded its portfolio of wind generation businesses with the acquisition of Mountain View Power Partners (“Mountain View”), which consists of 111 wind turbines with a capacity of 67 MW in Palm Springs, California. |
| | • | | In July, we acquired a 49% interest in Guohua Hulunbeier Wind Farm, a 49.5 MW wind farm development in China. The Company also reached a separate agreement with Guohua to move to phase II of our jointly-owned Huanghua wind project to expand the facility, doubling the capacity to 99 MW. AES has a 49% interest in the Huanghua Project. |
| | • | | In December, the Company obtained financing to build a 156 MW wind farm in Kavarna, the largest in Bulgaria, and a 22 MW wind farm in Scotland. Additionally we acquired a 34 MW wind farm from our affiliate, InnoVent. All three are expected to commence commercial operations in 2009. |
| | • | | Solar Energy—In March, the Company formed AES Solar, a joint venture with Riverstone. AES Solar will develop land-based solar photovoltaic panels that capture sunlight to convert into electricity that feed directly into power grids. AES Solar has commenced commercial operations of 24 MW solar projects in Spain. Under the terms of the agreement, the Company and Riverstone will each provide up to $500 million of capital over the next five years. Through December 31, 2008, the Company has contributed total capital of $135 million. |
| | • | | Climate Solutions—Highlights from our climate solutions activities include: |
| | • | | In April, the Company acquired the rights to the gas from a landfill project in El Salvador (“Nejapa”). Nejapa produces emission reduction credits and plans to build a 6 MW generation facility that could potentially increase to 25 MW in the future. |
| | • | | In June, as a result of a financial restructuring, the Company assumed 100% ownership of AgCert International Plc, an Irish company investing in GHG projects primarily in Brazil and Mexico. AgCert currently produces approximately 1.4 million tonnes per year of CERs. |
| | • | | In September, Greenhouse Gas Services LLC, the Company’s joint venture with General Electric, announced an agreement with Google to co-develop projects to reduce GHG emissions and produce GHG credits. The first project will capture methane gas in North Carolina. |
Construction
As of December 31, 2008, the Company has more than 3,000 Gross MW of new generation capacity. The projects under construction include 14 core power projects totaling 2,993 MW and 11 wind power projects totaling 410 MW.
| | • | | We began construction of Angamos, a 518 MW coal-fired generation facility in Chile expected to begin commercial operations in 2011. |
23
| | • | | We also further advanced our recent projects with the start of construction of three hydro projects in Turkey that are being developed through our investment made in May 2007 in the IC Ictas Energy Group. |
| | • | | In July, the Company achieved early successful testing of simple cycle operation for the Amman East facility in Jordan, a 380 MW natural gas-fired project expected to achieve full combined-cycle operation in the first half of 2009. |
| | • | | In August, the Company started commercial operations of the 170 MW Buffalo Gap III wind farm in Abilene, Texas, bringing the total wind generation capacity of the Buffalo Gap wind farm to 524 MW. |
For a complete listing of the Company’s projects under construction or in development please see Item 1—Our Organizations and Segments.
Portfolio Management
| | • | | In the first quarter of 2008, the Company finalized our termination agreement with the Chinese government and shut down Hefei, a 115 MW oil-fueled generation facility. The plant became the property of the Anhui Province and we received termination compensation of approximately $39 million in March 2008. |
| | • | | In May 2008, the Company completed the sale of Ekibastuz and Maikuben West, a coal-fired power plant and a coal mine with operations in Kazakhstan. Proceeds from the sale of these businesses totaled approximately $1.1 billion, a portion of which was used to pay down debt in June 2008. We have the opportunity to receive additional consideration of up to approximately $380 million under performance incentives and a management agreement to continue operation and management of the plants for the next three years. |
| | • | | In November 2008, the Company sold a 9.6% ownership in AES Gener for $175 million which reduced the Company’s ownership percentage from 80.2% to 70.6%. As a result, the Company recognized a pre-tax loss of $31 million in the fourth quarter of 2008. The net proceeds from this transaction were used to participate in Gener’s capital increase in February 2009 as discussed underOutlook for the Future. |
| | • | | In December 2008, the Company sold its 70% interest in Jiaozuo, a 250 MW coal-fired generation plant in China for net proceeds of $73 million. Prior periods have been restated to reflect this business within Discontinued Operations for all periods presented. |
Credit Crisis and the Macroeconomic Environment
In the second half of 2007, conditions in the credit markets began to deteriorate in the United States and abroad. In the third and fourth quarter of 2008, this crisis and associated market conditions worsened dramatically, with unprecedented market volatility, widening credit spreads, volatile currencies, illiquidity, and increased counterparty credit risk.
Beginning in the second half of 2007, the Company began a series of debt-related initiatives, including the refinancing of approximately $2.0 billion of recourse debt in transactions executed in the fourth quarter of 2007 and the second quarter of 2008. As a result of these transactions, The AES Corporation reduced the 2009 maturities on its recourse debt from $467 million as of June 30, 2007 to $154 million as of December 31, 2008. The AES Corporation also eliminated many of the restrictive covenants in its 8.75% Second Priority Senior Secured Notes due 2013 and modified certain covenants contained in its senior secured credit facility. The amendments made the financial covenants less restrictive and made certain other changes, such as expanding the Company’s ability to repurchase its own common stock. For further information regarding these covenant
24
changes, see the Capital Resources and Liquidity—Parent Company Liquidity section of Management’s Discussion and Analysis of Financial Condition and Results of Operations. In addition, The AES Corporation successfully replaced Lehman Commercial Paper with another bank as a lender under its senior secured credit facility.
Because of the factors described above, management currently believes that it can meet its near-term liquidity requirements through a combination of existing cash and cash equivalent balances, cash provided by operating activities, financings, and, if needed, borrowings under its secured and unsecured credit facilities. Although there can be no assurance due to the challenging times currently faced by financial institutions, management believes that the participating banks under its facilities will be able to meet their funding commitments.
The Company is also subject to credit risk, which includes risk related to the ability of counterparties (such as parties to our PPAs, fuel supply agreements, hedging agreements, and other contractual arrangements) to meet their contractual payment obligations or the potential nonperformance of counterparties to deliver contracted commodities or services at the contracted price. While counterparty credit risk has increased in the current crisis and there can be no assurances regarding the future, to date the Company has not suffered any material effects related to its counterparties.
The global economic slowdown could also result in a decline in the value of our assets, which could result in material impairments of certain assets or result in an increase in our obligations which could be material to our operations. For example, as discussed above, during the fourth quarter of 2008, and in response to the financial market crisis, the Company reviewed and prioritized the projects in our development pipeline. As a result we recognized an impairment charge of approximately $75 million ($34 million, net of noncontrolling interests and income taxes). The projects that were impaired included two liquefied natural gas projects in North America and a non-power development project at one of our facilities in North America.
In addition to the decline in development assets noted above, there is a risk that the fair value of other assets could also decline, resulting in additional impairment charges and/or a material increase in our obligations. Certain subsidiaries of the Company have defined benefit pension plans. The Company periodically evaluates the value of the pension plan assets to ensure that they will be sufficient to fund their respective pension obligations. Given the declines in worldwide asset values, we are expecting an increase in pension expense and funding requirements in future periods, which may be material. As of December 31, 2008 we expect the Company to make future employer contributions to its defined benefit pension plans in 2009 of approximately $154 million, of which $21 million will be made to its U.S. plans and $133 million to foreign plans primarily in Brazil (subject to changes in foreign currency exchange rates), compared to employer contributions made in 2008 of $197 million, of which $59 million was made to U.S. plans and $138 million to foreign plans. In Brazilian real (“R$”) contributions for our subsidiaries in Brazil are expected to increase from R$236 million in 2008 to R$294 million in 2009. The decline in the fair value of pension plan assets will also result in increased pension expense in 2009, currently estimated at $124 million in 2009 (subject to changes in foreign currency exchange rates) compared to $60 million in 2008. Expense at our subsidiaries in Brazil, in local currency, is expected to be R$176 million in 2009 compared to R$77 million in 2008. See Item 1A—Risk Factors, “Some of our subsidiaries participate in defined benefit pension plans and their net pension plan obligations may require additional significant contributions.”
To date, other than the impacts described above, the global economic slowdown has not significantly impacted the Company. However, in the event that the credit crisis and global recession deteriorate further, or are protracted, there could be a material adverse impact on the Company. The Company could be materially impacted if such events or other events occur such that participating lenders under its secured and unsecured facilities fail to meet their commitments, or the Company is unable to access the capital markets on favorable terms or at all, is unable to raise funds through the sale of assets, or is otherwise unable to finance its activities or refinance its debt, or if capital market disruptions result in increased borrowing costs (including with respect to
25
interest payments on the Company’s variable rate debt). The Company could also be adversely affected if general economic or political conditions in the markets where the Company operates deteriorate, resulting in a reduction in cash flow from operations, a reduction in the value of currencies in these markets relative to the dollar (which could cause currency losses), an increase in the price of commodities used in our operations and construction, or if the value of its assets remain depressed or decline further. If any of the foregoing events occur, such events (or a combination thereof) could have a material impact on the Company, its results of operations, liquidity, financial covenants, and/or its credit rating.
The Company could also be adversely affected if the foregoing effects are exacerbated or general economic or political conditions in the markets where the Company operates deteriorate, resulting in a reduction in cash flow from operations, a reduction in the value of currencies in these markets relative to the dollar (which could cause currency losses), an increase in the price of commodities used in our operations and construction or a decline in asset values.
Outlook for the Future
In 2008, management continued to focus its efforts on improving operations, executing our growth strategy, managing our risk and strategically managing our portfolio of businesses. As market conditions deteriorated in the second half of 2008, our strategy evolved, with an increased emphasis on preserving liquidity. We also recognized that uncertain economic conditions could potentially slow global demand for power for some period of time. Accordingly, we scaled back our development plans mid-year to focus on projects that we believe will still have attractive returns and can still attract capital in difficult financial markets and on completing our projects that are currently under construction. If the Company has capital available for investment beyond these priorities (whether for further development, reductions in debt, or repurchases of stock), it will be allocated based on management’s assessment of its most effective use.
Consistent with this strategy, in the fourth quarter of 2008, management conducted a review of its development pipeline, and determined that certain projects in the pipeline may not achieve financial close, will not provide the returns originally anticipated, or are otherwise unfeasible, or that other uses of capital such as debt repayment or stock repurchases offer a better return on the Company’s capital. Accordingly, management has determined it will not pursue certain projects and will delay others until the credit markets recover. Furthermore, management will continue to review its pipeline and may further reduce the number of projects it pursues. The Company is also evaluating other options with respect to its pipeline, such as the addition of partners who can contribute capital, share project risk and/or provide strategic expertise. There can be no assurance regarding the outcome of any such decisions on the Company, its results of operations or its financial condition.
The AES Corporation has $154 million in recourse debt maturing in 2009 compared with Parent Company liquidity of approximately $1.4 billion.
With regard to its projects currently under construction, the Company believes that it can complete these projects through a combination of existing cash and cash equivalent balances, cash provided by operating activities, financings, and, if needed, borrowings under its secured and unsecured credit facilities. The Company has secured the financing for the vast majority of projects under construction.
The Company is also focused on operational improvements and cost reductions to help further improve its cash flow from operations and enhance its financial flexibility. The Company has already commenced efforts to reduce costs and streamline our organization. These efforts include the reorganization of the Company from four regions to three regions, which is expected to eliminate redundancies and improve our cost structure.
26
Recent Events
On December 23, 2008, the local Chilean SEC approved Gener’s issuance of approximately 945 million new shares at a price of $162.50 Chilean Pesos. The proceeds of the share issuance were $246 million and Gener anticipates using these proceeds for future expansion plans, working capital and other operating needs. The preemptive rights period began on January 7, 2009 remained open for 30 days and closed on February 5, 2009. During the preemptive rights period AES, through its wholly-owned subsidiary, Cachagua, paid $175 million from the proceeds of the November 2008 share sale to maintain its current ownership percentage of approximately 70.6%.
2008 Performance Highlights
| | | | | | | | | | | | |
| | | Year Ended December 31, | |
| | | 2008 | | | 2007 | | | 2006 | |
| | | ($’s in millions, except per share amounts) | |
Revenue | | $ | 16,070 | | | $ | 13,516 | | | $ | 11,509 | |
Gross Margin | | $ | 3,707 | | | $ | 3,392 | | | $ | 3,419 | |
Gross Margin as a % of Revenue | | | 23.1 | % | | | 25.1 | % | | | 29.7 | % |
Net Income Attributable to The AES Corporation | | $ | 1,234 | | | $ | (95 | ) | | $ | 247 | |
Net Cash Provided by Operating Activities | | $ | 2,175 | | | $ | 2,353 | | | $ | 2,348 | |
Revenue
Revenue increased 19% to $16.1 billion in 2008 compared with $13.5 billion in 2007 primarily due to higher generation rates in Latin America, the impact of favorable foreign currency translation of approximately $350 million and utility tariffs and volume.
Gross margin
Gross margin increased 9% to $3.7 billion in 2008 compared with $3.4 billion in 2007 primarily due to higher generation rates in Latin America, favorable foreign currency impact, utility volume and tariff, partially offset by an increase in fixed costs associated with allowances for bad debts and higher purchased energy costs, primarily in Brazil and Cameroon. Gross margin as a percentage of revenue decreased to 23.1% in 2008 compared with 25.1% in 2007 driven by the increase in fixed costs.
Our gross margin remained at approximately $3.4 billion in 2006 and 2007 and increased to $3.7 billion in 2008. Gross margin however declined in the fourth quarter of 2008 due to several factors including the mix of earnings within our portfolio, foreign currency exchange rates, commodity prices, and recent acquisitions, such as Masinloc in the Philippines. We believe that it is reasonably possible that the recent trend in gross margin reported in the fourth quarter will continue. The Company’s future gross margin trends may be significantly impacted by currency exchange rates, commodity prices and the impact of any significant regulatory developments in each country where the Company conducts its business. The Company is subject to extensive and complex governmental regulations which affect most aspects of our business, such as regulations governing the generation and distribution of electricity and environmental regulations, as described more fully in the Business section of the 2008 Form 10-K.
Net income attributable to The AES Corporation
Net income attributable to The AES Corporation increased $1.3 billion to $1.2 billion in 2008. In 2007, net loss attributable to The AES Corporation of $95 million was largely impacted by a loss from the sale of C.A. La Electricidad de Caracas (“EDC”) of $680 million, net of tax, which was reflected in discontinued operations. In 2008, net income attributable to The AES Corporation benefited from the recognition of a non-taxable gain on
27
the sale of assets in Kazakhstan of $905 million. In each case, the gain or loss recognized on the sale of the business had a significant impact on net income attributable to The AES Corporation during the applicable period. However, while the Company engages in the sale of assets from time to time, the amount of gain or loss that would be recognized in such sale, if any, will depend on a number of factors related to any asset or business that may be sold. Therefore, the Company does not expect that the increase in net income attributable to The AES Corporation which occurred between 2007 and 2008 will continue in future periods.
All amounts are after taxes and noncontrolling interests unless otherwise noted. The 2008 results also included additional tax expense of $144 million related to the repatriation of a portion of the Kazakhstan sale proceeds, impairment charges of $83 million related to asset impairments in Brazil, South Africa and certain LNG and other development efforts, a loss of $34 million related to corporate debt restructuring and an increase in foreign currency transaction losses of $209 million. The 2007 results included asset impairment charges of $224 million related to Uruguaiana and AgCert, a gain of $101 million related to the acquisition of a leasehold interest at the Company’s Eastern Energy business in New York and the recovery of certain tax assets in Latin America and a $55 million loss related to a corporate debt restructuring. The remaining increase was primarily a result of improved performance in 2008.
Net cash from operating activities
Net cash from operating activities decreased 8% to $2.2 billion in 2008 compared with $2.4 billion in 2007. Excluding the decrease in net cash provided by operating activities from EDC in Venezuela, which was sold in May 2007, net cash provided by operating activities would have decreased $37 million. This decrease was primarily due to increased employer pension contributions at our U.S. and foreign subsidiaries and an increase in regulatory assets related to future recoverable purchased energy costs in Brazil. These decreases were partially offset by a decrease in cash used by a Brazilian subsidiary to pay income taxes in 2008 as a result of tax credits used as the primary payment method in 2008 and improved operations in Latin America and Europe as well as our Africa businesses reported in the Corporate and Other segment. Please refer toConsolidated Cash Flows—Operating Activities for further discussion.
28
Consolidated Results of Operations
| | | | | | | | | | | | | | | | | | | | |
| | | Year Ended December 31, | |
| Results of operations | | 2008 | | | 2007 | | | 2006 | | | $ change
2008 vs. 2007 | | | $ change
2007 vs. 2006 | |
| | | (in millions, except per share amounts) | |
Revenue: | | | | | | | | | | | | | | | | | | | | |
Latin America Generation | | $ | 4,465 | | | $ | 3,510 | | | $ | 2,615 | | | $ | 955 | | | $ | 895 | |
Latin America Utilities | | | 5,927 | | | | 5,172 | | | | 4,552 | | | | 755 | | | | 620 | |
North America Generation | | | 2,234 | | | | 2,168 | | | | 1,928 | | | | 66 | | | | 240 | |
North America Utilities | | | 1,079 | | | | 1,052 | | | | 1,032 | | | | 27 | | | | 20 | |
Europe Generation | | | 1,096 | | | | 910 | | | | 789 | | | | 186 | | | | 121 | |
Asia Generation | | | 1,264 | | | | 817 | | | | 718 | | | | 447 | | | | 99 | |
Corporate and Other (1) | | | 5 | | | | (113 | ) | | | (125 | ) | | | 118 | | | | 12 | |
| | | | | | | | | | | | | | | | | | | | |
Total Revenue | | $ | 16,070 | | | $ | 13,516 | | | $ | 11,509 | | | $ | 2,554 | | | $ | 2,007 | |
| | | | | | | | | | | | | | | | | | | | |
Gross Margin: | | | | | | | | | | | | | | | | | | | | |
Latin America Generation | | $ | 1,394 | | | $ | 955 | | | $ | 1,052 | | | $ | 439 | | | $ | (97 | ) |
Latin America Utilities | | | 860 | | | | 865 | | | | 888 | | | | (5 | ) | | | (23 | ) |
North America Generation | | | 657 | | | | 702 | | | | 610 | | | | (45 | ) | | | 92 | |
North America Utilities | | | 261 | | | | 313 | | | | 277 | | | | (52 | ) | | | 36 | |
Europe Generation | | | 266 | | | | 243 | | | | 214 | | | | 23 | | | | 29 | |
Asia Generation | | | 143 | | | | 176 | | | | 186 | | | | (33 | ) | | | (10 | ) |
Total Corporate and Other(2) | | | (245 | ) | | | (241 | ) | | | (109 | ) | | | (4 | ) | | | (132 | ) |
Interest expense | | | (1,844 | ) | | | (1,788 | ) | | | (1,769 | ) | | | (56 | ) | | | (19 | ) |
Interest income | | | 540 | | | | 500 | | | | 434 | | | | 40 | | | | 66 | |
Other expense | | | (163 | ) | | | (255 | ) | | | (451 | ) | | | 92 | | | | 196 | |
Other income | | | 379 | | | | 358 | | | | 116 | | | | 21 | | | | 242 | |
Gain on sale of investments | | | 909 | | | | — | | | | 98 | | | | 909 | | | | (98 | ) |
(Loss) gain on sale of subsidiary stock | | | (31 | ) | | | 134 | | | | (535 | ) | | | (165 | ) | | | 669 | |
Impairment expense | | | (175 | ) | | | (408 | ) | | | (17 | ) | | | 233 | | | | (391 | ) |
Foreign currency transaction (losses) gains on net monetary position | | | (185 | ) | | | 24 | | | | (80 | ) | | | (209 | ) | | | 104 | |
Other non-operating expense | | | (15 | ) | | | (57 | ) | | | — | | | | 42 | | | | (57 | ) |
Income tax expense | | | (774 | ) | | | (679 | ) | | | (359 | ) | | | (95 | ) | | | (320 | ) |
Net equity in earnings of affiliates | | | 33 | | | | 76 | | | | 73 | | | | (43 | ) | | | 3 | |
| | | | | | | | | | | | | | | | | | | | |
Income from continuing operations | | | 2,010 | | | | 918 | | | | 628 | | | | 1,092 | | | | 290 | |
Income from operations of discontinued businesses | | | 12 | | | | 79 | | | | 115 | | | | (67 | ) | | | (36 | ) |
Gain (loss) from disposal of discontinued businesses | | | 6 | | | | (661 | ) | | | (57 | ) | | | 667 | | | | (604 | ) |
Extraordinary items | | | — | | | | — | | | | 21 | | | | — | | | | (21 | ) |
| | | | | | | | | | | | | | | | | | | | |
Net income | | | 2,028 | | | | 336 | | | | 707 | | | | 1,692 | | | | (371 | ) |
Noncontrolling interests | | | (794 | ) | | | (431 | ) | | | (460 | ) | | | (363 | ) | | | 29 | |
| | | | | | | | | | | | | | | | | | | | |
Net income (loss) attributable to The AES Corporation | | $ | 1,234 | | | $ | (95 | ) | | $ | 247 | | | $ | 1,329 | | | $ | (342 | ) |
| | | | | | | | | | | | | | | | | | | | |
Per share data: | | | | | | | | | | | | | | | | | | | | |
Basic income per share from continuing operations | | $ | 1.82 | | | $ | 0.73 | | | $ | 0.25 | | | $ | 1.09 | | | $ | 0.48 | |
Diluted income per share from continuing operations | | $ | 1.80 | | | $ | 0.72 | | | $ | 0.25 | | | $ | 1.08 | | | $ | 0.47 | |
| (1) | “Corporate and Other” includes revenues from the Company’s Europe Utilities, Africa Utilities, Africa Generation and renewables businesses and inter-segment eliminations of revenues related to transfers of electricity from Tietê (generation) to Eletropaulo (utility) in Latin America. |
| (2) | Total Corporate and Other expenses include corporate general and administrative expenses, expenses related to the Company’s Europe Utilities, Africa Utilities, Africa Generation businesses and renewables initiatives as well as certain inter-segment eliminations, primarily corporate charges for self insurance premiums. |
29
Segment Analysis
Latin America
The following table summarizes revenue and gross margin for our Generation segment in Latin America for the periods indicated:
| | | | | | | | | | | | | | | | | | |
| | | For the Years Ended December 31, | |
| | | 2008 | | | 2007 | | | 2006 | | | % Change
2008 vs. 2007 | | | % Change
2007 vs. 2006 | |
| | | (Dollars in millions) | |
Latin America Generation | | | | | | | | | | | | | | | | | | |
Revenue | | $ | 4,465 | | | $ | 3,510 | | | $ | 2,615 | | | 27 | % | | 34 | % |
Gross Margin | | $ | 1,394 | | | $ | 955 | | | $ | 1,052 | | | 46 | % | | -9 | % |
Gross Margin as a % of Segment Revenue | | | 31 | % | | | 27 | % | | | 40 | % | | | | | | |
Fiscal Year 2008 versus 2007
Generation revenue increased $955 million, or 27%, from the previous year primarily due to higher contract and spot prices and higher volume at Gener in Chile and our businesses in Argentina of approximately $508 million and $188 million, respectively, higher contract and spot prices at our businesses in the Dominican Republic of approximately $132 million, favorable foreign currency translation of approximately $77 million and higher spot prices at our businesses in Panama of approximately $45 million.
Generation gross margin increased $439 million, or 46%, from the previous year primarily due to higher contract and spot prices and higher volume at Gener and our businesses in Argentina of approximately $318 million, higher contract and spot prices at our businesses in the Dominican Republic of approximately $86 million, favorable foreign currency translation of approximately $44 million, and higher spot prices at our businesses in Panama of approximately $30 million. These increases were partially offset by higher purchased energy prices of approximately $57 million at Uruguaiana in Brazil.
Fiscal Year 2007 versus 2006
Generation revenue increased $895 million, or 34%, from the previous year primarily due to higher rates and volume at Gener and our businesses in Argentina of approximately $443 million and $95 million, respectively; and increased volume and intercompany sales from Tietê, in Brazil, to Eletropaulo, our Brazilian utility, of approximately $130 million. Our increase in ownership of the controlling shares of Itabo, in the Dominican Republic, which resulted in a change from the equity method of accounting consolidation, contributed approximately $87 million in revenue. The increase from foreign currency translation was approximately $38 million.
Generation gross margin decreased $97 million, or 9%, from the previous year primarily due to increased cost from gas supply curtailments, drier than normal hydrology and higher spot prices for electricity in the Company’s businesses in Argentina, Chile and Southern Brazil of approximately $173 million and one time transmission charges at Tietê of $39 million, offset in part, by higher sales at Itabo of $23 million and intercompany sales in Tietê of $103 million.
The following table summarizes revenue and gross margin for our Utilities segment in Latin America for the periods indicated:
| | | | | | | | | | | | | | | | | | |
| | | For the Years Ended December 31, | |
| | | 2008 | | | 2007 | | | 2006 | | | % Change
2008 vs. 2007 | | | % Change
2007 vs. 2006 | |
| | | (Dollars in millions) | |
Latin America Utilities | | | | | | | | | | | | | | | | | | |
Revenue | | $ | 5,927 | | | $ | 5,172 | | | $ | 4,552 | | | 15 | % | | 14 | % |
Gross Margin | | $ | 860 | | | $ | 865 | | | $ | 888 | | | -1 | % | | -3 | % |
Gross Margin as a % of Segment Revenue | | | 15 | % | | | 17 | % | | | 20 | % | | | | | | |
30
Fiscal Year 2008 versus 2007
Utilities revenue increased $755 million, or 15%, from the previous year primarily due to favorable foreign currency translation of approximately $357 million at our businesses in Brazil, increased rates primarily associated with higher pass-through purchased energy and transmission costs at Eletropaulo of approximately $148 million, and higher volume at Eletropaulo and Sul in Brazil of approximately $162 million and $30 million, respectively.
Utilities gross margin decreased $5 million, or 1%, from the previous year primarily due to a decrease in the non-pass through rates at Eletropaulo as a result of the July 2007 tariff reset of approximately $74 million, increased fixed costs of approximately $71 million at Eletropaulo primarily due to higher provisions for bad debts and higher purchased energy costs at Eletropaulo of approximately $68 million. These decreases were partially offset by higher volume at Eletropaulo of approximately $162 million and favorable foreign currency translation of approximately $67 million at our businesses in Brazil.
Fiscal Year 2007 versus 2006
Utilities revenue increased $620 million, or 14%, from the previous year primarily due to favorable foreign currency translation of $493 million, and increased rates and volume at Sul and at our plants in El Salvador of $58 million and $41 million, respectively, offset by a net decrease in tariffs of $24 million at Eletropaulo.
Utilities gross margin decreased $23 million, or 3%, from the previous year primarily due to reduced tariff rates at Eletropaulo of $355 million offset by lower costs, favorable foreign currency translation of $148 million and higher volume of $74 million. Additionally, Sul had increased rates and volume of $27 million and favorable foreign currency translation of $19 million.
North America
The following table summarizes revenue and gross margin for our Generation segment in North America for the periods indicated:
| | | | | | | | | | | | | | | | | | |
| | | For the Years Ended December 31, | |
| | | 2008 | | | 2007 | | | 2006 | | | % Change
2008 vs. 2007 | | | % Change
2007 vs. 2006 | |
| | | (Dollars in millions) | |
North America Generation | | | | | | | | | | | | | | | | | | |
Revenue | | $ | 2,234 | | | $ | 2,168 | | | $ | 1,928 | | | 3 | % | | 12 | % |
Gross Margin | | $ | 657 | | | $ | 702 | | | $ | 610 | | | -6 | % | | 15 | % |
Gross Margin as a % of Segment Revenue | | | 29 | % | | | 32 | % | | | 32 | % | | | | | | |
Fiscal Year 2008 versus 2007
Generation revenue increased $66 million, or 3%, from the previous year primarily due to higher volume of $38 million at TEG/TEP in Mexico, and net higher revenue at Merida in Mexico of $29 million primarily due to the pass-through of higher fuel costs offset by a revenue adjustment. In addition, revenue increased $8 million at Red Oak in New Jersey, due to higher pricing and availability bonuses. At Warrior Run in Maryland, revenue increased $12 million due to the pass-through of higher fuel costs and higher volume due to no significant outages in 2008. These effects were partially offset by lower volume in New York of $23 million primarily due to planned outages and lower capacity factors.
Generation gross margin decreased $45 million, or 6%, and decreased as a percentage of revenue from the previous year due to lower gross margin in New York of $46 million mainly due to a planned outage and lower volume, and higher fuel prices and outages of $16 million at Deepwater in Texas. Gross margin decreased
31
$13 million at TEG/TEP due primarily to outages and lower rates due to changes in the sales contract rates associated with the refinancing in 2007. These decreases were partially offset by a net increase in gross margin in Hawaii of $29 million primarily due to a $22 million net mark-to-market derivative gain on a coal supply contract and a one time use tax refund of $6 million.
Fiscal Year 2007 versus 2006
Generation revenue increased $240 million, or 12%, from the previous year primarily due to approximately $200 million in new business as a result of our acquisition of TEG/TEP and approximately $96 million in higher rate and volume sales at the Company’s New York facilities; offset by mark-to-market adjustments for embedded derivatives of $51 million at Deepwater and lower emission sales of $39 million.
Generation gross margin increased $92 million, or 15%, from the previous year primarily due to approximately $62 million related to our acquisition of TEG/TEP and $90 million related to higher rates and volumes and lower cost at the Company’s New York facilities offset by lower sales of excess emissions allowances of approximately $39 million.
The following table summarizes revenue and gross margin for our Utilities segment in North America for the periods indicated:
| | | | | | | | | | | | | | | | | | |
| | | For the Years Ended December 31, | |
| | | 2008 | | | 2007 | | | 2006 | | | % Change
2008 vs. 2007 | | | % Change
2007 vs. 2006 | |
| | | (Dollars in millions) | |
North America Utilities | | | | | | | | | | | | | | | | | | |
Revenue | | $ | 1,079 | | | $ | 1,052 | | | $ | 1,032 | | | 3 | % | | 2 | % |
Gross Margin | | $ | 261 | | | $ | 313 | | | $ | 277 | | | -17 | % | | 13 | % |
Gross Margin as a % of Segment Revenue | | | 24 | % | | | 30 | % | | | 27 | % | | | | | | |
Fiscal Year 2008 versus 2007
Utilities revenue increased $27 million, or 3%, from the previous year primarily due to a $42 million increase in rate adjustments at IPL in Indiana, related to environmental investments, $42 million of higher fuel and purchased power costs and an $8 million increase in wholesale prices. These increases were offset by $32 million of credits to customers established during the first six months of 2008, $16 million of lower retail volume primarily due to unfavorable weather compared to 2007 and an $18 million decrease in wholesale volume.
Utilities gross margin decreased $52 million, or 17%, from the previous year primarily due to lower variable retail margin of $42 million driven by the credits to customers established during the first six months of 2008 and lower retail volume. In addition, IPL had higher maintenance expenses of $9 million primarily due to storm restoration costs and the timing and duration of major generating unit overhauls, an increase of $6 million in labor and benefits costs and an increase of $3 million in contractor and consulting costs. These decreases to gross margin were offset by a return recovered through rates on approved environmental investments of $14 million.
Fiscal Year 2007 versus 2006
Utilities revenue increased $20 million, or 2%, from the previous year primarily due to increased volume due to weather, offset by a decrease in fuel charges passed through to customer at IPL.
Utilities gross margin increased $36 million, or 13%, from the previous year primarily due to increased volume sales and a return recovered through rates on approved environmental investments at IPL.
32
Europe
The following table summarizes revenue for our Generation segment in Europe for the periods indicated:
| | | | | | | | | | | | | | | | | | |
| | | For the Years Ended December 31, | |
| | | 2008 | | | 2007 | | | 2006 | | | % Change
2008 vs. 2007 | | | % Change
2007 vs. 2006 | |
| | | (Dollars in millions) | |
Europe Generation | | | | | | | | | | | | | | | | | | |
Revenue | | $ | 1,096 | | | $ | 910 | | | $ | 789 | | | 20 | % | | 15 | % |
Gross Margin | | $ | 266 | | | $ | 243 | | | $ | 214 | | | 9 | % | | 14 | % |
Gross Margin as a % of Segment Revenue | | | 24 | % | | | 27 | % | | | 27 | % | | | | | | |
Fiscal Year 2008 versus 2007
Generation revenue increased $186 million, or 20%, from the previous year primarily due to an increase in capacity income and energy payments at Kilroot in Northern Ireland of approximately $105 million, rate recovery and higher volume of approximately $93 million at our businesses in Hungary and favorable foreign currency translation in Hungary of $32 million. In addition, revenue at Kilroot increased approximately $21 million compared to the previous year primarily due to the unfavorable impact of two major overhauls in 2007. These increases were partially offset by a reduction in revenue of approximately $49 million in Kazakhstan following the sale of Ekibastuz and Maikuben in the second quarter of 2008 that was partially offset by approximately $12 million in management fees earned from continuing management agreements for those businesses. In addition, revenue at Kilroot was approximately $37 million lower due to the unfavorable impact of foreign currency translation.
Generation gross margin increased $23 million, or 9%, from the previous year primarily due to higher rates and volume of $43 million at Tisza II in Hungary, and an increase in capacity income and fewer forced outages at Kilroot of approximately $32 million. These were offset by an increase in fixed costs of $24 million at Kilroot and Tisza II, unfavorable foreign currency translation of $12 million at Kilroot and a reduction in gross margin of $29 million in Kazakhstan following the sale of Ekibastuz and Maikuben in the second quarter of 2008 that was partially offset by $9 million in net gross margin from continuing management agreements for those businesses.
Fiscal Year 2007 versus 2006
Generation revenue increased $121 million, or 15%, from the previous year primarily due to favorable foreign currency translation of $77 million and increased rate and volume sales of approximately $60 million at our businesses in Kazakhstan.
Generation gross margin increased $29 million, or 14%, from the previous year primarily due to rate and volume increases at our businesses in Kazakhstan and Kilroot of $44 million and $13 million, respectively. These increases were offset by lower emission sales in Hungary and Bohemia in the Czech Republic of approximately $28 million.
Asia
The following table summarizes revenue and gross margin for our Generation segment in Asia for the periods indicated:
| | | | | | | | | | | | | | | | | | |
| | | For the Years Ended December 31, | |
| | | 2008 | | | 2007 | | | 2006 | | | % Change
2008 vs. 2007 | | | % Change
2007 vs. 2006 | |
| | | (Dollars in millions) | |
Asia Generation | | | | | | | | | | | | | | | | | | |
Revenue | | $ | 1,264 | | | $ | 817 | | | $ | 718 | | | 55 | % | | 14 | % |
Gross Margin | | $ | 143 | | | $ | 176 | | | $ | 186 | | | -19 | % | | -5 | % |
Gross Margin as a % of Segment Revenue | | | 11 | % | | | 22 | % | | | 26 | % | | | | | | |
33
Fiscal Year 2008 versus 2007
Generation revenue increased $447 million, or 55%, from the previous year primarily due to higher rates driven by increased pass-through fuel prices of $259 million and volume of $41 million at our Lal Pir and Pak Gen businesses in Pakistan, an increase in rates due to pass-through fuel prices at Kelanitissa in Sri Lanka, of approximately $55 million, and revenue generated from our new businesses, Masinloc in the Philippines, and Amman East in Jordan, of $148 million and $46 million, respectively. These increases were partially offset by unfavorable impact of foreign currency translation of $95 million in Pakistan.
Generation gross margin decreased $33 million, or 19%, from the previous year primarily due to the impact of increased fuel prices on heat rate losses of approximately $14 million at Lal Pir and Pak Gen and a $15 million unfavorable impact on revenue from an amended PPA accounted for as a lease, and therefore revenue was recognized on a straight-line basis in accordance with EITF No. 01-8,Determining Whether an Arrangement Contains a Lease at Ras Laffan in Qatar. In addition, Masinloc generated a net gross margin loss of $18 million for the year ended December 31, 2008. These unfavorable effects were partially offset by the favorable impact of $14 million from the start of commercial operations in July 2008 at Amman East.
Fiscal Year 2007 versus 2006
Generation revenue increased $99 million, or 14%, from the previous year primarily due to higher dispatch in Pakistan of $83 million and higher volume and rates at Kelanitissa of approximately $30 million offset by volume decreases of approximately $8 million at Chigen in China.
Generation gross margin decreased $10 million, or 5%, from the previous year primarily due to decreased volume at Chigen.
Corporate and Other
Corporate and other includes general and administrative expenses, executive management, finance, legal, human resources, information systems which are not allocable to our business segments and the effects of eliminating transactions, such as self-insurance charges, between the operating segments and corporate. In addition, this includes net operating results from our generation and utilities businesses in Africa, utilities businesses in Europe and AES Wind Generation and other renewables projects and costs associated with our development group which are immaterial for the purposes of separate segment disclosure. For the years ended December 31, 2008, 2007 and 2006, “Corporate and other” was 2%, 2% and 1% of total revenue, respectively.
Corporate and other increased $4 million, or 2%, to $245 million in 2008 from $241 million in 2007. The increase was primarily due to increased fixed costs of $55 million at our Utilities businesses in Europe and Africa, higher spending of $16 million on SAP implementation projects and $27 million on the expansion of AES Wind Generation and our renewables initiatives, offset partially by increased rates and volume at Sonel, our Utility business in Cameroon, of $36 million, increased tariff rates of $23 million at our businesses in the Ukraine and a reduction in professional fees related to material weakness remediation efforts.
Corporate and other increased $132 million, or 121%, to $241 million in 2007 from $109 million in 2006. The increase was primarily due to increased non-fuel operating and maintenance costs as well as higher fuel usage at Sonel, higher spending in professional fees of approximately $24 million primarily to complete the restatement of our financial statements and for continued material weakness remediation efforts, higher spending due to headcount increases primarily related to the strengthening of our finance organization of approximately $15 million and increased spending of $18 million for our SAP implementation projects.
34
Interest expense
Interest expense increased $56 million, or 3%, to $1,844 million in 2008 primarily due to additional interest expense at our recently acquired subsidiary, Masinloc, interest expense associated with derivatives at Eletropaulo, Panama and Puerto Rico, as well as unfavorable foreign currency translation in Brazil. These increases were offset by decreases from the elimination of a financial transaction tax in Brazil, a decrease in regulatory liabilities at Eletropaulo, and a decrease in capitalized interest on development projects at Kilroot.
Interest expense increased $19 million, or 1%, to $1,788 million in 2007 primarily due to unfavorable impacts from foreign currency translation in Brazil and interest expense associated with derivatives. These increases were offset by the benefits of debt retirement activity at several of our subsidiaries in Latin America and lower interest rates at one of our subsidiaries in Brazil.
Interest income
Interest income increased $40 million, or 8%, to $540 million in 2008 primarily due to interest income on short-term investments and cash equivalents at two of our subsidiaries in Brazil, inflationary adjustments on accounts receivable at Gener, and interest earned on a convertible loan acquired in March 2008. These increases were offset by decreases due to lower interest income related to a gross receipts tax recovery at Tietê recorded during the second quarter of 2007 and decreased interest income related to derivatives at TEG/TEP.
Interest income increased $66 million, or 15%, to $500 million in 2007 primarily due to favorable foreign currency translation on the Brazilian Real and higher cash and short-term investment balances at certain of our subsidiaries, offset by decreases at two of our Brazilian subsidiaries due to lower interest rates.
Other income
| | | | | | | | | |
| | | Years Ended December 31, |
| | | 2008 | | 2007 | | 2006 |
| | | (in millions) |
Gain on extinguishment of liabilities | | $ | 199 | | $ | 22 | | $ | 45 |
Insurance proceeds | | | 40 | | | 18 | | | 30 |
Legal/dispute settlement | | | 39 | | | 26 | | | 1 |
Gain on sale of assets | | | 34 | | | 24 | | | 18 |
Contract settlement gain | | | — | | | 135 | | | — |
Gross receipts tax recovery | | | — | | | 93 | | | — |
Other | | | 67 | | | 40 | | | 22 |
| | | | | | | | | |
Total other income | | $ | 379 | | $ | 358 | | $ | 116 |
| | | | | | | | | |
Other income increased $21 million to $379 million in 2008 primarily due to gains on the extinguishment of a gross receipts tax liability and legal contingency of $117 million and $75 million, respectively, at Eletropaulo, $29 million of insurance recoveries for damaged turbines at Uruguaiana, $32 million of cash proceeds related to a favorable legal settlement at Southland in California, and compensation of $18 million for the impairment associated with the settlement agreement to shut down Hefei. These increases were offset by a $135 million contract settlement gain in 2007 at Eastern Energy and a $93 million gross receipts tax recovery in 2007 at Eletropaulo and Tietê in 2007.
Other income increased $242 million to $358 million in 2007 primarily due to the Eastern Energy contract settlement gain and tax recoveries in Brazil noted above in addition to favorable legal settlements at Eletropaulo and Red Oak. These increases were offset by a decrease in gains on the extinguishment of debt, which were driven by debt retirement activities at several of our businesses in Latin America in 2006.
35
Other expense
| | | | | | | | | |
| | | Years Ended December 31, |
| | | 2008 | | 2007 | | 2006 |
| | | (in millions) |
Loss on extinguishment of liabilities | | $ | 70 | | $ | 106 | | $ | 181 |
Loss on sale and disposal of assets | | | 34 | | | 79 | | | 23 |
Legal/dispute settlement | | | 19 | | | 36 | | | 31 |
Regulatory special obligations | | | — | | | — | | | 139 |
Write-down of disallowed regulatory assets | | | — | | | 16 | | | 36 |
Other | | | 40 | | | 18 | | | 41 |
| | | | | | | | | |
Total other expense | | $ | 163 | | $ | 255 | | $ | 451 |
| | | | | | | | | |
Other expense decreased $92 million to $163 million in 2008, from $255 million in 2007, primarily due to a decrease in losses on sales and disposals of assets at Sul as well as an extinguishment of debt at the Parent Company. In 2008, there was a loss of $55 million on the retirement of Senior Notes at the Parent Company, compared to a loss of $90 million on a smaller debt retirement in 2007.
Other expense decreased $196 million to $255 million in 2007 primarily due to higher losses in 2006 associated with debt retirement activities at several of our Latin American businesses, special obligation charges and the write-down of disallowed regulatory assets at Eletropaulo in 2006. In 2007, there was a loss of $90 million on the retirement of Senior Notes at the Parent Company, as well as higher losses on sales and disposals of assets at Eletropaulo and Sul.
Impairment Expense
As discussed in Note 19—Impairment Expense to the Consolidated Financial Statements included in Item 8 of this Form 8-K, impairment expense for the year 2008 was $175 million and consisted primarily of the following:
In the fourth quarter of 2008, and in response to the financial market crisis, the Company reviewed and prioritized projects in the development pipeline. From this review, the Company determined that the carrying value exceeded the future discounted cash flows for certain projects. As a result, the Company recorded an impairment charge of $75 million ($34 million, net of noncontrolling interests and income taxes) related to two liquefied natural gas projects in North America and a non-power development project at one of our facilities in North America. During 2008, the Company recognized additional impairment charges of $36 million related to long-lived assets at Uruguaiana. The impairment was triggered by a combination of gas curtailments and increases in the spot market price of energy in 2007 that continued in 2008. Following an initial impairment charge in the fourth quarter of 2007, further charges were incurred in 2008 due to fixed asset purchase agreements in place. During the first half of 2008, the Company withdrew from projects in South Africa and Israel which resulted in impairment charges of $36 million. The Company also recognized an impairment of $18 million related to the shut down of the Hefei plant in China.
Impairment expense for the year 2007 was $408 million and consisted primarily of the following: In the fourth quarter of 2007, the Company recognized a pre-tax impairment charge of approximately $14 million related to a $52 million prepayment advanced to AgCert for a specified amount of future CER credits. AgCert, a United Kingdom based corporation that produces emission reduction credits, notified AES that it was not able to meet its contractual obligations to deliver CERs, which triggered an analysis of the asset’s recoverability and resulted in the asset impairment charge. Also during the fourth quarter of 2007, there was a pre-tax impairment charge of approximately $352 million at Uruguaiana, a gas-fired thermoelectric plant located in Brazil. The impairment was the result of an analysis of Uruguaiana’s long-lived assets, which was triggered by the combination of gas curtailments and increases in the spot market price of energy. In August 2007, there was a
36
pre-tax impairment charge of $25 million triggered by the failure of a compressor at our Placerita subsidiary in California. The fixed asset impairment was caused by damage sustained to one of the plant’s gas turbines. Also during the third quarter of 2007, a pre-tax fixed asset impairment charge of approximately $10 million was recognized related to the curtailment of operations at Coal Creek Minerals, LLC, a coal mining company owned by our subsidiary Cavanal Minerals located in the United States.
Impairment expense for the year 2006 was $17 million and consisted primarily of the following: During the fourth quarter of 2006, there was a pre-tax impairment charge of $6 million related to AES China Generating Co. Ltd. (“Chigen”) equity investment in Wuhu, a coal-fired plant located in China. The equity impairment in Wuhu was required as a result of a goodwill impairment analysis at Chigen. During the third quarter of 2006, there was an impairment charge of $5 million related to a decrease in the market value of five held for sale gas turbines at our subsidiary Itabo located in the Dominican Republic.
Gain on sale of investments
Gain on sale of investments of $909 million in 2008 consisted primarily of the sale in May 2008 of our two wholly-owned subsidiaries in Kazakhstan, AES Ekibastuz LLP and Maikuben West LLP for a net gain of $905 million.
There was no gain on sale of investments for the year ended December 31, 2007.
Gain on sale of investments in 2006 of $98 million was the result of a net gain of $87 million from our sale of an equity investment in a power project in Canada (Kingston) in March 2006 and a net gain of $10 million related to our transfer of Infoenergy, a wholly owned AES subsidiary, to Brasiliana in September 2006. Brasiliana is 53.85% owned by BNDES, but controlled by AES. This transaction was part of the Company’s agreement with BNDES to terminate the Sul Option.
(Loss) gain on sale of subsidiary stock
In November 2008, Cachagua, our wholly owned subsidiary, which owned 80.2% of AES Gener S.A. (“Gener”) shares prior to the transaction, sold 9.6% of its ownership in Gener to a third party. After this transaction, Cachagua’s new ownership in Gener was 70.6%. As a result of this transaction, the Company recorded a net loss on the sale of shares of $31 million.
Gain on sale of subsidiary stock in 2007 of $134 million was a result of net gains recognized on the sale of a 0.91% and 10.18% ownership interest in Gener in May and October of 2007, respectively.
As discussed in Note 17—Subsidiary Stock to the Consolidated Financial Statements in Item 8 of this Form 8-K, in September 2006, Brasiliana’s wholly owned subsidiary, Transgás sold a 33% economic ownership in Eletropaulo, a regulated electric utility in Brazil. Despite the reduction in economic ownership, there was no change in Brasiliana’s voting interest in Eletropaulo, and Brasiliana continues to control Eletropaulo. Brasiliana received $522 million in net proceeds on the sale. On October 5, 2006 Transgás, sold an additional 5% economic ownership in Eletropaulo for net proceeds of $78 million. In 2006, AES recognized a pre-tax loss of $535 million primarily as a result of the recognition of previously deferred currency translation losses.
37
Foreign currency transaction gains (losses) on net monetary position
The following table summarizes the gains (losses) on the Company’s net monetary position from foreign currency transaction activities:
| | | | | | | | | | | | |
| | | Years Ended December 31, | |
| | | 2008 | | | 2007 | | | 2006 | |
| | | (in millions) | |
AES Corporation | | $ | 38 | | | $ | 31 | | | $ | (17 | ) |
Chile | | | (102 | ) | | | (4 | ) | | | — | |
Philippines | | | (57 | ) | | | — | | | | — | |
Brazil | | | (44 | ) | | | 5 | | | | (49 | ) |
Argentina | | | (22 | ) | | | (8 | ) | | | (3 | ) |
Kazakhstan | | | 11 | | | | 10 | | | | 1 | |
Mexico | | | (9 | ) | | | (2 | ) | | | — | |
Colombia | | | 5 | | | | (7 | ) | | | (1 | ) |
Pakistan | | | (1 | ) | | | (4 | ) | | | (18 | ) |
Other | | | (4 | ) | | | 3 | | | | 7 | |
| | | | | | | | | | | | |
Total(1) | | $ | (185 | ) | | $ | 24 | | | $ | (80 | ) |
| | | | | | | | | | | | |
| (1) | Includes $10 million, ($22) million and ($51) million of gains (losses) on foreign currency derivative contracts for the years ended December 31, 2008, 2007 and 2006, respectively. |
The Company recognized foreign currency transaction losses of $185 million for the year ended December 31, 2008. These consisted primarily of losses in Chile, the Philippines, Brazil, Argentina and Mexico partially offset by gains at The AES Corporation and in Kazakhstan.
| | • | | Losses of $102 million in Chile were primarily due to the devaluation of the Chilean Peso by 28% in 2008, resulting in losses at Gener, a U.S. Dollar functional currency subsidiary, associated with its net working capital denominated in Chilean Pesos, mainly cash, accounts receivable and VAT receivables. |
| | • | | Losses of $57 million in the Philippines were primarily due to remeasurement losses at Masinloc, a Philippine Peso functional currency subsidiary, on U.S. Dollar denominated debt resulting from depreciation of the Philippine Peso of 16% in 2008. |
| | • | | Losses of $44 million in Brazil were primarily due to the realization of deferred exchange variance on past energy purchases made by Eletropaulo denominated in U.S. Dollar, resulting in foreign currency transaction losses of $41 million. |
| | • | | Losses of $22 million in Argentina were primarily due to the devaluation of the Argentinean Peso by 10% in 2008, resulting in losses at Alicura, an Argentine Peso functional currency subsidiary, associated with its U.S. Dollar denominated debt. |
| | • | | Losses of $9 million in Mexico were primarily due to the devaluation of the Mexican Peso by 26% in 2008, resulting in losses of approximately $9 million at TEG/TEP. |
| | • | | Gains of $38 million at The AES Corporation were primarily due to debt denominated in British Pounds and gains on foreign exchange derivatives, partially offset by losses on notes receivable denominated in Euro. |
| | • | | Gains of $11 million in Kazakhstan were primarily due to net foreign currency transaction gains of $16 million related to energy sales denominated and fixed in the U.S. Dollar, offset by $5 million of foreign currency transaction losses on external and intercompany debt denominated in other than functional currencies. |
38
Foreign currency transaction gains of $24 million for the year ended December 31, 2007 primarily consisted of gains at The AES Corporation and in Kazakhstan partially offset by losses in Argentina and Colombia.
| | • | | Gains of $31 million at The AES Corporation were primarily the result of favorable exchange rates for debt denominated in British Pounds and the Euro. |
| | • | | Gains of $10 million in Kazakhstan were primarily due to $12 million of gains related to debt denominated in currencies other than the Kazakh Tenge functional currency, partially offset by $3 million of losses related to energy sales denominated and fixed in the U.S. Dollar. |
| | • | | Losses of $8 million in Argentina were primarily due to the devaluation of the Argentine Peso by 3% in 2007, resulting in losses of $11 million at Alicura associated with its U.S. Dollar denominated debt. |
| | • | | Losses of $7 million in Colombia were primarily due to the appreciation of the Colombian Peso by 11% in 2007 at Chivor, a U.S. Dollar function currency subsidiary. |
Foreign currency transaction losses of $80 million for the year ended December 31, 2006 primarily consisted of losses in Brazil, Pakistan and at The AES Corporation.
| | • | | Losses of $49 million in Brazil were primarily the result of losses of $45 million at Eletropaulo from swap contracts that were paid and executed in 2006 as Eletropaulo converted U.S. Dollar debt to Brazilian Real debt. |
| | • | | Losses of $18 million in Pakistan were primarily the result of the depreciation of the Pakistani Rupee. |
| | • | | Losses of $17 million at AES Corporation were primarily the result of unfavorable exchange rates for debt denominated in British Pounds and the Euro. |
Other non-operating expense
Other non-operating expense was $15 million in 2008 compared to $57 million in 2007. The 2008 expense related primarily to an impairment of the Company’s investment in a company developing a “blue gas” (coal to gas) technology project. The Company made this investment in September 2007 and accounted for the investment in convertible preferred shares under the cost method of accounting. During the fourth quarter of 2008, the market value of the shares materially declined due to downward trends in the capital markets and management concluded that the decline was other-than-temporary and recorded an impairment charge of $10 million. Additionally, the Company recorded an other-than-temporary impairment charge of approximately $5 million related to its investments in other entities developing new energy technology and products.
Other non-operating expense in 2007 reflected the impairment in the Company’s investment in AgCert, a U.K. based corporation, publicly traded on the London Stock Exchange, that produces CER credits. The Company acquired its investment in AgCert in May 2006 and, similar to the circumstances stated above, the market value of the Company’s investment materially declined during the first half of 2007 and the Company recorded an other-than-temporary impairment charge of $52 million in 2007. An additional charge of $5 million was recognized for the decrease in value of the AgCert warrants also held by the Company. The Company began consolidating AgCert in January 2008 when it became the primary beneficiary.
Income taxes
Income tax expense on continuing operations increased $95 million, or 14%, to $774 million in 2008. The Company’s effective tax rates were 28% for 2008 and 45% for 2007. The decrease in the 2008 effective tax rate was primarily due to the non-taxable gain of $905 million on the sale of the Kazakhstan businesses in the second quarter of 2008, offset by U.S. taxes on distributions from the Company’s primary holding company to facilitate early retirement of parent debt in 2008. The decrease was also attributable to the implementation of a tax planning strategy that mitigated the impact of the Mexico Flat Rate Business Tax (“IETU”) enacted in the fourth quarter of 2007. The strategy resulted in a reduction to deferred tax expense in 2008 of $24 million and $23 million at TEG and TEP, respectively.
39
Income tax expense related to continuing operations increased $320 million, or 89%, to $679 million in 2007. The Company’s effective tax rates were 45% for 2007 and 39% for 2006. The increase in the 2007 effective tax rate was due, in part, to an impairment at Uruguaiana for which no tax benefit was recorded, the impact of an appreciating Real in certain of our Brazilian subsidiaries, and the impact of income tax law changes in Mexico, partially offset by the nontaxable gain on the sales of shares of one of the Company’s Chilean subsidiaries and a release of valuation allowance at one of our subsidiaries in Argentina.
Net equity in earnings of affiliates
Net equity in earnings of affiliates decreased $43 million, or 57%, to $33 million in 2008 primarily due to the impact of increased coal prices at Yangcheng, a coal-fired plant in China, a decrease as a result of development costs related to AES Solar, formed in March 2008, and an additional write-off of three projects in Turkey that were abandoned in December 2007. Additionally, earnings decreased due to the sale of a wind project in the fourth quarter of 2007, a decrease in earnings at OPGC, in India, and decreased earnings due to a discontinuance of hedge accounting for a number of interest rate swaps at Guacolda in Chile. These losses were partially offset by a decrease in net losses at Cartagena in Spain primarily from a write-off of deferred financing costs in 2007 that did not recur in 2008.
Net equity in earnings of affiliates increased $3 million, or 4%, to $76 million in 2007 primarily due to a full year of operations at Cartagena in 2007 and the absence of liquidated damages incurred in 2006 for construction delays. The increase was partially offset by a decrease in earnings in 2007 at AES Barry compared to 2006, due to proceeds received in 2006 from the settlement of a legal claim that did not recur in 2007.
Net income attributable to noncontrolling interests
Net income attributable to noncontrolling interests increased $363 million, or 84%, to $794 million in 2008 primarily due to the decreased losses as a result of the impairment recognized at Uruguaiana during 2007, increased earnings at Eletropaulo, Gener, Itabo, Panama and Tietê, as well as an increase in minority shareholders from approximately 20% to approximately 29% as a result of the sale of shares in Gener in November 2008. These increases were partially offset by an impairment recognized in the Bahamas, a net loss at Masinloc, and decreased earnings at Ras Laffan, Sonel, and Caess-EEO & Clesa in El Salvador.
Net income attributable to noncontrolling interests decreased $29 million, or 6%, to $431 million in 2007 primarily due to the recognition of previously deferred currency translation losses associated with the sale of Eletropaulo shares during the third quarter 2006, resulting in a decrease of our economic ownership in Eletropaulo from 34% to 16%. See Note 17—Subsidiary Stock to the Consolidated Financial Statements included in Item 8 of this Form 8-K for a further discussion of the sale of Eletropaulo shares and the Brasiliana restructuring. The decrease was also attributable to the noncontrolling interest impact of the impairment recognized at Uruguaiana in 2007, offset by increased earnings at Tietê.
Discontinued operations
As further discussed in Note 21—Discontinued Operations and Held for Sale Businesses to the Consolidated Financial Statements included in Item 8 of this Form 8-K, Discontinued Operations includes the results of five businesses: Jiaozuo, a generation business in China, (sold in December 2008); La Electricidad de Caracas (“EDC”), a utility business in Venezuela, (sold in May 2007); Central Valley, a generation business in California (sold in July 2007); Eden, a utility business in Argentina (sold in June 2007), and Indian Queens, a generation business in the U.K. (sold in May 2006). Prior periods have been restated to reflect these businesses within Discontinued Operations for all periods presented.
In 2008, income from operations of discontinued businesses, net of tax, was $12 million and reflected the operations of Jiaozuo, a coal-fired generation facility in China sold in December 2008. The Company received $73 million for its 70% interest in the business. The net gain on the disposition was $7 million.
40
In 2007, income from operations of discontinued businesses, net of tax, was $79 million and reflected the operations of Jiaozuo, EDC, Central Valley and Eden. EDC and Central Valley were sold in May 2007 and July 2007 for $739 million and $51 million, respectively, and the Eden sale was finalized in June 2007, therefore their results are reflected in the Company’s results of operations through their respective sales dates. The loss on the disposal of discontinued businesses was $661 million and primarily related to the $680 million loss on the sale of EDC.
In 2006, income from operations of discontinued businesses, net of tax, was $115 million and reflected the operations of Jiaozuo, EDC, Central Valley, Eden and Indian Queens. Indian Queens was sold in May 2006 therefore its results are reflected in the Company’s results of operations through the sale date. The loss on the disposal of discontinued businesses was $57 million and primarily related to the $62 million impairment charge recognized at Eden to adjust the carrying value of its assets to their estimated net realizable value when the Company reached an agreement to sell Eden in May 2006. The Eden sale was finalized in June 2007.
Extraordinary item
In May 2006, AES purchased an additional 25% interest in Itabo, a power generation business located in the Dominican Republic for approximately $23 million. Prior to May, the Company held a 25% interest in Itabo, through its Gener subsidiary, and had accounted for the investment using the equity method of accounting with a corresponding investment balance reflected in the “Investments in and advances to affiliates” line item on the Consolidated Balance Sheets. As a result of the transaction, the Company consolidates Itabo and, therefore, the investment balance has been reclassified to the appropriate line items on the Consolidated Balance Sheets with a corresponding noncontrolling interest liability for the remaining 50% interest not owned by AES. The Company realized an after-tax extraordinary gain of $21 million as a result of the transaction due to an excess of the fair value of the noncurrent assets over the purchase price.
Critical Accounting Estimates
The Consolidated Financial Statements of AES are prepared in conformity with GAAP, which requires the use of estimates, judgments, and assumptions that affect the reported amounts of assets and liabilities at the date of the financial statements and the reported amounts of revenues and expenses during the periods presented. AES’s significant accounting policies are described in Note 1—General and Summary of Significant Accounting Policies to the Consolidated Financial Statements included in Item 8 of this Form 8-K.
An accounting estimate is considered critical if:
| | • | | the estimate requires management to make assumptions about matters that were highly uncertain at the time the estimate was made; |
| | • | | different estimates reasonably could have been used; or |
| | • | | the impact of the estimates and assumptions on financial condition or operating performance is material. |
Management believes that the accounting estimates employed are appropriate and the resulting balances are reasonable; however, actual results could differ from the original estimates, requiring adjustments to these balances in future periods. Management has discussed these critical accounting policies with the audit committee, as appropriate. Listed below are certain significant estimates and assumptions used in the preparation of the Consolidated Financial Statements.
Income Tax Reserves
We are subject to income taxes in both the United States and numerous foreign jurisdictions. Our worldwide income tax provision requires significant judgment and is based on calculations and assumptions that are subject to examination by the Internal Revenue Service and other taxing authorities. The Company and certain of its
41
subsidiaries are under examination by relevant taxing authorities for various tax years. The Company regularly assesses the potential outcome of these examinations in each of the taxing jurisdictions when determining the adequacy of the provision for income taxes. The Company adopted Financial Accounting Standards Board (“FASB”) Interpretation (“FIN”) No. 48,Accounting for Uncertainty in Income Taxes, (“FIN No. 48”) effective January 1, 2007. The Interpretation prescribes a more-likely-than-not recognition threshold and establishes new measurement requirements for financial statement reporting of an entity’s income tax positions. Tax reserves have been established, which the Company believes to be adequate in relation to the potential for additional assessments. Once established, reserves are adjusted only when there is more information available or when an event occurs necessitating a change to the reserves. While the Company believes that the amount of the tax estimates are reasonable, it is possible that the ultimate outcome of current or future examinations may exceed current reserves in amounts that could be material.
Goodwill
We test goodwill for impairment annually and whenever events or circumstances make it more likely than not that impairment may have occurred. Such indicators could include a significant adverse change in the business climate or a decision to sell or dispose all or a portion of a reporting unit. Goodwill impairment is evaluated using a two-step process. The first step is to identify if a potential impairment exists by comparing the fair value of a reporting unit with its carrying value. Determining whether an impairment has occurred requires the valuation of the respective reporting unit. The Company uses a discounted cash flow method to estimate the fair value. If the fair value of the reporting unit exceeds its carrying value, goodwill of the reporting unit is not considered to be impaired and no further analysis is required. In applying this methodology, we rely on a number of factors, including actual operating results, future business plans, economic projections and market data. Assumptions about operating results and growth rates are based on forecasts, future business plans, economic projections and anticipated future cash flows, among other things. Changes in any of these assumptions could result in management reaching a different conclusion regarding the potential impairment of a reporting unit. Our impairment analysis contains uncertainties from uncontrollable events that could positively or negatively impact the anticipated future economic and operating conditions.
If the carrying value exceeds the reporting unit’s fair value, this could indicate potential impairment and step two of the goodwill evaluation process is required to determine if goodwill is impaired and to measure the amount of impairment loss to recognize, if any. The measurement of impairment requires a fair value estimate of each identified tangible and intangible asset in the same manner the fair value would be determined in a business combination. In this case, we supplement the cash flow approach discussed above with appraisals, or other observable sources of fair value, as appropriate.
Regulatory Assets and Liabilities
The Company accounts for certain of its regulated operations under the provisions of SFAS No. 71,Accounting for the Effects of Certain Types of Regulation, (“SFAS No. 71”). As a result, AES recognizes assets and liabilities that result from the regulated ratemaking process that would not be recognized under GAAP for non-regulated entities. Regulatory assets generally represent incurred costs that have been deferred because such costs are probable of future recovery in customer rates. Regulatory liabilities generally represent obligations to make refunds to customers for previous collections for costs that are not likely to be incurred or included in future rate initiatives. Management continually assesses whether the regulatory assets are probable of future recovery by considering factors such as applicable regulatory changes, recent rate orders applicable to other regulated entities and the status of any pending or potential deregulation legislation. If future recovery of costs ceases to be probable, any asset write-offs would be required to be recognized in operating income.
42
Fair Value
Fair Value of Financial Instruments
A significant number of the Company’s financial instruments are carried at fair value with changes in fair value recognized in earnings or other comprehensive income each period. The Company makes estimates regarding valuation of assets and liabilities measured at fair value in preparing the Consolidated Financial Statements. These assets and liabilities include short and long-term investments in debt and equity securities, included in the balance sheet line items “Short-term investments” and “Other assets (Noncurrent)”, derivative assets, included in “Other current assets” and “Other assets (Noncurrent)” and derivative liabilities, included in “Accrued and other liabilities (current)” and “Other long-term liabilities”. The Company uses valuation techniques and methodologies that maximize the use of observable inputs and minimize the use of unobservable inputs. Where available, fair value is based on observable market prices or parameters or derived from such prices or parameters. Where observable prices or inputs are not available, valuation models are applied. The valuation techniques involve some level of management estimation and judgment, the degree of which is dependent on the price transparency for the instruments or market and the instruments’ complexity. Investments are generally fair valued based on quoted market prices or other observable market data such as interest rate indices. The Company’s investments are primarily certificates of deposit, government debt securities and money market funds. Derivatives are valued using observable data as inputs into internal valuation models. The Company’s derivatives primarily consist of interest rate swaps, foreign currency instruments, and commodity and embedded derivatives. Additional discussion regarding the nature of these financial instruments and valuation techniques can be found in Note 6—Fair Value of Financial Instruments.
Accounting for Derivative Instruments and Hedging Activities
We enter into various derivative transactions in order to hedge our exposure to certain market risks. We primarily use derivative instruments to manage our interest rate, commodity, and foreign currency exposures. We do not enter into derivative transactions for trading purposes.
Under SFAS No. 133,Accounting for Derivative Instruments and Hedging Activities as amended, (“SFAS No. 133”), we recognize all derivatives as either assets or liabilities in the balance sheet and measure those instruments at fair value except where derivatives qualify and are designated as “normal purchase/normal sale” transactions. Changes in fair value of derivatives are recognized in earnings unless specific hedge criteria are met. Income and expense related to derivative instruments are recognized in the same category as generated by the underlying asset or liability.
SFAS No. 133 enables companies to designate qualifying derivatives as hedging instruments based on the exposure being hedged. These hedge designations include fair value hedges and cash flow hedges. Changes in the fair value of a derivative that is highly effective and is designated and qualifies as a fair value hedge, are recognized in earnings as offsets to the changes in fair value of the exposure being hedged. The Company has no fair value hedges at this time. Changes in the fair value of a derivative that is highly effective and is designated as and qualifies as a cash flow hedge, are deferred in accumulated other comprehensive income and are recognized into earnings as the hedged transactions occur. Any ineffectiveness is recognized in earnings immediately. For all hedge contracts, the Company provides formal documentation of the hedge and effectiveness testing in accordance with SFAS No. 133.
The Company adopted SFAS No. 157,Fair Value Measurement, (“SFAS No. 157”) on January 1, 2008. SFAS No. 157 provides additional guidance on the definition of fair value and defines fair value as the price that would be received to sell an asset or paid to transfer a liability in an orderly transaction between market participants at the measurement date, or exit price. SFAS No. 157 requires the Company to consider and reflect the assumptions of market participants in the fair value calculation. These factors include nonperformance risk (the risk that the obligation will not be fulfilled) and credit risk, both of the reporting entity (for liabilities) and of the counterparty (for assets). These factors were not previously considered in the fair value calculation. Due to
43
the nature of the Company’s interest rate swaps, which are typically associated with non-recourse debt, credit risk for AES is evaluated at the subsidiary level rather than at the Parent Company level. Nonperformance risk on the Company’s derivative instruments is an adjustment to the initial asset/liability fair value position that is derived from internally developed valuation models that utilize observable market inputs.
As a result of uncertainty, complexity and judgment, accounting estimates related to derivative accounting could result in material changes to our financial statements under different conditions or utilizing different assumptions. As a part of accounting for these derivatives, we make estimates concerning nonperformance, volatilities, market liquidity, future commodity prices, interest rates, credit ratings (both ours and our counterparty’s), and exchange rates.
The fair value of our derivative portfolio is generally determined using internal valuation models, most of which are based on observable market inputs including interest rate curves and forward and spot prices for currencies and commodities. The Company derives most of its financial instrument market assumptions from market efficient data sources (e.g. Bloomberg and Platt’s). In some cases, where market data is not readily available, management uses comparable market sources and empirical evidence to derive market assumptions to determine a financial instrument’s fair value. In certain instances, the published curve may not extend through the remaining term of the contract and management must make assumptions to extrapolate the curve. Additionally, in the absence of quoted prices, we may rely on “indicative pricing” quotes from financial institutions to input into our valuation model for certain of our foreign currency swaps. These indicative pricing quotes do not constitute either a bid or ask price and therefore are not considered observable market data. For individual contracts, the use of different valuation models or assumptions could have a material effect on the calculated fair value.
Fair Value Hierarchy
The Company uses valuation techniques and methodologies that maximize the use of observable inputs and minimize the use of unobservable inputs. Where available, fair value is based on observable market prices or parameters or derived from such prices or parameters. Where observable prices or inputs are not available, valuation models are applied. The valuation techniques involve some level of management estimation and judgment, the degree of which is dependent on the price transparency for the instruments or market and the instruments’ complexity.
To increase consistency and enhance disclosure of the fair value of financial instruments, SFAS No. 157 creates a fair value hierarchy to prioritize the inputs used to measure fair value into three categories. A financial instrument’s level within the fair value hierarchy is based on the lowest level of input significant to the fair value measurement, where Level 1 is the highest and Level 3 is the lowest. For more information regarding the fair value hierarchy, see Note 1—General and Summary of Significant Accounting Policies in Item 8. Financial Statements and Supplementary Data in this Form 8-K.
New Accounting Pronouncements
In September 2006, the FASB issued SFAS No. 157. SFAS No. 157 provides enhanced guidance for using fair value to measure assets and liabilities, but does not expand the application of fair value accounting to any new circumstances. The Company adopted SFAS No. 157 on January 1, 2008. See the Company’s fair value policy in Note 1—General and Summary of Significant Accounting Policies in Item 8. Financial Statements and Supplementary Data in this Form 8-K.
SFAS No. 157 is applied prospectively, except for changes in fair value for existing derivative financial instruments that include an adjustment for a blockage factor, existing hybrid instruments measured at fair value and financial instruments accounted for in accordance with Emerging Issues Task Force (“EITF”) Issue No. 02-3,Issues Involved in Accounting for Derivative Contracts Held for Trading Purposes and Contracts Involved in
44
Energy Trading and Risk Management Activities (“EITF No. 02-3”), under which day one gain or loss recognition was prohibited. For these instruments, the impact of the adoption of SFAS No. 157 can be recorded as an adjustment to beginning retained earnings in the year of adoption. The Company does not have any of these financial instruments; therefore there is no cumulative impact of the adoption of SFAS No. 157 for AES. The adoption of SFAS No. 157 did not materially impact the Company’s financial condition, results of operations, or cash flows.
FSP No. 157-1: Application of FASB Statement No. 157 to FASB Statement No. 13 and Other Accounting Pronouncements That Address Fair Value Measurements for Purposes of Lease Classification or Measurement under Statement 13 (“FSP No. 157-1”).
In February 2008, the FASB issued FASB Staff Position (“FSP”) No. 157-1,Application of FASB Statement No. 157 to FASB Statement No. 13 and Other Accounting Pronouncements That Address Fair Value Measurements for Purposes of Lease Classification or Measurement Under Statement 13, (“FSP No. 157-1”). FSP No. 157-1 excludes SFAS No. 13,Accounting for Leases, (“SFAS No. 13”) and most other accounting pronouncements that address fair value measurement of leases from the scope of SFAS No. 157.
FSP No. 157-2: Effective Date of FASB Statement No. 157 (“FSP No. 157-2”).
In February 2008, the FASB issued FSP No. 157-2, which delays the effective date of SFAS No. 157 for all nonrecurring fair value measurements of nonfinancial assets and liabilities until fiscal years beginning after November 15, 2008, or January 1, 2009 for AES. AES continues to evaluate the future impact of SFAS No. 157 on these assets and liabilities but at this time does not believe that the impact will be material.
FSP No. 157-3: Determining the Fair Value of a Financial Asset When the Market for That Asset is Not Active (“FSP No. 157-3”).
In October 2008, the FASB issued FSP No. 157-3, which clarifies the application of SFAS No. 157 in a market that is not active and provides an example to illustrate key considerations in determining the fair value of a financial asset when the market for that financial asset is not active. The guidance emphasizes that determining fair value in an inactive market depends on the facts and circumstances and may require the use of significant judgments. FSP No. 157-3 is effective upon issuance, including prior periods for which financial statements have not been issued, and therefore was effective for AES at September 30, 2008. The adoption of FSP No. 157-3 did not have a material impact on the Company.
SFAS No. 159: The Fair Value Option for Financial Assets and Financial Liabilities—including an amendment of FAS No. 115 (“SFAS No. 159”).
In February 2007, the FASB issued SFAS No. 159, which allows entities to choose, at specified election dates, to measure eligible financial assets and liabilities at fair value that are not otherwise required to be measured at fair value. If a company elects the fair value option for an eligible item, changes in that item’s fair value in subsequent reporting periods must be recognized in current earnings. The Company adopted SFAS No. 159 effective January 1, 2008. As allowed by the standard, the Company did not elect the fair value option for the measurement of any eligible assets or liabilities. Therefore, the January 1, 2008 adoption did not have an impact on the Company.
FSP FAS 133-1 and FIN 45-4: Disclosures about Credit Derivatives and Certain Guarantees: An Amendment of FASB Statement No. 133 and FASB Interpretation No.45; and Clarification of the Effective Date of FASB Statement No. 161 (“FSP No. FAS 133-1 & FIN 45-4” or “the FSP”).
In September 2008, the FASB issued the FSP to address the concerns of financial statement users that existing disclosure requirements under SFAS No. 133 do not adequately reflect the potential adverse effects of changes in credit risk on the financial statements of the sellers of credit derivatives. FSP No. FAS 133-1 &
45
FIN 45-4 requires disclosure of additional information about these potential adverse effects of changes in credit risk on the financial position, financial performance, and cash flows of sellers of credit derivatives. The disclosures are required for all credit derivatives, whether freestanding or embedded in a hybrid instrument. The FSP also amends FIN No. 45 to require additional disclosure about the current status of the payment performance risk of a guarantee. This new disclosure applies to all guarantees, not just those related to credit risk. The provisions in the FSP are effective for reporting periods ending after November 15, 2008, or December 31, 2008 for AES. AES has incorporated these additional disclosures into its Form 10-K for the year ended December 31, 2008. Comparative disclosures are required for periods subsequent to adoption. Additionally, the FSP clarifies that SFAS No. 161 is effective for all periods, including quarterly and annual periods beginning after November 15, 2008, or January 1, 2009 for AES.
FSP No. FAS 140-4 and FIN 46(R)-8: Disclosures by Public Entities (Enterprises) about Transfers of Financial Assets and Interests in Variable Interest Entities (“FSP No. FAS 140-4 & FIN 46(R)-8”).
In December 2008, the FASB issued FSP No. FAS 140-4 and FIN 46(R)-8, which expands the required disclosures pertaining to an enterprise’s involvement with variable interest entities (“VIEs”) and is intended to provide more transparent information related to that involvement. The new disclosure requirements include additional information regarding consolidated VIEs as well as a requirement for sponsors of a VIE to disclose certain information even if they do not hold a significant financial interest in the VIE. FSP No. FAS 140-4 & FIN 46(R)-8 is effective for reporting periods ending after December 15, 2008. The Company adopted FSP No. FAS 140-4 & FIN 46(R)-8 effective December 31, 2008 but there was no material change to our disclosures.
SFAS No. 160: Noncontrolling Interests in Consolidated Financial Statements, an amendment of ARB No. 51 (“SFAS No. 160”).
SFAS No. 160 changed the accounting and reporting for minority interests, which are now classified as a component of equity and referred to as noncontrolling interests. Effective January 1, 2009, the Company adopted SFAS No. 160, which resulted in the reclassification of amounts considered to be permanent equity previously classified as minority interest to a separate component of equity titled “Noncontrolling Interests” in the accompanying consolidated balance sheets and statements of changes in equity. Additionally, net income and comprehensive income attributable to noncontrolling interests are reflected separately from consolidated net income and comprehensive income in the accompanying consolidated statements of operations and statements of changes in equity. Financial statements for all periods presented in this Current Report on Form 8-K have been reclassified to conform to the presentation requirements of SFAS No. 160 as required by SEC regulations.
The following accounting standards have been issued, but as of December 31, 2008 are not yet effective and have not been adopted by AES.
SFAS No. 141 (revised 2007): Business Combinations (“SFAS No. 141(R)”).
In December 2007, the FASB issued SFAS No. 141(R). SFAS No. 141(R) will significantly change how business acquisitions are accounted for at the acquisition date and in subsequent periods. The standard changes the accounting for the business combination at the acquisition date to a fair value based approach rather than the cost allocation approach currently used. Other differences include changes in the accounting for acquisition related costs, contingencies and income taxes. SFAS No. 141(R) will be effective for public companies for fiscal years beginning on or after December 15, 2008, January 1, 2009 for AES, and will be applied prospectively. Early adoption is prohibited. AES has not completed its analysis of the potential future impact of SFAS No. 141(R).
46
SFAS No. 161: Disclosures about Derivative Instruments and Hedging Activities, an amendment of SFAS No. 133 (“SFAS No. 161”).
In March 2008, the FASB issued SFAS No. 161, which expands the disclosure requirements under SFAS No. 133. The enhanced quantitative and qualitative disclosures will include how and why an entity uses derivative instruments, how derivative instruments and related hedged items are accounted for and how derivative instruments and related hedged items affect an entity’s financial position, financial performance and cash flows. SFAS No. 161 is effective for the Company on January 1, 2009. SFAS No. 161 also amends SFAS No. 107,Disclosures about Fair Value Instruments, (“SFAS No. 107”) to clarify that derivative instruments are subject to SFAS No. 107 disclosure requirements regarding concentration of credit risk. The Company will incorporate the additional disclosures beginning with its Form 10-Q for the three months ending March 31, 2009.
SFAS No 162: The Hierarchy of Generally Accepted Accounting Principles (“SFAS No. 162”).
In May 2008, the FASB issued SFAS No. 162, which identifies the framework, or hierarchy for selecting accounting principles to be used in preparing financial statements presented in conformity with U.S. GAAP. SFAS No. 162 amends the existing U.S. GAAP hierarchy established and set forth in the American Institute of Certified Public Accountants (“AICPA”) Statement of Auditing Standard No. 69,The Meaning of Present Fairly in Conformity With Generally Accepted Accounting Principles, (“SAS 69”). The framework serves as a guide in determining the appropriate accounting treatment to be used for a transaction or event. We do not expect SFAS No. 162 to have an impact on Company’s current accounting practices. The Standard will become effective 60 days following the SEC’s approval of Public Company Accounting Oversight Board (“PCAOB”) amendments to AU Section 411,The Meaning of Present Fairly in Conformity with Generally Accepted Accounting Principles.
FSP No. FAS 142-3: Determination of the Useful Life of Intangible Assets (“FSP No. FAS 142-3”).
In April 2008, the FASB issued FSP No. FAS 142-3, which amends the factors considered in developing renewal or extension assumptions used to determine the useful life of a recognized intangible asset under SFAS No. 142,Goodwill and Other Intangible Assets, (“SFAS No. 142”). FSP No. 142-3 requires a consistent approach between the useful life of a recognized intangible asset under SFAS No. 142 and the period of expected cash flows used to measure the fair value of an asset under SFAS No. 141(R). The FSP also requires enhanced disclosures when an intangible asset’s expected future cash flows are affected by an entity’s intent and/or ability to renew or extend the arrangement. FSP No. 142-3 is effective for financial statements issued for fiscal years beginning after December 15, 2008, January 1, 2009 for AES, and is to be applied prospectively. Early adoption is prohibited. AES has not completed its analysis of the potential impact of FSP No. 142-3, but does not believe the adoption will have a material impact on the Company’s financial condition, results of operations, or cash flows.
FSP No. APB 14-1: Accounting for Convertible Debt Instruments That May Be Settled in Cash upon Conversion (Including Partial Cash Settlement) (“FSP No. APB 14-1”).
In May 2008, the FASB issued FSP No. APB 14-1, which clarifies that convertible debt instruments that may be settled in cash or other assets upon conversion are not addressed by APB No. 14,Accounting for Convertible Debt and Debt Issued with Stock Purchase Warrants. Additionally, FSP APB No. 14-1 requires an entity to separately account for the liability and equity components of a convertible instrument to reflect an entity’s nonconvertible debt borrowing rate when interest cost is recognized in subsequent periods. FSP APB No. 14-1 also expands the disclosure requirements regarding convertible debt instrument terms and how the instrument is reflected in an entity’s financial statements. AES has reviewed the impact of FSP No. APB 14-1 and determined that FSP No. APB 14-1 is not applicable for any of the Company’s instruments.
47
EITF 08-3: Accounting by Lessees for Maintenance Deposits (“EITF 08-3”).
In June 2008, the EITF issued EITF 08-3, which clarifies how a lessee accounts for nonrefundable maintenance deposits. Under EITF 08-3 nonrefundable maintenance deposits will be recorded as a deposit asset and as reimbursable maintenance is performed by the lessee, the underlying maintenance is expensed or capitalized in accordance with the lessee’s accounting policy. EITF 08-3 is effective for the Company beginning on January 1, 2009. Early adoption is not permitted. The effect of adoption will be reflected as a change in accounting principle through a cumulative effect adjustment to the opening balance of retained earnings in the year of adoption. AES is currently reviewing the potential impact of EITF 08-3, but at this time does not believe it will have a material impact on the Company’s financial statements.
FSP No. FAS 132(R)-1: Employers’ Disclosures about Postretirement Benefit Plan Assets (“FSP No. FAS 132(R)-1”).
In December 2008, the FASB issued FSP No. FAS 132(R)-1, which provides guidance regarding an employers’ disclosures about plan assets of a defined benefit pension or other postretirement plan. The FSP is effective for fiscal years ending after December 15, 2009, or the year ending December 31, 2009 for AES. The Company will incorporate the required disclosures in its Form 10-K for the year ending December 31, 2009.
EITF 08-6: Equity Method Investment Accounting Considerations (“EITF 08-6”).
In November 2008 EITF 08-6 was issued. This Issue clarifies the accounting for certain transactions and impairment considerations involving equity method investments. EITF 08-6 makes certain amendments to APB 18,The Equity Method of Accounting for Common Stock. The Company does not expect EITF 08-6 to have a significant impact on current practice. EITF 08-6 is effective for fiscal years beginning on or after December 15, 2008, and interim periods within those fiscal years, consistent with the effective dates of Statement 141(R) and Statement 160, or January 1, 2009 for AES.
Capital Resources and Liquidity
Overview
As discussed in Highlights of 2008, the Company began a number of initiatives as early as October 2007 and continuing throughout 2008 to mitigate our refinancing risks and manage our liquidity at the Parent Company as well as our subsidiaries. These efforts included reducing our discretionary growth investments, extending and smoothing our future debt maturities, and reducing our planned spending for overhead and development expenses.
As a result of these efforts, Parent Company Liquidity at December 31, 2008 was approximately $1.4 billion. This is available to service $260 million of investment commitments over the next three years, which includes $154 million of scheduled debt maturities in 2009, before considering cash inflows and outflows related to distributions from subsidiaries, overhead and development expenses as well as cash taxes at the Parent Company.
As of December 31, 2008, the Company had unrestricted cash and cash equivalents of $0.9 billion and short term investments of $1.4 billion. In addition, we had restricted cash and debt service reserves of $1.4 billion. The Company also had non-recourse and recourse aggregate principal amounts of debt outstanding of $12.9 billion and $5.2 billion, respectively. Of the approximately $1.1 billion of our short-term non-recourse debt $945 million is presented as current because it is due in the next twelve months and $129 million relates to defaulted debt. We expect such maturities will be repaid from net cash provided by operating activities of the subsidiary to which the debt relates or through opportunistic refinancing activity or some combination thereof. Approximately $0.2 billion of our recourse debt matures within the next twelve months which we expect to repay using cash on hand at the Parent Company or through net cash provided by operating activities.
48
We rely mainly on long-term debt obligations to fund our project development, construction and acquisition activities. We have, to the extent achievable, utilized non-recourse debt to fund a significant portion of the capital expenditures and investments required to construct and acquire our electric power plants, distribution companies and related assets. Our non-recourse financing is designed to limit cross default risk to the Parent Company or other subsidiaries and affiliates and is generally secured by the capital stock, physical assets, contracts and cash flow of the related subsidiary or affiliate. Generally our non-recourse long-term debt is a combination of fixed and variable interest rate instruments. A portion or all of our variable rate non-recourse debt is generally fixed through the use of interest rate swaps. In addition, the debt is typically denominated in the currency that matches the currency expected to be received for revenue generated from the benefiting project thereby reducing currency risk. As of December 31, 2008, approximately 92% of the Company’s non-recourse debt is denominated in currency matched to the local currency of the subsidiary that incurred the debt. In certain cases the currency is matched through the use of derivative instruments. These derivatives can require that the Company post collateral to support the currency match. As of December 31, 2008, Gener had posted $25 million in the form of a letter of credit and $46 million in bank deposits to support this type of swap. Our non-recourse debt is funded by international commercial banks, multilateral institutions and local regional banks. For more information on our long-term debt, see Note 10—Long-Term Debt to the Consolidated Financial Statements included in Item 8 of this Form 8-K.
Given its long-term debt obligations, the Company is subject to interest rate risk on debt balances that accrue interest at variable rates. When possible, the Company will borrow funds at fixed interest rates or hedge its variable rate debt to fix its interest costs on such obligations. In addition, the Company historically has tried to maintain at least 70% of its consolidated long-term obligations at fixed rates of interest including through the use of interest rate swaps and other interest rate related derivatives. These efforts apply to the notional amount of the swaps compared to the amount of related underlying debt. While the Company believes that this represents an economic hedge, the Company may be required to mark-to-market all or a portion of these interest rate swaps and other derivatives. Presently, The Parent Company’s only exposure to variable interest rate debt relates to indebtedness under its senior secured and unsecured credit facilities. On a consolidated basis, of the Company’s $18.1 billion of total debt outstanding as of December 31, 2008, approximately $3.4 billion bore interest at variable rates of interest that was not subject to an interest rate swap which fixed the interest rate.
In addition to utilizing non-recourse debt at a subsidiary level when available, the Parent Company provides a portion, or in certain instances all, of the remaining long-term financing or credit required to fund development, construction or acquisition of a particular project. These investments have generally taken the form of equity investments or loans, which are subordinated to the project’s non-recourse loans. We generally obtain the funds for these investments from our cash flows from operations and/or the proceeds from our issuances of debt, common stock and other securities, as well as proceeds from the sales of assets. Similarly, in certain of our businesses, we may provide financial guarantees or other credit support for the benefit of counterparties who have entered into contracts for the purchase or sale of electricity with our subsidiaries or lenders. In such circumstances, if a subsidiary defaults on its payment or supply obligation, we will be responsible for the subsidiary’s obligations up to the amount provided for in the relevant guarantee or other credit support. At December 31, 2008, we had provided outstanding financial and performance-related guarantees or other credit support commitments to or for the benefit of our subsidiaries, which were limited by the terms of the agreements, in an aggregate of approximately $411 million (excluding investment commitments and those collateralized by letters of credit and other obligations discussed below).
As a result of the Parent Company’s below investment grade rating, as well as economic conditions that might have an effect on the appetite for corporate credit, counterparties may be unwilling to accept our general unsecured commitments to provide credit support. Accordingly, with respect to both new and existing commitments, we may be required to provide some other form of assurance, such as a letter of credit, to backstop or replace our credit support. We may not be able to provide adequate assurances to such counterparties. In addition, to the extent we are required and able to provide letters of credit or other collateral to such counterparties; this will reduce the amount of credit available to us to meet our other liquidity needs. At
49
December 31, 2008, we had $207 million in letters of credit outstanding, which operate to guarantee performance relating to certain project development activities and subsidiary operations. These letters of credit were provided under our revolver and senior unsecured credit facility. We paid letter of credit fees that averaged approximately 3.4% per annum in 2008 on the outstanding amounts.
We expect to continue to seek, where possible, non-recourse debt financing in connection with the assets or businesses that our affiliates or we may develop, construct or acquire. However, depending on local and global market conditions and the unique characteristics of individual businesses, non-recourse debt may not be available or may not be available on economically attractive terms. See Credit Crisis and Macroeconomic Environment discussion above. If we decide not to provide any additional funding or credit support to a subsidiary project that is under construction or has near-term debt payment obligations and that subsidiary is unable to obtain additional non-recourse debt, such subsidiary may become insolvent, and we may lose our investment in such subsidiary. Additionally, if any of our subsidiaries lose a significant customer, the subsidiary may need to withdraw from a project or restructure the non-recourse debt financing. If we or such subsidiary chooses not to proceed with a project or is unable to successfully complete a restructuring of the non-recourse debt, we may lose our investment in such subsidiary.
Many of our subsidiaries depend on timely and continued access to capital markets to manage their liquidity needs. The inability to raise capital on favorable terms, to refinance existing indebtedness or to fund operations and other commitments during times of political or economic uncertainty may have material adverse effects on the financial condition and results of operations of those subsidiaries. In addition, changes in the timing of tariff increases or delays in the regulatory determinations under the relevant concessions could affect the cash flows and results of operations of our businesses.
Capital Expenditures
The Company spent $2.9 billion, $2.4 billion and $1.5 billion on capital expenditures in 2008, 2007 and 2006, respectively. A significant majority of these costs were funded with non-recourse debt consistent with our financial strategy. At December 31, 2008, the Company had a total of $1.8 billion of availability under long-term non-recourse construction credit facilities. As more fully described in Credit Crisis and Macroeconomic Environment above, we have taken steps to dramatically decrease the amount of new discretionary capital spending. We expect to continue funding projects that are currently in the construction phase using existing capital provided by these non-recourse credit facilities as supplemented by internally generated cash flows, Parent Company liquidity, contribution from existing or new partners and other funding sources. As a result, property, plant and equipment and long-term non-recourse debt are expected to increase over the next few years even though the rate of discretionary spending has been decreased. While we believe we have the resources to continue funding the projects in construction, there can be no assurances that we will continue to fund all these existing construction efforts.
As of December 31, 2008, the Parent Company had $260 million in commitments to invest in our subsidiaries projects under construction and to purchase related equipment, excluding $151 million of such obligations already included in the letters of credits discussed above. The Company expects to fund these net investment commitments over time according to the following schedule: $166 million in 2009, $39 million in 2010 and $55 million in 2011. The exact payment schedules will be dictated by the construction milestones. We expect to fund these commitments from a combination of current liquidity and internally generated Parent Company cash flow.
The Company continues to assess the possible need for capital expenditures associated with international, federal, regional and state regulation of GHG emissions from electric power generation facilities. Legislation and regulations regarding GHG emissions, if enacted, may place significant costs on GHG emissions from fossil fuel-fired electric power generation facilities, particularly coal-fired facilities, and in order to comply, CO2 emitting facilities may be required to purchase additional GHG emissions allowances or offsets under cap-and-trade programs, pay a carbon tax or to install new pollution-control equipment to capture and reduce the amount of
50
GHG emitted from the facilities, in the event that reliable technology to do so is developed. The capital expenditures required to comply with any future GHG legislation and regulations could be significant and unless such costs can be passed on to customers or counterparties, such regulations could impair the profitability of some of the electric power generation facilities operated by our subsidiaries or render certain of them uneconomical to operate, either of which could have a material adverse effect on our consolidated results of operations and financial condition.
With respect to our operations outside the United States, certain of the businesses operated by the Company’s subsidiaries are subject to compliance with EU ETS and the Kyoto Protocol in certain countries and other country-specific programs to regulate GHG emissions. To date, compliance with the Kyoto Protocol and EU ETS has not had a material adverse effect on the Company’s consolidated results of operations, financial condition and cash flows because of, among other factors, the cost of GHG emission allowances and/or the ability of our businesses to pass the cost of purchasing such allowances on to customers or counterparties. However, in the event that such counterparties or regulatory authorities challenge our ability to pass these costs on, there can be no assurance that the Company and/or the relevant subsidiary would prevail in any such dispute. Furthermore, even if the Company and/or the relevant subsidiary does prevail, it would be subject to the cash and administrative burden associated with such dispute.
As discussed in Item 1: Business—Regulatory Matters—Environmental and Land Use Regulations, in the United States there presently are no federal laws or regulations regulating GHG emissions, although several legislative proposals are currently under consideration. In 2008, the Company’s subsidiaries operated businesses which had total approximate CO2 emissions of 83.8 million metric tonnes (ownership adjusted). Approximately 41.5 million metric tonnes of the 83.8 million metric tonnes were emitted in the United States (both figures ownership adjusted). Approximately 11.8 million metric tonnes were emitted in U.S. states participating in the RGGI. At this time, the federal legislative proposals under consideration applicable to electric power generation facilities generally incorporate market- based cap-and-trade programs which authorize facilities to comply through the acquisition of emissions allowances in lieu of capital expenditures. Certain of the states, either alone or as part of a regional initiative, in which our subsidiaries operate are in the process of developing programs to reduce GHG emissions, primarily CO2, from the electric power generation facilities through cap-and-trade programs, which would allow CO2 emitting facilities to comply by purchase additional GHG emissions allowances or offsets under cap-and-trade programs or by installing new pollution- control equipment to capture and reduce the amount of GHG emitted from the facilities, in the event that reliable technology to do so is developed. We believe that legislative or regulatory actions, if enacted, may require a material increase in capital expenditures at our subsidiaries.
In the future the actual impact on our subsidiaries’ capital expenditures from any potential federal program to regulate and reduce GHG emissions, if enacted, and the state and regional programs in the process of development, will depend on a number of factors, including among others, the GHG reductions required under any such legislation or regulations, the price and availability of offsets, the extent to which our subsidiaries would be entitled to receive GHG emissions allowances without having to purchase them, the quantity of allowances which our subsidiaries would have to purchase, the price of allowances, our subsidiaries’ ability to recover or pass through costs incurred to comply with any legislative or regulatory requirements that are ultimately imposed and the use of market-based compliance options such as cap-and-trade programs. Another factor is the success of our climate solutions business, which may generate credits that will help offset our GHG emissions. However, as set forth in the Risk Factor titled “Our renewable energy projects and other initiatives face considerable uncertainties including development, operational and regulatory challenges,” there is no guarantee that the climate solutions business will be successful. Even if our climate solutions business is successful, the level of benefit is unclear with regard to the impact of legislation or litigation concerning GHG emissions.
51
Common Stock Repurchase Program
On August 7, 2008, the Company’s Board of Directors approved a share repurchase plan of up to $400 million of its outstanding common stock over a six month period ending February 7, 2009. From the inception of the plan through December 31, 2008, the Company repurchased 10,691,267 shares at a total cost of $143 million, including commissions, using cash balances on hand. There were no share repurchases in the fourth quarter of 2008. No shares were repurchased subsequent to December 31, 2008 and the board authorization of the plan expired on February 7, 2009.
Consolidated Cash Flows
| | | | | | | | | | | | | | | | | |
| | | | | | | | | | $ Change |
Years Ended December 31, | | 2008 | | 2007 | | 2006 | | | 2008 vs. 2007 | | | 2007 vs. 2006 |
| (in millions) | | | | | | | | | | | | |
Net cash provided by operating activities | | $ | 2,175 | | $ | 2,353 | | $ | 2,348 | | | $ | (178 | ) | | $ | 5 |
Net cash used in investing activities | | | 3,581 | | | 1,970 | | | 907 | | | | 1,611 | | | | 1,063 |
Net cash provided by (used in) financing activities | | | 362 | | | 244 | | | (1,317 | ) | | | 118 | | | | 1,561 |
Operating Activities
Net cash provided by operating activities decreased $178 million to $2,175 million during 2008 compared to $2,353 million during 2007. Excluding the decrease in net cash provided by operating activities from EDC in Venezuela, which was sold in May 2007, net cash provided by operating activities would have decreased $37 million. This decrease was partially due to a decrease of approximately $101 million at IPL in North America primarily due to an increase in regulatory assets, higher working capital requirements and an increase in employer pension contributions; $77 million at our Latin America Utilities due to an increase in regulatory assets primarily comprised of recoverable purchased energy costs, partially offset by improved net working capital; $65 million at our Asia Generation businesses due to decreased net operating results, principally due to losses at our newly acquired business in the Philippines, and increased receivables due to delayed offtaker payments and increased commodity prices impacting our Pakistan business; $45 million at our renewables businesses due to decreased margin performance and additional working capital requirements; and additional interest related to Parent Company debt. These decreases were partially offset by an increase in net cash provided by operating activities at our Latin America Generation businesses of approximately $250 million primarily due to improved margin performance and a decrease in cash used by one Brazilian subsidiary to pay income taxes in 2008 compared to 2007 as tax credits were the primary payment method in 2008. In addition, our Europe Utilities and Africa Utilities, both reported in Corporate and Other, experienced an increase in net cash provided by operating activities of approximately $65 million due to improved performance and net working capital.
Investing Activities
Net cash used for investing activities increased $1,611 million to $3,581 million during 2008 compared to net cash used of $1,970 million during 2007. This increase was largely attributable to the acquisition of Masinloc in the Philippines.
Acquisitions, net of cash acquired totaled $1,135 million in 2008 compared to $315 million during 2007, an increase of $820 million. Masinloc is a 660 gross MW coal-fired thermal power generation facility purchased during the second quarter of 2008 for cash of approximately $930 million, as discussed in Note 22—Acquisitions and Dispositions to the Consolidated Financial Statements included in Item 8 of this Form 8-K. We also acquired Mountain View in the U.S. during the first quarter of 2008. The activity in 2007 was mainly due to the purchase of two 230 MW petroleum coke-fired power plants at TEG/TEP in Mexico and the purchase of 51% interest in a joint venture with 26 MW existing capacity and a 390 MW development pipeline of hydroelectric projects in Turkey.
52
Other significant investing activities included:
Capital expenditures totaled $2,850 million during 2008 compared to $2,425 million during 2007, an increase of $425 million. The increase was mainly due to a net increased spending of $370 million for plant construction at Gener and $144 million for wind development projects at our U.S. businesses which were partially offset by a decrease of $154 million due to completion of a plant at Maritza in Bulgaria in 2007.
Proceeds from the sale of businesses totaled $1,328 million in 2008 and $1,136 million in 2007. The proceeds in 2008 included $1,084 million from the sale of Ekibastuz, a coal-fired generation plant, and Maikuben, a coal mine, in Kazakhstan, $171 million in net proceeds from the sale of a 10% ownership interest in AES Gener and $73 million in proceeds from the sale of Jiaozuo. In 2007 proceeds from the sale of businesses included $739 million from the sale of EDC, $331 million in proceeds from the sale of an 11% ownership interest in Gener, $51 million from the sale of Central Valley in the U.S. and $17 million for the sale of Eden in Argentina.
The purchase of short-term investments, net of sales totaled $319 million in 2008, a $171 million decrease compared to 2007. These transactions included increases in net sales of $323 million and $209 million at Eletropaulo and Uruguaiana, respectively, as a result of a change to the investment strategy to acquire public debt and government securities. This was offset by a $229 million increase in net purchases at Brasiliana Energia in Brazil related to certificates of deposit, government debt securities and money market funds, a $93 million increase in net purchases at Alicura in Argentina related to the purchase of short-term bonds in 2008 and a $56 million increase in net purchases at Tietê in Brazil as the result of a change in investment strategy to invest in Brazilian government bonds.
Restricted cash balances increased $295 million in 2008. Restricted cash balances increased $215 million at Gener, $72 million at Chigen, $70 million at Kilroot, $24 million at TEG/TEP, and $20 million at Southland. These were offset by decreases of $49 million at New York, $30 million at Maritza, $18 million at Ebute in Nigeria and $14 million at Alicura.
Cash used for advances to affiliate and equity investments was $240 million in 2008, an increase of $208 million, primarily from our investment in AES Solar. Additionally, the Company also made additional equity investments in Turkish Hydros and Asia renewables for the Huanghua joint venture wind project in Asia.
Loan advances were $173 million in 2008, which consisted primarily of the Company’s acquisition of a convertible loan from a Brazilian wind development business in the first quarter of 2008.
Financing Activities
Net cash provided by financing activities increased $118 million to $362 million during 2008 compared to $244 million during 2007. This $118 million change was primarily attributable to an increase in debt, net of repayments of $138 million, a decrease in distributions to noncontrolling interests of $102 million and an increase in contributions from noncontrolling interests of $36 million offset by an increase in the purchase of treasury stock of $143 million under the Company’s common stock repurchase plan.
Net borrowings under revolving credit facilities were $298 million during 2008, compared to net repayments of $85 million during 2007. This increase in net borrowings of $383 million was primarily due to a $126 million reduction in repayments at IPL, $116 million in repayments at Buffalo Gap 2 in the U.S. in 2007, an increase in borrowings of $60 million, $48 million, $23 million, and $12 million at Pak Gen, Lal Pir, our Panama business, and CAESS in El Salvador, respectively.
Issuances of recourse and non-recourse debt during 2008 were $2,783 million compared to $4,297 million during 2007. This decrease of $1,514 million was primarily due to a decrease in the issuance of recourse debt at the Parent Company of $1,375 million and issuances of non-recourse debt during 2007 of $454 million at TEG/TEP and $446 million at Eletropaulo. These decreases were offset in part by increases in the issuance of non-recourse debt of $629 million at Masinloc and $229 million at IPL.
53
Repayments of recourse debt and non-recourse debt during 2008 were $2,297 million compared to $3,566 million during 2007. This decrease of $1,269 million was predominately due to a decrease in repayments of non-recourse debt of $515 million at Eletropaulo and $443 million at TEG/TEP, a decrease in repayments of recourse debt of $278 million at the Parent Company, and decreases in repayments of non-recourse debt of $226 million at Gener, $96 million at Alicura, $94 million at Kilroot, and $83 million at Sonel. These decreases were offset in part by increases in repayments of non-recourse debt of $309 million at IPL and $251 million at Buffalo Gap 3 in the U.S.
Distributions to noncontrolling interests were $597 million during 2008 compared to $699 million during 2007. This decrease of $102 million was primarily due to higher dividends paid to minorities (BNDES) at Brasiliana Energia during 2007.
Contributions from noncontrolling interests were $410 million during 2008 compared to $374 million during 2007. This increase of $36 million was primarily due to current year contributions of $240 million at Buffalo Gap 3, $77 million at Mountain View I and II and $52 million at Gener offset by the receipt of a contribution of $313 million from the tax equity partners at Buffalo Gap 2 in 2007.
Contractual Obligations
A summary of our contractual obligations, commitments and other liabilities as of December 31, 2008 is presented in the table below (in millions):
| | | | | | | | | | | | | | | | | | | | |
Contractual Obligations | | Total | | Less
than 1
year | | 1-3 years | | 4-5 years | | 5 years
and more | | Other | | Footnote
Reference |
Debt Obligations (1) | | $ | 18,030 | | $ | 1,219 | | $ | 2,690 | | $ | 2,399 | | $ | 11,722 | | $ | — | | 10 |
Interest Payments on Long-Term Debt (2) | | $ | 10,597 | | | 1,363 | | | 2,533 | | | 2,082 | | | 4,619 | | | — | | n/a |
Capital Lease Obligations (3) | | $ | 158 | | | 11 | | | 17 | | | 14 | | | 116 | | | — | | 11 |
Operating Lease Obligations (4) | | $ | 493 | | | 64 | | | 118 | | | 118 | | | 193 | | | — | | 11 |
Sale Leaseback Obligations (5) | | $ | 744 | | | 39 | | | 84 | | | 90 | | | 531 | | | — | | 11 |
Electricity Obligations (6) | | $ | 47,265 | | | 1,754 | | | 4,387 | | | 5,039 | | | 36,085 | | | — | | 11 |
Fuel Obligations (7) | | $ | 21,841 | | | 2,113 | | | 3,260 | | | 2,728 | | | 13,740 | | | — | | 11 |
Other Purchase Obligations (8) | | $ | 20,924 | | | 2,403 | | | 2,467 | | | 1,700 | | | 14,354 | | | — | | 11 |
Other Long-term Liabilities Reflected on AES’s Consolidated Balance Sheet under GAAP (9) | | $ | 1,055 | | | 27 | | | 162 | | | 59 | | | 641 | | | 166 | | n/a |
| | | | | | | | | | | | | | | | | | | | |
Total | | $ | 121,107 | | $ | 8,993 | | $ | 15,718 | | $ | 14,229 | | $ | 82,001 | | $ | 166 | | |
| | | | | | | | | | | | | | | | | | | | |
| (1) | Includes recourse and non-recourse debt presented on the Consolidated Financial Statements. Non-recourse debt borrowings are not a direct obligation of AES, the Parent Company. Recourse debt represents the direct borrowings of AES, the Parent Company. See Note 10—Long-Term Debt to the Consolidated Financial Statements included in Item 8 of this Form 8-K which provides additional disclosure regarding these obligations. These amounts exclude capital lease obligations which are included in the capital lease category, see (3) below. |
| (2) | Interest payments are estimated based on final maturity dates of debt securities outstanding at December 31, 2008 and do not reflect anticipated future refinancing, early redemptions or new debt issuances. Variable rate interest obligations are estimated based on rates as of December 31, 2008. |
| (3) | Several AES subsidiaries have leases for operating and office equipment and vehicles that are classified as capital leases within Property, Plant and Equipment. Minimum contractual obligations include $96 million of imputed interest. |
| (4) | The Company was obligated under long-term non-cancelable operating leases, primarily for office rental and site leases. These amounts exclude amounts related to the sale/leaseback discussed below in item (5). |
54
| (5) | Sale/Leaseback Obligations—represent a sales/leaseback with operating lease treatment at one of our New York subsidiaries. |
| (6) | Operating subsidiaries of the Company have entered into contracts for the purchase of electricity from third parties. |
| (7) | Operating subsidiaries of the Company have entered into fuel purchase contracts subject to termination only in certain limited circumstances. |
| (8) | Amounts relate to other contractual obligations where the Company has an enforceable and legally binding agreement to purchase goods or services that specifies all significant terms, including: quantity, pricing, and approximate timing. These amounts include planned capital expenditures that are contractually obligated. |
| (9) | These amounts do not include current liabilities on the Consolidated Balance Sheet except for the current portion of FIN No. 48 obligations. See the indicated notes to the Consolidated Financial Statements included in Item 8 of this Form 8-K for additional information on the items excluded. Derivatives (See Note 5—Derivative Instruments) and incentive compensation are excluded as the Company is not able to reasonably estimate the timing or amount of the future payments. In addition, the amounts do not include: (1) regulatory liabilities (See Note—9 Regulatory Assets and Liabilities), (2) contingencies (See Note 12—Contingencies), (3) pension and other post retirement employee benefit liabilities (see Note 13—Benefit Plans) or (4) any taxes (See Note 20—Income Taxes) except for FIN No. 48 obligations. Noncurrent FIN No. 48 obligations are reflected in the “Other” column of the table above as the Company is not able to reasonably estimate the timing of the future payments. |
Parent Company Liquidity
The following discussion of “Parent Company Liquidity” has been included because we believe it is a useful measure of the liquidity available to The AES Corporation, or the Parent Company, given the non-recourse nature of most of our indebtedness. Parent Company liquidity as outlined below is a non-GAAP measure and should not be construed as an alternative to cash and cash equivalents which are determined in accordance with GAAP, as a measure of liquidity. Cash and cash equivalents are disclosed in the Consolidated Statements of Cash Flows and the parent only unconsolidated statements of cash flows in Schedule I of this Form 8-K. Parent Company liquidity may differ from similarly titled measures used by other companies. The principal sources of liquidity at the Parent Company level are:
| | • | | dividends and other distributions from our subsidiaries, including refinancing proceeds; |
| | • | | proceeds from debt and equity financings at the Parent Company level, including borrowings under our credit facilities; and |
| | • | | proceeds from asset sales. |
Cash requirements at the Parent Company level are primarily to fund:
| | • | | principal repayments of debt; |
| | • | | construction commitments; |
| | • | | other equity commitments; |
| | • | | Parent Company overhead and development costs. |
The Company defines Parent Company Liquidity as cash available to the Parent Company plus available borrowings under existing credit facilities. The cash held at qualified holding companies represents cash sent to subsidiaries of the Company domiciled outside of the U.S. Such subsidiaries have no contractual restrictions on
55
their ability to send cash to the Parent Company. Parent Company Liquidity is reconciled to its most directly comparable U.S. GAAP financial measure, “cash and cash equivalents” at December 31, 2008 and 2007 as follows:
| | | | | | | | | |
Parent Company Liquidity | | 2008 | | 2007 | | 2006 |
| | | (in millions) |
Cash and cash equivalents | | $ | 903 | | $ | 2,043 | | $ | 1,347 |
Less: Cash and cash equivalents at subsidiaries | | | 656 | | | 728 | | | 1,090 |
| | | | | | | | | |
Parent and qualified holding companies cash and cash equivalents | | | 247 | | | 1,315 | | | 257 |
| | | | | | | | | |
Borrowing available under revolving credit facility | | | 720 | | | 520 | | | 662 |
Borrowing available under senior unsecured credit facility | | | 423 | | | 318 | | | 227 |
| | | | | | | | | |
Total Parent Company Liquidity | | $ | 1,390 | | $ | 2,153 | | $ | 1,146 |
| | | | | | | | | |
Recourse Debt Transactions:
Financing and Tender Offer
In the second quarter of 2008, the Company completed a number of debt-related transactions that resulted in a net reduction of approximately $360 million of recourse debt. These transactions included $223 million of debt paid at maturity, the repurchase of the tendered $762 million of senior notes maturing from 2009 to 2013, and the issuance of $625 million of 8% Senior Unsecured Notes at par value due 2020. The notes repaid at maturity included $223 million outstanding 6.0% Junior Subordinated Convertible Debentures due May 15, 2008 and 8.75% Senior Unsecured Notes due June 15, 2008. On May 15, 2008, we issued $625 million of 8% Senior Unsecured Notes due 2020 (“2020 Notes”) at par value. Deferred financing costs attributable to the issuance of the 2020 Notes were approximately $10 million.
On June 19, 2008, the Company repurchased $762 million of senior notes maturing from 2009 to 2013 in connection with a tender process. Specifically, the Company repurchased $313 million of the 9.50% Senior Notes due 2009, (the “2009 Notes”), $209 million of the 9.375% Senior Notes due 2010, (the “2010 Notes”), $178 million of the 8.875% Senior Notes due 2011, (the “2011 Notes”) and $62 million of the 8.75% Second Priority Senior Secured Notes due 2013 (the “2013 Notes”). The Company recognized and included a pre-tax loss on the retirement of the senior notes for the year ended December 31, 2008 of $55 million in “Other expense” which included $52 million of tender consideration.
In connection with the tender offer for the senior notes, the Company also solicited and received consents from the note holders of the 2013 Notes to amend the related indenture so that the covenants conform substantially to the covenants contained in the indenture governing the Company’s senior unsecured notes, with the exception of those covenants related to security.
Amendment of Credit Agreement
On July 29, 2008, The AES Corporation and certain subsidiary guarantors amended and restated the Company’s existing senior secured credit facility pursuant to the terms of the Fourth Amended and Restated Credit and Reimbursement Agreement, dated as of July 29, 2008 (the “Amended and Restated Credit Agreement”). The Amended and Restated Credit Agreement provides for a $200 million term loan facility maturing on August 10, 2011, and $750 million revolving credit facility maturing on June 23, 2010.
The Company entered into the Amended and Restated Credit Agreement to, among other things: (i) increase the size of the Restricted Payments basket; (ii) reduce the required minimum Cash Flow Coverage Ratio (as defined therein) and increase the maximum Recourse Debt to Cash Flow Ratio (as defined therein); (iii) clarify and make modifications in the provisions that permit hedging activities; and (iv) make certain other changes,
56
such as excluding certain equity-like securities from the definition of Recourse Debt, amending the financial reporting and environmental notice requirements, clarifying that the term “Permitted Business” includes climate solutions, carbon offsets, biofuels, battery storage and ancillary businesses, including related trading activities and amending certain other definitions and covenants.
Recourse Debt:
Our recourse debt at year-end was approximately $5.2 billion, $5.6 billion, and $4.8 billion in 2008, 2007 and 2006, respectively. The following table sets forth our Parent Company contingent contractual obligations as of December 31, 2008:
| | | | | | | |
Contingent Contractual Obligations | | Amount | | Number of
Agreements | | Exposure Range
for Each
Agreement |
| | | (in millions) | | | | (in millions) |
Guarantees | | $ | 411 | | 34 | | <$1 – $ 53 |
Letters of credit under the revolving credit facility | | | 30 | | 4 | | <$1 – $ 28 |
Letters of credit under the senior unsecured credit facility | | | 177 | | 15 | | <$1 – $131 |
| | | | | | | |
Total | | $ | 618 | | 53 | | |
| | | | | | | |
As of December 31, 2008, the Company had $260 million of commitments to invest in subsidiaries under construction and to purchase related equipment, excluding $151 million of such obligations already included in the letters of credits discussed above. The Company expects to fund these net investment commitments over time according to the following schedule: $166 million in 2009, $39 million in 2010 and $55 million in 2011. The exact payment schedules will be dictated by the construction milestones. We expect to fund these commitments from a combination of current liquidity and internally generated Parent Company cash flow.
We have a diverse portfolio of performance related contingent contractual obligations. These obligations are designed to cover potential risks and only require payment if certain targets are not met or certain contingencies occur. The risks associated with these obligations include change of control, construction cost overruns, subsidiary default, political risk, tax indemnities, spot market power prices, supplies support and liquidated damages under power sales agreements for projects in development, in operation and under construction. While we do not expect that we will be required to fund any material amounts under these contingent contractual obligations during 2009 or beyond, many of the events which would give rise to such obligations are beyond our control. We can provide no assurance that we will be able to fund our obligations under these contingent contractual obligations if we are required to make substantial payments thereunder.
While we believe that our sources of liquidity will be adequate to meet our needs for the foreseeable future, this belief is based on a number of material assumptions, including, without limitation, assumptions about our ability to access the capital markets (see “Credit Crisis and the Macroeconomic Environment”), the operating and financial performance of our subsidiaries, currency exchange rates, power market pool prices, and the ability of our subsidiaries to pay dividends. In addition, our subsidiaries’ ability to declare and pay cash dividends to us (at the Parent Company level) is subject to certain limitations contained in loans, governmental provisions and other agreements. We can provide no assurance that these sources will be available when needed or that the actual cash requirements will not be greater than anticipated. We have met our interim needs for shorter-term and working capital financing at the Parent Company level with our secured revolving credit facility and senior unsecured credit facility. See Item 1A Risk Factors, “The AES Corporation is a holding company and its ability to make payments on its outstanding indebtedness, including its public debt securities, is dependent upon the receipt of funds from its subsidiaries by way of dividends, fees, interest, loans or otherwise.”
Various debt instruments at the Parent Company level, including our senior secured credit facilities, contain certain restrictive covenants. The covenants provide for, among other items:
| | • | | limitations on other indebtedness, liens, investments and guarantees; |
57
| | • | | limitations on dividends, stock repurchases and other equity transactions; |
| | • | | restrictions and limitations on mergers and acquisitions, sales of assets, leases, transactions with affiliates and off balance sheet and derivative arrangements; |
| | • | | maintenance of certain financial ratios; and |
| | • | | financial and other reporting requirements. |
As of December 31, 2008, we were in compliance with these covenants.
Non-Recourse Debt:
While the lenders under our non-recourse debt financings generally do not have direct recourse to the Parent Company, defaults thereunder can still have important consequences for our results of operations and liquidity, including, without limitation:
| | • | | reducing our cash flows as the subsidiary will typically be prohibited from distributing cash to the parent level during the time period of any default; |
| | • | | triggering our obligation to make payments under any financial guarantee, letter of credit or other credit support we have provided to or on behalf of such subsidiary; |
| | • | | causing us to record a loss in the event the lender forecloses on the assets; and |
| | • | | triggering defaults in our outstanding debt at the parent level. |
For example, our senior secured credit facilities and outstanding debt securities at the parent level include events of default for certain bankruptcy related events involving material subsidiaries. In addition, our revolving credit agreement at the parent level includes events of default related to payment defaults and accelerations of outstanding debt of material subsidiaries.
Some of our subsidiaries are currently in default with respect to all or a portion of their outstanding indebtedness. The total non-recourse debt classified as current in the accompanying Consolidated Balance Sheets amounts to $1.1 billion. The portion of current debt related to such defaults was $129 million at December 31, 2008, all of which was non-recourse debt related to three subsidiaries—Aixi, Kelanitissa and Kilroot.
None of the subsidiaries that are currently in default are subsidiaries that currently meet the applicable definition of materiality in AES’s corporate debt agreements in order for such defaults to trigger an event of default or permit acceleration under such indebtedness. At December 31, 2008 none of our subsidiaries met the definition of material subsidiary under our recourse debt agreements. However, as a result of additional dispositions of assets, other significant reductions in asset carrying values or other matters in the future that may impact our financial position and results of operations or the financial position of the individual subsidiary, it is possible that one or more of these subsidiaries could fall within the definition of a “material subsidiary” and thereby upon an acceleration trigger an event of default and possible acceleration of the indebtedness under the AES Parent Company’s outstanding debt securities.
Off-Balance Sheet Arrangements
In May 1999, one of our subsidiaries acquired six electric generating plants from New York State Electric and Gas. Concurrently, the subsidiary sold two of the plants to an unrelated third party for $666 million and simultaneously entered into a leasing arrangement with the unrelated party. In May 2007, the subsidiary purchased a portion of the lessor’s interest in a trust estate that holds the leased plants. Future minimum lease commitments under the lease agreement have been reduced by the subsidiary’s interest in the plants. We have accounted for this transaction as a sale/leaseback transaction with operating lease treatment. We expense periodic
58
lease payments as incurred, which amounted to $34 million, $42 million and $54 million for the years ended December 31, 2008, 2007 and 2006, respectively. We are not subject to any additional liabilities or contingencies if the arrangement terminates and we believe that the dissolution of the off-balance sheet arrangement would have minimal effects on our operating cash flows. The terms of the lease include restrictive covenants such as the maintenance of certain coverage ratios. Historically, the plants have satisfied the restrictive covenants of the lease and there are no known trends or uncertainties that would indicate that the lease will be terminated early. See Note 11—Commitments to the Consolidated Financial Statements included in Item 8 of this Form 8-K for a more complete discussion of this transaction.
IPL, a consolidated subsidiary of the Company, formed IPL Funding Corporation (“IPL Funding”) in 1996 as a special-purpose entity, consolidated by IPL, to purchase retail receivables originated by IPL pursuant to a receivables sale agreement entered into with IPL. At the same time, IPL Funding entered into a purchase facility (the “Purchase Facility”) with unrelated parties (the “Purchasers”) pursuant to which the Purchasers agree to purchase from IPL Funding, on a revolving basis, up to $50 million, of interests in the pool of receivables purchased from IPL. As collections reduce accounts receivable included in the pool, IPL Funding sells ownership interests in additional receivables acquired from IPL to return the ownership interests sold up to a maximum of $50 million, as permitted by the Purchase Facility. During 2008, the Purchase Facility was extended through May 27, 2009. Accounts receivable on the Company’s Consolidated Balance Sheets are stated net of the $50 million sold.
IPL and IPL Funding provide certain indemnities to the Purchasers, including indemnification in the event that there is a breach of representations and warranties made with respect to the purchased receivables. IPL Funding and IPL each have agreed to indemnify the Purchasers on an after-tax basis for any and all damages, losses, claims, liabilities, penalties, taxes, costs and expenses at any time imposed on or incurred by the indemnified parties arising out of or otherwise relating to the purchase facility, subject to certain limitations as defined in the Purchase Facility.
Under the Purchase Facility, if IPL fails to maintain certain financial covenants regarding interest coverage and debt-to-capital ratios, it would constitute a “termination event.” As of December 31, 2008, IPL was in compliance with such covenants. In addition, as a result of IPL’s current credit rating, the facility agent has the ability to (i) replace IPL as the collection agent; and (ii) declare a “lock-box” event. Under a lock-box event or a termination event, the facility agent has the ability to require all proceeds of purchased receivables of IPL to be directed to lock-box accounts within 45 days of notifying IPL. A termination event would also (i) give the facility agent the option to take control of the lock-box account, and (ii) give the Purchasers the option to discontinue the purchase of additional interests in receivables and cause all proceeds of the purchased interests to be used to reduce the Purchaser’s investment and to pay other amounts owed to the Purchasers and the facility agent. This would have the effect of reducing the operating capital available to IPL by the aggregate amount of such purchased interests in receivables (currently $50 million). Please refer to Note 25—Off-Balance Sheet and Related Party Transactions to the Consolidated Financial Statements in Item 8 of this Form 8-K for further details on IPL’s servicing responsibilities and indemnification requirements under the Purchase Facility.
59
| ITEM 8. | FINANCIAL STATEMENTS AND SUPPLEMENTARY DATA |
REPORT OF INDEPENDENT REGISTERED PUBLIC ACCOUNTING FIRM
ON THE FINANCIAL STATEMENTS
The Board of Directors and Stockholders of The AES Corporation:
We have audited the accompanying consolidated balance sheet of The AES Corporation and its subsidiaries as of December 31, 2008, and the related consolidated statements of operations, stockholders’ equity and cash flows for the year then ended. Our audit also included the financial statement schedule for the year ended December 31, 2008 listed on pages S2-S6. These financial statements and schedule are the responsibility of the Company’s management. Our responsibility is to express an opinion on these financial statements and schedule based on our audit.
We conducted our audit in accordance with the standards of the Public Company Accounting Oversight Board (United States). Those standards require that we plan and perform the audit to obtain reasonable assurance about whether the financial statements are free of material misstatement. An audit includes examining, on a test basis, evidence supporting the amounts and disclosures in the financial statements. An audit also includes assessing the accounting principles used and significant estimates made by management, as well as evaluating the overall financial statement presentation. We believe that our audit provides a reasonable basis for our opinion.
In our opinion, the financial statements referred to above present fairly, in all material respects, the consolidated financial position of The AES Corporation and its subsidiaries at December 31, 2008, and the consolidated results of their operations and their cash flows for the year ended December 31, 2008, in conformity with U.S. generally accepted accounting principles. Also, in our opinion, the related financial statement schedule for the year ended December 31, 2008, when considered in relation to the basic financial statements taken as a whole, present fairly, in all material respects, the information set forth therein.
As discussed in Note 1 to the consolidated financial statements, on January 1, 2009, The AES Corporation adopted Statement of Financial Accounting Standards No. 160, “Noncontrolling Interests in Consolidated Financial Statements—an amendment of ARB No. 51” (SFAS No. 160) and retrospectively adjusted all periods presented in its consolidated financial statements for the change.
We also have audited, in accordance with the standards of the Public Company Accounting Oversight Board (United States), The AES Corporation’s internal control over financial reporting as of December 31, 2008, based on criteria established in Internal Control-Integrated Framework issued by the Committee of Sponsoring Organizations of the Treadway Commission and our report dated February 26, 2009 expressed an unqualified opinion thereon.
/s/ Ernst & Young LLP
McLean, Virginia
February 26, 2009,
except for Notes 1, 8, 14, 15 and 17 related to the effect of the adoption of Statement of Financial Accounting Standards No. 160, “Noncontrolling Interests in Consolidated Financial Statements—an amendment of ARB No. 51,” and the change in reportable segments, as to which the date is September 14, 2009
60
REPORT OF INDEPENDENT REGISTERED PUBLIC ACCOUNTING FIRM
ON THE FINANCIAL STATEMENTS
To the Board of Directors and Stockholders of
The AES Corporation
Arlington, VA
We have audited the accompanying consolidated balance sheet of The AES Corporation and subsidiaries (the “Company”) as of December 31, 2007 and the related consolidated statements of operations, changes in equity, and cash flows for each of the two years in the period ended December 31, 2007. Our audits also included the 2007 and 2006 information in the financial statement schedule on pages S2 - S6. These financial statements and financial statement schedule are the responsibility of the Company’s management. Our responsibility is to express an opinion on the financial statements and financial statement schedule based on our audits.
We conducted our audits in accordance with the standards of the Public Company Accounting Oversight Board (United States). Those standards require that we plan and perform the audit to obtain reasonable assurance about whether the financial statements are free of material misstatement. An audit includes examining, on a test basis, evidence supporting the amounts and disclosures in the financial statement. An audit also includes assessing the accounting principles used and significant estimates made by management, as well as evaluating the overall financial statement presentation. We believe that our audits provide a reasonable basis for our opinion.
In our opinion, such consolidated financial statements present fairly, in all material respects, the financial position of The AES Corporation and subsidiaries as of December 31, 2007 and the results of their operations and their cash flows for each of the two years in the period ended December 31, 2007, in conformity with accounting principles generally accepted in the United States of America. Also, in our opinion, such financial statement schedule, when considered in relation to the basic financial statements taken as a whole, presents fairly, in all material respects, the information set forth therein.
As discussed in Note 1 to the consolidated financial statements, the Company adopted Financial Accounting Standards Board Interpretation No. 48,“Accounting for Uncertainty in Income Taxes” in 2007 and Statement of Financial Accounting Standards No. 158,“Employers’ Accounting for Defined Benefit Pension and Other Postretirement Plans” in 2006.
As also discussed in Notes 1, 8, 14, 15 and 17 to the consolidated financial statements, the accompanying 2007 and 2006 financial statements have been adjusted for the retroactive application of Statement of Financial Accounting Standards No. 160,“Noncontrolling Interests in Consolidated Financial Statements, an amendment of ARB No. 51,” which was adopted by the Company on January 1, 2009, and for the changes in reportable segments that occurred in the first quarter of 2009.
/s/ Deloitte & Touche LLP
McLean, Virginia
March 14, 2008
(September 11, 2009 as to the effects of the adoption of Statement of Financial Accounting Standards No. 160,“Noncontrolling Interests in Consolidated Financial Statements, an amendment of ARB No. 51”described in the Noncontrolling Interests section of Note 1, Note 14 and Note 17, and the changes in reportable segments described in Notes 8 and 15, and February 26, 2009 as to the Discontinued Operations and Reclassifications section of Note 1 and Note 21)
61
THE AES CORPORATION
CONSOLIDATED BALANCE SHEETS
DECEMBER 31, 2008 AND 2007
| | | | | | | | |
| | | 2008 | | | 2007 | |
| | | (in millions) | |
ASSETS | | | | | | | | |
CURRENT ASSETS | | | | | | | | |
Cash and cash equivalents | | $ | 903 | | | $ | 2,043 | |
Restricted cash | | | 729 | | | | 522 | |
Short-term investments | | | 1,382 | | | | 1,306 | |
Accounts receivable, net of reserves of $254 and $255, respectively | | | 2,233 | | | | 2,252 | |
Inventory | | | 564 | | | | 476 | |
Receivable from affiliates | | | 31 | | | | 56 | |
Deferred income taxes—current | | | 180 | | | | 283 | |
Prepaid expenses | | | 177 | | | | 137 | |
Other current assets | | | 1,117 | | | | 1,076 | |
Current assets of discontinued and held for sale businesses | | | — | | | | 185 | |
| | | | | | | | |
Total current assets | | | 7,316 | | | | 8,336 | |
| | | | | | | | |
NONCURRENT ASSETS | | | | | | | | |
Property, Plant and Equipment: | | | | | | | | |
Land | | | 854 | | | | 1,041 | |
Electric generation, distribution assets, and other | | | 24,654 | | | | 24,682 | |
Accumulated depreciation | | | (7,515 | ) | | | (7,519 | ) |
Construction in progress | | | 3,410 | | | | 1,770 | |
| | | | | | | | |
Property, plant and equipment, net | | | 21,403 | | | | 19,974 | |
| | | | | | | | |
Other assets: | | | | | | | | |
Deferred financing costs, net of accumulated amortization of $272 and $227, respectively | | | 366 | | | | 352 | |
Investments in and advances to affiliates | | | 901 | | | | 730 | |
Debt service reserves and other deposits | | | 636 | | | | 568 | |
Goodwill | | | 1,421 | | | | 1,416 | |
Other intangible assets, net of accumulated amortization of $185 and $173, respectively | | | 500 | | | | 466 | |
Deferred income taxes—noncurrent | | | 567 | | | | 647 | |
Other assets | | | 1,696 | | | | 1,698 | |
Noncurrent assets of discontinued and held for sale businesses | | | — | | | | 266 | |
| | | | | | | | |
Total other assets | | | 6,087 | | | | 6,143 | |
| | | | | | | | |
TOTAL ASSETS | | $ | 34,806 | | | $ | 34,453 | |
| | | | | | | | |
LIABILITIES AND EQUITY | | | | | | | | |
CURRENT LIABILITIES | | | | | | | | |
Accounts payable | | $ | 1,042 | | | $ | 1,067 | |
Accrued interest | | | 252 | | | | 255 | |
Accrued and other liabilities | | | 2,660 | | | | 2,626 | |
Non-recourse debt—current portion | | | 1,074 | | | | 1,142 | |
Recourse debt—current portion | | | 154 | | | | 223 | |
Current liabilities of discontinued and held for sale businesses | | | — | | | | 169 | |
| | | | | | | | |
Total current liabilities | | | 5,182 | | | | 5,482 | |
| | | | | | | | |
LONG-TERM LIABILITIES | | | | | | | | |
Non-recourse debt | | | 11,869 | | | | 11,293 | |
Recourse debt | | | 4,994 | | | | 5,332 | |
Deferred income taxes—noncurrent | | | 1,132 | | | | 1,187 | |
Pension and other post-retirement liabilities | | | 1,017 | | | | 921 | |
Other long-term liabilities | | | 3,525 | | | | 3,754 | |
Long-term liabilities of discontinued and held for sale businesses | | | — | | | | 79 | |
| | | | | | | | |
Total long-term liabilities | | | 22,537 | | | | 22,566 | |
| | | | | | | | |
Commitments and Contingent Liabilities (see Notes 11 and 12) | | | | | | | | |
Cumulative preferred stock of subsidiary | | | 60 | | | | 60 | |
EQUITY | | | | | | | | |
THE AES CORPORATION STOCKHOLDERS’ EQUITY | | | | | | | | |
Common stock ($0.01 par value, 1,200,000,000 shares authorized; 673,478,012 issued and 662,786,745 outstanding at December 31, 2008 and 670,339,855 issued and outstanding at December 31, 2007) | | | 7 | | | | 7 | |
Additional paid-in capital | | | 6,832 | | | | 6,776 | |
Accumulated deficit | | | (8 | ) | | | (1,241 | ) |
Accumulated other comprehensive loss | | | (3,018 | ) | | | (2,378 | ) |
Treasury stock, at cost (10,691,267 and 0 shares at December 31, 2008 and 2007, respectively) | | | (144 | ) | | | — | |
| | | | | | | | |
Total The AES Corporation stockholders’ equity | | | 3,669 | | | | 3,164 | |
NONCONTROLLING INTERESTS | | | 3,358 | | | | 3,181 | |
| | | | | | | | |
Total equity | | | 7,027 | | | | 6,345 | |
| | | | | | | | |
TOTAL LIABILITIES AND EQUITY | | $ | 34,806 | | | $ | 34,453 | |
| | | | | | | | |
See Accompanying Notes to these Consolidated Financial Statements
62
THE AES CORPORATION
CONSOLIDATED STATEMENTS OF OPERATIONS
YEARS ENDED DECEMBER 31, 2008, 2007, AND 2006
| | | | | | | | | | | | |
| | | 2008 | | | 2007 | | | 2006 | |
| | | (in millions, except per share amounts) | |
Revenues: | | | | | | | | | | | | |
Regulated | | $ | 7,772 | | | $ | 6,867 | | | $ | 6,154 | |
Non-Regulated | | | 8,298 | | | | 6,649 | | | | 5,355 | |
| | | | | | | | | | | | |
Total revenues | | | 16,070 | | | | 13,516 | | | | 11,509 | |
| | | | | | | | | | | | |
Cost of Sales: | | | | | | | | | | | | |
Regulated | | | (5,567 | ) | | | (4,747 | ) | | | (4,075 | ) |
Non-Regulated | | | (6,796 | ) | | | (5,377 | ) | | | (4,015 | ) |
| | | | | | | | | | | | |
Total cost of sales | | | (12,363 | ) | | | (10,124 | ) | | | (8,090 | ) |
| | | | | | | | | | | | |
Gross margin | | | 3,707 | | | | 3,392 | | | | 3,419 | |
| | | | | | | | | | | | |
General and administrative expenses | | | (371 | ) | | | (379 | ) | | | (301 | ) |
Interest expense | | | (1,844 | ) | | | (1,788 | ) | | | (1,769 | ) |
Interest income | | | 540 | | | | 500 | | | | 434 | |
Other expense | | | (163 | ) | | | (255 | ) | | | (451 | ) |
Other income | | | 379 | | | | 358 | | | | 116 | |
Gain on sale of investments | | | 909 | | | | — | | | | 98 | |
(Loss) gain on sale of subsidiary stock | | | (31 | ) | | | 134 | | | | (535 | ) |
Impairment expense | | | (175 | ) | | | (408 | ) | | | (17 | ) |
Foreign currency transaction (losses) gains on net monetary position | | | (185 | ) | | | 24 | | | | (80 | ) |
Other non-operating expense | | | (15 | ) | | | (57 | ) | | | — | |
| | | | | | | | | | | | |
INCOME FROM CONTINUING OPERATIONS BEFORE INCOME TAXES AND EQUITY IN EARNINGS OF AFFILIATES | | | 2,751 | | | | 1,521 | | | | 914 | |
Income tax expense | | | (774 | ) | | | (679 | ) | | | (359 | ) |
Net equity in earnings of affiliates | | | 33 | | | | 76 | | | | 73 | |
| | | | | | | | | | | | |
INCOME FROM CONTINUING OPERATIONS | | | 2,010 | | | | 918 | | | | 628 | |
Income from operations of discontinued businesses, net of income tax expense of $4, $29 and $83, respectively | | | 12 | | | | 79 | | | | 115 | |
Gain (loss) from disposal of discontinued businesses, net of income tax benefit of $—, $8 and $— respectively | | | 6 | | | | (661 | ) | | | (57 | ) |
| | | | | | | | | | | | |
INCOME (LOSS) BEFORE EXTRAORDINARY ITEMS | | | 2,028 | | | | 336 | | | | 686 | |
Extraordinary items, net of income tax expense of $—, $— and $— | | | — | | | | — | | | | 21 | |
| | | | | | | | | | | | |
NET INCOME | | | 2,028 | | | | 336 | | | | 707 | |
Less: Income attributable to noncontrolling interests | | | (794 | ) | | | (431 | ) | | | (460 | ) |
| | | | | | | | | | | | |
NET INCOME ATTRIBUTABLE TO THE AES CORPORATION | | $ | 1,234 | | | $ | (95 | ) | | $ | 247 | |
| | | | | | | | | | | | |
BASIC EARNINGS (LOSS) PER SHARE: | | | | | | | | | | | | |
Income from continuing operations attributable to The AES Corporation common stockholders, net of tax | | $ | 1.82 | | | $ | 0.73 | | | $ | 0.25 | |
Discontinued operations attributable to The AES Corporation common stockholders, net of tax | | | 0.02 | | | | (0.87 | ) | | | 0.09 | |
Extraordinary items attributable to The AES Corporation common stockholders, net of tax | | | — | | | | — | | | | 0.03 | |
| | | | | | | | | | | | |
NET INCOME ATTRIBUTABLE TO THE AES CORPORATION COMMON STOCKHOLDERS | | $ | 1.84 | | | $ | (0.14 | ) | | $ | 0.37 | |
| | | | | | | | | | | | |
DILUTED EARNINGS (LOSS) PER SHARE: | | | | | | | | | | | | |
Income from continuing operations attributable to The AES Corporation common stockholders, net of tax | | $ | 1.80 | | | $ | 0.72 | | | $ | 0.25 | |
Discontinued operations attributable to The AES Corporation common stockholders, net of tax | | | 0.02 | | | | (0.86 | ) | | | 0.09 | |
Extraordinary items attributable to The AES Corporation common stockholders, net of tax | | | — | | | | — | | | | 0.03 | |
| | | | | | | | | | | | |
NET INCOME ATTRIBUTABLE TO THE AES CORPORATION COMMON STOCKHOLDERS | | $ | 1.82 | | | $ | (0.14 | ) | | $ | 0.37 | |
| | | | | | | | | | | | |
AMOUNTS ATTRIBUTABLE TO THE AES CORPORATION COMMON STOCKHOLDERS: | | | | | | | | | | | | |
Income from continuing operations, net of tax | | $ | 1,216 | | | $ | 487 | | | $ | 168 | |
Discontinued operations, net of tax | | | 18 | | | | (582 | ) | | | 58 | |
Extraordinary items, net of tax | | | — | | | | — | | | | 21 | |
| | | | | | | | | | | | |
Net income | | $ | 1,234 | | | $ | (95 | ) | | $ | 247 | |
| | | | | | | | | | | | |
See Accompanying Notes to these Consolidated Financial Statements
63
THE AES CORPORATION
CONSOLIDATED STATEMENTS OF CASH FLOWS
YEARS ENDED DECEMBER 31, 2008, 2007, AND 2006
| | | | | | | | | | | | |
| | | 2008 | | | 2007 | | | 2006 | |
| | | (in millions) | |
OPERATING ACTIVITIES: | | | | | | | | | | | | |
Net income | | $ | 2,028 | | | $ | 336 | | | $ | 707 | |
Adjustments to net income: | | | | | | | | | | | | |
Depreciation and amortization | | | 1,001 | | | | 942 | | | | 933 | |
(Gain) loss from sale of investments and impairment expense | | | (712 | ) | | | 333 | | | | 471 | |
(Gain) loss on disposal and impairment write-down—discontinued operations | | | (7 | ) | | | 669 | | | | 57 | |
Provision for deferred taxes | | | 160 | | | | 210 | | | | (10 | ) |
Contingencies | | | 52 | | | | 196 | | | | 173 | |
Loss on the extinguishment of debt | | | 56 | | | | 92 | | | | 148 | |
Other | | | 127 | | | | (13 | ) | | | 34 | |
Changes in operating assets and liabilities: | | | | | | | | | | | | |
(Increase) decrease in accounts receivable | | | (451 | ) | | | (306 | ) | | | 94 | |
(Increase) decrease in inventory | | | (83 | ) | | | (26 | ) | | | (3 | ) |
(Increase) decrease in prepaid expenses and other current assets | | | (47 | ) | | | 361 | | | | (115 | ) |
(Increase) decrease in other assets | | | (467 | ) | | | (134 | ) | | | 147 | |
Increase (decrease) in accounts payable and accrued liabilities | | | 260 | | | | (322 | ) | | | (473 | ) |
Increase (decrease) in income taxes and other income tax payables, net | | | 226 | | | | (140 | ) | | | (51 | ) |
Increase (decrease) in other liabilities | | | 32 | | | | 155 | | | | 236 | |
| | | | | | | | | | | | |
Net cash provided by operating activities | | | 2,175 | | | | 2,353 | | | | 2,348 | |
| | | | | | | | | | | | |
INVESTING ACTIVITIES: | | | | | | | | | | | | |
Capital expenditures | | | (2,850 | ) | | | (2,425 | ) | | | (1,460 | ) |
Acquisitions—net of cash acquired | | | (1,135 | ) | | | (315 | ) | | | (19 | ) |
Proceeds from the sale of businesses | | | 1,328 | | | | 1,136 | | | | 898 | |
Proceeds from the sale of assets | | | 105 | | | | 16 | | | | 24 | |
Sale of short-term investments | | | 5,150 | | | | 2,492 | | | | 2,011 | |
Purchase of short-term investments | | | (5,469 | ) | | | (2,982 | ) | | | (2,359 | ) |
(Increase) decrease in restricted cash | | | (295 | ) | | | (28 | ) | | | (8 | ) |
(Decrease) increase in debt service reserves and other assets | | | (100 | ) | | | 122 | | | | 39 | |
Affiliate advances and equity investments | | | (240 | ) | | | (32 | ) | | | (18 | ) |
Loan advances | | | (173 | ) | | | — | | | | — | |
Other investing | | | 98 | | | | 46 | | | | (15 | ) |
| | | | | | | | | | | | |
Net cash used in investing activities | | | (3,581 | ) | | | (1,970 | ) | | | (907 | ) |
| | | | | | | | | | | | |
FINANCING ACTIVITIES: | | | | | | | | | | | | |
Borrowings (repayments) under the revolving credit facilities, net | | | 298 | | | | (85 | ) | | | 72 | |
Issuance of recourse debt | | | 625 | | | | 2,000 | | | | — | |
Issuance of non-recourse debt | | | 2,158 | | | | 2,297 | | | | 3,097 | |
Repayments of recourse debt | | | (1,037 | ) | | | (1,315 | ) | | | (150 | ) |
Repayments of non-recourse debt | | | (1,260 | ) | | | (2,251 | ) | | | (4,059 | ) |
Payments for deferred financing costs | | | (82 | ) | | | (97 | ) | | | (86 | ) |
Distributions to noncontrolling interests | | | (597 | ) | | | (699 | ) | | | (335 | ) |
Contributions from noncontrolling interests | | | 410 | | | | 374 | | | | 125 | |
Financed capital expenditures | | | (47 | ) | | | (35 | ) | | | (52 | ) |
Purchase of treasury stock | | | (143 | ) | | | — | | | | — | |
Other financing | | | 37 | | | | 55 | | | | 71 | |
| | | | | | | | | | | | |
Net cash provided by (used in) financing activities | | | 362 | | | | 244 | | | | (1,317 | ) |
Effect of exchange rate changes on cash | | | (96 | ) | | | 69 | | | | 62 | |
| | | | | | | | | | | | |
Total increase (decrease) in cash and cash equivalents | | | (1,140 | ) | | | 696 | | | | 186 | |
Cash and cash equivalents, beginning | | | 2,043 | | | | 1,347 | | | | 1,161 | |
| | | | | | | | | | | | |
Cash and cash equivalents, ending | | $ | 903 | | | $ | 2,043 | | | $ | 1,347 | |
| | | | | | | | | | | | |
SUPPLEMENTAL DISCLOSURES: | | | | | | | | | | | | |
Cash payments for interest, net of amounts capitalized | | $ | 1,615 | | | $ | 1,762 | | | $ | 1,718 | |
Cash payments for income taxes, net of refunds | | $ | 465 | | | $ | 621 | | | $ | 479 | |
SCHEDULE OF NONCASH INVESTING AND FINANCING ACTIVITIES: | | | | | | | | | | | | |
Assets acquired in acquisition of subsidiary | | $ | 1,097 | | | $ | 434 | | | $ | — | |
Non-recourse debt assumed in acquisition of subsidiary | | $ | — | | | $ | 647 | | | $ | — | |
Liabilities extinguished due to sale of assets | | $ | — | | | $ | 134 | | | $ | 30 | |
Liabilities assumed in acquisition of subsidiary | | $ | 49 | | | $ | 37 | | | $ | — | |
Assets acquired in noncash asset exchange | | $ | 18 | | | $ | — | | | $ | — | |
Assets disposed of in noncash asset exchange | | $ | 4 | | | $ | — | | | $ | — | |
See Accompanying Notes to these Consolidated Financial Statements
64
THE AES CORPORATION
CONSOLIDATED STATEMENTS OF CHANGES IN EQUITY
YEARS ENDED DECEMBER 31, 2008, 2007, AND 2006
| | | | | | | | | | | | | | | | | | | | | | | | | | | | | | | |
| | | THE AES CORPORATION STOCKHOLDERS | | | | | | | |
| | | Common Stock | | Treasury Stock | | | Additional
Paid-In
Capital | | | Accumulated
Deficit | | | Accumulated Other
Comprehensive
Loss | | | Noncontrolling
Interests | | | Consolidated
Comprehensive
Income | |
| | | Shares | | Amount | | Shares | | Amount | | | | | | |
| | | (in millions) | |
Balance at January 1, 2006 | | 655.9 | | $ | 7 | | — | | $ | — | | | $ | 6,566 | | | $ | (1,340 | ) | | $ | (3,650 | ) | | $ | 1,527 | | | | | |
Net income | | — | | | — | | — | | | — | | | | — | | | | 247 | | | | — | | | | 460 | | | $ | 707 | |
Income from operations of discontinued businesses | | — | | | — | | — | | | — | | | | — | | | | — | | | | — | | | | 21 | | | | | |
Effect of SFAS No. 158 recognition of funded status, net of income tax | | — | | | — | | — | | | — | | | | — | | | | — | | | | 94 | | | | — | | | | — | |
Subsidiary sale of stock | | — | | | — | | — | | | — | | | | (35 | ) | | | — | | | | — | | | | — | | | | — | |
Change in fair value of available-for-sale securities, net of income tax | | — | | | — | | — | | | — | | | | — | | | | — | | | | (3 | ) | | | — | | | | (3 | ) |
Foreign currency translation adjustment, net of income tax | | — | | | — | | — | | | — | | | | — | | | | — | | | | 691 | | | | 111 | | | | 802 | |
Minimum pension liability adjustment, net of income tax | | — | | | — | | — | | | — | | | | — | | | | — | | | | 5 | | | | 69 | | | | 74 | |
Change in derivative fair value, including a reclassification to earnings, net of income tax | | — | | | — | | — | | | — | | | | — | | | | — | | | | 269 | | | | 7 | | | | 276 | |
| | | | | | | | | | | | | | | | | | | | | | | | | | | | | | | |
Other comprehensive income | | | | | | | | | | | | | | | | | | | | | | | | | | | | | | 1,149 | |
| | | | | | | | | | | | | | | | | | | | | | | | | | | | | | | |
Total comprehensive income | | | | | | | | | | | | | | | | | | | | | | | | | | | | | $ | 1,856 | |
| | | | | | | | | | | | | | | | | | | | | | | | | | | | | | | |
Capital contributions from noncontrolling interests | | — | | | — | | — | | | — | | | | — | | | | — | | | | — | | | | 493 | | | | | |
Dividends declared to noncontrolling interests | | — | | | — | | — | | | — | | | | — | | | | — | | | | — | | | | (398 | ) | | | | |
Purchase of subsidiary stock | | — | | | — | | — | | | — | | | | — | | | | — | | | | — | | | | (10 | ) | | | | |
Sale of subsidiary stock | | — | | | — | | — | | | — | | | | — | | | | — | | | | — | | | | 587 | | | | | |
Issuance of common stock under benefit plans and exercise of stock options and warrants | | 9.2 | | | — | | — | | | — | | | | 97 | | | | — | | | | — | | | | — | | | | | |
Stock compensation | | — | | | — | | — | | | — | | | | 31 | | | | — | | | | — | | | | — | | | | | |
| | | | | | | | | | | | | | | | | | | | | | | | | | | | | | | |
Balance at December 31, 2006 | | 665.1 | | $ | 7 | | — | | $ | — | | | $ | 6,659 | | | $ | (1,093 | ) | | $ | (2,594 | ) | | $ | 2,867 | | | | | |
| | | | | | | | | | | | | | | | | | | | | | | | | | | | | | | |
Net income (loss) | | — | | | — | | — | | | — | | | | — | | | | (95 | ) | | | — | | | | 431 | | | | 336 | |
Income from operations of discontinued businesses | | — | | | — | | — | | | — | | | | — | | | | — | | | | — | | | | 21 | | | | | |
Cumulative effect of adoption of FIN No. 48 | | — | | | — | | — | | | — | | | | — | | | | (53 | ) | | | — | | | | — | | | | — | |
Change in fair value of available-for-sale securities, net of income tax | | | | | | | | | | | | | | — | | | | — | | | | 3 | | | | — | | | | 3 | |
Foreign currency translation adjustment, net of income tax | | — | | | — | | — | | | — | | | | — | | | | — | | | | 324 | | | | 319 | | | | 643 | |
Change in unfunded pensions obligation, net of income tax | | — | | | — | | — | | | — | | | | — | | | | — | | | | 8 | | | | (11 | ) | | | (3 | ) |
Change in derivative fair value, including a reclassification to earnings, net of income tax | | — | | | — | | — | | | — | | | | — | | | | — | | | | (119 | ) | | | (15 | ) | | | (134 | ) |
| | | | | | | | | | | | | | | | | | | | | | | | | | | | | | | |
Other comprehensive income | | | | | | | | | | | | | | | | | | | | | | | | | | | | | | 509 | |
| | | | | | | | | | | | | | | | | | | | | | | | | | | | | | | |
Total comprehensive income | | | | | | | | | | | | | | | | | | | | | | | | | | | | | $ | 845 | |
| | | | | | | | | | | | | | | | | | | | | | | | | | | | | | | |
Capital contributions from noncontrolling interests | | — | | | — | | — | | | — | | | | — | | | | — | | | | — | | | | 290 | | | | | |
Dividends declared to noncontrolling interests | | — | | | — | | — | | | — | | | | — | | | | — | | | | — | | | | (578 | ) | | | | |
Disposition of businesses | | — | | | — | | — | | | — | | | | — | | | | — | | | | — | | | | (143 | ) | | | | |
Issuance of common stock under benefit plans and exercise of stock options and warrants, net of income tax | | 5.2 | | | — | | — | | | — | | | | 85 | | | | — | | | | — | | | | — | | | | | |
Stock compensation | | — | | | — | | — | | | — | | | | 32 | | | | — | | | | — | | | | — | | | | | |
| | | | | | | | | | | | | | | | | | | | | | | | | | | | | | | |
Balance at December 31, 2007 | | 670.3 | | $ | 7 | | — | | $ | — | | | $ | 6,776 | | | $ | (1,241 | ) | | $ | (2,378 | ) | | $ | 3,181 | | | | | |
| | | | | | | | | | | | | | | | | | | | | | | | | | | | | | | |
Net income | | — | | | — | | — | | | — | | | | — | | | | 1,234 | | | | — | | | | 794 | | | | 2,028 | |
Income from operations of discontinued businesses | | — | | | — | | — | | | — | | | | — | | | | — | | | | — | | | | 4 | | | | | |
Foreign currency translation adjustment, net of income tax | | — | | | — | | — | | | — | | | | — | | | | — | | | | (560 | ) | | | (492 | ) | | | (1,052 | ) |
Change in unfunded pensions obligation, net of income tax | | — | | | — | | — | | | — | | | | — | | | | — | | | | (49 | ) | | | (100 | ) | | | (149 | ) |
Change in derivative fair value, including a reclassification to earnings, net of income tax | | — | | | — | | — | | | — | | | | — | | | | — | | | | (31 | ) | | | (37 | ) | | | (68 | ) |
| | | | | | | | | | | | | | | | | | | | | | | | | | | | | | | |
Other comprehensive income | | | | | | | | | | | | | | | | | | | | | | | | | | | | | | (1,269 | ) |
| | | | | | | | | | | | | | | | | | | | | | | | | | | | | | | |
Total comprehensive income | | | | | | | | | | | | | | | | | | | | | | | | | | | | | $ | 759 | |
| | | | | | | | | | | | | | | | | | | | | | | | | | | | | | | |
Capital contributions from noncontrolling interests | | — | | | — | | — | | | — | | | | — | | | | — | | | | — | | | | 619 | | | | | |
Dividends declared to noncontrolling interests | | — | | | — | | — | | | — | | | | — | | | | — | | | | — | | | | (574 | ) | | | | |
Disposition of businesses | | — | | | — | | — | | | — | | | | — | | | | — | | | | — | | | | (37 | ) | | | | |
Effect of SFAS No. 158 measurement date change | | — | | | — | | — | | | — | | | | — | | | | (1 | ) | | | — | | | | — | | | | | |
Acquisition of treasury stock | | — | | | — | | 10.7 | | | (144 | ) | | | — | | | | — | | | | — | | | | — | | | | | |
Issuance of common stock under benefit plans and exercise of stock options and warrants, net of income tax | | 3.2 | | | — | | — | | | — | | | | 30 | | | | — | | | | — | | | | — | | | | | |
Stock compensation | | — | | | — | | — | | | — | | | | 26 | | | | — | | | | — | | | | — | | | | | |
| | | | | | | | | | | | | | | | | | | | | | | | | | | | | | | |
Balance at December 31, 2008 | | 673.5 | | $ | 7 | | 10.7 | | $ | (144 | ) | | $ | 6,832 | | | $ | (8 | ) | | $ | (3,018 | ) | | $ | 3,358 | | | | | |
| | | | | | | | | | | | | | | | | | | | | | | | | | | | | | | |
See Accompanying Notes to these Consolidated Financial Statements
65
THE AES CORPORATION
NOTES TO CONSOLIDATED FINANCIAL STATEMENTS
DECEMBER 31, 2008, 2007, AND 2006
1. GENERAL AND SUMMARY OF SIGNIFICANT ACCOUNTING POLICIES
The AES Corporation is a holding company (the “Parent Company”) that through its subsidiaries and affiliates, (collectively, “AES” or “the Company”) operates a geographically diversified portfolio of electricity generation and distribution businesses.
PRINCIPLES OF CONSOLIDATION—The Consolidated Financial Statements of the Company include the accounts of The AES Corporation, its subsidiaries and controlled affiliates, and variable interest entities (“VIEs”) of which the Company is the primary beneficiary. All intercompany transactions and balances have been eliminated in consolidation.
A VIE is an entity (a) that has a total equity investment at risk that is not sufficient to finance its activities without additional subordinated financial support provided by any parties or (b) where the group of equity holders does not have (i) the ability to make significant decisions about the entity’s activities, (ii) the obligation to absorb the entity’s expected losses or (iii) the right to receive the entity’s expected residual returns or (c) where the voting rights of some equity holders are not proportional to their obligations to absorb expected losses, receive expected residual returns or both, and substantially all of the entity’s activities either involve or are conducted on behalf of an investor that has disproportionately few voting rights.
The Company is considered the primary beneficiary of a VIE and thus consolidates the VIE when the Company absorbs a majority of expected losses of the VIE, receives a majority of expected residual returns of the VIE (unless another enterprise receives this majority), or both. The Company performs a qualitative determination as to which variable interest holder is the primary beneficiary, but, when this is not clear, the Company will make the determination based on a computation and allocation of expected losses and expected residual returns. The primary beneficiary determination has not historically required significant judgments or assumptions to be made.
The Company determines if it is the primary beneficiary when it becomes involved in the VIE. If the Company is the primary beneficiary, it reconsiders this decision when it sells or otherwise disposes of all or part of our variable interests to unrelated parties or if the VIE issues new variable interests to parties other than the Company or its related parties. Conversely, if the Company is not the primary beneficiary, it reconsiders this decision when it acquires additional variable interests in these entities.
EQUITY METHOD INVESTMENTS—Entities (whether or not they are VIEs) over which the Company has the ability to exercise significant influence, but not control, are accounted for using the equity method. The Company periodically assesses the recoverability of its equity method investments. If an identified event or change in circumstances requires an impairment evaluation, management assesses the fair value based on valuation methodologies, including discounted cash flows, estimates of sale proceeds and external appraisals, as appropriate. The difference between the carrying value of the equity method investment and its estimated fair value is recognized as an impairment when the loss in value is deemed other-than-temporary and included in “other non-operating expense” on the Consolidated Statements of Operations.
In accordance with Accounting Principles Board (“APB”) Opinion No. 18,The Equity Method of Accounting for Investments in Common Stock (“APB No. 18”) the Company discontinues the application of the equity method when an investment is reduced to zero and is not otherwise committed to provide further financial support for the investee. The Company resumes the application of the equity method if the investee subsequently reports net income to the extent that the Company’s share of such net income equals the share of net losses not recognized during the period the equity method was suspended.
66
DISCONTINUED OPERATIONS AND RECLASSIFICATIONS—Certain immaterial prior period amounts have been reclassified within the Consolidated Financial Statements to conform with current year presentation. In addition, in December 2008, the Company sold its coal-fired generation plant, Jiaozuo, in China. These operations were considered to be discontinued operations, as defined under Statement of Financial Accounting Standards (“SFAS”) No. 144,Accounting for the Impairment or Disposal of Long-Lived Assets (“SFAS No. 144”), and the prior period Consolidated Financial Statements in this Form 8-K have been restated to reflect this business as a discontinued operation as discussed in Note 21—Discontinued Operations and Held for Sale Businesses.
USE OF ESTIMATES—The preparation of financial statements in conformity with accounting principles generally accepted in the United States of America (“GAAP”) requires the Company to make estimates and assumptions that affect reported amounts of assets and liabilities and disclosures of contingent assets and liabilities at the date of the financial statements, as well as the reported amounts of revenues and expenses during the reporting period. Actual results could differ from those estimates. Items subject to such estimates and assumptions include the carrying value and estimated useful lives of long-lived assets; impairment of goodwill and equity method investments; valuation allowances for receivables and deferred tax assets; the recoverability of deferred regulatory assets and the valuation of certain financial instruments, pension liabilities, environmental liabilities and potential litigation claims and settlements.
CASH AND CASH EQUIVALENTS—The Company considers unrestricted cash on hand, deposits in banks, certificates of deposit and short-term marketable securities with an original or remaining maturity at the date of acquisition of three months or less to be cash and cash equivalents; such balances approximate fair value.
RESTRICTED CASH—Restricted cash includes cash and cash equivalents which are restricted as to withdrawal or usage. The nature of restrictions includes restrictions imposed by the financing agreements such as security deposits kept as collateral, debt service reserves, maintenance reserves and others, as well as restrictions imposed by long-term power purchase agreements (“PPA”).
ALLOWANCE FOR DOUBTFUL ACCOUNTS—The Company maintains an allowance for doubtful accounts for estimated uncollectible accounts receivable. The allowance is based on the Company’s assessment of known delinquent accounts, historical experience and other currently available evidence of the collectibility and the aging of accounts receivable.
INVESTMENTS IN MARKETABLE SECURITIES—Short-term investments in marketable debt and equity securities consist of securities with original or remaining maturities in excess of three months but less than one year.
Marketable debt securities that the Company has both the positive intent and ability to hold to maturity are classified as held-to-maturity and are carried at historical cost. Other marketable securities that the Company does not intend to hold to maturity are classified as available-for-sale or trading and are reflected at fair value. Available-for-sale investments are marked-to-market at the end of each reporting period, with unrealized holding gains or losses, which represent changes in the market value of the investment, reflected in accumulated other comprehensive income (“AOCI”) a separate component of stockholders’ equity. In accordance with SFAS No. 115,Accounting for Certain Investments in Debt and Equity Securities, (“SFAS No. 115”), when there is an other-than-temporary decline in the market value of available-for-sale or held-to-maturity investments, the Company recognizes an impairment charge which is classified as “other non-operating expense” on the Consolidated Statements of Operations. Investments classified as trading are marked-to-market on a periodic basis through the Consolidated Statements of Operations. Interest and dividends on investments are reported in interest income. Gains and losses on sales of investments are determined using the specific identification method.
See Note 6—Fair Value of Financial Instruments and the Company’s Fair Value policy for additional discussion regarding the determination of the fair value of the Company’s investments in marketable debt and equity securities.
67
PROPERTY, PLANT AND EQUIPMENT—Property, plant and equipment are stated at cost. The cost of renewals and betterments that extend the useful life of property, plant and equipment are capitalized.
Construction progress payments, engineering costs, insurance costs, salaries, interest and other costs directly relating to construction in progress are capitalized during the construction period, provided the completion of the project is deemed probable, or expensed at the time the Company determines that development of a particular project is no longer probable. The continued capitalization of such costs is subject to ongoing risks related to successful completion, including those related to government approvals, siting, financing, construction, permitting and contract compliance. Construction in progress balances are transferred to electric generation and distribution assets when each asset is ready for its intended use. Government subsidies are recorded as a reduction in fixed assets and reflected in investing activities.
Depreciation, after consideration of salvage value and asset retirement obligations, is computed primarily using the straight-line method over the estimated useful lives of the assets, which are on a composite or component basis. Maintenance and repairs are charged to expense as incurred. Capital spare parts, including rotable spare parts, are included in electric generation and distribution assets. If the part is considered a component, it is depreciated over its useful life after the part is placed in service. If the part is deemed part of a composite asset, the part is depreciated over its useful life even when being held as a spare part.
DEFERRED FINANCING COSTS—Financing costs are deferred and amortized over the related financing period using the effective interest method or the straight-line method when it does not differ materially from the effective interest method. Make-whole payments in connection with early debt retirements are classified as investing activities.
GOODWILL AND OTHER INTANGIBLES—In accordance with SFAS No. 142,Goodwill and Other Intangible Assets (“SFAS No. 142”), the Company recognizes goodwill for the excess of the cost of an acquired entity over the net amount assigned to assets acquired and liabilities assumed. The Company evaluates goodwill and indefinite-lived intangible assets for impairment on an annual basis and whenever events or changes in circumstances trigger an analysis of its carrying value. The Company’s annual impairment testing date is October 1st. The evaluation of impairment involves comparing the current fair value of each of the Company’s reporting units to their carrying value as required by SFAS No. 142. The income approach using a discounted cash flow model (“DCF Model”) is primarily used in determining the current fair value of its reporting units. Finite-lived intangible assets are amortized over their useful lives which range from 2 - 95 years. The Company accounts for emission allowances as intangible assets and charges them to expense when sold or used; granted allowances are valued at zero.
LONG-LIVED ASSETS—In accordance with SFAS No. 144, the Company evaluates the impairment of long-lived assets based on the projection of undiscounted cash flows when circumstances indicate that the carrying amount of such assets may not be recoverable or the assets meet the held for sale criteria under SFAS No. 144. These events or circumstances may include the relative pricing of wholesale electricity by region, anticipated demand and cost of fuel. If the carrying amount is not recoverable, an impairment charge is recognized for the amount by which the carrying value of the long-lived asset exceeds its fair value. For regulated assets, an impairment charge could be offset by the establishment of a regulatory asset, if recovery through approved rates was probable. For non-regulated assets, an impairment charge would be recognized as a charge against earnings.
The fair value of an asset is the amount at which that asset could be bought or sold in a current transaction between willing parties, that is, other than a forced or liquidation sale. Quoted market prices in active markets are the best evidence of fair value and are used as the basis for measurement, if available. In the absence of quoted market prices for identical or similar assets in active markets, fair value is estimated using various internal and external valuation methods including cash flow projections or other indicators of fair value such as bids received, comparable sales or appraisals.
68
In connection with the periodic evaluation of long-lived assets in accordance with the requirements of SFAS No. 144, the fair value of the asset can vary if different estimates and assumptions would have been used in our applied valuation techniques. In cases of impairment described in Note 19—Impairment Expense, we made our best estimate of fair value using valuation methods based on the most current information at that time. Fluctuations in realized sales proceeds versus the estimated fair value of the asset are generally due to a variety of factors including differences in subsequent market conditions, the level of bidder interest, timing and terms of the transactions and management’s analysis of the benefits of the transaction.
ASSET RETIREMENT OBLIGATIONS—In accordance with SFAS No. 143,Accounting for Asset Retirement Obligations (“SFAS No. 143”), the Company records the fair value of the liability for a legal obligation to retire an asset in the period in which the obligation is incurred. When a new liability is recognized, the Company will capitalize the costs of the liability by increasing the carrying amount of the related long-lived asset. The liability is accreted to its present value each period and the capitalized cost is depreciated over the useful life of the related asset. Upon settlement of the obligation, the Company eliminates the liability and, based on the actual cost to retire, may incur a gain or loss.
CONDITIONAL ASSET RETIREMENT OBLIGATIONS—Pursuant to Financial Accounting Standards Board (“FASB”) Interpretation (“FIN”) No. 47,Accounting for Conditional Asset Retirement Obligations (“FIN No. 47”), the Company records the estimated fair value of conditional asset retirement obligations. The Company’s asset retirement obligations covered by FIN No. 47 primarily include conditional obligations to demolish assets or return assets in good working condition at the end of the contractual or concession term, and for the removal of equipment containing asbestos and other contaminants.
GUARANTOR ACCOUNTING—Pursuant to FIN No. 45,Guarantor’s Accounting and Disclosure Requirements for Guarantees, Including Direct Guarantees of Indebtedness of Others, at the inception of a guarantee, the Company records the fair value of a guarantee as a liability, with the offset dependent on the circumstances under which the guarantee was issued.
INCOME TAXES—Deferred tax assets and liabilities are recognized for the future tax consequences attributable to differences between the financial statement carrying amounts of the existing assets and liabilities, and their respective income tax bases. The Company establishes a valuation allowance when it is more likely than not that all or a portion of a deferred tax asset will not be realized. As discussed in Note 20—Income Taxes, in June 2006, the FASB issued FIN No. 48,Accounting for Uncertainty in Income Taxes, (“FIN No. 48”) which applied to our financial statements beginning January 1, 2007. The Company adopted FIN No. 48 on January 1, 2007 and recognized a cumulative effect of $53 million of applying the provisions of this Interpretation as an adjustment to beginning retained earnings. FIN No. 48 applies to all tax positions accounted for in accordance with SFAS No. 109,Accounting for Income Taxes, (“SFAS No. 109”) and requires the Company’s tax positions to be evaluated under a more-likely-than-not recognition threshold and measurement analysis before they can be recognized for financial statement reporting.
Uncertain tax positions have been classified as noncurrent income tax liabilities unless expected to be paid in one year. The Company’s policy for interest and penalties related to income tax exposures is to recognize interest and penalties as a component of the provision for income taxes in the Consolidated Statements of Operations.
FOREIGN CURRENCY TRANSLATION—A business’ functional currency is the currency of the primary economic environment in which the business operates and is generally the currency in which the business generates and expends cash. Subsidiaries and affiliates whose functional currency is other than the U.S. Dollar translate their assets and liabilities into U.S. Dollars at the current exchange rates in effect at the end of the fiscal period. The revenue and expense accounts of such subsidiaries and affiliates are translated into U.S. Dollars at the average exchange rates that prevailed during the period. Translation adjustments are included in accumulated other comprehensive loss, a separate component of stockholders’ equity. Gains and losses on
69
intercompany foreign currency transactions which are long-term in nature, which the Company does not intend to settle in the foreseeable future, are also recognized in accumulated other comprehensive loss. Gains and losses that arise from exchange rate fluctuations on transactions denominated in a currency other than the functional currency are included in determining net income.
REVENUE RECOGNITION—The revenue of the Utilities business is classified as regulated on the Consolidated Statement of Operations. Revenues from the sale of energy are recognized in the period during which the sale occurs. The calculation of revenues earned but not yet billed is based on the number of days not billed in the month, the estimated amount of energy delivered during those days and the estimated average price per customer class for that month. Differences between actual and estimated unbilled revenues have been immaterial. The revenues from the Generation business are classified as non-regulated and are recognized based upon output delivered and capacity provided at rates as specified under contract terms or prevailing market rates. The Company has businesses wherein it makes sales and purchases of power to and from Independent System Operators (“ISOs”) and Regional Transmission Organizations (“RTOs”). In those instances, the Company accounts for these transactions on a net hourly basis because the transactions are settled on a net hourly basis.
GENERAL AND ADMINISTRATIVE EXPENSES—General and administrative expenses include corporate and other expenses related to corporate staff functions and initiatives, primarily executive management, finance, legal, human resources, information systems and certain development costs which are not allocable to our business segments.
REGULATORY ASSETS AND LIABILITIES—The Company accounts for certain of its regulated operations under the provisions of SFAS No. 71,Accounting for the Effects of Certain Types of Regulation (“SFAS No. 71”). As a result, AES records assets and liabilities that result from the regulated ratemaking process that are not recognized under GAAP for non-regulated entities. Regulatory assets generally represent incurred costs that have been deferred due to the probability of future recovery in customer rates. Regulatory liabilities generally represent obligations to make refunds to customers. Management continually assesses whether the regulatory assets are probable of future recovery by considering factors such as applicable regulatory changes, recent rate orders applicable to other regulated entities and the status of any pending or potential deregulation legislation. If future recovery of costs previously deferred ceases to be probable, the asset write-offs are recognized in continuing operations.
DERIVATIVES—The Company enters into various derivative transactions in order to hedge its exposure to certain market risks. AES primarily uses derivative instruments to manage its interest rate, commodity and foreign currency exposures. The Company does not enter into derivative transactions for trading purposes.
Under SFAS No. 133,Accounting for Derivative Instruments and Hedging Activities (“SFAS No. 133”), as amended, the Company recognizes all derivatives, except those designated as normal purchase or normal sales at inception as either assets or liabilities in the balance sheet and measures those instruments at fair value. Changes in the fair value of derivatives are recognized in earnings unless specific hedge criteria are met. Gains and losses related to derivative instruments that qualify as hedges are recognized in the same category as generated by the underlying asset or liability. Gains or losses on derivatives that do not qualify for hedge accounting are recognized as interest income or expense for interest rate derivatives, foreign currency gains or losses on foreign currency derivatives, and revenue or cost of sales for commodity derivatives.
SFAS No. 133 enables companies to designate qualifying derivatives as hedging instruments based on the exposure being hedged. These hedge designations include fair value hedges and cash flow hedges. Changes in the fair value of a derivative that is highly effective as, and is designated and qualifies as, a fair value hedge are recognized in earnings as offsets to the changes in fair value of the exposure being hedged. Changes in the fair value of a derivative that is highly effective as, and is designated as and qualifies as, a cash flow hedge are deferred in accumulated other comprehensive income and are recognized into earnings as the hedged transactions affect earnings. Any ineffectiveness is recognized in earnings immediately. The ineffective portion is recognized
70
as interest income or expense for interest rate hedges, foreign currency gains or losses on foreign currency hedges, and non-regulated revenue or non-regulated cost of sales for commodity hedges. For all hedge contracts, the Company maintains formal documentation of the hedge and effectiveness testing in accordance with SFAS No. 133. If AES deems that the derivative is not highly effective as a hedge, hedge accounting will be discontinued prospectively.
For cash flow hedges of forecasted transactions, AES estimates the future cash flows represented by the forecasted transactions and evaluates the probability of the occurrence and timing of such transactions. Changes in conditions or the occurrence of unforeseen events could require discontinuance of hedge accounting or could affect the timing of the reclassification of gains or losses on cash flow hedges from accumulated other comprehensive loss into earnings.
See Note 6—Fair Value of Financial Instruments and the Company’s fair value policy for additional discussion regarding the determination of the fair value of the Company’s derivative assets and liabilities.
SHARE-BASED COMPENSATION—The Company accounts for stock-based compensation plans under the fair value recognition provision of SFAS No. 123,Share-Based Payment, as amended by SFAS No. 148,Accounting for Stock-Based Compensation—Transition and Disclosure (“SFAS No. 123(R)”). Currently, the Company uses a Black-Scholes Option pricing model to estimate the fair value of stock options granted to employees.
AES adopted SFAS No. 123(R) effective January 1, 2006. For transition purposes, AES elected the modified prospective application method. Under this application method, SFAS No. 123(R) applies to new awards and to awards modified, repurchased or cancelled after January 1, 2006. The standard requires companies to recognize compensation cost relating to share-based payment transactions in their financial statements. That cost is measured on the grant date based on the fair value of the equity or liability instruments issued and is expensed on a straight-line basis over the requisite service period, net of estimated forfeitures.
In addition, effective January 1, 2006, AES adopted FASB Staff Position (“FSP”) No. SFAS 123(R)-3,Transition Election Related to Accounting for the Tax Effects of Share-Based Payment Awards, which provides the Company the option to use the “short-cut method” for calculating the historical pool of windfall tax benefits upon adoption of SFAS No. 123(R).
SALES OF STOCK BY A SUBSIDIARY—The issuance or sale of previously unissued shares of stock by a subsidiary of the Company are accounted for as capital transactions as permitted by SEC Staff Accounting Bulletin No. 51,Accounting for Sales of Stock by a Subsidiary (“SAB No. 51”). Sales of stock of a subsidiary when no new shares are issued are not treated as capital transactions and may result in either a gain or loss on the sale.
PENSION AND OTHER POSTRETIREMENT PLANS—The Company adopted SFAS No. 158,Employers’ Accounting for Defined Benefit Pension and Other Postretirement Plans (“SFAS No. 158”), effective December 31, 2006, which requires recognition of an asset or liability in the balance sheet reflecting the funded status of pension and other postretirement benefits plans with current-year changes in the funded status recognized in accumulated other comprehensive income. The plan assets are recorded at fair value. The Company recognized a cumulative adjustment to adopt the recognition provisions of SFAS No. 158 as of December 31, 2006. AES adopted the measurement date provisions of the standard, which require a year-end measurement date of plan assets and obligations for all defined benefit plans, for the fiscal year ended December 31, 2008, resulting in a cumulative adjustment to retained earnings of $1 million as of December 31, 2008.
NONCONTROLLING INTERESTS—Effective January 1, 2009, the Company adopted SFAS No. 160,Noncontrolling Interests in Consolidated Financial Statements, an amendment of ARB No. 51 (“SFAS No. 160”), which changed the accounting for and the reporting of minority interest, now referred to as noncontrolling
71
interests, in the Company’s consolidated financial statements. The adoption of SFAS No. 160 resulted in the reclassification of amounts considered to be permanent equity previously classified as minority interest to a separate component of equity titled “Noncontrolling Interests” in the accompanying consolidated balance sheets and statements of changes in equity. Additionally, net income and comprehensive income attributable to noncontrolling interests are reflected separately from consolidated net income and comprehensive income in the accompanying consolidated statements of operations and statements of changes in equity. Financial statements for all periods presented in this Form 8-K have been reclassified to conform to the current year presentation requirements of SFAS No. 160 as required by SEC regulations.
Although in general, the noncontrolling ownership interest in earnings is calculated based on ownership percentage, certain of our wind businesses use the hypothetical liquidation at book value (“HLBV”) method in consolidation. HLBV uses a balance sheet approach, which measures equity in income or loss by calculating the change in the amount of net worth partners are legally able to claim based on a liquidation of the entity at the beginning of a reporting period compared to the end of that period. This method is used in AES Wind ventures which contain agreements designating different allocations of value among investors, where the allocations change in form or percentage over the life of the venture.
FAIR VALUE—The Company adopted SFAS No. 157,Fair Value Measurements (“SFAS No. 157”) for financial assets and liabilities on January 1, 2008. SFAS No. 157 was applied prospectively, except for changes in fair value of existing derivative financial instruments that include an adjustment for a blockage factor, existing hybrid instruments measured at fair value and financial instruments accounted for in accordance with Emerging Issues Task Force (“EITF”) Issue No. 02-3,Issues Involved in Accounting for Derivative Contracts Held for Trading Purposes and Contracts Involved in Energy Trading and Risk Management Activities (“EITF No. 02-3”), under which day one gain or loss recognition was prohibited. For these instruments, the impact of the adoption of SFAS No. 157 can be recorded as an adjustment to beginning retained earnings in the year of adoption. The Company did not have any of these financial instruments; therefore there is no cumulative impact of the adoption of SFAS No. 157 for AES. The adoption of SFAS No. 157 did not materially impact the Company’s financial condition, results of operations, or cash flows.
The Company applies SFAS No. 157 to determine the fair value of short-term and long-term investments in marketable debt and equity securities, included in the balance sheet line items “Short-term investments” and “Other assets (Noncurrent)”, derivative assets, included in “Other current assets” and “Other assets (Noncurrent)” and derivative liabilities, included in “Accrued and other liabilities (current)” and “Other long-term liabilities”. Effective January 1, 2009, the Company will also apply SFAS No. 157 to nonrecurring fair value measurements of nonfinancial assets and liabilities.
Fair value, as defined in SFAS No. 157, is the price that would be received to sell an asset or paid to transfer a liability in an orderly transaction between market participants at the measurement date, or exit price. The principal or most advantageous market should be considered from the perspective of the reporting entity. SFAS No. 157 requires that the Company reflect the assumptions market participants would use in pricing an asset or liability based on the best information available. Reporting entities are required to consider factors that were not previously measured when determining the fair value of financial instruments. These factors include nonperformance risk (the risk that the obligation will not be fulfilled) and credit risk, both of the reporting entity (for liabilities) and of the counterparty (for assets). Due to the decentralization and nature of derivatives (interest rate swaps) associated with the Company’s non-recourse debt, credit risk for AES on such derivatives is assessed at the subsidiary level rather than at the Parent Company level. SFAS No. 157 also excludes transaction costs and any adjustments for blockage factors, which were allowable under previous accounting standards, from the instruments’ fair value determination.
The Company uses valuation techniques and methodologies that maximize the use of observable inputs and minimize the use of unobservable inputs. Where available, fair value is based on observable market prices or parameters or derived from such prices or parameters. Where observable prices or inputs are not available,
72
valuation models are applied. The valuation techniques involve some level of management estimation and judgment, the degree of which is dependent on the price transparency for the instruments or market and the instruments’ complexity.
To increase consistency and enhance disclosure of the fair value of financial instruments, SFAS No. 157 creates a fair value hierarchy to prioritize the inputs used to measure fair value into three categories. A financial instrument’s level within the fair value hierarchy is based on the lowest level of input significant to the fair value measurement, where Level 1 is the highest and Level 3 is the lowest. The three levels are defined as follows:
Level 1—unadjusted quoted prices in active markets accessible by the reporting entity for identical assets or liabilities. Active markets are those in which transactions for the asset or liability occur with sufficient frequency and volume to provide pricing information on an ongoing basis.
Level 2—pricing inputs other than quoted market prices included in Level 1 that are based on observable market data, that are directly or indirectly observable for substantially the full term of the asset or liability. These include quoted market prices for similar assets or liabilities, quoted market prices for identical or similar assets in markets that are not active, adjusted quoted market prices, inputs from observable data such as interest rate and yield curves, volatilities or default rates observable at commonly quoted intervals or inputs derived from observable market data by correlation or other means.
Level 3—pricing inputs that are unobservable, or less observable, from objective sources. Unobservable inputs should only be used to the extent observable inputs are not available. These inputs maintain the concept of an exit price from the perspective of a market participant and should reflect assumptions of other market participants. An entity should consider all market participant assumptions that are available without unreasonable cost and effort. These are given the lowest priority and are generally used in internally developed methodologies to generate management’s best estimate of the fair value when no observable market data is available.
The fair value of the Company’s investments in marketable debt and equity securities is generally based on quoted market prices or other observable market data such as interest rate indices. The Company’s marketable investments are primarily certificates of deposit, government debt securities and money market funds. Derivatives are valued using observable data as inputs into internal valuation models. Additional discussion of the Company’s investments in marketable debt and equity securities can be found in Note 4—Investments in Marketable Securities. The Company’s derivatives primarily consist of interest rate swaps, foreign currency instruments, and commodity and embedded derivatives. Additional discussion regarding the nature of these financial instruments and valuation techniques can be found in Note 6—Fair Value of Financial Instruments.
NEW ACCOUNTING PRONOUNCEMENTS
SFAS No. 157, Fair Value Measurements
In September 2006, the FASB issued SFAS No. 157. SFAS No. 157 provides enhanced guidance for using fair value to measure assets and liabilities, but does not expand the application of fair value accounting to any new circumstances. The Company adopted SFAS No. 157 on January 1, 2008. See the Company’s Fair Value policy footnote above for additional details.
FSP No. 157-1: Application of FASB Statement No. 157 to FASB Statement No. 13 and Other Accounting Pronouncements That Address Fair Value Measurements for Purposes of Lease Classification or Measurement under Statement 13 (“FSP No. 157-1”).
In February 2008, the FASB issued FASB Staff Position (“FSP”) No. 157-1. FSP No. 157-1 excludes SFAS No. 13,Accounting for Leases, (“SFAS No. 13”) and most other accounting pronouncements that address fair value measurement of leases from the scope of SFAS No. 157.
73
FSP No. 157-2: Effective Date of FASB Statement No. 157 (“FSP No. 157-2”).
In February 2008, the FASB issued FSP No. 157-2, which delays the effective date of SFAS No. 157 for all nonrecurring fair value measurements of nonfinancial assets and liabilities until fiscal years beginning after November 15, 2008, or January 1, 2009 for AES. AES continues to evaluate the future impact of SFAS No. 157 on these assets and liabilities but at this time does not believe the impact will be material.
FSP No. 157-3: Determining the Fair Value of a Financial Asset When the Market for That Asset is Not Active (“FSP No. 157-3”).
In October 2008, the FASB issued FSP No. 157-3, which clarifies the application of SFAS No. 157 in a market that is not active and provides an example to illustrate key considerations in determining the fair value of a financial asset when the market for that financial asset is not active. The guidance emphasizes that determining fair value in an inactive market depends on the facts and circumstances and may require the use of significant judgments. FSP No. 157-3 is effective upon issuance, including prior periods for which financial statements have not been issued, and therefore was effective for AES at September 30, 2008. The adoption of FSP No. 157-3 did not have a material impact on the Company.
SFAS No. 159: The Fair Value Option for Financial Assets and Financial Liabilities—including an amendment of FAS No. 115 (“SFAS No. 159”).
In February 2007, the FASB issued SFAS No. 159, which allows entities to choose, at specified election dates, to measure eligible financial assets and liabilities at fair value that are not otherwise required to be measured at fair value. If a company elects the fair value option for an eligible item, changes in that item’s fair value in subsequent reporting periods must be recognized in current earnings. The Company adopted SFAS No. 159 effective January 1, 2008. As allowed by the standard, the Company did not elect the fair value option for the measurement of any eligible assets or liabilities. Therefore, the January 1, 2008 adoption did not have an impact on the Company.
FSP FAS 133-1 and FIN 45-4: Disclosures about Credit Derivatives and Certain Guarantees: An Amendment of FASB Statement No. 133 and FASB Interpretation No.45; and Clarification of the Effective Date of FASB Statement No. 161 (“FSP No. FAS 133-1 & FIN 45-4” or “the FSP”).
In September 2008, the FASB issued the FSP to address the concerns of financial statement users that existing disclosure requirements under SFAS No. 133 do not adequately reflect the potential adverse effects of changes in credit risk on the financial statements of the sellers of credit derivatives. FSP No. FAS 133-1 & FIN 45-4 requires disclosure of additional information about these potential adverse effects of changes in credit risk on the financial position, financial performance, and cash flows of sellers of credit derivatives. The disclosures are required for all credit derivatives, whether freestanding or embedded in a hybrid instrument. The FSP also amends FIN No. 45 to require additional disclosure about the current status of the payment performance risk of a guarantee. This new disclosure applies to all guarantees, not just those related to credit risk. The provisions in the FSP are effective for reporting periods ending after November 15, 2008, or December 31, 2008 for AES. AES has incorporated these additional disclosures into its Form 10-K for the year ended December 31, 2008. Comparative disclosures are required for periods subsequent to adoption. Additionally, the FSP clarifies that SFAS No. 161 is effective for all periods, including quarterly and annual periods beginning after November 15, 2008, or January 1, 2009 for AES.
FSP No. FAS 140-4 and FIN 46(R)-8: Disclosures by Public Entities (Enterprises) about Transfers of Financial Assets and Interests in Variable Interest Entities (“FSP No. FAS 140-4 & FIN 46(R)-8”).
In December 2008, the FASB issued FSP No. FAS 140-4 & FIN 46(R)-8, which expands the required disclosures pertaining to an enterprise’s involvement with VIEs and is intended to provide more transparent information related to that involvement. The new disclosure requirements include additional information
74
regarding consolidated VIEs as well as a requirement for sponsors of a VIE to disclose certain information even if they do not hold a significant financial interest in the VIE. FSP No. FAS 140-4 & FIN 46(R)-8 is effective for reporting periods ending after December 15, 2008 but there was no material impact to our disclosures.
The following accounting standards have been issued, but as of December 31, 2008 are not yet effective and have not been adopted by AES.
SFAS No. 141(revised 2007): Business Combinations (“SFAS No. 141(R)”).
In December 2007, the FASB issued SFAS No. 141(R). SFAS No. 141(R) will significantly change how business acquisitions are accounted for at the acquisition date and in subsequent periods. The standard changes the accounting for the business combination at the acquisition date to a fair value based approach rather than the cost allocation approach currently used. Other differences include changes in the accounting for acquisition related costs, contingencies and income taxes. SFAS No. 141(R) will be effective for public companies for fiscal years beginning on or after December 15, 2008, January 1, 2009 for AES, and will be applied prospectively. Early adoption is prohibited. AES has not completed its analysis of the potential future impact of SFAS No. 141(R).
SFAS No. 160: Noncontrolling Interests in Consolidated Financial Statements, an amendment of ARB No. 51 (“SFAS No. 160”).
SFAS No. 160 significantly revises the provisions of Accounting Research Bulletin (“ARB”) No. 51,Consolidated Financial Statements, related to the allocation of losses to noncontrolling interests, sale of stock of a subsidiary and the deconsolidation of a subsidiary. Under SFAS No. 160, losses continue to be attributed to the noncontrolling interests, even when the noncontrolling interests’ basis has been reduced to zero, rather than allocated to the controlling interest after the associated noncontrolling interests’ basis was reduced to zero. The Company had no material losses that it did not allocate to noncontrolling interests prior to the adoption of SFAS No. 160 and the adoption did not have a material impact.
SFAS No. 160 requires a change in a parent’s ownership interest in a subsidiary when the parent retains its controlling financial interest to be accounted for as an equity transaction. Gains or losses from such transactions are no longer recognized in net income and the carrying values of the subsidiary’s assets (including goodwill) and liabilities are not adjusted. In certain transactions, AES had previously elected an option under SEC Staff Accounting Bulletin (“SAB”) No. 51,Accounting for Sales of Stock by a Subsidiary (“SAB 51”), to recognize a gain or loss on the sale of stock by a subsidiary rather than account for the sale as an equity transaction. This option is no longer available under SFAS No. 160.
A parent company deconsolidates a subsidiary when that parent company no longer controls the subsidiary. When control is lost, the parent-subsidiary relationship no longer exists and the parent derecognizes the assets and liabilities of the subsidiary. In accordance with SFAS No. 160, if the parent company retains a noncontrolling interest, the remaining noncontrolling investment in the subsidiary is remeasured at fair value and is included in the gain or loss recognized upon the deconsolidation of the subsidiary. Under SAB 51, the retained noncontrolling interest in the subsidiary was not adjusted to fair value.
SFAS No. 161: Disclosures about Derivative Instruments and Hedging Activities, an amendment of SFAS No. 133 (“SFAS No. 161”).
In March 2008, the FASB issued SFAS No. 161, which expands the disclosure requirements under SFAS No. 133. The enhanced quantitative and qualitative disclosures will include how and why an entity uses derivative instruments, how derivative instruments and related hedged items are accounted for and how derivative instruments and related hedged items affect an entity’s financial position, financial performance and cash flows. SFAS No. 161 is effective for the Company on January 1, 2009. SFAS No. 161 also amends SFAS
75
No. 107,Disclosures about Fair Value Instruments (“SFAS No. 107”), to clarify that derivative instruments are subject to SFAS No. 107 disclosure requirements regarding concentration of credit risk. The Company will incorporate the additional disclosures beginning with its Form 10-Q for the three months ending March 31, 2009.
SFAS No 162: The Hierarchy of Generally Accepted Accounting Principles (“SFAS No. 162”).
In May 2008, the FASB issued SFAS No. 162, which identifies the framework, or hierarchy for selecting accounting principles to be used in preparing financial statements presented in conformity with U.S. GAAP. SFAS No. 162 amends the existing U.S. GAAP hierarchy established and set forth in the American Institute of Certified Public Accountants (“AICPA”) Statement of Auditing Standards No. 69,The Meaning of Present Fairly in Conformity With Generally Accepted Accounting Principles (“SAS 69”). The framework serves as a guide in determining the appropriate accounting treatment to be used for a transaction or event. We do not expect SFAS No. 162 to have an impact on the Company’s current accounting practices. The Standard will become effective 60 days following the SEC’s approval of Public Company Accounting Oversight Board (“PCAOB”) amendments to AU Section 411,The Meaning of Present Fairly in Conformity with Generally Accepted Accounting Principles.
FSP No. FAS 142-3: Determination of the Useful Life of Intangible Assets (“FSP No. FAS 142-3”).
In April 2008, the FASB issued FSP No. FAS 142-3, which amends the factors considered in developing renewal or extension assumptions used to determine the useful life of a recognized intangible asset under SFAS No. 142. FSP No. 142-3 requires a consistent approach between the useful life of a recognized intangible asset under SFAS No. 142 and the period of expected cash flows used to measure the fair value of an asset under SFAS No. 141(R). The FSP also requires enhanced disclosures when an intangible asset’s expected future cash flows are affected by an entity’s intent and/or ability to renew or extend the arrangement. FSP No. 142-3 is effective for financial statements issued for fiscal years beginning after December 15, 2008, January 1, 2009 for AES, and is to be applied prospectively. Early adoption is prohibited. AES has not completed its analysis of the potential impact of FSP No. 142-3, but does not believe the adoption will have a material impact on the Company’s financial condition, results of operations, or cash flows.
FSP No. APB 14-1: Accounting for Convertible Debt Instruments That May Be Settled in Cash upon Conversion (Including Partial Cash Settlement) (“FSP No. APB 14-1”).
In May 2008, the FASB issued FSP No. APB 14-1, which clarifies that convertible debt instruments that may be settled in cash or other assets upon conversion are not addressed by APB No. 14,Accounting for Convertible Debt and Debt Issued with Stock Purchase Warrants. Additionally, FSP APB No. 14-1 requires an entity to separately account for the liability and equity components of a convertible instrument to reflect an entity’s nonconvertible debt borrowing rate when interest cost is recognized in subsequent periods. FSP APB No. 14-1 also expands the disclosure requirements regarding convertible debt instrument terms and how the instrument is reflected in an entity’s financial statements. AES has reviewed the impact of FSP No. APB 14-1 and determined that FSP No. APB 14-1 is not applicable for any of the Company’s instruments.
EITF 08-3: Accounting by Lessees for Maintenance Deposits (“EITF 08-3”).
In June 2008, the Emerging Issues Task Force (“EITF”) issued EITF 08-3, which clarifies how a lessee accounts for nonrefundable maintenance deposits. Under EITF 08-3, nonrefundable maintenance deposits will be recorded as a deposit asset and as reimbursable maintenance is performed by the lessee, the underlying maintenance is expensed or capitalized in accordance with the lessee’s accounting policy. EITF 08-3 is effective for the Company beginning on January 1, 2009. Early adoption is not permitted. The effect of adoption will be reflected as a change in accounting principle through a cumulative effect adjustment to the opening balance of retained earnings in the year of adoption. AES is currently reviewing the potential impact of EITF 08-3, but at this time does not believe it will have a material impact on the Company’s financial statements.
76
FSP No. FAS 132(R)-1: Employers’ Disclosures about Postretirement Benefit Plan Assets (“FSP No. FAS 132(R)-1”).
In December 2008, the FASB issued FSP No. FAS 132(R)-1, which provides guidance regarding an employer’s disclosures about plan assets of a defined benefit pension or other postretirement plan. The FSP is effective for fiscal years ending after December 15, 2009, or the year ending December 31, 2009 for AES. The Company will incorporate the required disclosures in its Form 10-K for the year ending December 31, 2009.
EITF 08-6: Equity Method Investment Accounting Considerations (“EITF 08-6”).
In November 2008, EITF 08-6 was issued. This Issue clarifies the accounting for certain transactions and impairment considerations involving equity method investments. EITF 08-6 makes certain amendments to APB 18. The Company does not expect EITF 08-6 to have a significant impact on current practice. EITF 08-6 is effective for fiscal years beginning on or after December 15, 2008, and interim periods within those fiscal years, consistent with the effective dates of Statement 141(R) and Statement 160, or January 1, 2009 for AES.
2. INVENTORY
Inventories primarily consist of coal, fuel oil and other raw materials used to generate power, and spare parts and supplies used to maintain power generation and distribution facilities. Most of the Company’s inventories are reflected at the lower of cost or market using either the average cost method (81%) or the first-in, first-out (“FIFO”) method (17%). The remaining 2% are valued using actual cost and specific identification.
The following table summarizes our inventory balances as of December 31, 2008 and 2007:
| | | | | | |
| | | December 31, |
| | | 2008 | | 2007 |
| | | (in millions) |
Coal, fuel oil and other raw materials | | $ | 311 | | $ | 236 |
Spare parts and supplies | | | 253 | | | 240 |
| | | | | | |
Total | | $ | 564 | | $ | 476 |
| | | | | | |
3. PROPERTY, PLANT & EQUIPMENT
The following table summarizes the components of the electric generation and distribution assets and other and estimated useful lives:
| | | | | | | | | | |
| | | Estimated
Useful Life | | December 31, | |
| | | 2008 | | | 2007 | |
| | | (in millions) | |
Electric generation and distribution facilities | | 3 - 50 yrs. | | $ | 21,973 | | | $ | 21,978 | |
Other buildings | | 5 - 50 yrs. | | | 1,673 | | | | 1,839 | |
Furniture, fixtures and equipment | | 3 - 30 yrs. | | | 532 | | | | 593 | |
Other | | 2 - 50 yrs. | | | 476 | | | | 272 | |
| | | | | | | | | | |
Total electric generation and distribution assets and other | | | | | 24,654 | | | | 24,682 | |
Accumulated depreciation | | | | | (7,515 | ) | | | (7,519 | ) |
| | | | | | | | | | |
Net electric generation and distribution assets and other(1) | | | | $ | 17,139 | | | $ | 17,163 | |
| | | | | | | | | | |
| (1) | Net electric generation and distribution assets and other related to Jiaozuo of $70 million and Ekibastuz and Maikuben of $151 million as of December 31, 2007 are excluded from the table above and are included in the noncurrent assets and liabilities of held for sale and discontinued businesses. |
77
The following table summarizes interest capitalized during development and construction on qualifying assets for the years ended December 31, 2008, 2007 and 2006:
| | | | | | | | | |
| | | December 31, |
| | | 2008 | | 2007 | | 2006 |
| | | (in millions) |
Interest capitalized during development & construction | | $ | 176 | | $ | 86 | | $ | 50 |
Recoveries of liquidating damages from construction delays and government subsidies are reflected as a reduction in the related projects’ construction costs. Approximately $11.5 billion of property, plant and equipment, net of accumulated depreciation, was mortgaged, pledged or subject to liens as of December 31, 2008.
Depreciation expense, including the amortization of assets recorded under capital leases, was $973 million, $898 million and $802 million for the years ended December 31, 2008, 2007 and 2006, respectively.
Net electric generation and distribution assets and other include unamortized internal use software costs of $104 million and $35 million as of December 31, 2008 and 2007, respectively. Amortization expense associated with software costs was $41 million, $20 million and $21 million for the years ended December 31, 2008, 2007 and 2006.
The following table summarizes regulated and non-regulated generation and distribution facilities property, plant and equipment and accumulated depreciation as of December 31, 2008 and 2007:
| | | | | | | | |
| | | December 31, | |
| | | 2008 | | | 2007 | |
| | | (in millions) | |
Regulated assets | | $ | 9,761 | | | $ | 10,710 | |
Regulated accumulated depreciation | | | (3,901 | ) | | | (4,219 | ) |
| | | | | | | | |
Regulated generation, distribution assets, and other, net | | | 5,860 | | | | 6,491 | |
Non-regulated assets | | | 14,893 | | | | 13,972 | |
Non-regulated accumulated depreciation | | | (3,614 | ) | | | (3,300 | ) |
| | | | | | | | |
Non-regulated generation, distribution assets, and other, net | | | 11,279 | | | | 10,672 | |
| | | | | | | | |
Total generation and distribution assets, and other, net | | $ | 17,139 | | | $ | 17,163 | |
| | | | | | | | |
The following table summarizes the amounts recognized, which were related to asset retirement obligations, for the years ended December 31, 2008 and 2007:
| | | | | | | | |
| | | 2008 | | | 2007 | |
| | | (in millions) | |
Balance at January 1 | | $ | 64 | | | $ | 51 | |
Additional liabilities incurred | | | 5 | | | | 14 | |
Liabilities settled | | | (1 | ) | | | (3 | ) |
Accretion expense | | | 5 | | | | 4 | |
Change in estimated cash flows | | | (2 | ) | | | (3 | ) |
Translation adjustments | | | (1 | ) | | | 1 | |
| | | | | | | | |
Balance at December 31 | | $ | 70 | | | $ | 64 | |
| | | | | | | | |
The Company’s retirement obligations covered by SFAS No. 143 primarily include active ash landfills, water treatment basins and the removal or dismantlement of certain plant and equipment. The fair value of legally restricted assets for purposes of settling asset retirement obligations was less than $1 million as of December 31, 2008 and 2007.
78
4. INVESTMENTS IN MARKETABLE SECURITIES
The following table sets forth the Company’s investments in marketable debt and equity securities classified as trading and available-for-sale as of December 31, 2008 and 2007 by type of investment and by level within the fair value hierarchy in accordance with SFAS No. 157. Financial assets and liabilities have been classified in their entirety based on the lowest level of input that is significant to the fair value measurement. The Company’s assessment of the significance of a particular input to the fair value measurement requires judgment, and may affect the determination of the fair value of the assets and liabilities and their placement within the fair value hierarchy levels.
| | | | | | | | | | | | | | | |
| | | December 31, |
| | | 2008 | | 2007 |
| | | Level 1 (1) | | Level 2 (1) | | Level 3 (1) | | Total | | Total |
| | | (in millions) |
AVAILABLE-FOR-SALE: | | | | | | | | | | | | | | | |
Unsecured debentures(2) | | $ | — | | $ | 674 | | $ | — | | $ | 674 | | $ | 573 |
Certificates of deposit(2) | | | — | | | 493 | | | — | | | 493 | | | 147 |
Government debt securities | | | — | | | 32 | | | — | | | 32 | | | 268 |
Mutual funds | | | — | | | — | | | — | | | — | | | 273 |
Common stock | | | 1 | | | — | | | — | | | 1 | | | 42 |
Money market funds | | | — | | | 21 | | | — | | | 21 | | | 3 |
Other | | | — | | | 42 | | | — | | | 42 | | | 26 |
| | | | | | | | | | | | | | | |
Subtotal | | $ | 1 | | $ | 1,262 | | $ | — | | $ | 1,263 | | $ | 1,332 |
TRADING: | | | | | | | | | | | | | | | |
Government debt securities | | | — | | | — | | | — | | | — | | | 6 |
| | | | | | | | | | | | | | | |
Subtotal | | | — | | | — | | | — | | | — | | | 6 |
| | | | | | | | | | | | | | | |
TOTAL | | $ | 1 | | $ | 1,262 | | $ | — | | $ | 1,263 | | $ | 1,338 |
| | | | | | | | | | | | | | | |
| (1) | See the Company’s fair value policy in Note 1 for further detail regarding the fair value hierarchy and Note 6—Fair Value of Financial Instruments for further detail on types of investments held. |
| (2) | Unsecured debentures are instruments similar to certificates of deposit that are held primarily by our subsidiaries in Brazil. The unsecured debentures and certificates of deposit included here do not qualify as cash equivalents under SFAS No. 95,Statement of Cash Flows, but meet the definition of a security under SFAS No. 115 and are therefore classified as available-for-sale securities. |
The following table sets forth the Company’s investments in marketable debt securities classified as held-to-maturity as of December 31, 2008 and 2007:
| | | | | | | | |
| | | December 31, | |
| | | 2008 | | | 2007 | |
| | | (in millions) | |
Government debt securities | | $ | 93 | | | $ | — | |
Certificates of deposit | | | 45 | | | | 36 | |
Other | | | 12 | | | | — | |
| | | | | | | | |
Total | | $ | 150 | (1) | | $ | 36 | (1) |
| | | | | | | | |
| (1) | At December 31, 2008 and 2007, $14 million and $28 million, respectively, of investments classified as held-to-maturity were restricted or pledged as collateral for certain debt arrangements. |
The amortized cost approximated fair value of the held-to-maturity investments at December 31, 2008 and 2007.
79
As of December 31, 2008, the stated maturities for the investments (including restricted investments) ranged from one month to three years.
The following table summarizes the unrealized gains and losses related to sales of and investments in available-for-sale securities. There were no realized gains or losses on the sale of available-for-sale securities.
| | | | | | | | | | | |
| | | December 31, | |
| | | 2008 | | | 2007 | | 2006 | |
| | | (in millions) | |
Gains (losses) included in other comprehensive income | | $ | (2 | ) | | $ | 3 | | $ | (3 | ) |
Proceeds from sales | | $ | 5,006 | | | $ | 2,345 | | $ | 1,706 | |
Gross realized gains on sales | | $ | — | | | $ | — | | $ | — | |
Gross realized losses on sales | | $ | — | | | $ | — | | $ | — | |
The Company recognized other-than-temporary impairment charges of $15 million and $52 million for the years ended December 31, 2008 and 2007, respectively. There was no other-than-temporary impairment expense in 2006. In 2008, the impairment primarily related to the Company’s investment in a company developing a commercial facility for a “blue gas” (coal to gas) technology project. The Company made this investment in September 2007 and accounted for the investment in convertible preferred shares under the cost method of accounting. During the fourth quarter of 2008, the market value of the shares materially declined due to downward trends in the capital markets and management concluded that the decline was other-than-temporary and recorded an impairment charge of $10 million.
In 2007, other-than-temporary impairment related to the Company’s investment in AgCert International (“AgCert”). The Company made its first significant investment in the greenhouse gas (“GHG”) emission area, acquiring a 9.9% ownership interest in AgCert for $52 million in May 2006 and, in accordance with SFAS No. 115, classified these securities as “available-for-sale”. AgCert is an Ireland-based company which uses agricultural sources to produce GHG emission offsets under the Kyoto protocol. At that time, our investment in the stock, which was traded on the London Stock Exchange was classified as a long-term available-for-sale investment and revalued at the end of each reporting period, with changes in the market value of the investment reflected in accumulated other comprehensive income. There was a material decline in the market value of these securities, based on a continual decline in the traded market price during the year ended December 31, 2007, and the Company recognized an other-than-temporary impairment charge of $52 million.
5. DERIVATIVE INSTRUMENTS
AES utilizes derivative financial instruments to hedge interest rate risk, foreign exchange risk and commodity price risk. The Company utilizes interest rate derivatives to hedge interest rate risk on variable rate debt. Most of AES’s interest rate derivatives are designated and qualify as cash flow hedges. Currency forwards, options and swap agreements are utilized by the Company to hedge foreign exchange risk. The Company utilizes electric and fuel derivative instruments, including swaps, options, forwards and futures, to hedge the risk related to electricity sales and fuel purchases.
Certain derivatives are not designated as hedging instruments. While these instruments economically hedge interest rate risk, foreign exchange risk or commodity price risk, they do not qualify for hedge accounting treatment as defined by SFAS No. 133.
80
The following table sets forth the Company’s investments in derivative instruments as of December 31, 2008 by type of derivative and by level within the fair value hierarchy in accordance with SFAS No. 157. Financial assets and liabilities have been classified in their entirety based on the lowest level of input that is significant to the fair value measurement. The Company’s assessment of the significance of a particular input to the fair value measurement requires judgment, and may affect the determination of the fair value of the assets and liabilities and their placement within the fair value hierarchy levels.
| | | | | | | | | | | | |
| | | December 31, 2008 | | Quoted Market
Prices in Active
Market for
Identical Assets
(Level 1) | | Significant
Other
Observable
Inputs
(Level 2) | | Significant
Unobservable
Inputs
(Level 3) |
| | | (in millions) |
Assets | | | | | | | | | | | | |
Current assets: | | | | | | | | | | | | |
Commodity derivatives | | $ | 132 | | $ | — | | $ | 91 | | $ | 41 |
Foreign currency derivatives | | | 1 | | | — | | | — | | | 1 |
Interest rate swaps | | | 1 | | | — | | | 1 | | | — |
| | | | | | | | | | | | |
Total current assets | | $ | 134 | | $ | — | | $ | 92 | | $ | 42 |
| | | | | | | | | | | | |
Noncurrent assets: | | | | | | | | | | | | |
Commodity derivatives | | | 191 | | | — | | | 9 | | | 182 |
Foreign currency derivatives | | | 16 | | | — | | | — | | | 16 |
Interest rate swaps | | | 9 | | | — | | | — | | | 9 |
| | | | | | | | | | | | |
Total noncurrent assets | | $ | 216 | | $ | — | | $ | 9 | | $ | 207 |
| | | | | | | | | | | | |
Total assets | | $ | 350 | | $ | — | | $ | 101 | | $ | 249 |
| | | | | | | | | | | | |
Liabilities | | | | | | | | | | | | |
Current liabilities: | | | | | | | | | | | | |
Commodity derivatives | | $ | 1 | | $ | — | | $ | — | | $ | 1 |
Foreign currency derivatives | | | 3 | | | — | | | 3 | | | — |
Foreign currency forwards and swaps | | | 15 | | | — | | | 15 | | | — |
Interest rate swaps | | | 99 | | | — | | | 75 | | | 24 |
Interest rate caps and floors | | | 7 | | | — | | | 4 | | | 3 |
| | | | | | | | | | | | |
Total current liabilities | | $ | 125 | | $ | — | | $ | 97 | | $ | 28 |
| | | | | | | | | | | | |
Noncurrent liabilities: | | | | | | | | | | | | |
Commodity derivatives | | $ | 3 | | | — | | | — | | | 3 |
Foreign currency derivatives | | | 3 | | | — | | | 1 | | | 2 |
Foreign currency forwards and swaps | | | 45 | | | — | | | — | | | 45 |
Interest rate swaps | | | 340 | | | — | | | 118 | | | 222 |
Interest rate caps and floors | | | 18 | | | — | | | — | | | 18 |
| | | | | | | | | | | | |
Total noncurrent liabilities | | $ | 409 | | $ | — | | $ | 119 | | $ | 290 |
| | | | | | | | | | | | |
Total liabilities | | $ | 534 | | $ | — | | $ | 216 | | $ | 318 |
| | | | | | | | | | | | |
81
The following table presents a reconciliation of all assets and liabilities measured at fair value on a recurring basis using significant unobservable inputs (Level 3) for the year ended December 31, 2008:
| | | | |
| | | Level 3 | |
| | | (in millions) | |
Beginning balance at December 31, 2007(1) | | $ | 84 | |
Total gains/losses (realized/unrealized)(1) | | | | |
Included in earnings | | | (106 | ) |
Included in other comprehensive income | | | 75 | |
Purchases, issuances and settlements(1) | | | 141 | |
Assets transferred in/(out) of Level 3 | | | (26 | ) |
Liabilities transferred (in)/out of Level 3(2) | | | (237 | ) |
| | | | |
Ending balance at December 31, 2008(1) | | $ | (69 | ) |
| | | | |
Total gains/losses for the period included in earnings attributable to the change in unrealized gains/losses relating to assets and liabilities held at December 31, 2008 and 2007 | | $ | (8 | ) |
| | | | |
| (1) | Derivative assets and (liabilities) are presented on a net basis. |
| (2) | Liabilities transferred into Level 3 primarily resulted from an increase in the significance of the judgments used in applying observable inputs to credit valuation adjustments in the valuation of these derivative instruments. |
The maximum length of time over which AES is hedging its exposure to variability in future cash flows for forecasted interest, foreign currency and commodity transactions is 19 years, 20 years and 2 years, respectively. For the years ended December 31, 2008, 2007 and 2006, pre-tax (losses) gains of $(35) million, $(2) million, and $3 million, respectively, were reclassified into earnings as a result of the discontinuance of a cash flow hedge because it was probable that the forecasted transaction would not occur by the end of the originally specified time period (as documented at the inception of the hedging relationship) or within an additional two-month time period. The Company recognized after-tax (losses) gains of $(8) million, $6 million, and $18 million related to the ineffective portion of derivatives qualifying as cash flow hedges for the years ended December 31, 2008, 2007 and 2006, respectively.
After-tax gains (losses) related to the changes in fair value of derivatives that do not qualify for hedge accounting were $10 million, $(21) million and $22 million for the years ended December 31, 2008, 2007 and 2006, respectively. The after-tax losses include embedded foreign currency derivatives, interest rate options, commodity derivatives and embedded derivatives. The composition and methodology for fair value determination of derivative assets and liabilities are further discussed in Note 6—Fair Value of Financial Instruments.
Amounts recognized in accumulated other comprehensive loss due to hedges, after income taxes, during the years ended December 31, 2008, 2007 and 2006, respectively, are as follows:
| | | | | | | | | | | | | | | | | | | | |
December 31, | | Balance,
beginning
of year | | | Reclassification
to earnings | | | Reclassification
upon sale or
disposal | | | Change in
fair value | | | Balance,
December 31 | |
| | | (in millions) | |
2008 | | $ | (232 | ) | | $ | 76 | | | $ | — | | | $ | (107 | ) | | $ | (263 | ) |
2007 | | | (113 | ) | | | (52 | ) | | | — | | | | (67 | ) | | | (232 | ) |
2006 | | | (382 | ) | | | (6 | ) | | | (3 | ) | | | 278 | | | | (113 | ) |
Approximately $16 million of the pre-tax accumulated other comprehensive loss related to derivative instruments as of December 31, 2008 is expected to be recognized as a decrease to income from continuing operations before income taxes over the next twelve months. This estimate includes estimated losses of $0 million, $1 million and $15 million related to foreign currency, commodity and interest rate instruments,
82
respectively. The estimated commodity losses of $1 million relate to a power purchase agreement where the normal purchase normal sale scope exception from derivative accounting was elected as of December 31, 2008, which will also result in an estimated $8 million decrease to income from continuing operations before income taxes over the next twelve months due to the amortization of the derivative asset of $187 million. The balance in accumulated other comprehensive loss related to derivative transactions will be reclassified into earnings as interest expense is recognized for hedges of interest rate risk, as depreciation is recognized for hedges of interest that is capitalized, as foreign currency transaction and translation gains and losses are recognized for hedges of foreign currency exposure, and as electric and gas sales and purchases are recognized for hedges of forecasted electric and fuel transactions. These balances are included in the Consolidated Statement of Cash Flows as operating and/or investing activities based on the nature of the underlying transaction.
6. FAIR VALUE OF FINANCIAL INSTRUMENTS
The fair value of current financial assets, current financial liabilities, debt service reserves and other deposits is estimated to be equal to their reported carrying amounts. The fair value of non-recourse debt, excluding capital leases, is estimated differently based upon the type of loan. For variable rate loans, carrying value approximates fair value. For fixed rate loans, the fair value is estimated using quoted market prices or discounted cash flow analyses. See Note 10—Long-Term Debt for additional information on the fair value and carrying value of debt. The fair value of interest rate swap, cap and floor agreements, foreign currency forwards and swaps, and energy derivatives is the estimated net amount that the Company would receive or pay to terminate the agreements as of the balance sheet date.
The estimated fair values of the Company’s assets and liabilities have been determined using available market information. The estimates are not necessarily indicative of the amounts the Company could realize in a current market exchange. The use of different market assumptions and/or estimation methodologies may have a material effect on the estimated fair value amounts.
In September 2006, the FASB issued SFAS No. 157, which provided a framework for measuring fair value and established a fair value hierarchy of the valuation techniques used to measure the fair value of financial assets and liabilities and expands disclosures about fair value measurement. The Company adopted the provisions of SFAS No. 157 as of January 1, 2008, for financial assets and liabilities. Although the adoption of SFAS No. 157 did not materially impact the Company’s financial condition, results of operations or cash flow, additional disclosures about our fair value measurements are discussed below.
Valuation Techniques:
SFAS No. 157 describes three main approaches to measuring the fair value of assets and liabilities: (1) market approach; (2) income approach and (3) cost approach. The market approach uses prices and other relevant information generated from market transactions involving identical or comparable assets or liabilities. The income approach uses valuation techniques to convert future amounts to a single present value amount. The measurement is based on the value indicated by current market expectations about those future amounts. The cost approach is based on the amount that would currently be required to replace an asset. The Company does not currently determine the fair value of any of our financial assets and liabilities using the cost approach. Financial assets and liabilities that are measured at fair value on a recurring basis at AES fall into two broad categories: investments and derivatives. Our investments are generally measured at fair value using the market approach and our derivatives are valued using the income approach.
Investments
These investments generally consist of debt and equity securities. Equity securities are adjusted to fair value using quoted market prices. Debt securities primarily consist of certificates of deposit, government debt securities and money market funds held by our Brazilian subsidiaries. The implementation of SFAS No. 157 did not result
83
in a material change in the fair value of these investments due to the fact that these investments are primarily held by highly rated institutions and governmental agencies and therefore, the consideration of counterparty credit risk did not have a material impact on the determination of fair value. Returns and pricing on these instruments are generally indexed to the CDI (Brazilian equivalent to LIBOR), Selic (overnight borrowing rate) or IGPM (inflation) rates in Brazil and are adjusted based on the banks’ assessment of the specific businesses. Fair value is determined based on comparisons to market data obtained for similar assets and are considered Level 2 inputs. The Company holds some auction rate securities through IPALCO Enterprises Inc. (“IPALCO”), a U.S. subsidiary in Indiana. The fair value of these securities was $2 million as of December 31, 2008. Based on the current credit environment, these were evaluated for potential impairment and were determined to not be impaired at this time. For more detail regarding the fair value of investments see Note 4—Investments in Marketable Securities.
Derivatives
When deemed appropriate, the Company manages its risk from interest and foreign currency exchange rate and commodity price fluctuations through the use of derivative financial assets and liabilities. The Company’s derivatives are primarily interest rate swaps on non-recourse debt to establish a fixed rate on variable rate debt, foreign exchange instruments to hedge against currency fluctuations and derivatives or embedded derivatives associated with commodity contracts. The Company’s subsidiaries are counterparties to various interest rate swaps, interest rate options, foreign currency swaps and commodity and embedded derivatives in certain agreements, generally PPAs. The fair value of our derivative portfolio was determined using internal valuation models, most of which are based on observable market inputs including interest rate curves and forward and spot prices for currencies and commodities. The primary pricing inputs used in determining the fair value of our interest rate swaps and our foreign currency exchange swaps are LIBOR swap rates and forward foreign exchange curves with the same duration as the instrument as reported in published information provided by pricing services. For each derivative, the projected forward swap rate is used to determine the stream of cash flows over the remaining term of the contract. The cash flows are then discounted using a spot discount rate to determine the fair value. To the extent that management can estimate the fair value of these assets or liabilities without the use of significant unobservable inputs, these derivatives are included in Level 2.
Derivative assets and liabilities included in Level 3 are also valued using the income approach. Consistent with our Level 2 financial assets and liabilities, the stream of cash flows over the remaining term of the contract is calculated. The cash flows are then discounted using a spot discount rate to determine the fair value. In certain instances, the published curve may not extend through the remaining term of the contract and management must make assumptions to extrapolate the curve. Additionally, in the absence of quoted prices, we may rely on “indicative pricing” quotes from financial institutions to input into our valuation model for certain of our foreign currency swaps. These indicative pricing quotes do not constitute either a bid or ask price and therefore are not considered observable market data. These fair value measurements also include adjustments for credit risk. The magnitude of the credit risk adjustment for contracts with certain counterparties resulted in a Level 3 classification for these contracts as of December 31, 2008.
Fair Value Considerations:
In determining the fair value of our financial instruments, the Company considers the source of observable market data inputs, liquidity of the instrument, the credit risk and risk of nonperformance of itself or the counterparty to the contract. The conditions and criteria used to assess these factors are:
Sources of Market Assumptions:
The Company derives most of its financial instrument market assumptions from market efficient data sources (e.g., Bloomberg and Platt’s). In some cases, where market data is not readily available, management uses comparable market sources and empirical evidence to derive market assumptions to determine a financial instrument’s fair value.
84
Market liquidity:
Market liquidity is assessed by the Company based on criteria as to whether the financial instrument participates in an active or inactive market. An active market can be defined as a spot market or settlement mechanism environment and also a potential forward/futures market that is based on the activity in the forward/futures market. A financial instrument is considered to be in an active market if the prices are fully transparent to the market participants, can be measured by market bid and ask quotes, the market has a relatively large proportion of trading volume as compared to the Company’s current trading volume and the market has a significant number of market participants that will allow the market to rapidly absorb the quantity of the assets traded without significantly affecting the market price. Other factors the Company considers when determining whether a market is active or inactive include the presence of government or regulatory control over pricing that could make it difficult to establish a market based price upon entering into a transaction.
Nonperformance risk:
The impact of nonperformance risk that includes credit risk considers changes in current market conditions, readily available information on nonperformance risk, letters of credit, collateral, other arrangements available and the nature of master netting arrangements. The Company and its subsidiaries are counterparties to various interest rate swaps, interest rate options, foreign currency swaps, derivatives and embedded derivatives which subject the Company to nonperformance risk. The financial instruments held at the subsidiary level are generally non-recourse to the Parent Company.
Nonperformance risk on the investments held by the Company is incorporated in the investment’s exit price that is derived from quoted market data that is used to mark-to-market the investment.
Nonperformance risk on the Company’s derivative instruments is an adjustment to the initial asset/liability fair value position that is derived from internally developed valuation models that utilize observable market inputs such as LIBOR interest swap rates, foreign exchange forward curves, and market commodity pricing or, in certain cases, utilize management assumptions to generate extrapolated inputs from observable market data. The Company adjusts for nonperformance risk by deducting a credit valuation adjustment (“CVA”) that calculates counterparty risk based on the counterparty’s margin or debt spread and the tenor of the respective derivative instrument. The counterparty for a derivative asset position is considered to be the bank or government sponsored banking entity or counterparty to the PPA of the respective subsidiary. The CVA for asset positions is based on the counterparty’s credit ratings and debt spreads or, in the absence of readily obtainable credit information, the respective country debt spreads is used as a proxy. The counterparty for a derivative liability position is primarily the Parent Company or the subsidiary. The CVA for liability positions is based on the Parent Company’s or the subsidiary’s current debt spread, replacement margin with lenders, or in the absence of readily obtainable credit information, the debt spread of the subsidiary’s offtaker or the respective country debt spreads are used as a proxy. If the instrument is recourse to the Parent Company, the Parent Company’s current debt spread is used to adjust for nonperformance risk.
All derivative instruments are analyzed individually and are subject to unique risk exposures. The aggregate counterparty credit risk adjustments applied to the Company’s derivative asset position was $39 million for the year ended December 31, 2008 decreasing the asset position. The aggregate credit risk adjustments applied to the Company’s derivative liability position was $105 million for the year ended December 31, 2008 decreasing the liability position.
85
Assets and Liabilities at Fair Value
The following table summarizes the carrying value and fair value of the Company’s financial assets and liabilities as of December 31, 2008 and 2007.
| | | | | | | | | | | | |
| | | December 31, |
| | | 2008 | | 2007 |
| | | Carrying
Amount | | Fair
Value (1) | | Carrying
Amount | | Fair
Value (1) |
| | | (in millions) |
Assets | | | | | | | | | | | | |
Marketable securities (2) | | $ | 1,413 | | $ | 1,413 | | $ | 1,374 | | $ | 1,374 |
Derivatives (3) | | | 350 | | | 350 | | | 199 | | | 199 |
| | | | | | | | | | | | |
Total assets | | $ | 1,763 | | $ | 1,763 | | $ | 1,573 | | $ | 1,573 |
| | | | | | | | | | | | |
Liabilities | | | | | | | | | | | | |
Debt (4) | | $ | 18,091 | | $ | 15,588 | | $ | 17,990 | | $ | 17,691 |
Derivatives (3) | | | 534 | | | 534 | | | 318 | | | 318 |
| | | | | | | | | | | | |
Total liabilities | | $ | 18,625 | | $ | 16,122 | | $ | 18,308 | | $ | 18,009 |
| | | | | | | | | | | | |
| (1) | See the Company’s fair value policy in Note 1 for further detail regarding the fair value hierarchy. |
| (2) | See Note 4—Investments in Marketable Securities for additional information regarding the classification of marketable securities in the Fair Value Hierarchy in accordance with SFAS No. 157. |
| (3) | See Note 5—Derivative Instruments for additional information regarding the classification of derivative instruments in the Fair Value Hierarchy in accordance with SFAS No. 157. |
| (4) | See Note 10—Long-Term Debt for additional information regarding the fair value of debt. |
7. INVESTMENTS IN AND ADVANCES TO AFFILIATES
The following table summarizes the relevant effective equity ownership interest and carrying values for the Company’s investments accounted for under the equity method as of December 31, 2008 and 2007.
| | | | | | | | | | | | | |
Affiliate | | Country | | December 31, |
| | | 2008 | | 2007 | | | 2008 | | 2007 |
| | | Carrying Value | | | Ownership Interest % |
AES Solar Ltd | | United States | | $ | 126 | | $ | — | | | 50 | | — |
Barry (1) | | United Kingdom | | | — | | | — | | | 100 | | 100 |
Cartagena (1) | | Spain | | | — | | | 34 | | | 71 | | 71 |
CEMIG | | Brazil | | | — | | | — | | | 10 | | 10 |
Chigen affiliates | | China | | | 179 | | | 204 | | | 27 | | 27 |
Elsta | | Netherlands | | | 138 | | | 126 | | | 50 | | 50 |
Guacolda | | Chile | | | 81 | | | 67 | | | 35 | | 40 |
Huanghua | | China | | | 36 | | | 4 | | | 49 | | 49 |
IC Ictas Energy Group | | Turkey | | | 94 | | | 78 | | | 51 | | 51 |
InnoVent | | France | | | 37 | | | 28 | | | 40 | | 40 |
OPGC | | India | | | 192 | | | 223 | | | 49 | | 49 |
Trinidad Generation Unlimited (1) | | Trinidad | | | 16 | | | — | | | 60 | | — |
Other affiliates | | United States | | | 2 | | | 4 | | | — | | — |
| | | | | | | | | | | | | |
| | | | $ | 901 | | $ | 768 | | | | | |
Less: Affiliate loan receivables included above (2) | | | — | | | (38 | ) | | | | |
| | | | | | | | | | | | | |
Total investments in and advances to affiliates | | $ | 901 | | $ | 730 | | | | | |
| | | | | | | | | | | | | |
86
| (1) | Represent VIEs in which we hold a significant variable interest. |
| (2) | Represents participative loan receivable with Cartagena, included in the Receivable from Affiliates line item in the Consolidated Balance Sheets, that absorbs the Company’s share of equity method losses as a result of the initial equity investment having been reduced to zero. |
AES Barry Ltd.—The Company holds a 100% ownership interest in AES Barry Ltd. (“Barry”), a 230 MW gas-fired combined cycle power plant in the United Kingdom. As a result of a debt agreement, no material financial or operating decisions can be made without the banks’ consent, and the Company does not control Barry. As of December 31, 2008 and 2007 other long-term liabilities included $49 million and $74 million, respectively, related to this debt agreement.
Cartagena Energia—The Company owns 71% of Cartagena Energia (“Cartagena”) a 1200 MW power plant in Cartagena, Spain completed in November 2006. The Company’s initial investment in Cartagena was approximately $29 million. Cartagena was determined to be a VIE and the Company is not the primary beneficiary due to the fact that the sole customer of the plant absorbs the majority of the commodity price risk. In December 2008, the Company’s basis in its investment in Cartagena was reduced to zero and the equity method of accounting was suspended.
CEMIG—The Company is a party to a joint venture/consortium agreement through which the Company has a 9.6% equity interest in Companhia Energetica de Minas Gerais (“CEMIG”), an integrated utility in Minas Gerais, Brazil. Although our interest in CEMIG is below the 20% threshold for significant influence, AES has significant influence over the operational and financial policies of CEMIG through representation on the board of directors of CEMIG. In 2002, the Company determined there was an other-than-temporary impairment of its investment in CEMIG and wrote it down to fair market value, $155 million. Additionally, AES established a valuation allowance against a deferred tax asset related to the CEMIG investment. The total amount of these charges, net of tax, was $587 million. As a result, the Company’s investment in CEMIG, is a $484 million net liability at December 31, 2008 included in the Other Long-Term Liabilities line item on the Consolidated Balance Sheets. The Company has discontinued the application of the equity method in accordance with its accounting policy regarding equity method investments.
AES Solar Energy Ltd.—In March 2008, the Company formed AES Solar Energy Ltd (“AES Solar”), a joint venture with Riverstone Holdings LLC (“Riverstone”). AES Solar will develop land-based solar photovoltaic panels that capture sunlight to convert into electricity that feed directly into power grids. AES Solar is accounted for under the equity method of accounting based on the Company’s 50% ownership and significant influence but not control over the joint venture. Under the terms of the agreement, the Company and Riverstone will each provide up to $500 million of capital over the next five years. As of December 31, 2008, AES had invested approximately $135 million in the joint venture.
Guohua AES (Huanghua) Wind Power Co., Ltd—In May 2007, the Company acquired a 49% interest in Guohua AES (Huanghua) Wind Power Co., Ltd. (“AES Huanghua”), a joint venture that is primarily engaged to develop, construct, own and operate wind farms in China. In the third quarter of 2008, the Company also acquired a 49% interest in three separate wind farm projects in China—Guohua AES (“Hulunbeier”) Wind Power Co., Ltd.; Guohua AES (“Chenba’erhu”) Wind Power Co., Ltd.; and Guohua AES (“Xinba’erhu”) Wind Power Co., Ltd. The Company has invested approximately $20 million in the projects to date.
Trinidad Generation Unlimited—In 2007, the Company began pursuing a development project to construct and operate a 720 MW combined cycle power plant in Trinidad through its wholly owned subsidiary, Trinidad Generation Unlimited (“TGU.”) In July 2008, a shareholder agreement was executed establishing the Company’s ownership interest in TGU at 60% with the remaining 40% interest held by the Government of Trinidad and Tobago. AES is not considered the primary beneficiary of TGU.
87
Summarized Financial Information
The following tables summarize financial information of the Company’s 50%-or-less owned affiliates and majority-owned unconsolidated subsidiaries that are accounted for using the equity method.
| | | | | | | | | | | | | | | | | | | | | | | |
| | | 50%-or-less Owned Affiliates | | Majority-Owned
Unconsolidated Subsidiaries | |
Years ended December 31, | | 2008 | | | 2007 | | | 2006 (1) | | 2008 | | | 2007 | | | 2006 | |
| | | (in millions) | | (in millions) | |
Revenues | | $ | 1,180 | | | $ | 988 | | | $ | 938 | | $ | 170 | | | $ | 145 | | | $ | 16 | |
Gross margin | | | 274 | | | | 255 | | | | 275 | | | 61 | | | | 57 | | | | (5 | ) |
Net income (loss) | | | 83 | | | | 194 | | | | 202 | | | (4 | ) | | | (17 | ) | | | (22 | ) |
| | | | | | |
December 31, | | 2008 | | | 2007 | | | | | 2008 | | | 2007 | | | | |
| | | (in millions) | | | | | (in millions) | | | | |
Current assets | | $ | 734 | | | $ | 541 | | | | | | $ | 222 | | | $ | 146 | | | | | |
Noncurrent assets | | | 2,626 | | | | 1,995 | | | | | | | 1,297 | | | | 1,164 | | | | | |
Current liabilities | | | 563 | | | | 278 | | | | | | | 181 | | | | 267 | | | | | |
Noncurrent liabilities | | | 1,264 | | | | 1,005 | | | | | | | 1,072 | | | | 1,015 | | | | | |
Noncontrolling interests | | | (163 | ) | | | (132 | ) | | | | | | (26 | ) | | | (14 | ) | | | | |
Stockholders’ equity | | | 1,696 | | | | 1,385 | | | | | | | 292 | | | | 42 | | | | | |
| (1) | Includes information pertaining to Kingston Cogeneration Limited Partnership through March 2006 and U.S. Wind Force LLC through December 2006, the respective disposition dates, and Itabo through May 2006, at which time it became a consolidated subsidiary as a result of the Company’s purchase of an additional 25% interest in Itabo. Upon consolidation of Itabo, the Company recognized an extraordinary gain of $21 million. |
At December 31, 2008, retained earnings included $137 million related to the undistributed earnings of affiliates. Distributions received from affiliates were $50 million, $59 million and $44 million for the years ended December 31, 2008, 2007 and 2006, respectively.
Refer to Item 1 of this Form 8-K for additional information on these affiliates.
8. GOODWILL AND OTHER INTANGIBLE ASSETS
SFAS No. 142 requires that goodwill be evaluated for impairment at the reporting unit level. A reporting unit is an operating segment as defined by SFAS No. 131, Disclosures about Segments of an Enterprise and Related Information, (“SFAS No. 131”), or a component or combination of components within an operating segment with similar economic characteristics that are one level below an operating segment. Generally, each AES business constitutes a reporting unit. Reporting units have been acquired generally in separate transactions. In the event that more than one reporting unit is acquired in a single acquisition, the fair value of each reporting unit is determined, and that fair value is allocated to the assets and liabilities of that unit. If the determined fair value of the reporting unit exceeds the amount allocated to the net assets of the reporting unit, goodwill is assigned to that reporting unit.
88
The following table summarizes the changes in the carrying amount of goodwill, by segment as of December 31, 2008, 2007 and 2006:
| | | | | | | | | | | | | | | | | | | | | | | | |
| | | December 31, |
| | | 2008 | | | 2007 | | | 2006 |
| | | Carrying
amount | | Acquisitions | | | Translation
adjustments
and Other | | | Carrying
amount | | Acquisitions | | Translation
adjustments
and Other | | | Carrying
amount |
Latin America—Generation | | $ | 902 | | $ | — | | | $ | (3 | ) | | $ | 905 | | $ | — | | $ | (1 | ) | | $ | 906 |
Latin America—Utilities | | | 133 | | | — | | | | — | | | | 133 | | | — | | | — | | | | 133 |
North America—Generation | | | 101 | | | — | | | | (9 | ) | | | 110 | | | 11 | | | (11 | ) | | | 110 |
North America—Utilities | | | — | | | — | | | | — | | | | — | | | — | | | — | | | | — |
Europe Generation | | | 108 | | | — | | | | (40 | ) | | | 148 | | | — | | | 3 | | | | 145 |
Asia—Generation | | | 78 | | | 65 | (1) | | | (11 | ) | | | 24 | | | — | | | — | | | | 24 |
Corporate and Other | | | 99 | | | 6 | | | | (3 | ) | | | 96 | | | — | | | — | | | | 96 |
| | | | | | | | | | | | | | | | | | | | | | | | |
Total | | $ | 1,421 | | $ | 71 | | | $ | (66 | ) | | $ | 1,416 | | $ | 11 | | $ | (9 | ) | | $ | 1,414 |
| | | | | | | | | | | | | | | | | | | | | | | | |
| (1) | Includes goodwill acquired for the period of $65 million related to the acquisition of Masinloc. |
The Company conducts its annual goodwill impairment analysis as of October 1st each year. For the years ended December 31, 2008 and 2007, the Company had no goodwill impairment. Goodwill impairment of $2 million was recognized during the year ended December 31, 2006 at one of our European generation plants. The fair value of the reporting unit was determined by the income approach using a discounted cash flow valuation model as current quoted market prices were not always available and there was not sufficient evidence that the reporting unit could be bought or sold in the market place between willing third parties. Goodwill impairment is included in “Impairment expense” on the Consolidated Statement of Operations.
The following tables summarize the balances comprising other intangibles in the accompanying Consolidated Balance Sheets for the years ending December 31, 2008 and 2007:
| | | | | | | | | | | |
| | | December 31, 2008 |
| | | Gross Balance | | | Accumulated
Amortization | | | Net Balance |
| | | (in millions) |
Sales concessions | | $ | 165 | | | $ | (77 | ) | | $ | 88 |
All other | | | 520 | (1) | | | (108 | ) | | | 412 |
| | | | | | | | | | | |
Total | | $ | 685 | | | $ | (185 | ) | | $ | 500 |
| | | | | | | | | | | |
| |
| | | December 31, 2007 |
| | | Gross Balance | | | Accumulated
Amortization | | | Net Balance |
| | | (in millions) |
Sales concessions | | $ | 175 | | | $ | (72 | ) | | $ | 103 |
All other | | | 464 | (1) | | | (101 | ) | | | 363 |
| | | | | | | | | | | |
Total | | $ | 639 | | | $ | (173 | ) | | $ | 466 |
| | | | | | | | | | | |
| (1) | All other consists primarily of market access, fuel sourcing and other intangible assets acquired upon the Company’s acquisition of certain properties in the state of New York in 1999. |
In 2008, the Company acquired intangible assets of $85 million the largest of which was the acquisition of landfill gas rights in El Salvador. The acquired intangible assets included $59 million which were subject to amortization with an average amortization period of 20 years and $26 million of intangible assets not subject to amortization.
89
The following table summarizes the estimated amortization expense, broken down by intangible asset category, for 2009 through 2013:
| | | | | | | | | | | | | | | |
| | | Estimated amortization expense |
| | | 2009 | | 2010 | | 2011 | | 2012 | | 2013 |
| | | (in millions) |
Sales concessions | | $ | 7 | | $ | 7 | | $ | 7 | | $ | 6 | | $ | 6 |
All other | | | 14 | | | 14 | | | 14 | | | 14 | | | 13 |
| | | | | | | | | | | | | | | |
Total | | $ | 21 | | $ | 21 | | $ | 21 | | $ | 20 | | $ | 19 |
| | | | | | | | | | | | | | | |
Intangible asset amortization expense was $19 million, $23 million and $23 million for the years ended December 31, 2008, 2007 and 2006, respectively. Intangible assets included in the tables above that are not subject to amortization primarily consist of land use rights and emission allowances, which had a carrying value of $83 million at December 31, 2008 and $56 million at December 31, 2007.
90
9. REGULATORY ASSETS & LIABILITIES
The Company has recorded regulatory assets and liabilities that it expects to pass through to its customers in accordance with, and subject to, regulatory provisions as follows:
| | | | | | | | |
| | | December 31, | | |
| | | 2008 | | 2007 | | Recovery Period |
| | | (in millions) | | |
REGULATORY ASSETS | | | | | | | | |
Current regulatory assets: | | | | | | | | |
Brazil tariff recoveries(2) | | | | | | | | |
Energy purchases | | $ | 76 | | $ | 168 | | Over tariff reset period |
Transmission costs, regulatory fees and other | | | 121 | | | 127 | | Over tariff reset period |
El Salvador tariff recoveries(3) | | | 136 | | | 58 | | Over tariff reset period |
Other(4) | | | 18 | | | 27 | | Various |
| | | | | | | | |
Total current regulatory assets | | $ | 351 | | $ | 380 | | |
Noncurrent regulatory assets: | | | | | | | | |
Defined benefit pension obligations(1)(5) | | | 281 | | | 88 | | Various |
Deferred Income Taxes(1)(6) | | | 75 | | | 72 | | Various |
Brazil tariff recoveries(2) | | | | | | | | |
Energy purchases | | | 31 | | | 47 | | Over tariff reset period |
Transmission costs, regulatory fees and other | | | 48 | | | 39 | | Over tariff reset period |
Other(4) | | | 106 | | | 106 | | Various |
| | | | | | | | |
Total noncurrent regulatory assets | | | 541 | | | 352 | | |
| | | | | | | | |
TOTAL REGULATORY ASSETS | | $ | 892 | | $ | 732 | | |
| | | | | | | | |
REGULATORY LIABILITIES | | | | | | | | |
Current regulatory liabilities: | | | | | | | | |
Efficiency program costs(7) | | $ | 116 | | $ | 145 | | Over tariff reset period |
Brazil tariff recoveries(2) | | | | | | | | |
Energy purchases | | | 31 | | | 62 | | Over tariff reset period |
Transmission costs, regulatory fees and other | | | 44 | | | 62 | | Over tariff reset period |
Other(4) | | | 14 | | | 39 | | Various |
| | | | | | | | |
Total current regulatory liabilities | | $ | 205 | | $ | 308 | | |
Noncurrent regulatory liabilities: | | | | | | | | |
Asset retirement obligations(8) | | | 459 | | | 443 | | Over book life of assets |
Brazil special obligations(9) | | | 291 | | | 351 | | To be determined |
Brazil tariff recoveries(2) | | | | | | | | |
Energy purchases | | | 8 | | | 22 | | Over tariff reset period |
Transmission costs, regulatory fees and other | | | 2 | | | 7 | | Over tariff reset period |
Deferred income taxes | | | 10 | | | — | | Various |
Other(4) | | | 9 | | | 23 | | Various |
| | | | | | | | |
Total noncurrent regulatory liabilities | | $ | 779 | | $ | 846 | | |
| | | | | | | | |
TOTAL REGULATORY LIABILITIES | | $ | 984 | | $ | 1,154 | | |
| | | | | | | | |
| (1) | Past expenditures on which the Company does not earn a rate of return. |
| (2) | Recoverable per ANEEL regulations through the Annual Tariff Adjustment (“IRT”). These costs are generally non-controllable costs and primarily consist of purchased electricity, energy transmission costs, and sector costs that are considered volatile. These costs are recovered in 24 installments through the annual IRT process and are amortized over the tariff reset period. |
91
| (3) | Deferred fuel costs incurred by our El Salvador subsidiaries associated with purchase of energy from El Salvador spot market and the power generation plants. In El Salvador, the deferred fuel adjustment represents the variance between the actual fuel costs and the fuel costs recovered in the tariffs. The variance is recovered semi-annually at the tariff reset period. |
| (4) | Includes assets with and without a rate of return. Other current regulatory assets that do not earn a rate of return were $9 million and $18 million, as of December 31, 2008 and 2007, respectively. Other noncurrent regulatory assets that do not earn a rate of return were $83 million and $82 million, as of December 31, 2008 and 2007, respectively. Those without a rate of return that are recoverable based on specific rate orders primarily consist of the following: |
| | • | | Deferred fuel costs: expected to be recovered through future fuel adjustment charges. In the United States, deferred fuel costs at IPL represent variances between estimated and actual fuel and purchased power costs. IPL is permitted to recover underestimated fuel and purchased power costs in future rates. |
| | • | | Transmission service costs and other administrative costs from IPL’s participation in the Midwest ISO market. Recovery of costs is probable, but the timing is not yet determined. |
Other Current and Noncurrent Regulatory Liabilities consist of:
| | • | | Penalties and fees from regulators at our Brazil subsidiaries and financial transmission rights used to hedge exposure in the Midwest ISO market that are credited per specific rate orders. |
| | • | | Costs incurred by our Brazilian subsidiaries associated with monthly energy price variances between the wholesale energy market prices owed to the power generation plants producing free energy and the capped price reimbursed by the local distribution companies which are passed through to the final customers through energy tariffs. |
| (5) | SFAS No. 71 allows the defined pension and postretirement benefit obligation to be recorded as a regulatory asset equal to the previously unrecognized actuarial gains and losses and prior service costs that are expected to be recovered through future rates. Pension expense is recognized based on the plan’s actuarially determined pension liability. Recovery of costs is probable, but not yet determined. The increase in the regulatory asset of $193 million at December 31, 2008 is primarily a result of a lower than expected return on assets in 2008. |
| (6) | Probable of recovery through future rates, based upon established regulatory practices, which permit the recovery of current taxes. This asset is offset by a deferred tax liability and is expected to be recovered, without interest, over the period book-tax timing differences reverse and become current taxes. |
| (7) | Payments received for costs expected to be incurred to improve the efficiency of our plants in Brazil that are recovered as part of the IRT. |
| (8) | Non-legal asset retirement obligation for removal costs which do not have an associated legal retirement obligation as defined by SFAS No. 143. |
| (9) | Obligations established by ANEEL in Brazil associated with electric utility concessions and represent amounts received from customers or donations not subject to return. These donations are allocated to support energy network expansion and to improve utility operations to meet customers’ needs. The maturity term is established by ANEEL whose settlement shall occur when the concession ends. |
The current portion of regulatory assets and liabilities are recorded in either other current assets or accrued and other liabilities, respectively, on the accompanying Consolidated Balance Sheets. The noncurrent portion of the regulatory assets and liabilities is recorded in either other assets or other long-term liabilities, respectively, in the accompanying Consolidated Balance Sheets.
92
The following table summarizes regulatory assets by region as of December 31, 2008 and 2007:
| | | | | | |
| | | December 31, |
| | | 2008 | | 2007 |
| | | (in millions) |
Latin America | | $ | 413 | | $ | 441 |
North America | | | 479 | | | 286 |
Corporate & Other | | | — | | | 5 |
| | | | | | |
Total regulatory assets | | $ | 892 | | $ | 732 |
| | | | | | |
The following table summarizes regulatory liabilities by region as of December 31, 2008 and 2007:
| | | | | | |
| | | December 31, |
| | | 2008 | | 2007 |
| | | (in millions) |
Latin America | | $ | 508 | | $ | 709 |
North America | | | 476 | | | 445 |
| | | | | | |
Total regulatory liabilities | | $ | 984 | | $ | 1,154 |
| | | | | | |
10. LONG-TERM DEBT
The Company has two types of debt reported on its balance sheet: non-recourse and recourse debt. Non-recourse debt is used to fund investments and capital expenditures for construction and acquisition of our electric power plants, wind farms and distribution companies at our subsidiaries. Non-recourse debt is generally secured by the capital stock, physical assets, contracts and cash flows of the related subsidiary. The default risk is limited to the respective business and is without recourse to the Parent Company and other subsidiaries. Recourse debt is direct borrowings by the Parent Company and is used to fund development, construction or acquisition and serves as equity investments or loans to the affiliates. This debt is with recourse to the Parent Company and is structurally subordinated to the affiliates’ non-recourse debt.
Recourse and non-recourse debt is carried at amortized cost. The following table summarizes the carrying amount and estimated fair values of the Company’s recourse and non-recourse debt as of December 31, 2008 and 2007:
| | | | | | | | | | | | |
| | | December 31, |
| | | 2008 | | 2007 |
| | | Carrying
Amount | | Fair
Value | | Carrying
Amount | | Fair
Value |
| | | (in millions) |
Non-recourse debt | | $ | 12,943 | | $ | 11,200 | | $ | 12,435 | | $ | 12,043 |
Recourse debt | | | 5,148 | | | 4,388 | | | 5,555 | | | 5,648 |
| | | | | | | | | | | | |
Total debt | | $ | 18,091 | | $ | 15,588 | | $ | 17,990 | | $ | 17,691 |
| | | | | | | | | | | | |
The fair value of non-recourse debt, excluding capital leases, is estimated differently based upon the type of loan. For fixed rate loans, the fair value is estimated using quoted market prices or a discounted cash flow analysis. For variable rate loans, we reported that carrying value approximated fair value in 2007, as the average credit spread of AES’ portfolio of variable rate notes was equivalent to the spread between LIBOR and the appropriate current yields. In late 2008, credit spreads increased significantly above historic levels. For the USD, Euro and British Pound markets where we believe the credit spread expansion is material, fair value was estimated using a discounted cash flow analysis. The increase in credit spreads was calculated as the difference between composite fair value curves published by pricing services for the appropriate issuer credit rating and
93
LIBOR. For remaining currencies, we continue to report carrying value is equal to fair value. The estimated fair value was determined using available market information as of December 31, 2008 and 2007. The Company is not aware of any factors that would significantly affect the estimated fair value amounts since December 31, 2008.
NON-RECOURSE DEBT
The following table summarizes the non-recourse debt of the Company as of December 31, 2008 and 2007:
| | | | | | | | | | | | | |
NON-RECOURSE DEBT | | Interest
Rate (1) | | | Maturity | | December 31, | |
| | | | 2008 | | | 2007 | |
| | | | | | | | (in millions) | |
VARIABLE RATE: (2) | | | | | | | | | | | | | |
Bank loans(3) | | 4.10 | % | | 2009-2026 | | $ | 3,401 | | | $ | 2,809 | |
Notes and bonds | | 16.48 | % | | 2010-2041 | | | 1,844 | | | | 2,550 | |
Debt to (or guaranteed by) multilateral, export credit agencies or development banks (4) | | 5.89 | % | | 2009-2027 | | | 1,093 | | | | 995 | |
Other | | 8.96 | % | | 2009-2028 | | | 524 | | | | 212 | |
FIXED RATE: | | | | | | | | | | | | | |
Bank loans | | 8.48 | % | | 2009-2023 | | | 426 | | | | 327 | |
Notes and bonds | | 8.06 | % | | 2010-2037 | | | 5,197 | | | | 5,244 | |
Debt to (or guaranteed by) multilateral, export credit agencies or development banks (3) | | 6.75 | % | | 2009-2013 | | | 393 | | | | 7 | |
Other | | 7.21 | % | | 2009-2033 | | | 65 | | | | 291 | |
| | | | | | | | | | | | | |
SUBTOTAL | | | | | | | $ | 12,943 | | | $ | 12,435 | (4) |
Less: Current maturities | | | | | | | | (1,074 | ) | | | (1,142 | ) |
| | | | | | | | | | | | | |
TOTAL | | | | | | | $ | 11,869 | | | $ | 11,293 | |
| | | | | | | | | | | | | |
| (1) | Weighted average interest rate at December 31, 2008. |
| (2) | The Company has interest rate swaps and interest rate option agreements in an aggregate notional principal amount of approximately $3.6 billion on non-recourse debt outstanding at December 31, 2008. The swap agreements economically change the variable interest rates on the portion of the debt covered by the notional amounts to fixed rates ranging from approximately 1.93% to 7.00%. The option agreements fix interest rates within a range from 4.50% to 7.00%. The agreements expire at various dates from 2009 through 2027. |
| (3) | Variable rate notes and bonds consist of approximately $1.7 billion of debt issued by our Brazilian subsidiaries with a weighted average interest rate of 16.84% at December 31, 2008, and $132 million of auction rate bonds issued by IPL. These auction rate bonds have paid the penalty rate of 12% since late September 2008 due to failed auctions of these securities. Subsequent to December 31, 2008 IPL’s auction rate bonds were able to be remarketed at rates lower than these penalty rates. |
| (4) | Multilateral loans include loans funded and guaranteed by bilaterals, multilaterals, development banks and other similar institutions. |
| (5) | Ekibastuz and Maikuben debt of $164 million and Jiaozuo debt of $3 million as of December 31, 2007 are excluded from non-recourse debt and are included in current and long-term liabilities of held for sale and discontinued businesses in the accompanying Consolidated Balance Sheets. |
94
Future principal payments on non-recourse debt as of December 31, 2008 are set forth in the table below:
| | | |
December 31, | | Annual
Maturities |
| | | (in millions) |
2009 | | $ | 1,074 |
2010 | | | 955 |
2011 | | | 1,079 |
2012 | | | 762 |
2013 | | | 955 |
Thereafter | | | 8,118 |
| | | |
Total long-term debt | | $ | 12,943 |
| | | |
As of December 31, 2008, AES subsidiaries in operations had approximately $1.1 billion of a number of available but unused committed revolving credit lines to support their working capital, debt service reserves and other business needs. These credit lines can be used in one or more of the following ways: solely for borrowings; solely for letters of credit; or a combination of these uses. The weighted average interest rate on borrowing from these facilities was 11.54% at December 31, 2008. In addition to the committed credit lines described above, an operating subsidiary of the Company in Brazil had credit commitments from banks to lend up to $856 million at December 31, 2008. This credit commitment is subject to certain conditions and can only be used if the Company decides to exercise its preemptive rights to acquire the noncontrolling interest shares of Brasiliana held by a third-party in response to a decision by the partner to sell and exercise its preemptive rights to include our ownership portion in the sale. In addition to the credit lines described above, AES subsidiaries with facilities under construction had a total of approximately $2.0 billion of committed but unused credit facilities available to fund construction and other related costs.
Non-Recourse Debt Covenants, Restrictions and Defaults
The terms of the Company’s non-recourse debt include certain financial and non-financial covenants. These covenants are limited to subsidiary activity and vary among the subsidiaries. These covenants may include but are not limited to maintenance of certain reserves, minimum levels of working capital and limitations on incurring additional indebtedness. Compliance with certain covenants may not be objectively determinable.
As of December 31, 2008 and 2007, approximately $697 million and $614 million, respectively, of restricted cash was maintained in accordance with certain covenants of the debt agreements, and these amounts were included within restricted cash and debt service reserves and other deposits in the accompanying Consolidated Balance Sheets.
Various lender and governmental provisions restrict the ability of the Company’s subsidiaries to transfer their net assets to the Parent Company. Such restricted net assets of subsidiaries amounted to approximately $5 billion at December 31, 2008.
The following table summarizes the Company’s subsidiary non-recourse debt in default as of December 31, 2008 and is included in the current portion of non-recourse debt unless otherwise indicated:
| | | | | | | | |
Subsidiary | | Primary Nature
of Default | | December 31, 2008 |
| | | Default | | Net Assets |
| | | | | (in millions) |
Aixi | | Payment | | $ | 2 | | $ | 8 |
Kelanitissa | | Covenant | | | 50 | | | 1 |
Kilroot | | Covenant | | | 77 | | | 178 |
| | | | | | | | |
Total | | | | $ | 129 | | | |
| | | | | | | | |
95
None of the subsidiaries that are currently in default is a material subsidiary under AES’s corporate debt agreements whose acceleration of debt or bankruptcy would trigger an event of default or permit acceleration under such indebtedness. At December 31, 2008 none of our subsidiaries met the definition of material subsidiary under our recourse secured and unsecured bond indentures and our unsecured line of credit. All of the subsidiary guarantors under our recourse secured credit facilities are defined as material subsidiaries under that agreement. The bankruptcy or acceleration of material amounts of debt at these entities would cause a cross default under the recourse secured credit facilities. The subsidiary guarantors include the subsidiaries which own AES Eastern Energy, AES Warrior Run, AES Shady Point and AES Hawaii. However, as a result of additional dispositions of assets, other significant reductions in asset carrying values or other matters in the future that may impact our financial position and results of operations or the financial position or results of the individual subsidiary, it is possible that one or more of these subsidiaries could fall within the definition of a “material subsidiary” and thereby upon a bankruptcy or acceleration of its non-recourse debt trigger an event of default and possible acceleration of the indebtedness under the AES Parent Company’s outstanding debt securities.
Sonel, our subsidiary in Cameroon, and Masinloc, our subsidiary in the Philippines, were in default on total non-recourse debt of $217 million and $598 million, respectively, at December 31, 2008 due to covenant breaches. Subsequent to December 31, 2008, both subsidiaries were able to amend the terms of their respective debt agreements and are no longer considered in default, therefore the debt was appropriately classified as long-term at December 31, 2008 and was excluded from the debt default table above.
RECOURSE DEBT
The following table summarizes the recourse debt of the Company as of December 31, 2008 and 2007:
| | | | | | | | | | | | |
| | | | | | | December 31, | |
RECOURSE DEBT | | Interest Rate | | Maturity | | 2008 | | | 2007 | |
| | | | | | | (in millions) | |
Senior Unsecured Note | | 8.75% | | 2008 | | $ | — | | | $ | 9 | |
Term Convertible Trust Securities | | 6.00% | | 2008 | | | — | | | | 214 | |
Senior Unsecured Note | | 9.50% | | 2009 | | | 154 | | | | 467 | |
Senior Unsecured Note | | 9.375% | | 2010 | | | 214 | | | | 423 | |
Senior Secured Term Loan | | LIBOR + 1.75% | | 2011 | | | 200 | | | | 200 | |
Senior Unsecured Note | | 8.875% | | 2011 | | | 129 | | | | 307 | |
Senior Unsecured Note | | 8.375% | | 2011 | | | 124 | | | | 171 | |
Second Priority Senior Secured Note | | 8.75% | | 2013 | | | 690 | | | | 752 | |
Senior Unsecured Note | | 7.75% | | 2014 | | | 500 | | | | 500 | |
Senior Unsecured Note | | 7.75% | | 2015 | | | 500 | | | | 500 | |
Senior Unsecured Note | | 8.00% | | 2017 | | | 1,500 | | | | 1,500 | |
Senior Unsecured Note | | 8.00% | | 2020 | | | 625 | | | | — | |
Term Convertible Trust Securities | | 6.75% | | 2029 | | | 517 | | | | 517 | |
Unamortized discounts | | | | | | | (5 | ) | | | (5 | ) |
| | | | | | | | | | | | |
SUBTOTAL | | | | | | $ | 5,148 | | | $ | 5,555 | |
Less: Current maturities | | | | | | | (154 | ) | | | (223 | ) |
| | | | | | | | | | | | |
Total | | | | | | $ | 4,994 | | | $ | 5,332 | |
| | | | | | | | | | | | |
96
Future principal payments on recourse debt as of December 31, 2008 are set forth in the table below:
| | | |
December 31, | | Annual Maturities |
| | | (in millions) |
2009 | | $ | 154 |
2010 | | | 214 |
2011 | | | 453 |
2012 | | | — |
2013 | | | 690 |
Thereafter | | | 3,637 |
| | | |
Total long-term debt | | $ | 5,148 |
| | | |
Financing and Tender Offer
In the second quarter of 2008, the Company completed a number of debt-related transactions that resulted in a net reduction of approximately $360 million in aggregate principal of recourse debt. These transactions, described in further detail below, included $223 million of debt paid at maturity, the repurchase of the $762 million of senior notes maturing from 2009 to 2013 that were tendered in the Company’s publicly announced tender offer, and the issuance of $625 million of 8% Senior Unsecured Notes due 2020 at par value.
The notes repaid at maturity included $223 million outstanding 6.0% Junior Subordinated Convertible Debentures due May 15, 2008 and 8.75% Senior Unsecured Notes due June 15, 2008.
On May 15, 2008, we issued $625 million of 8% Senior Unsecured Notes due 2020 at par value. Deferred financing costs attributable to the issuance of these senior notes were approximately $10 million.
On June 19, 2008 the Company repurchased $762 million aggregate principal of senior notes maturing from 2009 to 2013 in connection with its publicly announced tender offer. Specifically, the Company repurchased $313 million of the 9.50% Senior Notes due 2009, (the “2009 Notes”), $209 million of the 9.375% Senior Notes due 2010 (the “2010 Notes”), $178 million of the 8.875% Senior Notes due 2011 (the “2011 Notes”), and $62 million of the 8.75% Second Priority Senior Secured Notes due 2013 (the “2013 Notes”). The Company recognized and included a pre-tax loss on the retirement of the senior notes for the year ended December 31, 2008 of $55 million, in “Other expense” which included $52 million of tender consideration.
In connection with the tender offer for the senior notes in 2008, the Company solicited and received consents from the remaining holders of the 2013 Notes to amend the related indenture to conform substantially all of the covenants, except those related to security, to those contained in the indenture governing the Company’s senior unsecured notes.
Amendment of Credit Agreement
On July 29, 2008, The AES Corporation and certain subsidiary guarantors amended and restated the Company’s existing senior secured bank facility (“Bank Facility”) pursuant to the terms of the Fourth Amended and Restated Credit and Reimbursement Agreement (the “Amended and Restated Credit Agreement”). The Amended and Restated Credit Agreement provides for a $200 million senior secured term loan (“Term Loan”) maturing on August 10, 2011, and a Revolving Credit Facility (“the Revolver”) with available borrowings up to $750 million, maturing on June 23, 2010. The Amended and Restated Credit Agreement is included as an exhibit to the 2008 Form 10-K.
The Company entered into the Amended and Restated Credit Agreement primarily to accomplish the following: (i) increase the size of the Restricted Payments basket to allow the Company to repurchase or pay dividends on equity; (ii) reduce the required minimum Cash Flow Coverage Ratio (as defined therein) and
97
increase the maximum Recourse Debt to Cash Flow Ratio (as defined therein); (iii) clarify and make modifications to the provisions that permit hedging activities; and (iv) make certain other changes, such as excluding certain equity-like securities from the definition of Recourse Debt, amending the financial reporting and environmental notice requirements, clarifying that the term “Permitted Business” includes climate solutions, carbon offsets, biofuels, battery storage and ancillary businesses, including related trading activities and amending certain other definitions and covenants.
As of December 31, 2008, the Revolving Credit Facility accrued interest at LIBOR plus 1.5% and there were no outstanding borrowings against the Revolving Credit Facility. The Company had $30 million of letters of credit outstanding against the Revolving Credit Facility and $720 million was available under the Revolving Credit Facility.
The Company’s senior unsecured credit facility (“Credit Facility”) had available borrowings of $423 million. At December 31, 2008, the Company had no outstanding borrowings under the Credit Facility. The Company had $177 million of letters of credit outstanding against the Credit Facility as of December 31, 2008. The Credit Facility, which accrues interest at a variable rate indexed to LIBOR and matures in 2010, is being used to support the Company’s ongoing share of construction obligations for AES Maritza East 1 and for general corporate purposes. AES Maritza East 1 is a coal-fired generation project in Bulgaria that began construction in the second quarter of 2006 and is expected to commence operations in 2010.
Recourse Debt Covenants and Guarantees
Certain of the Company’s obligations under the Bank Facilities are guaranteed by its direct subsidiaries through which the Company owns its interests in the Shady Point, Hawaii, Warrior Run and Eastern Energy businesses. The Company’s obligations under the Bank Facility and Second Priority Senior Secured Notes are, subject to certain exceptions, secured by:
(i) all of the capital stock of domestic subsidiaries owned directly by the Company and 65% of the capital stock of certain foreign subsidiaries owned directly or indirectly by the Company; and
(ii) certain intercompany receivables, certain intercompany notes and certain intercompany tax sharing agreements.
The Bank Facility is subject to mandatory prepayment under certain circumstances. The net cash proceeds from the sale of a Guarantor or any of its subsidiaries must be applied pro rata to repay the Term Loan using 60% of net cash proceeds, reduced to 50% when and if the parent’s recourse debt to cash flow ratio is less than 5:1. The lenders have the option to waive their pro rata redemption. In the case of sales of assets of or equity interests in IPALCO or any of its subsidiaries, any net cash proceeds of the asset sale remaining after application to the Term Loan facility must be used to reduce commitments under the Revolver, unless the supermajority of banks otherwise agree or unless the facilities are rated at least Ba1 from Moody’s and AES’ corporate credit rating from S&P is at least BB–.
The Bank Facility contains customary covenants and restrictions on the Company’s ability to engage in certain activities, including, but not limited to, limitations on other indebtedness, liens, investments and guarantees; limitations on restricted payments such as shareholder dividends and equity repurchases; restrictions on mergers and acquisitions, sales of assets, leases, transactions with affiliates and off-balance sheet or derivative arrangements; and other financial reporting requirements.
The Bank Facility also contains financial covenants requiring the Company to maintain certain financial ratios including a cash flow to interest coverage ratio, calculated quarterly, which provides that a minimum ratio of the Company’s adjusted operating cash flow to the Company’s interest charges related to recourse debt of 1.3× must be maintained at all times and a recourse debt to cash flow ratio, calculated quarterly, which provides that the ratio of the Company’s total recourse debt to the Company’s adjusted operating cash flow must not exceed a maximum of 8.0× at any time of calculation.
98
The terms of the Company’s Senior Unsecured Notes, Credit Facility, and Second Priority Secured Notes contain certain covenants including, without limitation, limitation on the Company’s ability to incur liens or enter into sale and leaseback transactions.
TERM CONVERTIBLE TRUST SECURITIES
In 1999, AES Trust III, a wholly owned special purpose business trust, issued 9 million of $3.375 Term Convertible Preferred Securities (“TECONS”) (liquidation value $50) for total proceeds of approximately $518 million and concurrently purchased approximately $518 million of 6.75% Junior Subordinated Convertible Debentures due 2029 (the “6.75% Debentures” of the Company). The TECONS are consolidated and classified as long-term recourse debt on the Company’s balance sheet.
AES, at its option, can redeem the 6.75% Debentures which would result in the required redemption of the TECONS issued by AES Trust III, currently for $50 per TECON. The TECONS must be redeemed upon maturity of the Junior Subordinated Debentures. The TECONS are convertible into the common stock of AES at each holder’s option prior to October 15, 2029 at the rate of 1.4216, representing a conversion price of $35.17 per share.
Dividends on the TECONS are payable quarterly at an annual rate of 6.75%. The Trust is permitted to defer payment of dividends for up to 20 consecutive quarters, provided that the Company has exercised its right to defer interest payments under the corresponding debentures or notes. AES has not exercised the option to defer any dividends at this time. During such deferral periods, dividends on the TECONS would accumulate quarterly and accrue interest, and the Company may not declare or pay dividends on its common stock. All dividends due under the Trust have been paid.
AES Trust III is a VIE under FIN No. 46(R). AES’s obligations under the Junior Subordinated Debentures and other relevant trust agreements, in aggregate, constitute a full and unconditional guarantee by AES of the TECON Trusts’ obligations under the trust securities issued the respective trust. Accordingly, AES consolidates the results of AES Trust III. As of December 31, 2008 and 2007, the sole assets of AES Trust III are the Junior Subordinated Debentures.
In 2000, AES Trust VII, a wholly owned special purpose business trust and a VIE under FIN No. 46(R), issued 9.2 million of $3.00 TECONS (liquidation value $50) for total proceeds of approximately $460 million and concurrently purchased approximately $460 million of 6% Junior Subordinated Convertible Debentures due 2008 (the “6% Debentures”). In May 2008, the Company used a portion of the proceeds from the issuance of its 8% Senior Unsecured Notes due 2020 to redeem the 6% Debentures and AES Trust VII was dissolved. At December 31, 2007, the sole assets of AES Trust VII were the 6% Debentures.
11. COMMITMENTS
OPERATING LEASES—As of December 31, 2008, the Company was obligated under long-term non-cancelable operating leases, primarily for certain transmission lines, office rental and site leases. Rental expense for lease commitments under these operating leases for the years ended December 31, 2008, 2007 and 2006 was $74 million, $64 million and $17 million, respectively.
99
The table below sets forth the future minimum lease commitments under these operating leases at December 31, 2008 for 2009 through 2013 and thereafter:
| | | |
December 31, | | Future
Commitments
for Operating
Leases |
| | | (in millions) |
2009 | | $ | 64 |
2010 | | | 59 |
2011 | | | 59 |
2012 | | | 59 |
2013 | | | 59 |
Thereafter | | | 193 |
| | | |
Total | | $ | 493 |
| | | |
CAPITAL LEASES—Several AES subsidiaries lease operating and office equipment and vehicles that are considered capital lease transactions. These capital leases are recognized in Property, Plant and Equipment within “Electric generation and distribution assets” and primarily relate to transmission lines at our subsidiaries in Brazil. The gross value of the leased assets for the years ended December 31, 2008 and 2007 was $95 million and $69 million, respectively.
The following table is a schedule by years of future minimum lease payments under capital leases together with the present value of the net minimum lease payments at December 31, 2008 for 2009 through 2013 and thereafter:
| | | |
December 31, | | Future
Minimum
Lease
Payments |
| | | (in millions) |
2009 | | $ | 11 |
2010 | | | 9 |
2011 | | | 8 |
2012 | | | 7 |
2013 | | | 7 |
Thereafter | | | 116 |
| | | |
Total | | $ | 158 |
Less: Imputed interest | | | 96 |
| | | |
Present value of total minimum lease payments | | $ | 62 |
| | | |
SALE/LEASEBACK—In May 1999, a subsidiary of the Company acquired six electric generating stations from New York State Electric and Gas (“NYSEG”). Concurrently, the subsidiary sold two of the plants to an unrelated third party for $666 million and simultaneously entered into a leasing arrangement with the unrelated party. This transaction has been accounted for as a sale/leaseback with operating lease treatment. In May 2007, the subsidiary purchased a portion of the lessor’s interest in a trust estate that holds the leased plants. Future minimum lease commitments under the lease agreement are reduced by the subsidiary’s interest in the plants. Rental expense was $34 million, $42 million and $54 million for the years ended December 31, 2008, 2007 and 2006, respectively.
100
The following table summarizes the future minimum lease commitments under the sale/leaseback arrangement at December 31, 2008 for 2009 through 2013 and thereafter:
| | | |
December 31, | | Future
Minimum
Lease
Commitments |
| | | (in millions) |
2009 | | $ | 39 |
2010 | | | 41 |
2011 | | | 43 |
2012 | | | 44 |
2013 | | | 46 |
Thereafter | | | 531 |
| | | |
Total | | $ | 744 |
| | | |
CONTRACTS—Operating subsidiaries of the Company have entered into contracts for the purchase of electricity from third parties that primarily include energy auction agreements at our Brazil subsidiaries with extended terms from 2009 through 2042. Purchases in the years ended December 31, 2008, 2007 and 2006 were approximately $1.5 billion, $2.2 billion and $1.2 billion, respectively.
The table below sets forth the future commitments under these electricity purchase contracts at December 31, 2008 for 2009 through 2013 and thereafter:
| | | |
December 31, | | Future
Commitments
for Electricity
Purchase
Contracts |
| | | (in millions) |
2009 | | $ | 1,754 |
2010 | | | 2,021 |
2011 | | | 2,366 |
2012 | | | 2,588 |
2013 | | | 2,451 |
Thereafter | | | 36,085 |
| | | |
Total | | $ | 47,265 |
| | | |
Operating subsidiaries of the Company have entered into various long-term contracts for the purchase of fuel subject to termination only in certain limited circumstances. Purchases in the years ended December 31, 2008, 2007 and 2006 were $1.8 billion, $1.3 billion and $844 million, respectively.
The table below sets forth the future commitments under these fuel contracts as of December 31, 2008 for 2009 through 2013 and thereafter:
| | | |
December 31, | | Future
Commitments
for Fuel
Contracts |
| | | (in millions) |
2009 | | $ | 2,113 |
2010 | | | 1,798 |
2011 | | | 1,462 |
2012 | | | 1,391 |
2013 | | | 1,337 |
Thereafter | | | 13,740 |
| | | |
Total | | $ | 21,841 |
| | | |
101
The Company’s subsidiaries entered into other various long-term contracts. These contracts are mainly for construction projects, service and maintenance, transmission of electricity and other operation services. Payments under these contracts for the years ended December 31, 2008, 2007 and 2006 were $1.9 billion, $840 million and $596 million, respectively.
The table below sets forth the future commitments under these other purchase contracts as of December 31, 2008 for 2009 through 2013 and thereafter:
| | | |
December 31, | | Future
Commitments
for Other
Purchase
Contracts |
| | | (in millions) |
2009 | | $ | 2,403 |
2010 | | | 1,463 |
2011 | | | 1,004 |
2012 | | | 917 |
2013 | | | 783 |
Thereafter | | | 14,354 |
| | | |
Total | | $ | 20,924 |
| | | |
12. CONTINGENCIES
ENVIRONMENTAL—The Company reviews its obligations as they relate to compliance with environmental laws, including site restoration and remediation. As of December 31, 2008, the Company has recognized liabilities of $30 million for projected environmental remediation costs. Due to the uncertainties associated with environmental assessment and remediation activities, future costs of compliance or remediation could be higher or lower than the amount currently accrued. Based on currently available information and analysis, the Company believes that it is reasonably possible that costs associated with such liabilities or as yet unknown liabilities may exceed current reserves in amounts that could be material but cannot be estimated as of December 31, 2008.
GUARANTEES, LETTERS OF CREDIT—In connection with certain project financing, acquisition, power purchase, and other agreements, AES has expressly undertaken limited obligations and commitments, most of which will only be effective or will be terminated upon the occurrence of future events. In the normal course of business, AES and certain of its subsidiaries enter into various agreements providing financial or performance assurance to third parties on behalf of certain subsidiaries. Such agreements include guarantees and letters of credit. These agreements are entered into primarily to support or enhance the creditworthiness otherwise achieved by a subsidiary on a stand-alone basis, thereby facilitating the availability of sufficient credit to accomplish the subsidiaries’ intended business purposes. In addition to the contingent obligations of the Parent Company identified in the table below, the Company’s subsidiaries had letters of credit outstanding to support various contingent obligations. At December 31, 2008, these letters of credit at our consolidated subsidiaries totaled approximately $1.2 billion.
102
The following table summarizes the Parent Company’s contingent contractual obligations as of December 31, 2008:
| | | | | | | | |
Contingent contractual obligations | | Amount | | Number of
Agreements | | Maximum
Exposure
Range for
Each
Agreement |
| | | (in millions) | | | | (in millions) |
Guarantees | | $ | 411 | | 34 | | <$ | 1 - $ 53 |
Letters of credit - under the Revolving Credit Facility | | | 30 | | 4 | | <$ | 1 - $ 28 |
Letters of credit - under the Senior Unsecured Credit Facility | | | 177 | | 15 | | <$ | 1 - $131 |
| | | | | | | | |
Total | | $ | 618 | | 53 | | | |
| | | | | | | | |
Most of the contingent obligations primarily relate to future performance commitments which the Company or its subsidiaries expect to fulfill within the normal course of business. Amounts presented in the above table represent the Parent Company’s current undiscounted exposure to guarantees and the range of maximum undiscounted potential exposure to the Parent Company as of December 31, 2008. Guarantee termination provisions vary from less than one year to greater than 20 years. Some result from the end of a contract period, assignment, asset sale, and change in credit rating or elapsed time. The amounts above include obligations made by the Parent Company for the direct benefit of the lenders associated with the non-recourse debt of subsidiaries of $48 million.
The risks associated with these obligations include change of control, construction cost overruns, political risk, tax indemnities, spot market power prices, supplier support and liquidated damages under power purchase agreements for projects in development, under construction and operating. While the Company does not expect to be required to fund any material amounts under these contingent contractual obligations during 2009 or beyond that are not recognized on the Consolidated Balance Sheet, many of the events which would give rise to such an obligation are beyond the Parent Company’s control. There can be no assurance that the Parent Company would have adequate sources of liquidity to fund its obligations under these contingent contractual obligations if it were required to make substantial payments thereunder.
In 2008, the Parent Company paid letter of credit fees which averaged 3.4% per annum on the outstanding amounts of letters of credit.
LITIGATION—The Company is involved in certain claims, suits and legal proceedings in the normal course of business, some of which are described below. The Company has accrued for litigation and claims where it is probable that a liability has been incurred and the amount of loss can be reasonably estimated. The Company believes, based upon information it currently possesses and taking into account established reserves for estimated liabilities and its insurance coverage, that the ultimate outcome of these proceedings and actions is unlikely to have a material adverse effect on the Company’s financial statements. However, it is reasonably possible that some matters could be decided unfavorably to the Company, and could require the Company to pay damages or make expenditures in amounts that could be material but cannot be estimated as of December 31, 2008. The Company has evaluated claims, in accordance with SFAS No. 5,Accounting for Contingencies, (“SFAS No. 5”) that it deems both probable and reasonably estimable and accordingly, has recorded aggregate reserves for all claims for approximately $389 million and $486 million at December 31, 2008 and 2007, respectively.
In 1989, Centrais Elétricas Brasileiras S.A. (“Eletrobrás”) filed suit in the Fifth District Court in the State of Rio de Janeiro against Eletropaulo Eletricidade de São Paulo S.A. (“EEDSP”) relating to the methodology for calculating monetary adjustments under the parties’ financing agreement. In April 1999, the Fifth District Court found for Eletrobrás and in September 2001, Eletrobrás initiated an execution suit in the Fifth District Court to
103
collect approximately R$937 million ($400 million) from Eletropaulo (as estimated by Eletropaulo) and a lesser amount from an unrelated company, Companhia de Transmissão de Energia Elétrica Paulista (“CTEEP”) (Eletropaulo and CTEEP were spun off from EEDSP pursuant to its privatization in 1998). In November 2002, the Fifth District Court rejected Eletropaulo’s defenses in the execution suit. Eletropaulo appealed and in September 2003, the Appellate Court of the State of Rio de Janeiro ruled that Eletropaulo was not a proper party to the litigation because any alleged liability had been transferred to CTEEP pursuant to the privatization. In June 2006, the Superior Court of Justice (“SCJ”) reversed the Appellate Court’s decision and remanded the case to the Fifth District Court for further proceedings, holding that Eletropaulo’s liability, if any, should be determined by the Fifth District Court. Eletropaulo’s subsequent appeals to the Special Court (the highest court within the SCJ) and the Supreme Court of Brazil have been dismissed. Eletrobrás may resume the execution suit in the Fifth District Court at any time. If Eletrobrás does so, Eletropaulo will be required to provide security in the amount of its alleged liability. In that case, if Eletrobrás requests the seizure of such security and the Fifth District Court grants such request, Eletropaulo’s results of operations may be materially adversely affected. In addition, in February 2008, CTEEP filed a lawsuit in the Fifth District Court against Eletrobrás and Eletropaulo seeking a declaration that CTEEP is not liable for any debt under the financing agreement. Eletropaulo believes it has meritorious defenses to the claims asserted against it and will defend itself vigorously in these proceedings; however, there can be no assurances that it will be successful in its efforts.
In September 1999, a state appellate court in Minas Gerais, Brazil, granted a temporary injunction suspending the effectiveness of a shareholders’ agreement between Southern Electric Brasil Participacoes, Ltda. (“SEB”) and the state of Minas Gerais concerning CEMIG, an integrated utility in Minas Gerais. The Company’s investment in CEMIG is through SEB. This shareholders’ agreement granted SEB certain rights and powers in respect of CEMIG (“Special Rights”). In March 2000, a lower state court in Minas Gerais held the shareholders’ agreement invalid where it purported to grant SEB the Special Rights and enjoined the exercise of the Special Rights. In August 2001, the state appellate court denied an appeal of the decision and extended the injunction. In October 2001, SEB filed appeals against the state appellate court’s decision with the Federal Superior Court and the Supreme Court of Justice. The state appellate court denied access of these appeals to the higher courts, and in August 2002 SEB filed interlocutory appeals against such denial with the Federal Superior Court and the Supreme Court of Justice. In December 2004, the Federal Superior Court declined to hear SEB’s appeal. However, the Supreme Court of Justice is considering whether to hear SEB’s appeal. SEB intends to vigorously pursue a restoration of the value of its investment in CEMIG by all legal means; however, there can be no assurances that it will be successful in its efforts. Failure to prevail in this matter may limit SEB’s influence on the daily operation of CEMIG.
In August 2000, the Federal Energy Regulation Commission (“FERC”) announced an investigation into the organized California wholesale power markets in order to determine whether rates were just and reasonable. Further investigations involved alleged market manipulation. FERC requested documents from each of the AES Southland, LLC plants and AES Placerita, Inc. AES Southland and AES Placerita have cooperated fully with the FERC investigations. AES Southland was not subject to refund liability because it did not sell into the organized spot markets due to the nature of its tolling agreement. AES Placerita is currently subject to refund liability of $588,000 plus interest for spot sales to the California Power Exchange from October 2, 2000 to June 20, 2001 (“Refund Period”). In September 2004, the U.S. Court of Appeals for the Ninth Circuit issued an order addressing FERC’s decision not to impose refunds for the alleged failure to file rates, including transaction specific data, for sales during 2000 and 2001 (“September 2004 Decision”). Although it did not order refunds, the Ninth Circuit remanded the case to FERC for a refund proceeding to consider remedial options. In March 2008, FERC issued its order on remand, requiring the parties to engage in settlement discussions before a settlement judge and establishing procedures for an evidentiary hearing if the settlement process failed. In addition, in August 2006 in a separate case, the Ninth Circuit confirmed the Refund Period, expanded the transactions subject to refunds to include multi-day transactions, expanded the potential liability of sellers to include any pre-Refund Period tariff violations, and remanded the matter to FERC (“August 2006 Decision”). Various parties filed petitions for rehearing in November 2007. The August 2006 Decision may allow FERC to reopen closed investigations and order relief. AES Placerita made sales during the periods at issue in the
104
September 2004 and August 2006 Decisions. Both appeals may be subject to further court review, and further FERC proceedings on remand would be required to determine potential liability, if any. Prior to the August 2006 Decision, AES Placerita’s potential liability for the Refund and pre-Refund Periods could have approximated $23 million plus interest. However, given the September 2004 and August 2006 Decisions, it is unclear whether AES Placerita’s potential liability is less than or exceeds that amount. AES Placerita believes it has meritorious defenses to the claims asserted against it and will defend itself vigorously in these proceedings; however, there can be no assurances that it will be successful in its efforts.
In August 2001, the Grid Corporation of Orissa, India (“Gridco”), filed a petition against the Central Electricity Supply Company of Orissa Ltd. (“CESCO”), an affiliate of the Company, with the Orissa Electricity Regulatory Commission (“OERC”), alleging that CESCO had defaulted on its obligations as an OERC-licensed distribution company, that CESCO management abandoned the management of CESCO, and asking for interim measures of protection, including the appointment of an administrator to manage CESCO. Gridco, a state-owned entity, is the sole wholesale energy provider to CESCO. Pursuant to the OERC’s August 2001 order, the management of CESCO was replaced with a government administrator who was appointed by the OERC. The OERC later held that the Company and other CESCO shareholders were not necessary or proper parties to the OERC proceeding. In August 2004, the OERC issued a notice to CESCO, the Company and others giving the recipients of the notice until November 2004 to show cause why CESCO’s distribution license should not be revoked. In response, CESCO submitted a business plan to the OERC. In February 2005, the OERC issued an order rejecting the proposed business plan. The order also stated that the CESCO distribution license would be revoked if an acceptable business plan for CESCO was not submitted to and approved by the OERC prior to March 31, 2005. In its April 2, 2005 order, the OERC revoked the CESCO distribution license. CESCO has filed an appeal against the April 2, 2005 OERC order and that appeal remains pending in the Indian courts. In addition, Gridco asserted that a comfort letter issued by the Company in connection with the Company’s indirect investment in CESCO obligates the Company to provide additional financial support to cover all of CESCO’s financial obligations to Gridco. In December 2001, Gridco served a notice to arbitrate pursuant to the Indian Arbitration and Conciliation Act of 1996 on the Company, AES Orissa Distribution Private Limited (“AES ODPL”), and Jyoti Structures (“Jyoti”) pursuant to the terms of the CESCO Shareholders Agreement between Gridco, the Company, AES ODPL, Jyoti and CESCO (the “CESCO arbitration”). In the arbitration, Gridco appeared to be seeking approximately $189 million in damages, plus undisclosed penalties and interest, but a detailed alleged damage analysis was not filed by Gridco. The Company counterclaimed against Gridco for damages. In June 2007, a 2-to-1 majority of the arbitral tribunal rendered its award rejecting Gridco’s claims and holding that none of the respondents, the Company, AES ODPL, or Jyoti, had any liability to Gridco. The respondents’ counterclaims were also rejected. The Company subsequently filed an application to recover its costs of the arbitration, which is under consideration by the tribunal. In addition, in September 2007, Gridco filed a challenge of the arbitration award with the local Indian court. In June 2008, Gridco filed a separate application with the local Indian court for an order enjoining the Company from selling or otherwise transferring its shares in Orissa Power Generation Corporation Ltd’s (“OPGC”), and requiring the Company to provide security in the amount of the contested damages in the CESCO arbitration until Gridco’s challenge to the arbitration award is resolved. The Company believes that it has meritorious defenses to the claims asserted against it and will defend itself vigorously in these proceedings; however, there can be no assurances that it will be successful in its efforts.
In early 2002, Gridco made an application to the OERC requesting that the OERC initiate proceedings regarding the terms of OPGC’s existing PPA with Gridco. In response, OPGC filed a petition in the Indian courts to block any such OERC proceedings. In early 2005, the Orissa High Court upheld the OERC’s jurisdiction to initiate such proceedings as requested by Gridco. OPGC appealed that High Court’s decision to the Supreme Court and sought stays of both the High Court’s decision and the underlying OERC proceedings regarding the PPAs terms. In April 2005, the Supreme Court granted OPGC’s requests and ordered stays of the High Court’s decision and the OERC proceedings with respect to the PPA’s terms. The matter is awaiting further hearing. Unless the Supreme Court finds in favor of OPGC’s appeal or otherwise prevents the OERC’s proceedings regarding the PPA’s terms, the OERC will likely lower the tariff payable to OPGC under the PPA, which would have an adverse impact on OPGC’s financials. OPGC believes that it has meritorious claims and defenses and will assert them vigorously in these proceedings; however, there can be no assurances that it will be successful in its efforts.
105
In March 2003, the office of the Federal Public Prosecutor for the State of Sao Paulo, Brazil (“MPF”) notified AES Eletropaulo that it had commenced an inquiry related to the Brazilian National Development Bank (“BNDES”) financings provided to AES Elpa and AES Transgás and the rationing loan provided to Eletropaulo, changes in the control of Eletropaulo, sales of assets by Eletropaulo and the quality of service provided by Eletropaulo to its customers, and requested various documents from Eletropaulo relating to these matters. In July 2004, the MPF filed a public civil lawsuit in federal court alleging that BNDES violated Law 8429/92 (the Administrative Misconduct Act) and BNDES’s internal rules by: (1) approving the AES Elpa and AES Transgás loans; (2) extending the payment terms on the AES Elpa and AES Transgás loans; (3) authorizing the sale of Eletropaulo’s preferred shares at a stock- market auction; (4) accepting Eletropaulo’s preferred shares to secure the loan provided to Eletropaulo; and (5) allowing the restructurings of Light Serviços de Eletricidade S.A. (“Light”) and Eletropaulo. The MPF also named AES Elpa and AES Transgás as defendants in the lawsuit because they allegedly benefited from BNDES’s alleged violations. In June 2005, AES Elpa and AES Transgás presented their preliminary answers to the charges. In May 2006, the federal court ruled that the MPF could pursue its claims based on the first, second, and fourth alleged violations noted above. The MPF subsequently filed an interlocutory appeal seeking to require the federal court to consider all five alleged violations. Also, in July 2006, AES Elpa and AES Transgás filed an interlocutory appeal seeking to enjoin the federal court from considering any of the alleged violations. The MPF’s lawsuit before the federal court has been stayed pending those interlocutory appeals. AES Elpa and AES Transgás believe they have meritorious defenses to the allegations asserted against them and will defend themselves vigorously in these proceedings; however, there can be no assurances that they will be successful in their efforts.
AES Florestal, Ltd. (“Florestal”), had been operating a pole factory and had other assets, including a wooded area known as “Horto Renner,” in the State of Rio Grande do Sul, Brazil (collectively, “Property”). Florestal had been under the control of AES Sul (“Sul”) since October 1997, when Sul was created pursuant to a privatization by the Government of the State of Rio Grande do Sul. After it came under the control of Sul, Florestal performed an environmental audit of the entire operational cycle at the pole factory. The audit discovered 200 barrels of solid creosote waste and other contaminants at the pole factory. The audit concluded that the prior operator of the pole factory, Companhia Estadual de Energia Elétrica (“CEEE”), had been using those contaminants to treat the poles that were manufactured at the factory. Sul and Florestal subsequently took the initiative of communicating with Brazilian authorities, as well as CEEE, about the adoption of containment and remediation measures. The Public Attorney’s Office has initiated a civil inquiry (Civil Inquiry n. 24/05) to investigate potential civil liability and has requested that the police station of Triunfo institute a police investigation (IP number 1041/05) to investigate potential criminal liability regarding the contamination at the pole factory. The parties filed defenses in response to the civil inquiry. The Public Attorney’s Office then requested an injunction which the judge rejected on September 26, 2008. The Public Attorney’s office has a right to appeal the decision. The environmental agency (“FEPAM”) has also started a procedure (Procedure no. 088200567/059) to analyze the measures that shall be taken to contain and remediate the contamination. Also, in March 2000, Sul filed suit against CEEE in the 2nd Court of Public Treasure of Porto Alegre seeking to register in Sul’s name the Property that it acquired through the privatization but that remained registered in CEEE’s name. During those proceedings, AES subsequently waived its claim to re-register the Property and asserted a claim to recover the amounts paid for the Property. That claim is pending. In November 2005, the 7th Court of Public Treasure of Porto Alegre ruled that the Property must be returned to CEEE. CEEE has had sole possession of Horto Renner since September 2006 and of the rest of the Property since April 2006. In February 2008, Sul and CEEE signed a “Technical Cooperation Protocol” pursuant to which they requested a new deadline from FEPAM in order to present a proposal. The proposal was delivered on April 8, 2008. FEPAM responded by indicating that the parties should undertake the first step of the proposal which would be to retain a contractor. In its response Sul indicated that such step should be undertaken by CEEE as the relevant environmental events resulted from CEEE’s operations. It is estimated that remediation could cost approximately R$14.7 million ($6.3 million). Discussions between Sul and CEEE are ongoing.
106
In January 2004, the Company received notice of a “Formulation of Charges” filed against the Company by the Superintendence of Electricity of the Dominican Republic. In the “Formulation of Charges,” the Superintendence asserts that the existence of three generation companies (Empresa Generadora de Electricidad Itabo, S.A., (“Itabo”) Dominican Power Partners, and AES Andres BV) and one distribution company (Empresa Distribuidora de Electricidad del Este, S.A. (“Este”)) in the Dominican Republic, violates certain cross- ownership restrictions contained in the General Electricity Law of the Dominican Republic. In February 2004, the Company filed in the First Instance Court of the National District of the Dominican Republic an action seeking injunctive relief based on several constitutional due process violations contained in the “Formulation of Charges” (“Constitutional Injunction”). In February 2004, the Court granted the Constitutional Injunction and ordered the immediate cessation of any effects of the “Formulation of Charges,” and the enactment by the Superintendence of Electricity of a special procedure to prosecute alleged antitrust complaints under the General Electricity Law. In March 2004, the Superintendence of Electricity appealed the Court’s decision. In July 2004, the Company divested any interest in Este. The Superintendence of Electricity’s appeal is pending. The Company believes it has meritorious defenses to the claims asserted against it and will defend itself vigorously in these proceedings; however, there can be no assurances that it will be successful in its efforts.
In April 2004, BNDES filed a collection suit against SEB, a subsidiary of the Company, to obtain the payment of R$3.5 billion ($1.5 billion), which includes principal, interest and penalties under the loan agreement between BNDES and SEB, the proceeds of which were used by SEB to acquire shares of CEMIG. In May 2004, the 15th Federal Circuit Court (“Circuit Court”) ordered the attachment of SEB’s CEMIG shares, which were given as collateral for the loan, as well as dividends paid by CEMIG to SEB. At the time of the attachment, the shares were worth approximately R$762 million ($325 million). In December 2006, SEB’s defense was ruled groundless by the Circuit Court, and in January 2007, SEB filed an appeal to the relevant Federal Court of Appeals. Subsequently, BNDES has seized a total of approximately R$630 million ($269 million) in attached dividends, with the approval of the Circuit Court. Also, in April 2008, BNDES filed a plea to seize the attached CEMIG shares. The Circuit Court will consider BNDES’s request to seize the attached CEMIG shares after the net value of the alleged debt is recalculated in light of BNDES’s seizure of dividends. SEB believes it has meritorious defenses to the claims asserted against it and will defend itself vigorously in these proceedings; however, there can be no assurances that it will be successful in its efforts.
In July 2004, the Corporación Dominicana de Empresas Eléctricas Estatales (“CDEEE”) filed lawsuits against Itabo, an affiliate of the Company, in the First and Fifth Chambers of the Civil and Commercial Court of First Instance for the National District. CDEEE alleges in both lawsuits that Itabo spent more than was necessary to rehabilitate two generation units of an Itabo power plant and, in the Fifth Chamber lawsuit, that those funds were paid to affiliates and subsidiaries of AES Gener and Coastal Itabo, Ltd. (“Coastal”), a former shareholder of Itabo, without the required approval of Itabo’s board of administration. In the First Chamber lawsuit, CDEEE seeks an accounting of Itabo’s transactions relating to the rehabilitation. In November 2004, the First Chamber dismissed the case for lack of legal basis. On appeal, in October 2005 the Court of Appeals of Santo Domingo ruled in Itabo’s favor, reasoning that it lacked jurisdiction over the dispute because the parties’ contracts mandated arbitration. The Supreme Court of Justice is considering CDEEE’s appeal of the Court of Appeals’ decision. In the Fifth Chamber lawsuit, which also names Itabo’s former president as a defendant, CDEEE seeks $15 million in damages and the seizure of Itabo’s assets. In October 2005, the Fifth Chamber held that it lacked jurisdiction to adjudicate the dispute given the arbitration provisions in the parties’ contracts. The First Chamber of the Court of Appeal ratified that decision in September 2006. In a related proceeding, in May 2005, Itabo filed a lawsuit in the U.S. District Court for the Southern District of New York seeking to compel CDEEE to arbitrate its claims. The petition was denied in July 2005. Itabo’s appeal of that decision to the U.S. Court of Appeals for the Second Circuit has been stayed since September 2006. Further, in September 2006, in an International Chamber of Commerce arbitration, an arbitral tribunal determined that they lacked jurisdiction to decide arbitration claims concerning these disputes. Itabo believes it has meritorious claims and defenses and will assert them vigorously in these proceedings; however, there can be no assurances that it will be successful in its efforts.
107
In April 2006, a putative class action complaint was filed in the U.S. District Court for the Southern District of Mississippi (“District Court”) on behalf of certain individual plaintiffs and all residents and/or property owners in the State of Mississippi who allegedly suffered harm as a result of Hurricane Katrina, and against the Company and numerous unrelated companies, whose alleged greenhouse gas emissions allegedly increased the destructive capacity of Hurricane Katrina. The plaintiffs assert unjust enrichment, civil conspiracy/aiding and abetting, public and private nuisance, trespass, negligence, and fraudulent misrepresentation and concealment claims against the defendants. The plaintiffs seek damages relating to loss of property, loss of business, clean-up costs, personal injuries and death, but do not quantify their alleged damages. In August 2007, the District Court dismissed the case. The plaintiffs have appealed to the U.S. Court of Appeals for the Fifth Circuit, which heard oral arguments in November 2008 and is considering the appeal. The Company believes it has meritorious defenses to the claims asserted against it and will defend itself vigorously in these proceedings; however, there can be no assurances that it will be successful in its efforts.
In June 2006, AES Ekibastuz was found to have breached a local tax law by failing to obtain a license for use of local water for the period of January 1, 2005 through October 3, 2005, in a timely manner. As a result, an additional permit fee was imposed, bringing the total permit fee to approximately $135,000. The Company has appealed this decision to the Supreme Court.
In June 2007, the Competition Committee of the Ministry of Industry and Trade of the Republic of Kazakhstan ordered AES Ust-Kamenogorsk TETS LLP (“UKT”) to pay approximately 835 million KZT ($7 million) to the state for alleged antimonopoly violations in 2005 through January 2007. The Competition Committee also ordered UKT to pay approximately 235 million KZT ($2 million), as estimated by the Company, to certain customers that allegedly have paid unreasonably high power prices since January 2007. In November 2007, the economic court of first instance upheld the Competition Committee’s order in part, finding that UKT had violated Kazakhstan’s antimonopoly laws, but reduced the damages to be paid to the state to 833 million KZT ($7 million) and rejected the damages to be paid to customers. The court of appeals (first panel) later affirmed the economic court’s decision and, therefore, in June 2008, UKT paid the damages. The court of appeals (second panel) rejected UKT’s appeal in June 2008. UKT has appealed to the Supreme Court of Kazakhstan. The Competition Committee’s successor (the Antimonopoly Agency) has not indicated whether it intends to assert claims against UKT for alleged antimonopoly violations post January 2007. UKT believes it has meritorious claims and defenses; however, there can be no assurances that it will prevail in these proceedings.
In July 2007, the Competition Committee ordered Nurenergoservice, an AES subsidiary, to pay approximately 18 billion KZT ($150 million) for alleged antimonopoly violations in 2005 through the first quarter of 2007. The Competition Committee’s order was affirmed by the economic court in April 2008. Nurenergoservice’s subsequent appeals have been unsuccessful to date, including at the court of appeals (first panel), which rejected Nurenergoservice’s appeal in July 2008. Also, the economic court has issued an injunction to secure Nurenergoservice’s alleged liability, freezing Nurenergoservice’s bank accounts and prohibiting Nurenergoservice from transferring or disposing of its property. In separate but related proceedings, in August 2007, the Competition Committee ordered Nurenergoservice to pay approximately 2 billion KZT (approximately $17 million) in administrative fines for its alleged antimonopoly violations. Nurenergoservice subsequently appealed to the administrative court of first instance. That appeal has been stayed since October 2007 but could resume at any time. The Antimonopoly Agency has not indicated whether it intends to assert claims against Nurenergoservice for alleged antimonopoly violations post first quarter 2007. Nurenergoservice believes it has meritorious claims and defenses; however, there can be no assurances that it will prevail in these proceedings. As Nurenergoservice did not prevail in the economic court or the court of appeals (first panel) with respect to the alleged damages, it will have to pay the alleged damages or risk seizure of its assets. In February 2009, the Antimonopoly Agency seized approximately 783 million KZT ($5 million) from a frozen Nurenergoservice bank account in partial satisfaction of Nurenergoservice alleged damages liability. Furthermore, if Nurenergoservice does not prevail in the administrative court with respect to the fines, it will have to pay the fines or risk seizure of its assets.
108
In August 2007, the Competition Committee ordered Sogrinsk TETS, a thermal cogeneration plant under AES concession, to terminate its contracts with Nurenergoservice and Ust-Kamenogorsk HPP because of Sogrinsk’s alleged antimonopoly violations in 2005 through January 2007. The Competition Committee did not order Sogrinsk to pay any damages or fines. The Kazakhstan courts have affirmed the order, including the Supreme Court of Kazakhstan in October 2008. The Antimonopoly Agency has not indicated whether it intends to assert claims against Sogrinsk for alleged antimonopoly violations post January 2007.
In November 2007, the Competition Committee initiated an investigation of allegations that Irtysh Power and Light, LLP (“Irtysh”), an AES company which manages the state-owned Ust-Kamenogorsk Heat Nets system, had violated Kazakhstan’s antimonopoly laws in January through November 2007 by selling power at below-market prices. In February 2008, the Competition Committee determined that the allegations were baseless. The Competition Committee subsequently appeared to initiate an investigation to determine whether Irtysh had illegally coordinated with other AES companies concerning the sale of power, but its successor (the Antimonopoly Agency) has not issued any order or otherwise taken any action on any such investigation to date. Irtysh believes it has meritorious claims and defenses and will assert them vigorously in any formal proceeding; however, there can be no assurances that it will be successful in its efforts.
In December 2008, the Antimonopoly Agency ordered Ust-Kamenogorsk HPP (“UK HPP”), a hydroelectric plant under AES concession, to pay approximately 1.1 billion KZT ($9 million) for alleged antimonopoly violations in February through November 2007. The economic court has issued an injunction to secure UK HPP’s alleged liability, among other things freezing UK HPP’s bank accounts. Furthermore, the Antimonopoly Agency has initiated administrative proceedings against UK HPP seeking an unspecified amount of administrative fines for the alleged antimonopoly violations. UK HPP believes it has meritorious defenses and will assert them vigorously; however, there can be no assurances that it will be successful in its efforts.
In June 2007, the Company received a letter from an outside law firm purportedly representing a shareholder demanding that the Company’s Board conduct a review of certain stock option plans, procedures and historical granting and exercise practices, and other matters, and that the Company commence legal proceedings against any officer and/or director who may be liable for damages to the Company. The Board has established a Special Committee, which has retained independent counsel, to consider the demands presented in the letter in light of the work undertaken by the Company in its review of share-based compensation. The Company has not received any communication from the purported shareholder who made the demand since the second half of 2007.
In July 2007, AES Energia Cartagena SRL, (“AESEC”) initiated arbitration against Initec Energia SA, Mitsubishi Corporation, and MC Power Project Management, SL (“Contractor”) to recover damages from the Contractor for its delay in completing the construction of AESEC’s majority-owned power facility in Murcia, Spain. In October 2007, the Contractor denied AESEC’s claims and asserted counterclaims to recover approximately €12 million ($17 million) for alleged unpaid milestone and scope change order payments, among other things, and an unspecified amount for an alleged early completion bonus. The final hearing is scheduled to begin in June 2009. AESEC believes that it has meritorious claims and defenses and will assert them vigorously in these proceedings; however, there can be no assurances that it will be successful in its efforts.
In November 2007, the International Brotherhood of Electrical Workers, Local Union No. 1395, and sixteen individual retirees, (the “Complainants”), filed a complaint at the Indiana Utility Regulatory Commission (“IURC”) seeking enforcement of their interpretation of the 1995 final order and associated settlement agreement resolving IPL’s basic rate case. The Complainants are requesting that the IURC conduct an investigation of IPL’s failure to fund the Voluntary Employee Beneficiary Association Trust (“VEBA Trust”), at a level of approximately $19 million per year. The VEBA Trust was spun off to an independent trustee in 2001. The complaint seeks an IURC order requiring IPL to make contributions to place the VEBA Trust in the financial position in which it allegedly would have been had IPL not ceased making annual contributions to the VEBA Trust after its spin off. The complaint also seeks an IURC order requiring IPL to resume making annual
109
contributions to the VEBA Trust. IPL filed a motion to dismiss and both parties are seeking summary judgment in the IURC proceeding. To date, no procedural schedule for this proceeding has been established. IPL believes it has meritorious defenses to the Complainants’ claims and it will assert them vigorously in response to the complaint; however, there can be no assurances that it will be successful in its efforts.
In September 2007, the New York Attorney General issued a subpoena to the Company seeking documents and information concerning the Company’s analysis and public disclosure of the potential impacts that greenhouse gas (“GHG”) legislation and climate change from GHG emissions might have on the Company’s operations and results. The Company has produced documents and information in response to the subpoena.
In October 2007, the Ekibastuz Tax Committee issued a notice for the assessment of certain taxes against AES Ekibastuz LLP. A portion of the assessment, approximately $1.7 million, relates to alleged environmental pollution. The review by the Ekibastuz Tax Committee is ongoing and their decision on any assessment, including the portion related to alleged environmental pollution, is not yet final. In addition, as the result of a subsequent tax audit which was completed on January 24, 2008, an additional amount of approximately 36 million KZT in principal, 20 million KZT in interest and 13 million KZT in penalty (collectively, approximately $600,000), was assessed as underpayment of taxes for the 2004 calendar year and VAT for January 2004. AES Ekibastuz appealed these assessments. However, this position was rejected by the Regional Tax Committee in a decision dated January 30, 2008. On February 29, 2008, AES Ekibastuz appealed to the Ministry of Finance of the Republic of Kazakhstan and is currently awaiting a decision.
In February 2008, the Native Village of Kivalina, Alaska, and the City of Kivalina filed a complaint in the U.S. District Court for the Northern District of California against the Company and numerous unrelated companies, claiming that the defendants’ alleged GHG emissions are destroying the plaintiffs’ alleged land. The plaintiffs assert nuisance and concert of action claims against the Company and the other defendants, and a conspiracy claim against a subset of the other defendants. The plaintiffs seek to recover relocation costs, indicated in the complaint to be from $95 million to $400 million, and other alleged damages from the defendants, which are not quantified. The Company has filed a motion to dismiss the case, which the plaintiffs have opposed. The Company believes it has meritorious defenses to the claims asserted against it and will defend itself vigorously in these proceedings; however, there can be no assurances that it will be successful in its efforts.
A public civil action has been asserted against Eletropaulo and Associação Desportiva Cultural Eletropaulo (the “Associação”) relating to alleged environmental damage caused by construction of the Associação near Guarapiranga Reservoir. The initial decision that was upheld on the first appeal found that Eletropaulo should either repair the alleged environmental damage by demolishing certain construction and reforesting the area, pursuant to a project which would cost approximately $628,000, or pay an indemnification amount of approximately $5 million. Eletropaulo has appealed this decision to the Supreme Court and is awaiting a decision.
In 2007, a lower court issued a decision related to a 1993 claim that was filed by the Public Attorney’s office against Eletropaulo, the Sao Paulo State Government, SABESP (a state owned company), CETESB (a state owned company) and DAEE (the municipal Water and Electric Energy Department), alleging that they were liable for pollution of the Billings Reservoir as a result of pumping water from Pinheiros River into Billings Reservoir. The events in question occurred while Eletropaulo was a state owned company. The initial lower court decision in 2007 found the parties liable for the payment of R$517.46 million ($221 million) for remediation. Eletropaulo subsequently appealed the decision and Eletropaulo is still awaiting a decision on the appeal. The filing of the appeal suspended the lower court’s decision. Eletropaulo believes it has meritorious defenses to the claims asserted against it and will defend itself vigorously in these proceedings; however, there can be no assurances that it will be successful in its efforts.
In September 2008, IPL received a Clean Air Act Section 114 information request. The request seeks various information regarding production levels and projects implemented at IPL’s generating stations, generally for the time period from January 1, 2001 to the date of the information request. This type of information request
110
has been used in the past to assist the EPA in determining whether a plant is in compliance with applicable standards under the Clean Air Act. At this time it is not possible to predict what impact, if any, this request may have on IPL, its results of operation or its financial position.
In November 2007, the U.S. Department of Justice (“DOJ”) indicated to AES Thames, LLC (“AES Thames”) that the U.S. EPA had requested that the DOJ file a federal court action against AES Thames for alleged violations of the Clean Air Act (“CAA”), the Clean Water Act (“CWA”), the Comprehensive Environmental Response, Compensation, and Liability Act (“CERCLA”) and the Emergency Planning and Community Right-to-Know Act (“EPCRA”), in particular alleging that AES Thames had violated (i) the terms of its Prevention of Significant Deterioration (“PSD”) air permits in the calculation of its steam load permit limit; and (ii) the CWA, CERCLA and EPCRA in connection with two spills of chlorinating agents. The DOJ subsequently indicated that it would like to settle this matter prior to filing a suit and negotiations are ongoing. During such discussions, the DOJ and EPA have accepted AES Thames method of operation and have asked AES Thames to seek a minor permit modification to clarify the air permit condition. On October 21, 2008, the DOJ proposed a civil penalty of $245,000 for the alleged violations. The Company believes that it has meritorious defenses to the claims asserted against it and if a settlement cannot be achieved, the Company will defend itself vigorously in any lawsuit.
In December 2008, there were press reports that the National Electricity Regulatory Entity of Argentina (“ENRE”) had filed a criminal action in the National Criminal and Correctional Court of Argentina against the board of directors and administrators of EDELAP, an AES subsidiary. Although EDELAP has not been officially served with notice of the action, press reports have stated that ENRE’s action concerns certain bank cancellations of EDELAP debt in 2006 and 2007, which were accomplished through transactions between the banks and related AES companies. According to press reports, ENRE claims that EDELAP should have reflected in its accounts the alleged benefits of the transactions that were allegedly obtained by the related companies. EDELAP believes that the allegations lack merit; however, there can be no assurances that its board and administrators will be successful in any formal proceedings concerning the allegations.
In January 2009, an alleged shareholder of the Company filed a shareholder derivative and putative class action in Delaware state court against the Company and certain members of its board of directors. The plaintiff claims that Section 2.17(B) of the Company’s bylaws, concerning shareholder action by written consent, is illegal under Delaware law. The plaintiff does not seek damages but declarations that Section 2.17(B) is unlawful and void and that the board member defendants breached their respective fiduciary duties of loyalty by adopting that bylaw in October 2008. The plaintiff further seeks to recover his litigation costs. The Company defendants believe they have meritorious defenses and will assert them vigorously in these proceedings; however, there can be no assurances that they will be successful in their efforts.
A CAA Section 114 information request regarding Cayuga and Somerset was received in February 2009. The request seeks various operating and testing data and other information regarding certain types of projects at the Cayuga and Somerset facilities, generally for the time period from January 1, 2000 through the date of the information request. This type of information request has been used in the past to assist the EPA in determining whether a plant is in compliance with applicable standards under the CAA. At this time it is not possible to predict what impact, if any, this request may have on Cayuga and/or Somerset, their results of operation or their financial position.
13. BENEFIT PLANS
DEFINED CONTRIBUTION PLAN The Company sponsors one defined contribution plan, qualified under section 401 of the Internal Revenue Code. All employees of the Company are eligible to participate in the plan except for those employees who are not covered by their collective bargaining agreement. The plan provides for Company matching contributions in Company stock, other Company contributions at the discretion of the Compensation Committee of the Board of Directors in Company stock, and discretionary tax deferred contributions from the participants. Participants are fully vested in their own contributions and the Company’s
111
matching contributions. Participants vest in other Company contributions ratably over a five-year period ending on the fifth anniversary of their hire date. Company contributions to the plans were approximately $21 million, $22 million, and $21 million for the years ended December 31, 2008, 2007, and 2006, respectively.
DEFINED BENEFIT PLANS Certain of the Company’s subsidiaries have defined benefit pension plans covering substantially all of their respective employees. Pension benefits are based on years of credited service, age of the participant and average earnings. Of the 24 defined benefit plans, three are at U.S. subsidiaries and the remaining plans are at foreign subsidiaries. In May 2007, the Company sold EDC; the impact of this disposition is reflected in the tables below in the Plan settlements line item for the year ended December 31, 2007.
The Company adopted the recognition provisions of SFAS No. 158, effective December 31, 2006, which requires recognition of an asset or liability in the balance sheet reflecting the funded status of pension and other post-retirement benefits plans with current-year changes in the funded status recognized in stockholders’ equity. The Company recognized a cumulative adjustment to adopt the recognition provisions of SFAS No. 158 as of December 31, 2006. AES adopted the measurement date provisions of the standard, which require a year-end measurement date of plan assets and obligations for all defined benefit plans, for the fiscal year ended December 31, 2008 and accordingly, recognized a cumulative adjustment of $1 million to retained earnings as of December 31, 2008. Prior to the year ended December 31, 2008, seven of the Company’s defined benefit plans used an early measurement date to value their plan assets and obligations.
The following table reconciles the Company’s funded status, both domestic and foreign, as of December 31, 2008 and 2007:
| | | | | | | | | | | | | | | | |
| | | December 31, | |
| | | 2008 | | | 2007 | |
| | | U.S. | | | Foreign | | | U.S. | | | Foreign | |
| | | (in millions) | |
CHANGE IN PROJECTED BENEFIT OBLIGATION: | | | | | | | | | | | | | | | | |
Benefit obligation at beginning of year | | $ | 513 | | | $ | 4,358 | | | $ | 555 | | | $ | 3,213 | |
Adjustments due to adoption of SFAS No. 158 measurement date provisions | | | 3 | | | | 1 | | | | — | | | | — | |
Service cost | | | 6 | | | | 11 | | | | 7 | | | | 9 | |
Interest cost | | | 32 | | | | 453 | | | | 30 | | | | 393 | |
Employee contributions | | | — | | | | 20 | | | | — | | | | 15 | |
Plan amendments | | | 10 | | | | — | | | | 2 | | | | — | |
Plan settlements | | | (1 | ) | | | — | | | | — | | | | (58 | ) |
Benefits paid | | | (32 | ) | | | (377 | ) | | | (29 | ) | | | (344 | ) |
Net transfer in | | | — | | | | — | | | | — | | | | 2 | |
Actuarial loss (gain) | | | 26 | | | | 138 | | | | (52 | ) | | | 459 | |
Effect of foreign currency exchange rate change | | | — | | | | (1,106 | ) | | | — | | | | 669 | |
| | | | | | | | | | | | | | | | |
Benefit obligation as of December 31 | | $ | 557 | | | $ | 3,498 | | | $ | 513 | | | $ | 4,358 | |
| | | | | | | | | | | | | | | | |
CHANGE IN PLAN ASSETS: | | | | | | | | | | | | | | | | |
Fair value of plan assets at beginning of year | | $ | 430 | | | $ | 3,587 | | | $ | 422 | | | $ | 2,538 | |
Actual return on plan assets | | | (129 | ) | | | 268 | | | | 34 | | | | 762 | |
Employer contributions | | | 59 | | | | 138 | | | | 3 | | | | 113 | |
Employee contributions | | | — | | | | 20 | | | | — | | | | 15 | |
Plan settlements | | | (1 | ) | | | — | | | | — | | | | (40 | ) |
Benefits paid | | | (32 | ) | | | (377 | ) | | | (29 | ) | | | (344 | ) |
Acquisitions/divestitures | | | — | | | | — | | | | — | | | | 1 | |
Effect of foreign currency exchange rate change | | | — | | | | (884 | ) | | | — | | | | 542 | |
| | | | | | | | | | | | | | | | |
Fair value of plan assets as of December 31 | | $ | 327 | | | $ | 2,752 | | | $ | 430 | | | $ | 3,587 | |
| | | | | | | | | | | | | | | | |
RECONCILIATION OF FUNDED STATUS | | | | | | | | | | | | | | | | |
Funded status as of December 31 | | $ | (230 | ) | | $ | (746 | ) | | $ | (83 | ) | | $ | (771 | ) |
| | | | | | | | | | | | | | | | |
112
The following table summarizes the amounts recognized on the Consolidated Balance Sheets, both domestic and foreign, as of December 31, 2008 and 2007:
| | | | | | | | | | | | | | | | |
| | | December 31, | |
| | | 2008 | | | 2007 | |
| | | U.S. | | | Foreign | | | U.S. | | | Foreign | |
| | | (in millions) | |
AMOUNTS RECOGNIZED ON THE CONSOLIDATED BALANCE SHEETS | | | | | | | | | | | | | | | | |
Noncurrent assets | | $ | — | | | $ | 22 | | | $ | — | | | $ | 50 | |
Accrued benefit liability—current | | | — | | | | (3 | ) | | | — | | | | (2 | ) |
Accrued benefit liability—long-term | | | (230 | ) | | | (765 | ) | | | (83 | ) | | | (819 | ) |
| | | | | | | | | | | | | | | | |
Net amount recognized at end of year | | $ | (230 | ) | | $ | (746 | ) | | $ | (83 | ) | | $ | (771 | ) |
| | | | | | | | | | | | | | | | |
The following table summarizes the Company’s accumulated benefit obligation, both domestic and foreign, as of December 31, 2008 and 2007:
| | | | | | | | | | | | |
| | | December 31, |
| | | 2008 | | 2007 |
| | | U.S. | | Foreign | | U.S. | | Foreign |
| | | (in millions) |
Accumulated Benefit Obligation | | $ | 541 | | $ | 3,335 | | $ | 510 | | $ | 4,323 |
Information for pension plans with an accumulated benefit obligation in excess of plan assets: | | | | | | | | | | | | |
Projected benefit obligation | | $ | 557 | | $ | 3,336 | | $ | 513 | | $ | 4,173 |
Accumulated benefit obligation | | | 541 | | | 3,179 | | | 510 | | | 4,143 |
Fair value of plan assets | | | 327 | | | 2,570 | | | 430 | | | 3,351 |
Information for pension plans with a projected benefit obligation in excess of plan assets: | | | | | | | | | | | | |
Projected benefit obligation | | $ | 557 | | $ | 3,339 | | $ | 513 | | $ | 4,173 |
Fair value of plan assets | | | 327 | | | 2,571 | | | 430 | | | 3,351 |
The table below demonstrates the significant weighted average assumptions used in the calculation of benefit obligation and net periodic benefit cost, both domestic and foreign, as of December 31, 2008 and 2007:
| | | | | | | | | | | | |
| | | December 31, | |
| | | 2008 | | | 2007 | |
| | | U.S. | | | Foreign | | | U.S. | | | Foreign | |
Benefit Obligation: | | | | | | | | | | | | |
Discount rates | | 6.26 | % | | 11.78 | % | | 6.48 | % | | 11.25 | % |
Rates of compensation increase | | 4.75 | % | | 5.97 | % | | 4.75 | % | | 6.93 | % |
Periodic Benefit Cost: | | | | | | | | | | | | |
Discount rate | | 6.48 | % | | 11.25 | % | | 5.64 | % | | 11.73 | % |
Expected long-term rate of return on plan assets | | 7.77 | % | | 12.31 | % | | 8.00 | % | | 12.41 | % |
Rate of compensation increase | | 4.75 | % | | 6.93 | % | | 4.75 | % | | 6.98 | % |
A subsidiary of the Company has a defined benefit obligation of $528 million and $482 million at December 31, 2008 and 2007, respectively, and uses salary bands to determine future benefit costs rather than a rate of compensation increases. Rates of compensation increases in the table above do not include amounts related to this specific defined benefit plan.
The Company establishes its estimated long-term return on plan assets considering various factors, which include the targeted asset allocation percentages, historic returns and expected future returns.
113
The measurement of pension obligations, costs and liabilities is dependent on a variety of assumptions. These assumptions include estimates of the present value of projected future pension payments to all plan participants, taking into consideration the likelihood of potential future events such as salary increases and demographic experience. These assumptions may have an effect on the amount and timing of future contributions.
The assumptions used in developing the required estimates include the following key factors:
| | • | | Expected return on plan assets; and |
The effects of actual results differing from the Company’s assumptions are accumulated and amortized over future periods and, therefore, generally affect our recognized expense in such future periods.
Sensitivity of our pension funded status and stockholders’ equity to the indicated increase or decrease in the discount rate and long-term rate of return on plan assets assumptions is shown below. Note that these sensitivities may be asymmetric, and are specific to the base conditions at year-end 2008. They also may not be additive, so the impact of changing multiple factors simultaneously cannot be calculated by combining the individual sensitivities shown. The December 31, 2008 funded status is affected by December 31, 2008 assumptions. Pension expense for 2008 is affected by December 31, 2007 assumptions. The impact on pension expense from a one percentage point change in these assumptions is shown in the table below (in millions):
| | | | |
Increase of 1% in the discount rate | | $ | (10 | ) |
Decrease of 1% in the discount rate | | $ | 15 | |
Increase of 1% in the long-term rate of return on plan assets | | $ | (39 | ) |
Decrease of 1% in the long-term rate of return on plan assets | | $ | 39 | |
The following table summarizes the components of the net periodic benefit cost, both domestic and foreign, for the years ended December 31, 2008 through 2006:
| | | | | | | | | | | | | | | | | | | | | | | | |
| | | December 31, | |
| | | 2008 | | | 2007 | | | 2006 | |
Components of Net Periodic Benefit Cost: | | U.S. | | | Foreign | | | U.S. | | | Foreign | | | U.S. | | | Foreign | |
| | | (in millions) | |
Service cost | | $ | 6 | | | $ | 11 | | | $ | 7 | | | $ | 9 | | | $ | 6 | | | $ | 7 | |
Interest cost | | | 32 | | | | 453 | | | | 30 | | | | 393 | | | | 30 | | | | 356 | |
Expected return on plan assets | | | (34 | ) | | | (412 | ) | | | (33 | ) | | | (333 | ) | | | (29 | ) | | | (255 | ) |
Amortization of initial net asset | | | — | | | | (3 | ) | | | — | | | | (3 | ) | | | — | | | | (3 | ) |
Amortization of prior service cost | | | 3 | | | | — | | | | 3 | | | | — | | | | 2 | | | | — | |
Amortization of net loss | | | 1 | | | | 2 | | | | 6 | | | | 2 | | | | 5 | | | | 2 | |
Curtailment gain recognized | | | — | | | | — | | | | — | | | | (3 | ) | | | — | | | | — | |
Settlement gain recognized | | | 1 | | | | — | | | | — | | | | (6 | ) | | | — | | | | — | |
| | | | | | | | | | | | | | | | | | | | | | | | |
Total pension cost | | $ | 9 | | | $ | 51 | | | $ | 13 | | | $ | 59 | | | $ | 14 | | | $ | 107 | |
| | | | | | | | | | | | | | | | | | | | | | | | |
For the year ended December 31, 2006, $(102) million (prior to the adjustment for the adoption of SFAS No. 158), was included in other comprehensive income arising from a change in the additional minimum pension liability.
114
The following table summarizes the amounts reflected in Accumulated Other Comprehensive Income on the Consolidated Balance Sheet as of December 31, 2008 that have not yet been recognized as components of net periodic benefit cost:
| | | | | | | | | | | | | | |
| | | December 31, 2008 | |
| | | Accumulated Other
Comprehensive Income | | | Amounts expected to be
reclassified to earnings
in next fiscal year | |
| | | U.S. | | Foreign | | | U.S. | | Foreign | |
| | | (in millions) | |
Initial net transition asset | | $ | — | | $ | 3 | | | $ | — | | $ | 2 | |
Prior service cost | | | — | | | (2 | ) | | | — | | | — | |
Unrecognized net actuarial loss | | | — | | | (393 | ) | | | — | | | (6 | ) |
| | | | | | | | | | | | | | |
Total | | $ | — | | $ | (392 | ) | | $ | — | | $ | (4 | ) |
| | | | | | | | | | | | | | |
The following table summarizes the Company’s target allocation for 2008 and pension plan asset allocation, both domestic and foreign, as of December 31, 2008 and 2007:
| | | | | | | | | | | | | | | | |
| | | | | Percentage of Plan Assets as of December 31, | |
| | | Target Allocations | | 2008 | | | 2007 | |
Asset Category | | U.S. | | Foreign | | U.S. | | | Foreign | | | U.S. | | | Foreign | |
Equity securities | | 27% - 74% | | 29% - 30% | | 54.57 | % | | 22.24 | % | | 60.89 | % | | 24.64 | % |
Debt securities | | 26% - 54% | | 65% | | 37.08 | % | | 72.30 | % | | 28.87 | % | | 69.40 | % |
Real estate | | 0% - 9% | | 1% | | 1.91 | % | | 1.23 | % | | 2.84 | % | | 1.28 | % |
Other | | 0% - 9% | | 4% - 5% | | 6.44 | % | | 4.23 | % | | 7.40 | % | | 4.68 | % |
| | | | | | | | | | | | | | | | |
Total pension cost | | | | | | 100.00 | % | | 100.00 | % | | 100.00 | % | | 100.00 | % |
| | | | | | | | | | | | | | | | |
The U.S. plans seek to achieve the following long-term investment objectives:
| | • | | Maintenance of sufficient income and liquidity to pay retirement benefits and other lump sum payments; |
| | • | | Long-term rate of return in excess of the annualized inflation rate; |
| | • | | Long-term rate of return (net of relevant fees that meet or exceed the assumed actuarial rate); |
| | • | | Long-term competitive rate of return on investments, net of expenses, that is equal to or exceeds various benchmark rates. |
Consistent with the above, the allocation is reviewed periodically to determine a suitable asset allocation which seeks to control risk through portfolio diversification and takes into account, among other possible factors, the above-stated objectives, in conjunction with current funding levels, cash flow conditions and economic and industry trends.
The investment strategy of the foreign plans seeks to maximize return on investment while minimizing risk. Our assumed asset allocation uses a lower exposure to equities to closely match market conditions and near term forecasts. Some of the Company’s plans hold investments that are illiquid. These assets are held by our subsidiaries in Brazil and total $279 million and represent 9% of total plan assets at December 31, 2008.
115
The following table summarizes the scheduled cash flows for U.S. and foreign expected employer contributions and expected future benefit payments, both domestic and foreign:
| | | | | | |
| | | U.S. | | Foreign |
| | | (in millions) |
Expected employer contribution in 2009 | | $ | 21 | | $ | 133 |
Expected benefit payments for fiscal year ending: | | | | | | |
2009 | | | 32 | | | 297 |
2010 | | | 32 | | | 324 |
2011 | | | 33 | | | 339 |
2012 | | | 34 | | | 352 |
2013 | | | 36 | | | 366 |
2014 - 2018 | | | 202 | | | 2,034 |
14. EQUITY
STOCK REPURCHASE
On August 7, 2008, the Company’s Board of Directors approved a share repurchase plan for up to $400 million of its outstanding common stock. The Board authorization permits the Company to repurchase shares over a six month period ending February 7, 2009. Shares of common stock repurchased under this plan through December 31, 2008 totaled 10,691,267 at a total cost of $143 million plus commissions of $0.3 million (average of $13.41 per share including commissions). The remaining amount authorized to be purchased under the share repurchase plan as of December 31, 2008 was $257 million. The shares of stock repurchased have been classified as treasury stock and accounted for using the cost method. A total of 10,691,267 shares were held in treasury stock at December 31, 2008. At December 31, 2007, there were no shares of common stock held in treasury stock. The Company did not retire any shares of treasury stock during the year ended December 31, 2008. No shares of common stock were repurchased subsequent to December 31, 2008 and the Board authorization of the plan expired on February 7, 2009.
COMPREHENSIVE INCOME
The components of comprehensive income for the years ended December 31, 2008, 2007 and 2006 were as follows:
| | | | | | | | | | | | |
| | | December 31, | |
| | | 2008 | | | 2007 | | | 2006 | |
| | | (in millions) | |
Net income | | $ | 2,028 | | | $ | 336 | | | $ | 707 | |
Change in fair value of available-for-sale securities, net of income tax (expense) benefit of $-, $(3) and $2, respectively | | | — | | | | 3 | | | | (3 | ) |
Foreign currency translation adjustments, net of income tax benefit (expense) of $53, $(33) and $(13), respectively | | | (1,052 | ) | | | 643 | | | | 802 | |
Derivative activity: | | | | | | | | | | | | |
Reclassification to earnings, net of income tax expense of $19, $38 and $11, respectively | | | 90 | | | | (50 | ) | | | (3 | ) |
Change in derivative fair value, net of income tax (expense) benefit of $(29), $109 and $(184), respectively | | | (158 | ) | | | (84 | ) | | | 279 | |
| | | | | | | | | | | | |
Total change in fair value of derivatives | | | (68 | ) | | | (134 | ) | | | 276 | |
Change in unfunded pension obligation, net of income tax benefit (expense) of $77, $— and $(38), respectively | | | (149 | ) | | | (3 | ) | | | 74 | |
| | | | | | | | | | | | |
Other comprehensive (loss) income | | | (1,269 | ) | | | 509 | | | | 1,149 | |
| | | | | | | | | | | | |
Comprehensive income | | | 759 | | | | 845 | | | | 1,856 | |
Less: Comprehensive income attributable to noncontrolling interests | | | (165 | ) | | | (724 | ) | | | (647 | ) |
| | | | | | | | | | | | |
Comprehensive income attributable to The AES Corporation | | $ | 594 | | | $ | 121 | | | $ | 1,209 | |
| | | | | | | | | | | | |
116
The following table summarizes the balances comprising accumulated other comprehensive loss net of tax, as of December 31, 2008 and 2007:
| | | | | | |
| | | December 31, |
| | | 2008 | | 2007 |
| | | (in millions) |
Foreign currency translation adjustment | | $ | 2,584 | | $ | 2,023 |
Unrealized derivative losses | | | 263 | | | 232 |
Unfunded pension obligation | | | 171 | | | 123 |
| | | | | | |
Total | | $ | 3,018 | | $ | 2,378 |
| | | | | | |
15. SEGMENT AND GEOGRAPHIC INFORMATION
As further described below, beginning with the Company’s Quarterly Report on Form 10-Q for the three months ended March 31, 2009 filed with the SEC on May 8, 2009, the Company modified its segment reporting in accordance with SFAS No. 131. Therefore in this Form 8-K the Company has recast information for all periods presented to reflect the new segment reporting structure
Background
Through the end of 2008, and as reflected in the 2008 Form 10-K, the Company organized its operations for management and external reporting purposes along two primary lines of business—the generation of electricity (“Generation”) and the distribution of electricity (“Utilities”) within four geographic regions: Latin America; North America; Europe & Africa; and Asia & the Middle East (“Asia”). Three regions, North America, Latin America and Europe & Africa, are engaged in both Generation and Utility businesses. Our Asia region only has Generation businesses. This regional management structure resulted in the Company reporting seven segments, as defined in SFAS No. 131. The reportable segments included Latin America Generation, Latin America Utilities, North America Generation, North America Utilities, Europe & Africa Generation, Europe & Africa Utilities and Asia Generation. In addition, the Company reported certain activities in “Corporate and Other” including corporate overhead costs which were not directly associated with the operations of our seven reportable segments; and other intercompany charges such as self-insurance premiums which were fully eliminated in consolidation. AES Wind Generation, solar, climate solutions and certain other initiatives, were managed by our alternative energy group and the associated revenue, development and operational costs were reported under “Corporate and Other” since the results of these initiatives were not material to the presentation of the Company’s reportable segments.
2009 Segment Reporting
Management Reporting Structure—In early 2009, we implemented certain internal organizational changes in an effort to streamline the organization. These changes affected how results are reported internally for management review. The new management reporting structure continues to be organized along our two lines of business, but there are now three regions: (1) Latin America & Africa; (2) North America and AES Wind; and (3) Europe, Middle East & Asia (collectively “EMEA”), each managed by a regional president. The Company no longer has an alternative energy group. Instead, AES Wind Generation is managed within our North America region while climate solutions projects are now managed and reported within the region in which they are located. Key climate solutions initiatives include investments in GHG initiatives, projects to create emissions offsets for the voluntary U.S. market, projects that produce certified emission reduction credits (“CERs”) and initiatives related to utility-scale energy storage systems (such as batteries) which store and release power when needed. AES Solar is accounted for using the equity method and will continue to be reflected in “Corporate and Other.” In addition to the change in regional management structure, with the exception of AES Wind Development, the Company now manages all development efforts centrally through a development group.
117
Segment Reporting Structure—The new segment reporting structure uses the Company’s management reporting structure as its foundation. The Company’s segment reporting structure is organized along our two lines of business and three regions to reflect how the Company manages the business internally. The Company applied the guidance in SFAS No. 131, which provides certain quantitative thresholds and aggregation criteria, and the Company concluded that it now has six reportable segments. This new segment structure is reflected in this Current Report on Form 8-K. The operating segments comprising the former Europe & Africa Generation and Utilities reportable segments are no longer managed together. Under the new management structure Africa is managed with the Latin America region and Europe is managed with the Asia region. Only Europe—Generation was determined to be a reportable segment based on the Company’s application of SFAS No. 131. As described below, our Europe Utilities, Africa Utilities and Africa Generation operating segments are now reported within “Corporate and Other” because they do not meet the criteria to allow for aggregation with another operating segment or the quantitative thresholds that would require separate disclosure under SFAS No. 131.
Therefore, as a result of this analysis, the Company now reports six segments, which include:
| | • | | Latin America—Generation; |
| | • | | Latin America—Utilities; |
| | • | | North America—Generation; |
| | • | | North America—Utilities; |
Corporate and Other—“Corporate and Other” now includes corporate overhead costs which are not directly associated with the operations of our six reportable segments, other intercompany charges such as self-insurance premiums which are fully eliminated in consolidation. In addition, “Corporate and Other” includes the operating results of the Company’s Europe Utilities, Africa Utilities and Africa Generation businesses, AES Wind and development and operational costs related to the development group. AES Solar is accounted for under the equity method of accounting, therefore its operating results are included in “Net Equity in Earnings of Affiliates,” not in “Corporate and Other.” None of these operating segments are currently material to our presentation of reportable segments, individually or in the aggregate.
The Company uses multiple measures to evaluate the performance of its segments. The GAAP measure that most closely aligns with the Company’s performance measure is gross margin. Gross margin is defined as total revenue less operating expenses including depreciation and amortization, local fixed operating and other overhead costs. Segment revenue includes inter-segment sales related to the transfer of electricity from generation plants to utilities within Latin America. No inter-segment revenue relationships exist between other segments. Corporate allocations include certain management fees and self insurance activity which are reflected within segment gross margin. All intra-segment activity has been eliminated with respect to revenue and gross margin within the segment; inter-segment activity has been eliminated within the total consolidated results. All balance sheet information for businesses that were discontinued is segregated and is shown in the line “Discontinued Businesses” in the accompanying segment tables.
118
The tables below present the breakdown of business segment balance sheet and income statement data as of and for the years ended December 31, 2008 through 2006:
| | | | | | | | | | | | | | | | | | | | | | | | | | | | | | | | |
| | | Total Revenue | | | Intersegment | | | External Revenue |
| | | 2008 | | 2007 | | | 2006 | | | 2008 | | | 2007 | | | 2006 | | | 2008 | | 2007 | | 2006 |
| | | (in millions) |
Revenue | | | |
Latin America—Generation | | $ | 4,465 | | $ | 3,510 | | | $ | 2,615 | | | $ | (990 | ) | | $ | (885 | ) | | $ | (789 | ) | | $ | 3,475 | | $ | 2,625 | | $ | 1,826 |
Latin America—Utilities | | | 5,927 | | | 5,172 | | | | 4,552 | | | | — | | | | (17 | ) | | | — | | | | 5,927 | | | 5,155 | | | 4,552 |
North America—Generation | | | 2,234 | | | 2,168 | | | | 1,928 | | | | — | | | | — | | | | — | | | | 2,234 | | | 2,168 | | | 1,928 |
North America—Utilities | | | 1,079 | | | 1,052 | | | | 1,032 | | | | — | | | | — | | | | — | | | | 1,079 | | | 1,052 | | | 1,032 |
Europe Generation | | | 1,096 | | | 910 | | | | 789 | | | | — | | | | — | | | | — | | | | 1,096 | | | 910 | | | 789 |
Asia—Generation | | | 1,264 | | | 817 | | | | 718 | | | | — | | | | — | | | | — | | | | 1,264 | | | 817 | | | 718 |
Corp/Other & eliminations | | | 5 | | | (113 | ) | | | (125 | ) | | | 990 | | | | 902 | | | | 789 | | | | 995 | | | 789 | | | 664 |
| | | | | | | | | | | | | | | | | | | | | | | | | | | | | | | | |
Total Revenue | | $ | 16,070 | | $ | 13,516 | | | $ | 11,509 | | | $ | — | | | $ | — | | | $ | — | | | $ | 16,070 | | $ | 13,516 | | $ | 11,509 |
| | | | | | | | | | | | | | | | | | | | | | | | | | | | | | | | |
| | | |
| | | Total Gross Margin | | | Intersegment | | | External Gross Margin |
| | | 2008 | | 2007 | | | 2006 | | | 2008 | | | 2007 | | | 2006 | | | 2008 | | 2007 | | 2006 |
| | | (in millions) |
Gross Margin | | | |
Latin America—Generation | | $ | 1,394 | | $ | 955 | | | $ | 1,052 | | | $ | (975 | ) | | $ | (853 | ) | | $ | (773 | ) | | $ | 419 | | | 102 | | $ | 279 |
Latin America—Utilities | | | 860 | | | 865 | | | | 888 | | | | 991 | | | | 875 | | | | 808 | | | | 1,851 | | | 1,740 | | | 1,696 |
North America—Generation | | | 657 | | | 702 | | | | 610 | | | | 17 | | | | 18 | | | | 13 | | | | 674 | | | 720 | | | 623 |
North America—Utilities | | | 261 | | | 313 | | | | 277 | | | | 4 | | | | 3 | | | | 2 | | | | 265 | | | 316 | | | 279 |
Europe Generation | | | 266 | | | 243 | | | | 214 | | | | 2 | | | | 2 | | | | 4 | | | | 268 | | | 245 | | | 218 |
Asia—Generation | | | 143 | | | 176 | | | | 186 | | | | 3 | | | | 4 | | | | 5 | | | | 146 | | | 180 | | | 191 |
Corp/Other & eliminations | | | 126 | | | 138 | | | | 192 | | | | (42 | ) | | | (49 | ) | | | (59 | ) | | | 84 | | | 89 | | | 133 |
| | | | | | | | | | | | | | | | | | | | | | | | | | | | | | | | |
Total Gross Margin | | $ | 3,707 | | $ | 3,392 | | | $ | 3,419 | | | $ | — | | | $ | — | | | $ | — | | | $ | 3,707 | | $ | 3,392 | | $ | 3,419 |
| | | | | | | | | | | | | | | | | | | | | | | | | | | | | | | | |
| | | |
| | | Total Assets | | | Depreciation and
Amortization | | | Capital Expenditures |
| | | 2008 | | 2007 | | | 2006 | | | 2008 | | | 2007 | | | 2006 | | | 2008 | | 2007 | | 2006 |
| | | (in millions) |
Latin America—Generation | | $ | 8,228 | | $ | 7,659 | | | $ | 6,909 | | | $ | 168 | | | $ | 169 | | | $ | 154 | | | $ | 889 | | $ | 393 | | $ | 126 |
Latin America—Utilities | | | 7,267 | | | 8,780 | | | | 7,297 | | | | 222 | | | | 199 | | | | 182 | | | | 440 | | | 394 | | | 313 |
North America—Generation | | | 6,426 | | | 6,272 | | | | 5,303 | | | | 195 | | | | 190 | | | | 167 | | | | 133 | | | 165 | | | 125 |
North America—Utilities | | | 3,093 | | | 2,836 | | | | 2,807 | | | | 152 | | | | 142 | | | | 136 | | | | 107 | | | 202 | | | 196 |
Europe Generation | | | 2,656 | | | 2,506 | | | | 1,850 | | | | 46 | | | | 59 | | | | 46 | | | | 422 | | | 659 | | | 305 |
Asia—Generation | | | 3,239 | | | 2,180 | | | | 2,072 | | | | 69 | | | | 53 | | | | 55 | | | | 152 | | | 62 | | | 9 |
Discontinued businesses | | | — | | | 451 | | | | 2,830 | | | | 8 | | | | 17 | | | | 105 | | | | 6 | | | 46 | | | 100 |
Corp/Other & eliminations | | | 3,897 | | | 3,769 | | | | 2,206 | | | | 141 | | | | 113 | | | | 88 | | | | 738 | | | 539 | | | 338 |
| | | | | | | | | | | | | | | | | | | | | | | | | | | | | | | | |
Total | | $ | 34,806 | | $ | 34,453 | | | $ | 31,274 | | | $ | 1,001 | | | $ | 942 | | | $ | 933 | | | $ | 2,887 | | $ | 2,460 | | $ | 1,512 |
| | | | | | | | | | | | | | | | | | | | | | | | | | | | | | | | |
| | | | | |
| | | Investment in and Advances
to Affiliates | | | Equity in Earnings
(Loss) | | | | | | | |
| | | 2008 | | 2007 | | | 2006 | | | 2008 | | | 2007 | | | 2006 | | | | | | | |
| | | (in millions) | | | | | | | |
Latin America—Generation | | $ | 81 | | $ | 67 | | | $ | 59 | | | $ | 9 | | | $ | 17 | | | $ | 16 | | | | | | | | | | |
Latin America—Utilities | | | — | | | — | | | | — | | | | — | | | | — | | | | — | | | | | | | | | | |
North America—Generation | | | 2 | | | — | | | | — | | | | (2 | ) | | | — | | | | 3 | | | | | | | | | | |
North America—Utilities | | | 1 | | | 1 | | | | 1 | | | | — | | | | — | | | | — | | | | | | | | | | |
Europe Generation | | | 230 | | | 200 | | | | 131 | | | | 28 | | | | 11 | | | | 8 | | | | | | | | | | |
Asia—Generation | | | 407 | | | 431 | | | | 376 | | | | 12 | | | | 43 | | | | 47 | | | | | | | | | | |
Discontinued businesses | | | — | | | — | | | | — | | | | — | | | | — | | | | — | | | | | | | | | | |
Corp/Other & eliminations | | | 180 | | | 31 | | | | 24 | | | | (14 | ) | | | 5 | | | | (1 | ) | | | | | | | | | |
| | | | | | | | | | | | | | | | | | | | | | | | | | | | | | | | |
Total | | $ | 901 | | $ | 730 | | | $ | 591 | | | $ | 33 | | | $ | 76 | | | $ | 73 | | | | | | | | | | |
| | | | | | | | | | | | | | | | | | | | | | | | | | | | | | | | |
119
The table below presents information about the Company’s consolidated operations and long-lived assets, by country, for years ended December 31, 2008 through 2006 and as of December 31, 2008 and 2007, respectively. Revenues are recorded in the country in which they are earned and assets are recorded in the country in which they are located.
| | | | | | | | | | | | | | | |
| | | Revenues | | Property, Plant &
Equipment, net |
| | | 2008 | | 2007 | | 2006 | | 2008 | | 2007 |
| | | (in millions) |
United States | | $ | 2,745 | | $ | 2,641 | | $ | 2,573 | | $ | 6,936 | | $ | 6,448 |
| | | | | | | | | | | | | | | |
Non-U.S. | | | | | | | | | | | | | | | |
Brazil | | | 5,501 | | | 4,748 | | | 4,119 | | | 4,206 | | | 5,369 |
Chile | | | 1,349 | | | 1,011 | | | 594 | | | 1,540 | | | 968 |
Argentina | | | 949 | | | 678 | | | 542 | | | 446 | | | 450 |
Pakistan | | | 607 | | | 396 | | | 318 | | | 204 | | | 265 |
Dominican Republic | | | 601 | | | 476 | | | 357 | | | 634 | | | 651 |
El Salvador | | | 484 | | | 479 | | | 437 | | | 255 | | | 249 |
Hungary | | | 466 | | | 344 | | | 304 | | | 211 | | | 241 |
Mexico | | | 463 | | | 399 | | | 185 | | | 819 | | | 838 |
Ukraine | | | 403 | | | 330 | | | 269 | | | 78 | | | 104 |
Cameroon | | | 379 | | | 330 | | | 300 | | | 579 | | | 504 |
United Kingdom | | | 342 | | | 235 | | | 222 | | | 308 | | | 383 |
Colombia | | | 291 | | | 213 | | | 184 | | | 395 | | | 393 |
Puerto Rico | | | 251 | | | 245 | | | 234 | | | 622 | | | 620 |
Kazakhstan | | | 234 | | | 284 | | | 215 | | | 56 | | | 52 |
Panama | | | 210 | | | 175 | | | 144 | | | 715 | | | 582 |
Sri Lanka | | | 184 | | | 123 | | | 92 | | | 79 | | | 83 |
Qatar | | | 161 | | | 178 | | | 169 | | | 526 | | | 552 |
Philippines(1) | | | 148 | | | — | | | — | | | 731 | | | — |
Oman | | | 105 | | | 105 | | | 114 | | | 321 | | | 331 |
Bulgaria(2) | | | — | | | — | | | 1 | | | 1,329 | | | 542 |
Other Non-U.S. | | | 197 | | | 126 | | | 136 | | | 413 | | | 349 |
| | | | | | | | | | | | | | | |
Total Non-U.S. | | | 13,325 | | | 10,875 | | | 8,936 | | | 14,467 | | | 13,526 |
| | | | | | | | | | | | | | | |
Total | | $ | 16,070 | | $ | 13,516 | | $ | 11,509 | | $ | 21,403 | | $ | 19,974 |
| | | | | | | | | | | | | | | |
| (1) | Acquired in May 2008, revenues represent results for a partial year. |
| (2) | Currently under development, facility is not operational at this time. |
16. SHARE-BASED COMPENSATION
STOCK OPTIONS—AES grants options to purchase shares of common stock under stock option plans. Under the terms of the plans, the Company may issue options to purchase shares of the Company’s common stock at a price equal to 100% of the market price at the date the option is granted. Stock options are generally granted based upon a percentage of an employee’s base salary. Stock options issued under these plans in 2008, 2007 and 2006 have a three-year vesting schedule and vest in one-third increments over the three-year period. The stock options have a contractual term of ten years. At December 31, 2008, approximately 19 million shares were remaining for award under the plans. In all circumstances, stock options granted by AES do not entitle the holder the right, or obligate AES, to settle the stock option in cash or other assets of AES.
120
The weighted average fair value of each option grant has been estimated, as of the grant date, using the Black-Scholes option-pricing model with the following weighted average assumptions:
| | | | | | | | | |
| | | December 31, | |
| | | 2008 | | | 2007 | | | 2006 | |
Expected volatility | | 37 | % | | 29 | % | | 30 | % |
Expected annual dividend yield | | 0 | % | | 0 | % | | 0 | % |
Expected option term (years) | | 6 | | | 6 | | | 6 | |
Risk-free interest rate | | 3.04 | % | | 4.67 | % | | 4.63 | % |
Beginning January 1, 2006, the Company exclusively relies on implied volatility as the expected volatility to determine the fair value using the Black-Scholes option-pricing model. The implied volatility may be exclusively relied upon due to the following factors:
| | • | | The Company utilizes a valuation model that is based on a constant volatility assumption to value its employee share options; |
| | • | | The implied volatility is derived from options to purchase AES common stock that are actively traded; |
| | • | | The market prices of both the traded options and the underlying share are measured at a similar point in time to each other and on a date reasonably close to the grant date of the employee share options; |
| | • | | The traded options have exercise prices that are both near-the-money and close to the exercise price of the employee share options; and |
| | • | | The remaining maturities of the traded options on which the estimate is based are at least one year. |
Pursuant to SAB No. 107, the Company used a simplified method to determine the expected term based on the average of the original contractual term and the pro rata vesting term. This simplified method was used for stock options granted during the years ended December 31, 2007 and 2006. In 2008, the Company continued to use the simplified method pursuant to SAB No. 110, which amends SAB No. 107 and allows for the continued use of the simplified method under certain circumstances for stock options accounted for under SFAS No. 123(R). This is appropriate given a lack of relevant stock option exercise data. This simplified method may be used as the Company’s stock options have the following characteristics:
| | • | | The stock options are granted at-the-money; |
| | • | | Exercisability is conditional only on performing service through the vesting date; |
| | • | | If an employee terminates service prior to vesting, the employee forfeits the stock options; |
| | • | | If an employee terminates service after vesting, the employee has a limited time to exercise the stock option; and |
| | • | | The stock option is nonhedgeable and not transferable. |
The Company does not discount the grant date fair values determined to estimate post-vesting restrictions. Post-vesting restrictions include black-out periods when the employee is not able to exercise stock options based on their potential knowledge of information prior to the release of that information to the public. The assumptions that the Company has made in determining the grant date fair value of its stock options and the estimated forfeiture rates represent its best estimate.
Using the above assumptions, the weighted average fair value of each stock option granted was $7.65, $8.49 and $6.82, for the years ended December 31, 2008, 2007, and 2006, respectively.
121
The following table summarizes the components of stock-based compensation related to employee stock options recognized in the Company’s financial statements:
| | | | | | | | | | | | |
| | | December 31, | |
| | | 2008 | | | 2007 | | | 2006 | |
| | | (in millions) | |
Pre-tax compensation expense | | $ | 12 | | | $ | 15 | | | $ | 17 | |
Tax benefit | | | (3 | ) | | | (4 | ) | | | (5 | ) |
| | | | | | | | | | | | |
Stock options expense, net of tax | | $ | 9 | | | $ | 11 | | | $ | 12 | |
| | | | | | | | | | | | |
Total intrinsic value of options exercised | | $ | 9 | | | $ | 41 | | | $ | 78 | |
Total fair value of options vested | | | 13 | | | | 14 | | | | 12 | |
Cash received from the exercise of stock options | | | 17 | | | | 50 | | | | 78 | |
Windfall tax benefits realized from the exercised stock options | | | 1 | | | | 2 | | | | — | |
There was no cash used to settle stock options or compensation cost capitalized as part of the cost of an asset for the years ended December 31, 2008, 2007 and 2006. As of December 31, 2008, $16 million of total unrecognized compensation cost related to stock options is expected to be recognized over a weighted average period of approximately 1.7 years. There were no modifications to stock option awards during the year ended December 31, 2008.
A summary of the option activity for year ended December 31, 2008 follows (number of options in thousands, dollars in millions except per option amounts):
| | | | | | | | | | | |
| | | Options | | | Weighted
Average
Exercise
Price | | Weighted
Average
Remaining
Contractual
Term
(in years) | | Aggregate
Intrinsic
Value |
Outstanding at December 31, 2007 | | 24,737 | | | $ | 18.23 | | | | | |
Exercised year to date | | (1,595 | ) | | | 10.50 | | | | | |
Forfeited and expired year to date | | (990 | ) | | | 24.72 | | | | | |
Granted year to date | | 2,156 | | | | 18.86 | | | | | |
| | | | | | | | | | | |
Outstanding at December 31, 2008 | | 24,308 | | | $ | 18.52 | | 4.1 | | $ | 10 |
| | | | | | | | | | | |
Vested and expected to vest at December 31, 2008 | | 23,652 | | | $ | 18.48 | | 4.0 | | $ | 10 |
| | | | | | | | | | | |
Eligible for exercise at December 31, 2008 | | 20,563 | | | $ | 18.30 | | 3.2 | | $ | 10 |
| | | | | | | | | | | |
The aggregate intrinsic value in the table above represents the total pre-tax intrinsic value (the difference between the Company’s closing stock price on the last trading day of the fourth quarter of 2008 and the exercise price, multiplied by the number of in-the-money options) that would have been received by the option holders had all option holders exercised their options on December 31, 2008. The amount of the aggregate intrinsic value will change based on the fair market value of the Company’s stock.
The Company initially recognizes compensation cost on the estimated number of instruments for which the requisite service is expected to be rendered. In 2008, AES has estimated a forfeiture rate of 16.87% and 10.19% for stock options granted to non-officer employees and officer employees of AES, respectively. In 2007, based on actual experience, AES reevaluated the forfeiture rates for non-officer employees for its prior year grants and adjusted the rate to 14.70% from 8.55% for the plan year ended December 31, 2006. Those estimates will be revised if subsequent information indicates that the actual number of instruments forfeited is likely to differ from previous estimates. Based on the estimated forfeiture rates, the Company expects to expense $14 million on a straight-line basis over a three year period (approximately $4.6 million per year) related to stock options granted during the year ended December 31, 2008.
122
RESTRICTED STOCK
Restricted Stock Units Without Market Conditions—The Company issues restricted stock units (“RSUs”) without market conditions under its long-term compensation plan. The RSUs are generally granted based upon a percentage of the participant’s base salary. The units have a three-year vesting schedule and vest in one-third increments over the three-year period. The units are then required to be held for an additional two years before they can be redeemed for shares, and thus become transferable.
For the years ended December 31, 2008, 2007, and 2006, RSUs issued without a market condition had a grant date fair value equal to the closing price of the Company’s stock on the grant date. The Company does not discount the grant date fair values to reflect any post-vesting restrictions. RSUs without a market condition granted to non-executive employees during the years ended December 31, 2008, 2007, and 2006 had grant date fair values per RSU of $18.87, $22.28 and $17.57, respectively.
The following table summarizes the components of the Company’s stock-based compensation related to its employee RSUs issued without market conditions recognized in the Company’s financial statements:
| | | | | | | | | | | | |
| | | December 31, | |
| | | 2008 | | | 2007 | | | 2006 | |
| | | (in millions) | |
RSU expense before income tax | | $ | 10 | | | $ | 10 | | | $ | 10 | |
Tax benefit | | | (2 | ) | | | (3 | ) | | | (2 | ) |
| | | | | | | | | | | | |
RSU expense, net of tax | | $ | 8 | | | $ | 7 | | | $ | 8 | |
| | | | | | | | | | | | |
Total intrinsic value of RSUs converted(1) | | $ | — | | | $ | — | | | $ | — | |
Total fair value of RSUs vested | | $ | 10 | | | $ | 10 | | | $ | 7 | |
| (1) | 59,000 RSUs were converted during the year ended December 31, 2008. No RSUs were converted during the years ended December 31, 2007 and 2006. |
There was no cash used to settle RSUs or compensation cost capitalized as part of the cost of an asset for the years ended December 31, 2008, 2007 and 2006. As of December 31, 2008, $16 million of total unrecognized compensation cost related to RSUs without the market condition is expected to be recognized over a weighted average period of approximately 1.8 years. There were no modifications to RSU awards during the year ended December 31, 2008.
A summary of the RSUs activity for the year ended December 31, 2008 follows (number of RSUs in thousands, dollars in millions except per unit amounts):
| | | | | | | | |
| | | RSUs | | | Weighted
Average
Grant-date
Fair Values | | Weighted
Average
Remaining
Vesting
Term |
Nonvested at December 31, 2007 | | 1,311 | | | $ | 20.17 | | |
Vested year to date | | (597 | ) | | | 19.26 | | |
Forfeited and expired year to date | | (153 | ) | | | 19.83 | | |
Granted year to date | | 974 | | | | 18.87 | | |
| | | | | | | | |
Nonvested at December 31, 2008 | | 1,535 | | | $ | 19.73 | | 1.7 |
| | | | | | | | |
Vested at December 31, 2008 | | 2,213 | | | $ | 14.05 | | — |
Vested and expected to vest at December 31, 2008 | | 3,459 | | | $ | 16.08 | | — |
The weighted average grant date fair value of RSUs without a market condition granted during year ended December 31, 2008, was $18.87. The fair value of RSUs without a market condition that vested during the years ended December 31, 2008, 2007 and 2006 was $10 million, $10 million and $7 million, respectively. RSUs
123
without a market condition vesting during the years ended December 31, 2008, 2007 and 2006 were 597,000, 714,000 and 569,000, respectively. 59,000 RSUs were converted during the year ended December 31, 2008. No RSUs were converted during the years ended December 31, 2007 and 2006.
The total grant date fair value of RSUs granted without a market condition was $15 million during the year ended December 31, 2008.
Restricted Stock Units With Market Conditions—Restricted stock units issued to officers of the Company have a three-year vesting schedule and include a market condition to vest. Vesting will occur if the applicable continued employment conditions are satisfied and the Total Stockholder Return (“TSR”) on AES common stock exceeds the TSR of the Standard and Poor’s 500 (“S&P 500”) over the three-year measurement period beginning on January 1st in the year of grant and ending after three years on December 31st. In certain situations where the TSR of both AES common stock and the S&P 500 exhibit a gain over the measurement period, the grant may vest without the TSR of AES common stock exceeding the TSR of the S&P 500, if the Compensation Committee exercises its discretion to permit such vesting. The units are then required to be held for an additional two years subsequent to vesting before they can be redeemed for shares, and thus become transferable. In all circumstances, restricted stock units granted by AES do not entitle the holder the right, or obligate AES, to settle the restricted stock unit in cash or other assets of AES.
The effect of the market condition on restricted stock units issued to officers of the Company is reflected in the award’s fair value on the grant date for the year ended December 31, 2008. A discount of 14% was applied to the closing price of the Company’s stock on the date of grant to estimate the fair value to reflect the market condition for RSUs with market conditions granted during the year ended December 31, 2008. RSUs that included a market condition granted during the year ended December 31, 2008 and 2007 had a grant date fair value per RSU of $16.23 and $18.27, respectively.
The following table summarizes the components of the Company’s stock-based compensation related to its RSUs granted with market conditions recognized in the Company’s financial statements:
| | | | | | | | | | | | |
| | | December 31, | |
| | | 2008 | | | 2007 | | | 2006 | |
| | | (in millions) | |
RSU expense before income tax | | $ | 4 | | | $ | 5 | | | $ | 4 | |
Tax benefit | | | (1 | ) | | | (2 | ) | | | (1 | ) |
| | | | | | | | | | | | |
RSU expense, net of tax | | $ | 3 | | | $ | 3 | | | $ | 3 | |
| | | | | | | | | | | | |
Total intrinsic value of RSUs converted(1) | | $ | — | | | $ | — | | | $ | — | |
Total fair value of RSUs vested | | $ | 5 | | | $ | 5 | | | $ | — | |
| (1) | No RSUs were converted during the years ended December 31, 2008, 2007 or 2006. |
There was no cash used to settle RSUs or compensation cost capitalized as part of the cost of an asset for the years ended December 31, 2008, 2007 and 2006. As of December 31, 2008, $5 million of total unrecognized compensation cost related to RSUs with a market condition is expected to be recognized over a weighted average period of approximately 1.7 years. There were no modifications to RSU awards during the year ended December 31, 2008.
124
A summary of the restricted stock unit activity for the year ended December 31, 2008 follows (number of RSUs in thousands, $ in millions except per unit amounts):
| | | | | | | | |
| | | RSUs | | | Weighted
Average
Grant-date
Fair Values | | Weighted
Average
Remaining
Vesting
Term |
Nonvested at December 31, 2007 | | 872 | | | $ | 15.30 | | |
Vested year to date | | (352 | ) | | | 16.81 | | |
Forfeited and expired year to date | | (22 | ) | | | 15.35 | | |
Granted year to date | | 267 | | | | 16.23 | | |
| | | | | | | | |
Nonvested at December 31, 2008 | | 765 | | | $ | 14.93 | | 1.1 |
| | | | | | | | |
Vested at December 31, 2008 | | 900 | | | $ | 12.04 | | — |
Vested and expected to vest at December 31, 2008 | | 1,665 | | | $ | 13.38 | | — |
The weighted average grant date fair value of RSUs with a market condition granted during year ended December 31, 2008, was $16.23. RSUs with a market condition that vested during the years ended December 31, 2008 and 2007 were 352,000 and 548,000, respectively. No RSUs with a market condition vested during the year ended December 31, 2006. No RSUs were converted during the years ended December 31, 2008, 2007 and 2006.
The total grant date fair value of RSUs with a market condition granted during the year ended December 31, 2008 was $3.9 million. If no discount was applied to reflect the market condition for RSUs issued to officers, the total grant date fair value of RSUs with a market condition granted during year ended December 31, 2008 would have increased by $0.6 million.
17. SUBSIDIARY STOCK
The Company held $60 million of cumulative preferred stock of a subsidiary at December 31, 2008 and 2007. This represented five series of preferred stock of IPL, the Company’s integrated utility in Indiana. The total annual dividend requirement was approximately $3 million at December 31, 2008 and 2007. Certain series of the preferred stock were redeemable solely at the option of the issuer at prices between $101 and $118 per share. Holders of one series of preferred stock are entitled to elect a majority of IPL’s board of directors if IPL has not paid dividends to its preferred stockholders for four full quarters. Based on the preferred stockholders’ ability to elect a majority of IPL’s board of directors in this circumstance, the redemption of the preferred shares is considered to be not solely within the control of the issuer and the preferred stock was considered temporary equity and presented in the mezzanine level of the consolidated balance sheets as required by SFAS No. 160 and EITF Topic D-98,“Classification and Measurement of Redeemable Securities.”
On November 6, 2008, a wholly-owned subsidiary of the Company, Inversiones Cachagua Limitada (“Cachagua”), sold a 9.6% ownership interest in AES Gener in a private transaction for $174.9 million. The sale reduced the Company’s ownership percentage of AES Gener from 80.2% to 70.6%. The Company recognized a pre-tax loss of $30.8 million, including $3.6 million of related fees, from this transaction in the fourth quarter of 2008. The net proceeds from this transaction was used exclusively for Gener’s capital increase as approved by Gener’s Extraordinary Shareholders Meeting on November 19, 2008. See further discussion of Gener’s 2009 capital increase in Note 27—Subsequent Events.
In May and October 2007, Cachagua sold a 0.9% and 10.2% ownership interest, respectively, in AES Gener for $330.9 million. The sale reduced the Company’s ownership percentage of AES Gener to 80.2%. The Company recorded a pre-tax gain on the sale of $134.2 million, including $8.3 million of related fees.
Sale of Subsidiary Stock and Brasiliana Restructuring—In September 2006, Brasiliana’s wholly owned subsidiary, Transgás, sold a 33% economic ownership in Eletropaulo, a regulated electric utility in Brazil. Despite the reduction in economic ownership, there was no change in Brasiliana’s voting interest in Eletropaulo
125
and Brasiliana continues to control Eletropaulo. Transgás received $522 million in net proceeds on the sale. On October 5, 2006 Transgás, sold an additional 5% economic ownership in Eletropaulo for $78 million in net proceeds. For the year ended December 31, 2006, AES recognized a pre-tax loss of $535 million primarily as a result of the recognition of previously deferred currency translation losses.
18. OTHER INCOME AND EXPENSE
The components of other income are summarized as follows:
| | | | | | | | | |
| | | Years Ended December 31, |
| | | 2008 | | 2007 | | 2006 |
| | | (in millions) |
Contract settlement gain | | $ | — | | $ | 135 | | $ | — |
Gross receipts tax recovery | | | — | | | 93 | | | — |
Legal/dispute settlement | | | 39 | | | 26 | | | 1 |
Gain on sale of assets | | | 34 | | | 24 | | | 18 |
Gain on extinguishment of liabilities | | | 199 | | | 22 | | | 45 |
Insurance proceeds | | | 40 | | | 18 | | | 30 |
Other | | | 67 | | | 40 | | | 22 |
| | | | | | | | | |
Total other income | | $ | 379 | | $ | 358 | | $ | 116 |
| | | | | | | | | |
Other income primarily includes gains on asset sales and extinguishments of liabilities, favorable judgments on legal settlements, and other income from miscellaneous transactions. Other income of $379 million for the year ended December 31, 2008 included $32 million of cash proceeds related to a favorable legal settlement at Southland in California, $23 million of gains associated with a sale of land at Eletropaulo and sales of turbines at Itabo, gains on the extinguishment of a tax liability and a legal contingency at Eletropaulo of $117 million and $75 million, respectively, $29 million of insurance recoveries for damaged turbines at Uruguaiana, and compensation of $18 million for the impairment associated with the settlement agreement to shut down Hefei. Other income of $358 million for the year ended December 31, 2007 included a $135 million contract settlement gain at Eastern Energy, a $93 million gross receipts tax recovery at Eletropaulo and Tiete and $25 million from favorable legal settlements totaling $25 million at Eletropaulo and Red Oak in New Jersey. Other income of $116 million for the year ended December 31, 2006 included debt retirement gains at several of our businesses in Latin America.
The components of other expense are summarized as follows:
| | | | | | | | | |
| | | Years Ended December 31, |
| | | 2008 | | 2007 | | 2006 |
| | | (in millions) |
Loss on extinguishment of liabilities | | $ | 70 | | $ | 106 | | $ | 181 |
Regulatory special obligations | | | — | | | — | | | 139 |
Loss on sale and disposal of assets | | | 34 | | | 79 | | | 23 |
Legal/dispute settlement | | | 19 | | | 36 | | | 31 |
Write-down of disallowed regulatory assets | | | — | | | 16 | | | 36 |
Other | | | 40 | | | 18 | | | 41 |
| | | | | | | | | |
Total other expense | | $ | 163 | | $ | 255 | | $ | 451 |
| | | | | | | | | |
Other expense primarily includes losses on asset sales and extinguishment of liabilities, charges from legal disputes, mark to market adjustments on commodity derivatives and losses from other miscellaneous transactions. Other expense of $163 million for the year ended December 31, 2008 included $69 million of losses on the retirement of debt at the Parent Company in connection with the refinancing in June 2008, as further
126
discussed in Note 10—Long Term Debt, and IPALCO associated with a $375 million refinancing in April 2008, and losses on disposal of assets primarily at Eletropaulo in Brazil. Other expense of $255 million for the year ended December 31, 2007 included a loss of $90 million on the retirement of senior secured notes at the Parent Company, a $28 million increase in legal reserves in Kazakhstan and losses on the sale and disposal of assets at Eletropaulo and Sul. Other expense of $451 million for the year ended December 31, 2006 included losses on the early extinguishment of debt at several of our Latin American businesses and a loss of $37 million on the retirement of debt at the Parent Company. Other expense also included special obligation charges and a provision for recoverability of regulatory assets at Eletropaulo.
19. IMPAIRMENT EXPENSE
Impairment expense for the years ended December 31, 2008, 2007 and 2006 consisted of:
| | | |
| | | 2008 |
| | | (in millions) |
LNG projects in North America | | $ | 67 |
Uruguaiana | | | 36 |
South African peakers | | | 31 |
Hefei | | | 18 |
Non-power development project | | | 8 |
Other | | | 15 |
| | | |
Total | | $ | 175 |
| | | |
In the fourth quarter of 2008 and in response to the financial market crisis, the Company reviewed and prioritized projects in the development pipeline. From this review, the Company determined that the carrying value exceeded the future discounted cash flows for certain projects. In accordance with SFAS No. 144, the Company recorded a total pre-tax impairment charge of $75 million ($34 million, net of noncontrolling interests and income taxes) related to two liquefied natural gas projects in North America and a non-power development project at one of our facilities in North America. These projects were reported in the North America Generation segment.
Following an initial impairment charge in the fourth quarter of 2007 at Uruguaiana, there were impairment charges of $36 million recognized during the first three quarters of 2008. The impairment was triggered by a combination of gas curtailments and increases in the spot market price of energy in 2007 that continued in 2008. The additional impairment charges in 2008 were primarily due to fixed asset purchase agreements in place. Uruguaiana is a thermoelectric generation plant located in Brazil and reported in the Latin America Generation segment.
The Company recognized impairment charges totaling $31 million related to a project in South Africa the Company withdrew from during the first quarter of 2008. These represented project development costs and an impairment of turbine deposits related to the project. All costs capitalized and incurred on the project have been written off as no future benefit is expected from these assets. This project was reported in “Corporate and Other.”
The Anhui Development and Reform commission issued notice to our Hefei plant in China, in March 2007 as a result of the 2007 State Council’s decision to shut down smaller, inefficient and potentially polluting generation units nationwide. A settlement agreement was signed March 30, 2008 to end the contractual PPA arrangement. In accordance with SFAS No. 144, management concluded that the assets were impaired in March 2008, since the long-lived asset group would be sold or otherwise disposed of significantly before the end of its previously estimated life. As a result, impairment charges of $18 million were recognized associated with the settlement agreement to shut down the Hefei plant, which is reported in the Asia Generation segment.
127
| | | |
| | | 2007 |
| | | (in millions) |
Uruguaiana | | $ | 352 |
Placerita | | | 25 |
AgCert | | | 14 |
Coal Creek | | | 10 |
Other | | | 7 |
| | | |
Total | | $ | 408 |
| | | |
During the fourth quarter of 2007, the combination of gas curtailments and increases in the spot market price of energy triggered an impairment analysis of Uruguaiana’s long-lived assets for recoverability. Based on the accounting guidance provided by SFAS No. 144, management concluded that an impairment occurred during fourth quarter 2007 due to the carrying amount of its long-lived asset exceeding its fair value. The expected present value of future cash flows was used to estimate fair value. As a result of this impairment analysis, a pre-tax impairment charge of $352 million was recognized which represents a full impairment of the fixed assets. Uruguaiana is a thermoelectric plant located in Brazil and is reported in the Latin America Generation segment.
In August 2007, Placerita, a gas-fired combined cycle generation plant located in the United States, sustained property damage to the compressor section in one of its gas turbines. This event triggered an impairment analysis of the plant’s long-lived assets, which resulted in a pre-tax impairment charge of approximately $25 million, which represents the net book value of the plant. It was determined that no future net cash flows would be received from the use of this long-lived asset and it was fully impaired. Placerita is reported in the North America Generation segment.
In May 2006, AES advanced AgCert, a United Kingdom based corporation that produces emission reduction credits, cash of $52 million. AES recognized this prepayment as a long-term asset as consideration for future CER credits and AgCert stock warrants. The asset is revalued each period based on current exchange rates. In the fourth quarter of 2007, AgCert notified AES that it was not able to meet its contractual obligations to deliver CERs, which triggered an analysis of the asset’s recoverability. AgCert’s financial information indicated a significant decrease in liquidity. As a result of the decline in liquidity and AgCert’s inability to fulfill its contractual obligations for future delivery of the CERs, the Company recognized a pre-tax impairment charge of $14 million using the net present value of forecasted operations. This investment and long-term asset are reported in the Latin America Utilities segment.
During the third quarter of 2007, AES made a decision to curtail operations at Coal Creek Minerals, LLC (“Coal Creek”), a coal mining company, due to its inability to meet expected financial projections. The abandonment of Coal Creek triggered an impairment analysis of its long-lived assets, which resulted in a pre-tax impairment charge of approximately $10 million. The fair market value for fixed assets was estimated by evaluating the probability of all assets to be sold and the most recent sale price attributed to other assets recently sold. Coal Creek is owned by one of our subsidiaries, Cavanal Minerals, which is reported in the North America Generation segment.
| | | |
| | | 2006 |
| | | (in millions) |
Chigen | | $ | 6 |
Itabo | | | 5 |
Other | | | 6 |
| | | |
Total | | $ | 17 |
| | | |
During the fourth quarter of 2006, as a result of performing the annual goodwill impairment analysis of AES China Generating Co. Ltd (“Chigen”) in accordance with SFAS No. 142, a potential impairment of its equity
128
investment in Wuhu, a coal-fired plant located in China, was identified. As part of the subsequent impairment analysis, the fair value of this investment was analyzed and determined to be less than the carrying value, resulting in a pre-tax impairment charge of $6 million. Chigen is reported in the Asia Generation segment.
In June 2006, AES recognized a pre-tax impairment charge of $5 million related to five gas turbines that were classified as held for sale at Itabo. The impairment loss was recognized based on bids received from potential buyers that indicated the market value of the turbines was lower than the carrying value. Itabo is included in the results of the Latin America Generation segment. AES began consolidating Itabo subsequent to its purchase of an additional ownership interest in May 2006.
20. INCOME TAXES
INCOME TAX PROVISION
The following table summarizes the expense for income taxes on continuing operations, for the years ended December 31, 2008, 2007 and 2006:
| | | | | | | | | | | |
| | | December 31, | |
| | | 2008 | | | 2007 | | 2006 | |
| | | (in millions) | |
Federal: | | | | | | | | | | | |
Current | | $ | 12 | | | $ | 2 | | $ | (50 | ) |
Deferred | | | 122 | | | | 5 | | | 39 | |
State | | | | | | | | | | | |
Current | | | (1 | ) | | | 2 | | | (3 | ) |
Deferred | | | (7 | ) | | | 8 | | | (12 | ) |
Foreign | | | | | | | | | | | |
Current | | | 611 | | | | 475 | | | 455 | |
Deferred | | | 37 | | | | 187 | | | (70 | ) |
| | | | | | | | | | | |
Total | | $ | 774 | | | $ | 679 | | $ | 359 | |
| | | | | | | | | | | |
EFFECTIVE AND STATUTORY RATE RECONCILIATION
The following table summarizes a reconciliation of the U.S. statutory federal income tax rate to the Company’s effective tax rate, as a percentage of income before taxes for the years ended December 31, 2008, 2007 and 2006:
| | | | | | | | | |
| | | December 31, | |
| | | 2008 | | | 2007 | | | 2006 | |
Statutory Federal tax rate | | 35 | % | | 35 | % | | 35 | % |
State taxes, net of Federal tax benefit | | — | | | — | | | — | |
Taxes on foreign earnings | | (4 | ) | | 11 | | | 7 | |
Valuation allowance | | 2 | | | (2 | ) | | (22 | ) |
Cumulative translation allowance | | — | | | — | | | 21 | |
Gain on sale of Kazakhstan businesses | | (12 | ) | | — | | | — | |
Taxes on cash repatriation | | 5 | | | — | | | — | |
Other—net | | 2 | | | 1 | | | (2 | ) |
| | | | | | | | | |
Effective tax rate | | 28 | % | | 45 | % | | 39 | % |
| | | | | | | | | |
DEFERRED INCOME TAXES—Deferred income taxes reflect the net tax effects of (a) temporary differences between the carrying amounts of assets and liabilities for financial reporting purposes and the amounts used for income tax purposes, and (b) operating loss and tax credit carry forwards. These items are stated at the enacted tax rates that are expected to be in effect when taxes are actually paid or recovered.
129
As of December 31, 2008, the Company had federal net operating loss carry forwards for tax purposes of approximately $1.6 billion which expire from 2020 to 2027. Approximately $68 million of the net operating loss carry forward relates to stock option deductions and will be recorded to additional paid-in capital when realized. The Company also had federal general business tax credit carry forwards for tax purposes of approximately $18 million expiring primarily from 2021 to 2028, and federal alternative minimum tax credits of approximately $15 million that carry forward without expiration. The Company had state net operating loss carry forwards as of December 31, 2008 of approximately $3.0 billion expiring in years 2012 to 2028. The Company also has federal and state net operating loss carry forwards of $315 million expiring from 2025 to 2026 for a U.S. entity that is not included in its U.S. consolidated tax group. As of December 31, 2008, the Company had foreign net operating loss carry forwards of approximately $2.8 billion that expire at various times beginning in 2009 and some of which carry forward without expiration, and tax credits available in foreign jurisdictions of approximately $37 million, $5 million of which expire in 2009 to 2011, $21 million of which expire in 2012 to 2019 and $11 million of which carry forward without expiration.
The valuation allowance decreased by $210 million during 2008 to $1.4 billion at December 31, 2008. This net decrease was primarily the result of decreases in deferred tax assets at certain Brazilian subsidiaries that required corresponding decreases in the valuation allowances.
The valuation allowance increased by $178 million during 2007 to $1.6 billion at December 31, 2007. This net increase was primarily the result of increases in deferred tax assets at certain Brazilian subsidiaries that required corresponding increases in the valuation allowances.
The valuation allowance decreased by $50 million during 2006 to $1.4 billion at December 31, 2006. This net decrease was primarily the result of the removal of valuation allowance against deferred tax assets at foreign subsidiaries.
The Company believes that it is more likely than not that the remaining deferred tax assets as shown below will be realized when future taxable income is generated through the reversal of existing taxable temporary differences and income that is expected to be generated by businesses that have long-term contracts or a history of generating taxable income. The Company is monitoring the utilization of its deferred tax asset for its U.S. consolidated net operating loss carryforward. Although management believes it is more likely than not that this deferred tax asset will be realized through generation of sufficient taxable income prior to expiration of the loss carry forwards, such realization is not assured.
The following table summarizes the deferred tax assets and liabilities, as of December 31, 2008 and 2007:
| | | | | | | | |
| | | December 31, | |
| | | 2008 | | | 2007 | |
| | | (in millions) | |
Differences between book and tax basis of property | | $ | 1,673 | | | $ | 1,622 | |
Other taxable temporary differences | | | 326 | | | | 248 | |
| | | | | | | | |
Total deferred tax liability | | $ | 1,999 | | | $ | 1,870 | |
| | | | | | | | |
Operating loss carry forwards | | | (1,214 | ) | | | (1,427 | ) |
Capital loss carry forwards | | | (298 | ) | | | (362 | ) |
Bad debt and other book provisions | | | (495 | ) | | | (614 | ) |
Retirement costs | | | (169 | ) | | | (184 | ) |
Tax credit carry forwards | | | (70 | ) | | | (85 | ) |
Cumulative translation allowances | | | (240 | ) | | | (215 | ) |
Other deductible temporary differences | | | (482 | ) | | | (299 | ) |
| | | | | | | | |
Total gross deferred tax asset | | | (2,968 | ) | | | (3,186 | ) |
| | | | | | | | |
Less: valuation allowance | | | 1,409 | | | | 1,619 | |
| | | | | | | | |
Total net deferred tax asset | | | (1,559 | ) | | | (1,567 | ) |
| | | | | | | | |
Net deferred tax liability | | $ | 440 | | | $ | 303 | |
| | | | | | | | |
130
The Company considers undistributed earnings of certain foreign subsidiaries to be indefinitely reinvested outside of the United States and, accordingly, no U.S. deferred taxes have been recorded with respect to such earnings as allowed under APB No. 23,Accounting for Income Taxes—Special Areas. Should the earnings be remitted as dividends, the Company may be subject to additional U.S. taxes, net of allowable foreign tax credits. It is not practicable to estimate the amount of any additional taxes which may be payable on the undistributed earnings.
Income from operations in certain countries is subject to reduced tax rates as a result of satisfying specific commitments regarding employment and capital investment. The Company’s income tax benefits related to the tax status of these operations are estimated to be $46 million, $56 million and $42 million for the years ended December 31, 2008, 2007 and 2006, respectively.
The following table summarizes the income (loss) from continuing operations, before income taxes, net equity in earnings of affiliates and noncontrolling interests, for the years ended December 31, 2008, 2007 and 2006:
| | | | | | | | | | | | |
| | | December 31, | |
| | | 2008 | | | 2007 | | | 2006 | |
| | | (in millions) | |
U.S. | | $ | (314 | ) | | $ | (165 | ) | | $ | (49 | ) |
Non-U.S. | | | 3,065 | | | | 1,686 | | | | 963 | |
| | | | | | | | | | | | |
Total | | $ | 2,751 | | | $ | 1,521 | | | $ | 914 | |
| | | | | | | | | | | | |
In the third and fourth quarters of 2008, the Company implemented a planning strategy at Termoelectricia del Golfo and Termoelectrica del Peñoles, respectively. This strategy resulted in a deferred tax benefit of approximately $47 million. The benefit is a partial reversal of a $52 million deferred tax charge that was recorded in the fourth quarter of 2007 for the Mexican law change that established the Flat Rate Business Tax (“IETU”).
UNCERTAIN TAX POSITIONS
Uncertain tax positions have been classified as non-current income tax liabilities unless expected to be paid in one year. The Company’s policy for interest and penalties related to income tax exposures is to recognize interest and penalties as a component of the provision for income taxes in the Consolidated Statements of Operations.
As of December 31, 2008 and 2007, the total amount of gross accrued income tax related interest included in the Consolidated Balance Sheets was $25 million and $29 million, respectively. The total amount of gross accrued income tax related penalties included in the Consolidated Balance Sheet as of December 31, 2008 and 2007 was $5 million and $8 million, respectively.
The total expense for interest related to unrecognized tax benefits for the years ended December 31, 2008 and 2007 amounted to $2 million and $15 million, respectively. For the years ended December 31, 2008 and 2007, the total (benefit) expense for penalties related to unrecognized tax benefits amounted to $(2) million and $4 million, respectively.
131
We are potentially subject to income tax audits in numerous jurisdictions in the U.S. and internationally until the applicable statute of limitation expires. Tax audits by their nature are often complex and can require several years to complete. The following is a summary of tax years potentially subject to examination in the significant tax and business jurisdictions in which we operate:
| | |
Jurisdiction | | Tax Years
Subject to
Examination |
Argentina | | 2003-2008 |
Brazil | | 2003-2008 |
Cameroon | | 2007-2008 |
Chile | | 1998-2008 |
El Salvador | | 2005-2008 |
United Kingdom | | 1999-2008 |
United States (Federal) | | 1992-2008 |
As of December 31, 2008 and 2007, the total amount of unrecognized tax benefits was $555 million and $590 million, respectively. The total amount of unrecognized tax benefits that would benefit the effective tax rate as of December 31, 2008 and 2007 is $527 million and $533 million, respectively, of which $131 million and $144 million, respectively, would be in the form of tax attributes that would attract a full valuation allowance.
The total amount of unrecognized tax benefits anticipated to result in a net decrease of unrecognized tax benefits within 12 months of December 31, 2008 is estimated to be between $20 million and $27 million. The estimated decrease is primarily due to anticipated audit closures, other tax payments and lapses in statutes of limitations.
The following is a reconciliation of the beginning and ending amounts of unrecognized tax benefits for the years ended December 31, 2008 and 2007:
| | | | | | | | |
| | | 2008 | | | 2007 | |
| | | (in millions) | |
Balance at January 1 | | $ | 590 | | | $ | 559 | |
Additions for current year tax positions | | | 6 | | | | 18 | |
Additions for tax positions of prior years | | | 80 | | | | 39 | |
Reductions for tax positions of prior years | | | (26 | ) | | | (21 | ) |
Effects of foreign currency translation | | | (74 | ) | | | 18 | |
Settlements | | | (18 | ) | | | (22 | ) |
Lapse of statute of limitations | | | (3 | ) | | | (1 | ) |
| | | | | | | | |
Balance at December 31 | | $ | 555 | | | $ | 590 | |
| | | | | | | | |
The Company and certain of its subsidiaries are currently under examination by the relevant taxing authorities for various tax years. The Company regularly assesses the potential outcome of these examinations in each of the taxing jurisdictions when determining the adequacy of the amount of unrecognized tax benefit recorded. While it is often difficult to predict the final outcome or the timing of resolution of any particular uncertain tax position, we believe we have appropriately accrued for our uncertain tax benefits. However, audit outcomes and the timing of audit settlements and future events that would impact our previously recorded unrecognized tax benefits and the range of anticipated increases or decreases in unrecognized tax benefits are subject to significant uncertainty. It is possible that the ultimate outcome of current or future examinations may exceed current unrecognized tax benefits in amounts that could be material, but cannot be estimated as of December 31, 2008. Our effective tax rate and net income in any given future period could therefore be materially impacted.
132
21. DISCONTINUED OPERATIONS AND HELD FOR SALE BUSINESSES
The following table summarizes the income (loss) on disposal and impairment for the following discontinued operations for the years ended December 31, 2008, 2007 and 2006:
| | | | | | | | | | | | |
| | | December 31, | |
Subsidiary | | 2008 | | | 2007 | | | 2006 | |
| | | (in millions) | |
Central Valley | | $ | (1 | ) | | $ | 20 | | | $ | — | |
EDC | | | — | | | | (680 | ) | | | — | |
Eden | | | — | | | | (1 | ) | | | (62 | ) |
Indian Queens | | | — | | | | — | | | | 5 | |
Jiaozuo | | | 7 | | | | — | | | | — | |
| | | | | | | | | | | | |
Gain (loss) on disposal and impairment, after taxes | | $ | 6 | | | $ | (661 | ) | | $ | (57 | ) |
| | | | | | | | | | | | |
In December 2008, the Company reached an agreement to sell its 70% equity interest in Jiaozuo AES Wanfang Power Co., Ltd. (“Jiaozuo”), which is reported in the Asia Generation segment, for approximately $73 million net of any withholding taxes. The AES Board of Directors approved the sale of Jiaozuo which closed on December 15, 2008 and the Company recognized a gain on the sale of approximately $7 million. Goodwill of $4 million was written off in connection with the gain on sale. This gain is included in the 2008 Gain (loss) from disposal of discontinued businesses line item on the consolidated Statement of Operations for the year ended December 31, 2008.
On February 22, 2007, the Company entered into a definitive agreement with Petróleos de Venezuela, S.A., (“PDVSA”) to sell all of its shares of EDC, a distribution business reported in the Latin America Utilities segment, for $739 million net of any withholding taxes. In addition, the agreement provided for the payment of a $120 million dividend in 2007 which was declared on March 1, 2007 payable to the EDC shareholders of record as of March 9, 2007. A wholly-owned subsidiary of the Company was the owner of 82.14% of the outstanding shares of EDC, and therefore, on May 31, 2007, received approximately $97 million in dividends (representing approximately $99 million in gross dividends offset by fees). The sale of EDC and the payment of the purchase price occurred on May 16, 2007. EDC is classified as “discontinued operations” and reflected as such on the face of the Consolidated Financial Statements for all periods presented. During the first quarter of 2007, the Company recognized an impairment charge of approximately $638 million related to this sale. As a result of the final disposition of EDC in May 2007, the Company recognized an additional impairment charge of approximately $42 million, net of income and withholding taxes. The total impairment charge of $680 million represented the net book value of the Company’s investment in EDC less the selling price. The Company impaired the carrying value of EDC’s electric generation and distribution assets to their net realizable value. The impairment expense was included in the loss from disposal of discontinued businesses line item on the Consolidated Statement of Operations for the year ended December 31, 2007.
In July 2007, the Company’s wholly-owned subsidiary, Central Valley, sold 100% of its indirect interest in two biomass fired power plants located in central California (the 50 MW Delano facility and the 25 MW Mendota facility) for $51 million. These facilities, along with an associated management company (together, the “Central Valley Businesses”) were included in the North America Generation segment. Central Valley is classified as “discontinued operations” in the Company’s Consolidated Financial Statements for all periods presented. The Company recognized a gain on the sale of approximately $20 million net of income and withholding taxes.
In May 2006, the Company reached an agreement to sell 100% of its interest in Eden, a Latin America utility business located in Argentina. Therefore, Eden a wholly-owned subsidiary of AES, was classified as “held for sale” and reflected as such on the Consolidated Financial Statements. In 2006, the Company recognized a
133
$62 million impairment charge to adjust the carrying value of Eden’s assets to their estimated net realizable value. The impairment expense is included in the 2006 loss from disposal of discontinued businesses line item on the financial statements for the year ended December 31, 2007. The Buenos Aires Province in Argentina approved the transaction in May 2007.
In September 2006, the Company completed the sale of AES Indian Queens Power Limited and AES Indian Queens Operations Limited, collectively “IQP”, which was part of the Europe Generation segment. IQP is an Open Cycle Gas Turbine, located in the U.K. Proceeds from the sale were $28 million in cash and the buyer assumed $30 million of IQP’s debt. The Company recognized a gain on disposal of discontinued businesses of $5 million in 2006. The results of operations of IQP and the associated gain on disposal are reflected in the discontinued operations line items on the Consolidated Financial Statements.
Information for business components included in discontinued operations is as follows:
| | | | | | | | | | | | |
| | | December 31, | |
| | | 2008 | | | 2007 | | | 2006 | |
| | | (in millions) | |
Revenues | | $ | 100 | | | $ | 381 | | | $ | 863 | |
| | | | | | | | | | | | |
Income from operations of discontinued businesses (before taxes) | | | 16 | | | | 108 | | | | 198 | |
Income tax expense | | | (4 | ) | | | (29 | ) | | | (83 | ) |
| | | | | | | | | | | | |
Income from operations of discontinued businesses | | $ | 12 | | | $ | 79 | | | $ | 115 | |
| | | | | | | | | | | | |
Gain (loss) on disposal of discontinued businesses, after taxes | | $ | 6 | | | $ | (661 | ) | | $ | (57 | ) |
| | | | | | | | | | | | |
As further discussed in Note 22—Acquisitions and Dispositions, in February 2008, the Company entered into an agreement to sell two of its wholly-owned subsidiaries in Kazakhstan, AES Ekibastuz LLP (“Ekibastuz”) and Maikuben West LLP (“Maikuben”). These businesses are included in the Europe Generation segment. Total consideration for the transaction was approximately $1.1 billion with potential earn-out provisions up to an additional $381 million that may be awarded over a three-year period. These businesses generated total revenues of $114 million, $106 million, and $78 million, and net income (loss) of $61 million, $(35) million, and $(47) million for the years ended December 31, 2008, 2007 and 2006, respectively, excluding intercompany transactions. The assets and liabilities of these businesses were reclassified to “held for sale” on the Consolidated Balance Sheets for all periods presented prior to the completion of the sale on May 30, 2008. As a result of AES’s continuing involvement in the management and operations of the businesses after the sale was completed, their results of operations continued to be reflected as part of income from continuing operations for all periods presented. Revenue recognized subsequent to the sale represented the management fees earned for the Company’s continued management of the operations of the businesses.
22. ACQUISITIONS AND DISPOSITIONS
Acquisitions
In April 2008, the Company completed the purchase of a 92% interest in a 660 gross MW coal-fired thermal power generation facility in Masinloc, Philippines (“Masinloc”) from the Power Sector Assets & Liabilities Management Corporation, a state enterprise, for $930 million in cash. Project financing of $665 million was obtained from International Finance Corporation (“IFC”), the Asian Development Bank and a consortium of commercial banks. IFC is also an 8% minority shareholder in Masinloc. AES immediately embarked upon a comprehensive rehabilitation program to improve the output, reliability and general condition of the plant. Environmental clean-up costs have been estimated pending a detailed study. Including transaction costs and completion of the planned upgrade program to improve environmental and operational performance, the total project cost is estimated to be $1.1 billion. Beginning on the acquisition date in April 2008, the results of operations of Masinloc are reflected in the Consolidated Financial Statements. The Company finalized the purchase price allocation of this acquisition in the fourth quarter of 2008.
134
Dispositions
On May 30, 2008, the Company completed the sale of two of its wholly-owned subsidiaries in Kazakhstan, Ekibastuz, a coal-fired generation plant, and Maikuben, a coal mine. Total consideration received in the transaction was approximately $1.1 billion with additional potential earn-out provisions, a three-year management fee arrangement and a capital expenditures program bonus of up to approximately $380 million. The earn-out bonus for 2008 is primarily based on EBITDA, a non-GAAP measure, and the calculation is currently being finalized. If the business meets the EBITDA threshold, the earn-out bonus could range from $60 million to $105 million depending on EBITDA. If the business does not meet the minimum EBITDA threshold, no earn-out bonus is paid. No earn-out provision has been recognized as of December 31, 2008, as the Company has not completed discussions with the counterparty relative to the calculation to permit recognition under U.S. GAAP. The earn-out will be recognized when it becomes determinable and probable.
As a result of AES’s continuing involvement in the management and operations of the businesses through its three-year management and operation agreement, the results of operations from Ekibastuz and Maikuben were included in income from continuing operations through the disposition date. Income earned as a result of the three-year management and operation agreement was recognized as management fee income for all periods subsequent to the disposition. The management fee income earned for the year ended December 31, 2008 was $12 million and is included as revenue in the Europe Generation segment. A portion of the sale proceeds was used to pay down recourse debt as discussed in Note 10—Long-Term Debt. The Company plans to use the remaining proceeds from the sale of these businesses to fund operations, invest in growth initiatives, or to pay down additional debt. Excluding income earned under the three-year management and operation agreement subsequent to the sale of the business in May 2008, Ekibastuz and Maikuben generated revenue of $114 million, $106 million and $78 million for the years ended December 31, 2008, 2007 and 2006, respectively.
23. EARNINGS PER SHARE
Basic and diluted earnings per share are based on the weighted average number of shares of common stock and potential common stock outstanding during the period, after giving effect to stock splits. Potential common stock, for purposes of determining diluted earnings per share, includes the effects of dilutive stock options, warrants, deferred compensation arrangements, and convertible securities. The effect of such potential common stock is computed using the treasury stock method or the if-converted method, as applicable.
The following table presents a reconciliation of the numerators and denominators of the basic and diluted earnings per share computations for income from continuing operations. In the table below, income represents the numerator (in millions) and shares represent the denominator (in millions):
| | | | | | | | | | | | | | | | | | | | | | | | | | |
| | | December 31, 2008 | | | December 31, 2007 | | | December 31, 2006 |
| | | Income | | Shares | | $ per
Share | | | Income | | Shares | | $ per
Share | | | Income | | Shares | | $ per
Share |
BASIC EARNINGS PER SHARE | | | | | | | | | | | | | | | | | | | | | | | | | | |
Income from continuing operations attributable to The AES Corporation common stockholders | | $ | 1,216 | | 669 | | $ | 1.82 | | | $ | 487 | | 668 | | $ | 0.73 | | | $ | 168 | | 661 | | $ | 0.25 |
EFFECT OF DILUTIVE SECURITIES | | | | | | | | | | | | | | | | | | | | | | | | | | |
Convertible securities | | | 22 | | 15 | | | (0.02 | ) | | | | | | | | | | | | | | | | | |
Stock options and warrants | | | — | | 4 | | | — | | | | — | | 9 | | | (0.01 | ) | | | — | | 10 | | | — |
Restricted stock units | | | — | | 1 | | | — | | | | — | | 1 | | | — | | | | — | | 1 | | | — |
| | | | | | | | | | | | | | | | | | | | | | | | | | |
DILUTED EARNINGS PER SHARE | | $ | 1,238 | | 689 | | $ | 1.80 | | | $ | 487 | | 678 | | $ | 0.72 | | | $ | 168 | | 672 | | $ | 0.25 |
| | | | | | | | | | | | | | | | | | | | | | | | | | |
135
The calculation of diluted earnings per share excluded 11,150,853, 5,740,727 and 5,164,492 options outstanding at December 31, 2008, 2007 and 2006, respectively, that could potentially dilute basic earnings per share in the future. Those options were not included in the computation of diluted earnings per share because the exercise price of those options exceeded the average market price during the related period. In 2008, all convertible debentures were included in the earnings per share calculation. In 2007 and 2006, all convertible debentures were omitted from the earnings per share calculation because they were antidilutive.
24. RISKS AND UNCERTAINTIES
AES is a global power producer in 29 countries on five continents. See additional discussion of the Company’s principal markets in Note 15—Segment and Geographic Information. Our principal lines of business are Generation and Utilities. The Generation line of business uses a wide range of technologies, including coal, gas, hydroelectric, and biomass as fuel to generate electricity. Our Utilities business is comprised of businesses that transmit, distribute, and in certain circumstances generate power. In addition, the Company continues to expand our reach into the renewables area. These efforts include projects primarily in wind and solar.
POLITICAL AND ECONOMIC RISKS—The Company’s market capitalization has been negatively impacted largely in the second half of 2008. During this period, credit markets and global markets deteriorated and experienced increased market volatility, which can pose risks to the overall liquidity of our businesses with heightened unpredictability in currencies, counterparty credit risk and the widening of credit spreads in certain markets. If market conditions are protracted or continue to deteriorate, the Company may be at risk to decreased earnings and cash flows due to, among other factors, adverse fluctuations in the commodities and foreign currency spot markets or deterioration in global macroeconomic conditions. With the tightening of the credit markets, there is a risk that future investments may not be able to be financed through accessing capital and debt markets and may be subject to restrictions in the near future. Currently, the Company has a below-investment grade rating from Standard & Poor’s of BBB-. This may limit the ability of the Company to finance new and existing development projects to cash currently available on hand and through reinvestment of earnings. As of December 31, 2008, the Company had $903 million of unrestricted cash available. As a result of the impact of the 2008 credit market environment, the Company has evaluated current development projects in the pipeline to assess their future profitability. Impairment expense was recognized in the fourth quarter of 2008 related to these development projects in the pipeline that the Company considered to be impaired or for which they decided to cease future development efforts. These impairment charges represented a net $34 million impact on the Company’s earnings, but impairments may continue or could increase in the future if the credit market continues to worsen.
During 2008, approximately 83% of our revenue, and all of our revenue from discontinued businesses, was generated outside the United States and a significant portion of our international operations is conducted in developing countries. While our growth strategy has evolved as 2008 has progressed, to a focus on targeted projects in order to maintain our liquidity, we continue to invest in projects in developing countries because the growth rates and the opportunity to implement operating improvements and achieve higher operating margins may be greater than those typically achievable in more developed countries. International operations, particularly the operation, financing and development of projects in developing countries, entail significant risks and uncertainties, including, without limitation:
| | • | | economic, social and political instability in any particular country or region; |
| | • | | adverse changes in currency exchange rates; |
| | • | | government restrictions on converting currencies or repatriating funds; |
| | • | | unexpected changes in foreign laws and regulations or in trade, monetary or fiscal policies; |
| | • | | high inflation and monetary fluctuations; |
| | • | | restrictions on imports of coal, oil, gas or other raw materials required by our generation businesses to operate; |
136
| | • | | threatened or consummated expropriation or nationalization of our assets by foreign governments; |
| | • | | unwillingness of governments, government agencies or similar organizations to honor their contracts; |
| | • | | inability to obtain access to fair and equitable political, regulatory, administrative and legal systems; |
| | • | | adverse changes in government tax policy; |
| | • | | difficulties in enforcing our contractual rights or enforcing judgments or obtaining a just result in local jurisdictions; and |
| | • | | potentially adverse tax consequences of operating in multiple jurisdictions. |
Any of these factors, individually or in combination with others, could materially and adversely affect our business, results of operations and financial condition. In addition, our Latin American operations experience volatility in revenues and earnings which have caused and are expected to cause significant volatility in our results of operations and cash flows. The volatility is caused by regulatory and economic difficulties, political instability and currency devaluations being experienced in many of these countries. This volatility reduces the predictability and enhances the uncertainty associated with cash flows from these businesses.
Our inability to predict, influence or respond appropriately to changes in law or regulatory schemes, including any inability to obtain expected or contracted increases in electricity tariff rates or tariff adjustments for increased expenses, could adversely impact our results of operations or our ability to meet publicly announced projections or analyst’s expectations. Furthermore, changes in laws or regulations or changes in the application or interpretation of regulatory provisions in jurisdictions where we operate, particularly our Utilities where electricity tariffs are subject to regulatory review or approval, could adversely affect our business, including, but not limited to:
| | • | | changes in the determination, definition or classification of costs to be included as reimbursable or pass-through costs; |
| | • | | changes in the definition or determination of controllable or non-controllable costs; |
| | • | | changes in the definition of events which may or may not qualify as changes in economic equilibrium; |
| | • | | changes in the timing of tariff increases; |
| | • | | other changes in the regulatory determinations under the relevant concessions; or |
| | • | | changes in environmental regulations, including regulations relating to GHG emissions in any of our businesses. |
Any of the above events may result in lower margins for the affected businesses, which can adversely affect our business.
RISKS RELATED TO FOREIGN CURRENCIES—AES operates businesses in many foreign environments and such operations in foreign countries may be impacted by significant fluctuations in foreign currency exchange rates. The Company’s financial position and results of operations have been significantly affected by fluctuations in the value of the Brazilian real, the Argentine peso, the Dominican Republic peso, the Euro, the Chilean peso, the Colombian peso and the Philippine peso relative to the U.S. Dollar.
RISKS RELATED TO POWER SALES CONTRACTS—Several of the Company’s power plants rely on power sales contracts with one or a limited number of entities for the majority of, and in some case all of, the relevant plant’s output over the term of the power sales contract. The remaining term of the power sales contracts related to the Company’s power plants range from less than one to 41 years. No single customer accounted for 10% or more of total revenues in 2008, 2007, or 2006.
137
The cash flows and results of operations of such plants are dependent on the credit quality of the purchasers and the continued ability of their customers and suppliers to meet their obligations under the relevant power sales contract. If a substantial portion of the Company’s long-term power sales contracts were modified or terminated, the Company would be adversely affected to the extent that it was unable to find other customers at the same level of contract profitability. The loss of one or more significant power sales contracts or the failure by any of the parties to a power sales contract to fulfill its obligations thereunder could have a material adverse impact on the Company’s business, results of operations and financial condition.
25. OFF-BALANCE SHEET ARRANGEMENTS AND RELATED PARTY TRANSACTIONS
IPL, a consolidated subsidiary of the Company, formed IPL Funding Corporation (“IPL Funding”) in 1996 to purchase, on a revolving basis, up to $50 million of the retail accounts receivable and related collections of IPL. IPL Funding is consolidated by IPL and IPALCO since it meets requirements set forth in SFAS No. 140,Accounting for Transfers and Servicing of Financial Assets and Extinguishments of Liabilities, to be considered a qualified special-purpose entity. IPL Funding has entered into a purchase facility with unrelated parties (“the Purchasers”) pursuant to which the Purchasers agree to purchase from IPL Funding, on a revolving basis, up to $50 million of the receivables purchased from IPL. During 2008, this agreement was extended through May 26, 2009. Accounts receivable on the Company’s Consolidated Balance Sheets are stated net of the $50 million sold.
IPL retains servicing responsibilities for its role as a collection agent on the amounts due on the sold receivables. However, the Purchasers assume the risk of collection on the purchased receivables without recourse to IPL in the event of a loss. While no direct recourse to IPL exists, it risks loss in the event collections are not sufficient to allow for full recovery of its retained interests. No servicing asset or liability is recognized since the servicing fee paid to IPL approximates a market rate.
The carrying values of the retained interest is determined by allocating the carrying value of the receivables between the assets sold and the interests retained based on relative fair value. The key assumptions in estimating fair value are credit losses, the selection of discount rates, and expected receivables turnover rate. As a result of short accounts receivable turnover period and historically low credit losses, the impact of these assumptions has not been significant to the fair value. The hypothetical effect on the fair value of the retained interests assuming both a 10% and a 20% unfavorable variation in credit losses or discount rates is not material due to the short turnover of receivables and historically low credit loss history.
The losses recognized on the sales of receivables were $2 million, $3 million and $3 million for the years ended December 31, 2008, 2007 and 2006, respectively. These losses are included in other operating expense on the Consolidated Statements of Operations. The amount of the losses recognized depends on the previous carrying amount of the financial assets involved in the transfer, allocated between the assets sold and the interests that continue to be held by the transferor based on their relative fair value at the date of transfer, and the proceeds received.
IPL’s retained interest in the receivables sold was $83 million and $64 million at December 31, 2008 and 2007, respectively. There were no proceeds from new securitizations for each of the years ended December 31, 2008, 2007 and 2006. Servicing fees of $0.6 million were received for each of the years ended December 31, 2008, 2007 and 2006.
IPL and IPL Funding provide certain indemnities to the Purchasers, including indemnification in the event that there is a breach of representations and warranties made with respect to the purchased receivables. IPL Funding and IPL each have agreed to indemnify the Purchasers on an after-tax basis for any and all damages, losses, claims, liabilities, penalties, taxes, costs and expenses at any time imposed on or incurred by the indemnified parties arising out of or otherwise relating to the purchase facility, subject to certain limitations as defined in the Purchase Facility.
138
Under the Purchase Facility, if IPL fails to maintain certain financial covenants regarding interest coverage and debt to capital, it would constitute a “termination event.” As of December 31, 2008, IPL was in compliance with such covenants.
As a result of IPL’s current credit rating, the facility agent has the ability to:
| | (i) | replace IPL as the collection agent; and |
| | (ii) | declare a “lock-box” event. |
Under a lock-box event or a termination event, the facility agent has the ability to require all proceeds of purchased receivables of IPL to be directed to lock-box accounts within 45 days of notifying IPL. A termination event would also:
| | (i) | give the facility agent the option to take control of the lock-box account; and |
| | (ii) | give the Purchasers the option to discontinue the purchase of new receivables and cause all proceeds of the purchased receivables to be used to reduce the Purchaser’s investment and to pay other amounts owed to the Purchasers and the facility agent. |
This would have the effect of reducing the operating capital available to IPL by the aggregate amount of such purchased receivables (currently $50 million).
Our Panamanian businesses are partially owned by the Government of Panama (the “Government”). The Government, in turn, partially owns the distribution companies within Panama. For the years ended December 31, 2008, 2007 and 2006, our Panamanian businesses recognized electricity sales to the Government totaling $203 million, $168 million and $141 million, respectively. For the same period, our Panamanian businesses purchased electricity which excludes transmission charges from the Government totaling $27 million, $24 million and $15 million, respectively. As of December 31, 2008 and 2007, our Panamanian businesses owed the Government $2 million and $3 million, respectively, payable on normal trade terms. For the same period, the Government owed our Panamanian businesses $29 million and $44 million, respectively, payable on normal trade terms.
139
26. SELECTED QUARTERLY FINANCIAL DATA (UNAUDITED)
Quarterly Financial Data
The following tables summarize the unaudited quarterly statements of operations for the Company for 2008 and 2007. Amounts reflect all adjustments necessary in the opinion of management for a fair statement of the results for interim periods.
| | | | | | | | | | | | | | | | |
| | | Quarter ended 2008 | |
| | | Mar 31 | | | June 30 | | | Sept 30 | | | Dec 31 | |
| | | (in millions, except per share data) | |
Revenues | | $ | 4,081 | | | $ | 4,126 | | | $ | 4,319 | | | $ | 3,544 | |
| | | | | | | | | | | | | | | | |
Gross margin | | | 1,042 | | | | 1,029 | | | | 962 | | | | 674 | |
| | | | | | | | | | | | | | | | |
Income from continuing operations, net of tax | | | 407 | | | | 1,159 | | | | 361 | | | | 83 | |
Less: income attributable to noncontrolling interests | | | (175 | ) | | | (257 | ) | | | (214 | ) | | | (148 | ) |
| | | | | | | | | | | | | | | | |
Income from continuing operations attributable to The AES Corporation, net of tax | | | 232 | | | | 902 | | | | 147 | | | | (65 | ) |
Discontinued operations, net of tax | | | 1 | | | | 1 | | | | (2 | ) | | | 18 | |
| | | | | | | | | | | | | | | | |
Net income (loss) attributable to The AES Corporation | | | 233 | | | | 903 | | | | 145 | | | | (47 | ) |
| | | | | | | | | | | | | | | | |
Net income | | $ | 408 | | | $ | 1,160 | | | $ | 359 | | | $ | 101 | |
| | | | | | | | | | | | | | | | |
Basic income per share: | | | | | | | | | | | | | | | | |
Income from continuing operations attributable to The AES Corporation, net of tax | | $ | 0.35 | | | $ | 1.34 | | | $ | 0.22 | | | $ | (0.10 | ) |
Discontinued operations attributable to The AES Corporation, net of tax | | | — | | | | — | | | | — | | | | 0.03 | |
| | | | | | | | | | | | | | | | |
Basic income (loss) per share attributable to The AES Corporation | | $ | 0.35 | | | $ | 1.34 | | | $ | 0.22 | | | $ | (0.07 | ) |
| | | | | | | | | | | | | | | | |
Diluted income per share: | | | | | | | | | | | | | | | | |
Income from continuing operations attributable to The AES Corporation, net of tax | | $ | 0.34 | | | $ | 1.31 | | | $ | 0.22 | | | $ | (0.10 | ) |
Discontinued operations attributable to The AES Corporation, net of tax | | | — | | | | — | | | | — | | | | 0.03 | |
| | | | | | | | | | | | | | | | |
Diluted income (loss) per share attributable to The AES Corporation | | $ | 0.34 | | | $ | 1.31 | | | $ | 0.22 | | | $ | (0.07 | ) |
| | | | | | | | | | | | | | | | |
| |
| | | Quarter ended 2007 | |
| | | Mar 31 | | | June 30 | | | Sept 30 | | | Dec 31 | |
| | | (in millions, except per share data) | |
Revenues | | $ | 3,072 | | | $ | 3,320 | | | $ | 3,468 | | | $ | 3,656 | |
| | | | | | | | | | | | | | | | |
Gross margin | | | 841 | | | | 898 | | | | 844 | | | | 809 | |
| | | | | | | | | | | | | | | | |
Income from continuing operations, net of tax | | | 249 | | | | 529 | | | | 254 | | | | (114 | ) |
Less: income attributable to noncontrolling interests | | | (139 | ) | | | (247 | ) | | | (162 | ) | | | 117 | |
| | | | | | | | | | | | | | | | |
Income from continuing operations attributable to The AES Corporation, net of tax | | | 110 | | | | 282 | | | | 92 | | | | 3 | |
Discontinued operations, net of tax | | | (571 | ) | | | (28 | ) | | | 12 | | | | 5 | |
| | | | | | | | | | | | | | | | |
Net (loss) income attributable to The AES Corporation | | $ | (461 | ) | | $ | 254 | | | $ | 104 | | | $ | 8 | |
| | | | | | | | | | | | | | | | |
Net income (loss) | | $ | (322 | ) | | $ | 501 | | | $ | 266 | | | $ | (109 | ) |
| | | | | | | | | | | | | | | | |
Basic income per share: | | | | | | | | | | | | | | | | |
Income from continuing operations attributable to The AES Corporation, net of tax | | $ | 0.17 | | | $ | 0.42 | | | $ | 0.14 | | | $ | — | |
Discontinued operations attributable to The AES Corporation, net of tax | | | (0.86 | ) | | | (0.04 | ) | | | 0.02 | | | | 0.01 | |
| | | | | | | | | | | | | | | | |
Basic (loss) income per share attributable to The AES Corporation | | $ | (0.69 | ) | | $ | 0.38 | | | $ | 0.16 | | | $ | 0.01 | |
| | | | | | | | | | | | | | | | |
Diluted income per share: | | | | | | | | | | | | | | | | |
Income from continuing operations attributable to The AES Corporation, net of tax | | $ | 0.16 | | | $ | 0.41 | | | $ | 0.14 | | | $ | — | |
Discontinued operations attributable to The AES Corporation, net of tax | | | (0.84 | ) | | | (0.04 | ) | | | 0.01 | | | | 0.01 | |
| | | | | | | | | | | | | | | | |
Diluted (loss) income per share attributable to The AES Corporation | | $ | (0.68 | ) | | $ | 0.37 | | | $ | 0.15 | | | $ | 0.01 | |
| | | | | | | | | | | | | | | | |
140
27. SUBSEQUENT EVENTS
On December 23, 2008, the local Chilean SEC approved Gener’s share issuance of approximately 945 million shares at a price of $162.50 Chilean Pesos. The proceeds of the share issuance was $246 million and Gener anticipates using these proceeds for future expansion plans, working capital and other operating needs. The preemptive rights period began on January 7, 2009 remained open for 30 days and closed on February 5, 2009. During the preemptive rights period AES, through its wholly-owned subsidiary, Cachagua, paid $175 million to maintain its current ownership percentage of approximately 70.6%.
On February 9, 2009, the government of the Dominican Republic, the government-owned power companies and the power companies sector (“generation companies”), signed two Memorandums of Understanding (each an “MOU”). The first MOU provides for the settlement of outstanding 2008 accounts receivables (“2008 A/R”) held by the generation companies from distribution companies through the payment of government-issued bonds of which the Company’s three generation businesses have been allocated $110 million. This MOU also states that the bonds can be used to offset fiscal taxes, but that element will need to be approved by the National Congress of the Dominican Republic during their first legislative session of 2009. The second MOU acknowledges that the bond payment does not fully satisfy the outstanding 2008 A/R balance. The residual amount outstanding after the bond payment will be fully settled by the distribution companies, within a timeframe to be negotiated in the near future.
It is AES’ intention to accept these bonds as settlement for approximately $110 million of outstanding 2008 A/R, under the assumption that the bonds will have the ability to offset fiscal taxes. The Company’s businesses will have approximately $58 million of 2008 A/R outstanding after the bond payment that will be subject to the terms of the second MOU. The intention of the distribution companies is to pay approximately $35 million of these receivables in 2009. Therefore, AES has appropriately reclassified $23 million to long-term receivables on the Company’s Consolidated Balance Sheet as of December 31, 2008.
141
THE AES CORPORATION AND SUBSIDIARIES
INDEX TO FINANCIAL STATEMENT SCHEDULES
Schedules other than those listed above are omitted as the information is either not applicable, not required, or has been furnished in the financial statements or notes thereto included in Item 8 hereof.
S-1
THE AES CORPORATION
SCHEDULE I CONDENSED FINANCIAL INFORMATION OF REGISTRANT
UNCONSOLIDATED BALANCE SHEETS
(IN MILLIONS)
| | | | | | | | |
| | | December 31, | |
| | | 2008 | | | 2007 | |
| ASSETS | | | | | | | | |
Current Assets: | | | | | | | | |
Cash and cash equivalents | | $ | 200 | | | $ | 913 | |
Restricted cash | | | 13 | | | | 15 | |
Accounts and notes receivable from subsidiaries | | | 710 | | | | 932 | |
Deferred income taxes | | | 19 | | | | 11 | |
Prepaid expenses and other current assets | | | 43 | | | | 62 | |
| | | | | | | | |
Total current assets | | | 985 | | | | 1,933 | |
Investment in and advances to subsidiaries and affiliates | | | 7,659 | | | | 6,220 | |
Office Equipment: | | | | | | | | |
Cost | | | 66 | | | | 67 | |
Accumulated depreciation | | | (34 | ) | | | (29 | ) |
| | | | | | | | |
Office equipment, net | | | 32 | | | | 38 | |
Other Assets: | | | | | | | | |
Deferred financing costs (net of accumulated amortization of $89 and $75, respectively) | | | 67 | | | | 71 | |
Deferred income taxes | | | 311 | | | | 522 | |
Other assets | | | 3 | | | | 213 | |
| | | | | | | | |
Total other assets | | | 381 | | | | 806 | |
| | | | | | | | |
Total | | $ | 9,057 | | | $ | 8,997 | |
| | | | | | | | |
| LIABILITIES AND STOCKHOLDERS’ EQUITY | | | | | | | | |
Current Liabilities: | | | | | | | | |
Accounts payable | | | — | | | | 7 | |
Accrued and other liabilities | | | 210 | | | | 261 | |
Senior notes payable—current portion | | | 154 | | | | 223 | |
| | | | | | | | |
Total current liabilities | | | 364 | | | | 491 | |
Long-term Liabilities: | | | | | | | | |
Term loan | | | 200 | | | | 200 | |
Senior notes payable | | | 4,277 | | | | 4,615 | |
Junior subordinated notes and debentures payable | | | 517 | | | | 517 | |
Other long-term liabilities | | | 30 | | | | 10 | |
| | | | | | | | |
Total long-term liabilities | | | 5,024 | | | | 5,342 | |
Stockholders’ equity: | | | | | | | | |
Common stock | | | 7 | | | | 7 | |
Additional paid-in capital | | | 6,832 | | | | 6,776 | |
Accumulated loss | | | (8 | ) | | | (1,241 | ) |
Accumulated other comprehensive loss | | | (3,018 | ) | | | (2,378 | ) |
Treasury stock | | | (144 | ) | | | — | |
| | | | | | | | |
Total stockholders’ equity | | | 3,669 | | | | 3,164 | |
| | | | | | | | |
Total | | $ | 9,057 | | | $ | 8,997 | |
| | | | | | | | |
See Notes to Schedule 1
S-2
THE AES CORPORATION
SCHEDULE I CONDENSED FINANCIAL INFORMATION OF REGISTRANT
STATEMENTS OF UNCONSOLIDATED OPERATIONS
(IN MILLIONS)
| | | | | | | | | | | | |
| | | For the Years Ended December 31 | |
| | | 2008 | | | 2007 | | | 2006 | |
Revenues from subsidiaries and affiliates | | $ | 36 | | | $ | 32 | | | $ | 38 | |
Equity in earnings (losses) of subsidiaries and affiliates | | | 2,019 | | | | 588 | | | | 882 | |
Interest income | | | 173 | | | | 155 | | | | 48 | |
General and administrative expenses | | | (264 | ) | | | (411 | ) | | | (293 | ) |
Interest expense | | | (516 | ) | | | (471 | ) | | | (443 | ) |
| | | | | | | | | | | | |
Income (loss) before income taxes | | | 1,448 | | | | (107 | ) | | | 232 | |
Income tax benefit (expense) | | | (215 | ) | | | 12 | | | | 15 | |
| | | | | | | | | | | | |
Net income (loss) attributable to The AES Corporation | | $ | 1,233 | | | $ | (95 | ) | | $ | 247 | |
| | | | | | | | | | | | |
See Notes to Schedule 1
S-3
THE AES CORPORATION
SCHEDULE I CONDENSED FINANCIAL INFORMATION OF REGISTRANT
STATEMENTS OF UNCONSOLIDATED CASH FLOWS
(IN MILLIONS)
| | | | | | | | | | | | |
| | | For the Years Ended December 31, | |
| | | 2008 | | | 2007 | | | 2006 | |
Net cash provided by operating activities | | $ | 863 | | | $ | 213 | | | $ | 288 | |
Investing Activities: | | | | | | | | | | | | |
Proceeds from asset sales, net of expenses | | | — | | | | 55 | | | | 120 | |
Investment in and advances to subsidiaries | | | (1,098 | ) | | | (899 | ) | | | (337 | ) |
Acquisitions, net of cash acquired | | | (95 | ) | | | (3 | ) | | | (103 | ) |
Return of capital | | | 89 | | | | 265 | | | | 10 | |
Increase in restricted cash | | | 2 | | | | (7 | ) | | | (1 | ) |
Additions to property, plant and equipment | | | (23 | ) | | | (199 | ) | | | (37 | ) |
| | | | | | | | | | | | |
Net cash used in investing activities | | | (1,125 | ) | | | (788 | ) | | | (348 | ) |
Financing Activities: | | | | | | | | | | | | |
Borrowings of notes payable and other coupon bearing securities | | | 625 | | | | 2,000 | | | | — | |
Repayments of notes payable and other coupon bearing securities | | | (1,037 | ) | | | (1,315 | ) | | | (150 | ) |
Return of investment on equity capital contributions | | | — | | | | — | | | | 117 | |
Loans from subsidiaries | | | 90 | | | | 534 | | | | — | |
Proceeds from issuance of common stock | | | 28 | | | | 58 | | | | 78 | |
Purchase of treasury stock | | | (143 | ) | | | — | | | | — | |
Payments for deferred financing costs | | | (14 | ) | | | (27 | ) | | | (9 | ) |
| | | | | | | | | | | | |
Net cash (used in) provided by financing activities | | | (451 | ) | | | 1,250 | | | | 36 | |
Increase (decrease) in cash and cash equivalents | | | (713 | ) | | | 675 | | | | (24 | ) |
Cash and cash equivalents, beginning | | | 913 | | | | 238 | | | | 262 | |
| | | | | | | | | | | | |
Cash and cash equivalents, ending | | $ | 200 | | | $ | 913 | | | $ | 238 | |
| | | | | | | | | | | | |
Schedule of non-cash investing and financing activities: | | | | | | | | | | | | |
Cash payments for interest, net of amounts capitalized | | $ | 469 | | | $ | 416 | | | $ | 419 | |
Cash payments for income taxes, net of refunds | | $ | — | | | $ | — | | | $ | — | |
See Notes to Schedule 1
S-4
THE AES CORPORATION
SCHEDULE I
NOTES TO SCHEDULE I
1. Application of Significant Accounting Principles
Accounting for Subsidiaries and Affiliates—The AES Corporation (the “Company”) has accounted for the earnings of its subsidiaries on the equity method in the unconsolidated financial information.
Revenues—Construction management fees earned by the parent from its consolidated subsidiaries are eliminated.
Income Taxes—Effective January 1, 2007, the Company adopted the provisions set forth in FIN No. 48,Accounting for Uncertainty in Income Taxes, (“FIN No. 48”). Under FIN No. 48, positions taken on the Company’s income tax return which satisfy a more-likely-than-not threshold will be recognized in the financial statements. The unconsolidated income tax expense or benefit computed for the Company in accordance with SFAS No. 109,Accounting for Income Taxes, reflects the tax assets and liabilities of the Company on a stand-alone basis and the effect of filing a consolidated U.S. income tax return with certain other affiliated companies.
Accounts and Notes Receivable from Subsidiaries—such amounts have been shown in current or long-term assets based on terms in agreements with subsidiaries, but payment is dependent upon meeting conditions precedent in the subsidiary loan agreements.
Selected Unconsolidated Balance Sheet Data:
| | | | | | | | |
| | | December 31, 2008 | | | December 31, 2007 | |
| | | (in millions) | |
Assets | | | | | | | | |
Investment in and advances to subsidiaries and affiliates | | $ | 7,659 | | | $ | 6,220 | |
Deferred income taxes | | $ | 311 | | | $ | 522 | |
Total other assets | | $ | 381 | | | $ | 806 | |
Total assets | | $ | 9,057 | | | $ | 8,997 | |
| | |
Liabilities & Stockholders’ Equity | | | | | | | | |
Other long-term liabilities | | $ | 30 | | | $ | 10 | |
Total long-term liabilities | | $ | 5,024 | | | $ | 5,342 | |
Additional paid-in capital | | $ | 6,832 | | | $ | 6,776 | |
Accumulated loss | | $ | (8 | ) | | $ | (1,241 | ) |
Accumulated other comprehensive loss | | $ | (3,018 | ) | | $ | (2,378 | ) |
Total stockholders’ equity | | $ | 3,669 | | | $ | 3,164 | |
Total liabilities & stockholders’ equity | | $ | 9,057 | | | $ | 8,997 | |
Selected Unconsolidated Operations Data:
| | | | | | | | | | | |
| | | For the Year Ended December 31, |
| | | 2008 | | | 2007 | | | 2006 |
| | | (in millions) |
Equity in earnings of subsidiaries and affiliates | | $ | 2,019 | | | $ | 588 | | | $ | 882 |
Income (loss) before cumulative effect of change in accounting principle | | $ | 1,448 | | | $ | (107 | ) | | $ | 232 |
Income (loss) before income taxes | | $ | 1,448 | | | $ | (107 | ) | | $ | 232 |
Income tax benefit | | $ | (215 | ) | | $ | 12 | | | $ | 15 |
Net income (loss) attributable to The AES Corporation | | $ | 1,233 | | | $ | (95 | ) | | $ | 247 |
S-5
2. Notes Payable
| | | | | | | | | | | | | | | |
| | | Interest Rate | | | Final
Maturity | | First Call
Date (1) | | December 31, | |
| | | | | | 2008 | | | 2007 | |
| | | | | | | | | | (in millions) | |
Senior Secured Term Loan | | LIBOR + 1.75 | % | | 2011 | | — | | $ | 200 | | | $ | 200 | |
Senior Secured Notes | | 8.750 | % | | 2013 | | 5/15/08 | | | 690 | | | | 752 | |
Senior Notes | | 8.000 | % | | 2017 | | — | | | 1,500 | | | | 1,500 | |
Senior Notes | | 7.750 | % | | 2015 | | — | | | 500 | | | | 500 | |
Senior Notes | | 8.750 | % | | 2008 | | — | | | — | | | | 9 | |
Senior Notes | | 9.500 | % | | 2009 | | — | | | 154 | | | | 467 | |
Senior Notes | | 9.375 | % | | 2010 | | — | | | 214 | | | | 423 | |
Senior Notes | | 8.875 | % | | 2011 | | — | | | 129 | | | | 307 | |
Senior Notes | | 8.375 | % | | 2011 | | — | | | 124 | | | | 171 | |
Senior Notes | | 7.750 | % | | 2014 | | — | | | 500 | | | | 500 | |
Senior Notes | | 8.000 | % | | 2020 | | — | | | 625 | | | | — | |
Convertible Junior Subordinated Debentures | | 6.000 | % | | 2008 | | — | | | — | | | | 214 | |
Convertible Junior Subordinated Debentures | | 6.750 | % | | 2029 | | — | | | 517 | | | | 517 | |
Unamortized discounts | | | | | | | | | | (5 | ) | | | (5 | ) |
| | | | | | | | | | | | | | | |
SUBTOTAL | | | | | | | | | | 5,148 | | | | 5,555 | |
| | | | | | | | | | | | | | | |
Less: Current maturities | | | | | | | | | | (154 | ) | | | (223 | ) |
| | | | | | | | | | | | | | | |
Total | | | | | | | | | $ | 4,994 | | | $ | 5,332 | |
| | | | | | | | | | | | | | | |
| (1) | The first call date represents the date that the Company, at its option, can call the related debt. |
FUTURE MATURITIES OF DEBT—Scheduled maturities of total debt for continuing operations at December 31, 2008 are:
| | | |
2009 | | $ | 154 |
2010 | | | 214 |
2011 | | | 453 |
2012 | | | — |
2013 | | | 690 |
Thereafter | | | 3,637 |
| | | |
Total | | $ | 5,148 |
| | | |
3. Dividends from Subsidiaries and Affiliates
Cash dividends received from consolidated subsidiaries and from affiliates accounted for by the equity method were as follows:
| | | | | | | | | |
| | | 2008 | | 2007 | | 2006 |
Subsidiaries | | $ | 738 | | $ | 737 | | $ | 808 |
Affiliates | | $ | 61 | | $ | 21 | | $ | 19 |
4. Guarantees and Letters of Credit
GUARANTEES—In connection with certain of its project financing, acquisition, and power purchase agreements, the Company has expressly undertaken limited obligations and commitments, most of which will only be effective or will be terminated upon the occurrence of future events. These obligations and commitments, excluding those collateralized by letter of credit and other obligations discussed below, were limited as of December 31, 2008, by the terms of the agreements, to an aggregate of approximately $411 million representing 34 agreements with individual exposures ranging from less than $1 million up to $53 million.
LETTERS OF CREDIT—At December 31, 2008, the Company had $207 million in letters of credit outstanding representing 19 agreements with individual exposures ranging from less than $1 million up to $131 million, which operate to guarantee performance relating to certain project development and construction activities and subsidiary operations. In 2008, the Company paid letter of credit fees which averaged 3.4% per annum on the outstanding amounts. In addition, the Company had less than $1 million in surety bonds outstanding at December 31, 2008.
S-6