EXHIBIT 99.1
Overview
We are a global power company, dedicated to improving lives by providing safe, reliable and sustainable energy solutions in every market we serve. We own a portfolio of electricity generation and distribution businesses on five continents in 27 countries, with total capacity of approximately 42,600 Megawatts (“MW”) and distribution networks serving approximately 12 million customers as of December 31, 2011. In addition, we have approximately 2,400 MW under construction in eight countries. We were incorporated in Delaware in 1981.
We own and operate two primary types of businesses. The first is our Generation business, where we own and/or operate power plants to generate and sell power to wholesale customers such as utilities and other intermediaries. The second is our Utilities business, where we own and/or operate utilities to generate, distribute, transmit and sell electricity to end-user customers in the residential, commercial, industrial and governmental sectors within a defined service area.
Our assets are diverse with respect to fuel source and type of market, which helps reduce certain types of operating risk. Our portfolio employs a broad range of fuels, including coal, diesel, fuel oil, natural gas, biomass and renewable sources such as hydroelectric power, wind and solar, which reduces the risks associated with dependence on any one fuel source. Our portfolio combines a presence in stable markets in developed countries with faster growing emerging markets. In addition, our Generation portfolio is largely contracted, which reduces the risk related to market prices of electricity and fuel. We also attempt to limit risk by matching the currency of most of our subsidiary debt to the revenue of the underlying business and by hedging some of our interest rate and commodity risk. However, our business is still subject to these and other risks, which are further described in Item 1A.—Risk Factors of the 2011 Form 10-K.
Our goal is to maximize value for our shareholders by growing cash flow and earnings per share and achieving better returns on our investments. We will expand our platforms in our core markets, specifically Brazil, Chile, Colombia and the United States, and will work to develop growth platforms in key markets including Turkey, Poland and the United Kingdom. Over time, by focusing our growth and exiting select non-strategic markets, we expect to narrow our geographic focus to achieve better results with fewer countries. Across our portfolio, we will work to optimize profitability, as well as reduce our overhead and business development costs. Finally, we have announced our intent to initiate a dividend beginning in the third quarter of 2012, with the first payment expected to be made in the fourth quarter of 2012.
Key Lines of Business
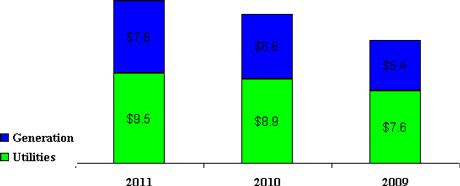
AES’ primary sources of revenue and gross margin today are from Generation and Utilities. These businesses are distinguished by the nature of the customers, operational differences, cost structure, regulatory environment and risk exposure. The breakout of revenue and gross margin between Generation and Utilities for the years ended December 31, 2011, 2010 and 2009, respectively, is shown below. Operating results for integrated utilities, which have both Generation and Utilities, are reflected in the Utilities amounts below.
1
Revenue
($ in billions)
Gross Margin
($ in billions)
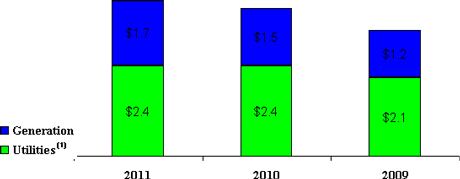
| (1) | Utilities gross margin includes the margin from generation businesses owned by the Company and from whom the utility purchases energy. |
Generation
We currently own or operate a generation portfolio of approximately 32,300 MW, excluding the generation capabilities of our integrated utilities, consisting of 96 Generation facilities in 22 countries on five continents at our generation businesses. We also have approximately 2,100 MW of capacity currently under construction in four countries. We are a major power source in many countries, such as Chile, where AES Gener (“Gener”) is the second largest electricity generation company in terms of capacity. Our Generation business uses a wide range of technologies and fuel types including coal, combined-cycle gas turbines, hydroelectric power and biomass. Generation revenue was $7.6 billion, $6.8 billion and $5.4 billion for the years ended December 31, 2011, 2010 and 2009, respectively.
Performance drivers for our Generation businesses include, among other factors, plant reliability, fuel costs, power prices, volume and fixed-cost management. Growth in the Generation business is largely tied to securing new power purchase agreements (“PPAs”), expanding capacity in our existing facilities, reducing our fixed costs and building or acquiring new power plants.
2
The majority of the electricity produced by our Generation businesses is sold under long-term PPAs, to wholesale customers. In 2011, approximately 71% of the revenue from our Generation business was from plants that operate under PPAs of three years or longer for 75% or more of their output capacity. These businesses often reduce their exposure to fuel supply risks by entering into long-term fuel supply contracts or fuel tolling arrangements where the customer assumes full responsibility for purchasing and supplying the fuel to the power plant. These long-term contractual agreements help reduce the volatility of our cash flows and earnings and also reduce exposure to volatility in the market price for electricity and fuel; however, the amount of earnings and cash flow predictability varies from business to business based on the degree to which its exposure is limited by the contracts it has negotiated.
Our Generation businesses with long-term contracts face most of their competition from other utilities and independent power producers (“IPPs”) prior to the execution of a power sales agreement during the development phase of a project or upon expiration of an existing agreement. Once a project is operational, we traditionally have faced limited competition due to the long-term nature of the generation contracts. However, as our existing contracts expire, we may face increased competition to attract new customers and maintain our current customer base.
The balance of our Generation business sells power through competitive markets under short-term contracts, directly in the spot market or, in some cases, at regulated prices. As a result, the cash flows and earnings associated with these businesses are more sensitive to fluctuations in the market price for electricity, natural gas, coal and other fuels. Competitive factors for these facilities include price, reliability, operational cost and third-party credit requirements.
Utilities
AES utility businesses distribute power to over 12 million people in six countries on five continents and consist primarily of 13 companies owned or operated under management agreements, each of which operates in defined service areas. These businesses also include 29 generation plants in two countries with generation capacity totaling approximately 8,500 MW. These businesses have a variety of structures ranging from pure distribution businesses to fully integrated utilities, which generate, transmit and distribute power. For instance, our wholly-owned subsidiary in the U.S., Indianapolis Power & Light (“IPL”), has the exclusive right to provide retail services to approximately 470,000 customers in Indianapolis, Indiana. The Dayton Power and Light Company (“DP&L”) serves approximately 500,000 customers in West Central Ohio. Eletropaulo Metropolitana Electricidade de São Paulo S.A. (“AES Eletropaulo” or “Eletropaulo”), serving the São Paulo metropolitan region for over 100 years, has approximately six million customers and is the largest electricity distribution company in Latin America in terms of revenue and electricity distributed. Utilities revenue was $9.5 billion, $8.9 billion and $7.6 billion for the years ended December 31, 2011, 2010 and 2009, respectively.
Performance drivers for Utilities include, but are not limited to, reliability of service, management of working capital, negotiation of tariff adjustments, compliance with extensive regulatory requirements, and in developing countries, reduction of commercial and technical losses. The results of operations of our Utilities businesses are sensitive to changes in economic growth, regulations and variations in weather conditions in the areas in which they operate. In certain locations, our distribution businesses face increased competition as a result of changes in laws and regulations which allow wholesale and retail services to be provided on a competitive basis.
The majority of our utilities face relatively little direct competition due to significant barriers to entry, which are present in these markets. Competition is a factor in efforts to acquire existing businesses. In this arena, we compete against a number of other market participants, some of which have greater financial resources, have been engaged in distribution related businesses for longer periods of time and/or have accumulated more significant portfolios. Relevant competitive factors for our power distribution businesses include financial resources, governmental assistance, regulatory restrictions and access to non-recourse financing.
Renewables and Other Initiatives
In recent years, as demand for renewable sources of energy has grown, we have developed projects in wind, solar and other renewable initiatives including energy storage. In 2005, we started a wind generation business (“Wind Generation”), which currently has 21 plants in operation in five countries totaling approximately 1,800 MW in generation capacity and is one of the largest producers of wind power in the U.S. In addition, 205 MW are under
3
construction in four countries. In March 2008, we formed AES Solar Energy LLC (“AES Solar”), a joint venture with Riverstone Holdings, LLC (“Riverstone”), a private equity firm, which has since commenced commercial operations of 26 plants totaling 151 MW of solar projects in Bulgaria, France, Greece, Italy and Spain. We also have a line of business to develop and implement utility scale energy storage systems (such as batteries), which store and release power when needed. None of these initiatives are currently material to our operations, however, there are risks associated with these initiatives, which are further described in Item 1A.—Risk Factors of the 2011 Form 10-K.
Risks
We routinely encounter and address risks, some of which may cause our future results to be different, sometimes materially different, than we presently anticipate. The categories of risk we have identified in Item 1A.—Risk Factors of the 2011 Form 10-K include the following:
| | • | | risks related to our high level of indebtedness; |
| | • | | risks associated with our ability to raise needed capital; |
| | • | | external risks associated with revenue and earnings volatility; |
| | • | | risks associated with our operations; |
| | • | | risks associated with governmental regulation and laws; and |
| | • | | risks associated with our disclosure controls and internal controls over financial reporting. |
The categories of risk identified above are discussed in greater detail in Item 1A.—Risk Factors of the 2011 Form 10-K. These risk factors should be read in conjunction with Item 7.—Management’s Discussion and Analysis of Financial Condition and Results of Operations, and the Consolidated Financial Statements and related notes included elsewhere in this report.
Our Organization and Segments
We believe our broad geographic footprint allows us to focus development in targeted markets with opportunities for new investment, and provides stability through our presence in more developed regions. In addition, our presence in each region affords us important relationships and helps us identify local markets with attractive opportunities for new investment. The management reporting structure is organized along two lines of business—Generation and Utilities, each led by a Chief Operating Officer (“COO”), who in turn reports to our Chief Executive Officer (“CEO”). Our CEO and COOs are based in Arlington, Virginia. During the first quarter of 2012, the Company completed the restructuring of its operational management and reporting process. For financial reporting purposes, the Company has identified seven reportable segments which include:
| | • | | Generation—Latin America—Other; |
| | • | | Generation—North America; |
| | • | | Utilities—Latin America; |
| | • | | Utilities—North America. |
As discussed in Note 16—Segment and Geographic Information to the Consolidated Financial Statements, based on the application of the segment accounting guidance, Tietê is reported as a separate segment for purposes of the required segment accounting disclosures, but is included in Generation—Latin America within the discussion of operating results for revenue and gross margin in management’s discussion and analysis as is it managed with the other Latin American generation businesses.
4
Corporate and Other—The Company’s Europe Utilities, Africa Utilities, Africa Generation and Wind Generation businesses as well as the Company’s renewables initiatives are reported within “Corporate and Other” because they do not require separate disclosure under segment reporting accounting guidance. See Item 7.—Management’s Discussion and Analysis of Financial Condition and Results of Operations for further discussion of the Company’s segment structure used for financial reporting purposes.
The following describes our businesses by their geographical area of operations:
Latin America
Our Latin America operations accounted for 65%, 65% and 67% of consolidated AES revenue in 2011, 2010 and 2009, respectively. The following table provides highlights of our Latin America operations:
| | |
| Countries | | Argentina, Brazil, Chile, Colombia, Dominican
Republic, El Salvador and Panama |
| Generation Capacity | | 12,616 Gross MW |
| Utilities Penetration | | 8.7 million customers (48,470 Gigawatt Hours (“GWh”)) |
| Generation Facilities | | 56 (including 1 under construction) |
| Utilities Businesses | | 6 |
| Key Generation Businesses | | Gener, Tietê and Alicura |
| Key Utilities Businesses | | Eletropaulo and Sul |
The bar charts below shows the breakdown between our Latin America Generation and Utilities segments as a percentage of total Latin America revenue and gross margin for the years ended December 31, 2011, 2010, and 2009. See Note 16—Segment and Geographic Information in the Consolidated Financial Statements in Item 8 of this Form 8-K for information on revenue from external customers, Adjusted Gross Margin (a non-GAAP measure) and total assets by segment.
| | |
Revenue ($ in billions) 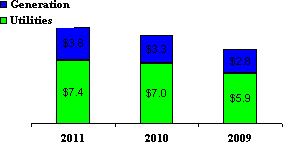
| | Gross Margin ($ in billions) 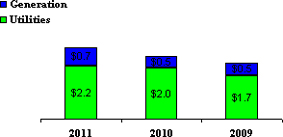
|
Latin America Generation. Our largest generation business in Latin America, AES Tietê (“Tietê”), located in Brazil, represents approximately 18% of the total generation capacity in the state of São Paulo and is the tenth largest generator in Brazil. AES holds a 24% economic interest in Tietê. In Chile, we are the second largest generator of power. We currently have one new generation plant under construction—a coal plant in Chile with a generation capacity of 270 MW.
5
Set forth below is a list of our Latin America Generation facilities:
Generation
| | | | | | | | | | | | | | | | |
Business | | Location | | Fuel | | Gross
MW | | | AES Equity
Interest
(Percent,
Rounded) | | | Year
Acquired
or Began
Operation | |
Alicura | | Argentina | | Hydro | | | 1,050 | | | | 99 | % | | | 2000 | |
Gener - TermoAndes | | Argentina | | Gas/Diesel | | | 643 | | | | 71 | % | | | 2000 | |
Los Caracoles(1) | | Argentina | | Hydro | | | 125 | | | | 0 | % | | | 2009 | |
Paraná-GT | | Argentina | | Gas/Diesel | | | 845 | | | | 99 | % | | | 2001 | |
Quebrada de Ullum(1) | | Argentina | | Hydro | | | 45 | | | | 0 | % | | | 2004 | |
Rio Juramento - Cabra Corral | | Argentina | | Hydro | | | 102 | | | | 99 | % | | | 1995 | |
Rio Juramento - El Tunal | | Argentina | | Hydro | | | 10 | | | | 99 | % | | | 1995 | |
San Juan - Sarmiento | | Argentina | | Gas/Diesel | | | 33 | | | | 99 | % | | | 1996 | |
San Juan - Ullum | | Argentina | | Hydro | | | 45 | | | | 99 | % | | | 1996 | |
San Nicolás | | Argentina | | Coal/Gas/Oil | | | 675 | | | | 99 | % | | | 1993 | |
Tietê(2) | | Brazil | | Hydro | | | 2,659 | | | | 24 | % | | | 1999 | |
Uruguaiana | | Brazil | | Gas | | | 639 | | | | 46 | % | | | 2000 | |
Gener - Electrica Angamos | | Chile | | Coal | | | 545 | | | | 71 | % | | | 2011 | |
Gener - Electrica Santiago(3) | | Chile | | Gas/Diesel | | | 479 | | | | 64 | % | | | 2000 | |
Gener - Electrica Ventanas(4) | | Chile | | Coal | | | 272 | | | | 71 | % | | | 2010 | |
Gener - Gener(5) | | Chile | | Hydro/Coal/Diesel/Biomass | | | 1,003 | | | | 71 | % | | | 2000 | |
Gener - Guacolda(6),(7) | | Chile | | Coal/Pet Coke | | | 608 | | | | 35 | % | | | 2000 | |
Gener - Norgener | | Chile | | Coal/Pet Coke | | | 277 | | | | 71 | % | | | 2000 | |
Chivor | | Colombia | | Hydro | | | 1,000 | | | | 71 | % | | | 2000 | |
Andres | | Dominican Republic | | Gas | | | 319 | | | | 100 | % | | | 2003 | |
Itabo(8) | | Dominican Republic | | Coal | | | 295 | | | | 50 | % | | | 2000 | |
Los Mina | | Dominican Republic | | Gas | | | 236 | | | | 100 | % | | | 1996 | |
AES Nejapa | | El Salvador | | Landfill Gas | | | 6 | | | | 100 | % | | | 2011 | |
Bayano | | Panama | | Hydro | | | 260 | | | | 49 | % | | | 1999 | |
Changuinola | | Panama | | Hydro | | | 223 | | | | 100 | % | | | 2011 | |
Chiriqui - Esti | | Panama | | Hydro | | | 120 | | | | 49 | % | | | 2003 | |
Chiriqui - La Estrella | | Panama | | Hydro | | | 48 | | | | 49 | % | | | 1999 | |
Chiriqui - Los Valles | | Panama | | Hydro | | | 54 | | | | 49 | % | | | 1999 | |
| | | | | | | | | | | | | | | | |
| | | | | | | 12,616 | | | | | | | | | |
| | | | | | | | | | | | | | | | |
| (1) | AES operates these facilities through management or operations and maintenance (“O&M”) agreements and owns no equity interest in these businesses. |
| (2) | Tietê plants: Água Vermelha, Bariri, Barra Bonita, Caconde, Euclides da Cunha, Ibitinga, Limoeiro, Mog-Guaçu, Nova Avanhandava, Promissão, Sao Joaquim and seven other small hydroelectric plants below Tietê’s wholly-owned subsidiary “PCH Minas Ltda”. |
| (3) | Gener—Electrica Santiago plants: Nueva Renca and Renca. |
| (4) | Gener—Electrica Ventanas plant: Nueva Ventanas. |
| (5) | Gener—Gener plants: Alfalfal, Constitución, Laguna Verde, Laguna Verde Turbogas, Laja, Los Vientos, Maitenas, Queltehues, San Francisco de Mostazal, Santa Lidia, Ventanas and Volcán. |
| (6) | Gener—Guacolda plants: Guacolda 1, Guacolda 2, Guacolda 3 and Guacolda 4. |
| (7) | Unconsolidated entities for which the results of operations are reflected in Equity in Earnings of Affiliates. |
| (8) | Itabo plants: Itabo complex (two coal-fired steam turbines and one gas-fired steam turbine). |
6
Generation under construction
| | | | | | | | | | | | | | | | |
Business | | Location | | Fuel | | Gross
MW | | | AES Equity
Interest
(Percent,
Rounded) | | | Expected
Year of
Commercial
Operations | |
Campiche | | Chile | | Coal | | | 270 | | | | 71 | % | | | 2013 | |
Latin America Utilities. Each of our Utilities businesses in Latin America sells electricity under regulated tariff agreements and has transmission and distribution capabilities but none of them has generation capability. AES Eletropaulo, a consolidated subsidiary of which AES owns a 16% economic interest and which has served the São Paulo, Brazil area for over 100 years, has approximately six million customers and is the largest electricity distribution company in Latin America in terms of revenue and electricity distributed. Pursuant to its concession agreement, AES Eletropaulo is entitled to distribute electricity in its service area until 2028. AES Eletropaulo’s service territory consists of 24 municipalities in the greater São Paulo metropolitan area and adjacent regions that account for approximately 17% of Brazil’s GDP and 40% of the population in the State of São Paulo. AES Sul (“Sul”), a wholly-owned subsidiary, serves over one million customers.
Set forth below is a list of our Latin America Utilities facilities:
Distribution
| | | | | | | | | | | | | | | | | | |
Business | | Location | | Approximate Number
of Customers Served as
of 12/31/2011 | | | GWh
Sold in
2011 | | | AES Equity
Interest
(Percent,
Rounded) | | | Year
Acquired | |
Eletropaulo | | Brazil | | | 6,348,000 | | | | 36,817 | | | | 16 | % | | | 1998 | |
Sul | | Brazil | | | 1,260,000 | | | | 8,223 | | | | 100 | % | | | 1997 | |
CAESS | | El Salvador | | | 516,000 | | | | 2,060 | | | | 75 | % | | | 2000 | |
CLESA | | El Salvador | | | 304,000 | | | | 786 | | | | 64 | % | | | 1998 | |
DEUSEM | | El Salvador | | | 62,000 | | | | 108 | | | | 74 | % | | | 2000 | |
EEO | | El Salvador | | | 229,000 | | | | 476 | | | | 89 | % | | | 2000 | |
| | | | | | | | | | | | | | | | | | |
| | | | | 8,719,000 | | | | 48,470 | | | | | | | | | |
| | | | | | | | | | | | | | | | | | |
North America
Our North America operations accounted for 15%, 16% and 18% of consolidated revenue in 2011, 2010 and 2009, respectively. The following table provides highlights of our North America operations:
| | |
| Countries | | U.S., Puerto Rico and Mexico |
| Generation Capacity | | 15,756 Gross MW |
| Utilities Penetration | | 970,000 customers (16,890 GWh) |
| Generation Facilities | | 15 |
| Utilities Businesses | | 2 integrated utilities (includes 18 generation plants) |
| Key Generation Businesses | | Southland and TEG/TEP |
| Key Utilities Businesses | | IPL, DPL (Since November 28, 2011) |
The bar charts below shows the breakdown between our North America Generation and Utilities segments as a percentage of total North America revenue and gross margin for the years ended December 31, 2011, 2010 and 2009. See Note 16—Segment and Geographic Information in the Consolidated Financial Statements in Item 8 of this Form 8-K for information on revenue from external customers, Adjusted Gross Margin (a non-GAAP measure) and total assets by segment.
7
| | |
Revenue ($ in billions) 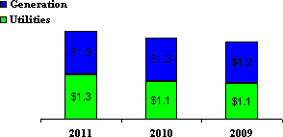
| | Gross Margin ($ in millions) 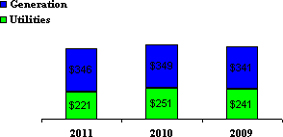
|
North America Generation. Approximately 92% of the generation capacity is supported by long-term power purchase or tolling agreements. Our North America Generation business consists of seven gas-fired, five coal-fired and three petroleum coke-fired plants in the United States, Puerto Rico, Mexico, and Trinidad.
Our largest generation business is AES Southland. This business operates three gas-fired plants, representing generation capacity of 3,853 MW, in the Los Angeles basin under a long-term tolling agreement. Other significant generation facilities include TEG and TEP, which represent a total of 460 MW of long-term contracted generation capacity in Mexico.
Set forth below is a list of our North America Generation facilities:
Generation
| | | | | | | | | | | | | | | | |
Business | | Location | | Fuel | | Gross
MW | | | AES Equity
Ownership
(Percent,
Rounded) | | | Year
Acquired
or Began
Operation | |
Mérida III | | Mexico | | Gas | | | 484 | | | | 55 | % | | | 2000 | |
Termoelectrica del Golfo (TEG) | | Mexico | | Pet Coke | | | 230 | | | | 99 | % | | | 2007 | |
Termoelectrica del Peñoles (TEP) | | Mexico | | Pet Coke | | | 230 | | | | 99 | % | | | 2007 | |
Trinidad | | Trinidad | | Gas | | | 394 | | | | 10 | % | | | 2011 | |
Southland - Alamitos | | USA - CA | | Gas | | | 2,047 | | | | 100 | % | | | 1998 | |
Southland - Huntington Beach | | USA - CA | | Gas | | | 430 | | | | 100 | % | | | 1998 | |
Southland - Redondo Beach | | USA - CA | | Gas | | | 1,376 | | | | 100 | % | | | 1998 | |
Hawaii | | USA - HI | | Coal | | | 203 | | | | 100 | % | | | 1992 | |
Warrior Run | | USA - MD | | Coal | | | 205 | | | | 100 | % | | | 2000 | |
Red Oak(1) | | USA - NJ | | Gas | | | 832 | | | | 100 | % | | | 2002 | |
Shady Point | | USA - OK | | Coal | | | 360 | | | | 100 | % | | | 1991 | |
Beaver Valley | | USA - PA | | Coal | | | 125 | | | | 100 | % | | | 1985 | |
Ironwood(1) | | USA - PA | | Gas | | | 710 | | | | 100 | % | | | 2001 | |
Puerto Rico | | USA - PR | | Coal | | | 454 | | | | 100 | % | | | 2002 | |
Deepwater | | USA - TX | | Pet Coke | | | 160 | | | | 100 | % | | | 1986 | |
| | | | | | | | | | | | | | | | |
| | | | | | | 8,240 | | | | | | | | | |
| | | | | | | | | | | | | | | | |
| (1) | These businesses met the held for sale criteria in February 2012 and the sale transactions subsequently closed in April 2012. The earnings from these businesses will be reported as part of discontinued operations through the dates of transaction close. See Note 22—Discontinued Operations and Held for Sale Businesses to theConsolidated Financial Statements for further information. |
8
Generation under construction
| | | | | | | | | | | | | | | | |
Business | | Location | | Fuel | | Gross
MW | | | AES Equity
Interest
(Percent,
Rounded) | | | Expected
Year of
Commercial
Operations | |
Trinidad | | Trinidad | | Gas | | | 394 | | | | 10 | % | | | 2012 | |
North America Utilities. AES has two integrated utilities in North America, IPL, which it owns through IPALCO Enterprises, Inc. (“IPALCO”), the parent holding company of IPL and The Dayton Power and Light Company (“DP&L”), which it owns through DPL Inc. (“DPL”), the parent company of DP&L. IPL generates, transmits, distributes and sells electricity to approximately 470,000 customers in the city of Indianapolis and neighboring areas within the state of Indiana. IPL owns and operates four generating stations. Two of the generating stations are primarily coal-fired stations. The third station has a combination of units that use coal (base load capacity) and natural gas and/or oil (peaking capacity) for fuel to produce electricity. The fourth station is a small peaking station that uses gas-fired combustion turbine technology for the production of electricity. IPL’s gross electric generation capacity is 3,699 MW. Approximately 45% of IPL’s coal is provided by one supplier with which IPL has long-term contracts. A key driver for the business is tariff recovery for environmental projects through the rate adjustment process. IPL’s customers include residential, industrial, commercial and all other which made up 33%, 13%, 36% and 6%, respectively, of North America Utilities revenue for 2011. The remaining 12% of North America Utilities revenue is from DPL.
DP&L generates, transmits, distributes and sells electricity to more than 500,000 customers in a 6,000 square mile area of West Central Ohio. DP&L, with certain other Ohio utilities and their affiliates, commonly owns seven coal-fired electric generating facilities and numerous transmission facilities. DP&L also has one wholly-owned coal-fired plant. DP&L is affiliated with DPL Energy, LLC (“DPLE”) which owns peaking generation units located in Ohio and Indiana. DP&L’s wholly-owned plants and share of the capacity of its jointly-owned plants and DPLE’s wholly-owned peaking units aggregates to approximately 3,817 MW. During the period November 28, 2011 through December 31, 2011, approximately 80% of DP&L’s coal was provided by four suppliers and DP&L has long-term contracts with three of them. DP&L’s customers include residential, commercial, industrial and governmental, which make up 67%, 21% and 12%, respectively, of DP&L’s revenue for the period after acquisition in November 2011.
Generation
| | | | | | | | | | | | | | | | |
Business | | Location | | Fuel | | Gross
MW | | | AES Equity
Interest
(Percent,
Rounded) | | | Year
Acquired
or Began
Operation | |
IPL(1) | | USA - IN | | Coal/Gas/Oil | | | 3,699 | | | | 100 | % | | | 2001 | |
DP&L(2) | | USA - OH | | Coal/Diesel/Solar | | | 3,817 | | | | 100 | % | | | 2011 | |
| | | | | | | | | | | | | | | | |
| | | | | | | 7,516 | | | | | | | | | |
| | | | | | | | | | | | | | | | |
| (1) | IPL plants: Eagle Valley, Georgetown, Harding Street and Petersburg. |
| (2) | DP&L wholly-owned plants: Hutchings, Tait Units 1-3 and diesels, Yankee Street, Yankee Solar, Monument and Sidney. DP&L jointly-owned plants: Beckjord Unit 6, Conesville Unit 4, East Bend Unit 2, Killen, Miami Fort Units 7 & 8, Stuart and Zimmer. In addition to the above, DP&L, also owns a 4.9% equity ownership in OVEC, an electric generating company. OVEC has two plants in Cheshire, Ohio and Madison, Indiana with a combined generation capacity of approximately 2,655 MW. DP&L’s share of this generation capacity is approximately 111 MW. DPLE plants: Tait Units 4-7 and Montpelier Units 1-4. |
9
Distribution
| | | | | | | | | | | | | | | | | | |
Business | | Location | | Approximate
Number of
Customers Served as
of 12/31/2011 | | | GWh
Sold in
2011 | | | AES Equity
Interest
(Percent,
Rounded) | | | Year
Acquired | |
IPL | | USA - IN | | | 470,000 | | | | 15,647 | | | | 100 | % | | | 2001 | |
DP&L(1) | | USA - OH | | | 500,000 | | | | 1,243 | | | | 100 | % | | | 2011 | |
| | | | | | | | | | | | | | | | | | |
| | | | | 970,000 | | | | 16,890 | | | | | | | | | |
| | | | | | | | | | | | | | | | | | |
| (1) | GWh sold from the acquisition on November 28, 2011 through December 31, 2011. |
Europe
The following table provides highlights of our Europe operations:
| | |
| Countries | | Bulgaria, Hungary, Jordan, Kazakhstan, Netherlands, Spain, Turkey, Ukraine and the United Kingdom |
| Generation Capacity | | 8,779 Gross MW |
| Utilities Penetration | | 1.8 million customers (10,862 GWh) |
| Generation Facilities | | 20 |
| Utilities Businesses | | 4 |
| Key Generation Businesses | | Maritza, Ballylumford, Kilroot |
| Key Utilities Businesses | | Kievoblenergo and Rivneenergo |
Our Utilities operations in Europe are discussed further under Corporate and Other below.
Europe Generation. Our Generation operations in Europe accounted for 9%, 8% and 6% of our consolidated revenue in 2011, 2010 and 2009, respectively. In 2011, our Maritza facility in Bulgaria, a 670 MW coal-fired plant, commenced commercial operations. As a result of the announced sale of 80% of our interest in Cartagena, a 1,199 MW gas-fired plant in Spain, we have classified Cartagena as “held for sale” on the Consolidated Balance Sheets. AES operates four power plants in Kazakhstan which account for 8% of the country’s total installed generation capacity. In the United Kingdom, we own and operate more than 1,900 MW at the Ballylumford plant and the Kilroot facility. See Note 16—Segment and Geographic Information in the Consolidated Financial Statements in Item 8 of this Form 8-K for revenue, Adjusted Gross Margin (a non-GAAP measure) and total assets by segment. Key business drivers of this segment are: foreign currency exchange rates, new legislation and regulations including those related to the environment.
Set forth below is a list of our Europe Generation facilities:
Generation
| | | | | | | | | | | | | | | | |
Business | | Location | | Fuel | | Gross
MW | | | AES Equity
Interest
(Percent,
Rounded) | | | Year
Acquired
or Began
Operation | |
Maritza | | Bulgaria | | Coal | | | 670 | | | | 100 | % | | | 2011 | |
Tisza II | | Hungary | | Gas/Oil | | | 900 | | | | 100 | % | | | 1996 | |
Amman East | | Jordan | | Gas | | | 380 | | | | 37 | % | | | 2009 | |
Shulbinsk HPP(1) | | Kazakhstan | | Hydro | | | 702 | | | | 0 | % | | | 1997 | |
Sogrinsk CHP | | Kazakhstan | | Coal | | | 301 | | | | 100 | % | | | 1997 | |
Ust - Kamenogorsk HPP(1) | | Kazakhstan | | Hydro | | | 331 | | | | 0 | % | | | 1997 | |
Ust - Kamenogorsk CHP | | Kazakhstan | | Coal | | | 1,354 | | | | 100 | % | | | 1997 | |
Elsta(2) | | Netherlands | | Gas | | | 630 | | | | 50 | % | | | 1998 | |
Cartagena(3) | | Spain | | Gas | | | 1,199 | | | | 71 | % | | | 2006 | |
Damlapinar(2),(4) | | Turkey | | Hydro | | | 16 | | | | 51 | % | | | 2010 | |
Girlevik II-Mercan(2),(4) | | Turkey | | Hydro | | | 12 | | | | 51 | % | | | 2007 | |
Kepezkaya(2),(4) | | Turkey | | Hydro | | | 28 | | | | 51 | % | | | 2010 | |
Yukari-Mercan(2),(4) | | Turkey | | Hydro | | | 14 | | | | 51 | % | | | 2007 | |
Kumkoy(2),(4) | | Turkey | | Hydro | | | 18 | | | | 51 | % | | | 2011 | |
Bursa(2),(5) | | Turkey | | Gas | | | 156 | | | | 50 | % | | | 2011 | |
Kocaeli(2),(5) | | Turkey | | Gas | | | 158 | | | | 50 | % | | | 2011 | |
Istanbul (Koc University)(2),(5) | | Turkey | | Gas | | | 2 | | | | 50 | % | | | 2011 | |
Ballylumford | | United Kingdom | | Natural Gas | | | 1,246 | | | | 100 | % | | | 2010 | |
Kilroot(6) | | United Kingdom | | Coal/Gas/Oil | | | 662 | | | | 99 | % | | | 1992 | |
| | | | | | | | | | | | | | | | |
| | | | | | | 8,779 | | | | | | | | | |
| | | | | | | | | | | | | | | | |
10
| (1) | AES operates these facilities under concession agreements until 2017. |
| (2) | Unconsolidated entities, the results of operations of which are reflected in Equity in Earnings of Affiliates. |
| (3) | In October 2011, the Company met held for sale criteria and expects to dispose of 80% of its interest in this business within the next twelve months. Until the business is sold, it will be reported as a held for sale business on the Consolidated Balance Sheets and reflected in continuing operations on the Consolidated Statements of Operations, as the Company continues to hold an ownership interest in the business. |
| (4) | Joint Venture with I.C. Energy. |
| (5) | Joint Venture with Koc Holding. |
| (6) | Includes Kilroot Open Cycle Gas Turbine (“OCGT”). |
Asia
Our Asia operations accounted for 4%, 4% and 3% of consolidated revenue in 2011, 2010 and 2009, respectively. Asia’s Generation business operates 7 power plants with a total capacity of 3,802 MW in four countries. In Asia, AES operates generation facilities only. See Note 16—Segment and Geographic Information in the Consolidated Financial Statements in Item 8 of this Form 8-K for revenue, Adjusted Gross Margin (a non-GAAP measure) and total assets by segment. The following table provides highlights of our Asia operations:
| | |
Countries | | China, India, the Philippines and Sri Lanka |
Generation Capacity | | 3,802 Gross MW |
Utilities Penetration | | None |
Generation Facilities | | 8 (including 1 under construction) |
Utilities Businesses | | None |
Key Businesses | | Masinloc, Kelanitissa and Yangcheng |
Asia Generation. More than half of our generation capacity in Asia is located in China. In 1996, AES joined with Chinese partners to build Yangcheng, the first “coal-by-wire” power plant with the generation capacity of 2,100 MW. In April 2008, the Company completed the purchase of a 92% interest in a 660 MW coal-fired thermal power generation facility in Masinloc, Philippines (“Masinloc”).
Set forth below is a list of our generation facilities in Asia:
Generation
| | | | | | | | | | | | | | | | |
Business | | Location | | Fuel | | Gross
MW | | | AES Equity
Interest
(Percent,
Rounded) | | | Year
Acquired
or Began
Operation | |
Chengdu(1) | | China | | Gas | | | 50 | | | | 35 | % | | | 1997 | |
Cili | | China | | Hydro | | | 25 | | | | 51 | % | | | 1994 | |
JHRH(1) | | China | | Hydro | | | 379 | | | | 35 | % | | | 2010 | |
Yangcheng(1) | | China | | Coal | | | 2,100 | | | | 25 | % | | | 2001 | |
OPGC(1) | | India | | Coal | | | 420 | | | | 49 | % | | | 1998 | |
Masinloc | | Philippines | | Coal | | | 660 | | | | 92 | % | | | 2008 | |
Kelanitissa | | Sri Lanka | | Diesel | | | 168 | | | | 90 | % | | | 2003 | |
| | | | | | | | | | | | | | | | |
| | | | | | | 3,802 | | | | | | | | | |
| | | | | | | | | | | | | | | | |
| (1) | Unconsolidated entities for which the results of operations are reflected in Equity in Earnings of Affiliates. |
11
Generation under construction
| | | | | | | | | | | | | | | | |
Business | | Location | | Fuel | | Gross
MW | | | AES Equity
Interest
(Percent,
Rounded) | | | Expected
Year of
Commercial
Operation | |
Mong Duong II | | Vietnam | | Coal | | | 1,200 | | | | 51 | % | | | 2015 | |
Corporate and Other
“Corporate and Other” includes the net operating results from our Utilities businesses in Africa and Europe, Africa Generation and Wind Generation and other renewables projects. These operations do not require separate segment disclosure. The following provides additional details about our Utilities businesses in Africa and Europe, Africa generation and Wind Generation, which are reported within “Corporate and Other” for financial reporting purposes.
Europe Utilities. Our distribution businesses in the Ukraine and Kazakhstan together serve approximately 1.8 million customers.
Distribution
| | | | | | | | | | | | | | | | | | |
Business | | Location | | Approximate
Number of
Customers Served as
of 12/31/2011 | | | GWh
Sold in
2011 | | | AES Equity
Interest
(Percent,
Rounded) | | | Year
Acquired | |
Eastern Kazakhstan REC(1),(2),(3) | | Kazakhstan | | | 459,000 | | �� | | 3,444 | | | | 0 | % | | | | |
Ust-Kamenogorsk Heat Nets(1),(4) | | Kazakhstan | | | 96,000 | | | | — | | | | 0 | % | | | | |
Kievoblenergo | | Ukraine | | | 874,000 | | | | 5,079 | | | | 89 | % | | | 2001 | |
Rivneenergo | | Ukraine | | | 409,000 | | | | 2,339 | | | | 84 | % | | | 2001 | |
| | | | | | | | | | | | | | | | | | |
| | | | | 1,838,000 | | | | 10,862 | | | | | | | | | |
| | | | | | | | | | | | | | | | | | |
| (1) | AES operates these businesses through management agreements and owns no equity interest in these businesses. |
| (2) | In November 2011, AES sent notification to the Kazakhstan Government regarding the early termination of the management agreement for these companies. Transfer of management rights to the Kazakhstan Government should be completed within 180 days. |
| (3) | Shygys Energo Trade, a retail electricity company, is 100% owned by Eastern Kazakhstan REC (“EK REC”) and purchases distribution service from EK REC and electricity in the wholesale electricity market and resells to the distribution customers of EK REC. |
| (4) | Ust-Kamenogorsk Heat Nets provide transmission and distribution of heat with a total heat generating capacity of 224 Gcal. |
Africa Utilities. AES owns a 56% interest in an integrated utility, Société Nationale d’Electricité (“Sonel”). Sonel generates, transmits and distributes electricity to over half a million people and is the sole distributor of electricity in Cameroon.
Set forth below is a list of the generation and distribution facilities of Sonel:
Sonel’s generation facilities
| | | | | | | | | | | | | | | | |
Business | | Location | | Fuel | | Gross
MW | | | AES Equity
Interest
(Percent,
Rounded) | | | Year
Acquired
or Began
Operation | |
Sonel(1) | | Cameroon | | Hydro/Diesel/Heavy Fuel Oil | | | 936 | | | | 56 | % | | | 2001 | |
| (1) | Sonel plants: Bafoussam, Bassa, Djamboutou, Edéa, Lagdo, Limbé, Logbaba I, Logbaba II, Oyomabang I, Oyomabang II, Song Loulou, and other small remote network units. |
12
Sonel’s distribution facility
| | | | | | | | | | | | | | | | | | |
Business | | Location | | Approximate
Number of
Customers Served as
of 12/31/2011 | | | GWh
Sold in
2011 | | | AES Equity
Interest
(Percent,
Rounded) | | | Year
Acquired | |
Sonel | | Cameroon | | | 660,000 | | | | 3,345 | | | | 56 | % | | | 2001 | |
Africa Generation. Set forth below is a list of our generation facilities in Africa:
Generation
| | | | | | | | | | | | | | | | |
Business | | Location | | Fuel | | Gross
MW | | | AES Equity
Interest
(Percent,
Rounded) | | | Year
Acquired
or Began
Operation | |
Dibamba | | Cameroon | | Heavy Fuel Oil | | | 86 | | | | 56 | % | | | 2009 | |
Ebute | | Nigeria | | Gas | | | 294 | | | | 95 | % | | | 2001 | |
| | | | | | | | | | | | | | | | |
| | | | | | | 380 | | | | | | | | | |
| | | | | | | | | | | | | | | | |
Generation under construction
| | | | | | | | | | | | | | | | |
Business | | Location | | Fuel | | Gross
MW | | | AES Equity
Interest
(Percent,
Rounded) | | | Expected
Year of
Commercial
Operations | |
Kribi | | Cameroon | | Gas | | | 216 | | | | 56 | % | | | 2013 | |
Wind Generation. We own and operate 1,616 MW of wind generation capacity and operate an additional 134 MW of capacity through operating and management agreements. Our wind business is located primarily in North America where we operate wind generation facilities that have generation capacity of 1,266 MW.
Set forth below is a list of Wind Generation facilities:
Generation
| | | | | | | | | | | | | | | | |
Business | | Location | | Power Source | | Gross
MW | | | AES Equity
Interest
(Percent,
Rounded) | | | Year
Acquired
or Began
Operation | |
St. Nikola | | Bulgaria | | Wind | | | 156 | | | | 89 | % | | | 2010 | |
Dong Qi(1),(2) | | China | | Wind | | | 49 | | | | 49 | % | | | 2010 | |
Huanghua I(1),(2) | | China | | Wind | | | 49 | | | | 49 | % | | | 2009 | |
Huanghua II(1),(2) | | China | | Wind | | | 49 | | | | 49 | % | | | 2010 | |
Hulunbeier(1),(2) | | China | | Wind | | | 49 | | | | 49 | % | | | 2008 | |
InnoVent(2),(3) | | France | | Wind | | | 75 | | | | 40 | % | | | 2003-2009 | |
St. Patrick | | France | | Wind | | | 35 | | | | 100 | % | | | 2010 | |
North Rhins | | Scotland | | Wind | | | 22 | | | | 100 | % | | | 2010 | |
Altamont | | USA - CA | | Wind | | | 40 | | | | 100 | % | | | 2005 | |
Mountain View I & II(4) | | USA - CA | | Wind | | | 67 | | | | 100 | % | | | 2008 | |
Palm Springs | | USA - CA | | Wind | | | 30 | | | | 100 | % | | | 2005 | |
Tehachapi | | USA - CA | | Wind | | | 38 | | | | 100 | % | | | 2006 | |
Storm Lake II(4) | | USA - IA | | Wind | | | 78 | | | | 100 | % | | | 2007 | |
Lake Benton I(4) | | USA - MN | | Wind | | | 106 | | | | 100 | % | | | 2007 | |
Condon(4) | | USA - OR | | Wind | | | 50 | | | | 100 | % | | | 2005 | |
Armenia Mountain(4) | | USA - PA | | Wind | | | 101 | | | | 100 | % | | | 2009 | |
Buffalo Gap I(4) | | USA - TX | | Wind | | | 121 | | | | 100 | % | | | 2006 | |
Buffalo Gap II(4) | | USA - TX | | Wind | | | 233 | | | | 100 | % | | | 2007 | |
Buffalo Gap III(4) | | USA - TX | | Wind | | | 170 | | | | 100 | % | | | 2008 | |
Laurel Mountain | | USA - WV | | Wind | | | 98 | | | | 100 | % | | | 2011 | |
Wind generation facilities(5) | | USA | | Wind | | | 134 | | | | 0 | % | | | 2005 | |
| | | | | | | | | | | | | | | | |
| | | | | | | 1,750 | | | | | | | | | |
| | | | | | | | | | | | | | | | |
13
| (1) | Joint Venture with Guohua Energy Investment Co. Ltd. |
| (2) | Unconsolidated entities for which the results of operations are reflected in Equity in Earnings of Affiliates. |
| (3) | InnoVent plants: Bignan, Chepy, Croixrault-Moyencourt, Eurotunel, Frenouville, Gapree, Grand Fougeray, Guehenno, Hargicourt, Hescamps, LePortal, Les Diagots, Nibas, Plechatel, Saint-Hilaire la Croix and Valhoun. InnoVent owns various percentages of underlying projects. |
| (4) | AES owns these assets together with third party tax equity investors with variable ownership interests. The tax equity investors receive a portion of the economic attributes of the facilities, including tax attributes that vary over the life of the projects. The proceeds from the issuance of tax equity are recorded as Noncontrolling Interest in the Company’s Consolidated Balance Sheets. |
| (5) | AES operates these facilities through management or O&M agreements and owns no equity interest in these businesses. |
Wind Generation projects under construction
| | | | | | | | | | | | | | | | |
Business | | Location | | Power Source | | Gross
MW | | | AES Equity
Interest
(Percent,
Rounded) | | | Expected
Year of
Commercial
Operation | |
InnoVent(1) | | France | | Wind | | | 39 | | | | 40 | % | | | 2012 | |
Chen Qi(2) | | China | | Wind | | | 49 | | | | 49 | % | | | 2012 | |
Saurashtra | | India | | Wind | | | 39 | | | | 100 | % | | | 2012 | |
Drone Hill | | United Kingdom | | Wind | | | 29 | | | | 100 | % | | | 2012 | |
Mountain View IV | | US-CA | | Wind | | | 49 | | | | 100 | % | | | 2012 | |
| | | | | | | | | | | | | | | | |
| | | | | | | 205 | | | | | | | | | |
| | | | | | | | | | | | | | | | |
| (1) | InnoVent plants: Allery, Audrieu, Lamballe, Lefaux and Vron. InnoVent owns various percentages of underlying projects. |
| (2) | Joint Venture with Guohua Energy Investment Co. Ltd. |
Other. AES Solar and certain other unconsolidated businesses are accounted for using the equity method of accounting. Therefore, their operating results are included in “Net Equity in Earnings of Affiliates” on the face of the Consolidated Statements of Operations, not in revenue and gross margin. AES Solar was formed in March 2008 to develop, own and operate solar installations. Since its launch, AES Solar has commenced commercial operations of 151 MW of solar projects in Bulgaria, France, Greece, Italy and Spain; and has 106 MW under construction in Bulgaria, France, Greece, India, Italy and the U.S.
“Corporate and Other” also includes costs related to corporate overhead which are not directly associated with the operations of our six reportable segments and other intercompany charges such as self-insurance premiums which are fully eliminated in consolidation. See Note 16—Segment and Geographic Information in the Consolidated Financial Statements in Item 8 of this Form 8-K for information on revenue from external customers, Adjusted Gross Margin (a non-GAAP measure) and total assets by segment.
14
Financial Data by Country
The table below presents information, by country, about our consolidated operations for each of the three years ended December 31, 2011, 2010 and 2009, respectively, and property, plant and equipment as of December 31, 2011 and 2010, respectively. Revenue is recognized in the country in which it is earned and assets are reflected in the country in which they are located.
| | | | | | | | | | | | | | | | | | | | |
| | | Revenue | | | Property, Plant &
Equipment, net | |
| | | 2011 | | | 2010 | | | 2009 | | | 2011 | | | 2010 | |
| | | (in millions) | |
United States(1) | | $ | 2,110 | | | $ | 1,952 | | | $ | 1,851 | | | $ | 7,829 | | | $ | 5,379 | |
| | | | | | | | | | | | | | | | | | | | |
Non-U.S.: | | | | | | | | | | | | | | | | | | | | |
Brazil(2) | | | 6,640 | | | | 6,355 | | | | 5,292 | | | | 5,896 | | | | 6,263 | |
Chile | | | 1,608 | | | | 1,355 | | | | 1,239 | | | | 2,781 | | | | 2,560 | |
Argentina(3) | | | 979 | | | | 771 | | | | 571 | | | | 279 | | | | 270 | |
El Salvador | | | 752 | | | | 648 | | | | 619 | | | | 268 | | | | 261 | |
Dominican Republic | | | 674 | | | | 535 | | | | 429 | | | | 662 | | | | 625 | |
United Kingdom(4) | | | 587 | | | | 364 | | | | 228 | | | | 523 | | | | 507 | |
Philippines | | | 480 | | | | 501 | | | | 250 | | | | 766 | | | | 784 | |
Ukraine | | | 418 | | | | 356 | | | | 286 | | | | 94 | | | | 86 | |
Mexico | | | 404 | | | | 409 | | | | 329 | | | | 774 | | | | 786 | |
Cameroon | | | 386 | | | | 422 | | | | 370 | | | | 901 | | | | 823 | |
Colombia | | | 365 | | | | 393 | | | | 347 | | | | 384 | | | | 387 | |
Puerto Rico | | | 298 | | | | 253 | | | | 267 | | | | 581 | | | | 596 | |
Spain(5) | | | 258 | | | | 411 | | | | — | | | | — | | | | — | |
Bulgaria(6) | | | 251 | | | | 44 | | | | — | | | | 1,619 | | | | 1,825 | |
Hungary(7) | | | 204 | | | | 252 | | | | 259 | | | | 6 | | | | 73 | |
Panama | | | 189 | | | | 194 | | | | 168 | | | | 1,040 | | | | 921 | |
Kazakhstan | | | 145 | | | | 138 | | | | 123 | | | | 86 | | | | 63 | |
Sri Lanka | | | 140 | | | | 100 | | | | 109 | | | | 22 | | | | 69 | |
Jordan | | | 124 | | | | 120 | | | | 104 | | | | 216 | | | | 224 | |
Qatar(8) | | | — | | | | — | | | | — | | | | — | | | | — | |
Pakistan(9) | | | — | | | | — | | | | — | | | | — | | | | — | |
Oman(10) | | | — | | | | — | | | | — | | | | — | | | | — | |
Other Non-U.S.(11) | | | 116 | | | | 112 | | | | 133 | | | | 395 | | | | 291 | |
| | | | | | | | | | | | | | | | | | | | |
Total Non-U.S. | | | 15,018 | | | | 13,733 | | | | 11,123 | | | | 17,293 | | | | 17,414 | |
| | | | | | | | | | | | | | | | | | | | |
Total | | $ | 17,128 | | | $ | 15,685 | | | $ | 12,974 | | | $ | 25,122 | | | $ | 22,793 | |
| | | | | | | | | | | | | | | | | | | | |
| (1) | Excludes revenue of $374 million, $662 million and $695 million for the years ended December 31, 2011, 2010 and 2009, respectively, and property, plant and equipment of $619 million and $788 million as of December 31, 2011 and 2010, respectively, related to Eastern Energy, Thames, Ironwood and Red Oak which were reflected as discontinued operations and businesses held for sale in the accompanying Consolidated Statements of Operations and Consolidated Balance Sheets. |
| (2) | Excludes revenue of $124 million, $118 million and $102 million for the years ended December 31, 2011, 2010 and 2009, respectively, and property, plant and equipment of $151 million as of December 31, 2010, related to Brazil Telecom, which was reflected as discontinued operations and businesses held for sale in the accompanying Consolidated Statements of Operations and Consolidated Balance Sheets. |
| (3) | Excludes revenue of $102 million, $116 million and $113 million for the years ended December 31, 2011, 2010 and 2009, respectively, and property, plant and equipment of $189 million as of December 31, 2010, related to our Argentina distribution businesses, which were reflected as discontinued operations and businesses held for sale in the accompanying Consolidated Statements of Operations and Consolidated Balance Sheets. |
15
| (4) | Excludes revenue of $17 million, $21 million and $11 million for the years ended December 31, 2011, 2010 and 2009, respectively, and property, plant and equipment of $20 million as of December 31, 2010, related to carbon reduction projects, which were reflected as discontinued operations and businesses held for sale in the accompanying Consolidated Statements of Operations and Consolidated Balance Sheets. |
| (5) | Excludes property, plant and equipment of $620 million and $667 million as of December 31, 2011 and 2010, respectively, related to Cartagena, which was reflected as businesses held for sale in the accompanying Consolidated Balance Sheets. |
| (6) | Maritza and our wind project in Bulgaria were under development and therefore not operational as of December 31, 2009. Our wind project in Bulgaria started operations in 2010 and Maritza started operations in June 2011. |
| (7) | Excludes revenue of $14 million, $44 million and $58 million for the years ended December 31, 2011, 2010 and 2009, respectively, and property, plant and equipment of $7 million as of December 31, 2010, related to Borsod and Tiszapalkonya, which were reflected as discontinued operations and businesses held for sale in the accompanying Consolidated Statements of Operations and Consolidated Balance Sheets. |
| (8) | Excludes revenue of $129 million and $163 million for the years ended December 31, 2010 and 2009, respectively, related to Ras Laffan, which was reflected as discontinued operations and businesses held for sale in the accompanying Consolidated Statements of Operations. |
| (9) | Excludes revenue of $299 million and $470 million for the years ended December 31, 2010 and 2009, respectively, related to Lal Pir and Pak Gen, which were reflected as discontinued operations and businesses held for sale in the accompanying Consolidated Statements of Operations. |
| (10) | Excludes revenue of $62 million and $101 million for the years ended December 31, 2010 and 2009, respectively, related to Barka, which was reflected as discontinued operations and businesses held for sale in the accompanying Consolidated Statements of Operations. |
| (11) | Excludes revenue of $1 million for the year ended December 31, 2011, and property, plant and equipment of $2 million and $18 million as of December 31, 2011, and 2010, respectively, related to alternative energy and carbon reduction projects, which were reflected as discontinued operations and businesses held for sale in the accompanying Consolidated Statements of Operations and Consolidated Balance Sheets. |
| ITEM 6. | SELECTED FINANCIAL DATA |
The following table sets forth our selected financial data as of the dates and for the periods indicated. You should read this data together with Item 7.—Management’s Discussion and Analysis of Financial Condition and Results of Operations and the Consolidated Financial Statements and the notes thereto included in Item 8 of this Form 8-K. The selected financial data for each of the years in the five year period ended December 31, 2011 have been derived from our audited Consolidated Financial Statements. Prior period amounts have been restated to reflect discontinued operations in all periods presented. Our historical results are not necessarily indicative of our future results.
Acquisitions, disposals, reclassifications and changes in accounting principles affect the comparability of information included in the tables below. Please refer to the Notes to the Consolidated Financial Statements included in Item 8.—Financial Statements and Supplementary Data of this Form 8-K for further explanation of the effect of such activities. Please also refer to Item 1A.—Risk Factors of the 2011 Form 10-K and Note 25—Risks and Uncertainties to the Consolidated Financial Statements included in Item 8 of this Form 8-K for certain risks and uncertainties that may cause the data reflected herein not to be indicative of our future financial condition or results of operations.
16
SELECTED FINANCIAL DATA
| | | | | | | | | | | | | | | | | | | | |
| | | Year Ended December 31, | |
| Statement of Operations Data | | 2011(1) | | | 2010 | | | 2009 | | | 2008 | | | 2007 | |
| | | (in millions, except per share amounts) | |
| | | | | |
Revenue | | $ | 17,128 | | | $ | 15,685 | | | $ | 12,974 | | | $ | 14,034 | | | $ | 11,739 | |
Income from continuing operations(2) | | | 1,534 | | | | 1,461 | | | | 1,798 | | | | 1,836 | | | | 552 | |
| | | | | |
Income from continuing operations attributable to The AES Corporation, net of tax | | | 451 | | | | 476 | | | | 718 | | | | 1,093 | | | | 172 | |
Discontinued operations, net of tax | | | (393 | ) | | | (467 | ) | | | (60 | ) | | | 141 | | | | (267 | ) |
Net income (loss) attributable to The AES Corporation | | $ | 58 | | | $ | 9 | | | $ | 658 | | | $ | 1,234 | | | $ | (95 | ) |
| | | | | | | | | | | | | | | | | | | | |
| | | | | |
Basic (loss) earnings per share: | | | | | | | | | | | | | | | |
Income from continuing operations attributable to The AES Corporation, net of tax | | $ | 0.58 | | | $ | 0.62 | | | $ | 1.08 | | | $ | 1.63 | | | $ | 0.26 | |
Discontinued operations, net of tax | | | (0.51 | ) | | | (0.61 | ) | | | (0.09 | ) | | | 0.21 | | | | (0.40 | ) |
| | | | | | | | | | | | | | | | | | | | |
Basic earnings (loss) per share | | $ | 0.07 | | | $ | 0.01 | | | $ | 0.99 | | | $ | 1.84 | | | $ | (0.14 | ) |
| | | | | | | | | | | | | | | | | | | | |
| | | | | |
Diluted (loss) earnings per share: | | | | | | | | | | | | | | | |
Income from continuing operations attributable to The AES Corporation, net of tax | | $ | 0.58 | | | $ | 0.62 | | | $ | 1.07 | | | $ | 1.62 | | | $ | 0.25 | |
Discontinued operations, net of tax | | | (0.51 | ) | | | (0.61 | ) | | | (0.09 | ) | | | 0.20 | | | | (0.39 | ) |
| | | | | | | | | | | | | | | | | | | | |
Diluted earnings (loss) per share | | $ | 0.07 | | | $ | 0.01 | | | $ | 0.98 | | | $ | 1.82 | | | $ | (0.14 | ) |
| | | | | | | | | | | | | | | | | | | | |
| |
| | | December 31, | |
| Balance Sheet Data: | | 2011(1) | | | 2010 | | | 2009 | | | 2008 | | | 2007 | |
| | | (in millions) | |
Total assets | | $ | 45,333 | | | $ | 40,511 | | | $ | 39,535 | | | $ | 34,806 | | | $ | 34,453 | |
Non-recourse debt (long-term) | | $ | 13,412 | | | $ | 11,084 | | | $ | 11,532 | | | $ | 10,443 | | | $ | 9,794 | |
Non-recourse debt (long-term) - Discontinued operations | | $ | 1,198 | | | $ | 1,460 | | | $ | 1,332 | | | $ | 1,426 | | | $ | 1,536 | |
Recourse debt (long-term) | | $ | 6,180 | | | $ | 4,149 | | | $ | 5,301 | | | $ | 4,994 | | | $ | 5,332 | |
Cumulative preferred stock of a subsidiary | | $ | 78 | | | $ | 60 | | | $ | 60 | | | $ | 60 | | | $ | 60 | |
Retained earnings (accumulated deficit) | | $ | 678 | | | $ | 620 | | | $ | 650 | | | $ | (8 | ) | | $ | (1,241 | ) |
The AES Corporation stockholders’ equity | | $ | 5,946 | | | $ | 6,473 | | | $ | 4,675 | | | $ | 3,669 | | | $ | 3,164 | |
| (1) | DPL was acquired on November 28, 2011 and its results of operations have been included in AES’ consolidated results of operations from the date of acquisition. See Note 23—Acquisitions and Dispositions to the Consolidated Financial Statements included in Item 8.—Financial Statements and Supplementary Data of this Form 8-K for further information. |
| (2) | Includes pretax impairment expense of $242 million, $410 million, $142 million, $175 million and $408 million for the years ended December 31, 2011, 2010, 2009, 2008 and 2007, respectively. |
| ITEM 7. | MANAGEMENT’S DISCUSSION AND ANALYSIS OF FINANCIAL CONDITION AND RESULTS OF OPERATIONS |
Overview of Our Business
We are a global power company. We operate two primary lines of business. The first is our Generation business, where we own and/or operate power plants to generate and sell power to wholesale customers such as utilities, other intermediaries and certain end-users. The second is our Utilities business, where we own and/or operate utilities which distribute, transmit and sell electricity to end-user customers in the residential, commercial, industrial and governmental sectors within a defined service area and in certain circumstances, generate and sell
17
electricity on the wholesale market. For the year ended December 31, 2011, our Generation and Utilities businesses comprised approximately 45% and 55% of our consolidated revenue, respectively. For additional information regarding our business, see Item 1.—Business of this Form 8-K.
Our wind and solar businesses are not material contributors to our operating results. For additional information regarding our business, see Item 1.—Business of this Form 8-K.
Our Organization—The management reporting structure is organized along our two lines of business—Generation and Utilities. These lines of businesses are further disaggregated geographically for management reporting. Accordingly, management’s discussion and analysis of revenue and gross margin is organized as follows:
| | • | | Generation—Latin America; |
| | • | | Generation—North America; |
| | • | | Utilities—Latin America; |
| | • | | Utilities—North America; |
As discussed in Note 16—Segment and Geographic Information, based on application of the segment accounting guidance, Tietê is reported as a separate segment for purposes of the required segment accounting disclosures, but is included in Generation—Latin America within the discussion of operating results for revenue and gross margin in management’s discussion and analysis as is it managed with the other Latin American generation businesses.
Corporate and Other—The Company’s Europe Utilities, Africa Utilities, Africa Generation, Wind Generation operating segments and climate solutions and other renewables projects are reported within “Corporate and Other” because they do not meet the criteria to allow for aggregation with another operating segment or the quantitative thresholds that would require separate disclosure under segment reporting accounting guidance. None of these operating segments are currently material to our financial statement presentation of reportable segments, individually or in the aggregate. “Corporate and Other” also includes costs related to corporate overhead which are not directly associated with the operations of our six reportable segments and other intercompany charges such as self-insurance premiums which are fully eliminated in consolidation.
Components of Revenue and Cost of Sales—Revenue includes revenue earned from the sale of energy from our utilities and the production of energy from our generation plants, which are classified as regulated and non-regulated on the Consolidated Statements of Operations, respectively. Revenue also includes the gains or losses on derivatives (including embedded derivatives other than foreign currency embedded derivatives) associated with the sale of electricity. Cost of sales includes costs incurred directly by the businesses in the ordinary course of business. Examples include electricity and fuel purchases, maintenance, operations, non-income taxes and bad debt expense and recoveries as well as depreciation and general and administrative and support costs, including employee-related costs, that are directly associated with the operations of a particular business. Cost of sales also includes the gains or losses on derivatives (including embedded derivatives other than foreign currency embedded derivatives) associated with the purchase of electricity or fuel.
Key Drivers of Our Results. Our Generation and Utilities businesses are distinguished by the nature of their customers, operational differences, cost structure, regulatory environment and risk exposure. As a result, each line of business has different drivers which affect operating results. Performance drivers for our Generation businesses include, among other things, plant reliability and efficiency, power prices, volume, management of fixed and variable operating costs, management of working capital including collection of receivables, and the extent to which our plants have hedged their exposure to currency and commodities such as fuel. For our Generation businesses which sell power under short-term contracts or in the spot market, the most crucial factors are the current market price of electricity and the marginal costs of production. Growth in our Generation business is largely tied to securing new PPAs, expanding capacity in our existing facilities and building or acquiring new power plants. Performance drivers for our Utilities businesses include, but are not limited to, reliability of service; management of
18
working capital, including collection of receivables; negotiation of tariff adjustments; compliance with extensive regulatory requirements; management of pension assets; and in developing countries, reduction of commercial and technical losses. The operating results of our Utilities businesses are sensitive to changes in inflation, economic growth and weather conditions in areas in which they operate. In addition to these drivers, as explained below, the Company also has exposure to currency exchange rate fluctuations.
One of the key factors which affect our Generation business is our ability to enter into contracts for the sale of electricity and the purchase of fuel used to produce that electricity. Long-term contracts are intended to reduce the exposure to volatility associated with fuel prices in the market and the price of electricity by fixing the revenue and costs for these businesses. The majority of the electricity produced by our Generation businesses is sold under long-term contracts, or PPAs, to wholesale customers. In turn, most of these businesses enter into long-term fuel supply contracts or fuel tolling arrangements where the customer assumes full responsibility for purchasing and supplying the fuel to the power plant. While these long-term contractual agreements reduce exposure to volatility in the market price for electricity and fuel, the predictability of operating results and cash flows vary by business based on the extent to which a facility’s generation capacity and fuel requirements are contracted and the negotiated terms of these agreements. Entering into these contracts exposes us to counterparty credit risk. For further discussion of these risks, see “Supplier and/or customer concentration may expose the Company to significant financial credit or performance risks.” in Item 1A.—Risk Factors of the 2011 Form 10-K.
When fuel costs increase, many of our businesses are able to pass these costs on to their customers. Generation businesses with long-term contracts in place do this by including fuel pass-through or fuel indexing arrangements in their contracts. Utilities businesses can pass costs on to their customers through increases in current or future tariff rates. Therefore, in a rising fuel cost environment, the increased fuel costs for these businesses often result in an increase in revenue to the extent these costs can be passed through (though not necessarily on a one-for-one basis). Conversely, in a declining fuel cost environment, the decreased fuel costs can result in a decrease in revenue. Increases or decreases in revenue at these businesses that have the ability to pass through costs to the customer have a corresponding impact on cost of sales, to the extent the costs can be passed through, resulting in a limited impact on gross margin, if any. Although these circumstances may not have a large impact on gross margin, they can significantly affect gross margin as a percentage of revenue. As a result, gross margin as a percentage of revenue is a less relevant measure when evaluating our operating performance. To the extent our businesses are unable to pass through fuel cost increases to their customers, gross margin may be adversely affected.
Global diversification also helps us mitigate risk. Our presence in mature markets helps mitigate the exposure associated with our businesses in emerging markets. Additionally, our portfolio employs a broad range of fuels, including coal, gas, fuel oil, water (hydroelectric power), wind and solar, which reduces the risks associated with dependence on any one fuel source. However, to the extent the mix of fuel sources enabling our generation capabilities in any one market is not diversified, the spread in costs of different fuels may also influence the operating performance and the ability of our subsidiaries to compete within that market. For example, in a market where gas prices fall to a low level compared to coal prices, power prices may be set by low gas prices which can affect the profitability of our coal plants in that market. In certain cases, we may attempt to hedge fuel prices to manage this risk, but there can be no assurance that these strategies will be effective.
We also attempt to limit risk by hedging much of our interest rate and commodity risk, and by matching the currency of most of our subsidiary debt to the revenue of the underlying business. However, we only hedge a portion of our currency and commodity risks, and our businesses are still subject to these risks, as further described in Item 1A.—Risk Factors of the 2011 Form 10-K, “We may not be adequately hedged against our exposure to changes in commodity prices or interest rates.” Commodity and power price volatility could continue to impact our financial metrics to the extent this volatility is not hedged. For a discussion of our sensitivities to commodity, currency and interest rate risk, see Item 7A.—Quantitative and Qualitative Disclosures About Market Risk of the 2011 Form 10-K.
Due to our global presence, the Company has significant exposure to foreign currency fluctuations. The exposure is primarily associated with the impact of the translation of our foreign subsidiaries’ operating results from their local currency to U.S. dollars that is required for the preparation of our consolidated financial statements. Additionally, there is a risk of transaction exposure when an entity enters into transactions, including debt agreements, in currencies other than their functional currency. These risks are further described in Item 1A.—Risk Factors of the 2011 Form 10-K, “Our financial position and results of operations may fluctuate significantly due to fluctuations in currency exchange rates experienced at our foreign operations.” In the year ended December 31,
19
2011, changes in foreign currency exchange rates have had a significant impact on our operating results. If the current foreign currency exchange rate volatility continues, our gross margin and other financial metrics could be affected.
Another key driver of our results is our ability to bring new businesses into commercial operations successfully and to integrate acquisitions. We currently have approximately 2,391 MW of projects under construction in nine countries. Our prospects for increased operating results and cash flows are dependent upon successful completion of these projects on time and within budget. However, as disclosed in Item 1A.—Risk Factors of the 2011 Form 10-K, “Our business is subject to substantial development uncertainties,” construction is subject to a number of risks, including risks associated with site identification, financing and permitting and our ability to meet construction deadlines. Delays or the inability to complete projects and commence commercial operations can result in increased costs, impairment of assets and other challenges involving partners and counterparties to our construction agreements, PPAs and other agreements. Similarly, failure to integrate acquisitions and manage market risk, including the Company’s recent acquisition of DPL, could impact our future operating results as disclosed in Item 1A.—Risk Factors of the 2011 Form 10-K, “After completion of the DPL acquisition, the Company, may fail to realize the anticipated benefits and cost savings of the acquisition, which could adversely affect the value of the Company’s common stock” andKey Trends and Uncertainties—Goodwill, below.
Our gross margin is also impacted by the fact that in each country in which we conduct business, we are subject to extensive and complex governmental regulations such as regulations governing the generation and distribution of electricity, and environmental regulations which affect most aspects of our business. Regulations differ on a country by country basis (and even at the state and local municipality levels) and are based upon the type of business we operate in a particular country, and affect many aspects of our operations and development projects. Our ability to negotiate tariffs, enter into long-term contracts, pass through costs related to capital expenditures and otherwise navigate these regulations can have an impact on our revenue, costs and gross margin. Environmental and land use regulations, including existing and proposed regulation of GHG emissions, could substantially increase our capital expenditures or other compliance costs, which could in turn have a material adverse effect on our business and results of operations. For a further discussion of the Regulatory Environment, see Item 1.—Business—Regulatory Matters—Environmental and Land Use Regulations and Item 1A.—Risk Factors—Risks Associated with Government Regulation and Laws of the 2011 Form 10-K.
Management’s Priorities
Management has re-evaluated its priorities following the appointment of its new CEO in September 2011. Management is focused on the following priorities:
| | • | | Execution of our geographic concentration strategy to maximize shareholder value through disciplined capital allocation including: |
| | • | | platform expansion in Brazil, Chile, Colombia, and the United States, |
| | • | | platform development in Turkey, Poland, and the United Kingdom, |
| | • | | corporate debt reduction, and |
| | • | | a return of capital to shareholders, including our intent to initiate a dividend in 2012; |
| | • | | Closing the sales of businesses for which we have signed agreements with counterparties and prudently exiting select non-strategic markets; |
| | • | | Optimizing profitability of operations in the existing portfolio; |
| | • | | Integration of DPL into our portfolio; |
| | • | | Implementing a management realignment of our businesses under two business lines: Utilities and Generation, and achieving cost savings through the alignment of overhead costs with business requirements, systems automation and optimal allocation of business development spending; and |
20
| | • | | Completion of an approximately 2,400 MW construction program and the integration of new projects into existing businesses. During the year ended December 31, 2011, the following projects commenced commercial operations: |
| | | | | | | | | | | | |
Project | | Location | | Fuel | | Gross
MW | | | AES Equity
Interest
(Percent,
Rounded) | |
| | | | |
AES Solar(1) | | Various | | Solar | | | 62 | | | | 50 | % |
Angamos | | Chile | | Coal | | | 545 | | | | 71 | % |
Changuinola | | Panama | | Hydro | | | 223 | | | | 100 | % |
Kumkoy(2) | | Turkey | | Hydro | | | 18 | | | | 51 | % |
Laurel Mountain | | US-WV | | Wind | | | 98 | | | | 100 | % |
Maritza | | Bulgaria | | Coal | | | 670 | | | | 100 | % |
Sao Joaquim | | Brazil | | Hydro | | | 3 | | | | 24 | % |
Trinidad(3) | | Trinidad | | Gas | | | 394 | | | | 10 | % |
| (1) | AES Solar Energy Ltd. is a Joint Venture with Riverstone Holdings and is accounted for as an equity method investment. Plants that came online during the year include: Kalipetrovo, Ugento, Soemina, Francavilla Fontana, Latina, Cocomeri, Francofonte, Scopeto, Sabaudia, Aprilla-1, Siracusa 1-3 Complex, Manduria Apollo and Rinaldone. |
| (2) | Joint Venture with I.C. Energy. |
| (3) | An equity method investment held by AES. |
Key Trends and Uncertainties
Our operations continue to face many risks as discussed in Item 1A.—Risk Factors of the 2011 Form 10-K. Some of these challenges are also described below in “Key Drivers of Results in 2011”. We continue to monitor our operations and address challenges as they arise.
Operations
In August 2010, the Esti power plant, a 120 MW run-of-river hydroelectric power plant in Panama, was taken offline due to damage to its tunnel infrastructure. AES Panama is partially covered for business interruption losses and property damage under existing insurance programs. The Esti power plant is currently being repaired and is projected to resume operations by the second quarter of 2012. However, due to the inherent uncertainties associated with construction, it is possible that commercial operations may resume after this timeframe which could impact our results for 2012.
Regulatory tariff revisions have a potential to adversely impact the results of our utility businesses. For example, Eletropaulo, our utility business in Brazil, is currently billing its customers under the pre-existing tariff as required by the regulator. In July 2011, the regulator postponed the review and reset of Eletropaulo’s regulated tariff, which includes a tariff component that determines the margin Eletropaulo is allowed to earn. The review and reset of the regulated tariff is performed every four years. Management believes that it is probable that the new tariff rate will be lower than the current tariff rate, resulting in future refunds to customers, and based on its best estimate continues to record the amount of estimated future refunds as a reduction of revenue and a regulatory liability. The estimate is sensitive to the key assumption regarding the regulatory asset base that will be used by the regulator to determine the return included in the revised tariff. This assumption is subject to ongoing discussions with the regulator. As the periodic review and reset process progresses with the regulator into 2012, it is at least reasonably possible that the estimated amount of refunds will change in amounts that could require more refunds than we currently expect, in amounts that could be material.
See Item 1—Business—Regulatory Matters—United States—The Dayton Power and Light Company included in the 2011 Form 10-K for further information regarding DPL’s expected filing with PUCO to propose either a new ESP or MRO to be effective January 1, 2013. The outcome of the proceeding could have a material impact on our results.
Global Economic Considerations
During the past few years, economic conditions in some countries where our subsidiaries conduct business have deteriorated. Global economic conditions remain volatile and could have an adverse impact on our businesses in the event these recent trends continue.
21
Our business or results of operations could be impacted if we or our subsidiaries are unable to access the capital markets on favorable terms or at all, are unable to raise funds through the sale of assets or are otherwise unable to finance or refinance our activities. At this time, the Euro Zone continues to face a sovereign debt crisis, the impacts of which are described below. The Company could also be adversely affected if capital market disruptions result in increased borrowing costs (including with respect to interest payments on the Company’s or our subsidiaries’ variable rate debt) or if commodity prices affect the profitability of our plants or their ability to continue operations.
In addition, in recent months, global economic sentiment has indicated that there is a possibility of global economic slowdown in the coming months. The Company could be adversely affected if general economic or political conditions in the markets where our subsidiaries operate deteriorate, resulting in a reduction in cash flow from operations, a reduction in the availability and/or an increase in the cost of capital, or if the value of our assets remain depressed or declines further. Any of the foregoing events or a combination thereof could have a material impact on the Company, its results of operations, liquidity, financial covenants, and/or its credit rating.
Our subsidiaries are subject to credit risk, which includes risk related to the ability of counterparties (such as parties to our PPAs, fuel supply agreements, hedging agreements and other contractual arrangements) to deliver contracted commodities or services at the contracted price or to satisfy their financial or other contractual obligations. The Company has not suffered any material effects related to its counterparties during the year ended December 31, 2011. However, if macroeconomic conditions impact our counterparties, they may be unable to meet their commitments which could result in the loss of favorable contractual positions, which could have a material impact on our business.
Euro Zone Debt Crisis. During the past year, certain European Union countries have continually faced a sovereign debt crisis and it is possible that this crisis could spread to other countries. This crisis has resulted in an increased risk of default by governments and the implementation of austerity measures in certain countries. If the crisis continues, worsens, or spreads, there could be a material adverse impact on the Company. Our businesses may be impacted if they are unable to access the capital markets, face increased taxes or labor costs, or if governments fail to fulfill their obligations to us or adopt austerity measures which adversely impact our projects. At December 31, 2011, the Company had unfunded commitments from European banks for our corporate revolver and for certain project finance debt totaling $142 million and $728 million, respectively. Approximately 7% of the non-recourse debt held by subsidiaries was denominated in Euros and 15% of our variable rate debt was indexed to Euribor at December 31, 2011. In addition, as discussed in Item 1A.—Risk Factors—Our renewable energy projects and other initiatives face considerable uncertainties including development, operational and regulatory challenges of the 2011 Form 10-K, our renewables businesses are dependent on favorable regulatory incentives, including subsidies, which are provided by sovereign governments, including European governments. If these subsidies or other incentives are reduced or repealed, or sovereign governments are unable or unwilling to fulfill their commitments or maintain favorable regulatory incentives for renewables, in whole or in part, this could impact the ability of the affected businesses to continue to sustain and/or grow their operations. For example, in 2011, tariffs for certain of our European solar businesses were reduced, and could be reduced further. The Company’s investment in AES Solar Energy Ltd., whose primary operations are in Europe, was $225 million at December 31, 2011. During the year ended December 31, 2011, in connection with the tariff decreases, AES Solar Energy Ltd. recognized an impairment charge of $20 million on its assets, of which AES’s share was $10 million. In addition, any of the foregoing could also impact contractual counterparties of our subsidiaries in core power or renewables. If such counterparties are adversely impacted, then they may be unable to meet their commitments to our subsidiaries. For example, our investments in Bulgaria rely on offtaker contracts from NEK, a fully state-owned entity. The Company has assets of $1.2 billion in Bulgaria. For further information on the importance of long-term contracts and our counterparty credit risk, see Item 1A.—Risk Factors—“We may not be able to enter into long-term contracts, which reduce volatility in our results of operations…” of the 2011 Form 10-K. As a result of any of the foregoing events, we may have to provide loans or equity to support affected businesses or projects, restructure them, write down their value and/or face the possibility that these projects cannot continue operations or provide returns consistent with our expectations, any of which could have a material impact on the Company.
As noted in Item 1A—Risk Factors—“We may not be adequately hedged against our exposure to changes in commodity prices or interest rates” in the 2011 Form 10-K, Item 7—Management’s Discussion and Analysis,Key Drivers of Results in 2011 of this Form 8-K, and Item 7A.—Quantitative and Qualitative Disclosures About Market Risk—Commodity Price Risk of the 2011 Form 10-K, the Company’s North American businesses continue to face pressure as a result of high coal prices relative to natural gas, which has affected the results of certain of our coal
22
plants in the region, particularly those which are merchant plants that are exposed to market risk and those that have hybrid merchant risk, meaning those businesses that have a PPA in place, but purchase fuel at market prices or under short term contracts. In 2011, AES Thames, LLC (“Thames”), our 208 MW coal-fired plant in Connecticut, and Eastern Energy, our coal-fired plants in New York; filed for bankruptcy and are no longer in our portfolio of businesses. In connection with the recent Eastern Energy bankruptcy filing, it is possible that creditors may attempt to bring claims against Eastern Energy and or directly against the AES Corporation. While we believe Eastern Energy and The AES Corporation would have meritorious defenses against any such claims, there can be no assurance that Eastern Energy or the AES Corporation would prevail in such claims. At this time, AES Deepwater has been idled to mitigate operating risks caused by high fuel costs and other competitive pressures. If the conditions described above continue or worsen, our North American businesses with market or hybrid merchant exposure may need to restructure their obligations or seek additional funding (including from the Parent) or face the possibility that they may be unable to meet their obligations and continue operations, which could result in the loss of earnings or cash flow or result in a write down in the value of these assets, any of which could have a material impact on the Company. For further discussion of the risks associated with commodity prices, see Item 1A.—Risk Factors “We may not be adequately hedged against our exposure to changes in commodity prices or interest rates.” of the 2011 Form 10-K.
If global economic conditions worsen, it could also affect the prices we receive for the electricity we generate or transmit. Utility regulators or parties to our generation contracts may seek to lower our prices based on prevailing market conditions as PPAs, concession agreements or other contracts come up for renewal or reset. In addition, rising fuel and other costs coupled with contractual price or tariff decreases could restrict our ability to operate profitably in a given market. Each of these factors, as well as those discussed above, could result in a decline in the value of our assets including those at the businesses we operate, our equity investments and projects under development and could result in asset impairments that could be material to our operations. We continue to monitor our projects and businesses.
Impairments
Long-lived assets. The global economic conditions and other adverse factors discussed above heighten the risk of significant asset impairment. The Company continues to evaluate the impact of economic conditions on the fair value of our long-lived assets on an ongoing basis. Examples of conditions that could be indicative of impairment which would require us to evaluate the recovery of a long-lived asset or asset group include:
| | • | | current period operating or cash flow losses combined with a history of operating or cash flow losses or a projection that demonstrates continuing losses associated with the use of a long-lived asset group; |
| | • | | a significant adverse change in legal factors, including changes in environmental or other regulations or in the business climate that could affect the value of a long-lived asset group, including an adverse action or assessment by a regulator; |
| | • | | a significant adverse change in the extent or manner in which a long-lived asset group is being used or in its physical condition; and |
| | • | | a current expectation that, more likely than not, a long-lived asset (asset group) will be sold or otherwise disposed of significantly before the end of its previously estimated useful life. |
During the third quarter of 2011, the Company evaluated the future use of certain wind turbines held in storage pending their installation and turbine deposits. Due to reduced wind turbine market pricing and advances in turbine technology, the Company determined that it was more likely than not the turbines would be sold before the end of their previously estimated useful lives. At the same time, the Company also concluded that it was more likely than not non-refundable deposits that it had made in prior years to a turbine manufacturer for the purchase of wind turbines were not recoverable. The Company determined it was more likely than not that it would not proceed with the purchase of these turbines due to the availability of more advanced and lower cost turbines in the market. In October 2011, the Company determined that an impairment had occurred as of September 30, 2011 and wrote down the aggregate carrying amount of $161 million of these assets to their estimated fair value of $45 million by recognizing asset impairment expense of $116 million. In January 2012, the Company forfeited the deposits for which a full impairment charge was recognized in the third quarter of 2011, and there is no obligation for further payments under the related turbine supply agreement. Additionally, the Company sold some of the turbines held in storage during the fourth quarter of 2011 and is continuing to evaluate the future use of the turbines held in storage.
23
The Company determined it is more likely than not that they will be sold, however they are not being actively marketed for sale at this time as the Company is reconsidering the potential use of the turbines in light of recent development activity at one of its advance stage development projects. It is reasonably possible that the turbines could incur further loss in value due to changing market conditions and advances in technology.
We have continued to evaluate the recoverability of our long-lived assets at Kelanitissa, our diesel-fired generation plant in Sri Lanka, as a result of both the existing government regulation which may require the government to acquire an ownership interest and the current expectation of future losses. In 2011, our evaluations indicated that the long-lived assets were not recoverable and accordingly, they were written down to their estimated fair value of $24 million based on a discounted cash flow analysis. Kelanitissa is a Build-operate-transfer (“BOT”) generation facility and payments under its PPA are scheduled to decline over the PPA term. It is possible that further impairment charges may be required in the future as Kelanitissa gets closer to the BOT date.
Equity method investments. Adverse changes in economic and business conditions could also impact the value of our equity method investments. For example, Yangcheng International Power Generating Co. Ltd (“Yangcheng”), our 2,100 MW coal-fired plant in China, which is accounted for under the equity method of accounting, continues to experience lower operating margin due to higher coal prices. The coal prices trended upward during the nine months ended September 30, 2011 and it is unlikely that the trend will reverse in the next several years. Due to the tight governmental control on the tariff, it is also difficult to pass through the increase in fuel costs to customers. At the end of the venture in 2016, AES is required to surrender its interest to other venture partners without additional compensation. During the third quarter of 2011, an other-than-temporary-impairment of $74 million was recognized to write down Yangcheng to its estimated fair value of $26 million. It is reasonably possible that further impairment expense may be required on Yangcheng or any other equity method investments if adverse changes occur in economic or business environments.
Goodwill. The Company seeks business acquisitions as one of its growth strategies. We have achieved significant growth in the past as a result of several business acquisitions, which also resulted in the recognition of goodwill. As noted in Item 1A.—Risk Factors of the 2011 Form 10-K, there is always a risk that “Our acquisitions may not perform as expected.” One of the primary factors contributing to goodwill is the synergies expected from an acquisition that follow the integration of the acquired business with the existing operations of an entity. Thus, an entity’s ability to realize benefits of goodwill depends on the successful integration of the acquired business. If such integration efforts are not successful, it could be difficult to realize the benefits of goodwill, which could result in impairment of goodwill. As described in Note 23—Acquisitions and Dispositions included in Item 8 of this Form 8-K, the Company completed the acquisition of DPL on November 28, 2011, which resulted in the provisional recognition of $ 2.5 billion of goodwill. Efforts to integrate DPL into the Company’s existing operations are ongoing and the Company’s ability to realize the benefit of DPL’s goodwill will depend on our ability to realize the expected operating synergies and manage the market risks of DPL as further described in Item 1A.—Risk Factors of the 2011 Form 10-K “After completion of the DPL acquisition, the Company may fail to realize the anticipated benefits and cost savings of the acquisition, which could adversely affect the value of the Company’s common stock.” Additionally, utilities in Ohio continue to face downward pressure on operating margins due to the evolving regulatory environment, which is moving towards a market-based competitive pricing mechanism. At the same time, the declining energy prices are also reducing operating margins across the utility industry. These competitive forces could adversely impact the future operating performance of DPL and may result in impairment of its goodwill.
The value of goodwill is also positively correlated with the economic environments in which our acquired businesses operate and a severe economic downturn could negatively impact the value of goodwill. Also, the evolving environmental regulations, including GHG regulations, around the globe continue to increase the operating costs of our generation businesses. In extreme situations, the environmental regulations could even make a once profitable business uneconomical. In addition, most of our generation businesses have a finite life and as the acquired businesses reach the end of their finite lives, the carrying amount of goodwill is gradually realized through their periodic operating results. The accounting guidance, however, prohibits the systematic amortization of goodwill and rather requires an annual impairment evaluation. Thus, as some of our acquired businesses approach the end of their finite lives, they may incur goodwill impairment charges even if there are no discrete adverse changes in the economic environment.
In the fourth quarter of 2011, the Company completed its annual goodwill impairment evaluation and did not have any reporting units that were considered “at risk”. A reporting unit is considered “at risk” when its fair value is
24
not higher than its carrying amount by more than 10%. While there were no potential impairment indicators at that time that could result in the recognition of goodwill impairment at our reporting units, it is possible we may incur goodwill impairment at our reporting units in future periods if any of the following events occur: a deterioration in general economic conditions (e.g., a recession), or the environment in which a business operates; an increased competitive environment (e.g., a new plant in the grid); a change in the market for a business’ products or services; or a regulatory or political development (e.g., changing environmental regulations on coal consumption and water intake); increases in raw materials, labor, or other costs that have a negative effect on earnings (e.g., where a business cannot pass through the increase in input costs); negative or declining cash flows or a decline in actual or planned revenue or earnings (e.g., where recent results have been worse than previously expected); a more-likely-than-not expectation of selling or disposing all, or a portion of, a reporting unit; the testing for recoverability of a significant asset group within a reporting unit; or a business reaches the end of its finite life.
The likelihood of the occurrence of these events may increase if global economic conditions remain volatile or deteriorate further. For example, during the third quarter of 2011, the Company identified higher coal prices and the resulting reduced operating margins in China as an impairment indicator of goodwill at Chigen, our wholly-owned subsidiary that holds AES’ interests in Chinese ventures. An interim evaluation of goodwill was performed at September 30, 2011 and its entire carrying amount of $17 million was recognized as a goodwill impairment.
See Note 20—Impairment Expense included in Item 8.—Financial Statements and Supplementary Data of this Form 8-K for further information.
Recent Events
Cartagena—On February 9, 2012, a subsidiary of the Company completed the sale of 80% of its interest in the wholly-owned holding company of AES Energia Cartagena S.R.L. (“AES Cartagena”), a 1,199 MW gas-fired generation business in Spain. AES owned approximately 71% of AES Cartagena through this holding company structure. Net proceeds from the sale were approximately €172 million ($229 million). The Company expects to recognize a gain on the sale transaction in the range of $163 million to $179 million during the first quarter of 2012. Under the terms of the sale agreement, Electrabel International Holdings B.V., the buyer (a subsidiary of GDF SUEZ S.A. or “GDFS”), has an option to purchase AES’ remaining 20% interest in the holding company for a fixed price of €28 million ($36 million) during a five month period beginning 13 months from February 9, 2012. Concurrent with the sale, GDFS settled the outstanding arbitration between the parties regarding certain emissions costs and other taxes that AES Cartagena sought to recover from GDFS as energy manager under the existing commercial arrangements. GDFS agreed to pay €71 million ($92 million) to AES Cartagena for such costs incurred by AES Cartagena for 2008—2010 period and for 2011 through the date of sale close, of which €28 million ($38 million) was paid at closing. See Item 3—Legal Proceedings of the 2011 Form 10-K for further information. Due to the Company’s expected continuing ownership interest extending beyond one year from the completion of the sale of its 80% interest, prior period operating results of AES Cartagena have not been reclassified as discontinued operations.
Red Oak and Ironwood—In February 2012, the Company entered into agreements to sell its interest in Red Oak and Ironwood. See Note 22—Discontinued Operations and Held for Sale Businessesto the Consolidated Financial Statements for further information.
Key Drivers of Results in 2011
In 2011, the Company’s gross margin increased $199 million, net income attributable to The AES Corporation increased $49 million and cash flow from operations decreased $581 million compared to the prior year.
During the year ended December 31, 2011, the Company benefited from new businesses including a full year of operations from Ballylumford, in Northern Ireland, which was acquired in August 2010 and the impact of Angamos I, in Chile, and Maritza, in Bulgaria, which commenced commercial operations in April and June 2011, respectively. Gener, our generation business in Chile, saw improvements over the prior year due to higher generation at the Electrica Santiago plant running on liquefied natural gas and higher contract and spot sales. These favorable results were partially offset by an unfavorable adjustment to regulatory liabilities at Eletropaulo related to the estimated impact of the July 2011 tariff reset as discussed above.
In 2012, we expect to face continued challenges at certain of our businesses.
25
| | • | | The determination of the 2011 tariff reset in Brazil has not been finalized. Although we expect the tariff to decrease, the impact on the regulatory asset base and its potential impact on our Brazilian utility, Eletropaulo, remain uncertain at this time. |
| | • | | Over the course of the second half of 2011, the marginal cost in the SING market in Chile has been impacted by the entrance of four new base load generation plants with approximately 800MW of capacity and local fuel price dynamics, negatively impacting our margin by reducing spot revenues. Furthermore, demand growth remained flat at a 3.5% growth rate similar to 2010. Marginal costs and demand projections are expected to remain at similar levels through most of 2012. |
| | • | | The Company will continue to see the adverse effects of relatively lower gas prices and a decline in power prices relative to coal. See Item 7A.—Quantitative and Qualitative Disclosures About Market Risk of the 2011 Form 10-K for more information. |
| | • | | The Company faces uncertainty over the U.S. taxation of earnings from its foreign subsidiaries following the expiration of a favorable tax provision in 2011 and expects its effective tax rate to increase, by amounts that could be material, if such provision is not renewed. |
Additional items that could impact our 2012 results are discussed inKey Trends and Uncertainties above, along with the risk factors included in Item 1A.—Risk Factors of the 2011 Form 10-K. However, management expects that improved operating performance at certain businesses, growth from newly acquired businesses and global cost reduction initiatives may lessen or offset the impact of the challenges described above. If these favorable effects do not occur, or if the challenges described above and elsewhere in this section impact us more significantly than we currently anticipate, or if volatile foreign currencies and commodities move unfavorably, then these adverse factors (or other adverse factors unknown to us) may impact our gross margin, net income attributable to The AES Corporation and cash flows.
The following briefly describes the key changes in our reported revenue, gross margin, net income attributable to The AES Corporation, net cash provided by operating activities, diluted earnings per share from continuing operations and Adjusted Earnings per Share (a non-GAAP measure) for the year ended December 31, 2011 compared to 2010 and 2009 and should be read in conjunction with ourConsolidated Results of Operations andSegment Analysis discussion withinManagement’s Discussion and Analysis of Financial Condition.
Performance Highlights
| | | | | | | | | | | | |
| | | Year Ended December 31, | |
| | | 2011 | | | 2010 | | | 2009 | |
| | | (in millions, except per share amounts) | |
Revenue | | $ | 17,128 | | | $ | 15,685 | | | $ | 12,974 | |
Gross margin | | $ | 4,070 | | | $ | 3,871 | | | $ | 3,294 | |
Net income attributable to The AES Corporation | | $ | 58 | | | $ | 9 | | | $ | 658 | |
Net cash provided by operating activities | | $ | 2,884 | | | $ | 3,465 | | | $ | 2,211 | |
Diluted earnings per share from continuing operations | | $ | 0.58 | | | $ | 0.62 | | | $ | 1.07 | |
Adjusted earnings per share (a non-GAAP measure)(1) | | $ | 1.03 | | | $ | 0.97 | | | $ | 1.05 | |
| (1) | See reconciliation and definition below underNon-GAAP Measure. |
Year Ended December 31, 2011
Revenue increased $1.4 billion, or 9%, to $17.1 billion in 2011 compared with $15.7 billion in 2010. Key drivers of the increase included:
| | • | | the favorable impact of foreign currency of $466 million; |
| | • | | the impact of new businesses including Ballylumford, in Northern Ireland and DPL in the United States, acquired in August 2010 and late November 2011, respectively, and Angamos I, in Chile, and Maritza, in Bulgaria, that commenced commercial operations in April and June 2011, respectively; |
| | • | | increased prices at our generation businesses in Argentina and at Gener, in Chile; |
26
| | • | | increased volume at our Brazilian utilities, driven by increased market demand; and |
| | • | | increased prices at our utility business in El Salvador due to higher fuel prices and drier weather. |
These increases were partially offset by:
| | • | | lower prices at Eletropaulo, our utility business in Brazil, primarily related to the estimated impact of the July 2011 tariff reset which is expected to be finalized by the Brazilian energy regulatory agency in 2012; and |
| | • | | lower volume at Cartagena, in Spain. |
Gross margin increased $199 million, or 5%, to $4.1 billion in 2011 compared with $3.9 billion in 2010. Key drivers of the increase included:
| | • | | the favorable impact of foreign currency of $112 million; |
| | • | | the impact of new businesses discussed above; |
| | • | | increased volume at Gener; |
| | • | | increased volume at our Brazilian utilities, driven by increased market demand; and |
| | • | | increased volume and prices in the Dominican Republic. |
These increases were partially offset by:
| | • | | lower prices at Eletropaulo, as discussed above; |
| | • | | the unfavorable impact of an unrealized mark-to-market derivative loss at Sonel, in Cameroon; |
| | • | | lower volume and rate in Hungary; |
| | • | | lower rate and volume at Kilroot, in Northern Ireland; and |
| | • | | an increase in global fixed costs, particularly at our Latin American generation businesses. |
Net income attributable to The AES Corporation increased $49 million to $58 million in 2011, compared to $9 million in 2010. Key drivers of the increase included:
| | • | | an increase in gross margin as described above; |
| | • | | a decrease in asset impairment expense due to higher prior year impairments related to the Southland generation facility offset primarily by current year impairments on wind turbines and deposits; and |
| | • | | a decrease in losses from discontinued operations primarily related to a gain on sale of Brazil Telecom in 2011 partially offsetting a loss on disposal of our Argentina distribution businesses and losses at other discontinued businesses compared to a significant impairment recorded at New York in 2010. |
This increase was partially offset by:
| | • | | an increase in interest expense due to increased debt and fees related to the DPL acquisition, reduced interest capitalization at Maritza due to commencement of operations in June 2011, and an unfavorable impact of foreign currency translation in Brazil; and |
| | • | | a decrease in net equity in earnings of affiliates partially offset by income tax expense related to the sale of the Company’s indirect investment in Companhia Energética de Minas Gerais (“CEMIG”). |
Net cash provided by operating activities decreased $581 million, or 17%, to $2.9 billion in 2011 compared with $3.5 billion in 2010. This net decrease was primarily due to the following:
| | • | | a decrease of $354 million at our Latin American utilities businesses primarily driven by our businesses in Brazil due to higher income tax payments of which $84 million is due to the sale of Brazil Telecom in October 2011, for which the pre-tax net sales proceeds of $890 million are recorded in cash flows from investing activities, and a one-time cash savings of $107 million mainly related to the utilization of a tax credit received as a result of the REFIS program in 2010, lower accounts receivable collections at Eletropaulo and higher payments for energy purchases, operation and maintenance expenses and pension contributions. These impacts were partially offset by higher accounts receivable collections at Sul; |
27
| | • | | a decrease of $145 million at our North America generation businesses primarily due to reduced operations in New York prior to its deconsolidation in December 2011 and higher working capital requirements at Puerto Rico, partially offset by the deconsolidation of Thames; and |
| | • | | a decrease of $56 million at Masinloc in the Philippines due to lower gross margin. |
Although net income for the period increased $471 million for 2011, net cash provided by operating activities decreased $581 million during 2011. Included in net income for each period are items such as impairments and losses from discontinued operations, which have both decreased in 2011, which have contributed to the increase in net income for the period, but are largely excluded from net cash provided by operating activities because they are non-cash in nature or the underlying cash activity is appropriately classified as an investing or financing activity. Also, net cash provided by operating activities in 2010 was impacted by certain non-recurring items, as discussed above, which were not expected to recur in 2011. The Company does not expect a further decrease in net cash provided by operating activities to continue in 2012, when compared to 2011, however, it can provide no assurance that such trend will not continue.
Year Ended December 31, 2010
Revenue increased $2.7 billion, or 21%, to $15.7 billion in 2010 compared with $13.0 billion in 2009. Key drivers of the increase included:
| | • | | the favorable impact of foreign currency of $802 million; |
| | • | | increased volume and rates at our Brazilian utilities attributable to increased demand due to the recovery of the local economy and the favorable impact of the June 2009 tariff reset; |
| | • | | the impact of the consolidation of Cartagena, in Spain, in accordance with the new consolidation accounting guidance which became effective January 1, 2010; |
| | • | | the favorable impact of rates at our generation businesses in Argentina; |
| | • | | higher generation rates and volume at Masinloc in the Philippines; |
| | • | | higher demand at Gener in Chile; |
| | • | | the impact of the Company’s new business in Northern Ireland, acquired in August 2010; |
| | • | | higher demand and rates at Indianapolis Power and Light; and |
| | • | | higher volume in Ukraine. |
Gross margin increased $577 million, or 18%, to $3.9 billion in 2010 compared with $3.3 billion in 2009. Key drivers of the increase included:
| | • | | the favorable impact of foreign currency of $212 million; |
| | • | | an increase in demand at our generation and utilities businesses in Latin America; |
| | • | | higher generation rates and volume at Masinloc in the Philippines; and |
| | • | | the impact of the consolidation of Cartagena, in Spain, in accordance with the new consolidation accounting guidance which became effective January 1, 2010. |
These increases were partially offset by an increase in fixed costs in Latin America, largely driven by bad debt recoveries and a reduction in bad debt expense in Brazil in 2009 that did not recur.
Net income attributable to The AES Corporation decreased $649 million to $9 million in 2010, compared to $658 million in 2009. Key drivers of the decrease included:
| | • | | impairment losses in New York related to our Eastern Energy facilities (whose results of operations are included in discontinued operations), in California related to our Southland (Huntington Beach) generation facility, in Hungary related to our Tisza II generation facility and in Texas related to our Deepwater facility; |
28
| | • | | a decrease in gain on sale of investments due to the sale of our businesses in Northern Kazakhstan which occurred in 2009; and |
| | • | | a decrease in other income due to the reduction in interest and penalties in 2009 associated with federal tax debts at Eletropaulo and Sul as a result of the Programa de Recuperacao Fiscal (“REFIS”) program and a favorable court decision in 2009 enabling Eletropaulo to receive reimbursement of excess non-income taxes paid from 1989 to 1992 in the form of tax credits to be applied against future tax liabilities. |
These decreases were partially offset by:
| | • | | the gain on sale of discontinued operations related to the sale of Barka which occurred in August 2010; |
| | • | | an increase in net equity in earnings of affiliates partially offset by income tax expense related to the sale of the Company’s indirect investment in CEMIG; |
| | • | | goodwill impairment of our business in Kilroot that occurred in 2009; |
| | • | | lower income tax expense due to 2010 asset impairments primarily recorded at certain U.S subsidiaries as referenced above; and |
| | • | | an increase in gross margin as described above. |
Net cash provided by operating activities increased $1.3 billion, or 57%, to $3.5 billion in 2010 compared with $2.2 billion in 2009. This net increase was primarily due to the following:
| | • | | an increase of $837 million at our Latin American utilities due to a one-time increase in tax payments in 2009 associated with a tax amnesty program of $326 million, higher working capital requirements during 2009 related to payments on the settlement of swap agreements of $65 million and in 2010, net cash provided by operating activities benefited from the one-time cash savings related to the utilization of tax credits received as a result of the REFIS program, as well as a $50 million decrease in employer contributions to pension plans and lower payments for contingencies; |
| | • | | an increase of $215 million at our Latin American generation businesses due to the higher gross margin in 2010 combined with improved working capital mainly as a result of higher collections of value added taxes and accounts receivable; |
| | • | | an increase of $99 million at Masinloc in the Philippines due to higher gross margin; and |
| | • | | an increase of $22 million as a result of the acquisition of Ballylumford in Northern Ireland. |
These increases were partially offset by a decrease of $196 million in operating cash flows from discontinued operations compared to 2009. In 2010, net cash provided by operating activities of discontinued and held for sale businesses was $111 million, including $33 million from businesses sold in 2010.
Non-GAAP Measure
We define adjusted earnings per share (“Adjusted EPS”) as diluted earnings per share from continuing operations excluding gains or losses of the consolidated entity due to (a) mark-to-market amounts related to derivative transactions, (b) unrealized foreign currency gains or losses, (c) significant gains or losses due to dispositions and acquisitions of business interests, (d) significant losses due to impairments, and (e) costs due to the early retirement of debt. The GAAP measure most comparable to Adjusted EPS is diluted earnings per share from continuing operations. AES believes that Adjusted EPS better reflects the underlying business performance of the Company and is considered in the Company’s internal evaluation of financial performance. Factors in this determination include the variability due to mark-to-market gains or losses related to derivative transactions, currency gains or losses, losses due to impairments and strategic decisions to dispose or acquire business interests or retire debt, which affect results in a given period or periods. Adjusted EPS should not be construed as an alternative to diluted earnings per share from continuing operations, which is determined in accordance with GAAP.
29
Reconciliation of Adjusted Earnings Per Share
| | | | | | | | | | | | |
| | | Year Ended December 31, | |
| | | 2011 | | | 2010 | | | 2009 | |
Diluted earnings per share from continuing operations | | $ | 0.58 | | | $ | 0.62 | | | $ | 1.07 | |
| | | |
Derivative mark-to-market (gains) losses(1) | | | 0.01 | | | | — | | | | 0.01 | |
Currency transaction (gains) losses(2) | | | 0.04 | | | | (0.05 | ) | | | (0.05 | ) |
Disposition/acquisition (gains) losses | | | — | | | | — | (3) | | | (0.19 | )(4) |
Impairment losses | | | 0.36 | (5) | | | 0.37 | (6) | | | 0.21 | (7) |
Debt retirement (gains) losses | | | 0.04 | (8) | | | 0.03 | (9) | | | — | |
| | | | | | | | | | | | |
Adjusted earnings per share | | $ | 1.03 | | | $ | 0.97 | | | $ | 1.05 | |
| | | | | | | | | | | | |
| (1) | Derivative mark-to-market (gains) losses were net of income tax per share of $0.01, $0.00 and $0.00 in 2011, 2010 and 2009, respectively. |
| (2) | Unrealized foreign currency transaction (gains) losses were net of income tax per share of $0.00, ($0.01) and $0.01 in 2011, 2010 and 2009, respectively. |
| (3) | The Company did not adjust for the gain or the related tax effect from the sale of its indirect investment in CEMIG, disclosed in Note 7—Investments in and Advances to Affiliates included in Item 8 of this Form 8-K, in its determination of Adjusted EPS because the gain was recognized by an equity method investee. The Company does not adjust for transactions of its equity method investees in its determination of adjusted EPS. |
| (4) | Amount includes: Kazakhstan gain of $98 million, or $0.15 per share, related to the termination of a management agreement as well as a gain of $13 million, or $0.02 per share, related to the reversal of a withholding tax contingency. In addition, there was a gain on sale associated with the shutdown of the Hefei plant in China of $14 million, or $0.02 per share. There were no taxes associated with any of these transactions. |
| (5) | Amount includes asset impairments, equity method investment impairments and a goodwill impairment. Asset impairments primarily includes impairments of wind turbines and deposits of $116 million ($75 million, or $0.10 per share, net of income taxes), Tisza II of $52 million ($50 million, or $0.06 per share, net of income taxes), Kelanitissa of $42 million ($38 million, or $0.05 per share, net of non-controlling interest), and Bohemia of $9 million, or $0.01 per share. Equity method investment impairments primarily included the impairments at Chigen, including Yangcheng, of $79 million, or $0.10 per share. Goodwill impairment at Chigen of $17 million, or $0.02 per share. |
| (6) | Amount primarily includes asset impairments at Southland (Huntington Beach) of $200 million, Tisza II of $85 million, and Deepwater of $79 million ($130 million, or $0.17 per share, $69 million, or $0.09 per share, and $51 million, or $0.07 per share, net of income tax, respectively) and goodwill impairment at Deepwater of $18 million (or $0.02 per share, with no income tax impact). |
| (7) | Amount includes: goodwill impairments at Kilroot of $118 million, or $0.18 per share, and in the Ukraine of $4 million, or $0.01 per share; write-off of development project costs in Latin America and Asia of $19 million ($11 million net of noncontrolling interests, or $0.01 per share) and an impairment of $10 million, or $0.01 per share, of the Company’s investment in a company developing “blue gas” (coal to gas) technology. There was no income tax impact associated with any of these transactions. |
| (8) | Amount includes loss on retirement of debt at Gener of $38 million ($22 million, or $0.03 per share, net of income taxes and noncontrolling interests) and at IPL of $15 million ($10 million, or $0.01 per share, net of income taxes). |
| (9) | Amount includes loss on retirement of debt at the Parent Company of $15 million, at Andres of $10 million, and at Itabo of $8 million ($10 million, or $0.01 per share, net of income tax at the Parent Company, $10 million, or $0.01 per share at Andres net of income tax, and $4 million, or $0.01 per share, net of noncontrolling interest at Itabo). |
30
Consolidated Results of Operations
| | | | | | | | | | | | | | | | | | | | |
| | | Year Ended December 31, | |
| Results of operations | | 2011 | | | 2010 | | | 2009 | | | $ change
2011 vs. 2010 | | | $ change
2010 vs. 2009 | |
| | | (in millions, except per share amounts) | |
Revenue: | | | | | | | | | | | | | | | | | | | | |
Generation - Latin America | | $ | 4,982 | | | $ | 4,281 | | | $ | 3,651 | | | $ | 701 | | | $ | 630 | |
Generation - North America | | | 1,325 | | | | 1,315 | | | | 1,249 | | | | 10 | | | | 66 | |
Generation - Europe | | | 1,550 | | | | 1,318 | | | | 762 | | | | 232 | | | | 556 | |
Generation - Asia | | | 625 | | | | 618 | | | | 375 | | | | 7 | | | | 243 | |
Utilities - Latin America | | | 7,374 | | | | 6,987 | | | | 5,877 | | | | 387 | | | | 1,110 | |
Utilities - North America | | | 1,326 | | | | 1,145 | | | | 1,068 | | | | 181 | | | | 77 | |
Corporate and Other(1) | | | 1,109 | | | | 1,053 | | | | 868 | | | | 56 | | | | 185 | |
Intersegment Eliminations(2) | | | (1,163 | ) | | | (1,032 | ) | | | (876 | ) | | | (131 | ) | | | (156 | ) |
| | | | | | | | | | | | | | | | | | | | |
Total Revenue | | $ | 17,128 | | | $ | 15,685 | | | $ | 12,974 | | | $ | 1,443 | | | $ | 2,711 | |
| | | | | | | | | | | | | | | | | | | | |
Gross Margin: | | | | | | | | | | | | | | | | | | | | |
Generation - Latin America | | $ | 1,840 | | | $ | 1,497 | | | $ | 1,357 | | | $ | 343 | | | $ | 140 | |
Generation - North America | | | 338 | | | | 347 | | | | 344 | | | | (9 | ) | | | 3 | |
Generation - Europe | | | 359 | | | | 310 | | | | 244 | | | | 49 | | | | 66 | |
Generation - Asia | | | 178 | | | | 240 | | | | 93 | | | | (62 | ) | | | 147 | |
Utilities - Latin America | | | 1,035 | | | | 1,023 | | | | 866 | | | | 12 | | | | 157 | |
Utilities - North America | | | 220 | | | | 249 | | | | 239 | | | | (29 | ) | | | 10 | |
Corporate and Other(3) | | | 78 | | | | 188 | | | | 132 | | | | (110 | ) | | | 56 | |
Intersegment Eliminations(4) | | | 22 | | | | 17 | | | | 19 | | | | 5 | | | | (2 | ) |
General and administrative expenses | | | (391 | ) | | | (391 | ) | | | (339 | ) | | | — | | | | (52 | ) |
Interest expense | | | (1,553 | ) | | | (1,451 | ) | | | (1,406 | ) | | | (102 | ) | | | (45 | ) |
Interest income | | | 400 | | | | 408 | | | | 344 | | | | (8 | ) | | | 64 | |
Other expense | | | (154 | ) | | | (234 | ) | | | (104 | ) | | | 80 | | | | (130 | ) |
Other income | | | 149 | | | | 100 | | | | 458 | | | | 49 | | | | (358 | ) |
Gain on sale of investments | | | 8 | | | | — | | | | 132 | | | | 8 | | | | (132 | ) |
Goodwill impairment | | | (17 | ) | | | (21 | ) | | | (122 | ) | | | 4 | | | | 101 | |
Asset impairment expense | | | (225 | ) | | | (389 | ) | | | (20 | ) | | | 164 | | | | (369 | ) |
Foreign currency transaction gains (losses) | | | (38 | ) | | | (33 | ) | | | 35 | | | | (5 | ) | | | (68 | ) |
Other non-operating expense | | | (82 | ) | | | (7 | ) | | | (12 | ) | | | (75 | ) | | | 5 | |
Income tax expense | | | (631 | ) | | | (575 | ) | | | (553 | ) | | | (56 | ) | | | (22 | ) |
Net equity in earnings (losses) of affiliates | | | (2 | ) | | | 183 | | | | 91 | | | | (185 | ) | | | 92 | |
| | | | | | | | | | | | | | | | | | | | |
Income from continuing operations | | | 1,534 | | | | 1,461 | | | | 1,798 | | | | 73 | | | | (337 | ) |
Income (loss) from operations of discontinued businesses | | | (90 | ) | | | (466 | ) | | | 107 | | | | 376 | | | | (573 | ) |
Gain (loss) from disposal of discontinued businesses | | | 86 | | | | 64 | | | | (150 | ) | | | 22 | | | | 214 | |
| | | | | | | | | | | | | | | | | | | | |
Net income | | | 1,530 | | | | 1,059 | | | | 1,755 | | | | 471 | | | | (696 | ) |
Noncontrolling interests: | | | | | | | | | | | | | | | | | | | | |
Income from continuing operations attributable to noncontrolling interests | | | (1,083 | ) | | | (985 | ) | | | (1,080 | ) | | | (98 | ) | | | 95 | |
Income from discontinued operations attributable to noncontrolling interests | | | (389 | ) | | | (65 | ) | | | (17 | ) | | | (324 | ) | | | (48 | ) |
| | | | | | | | | | | | | | | | | | | | |
Net income attributable to The AES Corporation | | $ | 58 | | | $ | 9 | | | $ | 658 | | | $ | 49 | | | $ | (649 | ) |
| | | | | | | | | | | | | | | | | | | | |
| | | | | |
Per Share Data: | | | | | | | | | | | | | | | | | | | | |
Basic earnings per share from continuing operations | | $ | 0.58 | | | $ | 0.62 | | | $ | 1.08 | | | $ | (0.04 | ) | | $ | (0.46 | ) |
Diluted earnings per share from continuing operations | | $ | 0.58 | | | $ | 0.62 | | | $ | 1.07 | | | $ | (0.04 | ) | | $ | (0.45 | ) |
| (1) | Corporate and Other includes revenue from our generation and utilities businesses in Africa, utilities businesses in Europe, Wind Generation and other renewables initiatives. |
| (2) | Represents inter-segment eliminations of revenue primarily related to transfers of electricity from Tietê (Generation—Latin America) to Eletropaulo (Utilities—Latin America). |
31
| (3) | Corporate and Other gross margin includes gross margin from our generation and utilities businesses in Africa, utilities businesses in Europe, Wind Generation and other renewables initiatives. |
| (4) | Inter-segment eliminations represent eliminations of revenue and gross margin among segments. |
Segment Analysis
Latin America—Generation
The following table summarizes revenue and gross margin for our Generation segment in Latin America for the periods indicated:
| | | | | | | | | | | | | | | | | | | | |
| | | For the Years Ended December 31, | |
| | | 2011 | | | 2010 | | | 2009 | | | % Change
2011 vs. 2010 | | | % Change
2010 vs. 2009 | |
| | | ($’s in millions) | |
Latin America Generation | | | | | | | | | | | | | | | | | | | | |
Revenue | | $ | 4,982 | | | $ | 4,281 | | | $ | 3,651 | | | | 16 | % | | | 17 | % |
Gross Margin | | $ | 1,840 | | | $ | 1,497 | | | $ | 1,357 | | | | 23 | % | | | 10 | % |
Fiscal Year 2011 versus 2010
Excluding the favorable impact of foreign currency translation and remeasurement of $13 million, primarily in Brazil partially offset by Argentina, generation revenue for 2011 increased $688 million, or 16%, from 2010 primarily due to:
| | • | | higher energy prices of $210 million in Argentina attributable to a price adjustment for consuming an alternate fuel; |
| | • | | new business of $175 million at Angamos in Chile; |
| | • | | higher contract and spot prices of $150 million at Gener as a result of lower water inflows in the Central Interconnected System and PPA price indexation; |
| | • | | higher volume of $113 million in Colombia and Panama due to higher water inflows in the system during 2011; |
| | • | | higher contract prices and volume of $80 million at Tietê as a result of the combined effect of higher spot sales and PPA indexation to CPI in the second half of 2011; and |
| | • | | higher ancillary services and third party gas sales of $57 million higher as well as contract prices of $53 million primarily from PPAs indexed to coal in the Dominican Republic. |
These increases were partially offset by:
| | • | | lower spot prices of $128 million in Colombia due to higher water inflows in the system during 2011; |
| | • | | a decrease of $32 million related to the final settlement of the power sales agreement between Uruguaiana and Sul in the second quarter of 2010; and |
| | • | | a net decrease of $19 million related to the forced outage in Panama. |
Excluding the favorable impact of foreign currency translation and remeasurement of $34 million, primarily in Brazil, generation gross margin for 2011 increased $309 million, or 21%, from 2010 primarily due to:
| | • | | higher volume of $158 million at Gener—Electrica Santiago due to improved fuel availability; |
| | • | | higher volume of $110 million in Colombia as a result of higher water inflows in the system during 2011; |
| | • | | higher contract prices and volume of $84 million at Tietê, as discussed above; |
| | • | | new business of $51 million at Angamos; |
| | • | | higher ancillary services and gas sales of $36 million and higher energy prices of $27 million in the Dominican Republic; and |
| | • | | higher volume and price of $26 million at our coal generation businesses in Argentina as a result of low hydrology. |
32
These increases were partially offset by:
| | • | | lower spot prices of $92 million in Colombia due to higher water inflows in the system during 2011; |
| | • | | higher fixed and operating costs of $71 million across the region, primarily attributable to higher employee costs, maintenance costs, an increase in non-income taxes in Argentina and Colombia, and higher depreciation at Tietê due to the change in useful lives and salvage values of property, plant and equipment, as a result of new regulatory information received; |
| | • | | a decrease of $39 million related to higher spot purchases and the forced outage in Panama; and |
| | • | | a decrease of $32 million related to the final settlement of the power sales agreement between Uruguaiana and Sul as discussed above. |
For the year ended December 31, 2011, revenue increased 16% while gross margin increased 23%, primarily due to the lower energy purchases at Gener due to higher generation.
Fiscal Year 2010 versus 2009
Excluding the favorable impact of foreign currency translation and remeasurement of $133 million, generation revenue for 2010 increased $497 million, or 14%, from 2009 primarily due to:
| | • | | higher spot prices of $221 million associated with increased fuel prices in Argentina; |
| | • | | higher volume of $139 million at Gener in Chile due to higher demand; |
| | • | | higher volume and ancillary services of $115 million, higher contract prices from PPAs indexed to gas and higher spot prices of $27 million in the Dominican Republic; |
| | • | | higher contract prices of $58 million in Colombia and Tietê in Brazil; |
| | • | | the positive impact of $28 million resulting from the final settlement of the power sales agreement between Sul and Uruguaiana, our businesses in Brazil; and |
| | • | | higher volume of $21 million in Panama due to higher water inflows into the system. |
These increases were partially offset by:
| | • | | lower volume sold at Uruguaiana of $53 million as a result of renegotiation of its power sales agreements; |
| | • | | lower volume due to unfavorable hydrology in Colombia and Argentina of $41 million; |
| | • | | lower contract prices at Gener of $32 million; and |
| | • | | lower contract prices on PPAs indexed to international coal prices in the Dominican Republic of $22 million. |
Excluding the favorable impact of foreign currency translation and remeasurement of $106 million, generation gross margin for 2010 increased $34 million, or 3%, from 2009 primarily due to:
| | • | | higher spot prices in Argentina of $69 million; |
| | • | | higher volume and ancillary services in the Dominican Republic of $55 million; |
| | • | | higher contract prices of $33 million in Colombia; |
| | • | | the positive impact of $28 million resulting from the final settlement of the power sales agreement between Sul and Uruguaiana, as mentioned above; and |
| | • | | higher volume of $23 million in Panama. |
33
These increases were partially offset by:
| | • | | higher fuel and purchased energy prices at Gener of $48 million; |
| | • | | the net effect of lower PPA prices and higher fuel costs in the Dominican Republic of $38 million; |
| | • | | the impact of a reversal of bad debt expense during the first quarter of 2009 of $36 million at Uruguaiana as a result of the renegotiation of one of its power sales agreements; and |
| | • | | higher fixed costs of $30 million at Gener primarily due to higher employee costs, increased maintenance expenses and costs incurred due to construction delays at Campiche. |
For the year ended December 31, 2010, revenue increased by 17% while gross margin increased 10%, primarily due to higher spot purchases and fuel prices at Gener and the reversal of bad debt expense as a result of the renegotiation of one of the power sales agreements at Uruguaiana in the first quarter of 2009.
Latin America—Utilities
The following table summarizes revenue and gross margin for our Utilities segment in Latin America for the periods indicated:
| | | | | | | | | | | | | | | | | | | | |
| | | For the Years Ended December 31, | |
| | | 2011 | | | 2010 | | | 2009 | | | % Change
2011 vs. 2010 | | | % Change
2010 vs. 2009 | |
| | | ($’s in millions) | |
Latin America Utilities | | | | | | | | | | | | | | | | | | | | |
Revenue | | $ | 7,374 | | | $ | 6,987 | | | $ | 5,877 | | | | 6 | % | | | 19 | % |
Gross Margin | | $ | 1,035 | | | $ | 1,023 | | | $ | 866 | | | | 1 | % | | | 18 | % |
Fiscal Year 2011 versus 2010
Excluding the favorable impact of foreign currency translation of $362 million in Brazil, utilities revenue for 2011 increased $25 million, or flat to 2010 primarily due to:
| | • | | higher volume of $277 million due to increased market demand in Brazil; |
| | • | | higher tariffs of $95 million in El Salvador due to increased energy prices related to higher fuel prices and drier weather which are pass-through to customers; and |
| | • | | higher tariffs of $27 million at Sul in Brazil due to higher volume of energy purchases which are pass-through to customers. |
These increases were partially offset by:
| | • | | lower tariffs of $207 million at Eletropaulo in Brazil, related to the estimated impact of the July 2011 tariff reset which is expected to be finalized by the Brazilian energy regulatory agency in 2012; and |
| | • | | lower tariffs of $139 million at Eletropaulo due to lower energy prices associated with energy purchases and pass-through transmission costs. |
Excluding the favorable impact of foreign currency translation of $63 million in Brazil, utilities gross margin for 2011 decreased $51 million, or 5%, from 2010 primarily due to:
| | • | | lower tariffs of $190 million at Eletropaulo, primarily related to the estimated impact of the July 2011 tariff reset as discussed above; and |
| | • | | higher depreciation of $50 million primarily in Brazil mainly due to the change in estimates of the useful lives and salvage values of property, plant and equipment, as a result of new regulatory information. |
These decreases were partially offset by:
| | • | | higher volume of $117 million primarily in Brazil due to increased market demand; and |
| | • | | lower fixed costs of $67 million primarily due to contingency reversals and a non-recurring reduction in bad debt expense in Brazil. |
34
For the year ended December 31, 2011, revenue increased 6% while gross margin increased 1%, primarily due to higher pass-through costs to customers and higher depreciation.
Fiscal Year 2010 versus 2009
Excluding the favorable impact of foreign currency translation of $690 million, primarily in Brazil, utilities revenue for 2010 increased $420 million, or 7%, from 2009 primarily due to:
| | • | | increased volume of $300 million, primarily in Brazil, due to increased market demand; and |
| | • | | higher tariffs of $111 million primarily related to the July 2009 tariff reset in Brazil partially offset by the unfavorable impact on rates at Eletropaulo in Brazil of a cumulative adjustment to regulatory liabilities and higher energy prices across our Latin America utility businesses associated with energy purchases passed through to customers of $97 million. |
Excluding the favorable impact of foreign currency translation of $100 million, primarily in Brazil, utilities gross margin for 2010 increased $57 million, or 7%, from 2009 primarily due to:
| | • | | increased volume of $147 million, primarily in Brazil, due to the increased market demand; and |
| | • | | lower contingencies of $142 million in Eletropaulo primarily related to labor contingencies which included a one-time reversal, reflecting an agreement with Fundação CESP, the pension plan administrator, of $51 million associated with claims for past benefit obligations which will now be accounted for as a component of the pension plan. |
These increases were partially offset by:
| | • | | higher fixed costs of $224 million primarily due to the recovery in 2009 of a municipality receivable previously written off in Brazil and higher salaries and other employee related costs, provisions for commercial losses, regulatory penalties and maintenance costs; and |
| | • | | $28 million related to the final settlement of the power sales agreement between Sul and Uruguaiana. |
North America—Generation
The following table summarizes revenue and gross margin for our Generation segment in North America for the periods indicated:
| | | | | | | | | | | | | | | | | | | | |
| | | For the Years Ended December 31, | |
| | | 2011 | | | 2010 | | | 2009 | | | % Change
2011 vs. 2010 | | | % Change
2010 vs. 2009 | |
| | | ($’s in millions) | |
North America Generation | | | | | | | | | | | | | | | | | | | | |
Revenue | | $ | 1,325 | | | $ | 1,315 | | | $ | 1,249 | | | | 1 | % | | | 5 | % |
Gross Margin | | $ | 338 | | | $ | 347 | | | $ | 344 | | | | -3 | % | | | 1 | % |
Fiscal Year 2011 versus 2010
Excluding the favorable impact of foreign currency translation of $9 million, generation revenue for 2011 increased $1 million, or remained flat compared to 2010 primarily due to:
| | • | | an increase in Puerto Rico of $23 million primarily due to a prior year forced outage and the related penalty and $20 million due to higher rates; and |
| | • | | higher volume of $8 million at TEG/TEP in Mexico. |
These increases were offset by:
| | • | | a decrease in volume of $21 million at Deepwater in Texas due to the layup of the plant in January 2011 caused by high fuel costs and diminishing power prices; and |
| | • | | decreases at Merida in Mexico of $18 million due to lower rates and volume and $7 million due to a combination of forced and scheduled outages. |
35
Generation gross margin for 2011 decreased $9 million, or 3%, from 2010 primarily due to:
| | • | | a decrease of $12 million at TEG/TEP due to a combination of forced and scheduled outages and higher fuel costs; |
| | • | | higher fuel costs and lower volume at Hawaii of $11 million; |
| | • | | higher fuel costs at Shady Point in Oklahoma of $10 million; |
| | • | | a decrease in volume of $6 million at Deepwater as discussed above; and |
| | • | | a decrease of $5 million at Merida due to a combination of forced and scheduled outages. |
These decreases were partially offset by:
| | • | | an increase of $15 million in Hawaii due to a favorable impact of prior year mark-to-market derivative adjustments; |
| | • | | lower fixed costs at Deepwater of $10 million as discussed above; and |
| | • | | an increase in Puerto Rico of $9 million primarily due to a prior year forced outage and the related penalty. |
Fiscal Year 2010 versus 2009
Excluding the favorable impact of foreign currency translation of $19 million, generation revenue for 2010 increased $47 million, or 4%, from 2009 primarily due to:
| | • | | increased rates, volume and an availability bonus at TEG/TEP in Mexico of $41 million; |
| | • | | higher volume, primarily due to fewer outages and higher rates, of $22 million at Merida in Mexico; and |
| | • | | higher volume of $19 million at Warrior Run in Maryland due to fewer outages. |
These increases were partially offset by:
| | • | | a net decrease of $18 million at Deepwater in Texas primarily due to lower volume; and |
| | • | | a net decrease of $14 million in Puerto Rico primarily due to a penalty from a forced outage. |
Excluding the favorable impact of foreign currency translation of $3 million, generation gross margin for 2010 was flat compared to 2009 primarily due to:
| | • | | a net increase of $26 million at TEG/TEP due to a current year availability bonus and fewer outages partially offset by higher fuel prices; and |
| | • | | higher volume of $14 million at Warrior Run due to fewer outages. |
These increases were partially offset by:
| | • | | a decrease of $16 million at Deepwater due to lower volume and rates; |
| | • | | a net decrease of $11 million in Puerto Rico primarily due to a forced outage; and |
| | • | | a decrease of $9 million in Hawaii due to an unfavorable impact of mark-to-market derivatives. |
North America—Utilities
The following table summarizes revenue and gross margin for our Utilities segment in North America for the periods indicated:
| | | | | | | | | | | | | | | | | | | | |
| | | For the Years Ended December 31, | |
| | | 2011 | | | 2010 | | | 2009 | | | % Change
2011 vs. 2010 | | | % Change
2010 vs. 2009 | |
| | | ($’s in millions) | |
North America Utilities | | | | | | | | | | | | | | | | | | | | |
Revenue | | $ | 1,326 | | | $ | 1,145 | | | $ | 1,068 | | | | 16 | % | | | 7 | % |
Gross Margin | | $ | 220 | | | $ | 249 | | | $ | 239 | | | | -12 | % | | | 4 | % |
36
Fiscal Year 2011 versus 2010
Utilities revenue for 2011 increased $181 million, or 16%, from 2010 primarily due to:
| | • | | an increase of $154 million from the operations of DPL, in Ohio, which was acquired on November 28, 2011; and |
| | • | | higher prices of $67 million, primarily due to higher fuel adjustment charges of $57 million at IPL in Indiana. |
These increases were partially offset by the following at IPL:
| | • | | lower retail volume of $21 million, primarily due to unfavorable weather and economic conditions; and |
| | • | | lower wholesale volume of $16 million, primarily due to increased generating unit outages. |
Utilities gross margin for 2011 decreased $29 million, or 12%, from 2010 primarily due to the following at IPL:
| | • | | lower wholesale margin of $12 million, primarily due to increased generating unit outages; |
| | • | | lower retail margin of $11 million, primarily due to unfavorable volume as discussed above; and |
| | • | | higher salaries, wages and benefits of $7 million, primarily due to increased overtime and higher pay rates in 2011. |
These decreases were partially offset by:
| | • | | increase of $6 million from the operations of DPL, which was acquired on November 28, 2011. |
For the year ended December 31, 2011, revenue increased by 16% while gross margin decreased 12%, primarily due to the positive impact of higher-pass through on revenue at IPL, which had no corresponding impact on gross margin and the unfavorable impact on gross margin from one-time acquisition charges of $16 million related to DPL.
Fiscal Year 2010 versus 2009
Utilities revenue for 2010 increased $77 million, or 7%, from 2009 primarily due to:
| | • | | higher retail demand of $64 million as a result of warmer weather and higher fuel adjustment charges; and |
| | • | | increased wholesale revenue of $11 million primarily due to higher prices. |
Utilities gross margin for 2010 increased $10 million, or 4%, from 2009 primarily due to:
| | • | | higher retail margin of $20 million due to increased demand; |
| | • | | lower pension expense of $12 million; and |
| | • | | lower emission allowance expense of $5 million. |
These increases were partially offset by:
| | • | | increased maintenance expenses of $16 million due to the timing of major generating unit overhauls; and |
| | • | | increased fixed costs of $14 million. |
For the year ended December 31, 2010, revenue increased by 7% while gross margin increased 4%, primarily due to increased fuel and maintenance costs.
37
Europe—Generation
The following table summarizes revenue and gross margin for our Generation segment in Europe for the periods indicated:
| | | | | | | | | | | | | | | | | | | | |
| | | For the Years Ended December 31, | |
| | | 2011 | | | 2010 | | | 2009 | | | % Change
2011 vs. 2010 | | | % Change
2010 vs. 2009 | |
| | | ($’s in millions) | |
Europe Generation | | | | | | | | | | | | | | | | | | | | |
Revenue | | $ | 1,550 | | | $ | 1,318 | | | $ | 762 | | | | 18 | % | | | 73 | % |
Gross Margin | | $ | 359 | | | $ | 310 | | | $ | 244 | | | | 16 | % | | | 27 | % |
Fiscal Year 2011 versus 2010
Excluding the favorable impact of foreign currency translation of $47 million, generation revenue for 2011 increased $185 million, or 14%, from 2010 primarily due to:
| | • | | $256 million from the operations at Ballylumford which was acquired in August 2010, driven by $224 million resulting from the acquisition and $32 million primarily from better availability due to a planned outage in 2010; and |
| | • | | new business of $182 million at Maritza, which commenced commercial operations in June 2011. |
These increases were partially offset by:
| | • | | lower revenue of $160 million at Cartagena primarily due to lower pass-through energy costs; |
| | • | | lower revenue of $54 million in Hungary primarily from lower contract sales, lower spot market sales and lower volume on ancillary services, partially offset by higher capacity prices; and |
| | • | | lower revenue of $46 million at Kilroot, in Northern Ireland, primarily resulting from the cancellation of the long-term PPA and supplementary agreements in November 2010. |
Excluding the favorable impact of foreign currency translation of $12 million, generation gross margin for 2011 increased $37 million, or 12%, from 2010 primarily due to:
| | • | | $77 million from the operations at Ballylumford, acquired in August 2010, driven by $64 million resulting from the acquisition and $13 million primarily from better availability due to a planned outage in 2010; and |
| | • | | $66 million at Maritza, which commenced operations in June 2011. |
These increases were partially offset by:
| | • | | lower gross margin of $68 million at Kilroot, primarily resulting from cancellation of the long-term PPA and supplementary agreements in November 2010, lower capacity factor due to a decline in market demand, partially offset by CO2 costs passed through in the market price; and |
| | • | | lower gross margin of $55 million in Hungary primarily due to decreased market demand, lower ramp-up ancillary services and lower spark spread, partially offset by higher capacity prices. |
In February 2012, the Company completed the sale of 80% of our interest in Cartagena. Due to the Company’s continuing involvement in the business subsequent to the sale, Cartagena is presented as held for sale on the Consolidated Balance Sheets, but presented in continuing operations on the Consolidated Income Statements. Accordingly, 2012 revenue and gross margin will be negatively impacted by the sale.
Fiscal Year 2010 versus 2009
Excluding the unfavorable impact of foreign currency translation of $37 million, generation revenue for 2010 increased $593 million, or 78%, from 2009 primarily due to:
| | • | | $409 million from the adoption of new accounting guidance on the consolidation of variable interest entities (“VIEs”) which resulted in the consolidation of Cartagena in Spain, a generation business previously accounted for under the equity method of accounting; |
| | • | | $117 million from the operations of Ballylumford in the United Kingdom, which was acquired in August 2010; |
38
| | • | | higher tariffs of $16 million at Altai in Kazakhstan; |
| | • | | $15 million from a full year of combined cycle operations at our Amman East plant in Jordan, which was single cycle until August 2009; and |
| | • | | higher volume of $15 million at Kilroot in the United Kingdom largely driven by coal pass-through and increased demand, partially offset by lower capacity revenue due to the termination of the long term PPA and related supplementary agreements. |
Generation gross margin for 2010 increased $66 million, or 27%, from 2009 primarily due to:
| | • | | $62 million from the consolidation of Cartagena as discussed above; |
| | • | | higher tariffs and lower fixed costs at Altai of $29 million; and |
| | • | | $13 million from the operations of Ballylumford since its acquisition. |
These increases were partially offset by:
| | • | | lower gross margin of $28 million primarily from the termination of the long-term PPA at Kilroot; and |
| | • | | lower gross margin of $11 million in Hungary primarily attributable to higher fuel costs that could not be passed through and lower sales of emission allowances. |
For the year ended December 31, 2010, revenue increased 73% while gross margin increased 27%, primarily due to the consolidation of Cartagena and acquisition of Ballylumford that had a larger positive impact on revenue than gross margin, and the positive impact of higher energy revenue at Kilroot, which as a pass-through had no corresponding impact on gross margin.
Asia—Generation
The following table summarizes revenue and gross margin for our Generation segment in Asia for the periods indicated:
| | | | | | | | | | | | | | | | | | | | |
| | | For the Years Ended December 31, | |
| | | 2011 | | | 2010 | | | 2009 | | | % Change
2011 vs. 2010 | | | % Change
2010 vs. 2009 | |
| | | ($’s in millions) | |
Asia Generation | | | | | | | | | | | | | | | | | | | | |
Revenue | | $ | 625 | | | $ | 618 | | | $ | 375 | | | | 1 | % | | | 65 | % |
Gross Margin | | $ | 178 | | | $ | 240 | | | $ | 93 | | | | -26 | % | | | 158 | % |
Fiscal Year 2011 versus 2010
Excluding the favorable impact of foreign currency translation of $20 million, generation revenue for 2011 decreased $13 million, or 2%, from 2010 primarily due to:
| | • | | a decrease of $39 million at Masinloc in the Philippines primarily due to lower generation prices and volume. Spot volume and prices were lower due to flat electricity demand and higher available capacity in the grid; |
| | • | | a decrease of $12 million due to the closure of Aixi in China in November 2010; and |
| | • | | outages of $9 million at Kelanitissa in Sri Lanka resulting in lower plant availability in 2011. |
These decreases were partially offset by:
| | • | | higher generation rates of $18 million due to higher pass-through fuel costs and higher generation volume of $29 million at Kelanitissa due to higher offtaker demand as a result of lower hydrology. |
Excluding the favorable impact of foreign currency translation of $8 million, generation gross margin for 2011 decreased $70 million, or 29%, from 2010 primarily due to:
| | • | | decrease of $59 million at Masinloc primarily attributable to a combination of flat market demand, lower spot prices, higher coal prices and increased fixed costs. |
39
For the year ended December 31, 2011, revenue increased 1% while gross margin decreased 26%, primarily due to higher pass-through fuel costs at Kelanitissa which had a positive impact on revenue but no corresponding impact on gross margin and the negative influence on gross margin arising from lower spot prices at Masinloc, as well as increases in coal prices and fixed costs.
Fiscal Year 2010 versus 2009
Excluding the favorable impact of foreign currency translation of $28 million, generation revenue for 2010 increased $215 million, or 57%, from 2009 primarily due to:
| | • | | favorable generation rates and volume of $210 million at Masinloc in the Philippines as a result of increased market demand and improved plant availability subsequent to the completion of its overhaul at the beginning of 2010; and |
| | • | | higher demand from both new and existing contract and spot customers as a result of lower supply shortages in the Philippines power market due to a strong energy growth rate. |
Excluding the favorable impact of foreign currency translation of $13 million, generation gross margin for 2010 increased $134 million, or 144%, from 2009 primarily due to:
| | • | | a combination of higher availability attributable to improved plant operations, higher market demand and favorable spot prices at Masinloc. |
For the year ended December 31, 2010, revenue increased 65% while gross margin increased 158%, primarily due to the positive influence on gross margin due to favorable spot rates and operational efficiencies resulting from the Masinloc plant overhauls in late 2009 and early 2010, which led to higher availability and allowed for more efficient operations that have materially improved the operating results for 2010 as compared to 2009.
Corporate and Other
Corporate and other includes the net operating results from our generation and utilities businesses in Africa, utilities businesses in Europe, Wind Generation and renewables projects which are immaterial for the purposes of separate segment disclosure. The following table excludes inter-segment activity and summarizes revenue and gross margin for Corporate and Other entities for the periods indicated:
| | | | | | | | | | | | | | | | | | | | |
| | | For the Years Ended December 31, | |
| | | 2011 | | | 2010 | | | 2009 | | | % Change
2011 vs. 2010 | | | % Change
2010 vs. 2009 | |
| | | ($’s in millions) | |
Revenue | | | | | | | | | | | | | | | | | | | | |
Europe Utilities | | $ | 418 | | | $ | 356 | | | $ | 286 | | | | 17 | % | | | 24 | % |
Africa Utilities | | | 386 | | | | 422 | | | | 370 | | | | -9 | % | | | 14 | % |
Africa Generation | | | 91 | | | | 87 | | | | 70 | | | | 5 | % | | | 24 | % |
Wind Generation | | | 235 | | | | 202 | | | | 133 | | | | 16 | % | | | 52 | % |
Corp/Other | | | 12 | | | | 12 | | | | 14 | | | | 0 | % | | | -14 | % |
Eliminations | | | (33 | ) | | | (26 | ) | | | (5 | ) | | | -27 | % | | | -420 | % |
| | | | | | | | | | | | | | | | | | | | |
Total Corporate and Other | | $ | 1,109 | | | $ | 1,053 | | | $ | 868 | | | | 5 | % | | | 21 | % |
| | | | | | | | | | | | | | | | | | | | |
| | | | | |
Gross Margin | | | | | | | | | | | | | | | | | | | | |
Europe Utilities | | $ | 23 | | | $ | 21 | | | $ | 16 | | | | 10 | % | | | 31 | % |
Africa Utilities | | | (59 | ) | | | 64 | | | | 70 | | | | -192 | % | | | -9 | % |
Africa Generation | | | 45 | | | | 52 | | | | 39 | | | | -13 | % | | | 33 | % |
Wind Generation | | | 72 | | | | 43 | | | | 9 | | | | 67 | % | | | 378 | % |
Corp/Other | | | (5 | ) | | | 4 | | | | (6 | ) | | | -225 | % | | | 167 | % |
Eliminations | | | 2 | | | | 4 | | | | 4 | | | | -50 | % | | | 0 | % |
| | | | | | | | | | | | | | | | | | | | |
Total Corporate and Other | | $ | 78 | | | $ | 188 | | | $ | 132 | | | | -59 | % | | | 42 | % |
| | | | | | | | | | | | | | | | | | | | |
40
Fiscal Year 2011 versus 2010
Excluding the favorable impact of foreign currency translation of $16 million, Corporate and Other revenue increased $40 million for 2011 from 2010 primarily due to:
| | • | | higher tariff of $71 million at our utility businesses in the Ukraine; and |
| | • | | $12 million from St. Nikola in Bulgaria that commenced commercial operations in March 2010. |
These increases were partially offset by:
| | • | | a net decrease of $52 million at Sonel in Cameroon primarily due to the unfavorable impact of an unrealized mark-to-market derivative adjustment, partially offset by higher tariff and volume. |
Excluding the unfavorable impact of foreign currency translation of $4 million, Corporate and Other gross margin decreased $106 million for 2011, or 56% from 2010. The decrease was primarily due to:
| | • | | a decrease of $119 million at Sonel primarily due to the unfavorable impact of an unrealized mark-to-market derivative adjustment and higher fixed costs. |
| | • | | a decrease of $16 million in the Ukraine primarily due to higher fixed costs. |
These decreases were partially offset by:
| | • | | gross margin of $10 million at St. Nikola, as discussed above. |
For the year ended December 31, 2011, revenue increased 5% while gross margin decreased 59%, primarily due to higher pass-through costs in the Ukraine which had a positive impact on revenue but no corresponding impact on gross margin and higher fixed costs at Sonel.
Fiscal Year 2010 versus 2009
Excluding the unfavorable impact of foreign currency translation of $30 million, primarily in Cameroon, Corporate and Other revenue increased $215 million for 2009, or 25%, from 2009. The increase was primarily due to:
| | • | | higher volume at our utility businesses in Ukraine driven by an overall increase in market demand; |
| | • | | higher volume and utility tariffs at Sonel in Cameroon driven by an increase in market demand; and |
| | • | | incremental revenue from new wind generation projects that commenced operations during the year and an overall volume increase across our wind businesses. |
Excluding the unfavorable impact of foreign currency translation of $9 million, primarily in Cameroon, Corporate and Other gross margin increased $65 million for 2009, or 50%, from 2009. The increase was primarily due to:
| | • | | an increase in gross margin from our new wind generation projects and higher volume, as discussed above; and |
| | • | | an increase in volume at Dibamba, our generation business, in Cameroon. |
These increases were partially offset by:
| | • | | an increase in fixed costs at Sonel. |
General and Administrative Expense
General and administrative expense includes those expenses related to corporate and region staff functions and/or initiatives, executive management, finance, legal, human resources, information systems, and development costs.
General and administrative expense remained flat at $391 million in 2011 and 2010. A reduction of business development costs and SAP implementation costs was offset by DPL transaction costs.
41
General and administrative expenses increased $52 million, or 15%, to $391 million in 2010 from 2009. The increase is primarily related to business development costs associated with increased development efforts, primarily in Europe, Turkey and India.
Interest expense
Interest expense increased $102 million, or 7%, to $1.6 billion in 2011 from 2010. This increase was primarily due to less interest capitalization at Maritza due to commencement of operations in June 2011, a monetary correction related to value-added tax on commercial losses at Eletropaulo, the unfavorable impact of foreign currency translation in Brazil, higher interest rates at Eletropaulo, and increased debt and fees related to the DPL acquisition. These increases were partially offset by lower interest rates at Tietê, and a fee on a non-exercised credit line was written off in Brazil in 2010.
Interest expense increased $45 million, or 3%, to $1.5 billion in 2010 from 2009. This increase was primarily due to interest expense at Cartagena which is now a consolidated entity, higher interest rates at Tietê, increased debt principal at Eletropaulo and interest being expensed related to St. Nikola, our wind project in Bulgaria, due to commencement of operations in 2010. These increases were partially offset by reduced debt at the Parent Company.
Interest income
Interest income decreased $8 million, or 2%, to $400 million in 2011 from 2010. The decrease was primarily due to the settlement of a dispute related to inflation adjustments for energy sales at Tietê in 2010. The decrease was partially offset by favorable foreign currency translation in Brazil.
Interest income increased $64 million, or 19%, to $408 million in 2010 from 2009. This increase was primarily due to a higher average balance in short term investments at Eletropaulo and the favorable impact of foreign currency translation in Brazil as well as the settlement of a dispute related to inflation adjustments for energy sales at Tietê. These increases were partially offset by reduced interest income from a loan to a wind development project in Brazil which was repaid in June 2010.
Other income
See discussion of the components of other income in Note 19—Other Income & Expense included in Item 8.—Financial Statements and Supplementary Data of this Form 8-K.
Other expense
See discussion of the components of other expense in Note 19—Other Income & Expense included in Item 8.—Financial Statements and Supplementary Data of this Form 8-K.
Goodwill Impairment
The Company recognized goodwill impairment of $17 million, $21 million and $122 million for the years ended December 31, 2011, 2010 and 2009, respectively.
See Note 9 —Goodwill and Other Intangible Assets included in Item 8.—Financial Statements and Supplementary Data of this Form 8-K for further discussion on goodwill impairment.
Asset Impairment Expense
The Company recognized asset impairment expense of $225 million, $389 million and $20 million for the years ended December 31, 2011, 2010 and 2009, respectively.
See Note 20—Impairment Expense included in Item 8.—Financial Statements and Supplementary Data of this Form 8-K for further information.
Gain on sale of investments
Gain on sale of investments of $8 million in 2011 consisted primarily of the gain related to the sale of Wuhu, an equity method investment in China.
There was no gain on sale of investments in 2010.
Gain on sale of investments of $132 million in 2009 consisted primarily of $98 million recognized in May 2009 related to the termination of the management agreement between the Company and Kazakhmys PLC for
42
Ekibastuz and Maikuben, a gain of $14 million from the sale of the remaining assets associated with the shutdown of the Hefei plant in China and $13 million from the reversal of a contingent liability related to the Kazakhstan sale in 2008.
Foreign currency transaction gains (losses) on net monetary position
The following table summarizes the gains (losses) on the Company’s net monetary position from foreign currency transaction activities:
| | | | | | | | | | | | |
| | | Years Ended December 31, | |
| | | 2011 | | | 2010 | | | 2009 | |
| | | (in millions) | |
AES Corporation | | $ | (10 | ) | | $ | (50 | ) | | $ | 13 | |
Chile | | | (19 | ) | | | 8 | | | | 65 | |
Philippines | | | 3 | | | | 8 | | | | 15 | |
Brazil | | | (12 | ) | | | (6 | ) | | | (9 | ) |
Argentina | | | 16 | | | | 12 | | | | (10 | ) |
Kazakhstan | | | — | | | | 1 | | | | (24 | ) |
Colombia | | | 1 | | | | (4 | ) | | | (11 | ) |
Other | | | (17 | ) | | | (2 | ) | | | (4 | ) |
| | | | | | | | | | | | |
Total(1) | | $ | (38 | ) | | $ | (33 | ) | | $ | 35 | |
| | | | | | | | | | | | |
| (1) | Includes gains (losses) of $44 million, $(10) million and $(39) million on foreign currency derivative contracts for the years ended December 31, 2011, 2010 and 2009, respectively. |
43
The Company recognized foreign currency transaction losses of $38 million for the year ended December 31, 2011. These losses consisted primarily of losses in Chile, Brazil, and at The AES Corporation, partially offset by gains in Argentina.
| | • | | Losses of $19 million in Chile were primarily due to an 11% devaluation of the Chilean Peso, resulting in losses at Gener (a U.S. Dollar functional currency subsidiary) associated with net working capital denominated in Chilean Pesos, mainly cash, accounts receivable, tax receivables and a $5 million loss on foreign currency derivatives. |
| | • | | Losses of $12 million in Brazil were primarily due to a 13% devaluation of the Brazilian Real resulting in losses mainly associated with U.S. Dollar denominated liabilities. |
| | • | | Losses of $10 million at The AES Corporation were primarily due to decreases in the valuation of intercompany notes receivable denominated in foreign currencies, resulting from the weakening of the Euro and British Pound during the year, partially offset by gains related to foreign currency option purchases. |
| | • | | Gains of $16 million in Argentina were primarily due to a gain on a foreign currency embedded derivative related to government receivables, partially offset by losses due to the 8% devaluation of the Argentine Peso, resulting in losses at Alicura (an Argentine Peso functional currency subsidiary) associated with its U.S. Dollar denominated debt. |
The Company recognized foreign currency transaction losses of $33 million for the year ended December 31, 2010. These losses consisted primarily of losses at The AES Corporation partially offset by gains in Argentina.
| | • | | Losses of $50 million at The AES Corporation were primarily due to the devaluation of notes receivable resulting from the weakening of the Euro and British Pound, and losses on foreign exchange swaps and options, partially offset by gains on cash balances and debt denominated in British Pounds. |
| | • | | Gains of $12 million in Argentina were primarily due to a gain on a foreign currency embedded derivative related to government receivables, partially offset by losses due to the devaluation of the Argentine Peso by 5%, resulting in losses at Alicura (an Argentine Peso functional currency subsidiary) associated with its U.S. Dollar denominated debt. |
The Company recognized foreign currency transaction gains of $35 million for the year ended December 31, 2009. These gains consisted primarily of gains in Chile, the Philippines and at The AES Corporation partially offset by losses in Kazakhstan, Colombia, Argentina and Brazil.
| | • | | Gains of $65 million in Chile were primarily due to the appreciation of the Chilean Peso of 20% resulting in gains at Gener (a U.S. Dollar functional currency subsidiary) associated with its net working capital denominated in Chilean Pesos, mainly cash and accounts receivables. This gain was partially offset by $14 million in losses on foreign currency derivatives. |
| | • | | Gains of $15 million in the Philippines were primarily due to the appreciation of the Philippine Peso of 3%, resulting in gains at Masinloc (a Philippine Peso functional currency subsidiary) on the remeasurement of U.S. Dollar denominated debt. |
| | • | | Gains of $13 million at The AES Corporation were primarily due to the settlement of the senior unsecured credit facility and the revaluation of notes receivable denominated in the Euro, partially offset by losses on debt denominated in British Pounds. |
| | • | | Losses of $24 million in Kazakhstan were primarily due to net foreign currency transaction losses of $12 million related to energy sales denominated and fixed in the U.S. Dollar and $12 million of foreign currency transaction losses on debt and other liabilities denominated in currencies other than the Kazakh Tenge. |
| | • | | Losses of $11 million in Colombia were primarily due to the appreciation of the Colombian Peso of 9%, resulting in losses at Chivor (a U.S. Dollar functional currency subsidiary) associated with its Colombian Peso denominated debt and losses on foreign currency derivatives. |
44
| | • | | Losses of $10 million in Argentina were primarily due to the devaluation of the Argentine Peso of 10% in 2009, resulting in losses at Alicura (an Argentine Peso functional currency subsidiary) associated with its U.S. Dollar denominated debt, partially offset by derivative gains. |
| | • | | Losses of $9 million in Brazil were primarily due to energy purchases made by Eletropaulo denominated in U.S. Dollar, resulting in foreign currency transaction losses of $18 million, partially offset by gains of $9 million due to the appreciation in 2009 of the Brazilian Real of 25%, resulting in gains at Sul and Uruguaiana associated with U.S. Dollar denominated liabilities. |
Other non-operating expense
Other non-operating expense was $82 million, $7 million and $12 million for the years ended December 31, 2011, 2010 and 2009, respectively.
See Note 8—Other Non-operating Expense included in Item 8.—Financial Statements and Supplementary Data of this Form 8-K for further information.
Income taxes
Income tax expense on continuing operations increased $56 million, or 10%, to $631 million in 2011. The Company’s effective tax rates were 29% for 2011 and 31% for 2010.
The net decrease in the 2011 effective tax rate was primarily due to a tax benefit related to partial release of a valuation allowance against certain deferred tax assets at one of our Brazilian subsidiaries in the current period and tax expense recorded in the second quarter of 2010 relating to the CEMIG sale transaction. These items were offset by the impact of impairments recorded in the current period at certain foreign subsidiaries and the tax benefit related to a reversal of a Chilean withholding tax liability recorded in the third quarter of 2010. See Notes 8—Other Non-Operating Expense and 20—Impairment Expense for additional information regarding the current period impairments.
Income tax expense on continuing operations increased $22 million, or 4%, to $575 million in 2010. The Company’s effective tax rates were 31% for 2010 and 24% for 2009.
The net increase in the 2010 effective tax rate was primarily due to expense recorded in the second quarter of 2010 relating to the CEMIG sale transaction, tax benefit recorded in 2009 upon the release of valuation allowances at certain U.S. and Brazilian subsidiaries, and $165 million of non-taxable income recorded in 2009 at Brazil as a result of the REFIS program. These items were offset by income tax benefit related to a reversal of a Chilean withholding tax liability recorded in the third quarter of 2010. Included in the net tax expense related to the CEMIG sale transaction is tax expense on the equity earnings associated with the reversal of the net long-term liability and tax benefit related to release of a valuation allowance against certain deferred tax assets.
Net equity in earnings of affiliates
Net equity in earnings of affiliates decreased $185 million, or 101%, to $(2) million in 2011. This decrease was primarily due to the sale of our interest in CEMIG during the second quarter of 2010 which resulted in a significant gain, and $72 million of impairments at AES Solar in 2011, of which our share was $36 million.
Net equity in earnings of affiliates increased $92 million, or 101%, to $183 million in 2010. This increase was primarily due to a gain recognized upon the sale of our interest in CEMIG during the second quarter of 2010, partially offset by 2009 equity in earnings of Cartagena which was accounted for as a consolidated entity in 2010 and thus reported directly within revenues and expenses.
Income from continuing operations attributable to noncontrolling interests
Income from continuing operations attributable to noncontrolling interests increased $98 million, or 10%, to $1.1 billion in 2011. This increase was primarily due to the appreciation of the Brazilian Real and increased gross margin at Gener due to increased volume. This was partially offset by lower prices at Eletropaulo primarily related to the estimated impact of the July 2011 tariff reset and lower gross margin at Sonel mainly due to the unfavorable impact of an unrealized mark-to-market derivative loss.
Income from continuing operations attributable to noncontrolling interests decreased $95 million, or 9%, to $1.0 billion in 2010. This decrease was primarily due to decreased earnings at Eletropaulo as a result of the absence of legal settlement income realized in 2009, a loss on legal settlement at Gener and reduced revenues due to decreased coal prices along with higher electricity purchases at Itabo. These decreases were partially offset by the appreciation of the Brazilian Real.
45
Discontinued operations
Total discontinued operations was a net loss of $4 million, $402 million and $43 million for the years ended December 31, 2011, 2010 and 2009, respectively.
See Note 22—Discontinued Operations and Held for Sale Businesses included in Item 8.—Financial Statements and Supplementary Data of this Form 8-K for further information.
Critical Accounting Estimates
The Consolidated Financial Statements of AES are prepared in conformity with GAAP, which requires the use of estimates, judgments and assumptions that affect the reported amounts of assets and liabilities at the date of the financial statements and the reported amounts of revenue and expenses during the periods presented. AES’ significant accounting policies are described in Note 1—General and Summary of Significant Accounting Policies to the Consolidated Financial Statements included in Item 8 of this Form 8-K.
An accounting estimate is considered critical if:
| | • | | the estimate requires management to make assumptions about matters that were highly uncertain at the time the estimate was made; |
| | • | | different estimates reasonably could have been used; or |
| | • | | the impact of the estimates and assumptions on financial condition or operating performance is material. |
Management believes that the accounting estimates employed are appropriate and the resulting balances are reasonable; however, actual results could materially differ from the original estimates, requiring adjustments to these balances in future periods. Management has discussed these critical accounting policies with the Audit Committee, as appropriate. Listed below are the Company’s most significant critical accounting estimates and assumptions used in the preparation of the Consolidated Financial Statements.
Income Taxes
We are subject to income taxes in both the United States and numerous foreign jurisdictions. Our worldwide income tax provision requires significant judgment and is based on calculations and assumptions that are subject to examination by the Internal Revenue Service and other taxing authorities. The Company and certain of its subsidiaries are under examination by relevant taxing authorities for various tax years. The Company regularly assesses the potential outcome of these examinations in each tax jurisdiction when determining the adequacy of the provision for income taxes. Accounting guidance for uncertainty in income taxes prescribes a more-likely-than-not recognition threshold. Tax reserves have been established, which the Company believes to be adequate in relation to the potential for additional assessments. Once established, reserves are adjusted only when there is more information available or when an event occurs necessitating a change to the reserves. While the Company believes that the amounts of the tax estimates are reasonable, it is possible that the ultimate outcome of current or future examinations may exceed current reserves in amounts that could be material.
Deferred tax assets and liabilities are recognized for the future tax consequences attributable to differences between the financial statement carrying amounts of the existing assets and liabilities, and their respective income tax bases. The Company establishes a valuation allowance when it is more likely than not that all or a portion of a deferred tax asset will not be realized.
The Company’s provision for income taxes could be adversely impacted by changes to the U.S. taxation of earnings of our foreign subsidiaries. Since 2006, the Company has benefitted from the Controlled Foreign Corporation look-through rule, originally enacted for the 2006 through 2009 tax years in the Tax Increase Prevention and Reconciliation Act (“TIPRA”) of 2005 and retroactively reinstated for the 2010 and 2011 tax years via the Tax Relief, Unemployment Insurance Reauthorization, and Job Creation Act of 2010. This provision provided an exception from current U.S. taxation of certain un-repatriated cross-border payments of subsidiary dividends, interest, rents, and royalties. In determining the Company’s effective tax rate for the year ended
46
December 31, 2011, the Company has included the benefits of this provision. However, the Controlled Foreign Corporation look-through rule has not been reinstated, retroactively or otherwise, for 2012 or subsequent tax years and there can be no assurance that this provision will continue to be extended. Accordingly, if this provision is not renewed, we expect our effective tax rate to increase by amounts that could be material.
Impairments
Our accounting policies on goodwill and long-lived assets are described in detail in Note 1—General and Summary of Significant Accounting Policies, included in Item 8 of this Form 8-K. Goodwill is tested annually for impairment at the reporting unit level on October 1 and whenever events or circumstances indicate that it is more likely than not that the fair value of a reporting unit has been reduced below its carrying amount. A long-lived asset (asset group) will be tested for recoverability whenever events or changes in circumstances indicate that its carrying amount may not be recoverable, i.e., the future undiscounted cash flows associated with the asset are less than its carrying amount. In the event that the carrying amount of the long-lived asset (asset group) is not recoverable, an impairment evaluation is performed, in which the fair value of the asset is estimated and compared to the carrying amount. Examples of indicators that would result in an impairment test for goodwill and a recoverability test for long-lived assets include, but are not limited to, a significant adverse change in the business climate, legislation changes or a change in the extent or manner in which a long-lived asset is being used or in its physical condition. Throughout the impairment evaluation process, management makes considerable judgments; however, the fair value determination is typically the most judgmental part of an impairment evaluation.
The Company determines the fair value of a reporting unit or a long-lived asset (asset group) by applying the approaches prescribed under the fair value measurement accounting framework. Generally, the market approach and income approach are most relevant in the fair value measurement of our reporting units and long-lived assets; however, due to the lack of available relevant observable market information in many circumstances, the Company often relies on the income approach. The Company may engage an independent valuation firm to assist management with the valuation. The decision to engage an independent valuation firm considers all relevant facts and circumstances, including a cost/benefit analysis and the Company’s internal valuation knowledge of the long-lived asset (asset group) or business. The Company develops the underlying assumptions consistent with its internal budgets and forecasts for such valuations. Additionally, the Company uses an internal discounted cash flow valuation model (the “DCF model”), based on the principles of present value techniques, to estimate the fair value of its reporting units or long-lived assets under the income approach. The DCF model estimates fair value by discounting our internal budgets and cash flow forecasts, adjusted to reflect market participant assumptions, to the extent necessary, at an appropriate discount rate.
Management applies considerable judgment in selecting several input assumptions during the development of our internal budgets and cash flow forecasts. Examples of the input assumptions that our budgets and forecasts are sensitive to include macroeconomic factors such as growth rates, industry demand, inflation, exchange rates, power prices and commodity prices. Whenever appropriate, management obtains these input assumptions from observable market data sources (e.g., Economic Intelligence Unit) and extrapolates the market information if an input assumption is not observable for the entire forecast period. Many of these input assumptions are dependent on other economic assumptions, which are often derived from statistical economic models with inherent limitations such as estimation differences. Further, several input assumptions are based on historical trends which often do not recur. The input assumptions most significant to our budgets and cash flows are based on expectations of macroeconomic factors which have been volatile recently. It is not uncommon that different market data sources have different views of the macroeconomic factors expectations and related assumptions. As a result, macroeconomic factors and related assumptions are often available in a narrow range; however, in some situations these ranges become wide and the use of a different set of input assumptions could produce significantly different budgets and cash flow forecasts.
A considerable amount of judgment is also applied in the estimation of the discount rate used in the DCF model. To the extent practical, inputs to the discount rate are obtained from market data sources (e.g., Bloomberg, Capital IQ, etc.). The Company selects and uses a set of publicly traded companies from the relevant industry to estimate the discount rate inputs. Management applies judgment in the selection of such companies based on its view of the most likely market participants. It is reasonably possible that the selection of a different set of likely market participants could produce different input assumptions and result in the use of a different discount rate.
Fair value of a reporting unit or a long-lived asset (asset group) is sensitive to both input assumptions to our budgets and cash flow forecasts and the discount rate. Further, estimates of long-term growth and terminal value are
47
often critical to the fair value determination. As part of the impairment evaluation process, management analyzes the sensitivity of fair value to various underlying assumptions. The level of scrutiny increases as the gap between fair value and carrying amount decreases. Changes in any of these assumptions could result in management reaching a different conclusion regarding the potential impairment, which could be material. Our impairment evaluations inherently involve uncertainties from uncontrollable events that could positively or negatively impact the anticipated future economic and operating conditions.
Further discussion of the impairment charges recognized by the Company can be found within Note 9—Goodwill and Other Intangible Assets, Note 20—Impairment Expense and Note 8—Other Non-operating Expense to the Consolidated Financial Statements included in Item 8 of this Form 8-K.
Fair Value
Fair Value Hierarchy
The Company uses valuation techniques and methodologies that maximize the use of observable inputs and minimize the use of unobservable inputs. Where available, fair value is based on observable market prices or parameters or derived from such prices or parameters. Where observable prices are not available, valuation models are applied to estimate the fair value using the available observable inputs. The valuation techniques involve some level of management estimation and judgment, the degree of which is dependent on the price transparency for the instruments or market and the instruments’ complexity.
To increase consistency and enhance disclosure of the fair value of financial instruments, the fair value measurement standard includes a fair value hierarchy to prioritize the inputs used to measure fair value into three categories. An asset or liability’s level within the fair value hierarchy is based on the lowest level of input significant to the fair value measurement, where Level 1 is the highest and Level 3 is the lowest. For more information regarding the fair value hierarchy, see Note 1—General and Summary of Significant Accounting Policies included in Item 8.—Financial Statements and Supplementary Data of this Form 8-K.
Fair Value of Financial Instruments
A significant number of the Company’s financial instruments are carried at fair value with changes in fair value recognized in earnings or other comprehensive income each period. The Company makes estimates regarding the valuation of assets and liabilities measured at fair value in preparing the Consolidated Financial Statements. These assets and liabilities include short and long-term investments in debt and equity securities, included in the balance sheet line items “Short-term investments” and “Other assets (Noncurrent)”, derivative assets, included in “Other current assets” and “Other assets (Noncurrent)” and derivative liabilities, included in “Accrued and other liabilities (current)” and “Other long-term liabilities”. Investments are generally fair valued based on quoted market prices or other observable market data such as interest rate indices. The Company’s investments are primarily certificates of deposit, government debt securities and money market funds. Derivatives are valued using observable data as inputs into internal valuation models. The Company’s derivatives primarily consist of interest rate swaps, foreign currency instruments, and commodity and embedded derivatives. Additional discussion regarding the nature of these financial instruments and valuation techniques can be found in Note 4—Fair Value included in Item 8.—Financial Statements and Supplementary Data of this Form 8-K.
Fair Value of Nonfinancial Assets and Liabilities
Significant estimates are made in determining the fair value of long-lived tangible and intangible assets (i.e., property, plant and equipment, intangible assets and goodwill) during the impairment evaluation process. In addition, the majority of assets acquired and liabilities assumed in a business combination are required to be recognized at fair value under the relevant accounting guidance. In determining the fair value of these items, management makes several assumptions discussed in the Impairments section.
Accounting for Derivative Instruments and Hedging Activities
We enter into various derivative transactions in order to hedge our exposure to certain market risks. We primarily use derivative instruments to manage our interest rate, commodity and foreign currency exposures. We do not enter into derivative transactions for trading purposes.
In accordance with the accounting standards for derivatives and hedging, we recognize all derivatives as either assets or liabilities in the balance sheet and measure those instruments at fair value except where derivatives qualify and are designated as “normal purchase/normal sale” transactions. Changes in fair value of derivatives are
48
recognized in earnings unless specific hedge criteria are met. Income and expense related to derivative instruments are recognized in the same category as that generated by the underlying asset or liability. See Note 6—Derivative instruments and hedging activityincluded in Item 8 of this Form 8-K for further information on the classification.
The accounting standards for derivatives and hedging enable companies to designate qualifying derivatives as hedging instruments based on the exposure being hedged. These hedge designations include fair value hedges and cash flow hedges. Changes in the fair value of a derivative that is highly effective and is designated and qualifies as a fair value hedge, are recognized in earnings as offsets to the changes in fair value of the exposure being hedged. The Company has no fair value hedges at this time. Changes in the fair value of a derivative that is highly effective and is designated as and qualifies as a cash flow hedge, are deferred in accumulated other comprehensive income and are recognized into earnings as the hedged transactions occur. Any ineffectiveness is recognized in earnings immediately. For all hedge contracts, the Company provides formal documentation of the hedge and effectiveness testing in accordance with the accounting standards for derivatives and hedging.
The fair value measurement accounting standard provides additional guidance on the definition of fair value and defines fair value as the price that would be received to sell an asset or paid to transfer a liability in an orderly transaction between market participants at the measurement date, or exit price. The fair value measurement standard requires the Company to consider and reflect the assumptions of market participants in the fair value calculation. These factors include nonperformance risk (the risk that the obligation will not be fulfilled) and credit risk, both of the reporting entity (for liabilities) and of the counterparty (for assets). Due to the nature of the Company’s interest rate swaps, which are typically associated with non-recourse debt, credit risk for AES is evaluated at the subsidiary level rather than at the Parent Company level. Nonperformance risk on the Company’s derivative instruments is an adjustment to the initial asset/liability fair value position that is derived from internally developed valuation models that utilize observable market inputs.
As a result of uncertainty, complexity and judgment, accounting estimates related to derivative accounting could result in material changes to our financial statements under different conditions or utilizing different assumptions. As a part of accounting for these derivatives, we make estimates concerning nonperformance, volatilities, market liquidity, future commodity prices, interest rates, credit ratings (both ours and our counterparty’s) and exchange rates.
The fair value of our derivative portfolio is generally determined using internal valuation models, most of which are based on observable market inputs including interest rate curves and forward and spot prices for currencies and commodities. The Company derives most of its financial instrument market assumptions from market efficient data sources (e.g., Bloomberg, Reuters and Platt’s). In some cases, where market data is not readily available, management uses comparable market sources and empirical evidence to derive market assumptions to determine a financial instrument’s fair value. In certain instances, the published curve may not extend through the remaining term of the contract and management must make assumptions to extrapolate the curve. Additionally, in the absence of quoted prices, we may rely on “indicative pricing” quotes from financial institutions to input into our valuation model for certain of our foreign currency swaps. These indicative pricing quotes do not constitute either a bid or ask price and therefore are not considered observable market data. For individual contracts, the use of different valuation models or assumptions could have a material effect on the calculated fair value.
Regulatory Assets and Liabilities
The Company accounts for certain of its regulated operations in accordance with the regulatory accounting standards. As a result, AES recognizes assets and liabilities that result from the regulated ratemaking process that would not be recognized under GAAP for non-regulated entities. Regulatory assets generally represent incurred costs that have been deferred because such costs are probable of future recovery through customer rates. Regulatory liabilities generally represent obligations to make refunds to customers for previous collections for costs that are not likely to be incurred or included in future rate initiatives. Management continually assesses whether the regulatory assets are probable of future recovery by considering factors such as applicable regulatory changes, recent rate orders applicable to other regulated entities and the status of any pending or potential deregulation legislation. If future recovery of costs ceases to be probable, any asset write-offs would be required to be recognized in operating income.
49
New Accounting Pronouncements Adopted
In 2011, the Company adopted certain new accounting pronouncements as they became effective or when we were allowed to early adopt. The adoption of these new accounting pronouncements did not have a material impact on the Company’s financial position or results of operations. See Note 1—General and Summary of Significant Accounting Policies included in Item 8 of this Form 8-K for further information.
Accounting Pronouncements Issued But Not Yet Effective
See Note 1—General and Summary of Significant Accounting Policies included in Item 8 of this Form 8-K for accounting pronouncements, which were issued, but not yet effective as of December 31, 2011. The Company does not expect to have a material impact on its financial condition or results of operations as a result of the adoption of the new accounting pronouncements, which were issued, but not yet effective.
Capital Resources and Liquidity
Overview
As of December 31, 2011, the Company had unrestricted cash and cash equivalents of $1.7 billion, of which approximately $0.2 billion was held at the Parent Company and qualified holding companies, and short term investments of $1.4 billion. In addition, we had restricted cash and debt service reserves of $1.4 billion. The Company also had non-recourse and recourse aggregate principal amounts of debt outstanding of $15.5 billion and $6.5 billion, respectively. Of the approximately $2.1 billion of our short-term non-recourse debt, $871 million was presented as current because it is due in the next twelve months and $1.3 billion relates to defaulted debt. We expect such current maturities will be repaid from net cash provided by operating activities of the subsidiary to which the debt relates or through opportunistic refinancing activity or some combination thereof. Approximately $305 million of our recourse debt matures within the next twelve months, which we expect to repay using cash on hand at the Parent Company or through net cash provided by operating activities. See further discussion of Parent Company Liquidity below.
The Company has two types of debt reported on its consolidated balance sheet: non-recourse and recourse debt. Non-recourse debt is used to fund investments and capital expenditures for construction and acquisition of our electric power plants, wind projects and distribution facilities at our subsidiaries. Non-recourse debt is generally secured by the capital stock, physical assets, contracts and cash flows of the related subsidiary. The default risk is limited to the respective business and is without recourse to the Parent Company and other subsidiaries. Recourse debt is direct borrowings by the Parent Company and is used to fund development, construction or acquisitions, including funding for equity investments or to provide loans to the Parent Company’s subsidiaries or affiliates. This Parent Company debt is with recourse to the Parent Company and is structurally subordinated to the debt of the Parent Company’s subsidiaries or affiliates, except to the extent such subsidiaries or affiliates guarantee the Parent Company’s debt.
We rely mainly on long-term debt obligations to fund our construction activities. We have, to the extent available at acceptable terms, utilized non-recourse debt to fund a significant portion of the capital expenditures and investments required to construct and acquire our electric power plants, distribution companies and related assets. Our non-recourse financing is designed to limit cross default risk to the Parent Company or other subsidiaries and affiliates. Our non-recourse long-term debt is a combination of fixed and variable interest rate instruments. Generally, a portion or all of the variable rate debt is fixed through the use of interest rate swaps. In addition, the debt is typically denominated in the currency that matches the currency of the revenue expected to be generated from the benefiting project, thereby reducing currency risk. In certain cases, the currency is matched through the use of derivative instruments. The majority of our non-recourse debt is funded by international commercial banks, with debt capacity supplemented by multilaterals and local regional banks.
Given our long-term debt obligations, the Company is subject to interest rate risk on debt balances that accrue interest at variable rates. When possible, the Company will borrow funds at fixed interest rates or hedge its variable rate debt to fix its interest costs on such obligations. In addition, the Company has historically tried to maintain at least 70% of its consolidated long-term obligations at fixed interest rates, including fixing the interest rate through the use of interest rate swaps. These efforts apply to the notional amount of the swaps compared to the amount of related underlying debt. Presently, the Parent Company’s only material un-hedged exposure to variable interest rate debt relates to indebtedness under its senior secured credit facility. On a consolidated basis, of the Company’s $15.5 billion of total non-recourse debt outstanding as of December 31, 2011, approximately $4.2 billion bore interest at variable rates that were not subject to a derivative instrument which fixed the interest rate.
50
In addition to utilizing non-recourse debt at a subsidiary level when available, the Parent Company provides a portion, or in certain instances all, of the remaining long-term financing or credit required to fund development, construction or acquisition of a particular project. These investments have generally taken the form of equity investments or intercompany loans, which are subordinated to the project’s non-recourse loans. We generally obtain the funds for these investments from our cash flows from operations, proceeds from the sales of assets and/or the proceeds from our issuances of debt, common stock and other securities. Similarly, in certain of our businesses, the Parent Company may provide financial guarantees or other credit support for the benefit of counterparties who have entered into contracts for the purchase or sale of electricity, equipment or other services with our subsidiaries or lenders. In such circumstances, if a business defaults on its payment or supply obligation, the Parent Company will be responsible for the business’ obligations up to the amount provided for in the relevant guarantee or other credit support. At December 31, 2011, the Parent Company had provided outstanding financial and performance-related guarantees or other credit support commitments to or for the benefit of our businesses, which were limited by the terms of the agreements, of approximately $340 million in aggregate (excluding investment commitments and those collateralized by letters of credit and other obligations discussed below).
As a result of the Parent Company’s below investment grade rating, counterparties may be unwilling to accept our general unsecured commitments to provide credit support. Accordingly, with respect to both new and existing commitments, the Parent Company may be required to provide some other form of assurance, such as a letter of credit, to backstop or replace our credit support. The Parent Company may not be able to provide adequate assurances to such counterparties. To the extent we are required and able to provide letters of credit or other collateral to such counterparties, this will reduce the amount of credit available to us to meet our other liquidity needs. At December 31, 2011, we had $12 million in letters of credit outstanding, provided under the senior secured credit facility, and $261 million in cash collateralized letters of credit outstanding outside of the senior secured credit facility. These letters of credit operate to guarantee performance relating to certain project development activities and business operations. During the quarter ended December 31, 2011, the Company paid letter of credit fees ranging from 0.250% to 3.250% per annum on the outstanding amounts.
We expect to continue to seek, where possible, non-recourse debt financing in connection with the assets or businesses that we or our affiliates may develop, construct or acquire. However, depending on local and global market conditions and the unique characteristics of individual businesses, non-recourse debt may not be available on economically attractive terms or at all. SeeGlobal Economic Conditions discussion above. If we decide not to provide any additional funding or credit support to a subsidiary project that is under construction or has near-term debt payment obligations and that subsidiary is unable to obtain additional non-recourse debt, such subsidiary may become insolvent, and we may lose our investment in that subsidiary. Additionally, if any of our subsidiaries lose a significant customer, the subsidiary may need to withdraw from a project or restructure the non-recourse debt financing. If we or the subsidiary choose not to proceed with a project or are unable to successfully complete a restructuring of the non-recourse debt, we may lose our investment in that subsidiary.
Many of our subsidiaries depend on timely and continued access to capital markets to manage their liquidity needs. The inability to raise capital on favorable terms, to refinance existing indebtedness or to fund operations and other commitments during times of political or economic uncertainty may have material adverse effects on the financial condition and results of operations of those subsidiaries. In addition, changes in the timing of tariff increases or delays in the regulatory determinations under the relevant concessions could affect the cash flows and results of operations of our businesses.
As of December 31, 2011, the Company had approximately $376 million of trade accounts receivable related to certain of its generation and utility businesses in Latin America classified as other long-term assets. These consist primarily of trade accounts receivable that, pursuant to amended agreements or government resolutions, have collection periods that extend beyond December 31, 2012, or one year past the balance sheet date. The Company is actively collecting these receivables and believes such amounts are collectible based on collection history and performance under agreements. Additionally, the current portion of these trade accounts receivable was $24 million at December 31, 2011.
51
Capital Expenditures
The Company spent $2.5 billion, $2.3 billion and $2.5 billion on capital expenditures in 2011, 2010 and 2009, respectively. A significant majority of these costs were funded with non-recourse debt consistent with our financial strategy. At December 31, 2011, the Company had a total of $1.4 billion of availability under long-term non-recourse construction credit facilities. As more fully described inKey Trends and Uncertainties above, we have taken steps to decrease the amount of new discretionary capital spending. We expect to continue funding projects that are currently in the construction phase using existing capital provided by these non-recourse credit facilities as supplemented by internally generated cash flows, Parent Company liquidity, contribution from existing or new partners and other funding sources. As a result, property, plant and equipment and long-term non-recourse debt are expected to increase over the next few years even though the rate of discretionary spending has decreased. While we believe we have the resources to continue funding the projects in construction, there can be no assurances that we will continue to fund all these existing construction efforts.
As of December 31, 2011, the Company had $9 million of commitments to invest in subsidiaries under construction and to purchase related equipment that were not included in the letters of credit discussed above. The Company expects to fund these net investment commitments in 2012. The exact payment schedules will be dictated by the construction milestones. We expect to fund these commitments from a combination of current liquidity and internally generated Parent Company cash flow.
Environmental Capital Expenditures
The Company continues to assess the possible need for capital expenditures associated with international, federal, regional and state regulation of GHG emissions from electric power generation facilities. Currently in the United States there is no Federal legislation establishing mandatory GHG emissions reduction programs (including CO2) affecting the electric power generating facilities of the Company’s subsidiaries. There are numerous state programs regulating GHG emissions from electric power generation facilities and there is a possibility that federal GHG legislation will be enacted within the next several years. Further, the EPA has adopted regulations pertaining to GHG emissions and has announced its intention to propose new regulations for electric generating units under Section 111 of the CAA. The EPA regulations and any subsequent Federal legislation, if enacted, may place significant costs on GHG emissions from fossil fuel-fired electric power generation facilities, particularly coal-fired facilities, and in order to comply, CO2 emitting facilities may be required to purchase additional GHG emissions allowances or offsets under cap-and-trade programs, pay a carbon tax or install new emission reduction equipment to capture or reduce the amount of GHG emitted from the facilities, in the event that reliable technology to do so is developed. The capital expenditures required to comply with any future GHG legislation or any GHG regulations could be significant and unless such costs can be passed on to customers or counterparties, such regulations could impair the profitability of some of the electric power generation facilities operated by our subsidiaries or render certain of them uneconomical to operate, either of which could have a material adverse effect on our consolidated results of operations and financial condition.
With respect to our operations outside the United States, certain of the businesses operated by the Company’s subsidiaries are subject to compliance with EU ETS and the Kyoto Protocol in certain countries and other country-specific programs to regulate GHG emissions. To date, compliance with the Kyoto Protocol and EU ETS has not had a material adverse effect on the Company’s consolidated results of operations, financial condition and cash flows because of, among other factors, the cost of GHG emission allowances and/or the ability of our businesses to pass the cost of purchasing such allowances on to customers or counterparties. However, in the event that such counterparties or regulatory authorities challenge our ability to pass these costs on, there can be no assurance that the Company and/or the relevant subsidiary would prevail in any such dispute. Furthermore, even if the Company and/or the relevant subsidiary does prevail, it would be subject to the cost and administrative burden associated with such dispute.
As discussed in Item 1.—Business—Regulatory Matters—Environmental and Land Use Regulations in the 2011 Form 10-K, in the United States there presently is no federal legislation establishing mandatory GHG emission reduction programs. In 2011, the Company’s subsidiaries operated businesses which had total approximate CO2 emissions of 74 million metric tons (ownership adjusted). Approximately 37.5 million metric tons of the 74 million metric tons were emitted in the U.S. (both figures ownership adjusted). Approximately 8.3 million metric tons were emitted in U.S. states participating in the RGGI. We believe that legislative or regulatory actions, if enacted, may require a material increase in capital expenditures at our subsidiaries.
52
In the future the actual impact on our subsidiaries’ capital expenditures from any potential federal program to regulate and reduce GHG emissions, if enacted, and the state and regional programs developed or in the process of development, or any EPA regulation of GHG emissions, will depend on a number of factors, including among others, the GHG reductions required under any such legislation or regulations, the cost of emissions reduction equipment, the price and availability of offsets, the extent to which our subsidiaries would be entitled to receive GHG emission allowances without having to purchase them, the quantity of allowances which our subsidiaries would have to purchase, the price of allowances, and our subsidiaries’ ability to recover or pass-through costs incurred to comply with any legislative or regulatory requirements that are ultimately imposed and the use of market-based compliance options such as cap-and-trade programs.
Income Taxes
We recognized tax expense of $631 million for the year ended December 31, 2011, while our cash payments for income taxes, net of refunds, totaled $971 million. The difference resulted primarily from cash payments related to the sale of two telecommunication companies in Brazil, the tax expense on which was recorded in gain from disposal of discontinued businesses. Tax expense was further impacted by a partial valuation allowance release at one of our Brazilian subsidiaries.
Consolidated Cash Flows
At December 31, 2011, cash and cash equivalents decreased $818 million from December 31, 2010 to $1.7 billion. The decrease in cash and cash equivalents was due to $2.9 billion of cash provided by operating activities, $4.9 billion of cash used for investing activities, $1.4 billion of cash provided by financing activities, an unfavorable effect of foreign currency exchange rates on cash of $122 million and an $86 million increase in cash of discontinued and held for sale businesses.
At December 31, 2010, cash and cash equivalents increased $768 million from December 31, 2009 to $2.5 billion. The increase in cash and cash equivalents was due to $3.5 billion of cash provided by operating activities, $2.0 billion of cash used for investing activities, $706 million of cash used for financing activities, favorable effect of foreign currency exchange rates on cash of $8 million and a $41 million decrease in cash of discontinued and held for sale businesses.
| | | | | | | | | | | | | | | | | | | | |
| | | | | | | | | | | | $ Change | |
| | | 2011 | | | 2010 | | | 2009 | | | 2011 vs. 2010 | | | 2010 vs. 2009 | |
| | | (in millions) | |
Net cash provided by (used in) operating activities | | $ | 2,884 | | | $ | 3,465 | | | $ | 2,211 | | | $ | (581 | ) | | $ | 1,254 | |
Net cash provided by (used in) investing activities | | $ | (4,906 | ) | | $ | (2,040 | ) | | $ | (1,917 | ) | | $ | (2,866 | ) | | $ | (123 | ) |
Net cash provided by (used in) financing activities | | $ | 1,412 | | | $ | (706 | ) | | $ | 610 | | | $ | 2,118 | | | $ | (1,316 | ) |
Operating Activities
Net cash provided by operating activities decreased $581 million, or 17%, to $2.9 billion during 2011 compared to 2010. This net decrease was primarily due to the following:
| | • | | a decrease of $354 million at our Latin American utilities businesses primarily driven by our businesses in Brazil due to higher income tax payments of which $84 million is due to the sale of Brazil Telecom in October 2011, for which the pre-tax net sales proceeds of $890 million are recorded in cash flows from investing activities, and a one-time cash savings of $107 million mainly related to the utilization of a tax credit received as a result of the REFIS program in 2010, lower accounts receivable collections at Eletropaulo and higher payments for energy purchases, operation and maintenance expenses and pension contributions. These impacts were partially offset by higher accounts receivable collections at Sul; |
| | • | | a decrease of $145 million at our North America generation businesses primarily due to reduced operations in New York prior to its deconsolidation in December 2011 and higher working capital requirements at Puerto Rico, partially offset by the deconsolidation of Thames; and |
| | • | | a decrease of $56 million at Masinloc in the Philippines due to lower gross margin. |
53
Although net income for the period increased $471 million for 2011, net cash provided by operating activities decreased $581 million during 2011. Included in net income for each period are items such as impairments and losses from discontinued operations, which have both decreased in 2011, which have contributed to the increase in net income for the period, but are largely excluded from net cash provided by operating activities because they are non-cash in nature or the underlying cash activity is appropriately classified as an investing or financing activity. Also, net cash provided by operating activities in 2010 was impacted by certain non-recurring items, as discussed above, which were not expected to recur in 2011. The Company does not expect a further decrease in net cash provided by operating activities to continue in 2012, when compared to 2011, however, it can provide no assurance that such trend will not continue.
Investing Activities
Net cash used for investing activities increased $2.9 billion, or 140%, to $4.9 billion during 2011 compared to 2010. This increase was largely attributable to the following:
| | • | | an increase of $3.3 billion in acquisitions, net of cash acquired, primarily due to the $3.4 billion acquisition of DPL in November 2011 and the $149 million acquisition of our equity investment in Entek in February and May 2011. These increases were offset by the acquisitions of Ballylumford in Northern Ireland and our equity investment in JHRH for $138 million and $35 million, respectively, during 2010; |
| | • | | an increase of $228 million in debt service reserves and other assets during 2011 compared to the 2010. During 2011, $284 million of funds were transferred to debt service reserves and other assets primarily related to the collateralization for a letter of credit of $222 million at the Parent Company for the Mong Duong project in Vietnam, $32 million for a construction retainage fee at Panama and $22 million at Kilroot. These increases were partially offset by a transfer out of debt service reserves and other assets for payment of rent of $33 million in New York; |
| | • | | a decrease of $132 million in proceeds from loan repayments during 2011. In 2010, we received $132 million in proceeds related to the repayment of the loan receivable from a wind development project in Brazil. There were no proceeds from loan repayments in 2011; and |
| | • | | an increase of $120 million in capital expenditures to $2.4 billion primarily due to increases in capital expenditures of $135 million for the Mong Duong project, and net increases of $128 million and $32 million at our Brazilian and African subsidiaries, respectively. These increases were partially offset by decreases in capital expenditures of $110 million at Maritza in Bulgaria and $86 million at Gener. |
These increases were partially offset by:
| | • | | an increase of $332 million in proceeds from the sale of businesses primarily due to the $890 million in net cash received for the Brazil Telecom sale in October 2011 and $36 million received from the sale of a 49% equity interest in Mong Duong. These were offset by a decrease in proceeds of $496 million related to the 2010 sale of our businesses in the Middle East as well as the final settlement proceeds of $99 million received in January 2010 from the termination of a management agreement with Kazakhmys PLC in Kazakhstan related to the 2008 sale of Ekibastuz and Maikuben; |
| | • | | an increase of $224 million from the sale of short-term investments, net of purchases, during 2011, primarily due to the increase of $135 million and $92 million at Gener and our Brazilian subsidiaries, respectively, due to the use of such investments to fund dividend distributions; and |
| | • | | an increase of $199 million of proceeds received from collection of a performance bond to compensate for construction delays at Maritza in Bulgaria. There were no proceeds from performance bonds in 2010. |
Financing Activities
Net cash provided by financing activities increased $2.1 billion, or 300%, to $1.4 billion during 2011 compared to net cash used for financing activities of $706 million during 2010. This increase was primarily attributable to the following:
| | • | | an increase of $3.3 billion in proceeds from issuances of recourse and non-recourse debt, primarily due to a $3.3 billion increase at the Parent Company used to partially fund the acquisition of DPL, as well as $625 million at IPALCO mostly used to refinance debt, offset by a decrease of $895 million at our Brazilian subsidiaries; |
54
| | • | | an increase of $359 million of net borrowings under revolving credit facilities primarily due to increases of $295 million at the Parent Company to fund, in part, the acquisition of DPL, $35 million at Alicura, $14 million at IPALCO and a net increase of $11 million attributable to discontinued operations; |
| | • | | a decrease of $166 million in repayments of recourse and non-recourse debt, attributable to decreases of $437 million at the Parent Company, $294 million at our Brazilian subsidiaries, $171 million at Andres, $133 million at Itabo, $103 million at Chigen, $42 million in New York, $23 million at our European Wind generation projects and $19 million at Kilroot. These decreases were partially offset by increases of $559 million at IPALCO, $337 million at Gener, $133 million at Sonel, $55 million at Maritza, and $20 million at Southland; and |
| | • | | a decrease of $157 million in distributions to noncontrolling interests, primarily due to $97 million related to distributions in connection with the sale of discontinued operations in the Middle East made in 2010, $69 million at our Armenia Mountain wind generation project, $53 million at our Brazilian subsidiaries, offset by an increase of $48 million at Gener. |
These increases were partially offset by:
| | • | | a $1.6 billion issuance of common stock net of transaction costs to China Investment Corporation in 2010; |
| | • | | an increase of $180 million in purchases of treasury stock under the Company’s common stock repurchase plan; and |
| | • | | an increase of $141 million in payments for financing fees primarily due to the issuance of debt at the Parent Company, Mong Duong and Gener. |
Contractual Obligations
A summary of our contractual obligations, commitments and other liabilities as of December 31, 2011 is presented in the table below, which excludes any businesses classified as discontinued operations or held-for-sale (in millions):
| | | | | | | | | | | | | | | | | | | | | | | | | | | | |
Contractual Obligations | | Total | | | Less than
1 year | | | 1-3
years | | | 4-5
years | | | 5 years
and more | | | Other | | | Footnote
Reference(9) | |
Debt Obligations(1) | | $ | 21,948 | | | $ | 2,417 | | | $ | 3,490 | | | $ | 4,146 | | | $ | 11,895 | | | $ | — | | | | 11 | |
Interest Payments on Long-Term Debt(2) | | | 10,397 | | | | 1,455 | | | | 2,667 | | | | 2,157 | | | | 4,118 | | | | — | | | | n/a | |
Capital Lease Obligations(3) | | | 178 | | | | 14 | | | | 21 | | | | 18 | | | | 125 | | | | — | | | | 12 | |
Operating Lease Obligations(4) | | | 1,007 | | | | 57 | | | | 112 | | | | 108 | | | | 730 | | | | — | | | | 12 | |
Sale/Leaseback Obligations | | | — | | | | — | | | | — | | | | — | | | | — | | | | — | | | | 12 | |
Electricity Obligations(5) | | | 35,107 | | | | 2,800 | | | | 4,446 | | | | 3,974 | | | | 23,887 | | | | — | | | | 12 | |
Fuel Obligations(6) | | | 10,156 | | | | 1,980 | | | | 1,977 | | | | 1,324 | | | | 4,875 | | | | — | | | | 12 | |
Other Purchase Obligations(7) | | | 15,841 | | | | 1,831 | | | | 2,663 | | | | 1,851 | | | | 9,496 | | | | — | | | | 12 | |
Other Long-term Liabilities Reflected on AES’s Consolidated Balance Sheet under GAAP(8) | | | 852 | | | | 7 | | | | 221 | | | | 87 | | | | 362 | | | | 175 | | | | n/a | |
| | | | | | | | | | | | | | | | | | | | | | | | | | | | |
Total | | $ | 95,486 | | | $ | 10,561 | | | $ | 15,597 | | | $ | 13,665 | | | $ | 55,488 | | | $ | 175 | | | | | |
| | | | | | | | | | | | | | | | | | | | | | | | | | | | |
| (1) | Includes recourse and non-recourse debt presented on the Consolidated Balance Sheet. Non-recourse debt borrowings are not a direct obligation of AES, the Parent Company. Recourse debt represents the direct borrowings of AES, the Parent Company. See Note 11—Debt to the Consolidated Financial Statements included in Item 8 of this Form 8-K which provides additional disclosure regarding these obligations. These amounts exclude capital lease obligations which are included in the capital lease category, see (3) below. |
| (2) | Interest payments are estimated based on final maturity dates of debt securities outstanding at December 31, 2011 and do not reflect anticipated future refinancing, early redemptions or new debt issuances. Variable rate interest obligations are estimated based on rates as of December 31, 2011. |
55
| (3) | Several AES subsidiaries have leases for operating and office equipment and vehicles that are classified as capital leases within Property, Plant and Equipment. Minimum contractual obligations include $106 million of imputed interest. |
| (4) | The Company was obligated under long-term noncancelable operating leases, primarily for office rental and site leases. |
| (5) | Operating subsidiaries of the Company have entered into contracts for the purchase of electricity from third parties. |
| (6) | Operating subsidiaries of the Company have entered into fuel purchase contracts subject to termination only in certain limited circumstances. |
| (7) | Amounts relate to other contractual obligations where the Company has an enforceable and legally binding agreement to purchase goods or services that specifies all significant terms, including: quantity, pricing, and approximate timing. These amounts include planned capital expenditures that are contractually obligated. |
| (8) | These amounts do not include current liabilities on the Consolidated Balance Sheet except for the current portion of uncertain tax obligations. Noncurrent uncertain tax obligations are reflected in the “Other” column of the table above as the Company is not able to reasonably estimate the timing of the future payments. In addition, the amounts do not include: (1) regulatory liabilities (See Note 10—Regulatory Assets and Liabilities), (2) contingencies (See Note 13—Contingencies), (3) pension and other post retirement employee benefit liabilities (see Note 14—Benefit Plans) or (4) any taxes (See Note 21—Income Taxes) except for uncertain tax obligations, as the Company is not able to reasonably estimate the timing of future payments. See the indicated notes to the Consolidated Financial Statements included in Item 8 of this Form 8-K for additional information on the items excluded. Derivatives (See Note 6—Derivative Instruments and Hedging Activities) and incentive compensation are excluded as the Company is not able to reasonably estimate the timing or amount of the future payments. |
| (9) | For further information see the note referenced below in Item 8.—Financial Statements and Supplementary Data. |
Parent Company Liquidity
The following discussion of “Parent Company Liquidity” has been included because we believe it is a useful measure of the liquidity available to The AES Corporation, or the Parent Company, given the non-recourse nature of most of our indebtedness. Parent Company liquidity as outlined below is a non-GAAP measure and should not be construed as an alternative to cash and cash equivalents which are determined in accordance with GAAP, as a measure of liquidity. Cash and cash equivalents are disclosed in the Consolidated Statements of Cash Flows and the Parent Only Unconsolidated Statements of Cash Flows in Schedule I of this Form 8-K. Parent Company liquidity may differ from similarly titled measures used by other companies. The principal sources of liquidity at the Parent Company level are:
| | • | | dividends and other distributions from our subsidiaries, including refinancing proceeds; |
| | • | | proceeds from debt and equity financings at the Parent Company level, including availability under our credit facilities; and |
| | • | | proceeds from asset sales. |
Cash requirements at the Parent Company level are primarily to fund:
| | • | | principal repayments of debt; |
| | • | | construction commitments; |
| | • | | other equity commitments; |
56
| | • | | Parent Company overhead and development costs; and |
| | • | | dividends on our common stock. |
The Company defines Parent Company Liquidity as cash available to the Parent Company plus available borrowings under existing credit facilities. The cash held at qualified holding companies represents cash sent to subsidiaries of the Company domiciled outside of the U.S. Such subsidiaries have no contractual restrictions on their ability to send cash to the Parent Company. Parent Company Liquidity is reconciled to its most directly comparable U.S. GAAP financial measure, “cash and cash equivalents” at December 31, 2011 and 2010 as follows:
| | | | | | | | |
Parent Company Liquidity | | 2011 | | | 2010 | |
| | | (in millions) | |
Cash and cash equivalents | | $ | 1,704 | | | $ | 2,522 | |
Less: Cash and cash equivalents at subsidiaries | | | (1,504 | ) | | | (1,400 | ) |
| | | | | | | | |
Parent and qualified holding companies cash and cash equivalents | | | 200 | | | | 1,122 | |
| | | | | | | | |
Commitments under Parent credit facilities | | | 800 | | | | 800 | |
Less: Letters of credit under the credit facilities | | | (12 | ) | | | (85 | ) |
Less: Borrowings under the credit facilities | | | (295 | ) | | | — | |
| | | | | | | | |
Borrowings available under Parent credit facilities | | | 493 | | | | 715 | |
| | | | | | | | |
Total Parent Company Liquidity | | $ | 693 | | | $ | 1,837 | |
| | | | | | | | |
The decrease in Parent Company Liquidity is primarily driven by the closing of the DPL Inc. acquisition in the fourth quarter of 2011 as well as new investments in Vietnam and Turkey.
Recourse Debt Transactions:
During the year ended December 31, 2011, the Company issued recourse debt of $2.05 billion as outlined below. The proceeds of the debt were used to partially finance the Company’s acquisition of DPL as discussed further in Note 23—Acquisitions and Dispositions.
On May 27, 2011, the Company secured a $1.05 billion term loan under a senior secured credit facility (the “senior secured term loan”). The senior secured term loan bears annual interest, at the Company’s option, at a variable rate of LIBOR plus 3.25% or Base Rate plus 2.25%, and matures in 2018. The senior secured term loan is subject to certain customary representations, covenants and events of default.
On June 15, 2011, the Company issued $1 billion aggregate principal amount of 7.375% senior unsecured notes maturing July 1, 2021 (the “7.375% 2021 Notes”). Upon a change of control, the Company must offer to repurchase the 7.375% 2021 Notes at a price equal to 101% of principal, plus accrued and unpaid interest. The 7.375% 2021 Notes are also subject to certain covenants restricting the ability of the Company to incur additional secured debt; to enter into sale-lease back transactions; to consolidate, merge, convey or transfer substantially all of its assets; as well as other covenants and events of default that are customary for debt securities similar to the 7.375% 2021 Notes. The Company entered into interest rate locks in May 2011 to hedge the risk of changes in LIBOR until the issuance of the 7.375% 2021 Notes. The Company paid $24 million to settle those interest rate locks as of June 15, 2011. The payment was recognized in accumulated other comprehensive loss and is being amortized over the life of the 7.375% 2021 Notes as an adjustment to interest expense using the effective yield method.
Recourse Debt:
Our recourse debt at year-end was approximately $6.5 billion and $4.6 billion in 2011 and 2010, respectively. The following table sets forth our Parent Company contingent contractual obligations as of December 31, 2011:
| | | | | | | | | | |
Contingent contractual obligations | | Amount | | | Number of
Agreements | | | Maximum Exposure Range for
Each Agreement |
| | | (in millions) | | | | | | (in millions) |
Guarantees(1) | | $ | 340 | | | | 20 | | | <$1 - $53 |
Letters of credit under the senior secured credit facility | | | 12 | | | | 11 | | | <$1 - $7 |
Cash collateralized letters of credit | | | 261 | | | | 13 | | | <$1 - $221 |
| | | | | | | | | | |
Total | | $ | 613 | | | | 44 | | | |
| | | | | | | | | | |
| (1) | Excludes guarantees of $11 million related to discontinued operations and held for sale businesses. |
57
As of December 31, 2011, the Company had $9 million of commitments to invest in subsidiaries under construction and to purchase related equipment that were not included in the letters of credit discussed above. The Company expects to fund these net investment commitments in 2012. The exact payment schedules will be dictated by the construction milestones. We expect to fund these commitments from a combination of current liquidity and internally generated Parent Company cash flow.
We have a diverse portfolio of performance related contingent contractual obligations. These obligations are designed to cover potential risks and only require payment if certain targets are not met or certain contingencies occur. The risks associated with these obligations include change of control, construction cost overruns, subsidiary default, political risk, tax indemnities, spot market power prices, sponsor support and liquidated damages under power sales agreements for projects in development, in operation and under construction. While we do not expect that we will be required to fund any material amounts under these contingent contractual obligations during 2012 or beyond, many of the events which would give rise to such obligations are beyond our control. We can provide no assurance that we will be able to fund our obligations under these contingent contractual obligations if we are required to make substantial payments thereunder.
We have indicated our intent to declare a dividend in 2012. While we believe we will have sufficient liquidity to do so, we can provide no assurance we will be able to declare a dividend at the amount indicated, if at all.
While we believe that our sources of liquidity will be adequate to meet our needs for the foreseeable future, this belief is based on a number of material assumptions, including, without limitation, assumptions about our ability to access the capital markets (seeKey Trends and Uncertainties and Global Economic Conditions), the operating and financial performance of our subsidiaries, currency exchange rates, power market pool prices, and the ability of our subsidiaries to pay dividends. In addition, our subsidiaries’ ability to declare and pay cash dividends to us (at the Parent Company level) is subject to certain limitations contained in loans, governmental provisions and other agreements. We can provide no assurance that these sources will be available when needed or that the actual cash requirements will not be greater than anticipated. We have met our interim needs for shorter-term and working capital financing at the Parent Company level with our senior secured credit facility. See Item 1A.—Risk Factors, “The AES Corporation is a holding company and its ability to make payments on its outstanding indebtedness, including its public debt securities, is dependent upon the receipt of funds from its subsidiaries by way of dividends, fees, interest, loans or otherwise.” of the 2011 Form 10-K.
Various debt instruments at the Parent Company level, including our senior secured credit facility, contain certain restrictive covenants. The covenants provide for, among other items:
| | • | | limitations on other indebtedness, liens, investments and guarantees; |
| | • | | limitations on dividends, stock repurchases and other equity transactions; |
| | • | | restrictions and limitations on mergers and acquisitions, sales of assets, leases, transactions with affiliates and off-balance sheet and derivative arrangements; |
| | • | | maintenance of certain financial ratios; and |
| | • | | financial and other reporting requirements. |
As of December 31, 2011, we were in compliance with these covenants at the Parent Company level.
58
Non-Recourse Debt:
While the lenders under our non-recourse debt financings generally do not have direct recourse to the Parent Company, defaults thereunder can still have important consequences for our results of operations and liquidity, including, without limitation:
| | • | | reducing our cash flows as the subsidiary will typically be prohibited from distributing cash to the Parent Company during the time period of any default; |
| | • | | triggering our obligation to make payments under any financial guarantee, letter of credit or other credit support we have provided to or on behalf of such subsidiary; |
| | • | | causing us to record a loss in the event the lender forecloses on the assets; and |
| | • | | triggering defaults in our outstanding debt at the Parent Company. |
For example, our senior secured credit facilities and outstanding debt securities at the Parent Company include events of default for certain bankruptcy related events involving material subsidiaries. In addition, our revolving credit agreement at the Parent Company includes events of default related to payment defaults and accelerations of outstanding debt of material subsidiaries.
Some of our subsidiaries are currently in default with respect to all or a portion of their outstanding indebtedness. The total non-recourse debt classified as current in the accompanying Consolidated Balance Sheets amounts to $2.1 billion. The portion of current debt related to such defaults was $1.3 billion at December 31, 2011, all of which was non-recourse debt related to three subsidiaries—Maritza, Sonel and Kelanitissa.
None of the subsidiaries that are currently in default are subsidiaries that met the applicable definition of materiality under AES’s corporate debt agreements as of December 31, 2011 in order for such defaults to trigger an event of default or permit acceleration under such indebtedness. However, as a result of additional dispositions of assets, other significant reductions in asset carrying values or other matters in the future that may impact our financial position and results of operations or the financial position of the individual subsidiary, it is possible that one or more of these subsidiaries could fall within the definition of a “material subsidiary” and thereby upon an acceleration trigger an event of default and possible acceleration of the indebtedness under the AES Parent Company’s outstanding debt securities.
Non-Recourse Debt Transactions:
On October 3, 2011, Dolphin Subsidiary II, Inc. (“Dolphin II”), a newly formed, wholly-owned special purpose indirect subsidiary of AES, entered into an indenture (the “Indenture”) with Wells Fargo Bank, N.A. (the “Trustee”) as part of its issuance of $450 million aggregate principal amount of 6.50% senior notes due 2016 (the “2016 Notes”) and $800 million aggregate principal amount of 7.25% senior notes due 2021 (the “7.25% 2021 Notes”, together with the 2016 Notes, the “notes”) to finance the acquisition (the “Acquisition”) of DPL. Upon closing of the acquisition on November 28, 2011, Dolphin II was merged into DPL with DPL being the surviving entity and obligor. The 2016 Notes and the 7.25% 2021 Notes are included under “Notes and bonds” in the non-recourse detail table above. See Note 23—Acquisitions and Dispositionsfor further information.
Interest on the 2016 Notes and the 7.25% 2021 Notes accrues at a rate of 6.50% and 7.25% per year, respectively, and is payable on April 15 and October 15 of each year, beginning April 15, 2012. Prior to September 15, 2016 with respect to the 2016 Notes and July 15, 2021 with respect to the 7.25% 2021 Notes, DPL may redeem some or all of the 2016 Notes or 7.25% 2021 Notes at par, plus a “make-whole” amount set forth in the Indenture and accrued and unpaid interest. At any time on or after September 15, 2016 or July 15, 2021 with respect to the 2016 Notes and 7.25% 2021 Notes, respectively, DPL may redeem some or all of the 2016 Notes or 7.25% 2021 Notes at par plus accrued and unpaid interest. The proceeds from issuance of the notes were used to partially finance the DPL acquisition.
59
| ITEM 8. | FINANCIAL STATEMENTS AND SUPPLEMENTARY DATA |
REPORT OF INDEPENDENT REGISTERED PUBLIC ACCOUNTING FIRM
The Board of Directors and Stockholders of The AES Corporation:
We have audited the accompanying consolidated balance sheets of The AES Corporation as of December 31, 2011 and 2010, and the related consolidated statements of operations, comprehensive income, cash flows and changes in equity for each of the three years in the period ended December 31, 2011. Our audits also included the financial statement schedules listed in Exhibit 99.1. These financial statements and schedules are the responsibility of the Company’s management. Our responsibility is to express an opinion on these financial statements and schedules based on our audits.
We conducted our audits in accordance with the standards of the Public Company Accounting Oversight Board (United States). Those standards require that we plan and perform the audit to obtain reasonable assurance about whether the financial statements are free of material misstatement. An audit includes examining, on a test basis, evidence supporting the amounts and disclosures in the financial statements. An audit also includes assessing the accounting principles used and significant estimates made by management, as well as evaluating the overall financial statement presentation. We believe that our audits provide a reasonable basis for our opinion.
In our opinion, the financial statements referred to above present fairly, in all material respects, the consolidated financial position of The AES Corporation at December 31, 2011 and 2010, and the consolidated results of its operations and its cash flows for each of the three years in the period ended December 31, 2011, in conformity with U.S. generally accepted accounting principles. Also, in our opinion, the related financial statement schedules, when considered in relation to the basic financial statements taken as a whole, present fairly, in all material respects, the information set forth therein.
As discussed in Note 1 to the consolidated financial statements, in 2010 The AES Corporation changed its method of accounting for the consolidation of variable interest entities with the adoption of amendments to Financial Accounting Standards Board (“FASB”) Accounting Standards Codification (“ASC”) 810,Consolidation, and its method of accounting for transfers and servicing of financial assets with the adoption of the amendments to FASB ASC 860,Transfers and Servicing, both effective January 1, 2010.
We also have audited, in accordance with the standards of the Public Company Accounting Oversight Board (United States), The AES Corporation’s internal control over financial reporting as of December 31, 2011, based on criteria established in Internal Control-Integrated Framework issued by the Committee of Sponsoring Organizations of the Treadway Commission and our report dated February 24, 2012 expressed an unqualified opinion thereon.
/s/ Ernst & Young LLP
McLean, Virginia
February 24, 2012, except for the impact of the matters discussed in Note 1 and Note 15 pertaining to the adoption of ASU 2011-05, Note 16 pertaining to segment and geographic information and Note 22 pertaining to discontinued operations, as to which the date is June 26, 2012
60
THE AES CORPORATION
CONSOLIDATED BALANCE SHEETS
DECEMBER 31, 2011 AND 2010
| | | | | | | | |
| | | 2011 | | | 2010 | |
| | | (in millions, except share | |
| | | and per share data) | |
ASSETS | | | | | | | | |
CURRENT ASSETS | | | | | | | | |
Cash and cash equivalents | | $ | 1,704 | | | $ | 2,522 | |
Restricted cash | | | 478 | | | | 387 | |
Short-term investments | | | 1,356 | | | | 1,718 | |
Accounts receivable, net of allowance for doubtful accounts of $273 and $295, respectively | | | 2,534 | | | | 2,244 | |
Inventory | | | 785 | | | | 549 | |
Receivable from affiliates | | | 7 | | | | 27 | |
Deferred income taxes - current | | | 454 | | | | 300 | |
Prepaid expenses | | | 157 | | | | 204 | |
Other current assets | | | 1,562 | | | | 1,024 | |
Current assets of discontinued and held for sale businesses | | | 191 | | | | 471 | |
| | | | | | | | |
Total current assets | | | 9,228 | | | | 9,446 | |
| | | | | | | | |
NONCURRENT ASSETS | | | | | | | | |
Property, Plant and Equipment: | | | | | | | | |
Land | | | 1,090 | | | | 1,119 | |
Electric generation, distribution assets and other | | | 31,143 | | | | 25,687 | |
Accumulated depreciation | | | (8,944 | ) | | | (8,447 | ) |
Construction in progress | | | 1,833 | | | | 4,434 | |
| | | | | | | | |
Property, plant and equipment, net | | | 25,122 | | | | 22,793 | |
| | | | | | | | |
Other Assets: | | | | | | | | |
Investments in and advances to affiliates | | | 1,422 | | | | 1,320 | |
Debt service reserves and other deposits | | | 876 | | | | 613 | |
Goodwill | | | 3,733 | | | | 1,271 | |
Other intangible assets, net of accumulated amortization of $164 and $151, respectively | | | 566 | | | | 448 | |
Deferred income taxes - noncurrent | | | 715 | | | | 589 | |
Other noncurrent assets | | | 2,331 | | | | 1,915 | |
Noncurrent assets of discontinued and held for sale businesses | | | 1,340 | | | | 2,116 | |
| | | | | | | | |
Total other assets | | | 10,983 | | | | 8,272 | |
| | | | | | | | |
TOTAL ASSETS | | $ | 45,333 | | | $ | 40,511 | |
| | | | | | | | |
LIABILITIES AND EQUITY | | | | | | | | |
CURRENT LIABILITIES | | | | | | | | |
Accounts payable | | $ | 2,014 | | | $ | 1,988 | |
Accrued interest | | | 327 | | | | 252 | |
Accrued and other liabilities | | | 3,398 | | | | 2,451 | |
Non-recourse debt - current, including $259 and $1,101, respectively, related to variable interest entities | | | 2,123 | | | | 2,503 | |
Recourse debt - current | | | 305 | | | | 463 | |
Current liabilities of discontinued and held for sale businesses | | | 279 | | | | 408 | |
| | | | | | | | |
Total current liabilities | | | 8,446 | | | | 8,065 | |
| | | | | | | | |
NONCURRENT LIABILITIES | | | | | | | | |
Non-recourse debt - noncurrent, including $1,156 and $1,152, respectively, related to variable interest entities | | | 13,412 | | | | 11,084 | |
Recourse debt - noncurrent | | | 6,180 | | | | 4,149 | |
Deferred income taxes - noncurrent | | | 1,328 | | | | 892 | |
Pension and other post-retirement liabilities | | | 1,729 | | | | 1,505 | |
Other noncurrent liabilities | | | 3,083 | | | | 2,532 | |
Noncurrent liabilities of discontinued and held for sale businesses | | | 1,348 | | | | 1,811 | |
| | | | | | | | |
Total noncurrent liabilities | | | 27,080 | | | | 21,973 | |
| | | | | | | | |
Commitments and Contingencies (see Notes 12 and 13) | | | | | | | | |
Cumulative preferred stock of subsidiaries | | | 78 | | | | 60 | |
EQUITY | | | | | | | | |
THE AES CORPORATION STOCKHOLDERS’ EQUITY | | | | | | | | |
Common stock ($0.01 par value, 1,200,000,000 shares authorized; 807,573,277 issued and 765,186,316 outstanding at December 31, 2011 and 804,894,313 issued and 787,607,240 outstanding at December 31, 2010) | | | 8 | | | | 8 | |
Additional paid-in capital | | | 8,507 | | | | 8,444 | |
Retained earnings | | | 678 | | | | 620 | |
Accumulated other comprehensive loss | | | (2,758 | ) | | | (2,383 | ) |
Treasury stock, at cost (42,386,961 and 17,287,073 shares at December 31, 2011 and 2010, respectively | | | (489 | ) | | | (216 | ) |
| | | | | | | | |
Total The AES Corporation stockholders’ equity | | | 5,946 | | | | 6,473 | |
NONCONTROLLING INTERESTS | | | 3,783 | | | | 3,940 | |
| | | | | | | | |
Total equity | | | 9,729 | | | | 10,413 | |
| | | | | | | | |
TOTAL LIABILITIES AND EQUITY | | $ | 45,333 | | | $ | 40,511 | |
| | | | | | | | |
See Accompanying Notes to these Consolidated Financial Statements
61
THE AES CORPORATION
CONSOLIDATED STATEMENTS OF OPERATIONS
YEARS ENDED DECEMBER 31, 2011, 2010, AND 2009
| | | | | | | | | | | | |
| | | 2011 | | | 2010 | | | 2009 | |
| | | (in millions, except per share amounts) | |
Revenue: | | | | | | | | | | | | |
Regulated | | $ | 9,504 | | | $ | 8,910 | | | $ | 7,601 | |
Non-Regulated | | | 7,624 | | | | 6,775 | | | | 5,373 | |
| | | | | | | | | | | | |
Total revenue | | | 17,128 | | | | 15,685 | | | | 12,974 | |
| | | | | | | | | | | | |
Cost of Sales: | | | | | | | | | | | | |
Regulated | | | (7,134 | ) | | | (6,532 | ) | | | (5,542 | ) |
Non-Regulated | | | (5,924 | ) | | | (5,282 | ) | | | (4,138 | ) |
| | | | | | | | | | | | |
Total cost of sales | | | (13,058 | ) | | | (11,814 | ) | | | (9,680 | ) |
| | | | | | | | | | | | |
Gross margin | | | 4,070 | | | | 3,871 | | | | 3,294 | |
| | | | | | | | | | | | |
General and administrative expenses | | | (391 | ) | | | (391 | ) | | | (339 | ) |
Interest expense | | | (1,553 | ) | | | (1,451 | ) | | | (1,406 | ) |
Interest income | | | 400 | | | | 408 | | | | 344 | |
Other expense | | | (154 | ) | | | (234 | ) | | | (104 | ) |
Other income | | | 149 | | | | 100 | | | | 458 | |
Gain on sale of investments | | | 8 | | | | — | | | | 132 | |
Goodwill impairment | | | (17 | ) | | | (21 | ) | | | (122 | ) |
Asset impairment expense | | | (225 | ) | | | (389 | ) | | | (20 | ) |
Foreign currency transaction gains (losses) | | | (38 | ) | | | (33 | ) | | | 35 | |
Other non-operating expense | | | (82 | ) | | | (7 | ) | | | (12 | ) |
| | | | | | | | | | | | |
INCOME FROM CONTINUING OPERATIONS BEFORE TAXES AND EQUITY IN EARNINGS OF AFFILIATES | | | 2,167 | | | | 1,853 | | | | 2,260 | |
Income tax expense | | | (631 | ) | | | (575 | ) | | | (553 | ) |
Net equity in earnings (losses) of affiliates | | | (2 | ) | | | 183 | | | | 91 | |
| | | | | | | | | | | | |
INCOME FROM CONTINUING OPERATIONS | | | 1,534 | | | | 1,461 | | | | 1,798 | |
Income (loss) from operations of discontinued businesses, net of income tax expense (benefit) of $(23), $(266) and $48, respectively | | | (90 | ) | | | (466 | ) | | | 107 | |
Gain (loss) from disposal of discontinued businesses, net of income tax expense (benefit) of $300, $132 and $0, respectively | | | 86 | | | | 64 | | | | (150 | ) |
| | | | | | | | | | | | |
NET INCOME | | | 1,530 | | | | 1,059 | | | | 1,755 | |
Noncontrolling interests: | | | | | | | | | | | | |
Less: Income from continuing operations attributable to noncontrolling interests | | | (1,083 | ) | | | (985 | ) | | | (1,080 | ) |
Less: Income from discontinued operations attributable to noncontrolling interests | | | (389 | ) | | | (65 | ) | | | (17 | ) |
| | | | | | | | | | | | |
Total net income attributable to noncontrolling interests | | | (1,472 | ) | | | (1,050 | ) | | | (1,097 | ) |
| | | | | | | | | | | | |
NET INCOME ATTRIBUTABLE TO THE AES CORPORATION | | $ | 58 | | | $ | 9 | | | $ | 658 | |
| | | | | | | | | | | | |
BASIC EARNINGS (LOSS) PER SHARE: | | | | | | | | | | | | |
Income from continuing operations attributable to The AES Corporation common stockholders, net of tax | | $ | 0.58 | | | $ | 0.62 | | | $ | 1.08 | |
Discontinued operations attributable to The AES Corporation common stockholders, net of tax | | | (0.51 | ) | | | (0.61 | ) | | | (0.09 | ) |
| | | | | | | | | | | | |
NET INCOME ATTRIBUTABLE TO THE AES CORPORATION COMMON STOCKHOLDERS | | $ | 0.07 | | | $ | 0.01 | | | $ | 0.99 | |
| | | | | | | | | | | | |
DILUTED EARNINGS (LOSS) PER SHARE: | | | | | | | | | | | | |
Income from continuing operations attributable to The AES Corporation common stockholders, net of tax | | $ | 0.58 | | | $ | 0.62 | | | $ | 1.07 | |
Discontinued operations attributable to The AES Corporation common stockholders, net of tax | | | (0.51 | ) | | | (0.61 | ) | | | (0.09 | ) |
| | | | | | | | | | | | |
NET INCOME ATTRIBUTABLE TO THE AES CORPORATION COMMON STOCKHOLDERS | | $ | 0.07 | | | $ | 0.01 | | | $ | 0.98 | |
| | | | | | | | | | | | |
AMOUNTS ATTRIBUTABLE TO THE AES CORPORATION COMMON STOCKHOLDERS: | | | | | | | | | | | | |
Income from continuing operations, net of tax | | $ | 451 | | | $ | 476 | | | $ | 718 | |
Discontinued operations, net of tax | | | (393 | ) | | | (467 | ) | | | (60 | ) |
| | | | | | | | | | | | |
Net income | | $ | 58 | | | $ | 9 | | | $ | 658 | |
| | | | | | | | | | | | |
See Accompanying Notes to these Consolidated Financial Statements
62
THE AES CORPORATION
CONSOLIDATED STATEMENTS OF COMPREHENSIVE INCOME
YEARS ENDED DECEMBER 31, 2011, 2010, AND 2009
| | | | | | | | | | | | |
| | | 2011 | | | 2010 | | | 2009 | |
| | | (in millions) | |
NET INCOME | | $ | 1,530 | | | $ | 1,059 | | | $ | 1,755 | |
Available-for-sale securities activity: | | | | | | | | | | | | |
Change in fair value of available-for-sale securities, net of income tax (expense) benefit of $0, $3 and $(4), respectively | | | 1 | | | | (5 | ) | | | 8 | |
Reclassification to earnings, net of income tax (expense) benefit of $0, $0 and $0, respectively | | | (2 | ) | | | — | | | | (2 | ) |
| | | | | | | | | | | | |
Total change in fair value of available-for-sale securities | | | (1 | ) | | | (5 | ) | | | 6 | |
| | | |
Foreign currency translation activity: | | | | | | | | | | | | |
Foreign currency translation adjustments, net of income tax (expense) benefit of $18, $(11) and $(78), respectively | | | (484 | ) | | | 468 | | | | 746 | |
Reclassification to earnings, net of income tax (expense) benefit of $0, $0 and $0, respectively | | | 188 | | | | 142 | | | | (4 | ) |
| | | | | | | | | | | | |
Total foreign currency translation adjustments | | | (296 | ) | | | 610 | | | | 742 | |
| | | |
Derivative activity: | | | | | | | | | | | | |
Change in derivative fair value, net of income tax (expense) benefit of $108, $56 and $34, respectively | | | (379 | ) | | | (242 | ) | | | 214 | |
Reclassification to earnings, net of income tax (expense) benefit of $(22), $(41) and $(41), respectively | | | 137 | | | | 162 | | | | (141 | ) |
| | | | | | | | | | | | |
Total change in fair value of derivatives | | | (242 | ) | | | (80 | ) | | | 73 | |
| | | |
Pension activity: | | | | | | | | | | | | |
Net actuarial (loss) for the period, net of income tax (expense) benefit of $117, $57 and $70, respectively | | | (223 | ) | | | (111 | ) | | | (139 | ) |
Amortization of net actuarial loss, net of income tax (expense) benefit of $(6), $(12) and $(1), respectively | | | 13 | | | | 23 | | | | — | |
| | | | | | | | | | | | |
Total pension adjustments | | | (210 | ) | | | (88 | ) | | | (139 | ) |
| | | | | | | | | | | | |
OTHER COMPREHENSIVE INCOME (LOSS) | | | (749 | ) | | | 437 | | | | 682 | |
| | | | | | | | | | | | |
COMPREHENSIVE INCOME (LOSS) | | | 781 | | | | 1,496 | | | | 2,437 | |
Less: Comprehensive income attributable to noncontrolling interests | | | (1,098 | ) | | | (1,108 | ) | | | (1,485 | ) |
| | | | | | | | | | | | |
COMPREHENSIVE INCOME (LOSS) ATTRIBUTABLE TO THE AES CORPORATION | | $ | (317 | ) | | $ | 388 | | | $ | 952 | |
| | | | | | | | | | | | |
See Accompanying Notes to these Consolidated Financial Statements
63
THE AES CORPORATION
CONSOLIDATED STATEMENTS OF CASH FLOWS
YEARS ENDED DECEMBER 31, 2011, 2010, AND 2009
| | | | | | | | | | | | |
| | | 2011 | | | 2010 | | | 2009 | |
| | | (in millions) | |
OPERATING ACTIVITIES: | | | | | | | | | | | | |
Net income | | $ | 1,530 | | | $ | 1,059 | | | $ | 1,755 | |
Adjustments to net income: | | | | | | | | | | | | |
Depreciation and amortization | | | 1,262 | | | | 1,178 | | | | 1,049 | |
(Gain) loss from sale of investments and impairment expense | | | 386 | | | | 1,313 | | | | 57 | |
(Gain) loss on disposal and impairment write-down - discontinued operations | | | (388 | ) | | | (209 | ) | | | 150 | |
Provision for deferred taxes | | | (199 | ) | | | (418 | ) | | | 15 | |
Contingencies | | | 30 | | | | 37 | | | | (122 | ) |
(Gain) loss on the extinguishment of debt | | | 62 | | | | 34 | | | | (6 | ) |
Undistributed gain from sale of equity method investment | | | — | | | | (106 | ) | | | — | |
Other | | | 149 | | | | (31 | ) | | | (99 | ) |
Changes in operating assets and liabilities, net of effects of acquisitions: | | | | | | | | | | | | |
(Increase) decrease in accounts receivable | | | (236 | ) | | | (98 | ) | | | 62 | |
(Increase) decrease in inventory | | | (141 | ) | | | 10 | | | | (34 | ) |
(Increase) decrease in prepaid expenses and other current assets | | | (7 | ) | | | 385 | | | | 147 | |
(Increase) decrease in other assets | | | (403 | ) | | | (248 | ) | | | (177 | ) |
Increase (decrease) in accounts payable and other current liabilities | | | 322 | | | | 136 | | | | (308 | ) |
Increase (decrease) income taxes and other income tax payables, net | | | 166 | | | | 166 | | | | 88 | |
Increase (decrease) in other liabilities | | | 351 | | | | 257 | | | | (366 | ) |
| | | | | | | | | | | | |
Net cash provided by operating activities | | | 2,884 | | | | 3,465 | | | | 2,211 | |
| | | | | | | | | | | | |
INVESTING ACTIVITIES: | | | | | | | | | | | | |
Capital expenditures | | | (2,430 | ) | | | (2,310 | ) | | | (2,520 | ) |
Acquisitions - net of cash acquired | | | (3,562 | ) | | | (254 | ) | | | — | |
Proceeds from the sale of businesses, net of cash sold | | | 927 | | | | 595 | | | | 2 | |
Proceeds from the sale of assets | | | 117 | | | | 23 | | | | 17 | |
Sale of short-term investments | | | 6,075 | | | | 5,786 | | | | 4,526 | |
Purchase of short-term investments | | | (5,860 | ) | | | (5,795 | ) | | | (4,248 | ) |
(Increase) decrease in restricted cash | | | 61 | | | | (104 | ) | | | 302 | |
(Increase) decrease in debt service reserves and other assets | | | (284 | ) | | | (56 | ) | | | 185 | |
Affiliate advances and equity investments | | | (155 | ) | | | (97 | ) | | | (155 | ) |
Proceeds from loan repayments | | | — | | | | 132 | | | | — | |
Proceeds from performance bond | | | 199 | | | | — | | | | — | |
Other investing | | | 6 | | | | 40 | | | | (26 | ) |
| | | | | | | | | | | | |
Net cash used in investing activities | | | (4,906 | ) | | | (2,040 | ) | | | (1,917 | ) |
| | | | | | | | | | | | |
FINANCING ACTIVITIES: | | | | | | | | | | | | |
Issuance of common stock | | | — | | | | 1,567 | | | | — | |
Borrowings under the revolving credit facilities, net | | | 437 | | | | 78 | | | | 11 | |
Issuance of recourse debt | | | 2,050 | | | | — | | | | 503 | |
Issuance of non-recourse debt | | | 3,218 | | | | 1,940 | | | | 1,997 | |
Repayments of recourse debt | | | (476 | ) | | | (914 | ) | | | (154 | ) |
Repayments of non-recourse debt | | | (2,217 | ) | | | (1,945 | ) | | | (1,008 | ) |
Payments for financing fees | | | (202 | ) | | | (61 | ) | | | (91 | ) |
Distributions to noncontrolling interests | | | (1,088 | ) | | | (1,245 | ) | | | (846 | ) |
Contributions from noncontrolling interests | | | 6 | | | | — | | | | 190 | |
Financed capital expenditures | | | (31 | ) | | | (23 | ) | | | (18 | ) |
Purchase of treasury stock | | | (279 | ) | | | (99 | ) | | | — | |
Other financing | | | (6 | ) | | | (4 | ) | | | 26 | |
| | | | | | | | | | | | |
Net cash (used in) provided by financing activities | | | 1,412 | | | | (706 | ) | | | 610 | |
Effect of exchange rate changes on cash | | | (122 | ) | | | 8 | | | | 22 | |
(Increase) decrease in cash of discontinued and held for sale businesses | | | (86 | ) | | | 41 | | | | (16 | ) |
| | | | | | | | | | | | |
Total increase (decrease) in cash and cash equivalents | | | (818 | ) | | | 768 | | | | 910 | |
Cash and cash equivalents, beginning | | | 2,522 | | | | 1,754 | | | | 844 | |
| | | | | | | | | | | | |
| | | |
Cash and cash equivalents, ending | | $ | 1,704 | | | $ | 2,522 | | | $ | 1,754 | |
| | | | | | | | | | | | |
SUPPLEMENTAL DISCLOSURES: | | | | | | | | | | | | |
Cash payments for interest, net of amounts capitalized | | $ | 1,442 | | | $ | 1,462 | | | $ | 1,395 | |
Cash payments for income taxes, net of refunds | | $ | 971 | | | $ | 698 | | | $ | 484 | |
SCHEDULE OF NONCASH INVESTING AND FINANCING ACTIVITIES: | | | | | | | | | | | | |
Assets acquired in noncash asset exchange | | $ | 20 | | | $ | 42 | | | $ | 111 | |
See Accompanying Notes to these Consolidated Financial Statements
64
THE AES CORPORATION
CONSOLIDATED STATEMENTS OF CHANGES IN EQUITY
YEARS ENDED DECEMBER 31, 2011, 2010, AND 2009
| | | | | | | | | | | | | | | | | | | | | | | | | | | | | | | | |
| | | THE AES CORPORATION STOCKHOLDERS | | | | |
| | | | | | | | | | | | Retained | | | Accumulated | | | | |
| | | | | | | | | Additional | | | Earnings | | | Other | | | | |
| | | Common Stock | | | Treasury Stock | | | Paid-In | | | (Accumulated | | | Comprehensive | | | Noncontrolling | |
| | | Shares | | | Amount | | | Shares | | | Amount | | | Capital | | | Deficit) | | | Loss | | | Interests | |
| | | (in millions) | |
Balance at January 1, 2009 | | | 673.5 | | | $ | 7 | | | | 10.7 | | | $ | (144 | ) | | $ | 6,832 | | | $ | (8 | ) | | $ | (3,018 | ) | | $ | 3,358 | |
Net income | | | — | | | | — | | | | — | | | | — | | | | — | | | | 658 | | | | — | | | | 1,097 | |
Change in fair value of available-for-sale securities, net of income tax | | | — | | | | — | | | | — | | | | — | | | | — | | | | — | | | | 6 | | | | — | |
Foreign currency translation adjustment, net of income tax | | | — | | | | — | | | | — | | | | — | | | | — | | | | — | | | | 271 | | | | 471 | |
Change in derivative fair value, including a reclassification to earnings, net of income tax | | | — | | | | — | | | | — | | | | — | | | | — | | | | — | | | | 40 | | | | 33 | |
Change in unfunded pensions obligation, net of income tax | | | — | | | | — | | | | — | | | | — | | | | — | | | | — | | | | (23 | ) | | | (116 | ) |
Capital contributions from noncontrolling interests | | | — | | | | — | | | | — | | | | — | | | | — | | | | — | | | | — | | | | 195 | |
Distributions to noncontrolling interests | | | — | | | | — | | | | — | | | | — | | | | — | | | | — | | | | — | | | | (825 | ) |
Disposition of businesses | | | — | | | | — | | | | — | | | | — | | | | — | | | | — | | | | — | | | | (8 | ) |
Issuance of treasury stock | | | — | | | | — | | | | (1.2 | ) | | | 18 | | | | (20 | ) | | | — | | | | — | | | | — | |
Issuance of common stock under benefit plans and exercise of stock options, net of income tax | | | 3.7 | | | | — | | | | — | | | | — | | | | 18 | | | | — | | | | — | | | | — | |
Stock compensation | | | — | | | | — | | | | — | | | | — | | | | 38 | | | | — | | | | — | | | | — | |
| | | | | | | | | | | | | | | | | | | | | | | | | | | | | | | | |
Balance at December 31, 2009 | | | 677.2 | | | $ | 7 | | | | 9.5 | | | $ | (126 | ) | | $ | 6,868 | | | $ | 650 | | | $ | (2,724 | ) | | $ | 4,205 | |
| | | | | | | | | | | | | | | | | | | | | | | | | | | | | | | | |
Net income | | | — | | | | — | | | | — | | | | — | | | | — | | | | 9 | | | | — | | | | 1,050 | |
Change in fair value of available-for-sale securities, net of income tax | | | — | | | | — | | | | — | | | | — | | | | — | | | | — | | | | (5 | ) | | | — | |
Foreign currency translation adjustment, net of income tax | | | — | | | | — | | | | — | | | | — | | | | — | | | | — | | | | 486 | | | | 124 | |
Change in derivative fair value, including a reclassification to earnings, net of income tax | | | — | | | | — | | | | — | | | | — | | | | — | | | | — | | | | (80 | ) | | | — | |
Change in unfunded pensions obligation, net of income tax | | | — | | | | — | | | | — | | | | — | | | | — | | | | — | | | | (22 | ) | | | (66 | ) |
Cumulative effect of consolidation of entities under variable interest entity accounting guidance | | | — | | | | — | | | | — | | | | — | | | | — | | | | (47 | ) | | | (38 | ) | | | 15 | |
Cumulative effect of deconsolidation of entities under variable interest entity accounting guidance | | | — | | | | — | | | | — | | | | — | | | | — | | | | 1 | | | | — | | | | — | |
Capital contributions from noncontrolling interests | | | — | | | | — | | | | — | | | | — | | | | — | | | | — | | | | — | | | | 35 | |
Distributions to noncontrolling interests | | | — | | | | — | | | | — | | | | — | | | | — | | | | — | | | | — | | | | (1,220 | ) |
Disposition of businesses | | | — | | | | — | | | | — | | | | — | | | | — | | | | — | | | | — | | | | (208 | ) |
Acquisition of treasury stock | | | — | | | | — | | | | 8.4 | | | | (99 | ) | | | — | | | | — | | | | — | | | | — | |
Issuance of common stock | | | 125.5 | | | | 1 | | | | — | | | | — | | | | 1,566 | | | | — | | | | — | | | | — | |
Issuance of common stock under benefit plans and exercise of stock options, net of income tax | | | 2.2 | | | | — | | | | (0.6 | ) | | | 9 | | | | 9 | | | | — | | | | — | | | | — | |
Stock compensation | | | — | | | | — | | | | — | | | | — | | | | 26 | | | | — | | | | — | | | | — | |
Changes in the carrying amount of redeemable stock of subsidiaries | | | — | | | | — | | | | — | | | | — | | | | — | | | | 7 | | | | — | | | | — | |
Acquisition of subsidiary shares from noncontrolling interests | | | — | | | | — | | | | — | | | | — | | | | (25 | ) | | | — | | | | — | | | | 5 | |
| | | | | | | | | | | | | | | | | | | | | | | | | | | | | | | | |
Balance at December 31, 2010 | | | 804.9 | | | $ | 8 | | | | 17.3 | | | $ | (216 | ) | | $ | 8,444 | | | $ | 620 | | | $ | (2,383 | ) | | $ | 3,940 | |
| | | | | | | | | | | | | | | | | | | | | | | | | | | | | | | | |
Net income | | | — | | | | — | | | | — | | | | — | | | | — | | | | 58 | | | | — | | | | 1,472 | |
Change in fair value of available-for-sale securities, net of income tax | | | — | | | | — | | | | — | | | | — | | | | — | | | | — | | | | (1 | ) | | | — | |
Foreign currency translation adjustment, net of income tax | | | — | | | | — | | | | — | | | | — | | | | — | | | | — | | | | (143 | ) | | | (153 | ) |
Change in derivative fair value, including a reclassification to earnings, net of income tax | | | — | | | | — | | | | — | | | | — | | | | — | | | | — | | | | (190 | ) | | | (52 | ) |
Change in unfunded pensions obligation, net of income tax | | | — | | | | — | | | | — | | | | — | | | | — | | | | — | | | | (41 | ) | | | (169 | ) |
Capital contributions from noncontrolling interests | | | — | | | | — | | | | — | | | | — | | | | — | | | | — | | | | — | | | | 8 | |
Distributions to noncontrolling interests | | | — | | | | — | | | | — | | | | — | | | | — | | | | — | | | | — | | | | (1,254 | ) |
Disposition of businesses | | | — | | | | — | | | | — | | | | — | | | | — | | | | — | | | | — | | | | (27 | ) |
Acquisition of treasury stock | | | — | | | | — | | | | 25.5 | | | | (279 | ) | | | — | | | | — | | | | — | | | | — | |
Issuance of common stock under benefit plans and exercise of stock options, net of income tax | | | 2.7 | | | | — | | | | (0.4 | ) | | | 6 | | | | 18 | | | | — | | | | — | | | | — | |
Stock compensation | | | — | | | | — | | | | — | | | | — | | | | 26 | | | | — | | | | — | | | | — | |
Net gain on sale of subsidiary shares to noncontrolling interests | | | — | | | | — | | | | — | | | | — | | | | 19 | | | | — | | | | — | | | | — | |
Sale of subsidiary shares to noncontrolling interests | | | — | | | | — | | | | — | | | | — | | | | — | | | | — | | | | — | | | | 16 | |
Acquisition of subsidiary shares from noncontrolling interests | | | — | | | | — | | | | — | | | | — | | | | — | | | | — | | | | — | | | | 2 | |
| | | | | | | | | | | | | | | | | | | | | | | | | | | | | | | | |
Balance at December 31, 2011 | | | 807.6 | | | $ | 8 | | | | 42.4 | | | $ | (489 | ) | | $ | 8,507 | | | $ | 678 | | | $ | (2,758 | ) | | $ | 3,783 | |
| | | | | | | | | | | | | | | | | | | | | | | | | | | | | | | | |
See Accompanying Notes to these Consolidated Financial Statements
65
THE AES CORPORATION
NOTES TO CONSOLIDATED FINANCIAL STATEMENTS
DECEMBER 31, 2011, 2010, AND 2009
1. GENERAL AND SUMMARY OF SIGNIFICANT ACCOUNTING POLICIES
The AES Corporation is a holding company (the “Parent Company”) that through its subsidiaries and affiliates, (collectively, “AES” or “the Company”) operates a geographically diversified portfolio of electricity generation and distribution businesses. Generally, given this holding company structure, the liabilities of the individual operating entities are not recourse to the parent and are isolated to the operating entities. Most of our operating entities are structured as limited liability entities, which limit the liability of shareholders. The structure is generally the same regardless of whether a subsidiary is consolidated under a voting or variable interest model.
On November 28, 2011, AES completed its acquisition of 100% common stock of DPL Inc. (“DPL”), the parent company of Dayton Power & Light Company (“DP&L”), a utility based in Ohio, pursuant to the terms and conditions of a definitive agreement (the “Merger Agreement”) dated April 19, 2011. Upon completion of the acquisition, DPL became a wholly owned subsidiary of AES. DPL’s operating results for the period November 28, 2011 through December 31, 2011 have been included in the Consolidated Statement of Operations with no comparable amounts for 2010. In accordance with the accounting guidance on business combinations, DPL’s net assets acquired and liabilities assumed in the acquisition have been included in the Consolidated Balance Sheet beginning on November 28, 2011. See Note 23—Acquisitions and Dispositions for additional information.
CORRECTION OF AN ERROR—Certain amounts related to the dispositions of businesses presented in the Consolidated Statement of Changes in Equity in our 2010 Form 10-K were incorrectly excluded from consolidated comprehensive income for the period because the Company failed to reflect the change in foreign currency translation adjustments and derivative fair value as an offset to net income for the period in the determination of comprehensive income for four business dispositions in 2010. As a result, comprehensive income was understated by $213 million; it was previously reported as $1,283 million and has now been restated to $1,496 million for the year ended December 31, 2010. There was no impact on amounts presented on the Consolidated Balance Sheet as of December 31, 2010 or the Consolidated Statement of Operations and Statement of Cash Flows for the year ended December 31, 2010.
PRINCIPLES OF CONSOLIDATION—The Consolidated Financial Statements of the Company include the accounts of The AES Corporation, its subsidiaries and controlled affiliates. Furthermore, variable interest entities (“VIEs”) in which the Company has a variable interest have been consolidated where the Company is the primary beneficiary. Investments in which the Company has the ability to exercise significant influence, but not control, are accounted for using the equity method of accounting. All intercompany transactions and balances have been eliminated in consolidation.
A VIE is an entity (a) that has a total equity investment at risk that is not sufficient to finance its activities without additional subordinated financial support or (b) where the group of equity holders does not have (i) the ability to make significant decisions about the entity’s activities, (ii) the obligation to absorb the entity’s expected losses or (iii) the right to receive the entity’s expected residual returns or (c) where the voting rights of some equity holders are not proportional to their obligations to absorb expected losses, receive expected residual returns, or both, and substantially all of the entity’s activities either involve or are conducted on behalf of an investor that has disproportionately few voting rights.
The determination of which party has the power to direct the activities that most significantly impact the economic performance of the VIE could require significant judgment and assumptions. That determination considers the purpose and design of the business, the risks that the business was designed to create and pass along to other entities, the activities of the business that can be directed and which party can direct them, and the expected relative impact of those activities on the economic performance of the business through its life. The businesses for which significant judgment and assumptions were required were primarily certain generation businesses who have power purchase agreements (“PPAs”) to sell energy exclusively or primarily to a single counterparty for the term of those agreements. For these generation businesses, the counterparty has the power to dispatch energy and, in some instances, to make decisions regarding the sale of excess energy. As such, the counterparty has the power to direct certain activities that significantly impact the economic performance of the business primarily through the cash flows and gross margin, if any, earned by the business from the sale of energy to the counterparty and sometimes through the counterparty’s absorption of fuel price risk. However, the counterparty usually does not have the power
66
to direct any of the other activities that could significantly impact the economic performance. These other activities include: daily operation and management, maintenance, repairs and capital expenditures, plant expansion, decisions regarding the overall financing of ongoing operations and budgets and, in some instances, decisions regarding the sale of excess energy. As such, AES has the power to direct some activities of the business that significantly impact its economic performance, primarily through the cash flows and gross margin earned from capacity payments received from being available to produce energy and from the sale of energy to other entities (particularly during any period beyond the end of the power purchase agreement). For these businesses, the determination as to which set of activities most significantly impact the economic performance of the business requires significant judgment and the use of assumptions. The Company concluded that the activities directed by the counterparty were less significant than those directed by AES.
DP&L has undivided interests in seven generation facilities and numerous transmission facilities. These undivided interests in jointly-owned facilities are accounted for on a pro rata basis in our consolidated financial statements. Certain expenses, primarily fuel costs for the generating units, are allocated to the joint owners based on their energy usage. The remaining expenses, investments in fuel inventory, plant materials and operating supplies and capital additions are allocated to the joint owners in accordance with their respective ownership interests.
Deconsolidations
Thames—AES Thames, LLC (“Thames”), a 208 MW coal–fired plant in Connecticut, filed petitions for bankruptcy protection under Chapter 11 in the U.S. Bankruptcy Court on February 1, 2011. Effective that date, the Company lost control of the business and was no longer able to exercise significant influence over its operating and financial policies. In accordance with the accounting guidance on consolidation, Thames was deconsolidated on February 1, 2011 and was subsequently accounted for as a cost method investment. At the time of deconsolidation, Thames had total assets and total liabilities of $158 million and $170 million, respectively. Subsequently, the Company paid $5 million in satisfaction of a pre-existing guarantee. On January 23, 2012, Thames’ request to convert to Chapter 7 liquidation was approved indicating the resolution of bankruptcy proceedings. Prior period operating results of Thames have been classified as discontinued operations. See Note 22—Discontinued Operations and Held for Sale Businesses for further information.
Eastern Energy—On December 30, 2011, AES Eastern Energy Limited Partnership (“AES Eastern Energy”) and 13 affiliated entities and on December 31, 2011, AES New York Equity, LLC filed petitions for bankruptcy protection under Chapter 11 in the U.S. Bankruptcy Court (collectively referred to as the “New York entities”). Effective that date, the Company lost control of the business and was no longer able to exercise significant influence over its operating and financial policies. In accordance with the accounting guidance on consolidation, the New York entities were deconsolidated at December 31, 2011 and are now accounted for as a cost method investment. At the time of deconsolidation, the New York entities had total assets and total liabilities of $166 million and $289 million, respectively. A net gain of $123 million has been deferred pending the resolution of the bankruptcy proceedings. Prior period operating results of Eastern Energy have been classified as discontinued operations. See Note 22—Discontinued Operations and Held for Sale Businesses for further information.
Borsod—AES Borsod Kft (“Borsod”), a Hungarian subsidiary formerly operating two generation plants in Hungary, entered liquidation on November 7, 2011. Effective that date, the Company lost control of the business and was no longer able to exercise significant influence over its operating and financial policies. In accordance with the accounting guidance on consolidation, Borsod was deconsolidated and is now accounted for as a cost method investment. At the time of deconsolidation, Borsod had total assets and total liabilities of $9 million and $18 million, respectively. A net gain of $9 million has been deferred pending the resolution of liquidation proceedings. Prior period operating results of Borsod have been classified as discontinued operations. See Note 22—Discontinued Operations and Held for Sale Businesses for further information.
USE OF ESTIMATES—The preparation of these consolidated financial statements in conformity with accounting principles generally accepted in the United States of America (“U.S. GAAP”) requires the Company to make estimates and assumptions that affect reported amounts of assets and liabilities and disclosures of contingent assets and liabilities at the date of the consolidated financial statements, as well as the reported amounts of revenue and expenses during the reporting period. Actual results could differ from those estimates. Items subject to such estimates and assumptions include: the carrying amount and estimated useful lives of long-lived assets; impairment of goodwill, long-lived assets and equity method investments; valuation allowances for receivables and deferred tax assets; the recoverability of deferred regulatory assets; the estimation of deferred regulatory liabilities; the fair value of financial instruments; the fair value of assets and liabilities acquired in a business combination accounted for
67
under the purchase method; the determination of noncontrolling interest using the hypothetical liquidation at book value (“HLBV”) method for certain wind generation partnerships; pension liabilities; environmental liabilities; and potential litigation claims and settlements.
On January 1, 2011, the Company changed its estimates related to depreciation on property, plant and equipment at its Brazilian concessionary utility and generation businesses. Based on information received from regulators, the depreciation rates and salvage values for its concession assets were adjusted on a prospective basis to reflect a remuneration basis, which represents the reimbursement expected by the Company at the end of the respective concession periods. For the year ended December 31, 2011, the impact to the consolidated statement of operations was an increase in depreciation expense of $68 million and a decrease in net income attributable to The AES Corporation of $18 million, or $0.02 per share.
DISCONTINUED OPERATIONS AND RECLASSIFICATIONS—A discontinued operation is a component of the Company that either has been disposed of or is classified as held for sale. A component of the Company comprises operations and cash flows that can be clearly distinguished, operationally and for financial reporting purposes, from the rest of the Company. Prior period amounts have been retrospectively revised to reflect the businesses determined to be discontinued operations, as further discussed in Note 22—Discontinued Operations and Held for Sale Businesses. Cash flows at discontinued and held for sale businesses are included within the relevant categories within operating, investing and financing activities. As cash at such businesses is reported within Current assets of discontinued and held for sale businesses, the aggregate amount of cash flows is offset by the net (increase) decrease in cash of discontinued and held for sale businesses, which is presented as a separate line item in the Consolidated Statements of Cash Flows.
COMPREHENSIVE INCOME—In June 2011, the FASB issued ASU No. 2011-05, “Comprehensive Income (Topic 220): Presentation of Comprehensive Income” (“ASU No. 2011-05”) which requires comprehensive income to be reported in either a single statement or in two consecutive statements reporting net income and other comprehensive income. The amendment does not change what items are reported in other comprehensive income or the U.S. GAAP requirement to report the reclassification of items from other comprehensive income to net income. The Company adopted ASU No. 2011-05 on January 1, 2012 and chose to report comprehensive income in two consecutive statements by adding a new consolidated statement of comprehensive income. To be consistent with this new presentation, the Company has presented consolidated statements of comprehensive income for each year in three-year period ended December 31, 2011 in these consolidated financial statements. As ASU No. 2011-05 impacts financial statement presentation only, the adoption did not have an impact on the Company’s historical financial position or results of operations and is not expected to have an impact in future periods.
FAIR VALUE—Fair value, as defined in the fair value measurement accounting guidance, is the price that would be received to sell an asset or paid to transfer a liability in an orderly transaction between market participants at the measurement date, or exit price. The Company applies the fair value measurement accounting guidance to financial assets and liabilities in determining the fair value of investments in marketable debt and equity securities, included in the consolidated balance sheet line items “Short-term investments” and “Other assets (noncurrent),” derivative assets, included in “Other current assets” and “Other assets (noncurrent)” and derivative liabilities, included in “Accrued and other liabilities (current)” and “Other long-term liabilities.” The Company applies the fair value measurement guidance to nonfinancial assets and liabilities upon the acquisition of a business or in conjunction with the measurement of an impairment loss on an asset group or goodwill under the accounting guidance for the impairment of long-lived assets or goodwill.
The fair value measurement accounting guidance requires that the Company make assumptions that market participants would use in pricing an asset or liability based on the best information available. These factors include nonperformance risk (the risk that the obligation will not be fulfilled) and credit risk of the reporting entity (for liabilities) and of the counterparty (for assets). The fair value measurement guidance prohibits the inclusion of transaction costs and any adjustments for blockage factors in determining the instruments’ fair value. The principal or most advantageous market should be considered from the perspective of the reporting entity.
Fair value, where available, is based on observable quoted market prices. Where observable prices or inputs are not available, several valuation models and techniques are applied. These models and techniques attempt to maximize the use of observable inputs and minimize the use of unobservable inputs. The process involves varying levels of management judgment, the degree of which is dependent on the price transparency of the instruments or market and the instruments’ complexity.
68
To increase consistency and enhance disclosure of fair value, the fair value measurement accounting guidance creates a fair value hierarchy to prioritize the inputs used to measure fair value into three categories. An asset or liability’s level within the fair value hierarchy is based on the lowest level of input significant to the fair value measurement, where Level 1 is the highest and Level 3 is the lowest. The three levels are defined as follows:
Level 1—unadjusted quoted prices in active markets accessible by the reporting entity for identical assets or liabilities. Active markets are those in which transactions for the asset or liability occur with sufficient frequency and volume to provide pricing information on an ongoing basis.
Level 2—pricing inputs other than quoted market prices included in Level 1 which are based on observable market data, that are directly or indirectly observable for substantially the full term of the asset or liability. These include quoted market prices for similar assets or liabilities, quoted market prices for identical or similar assets in markets that are not active, adjusted quoted market prices, inputs from observable data such as interest rate and yield curves, volatilities or default rates observable at commonly quoted intervals or inputs derived from observable market data by correlation or other means. The fair value of most over-the-counter derivatives derived from internal valuation models using market inputs and most investments in marketable debt securities qualify as Level 2.
Level 3—pricing inputs that are unobservable, or less observable, from objective sources. Unobservable inputs are only used to the extent observable inputs are not available. These inputs maintain the concept of an exit price from the perspective of a market participant and should reflect assumptions of other market participants. An entity should consider all market participant assumptions that are available without unreasonable cost and effort. These are given the lowest priority and are generally used in internally developed methodologies to generate management’s best estimate of the fair value when no observable market data is available. The fair value of the Company’s reporting units determined using a discounted cash flows valuation model for goodwill impairment assessment and the fair value of the Company’s long-lived asset groups determined using a discounted cash flows valuation model for the long-lived asset impairment assessments qualify as Level 3.
Any transfers between the fair value hierarchy levels are recognized at the end of the reporting period.
CASH AND CASH EQUIVALENTS—The Company considers unrestricted cash on hand, deposits in banks, certificates of deposit and short-term marketable securities, with an original or remaining maturity at the date of acquisition of three months or less, to be cash and cash equivalents. The carrying amounts of such balances approximate fair value.
RESTRICTED CASH—Restricted cash includes cash and cash equivalents which are restricted as to withdrawal or usage. The nature of restrictions includes restrictions imposed by financing agreements such as security deposits kept as collateral, debt service reserves, maintenance reserves and others, as well as restrictions imposed by long-term PPAs. On December 31, 2011, the Company reclassified approximately $130 million from restricted cash to cash and cash equivalents as it did not view certain restrictions in the financing arrangements of certain subsidiaries to be substantive in nature. Amounts at December 31, 2010 were immaterial and therefore were not reclassified for comparative presentation purposes.
INVESTMENTS IN MARKETABLE SECURITIES—Short-term investments in marketable debt and equity securities consist of securities with original or remaining maturities in excess of three months but less than one year. The Company’s marketable investments are primarily unsecured debentures, certificates of deposit, government debt securities and money market funds.
Marketable debt securities that the Company has both the positive intent and ability to hold to maturity are classified as held-to-maturity and are carried at amortized cost. Other marketable securities that the Company does not intend to hold to maturity are classified as available-for-sale or trading and are carried at fair value. Available-for-sale investments are marked-to-market at the end of each reporting period, with unrealized holding gains or losses, which represent changes in the market value of the investment, reflected in accumulated other comprehensive loss (“AOCL”), a separate component of equity. In measuring the other-than-temporary impairment of debt securities, the Company identifies two components: 1) the amount representing the credit loss, which is recognized as “other non-operating expense” in the Consolidated Statements of Operations; and 2) the amount related to other factors, which is recognized in AOCL unless there is a plan to sell the security, in which case it would be recognized in earnings. The amount recognized in AOCL for held-to-maturity debt securities is then amortized in earnings over the remaining life of such securities.
69
Investments classified as trading are marked-to-market on a periodic basis through the Consolidated Statements of Operations. Interest and dividends on investments are reported in interest income and other income, respectively. Gains and losses on sales of investments are determined using the specific identification method.
See Note 4—Fair Value and the Company’s fair value policy for additional discussion regarding the determination of the fair value of the Company’s investments in marketable debt and equity securities.
ACCOUNTS AND NOTES RECEIVABLE AND ALLOWANCE FOR DOUBTFUL ACCOUNTS—Accounts and Notes receivable are carried at amortized cost. The Company periodically assesses the collectability of accounts receivable considering factors such as specific evaluation of collectability, historical collection experience, the age of accounts receivable and other currently available evidence of the collectability, and records an allowance for doubtful accounts for the estimated uncollectable amount as appropriate. Certain of our businesses charge interest on accounts receivable either under contractual terms or where charging interest is a customary business practice. In such cases, interest income is recognized on an accrual basis. In situations where the collection of interest is uncertain, interest income is recognized as cash is received. Individual accounts and notes receivable are written off when they are no longer deemed collectible. Included in “Noncurrent Other Assets” are long-term financing receivables of $295 million, primarily with certain Latin American governmental bodies. These receivables have contractual maturities of greater than one year and are being collected in installments. Of the total $295 million, amounts of $232 million and $49 million, respectively, relate to our businesses in Argentina and the Dominican Republic. The remaining amount relates to our distribution businesses in Brazil.
In April 2011, the FASB issued ASU No. 2011-02,Receivables (Topic 310), “A Creditor’s Determination of Whether a Restructuring Is a Troubled Debt Restructuring” which provides additional guidance and clarification to help creditors determine whether a creditor has granted a concession and whether a debtor is experiencing financial difficulties for purposes of determining whether a restructuring constitutes a troubled debt restructuring. The Company adopted ASU No. 2011-2 on July 1, 2011. The adoption did not have any impact on the Company’s financial position, results of operations or cash flows.
INVENTORY—Inventory primarily consists of coal, fuel oil and other raw materials used to generate power, and spare parts and supplies used to maintain power generation and distribution facilities. Inventory is carried at lower of cost or market. Cost is the sum of the purchase price and incidental expenditures and charges incurred to bring the inventory to its existing condition or location. Cost is determined under the first-in, first-out (“FIFO”), average cost or specific identification method. Generally, cost is reduced to market value if the market value of inventory has declined and it is probable that the utility of inventory, in its disposal in the ordinary course of business, will not be recovered through revenue earned from the generation of power.
LONG-LIVED ASSETS—Long-lived assets include property, plant and equipment, assets under capital leases and intangible assets subject to amortization (i.e., finite-lived intangible assets).
Property, plant and equipment
Property, plant and equipment are stated at cost, net of accumulated depreciation. The costs of renewals and improvements that extend the useful life of property, plant and equipment are capitalized.
Construction progress payments, engineering costs, insurance costs, salaries, interest and other costs directly relating to construction in progress are capitalized during the construction period, provided the completion of the project is deemed probable, or expensed at the time the Company determines that development of a particular project is no longer probable. The continued capitalization of such costs is subject to ongoing risks related to successful completion, including those related to government approvals, site identification, financing, construction permitting and contract compliance. Construction in progress balances are transferred to electric generation and distribution assets when an asset group is ready for its intended use. Government subsidies and income tax credits are recorded as a reduction to property, plant and equipment and reflected in cash flows from investing activities.
Depreciation, after consideration of salvage value and asset retirement obligations, is computed primarily using the straight-line method over the estimated useful lives of the assets, which are determined on a composite or component basis. Maintenance and repairs are charged to expense as incurred. Capital spare parts, including rotable spare parts, are included in electric generation and distribution assets. If the spare part is considered a component, it is depreciated over its useful life after the part is placed in service. If the spare part is deemed part of a composite asset, the part is depreciated over the composite useful life even when being held as a spare part.
70
Intangible Assets Subject to Amortization
Finite-lived intangible assets are amortized over their useful lives which range from 1 – 50 years. The Company accounts for purchased emission allowances as intangible assets and records an expense when utilized or sold. Granted emission allowances are valued at zero.
Impairment of Long-lived Assets
The Company evaluates the impairment of long-lived assets (asset group) using internal projections of undiscounted cash flows when circumstances indicate that the carrying amount of such assets may not be recoverable or the assets meet the held for sale criteria under the relevant accounting standards. Events or changes in circumstances that may necessitate a recoverability evaluation may include but are not limited to: adverse changes in the regulatory environment, unfavorable changes in power prices or fuel costs, increased competition due to additional capacity in the grid, technological advancements, declining trends in demand, an expectation that it is more likely than not that the asset will be disposed of before the end of its previously estimated useful life, etc. The carrying amount of a long-lived asset (asset group) may not be recoverable if it exceeds the sum of undiscounted cash flows expected to result from the use and eventual disposal of the asset (asset group). In such cases, fair value of the long-lived asset (asset group) is determined in accordance with the fair value measurement accounting guidance. The excess of carrying amount over fair value, if any, is recognized as an impairment expense. For regulated assets, an impairment expense could be reduced by the establishment of a regulatory asset, if recovery through approved rates was probable. For non-regulated assets, impairment is recognized as an expense against earnings.
DEFERRED FINANCING COSTS—Costs incurred in connection with the issuance of long-term debt are deferred and amortized over the related financing period using the effective interest method or the straight-line method when it does not differ materially from the effective interest method. Make-whole payments in connection with early debt retirements are classified as cash flows used in investing activities.
EQUITY METHOD INVESTMENTS—Investments in entities over which the Company has the ability to exercise significant influence, but not control, are accounted for using the equity method of accounting and reported in “Investments in and advances to affiliates” on the Consolidated Balance Sheets. The Company periodically assesses the recoverability of its equity method investments. If an identified event or change in circumstances requires an impairment evaluation, management assesses the fair value based on valuation methodologies, including discounted cash flows, estimates of sale proceeds and external appraisals, as appropriate. The difference between the carrying amount of the equity method investment and its estimated fair value is recognized as impairment when the loss in value is deemed other-than-temporary and included in “Other non-operating expense” in the Consolidated Statement of Operations.
The Company discontinues the application of the equity method when an investment is reduced to zero and the Company is not otherwise committed to provide further financial support to the investee. The Company resumes the application of the equity method if the investee subsequently reports net income to the extent that the Company’s share of such net income equals the share of net losses not recognized during the period in which the equity method of accounting was suspended.
GOODWILL AND INDEFINITE-LIVED INTANGIBLE ASSETS—The Company recognizes goodwill as an asset representing the future economic benefits arising from other assets acquired in a business combination that are not individually identified and separately recognized. The Company evaluates goodwill and indefinite-lived intangible assets for impairment on an annual basis and whenever events or changes in circumstances necessitate an evaluation for impairment. The Company’s annual impairment testing date is October 1.
Goodwill:
The Company evaluates goodwill impairment at the reporting unit level, which is an operating segment, as defined in the segment reporting accounting guidance, or a component (i.e., one level below an operating segment). In determining its reporting units, the Company starts with its management reporting structure. Operating segments are identified and then analyzed to identify components (usually businesses) which make up these operating segments. Two or more components are combined into a single reporting unit if they share the economic similarity criteria prescribed by the accounting guidance. Assets and liabilities are allocated to a reporting unit if the assets will be employed by or a liability relates to the operations of the reporting unit or would be considered by a market participant in determining its fair value. Goodwill resulting from an acquisition is assigned to the reporting units that are expected to benefit from the synergies of the acquisition. Generally, each AES business constitutes a reporting unit.
71
In December 2010, the FASB issued ASU No. 2010-28,Intangibles—Goodwill and Other (Topic 350), “When to Perform Step 2 of the Goodwill Impairment Test for Reporting Units with Zero or Negative Carrying Amounts”, which amended the accounting guidance related to goodwill. The amendment modified Step One of the goodwill impairment test for reporting units with zero or negative carrying amounts. For those reporting units, an entity is required to perform Step Two of the goodwill impairment test if it is more likely than not that a goodwill impairment exists, eliminating an entity’s ability to assert that a reporting unit is not required to perform Step Two because the carrying amount of the reporting unit is zero or negative, despite the existence of qualitative factors that indicate the goodwill is more likely than not impaired. In determining whether it is more likely than not that a goodwill impairment exists, an entity should consider whether there are any adverse qualitative factors indicating that an impairment may exist. The Company adopted ASU No. 2010-28 on January 1, 2011. The adoption did not have any impact on the Company as none of its reporting units with goodwill has a zero or negative carrying amount.
In September 2011, the FASB issued ASU No. 2011-08,Intangibles—Goodwill and Other (Topic 350), “Testing Goodwill for Impairment” which amended the existing guidance for goodwill impairment testing. Under the amendments in ASU No. 2011-08, an entity has the option to first assess qualitative factors to determine whether the existence of events or circumstances leads to a determination that it is more likely than not that the fair value of a reporting unit is less than its carrying amount. If, after this qualitative assessment, an entity determines that it is not more likely than not that the fair value of a reporting unit is less than its carrying amount, then performing the two-step impairment test is unnecessary. Also, an entity has the option to bypass the qualitative assessment for any reporting unit in any period and proceed directly to performing the first step of the two-step goodwill impairment test. The amendments did not change the existing accounting guidance on how Step 1 and Step 2 of the goodwill impairment test are performed. In addition, an entity is no longer permitted to carry forward its detailed calculation of a reporting unit’s fair value from a prior year as previously permitted under the existing guidance. ASU No. 2011-08 is effective for annual and interim goodwill impairment tests performed for fiscal periods beginning on or after December 15, 2011 and early adoption is permitted. AES elected to adopt ASU No. 2011-8 early for its 2011 annual goodwill impairment evaluations performed at October 1 each year and qualitatively assessed certain of its reporting units for goodwill impairment evaluation. The adoption did not have an impact on the Company’s financial position, results of operations or cash flows
Goodwill impairment evaluation is performed in two steps. In Step 1, the carrying amount of a reporting unit is compared to its fair value and if the fair value exceeds the carrying amount, Step 2 is unnecessary. If the carrying amount exceeds the reporting unit’s fair value, this could indicate potential impairment and Step 2 of the goodwill evaluation process is required to determine if goodwill is impaired and to measure the amount of impairment loss to recognize, if any. In determining the implied fair value of goodwill for impairment measurement, the accounting guidance requires measuring all assets and liabilities, including unrecognized assets and liabilities, at fair value, as would be done in a business combination. When a Step 2 analysis is required to be completed, the fair value of individual assets and liabilities is determined using valuations (which in some cases may be based in part on third party valuation reports), or other observable sources of fair value, as appropriate. If the carrying amount of goodwill exceeds its implied fair value, the excess is recognized as an impairment loss.
Most of the Company’s reporting units are not publicly traded. Therefore, the Company estimates the fair value of its reporting units under the fair value measurement accounting guidance which requires making assumptions that a market participant would make in a hypothetical sale transaction at the testing date. The fair value of a reporting unit is estimated using internal budgets and forecasts, adjusted for any market participants’ assumptions and discounted at the rate of return required by a market participant. The Company considers both market and income-based approaches to determine a range of fair value, but typically concludes that the value derived using an income-based approach is more representative of fair value due to the lack of direct market comparables. The Company does use market data to corroborate and determine the reasonableness of the fair value derived from the income-based discounted cash flow analysis.
Indefinite-lived Intangible Assets:
The Company’s indefinite-lived intangible assets primarily include land use rights, easements, concessions and trade name. These are tested for impairment on an annual basis or whenever events or changes in circumstances necessitate an evaluation for impairment. If the carrying amount of an intangible asset exceeds its fair value, the excess is recognized as impairment expense.
72
ACCOUNTS PAYABLE AND OTHER ACCRUED LIABILITIES—Accounts payable consists of amounts due to trade creditors related to the Company’s core business operations. The nature of these payables include amounts owed to vendors and suppliers for items such as energy purchased for resale, fuel, maintenance, inventory and other raw materials. Other accrued liabilities include items such as income taxes, regulatory liabilities, legal contingencies and employee related costs including payroll, benefits and related taxes.
REGULATORY ASSETS AND LIABILITIES—The Company accounts for certain of its regulated operations in accordance with the accounting standards on regulated operations. As a result, AES records assets and liabilities that result from the regulated ratemaking process that are not recognized under GAAP for non-regulated entities. Regulatory assets generally represent incurred costs that have been deferred due to the probability of future recovery in customer rates. Regulatory liabilities generally represent obligations to make refunds to customers. Management continually assesses whether the regulatory assets are probable of future recovery by considering factors such as applicable regulatory changes, recent rate orders applicable to other regulated entities and the status of any pending or potential deregulation legislation. If future recovery of costs previously deferred ceases to be probable, the related regulatory assets are written off and recognized in continuing operations.
PENSION AND OTHER POSTRETIREMENT PLANS—In accordance with the accounting guidance on defined benefit pension and other postretirement plans, the Company recognizes in its Consolidated Balance Sheets an asset or liability reflecting the funded status of pension and other postretirement plans with current year changes in the funded status recognized in AOCL, except for those plans at certain of the Company’s regulated utilities that can recover portions of their pension and postretirement obligations through future rates. All plan assets are recorded at fair value. AES follows the measurement date provisions of the accounting guidance, which require a year-end measurement date of plan assets and obligations for all defined benefit plans.
INCOME TAXES—Deferred tax assets and liabilities are recognized for the future tax consequences attributable to differences between the financial statement carrying amounts of the existing assets and liabilities, and their respective income tax bases. The Company establishes a valuation allowance when it is more likely than not that all or a portion of a deferred tax asset will not be realized. The Company’s tax positions are evaluated under a more-likely-than-not recognition threshold and measurement analysis before they are recognized for financial statement reporting.
Uncertain tax positions have been classified as noncurrent income tax liabilities unless expected to be paid within one year. The Company’s policy for interest and penalties related to income tax exposures is to recognize interest and penalties as a component of the provision for income taxes in the Consolidated Statements of Operations.
ASSET RETIREMENT OBLIGATIONS—In accordance with the accounting standards for asset retirement obligations, the Company records the fair value of the liability for a legal obligation to retire an asset in the period in which the obligation is incurred. When a new liability is recognized, the Company capitalizes the costs of the liability by increasing the carrying amount of the related long-lived asset. The liability is accreted to its present value each period and the capitalized cost is depreciated over the useful life of the related asset. Upon settlement of the obligation, the Company eliminates the liability and, based on the actual cost to retire, may incur a gain or loss.
NONCONTROLLING INTERESTS—Noncontrolling interests are classified as a separate component of equity in the Consolidated Balance Sheets and Consolidated Statements of Changes in Equity. Additionally, net income and comprehensive income attributable to noncontrolling interests are reflected separately from consolidated net income and comprehensive income in the Consolidated Statements of Operations and Consolidated Statements of Changes in Equity. Any change in ownership of a subsidiary while the controlling financial interest is retained is accounted for as an equity transaction between the controlling and noncontrolling interests. Losses continue to be attributed to the noncontrolling interests, even when the noncontrolling interests’ basis has been reduced to zero.
Although in general, the noncontrolling ownership interest in earnings is calculated based on ownership percentage, certain of the Company’s wind businesses use the HLBV method in consolidation. HLBV uses a balance sheet approach, which measures the Company’s equity in income or loss by calculating the change in the amount of net worth the partners are legally able to claim based on a hypothetical liquidation of the entity at the beginning of a reporting period compared to the end of that period. This method is used in Wind Generation partnerships which contain agreements designating different allocations of value among investors, where the allocations change in form or percentage over the life of the partnership.
73
GUARANTOR ACCOUNTING—In accordance with the accounting standards on guarantees, at the inception of a guarantee, the Company records the fair value of a guarantee as a liability, with the offset dependent on the circumstances under which the guarantee was issued.
TRANSFER OF FINANCIAL ASSETS—Effective January 1, 2010, the Company prospectively adopted the new accounting guidance on transfers of financial assets, which among other things: removes the concept of a qualifying special purpose entity; introduces the concept of participating interests and specifies that in order to qualify for sale accounting a partial transfer of a financial asset or a group of financial assets should meet the definition of a participating interest; clarifies that an entity should consider all arrangements made contemporaneously with or in contemplation of a transfer; and, requires enhanced disclosures to provide financial statement users with greater transparency about transfers of financial assets and a transferor’s continuing involvement with transfers of financial assets accounted for as sales. Upon adoption on January 1, 2010, the Company recognized $40 million as accounts receivable and as an associated secured borrowing on its Consolidated Balance Sheet; both have since increased to $50 million as of December 31, 2011, as additional interests in receivables have been sold. While securitizing these accounts receivable through IPL Funding, a special purpose entity, IPL, the Company’s integrated utility in Indianapolis, had previously recognized the transaction as a sale, but had not recognized the accounts receivable and secured borrowing on its balance sheet. Under the facility, interests in these accounts receivable are sold, on a revolving basis, to unrelated parties (the Purchasers) up to the lesser of $50 million or an amount determinable under the facility agreement. The Purchasers assume the risk of collection on the interest sold without recourse to IPL, which retains the servicing responsibilities for the interest sold. While no direct recourse to IPL exists, IPL risks loss in the event collections are not sufficient to allow for full recovery of the retained interests. No servicing asset or liability is recorded since the servicing fee paid to IPL approximates a market rate. Under the new accounting guidance, the retained interest in these securitized accounts receivable does not meet the definition of a participating interest, thereby requiring the Company to recognize on its Consolidated Balance Sheet the portion transferred and the proceeds received as accounts receivable and a secured borrowing, respectively.
FOREIGN CURRENCY TRANSLATION—A business’ functional currency is the currency of the primary economic environment in which the business operates and is generally the currency in which the business generates and expends cash. Subsidiaries and affiliates whose functional currency is a currency other than the U.S. Dollar translate their assets and liabilities into U.S. Dollars at the current exchange rates in effect at the end of the fiscal period. The revenue and expense accounts of such subsidiaries and affiliates are translated into U.S. Dollars at the average exchange rates that prevailed during the period. Translation adjustments are included in AOCL. Gains and losses on intercompany foreign currency transactions that are long-term in nature and which the Company does not intend to settle in the foreseeable future, are also recognized in AOCL. Gains and losses that arise from exchange rate fluctuations on transactions denominated in a currency other than the functional currency are included in determining net income.
REVENUE RECOGNITION—Revenue from Utilities is classified as regulated in the Consolidated Statements of Operations. Revenue from the sale of energy is recognized in the period during which the sale occurs. The calculation of revenue earned but not yet billed is based on the number of days not billed in the month, the estimated amount of energy delivered during those days and the estimated average price per customer class for that month. Differences between actual and estimated unbilled revenue are usually immaterial. The Company has businesses where it makes sales and purchases of power to and from Independent System Operators (“ISOs”) and Regional Transmission Organizations (“RTOs”). In those instances, the Company accounts for these transactions on a net hourly basis because the transactions are settled on a net hourly basis. Revenue from Generation businesses is classified as non-regulated and is recognized based upon output delivered and capacity provided, at rates as specified under contract terms or prevailing market rates. Certain of the Company PPAs meet the definition of an operating lease or contain similar arrangements. Typically, minimum lease payments from such PPAs are recognized as revenue on a straight line basis over the lease term whereas contingent rentals are recognized when earned. Revenue is recorded net of any taxes assessed on and collected from customers, which are remitted to the governmental authorities.
In October 2009, the FASB issued ASU No. 2009-13,Revenue Recognition (Topic 605), “Multiple-Deliverable Revenue Arrangements”, which amended the accounting guidance related to revenue recognition. The amended guidance provides primarily two changes to the prior guidance for multiple-element revenue arrangements. The first eliminated the requirement that there be “objective and reliable evidence” of fair value for any undelivered items in order for a delivered item to be treated as a separate unit of accounting. The second required that the
74
consideration from multiple-element revenue arrangements be allocated to all the deliverables based on their relative selling price at the inception of the arrangement. AES adopted the standard on January 1, 2011. AES elected prospective adoption and applied the revised guidance to all revenue arrangements entered into or materially modified after the date of adoption. The adoption of ASU No. 2009-13 did not have a material impact on the financial position and results of operations of AES and is not expected to have a material impact in future periods.
SHARE-BASED COMPENSATION—The Company grants share-based compensation in the form of stock options and restricted stock units. The Company accounts for stock-based compensation plans under the accounting guidance on stock-based compensation, which requires entities to recognize compensation costs relating to share-based payments in their financial statements. That cost is measured on the grant date based on the fair value of the equity or liability instrument issued and is expensed on a straight-line basis over the requisite service period, net of estimated forfeitures. Currently, the Company uses a Black-Scholes option pricing model to estimate the fair value of stock options granted to its employees.
GENERAL AND ADMINISTRATIVE EXPENSES—General and administrative expenses include corporate and other expenses related to corporate staff functions and initiatives, primarily executive management, finance, legal, human resources and information systems, which are not directly allocable to our business segments. Additionally, all costs associated with business development efforts are classified as general and administrative expenses.
DERIVATIVES AND HEDGING ACTIVITIES—Derivatives primarily consist of interest rate swaps, cross currency swaps, foreign currency instruments, and commodity and embedded derivatives. The Company enters into various derivative transactions in order to hedge its exposure to certain market risks. AES primarily uses derivative instruments to manage its interest rate, foreign currency and commodity exposures. The Company does not enter into derivative transactions for trading purposes.
Under the accounting standards for derivatives and hedging, the Company recognizes all contracts that meet the definition of a derivative, except those designated as normal purchase or normal sale at inception, as either assets or liabilities in the Consolidated Balance Sheets and measures those instruments at fair value. Changes in the fair value of derivatives are recognized in earnings unless specific hedge criteria are met. Gains and losses related to derivative instruments that qualify as hedges are recognized in the same category as generated by the underlying asset or liability. Gains or losses on derivatives that do not qualify for hedge accounting are recognized as interest expense for interest rate and cross currency derivatives, foreign currency transaction gains or losses for foreign currency derivatives, and non-regulated revenue or non-regulated cost of sales for commodity derivatives.
The accounting standards for derivatives and hedging enable companies to designate qualifying derivatives as hedging instruments based on the exposure being hedged. These hedge designations include fair value hedges and cash flow hedges. Changes in the fair value of a derivative that is highly effective, designated and qualifies as a fair value hedge are recognized in earnings as offsets to the changes in fair value of the exposure being hedged. The Company has no fair value hedges at this time. Changes in the fair value of a derivative that is highly effective, designated and qualifies as a cash flow hedge are deferred in AOCL and are recognized into earnings as the hedged transactions affect earnings. Any ineffectiveness is recognized in earnings immediately. The ineffective portion is recognized as interest expense for interest rate and cross currency hedges, foreign currency transaction gains or losses for foreign currency hedges, and non-regulated revenue or non-regulated cost of sales for commodity hedges. For all hedge contracts, the Company maintains formal documentation of the hedge and effectiveness testing in accordance with the accounting standards for derivatives and hedging. If AES determines that the derivative is not highly effective as a hedge, hedge accounting will be discontinued prospectively.
For cash flow hedges of forecasted transactions, AES estimates the future cash flows of the forecasted transactions and evaluates the probability of the occurrence and timing of such transactions. Changes in conditions or the occurrence of unforeseen events could require discontinuance of hedge accounting or could affect the timing of the reclassification of gains or losses on cash flow hedges from AOCL into earnings.
The Company has elected not to offset net derivative positions in the financial statements. Accordingly, the Company does not offset such derivative positions against the fair value of amounts (or amounts that approximate fair value) recognized for the right to reclaim cash collateral (a receivable) or the obligation to return cash collateral (a payable) under master netting arrangements.
See Note 4—Fair Value and the Company’s fair value policy for additional discussion regarding the determination of the fair value of the Company’s derivative assets and liabilities.
75
Accounting Pronouncements Issued But Not Yet Effective
The following accounting standards have been issued, but as of December 31, 2011 are not yet effective for and have not been adopted by AES.
ASU No. 2011-04, Fair Value Measurements (Topic 820), “Amendments to Achieve Common Fair Value Measurement and Disclosure Requirements in U.S. GAAP and IFRSs”
In May 2011, the FASB issued ASU No. 2011-04, which among other requirements, prohibits the use of the block discount factor for all fair value level hierarchies; permits an entity to measure the fair value of its financial instruments on a net basis when the related market risks are managed on a net basis; states the highest and best use concept is no longer relevant in the measurement of financial assets and liabilities; clarifies that a reporting entity should disclose quantitative information about the unobservable inputs used in Level 3 measurements and that the application of premiums and discounts is related to the unit of account for the asset or liability being measured at fair value; and requires expanded disclosures to describe the valuation process used for Level 3 measurements and the sensitivity of Level 3 measurements to changes in unobservable inputs. In addition, entities are required to disclose the hierarchy level for items which are not measured at fair value in the statement of financial position, but for which fair value is required to be disclosed. ASU No. 2011-04 is effective for the first interim or annual period beginning on or after December 15, 2011, or January 1, 2012 for AES. The adoption is not expected to have a material impact on the Company’s financial position, results of operations or cash flows.
ASU No. 2011-10, Property, Plant, and Equipment (Topic 360), “Derecognition of in Substance Real Estate—a Scope Clarification”
In December 2011, the FASB issued ASU No. 2011-10, which clarifies that when a parent (reporting entity) ceases to have a controlling financial interest (as described in Subtopic 810-10) in a subsidiary that is in substance real estate as a result of default on the subsidiary’s nonrecourse debt, the reporting entity should apply the guidance in Subtopic 360-20 to determine whether it should derecognize the in substance real estate. Generally, a reporting entity would not satisfy the requirements to derecognize the in substance real estate before the legal transfer of the real estate to the lender and the extinguishment of the related nonrecourse indebtedness. That is, even if the reporting entity ceases to have a controlling financial interest under Subtopic 810-10, the reporting entity would continue to include the real estate, debt, and the results of the subsidiary’s operations in its consolidated financial statements until legal title to the real estate is transferred to legally satisfy the debt. ASU No. 2011-10 should be applied on a prospective basis to deconsolidation events occurring after the effective date. Prior periods should not be adjusted even if the reporting entity has continuing involvement with previously derecognized in substance real estate entities. ASU No. 2011-10 is effective for fiscal years, and interim periods within those years, beginning on or after June 15, 2012. Early adoption is permitted. The adoption of ASU No. 2011-10 is not expected to have a material impact on the Company’s financial position and results of operations.
2. INVENTORY
As of December 31, 2011, 81% of the Company’s inventory was valued using average cost, 17% was determined using the FIFO method and the remaining inventory was valued using the specific identification method. The following table summarizes our inventory balances as of December 31, 2011 and 2010:
| | | | | | | | |
| | | December 31, | |
| | | 2011 | | | 2010 | |
| | | (in millions) | |
Coal, fuel oil and other raw materials | | $ | 444 | | | $ | 272 | |
Spare parts and supplies | | | 341 | | | | 277 | |
| | | | | | | | |
Total | | $ | 785 | | | $ | 549 | |
| | | | | | | | |
76
3. PROPERTY, PLANT & EQUIPMENT
The following table summarizes the components of the electric generation and distribution assets and other property, plant and equipment with their estimated useful lives:
| | | | | | | | | | |
| | | Estimated
Useful Life | | December 31, | |
| | | | 2011 | | | 2010 | |
| | | | | (in millions) | |
Electric generation and distribution facilities | | 5 - 69 yrs. | | $ | 26,905 | | | $ | 22,365 | |
Other buildings | | 3 - 50 yrs. | | | 2,924 | | | | 2,082 | |
Furniture, fixtures and equipment | | 3 - 31 yrs. | | | 476 | | | | 479 | |
Other | | 1 - 46 yrs. | | | 838 | | | | 761 | |
| | | | | | | | | | |
Total electric generation and distribution assets and other | | | | | 31,143 | | | | 25,687 | |
Accumulated depreciation | | | | | (8,944 | ) | | | (8,447 | ) |
| | | | | | | | | | |
Net electric generation and distribution assets and other(1) | | | | $ | 22,199 | | | $ | 17,240 | |
| | | | | | | | | | |
| (1) | Net electric generation and distribution assets and other related to our businesses included in discontinued operations or held for sale of $1.2 billion and $1.8 billion as of December 31, 2011 and 2010, respectively, were excluded from the table above and were included in the noncurrent assets of discontinued and held for sale businesses. |
The amounts in the table above are stated net of impairment losses recognized as further discussed in Note 20—Impairment Expense.
The following table summarizes interest capitalized during development and construction on qualifying assets for the years ended December 31, 2011, 2010 and 2009:
| | | | | | | | | | | | |
| | | 2011 | | | 2010 | | | 2009 | |
| | | (in millions) | |
Interest capitalized during development and construction | | $ | 176 | | | $ | 188 | | | $ | 183 | |
Government subsidies and recoveries of liquidated damages from construction delays are reflected as a reduction in the related projects’ construction costs. During 2011, the Company recovered liquidated damages of €139 million ($180 million) from the EPC contractor at Maritza, which were used to reduce the carrying amount of related plant and equipment. Approximately $12.9 billion of property, plant and equipment, net of accumulated depreciation, was mortgaged, pledged or subject to liens as of December 31, 2011.
Depreciation expense, including the amortization of assets recorded under capital leases, was $1.2 billion, $1.0 billion and $867 million for the years ended December 31, 2011, 2010 and 2009, respectively.
Net electric generation and distribution assets and other include unamortized internal use software costs of $156 million and $163 million as of December 31, 2011 and 2010, respectively. Amortization expense associated with software costs was $46 million, $50 million and $46 million for the years ended December 31, 2011, 2010 and 2009.
The following table summarizes regulated and non-regulated generation and distribution property, plant and equipment and accumulated depreciation as of December 31, 2011 and 2010:
| | | | | | | | |
| | | December 31, | |
| | | 2011 | | | 2010 | |
| | | (in millions) | |
Regulated assets | | $ | 14,468 | | | $ | 12,006 | |
Regulated accumulated depreciation | | | (5,029 | ) | | | (4,961 | ) |
| | | | | | | | |
Regulated generation, distribution assets, and other, net | | | 9,439 | | | | 7,045 | |
| | | | | | | | |
Non-regulated assets | | | 16,675 | | | | 13,681 | |
Non-regulated accumulated depreciation | | | (3,915 | ) | | | (3,486 | ) |
| | | | | | | | |
Non-regulated generation, distribution assets, and other, net | | | 12,760 | | | | 10,195 | |
| | | | | | | | |
Net electric generation and distribution assets, and other | | $ | 22,199 | | | $ | 17,240 | |
| | | | | | | | |
77
The following table summarizes the amounts recognized, which were related to asset retirement obligations, for the years ended December 31, 2011 and 2010:
| | | | | | | | |
| | | 2011 | | | 2010 | |
| | | (in millions) | |
Balance at January 1 | | $ | 88 | | | $ | 60 | |
Additional liabilities incurred | | | 1 | | | | 22 | |
Assumed in business combination | | | 24 | | | | — | |
Accretion expense | | | 6 | | | | 5 | |
Change in estimated cash flows | | | (1 | ) | | | 1 | |
Translation adjustments | | | (1 | ) | | | — | |
| | | | | | | | |
Balance at December 31 | | $ | 117 | | | $ | 88 | |
| | | | | | | | |
The Company’s asset retirement obligations covered by the relevant guidance primarily include active ash landfills, water treatment basins and the removal or dismantlement of certain plant and equipment. The fair value of legally restricted assets for purposes of settling asset retirement obligations was $1 million at December 31, 2011. There were no legally restricted assets at December 31, 2010.
Ownership of Coal-Fired Facilities
DP&L has undivided ownership interests in seven coal-fired generation facilities jointly owned with other utilities. As of December 31, 2011, DP&L had $48 million of construction work in process at such facilities. DP&L’s share of the operating costs of such facilities is included in Cost of Sales in the Consolidated Statement of Operations and its share of investment in the facilities is included in Property, Plant and Equipment in the Consolidated Balance Sheet. DP&L’s undivided ownership interest in such facilities at December 31, 2011 is as follows:
| | | | | | | | | | | | | | | | | | | | |
| | | DP&L Share | | | DP&L Investment | |
| | | Ownership | | | Production
Capacity
(MW) | | | Gross
Plant
In Service | | | Accumulated
Depreciation | | | Construction
Work In
Process | |
| | | | | | | | | ($ in millions) | |
| | | | | |
Production Units: | | | | | | | | | | | | | | | | | | | | |
Beckjord Unit 6 | | | 50 | % | | | 210 | | | $ | — | | | $ | — | | | $ | — | |
Conesville Unit 4 | | | 17 | % | | | 129 | | | | — | | | | — | | | | 2 | |
East Bend Station | | | 31 | % | | | 186 | | | | — | | | | — | | | | 2 | |
Killen Station | | | 67 | % | | | 402 | | | | 331 | | | | — | | | | 4 | |
Miami Fort Units 7 and 8 | | | 36 | % | | | 368 | | | | 239 | | | | 1 | | | | 2 | |
Stuart Station | | | 35 | % | | | 820 | | | | 181 | | | | 1 | | | | 14 | |
Zimmer Station | | | 28 | % | | | 365 | | | | 161 | | | | 2 | | | | 24 | |
Transmission | | | various | | | | | | | | 34 | | | | — | | | | — | |
| | | | | | | | | | | | | | | | | | | | |
Total | | | | | | | 2,480 | | | $ | 946 | | | $ | 4 | | | $ | 48 | |
| | | | | | | | | | | | | | | | | | | | |
4. FAIR VALUE
The fair value of current financial assets and liabilities, debt service reserves and other deposits approximate their reported carrying amounts. The fair value of non-recourse debt is estimated differently based upon the type of loan. In general, the carrying amount of variable rate debt is a close approximation of its fair value. For fixed rate loans, the fair value is estimated using quoted market prices or discounted cash flow analyses. See Note 11—Debt for additional information on the fair value and carrying value of debt. The fair value of interest rate swap, cap and floor agreements, foreign currency forwards, swaps and options, and energy derivatives is the estimated net amount that the Company would receive or pay to sell or transfer the agreements as of the balance sheet date.
The estimated fair values of the Company’s assets and liabilities have been determined using available market information. By virtue of these amounts being estimates and based on hypothetical transactions to sell assets or transfer liabilities, the use of different market assumptions and/or estimation methodologies may have a material effect on the estimated fair value amounts.
78
The following table summarizes the carrying amount and fair value of certain of the Company’s financial assets and liabilities as of December 31, 2011 and 2010:
| | | | | | | | | | | | | | | | |
| | | December 31, | |
| | | 2011 | | | 2010 | |
| | | Carrying
Amount | | | Fair
Value | | | Carrying
Amount | | | Fair
Value | |
| | | (in millions) | |
Assets | | | | | | | | | | | | | | | | |
Marketable securities | | $ | 1,356 | | | $ | 1,356 | | | $ | 1,760 | | | $ | 1,760 | |
Derivatives | | | 120 | | | | 120 | | | | 119 | | | | 119 | |
| | | | | | | | | | | | | | | | |
Total assets | | $ | 1,476 | | | $ | 1,476 | | | $ | 1,879 | | | $ | 1,879 | |
| | | | | | | | | | | | | | | | |
Liabilities | | | | | | | | | | | | | | | | |
Debt | | $ | 22,020 | | | $ | 22,502 | | | $ | 18,199 | | | $ | 18,725 | |
Derivatives | | | 690 | | | | 690 | | | | 358 | | | | 358 | |
| | | | | | | | | | | | | | | | |
Total liabilities | | $ | 22,710 | | | $ | 23,192 | | | $ | 18,557 | | | $ | 19,083 | |
| | | | | | | | | | | | | | | | |
Valuation Techniques:
The fair value measurement accounting guidance describes three main approaches to measuring the fair value of assets and liabilities: (1) market approach; (2) income approach and (3) cost approach. The market approach uses prices and other relevant information generated from market transactions involving identical or comparable assets or liabilities. The income approach uses valuation techniques to convert future amounts to a single present value amount. The measurement is based on current market expectations of the return on those future amounts. The cost approach is based on the amount that would currently be required to replace an asset. The Company measures its investments and derivatives at fair value on a recurring basis. Additionally, in connection with annual or event-driven impairment evaluations, certain nonfinancial assets and liabilities are measured at fair value on a nonrecurring basis. These include long-lived tangible assets (i.e., property, plant and equipment), goodwill and intangible assets (e.g., sales concessions, land use rights and emissions allowances, etc.). In general, the Company determines the fair value of investments and derivatives using the market approach and the income approach, respectively. In the nonrecurring measurements of nonfinancial assets and liabilities, all three approaches are considered; however, fair value estimated under the income approach is often selected.
Investments
The Company’s investments measured at fair value generally consist of marketable debt and equity securities. Equity securities are measured at fair value using quoted market prices. Debt securities primarily consist of unsecured debentures, certificates of deposit and government debt securities held by our Brazilian subsidiaries. Returns and pricing on these instruments are generally indexed to the CDI (Brazilian equivalent to London Inter-Bank Offered Rate, or LIBOR, a benchmark interest rate widely used by banks in the interbank lending market) or Selic (overnight borrowing rate) rates in Brazil. Fair value is determined from comparisons to market data obtained for similar assets and are considered Level 2 in the fair value hierarchy. For more detail regarding the fair value of investments see Note 5—Investments in Marketable Securities.
Derivatives
When deemed appropriate, the Company manages its risk from interest and foreign currency exchange rate and commodity price fluctuations through the use of over-the-counter financial and physical derivative instruments. The derivatives are primarily interest rate swaps to hedge non-recourse debt to establish a fixed rate on variable rate debt, foreign exchange instruments to hedge against currency fluctuations, commodity derivatives to hedge against commodity price fluctuations and embedded derivatives associated with commodity contracts. The Company’s subsidiaries are counterparties to various over-the-counter derivatives, which include interest rate swaps and options, foreign currency options and forwards and commodity swaps. In addition, the Company’s subsidiaries are counterparties to certain PPAs and fuel supply agreements that are derivatives or include embedded derivatives.
79
For the derivatives where there is a standard industry valuation model, the Company uses that model to estimate the fair value. For the derivatives (such PPAs and fuel supply agreements that are derivatives or include embedded derivatives) where there is not a standard industry valuation model, the Company has created internal valuation models to estimate the fair value, using observable data to the extent available. For all derivatives, with the exception of those classified as Level 1, the income approach is used, which consists of forecasting future cash flows based on contractual notional amounts and applicable and available market data as of the valuation date. The following are among the most common market data inputs used in the income approach: volatilities, spot and forward benchmark interest rates (such as LIBOR and Euro Inter Bank Offered Rate (“EURIBOR”)), foreign exchange rates and commodity prices. Forward rates with the same tenor as the derivative instrument being valued are generally obtained from published sources, with these forward rates being assessed quarterly at a portfolio-level for reasonableness versus comparable, published information provided from another source. In situations where significant inputs are not observable, the Company uses relevant techniques to best estimate the inputs, such as regression analysis, Monte Carlo simulation or prices for similarly traded instruments available in the market.
For each derivative, with the exception of those classified as Level 1, the income approach is used to estimate the cash flows over the remaining term of the contract. Those cash flows are then discounted using the relevant spot benchmark interest rate (such as LIBOR or EURIBOR) plus a spread that reflects the credit or nonperformance risk. This risk is estimated by the Company using credit spreads and risk premiums that are observable in the market, whenever possible, or estimated borrowing costs based on bank quotes, industry publications and/or information on financing closed on similar projects. To the extent that management can estimate the fair value of these assets or liabilities without the use of significant unobservable inputs, these derivatives are classified as Level 2.
The Company’s methodology to fair value its derivatives is to start with any observable inputs, however, in certain instances the published forward rates or prices may not extend through the remaining term of the contract and management must make assumptions to extrapolate the curve, which necessitates the use of unobservable inputs, such as proxy commodity prices or historical settlements to forecast forward prices. In addition, in certain instances, there may not be third party data readily available, which requires the use of unobservable inputs. Similarly, in certain instances, the spread that reflects the credit or nonperformance risk is unobservable. The fair value hierarchy of an asset or a liability is based on the level of significance of the input assumptions. An input assumption is considered significant if it affects the fair value by at least 10%. Assets and liabilities are transferred to Level 3 when the use of unobservable inputs becomes significant. Similarly, when the use of unobservable input becomes insignificant for Level 3 assets and liabilities, they are transferred to Level 2. Transfers in and out of Level 3 are from and to Level 2 and are determined as of the end of the reporting period.
The only Level 1 derivative instruments as of December 31, 2011 are exchange-traded commodity futures for which the pricing is observable in active markets, and as such these are not expected to transfer to other levels.
Nonfinancial Assets and Liabilities
For nonrecurring measurements derived using the income approach, fair value is determined using valuation models based on the principles of discounted cash flows (“DCF”). The income approach is most often used in the impairment evaluation of long-lived tangible assets, goodwill and intangible assets. The Company has developed internal valuation models for such valuations; however, an independent valuation firm may be engaged in certain situations. In such situations, the independent valuation firm largely uses DCF valuation models as the primary measure of fair value though other valuation approaches are also considered. A few examples of input assumptions to such valuations include macroeconomic factors such as growth rates, industry demand, inflation, exchange rates and power and commodity prices. Whenever possible, the Company attempts to obtain market observable data to develop input assumptions. Where the use of market observable data is limited or not possible for certain input assumptions, the Company develops its own estimates using a variety of techniques such as regression analysis and extrapolations.
For nonrecurring measurements derived using the market approach, recent market transactions involving the sale of identical or similar assets are considered. The use of this approach is limited because it is often difficult to find sale transactions of identical or similar assets. This approach is used in the impairment evaluations of certain intangible assets. Otherwise, it is used to corroborate the fair value determined under the income approach.
For nonrecurring measurements derived using the cost approach, fair value is typically determined using the replacement cost approach. Under this approach, the depreciated replacement cost of assets is determined by first determining the current replacement cost of assets and then applying the remaining useful life percentages to such
80
cost. Further adjustments for economic and functional obsolescence are made to the depreciated replacement cost. This approach involves a considerable amount of judgment, which is why its use is limited to the measurement of a few long-lived tangible assets. Like the market approach, this approach is also used to corroborate the fair value determined under the income approach.
Fair Value Considerations:
In determining fair value, the Company considers the source of observable market data inputs, liquidity of the instrument, the credit risk of the counterparty and the risk of the Company’s or its counterparty’s nonperformance. The conditions and criteria used to assess these factors are:
Sources of market assumptions
The Company derives most of its market assumptions from market efficient data sources (e.g., Bloomberg, Reuters, and Platt’s). To determine fair value, where market data is not readily available, management uses comparable market sources and empirical evidence to develop its own estimates of market assumptions.
Market liquidity
The Company evaluates market liquidity based on whether the financial or physical instrument, or the underlying asset, is traded in an active or inactive market. An active market exists if the prices are fully transparent to market participants, can be measured by market bid and ask quotes, the market has a relatively large proportion of trading volume as compared to the Company’s current trading volume and the market has a significant number of market participants that will allow the market to rapidly absorb the quantity of the assets traded without significantly affecting the market price. Another factor the Company considers when determining whether a market is active or inactive is the presence of government or regulatory controls over pricing that could make it difficult to establish a market based price when entering into a transaction.
Nonperformance risk
Nonperformance risk refers to the risk that the obligation will not be fulfilled and affects the value at which a liability is transferred or an asset is sold. Nonperformance risk includes, but may not be limited to, the Company or counterparty’s credit and settlement risk. Nonperformance risk adjustments are dependent on credit spreads, letters of credit, collateral, other arrangements available and the nature of master netting arrangements. The Company and its subsidiaries are parties to various interest rate swaps and options; foreign currency options and forwards; and derivatives and embedded derivatives which subject the Company to nonperformance risk. The financial and physical instruments held at the subsidiary level are generally non-recourse to the Parent Company.
Nonperformance risk on the investments held by the Company is incorporated in the fair value derived from quoted market data to mark the investments to fair value.
The Company adjusts for nonperformance or credit risk on its derivative instruments by deducting a credit valuation adjustment (“CVA”). The CVA is based on the margin or debt spread of the Company’s subsidiary or counterparty and the tenor of the respective derivative instrument. The counterparty for a derivative asset position is considered to be the bank or government sponsored banking entity or counterparty to the PPA or commodity contract. The CVA for asset positions is based on the counterparty’s credit ratings and debt spreads or, in the absence of readily obtainable credit information, the respective country debt spreads are used as a proxy. The CVA for liability positions is based on the Parent Company’s or the subsidiary’s current debt spread, the margin on indicative financing arrangements, or in the absence of readily obtainable credit information, the respective country debt spreads are used as a proxy. All derivative instruments are analyzed individually and are subject to unique risk exposures.
81
Recurring Measurements
The following table sets forth, by level within the fair value hierarchy, the Company’s financial assets and liabilities that were measured at fair value on a recurring basis as of December 31, 2011 and 2010. Financial assets and liabilities have been classified in their entirety based on the lowest level of input that is significant to the fair value measurement. The Company’s assessment of the significance of a particular input to the fair value measurement requires judgment, and may affect the determination of the fair value of the assets and liabilities and their placement within the fair value hierarchy levels.
| | | | | | | | | | | | | | | | |
| | | Quoted Market
Prices in Active
Market for
Identical Assets
(Level 1) | | | Significant
Other
Observable
Inputs
(Level 2) | | | Significant
Unobservable
Inputs
(Level 3) | | | Total
December 31,
2011 | |
| | | (in millions) | |
| | | | |
Assets | | | | | | | | | | | | | | | | |
Available-for-sale securities | | $ | 1 | | | $ | 1,339 | | | $ | — | | | $ | 1,340 | |
Trading securities | | | 12 | | | | — | | | | — | | | | 12 | |
Derivatives | | | 2 | | | | 52 | | | | 66 | | | | 120 | |
| | | | | | | | | | | | | | | | |
Total assets | | $ | 15 | | | $ | 1,391 | | | $ | 66 | | | $ | 1,472 | |
| | | | | | | | | | | | | | | | |
Liabilities | | | | | | | | | | | | | | | | |
Derivatives | | $ | — | | | $ | 476 | | | $ | 214 | | | $ | 690 | |
| | | | | | | | | | | | | | | | |
Total liabilities | | $ | — | | | $ | 476 | | | $ | 214 | | | $ | 690 | |
| | | | | | | | | | | | | | | | |
| | | | |
| | | Quoted Market
Prices in Active
Market for
Identical Assets
(Level 1) | | | Significant
Other
Observable
Inputs
(Level 2) | | | Significant
Unobservable
Inputs
(Level 3) | | | Total
December 31,
2010 | |
| | | (in millions) | |
| | | | |
Assets | | | | | | | | | | | | | | | | |
Available-for-sale securities | | $ | 8 | | | $ | 1,700 | | | $ | 42 | | | $ | 1,750 | |
Trading securities | | | 10 | | | | — | | | | — | | | | 10 | |
Derivatives | | | — | | | | 58 | | | | 61 | | | | 119 | |
| | | | | | | | | | | | | | | | |
Total assets | | $ | 18 | | | $ | 1,758 | | | $ | 103 | | | $ | 1,879 | |
| | | | | | | | | | | | | | | | |
Liabilities | | | | | | | | | | | | | | | | |
Derivatives | | $ | — | | | $ | 346 | | | $ | 12 | | | $ | 358 | |
| | | | | | | | | | | | | | | | |
Total liabilities | | $ | — | | | $ | 346 | | | $ | 12 | | | $ | 358 | |
| | | | | | | | | | | | | | | | |
The following table presents a reconciliation of derivative assets and liabilities measured at fair value on a recurring basis using significant unobservable inputs (Level 3) for the years ended December 31, 2011 and 2010 (presented net by type of derivative):
| | | | | | | | | | | | | | | | | | | | |
| | | Year Ended December 31, 2011 | |
| | | Interest
Rate | | | Cross
Currency | | | Foreign
Currency | | | Commodity
& Other | | | Total | |
| | | (in millions) | |
| | | | | |
Balance at beginning of period | | $ | (1 | ) | | $ | 10 | | | $ | 22 | | | $ | 18 | | | $ | 49 | |
Total gains (losses) (realized and unrealized): | | | | | | | | | | | | | | | | | | | | |
Included in earnings(1) | | | — | | | | (4 | ) | | | 32 | | | | (71 | ) | | | (43 | ) |
Included in other comprehensive income | | | (13 | ) | | | (37 | ) | | | — | | | | — | | | | (50 | ) |
Included in regulatory assets | | | — | | | | — | | | | — | | | | 8 | | | | 8 | |
Settlements | | | — | | | | 13 | | | | (3 | ) | | | (8 | ) | | | 2 | |
Transfers of assets (liabilities) into Level 3(2) | | | (117 | ) | | | — | | | | — | | | | — | | | | (117 | ) |
Transfers of (assets) liabilities out of Level 3(2) | | | 3 | | | | — | | | | — | | | | — | | | | 3 | |
| | | | | | | | | | | | | | | | | | | | |
Balance at end of period | | $ | (128 | ) | | $ | (18 | ) | | $ | 51 | | | $ | (53 | ) | | $ | (148 | ) |
| | | | | | | | | | | | | | | | | | | | |
Total gains (losses) for the period included in earnings attributable to the change in unrealized gains (losses) relating to assets and liabilities held at the end of the period | | $ | — | | | $ | (2 | ) | | $ | 29 | | | $ | (71 | ) | | $ | (44 | ) |
| | | | | | | | | | | | | | | | | | | | |
82
| | | | | | | | | | | | | | | | | | | | |
| | | Year Ended December 31, 2010 | |
| | | Interest
Rate | | | Cross
Currency | | | Foreign
Currency | | | Commodity
& Other | | | Total | |
| | | (in millions) | |
| | | | | |
Balance at beginning of period | | $ | (12 | ) | | $ | (12 | ) | | $ | — | | | $ | 24 | | | $ | — | |
Total gains (losses) (realized and unrealized): | | | | | | | | | | | | | | | | | | | | |
Included in earnings(1) | | | 1 | | | | 4 | | | | 25 | | | | 21 | | | | 51 | |
Included in other comprehensive income | | | (12 | ) | | | 13 | | | | — | | | | — | | | | 1 | |
Included in regulatory assets | | | (3 | ) | | | — | | | | — | | | | 1 | | | | (2 | ) |
Settlements | | | 7 | | | | 5 | | | | (1 | ) | | | (28 | ) | | | (17 | ) |
Transfers of assets (liabilities) into Level 3(2) | | | — | | | | — | | | | (2 | ) | | | — | | | | (2 | ) |
Transfers of (assets) liabilities out of Level 3(2) | | | 18 | | | | — | | | | — | | | | — | | | | 18 | |
| | | | | | | | | | | | | | | | | | | | |
Balance at end of period | | $ | (1 | ) | | $ | 10 | | | $ | 22 | | | $ | 18 | | | $ | 49 | |
| | | | | | | | | | | | | | | | | | | | |
Total gains (losses) for the period included in earnings attributable to the change in unrealized gains (losses) relating to assets and liabilities held at the end of the period | | $ | — | | | $ | 7 | | | $ | 24 | | | $ | 9 | | | $ | 40 | |
| | | | | | | | | | | | | | | | | | | | |
| (1) | The gains (losses) included in earnings for these Level 3 derivatives are classified as follows: interest rate and cross currency derivatives as interest expense, foreign currency derivatives as foreign currency transaction gains (losses) and commodity and other derivatives as either non-regulated revenue, non-regulated cost of sales, or other expense. See Note 6—Derivative Instruments and Hedging Activities for further information regarding the classification of gains and losses included in earnings in the Consolidated Statements of Operations. |
| (2) | Transfers in and out of Level 3 are determined as of the end of the reporting period and are from and to Level 2. The only Level 1 derivative instruments as of December 31, 2011 are exchange-traded commodity futures for which the pricing is observable in active markets, and as such these are not expected to transfer to other levels. The (assets) liabilities transferred out of Level 3 are primarily the result of a decrease in the significance of unobservable inputs used to calculate the credit valuation adjustments of these derivative instruments. Similarly, the assets (liabilities) transferred into Level 3 are primarily the result of an increase in the significance of unobservable inputs used to calculate the credit valuation adjustments of these derivative instruments. |
The following table presents a reconciliation of available-for-sale securities measured at fair value on a recurring basis using significant unobservable inputs (Level 3) for the years ended December 31, 2011 and 2010:
| | | | | | | | |
| | | Year Ended December 31, | |
| | | 2011 | | | 2010 | |
| | | (in millions) | |
Balance at beginning of period(1) | | $ | 42 | | | $ | 42 | |
Settlements | | | (42 | ) | | | — | |
| | | | | | | | |
Balance at end of period | | $ | — | | | $ | 42 | |
| | | | | | | | |
Total gains (losses) for the period included in earnings attributable to the change in unrealized gains/losses relating to assets held at the end of the period | | $ | — | | | $ | — | |
| | | | | | | | |
| (1) | Available-for-sale securities in Level 3 are variable rate demand notes which have failed remarketing and for which there are no longer adequate observable inputs to measure the fair value. |
83
Nonrecurring Measurements:
For purposes of impairment evaluation, the Company measured the fair value of long-lived assets and equity method investments under the fair value measurement accounting guidance. To measure the amount of impairment, the Company compares the fair value of assets and liabilities at the evaluation date to the carrying amount at the end of the month prior to the evaluation date. The following table summarizes major categories of assets and liabilities measured at fair value on a nonrecurring basis during the period and their level within the fair value hierarchy:
| | | | | | | | | | | | | | | | | | | | |
| | | | | | Year Ended December 31, 2011 | |
| | | Carrying | | | Fair Value | | | Gross | |
| | | Amount | | | Level 1 | | | Level 2 | | | Level 3 | | | (Gain) Loss | |
| | | (in millions) | |
Long-lived assets held and used: | | | | | | | | | | | | | | | | | | | | |
Wind turbines and deposits | | $ | 161 | | | $ | — | | | $ | 45 | | | $ | — | | | $ | 116 | |
Tisza II | | | 94 | | | | — | | | | — | | | | 42 | | | | 52 | |
Kelanitissa | | | 66 | | | | — | | | | — | | | | 24 | | | | 42 | |
Bohemia | | | 14 | | | | — | | | | 5 | | | | — | | | | 9 | |
Discontinued operations and businesses held for sale: | | | | | | | | | | | | | | | | | | | | |
Edelap, Edes and Central Dique | | | 350 | | | | — | | | | 4 | | | | — | | | | 346 | |
Carbon reduction projects | | | 49 | | | | — | | | | — | | | | — | | | | 40 | (1) |
Wind projects | | | 22 | | | | — | | | | — | | | | — | | | | 22 | |
Borsod(2) | | | (9 | ) | | | — | | | | — | | | | — | | | | — | |
Eastern Energy(2) | | | (123 | ) | | | — | | | | — | | | | — | | | | — | |
Thames(2) | | | (7 | ) | | | — | | | | — | | | | — | | | | — | |
Brazil Telecom businesses | | | 142 | | | | — | | | | 893 | | | | | | | | (751 | ) |
Equity method affiliates: | | | | | | | | | | | | | | | | | | | | |
Yangcheng | | | 100 | | | | — | | | | — | | | | 26 | | | | 74 | |
Goodwill: | | | | | | | | | | | | | | | | | | | | |
Chigen | | | 17 | | | | — | | | | — | | | | — | | | | 17 | |
| | |
| | | | | | Year Ended December 31, 2010 | |
| | | Carrying | | | Fair Value | | | Gross | |
| | | Amount | | | Level 1 | | | Level 2 | | | Level 3 | | | (Gain) Loss | |
| | | (in millions) | |
Long-lived assets held and used: | | | | | | | | | | | | | | | | | | | | |
Southland (Huntington Beach) | | $ | 288 | | | $ | — | | | $ | — | | | $ | 88 | | | $ | 200 | |
Tisza II | | | 160 | | | | — | | | | — | | | | 75 | | | | 85 | |
Deepwater | | | 83 | | | | — | | | | — | | | | 4 | | | | 79 | |
Discontinued operations and businesses held for sale: | | | | | | | | | | | | | | | | | | | | |
Eastern Energy | | | 827 | | | | — | | | | — | | | | — | | | | 827 | |
Barka | | | 20 | | | | — | | | | 124 | | | | — | | | | (104 | ) |
Ras Laffan | | | 120 | | | | — | | | | 226 | | | | — | | | | (106 | ) |
Goodwill: | | | | | | | | | | | | | | | | | | | | |
Deepwater | | | 18 | | | | — | | | | — | | | | — | | | | 18 | |
Other | | | 3 | | | | — | | | | — | | | | — | | | | 3 | |
| (1) | The carrying amounts and fair value of the asset groups also include other assets and liabilities; however, impairment expense recognized was limited to the carrying amounts of long-lived assets. |
| (2) | The businesses, currently in liquidation/bankruptcy proceedings, had negative carrying amounts at the measurement date. Related gains on deconsolidation have been deferred pending the resolution of bankruptcy protection/liquidation proceedings. |
84
Long-lived Assets Held and Used
Wind Turbines and Deposits—During the third quarter of 2011, the Company determined that certain wind turbines and deposits held by our Wind Generation business were impaired. The long-lived assets with a carrying amount of $161 million were written down to their estimated fair value of $45 million under the market approach. This resulted in the recognition of asset impairment expense of $116 million for the year ended December 31, 2011.
Tisza II—In the fourth quarter of 2011, the Company determined there were impairment indicators for the long-lived assets at Tisza II, our gas-fired generation plant in Hungary. The asset group had a carrying amount of $94 million and was written down to its estimated fair value of $42 million resulting in the recognition of asset impairment expense of $52 million.
Kelanitissa—In 2011, the Company determined the long-lived assets at Kelanitissa, our diesel-fired plant in Sri Lanka, were impaired. The long-lived assets with a carrying amount of $66 million were written down to their estimated fair value of $24 million based on a discounted cash flow analysis. This resulted in the recognition of asset impairment expense of $42 million for the year ended December 31, 2011.
For further discussion of these impairments, see Note 20—Impairment Expense.
Discontinued Operations and Held for Sale Businesses
Edelap, Edes and Central Dique—During the fourth quarter of 2011, the Company sold its ownership interest in two distribution companies Empresa Distribuidora La Plata S.A. (“Edelap”), Empresa Distribuidora de Energia Sur S.A. (“Edes”) and a 68 MW generation plant, Central Dique S.A. (collectively, “Argentina distribution businesses”) in Argentina. These businesses had a carrying amount of $350 million, which was written down to the net sale price of $4 million resulting in a loss on disposal of $346 million.
Carbon Reduction Projects—In 2011, the Company determined that it would sell its interest in carbon reduction projects, our emission reduction credit projects in Asia and Latin America. The long-lived asset groups with an aggregate carrying amount of $49 million were written down to their estimated fair value of $5 million based on discounted cash flows analysis.
Wind Projects—In the fourth quarter of 2011, the Company determined that it would not pursue certain wind development projects in Poland and the U.K. The operating results of these projects have been presented as discontinued operations as they met the applicable criteria for reporting discontinued operations. The intangible assets, primarily project development rights, with an aggregate carrying amount of $22 million were fully written off based on discounted cash flows analysis.
Eastern Energy, Thames and Borsod—In 2011, these businesses filed for bankruptcy protection and/or liquidation. As of December 31, 2011, they were accounted for as cost method investments with the prior period operating results presented as discontinued operations. Gains resulting from their deconsolidation have been deferred pending the finalization of liquidation/bankruptcy proceedings. See Note 1—General and Summary of Significant Accounting Policies, Principles of Consolidation for further information.
Brazil Telecom Businesses—In the fourth quarter of 2011, the Company completed the sale of its ownership interest in two telecommunication businesses in Brazil. The businesses had a carrying amount of $ 142 million and were sold for $893 million (net of selling costs) resulting in a gain of $ (751) million before income tax and noncontrolling interests.
For further discussion, see Note 22—Discontinued Operations and Held for Sale Businesses.
Equity Method Affiliate
Yangcheng International Power Generating Co. Ltd. (“Yangcheng”)—During the third quarter of 2011, the Company determined that the carrying amount of Yangcheng, a 2,100 MW venture in China in which AES owns a 25% interest, had incurred an other-than-temporary impairment. Yangcheng’s carrying amount of $100 million was written down to its estimated fair value of $26 million determined under the income approach, resulting in the recognition of other non-operating expense of $74 million for the year ended December 31, 2011. See Note 7—Investments In and Advances to Affiliates and Note 8—Other Non-Operating Expense for further information.
85
Goodwill
During the third quarter of 2011, the Company determined there were impairment indicators for the goodwill at Chigen, our holding company in China that holds AES’ interests in Chinese ventures, including its investment in Yangcheng. Goodwill of $17 million was written down to its implied fair value of zero during an interim impairment evaluation, resulting in the recognition of goodwill impairment of $17 million for the year ended December 31, 2011.
For further discussion, see Note 9—Goodwill and Other Intangible Assets.
Long-lived Assets Held and Used
Tisza II and Southland (Huntington Beach). During the third quarter of 2010, the Company determined there were impairment indicators for the long-lived assets at Tisza II, our gas-fired generation plant in Hungary, and Southland, our gas-fired generation plants in California. These long-lived assets had carrying amounts of $160 million and $288 million, respectively, and were written down to their fair value of $75 million and $88 million, respectively. These resulted in the recognition of asset impairment expense of $85 million and $200 million, respectively, during the year ended December 31, 2010.
Deepwater. In the fourth quarter of 2010, the Company determined there were impairment indicators for the long-lived assets at Deepwater, our pet-coke-fired generation facility in Texas. These long-lived assets had a carrying amount of $83 million and were written down to their fair value of $4 million. This resulted in the recognition of asset impairment expense of $79 million.
For further discussion of these impairments, see Note 20—Impairment Expense.
Discontinued Operations and Held for Sale Businesses
In the fourth quarter of 2010, the Company determined there were impairment indicators for the long-lived assets at Eastern Energy. These long-lived assets had a carrying amount of $827 million and were considered fully impaired. As a result, an impairment loss of $827 million was recognized, which is included in Income from operations of discontinued businesses in the Consolidated Statement of Operations.
The Company determined the fair value of nonfinancial assets and liabilities of our held for sale businesses during the year ended December 31, 2010. These businesses included Barka in Oman, Ras Laffan in Qatar, and Eastern Energy, our coal-fired generation plants in New York.
For further discussion, see Note 22—Discontinued Operations and Held for Sale Businesses.
Goodwill
During the third quarter of 2010, the Company determined there were impairment indicators for the long-lived assets and goodwill at Deepwater, our pet coke-fired generation plant in Texas. Goodwill with an aggregate carrying amount of $18 million was written down to its implied fair value of zero, resulting in the recognition of goodwill impairment of $18 million for the year ended December 31, 2010.
For further discussion, see Note 9—Goodwill and Other Intangible Assets.
86
5. INVESTMENTS IN MARKETABLE SECURITIES
The following table sets forth the Company’s investments in marketable debt and equity securities classified as trading and available-for-sale as of December 31, 2011 and 2010 by type of investment and by level within the fair value hierarchy. The security types are determined based on the nature and risk of the security and are consistent with how the Company manages, monitors and measures its securities.
| | | | | | | | | | | | | | | | | | | | | | | | | | | | | | | | |
| | | December 31, | |
| | | 2011 | | | 2010 | |
| | | Level 1 | | | Level 2 | | | Level 3 | | | Total | | | Level 1 | | | Level 2 | | | Level 3 | | | Total | |
| | | (in millions) | |
AVAILABLE-FOR-SALE:(1) | | | | | | | | | | | | | | | | | | | | | | | | | | | | | | | | |
Debt securities: | | | | | | | | | | | | | | | | | | | | | | | | | | | | | | | | |
Unsecured debentures(2) | | $ | — | | | $ | 665 | | | $ | — | | | $ | 665 | | | $ | — | | | $ | 719 | | | $ | — | | | $ | 719 | |
Certificates of deposit(2) | | | — | | | | 576 | | | | — | | | | 576 | | | | — | | | | 873 | | | | — | | | | 873 | |
Government debt securities | | | — | | | | 31 | | | | — | | | | 31 | | | | — | | | | 47 | | | | — | | | | 47 | |
Other | | | — | | | | — | | | | — | | | | — | | | | — | | | | — | | | | 42 | | | | 42 | |
| | | | | | | | | | | | | | | | | | | | | | | | | | | | | | | | |
Subtotal | | | — | | | | 1,272 | | | | — | | | | 1,272 | | | | — | | | | 1,639 | | | | 42 | | | | 1,681 | |
Equity securities: | | | | | | | | | | | | | | | | | | | | | | | | | | | | | | | | |
Mutual funds | | | — | | | | 67 | | | | — | | | | 67 | | | | 1 | | | | 61 | | | | — | | | | 62 | |
Common stock | | | 1 | | | | — | | | | — | | | | 1 | | | | 7 | | | | — | | | | — | | | | 7 | |
| | | | | | | | | | | | | | | | | | | | | | | | | | | | | | | | |
Subtotal | | | 1 | | | | 67 | | | | — | | | | 68 | | | | 8 | | | | 61 | | | | — | | | | 69 | |
| | | | | | | | | | | | | | | | | | | | | | | | | | | | | | | | |
Total available-for-sale | | | 1 | | | | 1,339 | | | | — | | | | 1,340 | | | | 8 | | | | 1,700 | | | | 42 | | | | 1,750 | |
| | | | | | | | | | | | | | | | | | | | | | | | | | | | | | | | |
TRADING: | | | | | | | | | | | | | | | | | | | | | | | | | | | | | | | | |
Equity securities: | | | | | | | | | | | | | | | | | | | | | | | | | | | | | | | | |
Mutual funds | | | 12 | | | | — | | | | — | | | | 12 | | | | 10 | | | | — | | | | — | | | | 10 | |
| | | | | | | | | | | | | | | | | | | | | | | | | | | | | | | | |
Total trading | | | 12 | | | | — | | | | — | | | | 12 | | | | 10 | | | | — | | | | — | | | | 10 | |
| | | | | | | | | | | | | | | | | | | | | | | | | | | | | | | | |
TOTAL | | $ | 13 | | | $ | 1,339 | | | $ | — | | | $ | 1,352 | | | $ | 18 | | | $ | 1,700 | | | $ | 42 | | | $ | 1,760 | |
| | | | | | | | | | | | | | | | | | | | | | | | | | | | | | | | |
Held-to-maturity securities | | | | | | | | | | | | | | | 4 | | | | | | | | | | | | | | | | — | |
| | | | | | | | | | | | | | | | | | | | | | | | | | | | | | | | |
Total marketable securities | | | | | | | | | | | | | | $ | 1,356 | | | | | | | | | | | | | | | $ | 1,760 | |
| | | | | | | | | | | | | | | | | | | | | | | | | | | | | | | | |
| (1) | Amortized cost approximated fair value at December 31, 2011 and 2010, with the exception of certain common stock investments with a cost basis of $4 million and $6 million carried at their fair value of $1 million and $7 million at December 31, 2011 and 2010, respectively. In 2011, the Company recognized an other than temporary impairment of $3 million in net income on these investments. |
| (2) | Unsecured debentures are instruments similar to certificates of deposit that are held primarily by our subsidiaries in Brazil. The unsecured debentures and certificates of deposit included here do not qualify as cash equivalents and meet the definition of a security under the relevant guidance and are therefore classified as available-for-sale securities. |
As of December 31, 2011, all available-for-sale debt securities had stated maturities less than one year. As of December 31, 2010, all available-for-sale debt securities had stated maturities less than one year with the exception of $42 million of securities, primarily variable rate demand notes, held by IPL, a subsidiary of the Company in Indiana. These securities, classified as other debt securities in the table above, had stated maturities of greater than ten years, and were called at par during 2011.
The following table summarizes the pre-tax gains and losses related to available-for-sale securities for the years ended December 31, 2011, 2010 and 2009. As noted above, the Company recognized an other than temporary impairment of $3 million in 2011. There was no other-than-temporary impairment of marketable securities recognized in earnings or other comprehensive income for the years ended December 31, 2010 or 2009.
| | | | | | | | | | | | |
| | | 2011 | | | 2010 | | | 2009 | |
| | | (in millions) | |
| | | |
Gains included in earnings that relate to trading securities held at the reporting date | | $ | 1 | | | $ | — | | | $ | 1 | |
Unrealized gains (losses) on available-for-sale securities included in other comprehensive income | | | 2 | | | | 2 | | | | 10 | |
Gains reclassified out of other comprehensive income into earnings | | | — | | | | — | | | | 2 | |
Proceeds from sales of available-for-sale securities | | | 6,119 | | | | 5,852 | | | | 4,440 | |
Gross realized gains on sales | | | 3 | | | | 2 | | | | 3 | |
6. DERIVATIVE INSTRUMENTS AND HEDGING ACTIVITIES
Risk Management Objectives
The Company is exposed to market risks associated with its enterprise-wide business activities, namely the purchase and sale of fuel and electricity as well as foreign currency risk and interest rate risk. In order to manage the market risks associated with these business activities, we enter into contracts that incorporate derivatives and
87
financial instruments, including forwards, futures, options, swaps or combinations thereof, as appropriate. The Company generally applies hedge accounting to contracts as long as they are eligible under the accounting standards for derivatives and hedging. While derivative transactions are not entered into for trading purposes, some contracts are not eligible for hedge accounting.
Interest Rate Risk
AES and its subsidiaries generally utilize variable rate debt financing for construction projects and operations, resulting in an exposure to interest rate risk. Interest rate swap, lock, cap, and floor agreements are entered into to manage interest rate risk by effectively fixing or limiting the interest rate exposure on the underlying financing. These interest rate contracts range in maturity through 2043, and are typically designated as cash flow hedges. The following table sets forth, by underlying type of interest rate index, the Company’s current outstanding and maximum outstanding notional under its interest rate derivative instruments, the weighted average remaining term and the percentage of variable-rate debt hedged that is based on the related index as of December 31, 2011 regardless of whether the derivative instruments are in qualifying cash flow hedging relationships:
| | | | | | | | | | | | | | | | | | | | | | | | |
| | | December 31, 2011 | |
| | | Current | | | Maximum(1) | | | | | | | |
Interest Rate Derivatives | | Derivative
Notional | | | Derivative
Notional
Translated
to USD | | | Derivative
Notional | | | Derivative
Notional
Translated
to USD | | | Weighted
Average
Remaining
Term(1) | | | % of Debt
Currently
Hedged
by Index(2) | |
| | | (in millions) | | | (in years) | | | | |
LIBOR (U.S. Dollar) | | | 3,628 | | | $ | 3,628 | | | | 4,697 | | | $ | 4,697 | | | | 11 | | | | 67 | % |
EURIBOR (Euro) | | | 673 | | | | 872 | | | | 673 | | | | 872 | | | | 11 | | | | 63 | % |
LIBOR (British Pound Sterling) | | | 58 | | | | 90 | | | | 82 | | | | 128 | | | | 13 | | | | 87 | % |
| (1) | The Company’s interest rate derivative instruments primarily include accreting and amortizing notionals. The maximum derivative notional represents the largest notional at any point between December 31, 2011 and the maturity of the derivative instrument, which includes forward starting derivative instruments. The weighted average remaining term represents the remaining tenor of our interest rate derivatives weighted by the corresponding maximum notional. |
| (2) | Excludes forecasted issuances of debt and variable-rate debt tied to other indices where the Company has no interest rate derivatives. |
Cross currency swaps are utilized in certain instances to manage the risk related to fluctuations in both interest rates and certain foreign currencies. These cross currency contracts range in maturity through 2028. The following table sets forth, by type of foreign currency denomination, the Company’s outstanding notional amount under its cross currency derivative instruments as of December 31, 2011 which are all in qualifying cash flow hedge relationships. These swaps are amortizing and therefore the notional amount represents the maximum outstanding notional amount as of December 31, 2011:
| | | | | | | | | | | | | | | | |
| | | December 31, 2011 | |
Cross Currency Swaps | | Notional | | | Notional
Translated
to USD | | | Weighted
Average
Remaining
Term(1) | | | % of Debt
Currently
Hedged
by Index(2) | |
| | | (in millions) | | | (in years) | | | | |
Chilean Unidad de Fomento (CLF) | | | 6 | | | $ | 240 | | | | 14 | | | | 85 | % |
| (1) | Represents the remaining tenor of our cross currency swaps weighted by the corresponding notional. |
| (2) | Represents the proportion of foreign currency denominated debt hedged by the same foreign currency denominated notional of the cross currency swap. |
88
Foreign Currency Risk
We are exposed to foreign currency risk as a result of our investments in foreign subsidiaries and affiliates. AES operates businesses in many foreign countries and such operations in foreign countries may be impacted by significant fluctuations in foreign currency exchange rates. Foreign currency options and forwards are utilized, where deemed appropriate, to manage the risk related to fluctuations in certain foreign currencies. These foreign currency contracts range in maturity through 2015. The following tables set forth, by type of foreign currency denomination, the Company’s outstanding notional amounts over the remaining terms of its foreign currency derivative instruments as of December 31, 2011 regardless of whether the derivative instruments are in qualifying hedging relationships:
| | | | | | | | | | | | | | | | |
| | | December 31, 2011 | |
Foreign Currency Options | | Notional(1) | | | Notional
Translated
to USD(1) | | | Probability
Adjusted
Notional(2) | | | Weighted
Average
Remaining
Term(3) | |
| | | (in millions) | | | (in years) | |
Euro (EUR) | | | 38 | | | $ | 54 | | | $ | 52 | | | | <1 | |
Brazilian Real (BRL) | | | 86 | | | | 52 | | | | 49 | | | | <1 | |
British Pound (GBP) | | | 27 | | | | 44 | | | | 35 | | | | <1 | |
Philippine Peso (PHP) | | | 414 | | | | 10 | | | | 7 | | | | <1 | |
| (1) | Represents contractual notionals at inception of trade. |
| (2) | Represents the gross notional amounts times the probability of exercising the option, which is based on the relationship of changes in the option value with respect to changes in the price of the underlying currency. |
| (3) | Represents the remaining tenor of our foreign currency options weighted by the corresponding notional. |
| | | | | | | | | | | | |
| | | December 31, 2011 | |
Foreign Currency Forwards | | Notional | | | Notional
Translated
to USD | | | Weighted
Average
Remaining
Term(1) | |
| | | (in millions) | | | (in years) | |
Euro (EUR) | | | 113 | | | $ | 154 | | | | 2 | |
Chilean Peso (CLP) | | | 72,169 | | | | 145 | | | | <1 | |
British Pound (GBP) | | | 11 | | | | 16 | | | | <1 | |
Argentine Peso (ARS) | | | 61 | | | | 13 | | | | <1 | |
Colombian Peso (COP) | | | 23,993 | | | | 13 | | | | <1 | |
Hungarian Forint (HUF) | | | 1,236 | | | | 5 | | | | <1 | |
| (1) | Represents the remaining tenor of our foreign currency forwards weighted by the corresponding notional. |
In addition, certain of our subsidiaries have entered into contracts which contain embedded derivatives that require separate valuation and accounting due to the fact that the item being purchased or sold is denominated in a currency other than the functional currency of that subsidiary or the currency of the item. These contracts range in maturity through 2025. The following table sets forth, by type of foreign currency denomination, the Company’s outstanding notional over the remaining terms of its foreign currency embedded derivative instruments as of December 31, 2011:
| | | | | | | | | | | | |
| | | December 31, 2011 | |
Embedded Foreign Currency Derivatives | | Notional | | | Notional
Translated
to USD | | | Weighted
Average
Remaining
Term(1) | |
| | | (in millions) | | | (in years) | |
Philippine Peso (PHP) | | | 13,692 | | | $ | 312 | | | | 2 | |
Argentine Peso (ARS) | | | 938 | | | | 218 | | | | 11 | |
Kazakhstani Tenge (KZT) | | | 29,635 | | | | 200 | | | | 8 | |
Euro (EUR) | | | 3 | | | | 3 | | | | 9 | |
| (1) | Represents the remaining tenor of our foreign currency embedded derivatives weighted by the corresponding notional. |
89
Commodity Price Risk
We are exposed to the impact of market fluctuations in the price of electricity, fuel and environmental credits. Although we primarily consist of businesses with long-term contracts or retail sales concessions (which provide our distribution businesses with a franchise to serve a specific geographic region), a portion of our current and expected future revenues are derived from businesses without significant long-term purchase or sales contracts. These businesses subject our results of operations to the volatility of prices for electricity, fuel and environmental credits in competitive markets. We have used a hedging strategy, where appropriate, to hedge our financial performance against the effects of fluctuations in energy commodity prices.
The PPAs and fuel supply agreements entered into by the Company are evaluated to determine if they meet the definition of a derivative or contain embedded derivatives, either of which require separate valuation and accounting. To be a derivative under the accounting standards for derivatives and hedging, an agreement would need to have a notional and an underlying, require little or no initial net investment and could be net settled. Generally, these agreements do not meet the definition of a derivative, often due to the inability to be net settled. On a quarterly basis, we evaluate the markets for the commodities to be delivered under these agreements to determine if facts and circumstances have changed such that the agreements could then be net settled and meet the definition of a derivative.
Nonetheless, certain of the PPAs and fuel supply agreements entered into by certain of the Company’s subsidiaries are derivatives or contain embedded derivatives requiring separate valuation and accounting. These agreements range in maturity through 2024. The following table sets forth by type of commodity the Company’s outstanding notionals for the remaining term of its commodity derivative and embedded derivative instruments as of December 31, 2011:
| | | | | | | | |
| | | December 31, 2011 | |
Commodity Derivatives | | Notional | | | Weighted Average
Remaining Term(1) | |
| | | (in millions) | | | (in years) | |
Natural gas (MMBtu) | | | 31 | | | | 12 | |
Petcoke (Metric tons) | | | 13 | | | | 12 | |
Aluminum (MWh) | | | 16 | (2) | | | 8 | |
Heating Oil (Gallons) | | | 3 | | | | 1 | |
Coal (Metric tons) | | | 4 | | | | 3 | |
| (1) | Represents the remaining tenor of our commodity and embedded derivatives weighted by the corresponding volume. |
| (2) | Sonel’s PPA with its primary offtaker, an aluminum smelter, contains an embedded derivative which reflects the linkage of our energy contract pricing, in part, to the price of aluminum as quoted on the London Metals Exchange, a global metals exchange (as required by contract). The linkage between the contract price of power based on forecasted forward aluminum price curves and the Cameroon market price for power provides for economic alignment between Sonel’s financial results under the PPA and the offtaker’s financial performance. However, to the extent there are fluctuations in the price of aluminum as compared to the market price for power under our PPA, we may be exposed to significant swings in earnings through mark-to-market adjustments of the embedded derivative as the market price for aluminum has proven to be volatile. |
90
Accounting and Reporting
The following table sets forth the Company’s derivative instruments as of December 31, 2011 and 2010 by type of derivative and by level within the fair value hierarchy. Derivative assets and liabilities are recognized at their fair value. Derivative assets and liabilities are combined with other balances and included in the following captions in our Consolidated Balance Sheets: current derivative assets in other current assets, noncurrent derivative assets in other noncurrent assets, current derivative liabilities in accrued and other liabilities and long-term derivative liabilities in other long-term liabilities.
| | | | | | | | | | | | | | | | | | | | | | | | | | | | | | | | |
| | | December 31, 2011 | | | December 31, 2010 | |
| | | Level 1 | | | Level 2 | | | Level 3 | | | Total | | | Level 1 | | | Level 2 | | | Level 3 | | | Total | |
| | | (in millions) | | | (in millions) | |
Assets | | | | | | | | | | | | | | | | | | | | | | | | | | | | | | | | |
Current assets: | | | | | | | | | | | | | | | | | | | | | | | | | | | | | | | | |
Foreign currency derivatives | | $ | — | | | $ | 24 | | | $ | 4 | | | $ | 28 | | | $ | — | | | $ | 3 | | | $ | 3 | | | $ | 6 | |
Commodity and other derivatives | | | 2 | | | | 16 | | | | 3 | | | | 21 | | | | — | | | | 2 | | | | 3 | | | | 5 | |
| | | | | | | | | | | | | | | | | | | | | | | | | | | | | | | | |
Total current assets | | | 2 | | | | 40 | | | | 7 | | | | 49 | | | | — | | | | 5 | | | | 6 | | | | 11 | |
| | | | | | | | | | | | | | | | | | | | | | | | | | | | | | | | |
Noncurrent assets: | | | | | | | | | | | | | | | | | | | | | | | | | | | | | | | | |
Interest rate derivatives | | | — | | | | — | | | | — | | | | — | | | | — | | | | 49 | | | | — | | | | 49 | |
Cross currency derivatives | | | — | | | | — | | | | 1 | | | | 1 | | | | — | | | | — | | | | 12 | | | | 12 | |
Foreign currency derivatives | | | — | | | | 3 | | | | 58 | | | | 61 | | | | — | | | | — | | | | 27 | | | | 27 | |
Commodity and other derivatives | | | — | | | | 9 | | | | — | | | | 9 | | | | — | | | | 4 | | | | 16 | | | | 20 | |
| | | | | | | | | | | | | | | | | | | | | | | | | | | | | | | | |
Total noncurrent assets | | | — | | | | 12 | | | | 59 | | | | 71 | | | | — | | | | 53 | | | | 55 | | | | 108 | |
| | | | | | | | | | | | | | | | | | | | | | | | | | | | | | | | |
Total assets | | $ | 2 | | | $ | 52 | | | $ | 66 | | | $ | 120 | | | $ | — | | | $ | 58 | | | $ | 61 | | | $ | 119 | |
| | | | | | | | | | | | | | | | | | | | | | | | | | | | | | | | |
| | | | | | | | |
Liabilities | | | | | | | | | | | | | | | | | | | | | | | | | | | | | | | | |
Current liabilities: | | | | | | | | | | | | | | | | | | | | | | | | | | | | | | | | |
Interest rate derivatives | | $ | — | | | $ | 97 | | | $ | 22 | | | $ | 119 | | | $ | — | | | $ | 118 | | | $ | — | | | $ | 118 | |
Cross currency derivatives | | | — | | | | — | | | | 5 | | | | 5 | | | | — | | | | — | | | | 2 | | | | 2 | |
Foreign currency derivatives | | | — | | | | 5 | | | | 1 | | | | 6 | | | | — | | | | 13 | | | | — | | | | 13 | |
Commodity and other derivatives | | | — | | | | 17 | | | | 6 | | | | 23 | | | | — | | | | — | | | | — | | | | — | |
| | | | | | | | | | | | | | | | | | | | | | | | | | | | | | | | |
Total current liabilities | | | — | | | | 119 | | | | 34 | | | | 153 | | | | — | | | | 131 | | | | 2 | | | | 133 | |
| | | | | | | | | | | | | | | | | | | | | | | | | | | | | | | | |
Long-term liabilities: | | | | | | | | | | | | | | | | | | | | | | | | | | | | | | | | |
Interest rate derivatives | | | — | | | | 334 | | | | 106 | | | | 440 | | | | — | | | | 200 | | | | 1 | | | | 201 | |
Cross currency derivatives | | | — | | | | — | | | | 14 | | | | 14 | | | | — | | | | — | | | | — | | | | — | |
Foreign currency derivatives | | | — | | | | 10 | | | | 10 | | | | 20 | | | | — | | | | 15 | | | | 8 | | | | 23 | |
Commodity and other derivatives | | | — | | | | 13 | | | | 50 | | | | 63 | | | | — | | | | — | | | | 1 | | | | 1 | |
| | | | | | | | | | | | | | | | | | | | | | | | | | | | | | | | |
Total long-term liabilities | | | — | | | | 357 | | | | 180 | | | | 537 | | | | — | | | | 215 | | | | 10 | | | | 225 | |
| | | | | | | | | | | | | | | | | | | | | | | | | | | | | | | | |
Total liabilities | | $ | — | | | $ | 476 | | | $ | 214 | | | $ | 690 | | | $ | — | | | $ | 346 | | | $ | 12 | | | $ | 358 | |
| | | | | | | | | | | | | | | | | | | | | | | | | | | | | | | | |
91
The following table sets forth the fair value and balance sheet classification of derivative instruments as of December 31, 2011 and 2010:
| | | | | | | | | | | | | | | | | | | | | | | | |
| | | December 31, 2011 | | | December 31, 2010 | |
| | | Designated
as Hedging
Instruments | | | Not
Designated
as Hedging
Instruments | | | Total | | | Designated
as Hedging
Instruments | | | Not
Designated
as Hedging
Instruments | | | Total | |
| | | (in millions) | | | | | | (in millions) | | | | |
Assets | | | | | | | | | | | | | | | | | | | | | | | | |
Current assets: | | | | | | | | | | | | | | | | | | | | | | | | |
Foreign currency derivatives | | $ | 10 | | | $ | 18 | | | $ | 28 | | | $ | — | | | $ | 6 | | | $ | 6 | |
Commodity and other derivatives | | | 2 | | | | 19 | | | | 21 | | | | — | | | | 5 | | | | 5 | |
| | | | | | | | | | | | | | | | | | | | | | | | |
Total current assets | | | 12 | | | | 37 | | | | 49 | | | | — | | | | 11 | | | | 11 | |
| | | | | | | | | | | | | | | | | | | | | | | | |
| | | | | | |
Noncurrent assets: | | | | | | | | | | | | | | | | | | | | | | | | |
Interest rate derivatives | | | — | | | | — | | | | — | | | | 49 | | | | — | | | | 49 | |
Cross currency derivatives | | | 1 | | | | — | | | | 1 | | | | 12 | | | | — | | | | 12 | |
Foreign currency derivatives | | | 3 | | | | 58 | | | | 61 | | | | — | | | | 27 | | | | 27 | |
Commodity and other derivatives | | | — | | | | 9 | | | | 9 | | | | — | | | | 20 | | | | 20 | |
| | | | | | | | | | | | | | | | | | | | | | | | |
Total noncurrent assets | | | 4 | | | | 67 | | | | 71 | | | | 61 | | | | 47 | | | | 108 | |
| | | | | | | | | | | | | | | | | | | | | | | | |
Total assets | | $ | 16 | | | $ | 104 | | | $ | 120 | | | $ | 61 | | | $ | 58 | | | $ | 119 | |
| | | | | | | | | | | | | | | | | | | | | | | | |
| | | | | | |
Liabilities | | | | | | | | | | | | | | | | | | | | | | | | |
Current liabilities: | | | | | | | | | | | | | | | | | | | | | | | | |
Interest rate derivatives | | $ | 110 | | | $ | 9 | | | $ | 119 | | | $ | 107 | | | $ | 11 | | | $ | 118 | |
Cross currency derivatives | | | 5 | | | | — | | | | 5 | | | | 2 | | | | — | | | | 2 | |
Foreign currency derivatives | | | 1 | | | | 5 | | | | 6 | | | | 8 | | | | 5 | | | | 13 | |
Commodity and other derivatives | | | — | | | | 23 | | | | 23 | | | | — | | | | — | | | | — | |
| | | | | | | | | | | | | | | | | | | | | | | | |
Total current liabilities | | | 116 | | | | 37 | | | | 153 | | | | 117 | | | | 16 | | | | 133 | |
| | | | | | | | | | | | | | | | | | | | | | | | |
| | | | | | |
Long-term liabilities: | | | | | | | | | | | | | | | | | | | | | | | | |
Interest rate derivatives | | | 425 | | | | 15 | | | | 440 | | | | 186 | | | | 15 | | | | 201 | |
Cross currency derivatives | | | 14 | | | | — | | | | 14 | | | | — | | | | — | | | | — | |
Foreign currency derivatives | | | — | | | | 20 | | | | 20 | | | | — | | | | 23 | | | | 23 | |
Commodity and other derivatives | | | 3 | | | | 60 | | | | 63 | | | | — | | | | 1 | | | | 1 | |
| | | | | | | | | | | | | | | | | | | | | | | | |
Total long-term liabilities | | | 442 | | | | 95 | | | | 537 | | | | 186 | | | | 39 | | | | 225 | |
| | | | | | | | | | | | | | | | | | | | | | | | |
Total liabilities | | $ | 558 | | | $ | 132 | | | $ | 690 | | | $ | 303 | | | $ | 55 | | | $ | 358 | |
| | | | | | | | | | | | | | | | | | | | | | | | |
The Company has elected not to offset net derivative positions in the financial statements. Accordingly, the Company does not offset such derivative positions against the fair value of amounts (or amounts that approximate fair value) recognized for the right to reclaim cash collateral (a receivable) or the obligation to return cash collateral (a payable) under master netting arrangements. At December 31, 2011 and 2010, we held $3 million and $0 million, respectively, of cash collateral that we received from counterparties to our derivative positions. Beyond the cash collateral held by us, our derivative assets are exposed to the credit risk of the respective counterparty and, due to this credit risk, the fair value of our derivative assets (as shown in the above two tables) have been reduced by a credit valuation adjustment. Also, at December 31, 2011 and 2010, we had $16 million and $0 million, respectively, of cash collateral posted with (held by) counterparties to our derivative positions.
The table below sets forth the pre-tax accumulated other comprehensive income (loss) expected to be recognized as an increase (decrease) to income from continuing operations before income taxes over the next twelve months as of December 31, 2011 for the following types of derivative instruments:
| | | | |
| | | Accumulated Other
Comprehensive
Income (Loss)(1) | |
| | | (in millions) | |
Interest rate derivatives | | $ | (101 | ) |
Cross currency derivatives | | $ | (1 | ) |
Foreign currency derivatives | | $ | 7 | |
Commodity and other derivatives | | $ | (1 | ) |
| (1) | Excludes a loss of $94 million expected to be recognized as part of the sale of Cartagena, which closed on February 9, 2012, and is further discussed in Note 23—Acquisitions and Dispositions. |
The balance in accumulated other comprehensive loss related to derivative transactions will be reclassified into earnings as interest expense is recognized for interest rate hedges and cross currency swaps (except for the amount reclassified to foreign currency transaction gains and losses to offset the remeasurement of the foreign currency-denominated debt being hedged by the cross currency swaps), as depreciation is recognized for interest rate hedges during construction, as foreign currency transaction gains and losses are recognized for hedges of foreign currency exposure, and as electricity sales and fuel purchases are recognized for hedges of forecasted electricity and fuel transactions. These balances are included in the consolidated statements of cash flows as operating and/or investing activities based on the nature of the underlying transaction.
For the years ended December 31, 2011, 2010 and 2009, pre-tax gains (losses) of $0 million, $(1) million, and $0 million net of noncontrolling interests, respectively, were reclassified into earnings as a result of the discontinuance of a cash flow hedge because it was probable that the forecasted transaction would not occur by the end of the originally specified time period (as documented at the inception of the hedging relationship) or within an additional two-month time period thereafter.
92
The following table sets forth the pre-tax gains (losses) recognized in accumulated other comprehensive loss (“AOCL”) and earnings related to the effective portion of derivative instruments in qualifying cash flow hedging relationships, as defined in the accounting standards for derivatives and hedging, for the years ended December 31, 2011, 2010 and 2009:
| | | | | | | | | | | | | | | | | | | | | | | | | | |
| | | Gains (Losses)
Recognized in AOCL | | | Consolidated Statement of Operations | | Gains (Losses) Reclassified
from AOCL into Earnings | |
| | | 2011 | | | 2010 | | | 2009 | | | | 2011 | | | 2010 | | | 2009 | |
| | | (in millions) | | | | | (in millions) | |
Interest rate derivatives | | $ | (475 | )(1) | | $ | (243 | )(1) | | $ | 49 | | | Interest expense | | $ | (125 | )(2) | | $ | (108 | )(2) | | $ | (72 | )(2) |
| | | | | | | | | | | | | | Non-regulated cost of sales | | | (3 | ) | | | (2 | ) | | | — | |
| | | | | | | | | | | | | | Net equity in earnings of affiliates | | | (4 | ) | | | (1 | ) | | | — | |
Cross currency derivatives | | | (36 | ) | | | 11 | | | | 48 | | | Interest expense | | | (10 | ) | | | (1 | ) | | | 2 | |
| | | | | | | | | | | | | | Foreign currency transaction gains (losses) | | | (16 | ) | | | 25 | | | | 43 | |
Foreign currency derivatives | | | 24 | | | | (9 | ) | | | 2 | | | Foreign currency transaction gains (losses) | | | 1 | | | | (3 | ) | | | — | |
Commodity and other derivatives | | | — | | | | (8 | ) | | | 120 | | | Non-regulated revenue | | | — | (3) | | | — | (3) | | | 3 | (3) |
| | | | | | | | | | | | | | Non-regulated cost of sales | | | (2 | ) | | | — | | | | — | |
| | | | | | | | | | | | | | | | | | | | | | | | | | |
Total | | $ | (487 | ) | | $ | (249 | ) | | $ | 219 | | | | | $ | (159 | ) | | $ | (90 | ) | | $ | (24 | ) |
| | | | | | | | | | | | | | | | | | | | | | | | | | |
| (1) | Includes $(49) million and $(29) million related to Cartagena for the years ended December 31, 2011 and 2010, respectively, which was consolidated prospectively beginning January 1, 2010 under VIE accounting guidance. |
| (2) | Includes amounts that were reclassified from AOCL related to derivative instruments that previously, but no longer, qualify for cash flow hedge accounting. Excludes $0 million, $(113) million and $(35) million related to discontinued operations for the years ended December 31, 2011, 2010 and 2009, respectively. |
| (3) | Excludes $0 million, $11 million and $190 million related to discontinued operations for the years ended December 31, 2011, 2010 and 2009, respectively. |
The following table sets forth the pre-tax gains (losses) recognized in earnings related to the ineffective portion of derivative instruments in qualifying cash flow hedging relationships, as defined in the accounting standards for derivatives and hedging, for the years ended December 31, 2011, 2010 and 2009:
| | | | | | | | | | | | | | |
| | | Classification in Consolidated Statement of Operations | | Gains (Losses)
Recognized in Earnings | |
| | | | 2011 | | | 2010 | | | 2009 | |
| | | | | (in millions) | |
Interest rate derivatives | | Interest expense | | $ | (6 | ) | | $ | (15 | ) | | $ | (8 | ) |
| | Net equity in earnings of affiliates | | | (2 | ) | | | — | (1) | | | (1 | ) |
Cross currency derivatives | | Interest expense | | | (4 | ) | | | 5 | | | | (11 | ) |
Foreign currency derivatives | | Foreign currency transaction gains (losses) | | | — | (1) | | | — | (1) | | | — | (1) |
| | | | | | | | | | | | | | |
Total | | | | $ | (12 | ) | | $ | (10 | ) | | $ | (20 | ) |
| | | | | | | | | | | | | | |
93
The following table sets forth the pre-tax gains (losses) recognized in earnings related to derivative instruments not designated as hedging instruments under the accounting standards for derivatives and hedging, for the years ended December 31, 2011, 2010 and 2009:
| | | | | | | | | | | | | | |
| | | Classification in
Consolidated Statement of Operations | | Gains (Losses)
Recognized in Earnings | |
| | | | 2011 | | | 2010 | | | 2009 | |
| | | | | (in millions) | |
Interest rate derivatives | | Interest expense | | $ | (4 | ) | | $ | (9 | ) | | $ | (26 | ) |
Foreign currency derivatives | | Foreign currency transaction gains (losses) | | | 57 | | | | (36 | ) | | | (38 | ) |
| | Net equity in earnings of affiliates | | | — | | | | (2 | ) | | | — | |
Commodity and other derivatives | | Non-regulated revenue | | | (71 | ) | | | 21 | | | | 1 | |
| | Regulated revenue | | | 1 | | | | — | | | | — | |
| | Non-regulated cost of sales | | | (9 | ) | | | 5 | | | | (30 | ) |
| | Regulated cost of sales | | | (5 | ) | | | — | | | | — | |
| | | | | | | | | | | | | | |
Total | | | | $ | (31 | ) | | $ | (21 | ) | | $ | (93 | ) |
| | | | | | | | | | | | | | |
In addition, DPL and IPL have derivative instruments for which the gains and losses are accounted for in accordance with accounting standards for regulated operations, as regulatory assets or liabilities. Gains and losses due to changes in the fair value of these derivatives are probable of recovery through future rates and are initially recognized as an adjustment to the regulatory asset or liability and recognized through earnings when the related costs are recovered through rates. Therefore, these gains and losses are excluded from the above table. The following table sets forth the change in regulatory assets and liabilities resulting from the change in the fair value of these derivatives for the years ended December 31, 2011 and 2010:
| | | | | | | | |
| | | 2011 | | | 2010 | |
| | | (in millions) | |
(Increase) decrease in regulatory assets | | $ | (5 | ) | | $ | (3 | ) |
Increase (decrease) in regulatory liabilities | | $ | 8 | | | $ | 1 | |
Credit Risk-Related Contingent Features
Gener, our generation business in Chile, has cross currency swap agreements with counterparties to swap Chilean inflation indexed bonds issued in December 2007 into U.S. Dollars. The derivative agreements contain credit contingent provisions which would permit the counterparties with which Gener is in a net liability position to require collateral credit support when the fair value of the derivatives exceeds the unsecured thresholds established in the agreements. These thresholds vary based on Gener’s credit rating. If Gener’s credit rating were to fall below the minimum threshold established in the swap agreements, the counterparties can demand immediate collateralization of the entire mark-to-market loss of the swaps (excluding credit valuation adjustments), which was $18 million at December 31, 2011. The mark-to-market value of the swaps was in a net asset position at December 31, 2010. As of December 31, 2011 and 2010, Gener had not posted collateral to support these swaps.
DPL, our utility in Ohio, has certain over-the-counter commodity derivative contracts under master netting agreements that contain provisions that require its debt to maintain an investment-grade credit rating from credit rating agencies. If its debt were to fall below investment grade, the business would be in violation of these provisions, and the counterparties to the derivative contracts could request immediate payment or demand immediate and ongoing full overnight collateralization of the mark-to-market loss (excluding credit valuation adjustments), which was $28 million as of December 31, 2011. As of December 31, 2011, DPL had posted $16 million of cash collateral directly with third parties and in a broker margin account and held $3 million of cash collateral that it received from counterparties to its derivative instruments that were in an asset position.
94
7. INVESTMENTS IN AND ADVANCES TO AFFILIATES
The following table summarizes the relevant effective equity ownership interest and carrying values for the Company’s investments accounted for under the equity method as of December 31, 2011 and 2010.
| | | | | | | | | | | | | | | | | | |
| | | | | December 31, | |
Affiliate | | Country | | 2011 | | | 2010 | | | 2011 | | | 2010 | |
| | | | | Carrying Value | | | Ownership Interest % | |
| | | | | (in millions) | | | | | | | |
AES Solar Energy Ltd. | | Europe | | $ | 225 | | | $ | 256 | | | | 50 | % | | | 50 | % |
AES Solar Power LLC | | United States | | | 91 | | | | 8 | | | | 50 | % | | | 50 | % |
AES Solar Power, PR, LLC | | Puerto Rico | | | 8 | | | | — | | | | 50 | % | | | 0 | % |
Barry(1) | | United Kingdom | | | — | | | | — | | | | 100 | % | | | 100 | % |
CET(1) | | Brazil | | | 14 | | | | 22 | | | | 72 | % | | | 72 | % |
Chigen affiliates(2) | | China | | | 30 | | | | 146 | | | | 25 | % | | | 25 | % |
China Wind(3) | | China | | | 75 | | | | 69 | | | | 49 | % | | | 49 | % |
Elsta | | Netherlands | | | 197 | | | | 202 | | | | 50 | % | | | 50 | % |
Entek | | Turkey | | | 121 | | | | — | | | | 50 | % | | | 0 | % |
Guacolda | | Chile | | | 186 | | | | 149 | | | | 35 | % | | | 35 | % |
IC Ictas Energy Group | | Turkey | | | 161 | | | | 151 | | | | 51 | % | | | 51 | % |
InnoVent(1) | | France | | | 32 | | | | 31 | | | | 40 | % | | | 40 | % |
JHRH | | China | | | 59 | | | | 39 | | | | 49 | % | | | 35 | % |
OPGC | | India | | | 203 | | | | 224 | | | | 49 | % | | | 49 | % |
Trinidad Generation Unlimited(1) | | Trinidad | | | 19 | | | | 20 | | | | 10 | % | | | 10 | % |
Other affiliates | | | | | 1 | | | | 3 | | | | | | | | | |
| | | | | | | | | | | | | | | | | | |
Total investments in and advances to affiliates | | $ | 1,422 | | | $ | 1,320 | | | | | | | | | |
| | | | | | | | | | | | | | | | | | |
| (1) | Represent VIEs in which the Company holds a variable interest, but is not the primary beneficiary. |
| (2) | Represent our investments in Chengdu AES Kaihua Gas Turbine Company Ltd. and Yangcheng International Power Generating Co. Ltd. |
| (3) | Represent our investments in Guohua AES (Huanghua) Wind Power Co. Ltd., Guohua AES (Hulunbeier) Wind Power Co. Ltd., Guohua AES (Chenba’-erhu) Wind Power Co. Ltd., and Guohua AES (Xinba’-erhu) Wind Power Co. Ltd. |
AES Solar Energy Ltd.—In the fourth quarter of 2011, AES Solar Energy Ltd. (“AES Solar”), recognized a $40 million other-than-temporary impairment of a cost method investment in a manufacturer of solar panels. The Company’s share of impairment was $20 million, which was recorded within “Net equity in earnings of affiliates” in the Consolidated Statement of Operations.
AES Solar Power, PR, LLC—In June 2011, the Company formed AES Solar Power, PR LLC., a joint venture with R/C PR Investment Partnership L.P., a wholly-owned subsidiary of Riverstone/Carlyle Renewable Energy Partners II, LP. This joint venture was created to develop and construct a 24 MW project in Guayama, Puerto Rico. The investment balance at December 31, 2011 was $8 million.
AES Barry Ltd.—The Company holds a 100% ownership interest in AES Barry Ltd. (“Barry”), a dormant entity in the United Kingdom that disposed of its generation and other operating assets. Due to a debt agreement, no material financial or operating decisions can be made without the banks’ consent, and the Company does not control Barry. As of December 31, 2011 and 2010, other long-term liabilities included $52 million and $53 million, respectively, related to this debt agreement.
Cayman Energy Trader (“CET”)—In 2010, the Company transferred its 14.8% voting interest in Companhia Energética de Minas Gerais (“CEMIG”), an integrated utility in Brazil, through SEB, a Brazilian subsidiary, to a third party. The buyer also assumed a debt with Banco Nacional de Desenvolvimento Econômico e Social (“BNDES”) in the amount of approximately $1.4 billion (the “BNDES Loan”) including all unpaid interest and penalties. In exchange, SEB received $25 million and obtained a full release from any claims of BNDES and originating from the BNDES Loan. CEMIG was previously accounted for as an equity method investment due to the Company’s representation on its board of directors. The transfer resulted in the recognition of a $115 million pre-tax gain reflected in “Net equity in earnings of affiliates” in the Consolidated Statement of Operations for the year ended December 31, 2010. Additionally, $70 million of net tax expense resulting from the CEMIG transfer was recorded as “income tax expense,” rather than equity earnings, since the expense is attributable to a consolidated corporate level partner in the CEMIG investment. The Company retains its ownership in CET.
Chigen affiliates—In 2011, the Company recognized an other-than-temporary impairment of $74 million on Yangcheng, an equity method investment in China. See Note 8—Other Non-Operating Expense for further information.
95
Entek—In February 2011, the Company acquired a 49.6% interest in Entek Elektrik Uretim A.S. (“Entek”) for approximately $136 million. Additional purchase consideration of $13 million was paid in May 2011, increasing the total purchase consideration to $149 million. Entek owns and operates two gas-fired generation facilities in Turkey with an aggregate capacity of 312 MW and is also engaged in an energy trading business. The Company has significant influence, but not control, of Entek and, accordingly, the investment has been accounted for under the equity method of accounting.
Jianghe Rural Electrification Development Co., LTD (“JHRH”)—On June 3, 2010, the Company acquired a 35% ownership in this joint venture which operates seven hydro plants in China. In April 2011, the Company acquired an additional 14% ownership for $15 million, increasing its total ownership to 49%.
Trinidad Generation Unlimited (“TGU”)—Although the Company’s ownership in TGU is 10%, the Company accounts for the investment as an equity method investment due to the Company’s ability to exercise significant influence through the supermajority vote requirement for any significant future project development activities. TGU had four gas turbines commence commercial operations in 2011.
Summarized Financial Information
The following tables summarize financial information of the Company’s 50%-or-less owned affiliates and majority-owned unconsolidated subsidiaries that are accounted for using the equity method.
| | | | | | | | | | | | | | | | | | | | | | | | |
| | | 50%-or-less Owned Affiliates | | | Majority-Owned Unconsolidated Subsidiaries | |
Years ended December 31, | | 2011 | | | 2010 | | | 2009 | | | 2011 | | | 2010 | | | 2009 | |
| | | (in millions) | | | (in millions) | |
Revenue | | $ | 1,668 | | | $ | 1,341 | | | $ | 1,229 | | | $ | 24 | | | $ | 20 | | | $ | 158 | |
Gross margin | | | 258 | | | | 207 | | | | 240 | | | | 24 | | | | 18 | | | | 71 | |
Net income (loss) | | | (5 | ) | | | 100 | | | | 110 | | | | (5 | ) | | | 7 | | | | (5 | ) |
| | | | | | |
December 31, | | 2011 | | | 2010 | | | | | | 2011 | | | 2010 | | | | |
| | | (in millions) | | | | | | (in millions) | | | | |
Current assets | | $ | 1,182 | | | $ | 948 | | | | | | | $ | 58 | | | $ | 114 | | | | | |
Noncurrent assets | | | 4,298 | | | | 4,131 | | | | | | | | 519 | | | | 646 | | | | | |
Current liabilities | | | 899 | | | | 687 | | | | | | | | 109 | | | | 144 | | | | | |
Noncurrent liabilities | | | 1,720 | | | | 1,597 | | | | | | | | 269 | | | | 242 | | | | | |
Noncontrolling interests | | | (240 | ) | | | (206 | ) | | | | | | | — | | | | 125 | | | | | |
Stockholders’ equity | | | 3,101 | | | | 3,001 | | | | | | | | 199 | | | | 249 | | | | | |
At December 31, 2011, retained earnings included $136 million related to the undistributed earnings of the Company’s 50%-or-less owned affiliates. Distributions received from these affiliates were $36 million, $49 million and $35 million for the years ended December 31, 2011, 2010 and 2009, respectively. As of December 31, 2011, the aggregate carrying amount of our investments in equity affiliates exceeded the underlying equity in their net assets by $145 million.
Refer to Item 1 of this Form 8-K for additional information on these affiliates.
8. OTHER NON-OPERATING EXPENSE
Other non-operating expense of $82 million for the year ended December 31, 2011 primarily consisted of other-than-temporary impairments of equity method investments in China. During the third quarter of 2011 as part of the quarterly close process, the Company evaluated its investment in Yangcheng, a 2,100 MW coal-fired plant in China, for other-than-temporary-impairment. AES owns a 25% interest in Yangcheng and the remaining equity interest in the venture is held by Chinese partners. During the nine months ended September 30, 2011, coal prices continued an upward trend in China, thereby reducing the operating margin of coal generation facilities. During this time, there was no corresponding increase in tariffs to compensate for higher coal prices. Power prices in China are tightly regulated by the national and provincial governments, which often limit power generators’ ability to pass
96
through increases in fuel costs to customers. In addition, under the Yangcheng venture agreement, AES will surrender its equity interest to the venture partners in 2016 without additional compensation. During the nine months ended September 30, 2011, management continued to monitor the situation and in the third quarter determined that it was unlikely that there would be a reversal in the trends in coal prices during the remaining term of the venture. Accordingly, in September 2011, management revised downward its forecasts of earning and cash flows over the remaining term of the venture. The revised forecasts were significantly lower than management’s earlier estimates such that the carrying amount of the investment in Yangcheng was considered to have incurred an other-than-temporary-impairment. In determining the fair value of our investment, management used a discounted cash flow analysis based on probability-weighted revised cash distribution forecasts under multiple scenarios. As of September 30, 2011, Yangcheng had a carrying amount of $100 million which was written down to its estimated fair value of $26 million, and the difference was recognized as other non-operating expense.
Other non-operating expense of $7 million for the year ended December 31, 2010 primarily consisted of an other-than-temporary impairment of an equity method investment. During the second quarter of 2010, AES decided to not pursue its investment in a project to generate environmental offset credits and recognized the other-than-temporary impairment.
Other non-operating expense of $12 million for the year ended December 31, 2009 primarily consisted of impairment charges on a cost method investment in a company developing a commercial facility for a “blue gas” (coal to gas) technology project.
9. GOODWILL AND OTHER INTANGIBLE ASSETS
The following table summarizes the changes in the carrying amount of goodwill, by segment for the years ended December 31, 2011 and 2010.
| | | | | | | | | | | | | | | | | | | | | | | | | | | | | | | | |
| | | Latin
America -
Generation | | | Latin
America -
Utilities | | | North
America -
Generation | | | North
America -
Utilities | | | Europe -
Generation | | | Asia -
Generation | | | Corporate
and Other | | | Total | |
| | | | | | | | |
Balance as of December 31, 2009 | | | | | | | | | | | | | | | | | | | | | | | | | | | | | | | | |
Goodwill | | $ | 926 | | | $ | 140 | | | $ | 111 | | | $ | — | | | $ | 137 | | | $ | 78 | | | $ | 101 | | | $ | 1,493 | |
Accumulated impairment losses | | | (24 | ) | | | (7 | ) | | | (20 | ) | | | — | | | | (137 | ) | | | — | | | | (6 | ) | | | (194 | ) |
| | | | | | | | | | | | | | | | | | | | | | | | | | | | | | | | |
Net balance | | | 902 | | | | 133 | | | | 91 | | | | — | | | | — | | | | 78 | | | | 95 | | | | 1,299 | |
| | | | | | | | |
Impairment losses | | | — | | | | — | | | | (18 | ) | | | — | | | | — | | | | — | | | | (3 | ) | | | (21 | ) |
Foreign currency translation and other | | | — | | | | — | | | | (10 | ) | | | — | | | | — | | | | 3 | | | | — | | | | (7 | ) |
| | | | | | | | |
Balance as of December 31, 2010 | | | | | | | | | | | | | | | | | | | | | | | | | | | | | | | | |
Goodwill | | | 926 | | | | 140 | | | | 101 | | | | — | | | | 137 | | | | 81 | | | | 101 | | | | 1,486 | |
Accumulated impairment losses | | | (24 | ) | | | (7 | ) | | | (38 | ) | | | — | | | | (137 | ) | | | — | | | | (9 | ) | | | (215 | ) |
| | | | | | | | | | | | | | | | | | | | | | | | | | | | | | | | |
Net balance | | | 902 | | | | 133 | | | | 63 | | | | — | | | | — | | | | 81 | | | | 92 | | | | 1,271 | |
| | | | | | | | |
Impairment losses | | | — | | | | — | | | | — | | | | — | | | | — | | | | (17 | ) | | | — | | | | (17 | ) |
Goodwill acquired during the year(1) | | | — | | | | — | | | | — | | | | 2,489 | | | | — | | | | — | | | | — | | | | 2,489 | |
Foreign currency translation and other | | | — | | | | — | | | | (10 | ) | | | — | | | | — | | | | — | | | | — | | | | (10 | ) |
| | | | | | | | |
Balance as of December 31, 2011 | | | | | | | | | | | | | | | | | | | | | | | | | | | | | | | | |
Goodwill | | | 926 | | | | 140 | | | | 91 | | | | 2,489 | | | | 137 | | | | 81 | | | | 101 | | | | 3,965 | |
Accumulated impairment losses | | | (24 | ) | | | (7 | ) | | | (38 | ) | | | — | | | | (137 | ) | | | (17 | ) | | | (9 | ) | | | (232 | ) |
| | | | | | | | | | | | | | | | | | | | | | | | | | | | | | | | |
Net balance | | $ | 902 | | | $ | 133 | | | $ | 53 | | | $ | 2,489 | | | $ | — | | | $ | 64 | | | $ | 92 | | | $ | 3,733 | |
| | | | | | | | | | | | | | | | | | | | | | | | | | | | | | | | |
| (1) | Represents goodwill resulting from the acquisition of DPL, which was allocated to the two newly established reporting units identified within DPL. See Note 23—Acquisitions and Dispositions for further information. |
During the third quarter of 2011, the Company identified higher coal prices and the resulting reduced operating margins in China as an impairment indicator for the goodwill at Chigen, our wholly-owned subsidiary that holds equity interests in Chinese ventures and reported in the Asia Generation segment. A significant downward
97
revision of cash flow forecasts indicated that the fair value of Chigen reporting unit was lower than its carrying amount. As of September 30, 2011, Chigen had goodwill of $17 million. The Company performed an interim impairment evaluation of Chigen’s goodwill and determined that goodwill had no implied fair value. As a result, the entire carrying amount of $17 million was recognized as goodwill impairment in the third quarter.
During the third quarter of 2010, Deepwater, our petcoke-fired merchant generation facility in Texas, reported in the North America Generation segment, incurred a goodwill impairment of $18 million. The Company determined the adverse market conditions as an impairment indicator, performed the two-step goodwill impairment test and recognized the entire $18 million carrying amount of goodwill as goodwill impairment in the third quarter.
In 2009, Kilroot, our coal fired power plant in the United Kingdom, reported in the Europe Generation segment, incurred a goodwill impairment of $118 million. Factors contributing to the impairment included: reduced profit expectations based on latest estimates of future commodity prices and reduced expectations on the recovery of cash flows on the existing plant following the Company’s decision to forgo capital expenditures to meet emission allowance requirements taking effect in 2024. Additionally, one of our subsidiaries located in the Ukraine and reported within “Corporate and Other” incurred a goodwill impairment loss of $4 million.
The following tables summarize the balances comprising other intangible assets in the accompanying Consolidated Balance Sheets as of December 31, 2011 and 2010:
| | | | | | | | | | | | | | | | | | | | | | | | |
| | | December 31, 2011 | | | December 31, 2010 | |
| | | Gross
Balance | | | Accumulated
Amortization | | | Net
Balance | | | Gross
Balance | | | Accumulated
Amortization | | | Net
Balance | |
| | | (in millions) | | | (in millions) | |
Subject to Amortization | | | | | | | | | | | | | | | | | | | | | | | | |
Project development rights(1) | | $ | 102 | | | $ | — | | | $ | 102 | | | $ | 117 | | | $ | — | | | $ | 117 | |
Sales concessions | | | 156 | | | | (92 | ) | | | 64 | | | | 162 | | | | (89 | ) | | | 73 | |
Contractual payment rights(2) | | | 69 | | | | (13 | ) | | | 56 | | | | 65 | | | | (4 | ) | | | 61 | |
Land use rights | | | 49 | | | | (4 | ) | | | 45 | | | | 50 | | | | (2 | ) | | | 48 | |
Management rights | | | 39 | | | | (13 | ) | | | 26 | | | | 66 | | | | (30 | ) | | | 36 | |
Emission allowances(3) | | | 18 | | | | — | | | | 18 | | | | 8 | | | | — | | | | 8 | |
Electric security plan | | | 88 | | | | (9 | ) | | | 79 | | | | — | | | | — | | | | — | |
Customer contracts | | | 45 | | | | (3 | ) | | | 42 | | | | — | | | | — | | | | — | |
Customer relationships | | | 30 | | | | — | | | | 30 | | | | — | | | | — | | | | — | |
Other(4) | | | 71 | | | | (30 | ) | | | 41 | | | | 70 | | | | (26 | ) | | | 44 | |
| | | | | | | | | | | | | | | | | | | | | | | | |
Subtotal | | | 667 | | | | (164 | ) | | | 503 | | | | 538 | | | | (151 | ) | | | 387 | |
Indefinite-Lived Intangible Assets | | | | | | | | | | | | | | | | | | | | | | | | |
Land use rights | | | 52 | | | | — | | | | 52 | | | | 51 | | | | — | | | | 51 | |
Emission allowances(5) | | | 4 | | | | — | | | | 4 | | | | 8 | | | | — | | | | 8 | |
Trademark/Trade name | | | 5 | | | | — | | | | 5 | | | | — | | | | — | | | | — | |
Other | | | 2 | | | | — | | | | 2 | | | | 2 | | | | — | | | | 2 | |
| | | | | | | | | | | | | | | | | | | | | | | | |
Subtotal | | | 63 | | | | — | | | | 63 | | | | 61 | | | | — | | | | 61 | |
| | | | | | | | | | | | | | | | | | | | | | | | |
Total | | $ | 730 | | | $ | (164 | ) | | $ | 566 | | | $ | 599 | | | $ | (151 | ) | | $ | 448 | |
| | | | | | | | | | | | | | | | | | | | | | | | |
| (1) | Represent development rights, including but not limited to, land control, various permits and right to acquire equity interests in development projects resulting from asset acquisitions by our Wind group. A portion of these development rights was recognized as a loss on disposal of discontinued operations when certain development projects were abandoned during the fourth quarter of 2011. See Note 22—Discontinued Operations and Held for Sale Businesses for further information. |
| (2) | Represent legal rights to receive system reliability payments from the regulator. |
| (3) | Acquired or purchased emission allowances are expensed when utilized and included in net income for the year. |
| (4) | Consists of various intangible assets including PPAs and transmission rights, none of which is individually significant. |
| (5) | Represent perpetual emission allowances without an expiration date. |
98
The following table summarizes, by category, intangible assets acquired during the years ended December 31, 2011 and 2010:
| | | | | | | | | | | | |
| | | December 31, 2011 |
| | | Amount | | | Subject to Amortization/ Indefinite-Lived | | Weighted Average
Amortization Period | | | Amortization
Method |
| | | (in millions) | | | | | (in years) | | | |
Electric security plan(2) | | $ | 88 | | | Subject to amortization | | | 1 | | | Straight line |
Customer relationship(1)(3) | | | 30 | | | Subject to amortization | | | 12 | | | Straight line |
Customer contracts(1)(4) | | | 45 | | | Subject to amortization | | | 3 | | | Other |
Trademark/Trade name(1)(5) | | | 5 | | | Indefinite-lived | | | N/A | | | N/A |
Other | | | 4 | | | Subject to amortization | | | Various | | | As utilized |
| | | | | | | | | | | | |
Total | | $ | 172 | | | | | | | | | |
| | | | | | | | | | | | |
| |
| | | December 31, 2010 |
| | | Amount | | | Subject to Amortization/ Indefinite-Lived | | Weighted Average
Amortization Period | | | Amortization
Method |
| | | (in millions) | | | | | (in years) | | | |
Project development rights | | $ | 141 | | | Subject to amortization | | | Various | | | Straight line |
Contractual payment rights | | | 65 | | | Subject to amortization | | | 10 | | | Straight line |
Emission allowances | | | 14 | | | Subject to amortization | | | Various | | | As utilized |
Land use rights | | | 7 | | | Indefinite-lived | | | N/A | | | N/A |
| | | | | | | | | | | | |
Total | | $ | 227 | | | | | | | | | |
| | | | | | | | | | | | |
| (1) | Represents intangible assets arising from the acquisition of DPL. See Note 23—Acquisitions and Dispositions for further information. |
| (2) | Electric Security Plan is a rate plan for the supply and pricing of electric generation service applicable to Ohio’s electric utilities under state law. It provides a level of price stability to consumers of electricity as compared to market-based electricity prices. The plan was recognized as an intangible asset since the prices under the plan are higher than market prices charged by competitive retailers or CRES. |
| (3) | Customer relationships represent the value assigned to customer information possessed by DPL in the preliminary purchase price allocation, where DPL has regular contact with the customer, and the customer has the ability to make direct contact with DPL. See Note 23—Acquisitions and Dispositions for further information. |
| (4) | The amortization method used reflects the pattern in which the economic benefits of the intangible asset are consumed. |
| (5) | Trademarks/Trade name represent the value assigned to trade name of DPLER, DPL’s subsidiary engaged in competitive retail business in Ohio. |
The following table summarizes the estimated amortization expense, broken down by intangible asset category, for 2012 through 2016:
| | | | | | | | | | | | | | | | | | | | |
| | | Estimated amortization expense | |
| | | 2012 | | | 2013 | | | 2014 | | | 2015 | | | 2016 | |
| | | (in millions) | |
Contractual payment rights | | $ | 9 | | | $ | 9 | | | $ | 9 | | | $ | 9 | | | $ | 3 | |
Sales concessions | | | 6 | | | | 6 | | | | 6 | | | | 6 | | | | 5 | |
Customer relationships & contracts | | | 35 | | | | 11 | | | | 4 | | | | 3 | | | | 3 | |
Electric security plan | | | 79 | | | | — | | | | — | | | | — | | | | — | |
All other | | | 9 | | | | 6 | | | | 4 | | | | 4 | | | | 4 | |
| | | | | | | | | | | | | | | | | | | | |
Total | | $ | 138 | | | $ | 32 | | | $ | 23 | | | $ | 22 | | | $ | 15 | |
| | | | | | | | | | | | | | | | | | | | |
Intangible asset amortization expense was $36 million, $14 million and $16 million for the years ended December 31, 2011, 2010 and 2009, respectively.
99
10. REGULATORY ASSETS & LIABILITIES
The Company has recorded regulatory assets and liabilities that it expects to pass through to its customers in accordance with, and subject to, regulatory provisions as follows:
| | | | | | | | | | |
| | | December 31, | | | |
| | | 2011 | | | 2010 | | | Recovery Period |
| | | (in millions) | | | |
REGULATORY ASSETS | | | | | | |
Current regulatory assets: | | | | | | | | | | |
Brazil tariff recoveries:(1) | | | | | | | | | | |
Energy purchases | | $ | 79 | | | $ | 62 | | | Over tariff reset period |
Transmission costs, regulatory fees and other | | | 185 | | | | 82 | | | Over tariff reset period |
El Salvador tariff recoveries(2) | | | 108 | | | | 67 | | | Over tariff reset period |
Other(3) | | | 19 | | | | 1 | | | Various |
| | | | | | | | | | |
Total current regulatory assets | | | 391 | | | | 212 | | | |
| | | | | | | | | | |
| | | |
Noncurrent regulatory assets: | | | | | | | | | | |
Defined benefit pension obligations at IPL and DPL(4)(5) | | | 399 | | | | 235 | | | Various |
Income taxes recoverable from customers(4)(6) | | | 76 | | | | 66 | | | Various |
Brazil tariff recoveries:(1) | | | | | | | | | | |
Energy purchases | | | 84 | | | | 18 | | | Over tariff reset period |
Transmission costs, regulatory fees and other | | | 86 | | | | 32 | | | Over tariff reset period |
Deferred Midwest ISO costs(7) | | | 80 | | | | 80 | | | To be determined |
Other(3) | | | 122 | | | | 39 | | | Various |
| | | | | | | | | | |
Total noncurrent regulatory assets | | | 847 | | | | 470 | | | |
| | | | | | | | | | |
TOTAL REGULATORY ASSETS | | $ | 1,238 | | | $ | 682 | | | |
| | | | | | | | | | |
REGULATORY LIABILITIES | | | | | | | | | | |
Current regulatory liabilities: | | | | | | | | | | |
Brazil tariff reset adjustment(8) | | $ | 190 | | | $ | — | | | To be determined |
Efficiency program costs(9) | | | 29 | | | | 58 | | | Over tariff reset period |
Brazil tariff recoveries:(1) | | | | | | | | | | |
Energy purchases | | | 305 | | | | 118 | | | Over tariff reset period |
Transmission costs, regulatory fees and other | | | 172 | | | | 71 | | | Over tariff reset period |
Other(10) | | | 37 | | | | 37 | | | Various |
| | | | | | | | | | |
Total current regulatory liabilities | | | 733 | | | | 284 | | | |
| | | | | | | | | | |
| | | |
Noncurrent regulatory liabilities: | | | | | | | | | | |
Asset retirement obligations(11) | | | 649 | | | | 509 | | | Over life of assets |
Brazil special obligations(12) | | | 422 | | | | 435 | | | To be determined |
Brazil tariff recoveries:(1) | | | | | | | | | | |
Energy purchases | | | 76 | | | | 69 | | | Over tariff reset period |
Transmission costs, regulatory fees and other | | | 64 | | | | 57 | | | Over tariff reset period |
Efficiency program costs(9) | | | 44 | | | | 54 | | | Over tariff reset period |
Other(10) | | | 24 | | | | 8 | | | Various |
| | | | | | | | | | |
Total noncurrent regulatory liabilities | | | 1,279 | | | | 1,132 | | | |
| | | | | | | | | | |
TOTAL REGULATORY LIABILITIES | | $ | 2,012 | | | $ | 1,416 | | | |
| | | | | | | | | | |
| (1) | Recoverable per National Electric Energy Agency (“ANEEL”) regulations through the Annual Tariff Adjustment (“IRT”). These costs are generally non-controllable costs and primarily consist of purchased electricity, energy transmission costs and sector costs that are considered volatile. These costs are recovered in 24 installments through the annual IRT process and are amortized over the tariff reset period. |
| (2) | Deferred fuel costs incurred by our El Salvador subsidiaries associated with purchase of energy from the El Salvador spot market and the power generation plants. In El Salvador, the deferred fuel adjustment represents the variance between the actual fuel costs and the fuel costs recovered in the tariffs. The variance is recovered semi-annually at the tariff reset period. |
100
| (3) | Includes assets with and without a rate of return. Other current regulatory assets that did not earn a rate of return were $12 million and $0 million, as of December 31, 2011 and 2010, respectively. Other noncurrent regulatory assets that did not earn a rate of return were $37 million and $14 million, as of December 31, 2011 and 2010, respectively. Other Current and Noncurrent Regulatory Assets primarily consist of: |
| | • | | Unamortized losses on long-term debt reacquired or redeemed in prior periods at IPL and DPL, which are amortized over the lives of the original issues in accordance with the FERC and PUCO rules. |
| | • | | Unamortized carrying charges and certain other costs related to Petersburg unit 4 at IPL. |
| | • | | Deferred storm costs incurred to repair 2008 storm damage at DPL, which have been deferred until such time that DPL seeks recovery in a future rate proceeding. |
| (4) | Past expenditures on which the Company does not earn a rate of return. |
| (5) | The regulatory accounting standards allow the defined pension and postretirement benefit obligation to be recorded as a regulatory asset equal to the previously unrecognized actuarial gains and losses and prior service costs that are expected to be recovered through future rates. Pension expense is recognized based on the plan’s actuarially determined pension liability. Recovery of costs is probable, but not yet determined. Pension contributions made by our Brazilian subsidiaries are not included in regulatory assets as those contributions are not covered by the established tariff in Brazil. |
| (6) | Probable of recovery through future rates, based upon established regulatory practices, which permit the recovery of current taxes. This amount is expected to be recovered, without interest, over the period as book-tax temporary differences reverse and become current taxes. |
| (7) | Transmission service costs and other administrative costs from IPL’s participation in the Midwest ISO market, which are recoverable but do not earn a rate of return. Recovery of costs is probable, but the timing is not yet determined. |
| (8) | In July 2011, the Brazilian energy regulator (the “Regulator”) postponed the periodic review and reset of a component of Eletropaulo’s regulated tariff, which determines the margin to be earned by Eletropaulo. The review and reset of this tariff component is performed every four years. From July 2011 through December 2011, Eletropaulo continued to invoice customers under the existing tariff rate, as required by the Regulator. Management believes that it is probable that the new tariff rate will be lower than the existing tariff rate, resulting in future refunds to customers, and has estimated the amount of this liability. Accordingly, as of December 31, 2011, Eletropaulo recognized a regulatory liability. It is at least reasonably possible that future events confirming the final amount of the regulatory liability or a change in the estimated amount of the liability will occur in the near term as the periodic review and tariff reset process progresses with the Regulator in 2012. The primary factor in the ongoing discussions between Eletropaulo and the Regulator that causes the estimate to be sensitive to change is the regulatory asset base which will be used by the Regulator to determine the return included in the revised tariff. The final amount of the regulatory liability may differ from the estimated amount recognized as of December 31, 2011. |
| (9) | Payments received for costs expected to be incurred to improve the efficiency of our plants in Brazil that are refunded as part of the IRT. |
| (10) | Other Current and Noncurrent Regulatory Liabilities primarily consist of the cost incurred by electricity generators due to variance in energy prices during rationing periods (“Free Energy”). Our Brazilian subsidiaries are authorized to recover or refund this cost associated with monthly energy price variances between the wholesale energy market prices owed to the power generation plants producing Free Energy and the capped price reimbursed by the local distribution companies which are passed through to the final customers through energy tariffs. |
| (11) | Obligations for removal costs which do not have an associated legal retirement obligation as defined by the accounting standards on asset retirement obligations. |
| (12) | Obligations established by ANEEL in Brazil associated with electric utility concessions and represent amounts received from customers or donations not subject to return. These donations are allocated to support energy network expansion and to improve utility operations to meet customers’ needs. The term of the obligation is established by ANEEL. Settlement shall occur when the concession ends. |
101
The current regulatory assets and liabilities are recorded in “Other current assets” and “Accrued and other liabilities,” respectively, on the accompanying Consolidated Balance Sheets. The noncurrent regulatory assets and liabilities are recorded in “Other noncurrent assets” and “Other long-term liabilities,” respectively, in the accompanying Consolidated Balance Sheets.
The following table summarizes regulatory assets by region as of December 31, 2011 and 2010:
| | | | | | | | |
| | | December 31, | |
| | | 2011 | | | 2010 | |
| | | (in millions) | |
Latin America | | $ | 546 | | | $ | 265 | |
North America | | | 692 | | | | 417 | |
| | | | | | | | |
Total regulatory assets | | $ | 1,238 | | | $ | 682 | |
| | | | | | | | |
The following table summarizes regulatory liabilities by region as of December 31, 2011 and 2010:
| | | | | | | | |
| | | December 31, | |
| | | 2011 | | | 2010 | |
| | | (in millions) | |
Latin America | | $ | 1,333 | | | $ | 890 | |
North America | | | 679 | | | | 526 | |
| | | | | | | | |
Total regulatory liabilities | | $ | 2,012 | | | $ | 1,416 | |
| | | | | | | | |
11. DEBT
The Company has two types of debt reported on its Consolidated Balance Sheets: non-recourse and recourse debt. Non-recourse debt is used to fund investments and capital expenditures for the construction and acquisition of electric power plants, wind projects, distribution companies and other project-related investments at our subsidiaries. Non-recourse debt is generally secured by the capital stock, physical assets, contracts and cash flows of the related subsidiary. Absent guarantees, intercompany loans or other credit support, the default risk is limited to the respective business and is without recourse to the Parent Company and other subsidiaries, though the Company’s equity investments and/or subordinated loans to projects (if any) are at risk. Recourse debt is direct borrowings by the Parent Company and is used to fund development, construction or acquisitions, including serving as funding for equity investments or loans to the affiliates. The Parent Company’s debt is, among other things, recourse to the Parent Company and is structurally subordinated to the affiliates’ debt.
The following table summarizes the carrying amount and estimated fair values of the Company’s recourse and non-recourse debt as of December 31, 2011 and 2010:
| | | | | | | | | | | | | | | | |
| | | December 31, | |
| | | 2011 | | | 2010 | |
| | | Carrying
Amount | | | Fair
Value | | | Carrying
Amount | | | Fair
Value | |
| | | (in millions) | |
Non-recourse debt | | $ | 15,535 | | | $ | 15,862 | | | $ | 13,587 | | | $ | 13,857 | |
Recourse debt | | | 6,485 | | | | 6,640 | | | | 4,612 | | | | 4,868 | |
| | | | | | | | | | | | | | | | |
Total debt | | $ | 22,020 | | | $ | 22,502 | | | $ | 18,199 | | | $ | 18,725 | |
| | | | | | | | | | | | | | | | |
Recourse and non-recourse debt are carried at amortized cost. The fair value of recourse debt is estimated based on quoted market prices. The fair value of non-recourse debt is estimated differently based upon the type of loan. The fair value of fixed rate loans is estimated using quoted market prices, if available, or a discounted cash flow analysis. In the discounted cash flow analysis, the discount rate is based on the credit rating of the individual debt instruments, if available, or the credit rating of the subsidiary. If the subsidiary’s credit rating is not available, a synthetic credit rating is determined using certain key metrics, including cash flow ratios and interest coverage, as well as other industry specific factors. For subsidiaries located outside the U.S., in the event that the country rating is lower than the credit rating previously determined, the country rating is used for the purposes of the discounted cash flow analysis. The fair value of recourse and non-recourse debt excludes accrued interest at the valuation date.
102
The estimated fair value was determined using available market information as of December 31, 2011 and 2010. The Company is not aware of any factors that would significantly affect the estimated fair value amounts since December 31, 2011.
NON-RECOURSE DEBT
The following table summarizes the carrying amount and terms of non-recourse debt as of December 31, 2011 and 2010:
| | | | | | | | | | | | | | |
| | | | | | | | December 31, | |
NON-RECOURSE DEBT | | Interest
Rate(1) | | | Maturity | | 2011 | | | 2010 | |
| | | | | | | | (in millions) | |
VARIABLE RATE:(2) | | | | | | | | | | | | | | |
Bank loans | | | 2.95 | % | | 2012 - 2028 | | $ | 3,430 | | | $ | 3,052 | |
Notes and bonds | | | 11.70 | % | | 2012 - 2040 | | | 2,178 | | | | 2,982 | |
Debt to (or guaranteed by) multilateral, export credit agencies or development banks(3) | | | 3.30 | % | | 2012 - 2027 | | | 1,989 | | | | 1,848 | |
Other | | | 3.83 | % | | 2012 - 2041 | | | 321 | | | | 363 | |
FIXED RATE: | | | | | | | | | | | | | | |
Bank loans | | | 8.24 | % | | 2012 - 2023 | | | 412 | | | | 424 | |
Notes and bonds | | | 6.37 | % | | 2012 - 2061 | | | 6,487 | | | | 4,269 | |
Debt to (or guaranteed by) multilateral, export credit agencies or development banks(3) | | | 6.57 | % | | 2012 - 2027 | | | 513 | | | | 467 | |
Other | | | 11.66 | % | | 2012 - 2039 | | | 205 | | | | 182 | |
| | | | | | | | | | | | | | |
SUBTOTAL | | | | | | | | $ | 15,535 | (4) | | $ | 13,587 | (4) |
Less: Current maturities | | | | | | | | | (2,123 | ) | | | (2,503 | ) |
| | | | | | | | | | | | | | |
TOTAL | | | | | | | | $ | 13,412 | | | $ | 11,084 | |
| | | | | | | | | | | | | | |
| (1) | Weighted average interest rate at December 31, 2011. |
| (2) | The Company has interest rate swaps and interest rate option agreements in an aggregate notional principal amount of approximately $3.8 billion on non-recourse debt outstanding at December 31, 2011. The swap agreements economically change the variable interest rates on the portion of the debt covered by the notional amounts to fixed rates ranging from approximately 1.44% to 6.98%. The option agreements fix interest rates within a range from 1.00% to 7.00%. The agreements expire at various dates from 2016 through 2028. |
| (3) | Multilateral loans include loans funded and guaranteed by bilaterals, multilaterals, development banks and other similar institutions. |
| (4) | Non-recourse debt of $1.3 billion and $1.5 billion as of December 31, 2011 and 2010, respectively, was excluded from non-recourse debt and included in current and noncurrent liabilities of held for sale and discontinued businesses in the accompanying Consolidated Balance Sheets. |
Non-recourse debt as of December 31, 2011 is scheduled to reach maturity as set forth in the table below:
| | | | |
December 31, | | Annual
Maturities | |
| | | (in millions) | |
2012 | | $ | 2,123 | |
2013 | | | 1,358 | |
2014 | | | 1,661 | |
2015 | | | 812 | |
2016 | | | 2,260 | |
Thereafter | | | 7,321 | |
| | | | |
Total non-recourse debt | | $ | 15,535 | |
| | | | |
103
As of December 31, 2011, AES subsidiaries with facilities under construction had a total of approximately $1.4 billion of committed but unused credit facilities available to fund construction and other related costs. Excluding these facilities under construction, AES subsidiaries had approximately $1.2 billion in a number of available but unused committed revolving credit lines to support their working capital, debt service reserves and other business needs. These credit lines can be used in one or more of the following ways: solely for borrowings; solely for letters of credit; or a combination of these uses. The weighted average interest rate on borrowings from these facilities was 14.75% at December 31, 2011.
On October 3, 2011, Dolphin Subsidiary II, Inc. (“Dolphin II”), a newly formed, wholly-owned special purpose indirect subsidiary of AES, entered into an indenture (the “Indenture”) with Wells Fargo Bank, N.A. (the “Trustee”) as part of its issuance of $450 million aggregate principal amount of 6.50% senior notes due 2016 (the “2016 Notes”) and $800 million aggregate principal amount of 7.25% senior notes due 2021 (the “7.25% 2021 Notes”, together with the 2016 Notes, the “notes”) to finance the acquisition (the “Acquisition”) of DPL. Upon closing of the acquisition on November 28, 2011, Dolphin II was merged into DPL with DPL being the surviving entity and obligor. The 2016 Notes and the 7.25% 2021 Notes are included under “Notes and bonds” in the non-recourse detail table above. See Note 23—Acquisitions and Dispositions for further information.
Interest on the 2016 Notes and the 7.25% 2021 Notes accrues at a rate of 6.50% and 7.25% per year, respectively, and is payable on April 15 and October 15 of each year, beginning April 15, 2012. Prior to September 15, 2016 with respect to the 2016 Notes and July 15, 2021 with respect to the 7.25% 2021 Notes, DPL may redeem some or all of the 2016 Notes or 7.25% 2021 Notes at par, plus a “make-whole” amount set forth in the Indenture and accrued and unpaid interest. At any time on or after September 15, 2016 or July 15, 2021 with respect to the 2016 Notes and 7.25% 2021 Notes, respectively, DPL may redeem some or all of the 2016 Notes or 7.25% 2021 Notes at par plus accrued and unpaid interest. The proceeds from issuance of the notes were used to partially finance the DPL acquisition.
Non-Recourse Debt Covenants, Restrictions and Defaults
The terms of the Company’s non-recourse debt include certain financial and non-financial covenants. These covenants are limited to subsidiary activity and vary among the subsidiaries. These covenants may include but are not limited to maintenance of certain reserves, minimum levels of working capital and limitations on incurring additional indebtedness. Compliance with certain covenants may not be objectively determinable.
As of December 31, 2011 and 2010, approximately $594 million and $539 million, respectively, of restricted cash was maintained in accordance with certain covenants of the non-recourse debt agreements, and these amounts were included within “Restricted cash” and “Debt service reserves and other deposits” in the accompanying Consolidated Balance Sheets.
Various lender and governmental provisions restrict the ability of certain of the Company’s subsidiaries to transfer their net assets to the Parent Company. Such restricted net assets of subsidiaries amounted to approximately $3.3 billion at December 31, 2011.
The following table summarizes the Company’s subsidiary non-recourse debt in default or accelerated as of December 31, 2011 and is included in the current portion of non-recourse debt unless otherwise indicated:
| | | | | | | | | | | | |
| | | Primary Nature | | | December 31, 2011 | |
Subsidiary | | of Default | | | Default | | | Net Assets | |
| | | | | | (in millions) | |
Maritza | | | Covenant | | | $ | 905 | | | $ | 204 | |
Sonel | | | Covenant | | | | 331 | | | | 305 | |
Kelanitissa | | | Covenant | | | | 16 | | | | 48 | |
| | | | | | | | | | | | |
Total | | | | | | $ | 1,252 | | | | | |
| | | | | | | | | | | | |
None of the subsidiaries that are currently in default are subsidiaries that met the applicable definition of materiality under AES’ corporate debt agreements as of December 31, 2011 in order for such defaults to trigger an event of default or permit acceleration under such indebtedness. The bankruptcy or acceleration of material amounts of debt at such entities would cause a cross default under the recourse senior secured credit facility. However, as a
104
result of additional dispositions of assets, other significant reductions in asset carrying values or other matters in the future that may impact our financial position and results of operations or the financial position or results of the individual subsidiary, it is possible that one or more of these subsidiaries could fall within the definition of a “material subsidiary” and thereby upon a bankruptcy or acceleration of its non-recourse debt, trigger an event of default and possible acceleration of the indebtedness under the AES Parent Company’s outstanding debt securities.
RECOURSE DEBT
The following table summarizes the carrying amount and terms of recourse debt of the Company as of December 31, 2011 and 2010:
| | | | | | | | | | | | | | |
| | | | | Final | | | December 31, | |
RECOURSE DEBT | | Interest Rate | | Maturity | | | 2011 | | | 2010 | |
| | | | | | | | (in millions) | |
Senior Secured Term Loan | | LIBOR + 1.75% | | | 2011 | | | $ | — | | | $ | 200 | |
Senior Unsecured Note | | 8.875% | | | 2011 | | | | — | | | | 129 | |
Senior Unsecured Note | | 8.375% | | | 2011 | | | | — | | | | 134 | |
Senior Unsecured Note | | 7.75% | | | 2014 | | | | 500 | | | | 500 | |
Revolving Loan under Senior Secured Credit Facility(1) | | LIBOR + 3.00% | | | 2015 | | | | 295 | | | | — | |
Senior Unsecured Note | | 7.75% | | | 2015 | | | | 500 | | | | 500 | |
Senior Unsecured Note | | 9.75% | | | 2016 | | | | 535 | | | | 535 | |
Senior Unsecured Note | | 8.00% | | | 2017 | | | | 1,500 | | | | 1,500 | |
Senior Secured Term Loan | | LIBOR + 3.25% | | | 2018 | | | | 1,042 | | | | — | |
Senior Unsecured Note | | 8.00% | | | 2020 | | | | 625 | | | | 625 | |
Senior Unsecured Note | | 7.375% | | | 2021 | | | | 1,000 | | | | — | |
Term Convertible Trust Securities | | 6.75% | | | 2029 | | | | 517 | | | | 517 | |
Unamortized discounts | | | | | | | | | (29 | ) | | | (28 | ) |
| | | | | | | | | | | | | | |
SUBTOTAL | | | | | | | | $ | 6,485 | | | $ | 4,612 | |
Less: Current maturities | | | | | | | | | (305 | ) | | | (463 | ) |
| | | | | | | | | | | | | | |
Total | | | | | | | | $ | 6,180 | | | $ | 4,149 | |
| | | | | | | | | | | | | | |
| (1) | Subsequent to year end the loan was substantially repaid and is expected to be repaid in full prior to March 31, 2012. |
Recourse debt as of December 31, 2011 is scheduled to reach maturity as set forth in the table below:
| | | | |
December 31, | | Annual
Maturities | |
| | | (in millions) | |
2012 | | $ | 305 | |
2013 | | | 11 | |
2014 | | | 509 | |
2015 | | | 511 | |
2016 | | | 523 | |
Thereafter | | | 4,626 | |
| | | | |
Total recourse debt | | $ | 6,485 | |
| | | | |
Recourse Debt Transactions
During the year ended December 31, 2011, the Company issued recourse debt of $2.05 billion as outlined below. The proceeds of the debt were used to partially finance the Company’s acquisition of DPL as discussed further in Note 23—Acquisitions and Dispositions.
On May 27, 2011, the Company secured a $1.05 billion term loan under a senior secured credit facility (the “senior secured term loan”). The senior secured term loan bears annual interest, at the Company’s option, at a variable rate of LIBOR plus 3.25% or Base Rate plus 2.25%, and matures in 2018. The senior secured term loan is subject to certain customary representations, covenants and events of default.
105
On June 15, 2011, the Company issued $1 billion aggregate principal amount of 7.375% senior unsecured notes maturing July 1, 2021 (the “7.375% 2021 Notes”). Upon a change of control, the Company must offer to repurchase the 7.375% 2021 Notes at a price equal to 101% of principal, plus accrued and unpaid interest. The 7.375% 2021 Notes are also subject to certain covenants restricting the ability of the Company to incur additional secured debt; to enter into sale-lease back transactions; to consolidate, merge, convey or transfer substantially all of its assets; as well as other covenants and events of default that are customary for debt securities similar to the 7.375% 2021 Notes. The Company entered into interest rate locks in May 2011 to hedge the risk of changes in LIBOR until the issuance of the 7.375% 2021 Notes. The Company paid $24 million to settle those interest rate locks as of June 15, 2011. The payment was recognized in accumulated other comprehensive loss and is being amortized over the life of the 7.375% 2021 Notes as an adjustment to interest expense using the effective yield method.
Recourse Debt Covenants and Guarantees
Certain of the Company’s obligations under the senior secured credit facility are guaranteed by its direct subsidiaries through which the Company owns its interests in the AES Shady Point, AES Hawaii, AES Warrior Run and AES Eastern Energy businesses. On December 30, 2011, AES Eastern Energy filed for bankruptcy and was deconsolidated. See Note 1—General and Summary of Significant Accounting Policies for additional information. The Company’s obligations under the senior secured credit facility are, subject to certain exceptions, secured by:
| | (i) | all of the capital stock of domestic subsidiaries owned directly by the Company and 65% of the capital stock of certain foreign subsidiaries owned directly or indirectly by the Company; and |
| | (ii) | certain intercompany receivables, certain intercompany notes and certain intercompany tax sharing agreements. |
The senior secured credit facility is subject to mandatory prepayment under certain circumstances, including the sale of a guarantor subsidiary. In such a situation, the net cash proceeds from the sale of a Guarantor or any of its subsidiaries must be applied pro rata to repay the term loan using 60% of net cash proceeds, reduced to 50% when and if the parent’s recourse debt to cash flow ratio is less than 5:1. The lenders have the option to waive their pro rata redemption.
The senior secured credit facility contains customary covenants and restrictions on the Company’s ability to engage in certain activities, including, but not limited to, limitations on other indebtedness, liens, investments and guarantees; limitations on restricted payments such as shareholder dividends and equity repurchases; restrictions on mergers and acquisitions, sales of assets, leases, transactions with affiliates and off-balance sheet or derivative arrangements; and other financial reporting requirements.
The senior secured credit facility also contains financial covenants requiring the Company to maintain certain financial ratios including a cash flow to interest coverage ratio, calculated quarterly, which provides that a minimum ratio of the Company’s adjusted operating cash flow to the Company’s interest charges related to recourse debt of 1.3× must be maintained at all times and a recourse debt to cash flow ratio, calculated quarterly, which provides that the ratio of the Company’s total recourse debt to the Company’s adjusted operating cash flow must not exceed a maximum at any time of 7.5× at December 31, 2011.
The terms of the Company’s senior unsecured notes and senior secured credit facility contain certain covenants including, without limitation, limitation on the Company’s ability to incur liens or enter into sale and leaseback transactions.
TERM CONVERTIBLE TRUST SECURITIES
Between 1999 and 2000, AES Trust III, a wholly owned special purpose business trust, issued approximately 10.35 million of $3.375 Term Convertible Preferred Securities (“TECONS”) (liquidation value $50) for total proceeds of $517 million and concurrently purchased $517 million of 6.75% Junior Subordinated Convertible Debentures due 2029 (the “6.75% Debentures” of the Company). The TECONS are consolidated and classified as long-term recourse debt on the Company’s Consolidated Balance Sheet.
AES, at its option, can redeem the 6.75% Debentures which would result in the required redemption of the TECONS issued by AES Trust III, currently for $50 per TECON. The TECONS must be redeemed upon maturity of the 6.75% Debentures. The TECONS are convertible into the common stock of AES at each holder’s option prior to
106
October 15, 2029 at the rate of 1.4216, representing a conversion price of $35.17 per share. The maximum number of shares of common stock AES would be required to issue should all holders decide to convert their securities would be 14.7 million shares.
Dividends on the TECONS are payable quarterly at an annual rate of 6.75%. The Trust is permitted to defer payment of dividends for up to 20 consecutive quarters, provided that the Company has exercised its right to defer interest payments under the corresponding debentures or notes. During such deferral periods, dividends on the TECONS would accumulate quarterly and accrue interest, and the Company may not declare or pay dividends on its common stock. AES has not exercised the option to defer any dividends at this time and all dividends due under the Trust have been paid.
AES Trust III is a VIE under the relevant consolidation accounting guidance. AES’ obligations under the 6.75% Debentures and other relevant trust agreements, in aggregate, constitute a full and unconditional guarantee by AES of the TECON Trusts’ obligations. Accordingly, AES consolidates AES Trust III. As of December 31, 2011 and 2010, the sole assets of AES Trust III are the 6.75% Debentures.
107
12. COMMITMENTS
The following disclosures exclude any businesses classified as discontinued operations or held-for-sale.
OPERATING LEASES—As of December 31, 2011, the Company was obligated under long-term non-cancelable operating leases, primarily for certain transmission lines, office rental and site leases. Rental expense for lease commitments under these operating leases for the years ended December 31, 2011, 2010 and 2009 was $63 million, $56 million and $60 million, respectively.
The table below sets forth the future minimum lease commitments under these operating leases as of December 31, 2011 for 2012 through 2016 and thereafter:
| | | | |
December 31, | | Future
Commitments
for Operating
Leases | |
| | | (in millions) | |
2012 | | $ | 57 | |
2013 | | | 57 | |
2014 | | | 55 | |
2015 | | | 54 | |
2016 | | | 54 | |
Thereafter | | | 730 | |
| | | | |
Total | | $ | 1,007 | |
| | | | |
CAPITAL LEASES—Several AES subsidiaries lease operating and office equipment and vehicles that are considered capital lease transactions. These capital leases are recognized in Property, Plant and Equipment within “Electric generation and distribution assets” and primarily relate to transmission lines at our subsidiaries in Brazil. The gross value of the leased assets as of December 31, 2011 and 2010 was $95 million and $97 million, respectively.
The following table summarizes the future minimum lease payments under capital leases together with the present value of the net minimum lease payments as of December 31, 2011 for 2012 through 2016 and thereafter:
| | | | |
December 31, | | Future Minimum
Lease Payments | |
| | | (in millions) | |
2012 | | $ | 14 | |
2013 | | | 11 | |
2014 | | | 10 | |
2015 | | | 9 | |
2016 | | | 9 | |
Thereafter | | | 125 | |
| | | | |
Total | | $ | 178 | |
Less: Imputed interest | | | 106 | |
| | | | |
Present value of total minimum lease payments | | $ | 72 | |
| | | | |
CONTRACTS—Operating subsidiaries of the Company have entered into contracts for the purchase of electricity from third parties that primarily include energy auction agreements at our Brazil subsidiaries with extended terms from 2012 through 2028 and in some cases are subject to variable quantities or prices. Purchases in the years ended December 31, 2011, 2010 and 2009 were approximately $2.5 billion, $2.4 billion and $2.1 billion, respectively.
108
The table below sets forth the future minimum commitments under these electricity purchase contracts at December 31, 2011 for 2012 through 2016 and thereafter:
| | | | |
December 31, | | Future
Commitments
for Electricity
Purchase
Contracts | |
| | | (in millions) | |
2012 | | $ | 2,800 | |
2013 | | | 2,412 | |
2014 | | | 2,034 | |
2015 | | | 1,995 | |
2016 | | | 1,979 | |
Thereafter | | | 23,887 | |
| | | | |
Total | | $ | 35,107 | |
| | | | |
Operating subsidiaries of the Company have entered into various long-term contracts for the purchase of fuel subject to termination only in certain limited circumstances and in some cases are subject to variable quantities or prices. Purchases in the years ended December 31, 2011, 2010 and 2009 were $1.7 billion, $1.7 billion and $1.2 billion, respectively.
The table below sets forth the future minimum commitments under these fuel contracts as of December 31, 2011 for 2012 through 2016 and thereafter:
| | | | |
December 31, | | Future
Commitments
for Fuel
Contracts | |
| | | (in millions) | |
2012 | | $ | 1,980 | |
2013 | | | 1,187 | |
2014 | | | 790 | |
2015 | | | 663 | |
2016 | | | 661 | |
Thereafter | | | 4,875 | |
| | | | |
Total | | $ | 10,156 | |
| | | | |
The Company’s subsidiaries have entered into other various long-term contracts. These contracts are mainly for construction projects, service and maintenance, transmission of electricity and other operation services. Payments under these contracts for the years ended December 31, 2011, 2010 and 2009 were $1.7 billion, $1.6 billion and $2.7 billion, respectively.
The table below sets forth the future minimum commitments under these other purchase contracts as of December 31, 2011 for 2012 through 2016 and thereafter:
| | | | |
December 31, | | Future
Commitments
for Other
Purchase
Contracts | |
| | | (in millions) | |
2012 | | $ | 1,831 | |
2013 | | | 1,454 | |
2014 | | | 1,209 | |
2015 | | | 968 | |
2016 | | | 883 | |
Thereafter | | | 9,496 | |
| | | | |
Total | | $ | 15,841 | |
| | | | |
109
13. CONTINGENCIES
ENVIRONMENTAL LIABILITIES
The Company periodically reviews its obligations as they relate to compliance with environmental laws, including site restoration and remediation. As of December 31, 2011, the Company had recorded liabilities of $26 million for projected environmental remediation costs. Due to the uncertainties associated with environmental assessment and remediation activities, future costs of compliance or remediation could be higher or lower than the amount currently accrued. Based on currently available information and analysis, the Company believes that it is reasonably possible that costs associated with such liabilities, or as yet unknown liabilities, may exceed current reserves in amounts that could be material but cannot be estimated as of December 31, 2011.
GUARANTEES, LETTERS OF CREDIT
In connection with certain project financing, acquisition, power purchase, and other agreements, AES has expressly undertaken limited obligations and commitments, most of which will only be effective or will be terminated upon the occurrence of future events. In the normal course of business, AES has entered into various agreements, mainly guarantees and letters of credit, to provide financial or performance assurance to third parties on behalf of AES businesses. These agreements are entered into primarily to support or enhance the creditworthiness otherwise achieved by a business on a stand-alone basis, thereby facilitating the availability of sufficient credit to accomplish their intended business purposes. Most of the contingent obligations primarily relate to future performance commitments which the Company or its businesses expect to fulfill within the normal course of business. The expiration dates of these guarantees vary from less than one year to more than 15 years.
The following table summarizes the Parent Company’s contingent contractual obligations as of December 31, 2011. Amounts presented in the table below represent the Parent Company’s current undiscounted exposure to guarantees and the range of maximum undiscounted potential exposure. The maximum exposure is not reduced by the amounts, if any, that could be recovered under the recourse or collateralization provisions in the guarantees. The amounts include obligations made by the Parent Company for the direct benefit of the lenders associated with the non-recourse debt of businesses of $24 million.
| | | | | | | | | | |
Contingent contractual obligations | | Amount | | | Number of
Agreements | | | Maximum Exposure Range for
Each Agreement |
| | | (in millions) | | | | | | (in millions) |
Guarantees(1) | | $ | 340 | | | | 20 | | | <$1 - $53 |
Letters of credit under the senior secured credit facility | | | 12 | | | | 11 | | | <$1 - $7 |
Cash collateralized letters of credit | | | 261 | | | | 13 | | | <$1 - $221 |
| | | | | | | | | | |
Total | | $ | 613 | | | | 44 | | | |
| | | | | | | | | | |
| (1) | Excludes guarantees of $11 million related to discontinued operations and held for sale businesses. |
As of December 31, 2011, the Company had $9 million of commitments to invest in subsidiaries under construction and to purchase related equipment that were not included in the letters of credit discussed above. The Company expects to fund these net investment commitments in 2012. The exact payment schedules will be dictated by the construction milestones. We expect to fund these commitments from a combination of current liquidity and internally generated Parent Company cash flow.
During 2011, the Company paid letter of credit fees ranging from 0.250% to 3.250% per annum on the outstanding amounts of letters of credit.
110
LITIGATION
The Company is involved in certain claims, suits and legal proceedings in the normal course of business. The Company accrues for litigation and claims when it is probable that a liability has been incurred and the amount of loss can be reasonably estimated. The Company has evaluated claims in accordance with the accounting guidance for contingencies that it deems both probable and reasonably estimable and accordingly, has recorded aggregate reserves for all claims of approximately $363 million and $443 million as of December 31, 2011 and 2010, respectively. These reserves are reported on the consolidated balance sheets within “accrued and other liabilities” and “other long-term liabilities.” A significant portion of the reserves relate to employment, non-income tax and customer disputes in international jurisdictions, principally Brazil. Certain of the Company’s subsidiaries, principally in Brazil, are defendants in a number of labor and employment lawsuits. The complaints generally seek unspecified monetary damages, injunctive relief, or other relief. The subsidiaries have denied any liability and intend to vigorously defend themselves in all of these proceedings. There can be no assurance that these reserves will be adequate to cover all existing and future claims or that we will have the liquidity to pay such claims as they arise.
The Company believes, based upon information it currently possesses and taking into account established reserves for liabilities and its insurance coverage, that the ultimate outcome of these proceedings and actions is unlikely to have a material effect on the Company’s consolidated financial statements. However, where no reserve has been recognized, it is reasonably possible that some matters could be decided unfavorably to the Company and could require the Company to pay damages or make expenditures in amounts that could be material but could not be estimated as of December 31, 2011. The material contingencies where a loss is reasonably possible primarily include: claims under financing agreements; disputes with offtakers, suppliers and EPC contractors; alleged violation of monopoly laws and regulations; income tax and non-income tax assessments by tax authorities; and environmental matters. In aggregate, the Company estimates that the range of potential losses, where estimable, related to these material contingences to be in the range of $355 million to $1.7 billion. The amounts considered reasonably possible do not include amounts reserved, as discussed above. These material contingencies do not include income tax related contingencies which are considered part of our uncertain tax positions.
14. BENEFIT PLANS
DEFINED CONTRIBUTION PLAN—The Company sponsors one defined contribution plan (“the Plan”), qualified under section 401 of the Internal Revenue Code. All U.S. employees of the Company are eligible to participate in the Plan except for those employees who are covered by a collective bargaining agreement, unless such agreement specifically provides that the employee is considered an eligible employee under the Plan. The Plan provides matching contributions in AES common stock, other contributions at the discretion of the Compensation Committee of the Board of Directors in AES common stock and discretionary tax deferred contributions from the participants. Participants are fully vested in their own contributions and the Company’s matching contributions. Participants vest in other company contributions ratably over a five-year period ending on the fifth anniversary of their hire date. Company contributions to the Plan were approximately $22 million for each of the years ended December 31, 2011, 2010, and 2009.
DEFINED BENEFIT PLANS—Certain of the Company’s subsidiaries have defined benefit pension plans covering substantially all of their respective employees. Pension benefits are based on years of credited service, age of the participant and average earnings. Of the 26 active defined benefit plans as of December 31, 2011, four are at U.S. subsidiaries and the remaining plans are at foreign subsidiaries.
111
The following table reconciles the Company’s funded status, both domestic and foreign, as of December 31, 2011 and 2010:
| | | | | | | | | | | | | | | | |
| | | December 31, | |
| | | 2011 | | | 2010 | |
| | | U.S. | | | Foreign | | | U.S. | | | Foreign | |
| | | (in millions) | |
CHANGE IN PROJECTED BENEFIT OBLIGATION: | | | | | | | | | | | | | | | | |
Benefit obligation at beginning of year | | $ | 608 | | | $ | 5,986 | | | $ | 549 | | | $ | 5,129 | |
Service cost | | | 8 | | | | 19 | | | | 7 | | | | 16 | |
Interest cost | | | 33 | | | | 564 | | | | 32 | | | | 510 | |
Employee contributions | | | — | | | | 5 | | | | — | | | | 5 | |
Plan amendments | | | — | | | | — | | | | 11 | | | | — | |
Plan curtailments | | | — | | | | 5 | | | | — | | | | — | |
Plan settlements | | | — | | | | — | | | | — | | | | (2 | ) |
Benefits paid | | | (30 | ) | | | (465 | ) | | | (30 | ) | | | (409 | ) |
Business combinations | | | 365 | | | | — | | | | — | | | | 14 | |
Actuarial loss | | | 60 | | | | 371 | | | | 39 | | | | 474 | |
Effect of foreign currency exchange rate change | | | — | | | | (696 | ) | | | — | | | | 249 | |
| | | | | | | | | | | | | | | | |
Benefit obligation as of December 31 | | $ | 1,044 | | | $ | 5,789 | | | $ | 608 | | | $ | 5,986 | |
| | | | | | | | | | | | | | | | |
| | | | |
CHANGE IN PLAN ASSETS: | | | | | | | | | | | | | | | | |
Fair value of plan assets at beginning of year | | $ | 413 | | | $ | 4,730 | | | $ | 368 | | | $ | 4,042 | |
Actual return on plan assets | | | 6 | | | | 486 | | | | 46 | | | | 742 | |
Employer contributions | | | 37 | | | | 175 | | | | 29 | | | | 156 | |
Employee contributions | | | — | | | | 5 | | | | — | | | | 5 | |
Plan settlements | | | — | | | | — | | | | — | | | | (2 | ) |
Benefits paid | | | (30 | ) | | | (465 | ) | | | (30 | ) | | | (409 | ) |
Business combinations | | | 336 | | | | — | | | | — | | | | — | |
Effect of foreign currency exchange rate change | | | — | | | | (531 | ) | | | — | | | | 196 | |
| | | | | | | | | | | | | | | | |
Fair value of plan assets as of December 31 | | $ | 762 | | | $ | 4,400 | | | $ | 413 | | | $ | 4,730 | |
| | | | | | | | | | | | | | | | |
| | | | |
RECONCILIATION OF FUNDED STATUS | | | | | | | | | | | | | | | | |
Funded status as of December 31 | | $ | (282 | ) | | $ | (1,389 | ) | | $ | (195 | ) | | $ | (1,256 | ) |
| | | | | | | | | | | | | | | | |
The following table summarizes the amounts recognized on the Consolidated Balance Sheets related to the funded status of the plans, both domestic and foreign, as of December 31, 2011 and 2010:
| | | | | | | | | | | | | | | | |
| | | December 31, | |
| | | 2011 | | | 2010 | |
| | | U.S. | | | Foreign | | | U.S. | | | Foreign | |
| | | (in millions) | |
AMOUNTS RECOGNIZED ON THE CONSOLIDATED BALANCE SHEETS | | | | | | | | | | | | | | | | |
Noncurrent assets | | $ | — | | | $ | 20 | | | $ | — | | | $ | 32 | |
Accrued benefit liability - current | | | (1 | ) | | | (4 | ) | | | — | | | | (4 | ) |
Accrued benefit liability - long-term | | | (281 | ) | | | (1,405 | ) | | | (195 | ) | | | (1,284 | ) |
| | | | | | | | | | | | | | | | |
Net amount recognized at end of year | | $ | (282 | ) | | $ | (1,389 | ) | | $ | (195 | ) | | $ | (1,256 | ) |
| | | | | | | | | | | | | | | | |
The following table summarizes the Company’s accumulated benefit obligation, both domestic and foreign, as of December 31, 2011 and 2010:
| | | | | | | | | | | | | | | | |
| | | December 31, | |
| | | 2011 | | | 2010 | |
| | | U.S. | | | Foreign | | | U.S. | | | Foreign | |
| | | (in millions) | |
Accumulated Benefit Obligation | | $ | 1,020 | | | $ | 5,724 | | | $ | 592 | | | $ | 5,927 | |
Information for pension plans with an accumulated benefit obligation in excess of plan assets: | | | | | | | | | | | | | | | | |
Projected benefit obligation | | $ | 1,044 | | | $ | 5,478 | | | $ | 608 | | | $ | 5,697 | |
Accumulated benefit obligation | | | 1,020 | | | | 5,423 | | | | 592 | | | | 5,651 | |
Fair value of plan assets | | | 762 | | | | 4,072 | | | | 413 | | | | 4,410 | |
Information for pension plans with a projected benefit obligation in excess of plan assets: | | | | | | | | | | | | | | | | |
Projected benefit obligation | | $ | 1,044 | | | $ | 5,492 | | | $ | 608 | | | $ | 5,704 | |
Fair value of plan assets | | | 762 | | | | 4,084 | | | | 413 | | | | 4,415 | |
112
The table below summarizes the significant weighted average assumptions used in the calculation of benefit obligation and net periodic benefit cost, both domestic and foreign, as of December 31, 2011 and 2010:
| | | | | | | | | | | | | | | | |
| | | December 31, | |
| | | 2011 | | | 2010 | |
| | | U.S. | | | Foreign | | | U.S. | | | Foreign | |
Benefit Obligation: | | | | | | | | | | | | | | | | |
Discount rates | | | 4.67 | % | | | 9.52 | %(2) | | | 5.38 | % | | | 9.82 | %(2) |
Rates of compensation increase | | | 3.94 | %(1) | | | 5.98 | % | | | N/A | (1) | | | 5.99 | % |
Periodic Benefit Cost: | | | | | | | | | | | | | | | | |
Discount rate | | | 5.38 | % | | | 9.82 | % | | | 5.92 | % | | | 10.56 | % |
Expected long-term rate of return on plan assets | | | 7.49 | % | | | 11.08 | % | | | 8.00 | % | | | 11.14 | % |
Rate of compensation increase | | | 3.94 | %(1) | | | 5.98 | % | | | N/A | (1) | | | 5.99 | % |
| (1) | A U.S. subsidiary of the Company has a defined benefit obligation of $679 million and $607 million as of December 31, 2011 and 2010, respectively, and uses salary bands to determine future benefit costs rather than rates of compensation increases. Rates of compensation increases in the table above do not include amounts related to this specific defined benefit plan. |
| (2) | Includes an inflation factor that is used to calculate future periodic benefit cost, but is not used to calculate the benefit obligation. |
The Company establishes its estimated long-term return on plan assets considering various factors, which include the targeted asset allocation percentages, historic returns and expected future returns.
The measurement of pension obligations, costs and liabilities is dependent on a variety of assumptions. These assumptions include estimates of the present value of projected future pension payments to all plan participants, taking into consideration the likelihood of potential future events such as salary increases and demographic experience. These assumptions may have an effect on the amount and timing of future contributions.
The assumptions used in developing the required estimates include the following key factors:
| | • | | expected return on plan assets; and |
The effects of actual results differing from the Company’s assumptions are accumulated and amortized over future periods and, therefore, generally affect the Company’s recognized expense in such future periods.
Sensitivity of the Company’s pension funded status to the indicated increase or decrease in the discount rate and long-term rate of return on plan assets assumptions is shown below. Note that these sensitivities may be asymmetric and are specific to the base conditions at year-end 2011. They also may not be additive, so the impact of changing multiple factors simultaneously cannot be calculated by combining the individual sensitivities shown. The December 31, 2011 funded status is affected by the December 31, 2011 assumptions. Pension expense for 2011 is affected by the December 31, 2010 assumptions. The impact on pension expense from a one percentage point change in these assumptions is shown in the table below (in millions):
| | | | |
Increase of 1% in the discount rate | | $ | (40 | ) |
Decrease of 1% in the discount rate | | $ | 42 | |
Increase of 1% in the long-term rate of return on plan assets | | $ | (51 | ) |
Decrease of 1% in the long-term rate of return on plan assets | | $ | 51 | |
113
The following table summarizes the components of the net periodic benefit cost, both domestic and foreign, for the years ended December 31, 2011 through 2009:
| | | | | | | | | | | | | | | | | | | | | | | | |
| | | December 31, | |
Components of Net Periodic Benefit Cost: | | 2011 | | | 2010 | | | 2009 | |
| | U.S. | | | Foreign | | | U.S. | | | Foreign | | | U.S. | | | Foreign | |
| | | (in millions) | |
Service cost | | $ | 8 | | | $ | 19 | | | $ | 7 | | | $ | 16 | | | $ | 6 | | | $ | 12 | |
Interest cost | | | 33 | | | | 564 | | | | 32 | | | | 510 | | | | 32 | | | | 458 | |
Expected return on plan assets | | | (33 | ) | | | (508 | ) | | | (30 | ) | | | (427 | ) | | | (24 | ) | | | (373 | ) |
Amortization of initial net asset | | | — | | | | — | | | | — | | | | (1 | ) | | | — | | | | (2 | ) |
Amortization of prior service cost | | | 4 | | | | — | | | | 3 | | | | — | | | | 4 | | | | — | |
Amortization of net loss | | | 13 | | | | 23 | | | | 12 | | | | 38 | | | | 16 | | | | 6 | |
Loss on curtailment | | | — | | | | 5 | | | | — | | | | — | | | | — | | | | — | |
Settlement gain recognized | | | — | | | | — | | | | — | | | | 1 | | | | — | | | | — | |
| | | | | | | | | | | | | | | | | | | | | | | | |
Total pension cost | | $ | 25 | | | $ | 103 | | | $ | 24 | | | $ | 137 | | | $ | 34 | | | $ | 101 | |
| | | | | | | | | | | | | | | | | | | | | | | | |
The following table summarizes the amounts reflected in Accumulated Other Comprehensive Loss on the Consolidated Balance Sheet as of December 31, 2011 that have not yet been recognized as components of net periodic benefit cost:
| | | | | | | | | | | | | | | | |
| | | December 31, 2011 | |
| | | Accumulated Other
Comprehensive Loss | | | Amounts expected to be
reclassified to earnings in next
fiscal year | |
| | | U.S. | | | Foreign | | | U.S. | | | Foreign | |
| | | (in millions) | |
Prior service cost | | $ | — | | | $ | (2 | ) | | $ | — | | | $ | — | |
Unrecognized net actuarial loss | | | — | | | | (1,112 | ) | | | — | | | | (40 | ) |
| | | | | | | | | | | | | | | | |
Total | | $ | — | | | $ | (1,114 | ) | | $ | — | | | $ | (40 | ) |
| | | | | | | | | | | | | | | | |
The following table summarizes the Company’s target allocation for 2011 and pension plan asset allocation, both domestic and foreign, as of December 31, 2011 and 2010:
| | | | | | | | | | | | | | | | | | | | | | |
| | | | | | | | Percentage of Plan Assets as of December 31, | |
| | | Target Allocations | | 2011 | | | 2010 | |
Asset Category | | U.S. | | | Foreign | | U.S. | | | Foreign | | | U.S. | | | Foreign | |
| | | | | | |
Equity securities | | | 46 | % | | 15% - 30% | | | 42.07 | % | | | 23.48 | % | | | 53.51 | % | | | 22.43 | % |
Debt securities | | | 39 | % | | 59% - 85% | | | 38.53 | % | | | 72.55 | % | | | 25.91 | % | | | 73.64 | % |
Real estate | | | 0 | % | | 0% - 4% | | | 0.00 | % | | | 2.34 | % | | | 0.00 | % | | | 2.09 | % |
Other | | | 15 | % | | 0% - 6% | | | 19.40 | % | | | 1.63 | % | | | 20.58 | % | | | 1.84 | % |
| | | | | | | | | | | | | | | | | | | | | | |
Total pension assets | | | | | | | | | 100.00 | % | | | 100.00 | % | | | 100.00 | % | | | 100.00 | % |
| | | | | | | | | | | | | | | | | | | �� | | | |
The U.S. plans seek to achieve the following long-term investment objectives:
| | • | maintenance of sufficient income and liquidity to pay retirement benefits and other lump sum payments; |
| | • | long-term rate of return in excess of the annualized inflation rate; |
| | • | long-term rate of return, net of relevant fees, that meet or exceed the assumed actuarial rate; and |
| | • | long-term competitive rate of return on investments, net of expenses, that is equal to or exceeds various benchmark rates. |
The asset allocation is reviewed periodically to determine a suitable asset allocation which seeks to manage risk through portfolio diversification and takes into account, among other possible factors, the above-stated
114
objectives, in conjunction with current funding levels, cash flow conditions and economic and industry trends. The following table summarizes the Company’s U.S. plan assets by category of investment and level within the fair value hierarchy as of December 31, 2011 and 2010:
| | | | | | | | | | | | | | | | | | | | | | | | | | | | | | | | |
| | | December 31, 2011 | | | December 31, 2010 | |
U.S. Plans | | Level 1 | | | Level 2 | | | Level 3 | | | Total | | | Level 1 | | | Level 2 | | | Level 3 | | | Total | |
| | | (in millions) | |
Equity securities: | | | | | | | | | | | | | | | | | | | | | | | | | | | | | | | | |
Common stock | | $ | 120 | | | $ | — | | | $ | — | | | $ | 120 | | | $ | 146 | | | $ | — | | | $ | — | | | $ | 146 | |
Mutual funds | | | 140 | | | | — | | | | — | | | | 140 | | | | 39 | | | | — | | | | — | | | | 39 | |
Debt securities: | | | | | | | | | | | | | | | | | | | | | | | | | | | | | | | | |
Government debt securities | | | 31 | | | | — | | | | — | | | | 31 | | | | 32 | | | | — | | | | — | | | | 32 | |
Corporate debt securities | | | 114 | | | | — | | | | — | | | | 114 | | | | 62 | | | | — | | | | — | | | | 62 | |
Mutual funds(1) | | | 135 | | | | — | | | | — | | | | 135 | | | | 2 | | | | — | | | | — | | | | 2 | |
Other debt securities | | | 14 | | | | — | | | | — | | | | 14 | | | | 11 | | | | — | | | | — | | | | 11 | |
Other: | | | | | | | | | | | | | | | | | | | | | | | | | | | | | | | | |
Cash and cash equivalents | | | 43 | | | | — | | | | — | | | | 43 | | | | 69 | | | | — | | | | — | | | | 69 | |
Other investments | | | 72 | | | | 93 | | | | — | | | | 165 | | | | — | | | | 52 | | | | — | | | | 52 | |
| | | | | | | | | | | | | | | | | | | | | | | | | | | | | | | | |
Total plan assets | | $ | 669 | | | $ | 93 | | | $ | — | | | $ | 762 | | | $ | 361 | | | $ | 52 | | | $ | — | | | $ | 413 | |
| | | | | | | | | | | | | | | | | | | | | | | | | | | | | | | | |
| (1) | Mutual funds categorized as debt securities consist of mutual funds for which debt securities are the primary underlying investment. |
The investment strategy of the foreign plans seeks to maximize return on investment while minimizing risk. The assumed asset allocation has less exposure to equities in order to closely match market conditions and near term forecasts. The following table summarizes the Company’s foreign plan assets by category of investment and level within the fair value hierarchy as of December 31, 2011 and 2010:
| | | | | | | | | | | | | | | | | | | | | | | | | | | | | | | | |
| | | December 31, 2011 | | | December 31, 2010 | |
Foreign Plans | | Level 1 | | | Level 2 | | | Level 3 | | | Total | | | Level 1 | | | Level 2 | | | Level 3 | | | Total | |
| | | (in millions) | |
Equity securities: | | | | | | | | | | | | | | | | | | | | | | | | | | | | | | | | |
Common stock | | $ | 26 | | | $ | — | | | $ | — | | | $ | 26 | | | $ | 30 | | | $ | — | | | $ | — | | | $ | 30 | |
Mutual funds | | | 427 | | | | — | | | | — | | | | 427 | | | | 510 | | | | — | | | | — | | | | 510 | |
Private equity(1) | | | — | | | | — | | | | 580 | | | | 580 | | | | — | | | | — | | | | 521 | | | | 521 | |
Debt securities: | | | | | | | | | | | | | | | | | | | | | | | | | | | | | | | | |
Certificates of deposit | | | — | | | | 5 | | | | — | | | | 5 | | | | — | | | | 4 | | | | — | | | | 4 | |
Unsecured debentures | | | — | | | | 20 | | | | — | | | | 20 | | | | — | | | | 19 | | | | — | | | | 19 | |
Government debt securities | | | 6 | | | | 221 | | | | — | | | | 227 | | | | — | | | | 233 | | | | — | | | | 233 | |
Mutual funds(2) | | | 125 | | | | 2,805 | | | | — | | | | 2,930 | | | | 108 | | | | 3,107 | | | | — | | | | 3,215 | |
Other debt securities | | | — | | | | 10 | | | | — | | | | 10 | | | | — | | | | 12 | | | | — | | | | 12 | |
Real estate: | | | | | | | | | | | | | | | | | | | | | | | | | | | | | | | | |
Real estate(1) | | | — | | | | — | | | | 103 | | | | 103 | | | | — | | | | — | | | | 99 | | | | 99 | |
Other: | | | | | | | | | | | | | | | | | | | | | | | | | | | | | | | | |
Cash and cash equivalents | | | — | | | | — | | | | — | | | | — | | | | — | | | | 4 | | | | — | | | | 4 | |
Participant loans(3) | | | — | | | | — | | | | 72 | | | | 72 | | | | — | | | | — | | | | 83 | | | | 83 | |
| | | | | | | | | | | | | | | | | | | | | | | | | | | | | | | | |
Total plan assets | | $ | 584 | | | $ | 3,061 | | | $ | 755 | | | $ | 4,400 | | | $ | 648 | | | $ | 3,379 | | | $ | 703 | | | $ | 4,730 | |
| | | | | | | | | | | | | | | | | | | | | | | | | | | | | | | | |
| (1) | Plan assets of our Brazilian subsidiaries are invested in private equities and commercial real estate through the plan administrator in Brazil. The fair value of these assets is determined using the income approach through annual appraisals based on a discounted cash flow analysis. |
| (2) | Mutual funds categorized as debt securities consist of mutual funds for which debt securities are the primary underlying investment. |
| (3) | Loans to participants are stated at cost, which approximates fair value. |
115
The following table presents a reconciliation of all plan assets measured at fair value using significant unobservable inputs (Level 3) for the years ended December 31, 2011 and 2010:
| | | | | | | | |
| | | Year Ended December 31, | |
| | | 2011 | | | 2010 | |
| | | (in millions) | |
Balance at January 1 | | $ | 703 | | | $ | 564 | |
Actual return on plan assets: | | | | | | | | |
Returns relating to assets still held at reporting date | | | 167 | | | | 104 | |
Returns relating to assets sold during the period | | | 28 | | | | — | |
Purchases, sales and settlements, net | | | (48 | ) | | | 3 | |
Change due to exchange rate changes | | | (95 | ) | | | 32 | |
| | | | | | | | |
Balance at December 31 | | $ | 755 | | | $ | 703 | |
| | | | | | | | |
The following table summarizes the scheduled cash flows for U.S. and foreign expected employer contributions and expected future benefit payments, both domestic and foreign:
| | | | | | | | |
| | | U.S. | | | Foreign | |
| | | (in millions) | |
Expected employer contribution in 2012 | | $ | 49 | | | $ | 174 | |
Expected benefit payments for fiscal year ending: | | | | | | | | |
2012 | | | 55 | | | | 421 | |
2013 | | | 56 | | | | 435 | |
2014 | | | 58 | | | | 451 | |
2015 | | | 59 | | | | 465 | |
2016 | | | 61 | | | | 483 | |
2017 - 2021 | | | 325 | | | | 2,657 | |
15. EQUITY
STOCK PURCHASE AGREEMENT
On March 12, 2010, the Company and Terrific Investment Corporation (“Investor”), a wholly owned subsidiary of China Investment Corporation, entered into a stockholder agreement (the “Stockholder Agreement”) in connection with the agreement discussed in the following paragraph. Under the Stockholder Agreement, as long as Investor holds more than 5% of the outstanding shares of common stock of the Company, Investor has the right to designate one nominee, who must be reasonably acceptable to the Board, for election to the Board of Directors of the Company. Effective December 9, 2011, Investor’s designated nominee was elected to the Board of Directors of the Company. In addition, until such time as Investor holds 5% or less of the outstanding shares of common stock, Investor has agreed to vote its shares in accordance with the recommendation of the Company on any matters submitted to a vote of the stockholders of the Company relating to the election of directors and compensation matters. Otherwise, Investor may vote its shares at its discretion. Further, under the Stockholder Agreement, Investor will be subject to a standstill restriction which generally prohibits Investor from purchasing additional securities of the Company beyond the level acquired by it under the stock purchase agreement entered into between Investor and the Company on November 6, 2009. The standstill and lock-up restrictions also terminate at such time as Investor holds 5% or less of the outstanding shares of common stock. Investor has certain registration rights and preemptive rights under the Stockholder Agreement with respect to its shares of common stock of the Company.
On March 15, 2010, the Company completed the sale of 125,468,788 shares of common stock to Investor. The shares were sold for $12.60 per share, for an aggregate purchase price of $1.58 billion. Investor’s ownership in the Company’s common stock is now approximately 15% of the Company’s total outstanding shares of common stock on a fully diluted basis.
116
STOCK REPURCHASE PROGRAM
In July 2010, the Company’s Board of Directors approved a stock repurchase program (the “Program”) under which the Company can repurchase up to $500 million of AES common stock. The Board authorization permits the Company to repurchase stock through a variety of methods, including open market repurchases and/or privately negotiated transactions. There can be no assurances as to the amount, timing or prices of repurchases, which may vary based on market conditions and other factors. The Program does not have an expiration date and can be modified or terminated by the Board of Directors at any time. During the year ended December 31, 2011, shares of common stock repurchased under this plan totaled 25,541,980 at a total cost of $279 million plus a nominal amount of commissions (average of $10.93 per share including commissions), bringing the cumulative total purchases under the program to 33,924,805 shares at a total cost of $378 million plus a nominal amount of commissions (average of $11.16 per share including commissions).
The shares of stock repurchased have been classified as treasury stock and accounted for using the cost method. A total of 42,386,961 and 17,287,073 shares were held in treasury stock at December 31, 2011 and 2010, respectively. The Company has not retired any shares held in treasury during the years ended December 31, 2011, 2010 or 2009.
ACCUMULATED OTHER COMPREHENSIVE LOSS
The components of accumulated other comprehensive loss as of December 31, 2011 and 2010 were as follows:
| | | | | | | | |
| | | December 31, | |
| | | 2011 | | | 2010 | |
| | | (in millions) | |
Foreign currency translation adjustment | | $ | 1,967 | | | $ | 1,824 | |
Unrealized derivative losses, net | | | 534 | | | | 344 | |
Unfunded pension obligations | | | 257 | | | | 216 | |
Unrealized (gain) loss on securities available for sale | | | — | | | | (1 | ) |
| | | | | | | | |
Total | | $ | 2,758 | | | $ | 2,383 | |
| | | | | | | | |
EQUITY TRANSACTIONS WITH NONCONTROLLING INTERESTS
On July 7, 2011, a subsidiary of the Company completed the acquisition of an additional 10% equity interest in AES-VCM Mong Duong Power Company Limited (“Mong Duong”), a 1,200 MW coal-fired power plant in development in the Quang Ninh province in Vietnam, from Vietnam National Coal and Mineral Industries Group, its minority shareholder. On July 8, 2011, through a subsidiary, the Company sold 30% and 19% equity interests in Mong Duong to PSC Energy Global Co., Ltd. (a wholly owned subsidiary of POSCO Corporation) and Stable Investment Corporation (a wholly owned subsidiary of China Investment Corporation, a related party), respectively, resulting in the Company retaining a 51% indirect equity interest in Mong Duong. As a result of these transactions, the Company did not lose control of Mong Duong, which continues to be accounted for as a consolidated subsidiary. A net gain of $19 million resulting from these transactions was recorded as an equity transaction in additional paid-in capital.
The following table summarizes the net income attributable to The AES Corporation and transfers (to) from noncontrolling interests for the years ended December 31, 2011 and 2010:
| | | | | | | | |
| | | December 31, | |
| | | 2011 | | | 2010 | |
| | | (in millions) | |
Net income attributable to The AES Corporation | | $ | 58 | | | $ | 9 | |
Transfers (to) from the noncontrolling interests: | | | | | | | | |
Net increase in The AES Corporation’s paid-in capital for sale of subsidiary shares | | | 19 | | | | — | |
Decrease in The AES Corporation’s paid-in capital for purchase of subsidiary shares | | | — | | | | (25 | ) |
| | | | | | | | |
Net transfers (to) from noncontrolling interest | | | 19 | | | | (25 | ) |
| | | | | | | | |
Change from net income attributable to The AES Corporation and transfers (to) from noncontrolling interests | | $ | 77 | | | $ | (16 | ) |
| | | | | | | | |
117
16. SEGMENT AND GEOGRAPHIC INFORMATION
During the first quarter of 2012, the Company completed the restructuring of its operational management and reporting process. The management reporting structure is organized along two lines of business—Generation and Utilities, each led by a Chief Operating Officer. The segment reporting structure primarily uses the Company’s management reporting structure as its foundation to reflect how the Company manages the business internally with further aggregation by geographic regions to provide better socio-political-economic understanding of our business. Upon the application of the accounting guidance for segment reporting, the Company concluded that Tietê, our 2,663 MW hydro generation business in Brazil, met the quantitative thresholds to require separate presentation. As such, an additional reportable segment which consists solely of the results of Tietê is now reported as Generation—Tietê. Tietê was formerly reported within the Latin America—Generation segment. The previously disclosed Latin America—Generation segment is now reported as Generation—Latin America—Other and, with the exception of Tietê, includes the results of all remaining businesses as previously reported. All prior period results have been retrospectively revised to reflect the new segment reporting structure. The Company has increased from six to the following seven reportable segments:
| | • | | Generation—Latin America—Other; |
| | • | Generation—North America; |
| | • | Utilities—Latin America; |
| | • | Utilities—North America. |
Corporate and Other—The Company’s Europe Utilities, Africa Utilities, Africa Generation, Wind Generation operating segments and other climate solutions and renewables projects are reported within “Corporate and Other” because they do not meet the criteria to allow for aggregation with another operating segment or the quantitative thresholds that would require separate disclosure under segment reporting accounting guidance. None of these operating segments are currently material to our presentation of reportable segments, individually or in the aggregate. AES Solar and certain other unconsolidated businesses are accounted for using the equity method of accounting; therefore, their operating results are included in “Net Equity in Earnings of Affiliates” on the face of the Consolidated Statements of Operations, not in revenue or gross margin. “Corporate and Other” also includes corporate overhead costs which are not directly associated with the operations of our seven reportable segments and other intercompany charges such as self-insurance premiums which are fully eliminated in consolidation.
The Company uses adjusted gross margin, a non-GAAP measure, to evaluate the performance of its segments. Adjusted gross margin is defined by the Company as gross margin plus depreciation and amortization less general and administrative expenses.
Total revenue includes inter-segment sales related to the transfer of electricity from generation plants to utilities within Latin America. No material inter-segment revenue relationships exist between other segments. Corporate allocations include certain self-insurance activities which are reflected within segment adjusted gross margin. All intra-segment activity has been eliminated with respect to revenue and adjusted gross margin within the segment. Inter-segment activity has been eliminated within the total consolidated results. Asset information for businesses that were discontinued or classified as held for sale as of December 31, 2011 is segregated and is shown in the line “Discontinued Businesses” in the accompanying segment tables.
118
The tables below present the breakdown of business segment balance sheet and income statement data as of and for the years ended December 31, 2011 through 2009:
| | | | | | | | | | | | | | | | | | | | | | | | | | | | | | | | | | | | |
| | | Total Revenue | | | Intersegment | | | External Revenue | |
| | | 2011 | | | 2010 | | | 2009 | | | 2011 | | | 2010 | | | 2009 | | | 2011 | | | 2010 | | | 2009 | |
| | | (in millions) | |
Revenue | | | | | | | | | | | | | | | | | | | | | | | | | | | | | | | | | | | | |
Generation - Latin America - Other | | $ | 3,854 | | | $ | 3,282 | | | $ | 2,806 | | | $ | (39 | ) | | $ | (34 | ) | | $ | (16 | ) | | $ | 3,815 | | | $ | 3,248 | | | $ | 2,790 | |
Generation - Tiete | | | 1,128 | | | | 999 | | | | 845 | | | | (1,109 | ) | | | (983 | ) | | | (848 | ) | | | 19 | | | | 16 | | | | (3 | ) |
Generation - North America | | | 1,325 | | | | 1,315 | | | | 1,249 | | | | (4 | ) | | | — | | | | — | | | | 1,321 | | | | 1,315 | | | | 1,249 | |
Generation - Europe | | | 1,550 | | | | 1,318 | | | | 762 | | | | (2 | ) | | | (2 | ) | | | 2 | | | | 1,548 | | | | 1,316 | | | | 764 | |
Generation - Asia | | | 625 | | | | 618 | | | | 375 | | | | — | | | | — | | | | — | | | | 625 | | | | 618 | | | | 375 | |
Utilities - Latin America | | | 7,374 | | | | 6,987 | | | | 5,877 | | | | — | | | | — | | | | — | | | | 7,374 | | | | 6,987 | | | | 5,877 | |
Utilities - North America | | | 1,326 | | | | 1,145 | | | | 1,068 | | | | — | | | | — | | | | — | | | | 1,326 | | | | 1,145 | | | | 1,068 | |
Corporate and Other | | | 1,109 | | | | 1,053 | | | | 868 | | | | (9 | ) | | | (13 | ) | | | (14 | ) | | | 1,100 | | | | 1,040 | | | | 854 | |
| | | | | | | | | | | | | | | | | | | | | | | | | | | | | | | | | | | | |
Total Revenue | | $ | 18,291 | | | $ | 16,717 | | | $ | 13,850 | | | $ | (1,163 | ) | | $ | (1,032 | ) | | $ | (876 | ) | | $ | 17,128 | | | $ | 15,685 | | | $ | 12,974 | |
| | | | | | | | | | | | | | | | | | | | | | | | | | | | | | | | | | | | |
| | | | | | | | | | | | | | | | | | | | | | | | | | | | | | | | | | | | |
| | | Total Adjusted Gross Margin | | | Intersegment | | | External Adjusted Gross Margin | |
| | | 2011 | | | 2010 | | | 2009 | | | 2011 | | | 2010 | | | 2009 | | | 2011 | | | 2010 | | | 2009 | |
| | | (in millions) | |
Adjusted Gross Margin | | | | | | | | | | | | | | | | | | | | | | | | | | | | | | | | | | | | |
Generation - Latin America - Other | | $ | 1,209 | | | $ | 945 | | | $ | 891 | | | $ | 20 | | | $ | (27 | ) | | $ | (4 | ) | | $ | 1,229 | | | $ | 918 | | | $ | 887 | |
Generation - Tiete | | | 876 | | | | 754 | | | | 637 | | | | (1,109 | ) | | | (983 | ) | | | (848 | ) | | | (233 | ) | | | (229 | ) | | | (211 | ) |
Generation - North America | | | 439 | | | | 448 | | | | 453 | | | | 9 | | | | 2 | | | | (3 | ) | | | 448 | | | | 450 | | | | 450 | |
Generation - Europe | | | 469 | | | | 395 | | | | 273 | | | | 8 | | | | 3 | | | | 4 | | | | 477 | | | | 398 | | | | 277 | |
Generation - Asia | | | 176 | | | | 255 | | | | 111 | | | | 2 | | | | 2 | | | | 4 | | | | 178 | | | | 257 | | | | 115 | |
Utilities - Latin America | | | 1,321 | | | | 1,248 | | | | 1,060 | | | | 1,118 | | | | 1,018 | | | | 865 | | | | 2,439 | | | | 2,266 | | | | 1,925 | |
Utilities - North America | | | 394 | | | | 407 | | | | 401 | | | | 1 | | | | 2 | | | | 2 | | | | 395 | | | | 409 | | | | 403 | |
Corporate and Other | | | (33 | ) | | | 62 | | | | 3 | | | | (45 | ) | | | (17 | ) | | | (10 | ) | | | (78 | ) | | | 45 | | | | (7 | ) |
Reconciliation to Income from Continuing Operations before Taxes | | | | | | | | | | | | | |
Depreciation and amortization | | | | (1,176 | ) | | | (1,034 | ) | | | (884 | ) |
Interest expense | | | | (1,553 | ) | | | (1,451 | ) | | | (1,406 | ) |
Interest income | | | | 400 | | | | 408 | | | | 344 | |
Other expense | | | | (154 | ) | | | (234 | ) | | | (104 | ) |
Other income | | | | 149 | | | | 100 | | | | 458 | |
Gain on sale of investments | | | | 8 | | | | — | | | | 132 | |
Goodwill impairment | | | | (17 | ) | | | (21 | ) | | | (122 | ) |
Asset impairment expense | | | | (225 | ) | | | (389 | ) | | | (20 | ) |
Foreign currency transaction gains (losses) | | | | (38 | ) | | | (33 | ) | | | 35 | |
Other non-operating expense | | | | (82 | ) | | | (7 | ) | | | (12 | ) |
| | | | | | | | | | | | | | | | | | | | | | | | | | | | | | | | | | | | |
Income from continuing operations before taxes and equity in earnings of affiliates | | | $ | 2,167 | | | $ | 1,853 | �� | | $ | 2,260 | |
| | | | | | | | | | | | | | | | | | | | | | | | | | | | | | | | | | | | |
| | | | | | | | | | | | | | | | | | | | | | | | | | | | | | | | | | | | |
| | | Total Assets | | | Depreciation and Amortization | | | Capital Expenditures | |
| | | 2011 | | | 2010 | | | 2009 | | | 2011 | | | 2010 | | | 2009 | | | 2011 | | | 2010 | | | 2009 | |
| | | (in millions) | |
Generation - Latin America - Other | | $ | 9,067 | | | $ | 8,487 | | | $ | 8,010 | | | $ | 202 | | | $ | 175 | | | $ | 146 | | | $ | 553 | | | $ | 584 | | | $ | 921 | |
Generation - Tiete | | | 1,645 | | | | 1,886 | | | | 1,792 | | | | 59 | | | | 40 | | | | 37 | | | | 105 | | | | 57 | | | | 30 | |
Generation - North America | | | 3,625 | | | | 3,801 | | | | 4,199 | | | | 118 | | | | 131 | | | | 135 | | | | 39 | | | | 54 | | | | 45 | |
Generation - Europe | | | 3,276 | | | | 3,317 | | | | 3,147 | | | | 136 | | | | 114 | | | | 53 | | | | 140 | | | | 233 | | | | 212 | |
Generation - Asia | | | 1,717 | | | | 1,762 | | | | 1,594 | | | | 33 | | | | 33 | | | | 32 | | | | 129 | | | | 10 | | | | 22 | |
Utilities - Latin America | | | 9,468 | | | | 9,609 | | | | 8,810 | | | | 293 | | | | 231 | | | | 201 | | | | 666 | | | | 584 | | | | 356 | |
Utilities - North America | | | 9,384 | | | | 3,139 | | | | 3,035 | | | | 178 | | | | 161 | | | | 157 | | | | 232 | | | | 177 | | | | 116 | |
Discontinued businesses | | | 1,531 | | | | 2,587 | | | | 3,756 | | | | 59 | | | | 110 | | | | 140 | | | | 91 | | | | 105 | | | | 119 | |
Corp/Other and eliminations | | | 5,620 | | | | 5,923 | | | | 5,192 | | | | 184 | | | | 183 | | | | 148 | | | | 506 | | | | 529 | | | | 717 | |
| | | | | | | | | | | | | | | | | | | | | | | | | | | | | | | | | | | | |
Total | | $ | 45,333 | | | $ | 40,511 | | | $ | 39,535 | | | $ | 1,262 | | | $ | 1,178 | | | $ | 1,049 | | | $ | 2,461 | | | $ | 2,333 | | | $ | 2,538 | |
| | | | | | | | | | | | | | | | | | | | | | | | | | | | | | | | | | | | |
119
| | | | | | | | | | | | | | | | | | | | | | | | |
| | | Investment in and
Advances to Affiliates | | | Equity in Earnings (Loss) | |
| | | 2011 | | | 2010 | | | 2009 | | | 2011 | | | 2010 | | | 2009 | |
| | | (in millions) | |
Generation - Latin America - Other | | $ | 188 | | | $ | 150 | | | $ | 129 | | | $ | 35 | | | $ | 48 | | | $ | 30 | |
Generation - Tiete | | | — | | | | — | | | | — | | | | — | | | | — | | | | — | |
Generation - North America | | | 18 | | | | — | | | | 3 | | | | (2 | ) | | | (2 | ) | | | (2 | ) |
Generation - Europe | | | 479 | | | | 353 | | | | 308 | | | | 8 | | | | 19 | | | | 50 | |
Generation - Asia | | | 291 | | | | 409 | | | | 390 | | | | (1 | ) | | | 3 | | | | 28 | |
Utilities - Latin America | | | — | | | | — | | | | — | | | | — | | | | — | | | | — | |
Utilities - North America | | | — | | | | — | | | | — | | | | — | | | | — | | | | — | |
Discontinued businesses | | | — | | | | — | | | | — | | | | — | | | | — | | | | — | |
Corp/Other and eliminations | | | 446 | | | | 408 | | | | 327 | | | | (42 | ) | | | 115 | | | | (15 | ) |
| | | | | | | | | | | | | | | | | | | | | | | | |
Total | | $ | 1,422 | | | $ | 1,320 | | | $ | 1,157 | | | $ | (2 | ) | | $ | 183 | | | $ | 91 | |
| | | | | | | | | | | | | | | | | | | | | | | | |
The table below presents information, by country, about the Company’s consolidated operations for each of the years ended December 31, 2011 through 2009 and as of December 31, 2011 and 2010, respectively. Revenue is recorded in the country in which it is earned and assets are recorded in the country in which they are located.
| | | | | | | | | | | | | | | | | | | | |
| | | Revenue | | | Property, Plant &
Equipment, net | |
| | | 2011 | | | 2010 | | | 2009 | | | 2011 | | | 2010 | |
| | | (in millions) | |
United States(1) | | $ | 2,110 | | | $ | 1,952 | | | $ | 1,851 | | | $ | 7,829 | | | $ | 5,379 | |
| | | | | | | | | | | | | | | | | | | | |
Non-U.S.: | | | | | | | | | | | | | | | | | | | | |
Brazil(2) | | | 6,640 | | | | 6,355 | | | | 5,292 | | | | 5,896 | | | | 6,263 | |
Chile | | | 1,608 | | | | 1,355 | | | | 1,239 | | | | 2,781 | | | | 2,560 | |
Argentina(3) | | | 979 | | | | 771 | | | | 571 | | | | 279 | | | | 270 | |
El Salvador | | | 752 | | | | 648 | | | | 619 | | | | 268 | | | | 261 | |
Dominican Republic | | | 674 | | | | 535 | | | | 429 | | | | 662 | | | | 625 | |
United Kingdom(4) | | | 587 | | | | 364 | | | | 228 | | | | 523 | | | | 507 | |
Philippines | | | 480 | | | | 501 | | | | 250 | | | | 766 | | | | 784 | |
Ukraine | | | 418 | | | | 356 | | | | 286 | | | | 94 | | | | 86 | |
Mexico | | | 404 | | | | 409 | | | | 329 | | | | 774 | | | | 786 | |
Cameroon | | | 386 | | | | 422 | | | | 370 | | | | 901 | | | | 823 | |
Colombia | | | 365 | | | | 393 | | | | 347 | | | | 384 | | | | 387 | |
Puerto Rico | | | 298 | | | | 253 | | | | 267 | | | | 581 | | | | 596 | |
Spain(5) | | | 258 | | | | 411 | | | | — | | | | — | | | | — | |
Bulgaria(6) | | | 251 | | | | 44 | | | | — | | | | 1,619 | | | | 1,825 | |
Hungary(7) | | | 204 | | | | 252 | | | | 259 | | | | 6 | | | | 73 | |
Panama | | | 189 | | | | 194 | | | | 168 | | | | 1,040 | | | | 921 | |
Kazakhstan | | | 145 | | | | 138 | | | | 123 | | | | 86 | | | | 63 | |
Sri Lanka | | | 140 | | | | 100 | | | | 109 | | | | 22 | | | | 69 | |
Jordan | | | 124 | | | | 120 | | | | 104 | | | | 216 | | | | 224 | |
Qatar(8) | | | — | | | | — | | | | — | | | | — | | | | — | |
Pakistan(9) | | | — | | | | — | | | | — | | | | — | | | | — | |
Oman(10) | | | — | | | | — | | | | — | | | | — | | | | — | |
Other Non-U.S.(11) | | | 116 | | | | 112 | | | | 133 | | | | 395 | | | | 291 | |
| | | | | | | | | | | | | | | | | | | | |
Total Non-U.S. | | | 15,018 | | | | 13,733 | | | | 11,123 | | | | 17,293 | | | | 17,414 | |
| | | | | | | | | | | | | | | | | | | | |
Total | | $ | 17,128 | | | $ | 15,685 | | | $ | 12,974 | | | $ | 25,122 | | | $ | 22,793 | |
| | | | | | | | | | | | | | | | | | | | |
120
| (1) | Excludes revenue of $374 million, $662 million and $695 million for the years ended December 31, 2011, 2010 and 2009, respectively, and property, plant and equipment of $619 million and $788 million as of December 31, 2011 and 2010, respectively, related to Eastern Energy, Thames, Ironwood and Red Oak which were reflected as discontinued operations and businesses held for sale in the accompanying Consolidated Statements of Operations and Consolidated Balance Sheets. |
| (2) | Excludes revenue of $124 million, $118 million and $102 million for the years ended December 31, 2011, 2010 and 2009, respectively, and property, plant and equipment of $151 million as of December 31, 2010, related to Brazil Telecom, which was reflected as discontinued operations and businesses held for sale in the accompanying Consolidated Statements of Operations and Consolidated Balance Sheets. |
| (3) | Excludes revenue of $102 million, $116 million and $113 million for the years ended December 31, 2011, 2010 and 2009, respectively, and property, plant and equipment of $189 million as of December 31, 2010, related to our Argentina distribution businesses, which were reflected as discontinued operations and businesses held for sale in the accompanying Consolidated Statements of Operations and Consolidated Balance Sheets. |
| (4) | Excludes revenue of $17 million, $21 million and $11 million for the years ended December 31, 2011, 2010 and 2009, respectively, and property, plant and equipment of $20 million as of December 31, 2010, related to carbon reduction projects, which were reflected as discontinued operations and businesses held for sale in the accompanying Consolidated Statements of Operations and Consolidated Balance Sheets. |
| (5) | Excludes property, plant and equipment of $620 million and $667 million as of December 31, 2011 and 2010, respectively, related to Cartagena, which was reflected as businesses held for sale in the accompanying Consolidated Balance Sheets. |
| (6) | Maritza and our wind project in Bulgaria were under development and therefore not operational as of December 31, 2009. Our wind project in Bulgaria started operations in 2010 and Maritza started operations in June 2011. |
| (7) | Excludes revenue of $14 million, $44 million and $58 million for the years ended December 31, 2011, 2010 and 2009, respectively, and property, plant and equipment of $7 million as of December 31, 2010, related to Borsod and Tiszapalkonya, which were reflected as discontinued operations and businesses held for sale in the accompanying Consolidated Statements of Operations and Consolidated Balance Sheets. |
| (8) | Excludes revenue of $129 million and $163 million for the years ended December 31, 2010 and 2009, respectively, related to Ras Laffan, which was reflected as discontinued operations and businesses held for sale in the accompanying Consolidated Statements of Operations. |
| (9) | Excludes revenue of $299 million and $470 million for the years ended December 31, 2010 and 2009, respectively, related to Lal Pir and Pak Gen, which were reflected as discontinued operations and businesses held for sale in the accompanying Consolidated Statements of Operations. |
| (10) | Excludes revenue of $62 million and $101 million for the years ended December 31, 2010 and 2009, respectively, related to Barka, which was reflected as discontinued operations and businesses held for sale in the accompanying Consolidated Statements of Operations. |
| (11) | Excludes revenue of $1 million for the year ended December 31, 2011, and property, plant and equipment of $2 million and $18 million as of December 31, 2011, and 2010, respectively, related to alternative energy and carbon reduction projects, which were reflected as discontinued operations and businesses held for sale in the accompanying Consolidated Statements of Operations and Consolidated Balance Sheets. |
17. SHARE-BASED COMPENSATION
STOCK OPTIONS—AES grants options to purchase shares of common stock under stock option plans. Under the terms of the plans, the Company may issue options to purchase shares of the Company’s common stock at a price equal to 100% of the market price at the date the option is granted. Stock options are generally granted based upon a percentage of an employee’s base salary. Stock options issued under these plans in 2011, 2010 and 2009 have a three-year vesting schedule and vest in one-third increments over the three-year period. The stock options have a contractual term of ten years. At December 31, 2011, approximately 17 million shares were remaining for award under the plans. In all circumstances, stock options granted by AES do not entitle the holder the right, or obligate AES, to settle the stock option in cash or other assets of AES.
121
The weighted average fair value of each option grant has been estimated, as of the grant date, using the Black-Scholes option-pricing model with the following weighted average assumptions:
| | | | | | | | | | | | |
| | | December 31, | |
| | | 2011 | | | 2010 | | | 2009 | |
Expected volatility | | | 31 | % | | | 38 | % | | | 66 | % |
Expected annual dividend yield | | | 0 | % | | | 0 | % | | | 0 | % |
Expected option term (years) | | | 6 | | | | 6 | | | | 6 | |
Risk-free interest rate | | | 2.65 | % | | | 2.86 | % | | | 2.01 | % |
The Company exclusively relies on implied volatility as the expected volatility to determine the fair value using the Black-Scholes option-pricing model. The implied volatility may be exclusively relied upon due to the following factors:
| | • | | The Company utilizes a valuation model that is based on a constant volatility assumption to value its employee share options; |
| | • | | The implied volatility is derived from options to purchase AES common stock that are actively traded; |
| | • | | The market prices of both the traded options and the underlying shares are measured at a similar point in time and on a date reasonably close to the grant date of the employee share options; |
| | • | | The traded options have exercise prices that are both near-the-money and close to the exercise price of the employee share options; and |
| | • | | The remaining maturities of the traded options on which the estimate is based are at least one year. |
Pursuant to share-based compensation accounting guidance, the Company used a simplified method to determine the expected term based on the average of the original contractual term and the pro rata vesting period. This simplified method was used for stock options granted during 2011, 2010 and 2009. This is appropriate given a lack of relevant stock option exercise data. This simplified method may be used as the Company’s stock options have the following characteristics:
| | • | | The stock options are granted at-the-money; |
| | • | | Exercisability is conditional only on performing service through the vesting date; |
| | • | | If an employee terminates service prior to vesting, the employee forfeits the stock options; |
| | • | | If an employee terminates service after vesting, the employee has a limited time to exercise the stock option; and |
| | • | | The stock option is nonhedgeable and not transferable. |
The Company does not discount the grant date fair values to estimate post-vesting restrictions. Post-vesting restrictions include black-out periods when the employee is not able to exercise stock options based on their potential knowledge of information prior to the release of that information to the public.
Using the above assumptions, the weighted average fair value of each stock option granted was $4.54, $5.08 and $4.08, for the years ended December 31, 2011, 2010, and 2009, respectively.
The following table summarizes the components of stock-based compensation related to employee stock options recognized in the Company’s financial statements:
| | | | | | | | | | | | |
| | | December 31, | |
| | | 2011 | | | 2010 | | | 2009 | |
| | | (in millions) | |
Pre-tax compensation expense | | $ | 7 | | | $ | 9 | | | $ | 10 | |
Tax benefit | | | (2 | ) | | | (2 | ) | | | (3 | ) |
| | | | | | | | | | | | |
Stock options expense, net of tax | | $ | 5 | | | $ | 7 | | | $ | 7 | |
| | | | | | | | | | | | |
Total intrinsic value of options exercised | | $ | 8 | | | $ | 2 | | | $ | 3 | |
Total fair value of options vested | | | 7 | | | | 11 | | | | 13 | |
Cash received from the exercise of stock options | | | 4 | | | | 2 | | | | 6 | |
122
There was no cash used to settle stock options or compensation cost capitalized as part of the cost of an asset for the years ended December 31, 2011, 2010 and 2009. As of December 31, 2011, $3 million of total unrecognized compensation cost related to stock options is expected to be recognized over a weighted average period of 1.8 years. During the year ended December 31, 2011, modifications were made to stock option awards affecting 2 million stock options.
A summary of the option activity for the year ended December 31, 2011 follows (number of options in thousands, dollars in millions except per option amounts):
| | | | | | | | | | | | | | | | |
| | | Options | | | Weighted
Average
Exercise
Price | | | Weighted Average
Remaining
Contractual Term
(in years) | | | Aggregate
Intrinsic
Value | |
Outstanding at December 31, 2010 | | | 20,482 | | | $ | 16.04 | | | | | | | | | |
Exercised | | | (958 | ) | | | 4.21 | | | | | | | | | |
Forfeited and expired | | | (11,197 | ) | | | 17.72 | | | | | | | | | |
Granted | | | 1,131 | | | | 12.60 | | | | | | | | | |
| | | | | | | | | | | | | | | | |
Outstanding at December 31, 2011 | | | 9,458 | | | $ | 13.82 | | | | 4.8 | | | $ | 17 | |
| | | | | | | | | | | | | | | | |
Vested and expected to vest at December 31, 2011 | | | 9,379 | | | $ | 13.84 | | | | 4.7 | | | $ | 16 | |
| | | | | | | | | | | | | | | | |
Eligible for exercise at December 31, 2011 | | | 7,385 | | | $ | 14.58 | | | | 4.1 | | | $ | 14 | |
| | | | | | | | | | | | | | | | |
The aggregate intrinsic value in the table above represents the total pre-tax intrinsic value (the difference between the Company’s closing stock price on the last trading day of the fourth quarter of 2011 and the exercise price, multiplied by the number of in-the-money options) that would have been received by the option holders had all option holders exercised their options on December 31, 2011. The amount of the aggregate intrinsic value will change based on the fair market value of the Company’s stock.
The Company initially recognizes compensation cost on the estimated number of instruments for which the requisite service is expected to be rendered. In 2011, AES has estimated a forfeiture rate of 12.81% for stock options granted in 2011. This estimate will be revised if subsequent information indicates that the actual number of instruments forfeited is likely to differ from previous estimates. Based on the estimated forfeiture rate, the Company expects to expense $4.4 million on a straight-line basis over a three year period (approximately $1.5 million per year) related to stock options granted during the year ended December 31, 2011.
RESTRICTED STOCK
Restricted Stock Units Without Market Conditions—The Company issues restricted stock units (“RSUs”) without market conditions under its long-term compensation plan. The RSUs are generally granted based upon a percentage of the participant’s base salary. The units have a three-year vesting schedule and vest in one-third increments over the three-year period. Units granted prior to 2011 are required to be held for an additional two years before they can be converted into shares, and thus become transferable. There is no such requirement for units granted in 2011. In all circumstances, restricted stock units granted by AES do not entitle the holder the right, or obligate AES, to settle the restricted stock unit in cash or other assets of AES.
For the years ended December 31, 2011, 2010, and 2009, RSUs issued without a market condition had a grant date fair value equal to the closing price of the Company’s stock on the grant date. The Company does not discount the grant date fair values to reflect any post-vesting restrictions. RSUs without a market condition granted to employees during the years ended December 31, 2011, 2010, and 2009 had grant date fair values per RSU of $12.65, $12.18 and $6.71, respectively. The total grant date fair value of RSUs granted in 2011 without a market condition was $20 million.
123
The following table summarizes the components of the Company’s stock-based compensation related to its employee RSUs issued without market conditions recognized in the Company’s consolidated financial statements:
| | | | | | | | | | | | |
| | | December 31, | |
| | | 2011 | | | 2010 | | | 2009 | |
| | | (in millions) | |
RSU expense before income tax | | $ | 11 | | | $ | 11 | | | $ | 11 | |
Tax benefit | | | (3 | ) | | | (2 | ) | | | (3 | ) |
| | | | | | | | | | | | |
RSU expense, net of tax | | $ | 8 | | | $ | 9 | | | $ | 8 | |
| | | | | | | | | | | | |
Total value of RSUs converted(1) | | $ | 5 | | | $ | 5 | | | $ | 7 | |
Total fair value of RSUs vested | | $ | 10 | | | $ | 12 | | | $ | 12 | |
| (1) | Amount represents fair market value on the date of conversion. |
There was no cash used to settle RSUs or compensation cost capitalized as part of the cost of an asset for the years ended December 31, 2011, 2010 and 2009. As of December 31, 2011, $14 million of total unrecognized compensation cost related to RSUs without a market condition is expected to be recognized over a weighted average period of approximately 1.9 years. There were no modifications to RSU awards during the year ended December 31, 2011.
A summary of the activity of RSUs without a market condition for the year ended December 31, 2011 follows (number of RSUs in thousands):
| | | | | | | | | | | | |
| | | RSUs | | | Weighted
Average Grant
Date Fair Values | | | Weighted Average
Remaining Vesting
Term | |
Nonvested at December 31, 2010 | | | 2,167 | | | $ | 10.20 | | | | | |
Vested | | | (982 | ) | | | 10.91 | | | | | |
Forfeited and expired | | | (395 | ) | | | 12.16 | | | | | |
Granted | | | 1,565 | | | | 12.65 | | | | | |
| | | | | | | | | | | | |
Nonvested at December 31, 2011 | | | 2,355 | | | $ | 11.40 | | | | 1.6 | |
| | | | | | | | | | | | |
Vested at December 31, 2011 | | | 2,620 | | | $ | 13.97 | | | | | |
Vested and expected to vest at December 31, 2011 | | | 4,788 | | | $ | 12.77 | | | | | |
The table below summarizes the RSUs without a market condition that vested and were converted during the years ended December 31, 2011, 2010 and 2009 (number of RSUs in thousands):
| | | | | | | | | | | | |
| | | December 31, | |
| | | 2011 | | | 2010 | | | 2009 | |
RSUs vested during the year | | | 982 | | | | 929 | | | | 619 | |
RSUs converted during the year(1) | | | 442 | | | | 386 | | | | 772 | |
| (1) | Net of shares withheld for taxes of 150,000, 127,000 and 238,000 in the years ended December 31, 2011, 2010 and 2009, respectively. |
Restricted Stock Units With Market and Performance Conditions—Restricted stock units were issued to officers of the Company during 2011 that contain market and performance conditions. 50% percent of the RSUs contained in the award include a market condition and the remaining 50% include a performance condition. Vesting will occur if the applicable continued employment conditions are satisfied and (a) for the units subject to the market condition the Total Stockholder Return (“TSR”) on AES common stock exceeds the TSR of the Standard and Poor’s 500 (“S&P 500”) over the three-year measurement period beginning on January 1, 2011 and ending on December 31, 2013 and (b) for the units subject to the performance condition if the actual Cash Value Added (“CVA”) meets the performance target over the three-year measurement period of beginning on January 1, 2011 and ending on December 31, 2013. In all circumstances, restricted stock units granted by AES do not entitle the holder the right, or obligate AES, to settle the restricted stock unit in cash or other assets of AES.
124
Restricted stock units with a market condition were awarded to officers of the Company in previous years and contained only the market condition measuring the TSR on AES common stock. These units were required to be held for an additional two years subsequent to vesting before they could be converted into shares and become transferable. There is no such requirement for the shares granted during 2011.
The effect of the market condition on restricted stock units issued to officers of the Company is reflected in the award’s fair value on the grant date for the year ended December 31, 2011. A factor of 137% was applied to the closing price of the Company’s stock on the date of grant to estimate the fair value to reflect the market condition for the portion of RSUs with market conditions granted during the year ended December 31, 2011. RSUs that included a market condition granted during the year ended December 31, 2011, 2010 and 2009 had a grant date fair value per RSU of $17.68, $11.57 and $6.68, respectively. The fair value of the RSUs with a performance condition had a grant date fair value of $12.88 equal to the closing price of the Company’s stock on the grant date. The Company believes that it is probable that the performance condition will be met. This will continue to be evaluated throughout the performance period. The total grant date fair value of RSUs with market and performance conditions granted in 2011 was $12 million. If the factor was not applied to reflect the market condition for RSUs issued to officers, the total grant date fair value of RSUs with a market condition granted during the year ended December 31, 2011 would have decreased by $2 million.
The following table summarizes the components of the Company’s stock-based compensation related to its RSUs granted with market and performance conditions recognized in the Company’s consolidated financial statements:
| | | | | | | | | | | | |
| | | December 31, | |
| | | 2011 | | | 2010 | | | 2009 | |
| | | (in millions) | |
RSU expense before income tax | | $ | 5 | | | $ | 4 | | | $ | 4 | |
Tax benefit | | | (1 | ) | | | (1 | ) | | | (1 | ) |
| | | | | | | | | | | | |
RSU expense, net of tax | | $ | 4 | | | $ | 3 | | | $ | 3 | |
| | | | | | | | | | | | |
Total value of RSUs converted(1) | | $ | — | | | $ | 3 | | | $ | 4 | |
Total fair value of RSUs vested(2) | | $ | — | | | $ | — | | | $ | — | |
| (1) | Amount represents fair market value on the date of conversion. |
| (2) | RSUs granted in 2008 with a market condition did not vest in 2011 because the TSR on AES common stock did not exceed the TSR of the S&P 500 over the three year vesting period. |
There was no cash used to settle RSUs or compensation cost capitalized as part of the cost of an asset for the years ended December 31, 2011, 2010 and 2009. As of December 31, 2011, $6 million of total unrecognized compensation cost related to RSUs with market and performance conditions is expected to be recognized over a weighted average period of approximately 2.0 years. There were no modifications to RSU awards during the year ended December 31, 2011.
A summary of the activity of RSUs with market and performance conditions for the year ended December 31, 2011 follows (number of RSUs in thousands):
| | | | | | | | | | | | |
| | | RSUs | | | Weighted
Average
Grant Date
Fair Values | | | Weighted
Average
Remaining
Vesting
Term | |
Nonvested at December 31, 2010 | | | 1,283 | | | $ | 9.80 | | | | | |
Vested | | | — | | | | — | | | | | |
Forfeited and expired | | | (693 | ) | | | 13.94 | | | | | |
Granted | | | 767 | | | | 15.28 | | | | | |
| | | | | | | | | | | | |
Nonvested at December 31, 2011 | | | 1,357 | | | $ | 10.78 | | | | 1.1 | |
| | | | | | | | | | | | |
Vested at December 31, 2011 | | | — | | | $ | — | | | | | |
Vested and expected to vest at December 31, 2011 | | | 1,268 | | | $ | 10.55 | | | | | |
125
The table below summarizes the RSUs with market and performance conditions that vested and were converted during the years ended 2011, 2010 and 2009 (number of RSUs in thousands):
| | | | | | | | | | | | |
| | | December 31, | |
| | | 2011 | | | 2010 | | | 2009 | |
RSUs vested during the year | | | — | | | | — | | | | — | |
RSUs converted during the year(1) | | | — | | | | 245 | | | | 410 | |
| (1) | Net of shares withheld for taxes of 0, 102,000 and 153,000 during the years ended December 31, 2011, 2010 and 2009, respectively. |
18. SUBSIDIARY STOCK
Subsidiaries of the Company held cumulative preferred stock of $78 million and $60 million at December 31, 2011 and 2010, respectively, consisting of preferred stock held by IPL and DPL.
IPL, the Company’s integrated utility in Indiana, had $60 million of cumulative preferred stock outstanding at December 31, 2011 and 2010, which represented five series of preferred stock. The total annual dividend requirements were approximately $3 million at December 31, 2011 and 2010. Certain series of the preferred stock were redeemable solely at the option of the issuer at prices between $100 and $118 per share. Holders of the preferred stock are entitled to elect a majority of IPL’s board of directors if IPL has not paid dividends to its preferred stockholders for four consecutive quarters. Based on the preferred stockholders’ ability to elect a majority of IPL’s board of directors in this circumstance, the redemption of the preferred shares is considered to be not solely within the control of the issuer and the preferred stock is considered temporary equity and presented in the mezzanine level of the Consolidated Balance Sheets in accordance with the relevant accounting guidance for noncontrolling interests and redeemable securities.
DPL, the Company’s newly acquired utility in Ohio, had $18 million of cumulative preferred stock outstanding at December 31, 2011, which represented three series of preferred stock issued by DP&L, a wholly owned subsidiary of DPL. The total annual dividend requirements were approximately $1 million at December 31, 2011. The DP&L preferred stock may be redeemed at DP&L’s option as determined by its board of directors at per-share redemption prices between $101 and $103 per share, plus cumulative preferred dividends. In addition, DP&L’s Amended Articles of Incorporation contain provisions that permit preferred stockholders to elect members of the DP&L Board of Directors in the event that cumulative dividends on the preferred stock are in arrears in an aggregate amount equivalent to at least four full quarterly dividends. Based on the preferred stockholders’ ability to elect members of DP&L’s board of directors in this circumstance, the redemption of the preferred shares is considered to be not solely within the control of the issuer and the preferred stock is considered temporary equity and presented in the mezzanine level of the Consolidated Balance Sheets in accordance with the relevant accounting guidance for noncontrolling interests and redeemable securities.
In February 2009, in connection with a preemptive rights period associated with a share issuance (capital increase) at AES Gener, Inversiones Cachagua Limitada (“Cachagua”), a wholly owned subsidiary of the Company, paid $175 million to AES Gener to maintain its current ownership percentage of approximately 70.6%.
19. OTHER INCOME AND EXPENSE
The components of other income are summarized as follows:
| | | | | | | | | | | | |
| | | Years Ended December 31, | |
| | | 2011 | | | 2010 | | | 2009 | |
| | | (in millions) | |
Gain on extinguishment of tax and other liabilities | | $ | 14 | | | $ | 62 | | | $ | 168 | |
Tax credit settlement | | | 31 | | | | — | | | | 129 | |
Performance incentive fee | | | — | | | | — | | | | 80 | |
Gain on sale of assets | | | 47 | | | | 12 | | | | 14 | |
Other | | | 57 | | | | 26 | | | | 67 | |
| | | | | | | | | | | | |
Total other income | | $ | 149 | | | $ | 100 | | | $ | 458 | |
| | | | | | | | | | | | |
126
Other income generally includes gains on asset sales and extinguishments of liabilities, favorable judgments on contingencies, and other income from miscellaneous transactions.
Other income of $149 million for the year ended December 31, 2011 included an additional tax credit settlement from a favorable court decision in 2011 concerning reimbursement of excess non-income taxes paid from 1989 to 1992 at Eletropaulo and the reimbursement of income tax expense recognized related to an indemnity agreement between Los Mina and the Dominican Republic government. Other income also includes the gain on the sale of assets at Gener and Eletropaulo, sale of Huntington Beach units 3 & 4 at Southland and sale of land and minerals rights at IPL.
Other income of $100 million for the year ended December 31, 2010 included the extinguishment of a swap liability owed by two of our Brazilian subsidiaries, resulting in the recognition of a $62 million gain. The net impact to the Company after taxes and noncontrolling interest was $9 million. Other income also included a gain on sale of assets at Eletropaulo.
Other income of $458 million for the year ended December 31, 2009 included $165 million from the reduction in interest and penalties associated with federal tax debts at Eletropaulo and Sul as a result of the Programa de Recuperacao Fiscal (“REFIS”) program and a $129 million gain related to a favorable court decision enabling Eletropaulo to receive reimbursement of excess non-income taxes paid from 1989 to 1992 in the form of tax credits to be applied against future tax liabilities. The net impact to the Company after income taxes and noncontrolling interests for these items was $44 million. In addition, the Company recognized income of $80 million from a performance incentive bonus for management services provided to Ekibastuz and Maikuben in 2008. The management agreement was related to the sale of these businesses in Kazakhstan in May 2008; see further discussion of this transaction in Note 23—Acquisitions and Dispositions.
The components of other expense are summarized as follows:
| | | | | | | | | | | | |
| | | Years Ended December 31, | |
| | | 2011 | | | 2010 | | | 2009 | |
| | | (in millions) | |
Loss on sale and disposal of assets | | $ | 68 | | | $ | 84 | | | $ | 33 | |
Gener gas settlement | | | — | | | | 72 | | | | — | |
Loss on extinguishment of debt | | | 62 | | | | 37 | | | | — | |
Wind Generation transaction costs | | | — | | | | 22 | | | | — | |
Other | | | 24 | | | | 19 | | | | 71 | |
| | | | | | | | | | | | |
Total other expense | | $ | 154 | | | $ | 234 | | | $ | 104 | |
| | | | | | | | | | | | |
Other expense generally includes losses on asset sales, losses on extinguishment of debt, legal contingencies and losses from other miscellaneous transactions.
Other expense of $154 million for the year ended December 31, 2011 included $36 million that is primarily related to the premium paid on early retirement of debt at Gener, $15 million related to the early retirement of senior notes due in 2011 at IPALCO and loss on disposal of assets at Eletropaulo and TermoAndes.
Other expense of $234 million for the year ended December 31, 2010 included $72 million for a settlement agreement of gas transportation contracts at Gener. There were also previously capitalized transaction costs of $22 million that were incurred in connection with the preparation for the sale of a noncontrolling interest in our Wind Generation business. These costs were written off upon the expiration of the letter of intent on June 30, 2010. In addition, there were losses on disposal of assets at Eletropaulo, Panama, and Gener, an $18 million loss on debt extinguishment at Andres and Itabo, and a $15 million loss at the Parent Company from the retirement of senior notes.
Other expense of $104 million for the year ended December 31, 2009 included a $13 million loss recognized when three of our businesses in the Dominican Republic received $110 million par value bonds issued by the Dominican Republic government to settle existing accounts receivable for the same amount from the government-owned distribution companies. The loss represented an adjustment to reflect the fair value of the bonds on the date received. Other expenses also included losses on the disposal of assets at Eletropaulo and Andres and contingencies at Alicura in Argentina and our businesses in Kazakhstan.
127
20. IMPAIRMENT EXPENSE
Asset Impairment
Asset impairment expense for the year ended December 31, 2011 consisted of:
| | | | |
| | | 2011 | |
| | | (in millions) | |
Wind turbines & deposits | | $ | 116 | |
Tisza II | | | 52 | |
Kelanitissa | | | 42 | |
Other | | | 15 | |
| | | | |
Total | | $ | 225 | |
| | | | |
Wind Turbines & Deposits—During the third quarter of 2011, the Company evaluated the future use of certain wind turbines held in storage pending their installation. Due to reduced wind turbine market pricing and advances in turbine technology, the Company determined it was more likely than not that the turbines would be sold significantly before the end of their previously estimated useful lives. In addition, the Company has concluded that more likely than not non-refundable deposits it had made in prior years to a turbine manufacturer for the purchase of wind turbines are not recoverable. The Company determined it was more likely than not that it would not proceed with the purchase of turbines due to the availability of more advanced and lower cost turbines in the market. These developments were more likely than not as of September 30, 2011 and as a result were considered impairment indicators and the Company determined that an impairment had occurred as of September 30, 2011 as the aggregate carrying amount of $161 million of these assets was not recoverable and was reduced to their estimated fair value of $45 million determined under the market approach. This resulted in asset impairment expense of $116 million. Wind Generation is reported in the Corporate and Other segment. In January 2012, the Company forfeited the deposits for which a full impairment charge was recognized in the third quarter of 2011, and there is no obligation for further payments under the related turbine supply agreement. Additionally, the Company sold some of the turbines held in storage during the fourth quarter of 2011 and is continuing to evaluate the future use of the turbines held in storage. The Company determined it is more likely than not that they will be sold, however they are not being actively marketed for sale at this time as the Company is reconsidering the potential use of the turbines in light of recent development activity at one of its advance stage development projects. It is reasonably possible that the turbines could incur further loss in value due to changing market conditions and advances in technology.
Tisza II—During the fourth quarter of 2011, Tisza II, a 900 MW gas and oil-fired generation plant in Hungary entered into annual negotiations with its offtaker. As a result of these negotiations, as well as the further deterioration of the economic environment in Hungary, the Company determined that an indicator of impairment existed at December 31, 2011. Thus, the Company performed an asset impairment test and determined that based on the undiscounted cash flow analysis, the carrying amount of Tisza II asset group was not recoverable. The fair value of the asset group was then determined using a discounted cash flow analysis. The carrying value of the Tisza II asset group of $94 million exceeded the fair value of $42 million resulting in the recognition of asset impairment expense of $52 million during the three months ended December 31, 2011. Tisza II is reported in the Europe Generation reportable segment.
Kelanitissa—In 2011, the Company recognized asset impairment expense of $42 million for the long-lived assets of Kelanitissa, our diesel-fired generation plant in Sri Lanka. We have continued to evaluate the recoverability of our long-lived assets at Kelanitissa as a result of both the existing government regulation which may require the government to acquire an ownership interest and the current expectation of future losses. Our evaluation indicated that the long-lived assets were no longer recoverable and, accordingly, they were written down to their estimated fair value of $24 million based on a discounted cash flow analysis. The long-lived assets had a carrying amount of $66 million prior to the recognition of asset impairment expense. Kelanitissa is a Build-operate-transfer (BOT) generation facility and payments under its PPA are scheduled to decline over the PPA term. It is possible that further impairment charges may be required in the future as Kelanitissa gets closer to the BOT date. Kelanitissa is reported in the Asia Generation reportable segment.
128
Asset impairment expense for the year ended December 31, 2010 consisted of:
| | | | |
| | | 2010 | |
| | | (in millions) | |
Southland (Huntington Beach) | | $ | 200 | |
Tisza II | | | 85 | |
Deepwater | | | 79 | |
Other | | | 25 | |
| | | | |
Total | | $ | 389 | |
| | | | |
Southland—In September 2010, a new environmental policy on the use of ocean water to cool generation facilities was issued in California that requires generation plants to comply with the policy by December 31, 2020 and would require significant capital expenditure or plants’ shutdown. The Company’s Huntington Beach gas-fired generation facility in California, which is part of AES’ Southland business, was impacted by the new policy. The Company performed an asset impairment test and determined the fair value of the asset group using a discounted cash flow analysis. The carrying value of the asset group of $288 million exceeded the fair value of $88 million resulting in the recognition of asset impairment expense of $200 million for the year ended December 31, 2010. Southland is reported in the North America Generation reportable segment.
Tisza II—During the third quarter of 2010, the Company entered into annual negotiations with the offtaker of Tisza II. As a result of these preliminary negotiations, as well as the further deterioration of the economic environment in Hungary, the Company determined that an indicator of impairment existed at September 30, 2010. Thus, the Company performed an asset impairment test and determined that based on the undiscounted cash flow analysis, the carrying amount of the Tisza II asset group was not recoverable. The fair value of the asset group was then determined using a discounted cash flow analysis. The carrying value of the Tisza II asset group of $160 million exceeded the fair value of $75 million resulting in the recognition of asset impairment expense of $85 million during the year ended December 31, 2010.
Deepwater—In 2010, Deepwater, our 160 MW petcoke-fired merchant power plant located in Texas, experienced deteriorating market conditions due to increasing petcoke prices and diminishing power prices. As a result, Deepwater incurred operating losses and was shut down from time to time to avoid negative operating margin. In the fourth quarter of 2010, management concluded that, on an undiscounted cash flow basis, the carrying amount of the asset group was no longer recoverable. The fair value of Deepwater was determined using a discounted cash flow analysis and $79 million of impairment expense was recognized. Deepwater is reported in the North America Generation reportable segment.
Asset impairment expense for the year ended December 31, 2009 consisted of:
| | | | |
| | | 2009 | |
| | | (in millions) | |
Piabanha | | $ | 11 | |
Other | | | 9 | |
| | | | |
Total | | $ | 20 | |
| | | | |
During the fourth quarter of 2009, the Company recognized a pre-tax long-lived asset impairment charge of $11 million related to the Company’s Piabanha hydro project in Brazil. The Company determined that the carrying value exceeded the future discounted cash flows and abandoned the project. Piabanha is reported in the Company’s Latin America Generation segment.
129
21. INCOME TAXES
INCOME TAX PROVISION
The following table summarizes the expense for income taxes on continuing operations, for the years ended December 31, 2011, 2010 and 2009:
| | | | | | | | | | | | |
| | | December 31, | |
| | | 2011 | | | 2010 | | | 2009 | |
| | | (in millions) | |
Federal: | | | | | | | | | | | | |
Current | | $ | — | | | $ | (8 | ) | | $ | 3 | |
Deferred | | | (150 | ) | | | (125 | ) | | | (167 | ) |
State: | | | | | | | | | | | | |
Current | | | 1 | | | | 1 | | | | — | |
Deferred | | | 1 | | | | (19 | ) | | | (11 | ) |
Foreign: | | | | | | | | | | | | |
Current | | | 852 | | | | 678 | | | | 527 | |
Deferred | | | (73 | ) | | | 48 | | | | 201 | |
| | | | | | | | | | | | |
Total | | $ | 631 | | | $ | 575 | | | $ | 553 | |
| | | | | | | | | | | | |
EFFECTIVE AND STATUTORY RATE RECONCILIATION
The following table summarizes a reconciliation of the U.S. statutory federal income tax rate to the Company’s effective tax rate, as a percentage of income from continuing operations before taxes for the years ended December 31, 2011, 2010 and 2009:
| | | | | | | | | | | | |
| | | December 31, | |
| | | 2011 | | | 2010 | | | 2009 | |
Statutory Federal tax rate | | | 35 | % | | | 35 | % | | | 35 | % |
State taxes, net of Federal tax benefit | | | 0 | % | | | -3 | % | | | -2 | % |
Taxes on foreign earnings | | | -3 | % | | | -2 | % | | | -5 | % |
Valuation allowance | | | -3 | % | | | 0 | % | | | 0 | % |
Gain (loss) on sale of businesses | | | 0 | % | | | 4 | % | | | -3 | % |
Chilean withholding tax reversals | | | 0 | % | | | -3 | % | | | 0 | % |
Other - net | | | 0 | % | | | 0 | % | | | -1 | % |
| | | | | | | | | | | | |
Effective tax rate | | | 29 | % | | | 31 | % | | | 24 | % |
| | | | | | | | | | | | |
The current income taxes receivable and payable are included in Other Current Assets and Accrued and Other Liabilities, respectively, on the accompanying Consolidated Balance Sheets. The noncurrent income taxes receivable and payable are included in Other Assets and Other Long-Term Liabilities, respectively, on the accompanying Consolidated Balance Sheets. The following table summarizes the income taxes receivable and payable as of December 31, 2011 and 2010:
| | | | | | | | |
| | | December 31, | |
| | | 2011 | | | 2010 | |
| | | (in millions) | |
Income taxes receivable - current | | $ | 565 | | | $ | 504 | |
Income taxes receivable - noncurrent | | | 21 | | | | 21 | |
| | | | | | | | |
Total income taxes receivable | | $ | 586 | | | $ | 525 | |
| | | | | | | | |
Income taxes payable - current | | $ | 773 | | | $ | 678 | |
Income taxes payable - noncurrent | | | 3 | | | | 5 | |
| | | | | | | | |
Total income taxes payable | | $ | 776 | | | $ | 683 | |
| | | | | | | | |
DEFERRED INCOME TAXES—Deferred income taxes reflect the net tax effects of (a) temporary differences between the carrying amounts of assets and liabilities for financial reporting purposes and the amounts used for income tax purposes and (b) operating loss and tax credit carryforwards. These items are stated at the enacted tax rates that are expected to be in effect when taxes are actually paid or recovered.
As of December 31, 2011, the Company had federal net operating loss carryforwards for tax purposes of approximately $2.1 billion expiring in years 2023 to 2031. Approximately $73 million of the net operating loss carryforward related to stock option deductions will be recognized in additional paid-in capital when realized. The Company also had federal general business tax credit carryforwards of approximately $18 million expiring primarily from 2020 to 2031, and federal alternative minimum tax credits of approximately $5 million that carryforward without expiration. The Company had state net operating loss carryforwards as of December 31, 2011 of
130
approximately $5.0 billion expiring in years 2013 to 2031. As of December 31, 2011, the Company had foreign net operating loss carryforwards of approximately $3.1 billion that expire at various times beginning in 2012 and some of which carryforward without expiration, and tax credits available in foreign jurisdictions of approximately $23 million, $1 million of which expire in 2012 to 2014, $4 million of which expire in 2015 to 2022 and $18 million of which carryforward without expiration.
Valuation allowances decreased $374 million during 2011 to $0.9 billion at December 31, 2011. This net decrease was primarily the result of the release of a valuation allowance against certain foreign operating loss carryforwards which were written off in 2011 and a release of a valuation allowance at one of our Brazilian subsidiaries.
Valuation allowances decreased $322 million during 2010 to $1.3 billion at December 31, 2010. This net decrease was primarily the result of the release of valuation allowances against deferred tax assets at foreign subsidiaries.
The Company believes that it is more likely than not that the net deferred tax assets as shown below will be realized when future taxable income is generated through the reversal of existing taxable temporary differences and income that is expected to be generated by businesses that have long-term contracts or a history of generating taxable income. The Company continues to monitor the utilization of its deferred tax asset for its U.S. consolidated net operating loss carryforward. Although management believes it is more likely than not that this deferred tax asset will be realized through generation of sufficient taxable income prior to expiration of the loss carryforwards, such realization is not assured.
The following table summarizes the deferred tax assets and liabilities, as of December 31, 2011 and 2010:
| | | | | | | | |
| | | December 31, | |
| | | 2011 | | | 2010 | |
| | | (in millions) | |
Differences between book and tax basis of property | | $ | 1,895 | | | $ | 1,260 | |
Cumulative translation adjustment | | | 38 | | | | 94 | |
Other taxable temporary differences | | | 341 | | | | 390 | |
| | | | | | | | |
Total deferred tax liability | | | 2,274 | | | | 1,744 | |
| | | | | | | | |
| | |
Operating loss carryforwards | | | (1,482 | ) | | | (1,615 | ) |
Capital loss carryforwards | | | (112 | ) | | | (84 | ) |
Bad debt and other book provisions | | | (465 | ) | | | (522 | ) |
Retirement costs | | | (359 | ) | | | (313 | ) |
Tax credit carryforwards | | | (46 | ) | | | (52 | ) |
Other deductible temporary differences | | | (517 | ) | | | (390 | ) |
| | | | | | | | |
Total gross deferred tax asset | | | (2,981 | ) | | | (2,976 | ) |
| | | | | | | | |
Less: valuation allowance | | | 906 | | | | 1,280 | |
| | | | | | | | |
Total net deferred tax asset | | | (2,075 | ) | | | (1,696 | ) |
| | | | | | | | |
Net deferred tax (asset)/liability | | $ | 199 | | | $ | 48 | |
| | | | | | | | |
The Company considers undistributed earnings of certain foreign subsidiaries to be indefinitely reinvested outside of the United States and, accordingly, no U.S. deferred taxes have been recorded with respect to such earnings in accordance with the relevant accounting guidance for income taxes. Should the earnings be remitted as dividends, the Company may be subject to additional U.S. taxes, net of allowable foreign tax credits. It is not practicable to estimate the amount of any additional taxes which may be payable on the undistributed earnings.
Income from operations in certain countries is subject to reduced tax rates as a result of satisfying specific commitments regarding employment and capital investment. The Company’s income tax benefits related to the tax status of these operations are estimated to be $52 million, $60 million and $35 million for the years ended December 31, 2011, 2010 and 2009, respectively. The per share effect of these benefits after noncontrolling interests was $0.06, $0.07 and $0.04 for the year ended December 31, 2011, 2010 and 2009, respectively.
131
The following table summarizes the income (loss) from continuing operations, before income taxes, net equity in earnings of affiliates and noncontrolling interests, for the years ended December 31, 2011, 2010 and 2009:
| | | | | | | | | | | | |
| | | December 31, | |
| | | 2011 | | | 2010 | | | 2009 | |
| | | (in millions) | |
U.S. | | $ | (526 | ) | | $ | (539 | ) | | $ | (1,036 | ) |
Non-U.S. | | | 2,693 | | | | 2,392 | | | | 3,296 | |
| | | | | | | | | | | | |
Total | | $ | 2,167 | | | $ | 1,853 | | | $ | 2,260 | |
| | | | | | | | | | | | |
UNCERTAIN TAX POSITIONS
Uncertain tax positions have been classified as noncurrent income tax liabilities unless expected to be paid in one year. The Company’s policy for interest and penalties related to income tax exposures is to recognize interest and penalties as a component of the provision for income taxes in the Consolidated Statements of Operations.
As of December 31, 2011 and 2010, the total amount of gross accrued income tax related interest included in the Consolidated Balance Sheets was $15 million and $12 million, respectively. The total amount of gross accrued income tax related penalties included in the Consolidated Balance Sheets as of December 31, 2011 and 2010 was $4 million and $4 million, respectively.
The total expense (benefit) for interest related to unrecognized tax benefits for the years ended December 31, 2011, 2010 and 2009 amounted to $3 million, $(10) million and $4 million, respectively. For the years ended December 31, 2011, 2010 and 2009, the total expense (benefit) for penalties related to unrecognized tax benefits amounted to $0 million, $(1) million and $0 million, respectively.
We are potentially subject to income tax audits in numerous jurisdictions in the U.S. and internationally until the applicable statute of limitations expires. Tax audits by their nature are often complex and can require several years to complete. The following is a summary of tax years potentially subject to examination in the significant tax and business jurisdictions in which we operate:
| | |
Jurisdiction | | Tax Years
Subject to
Examination |
| |
Argentina | | 2005-2011 |
Brazil | | 2006-2011 |
Cameroon | | 2007-2011 |
Chile | | 1998-2011 |
Colombia | | 2008-2011 |
El Salvador | | 2008-2011 |
United Kingdom | | 2008-2011 |
United States (Federal) | | 1994-2011 |
As of December 31, 2011, 2010 and 2009, the total amount of unrecognized tax benefits was $471 million, $437 million and $510 million, respectively. The total amount of unrecognized tax benefits that would benefit the effective tax rate as of December 31, 2011, 2010 and 2009 is $424 million, $412 million and $484 million, respectively, of which $47 million, $51 million and $55 million, respectively, would be in the form of tax attributes that would warrant a full valuation allowance.
The total amount of unrecognized tax benefits anticipated to result in a net decrease to unrecognized tax benefits within 12 months of December 31, 2011 is estimated to be between $25 million and $34 million.
132
The following is a reconciliation of the beginning and ending amounts of unrecognized tax benefits for the years ended December 31, 2011, 2010 and 2009:
| | | | | | | | | | | | |
| | | 2011 | | | 2010 | | | 2009 | |
| | | (in millions) | |
Balance at January 1 | | $ | 437 | | | $ | 510 | | | $ | 554 | |
Additions for current year tax positions | | | 7 | | | | 14 | | | | 72 | |
Additions for tax positions of prior years | | | 49 | | | | 51 | | | | 7 | |
Reductions for tax positions of prior years | | | (18 | ) | | | (46 | ) | | | (9 | ) |
Effects of foreign currency translation | | | (1 | ) | | | (2 | ) | | | 6 | |
Settlements | | | — | | | | (67 | ) | | | (104 | ) |
Lapse of statute of limitations | | | (3 | ) | | | (23 | ) | | | (16 | ) |
| | | | | | | | | | | | |
Balance at December 31 | | $ | 471 | | | $ | 437 | | | $ | 510 | |
| | | | | | | | | | | | |
The amount of settlements of uncertain tax positions in 2009 was primarily the result of a non-cash audit settlement for $105 million at a Brazilian subsidiary which resulted in no tax expense or benefit.
The Company and certain of its subsidiaries are currently under examination by the relevant taxing authorities for various tax years. The Company regularly assesses the potential outcome of these examinations in each of the taxing jurisdictions when determining the adequacy of the amount of unrecognized tax benefit recorded. While it is often difficult to predict the final outcome or the timing of resolution of any particular uncertain tax position, we believe we have appropriately accrued for our uncertain tax benefits. However, audit outcomes and the timing of audit settlements and future events that would impact our previously recorded unrecognized tax benefits and the range of anticipated increases or decreases in unrecognized tax benefits are subject to significant uncertainty. It is possible that the ultimate outcome of current or future examinations may exceed our provision for current unrecognized tax benefits in amounts that could be material, but cannot be estimated as of December 31, 2011. Our effective tax rate and net income in any given future period could therefore be materially impacted.
22. DISCONTINUED OPERATIONS AND HELD FOR SALE BUSINESSES
On May 3, 2012, the Company filed its Quarterly Report on Form 10-Q for the quarter ended March 31, 2012 which reflected Red Oak and Ironwood as discontinued operations. As a result of the reclassification of these entities to discontinued operations in the consolidated financial statements for each of the three years in the period ended December 31, 2011, the Company has updated Notes 2, 3, 4, 11, 12, 13, 16, 19, 21, 22, 24, 27 and 28 to conform these notes to the revised financial statement presentation.
Discontinued operations include the results of the following businesses:
| | • | | Red Oak and Ironwood (held for sale in February 2012); |
| | • | | Argentina distribution businesses (sold in November 2011); |
| | • | | Eletropaulo Telecomunicacões Ltda. and AES Communications Rio de Janeiro S.A. (collectively, “Brazil Telecom”), our Brazil telecommunication businesses (sold in October 2011); |
| | • | | Carbon reduction projects (held for sale in December 2011); |
| | • | | Wind projects (abandoned in December 2011); |
| | • | | Eastern Energy in New York (held for sale in March 2011); |
| | • | | Borsod in Hungary (held for sale in March 2011); |
| | • | | Thames in Connecticut (disposed of in December 2011); |
| | • | | Barka in Oman (sold in August 2010); |
| | • | | Lal Pir and Pak Gen in Pakistan (sold in June 2010); and |
| | • | | Ras Laffan in Qatar (sold in October 2010). |
133
Information for businesses included in discontinued operations and the income (loss) on disposal and impairment on discontinued operations for the years ended December 31, 2011, 2010 and 2009 is provided in the tables below:
| | | | | | | | | | | | |
| | | Year ended December 31, | |
| | | 2011 | | | 2010 | | | 2009 | |
| | | (in millions) | |
Revenue | | $ | 631 | | | $ | 1,453 | | | $ | 1,715 | |
| | | | | | | | | | | | |
Income (loss) from operations of discontinued businesses, before taxes | | $ | (113 | ) | | $ | (732 | ) | | $ | 155 | |
Income tax (expense) benefit | | | 23 | | | | 266 | | | | (48 | ) |
| | | | | | | | | | | | |
Income (loss) from operations of discontinued businesses, after taxes | | $ | (90 | ) | | $ | (466 | ) | | $ | 107 | |
| | | | | | | | | | | | |
Gain (loss) on disposal of discontinued businesses, after taxes | | $ | 86 | | | $ | 64 | | | $ | (150 | ) |
| | | | | | | | | | | | |
Gain (Loss) on Disposal of Discontinued Businesses
| | | | | | | | | | | | |
| | | Year ended December 31, | |
Subsidiary | | 2011 | | | 2010 | | | 2009 | |
| | | (in millions) | |
Argentina distribution businesses | | $ | (338 | ) | | $ | — | | | $ | — | |
Brazil Telecom | | | 446 | | | | — | | | | — | |
Wind projects | | | (22 | ) | | | — | | | | — | |
Barka | | | — | | | | 80 | | | | — | |
Lal Pir | | | — | | | | (6 | ) | | | (74 | ) |
Pak Gen | | | — | | | | (16 | ) | | | (76 | ) |
Ras Laffan | | | — | | | | 6 | | | | — | |
| | | | | | | | | | | | |
Gain (loss) on disposal, after taxes | | $ | 86 | | | $ | 64 | | | $ | (150 | ) |
| | | | | | | | | | | | |
Red Oak—In February 2012, a subsidiary of the Company signed a sale agreement with a newly-formed portfolio company of Energy Capital Partners II, LP for the sale of 100% of its membership interest in AES Red Oak, LLC and AES Sayreville, two wholly-owned subsidiaries, that hold the Company’s interest in Red Oak for $147 million, subject to customary purchase price adjustments. The transaction closed on April 12, 2012 and the Company expects to recognize a pretax gain in the second quarter of 2012. Red Oak was previously reported in the North America Generation segment.
Ironwood—In February 2012, a subsidiary of the Company signed a sale agreement with an indirect wholly-owned subsidiary of PPL Corporation for the sale of 100% of its equity interest in AES Ironwood, Inc., a wholly-owned subsidiary, that holds the Company’s interest in Ironwood for $87 million, subject to customary purchase price adjustments. The transaction closed on April 13, 2012 and the Company expects to recognize a pretax gain in the second quarter of 2012. Ironwood was previously reported in the North America Generation segment.
Argentina distribution businesses—On November 17, 2011, the Company completed the sale of its 90% equity interest in Edelap and Edes, two distribution companies in Argentina serving approximately 329,000 and 172,000 customers, respectively, and its 51% equity interest in Central Dique, a 68 MW gas and diesel generation plant (collectively, “Argentina distribution businesses”) in Argentina. Net proceeds from the sale were approximately $4 million. The Company recognized a loss on disposal of $338 million, net of tax, including $208 million due to the recognition of cumulative translation losses. These businesses were previously reported in the Latin America Utilities segment.
Brazil Telecom—In October 2011, a subsidiary of the Company completed the sale of its ownership interest in two telecommunication companies in Brazil. The Company held approximately 46% ownership interest in these companies through the subsidiary. The subsidiary received net proceeds of approximately $893 million. The gain on sale was approximately $446 million, net of tax. These businesses were previously reported in the Latin America Utilities segment.
Carbon reduction projects—In December 2011, the Company’s board of directors approved plans to sell its 100% equity interests in its carbon reduction businesses in Asia and Latin America. The aggregate carrying amount of $49 million of these projects was written down as their estimated fair value was considered zero, resulting in a pre-tax impairment expense of $40 million, which is included in income from operations of discontinued businesses. The impairment expense recognized was limited to the carrying amounts of the individual assets within the asset group, where the fair value was greater than the carrying amount. When the disposal group met the held for sale criteria, the disposal group was measured at the lower of carrying amount or fair value less cost to sell. Carbon reduction projects were previously reported in “Corporate and Other”.
134
Wind projects—In the fourth quarter of 2011, the Company determined that it would no longer pursue certain development projects in Poland and the United Kingdom due to revisions in its growth strategy. As a result, the Company abandoned these projects and recognized the related project development rights, which were previously included in intangible assets, as a loss on disposal of discontinued operations of $22 million, net of tax. These wind projects were previously reported in “Corporate and Other”.
Eastern Energy—In March 2011, AES Eastern Energy (“AEE”) met the held for sale criteria and was reclassified from continuing operations to held for sale. AEE operates four coal-fired power plants: Cayuga, Greenidge, Somerset and Westover, representing generation capacity of 1,169 MW in the western New York power market. In 2010, AEE had recognized a pre-tax impairment expense of $827 million due to adverse market conditions. AEE along with certain of its affiliates is currently under bankruptcy protection and is recorded as a cost method investment. See Note 1—General and Summary of Significant Accounting Policies for further information. AEE was previously reported in the North America Generation segment.
Borsod—In March 2011, Borsod, which holds two coal/biomass-fired generation plants in Hungary with generating capacity of 161 MW, met the held for sale criteria and was reclassified from continuing operations to held for sale. Borsod is currently under liquidation and is recorded as a cost method investment. See Note 1—General and Summary of Significant Accounting Policies for further information. Borsod was previously reported in the Europe Generation segment.
Thames—In December 2011, Thames, a 208 MW coal-fired plant in Connecticut, met the discontinued operations criteria and its operating results were retrospectively reflected as discontinued operations. Thames is currently under liquidation and is recorded as a cost method investment with the historical operating results reflected in discontinued operations. See Note 1—General and Summary of Significant Accounting Policies for further information. Thames was previously reported in the North America Generation segment.
Barka—On August 19, 2010, the Company completed the sale of its 35% ownership interest in Barka, a 456 MW combined cycle gas facility and water desalination plant in Oman, and its 100% interest in two Barka related service companies. Total consideration received in the transaction was approximately $170 million, of which $124 million was AES’ portion. The Company recognized a gain on disposal of $80 million, net of tax, during the year ended December 31, 2010. Barka was previously reported in the Asia Generation segment.
Lal Pir and Pak Gen—On June 11, 2010, the Company completed the sale of its 55% ownership in Lal Pir and Pak Gen, two oil-fired facilities in Pakistan with respective generation capacities of 362 MW and 365 MW. Total consideration received in the transaction was approximately $117 million, of which $65 million was AES’ portion. The Company recognized a loss on disposal of $150 million, net of tax, during the year ended December 31, 2009 and impairment losses totaling $22 million, net of tax, during the year ended December 31, 2010 to reflect the change in the carrying value of net assets of Lal Pir and Pak Gen subsequent to meeting the held for sale criteria as of December 31, 2009. These businesses were previously reported in the Asia Generation segment.
Ras Laffan—On October 20, 2010, the Company completed the sale of its 55% equity interest in Ras Laffan, a 756 MW combined cycle gas plant and a water desalination facility in Qatar, and the associated operations company for an aggregate proceeds of approximately $234 million. The Company recognized a gain on disposal of $6 million, net of tax, during the year ended December 31, 2010. Ras Laffan was previously reported in the Asia Generation segment.
23. ACQUISITIONS AND DISPOSITIONS
Acquisitions
DPL—On November 28, 2011, AES completed its acquisition of 100% of the common stock of DPL for approximately $3.5 billion, pursuant to the terms and conditions of a definitive agreement (the “Merger Agreement”) dated April 19, 2011. DPL serves over 500,000 customers, primarily West Central Ohio, through its operating subsidiaries DP&L and DPL Energy Resources (“DPLER”). Additionally, DPL operates over 3,800 MW of power generation facilities and provides competitive retail energy services to residential, commercial, industrial and governmental customers. The Acquisition strengthens the Company’s U.S. utility operations by expanding in the Midwest and PJM, a regional transmission organization serving several eastern states as part of the Eastern Interconnection. The Company expects to benefit from the regional scale provided by Indianapolis Power & Light Company, its nearby integrated utility business in Indiana. AES funded the aggregate purchase consideration through a combination of the following:
| | • | | the proceeds from a $1.05 billion term loan obtained in May 2011; |
135
| | • | | the proceeds from a private offering of $1.0 billion notes in June 2011; |
| | • | | temporary borrowings of $251 million under its revolving credit facility; and |
| | • | | the proceeds from private offerings of $450 million aggregate principal amount of 6.50% senior notes due 2016 and $800 million aggregate principal amount of 7.25% senior notes due 2021 (collectively, the “Notes”) in October 2011 by Dolphin Subsidiary II, Inc. (“Dolphin II”), a wholly-owned special purpose indirect subsidiary of AES, which was merged into DPL upon the completion of acquisition. |
The fair value of the consideration paid for DPL was as follows (in millions):
| | | | |
Agreed enterprise value | | $ | 4,719 | |
Less: fair value of assumed long-term debt outstanding, net | | | (1,255 | ) |
| | | | |
Cash consideration paid to DPL’s common stockholders | | | 3,464 | |
Add: cash paid for outstanding stock-based awards | | | 19 | |
| | | | |
Total cash consideration paid | | $ | 3,483 | |
| | | | |
The preliminary allocation of the purchase price to the fair value of assets acquired and liabilities assumed is as follows (in millions):
| | | | |
Cash | | $ | 116 | |
Accounts receivable | | | 278 | |
Inventory | | | 124 | |
Other current assets | | | 41 | |
Property, plant and equipment | | | 2,549 | |
Intangible assets subject to amortization | | | 166 | |
Intangible assets - indefinite-lived | | | 5 | |
Regulatory assets | | | 201 | |
Other noncurrent assets | | | 58 | |
Current liabilities | | | (401 | ) |
Non-recourse debt | | | (1,255 | ) |
Deferred taxes | | | (558 | ) |
Regulatory liabilities | | | (117 | ) |
Other noncurrent liabilities | | | (195 | ) |
Redeemable preferred stock | | | (18 | ) |
| | | | |
Net identifiable assets acquired | | | 994 | |
Goodwill | | | 2,489 | |
| | | | |
Net assets acquired | | $ | 3,483 | |
| | | | |
At December 31, 2011, the assets acquired and liabilities assumed in the acquisition were recorded at provisional amounts based on the preliminary purchase price allocation. The Company is in the process of obtaining additional information to identify and measure all assets acquired and liabilities assumed in the acquisition within the measurement period, which could be up to one year from the date of acquisition. Such provisional amounts will be retrospectively adjusted to reflect any new information about facts and circumstances that existed at the acquisition date that, if known, would have affected the measurement of these amounts. Additionally, key input assumptions and their sensitivity to the valuation of assets acquired and liabilities assumed are currently being reviewed by management. It is likely that the value of the generation business related property, plant and equipment, the intangible asset related to the Electric Security Plan with its regulated customers and long-term coal contracts, the 4.9% equity ownership interest in the Ohio Valley Electric Corporation, and deferred taxes could change as the valuation process is finalized. DPLER, DPL’s wholly-owned Competitive Retail Electric Service (“CRES”) provider, will also likely have changes in its initial purchase price allocation for the valuation of its intangible assets for the trade name, and customer relationships and contracts.
136
As noted in the table above, the preliminary purchase price allocation has resulted in the recognition of $ 2.5 billion of goodwill. Factors primarily contributing to a price in excess of the fair value of the net tangible and intangible assets include, but are not limited to: the ability to expand the U.S. utility platform in the Mid-West market, the ability to capitalize on utility management experience gained from IPL, enhanced ability to negotiate with suppliers of fuel and energy, the ability to capture value associated with AES’ U.S. tax position, a well-positioned generating fleet, the ability of DPL to leverage its assembled workforce to take advantage of growth opportunities, etc. Our ability to realize the benefit of DPL’s goodwill depends on the realization of expected benefits resulting from a successful integration of DPL into AES’ existing operations and our ability to respond to the changes in the Ohio utility market. For example, utilities in Ohio continue to face downward pressure on operating margins due to the evolving regulatory environment, which is moving towards a market-based competitive pricing mechanism. At the same time, the declining energy prices are also reducing operating margins across the utility industry. These competitive forces could adversely impact the future operating performance of DPL and may result in impairment of its goodwill. Goodwill resulting from the acquisition has been assigned to two reporting units identified within DPL (i.e., DP&L, the regulated utility component and DPLER, the competitive retail component). However, the majority of the goodwill has been assigned to DP&L. DPL has been included in the North America Utility segment, which is primarily expected to benefit from the acquisition.
Actual DPL revenue and net income attributable to The AES Corporation included in AES’ Consolidated Statement of Operations for the year ended December 31, 2011, and AES’ unaudited pro forma 2011 and 2010 revenue and net income attributable to AES, including DPL, as if the acquisition had occurred January 1, 2010, are as follows:
| | | | | | | | |
| | | Revenue | | | Net Income (Loss)
Attributable to The
AES Corporation | |
| | | (in millions) | |
Actual from November 28, 2011 - December 31, 2011 | | $ | 154 | | | $ | (6 | ) |
Pro forma for 2011 (unaudited) | | $ | 18,945 | | | $ | 116 | |
Pro forma for 2010 (unaudited) | | $ | 17,659 | | | $ | 101 | |
The pro forma financial information has been presented for illustrative purposes only and is not necessarily indicative of the results of operations that would have been achieved had the acquisition been completed on the dates indicated, or the future consolidated results of operations of AES.
Net income attributable to The AES Corporation in the table above has been reduced by the net of tax impact of pro forma adjustments of $92 million and $198 million for the years ended December 31, 2011 and 2010, respectively. These pro forma adjustments primarily include: the amortization of fair value adjustment of DPL’s generation plant and equipment and intangible assets subject to amortization; interest expense on additional borrowings made to finance the acquisition; third-party acquisition-related costs (primarily investment banking, advisory, accounting and legal fees); and a reversal of bridge financing costs incurred in connection with the acquisition.
Ballylumford—In the second quarter of 2011, the Company finalized the purchase price allocation related to the acquisition of Ballylumford. There were no significant adjustments made to the preliminary purchase price allocation recorded in the third quarter of 2010 when the acquisition was completed.
Dispositions
Cartagena—On February 9, 2012, a subsidiary of the Company completed the sale of 80% of its interest in the wholly-owned holding company of AES Energia Cartagena S.R.L. (“AES Cartagena”), a 1,199 MW gas-fired generation business in Spain. AES owned approximately 71% of AES Cartagena through this holding company structure. Net proceeds from the sale were approximately €172 million ($229 million). Under the terms of the sale agreement, Electrabel International Holdings B.V., the buyer (a subsidiary of GDF SUEZ S.A. or “GDFS”), has an option to purchase AES’ remaining 20% interest in the holding company for a fixed price of €28 million ($36 million) during a five month period beginning 13 months from February 9, 2012. Concurrent with the sale, GDFS settled the outstanding arbitration between the parties regarding certain emissions costs and other taxes that AES Cartagena sought to recover from GDFS as energy manager under the existing commercial arrangements. GDFS agreed to pay €71 million ($92 million) to AES Cartagena for such costs incurred by AES Cartagena for 2008—
137
2010 period and for 2011 through the date of sale close, of which €28 million ($38 million) was paid at closing. See Item 3—Legal Proceedingsof this Form 8-K for further information. Due to the Company’s expected continuing ownership interest extending beyond one year from the completion of the sale of its 80% interest, prior period operating results of AES Cartagena have not been reclassified as discontinued operations.
Ekibastuz and Maikuben—In 2009, the Company recognized $80 million performance incentive bonus as “Other income” and $98.5 million upon termination of a management agreement as “Gain on sale of investments.” These amounts related to the sale of two wholly-owned subsidiaries in Kazakhstan: Ekibastuz, a coal-fired generation plant, and Maikuben, a coal mine, which the Company had previously completed in 2008. Due to the Company’s continuing involvement in the operations of these businesses extending beyond one year, their prior period operating results were not reclassified as discontinued operations. Excluding the amounts mentioned above, Ekibastuz and Maikuben generated no revenue or net income in 2011, 2010 and 2009.
24. EARNINGS PER SHARE
Basic and diluted earnings per share are based on the weighted average number of shares of common stock and potential common stock outstanding during the period. Potential common stock, for purposes of determining diluted earnings per share, includes the effects of dilutive restricted stock units, stock options and convertible securities. The effect of such potential common stock is computed using the treasury stock method or the if-converted method, as applicable.
The following table presents a reconciliation of the numerators and denominators of the basic and diluted earnings per share computations for income from continuing operations. In the table below, income represents the numerator (in millions) and shares represent the denominator (in millions):
| | | | | | | | | | | | | | | | | | | | | | | | | | | | | | | | | | | | |
| | | December 31, 2011 | | | December 31, 2010 | | | December 31, 2009 | |
| | | Income | | | Shares | | | $ per
Share | | | Income | | | Shares | | | $ per
Share | | | Income | | | Shares | | | $ per
Share | |
BASIC EARNINGS PER SHARE | | | | | | | | | | | | | | | | | | | | | | | | | | | | | | | | | | | | |
Income from continuing operations attributable to The AES Corporation common stockholders | | $ | 451 | | | | 778 | | | $ | 0.58 | | | $ | 476 | | | | 769 | | | $ | 0.62 | | | $ | 718 | | | | 667 | | | $ | 1.08 | |
EFFECT OF DILUTIVE SECURITIES | | | | | | | | | | | | | | | | | | | | | | | | | | | | | | | | | | | | |
Stock options | | | — | | | | 2 | | | | — | | | | — | | | | 2 | | | | — | | | | — | | | | 1 | | | | — | |
Restricted stock units | | | — | | | | 3 | | | | — | | | | — | | | | 3 | | | | — | | | | — | | | | 2 | | | | (0.01 | ) |
| | | | | | | | | | | | | | | | | | | | | | | | | | | | | | | | | | | | |
DILUTED EARNINGS PER SHARE | | $ | 451 | | | | 783 | | | $ | 0.58 | | | $ | 476 | | | | 774 | | | $ | 0.62 | | | $ | 718 | | | | 670 | | | $ | 1.07 | |
| | | | | | | | | | | | | | | | | | | | | | | | | | | | | | | | | | | | |
The calculation of diluted earnings per share excluded 6,479,841, 16,618,137 and 18,035,813 options outstanding at December 31, 2011, 2010 and 2009, respectively, that could potentially dilute basic earnings per share in the future. Those options were not included in the computation of diluted earnings per share because the exercise price of those options exceeded the average market price during the related period. In 2011, 2010 and 2009, all convertible debentures were omitted from the earnings per share calculation because they were antidilutive. In arriving at income attributable to AES Corporation common stockholders in computing basic earnings per share, dividends on preferred stock of our subsidiary were deducted.
In addition, on March 15, 2010, the Company issued 125,468,788 shares of common stock to an investor as described in Note 15—Equity.
25. RISKS AND UNCERTAINTIES
AES is a global power producer in 28 countries on five continents. See additional discussion of the Company’s principal markets in Note 16—Segment and Geographic Information. Our principal lines of business are Generation and Utilities. The Generation line of business uses a wide range of technologies, including coal, gas, hydroelectric, and biomass as fuel to generate electricity. Our Utilities business is comprised of businesses that transmit, distribute, and in certain circumstances, generate power. In addition, the Company has operations in the renewables area. These efforts include projects primarily in wind and solar.
OPERATING AND ECONOMIC RISKS—The Company operates in several developing economies where economic downturns could have a significant impact on the overall macroeconomic conditions including the
138
valuation of businesses. Deteriorating market conditions often expose the Company to the risk of decreased earnings and cash flows due to, among other factors, adverse fluctuations in the commodities and foreign currency spot markets. Additionally, credit markets around the globe continue to tighten their standards, which could impact our ability to finance growth projects through access to capital markets. Currently, the Company has a below-investment grade rating from Standard & Poor’s of BB-. This may limit the ability of the Company to finance new and existing development projects to cash currently available on hand and through reinvestment of earnings. As of December 31, 2011, the Company had $1.7 billion of unrestricted cash and cash equivalents.
During 2011, approximately 88% of our revenue, and 41% of our revenue from discontinued businesses, was generated outside the United States and a significant portion of our international operations is conducted in developing countries. We continue to invest in projects in developing countries because the growth rates and the opportunity to implement operating improvements and achieve higher operating margins may be greater than those typically achievable in more developed countries. International operations, particularly the operation, financing and development of projects in developing countries, entail significant risks and uncertainties, including, without limitation:
| | • | | economic, social and political instability in any particular country or region; |
| | • | | inability to economically hedge energy prices; |
| | • | | volatility in commodity prices; |
| | • | | adverse changes in currency exchange rates; |
| | • | | government restrictions on converting currencies or repatriating funds; |
| | • | | unexpected changes in foreign laws and regulations or in trade, monetary or fiscal policies; |
| | • | | high inflation and monetary fluctuations; |
| | • | | restrictions on imports of coal, oil, gas or other raw materials required by our generation businesses to operate; |
| | • | | threatened or consummated expropriation or nationalization of our assets by foreign governments; |
| | • | | unwillingness of governments, government agencies, similar organizations or other counterparties to honor their commitments; |
| | • | | unwillingness of governments, government agencies, courts or similar bodies to enforce contracts that are economically advantageous to subsidiaries of the Company and economically unfavorable to counterparties, against such counterparties, whether such counterparties are governments or private parties; |
| | • | | inability to obtain access to fair and equitable political, regulatory, administrative and legal systems; |
| | • | | adverse changes in government tax policy; |
| | • | | difficulties in enforcing our contractual rights or enforcing judgments or obtaining a just result in local jurisdictions; and |
| | • | | potentially adverse tax consequences of operating in multiple jurisdictions. |
Any of these factors, individually or in combination with others, could materially and adversely affect our business, results of operations and financial condition. In addition, our Latin American operations experience volatility in revenue and earnings which have caused and are expected to cause significant volatility in our results of operations and cash flows. The volatility is caused by regulatory and economic difficulties, political instability, indexation of certain PPAs to fuel prices, and currency fluctuations being experienced in many of these countries. This volatility reduces the predictability and enhances the uncertainty associated with cash flows from these businesses.
139
Our inability to predict, influence or respond appropriately to changes in law or regulatory schemes, including any inability to obtain reasonable increases in tariffs or tariff adjustments for increased expenses, could adversely impact our results of operations or our ability to meet publicly announced projections or analysts’ expectations. Furthermore, changes in laws or regulations or changes in the application or interpretation of regulatory provisions in jurisdictions where we operate, particularly our Utilities businesses where electricity tariffs are subject to regulatory review or approval, could adversely affect our business, including, but not limited to:
| | • | | changes in the determination, definition or classification of costs to be included as reimbursable or pass-through costs; |
| | • | | changes in the definition or determination of controllable or noncontrollable costs; |
| | • | | adverse changes in tax law; |
| | • | | changes in the definition of events which may or may not qualify as changes in economic equilibrium; |
| | • | | changes in the timing of tariff increases; |
| | • | | other changes in the regulatory determinations under the relevant concessions; or |
| | • | | changes in environmental regulations, including regulations relating to GHG emissions in any of our businesses. |
Any of the above events may result in lower margins for the affected businesses, which can adversely affect our results of operations.
FOREIGN CURRENCY RISKS—AES operates businesses in many foreign countries and such operations may be impacted by significant fluctuations in foreign currency exchange rates. The Company’s financial position and results of operations have been significantly affected by fluctuations in the value of the Brazilian real, the Argentine peso, the Dominican Republic peso, the Euro, the Chilean peso, the Colombian peso and the Philippine peso relative to the U.S. Dollar.
CONCENTRATIONS—The Company does not have any significant concentration of customers and the sources of fuel supply. Although the Company operates in primarily two lines of business, its operations are very diversified geographically. Several of the Company’s generation businesses rely on PPAs with one or a limited number of customers for the majority of, and in some case all of, the relevant business’ output over the term of the PPAs. However, no single customer accounted for 10% or more of total revenue in 2011, 2010 or 2009.
The cash flows and results of operations of our businesses are dependent on the credit quality of their customers and the continued ability of their customers and suppliers to meet their obligations under PPAs and fuel supply agreements. If a substantial portion of the Company’s long-term PPAs and/or fuel supply were modified or terminated, the Company would be adversely affected to the extent that it was unable to replace such contracts at equally favorable terms.
26. RELATED PARTY TRANSACTIONS
Our generation businesses in Panama are partially owned by the Government of Panama (the “Panamanian Government”). The Panamanian Government, in turn, partially owns the distribution companies within Panama. For the years ended December 31, 2011, 2010 and 2009, our Panamanian businesses recognized electricity sales to the Panamanian Government totaling $144 million, $146 million and $143 million, respectively. For the same period, our Panamanian businesses purchased electricity, which excludes transmission charges from the Panamanian Government, totaling $65 million, $21 million and $25 million, respectively. As of December 31, 2011 and 2010, our Panamanian businesses owed the Panamanian Government $1 million and $4 million, respectively, payable on normal trade terms. For the same period, the Panamanian Government owed our Panamanian businesses $19 million and $12 million, respectively, payable on normal trade terms.
Our generation businesses in the Dominican Republic are partially owned by the Government of the Dominican Republic (the “Dominican Government”). The Dominican Government, in turn, owns the distribution companies within the Dominican Republic. For the years ended December 31, 2011, 2010 and 2009, our Dominican Republic businesses recognized electricity sales to the Dominican Government totaling $227 million, $179 million and $204 million, respectively. For the same period, the Dominican Government owed our Dominican Republic businesses $100 million and $88 million, respectively, payable on normal trade terms.
During the year, the Company sold 19% of its interest in Mong Duong to Stable Investment Corporation, a subsidiary of China Investment Corporation. See Note 15—Equity for further information.
140
27. SELECTED QUARTERLY FINANCIAL DATA (UNAUDITED)
Quarterly Financial Data
The following tables summarize the unaudited quarterly statements of operations for the Company for 2011 and 2010. Amounts have been restated to reflect discontinued operations in all periods presented and reflect all adjustments necessary in the opinion of management for a fair statement of the results for interim periods.
| | | | | | | | | | | | | | | | |
| | | Quarter Ended 2011 | |
| | | Mar 31 | | | June 30 | | | Sept 30 | | | Dec 31(1) | |
| | | (in millions, except per share data) | |
Revenue | | $ | 4,156 | | | $ | 4,435 | | | $ | 4,307 | | | $ | 4,230 | |
| | | | | | | | | | | | | | | | |
Gross margin | | | 993 | | | | 992 | | | | 1,010 | | | | 1,075 | |
| | | | | | | | | | | | | | | | |
Income from continuing operations, net of tax(2) | | | 490 | | | | 436 | | | | 203 | | | | 405 | |
Discontinued operations, net of tax | | | (7 | ) | | | (9 | ) | | | (28 | ) | | | 40 | |
| | | | | | | | | | | | | | | | |
Net income | | $ | 483 | | | $ | 427 | | | $ | 175 | | | $ | 445 | |
| | | | | | | | | | | | | | | | |
Net income (loss) attributable to The AES Corporation | | $ | 224 | | | $ | 174 | | | $ | (131 | ) | | $ | (209 | ) |
| | | | | | | | | | | | | | | | |
| | | | |
Basic income (loss) per share: | | | | | | | | | | | | | | | | |
Income from continuing operations attributable to The AES Corporation, net of tax | | $ | 0.30 | | | $ | 0.24 | | | $ | (0.09 | ) | | $ | 0.12 | |
Discontinued operations attributable to The AES Corporation, net of tax | | | (0.02 | ) | | | (0.02 | ) | | | (0.08 | ) | | | (0.39 | ) |
| | | | | | | | | | | | | | | | |
Basic income (loss) per share attributable to The AES Corporation | | $ | 0.28 | | | $ | 0.22 | | | $ | (0.17 | ) | | $ | (0.27 | ) |
| | | | | | | | | | | | | | | | |
| | | | |
Diluted income (loss) per share: | | | | | | | | | | | | | | | | |
Income from continuing operations attributable to The AES Corporation, net of tax | | $ | 0.30 | | | $ | 0.24 | | | $ | (0.09 | ) | | $ | 0.12 | |
Discontinued operations attributable to The AES Corporation, net of tax | | | (0.02 | ) | | | (0.02 | ) | | | (0.08 | ) | | | (0.39 | ) |
| | | | | | | | | | | | | | | | |
Diluted income (loss) per share attributable to The AES Corporation | | $ | 0.28 | | | $ | 0.22 | | | $ | (0.17 | ) | | $ | (0.27 | ) |
| | | | | | | | | | | | | | | | |
| | | | | | | | | | | | | | | | |
| | | Quarter Ended 2010 | |
| | | Mar 31 | | | June 30 | | | Sept 30 | | | Dec 31 | |
| | | (in millions, except per share data) | |
Revenue | | $ | 3,805 | | | $ | 3,803 | | | $ | 3,885 | | | $ | 4,192 | |
| | | | | | | | | | | | | | | | |
Gross margin | | | 943 | | | | 976 | | | | 944 | | | | 1,008 | |
| | | | | | | | | | | | | | | | |
Income from continuing operations, net of tax(3) | | | 379 | | | | 423 | | | | 281 | | | | 378 | |
Discontinued operations, net of tax | | | 23 | | | | 6 | | | | 116 | | | | (547 | ) |
| | | | | | | | | | | | | | | | |
Net income | | $ | 402 | | | $ | 429 | | | $ | 397 | | | $ | (169 | ) |
| | | | | | | | | | | | | | | | |
Net income (loss) attributable to The AES Corporation | | $ | 187 | | | $ | 144 | | | $ | 114 | | | $ | (436 | ) |
| | | | | | | | | | | | | | | | |
| | | | |
Basic income (loss) per share: | | | | | | | | | | | | | | | | |
Income from continuing operations attributable to The AES Corporation, net of tax | | $ | 0.25 | | | $ | 0.19 | | | $ | 0.04 | | | $ | 0.15 | |
Discontinued operations attributable to The AES Corporation, net of tax | | | 0.02 | | | | (0.01 | ) | | | 0.10 | | | | (0.70 | ) |
| | | | | | | | | | | | | | | | |
Basic income (loss) per share attributable to The AES Corporation | | $ | 0.27 | | | $ | 0.18 | | | $ | 0.14 | | | $ | (0.55 | ) |
| | | | | | | | | | | | | | | | |
| | | | |
Diluted income (loss) per share: | | | | | | | | | | | | | | | | |
Income from continuing operations attributable to The AES Corporation, net of tax | | $ | 0.25 | | | $ | 0.19 | | | $ | 0.04 | | | $ | 0.15 | |
Discontinued operations attributable to The AES Corporation, net of tax | | | 0.02 | | | | (0.01 | ) | | | 0.10 | | | | (0.70 | ) |
| | | | | | | | | | | | | | | | |
Diluted income (loss) per share attributable to The AES Corporation | | $ | 0.27 | | | $ | 0.18 | | | $ | 0.14 | | | $ | (0.55 | ) |
| | | | | | | | | | | | | | | | |
141
| (1) | DPL was acquired on November 28, 2011 and its results of operations have been included in AES’ consolidated results of operations from the date of acquisition. See Note 23—Acquisitions and Dispositions for further information. |
| (2) | Includes pretax impairment expense of $33 million, $147 million and $62 million, for the second, third and fourth quarters of 2011, respectively. See Note 20—Impairment Expense and Note 9—Goodwill and Other Intangible Assets for additional discussion on these impairment expenses. |
| (3) | Includes pretax impairment expense of $315 million and $95 million, for the third and fourth quarters of 2010, respectively. See Note 20—Impairment Expense and Note 9—Goodwill and Other Intangible Assets for additional discussion on these impairment expenses. |
28. SUBSEQUENT EVENTS
Cartagena—The partial sale of Company’s interest in Cartagena was completed on February 9, 2012. See Note 23—Acquisitions and Dispositions for further information.
Red Oak and Ironwood—In February 2012, the Company entered into agreements to sell its interest in Red Oak and Ironwood. See Note 22—Discontinued Operations and Held for Sale Businesses for further information.
142
THE AES CORPORATION
SCHEDULE I CONDENSED FINANCIAL INFORMATION OF REGISTRANT
UNCONSOLIDATED BALANCE SHEETS
| | | | | | | | |
| | | December 31, | |
| | | 2011 | | | 2010 | |
| | | (in millions) | |
| ASSETS | | | | | | | | |
Current Assets: | | | | | | | | |
Cash and cash equivalents | | $ | 189 | | | $ | 594 | |
Restricted cash | | | 50 | | | | 10 | |
Accounts and notes receivable from subsidiaries | | | 871 | | | | 839 | |
Deferred income taxes | | | 24 | | | | 23 | |
Prepaid expenses and other current assets | | | 43 | | | | 31 | |
| | | | | | | | |
Total current assets | | | 1,177 | | | | 1,497 | |
Investment in and advances to subsidiaries and affiliates | | | 12,088 | | | | 10,741 | |
Office Equipment: | | | | | | | | |
Cost | | | 81 | | | | 93 | |
Accumulated depreciation | | | (67 | ) | | | (59 | ) |
| | | | | | | | |
Office equipment, net | | | 14 | | | | 34 | |
Other Assets: | | | | | | | | |
Deferred financing costs (net of accumulated amortization of $74 and $39, respectively) | | | 92 | | | | 64 | |
Deferred income taxes | | | 525 | | | | 352 | |
Debt service reserves and other deposits | | | 222 | | | | 1 | |
| | | | | | | | |
Total other assets | | | 839 | | | | 417 | |
| | | | | | | | |
Total | | $ | 14,118 | | | $ | 12,689 | |
| | | | | | | | |
| LIABILITIES AND STOCKHOLDERS’ EQUITY | | | | | | | | |
Current Liabilities: | | | | | | | | |
Accounts payable | | $ | 21 | | | $ | 14 | |
Accounts and notes payable to subsidiaries | | | 317 | | | | 253 | |
Accrued and other liabilities | | | 199 | | | | 175 | |
Term loan | | | — | | | | 200 | |
Senior notes payable - current portion | | | 305 | | | | 263 | |
| | | | | | | | |
Total current liabilities | | | 842 | | | | 905 | |
Long-term Liabilities: | | | | | | | | |
Senior notes payable | | | 5,663 | | | | 3,632 | |
Junior subordinated notes and debentures payable | | | 517 | | | | 517 | |
Accounts and notes payable to subsidiaries | | | 1,007 | | | | 1,055 | |
Other long-term liabilities | | | 143 | | | | 107 | |
| | | | | | | | |
Total long-term liabilities | | | 7,330 | | | | 5,311 | |
Stockholders’ equity: | | | | | | | | |
Common stock | | | 8 | | | | 8 | |
Additional paid-in capital | | | 8,507 | | | | 8,444 | |
Retained earnings | | | 678 | | | | 620 | |
Accumulated other comprehensive loss | | | (2,758 | ) | | | (2,383 | ) |
Treasury stock | | | (489 | ) | | | (216 | ) |
| | | | | | | | |
Total stockholders’ equity | | | 5,946 | | | | 6,473 | |
| | | | | | | | |
Total | | $ | 14,118 | | | $ | 12,689 | |
| | | | | | | | |
See Notes to Schedule I
THE AES CORPORATION
SCHEDULE I CONDENSED FINANCIAL INFORMATION OF REGISTRANT
STATEMENTS OF UNCONSOLIDATED OPERATIONS
| | | | | | | | | | | | |
| | | For the Years Ended December 31 | |
| | | 2011 | | | 2010 | | | 2009 | |
| | | (in millions) | |
Revenues from subsidiaries and affiliates | | $ | 59 | | | $ | 34 | | | $ | 39 | |
Equity in earnings of subsidiaries and affiliates | | | 357 | | | | 590 | | | | 983 | |
Interest income | | | 199 | | | | 279 | | | | 131 | |
General and administrative expenses | | | (241 | ) | | | (261 | ) | | | (218 | ) |
Interest expense | | | (490 | ) | | | (461 | ) | | | (485 | ) |
| | | | | | | | | | | | |
Income before income taxes | | | (116 | ) | | | 181 | | | | 450 | |
Income tax benefit (expense) | | | 174 | | | | (172 | ) | | | 208 | |
| | | | | | | | | | | | |
Net income | | $ | 58 | | | $ | 9 | | | $ | 658 | |
| | | | | | | | | | | | |
See Notes to Schedule I
THE AES CORPORATION
SCHEDULE I CONDENSED FINANCIAL INFORMATION OF REGISTRANT
STATEMENTS OF UNCONSOLIDATED COMPREHENSIVE INCOME
YEARS ENDED DECEMBER 31, 2011, 2010, AND 2009
| | | | | | | | | | | | |
| | | 2011 | | | 2010 | | | 2009 | |
| | | (in millions) | |
NET INCOME | | $ | 58 | | | $ | 9 | | | $ | 658 | |
Available-for-sale securities activity: | | | | | | | | | | | | |
Change in fair value of available-for-sale securities, net of income tax (expense) benefit of $0, $3 and $(4), respectively | | | 1 | | | | (5 | ) | | | 8 | |
Reclassification to earnings, net of income tax (expense) benefit of $0, $0 and $0, respectively | | | (2 | ) | | | — | | | | (2 | ) |
| | | | | | | | | | | | |
Total change in fair value of available-for-sale securities | | | (1 | ) | | | (5 | ) | | | 6 | |
| | | |
Foreign currency translation activity: | | | | | | | | | | | | |
Foreign currency translation adjustments, net of income tax (expense) benefit of $18, $(11) and $(78), respectively | | | (297 | ) | | | 383 | | | | 275 | |
Reclassification to earnings, net of income tax (expense) benefit of $0, $0 and $0, respectively | | | 154 | | | | 103 | | | | (4 | ) |
| | | | | | | | | | | | |
Total foreign currency translation adjustments, net of tax | | | (143 | ) | | | 486 | | | | 271 | |
| | | |
Derivative activity: | | | | | | | | | | | | |
Change in derivative fair value, net of income tax (expense) benefit of $95, $37 and $21, respectively | | | (311 | ) | | | (252 | ) | | | 178 | |
Reclassification to earnings, net of income tax (expense) benefit of $(21), $(20) and $(20), respectively | | | 121 | | | | 172 | | | | (138 | ) |
| | | | | | | | | | | | |
Total change in fair value of derivatives, net of tax | | | (190 | ) | | | (80 | ) | | | 40 | |
| | | |
Pension activity: | | | | | | | | | | | | |
Net actuarial (loss) for the period, net of income tax benefit of $25, $23 and $10, respectively | | | (43 | ) | | | (23 | ) | | | (23 | ) |
Amortization of net actuarial loss, net of income tax (expense) of $(1), $(12) and $0, respectively | | | 2 | | | | 1 | | | | — | |
| | | | | | | | | | | | |
Total change in unfunded pension obligation | | | (41 | ) | | | (22 | ) | | | (23 | ) |
| | | | | | | | | | | | |
OTHER COMPREHENSIVE INCOME (LOSS) | | | (375 | ) | | | 379 | | | | 294 | |
| | | | | | | | | | | | |
COMPREHENSIVE INCOME (LOSS) | | $ | (317 | ) | | $ | 388 | | | $ | 952 | |
| | | | | | | | | | | | |
See Notes to Schedule I
THE AES CORPORATION
SCHEDULE I CONDENSED FINANCIAL INFORMATION OF REGISTRANT
STATEMENTS OF UNCONSOLIDATED CASH FLOWS
| | | | | | | | | | | | |
| | | For the Years Ended December 31, | |
| | | 2011 | | | 2010 | | | 2009 | |
| | | (in millions) | |
Net cash provided by operating activities | | $ | 1,569 | | | $ | 488 | | | $ | 178 | |
Investing Activities: | | | | | | | | | | | | |
Investment in and advances to subsidiaries | | | (2,823 | ) | | | (1,185 | ) | | | (452 | ) |
(Purchase)/sale of short term investments, net | | | 2 | | | | (3 | ) | | | (5 | ) |
Return of capital | | | 363 | | | | 300 | | | | 166 | |
(Increase) decrease in restricted cash | | | (261 | ) | | | (2 | ) | | | 4 | |
Additions to property, plant and equipment | | | (28 | ) | | | (22 | ) | | | (8 | ) |
| | | | | | | | | | | | |
Net cash used in investing activities | | | (2,747 | ) | | | (912 | ) | | | (295 | ) |
Financing Activities: | | | | | | | | | | | | |
Borrowings under the revolver, net | | | 295 | | | | — | | | | — | |
Borrowings of notes payable and other coupon bearing securities | | | 2,050 | | | | — | | | | 503 | |
Repayments of notes payable and other coupon bearing securities | | | (477 | ) | | | (914 | ) | | | (154 | ) |
Loans (to) from subsidiaries | | | (744 | ) | | | (154 | ) | | | 205 | |
Proceeds from issuance of common stock | | | 3 | | | | 1,569 | | | | 14 | |
Purchase of treasury stock | | | (279 | ) | | | (99 | ) | | | — | |
Payments for deferred financing costs | | | (75 | ) | | | (12 | ) | | | (23 | ) |
| | | | | | | | | | | | |
Net cash provided by financing activities | | | 773 | | | | 390 | | | | 545 | |
| | | | | | | | | | | | |
Effect of exchange rate changes on cash | | | | | | | | | | | | |
Increase (decrease) in cash and cash equivalents | | | (405 | ) | | | (34 | ) | | | 428 | |
Cash and cash equivalents, beginning | | | 594 | | | | 628 | | | | 200 | |
| | | | | | | | | | | | |
Cash and cash equivalents, ending | | $ | 189 | | | $ | 594 | | | $ | 628 | |
| | | | | | | | | | | | |
Supplemental Disclosures: | | | | | | | | | | | | |
Cash payments for interest, net of amounts capitalized | | $ | 392 | | | $ | 412 | | | $ | 410 | |
Cash payments for income taxes, net of refunds | | $ | (6 | ) | | $ | — | | | $ | — | |
See Notes to Schedule I
THE AES CORPORATION
SCHEDULE I
NOTES TO SCHEDULE I
1. Application of Significant Accounting Principles
Accounting for Subsidiaries and Affiliates—The AES Corporation (the “Company”) has accounted for the earnings of its subsidiaries on the equity method in the unconsolidated financial information.
Revenue—Construction management fees earned by the parent from its consolidated subsidiaries are eliminated.
Income Taxes—Positions taken on the Company’s income tax return which satisfy a more-likely-than-not threshold will be recognized in the financial statements. The unconsolidated income tax expense or benefit computed for the Company reflects the tax assets and liabilities of the Company on a stand-alone basis and the effect of filing a consolidated U.S. income tax return with certain other affiliated companies.
Accounts and Notes Receivable from Subsidiaries—Certain prior period amounts have been reclassified to conform with current year presentation. Such amounts have been shown in current or long-term assets based on terms in agreements with subsidiaries, but payment is dependent upon meeting conditions precedent in the subsidiary loan agreements.
Selected Unconsolidated Balance Sheet Data:
| | | | | | | | |
| | | December 31, | | | December 31, | |
| | | 2011 | | | 2010 | |
| | | (in millions) | |
Assets | | | | | | | | |
Investment in and advances to subsidiaries and affiliates | | $ | 12,088 | | | $ | 10,741 | |
Deferred income taxes | | $ | 525 | | | $ | 352 | |
Total other assets | | $ | 839 | | | $ | 417 | |
Total assets | | $ | 14,118 | | | $ | 12,689 | |
| | |
Liabilities and Stockholders’ Equity | | | | | | | | |
Other long-term liabilities | | $ | 143 | | | $ | 107 | |
Total long-term liabilities | | $ | 7,330 | | | $ | 5,311 | |
Additional paid-in capital | | $ | 8,507 | | | $ | 8,444 | |
Retained earnings | | $ | 678 | | | $ | 620 | |
Accumulated other comprehensive loss | | $ | (2,758 | ) | | $ | (2,383 | ) |
Total stockholders’ equity | | $ | 5,946 | | | $ | 6,473 | |
Total liabilities and stockholders’ equity | | $ | 14,118 | | | $ | 12,689 | |
Selected Unconsolidated Operations Data:
| | | | | | | | | | | | |
| | | For the Year Ended December 31, | |
| | | 2011 | | | 2010 | | | 2009 | |
| | | (in millions) | |
Equity in earnings of subsidiaries and affiliates | | $ | 357 | | | $ | 590 | | | $ | 983 | |
Income before income taxes | | $ | (116 | ) | | $ | 181 | | | $ | 450 | |
Income tax benefit (expense) | | $ | 174 | | | $ | (172 | ) | | $ | 208 | |
Net income attributable to The AES Corporation | | $ | 58 | | | $ | 9 | | | $ | 658 | |
2. Notes Payable
| | | | | | | | | | | | |
| | | | | | | December 31, | |
| | | Interest Rate | | Maturity | | 2011 | | | 2010 | |
| | | | | | | (in millions) | |
Senior Secured Term Loan | | LIBOR + 1.75% | | 2011 | | $ | — | | | $ | 200 | |
Senior Unsecured Note | | 8.875% | | 2011 | | | — | | | | 129 | |
Senior Unsecured Note | | 8.375% | | 2011 | | | — | | | | 134 | |
Senior Unsecured Note | | 7.75% | | 2014 | | | 500 | | | | 500 | |
Revolving Loan under Senior Secured Credit Facility(1) | | LIBOR + 3.00% | | 2015 | | | 295 | | | | — | |
Senior Unsecured Note | | 7.75% | | 2015 | | | 500 | | | | 500 | |
Senior Unsecured Note | | 9.75% | | 2016 | | | 535 | | | | 535 | |
Senior Unsecured Note | | 8.00% | | 2017 | | | 1,500 | | | | 1,500 | |
Senior Secured Term Loan | | LIBOR + 3.25% | | 2018 | | | 1,042 | | | | — | |
Senior Unsecured Note | | 8.00% | | 2020 | | | 625 | | | | 625 | |
Senior Unsecured Note | | 7.375% | | 2021 | | | 1,000 | | | | — | |
Term Convertible Trust Securities | | 6.75% | | 2029 | | | 517 | | | | 517 | |
Unamortized discounts | | | | | | | (29 | ) | | | (28 | ) |
| | | | | | | | | | | | |
SUBTOTAL | | | | | | $ | 6,485 | | | $ | 4,612 | |
Less: Current maturities | | | | | | | (305 | ) | | | (463 | ) |
| | | | | | | | | | | | |
Total | | | | | | $ | 6,180 | | | $ | 4,149 | |
| | | | | | | | | | | | |
| (1) | Subsequent to year end the loan was substantially repaid and is expected to be repaid in full prior to March 31, 2012. |
FUTURE MATURITIES OF DEBT—Recourse debt as of December 31, 2011 is scheduled to reach maturity as set forth in the table below:
| | | | |
December 31, | | Annual
Maturities | |
| | | (in millions) | |
2012 | | $ | 305 | |
2013 | | | 11 | |
2014 | | | 509 | |
2015 | | | 511 | |
2016 | | | 523 | |
Thereafter | | | 4,626 | |
| | | | |
Total debt | | $ | 6,485 | |
| | | | |
3. Dividends from Subsidiaries and Affiliates
Cash dividends received from consolidated subsidiaries and from affiliates accounted for by the equity method were as follows:
| | | | | | | | | | | | |
| | | 2011 | | | 2010 | | | 2009 | |
| | | (in millions) | |
Subsidiaries | | $ | 1,059 | | | $ | 944 | | | $ | 948 | |
Affiliates | | $ | 25 | | | $ | 10 | | | $ | 60 | |
4. Guarantees and Letters of Credit
GUARANTEES—In connection with certain of its project financing, acquisition, and power purchase agreements, the Company has expressly undertaken limited obligations and commitments, most of which will only be effective or will be terminated upon the occurrence of future events. These obligations and commitments, excluding those collateralized by letter of credit and other obligations discussed below, were limited as of December 31, 2011, by the terms of the agreements, to an aggregate of approximately $340 million representing 20 agreements with individual exposures ranging from less than $1 million up to $53 million.
LETTERS OF CREDIT—At December 31, 2011, the Company had $12 million in letters of credit outstanding under the senior unsecured credit facility representing 11 agreements with individual exposures ranging from less than $1 million up to $7 million, which operate to guarantee performance relating to certain project development and construction activities and subsidiary operations. At December 31, 2011, the Company had
$261 million in cash collateralized letters of credit outstanding representing 13 agreements with individual exposures ranging from less than $1 million up to $221 million, which operate to guarantee performance relating to certain project development and construction activities and subsidiary operations. During 2011, the Company paid letter of credit fees ranging from 0.250% to 3.250% per annum on the outstanding amounts.
THE AES CORPORATION
SCHEDULE II
VALUATION AND QUALIFYING ACCOUNTS
(IN MILLIONS)
| | | | | | | | | | | | | | | | | | | | |
| | | Balance at
Beginning of
the Period | | | Charged
to Cost
and Expense | | | Amounts
Written off | | | Translation
Adjustment | | | Balance at
the End of
the Period | |
Allowance for accounts receivables | | | | | | | | | | | | | | | | | | | | |
(current and noncurrent) | | | | | | | | | | | | | | | | | | | | |
Year ended December 31, 2009 | | $ | 239 | | | $ | 104 | | | $ | (109 | ) | | $ | 42 | | | $ | 276 | |
Year ended December 31, 2010 | | | 276 | | | | 53 | | | | (37 | ) | | | 3 | | | | 295 | |
Year ended December 31, 2011 | | | 295 | | | | 43 | | | | (41 | ) | | | (24 | ) | | | 273 | |
Exhibit 12
The AES Corporation and Subsidiaries
Statement Re: Calculation of Ratio of Earnings to Fixed Charges
(in millions, unaudited)
| | | | | | | | | | | | | | | | | | | | |
| | | 2011 | | | 2010 | | | 2009 | | | 2008 | | | 2007 | |
Actual: | | | | | | | | | | | | | | | | | | | | |
Computation of earnings: | | | | | | | | | | | | | | | | | | | | |
Income from continuing operations before income taxes and equity in earnings of affiliates | | $ | 2,167 | | | $ | 1,853 | | | $ | 2,260 | | | $ | 2,498 | | | $ | 1,000 | |
Fixed charges | | | 1,805 | | | | 1,758 | | | | 1,732 | | | | 2,018 | | | | 1,877 | |
Amortization of capitalized interest | | | 27 | | | | 18 | | | | 12 | | | | 10 | | | | 10 | |
Distributed income of equity investees | | | 25 | | | | 14 | | | | 68 | | | | 183 | | | | 21 | |
Less: | | | | | | | | | | | | | | | | | | | | |
Capitalized interest | | | (176 | ) | | | (188 | ) | | | (183 | ) | | | (172 | ) | | | (84 | ) |
Preference security dividend of consolidated subsidiary | | | (5 | ) | | | (5 | ) | | | (4 | ) | | | (4 | ) | | | (6 | ) |
Noncontrolling interests in pretax income of subsidiaries that have not incurred fixed charges(1) | | | (8 | ) | | | (4 | ) | | | (9 | ) | | | — | | | | — | |
| | | | | | | | | | | | | | | | | | | | |
Earnings | | $ | 3,835 | | | $ | 3,446 | | | $ | 3,876 | | | $ | 4,533 | | | $ | 2,818 | |
| | | | | | | | | | | | | | | | | | | | |
Fixed charges: | | | | | | | | | | | | | | | | | | | | |
Interest expense, debt premium and discount amortization | | $ | 1,624 | | | $ | 1,565 | | | $ | 1,545 | | | $ | 1,842 | | | $ | 1,787 | |
Capitalized interest | | | 176 | | | | 188 | | | | 183 | | | | 172 | | | | 84 | |
Preference security dividend of consolidated subsidiary | | | 5 | | | | 5 | | | | 4 | | | | 4 | | | | 6 | |
| | | | | | | | | | | | | | | | | | | | |
Fixed charges | | $ | 1,805 | | | $ | 1,758 | | | $ | 1,732 | | | $ | 2,018 | | | $ | 1,877 | |
| | | | | | | | | | | | | | | | | | | | |
Ratio of earnings to fixed charges | | | 2.12 | | | | 1.96 | | | | 2.24 | | | | 2.25 | | | | 1.50 | |
| (1) | Amounts for prior periods have been restated to exclude from the computation of earnings only noncontrolling interests in pretax income of those subsidiaries that did not incur fixed charges. |