UNITED STATES
SECURITIES AND EXCHANGE COMMISSION
Washington, D.C. 20549
FORM N-CSR
CERTIFIED SHAREHOLDER REPORT OF REGISTERED
MANAGEMENT INVESTMENT COMPANIES
Investment Company Act file number 811-06310
Legg Mason Partners Variable Income Trust
(Exact name of registrant as specified in charter)
55 Water Street, New York, NY 10041
(Address of principal executive offices) (Zip code)
Robert I. Frenkel, Esq.
Legg Mason & Co., LLC
100 First Stamford Place
Stamford, CT 06902
(Name and address of agent for service)
Registrant’s telephone number, including area code: 1-877-721-1926
Date of fiscal year end: December 31
Date of reporting period: June 30, 2011
| ITEM 1. | REPORT TO STOCKHOLDERS. |
The Semi-Annual Report to Stockholders is filed herewith.
June 30, 2011

Semi-Annual
Repor t
Legg Mason
Western Asset
Variable Global
High Yield Bond Portfolio
INVESTMENT PRODUCTS: NOT FDIC INSURED • NO BANK GUARANTEE • MAY LOSE VALUE
| | |
| II | | Legg Mason Western Asset Variable Global High Yield Bond Portfolio |
Portfolio objective
The Portfolio seeks to maximize total return, consistent with the preservation of capital.
Letter from the chairman

Dear Shareholder,
We are pleased to provide the semi-annual report of Legg Mason Western Asset Variable Global High Yield Bond Portfolio for the six-month reporting period ended June 30, 2011. Please read on for Portfolio performance information and a detailed look at prevailing economic and market conditions during the Portfolio’s reporting period.
As always, we remain committed to providing you with excellent service and a full spectrum of investment choices. We also remain committed to supplementing the support you receive from your financial advisor. One way we accomplish this is through our website, www.leggmason.com/individualinvestors. Here you can gain immediate access to market and investment information, including:
| Ÿ | | Market insights and commentaries from our portfolio managers and |
| Ÿ | | A host of educational resources. |
We look forward to helping you meet your financial goals.
Sincerely,

R. Jay Gerken, CFA
Chairman, President and Chief Executive Officer
July 29, 2011
| | | | |
| Legg Mason Western Asset Variable Global High Yield Bond Portfolio | | | III | |
Investment commentary
Economic review
Although the U.S. economy continued to grow over the six months ended June 30, 2011, the pace of the expansion was disappointing, which resulted in a significant shift in investor sentiment. During the first half of the period, there were expectations of a strengthening economy and generally robust investor risk appetite. However, as the reporting period progressed, weakening economic data triggered a flight to quality as investor risk aversion increased. Despite giving back a portion of their previous gains in late May and June, investors who took on additional risk in their portfolios during the reporting period were generally rewarded.
U.S. gross domestic product (“GDP”)i growth, as reported by the U.S. Department of Commerce, has been less robust than previously realized during most other periods exiting a severe recession. Revised GDP growth was 2.3% during the fourth quarter of 2010 and 3.0% for calendar 2010 as a whole. The Commerce Department then reported that first and second quarter 2011 GDP growth were 0.4% and 1.3%, respectively. This moderation in growth during the first half of the year was due to a variety of factors, including less robust export activity, a decline in government spending and a deceleration in consumer spending given higher oil and food prices.
Turning to the job market, while there was some improvement in the first half of the reporting period, unemployment again moved higher from April through June. After being 9.0% or higher since April 2009, the unemployment rate fell to 8.9% in February and 8.8% in March 2011. The job market then weakened, as unemployment rose to 9.0% in April, 9.1% in May and 9.2% in June. As of the end of the reporting period, approximately 14.1 million Americans looking for work had yet to find a job, and roughly 44% of these individuals have been out of work for more than six months. In June 2011, the Federal Reserve Board (“Fed”)ii projected that unemployment would moderate, but that it would remain elevated and between 7.8% and 8.2% at the end of 2012.
The long-ailing housing market continued to show signs of strain during the reporting period. Looking back, sales increased in the spring of 2010 largely due to the government’s $8,000 tax credit for first-time home buyers. This proved to be only a temporary boost, as sales subsequently weakened after the tax credit expired at the end of April. Existing-home sales did rebound somewhat toward the end of 2010 and in January 2011, as mortgage rates remained relatively low. However, according to the National Association of Realtors (“NAR”), existing-home sales then declined a sharp 8.9% in February. After a 3.5% increase in March, existing-home sales fell 1.8%, 4.0% and 0.8% in April, May and June, respectively. At the end of June, the inventory of unsold homes was a 9.5 month supply at the current sales level, versus a 9.1 month supply in May. Existing-home prices were relatively stagnant versus a year ago, with the NAR reporting that the median existing-home price for all housing types was $184,300 in June 2011, up 0.8% from June 2010.
Even the manufacturing sector, one of the stalwarts of the economy in recent years, softened toward the end of the reporting period. Based on the Institute for Supply Management’s PMIiii, the manufacturing sector grew twenty-three consecutive months since it began expanding in August 2009 (a reading below 50 indicates a contraction, whereas a reading above 50 indicates an expansion). In January 2011, the manufacturing sector expanded at its fastest pace since May 2004, with a reading of 60.8 versus 58.5 for the previous month. Manufacturing activity remained strong during the next three months and was 60.4 in April. However, it then declined to 53.5 in
| | |
| IV | | Legg Mason Western Asset Variable Global High Yield Bond Portfolio |
Investment commentary (cont’d)
May, the lowest reading in the past twelve months. This was attributed, in part, to supply disruptions triggered by the March earthquake and tsunami in Japan. Manufacturing activity then moved modestly higher in June to 55.3, although only twelve of the eighteen industries tracked by the Institute for Supply Management expanded during the month.
Outside of the U.S., economic news was largely dominated by the sovereign debt crisis in Europe, geopolitical events in the Middle East and Northern Africa (“MENA”), and the natural disasters in Japan. Political turmoil in the MENA region caused oil prices to rise above $100 a barrel in February 2011, the first such occurrence in roughly two years. This led to concerns that higher oil prices could temper economic growth in both developed and emerging market countries. The tragedy in Japan also impacted the global economy. The World Bank has projected damage in northeast Japan could reach $235 billion. Japan’s economy fell back into recession in the first quarter of 2011, with GDP contracting 0.9%. However, the World Bank stated, “As a result of the earthquake and tsunami, Japan’s real GDP growth will slow, but the slowdown will likely be temporary. Growth should start picking up after mid-2011 as reconstruction efforts get underway.” Elsewhere, Eurozone GDP growth was 0.8% during the first quarter, compared to a 0.3% expansion in the fourth quarter of 2010. Among the largest emerging market countries, GDP growth was 9.7% in China and 7.8% in India during the first quarter of 2011.
Financial market overview
While stocks and lower-quality bonds generated solid results during the reporting period, there were several periods of heightened volatility and periodic sell-offs. These were triggered by a variety of factors, including concerns regarding the global economy, geopolitical unrest, the devastation in Japan and the ongoing European sovereign debt crisis. During those periods, investors tended to favor the relative safety of U.S. Treasury securities. However, these setbacks proved to be only temporary and risk aversion was generally replaced with solid demand for riskier assets.
The Fed took a number of actions as it sought to meet its dual mandate of fostering maximum employment and price stability. In November 2010, prior to the beginning of the reporting period, the Fed announced a second round of quantitative easing (often referred to as “QE2”) to help stimulate the economy, entailing the purchase of $600 billion of long-term U.S. Treasury securities by the end of the second quarter of 2011. Also, as has been the case since December 2008, the Fed kept the federal funds rateiv at a historically low range between 0 and 1/4 percent.
Despite these efforts, at its meeting in June 2011, the Fed said, “Information received since the Federal Open Market Committee met in April indicates that the economic recovery is continuing at a moderate pace, though somewhat more slowly than the Committee had expected. . . . To promote the ongoing economic recovery and to help ensure that inflation, over time, is at levels consistent with its mandate, the Committee decided today to keep the target range for the federal funds rate at 0 to 1/4 percent. The Committee continues to anticipate that economic conditions — including low rates of resource utilization and a subdued outlook for inflation over the medium run — are likely to warrant exceptionally low levels for the federal funds rate for an extended period.”
In June, the Fed also announced that it would complete QE2 on schedule at the end of June. However, given ongoing strains in the economy, it made no overtures toward reversing any of its accommodative policies and the Fed said it would
| | | | |
| Legg Mason Western Asset Variable Global High Yield Bond Portfolio | | | V | |
“maintain its existing policy of reinvesting principal payments from its securities holdings” rather than seeking to reduce the size of its balance sheet.
Given the economic challenges in the Eurozone, the European Central Bank (“ECB”) had not raised interest rates since July 2008. However, in early April 2011, the ECB raised interest rates from 1.00% to 1.25% and then to 1.50% in July (after the reporting period ended). In other developed countries, the Bank of England kept rates on hold at 0.50% during the reporting period, as did Japan at a range of zero to 0.10%, the lowest level since 2006. Elsewhere, a number of emerging market countries, including China, India and Brazil, raised interest rates during the reporting period in an effort to ward off inflation.
Fixed income market review
While volatility was elevated at times, the U.S. spread sectors (non-Treasuries) produced positive results during the reporting period. As was the case for much of 2010, the spread sectors generally outperformed equal-durationv Treasuries during the first four months of the reporting period. A combination of positive economic growth, benign core inflation, rising corporate profits and overall robust investor demand supported the spread sectors from January through April 2011. Investor sentiment then began to shift in May, as optimism about the economic expansion waned and investor risk appetite started to be replaced with increased risk aversion. While the U.S. spread sectors generally posted positive results in May, they underperformed equal-duration Treasuries. Risk aversion then increased in June given a host of disappointing economic data and a further escalation of the European sovereign debt crisis. Against this backdrop, the spread sectors generated relatively poor results during most of June as investors fled the spread sectors in favor of Treasury securities.
Both short- and long-term Treasury yields fluctuated during the six months ended June 30, 2011. When the period began, two- and ten-year Treasury yields were 0.61% and 3.30%, respectively. Yields initially moved higher given expectations for stronger growth in 2011 and the potential for rising inflation. On February 14, 2011, two-year Treasury yields peaked at 0.87%, while ten-year Treasuries peaked at 3.75% on February 8, 2011. Treasury yields then declined as investor risk aversion increased given the uprising in Libya and, later, due to the tragic events in Japan. Yields briefly moved higher toward the end of March, but then generally declined from April through June given disappointing economic data and periodic flights to quality. In late June, two- and ten-year Treasury yields bottomed at 0.35% and 2.88%, respectively, and ended the period at 0.45% and 3.18%, respectively. For the six months ended June 30, 2011, the Barclays Capital U.S. Aggregate Indexvi returned 2.72%. In comparison, the Barclays Capital Global Aggregate Index (Hedged)vii returned 1.48% over the same time frame.
The U.S. high-yield bond market produced strong results during the first five months of the reporting period. High-yield prices moved higher against a backdrop of generally better-than-expected corporate profits and overall strong investor demand. However, the asset class gave back a portion of its gains in June during the flight to quality, with the high-yield market posting its first monthly loss since November 2010. All told, the Barclays Capital U.S. High Yield — 2% Issuer Cap Indexviii returned 4.98% for the six months ended June 30, 2011.
Despite periods of volatility, the emerging market debt asset class generated a solid return for the six-month reporting period. Investor concerns regarding interest rate hikes in China and unrest in the MENA region dragged the asset class down from November 2010 (prior to the beginning of
| | |
| VI | | Legg Mason Western Asset Variable Global High Yield Bond Portfolio |
Investment commentary (cont’d)
the reporting period) through January 2011. Emerging market debt prices then largely stabilized in February and rallied from March through June. Overall, the JPMorgan Emerging Markets Bond Index Global (“EMBI Global”)ix returned 5.09% over the six months ended June 30, 2011.
Performance review
For the six months ended June 30, 2011, Class I shares of Legg Mason Western Asset Variable Global High Yield Bond Portfolio1 returned 4.73%. The Portfolio’s unmanaged benchmark, the Barclays Capital Global High Yield Index (Hedged)x, returned 4.78% over the same time frame. The Lipper Variable High Current Yield Funds Category Average2 returned 4.38% for the same period.
| | |
| Performance Snapshot as of June 30, 2011 (unaudited) |
| | | 6 months |
| Legg Mason Western Asset Variable Global High Yield Bond Portfolio1: | | |
Class I | | 4.73% |
Class II | | 4.53% |
| Barclays Capital Global High Yield Index (Hedged) | | 4.78% |
| Lipper Variable High Current Yield Funds Category Average | | 4.38% |
The performance shown represents past performance. Past performance is no guarantee of future results and current performance may be higher or lower than the performance shown above. Principal value, investment returns and yields will fluctuate and investors’ shares, when redeemed, may be worth more or less than their original cost.
Portfolio returns assume the reinvestment of all distributions, including returns of capital, if any, at net asset value and the deduction of all Portfolio expenses. Performance figures for periods shorter than one year represent cumulative figures and are not annualized.
The 30-Day SEC Yields for the period ended June 30, 2011 for Class I and Class II shares were 7.04% and 6.77%, respectively. The 30-Day SEC Yield is subject to change and is based on the yield to maturity of the Portfolio’s investments over a 30-day period and not on the dividends paid by the Portfolio, which may differ.
|
| Total Annual Operating Expenses (unaudited) |
As of the Portfolio’s current prospectus dated May 1, 2011, the gross total annual operating expense ratios for Class I and Class II shares were 0.91% and 1.17%, respectively.
Actual expenses may be higher. For example, expenses may be higher than those shown if average net assets decrease. Net assets are more likely to decrease and Portfolio expense ratios are more likely to increase when markets are volatile.
As always, thank you for your confidence in our stewardship of your assets.
Sincerely,
R. Jay Gerken, CFA
Chairman, President and
Chief Executive Officer
July 29, 2011
| 1 | The Portfolio is an underlying investment option of various variable annuity and variable life insurance products. The Portfolio’s performance returns do not reflect the deduction of expenses imposed in connection with investing in variable annuity or variable life insurance contracts, such as administrative fees, account charges and surrender charges, which, if reflected, would reduce the performance of the Portfolio. Past performance is no guarantee of future results. |
| 2 | Lipper, Inc., a wholly-owned subsidiary of Reuters, provides independent insight on global collective investments. Returns are based on the six-month period ended June 30, 2011, including the reinvestment of all distributions, including returns of capital, if any, calculated among the 122 funds in the Portfolio’s Lipper category. |
| | | | |
| Legg Mason Western Asset Variable Global High Yield Bond Portfolio | | | VII | |
RISKS: Investments in bonds are subject to interest rate and credit risks. As interest rates rise, bond prices fall, reducing the value of the Portfolio’s share price. High-yield bonds involve greater credit and liquidity risks than investment grade bonds. Investing in foreign securities is subject to certain risks not associated with domestic investing, such as currency fluctuations, and changes in political and economic conditions. These risks are magnified in emerging or developing markets. The Portfolio may use derivatives, such as options and futures, which can be illiquid, may disproportionately increase losses, and have a potentially large impact on Portfolio performance. Please see the Portfolio’s prospectus for a more complete discussion of these and other risks, and the Portfolio’s investment strategies.
All investments are subject to risk including the possible loss of principal. Past performance is no guarantee of future results. All index performance reflects no deduction for fees, expenses or taxes. Please note that an investor cannot invest directly in an index.
The information provided is not intended to be a forecast of future events, a guarantee of future results or investment advice. Views expressed may differ from those of the firm as a whole. Forecasts and predictions are inherently limited and should not be relied upon as an indication of actual or future performance.
| i | Gross domestic product (“GDP”) is the market value of all final goods and services produced within a country in a given period of time. |
| ii | The Federal Reserve Board (“Fed”) is responsible for the formulation of policies designed to promote economic growth, full employment, stable prices and a sustainable pattern of international trade and payments. |
| iii | The Institute for Supply Management’s PMI is based on a survey of purchasing executives who buy the raw materials for manufacturing at more than 350 companies. It offers an early reading on the health of the manufacturing sector. |
| iv | The federal funds rate is the rate charged by one depository institution on an overnight sale of immediately available funds (balances at the Federal Reserve) to another depository institution; the rate may vary from depository institution to depository institution and from day to day. |
| v | Duration is the measure of the price sensitivity of a fixed-income security to an interest rate change of 100 basis points. Calculation is based on the weighted average of the present values for all cash flows. |
| vi | The Barclays Capital U.S. Aggregate Index is a broad-based bond index comprised of government, corporate, mortgage- and asset-backed issues, rated investment grade or higher, and having at least one year to maturity. |
| vii | The Barclays Capital Global Aggregate Index (Hedged) is a broad-based bond index that measures a wide spectrum of global government, government-related agencies, corporate and securitized fixed-income investments, all with maturities greater than one year. |
| viii | The Barclays Capital U.S. High Yield – 2% Issuer Cap Index is an index of the 2% Issuer Cap component of the Barclays Capital U.S. Corporate High Yield Index, which covers the U.S. dollar-denominated, non-investment grade, fixed-rate, taxable corporate bond market. |
| ix | The JPMorgan Emerging Markets Bond Index Global (“EMBI Global”) tracks total returns for U.S. dollar-denominated debt instruments issued by emerging market sovereign and quasi-sovereign entities: Brady bonds, loans, Eurobonds and local market instruments. |
| x | The Barclays Capital Global High Yield Index (Hedged) provides a broad-based measure of the global high-yield fixed-income markets, representing the union of the U.S. High-Yield, Pan-European High-Yield, U.S. Emerging Markets High-Yield, CMBS High-Yield and Pan European Emerging Markets High-Yield Indices. |
| | | | |
| Legg Mason Western Asset Variable Global High Yield Bond Portfolio 2011 Semi-Annual Report | | | 1 | |
Portfolio at a glance† (unaudited)
Investment breakdown (%) as a percent of total investments
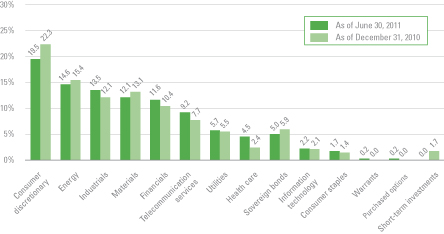
| † | The bar graph above represents the composition of the Portfolio’s investments as of June 30, 2011 and December 31, 2010 and does not include derivatives, such as, written options, futures contracts and forward foreign currency contracts. The Portfolio is actively managed. As a result, the composition of the Portfolio’s investments is subject to change at any time. |
| | |
| 2 | | Legg Mason Western Asset Variable Global High Yield Bond Portfolio 2011 Semi-Annual Report |
Portfolio expenses (unaudited)
Example
As a shareholder of the Portfolio, you may incur two types of costs: (1) transaction costs and (2) ongoing costs, including management fees; distribution and/or service (12b-1) fees; and other Portfolio expenses. This example is intended to help you understand your ongoing costs (in dollars) of investing in the Portfolio and to compare these costs with the ongoing costs of investing in other mutual funds.
This example is based on an investment of $1,000 invested on January 1, 2011 and held for the six months ended June 30, 2011.
Actual expenses
The table below titled “Based on Actual Total Return” provides information about actual account values and actual expenses. You may use the information provided in this table, together with the amount you invested, to estimate the expenses that you paid over the period. To estimate the expenses you paid on your account, divide your ending account value by $1,000 (for example, an $8,600 ending account value divided by $1,000 = 8.6), then multiply the result by the number under the heading entitled “Expenses Paid During the Period”.
Hypothetical example for comparison purposes
The table below titled “Based on Hypothetical Total Return” provides information about hypothetical account values and hypothetical expenses based on the actual expense ratio and an assumed rate of return of 5.00% per year before expenses, which is not the Portfolio’s actual return. The hypothetical account values and expenses may not be used to estimate the actual ending account balance or expenses you paid for the period. You may use the information provided in this table to compare the ongoing costs of investing in the Portfolio and other funds. To do so, compare the 5.00% hypothetical example relating to the Portfolio with the 5.00% hypothetical examples that appear in the shareholder reports of the other funds.
Please note that the expenses shown in the table below are meant to highlight your ongoing costs only and do not reflect any transactional costs. Therefore, the table is useful in comparing ongoing costs only, and will not help you determine the relative total costs of owning different funds. In addition, if these transaction costs were included, your costs would have been higher.
| | | | | | | | | | | | | | | | | | | | | | | | | | | | | | | | |
| Based on actual total return1 | | | | Based on hypothetical total return1 |
| | | Actual
Total Return2 | | Beginning
Account
Value | | | Ending
Account
Value | | | Annualized
Expense
Ratio | | Expenses
Paid
During
the
Period3 | | | | | | Hypothetical
Annualized
Total Return | | Beginning
Account
Value | | | Ending
Account
Value | | | Annualized
Expense
Ratio | | Expenses
Paid
During
the
Period3 |
| Class I | | 4.73% | | $ | 1,000.00 | | | $ | 1,047.30 | | | 0.93% | | $4.72 | | | | Class I | | 5.00% | | $ | 1,000.00 | | | $ | 1,020.18 | | | 0.93% | | $4.66 |
| Class II | | 4.53 | | | 1,000.00 | | | | 1,045.30 | | | 1.19 | | 6.03 | | | | Class II | | 5.00 | | | 1,000.00 | | | | 1,018.89 | | | 1.19 | | 5.96 |
| 1 | For the six months ended June 30, 2011. |
| 2 | Assumes the reinvestment of all distributions, including returns of capital, if any, at net asset value. Total return is not annualized, as it may not be representative of the total return for the year. Total returns do not reflect expenses associated with separate accounts such as administrative fees, account charges and surrender charges, which, if reflected, would reduce the total returns. Performance figures may reflect compensating balance arrangements, fees forgone and/or expense reimbursements. Past performance is no guarantee of future results. In the absence of compensating balance arrangements, fees forgone and/or expense reimbursements, the total return would have been lower. |
| 3 | Expenses (net of compensating balance arrangements, fees forgone and/or expense reimbursements) are equal to each class’ respective annualized expense ratio multiplied by the average account value over the period, multiplied by the number of days in the most recent fiscal half-year (181), then divided by 365. |
| | | | |
| Legg Mason Western Asset Variable Global High Yield Bond Portfolio 2011 Semi-Annual Report | | | 3 | |
Spread duration (unaudited)
Economic exposure — June 30, 2011
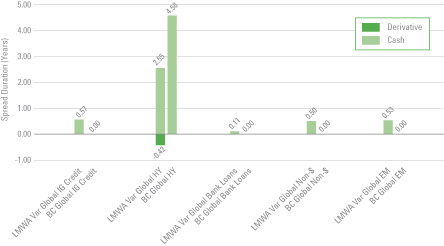
Spread duration measures the sensitivity to changes in spreads. The spread over Treasuries is the annual risk-premium demanded by investors to hold non-Treasury securities. Spread duration is quantified as the % change in price resulting from a 100 basis points change in spreads. For a security with positive spread duration, an increase in spreads would result in a price decline and a decline in spreads would result in a price increase. This chart highlights the market sector exposure of the Fund’s sectors relative to the selected benchmark sectors as of the end of the reporting period.
| | |
| BC Global | | — Barclays Capital Global High Yield Index (Hedged) |
| EM | | — Emerging Markets |
| HY | | — High Yield |
| IG Credit | | — Investment Grade Credit |
| LMWA Var Global | | — Legg Mason Western Asset Variable Global High Yield Bond Portfolio |
| Non-$ | | — Non-U.S. Dollar |
| | |
| 4 | | Legg Mason Western Asset Variable Global High Yield Bond Portfolio 2011 Semi-Annual Report |
Effective duration (unaudited)
Interest rate exposure — June 30, 2011
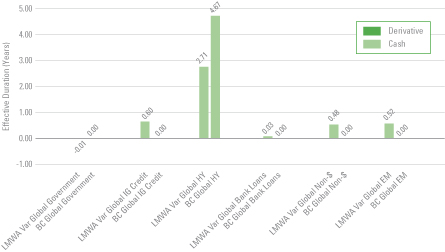
Effective duration measures the sensitivity to changes in relevant interest rates. Effective duration is quantified as the % change in price resulting from a 100 basis points change in interest rates. For a security with positive effective duration, an increase in interest rates would result in a price decline and a decline in interest rates would result in a price increase. This chart highlights the interest rate exposure of the Fund’s sectors relative to the selected benchmark sectors as of the end of the reporting period.
| | |
| BC Global | | — Barclays Capital Global High Yield Index (Hedged) |
| EM | | — Emerging Markets |
| HY | | — High Yield |
| IG Credit | | — Investment Grade Credit |
| LMWA Var Global | | — Legg Mason Western Asset Variable Global High Yield Bond Portfolio |
| Non-$ | | — Non-U.S. Dollar |
| | | | |
| Legg Mason Western Asset Variable Global High Yield Bond Portfolio 2011 Semi-Annual Report | | | 5 | |
Schedule of investments (unaudited)
June 30, 2011
Legg Mason Western Asset Variable Global High Yield Bond Portfolio
| | | | | | | | | | | | | | |
| Security | | Rate | | | Maturity
Date | | Face
Amount† | | | Value | |
| Corporate Bonds & Notes — 83.3% | | | | | | | | | | | | | | |
| Consumer Discretionary — 16.5% | | | | | | | | | | | | | | |
Auto Components — 0.4% | | | | | | | | | | | | | | |
Europcar Groupe SA, Senior Notes | | | 9.375 | % | | 4/15/18 | | | 395,000 | EUR | | $ | 578,537 | (a) |
Automobiles — 0.1% | | | | | | | | | | | | | | |
Escrow GCB General Motors | | | 7.200 | % | | 1/15/49 | | | 200,000 | | | | 6,000 | (b) |
Escrow GCB General Motors | | | 8.375 | % | | 7/15/49 | | | 1,550,000 | | | | 46,500 | (b) |
Ford Motor Credit Co., LLC, Senior Notes | | | 8.125 | % | | 1/15/20 | | | 130,000 | | | | 151,081 | |
Total Automobiles | | | | | | | | | | | | | 203,581 | |
Diversified Consumer Services — 1.2% | | | | | | | | | | | | | | |
Odeon & UCI Finco PLC, Senior Secured Notes | | | 9.000 | % | | 8/1/18 | | | 480,000 | GBP | | | 751,117 | (a) |
Service Corp. International, Senior Notes | | | 7.500 | % | | 4/1/27 | | | 370,000 | | | | 355,200 | |
Sotheby’s, Senior Notes | | | 7.750 | % | | 6/15/15 | | | 510,000 | | | | 563,550 | |
Stewart Enterprises Inc., Senior Notes | | | 6.500 | % | | 4/15/19 | | | 160,000 | | | | 160,600 | (a) |
Stonemor Operating LLC/Cornerstone Family Services of WV/Osiris Holding, Senior Notes | | | 10.250 | % | | 12/1/17 | | | 95,000 | | | | 95,000 | |
Total Diversified Consumer Services | | | | | | | | | | | | | 1,925,467 | |
Hotels, Restaurants & Leisure — 6.0% | | | | | | | | | | | | | | |
Boyd Gaming Corp., Senior Subordinated Notes | | | 7.125 | % | | 2/1/16 | | | 20,000 | | | | 18,550 | |
Caesars Entertainment Operating Co. Inc., Senior Secured Notes | | | 11.250 | % | | 6/1/17 | | | 450,000 | | | | 498,937 | |
CCM Merger Inc., Notes | | | 8.000 | % | | 8/1/13 | | | 180,000 | | | | 177,750 | (a) |
Choctaw Resort Development Enterprise, Senior Notes | | | 7.250 | % | | 11/15/19 | | | 235,000 | | | | 179,775 | (a) |
CityCenter Holdings LLC / CityCenter Finance Corp., Senior Secured Notes | | | 11.500 | % | | 1/15/17 | | | 450,000 | | | | 490,500 | (a)(c) |
Downstream Development Quapaw, Senior Notes | | | 12.000 | % | | 10/15/15 | | | 420,000 | | | | 469,350 | (a) |
Downstream Development Quapaw, Senior Secured Notes | | | 10.500 | % | | 7/1/19 | | | 390,000 | | | | 390,000 | (a) |
El Pollo Loco Inc. | | | 12.000 | % | | 12/28/17 | | | 660,000 | | | | 660,000 | (d) |
El Pollo Loco Inc., Senior Notes | | | 11.750 | % | | 11/15/13 | | | 645,000 | | | | 648,225 | |
Enterprise Inns PLC, Senior Secured Bonds | | | 6.500 | % | | 12/6/18 | | | 416,000 | GBP | | | 577,297 | |
Fontainebleau Las Vegas Holdings LLC/Fontainebleau Las Vegas Capital Corp. | | | 10.250 | % | | 6/15/15 | | | 265,000 | | | | 132 | (a)(e)(f)(g) |
Inn of the Mountain Gods Resort & Casino, Senior Secured Notes | | | 8.750 | % | | 11/30/20 | | | 275,000 | | | | 270,875 | (a) |
Landry’s Holdings Inc., Senior Secured Notes | | | 11.500 | % | | 6/1/14 | | | 160,000 | | | | 160,400 | (a) |
Landry’s Restaurants Inc., Senior Secured Notes | | | 11.625 | % | | 12/1/15 | | | 515,000 | | | | 553,625 | |
Landry’s Restaurants Inc., Senior Secured Notes | | | 11.625 | % | | 12/1/15 | | | 100,000 | | | | 107,500 | (a) |
Marstons Issuer PLC, Secured Bonds | | | 5.641 | % | | 7/15/35 | | | 223,000 | GBP | | | 316,291 | (e) |
MGM Resorts International, Senior Notes | | | 6.625 | % | | 7/15/15 | | | 300,000 | | | | 282,750 | |
See Notes to Financial Statements.
| | |
| 6 | | Legg Mason Western Asset Variable Global High Yield Bond Portfolio 2011 Semi-Annual Report |
Schedule of investments (unaudited) (cont’d)
June 30, 2011
Legg Mason Western Asset Variable Global High Yield Bond Portfolio
| | | | | | | | | | | | | | |
| Security | | Rate | | | Maturity
Date | | Face
Amount† | | | Value | |
Hotels, Restaurants & Leisure — continued | | | | | | | | | | | | | | |
MGM Resorts International, Senior Secured Notes | | | 10.375 | % | | 5/15/14 | | | 35,000 | | | $ | 39,900 | |
Mohegan Tribal Gaming Authority, Senior Subordinated Notes | | | 8.000 | % | | 4/1/12 | | | 1,020,000 | | | | 831,300 | |
Mohegan Tribal Gaming Authority, Senior Subordinated Notes | | | 6.875 | % | | 2/15/15 | | | 55,000 | | | | 37,125 | |
NCL Corp. Ltd., Senior Notes | | | 9.500 | % | | 11/15/18 | | | 590,000 | | | | 631,300 | (a) |
NCL Corp. Ltd., Senior Secured Notes | | | 11.750 | % | | 11/15/16 | | | 780,000 | | | | 902,850 | |
Pinnacle Entertainment Inc., Senior Subordinated Notes | | | 8.750 | % | | 5/15/20 | | | 50,000 | | | | 52,625 | |
Seven Seas Cruises S de RL LLC, Senior Secured Notes | | | 9.125 | % | | 5/15/19 | | | 450,000 | | | | 465,750 | (a) |
Snoqualmie Entertainment Authority, Senior Secured Notes | | | 4.204 | % | | 2/1/14 | | | 235,000 | | | | 212,675 | (a)(e) |
Snoqualmie Entertainment Authority, Senior Secured Notes | | | 9.125 | % | | 2/1/15 | | | 40,000 | | | | 39,300 | (a) |
Station Casinos Inc., Senior Notes | | | 6.000 | % | | 4/1/12 | | | 465,000 | | | | 47 | (b)(f)(g) |
Station Casinos Inc., Senior Notes | | | 7.750 | % | | 12/31/49 | | | 555,000 | | | | 56 | (b)(f)(g) |
Station Casinos Inc., Senior Subordinated Notes | | | 6.625 | % | | 3/15/18 | | | 75,000 | | | | 8 | (b)(f)(g) |
Sugarhouse HSP Gaming Prop Mezz LP/Sugarhouse HSP Gaming Finance Corp., Secured Notes | | | 8.625 | % | | 4/15/16 | | | 364,000 | | | | 376,740 | (a) |
Total Hotels, Restaurants & Leisure | | | | | | | | | | | | | 9,391,633 | |
Household Durables — 0.6% | | | | | | | | | | | | | | |
DFS Furniture Holdings PLC, Senior Secured Notes | | | 9.750 | % | | 7/15/17 | | | 256,000 | GBP | | | 404,705 | (a) |
DirectBuy Holdings Inc., Senior Secured Notes | | | 12.000 | % | | 2/1/17 | | | 100,000 | | | | 39,500 | (a) |
Standard Pacific Corp., Senior Notes | | | 8.375 | % | | 1/15/21 | | | 440,000 | | | | 433,400 | |
Total Household Durables | | | | | | | | | | | | | 877,605 | |
Internet & Catalog Retail — 0.4% | | | | | | | | | | | | | | |
Netflix Inc., Senior Notes | | | 8.500 | % | | 11/15/17 | | | 290,000 | | | | 326,975 | |
QVC Inc., Senior Secured Notes | | | 7.375 | % | | 10/15/20 | | | 265,000 | | | | 280,238 | (a) |
Total Internet & Catalog Retail | | | | | | | | | | | | | 607,213 | |
Media — 5.1% | | | | | | | | | | | | | | |
Affinity Group LLC, Senior Secured Notes | | | 11.500 | % | | 12/1/16 | | | 430,000 | | | | 453,650 | (a) |
CCO Holdings LLC/CCO Holdings Capital Corp., Senior Notes | | | 7.875 | % | | 4/30/18 | | | 300,000 | | | | 317,625 | |
Cengage Learning Acquisitions Inc., Senior Notes | | | 10.500 | % | | 1/15/15 | | | 885,000 | | | | 805,350 | (a) |
Cengage Learning Acquisitions Inc., Senior Subordinated Notes | | | 13.250 | % | | 7/15/15 | | | 710,000 | | | | 642,550 | (a)(e) |
Charter Communications Inc., Senior Notes | | | 6.500 | % | | 4/30/21 | | | 430,000 | | | | 426,237 | |
CMP Susquehanna Corp. | | | 3.443 | % | | 5/15/14 | | | 38,000 | | | | 29,072 | (a)(b)(e) |
CSC Holdings LLC, Senior Notes | | | 8.500 | % | | 6/15/15 | | | 285,000 | | | | 309,225 | |
See Notes to Financial Statements.
| | | | |
| Legg Mason Western Asset Variable Global High Yield Bond Portfolio 2011 Semi-Annual Report | | | 7 | |
Legg Mason Western Asset Variable Global High Yield Bond Portfolio
| | | | | | | | | | | | | | |
| Security | | Rate | | | Maturity
Date | | Face
Amount† | | | Value | |
Media — continued | | | | | | | | | | | | | | |
DISH DBS Corp., Senior Notes | | | 6.625 | % | | 10/1/14 | | | 30,000 | | | $ | 31,650 | |
DISH DBS Corp., Senior Notes | | | 7.875 | % | | 9/1/19 | | | 380,000 | | | | 411,825 | |
Globo Communicacoes e Participacoes SA, Bonds | | | 7.250 | % | | 4/26/22 | | | 200,000 | | | | 212,000 | (a) |
ITV PLC, Senior Notes | | | 10.000 | % | | 6/30/14 | | | 175,000 | EUR | | | 286,769 | |
LBI Media Inc., Senior Secured Notes | | | 9.250 | % | | 4/15/19 | | | 400,000 | | | | 398,000 | (a) |
Musketeer GmbH, Senior Secured Notes | | | 9.500 | % | | 3/15/21 | | | 250,000 | EUR | | | 387,915 | (a) |
National CineMedia LLC, Senior Notes | | | 7.875 | % | | 7/15/21 | | | 140,000 | | | | 142,499 | (a) |
NET Servicos de Comunicacao SA, Bonds | | | 7.500 | % | | 1/27/20 | | | 240,000 | | | | 275,760 | |
Nielsen Finance LLC/Nielsen Finance Co., Senior Notes | | | 7.750 | % | | 10/15/18 | | | 300,000 | | | | 316,500 | (a) |
Seat Pagine Gialle SpA, Senior Secured Notes | | | 10.500 | % | | 1/31/17 | | | 149,000 | EUR | | | 193,385 | (a) |
TVN Finance Corp. III AB, Senior Notes | | | 7.875 | % | | 11/15/18 | | | 75,000 | EUR | | | 109,577 | (a) |
Univision Communications Inc., Senior Notes | | | 8.500 | % | | 5/15/21 | | | 340,000 | | | | 340,850 | (a) |
Univision Communications Inc., Senior Secured Notes | | | 6.875 | % | | 5/15/19 | | | 320,000 | | | | 318,400 | (a) |
Univision Communications Inc., Senior Secured Notes | | | 7.875 | % | | 11/1/20 | | | 570,000 | | | | 587,100 | (a) |
UPC Holding BV, Senior Notes | | | 9.875 | % | | 4/15/18 | | | 140,000 | | | | 156,100 | (a) |
UPCB Finance III Ltd., Senior Secured Notes | | | 6.625 | % | | 7/1/20 | | | 180,000 | | | | 178,650 | (a) |
Ziggo Bond Co. BV, Senior Notes | | | 8.000 | % | | 5/15/18 | | | 400,000 | EUR | | | 597,462 | (a)(e) |
Total Media | | | | | | | | | | | | | 7,928,151 | |
Multiline Retail — 0.4% | | | | | | | | | | | | | | |
Neiman Marcus Group Inc., Senior Secured Notes | | | 7.125 | % | | 6/1/28 | | | 715,000 | | | | 664,950 | |
Specialty Retail — 0.7% | | | | | | | | | | | | | | |
American Greetings Corp., Senior Notes | | | 7.375 | % | | 6/1/16 | | | 95,000 | | | | 94,525 | |
American Greetings Corp., Senior Notes | | | 7.375 | % | | 6/1/16 | | | 30,000 | | | | 29,850 | |
Edcon Proprietary Ltd., Senior Notes | | | 4.721 | % | | 6/15/14 | | | 750,000 | EUR | | | 957,099 | (a)(e) |
Total Specialty Retail | | | | | | | | | | | | | 1,081,474 | |
Textiles, Apparel & Luxury Goods — 1.6% | | | | | | | | | | | | | | |
Boardriders SA, Senior Notes | | | 8.875 | % | | 12/15/17 | | | 550,000 | EUR | | | 839,455 | (a) |
Burlington Coat Factory Warehouse Corp., Senior Notes | | | 10.000 | % | | 2/15/19 | | | 280,000 | | | | 278,600 | (a) |
Empire Today LLC/Empire Today Finance Corp., Senior Secured Notes | | | 11.375 | % | | 2/1/17 | | | 200,000 | | | | 207,000 | (a) |
Giraffe Acquisition Corp., Senior Notes | | | 9.125 | % | | 12/1/18 | | | 590,000 | | | | 557,550 | (a) |
Oxford Industries Inc., Senior Secured Notes | | | 11.375 | % | | 7/15/15 | | | 595,000 | | | | 675,325 | |
Total Textiles, Apparel & Luxury Goods | | | | | | | | | | | | | 2,557,930 | |
Total Consumer Discretionary | | | | | | | | | | | | | 25,816,541 | |
| Consumer Staples — 1.6% | | | | | | | | | | | |
Food Products — 1.3% | | | | | | | | | | | | | | |
Blue Merger Sub Inc., Senior Notes | | | 7.625 | % | | 2/15/19 | | | 570,000 | | | | 578,550 | (a) |
See Notes to Financial Statements.
| | |
| 8 | | Legg Mason Western Asset Variable Global High Yield Bond Portfolio 2011 Semi-Annual Report |
Schedule of investments (unaudited) (cont’d)
June 30, 2011
Legg Mason Western Asset Variable Global High Yield Bond Portfolio
| | | | | | | | | | | | | | |
| Security | | Rate | | | Maturity
Date | | Face
Amount† | | | Value | |
Food Products — continued | | | | | | | | | | | | | | |
Bumble Bee Acquisiton Co., Senior Secured Notes | | | 9.000 | % | | 12/15/17 | | | 250,000 | | | $ | 252,500 | (a) |
Harmony Foods Corp., Senior Secured Notes | | | 10.000 | % | | 5/1/16 | | | 190,000 | | | | 194,750 | (a) |
Simmons Foods Inc., Senior Secured Notes | | | 10.500 | % | | 11/1/17 | | | 880,000 | | | | 937,200 | (a) |
Total Food Products | | | | | | | | | | | | | 1,963,000 | |
Personal Products — 0.2% | | | | | | | | | | | | | | |
Hypermarcas SA, Notes | | | 6.500 | % | | 4/20/21 | | | 380,000 | | | | 381,425 | (a) |
Tobacco — 0.1% | | | | | | | | | | | | | | |
Alliance One International Inc., Senior Notes | | | 10.000 | % | | 7/15/16 | | | 220,000 | | | | 213,400 | |
Total Consumer Staples | | | | | | | | | | | | | 2,557,825 | |
| Energy — 13.8% | | | | | | | | | | | | | | |
Energy Equipment & Services — 2.4% | | | | | | | | | | | | | | |
Complete Production Services Inc., Senior Notes | | | 8.000 | % | | 12/15/16 | | | 380,000 | | | | 399,000 | |
Hercules Offshore LLC, Senior Secured Notes | | | 10.500 | % | | 10/15/17 | | | 655,000 | | | | 687,750 | (a) |
Key Energy Services Inc., Senior Notes | | | 6.750 | % | | 3/1/21 | | | 390,000 | | | | 390,975 | |
Oil States International Inc., Senior Notes | | | 6.500 | % | | 6/1/19 | | | 400,000 | | | | 403,000 | (a) |
Parker Drilling Co., Senior Notes | | | 9.125 | % | | 4/1/18 | | | 310,000 | | | | 328,600 | |
Precision Drilling Corp., Senior Notes | | | 6.625 | % | | 11/15/20 | | | 350,000 | | | | 355,250 | |
Unit Corp., Senior Subordinated Notes | | | 6.625 | % | | 5/15/21 | | | 330,000 | | | | 330,412 | |
Vantage Drilling Co., Senior Secured Notes | | | 11.500 | % | | 8/1/15 | | | 710,000 | | | | 775,675 | |
Total Energy Equipment & Services | | | | | | | | | | | | | 3,670,662 | |
Oil, Gas & Consumable Fuels — 11.4% | | | | | | | | | | | | | | |
Arch Coal Inc., Senior Notes | | | 7.000 | % | | 6/15/19 | | | 420,000 | | | | 421,050 | (a) |
Berry Petroleum Co., Senior Notes | | | 6.750 | % | | 11/1/20 | | | 470,000 | | | | 473,525 | |
Calumet Specialty Products Partners LP/Calumet Finance Corp., Senior Notes | | | 9.375 | % | | 5/1/19 | | | 330,000 | | | | 341,550 | (a) |
Chesapeake Energy Corp., Senior Notes | | | 7.250 | % | | 12/15/18 | | | 680,000 | | | | 744,600 | |
Chesapeake Energy Corp., Senior Notes | | | 6.125 | % | | 2/15/21 | | | 500,000 | | | | 506,875 | |
Compagnie Generale de Geophysique-Veritas, Senior Notes | | | 7.750 | % | | 5/15/17 | | | 300,000 | | | | 310,500 | |
Concho Resources Inc., Senior Notes | | | 7.000 | % | | 1/15/21 | | | 390,000 | | | | 404,625 | |
CONSOL Energy Inc., Senior Notes | | | 8.250 | % | | 4/1/20 | | | 330,000 | | | | 361,350 | |
Corral Petroleum Holdings AB, Senior Bonds | | | 15.000 | % | | 9/18/11 | | | 706,863 | | | | 678,588 | (a)(c)(e) |
Crosstex Energy LP/Crosstex Energy Finance Corp., Senior Notes | | | 8.875 | % | | 2/15/18 | | | 120,000 | | | | 128,400 | |
Ecopetrol SA, Senior Notes | | | 7.625 | % | | 7/23/19 | | | 580,000 | | | | 697,450 | |
Energy Transfer Equity LP, Senior Notes | | | 7.500 | % | | 10/15/20 | | | 290,000 | | | | 308,850 | |
Enterprise Products Operating LLP, Junior Subordinated Notes | | | 8.375 | % | | 8/1/66 | | | 385,000 | | | | 417,194 | (e) |
EXCO Resources Inc., Senior Notes | | | 7.500 | % | | 9/15/18 | | | 540,000 | | | | 527,850 | |
See Notes to Financial Statements.
| | | | |
| Legg Mason Western Asset Variable Global High Yield Bond Portfolio 2011 Semi-Annual Report | | | 9 | |
Legg Mason Western Asset Variable Global High Yield Bond Portfolio
| | | | | | | | | | | | | | |
| Security | | Rate | | | Maturity
Date | | Face
Amount† | | | Value | |
Oil, Gas & Consumable Fuels — continued | | | | | | | | | | | | | | |
Indo Integrated Energy II BV, Senior Secured Notes | | | 9.750 | % | | 11/5/16 | | | 520,000 | | | $ | 595,400 | (a) |
KazMunaiGaz Finance Sub BV, Senior Notes | | | 8.375 | % | | 7/2/13 | | | 340,000 | | | | 371,875 | (a) |
LUKOIL International Finance BV, Bonds | | | 6.356 | % | | 6/7/17 | | | 250,000 | | | | 270,625 | (a) |
LUKOIL International Finance BV, Bonds | | | 6.656 | % | | 6/7/22 | | | 130,000 | | | | 137,150 | (a) |
MarkWest Energy Partners LP/MarkWest Energy Finance Corp., Senior Notes | | | 6.750 | % | | 11/1/20 | | | 310,000 | | | | 317,750 | |
MarkWest Energy Partners LP/MarkWest Energy Finance Corp., Senior Notes | | | 6.500 | % | | 8/15/21 | | | 380,000 | | | | 378,100 | |
MEG Energy Corp., Senior Notes | | | 6.500 | % | | 3/15/21 | | | 540,000 | | | | 544,725 | (a) |
Milagro Oil & Gas Inc., Secured Notes | | | 10.500 | % | | 5/15/16 | | | 520,000 | | | | 491,400 | (a) |
Novatek Finance Ltd., Notes | | | 6.604 | % | | 2/3/21 | | | 400,000 | | | | 420,000 | (a) |
Offshore Group Investments Ltd., Senior Secured Notes | | | 11.500 | % | | 8/1/15 | | | 190,000 | | | | 207,575 | (a) |
Overseas Shipholding Group Inc., Senior Notes | | | 8.125 | % | | 3/30/18 | | | 935,000 | | | | 922,144 | |
Pan American Energy LLC, Senior Notes | | | 7.875 | % | | 5/7/21 | | | 130,000 | | | | 138,450 | (a) |
Pan American Energy LLC, Senior Notes | | | 7.875 | % | | 5/7/21 | | | 88,000 | | | | 93,720 | (a) |
Peabody Energy Corp., Senior Notes | | | 7.875 | % | | 11/1/26 | | | 100,000 | | | | 112,750 | |
Petrobras International Finance Co., Senior Notes | | | 6.875 | % | | 1/20/40 | | | 250,000 | | | | 267,440 | |
Petrobras International Finance Co., Senior Notes | | | 6.750 | % | | 1/27/41 | | | 200,000 | | | | 214,423 | |
Petroleum Co. of Trinidad & Tobago Ltd., Senior Notes | | | 9.750 | % | | 8/14/19 | | | 320,000 | | | | 388,000 | (a) |
Petroplus Finance Ltd., Senior Notes | | | 6.750 | % | | 5/1/14 | | | 500,000 | | | | 492,500 | (a) |
Plains Exploration & Production Co., Senior Notes | | | 10.000 | % | | 3/1/16 | | | 320,000 | | | | 361,600 | |
Plains Exploration & Production Co., Senior Notes | | | 8.625 | % | | 10/15/19 | | | 265,000 | | | | 290,175 | |
PT Adaro Indonesia, Senior Notes | | | 7.625 | % | | 10/22/19 | | | 190,000 | | | | 211,850 | (a) |
Quicksilver Resources Inc., Senior Notes | | | 11.750 | % | | 1/1/16 | | | 1,050,000 | | | | 1,207,500 | |
Quicksilver Resources Inc., Senior Notes | | | 9.125 | % | | 8/15/19 | | | 100,000 | | | | 109,500 | |
Range Resources Corp., Senior Subordinated Notes | | | 8.000 | % | | 5/15/19 | | | 150,000 | | | | 163,500 | |
Regency Energy Partners LP/Regency Energy Finance Corp., Senior Notes | | | 6.875 | % | | 12/1/18 | | | 430,000 | | | | 447,200 | |
SandRidge Energy Inc., Senior Notes | | | 7.500 | % | | 3/15/21 | | | 165,000 | | | | 167,269 | (a) |
Teekay Corp., Senior Notes | | | 8.500 | % | | 1/15/20 | | | 545,000 | | | | 565,438 | |
TNK-BP Finance SA, Senior Notes | | | 7.500 | % | | 7/18/16 | | | 220,000 | | | | 248,050 | (a) |
TNK-BP Finance SA, Senior Notes | | | 7.875 | % | | 3/13/18 | | | 490,000 | | | | 564,725 | (a) |
TNK-BP Finance SA, Senior Notes | | | 7.875 | % | | 3/13/18 | | | 150,000 | | | | 172,875 | (a) |
Whiting Petroleum Corp., Senior Subordinated Notes | | | 6.500 | % | | 10/1/18 | | | 280,000 | | | | 292,600 | |
Xinergy Ltd., Senior Secured Notes | | | 9.250 | % | | 5/15/19 | | | 450,000 | | | | 456,750 | (a) |
Total Oil, Gas & Consumable Fuels | | | | | | | | | | | | | 17,945,466 | |
Total Energy | | | | | | | | | | | | | 21,616,128 | |
See Notes to Financial Statements.
| | |
| 10 | | Legg Mason Western Asset Variable Global High Yield Bond Portfolio 2011 Semi-Annual Report |
Schedule of investments (unaudited) (cont’d)
June 30, 2011
Legg Mason Western Asset Variable Global High Yield Bond Portfolio
| | | | | | | | | | | | | | |
| Security | | Rate | | | Maturity
Date | | Face
Amount† | | | Value | |
| Financials — 8.0% | | | | | | | | | | | | | | |
Capital Markets — 0.3% | | | | | | | | | | | | | | |
Boparan Holdings Ltd., Senior Notes | | | 9.875 | % | | 4/30/18 | | | 300,000 | GBP | | $ | 461,624 | (a)(e) |
Commercial Banks — 2.4% | | | | | | | | | | | | | | |
BAC Capital Trust VI, Capital Securities, Junior Subordinated Notes | | | 5.625 | % | | 3/8/35 | | | 230,000 | | | | 198,727 | |
BankAmerica Institutional Capital A, Junior Subordinated Bonds | | | 8.070 | % | | 12/31/26 | | | 120,000 | | | | 123,000 | (a) |
Credit Agricole SA, Subordinated Notes | | | 8.375 | % | | 10/13/19 | | | 200,000 | | | | 210,000 | (a)(e) |
Deutsche Postbank Funding Trust IV, Subordinated Notes | | | 5.983 | % | | 6/29/17 | | | 650,000 | EUR | | | 784,712 | (e) |
HBOS PLC, Subordinated Notes | | | 1.730 | % | | 9/1/16 | | | 412,000 | EUR | | | 530,023 | (e) |
NB Capital Trust II, Junior Subordinated Notes | | | 7.830 | % | | 12/15/26 | | | 220,000 | | | | 224,125 | |
NB Capital Trust IV, Junior Subordinated Notes | | | 8.250 | % | | 4/15/27 | | | 220,000 | | | | 226,325 | |
Royal Bank of Scotland Group PLC, Junior Subordinated Bonds | | | 7.648 | % | | 9/30/31 | | | 510,000 | | | | 461,550 | (e) |
RSHB Capital, Loan Participation Notes, Senior Secured Notes | | | 7.175 | % | | 5/16/13 | | | 690,000 | | | | 746,063 | (a) |
Santander Finance Preferred SA Unipersonal, Junior Subordinated Notes | | | 10.500 | % | | 9/29/14 | | | 190,000 | | | | 207,465 | (e) |
Total Commercial Banks | | | | | | | | | | | | | 3,711,990 | |
Consumer Finance — 0.4% | | | | | | | | | | | | | | |
SLM Corp., Medium-Term Notes | | | 8.000 | % | | 3/25/20 | | | 550,000 | | | | 591,526 | |
Diversified Financial Services — 3.5% | | | | | | | | | | | | | | |
Bankrate Inc., Senior Secured Notes | | | 11.750 | % | | 7/15/15 | | | 104,000 | | | | 119,080 | (a) |
Boats Investments (Netherlands) BV, Secured Notes | | | 8.710 | % | | 12/15/15 | | | 746,623 | EUR | | | 806,623 | (c) |
Capital One Capital V, Junior Subordinated Notes, Cumulative Trust Preferred Securities | | | 10.250 | % | | 8/15/39 | | | 260,000 | | | | 277,225 | |
Countrywide Capital III, Junior Subordinated Notes | | | 8.050 | % | | 6/15/27 | | | 140,000 | | | | 145,600 | |
ING Groep NV, Subordinated Bonds | | | 5.140 | % | | 3/17/16 | | | 550,000 | GBP | | | 745,910 | (e) |
International Lease Finance Corp., Senior Notes | | | 8.625 | % | | 9/15/15 | | | 460,000 | | | | 500,250 | (e) |
International Lease Finance Corp., Senior Notes | | | 8.750 | % | | 3/15/17 | | | 240,000 | | | | 263,100 | (e) |
International Lease Finance Corp., Senior Notes | | | 8.875 | % | | 9/1/17 | | | 240,000 | | | | 265,200 | |
International Lease Finance Corp., Senior Notes | | | 8.250 | % | | 12/15/20 | | | 920,000 | | | | 995,900 | |
MBNA Capital A, Junior Subordinated Notes | | | 8.278 | % | | 12/1/26 | | | 350,000 | | | | 359,187 | |
MMG Fiduciary & Trust Corp. | | | 6.750 | % | | 2/1/16 | | | 120,000 | | | | 122,400 | (a) |
Polish Television Holding BV, Senior Secured Bonds | | | 11.250 | % | | 5/15/17 | | | 250,000 | EUR | | | 378,852 | (a)(d)(e) |
Telenet Finance III Luxembourg S.C.A., Senior Secured Notes | | | 6.625 | % | | 2/15/21 | | | 400,000 | EUR | | | 563,746 | (a) |
Total Diversified Financial Services | | | | | | | | | | | | | 5,543,073 | |
See Notes to Financial Statements.
| | | | |
| Legg Mason Western Asset Variable Global High Yield Bond Portfolio 2011 Semi-Annual Report | | | 11 | |
Legg Mason Western Asset Variable Global High Yield Bond Portfolio
| | | | | | | | | | | | | | |
| Security | | Rate | | | Maturity
Date | | Face
Amount† | | | Value | |
Insurance — 0.7% | | | | | | | | | | | | | | |
Dai-ichi Life Insurance Co., Ltd., Subordinated Notes | | | 7.250 | % | | 7/25/21 | | | 180,000 | | | $ | 180,211 | (a)(e) |
ELM BV | | | 5.252 | % | | 5/25/16 | | | 500,000 | EUR | | | 641,706 | (e) |
ING Capital Funding Trust III, Junior Subordinated Bonds | | | 3.846 | % | | 9/30/11 | | | 370,000 | | | | 351,126 | (e) |
Total Insurance | | | | | | | | | | | | | 1,173,043 | |
Real Estate Management & Development — 0.5% | | | | | | | | | | | | | | |
Agile Property Holdings Ltd., Senior Notes | | | 10.000 | % | | 11/14/16 | | | 270,000 | | | | 286,200 | (a) |
Countrywide Holdings, Senior Secured Notes | | | 10.000 | % | | 5/8/18 | | | 283,000 | GBP | | | 461,014 | (a) |
Total Real Estate Management & Development | | | | | | | | | | | | | 747,214 | |
Thrifts & Mortgage Finance — 0.2% | | | | | | | | | | | | | | |
General Motors Financial Co., Senior Notes | | | 6.750 | % | | 6/1/18 | | | 370,000 | | | | 372,775 | (a) |
Total Financials | | | | | | | | | | | | | 12,601,245 | |
| Health Care — 4.4% | | | | | | | | | | | | | | |
Health Care Equipment & Supplies — 0.7% | | | | | | | | | | | | | | |
Biomet Inc., Senior Notes | | | 10.000 | % | | 10/15/17 | | | 140,000 | | | | 153,300 | |
Biomet Inc., Senior Toggle Notes | | | 10.375 | % | | 10/15/17 | | | 100,000 | | | | 110,750 | (c) |
Ontex, Senior Notes | | | 9.000 | % | | 4/15/19 | | | 250,000 | EUR | | | 341,692 | (a) |
Ontex IV SA, Senior Notes | | | 9.000 | % | | 4/15/19 | | | 430,000 | EUR | | | 587,709 | (a) |
Total Health Care Equipment & Supplies | | | | | | | | | | | | | 1,193,451 | |
Health Care Providers & Services — 2.9% | | | | | | | | | | | | | | |
American Renal Holdings, Senior Notes | | | 9.750 | % | | 3/1/16 | | | 600,000 | | | | 603,569 | (a)(c) |
American Renal Holdings, Senior Secured Notes | | | 8.375 | % | | 5/15/18 | | | 250,000 | | | | 255,937 | |
CRC Health Corp., Senior Subordinated Notes | | | 10.750 | % | | 2/1/16 | | | 1,355,000 | | | | 1,385,487 | |
Fresenius Medical Care U.S. Finance Inc., Senior Notes | | | 6.875 | % | | 7/15/17 | | | 440,000 | | | | 467,500 | |
Fresenius U.S. Finance II Inc., Senior Notes | | | 9.000 | % | | 7/15/15 | | | 40,000 | | | | 45,450 | (a) |
InVentiv Health Inc., Senior Notes | | | 10.000 | % | | 8/15/18 | | | 440,000 | | | | 419,600 | (a) |
Labco SAS, Senior Secured Notes | | | 8.500 | % | | 1/15/18 | | | 180,000 | EUR | | | 266,900 | (a) |
Symbion Inc., Senior Secured Notes | | | 8.000 | % | | 6/15/16 | | | 80,000 | | | | 78,600 | (a) |
Tenet Healthcare Corp., Senior Notes | | | 6.875 | % | | 11/15/31 | | | 150,000 | | | | 126,000 | |
Tenet Healthcare Corp., Senior Secured Notes | | | 8.875 | % | | 7/1/19 | | | 556,000 | | | | 616,465 | |
Universal Hospital Services Inc., Senior Secured Notes | | | 8.500 | % | | 6/1/15 | | | 225,000 | | | | 232,875 | (c) |
Total Health Care Providers & Services | | | | | | | | | | | | | 4,498,383 | |
Pharmaceuticals — 0.8% | | | | | | | | | | | | | | |
ConvaTec Healthcare E SA, Senior Notes | | | 10.875 | % | | 12/15/18 | | | 407,000 | EUR | | | 613,819 | (a) |
Endo Pharmaceuticals Holdings Inc., Senior Notes | | | 7.000 | % | | 7/15/19 | | | 70,000 | | | | 72,100 | (a) |
Giant Funding Corp., Senior Secured Notes | | | 8.250 | % | | 2/1/18 | | | 240,000 | | | | 251,400 | (a) |
UCB SA, Subordinated Notes | | | 7.750 | % | | 3/18/16 | | | 200,000 | EUR | | | 302,574 | |
Total Pharmaceuticals | | | | | | | | | | | | | 1,239,893 | |
Total Health Care | | | | | | | | | | | | | 6,931,727 | |
See Notes to Financial Statements.
| | |
| 12 | | Legg Mason Western Asset Variable Global High Yield Bond Portfolio 2011 Semi-Annual Report |
Schedule of investments (unaudited) (cont’d)
June 30, 2011
Legg Mason Western Asset Variable Global High Yield Bond Portfolio
| | | | | | | | | | | | | | |
| Security | | Rate | | | Maturity
Date | | Face
Amount† | | | Value | |
| Industrials — 12.0% | | | | | | | | | | | | | | |
Aerospace & Defense — 1.8% | | | | | | | | | | | | | | |
Ducommun Inc., Senior Notes | | | 9.750 | % | | 7/15/18 | | | 220,000 | | | $ | 227,150 | (a) |
FGI Operating Co. Inc., Senior Secured Notes | | | 10.250 | % | | 8/1/15 | | | 515,000 | | | | 549,762 | |
Kratos Defense & Security Solutions Inc., Senior Secured Notes | | | 10.000 | % | | 6/1/17 | | | 420,000 | | | | 445,200 | (a) |
Kratos Defense & Security Solutions Inc., Senior Secured Notes | | | 10.000 | % | | 6/1/17 | | | 240,000 | | | | 254,400 | |
Northrop Grumman Corp., Senior Notes | | | 6.875 | % | | 3/15/18 | | | 270,000 | | | | 278,100 | (a) |
Northrop Grumman Corp., Senior Notes | | | 7.125 | % | | 3/15/21 | | | 270,000 | | | | 280,800 | (a) |
Triumph Group Inc., Senior Notes | | | 8.625 | % | | 7/15/18 | | | 320,000 | | | | 352,400 | |
Wyle Services Corp., Senior Subordinated Notes | | | 10.500 | % | | 4/1/18 | | | 425,000 | | | | 452,625 | (a) |
Total Aerospace & Defense | | | | | | | | | | | | | 2,840,437 | |
Air Freight & Logistics — 0.5% | | | | | | | | | | | | | | |
TGI International Ltd., Senior Notes | | | 9.500 | % | | 10/3/17 | | | 650,000 | | | | 733,688 | (a) |
Airlines — 1.5% | | | | | | | | | | | | | | |
American Airlines Pass-Through Trust, Secured Notes | | | 7.000 | % | | 1/31/18 | | | 240,000 | | | | 226,800 | (a) |
BAA SH PLC, Senior Secured Notes | | | 7.125 | % | | 3/1/17 | | | 500,000 | GBP | | | 787,296 | |
Continental Airlines Inc., Pass-Through Certificates | | | 7.373 | % | | 6/15/17 | | | 179,499 | | | | 180,307 | |
Continental Airlines Inc., Pass-Through Certificates, Subordinated Secured Notes | | | 7.339 | % | | 4/19/14 | | | 65,871 | | | | 65,706 | |
Continental Airlines Inc., Senior Secured Notes | | | 6.750 | % | | 9/15/15 | | | 250,000 | | | | 252,500 | (a) |
Delta Air Lines Inc., Pass-Through Certificates | | | 8.954 | % | | 8/10/14 | | | 389,915 | | | | 402,119 | |
Delta Air Lines Inc., Pass-Through Certificates, Secured Notes | | | 8.021 | % | | 2/10/24 | | | 45,938 | | | | 46,682 | |
Delta Air Lines Inc., Pass-Through Certificates, Subordinated Secured Notes | | | 9.750 | % | | 12/17/16 | | | 111,320 | | | | 117,999 | |
Delta Air Lines Inc., Senior Secured Notes | | | 9.500 | % | | 9/15/14 | | | 144,000 | | | | 154,260 | (a) |
United Air Lines Inc., Senior Secured Notes | | | 9.875 | % | | 8/1/13 | | | 90,000 | | | | 94,950 | (a) |
Total Airlines | | | | | | | | | | | | | 2,328,619 | |
Building Products — 0.8% | | | | | | | | | | | | | | |
Ashton Woods USA LLC/Ashton Woods Finance Co., Senior Subordinated Notes | | | 0.000 | % | | 6/30/15 | | | 231,400 | | | | 141,154 | (a)(b)(e) |
Building Materials Corp. of America, Senior Notes | | | 6.750 | % | | 5/1/21 | | | 720,000 | | | | 725,400 | (a) |
Rearden G Holdings EINS GmbH, Senior Notes | | | 7.875 | % | | 3/30/20 | | | 160,000 | | | | 175,200 | (a) |
Shea Homes LP, Senior Secured Notes | | | 8.625 | % | | 5/15/19 | | | 270,000 | | | | 266,625 | (a) |
Total Building Products | | | | | | | | | | | | | 1,308,379 | |
Commercial Services & Supplies — 1.4% | | | | | | | | | | | | | | |
ALBA Group PLC & Co. KG, Senior Notes | | | 8.000 | % | | 5/15/18 | | | 150,000 | EUR | | | 218,338 | (a) |
Altegrity Inc., Senior Subordinated Notes | | | 11.750 | % | | 5/1/16 | | | 740,000 | | | | 780,700 | (a) |
See Notes to Financial Statements.
| | | | |
| Legg Mason Western Asset Variable Global High Yield Bond Portfolio 2011 Semi-Annual Report | | | 13 | |
Legg Mason Western Asset Variable Global High Yield Bond Portfolio
| | | | | | | | | | | | | | |
| Security | | Rate | | | Maturity
Date | | Face
Amount† | | | Value | |
Commercial Services & Supplies — continued | | | | | | | | | | | | | | |
American Reprographics Co., Senior Notes | | | 10.500 | % | | 12/15/16 | | | 530,000 | | | $ | 555,175 | |
Geo Group Inc., Senior Notes | | | 7.750 | % | | 10/15/17 | | | 370,000 | | | | 394,050 | |
RSC Equipment Rental Inc./RSC Holdings III LLC, Senior Notes | | | 8.250 | % | | 2/1/21 | | | 220,000 | | | | 220,000 | |
Total Commercial Services & Supplies | | | | | | | | | | | | | 2,168,263 | |
Construction & Engineering — 0.7% | | | | | | | | | | | | | | |
Abengoa Finance SAU, Senior Notes | | | 8.875 | % | | 11/1/17 | | | 420,000 | | | | 431,025 | (a) |
Odebrecht Finance Ltd., Senior Notes | | | 6.000 | % | | 4/5/23 | | | 650,000 | | | | 649,188 | (a) |
Total Construction & Engineering | | | | | | | | | | | | | 1,080,213 | |
Electrical Equipment — 0.3% | | | | | | | | | | | | | | |
NES Rentals Holdings Inc., Senior Secured Notes | | | 12.250 | % | | 4/15/15 | | | 480,000 | | | | 466,800 | (a) |
Industrial Conglomerates — 0.2% | | | | | | | | | | | | | | |
Leucadia National Corp., Senior Notes | | | 8.125 | % | | 9/15/15 | | | 320,000 | | | | 354,400 | |
Machinery — 0.8% | | | | | | | | | | | | | | |
Dematic SA, Senior Secured Notes | | | 8.750 | % | | 5/1/16 | | | 690,000 | | | | 688,275 | (a) |
Lonking Holdings Ltd., Senior Notes | | | 8.500 | % | | 6/3/16 | | | 560,000 | | | | 561,400 | (a) |
Total Machinery | | | | | | | | | | | | | 1,249,675 | |
Marine — 0.7% | | | | | | | | | | | | | | |
Navios Maritime Acquisition Corp., Senior Secured Notes | | | 8.625 | % | | 11/1/17 | | | 160,000 | | | | 158,400 | (a) |
Navios Maritime Acquisition Corp./Navios Acquisition Finance U.S. Inc., Senior Secured Notes | | | 8.625 | % | | 11/1/17 | | | 730,000 | | | | 722,700 | |
Navios Maritime Holdings Inc./Navios Maritime Finance II U.S. Inc., Senior Notes | | | 8.125 | % | | 2/15/19 | | | 230,000 | | | | 221,950 | (a) |
Total Marine | | | | | | | | | | | | | 1,103,050 | |
Road & Rail — 2.3% | | | | | | | | | | | | | | |
Florida East Coast Holdings Corp., Senior Notes | | | 10.500 | % | | 8/1/17 | | | 670,000 | | | | 698,475 | (a)(c) |
Florida East Coast Industries Inc., Senior Secured Notes | | | 8.125 | % | | 2/1/17 | | | 450,000 | | | | 466,875 | (a) |
Jack Cooper Holdings Corp., Senior Secured Notes | | | 12.750 | % | | 12/15/15 | | | 737,000 | | | | 781,220 | (a)(d) |
Kansas City Southern de Mexico, Senior Notes | | | 12.500 | % | | 4/1/16 | | | 204,000 | | | | 242,760 | |
Kansas City Southern de Mexico, Senior Notes | | | 8.000 | % | | 2/1/18 | | | 865,000 | | | | 942,850 | |
Kansas City Southern Railway, Senior Notes | | | 13.000 | % | | 12/15/13 | | | 20,000 | | | | 23,350 | |
Kansas City Southern Railway, Senior Notes | | | 8.000 | % | | 6/1/15 | | | 45,000 | | | | 48,487 | |
RailAmerica Inc., Senior Secured Notes | | | 9.250 | % | | 7/1/17 | | | 418,000 | | | | 460,845 | |
Total Road & Rail | | | | | | | | | | | | | 3,664,862 | |
Transportation — 1.0% | | | | | | | | | | | | | | |
CMA CGM, Senior Notes | | | 8.875 | % | | 4/15/19 | | | 600,000 | EUR | | | 733,051 | (a) |
Hapag-Lloyd AG, Senior Notes | | | 9.750 | % | | 10/15/17 | | | 340,000 | | | | 343,400 | (a) |
See Notes to Financial Statements.
| | |
| 14 | | Legg Mason Western Asset Variable Global High Yield Bond Portfolio 2011 Semi-Annual Report |
Schedule of investments (unaudited) (cont’d)
June 30, 2011
Legg Mason Western Asset Variable Global High Yield Bond Portfolio
| | | | | | | | | | | | | | |
| Security | | Rate | | | Maturity
Date | | Face
Amount† | | | Value | |
Transportation — continued | | | | | | | | | | | | | | |
Syncreon Global Ireland Ltd./Syncreon Global Finance US Inc., Senior Notes | | | 9.500 | % | | 5/1/18 | | | 390,000 | | | $ | 403,650 | (a) |
Total Transportation | | | | | | | | | | | | | 1,480,101 | |
Total Industrials | | | | | | | | | | | | | 18,778,487 | |
| Information Technology — 1.8% | | | | | | | | | | | | | | |
Electronic Equipment, Instruments & Components — 0.5% | | | | | | | | | | | |
NXP BV/NXP Funding LLC, Senior Secured Notes | | | 9.750 | % | | 8/1/18 | | | 750,000 | | | | 843,750 | (a) |
IT Services — 0.8% | | | | | | | | | | | | | | |
Ceridian Corp., Senior Notes | | | 12.250 | % | | 11/15/15 | | | 362,100 | | | | 369,342 | (c) |
First Data Corp., Senior Notes | | | 11.250 | % | | 3/31/16 | | | 30,000 | | | | 29,700 | |
First Data Corp., Senior Secured Notes | | | 7.375 | % | | 6/15/19 | | | 870,000 | | | | 880,875 | (a) |
Total IT Services | | | | | | | | | | | | | 1,279,917 | |
Semiconductors & Semiconductor Equipment — 0.5% | | | | | | | | | | | |
CDW LLC/CDW Finance Corp., Senior Notes | | | 11.500 | % | | 10/12/15 | | | 320,000 | | | | 339,200 | (c) |
Freescale Semiconductor Inc., Senior Notes | | | 10.750 | % | | 8/1/20 | | | 170,000 | | | | 192,950 | (a) |
STATS ChipPAC Ltd., Senior Notes | | | 7.500 | % | | 8/12/15 | | | 215,000 | | | | 228,975 | (a) |
Total Semiconductors & Semiconductor Equipment | | | | | | | | | | 761,125 | |
Total Information Technology | | | | | | | | | | | | | 2,884,792 | |
| Materials — 11.5% | | | | | | | | | | | | | | |
Chemicals — 2.6% | | | | | | | | | | | | | | |
Georgia Gulf Corp., Senior Secured Notes | | | 9.000 | % | | 1/15/17 | | | 435,000 | | | | 465,450 | (a) |
Ineos Finance PLC, Senior Secured Notes | | | 9.000 | % | | 5/15/15 | | | 410,000 | | | | 432,550 | (a) |
LBI Escrow Corp., Senior Secured Notes | | | 8.000 | % | | 11/1/17 | | | 286,000 | | | | 318,890 | (a) |
Lyondell Chemical Co., Senior Secured Notes | | | 11.000 | % | | 5/1/18 | | | 580,000 | | | | 652,500 | |
Rhodia SA, Senior Notes | | | 6.875 | % | | 9/15/20 | | | 640,000 | | | | 752,800 | (a) |
Solutia Inc., Senior Notes | | | 8.750 | % | | 11/1/17 | | | 190,000 | | | | 207,100 | |
Solutia Inc., Senior Notes | | | 7.875 | % | | 3/15/20 | | | 60,000 | | | | 64,500 | |
Styrolution GmbH, Senior Secured Notes | | | 7.625 | % | | 5/15/16 | | | 600,000 | EUR | | | 857,038 | (a) |
Texas Petrochemical Corp. Group LLC, Senior Secured Notes | | | 8.250 | % | | 10/1/17 | | | 250,000 | | | | 260,000 | (a) |
Total Chemicals | | | | | | | | | | | | | 4,010,828 | |
Construction Materials — 0.3% | | | | | | | | | | | | | | |
West China Cement Ltd., Senior Notes | | | 7.500 | % | | 1/25/16 | | | 560,000 | | | | 540,400 | (a) |
Containers & Packaging — 1.9% | | | | | | | | | | | | | | |
ARD Finance SA, Senior Secured Notes | | | 11.125 | % | | 6/1/18 | | | 200,000 | | | | 205,500 | (a)(c) |
Ardagh Packaging Finance PLC, Senior Notes | | | 9.250 | % | | 10/15/20 | | | 375,000 | EUR | | | 556,722 | (a) |
Berry Plastics Corp., Secured Notes | | | 9.750 | % | | 1/15/21 | | | 140,000 | | | | 136,150 | |
Clondalkin Industries BV, Senior Secured Notes | | | 8.000 | % | | 3/15/14 | | | 132,000 | EUR | | | 183,284 | (a) |
See Notes to Financial Statements.
| | | | |
| Legg Mason Western Asset Variable Global High Yield Bond Portfolio 2011 Semi-Annual Report | | | 15 | |
Legg Mason Western Asset Variable Global High Yield Bond Portfolio
| | | | | | | | | | | | | | |
| Security | | Rate | | | Maturity
Date | | Face
Amount† | | | Value | |
Containers & Packaging — continued | | | | | | | | | | | | | | |
Longview Fibre Paper & Packaging Inc., Senior Secured Notes | | | 8.000 | % | | 6/1/16 | | | 380,000 | | | $ | 383,800 | (a) |
Reynolds Group Issuer Inc., Senior Notes | | | 9.500 | % | | 6/15/17 | | | 60,000 | EUR | | | 83,964 | (a) |
Reynolds Group Issuer Inc./Reynolds Group Issuer LLC, Senior Notes | | | 8.250 | % | | 2/15/21 | | | 680,000 | | | | 639,200 | (a) |
Viskase Cos. Inc., Senior Secured Notes | | | 9.875 | % | | 1/15/18 | | | 690,000 | | | | 722,775 | (a)(b) |
Total Containers & Packaging | | | | | | | | | | | | | 2,911,395 | |
Metals & Mining — 4.8% | | | | | | | | | | | | | | |
China Oriental Group Co. Ltd. | | | 7.000 | % | | 11/17/17 | | | 400,000 | | | | 388,000 | (a) |
CSN Resources SA, Senior Bonds | | | 6.500 | % | | 7/21/20 | | | 190,000 | | | | 202,825 | (a) |
CSN Resources SA, Senior Bonds | | | 6.500 | % | | 7/21/20 | | | 186,000 | | | | 198,555 | (a) |
Evraz Group SA, Notes | | | 6.750 | % | | 4/27/18 | | | 1,170,000 | | | | 1,175,850 | (a) |
Evraz Group SA, Senior Notes | | | 9.500 | % | | 4/24/18 | | | 370,000 | | | | 426,425 | (a) |
FMG Resources (August 2006), Senior Notes | | | 6.375 | % | | 2/1/16 | | | 250,000 | | | | 250,625 | (a) |
Gerdau Holdings Inc., Senior Notes | | | 7.000 | % | | 1/20/20 | | | 354,000 | | | | 394,710 | (a) |
Midwest Vanadium Pty Ltd., Senior Secured Notes | | | 11.500 | % | | 2/15/18 | | | 780,000 | | | | 781,950 | (a) |
Novelis Inc., Senior Notes | | | 8.750 | % | | 12/15/20 | | | 670,000 | | | | 726,950 | |
Rio Tinto Finance USA Ltd., Senior Notes | | | 9.000 | % | | 5/1/19 | | | 120,000 | | | | 159,242 | |
Ryerson Holding Corp., Senior Secured Notes | | | 0.000 | % | | 2/1/15 | | | 700,000 | | | | 367,500 | |
Southern Copper Corp., Senior Notes | | | 6.750 | % | | 4/16/40 | | | 60,000 | | | | 58,669 | |
Thompson Creek Metals Co. Inc., Senior Notes | | | 7.375 | % | | 6/1/18 | | | 420,000 | | | | 413,700 | (a) |
Vale Overseas Ltd., Notes | | | 8.250 | % | | 1/17/34 | | | 63,000 | | | | 77,388 | |
Vale Overseas Ltd., Notes | | | 6.875 | % | | 11/21/36 | | | 287,000 | | | | 312,338 | |
Vedanta Resources PLC, Senior Notes | | | 8.750 | % | | 1/15/14 | | | 670,000 | | | | 721,925 | (a) |
Vedanta Resources PLC, Senior Notes | | | 6.750 | % | | 6/7/16 | | | 860,000 | | | | 861,032 | (a) |
Total Metals & Mining | | | | | | | | | | | | | 7,517,684 | |
Paper & Forest Products — 1.9% | | | | | | | | | | | | | | |
Appleton Papers Inc., Senior Secured Notes | | | 11.250 | % | | 12/15/15 | | | 441,000 | | | | 447,615 | |
China Forestry Holdings Co., Ltd., Senior Secured Bonds | | | 7.750 | % | | 11/17/15 | | | 600,000 | | | | 475,500 | (a)(b) |
Fibria Overseas Finance Ltd., Senior Notes | | | 7.500 | % | | 5/4/20 | | | 320,000 | | | | 350,016 | (a) |
Fibria Overseas Finance Ltd., Senior Notes | | | 6.750 | % | | 3/3/21 | | | 240,000 | | | | 252,600 | (a) |
NewPage Corp., Senior Secured Notes | | | 11.375 | % | | 12/31/14 | | | 160,000 | | | | 150,000 | |
PE Paper Escrow GmbH, Senior Secured Notes | | | 11.750 | % | | 8/1/14 | | | 423,000 | EUR | | | 695,457 | (a) |
Sino-Forest Corp., Notes | | | 6.250 | % | | 10/21/17 | | | 280,000 | | | | 130,200 | (a) |
Sino-Forest Corp., Senior Bonds | | | 10.250 | % | | 7/28/14 | | | 430,000 | | | | 217,150 | (a) |
Verso Paper Holdings LLC, Senior Secured Notes | | | 8.750 | % | | 2/1/19 | | | 370,000 | | | | 331,150 | (a) |
Total Paper & Forest Products | | | | | | | | | | | | | 3,049,688 | |
Total Materials | | | | | | | | | | | | | 18,029,995 | |
See Notes to Financial Statements.
| | |
| 16 | | Legg Mason Western Asset Variable Global High Yield Bond Portfolio 2011 Semi-Annual Report |
Schedule of investments (unaudited) (cont’d)
June 30, 2011
Legg Mason Western Asset Variable Global High Yield Bond Portfolio
| | | | | | | | | | | | | | |
| Security | | Rate | | | Maturity
Date | | Face
Amount† | | | Value | |
| Telecommunication Services — 8.3% | | | | | | | | | | | | | | |
Diversified Telecommunication Services — 4.8% | | | | | | | | | | | | | | |
Axtel SAB de CV, Senior Notes | | | 7.625 | % | | 2/1/17 | | | 790,000 | | | $ | 754,450 | (a) |
Axtel SAB de CV, Senior Notes | | | 9.000 | % | | 9/22/19 | | | 84,000 | | | | 82,446 | (a) |
Cincinnati Bell Telephone Co., Senior Debentures | | | 6.300 | % | | 12/1/28 | | | 20,000 | | | | 16,300 | |
Cogent Communications Group Inc., Senior Secured Notes | | | 8.375 | % | | 2/15/18 | | | 450,000 | | | | 463,500 | (a) |
Inmarsat Finance PLC, Senior Notes | | | 7.375 | % | | 12/1/17 | | | 290,000 | | | | 308,850 | (a) |
Intelsat Jackson Holdings SA, Senior Notes | | | 7.250 | % | | 4/1/19 | | | 270,000 | | | | 268,650 | (a) |
Primus Telecommunications Group Inc., Senior Subordinated Secured Notes | | | 14.250 | % | | 5/20/13 | | | 78,937 | | | | 79,726 | (c) |
Satelite Mexicanos SA de CV, Senior Secured Notes | | | 9.500 | % | | 5/15/17 | | | 340,000 | | | | 348,500 | (a) |
Sunrise Communications Holdings SA, Senior Secured Notes | | | 8.500 | % | | 12/31/18 | | | 125,000 | EUR | | | 190,332 | (a) |
TW Telecom Holdings Inc., Senior Notes | | | 8.000 | % | | 3/1/18 | | | 350,000 | | | | 374,938 | |
UBS Luxembourg SA for OJSC Vimpel Communications, Loan Participation Notes | | | 8.250 | % | | 5/23/16 | | | 100,000 | | | | 110,125 | (a) |
Vimpel Communications, Notes | | | 6.493 | % | | 2/2/16 | | | 200,000 | | | | 207,000 | (a) |
VIP Finance Ireland Ltd. for OJSC Vimpel Communications, Loan Participation Notes, Secured Notes | | | 8.375 | % | | 4/30/13 | | | 870,000 | | | | 941,416 | (a) |
West Corp., Senior Notes | | | 8.625 | % | | 10/1/18 | | | 530,000 | | | | 537,950 | (a) |
West Corp., Senior Notes | | | 7.875 | % | | 1/15/19 | | | 590,000 | | | | 573,775 | (a) |
West Corp., Senior Subordinated Notes | | | 11.000 | % | | 10/15/16 | | | 540,000 | | | | 575,100 | |
Wind Acquisition Finance SA, Senior Secured Notes | | | 7.250 | % | | 2/15/18 | | | 740,000 | | | | 771,450 | (a) |
Windstream Corp., Senior Notes | | | 7.500 | % | | 4/1/23 | | | 860,000 | | | | 864,300 | |
Total Diversified Telecommunication Services | | | | | | | | | | | | | 7,468,808 | |
Wireless Telecommunication Services — 3.5% | | | | | | | | | | | | | | |
Buccaneer Merger Sub Inc., Senior Notes | | | 9.125 | % | | 1/15/19 | | | 515,000 | | | | 538,175 | (a) |
MetroPCS Wireless Inc., Senior Notes | | | 7.875 | % | | 9/1/18 | | | 240,000 | | | | 255,300 | |
Phones4u Finance PLC, Senior Secured Notes | | | 9.500 | % | | 4/1/18 | | | 410,000 | GBP | | | 638,289 | (a) |
Sprint Capital Corp., Senior Notes | | | 6.875 | % | | 11/15/28 | | | 780,000 | | | | 742,950 | |
Sprint Capital Corp., Senior Notes | | | 8.750 | % | | 3/15/32 | | | 1,515,000 | | | | 1,647,562 | |
True Move Co., Ltd. | | | 10.750 | % | | 12/16/13 | | | 635,000 | | | | 688,181 | (a) |
True Move Co., Ltd., Notes | | | 10.750 | % | | 12/16/13 | | | 625,000 | | | | 677,344 | (a) |
VimpelCom Holdings BV, Senior Notes | | | 7.504 | % | | 3/1/22 | | | 290,000 | | | | 291,740 | (a)(e) |
Total Wireless Telecommunication Services | | | | | | | | | | | | | 5,479,541 | |
Total Telecommunication Services | | | | | | | | | | | | | 12,948,349 | |
See Notes to Financial Statements.
| | | | |
| Legg Mason Western Asset Variable Global High Yield Bond Portfolio 2011 Semi-Annual Report | | | 17 | |
Legg Mason Western Asset Variable Global High Yield Bond Portfolio
| | | | | | | | | | | | | | |
| Security | | Rate | | | Maturity
Date | | Face
Amount† | | | Value | |
| Utilities — 5.4% | | | | | | | | | | | | | | |
Electric Utilities — 2.0% | | | | | | | | | | | | | | |
AES Ironwood LLC, Secured Notes | | | 8.857 | % | | 11/30/25 | | | 273,889 | | | $ | 279,367 | |
AES Red Oak LLC, Secured Notes | | | 9.200 | % | | 11/30/29 | | | 120,000 | | | | 122,400 | |
Astoria Depositor Corp., Pass-Through Certificates | | | 8.144 | % | | 5/1/21 | | | 280,000 | | | | 268,800 | (a) |
Midwest Generation LLC, Pass-Through Certificates | | | 8.560 | % | | 1/2/16 | | | 170,341 | | | | 174,599 | |
Reliant Energy Mid-Atlantic Power Holdings LLC, Senior Notes | | | 9.681 | % | | 7/2/26 | | | 920,000 | | | | 984,400 | |
Texas Competitive Electric Holdings Co. LLC/TCEH Finance Inc., Senior Secured Notes | | | 11.500 | % | | 10/1/20 | | | 1,300,000 | | | | 1,283,750 | (a) |
Total Electric Utilities | | | | | | | | | | | | | 3,113,316 | |
Gas Utilities — 0.2% | | | | | | | | | | | | | | |
Southern Natural Gas Co., Senior Notes | | | 8.000 | % | | 3/1/32 | | | 60,000 | | | | 75,481 | |
Suburban Propane Partners LP/Suburban Energy Finance Corp., Senior Notes | | | 7.375 | % | | 3/15/20 | | | 250,000 | | | | 262,500 | |
Total Gas Utilities | | | | | | | | | | | | | 337,981 | |
Independent Power Producers & Energy Traders — 3.1% | | | | | | | | | | | |
AES Corp., Senior Notes | | | 7.375 | % | | 7/1/21 | | | 360,000 | | | | 365,850 | (a) |
Calpine Corp., Senior Secured Notes | | | 7.500 | % | | 2/15/21 | | | 210,000 | | | | 215,250 | (a) |
Calpine Corp., Senior Secured Notes | | | 7.875 | % | | 1/15/23 | | | 560,000 | | | | 577,500 | (a) |
Colbun SA, Senior Notes | | | 6.000 | % | | 1/21/20 | | | 240,000 | | | | 252,816 | (a) |
Energy Future Intermediate Holding Co. LLC, Senior Secured Notes | | | 9.750 | % | | 10/15/19 | | | 310,000 | | | | 314,949 | |
Energy Future Intermediate Holding Co. LLC/EFIH Finance Inc., Senior Secured Notes | | | 10.000 | % | | 12/1/20 | | | 1,155,000 | | | | 1,237,536 | (e) |
First Wind Holdings Inc., Senior Secured Notes | | | 10.250 | % | | 6/1/18 | | | 370,000 | | | | 375,550 | (a) |
Foresight Energy LLC/Foresight Energy Corp., Senior Notes | | | 9.625 | % | | 8/15/17 | | | 520,000 | | | | 554,450 | (a) |
Mirant Americas Generation LLC, Senior Notes | | | 9.125 | % | | 5/1/31 | | | 530,000 | | | | 535,300 | |
Mirant Mid Atlantic LLC, Pass-Through Certificates | | | 10.060 | % | | 12/30/28 | | | 350,746 | | | | 392,836 | |
Total Independent Power Producers & Energy Traders | | | | | | | | | | 4,822,037 | |
Multi-Utilities — 0.1% | | | | | | | | | | | | | | |
Empresas Publicas de Medellin ESP, Senior Notes | | | 7.625 | % | | 7/29/19 | | | 150,000 | | | | 175,125 | (a) |
Total Utilities | | | | | | | | | | | | | 8,448,459 | |
Total Corporate Bonds & Notes (Cost — $127,229,948) | | | | | | | | | | 130,613,548 | |
| Collateralized Senior Loans — 3.1% | | | | | | | | | | | | | | |
| Consumer Discretionary — 1.2% | | | | | | | | | | | | | | |
Diversified Consumer Services — 0.7% | | | | | | | | | | | | | | |
Realogy Corp., Term Loan | | | 13.500 | % | | 10/15/17 | | | 1,000,000 | | | | 1,061,667 | (h) |
See Notes to Financial Statements.
| | |
| 18 | | Legg Mason Western Asset Variable Global High Yield Bond Portfolio 2011 Semi-Annual Report |
Schedule of investments (unaudited) (cont’d)
June 30, 2011
Legg Mason Western Asset Variable Global High Yield Bond Portfolio
| | | | | | | | | | | | | | |
| Security | | Rate | | | Maturity
Date | | Face
Amount† | | | Value | |
Hotels, Restaurants & Leisure — 0.1% | | | | | | | | | | | | | | |
CityCenter Holdings LLC, Term Loan | | | 7.500 | % | | 1/13/15 | | | 150,000 | | | $ | 151,406 | (h) |
Specialty Retail — 0.4% | | | | | | | | | | | | | | |
BCBG Maxazria International, Term Loan B | | | 1.000 | % | | 5/19/15 | | | 450,000 | | | | 434,250 | (h) |
Michaels Stores Inc., Term Loan B2 | | | 4.750-4.813 | % | | 7/31/16 | | | 236,092 | | | | 235,679 | (h) |
Total Specialty Retail | | | | | | | | | | | | | 669,929 | |
Total Consumer Discretionary | | | | | | | | | | | | | 1,883,002 | |
| Industrials — 0.5% | | | | | | | | | | | | | | |
Aerospace & Defense — 0.4% | | | | | | | | | | | | | | |
Hawker Beechcraft Acquisition Co. LLC, Term Loan | | | 2.186-2.246 | % | | 3/26/14 | | | 725,912 | | | | 612,398 | (h) |
Marine — 0.1% | | | | | | | | | | | | | | |
Trico Shipping AS, Term Loan A | | | 10.000 | % | | 5/12/14 | | | 148,917 | | | | 148,917 | (d)(h) |
Total Industrials | | | | | | | | | | | | | 761,315 | |
| Information Technology — 0.3% | | | | | | | | | | | | | | |
IT Services — 0.3% | | | | | | | | | | | | | | |
First Data Corp., Term Loan B2 | | | 2.936-4.186 | % | | 9/24/14 | | | 469,297 | | | | 435,566 | (h) |
| Materials — 0.3% | | | | | | | | | | | | | | |
Chemicals — 0.3% | | | | | | | | | | | | | | |
Kerling PLC, Term Loan | | | 1.000 | % | | 6/30/16 | | | 300,000 | EUR | | | 430,868 | (d)(h) |
| Telecommunication Services — 0.7% | | | | | | | | | | | | | | |
Wireless Telecommunication Services — 0.7% | | | | | | | | | | | | | | |
Vodafone Americas Finance 2 Inc., Term Loan | | | 6.875 | % | | 8/11/15 | | | 610,056 | | | | 631,408 | (h) |
Vodafone Americas Finance 2 Inc., Term Loan B | | | 6.875 | % | | 8/11/15 | | | 550,000 | | | | 550,000 | (d)(h) |
Total Telecommunication Services | | | | | | | | | | | | | 1,181,408 | |
| Utilities — 0.1% | | | | | | | | | | | | | | |
Electric Utilities — 0.1% | | | | | | | | | | | | | | |
Texas Competitive Electric Holdings Co. LLC, Term Loan | | | 4.690-4.768 | % | | 10/10/17 | | | 294,982 | | | | 230,665 | (h) |
Total Collateralized Senior Loans (Cost — $4,820,360) | | | | | | | | | | 4,922,824 | |
| Convertible Bonds & Notes — 0.6% | | | | | | | | | | | | | | |
| Consumer Discretionary — 0.1% | | | | | | | | | | | | | | |
Diversified Consumer Services — 0.1% | | | | | | | | | | | | | | |
Realogy Corp., Senior Subordinated Bonds | | | 11.000 | % | | 4/15/18 | | | 160,000 | | | | 169,600 | (a) |
| Energy — 0.0% | | | | | | | | | | | | | | |
Oil, Gas & Consumable Fuels — 0.0% | | | | | | | | | | | | | | |
James River Coal Co., Senior Notes | | | 3.125 | % | | 3/15/18 | | | 30,000 | | | | 30,000 | (a) |
| Industrials — 0.4% | | | | | | | | | | | | | | |
Marine — 0.4% | | | | | | | | | | | | | | |
Horizon Lines Inc., Senior Notes | | | 4.250 | % | | 8/15/12 | | | 850,000 | | | | 692,750 | |
See Notes to Financial Statements.
| | | | |
| Legg Mason Western Asset Variable Global High Yield Bond Portfolio 2011 Semi-Annual Report | | | 19 | |
Legg Mason Western Asset Variable Global High Yield Bond Portfolio
| | | | | | | | | | | | | | |
| Security | | Rate | | | Maturity
Date | | Face
Amount† | | | Value | |
| Materials — 0.1% | | | | | | | | | | | | | | |
Chemicals — 0.1% | | | | | | | | | | | | | | |
Hercules Inc. | | | 6.500 | % | | 6/30/29 | | | 130,000 | | | $ | 119,600 | |
Total Convertible Bonds & Notes (Cost — $1,008,987) | | | | | | | | | | 1,011,950 | |
| Sovereign Bonds — 4.9% | | | | | | | | | | | | | | |
Argentina — 0.2% | | | | | | | | | | | | | | |
Republic of Argentina, Senior Bonds | | | 7.000 | % | | 10/3/15 | | | 293,000 | | | | 289,924 | |
Brazil — 0.8% | | | | | | | | | | | | | | |
Brazil Nota do Tesouro Nacional, Notes | | | 9.762 | % | | 1/1/14 | | | 98,000 | BRL | | | 59,451 | (e) |
Brazil Nota do Tesouro Nacional, Notes | | | 9.762 | % | | 1/1/17 | | | 1,896,000 | BRL | | | 1,101,718 | (e) |
Total Brazil | | | | | | | | | | | | | 1,161,169 | |
India — 0.3% | | | | | | | | | | | | | | |
ICICI Bank Ltd., Subordinated Bonds | | | 6.375 | % | | 4/30/22 | | | 500,000 | | | | 488,082 | (a)(e) |
Indonesia — 0.3% | | | | | | | | | | | | | | |
Republic of Indonesia, Senior Bonds | | | 6.875 | % | | 1/17/18 | | | 280,000 | | | | 329,000 | (a) |
Republic of Indonesia, Senior Bonds | | | 6.625 | % | | 2/17/37 | | | 100,000 | | | | 111,231 | (a) |
Total Indonesia | | | | | | | | | | | | | 440,231 | |
Russia — 0.5% | | | | | | | | | | | | | | |
Russian Foreign Bond-Eurobond | | | 11.000 | % | | 7/24/18 | | | 65,000 | | | | 93,035 | (a) |
Russian Foreign Bond-Eurobond, Senior Bonds | | | 7.500 | % | | 3/31/30 | | | 539,760 | | | | 637,591 | (a)(e) |
Total Russia | | | | | | | | | | | | | 730,626 | |
Turkey — 0.6% | | | | | | | | | | | | | | |
Republic of Turkey, Notes | | | 6.750 | % | | 5/30/40 | | | 100,000 | | | | 108,250 | |
Republic of Turkey, Senior Notes | | | 7.500 | % | | 7/14/17 | | | 470,000 | | | | 554,600 | |
Republic of Turkey, Senior Notes | | | 7.000 | % | | 3/11/19 | | | 150,000 | | | | 173,250 | |
Republic of Turkey, Senior Notes | | | 7.500 | % | | 11/7/19 | | | 140,000 | | | | 166,670 | |
Total Turkey | | | | | | | | | | | | | 1,002,770 | |
Venezuela — 2.2% | | | | | | | | | | | | | | |
Bolivarian Republic of Venezuela | | | 5.750 | % | | 2/26/16 | | | 4,200,000 | | | | 3,276,000 | (a) |
Bolivarian Republic of Venezuela, Senior Notes | | | 7.750 | % | | 10/13/19 | | | 310,000 | | | | 225,525 | (a) |
Total Venezuela | | | | | | | | | | | | | 3,501,525 | |
Total Sovereign Bonds (Cost — $6,667,833) | | | | | | | | | | | | | 7,614,327 | |
| | | | |
| | | | | | | | Shares | | | | |
| Common Stocks — 2.0% | | | | | | | | | | | | | | |
| Consumer Discretionary — 1.3% | | | | | | | | | | | | | | |
Automobiles — 0.1% | | | | | | | | | | | | | | |
General Motors Co. | | | | | | | | | 6,795 | | | | 206,296 | * |
Media — 1.2% | | | | | | | | | | | | | | |
Charter Communications Inc., Class A Shares | | | | | | | | | 34,031 | | | | 1,846,522 | * |
Total Consumer Discretionary | | | | | | | | | | | | | 2,052,818 | |
See Notes to Financial Statements.
| | |
| 20 | | Legg Mason Western Asset Variable Global High Yield Bond Portfolio 2011 Semi-Annual Report |
Schedule of investments (unaudited) (cont’d)
June 30, 2011
Legg Mason Western Asset Variable Global High Yield Bond Portfolio
| | | | | | | | | | | | | | |
| | | | |
| Security | | | | | | | Shares | | | Value | |
| Energy — 0.4% | | | | | | | | | | | | | | |
Energy Equipment & Services — 0.4% | | | | | | | | | | | | | | |
KCAD Holdings I Ltd. | | | | | | | | | 63,084,286 | | | $ | 635,764 | (b)(d) |
Oil, Gas & Consumable Fuels — 0.0% | | | | | | | | | | | | | | |
SemGroup Corp., Class A Shares | | | | | | | | | 2,496 | | | | 64,072 | * |
Total Energy | | | | | | | | | | | | | 699,836 | |
| Industrials — 0.3% | | | | | | | | | | | | | | |
Building Products — 0.1% | | | | | | | | | | | | | | |
Ashton Woods USA LLC, Class B Membership | | | | | | | | | 71 | | | | 45,795 | (b)(d) |
Nortek Inc. | | | | | | | | | 905 | | | | 32,571 | * |
Total Building Products | | | | | | | | | | | | | 78,366 | |
Marine — 0.2% | | | | | | | | | | | | | | |
DeepOcean Group Holding AS | | | | | | | | | 19,935 | | | | 318,960 | (d) |
Total Industrials | | | | | | | | | | | | | 397,326 | |
Total Common Stocks (Cost — $2,505,014) | | | | | | | | | | | | | 3,149,980 | |
| | | | |
| | | Rate | | | | | | | | | |
| Convertible Preferred Stocks — 0.5% | | | | | | | | | | | | | | |
| Financials — 0.5% | | | | | | | | | | | | | | |
Diversified Financial Services — 0.5% | | | | | | | | | | | | | | |
Bank of America Corp. (Cost — $822,194) | | | 7.250 | % | | | | | 830 | | | | 830,996 | |
| Preferred Stocks — 2.9% | | | | | | | | | | | | | | |
| Consumer Discretionary — 0.0% | | | | | | | | | | | | | | |
Media — 0.0% | | | | | | | | | | | | | | |
CMP Susquehanna Radio Holdings Corp. | | | 0.000 | % | | | | | 8,862 | | | | 1 | *(a) |
| Financials — 2.8% | | | | | | | | | | | | | | |
Commercial Banks — 0.3% | | | | | | | | | | | | | | |
Banesto Holdings Ltd. | | | 10.500 | % | | | | | 14,450 | | | | 363,509 | (a) |
Consumer Finance — 1.5% | | | | | | | | | | | | | | |
GMAC Capital Trust I | | | 8.125 | % | | | | | 93,800 | | | | 2,401,280 | * |
Diversified Financial Services — 1.0% | | | | | | | | | | | | | | |
Citigroup Capital XII | | | 8.500 | % | | | | | 10,400 | | | | 268,528 | |
Citigroup Capital XIII | | | 7.875 | % | | | | | 46,125 | | | | 1,281,352 | |
Total Diversified Financial Services | | | | | | | | | | | | | 1,549,880 | |
Thrifts & Mortgage Finance — 0.0% | | | | | | | | | | | | | | |
Federal Home Loan Mortgage Corp. (FHLMC) | | | 8.375 | % | | | | | 14,050 | | | | 41,448 | *(e) |
Total Financials | | | | | | | | | | | | | 4,356,117 | |
| Industrials — 0.1% | | | | | | | | | | | | | | |
Road & Rail — 0.1% | | | | | | | | | | | | | | |
Jack Cooper Holdings Corp. | | | 0.000 | % | | | | | 1,380 | | | | 131,100 | (a)(d) |
Total Preferred Stocks (Cost — $4,685,805) | | | | | | | | | | | | | 4,487,218 | |
See Notes to Financial Statements.
| | | | |
| Legg Mason Western Asset Variable Global High Yield Bond Portfolio 2011 Semi-Annual Report | | | 21 | |
Legg Mason Western Asset Variable Global High Yield Bond Portfolio
| | | | | | | | | | | | | | | | |
| Security | | | | | Expiration
Date | | | Contracts | | | Value | |
| Purchased Options — 0.2% | | | | | | | | | | | | | | | | |
Credit default swaption with BNP Paribas to sell protection on Markit CDX.NA.HY.16 Index, Call @ $102.50 | | | | | | | 9/21/11 | | | | 24,660,000 | | | $ | 210,823 | |
Credit default swaption with BNP Paribas to sell protection on Markit CDX.NA.HY.16 Index, Call @ $102.50 | | | | | | | 9/21/11 | | | | 7,700,000 | | | | 65,829 | |
Total Purchased Options (Cost — $335,628) | | | | | | | | | | | | | | | 276,652 | |
| | | | |
| | | | | | | | | Warrants | | | | |
| Warrants — 0.2% | | | | | | | | | | | | | | | | |
Buffets Restaurant Holdings | | | | | | | 4/28/14 | | | | 388 | | | | 4 | *(b)(d) |
Charter Communications Inc. | | | | | | | 11/30/14 | | | | 508 | | | | 6,096 | *(d) |
CMP Susquehanna Radio Holdings Co. | | | | | | | 3/23/19 | | | | 10,127 | | | | 0 | *(a)(b)(d) |
General Motors Co. | | | | | | | 7/10/16 | | | | 6,177 | | | | 132,188 | * |
General Motors Co. | | | | | | | 7/10/19 | | | | 6,177 | | | | 98,399 | * |
Jack Cooper Holdings Corp. | | | | | | | 12/15/17 | | | | 627 | | | | 59,565 | *(d) |
Jack Cooper Holdings Corp. | | | | | | | 5/6/18 | | | | 309 | | | | 30,900 | *(d) |
Nortek Inc. | | | | | | | 12/7/14 | | | | 2,304 | | | | 18,432 | *(b)(d) |
SemGroup Corp. | | | | | | | 11/30/14 | | | | 2,628 | | | | 17,739 | *(b) |
Total Warrants (Cost — $753,888) | | | | | | | | | | | | | | | 363,323 | |
Total Investments before Short-Term Investments (Cost — $148,829,657) | | | | 153,270,818 | |
| | | | |
| | | Rate | | | Maturity
Date | | | Face
Amount† | | | | |
| Short-Term Investments — 0.0% | | | | | | | | | | | | | | | | |
U.S. Government Agencies — 0.0% | | | | | | | | | | | | | | | | |
Federal Home Loan Mortgage Corp. (FHLMC), Discount Notes (Cost — $53,967) | | | 0.110-0.120 | % | | | 1/10/12 | | | | 54,000 | | | | 53,971 | (i)(j) |
Total Investments — 97.7 % (Cost — $148,883,624#) | | | | | | | | | | | | 153,324,789 | |
Other Assets in Excess of Liabilities — 2.3% | | | | | | | | | | | | | | | 3,552,495 | |
Total Net Assets — 100.0% | | | | | | | | | | | | | | $ | 156,877,284 | |
| † | Face amount denominated in U.S. dollars, unless otherwise noted. |
| * | Non-income producing security. |
| (a) | Security is exempt from registration under Rule 144A of the Securities Act of 1933. This security may be resold in transactions that are exempt from registration, normally to qualified institutional buyers. This security has been deemed liquid pursuant to guidelines approved by the Board of Trustees, unless otherwise noted. |
| (c) | Payment-in-kind security for which part of the income earned may be paid as additional principal. |
| (d) | Security is valued in good faith in accordance with procedures approved by the Board of Trustees (See Note 1). |
| (e) | Variable rate security. Interest rate disclosed is as of the most recent information available. |
See Notes to Financial Statements.
| | |
| 22 | | Legg Mason Western Asset Variable Global High Yield Bond Portfolio 2011 Semi-Annual Report |
Schedule of investments (unaudited) (cont’d)
June 30, 2011
Legg Mason Western Asset Variable Global High Yield Bond Portfolio
| (f) | The coupon payment on these securities is currently in default as of June 30, 2011. |
| (g) | The maturity principal is currently in default as of June 30, 2011. |
| (h) | Interest rates disclosed represent the effective rates on collateralized senior loans. Ranges in interest rates are attributable to multiple contracts under the same loan. |
| (i) | Rate shown represents yield-to-maturity. |
| (j) | All or a portion of this security is held at the broker as collateral for open futures contracts. |
| # | Aggregate cost for federal income tax purposes is substantially the same. |
| | |
Abbreviations used in this schedule: |
| BRL | | — Brazilian Real |
| EUR | | — Euro |
| GBP | | — British Pound |
| OJSC | | — Open Joint Stock Company |
| | | | | | | | | | | | | | | | |
| Schedule of Written Options | |
| Security | | Expiration
Date | | | Strike
Price | | | Notional
Par | | | Value | |
| Credit default swaption with BNP Paribas to buy protection on Markit CDX.NA.HY.16 Index, Call | | | 9/22/11 | | | $ | 99.00 | | | | 24,660,000 | | | $ | 702,507 | |
| Credit default swaption with BNP Paribas to buy protection on Markit CDX.NA.HY.16 Index, Call | | | 9/22/11 | | | | 104.00 | | | | 24,660,000 | | | | 107,956 | |
| Credit default swaption with BNP Paribas to buy protection on Markit CDX.NA.HY.16 Index, Call | | | 9/21/11 | | | | 99.00 | | | | 7,700,000 | | | | 219,355 | |
| Credit default swaption with Morgan Stanley & Co. Inc. to buy protection on Markit CDX.NA.HY.16 Index, Call | | | 9/21/11 | | | | 103.50 | | | | 7,700,000 | | | | 42,806 | |
| Total Written Options (Premiums received — $1,092,238) | | | | | | | | | | | $ | 1,072,624 | |
See Notes to Financial Statements.
| | | | |
| Legg Mason Western Asset Variable Global High Yield Bond Portfolio 2011 Semi-Annual Report | | | 23 | |
Statement of assets and liabilities (unaudited)
June 30, 2011
| | | | |
| |
| Assets: | | | | |
Investments, at value (Cost — $148,883,624) | | | $153,324,789 | |
Foreign currency, at value (Cost — $797,929) | | | 798,756 | |
Cash | | | 4,128,112 | |
Interest and dividends receivable | | | 3,052,118 | |
Deposits with brokers for futures contracts | | | 560,000 | |
Receivable for securities sold | | | 430,363 | |
Unrealized appreciation on forward foreign currency contracts | | | 221,112 | |
Receivable for Portfolio shares sold | | | 115,390 | |
Receivable from broker — variation margin on open futures contracts | | | 12,305 | |
Prepaid expenses | | | 819 | |
Total Assets | | | 162,643,764 | |
| |
| Liabilities: | | | | |
Payable for securities purchased | | | 4,452,743 | |
Written options, at value (premiums received $1,092,238) | | | 1,072,624 | |
Investment management fee payable | | | 104,699 | |
Payable for Portfolio shares repurchased | | | 37,561 | |
Unrealized depreciation on forward foreign currency contracts | | | 16,366 | |
Service and/or distribution fees payable | | | 6,216 | |
Trustees’ fees payable | | | 253 | |
Accrued expenses | | | 76,018 | |
Total Liabilities | | | 5,766,480 | |
| Total Net Assets | | | $156,877,284 | |
| |
| Net Assets: | | | | |
Par value (Note 7) | | $ | 191 | |
Paid-in capital in excess of par value | | | 166,631,206 | |
Undistributed net investment income | | | 4,751,070 | |
Accumulated net realized loss on investments, futures contracts
and foreign currency transactions | | | (19,114,278) | |
Net unrealized appreciation on investments, futures contracts, written options
and foreign currencies | | | 4,609,095 | |
| Total Net Assets | | | $156,877,284 | |
| |
| Shares Outstanding: | | | | |
Class I | | | 15,462,056 | |
Class II | | | 3,601,348 | |
| |
| Net Asset Value: | | | | |
Class I | | | $8.21 | |
Class II | | | $8.32 | |
See Notes to Financial Statements.
| | |
| 24 | | Legg Mason Western Asset Variable Global High Yield Bond Portfolio 2011 Semi-Annual Report |
Statement of operations (unaudited)
For the Six Months Ended June 30, 2011
| | | | |
| |
| Investment Income: | | | | |
Interest | | $ | 6,548,207 | |
Dividends | | | 113,301 | |
Less: Foreign taxes withheld | | | (1,633) | |
Total Investment Income | | | 6,659,875 | |
| |
| Expenses: | | | | |
Investment management fee (Note 2) | | | 625,410 | |
Shareholder reports | | | 53,723 | |
Service and/or distribution fees (Notes 2 and 5) | | | 36,791 | |
Audit and tax | | | 17,106 | |
Custody fees | | | 9,089 | |
Fund accounting fees | | | 7,460 | |
Transfer agent fees (Note 5) | | | 6,463 | |
Legal fees | | | 5,150 | |
Insurance | | | 2,236 | |
Trustees’ fees | | | 1,204 | |
Miscellaneous expenses | | | 421 | |
Total Expenses | | | 765,053 | |
| Net Investment Income | | | 5,894,822 | |
| |
Realized and Unrealized Gain (Loss) on Investments, Futures Contracts, Written Options and Foreign Currency Transactions (Notes 1, 3 and 4): | | | | |
Net Realized Gain (Loss) From: | | | | |
Investment transactions | | | 2,636,989 | |
Futures contracts | | | (42,863) | |
Foreign currency transactions | | | (846,307) | |
Net Realized Gain | | | 1,747,819 | |
Change in Net Unrealized Appreciation (Depreciation) From: | | | | |
Investments | | | (195,149) | |
Futures contracts | | | (109,445) | |
Written options | | | 19,614 | |
Foreign currencies | | | (259,547) | |
Change in Net Unrealized Appreciation (Depreciation) | | | (544,527) | |
| Net Gain on Investments, Futures Contracts, Written Options and Foreign Currency Transactions | | | 1,203,292 | |
| Increase in Net Assets from Operations | | $ | 7,098,114 | |
See Notes to Financial Statements.
| | | | |
| Legg Mason Western Asset Variable Global High Yield Bond Portfolio 2011 Semi-Annual Report | | | 25 | |
Statements of changes in net assets
| | | | | | | | |
For the Six Months Ended June 30, 2011 (unaudited)
and the Year Ended December 31, 2010 | | 2011 | | | 2010 | |
| | |
| Operations: | | | | | | | | |
Net investment income | | $ | 5,894,822 | | | $ | 12,121,665 | |
Net realized gain | | | 1,747,819 | | | | 6,453,309 | |
Change in net unrealized appreciation (depreciation) | | | (544,527) | | | | 714,636 | |
Increase in Net Assets From Operations | | | 7,098,114 | | | | 19,289,610 | |
| | |
| Distributions to Shareholders From (Notes 1 and 6): | | | | | | | | |
Net investment income | | | (1,200,006) | | | | (12,400,005) | |
Decrease in Net Assets From Distributions to Shareholders | | | (1,200,006) | | | | (12,400,005) | |
| | |
| Portfolio Share Transactions (Note 7): | | | | | | | | |
Net proceeds from sale of shares | | | 16,530,427 | | | | 56,075,692 | |
Reinvestment of distributions | | | 1,200,006 | | | | 12,400,005 | |
Cost of shares repurchased | | | (16,535,225) | | | | (78,608,153) | |
Increase (Decrease) in Net Assets From Portfolio Share Transactions | | | 1,195,208 | | | | (10,132,456) | |
Increase (Decrease) in Net Assets | | | 7,093,316 | | | | (3,242,851) | |
| | |
| Net Assets: | | | | | | | | |
Beginning of period | | | 149,783,968 | | | | 153,026,819 | |
End of period* | | $ | 156,877,284 | | | $ | 149,783,968 | |
* Includesundistributed net investment income of: | | | $4,751,070 | | | | $56,254 | |
See Notes to Financial Statements.
| | |
| 26 | | Legg Mason Western Asset Variable Global High Yield Bond Portfolio 2011 Semi-Annual Report |
Financial highlights
| | | | | | | | | | | | | | | | | | | | | | | | |
For a share of each class of beneficial interest outstanding throughout each year ended December 31,
unless otherwise noted: | |
| Class I Shares1 | | 20112 | | | 2010 | | | 2009 | | | 2008 | | | 2007 | | | 20063 | |
| | | | | | |
| Net asset value, beginning of period | | | $7.90 | | | | $7.50 | | | | $5.30 | | | | $9.05 | | | | $9.83 | | | | $9.48 | |
| | | | | | |
| Income (loss) from operations: | | | | | | | | | | | | | | | | | | | | | | | | |
Net investment income | | | 0.31 | | | | 0.68 | | | | 0.80 | | | | 0.82 | | | | 0.75 | | | | 0.70 | |
Net realized and unrealized gain (loss) | | | 0.06 | | | | 0.44 | | | | 2.13 | | | | (3.66) | | | | (0.75) | | | | 0.31 | |
Total income (loss) from operations | | | 0.37 | | | | 1.12 | | | | 2.93 | | | | (2.84) | | | | — | | | | 1.01 | |
| | | | | | |
| Less distributions from: | | | | | | | | | | | | | | | | | | | | | | | | |
Net investment income | | | (0.06) | | | | (0.72) | | | | (0.73) | | | | (0.91) | | | | (0.73) | | | | (0.60) | |
Net realized gains | | | — | | | | — | | | | — | | | | — | | | | (0.05) | | | | (0.06) | |
Total distributions | | | (0.06) | | | | (0.72) | | | | (0.73) | | | | (0.91) | | | | (0.78) | | | | (0.66) | |
| | | | | | |
| Net asset value, end of period | | | $8.21 | | | | $7.90 | | | | $7.50 | | | | $5.30 | | | | $9.05 | | | | $9.83 | |
Total return4 | | | 4.73 | % | | | 15.07 | % | | | 55.55 | % | | | (30.82) | % | | | (0.07) | % | | | 10.64 | % |
| | | | | | |
| Net assets, end of period (000s) | | | $126,898 | | | | $121,188 | | | | $123,458 | | | | $63,782 | | | | $103,980 | | | | $89,403 | |
| | | | | | |
| Ratios to average net assets: | | | | | | | | | | | | | | | | | | | | | | | | |
Gross expenses | | | 0.93 | %5 | | | 0.91 | % | | | 0.91 | % | | | 1.12 | % | | | 0.97 | % | | | 1.00 | %6 |
Net expenses7,8 | | | 0.93 | 5 | | | 0.91 | | | | 0.91 | | | | 0.98 | 9 | | | 0.96 | 9 | | | 1.00 | 6,9 |
Net investment income | | | 7.59 | 5 | | | 8.49 | | | | 11.79 | | | | 10.01 | | | | 7.60 | | | | 7.11 | |
| | | | | | |
| Portfolio turnover rate | | | 50 | % | | | 108 | % | | | 80 | % | | | 66 | % | | | 66 | % | | | 67 | % |
| 1 | Per share amounts have been calculated using the average shares method. |
| 2 | For the six months ended June 30, 2011 (unaudited). |
| 3 | Represents a share of capital stock outstanding prior April 30, 2007. |
| 4 | Performance figures may reflect compensating balance arrangements, fees forgone and/or expense reimbursements. In the absence of compensating balance arrangements, fees forgone and/or expense reimbursements, the total return would have been lower. Total returns do not reflect expenses associated with separate accounts such as administrative fees, account charges and surrender charges which, if reflected, would reduce the total return for all periods shown. Past performance is no guarantee of future results. Total returns for periods of less than one year are not annualized. |
| 6 | Included in the expense ratios are certain non-recurring restructuring (and reorganization, if applicable) fees that were incurred by the Portfolio during the period. Without these fees, the gross and net expense ratios would both have been 0.98%. |
| 7 | As a result of an expense limitation arrangement, the ratio of expenses, other than brokerage, interest, taxes, extraordinary expenses and acquired fund fees and expenses, to average net assets of Class I shares did not exceed 1.00%. This expense limitation arrangement cannot be terminated prior to December 31, 2012 without the Board of Trustees’ consent. |
| 8 | The impact of compensating balance arrangements, if any, was less than 0.01%. |
| 9 | Reflects fees forgone and/or expense reimbursements. |
See Notes to Financial Statements.
| | | | |
| Legg Mason Western Asset Variable Global High Yield Bond Portfolio 2011 Semi-Annual Report | | | 27 | |
| | | | | | | | | | | | | | | | | | | | | | | | |
For a share of each class of beneficial interest outstanding throughout each year ended December 31,
unless otherwise noted: | |
| Class II Shares1 | | 20112 | | | 2010 | | | 2009 | | | 2008 | | | 2007 | | | 20063 | |
| | | | | | |
| Net asset value, beginning of period | | | $8.01 | | | | $7.58 | | | | $5.33 | | | | $9.08 | | | | $9.85 | | | | $9.50 | |
| | | | | | |
| Income (loss) from operations: | | | | | | | | | | | | | | | | | | | | | | | | |
Net investment income | | | 0.30 | | | | 0.66 | | | | 0.78 | | | | 0.80 | | | | 0.73 | | | | 0.67 | |
Net realized and unrealized gain (loss) | | | 0.06 | | | | 0.45 | | | | 2.15 | | | | (3.67) | | | | (0.76) | | | | 0.31 | |
Total income (loss) from operations | | | 0.36 | | | | 1.11 | | | | 2.93 | | | | (2.87) | | | | (0.03) | | | | 0.98 | |
| | | | | | |
| Less distributions from: | | | | | | | | | | | | | | | | | | | | | | | | |
Net investment income | | | (0.05) | | | | (0.68) | | | | (0.68) | | | | (0.88) | | | | (0.69) | | | | (0.57) | |
Net realized gains | | | — | | | | — | | | | — | | | | — | | | | (0.05) | | | | (0.06) | |
Total distributions | | | (0.05) | | | | (0.68) | | | | (0.68) | | | | (0.88) | | | | (0.74) | | | | (0.63) | |
| | | | | | |
| Net asset value, end of period | | | $8.32 | | | | $8.01 | | | | $7.58 | | | | $5.33 | | | | $9.08 | | | | $9.85 | |
Total return4 | | | 4.53 | % | | | 14.70 | % | | | 55.14 | % | | | (31.01) | % | | | (0.33) | % | | | 10.34 | % |
| | | | | | |
| Net assets, end of period (000s) | | | $29,980 | | | | $28,596 | | | | $29,569 | | | | $21,332 | | | | $29,785 | | | | $31,433 | |
| | | | | | |
| Ratios to average net assets: | | | | | | | | | | | | | | | | | | | | | | | | |
Gross expenses | | | 1.19 | %5 | | | 1.17 | % | | | 1.24 | % | | | 1.21 | % | | | 1.25 | % | | | 1.35 | %6 |
Net expenses7,8 | | | 1.19 | 5 | | | 1.17 | | | | 1.24 | | | | 1.19 | 9 | | | 1.23 | 9 | | | 1.27 | 6,9 |
Net investment income | | | 7.32 | 5 | | | 8.22 | | | | 11.67 | | | | 9.73 | | | | 7.31 | | | | 6.82 | |
| | | | | | |
| Portfolio turnover rate | | | 50 | % | | | 108 | % | | | 80 | % | | | 66 | % | | | 66 | % | | | 67 | % |
| 1 | Per share amounts have been calculated using the average shares method. |
| 2 | For the six months ended June 30, 2011 (unaudited). |
| 3 | Represents a share of capital stock outstanding prior to April 30, 2007. |
| 4 | Performance figures may reflect compensating balance arrangements, fees forgone and/or expense reimbursements. In the absence of compensating balance arrangements, fees forgone and/or expense reimbursements, the total return would have been lower. Total returns do not reflect expenses associated with separate accounts such as administrative fees, account charges and surrender charges which, if reflected, would reduce the total return for all periods shown. Past performance is no guarantee of future results. Total returns for periods of less than one year are not annualized. |
| 6 | Included in the expense ratios are certain non-recurring restructuring (and reorganization, if applicable) fees that were incurred by the Portfolio during the period. Without these fees, the gross and net expense ratios would have been 1.33% and 1.25%, respectively |
| 7 | As a result of an expense limitation arrangement, the ratio of expenses, other than brokerage, interest, taxes, extraordinary expenses and acquired fund fees and expenses, to average net assets of Class II shares did not exceed 1.25%. This expense limitation arrangement cannot be terminated prior to December 31, 2012 without the Board of Trustees’ consent. |
| 8 | The impact of compensating balance arrangements, if any, was less than 0.01%. |
| 9 | Reflects fees forgone and/or expense reimbursements. |
See Notes to Financial Statements.
| | |
| 28 | | Legg Mason Western Asset Variable Global High Yield Bond Portfolio 2011 Semi-Annual Report |
Notes to financial statements (unaudited)
1. Organization and significant accounting policies
Legg Mason Western Asset Variable Global High Yield Bond Portfolio (the “Portfolio”) is a separate diversified investment series of Legg Mason Partners Variable Income Trust (the “Trust”). The Trust, a Maryland statutory trust, is registered under the Investment Company Act of 1940, as amended (the “1940 Act”), as an open-end management investment company.
Shares of the Portfolio may only be purchased or redeemed through variable annuity contracts and variable life insurance policies offered by the separate accounts of participating insurance companies or through eligible pension or other qualified plans.
The following are significant accounting policies consistently followed by the Portfolio and are in conformity with U.S. generally accepted accounting principles (“GAAP”). Estimates and assumptions are required to be made regarding assets, liabilities and changes in net assets resulting from operations when financial statements are prepared. Changes in the economic environment, financial markets and any other parameters used in determining these estimates could cause actual results to differ. Subsequent events have been evaluated through the date the financial statements were issued.
(a) Investment valuation. Debt securities are valued at the mean between the last quoted bid and asked prices provided by an independent pricing service, which are based on transactions in debt obligations, quotations from bond dealers, market transactions in comparable securities and various other relationships between securities. Publicly traded foreign government debt securities are typically traded internationally in the over-the-counter market, and are valued at the mean between the last quoted bid and asked prices as of the close of business of that market. Futures contracts are valued daily at the settlement price established by the board of trade or exchange on which they are traded. Equity securities for which market quotations are available are valued at the last reported sales price or official closing price on the primary market or exchange on which they trade. When reliable prices are not readily available, such as when the value of a security has been significantly affected by events after the close of the exchange or market on which the security is principally traded, but before the Portfolio calculates its net asset value, the Portfolio values these securities as determined in accordance with procedures approved by the Portfolio’s Board of Trustees. Short-term obligations with maturities of 60 days or less are valued at amortized cost, which approximates fair value.
The Portfolio has adopted Financial Accounting Standards Board Codification Topic 820 (“ASC Topic 820”). ASC Topic 820 establishes a single definition of fair value, creates a three-tier hierarchy as a framework for measuring fair value based on inputs used to value the Portfolio’s investments, and requires additional disclosure about fair value. The hierarchy of inputs is summarized below.
| Ÿ | | Level 1 — quoted prices in active markets for identical investments |
| Ÿ | | Level 2 — other significant observable inputs (including quoted prices for similar investments, interest rates, prepayment speeds, credit risk, etc.) |
| Ÿ | | Level 3 — significant unobservable inputs (including the Portfolio’s own assumptions in determining the fair value of investments) |
| | | | |
| Legg Mason Western Asset Variable Global High Yield Bond Portfolio 2011 Semi-Annual Report | | | 29 | |
The inputs or methodology used for valuing securities are not necessarily an indication of the risk associated with investing in those securities.
The Portfolio uses valuation techniques to measure fair value that are consistent with the market approach and/or income approach, depending on the type of security and the particular circumstance. The market approach uses prices and other relevant information generated by market transactions involving identical or comparable securities. The income approach uses valuation techniques to discount estimated future cash flows to present value.
The following is a summary of the inputs used in valuing the Portfolio’s assets and liabilities carried at fair value:
| | | | | | | | | | | | | | | | |
| ASSETS | |
| Description | | Quoted Prices
(Level 1) | | | Other Significant
Observable Inputs
(Level 2) | | | Significant
Unobservable
Inputs
(Level 3) | | | Total | |
| Long-term investments†: | | | | | | | | | | | | | | | | |
Corporate bonds & notes | | | — | | | $ | 129,172,328 | | | $ | 1,441,220 | | | $ | 130,613,548 | |
Collateralized senior loans | | | — | | | | 3,793,039 | | | | 1,129,785 | | | | 4,922,824 | |
Convertible bonds & notes | | | — | | | | 1,011,950 | | | | — | | | | 1,011,950 | |
Sovereign bonds | | | — | | | | 7,614,327 | | | | — | | | | 7,614,327 | |
Common stocks | | $ | 2,149,461 | | | | — | | | | 1,000,519 | | | | 3,149,980 | |
Convertible preferred stocks | | | 830,996 | | | | — | | | | — | | | | 830,996 | |
Preferred stocks | | | 3,992,608 | | | | 363,510 | | | | 131,100 | | | | 4,487,218 | |
Purchased options | | | — | | | | 276,652 | | | | — | | | | 276,652 | |
Warrants | | | 248,326 | | | | — | | | | 114,997 | | | | 363,323 | |
| Total long-term investments | | $ | 7,221,391 | | | $ | 142,231,806 | | | $ | 3,817,621 | | | $ | 153,270,818 | |
| Short-term investments† | | | — | | | | 53,971 | | | | — | | | | 53,971 | |
| Total investments | | $ | 7,221,391 | | | $ | 142,285,777 | | | $ | 3,817,621 | | | $ | 153,324,789 | |
| Other financial instruments: | | | | | | | | | | | | | | | | |
Forward foreign currency contracts | | | — | | | | 221,112 | | | | — | | | | 221,112 | |
| Total | | $ | 7,221,391 | | | $ | 142,506,889 | | | $ | 3,817,621 | | | $ | 153,545,901 | |
| | | | | | | | | | | | | | | | |
| LIABILITIES | |
| Description | | Quoted Prices
(Level 1) | | | Other Significant
Observable Inputs
(Level 2) | | | Significant
Unobservable
Inputs (Level 3) | | | Total | |
| Other financial instruments: | | | | | | | | | | | | | | | | |
Written options | | | — | | | $ | 1,072,624 | | | | — | | | $ | 1,072,624 | |
Forward foreign currency contracts | | | — | | | | 16,366 | | | | — | | | | 16,366 | |
Futures contracts | | $ | 51,565 | | | | — | | | | — | | | | 51,565 | |
| Total | | $ | 51,565 | | | $ | 1,088,990 | | | | — | | | $ | 1,140,555 | |
| † | See Schedule of Investments for additional detailed categorizations. |
| | |
| 30 | | Legg Mason Western Asset Variable Global High Yield Bond Portfolio 2011 Semi-Annual Report |
Notes to financial statements (unaudited) (cont’d)
The following is a reconciliation of investments in which significant unobservable inputs (Level 3) were used in determining fair value:
| | | | | | | | | | | | | | | | | | | | | | | | |
| Investments in Securities | | Corporate Bonds & Notes | | | Collateralized
Senior Loans | | | Common
Stocks | | | Preferred
Stocks | | | Warrants | | | Total | |
| Balance as of December 31, 2010 | | $ | 632,150 | | | $ | 598,850 | | | $ | 31,954 | | | $ | 1 | | | $ | 31,808 | | | $ | 1,294,763 | |
| Accrued premiums/discounts | | | 664 | | | | 180 | | | | — | | | | — | | | | — | | | | 844 | |
| Realized gain (loss)1 | | | (120,563) | | | | — | | | | — | | | | — | | | | (1) | | | | (120,564) | |
| Change in unrealized appreciation (depreciation)2 | | | 184,740 | | | | (2,687) | | | | (52,582) | | | | 10,019 | | | | 60,200 | | | | 199,690 | |
| Net purchases (sales) | | | 773,301 | | | | 533,442 | | | | 1,021,147 | | | | 121,081 | | | | 16,894 | | | | 2,465,865 | |
| Transfers in to Level 3 | | | — | | | | — | | | | — | | | | — | | | | 6,096 | | | | 6,096 | |
| Transfers out of Level 3 | | | (29,072) | | | | — | | | | — | | | | (1) | | | | — | | | | (29,073) | |
| Balance as of June 30, 2011 | | $ | 1,441,220 | | | $ | 1,129,785 | | | $ | 1,000,519 | | | $ | 131,100 | | | $ | 114,997 | | | $ | 3,817,621 | |
| Net change in unrealized appreciation (depreciation) for investments in securities still held at June 30, 20112 | | $ | 182,593 | | | $ | 9,805 | | | $ | (52,582) | | | $ | 10,019 | | | $ | 60,200 | | | $ | 210,035 | |
| 1 | This amount is included in net realized gain (loss) from investment transactions in the accompanying Statement of Operations. |
| 2 | This amount is included in the change in net unrealized appreciation (depreciation) in the accompanying Statement of Operations. Change in unrealized appreciation (depreciation) includes net unrealized appreciation (depreciation) resulting from changes in investment values during the reporting period and the reversal of previously recorded unrealized appreciation (depreciation) when gains or losses are realized. |
(b) Repurchase agreements. The Portfolio may enter into repurchase agreements with institutions that its investment adviser has determined are creditworthy. Each repurchase agreement is recorded at cost. Under the terms of a typical repurchase agreement, the Portfolio acquires a debt security subject to an obligation of the seller to repurchase, and of the Portfolio to resell, the security at an agreed-upon price and time, thereby determining the yield during the Portfolio’s holding period. When entering into repurchase agreements, it is the Portfolio’s policy that its custodian or a third party custodian, acting on the Portfolio’s behalf, take possession of the underlying collateral securities, the market value of which, at all times, at least equals the principal amount of the repurchase transaction, including accrued interest. To the extent that any repurchase transaction maturity exceeds one business day, the value of the collateral is marked-to-market and measured against the value of the agreement in an effort to ensure the adequacy of the collateral. If the counterparty defaults, the Portfolio generally has the right to use the collateral to satisfy the terms of the repurchase transaction. However, if the market value of the collateral declines during the period in which the Portfolio seeks to assert its rights or if bankruptcy proceedings are commenced with respect to the seller of the security, realization of the collateral by the Portfolio may be delayed or limited.
| | | | |
| Legg Mason Western Asset Variable Global High Yield Bond Portfolio 2011 Semi-Annual Report | | | 31 | |
(c) Futures contracts. The Portfolio uses futures contracts generally to gain exposure to, or hedge against, changes in interest rates or gain exposure to, or hedge against changes in certain asset classes. A futures contract represents a commitment for the future purchase or sale of an asset at a specified price on a specified date.
Upon entering into a futures contract, the Portfolio is required to deposit cash or cash equivalents with a broker in an amount equal to a certain percentage of the contract amount. This is known as the “initial margin” and subsequent payments (“variation margin”) are made or received by the Portfolio each day, depending on the daily fluctuation in the value of the contract. For certain futures, including foreign denominated futures, variation margin is not settled daily, but is recorded as a net variation margin payable or receivable. Futures contracts are valued daily at the settlement price established by the board of trade or exchange on which they are traded. The daily changes in contract value are recorded as unrealized gains or losses in the Statement of Operations and the Portfolio recognizes a realized gain or loss when the contract is closed.
Futures contracts involve, to varying degrees, risk of loss in excess of the amounts reflected in the financial statements. In addition, there is the risk that the Portfolio may not be able to enter into a closing transaction because of an illiquid secondary market.
(d) Written options. When the Portfolio writes an option, an amount equal to the premium received by the Portfolio is recorded as a liability, the value of which is marked-to-market daily to reflect the current market value of the option written. If the option expires, the premium received is recorded as a realized gain. When a written call option is exercised, the difference between the premium received plus the option exercise price and the Portfolio’s basis in the underlying security (in the case of a covered written call option), or the cost to purchase the underlying security (in the case of an uncovered written call option), including brokerage commission, is recognized as a realized gain or loss. When a written put option is exercised, the amount of the premium received is subtracted from the cost of the security purchased by the Portfolio from the exercise of the written put option to form the Portfolio’s basis in the underlying security purchased. The writer or buyer of an option traded on an exchange can liquidate the position before the exercise of the option by entering into a closing transaction. The cost of a closing transaction is deducted from the original premium received resulting in a realized gain or loss to the Fund.
The risk in writing a covered call option is that the Portfolio may forego the opportunity of profit if the market price of the underlying security increases and the option is exercised. The risk in writing a put option is that the Portfolio may incur a loss if the market price of the underlying security decreases and the option is exercised. The risk in writing an uncovered call option is that the Portfolio is exposed to the risk of loss if the market price of the underlying security increases. In addition, there is the risk that the Portfolio may not be able to enter into a closing transaction because of an illiquid secondary market.
| | |
| 32 | | Legg Mason Western Asset Variable Global High Yield Bond Portfolio 2011 Semi-Annual Report |
Notes to financial statements (unaudited) (cont’d)
(e) Forward foreign currency contracts. The Portfolio enters into a forward foreign currency contract to hedge against foreign currency exchange rate risk on its non-U.S. dollar denominated securities or to facilitate settlement of a foreign currency denominated portfolio transaction. A forward foreign currency contract is an agreement between two parties to buy and sell a currency at a set price with delivery and settlement at a future date. The contract is marked-to-market daily and the change in value is recorded by the Portfolio as an unrealized gain or loss. When a forward foreign currency contract is closed, through either delivery or offset by entering into another forward foreign currency contract, the Portfolio recognizes a realized gain or loss equal to the difference between the value of the contract at the time it was opened and the value of the contract at the time it is closed.
Forward foreign currency contracts involve elements of market risk in excess of the amounts reflected on the Statement of Assets and Liabilities. The Portfolio bears the risk of an unfavorable change in the foreign exchange rate underlying the forward foreign currency contract. Risks may also arise upon entering into these contracts from the potential inability of the counterparties to meet the terms of their contracts.
(f) Swaptions. The Portfolio purchases and writes swaptions contracts to manage exposure to an underlying instrument. The Portfolio may also purchase or write options to manage exposure to fluctuations in interest rates or to enhance yield. Swaption contracts written by the Portfolio represent an option that gives the purchaser the right, but not the obligation, to enter into a previously agreed upon swap contract at a future date. Swaption contracts purchased by the Portfolio represent an option that gives the Portfolio the right, but not the obligation, to enter into a previously agreed upon swap contract at a future date.
When the Portfolio writes a swaption, an amount equal to the premium received by the Portfolio is recorded as a liability, the value of which is market-to-market daily to reflect the current market value of the swaption written. If the swaption expires, the Portfolio realizes a gain equal to the amount of the premium received.
When the Portfolio purchases a swaption, an amount equal to the premium paid by the Portfolio is recorded as an investment on the statement of assets and liabilities, the value of which is market-to-market daily to reflect to current market value of the swaption purchased. If the swaption expires, the Portfolio realizes a loss equal to the amount of the premium paid.
Swaptions are market-to-market daily based upon quotations from market makers. Changes in the value of the swaption are reported as unrealized gains or losses in the Statement of Operations.
(g) Swap agreements. The Portfolio may invest in swaps for the purpose of managing its exposure to interest rate, credit or market risk, or for other purposes. The use of swaps involves risks that are different from those associated with ordinary portfolio transactions.
Swap contracts are marked-to-market daily and changes in value are recorded as unrealized appreciation (depreciation). Gains or losses are realized upon termination of the swap agreement. Periodic payments and premiums received or made by the Portfolio are recognized in the Statement of Operations as realized gains or losses,
| | | | |
| Legg Mason Western Asset Variable Global High Yield Bond Portfolio 2011 Semi-Annual Report | | | 33 | |
respectively. Collateral, in the form of restricted cash or securities, may be required to be held in segregated accounts with the Portfolio’s custodian in compliance with the terms of the swap contracts. Securities posted as collateral for swap contracts are identified in the Schedule of Investments and restricted cash, if any, is identified on the Statement of Assets and Liabilities. Risks may exceed amounts recorded in the Statement of Assets and Liabilities. These risks include changes in the returns of the underlying instruments, failure of the counterparties to perform under the contracts’ terms, and the possible lack of liquidity with respect to the swap agreements.
Payments received or made at the beginning of the measurement period are reflected as a premium or deposit, respectively, on the Statement of Assets and Liabilities. These upfront payments are amortized over the life of the swap and are recognized as realized gain or loss in the Statement of Operations. A liquidation payment received or made at the termination of the swap is recognized as a realized gain or loss in the Statement of Operations. Net periodic payments received or paid by the Portfolio are recognized as a realized gain or loss in the Statement of Operations.
The Portfolio’s maximum exposure in the event of a defined credit event on a credit default swap to sell protection is the notional amount. At June 30, 2011, the Portfolio had no open swap agreements.
Credit default swaps
The Portfolio may enter into credit default swap (“CDS”) contracts for investment purposes, to manage its credit risk or to add leverage. CDS agreements involve one party making a stream of payments to another party in exchange for the right to receive a specified return in the event of a default by a third party, typically corporate or sovereign issuers, on a specified obligation, or in the event of a write-down, principal shortfall, interest shortfall or default of all or part of the referenced entities comprising a credit index. The Portfolio may use a CDS to provide protection against defaults of the issuers (i.e., to reduce risk where the Portfolio has exposure to an issuer) or to take an active long or short position with respect to the likelihood of a particular issuer’s default. As a seller of protection, the Portfolio generally receives an upfront payment or a stream of payments throughout the term of the swap provided that there is no credit event. If the Portfolio is a seller of protection and a credit event occurs, as defined under the terms of that particular swap agreement, the maximum potential amount of future payments (undiscounted) that the Portfolio could be required to make under a credit default swap agreement would be an amount equal to the notional amount of the agreement. These amounts of potential payments will be partially offset by any recovery of values from the respective referenced obligations. As a seller of protection, the Portfolio effectively adds leverage to its portfolio because, in addition to its total net assets, the Portfolio is subject to investment exposure on the notional amount of the swap. As a buyer of protection, the Portfolio generally receives an amount up to the notional value of the swap if a credit event occurs.
Implied spreads are the theoretical prices a lender receives for credit default protection. When spreads rise, market perceived credit risk rises and when spreads fall,
| | |
| 34 | | Legg Mason Western Asset Variable Global High Yield Bond Portfolio 2011 Semi-Annual Report |
Notes to financial statements (unaudited) (cont’d)
market perceived credit risk falls. The implied credit spread of a particular referenced entity reflects the cost of buying/selling protection and may include upfront payments required to enter into the agreement. Wider credit spreads and decreasing market values, when compared to the notional amount of the swap, represent a deterioration of the referenced entity’s credit soundness and a greater likelihood or risk of default or other credit event occurring as defined under the terms of the agreement. Credit spreads utilized in determining the period end market value of credit default swap agreements on corporate or sovereign issues are disclosed in the Notes to Financial Statements and serve as an indicator of the current status of the payment/performance risk and represent the likelihood or risk of default for credit derivatives. For credit default swap agreements on asset-backed securities and credit indices, the quoted market prices and resulting values, particularly in relation to the notional amount of the contract as well as the annual payment rate, serve as an indication of the current status of the payment/performance risk.
The Portfolio’s maximum risk of loss from counterparty risk, as the protection buyer, is the fair value of the contract (this risk is mitigated by the posting of collateral by the counterparty to the Portfolio to cover the Portfolio’s exposure to the counterparty). As the protection seller, the Portfolio’s maximum risk is the notional amount of the contract. Credit default swaps are considered to have credit risk-related contingent features since they require payment by the protection seller to the protection buyer upon the occurrence of a defined credit event.
Entering into a CDS agreement involves, to varying degrees, elements of credit, market and documentation risk in excess of the related amounts recognized on the Statement of Assets and Liabilities. Such risks involve the possibility that there will be no liquid market for these agreements, that the counterparty to the agreement may default on its obligation to perform or disagree as to the meaning of the contractual terms in the agreement, and that there will be unfavorable changes in net interest rates.
(h) Foreign currency translation. Investment securities and other assets and liabilities denominated in foreign currencies are translated into U.S. dollar amounts based upon prevailing exchange rates on the date of valuation. Purchases and sales of investment securities and income and expense items denominated in foreign currencies are translated into U.S. dollar amounts based upon prevailing exchange rates on the respective dates of such transactions.
The Portfolio does not isolate that portion of the results of operations resulting from fluctuations in foreign exchange rates on investments from the fluctuations arising from changes in market prices of securities held. Such fluctuations are included with the net realized and unrealized gain or loss on investments.
Net realized foreign exchange gains or losses arise from sales of foreign currencies, including gains and losses on forward foreign currency contracts, currency gains or losses realized between the trade and settlement dates on securities transactions, and the difference between the amounts of dividends, interest, and foreign withholding taxes recorded on the Portfolio’s books and the U.S. dollar equivalent of the amounts actually received or paid. Net unrealized foreign exchange gains and losses
| | | | |
| Legg Mason Western Asset Variable Global High Yield Bond Portfolio 2011 Semi-Annual Report | | | 35 | |
arise from changes in the values of assets and liabilities, other than investments in securities, on the date of valuation, resulting from changes in exchange rates.
Foreign security and currency transactions may involve certain considerations and risks not typically associated with those of U.S. dollar denominated transactions as a result of, among other factors, the possibility of lower levels of governmental supervision and regulation of foreign securities markets and the possibility of political or economic instability.
(i) Loan participations. The Portfolio may invest in loans arranged through private negotiation between one or more financial institutions. The Portfolio’s investment in any such loan may be in the form of a participation in or an assignment of the loan. In connection with purchasing participations, the Portfolio generally will have no right to enforce compliance by the borrower with the terms of the loan agreement related to the loan, or any rights of off-set against the borrower and the Portfolio may not benefit directly from any collateral supporting the loan in which it has purchased the participation.
The Portfolio assumes the credit risk of the borrower, the lender that is selling the participation and any other persons interpositioned between the Portfolio and the borrower. In the event of the insolvency of the lender selling the participation, the Portfolio may be treated as a general creditor of the lender and may not benefit from any off-set between the lender and the borrower.
(j) Credit and market risk. The Portfolio invests in high-yield and emerging market instruments that are subject to certain credit and market risks. The yields of high-yield and emerging market debt obligations reflect, among other things, perceived credit and market risks. The Portfolio’s investment in securities rated below investment grade typically involve risks not associated with higher rated securities including, among others, greater risk related to timely and ultimate payment of interest and principal, greater market price volatility and less liquid secondary market trading. The consequences of political, social, economic or diplomatic changes may have disruptive effects on the market prices of investments held by the Portfolio. The Portfolio’s investment in non-U.S. dollar denominated securities may also result in foreign currency losses caused by devaluations and exchange rate fluctuations.
Investments in securities that are collateralized by residential real estate mortgages are subject to certain credit and liquidity risks. When market conditions result in an increase in default rates of the underlying mortgages and foreclosure values of underlying real estate properties are materially below the outstanding amount of these underlying mortgages, collection of the full amount of accrued interest and principal on these investments may be doubtful. Such market conditions may significantly impair the value and liquidity of these investments and may result in a lack of correlation between their credit ratings and values.
(k) Counterparty risk and credit-risk-related contingent features of derivative instruments. The Portfolio may invest in certain securities or engage in other transactions, where the Portfolio is exposed to counterparty credit risk in addition to broader market risks. The Portfolio may invest in securities of issuers, which may
| | |
| 36 | | Legg Mason Western Asset Variable Global High Yield Bond Portfolio 2011 Semi-Annual Report |
Notes to financial statements (unaudited) (cont’d)
also be considered counterparties as trading partners in other transactions. This may increase the risk of loss in the event of default or bankruptcy by the counterparty or if the counterparty otherwise fails to meet its contractual obligations. The Portfolio’s investment manager attempts to mitigate counterparty risk by (i) periodically assessing the creditworthiness of its trading partners, (ii) monitoring and/or limiting the amount of its net exposure to each individual counterparty based on its assessment and (iii) requiring collateral from the counterparty for certain transactions. Market events and changes in overall economic conditions may impact the assessment of such counterparty risk by the investment manager. In addition, declines in the values of underlying collateral received may expose the Portfolio to increased risk of loss.
The Portfolio has entered into master agreements with certain of its derivative counterparties that provide for general obligations, representations, agreements, collateral, events of default or termination and credit related contingent features. The credit related contingent features include, but are not limited to, a percentage decrease in the Portfolio’s net assets or NAV over a specified period of time. If these credit related contingent features were triggered, the derivatives counterparty could terminate the positions and demand payment or require additional collateral.
As of June 30, 2011, the Portfolio held written options and forward foreign currency contracts with credit related contingent features which had a liability position of $1,088,990. If a contingent feature in the master agreements would have been triggered, the Portfolio would have been required to pay this amount to its derivatives counterparties.
(l) Security transactions and investment income. Security transactions are accounted for on a trade date basis. Interest income, adjusted for amortization of premium and accretion of discount, is recorded on the accrual basis. Dividend income is recorded on the ex-dividend date. The cost of investments sold is determined by use of the specific identification method. To the extent any issuer defaults or a credit event occurs that impacts the issuer, the Portfolio may halt any additional interest income accruals and consider the realizability of interest accrued up to the date of default or credit event.
(m) Distributions to shareholders. Distributions from net investment income and distributions of net realized gains, if any, are declared at least annually. Distributions to shareholders of the Portfolio are recorded on the ex-dividend date and are determined in accordance with income tax regulations, which may differ from GAAP.
(n) Share class accounting. Investment income, common expenses and realized/unrealized gains (losses) on investments are allocated to the various classes of the Portfolio on the basis of daily net assets of each class. Fees relating to a specific class are charged directly to that share class.
(o) Compensating balance arrangements. The Portfolio has an arrangement with its custodian bank whereby a portion of the custodian’s fees is paid indirectly by credits earned on the Portfolio’s cash on deposit with the bank.
| | | | |
| Legg Mason Western Asset Variable Global High Yield Bond Portfolio 2011 Semi-Annual Report | | | 37 | |
(p) Federal and other taxes. It is the Portfolios’ policy to comply with the federal income and excise tax requirements of the Internal Revenue Code of 1986 (the “Code”), as amended, applicable to regulated investment companies. Accordingly, the Portfolios intend to distribute their taxable income and net realized gains, if any, to shareholders in accordance with timing requirements imposed by the Code. Therefore, no federal or state income tax provision is required in the Portfolios’ financial statements.
Management has analyzed the Portfolios’ tax positions taken on income tax returns for all open tax years and has concluded that as of June 30, 2011, no provision for income tax would be required in the Portfolio’s financial statements. The Portfolios’ federal and state income and federal excise tax returns for tax years for which the applicable statutes of limitations have not expired are subject to examination by Internal Revenue Service and state departments of revenue.
(q) Reclassification. GAAP requires that certain components of net assets be reclassified to reflect permanent differences between financial and tax reporting. These reclassifications have no effect on net assets or net asset value per share.
2. Investment management agreement and other transactions with affiliates
Legg Mason Partners Fund Advisor, LLC (“LMPFA”) is the Portfolio’s investment manager. Western Asset Management Company (“Western Asset”), Western Asset Management Company Limited (“Western Asset Limited”) and Western Asset Management Company Pte. Ltd. (“Western Singapore”) are the Portfolio’s subadvisers. LMPFA, Western Asset, Western Asset Limited and Western Singapore are wholly-owned subsidiaries of Legg Mason, Inc. (“Legg Mason”).
Under the investment management agreement, the Portfolio pays an investment management fee, calculated daily and paid monthly, in accordance with the following breakpoint schedule:
| | | | | |
| Average Daily Net Assets | | Annual Rate |
| First $1 billion | | | | 0.800 | % |
| Next $1 billion | | | | 0.775 | |
| Next $3 billion | | | | 0.750 | |
| Over $5 billion | | | | 0.700 | |
LMPFA provides administrative and certain oversight services to the Portfolio. LMPFA delegates to the subadviser the day-to-day portfolio management of the Portfolio. Western Asset Limited and Western Singapore provide certain advisory services to the Portfolio relating to currency transactions and investment in non-U.S. dollar denominated securities and related foreign currency instruments. For its services, LMPFA pays Western Asset 70% of the net management fee it receives from the Portfolio. In turn, Western Asset pays Western Asset Limited and Western Singapore a subadvisory fee of 0.30% on the assets managed by Western Asset Limited and Western Singapore.
| | |
| 38 | | Legg Mason Western Asset Variable Global High Yield Bond Portfolio 2011 Semi-Annual Report |
Notes to financial statements (unaudited) (cont’d)
As a result of expense limitation arrangements between the Portfolio and LMPFA, the ratio of expenses, other than brokerage, interest, taxes, extraordinary expenses and acquired fund fees and expenses, to average net assets of Class I and II shares did not exceed 1.00% and 1.25%, respectively. These expense limitation arrangements cannot be terminated prior to December 31, 2012 without the Board of Trustees’ consent.
The manager is permitted to recapture amounts previously forgone or reimbursed to a class during the same fiscal year if the class’ total annual operating expenses have fallen to a level below the expense limitation (“expense cap”) in effect at the time the fees were earned or the expense incurred. In no case will the manager recapture any amount that would result, on any particular business day of the Portfolio, in the class’ total annual operating expenses exceeding the expense cap or any other lower limit then in effect.
Legg Mason Investor Services, LLC, a wholly-owned broker-dealer subsidiary of Legg Mason, serves as the Portfolio’s sole and exclusive distributor.
All officers and one Trustee of the Trust are employees of Legg Mason or its affiliates and do not receive compensation from the Trust.
3. Investments
During the six months ended June 30, 2011, the aggregate cost of purchases and proceeds from sales of investments (excluding short-term investments) were as follows:
| | | | |
| Purchases | | $ | 81,838,677 | |
| Sales | | | 75,954,776 | |
At June 30, 2011, the aggregate gross unrealized appreciation and depreciation of investments for federal income tax purposes were substantially as follows:
| | | | |
| Gross unrealized appreciation | | $ | 9,415,781 | |
| Gross unrealized depreciation | | | (4,974,616) | |
| Net unrealized appreciation | | $ | 4,441,165 | |
At June 30, 2011, the Portfolio had the following open futures contracts:
| | | | | | | | | | | | | | | | | | | | |
| | | Number of
Contracts | | | Expiration
Date | | | Basis
Value | | | Market
Value | | | Unrealized
Gain (Loss) | |
| Contracts to Buy: | | | | | | | | | | | | | | | | | | | | |
U.S. Treasury Ultra
Long-term Bonds | | | 12 | | | | 9/11 | | | $ | 1,528,047 | | | $ | 1,515,000 | | | $ | (13,047) | |
| Contracts to Sell: | | | | | | | | | | | | | | | | | | | | |
| U.S. Treasury 5-Year Notes | | | 49 | | | | 9/11 | | | $ | 5,802,052 | | | $ | 5,840,570 | | | | (38,518) | |
| Net unrealized loss on open futures contracts | | | | | | | | | | | $ | (51,565) | |
During the six months period ended June 30, 2011, written option transactions for the Portfolio were as follows:
| | | | | | | | |
| | | Number of Contracts | | | Premiums | |
| Written options, outstanding December 31, 2010 | | | — | | | | — | |
| Options written | | | 64,720,000 | | | $ | 1,092,238 | |
| Written options, outstanding June 30, 2011 | | | 64,720,000 | | | | 1,092,238 | |
| | | | |
| Legg Mason Western Asset Variable Global High Yield Bond Portfolio 2011 Semi-Annual Report | | | 39 | |
At June 30, 2011, the Portfolio had the following open forward foreign currency contracts:
| | | | | | | | | | | | | | | | | | |
| Foreign Currency | | Counterparty | | Local
Currency | | | Market
Value | | | Settlement
Date | | | Unrealized
Gain (Loss) | |
| Contracts to Buy: | | | | | | | | | | | | | | | | | | |
| British Pound | | Citibank N.A. | | | 50,000 | | | $ | 80,204 | | | | 8/18/11 | | | $ | (1,357) | |
| Euro | | Citibank N.A. | | | 625,000 | | | | 905,229 | | | | 8/18/11 | | | | 25,479 | |
| Euro | | Citibank N.A. | | | 600,000 | | | | 869,020 | | | | 8/18/11 | | | | 14,861 | |
| Euro | | Citibank N.A. | | | 475,000 | | | | 687,974 | | | | 8/18/11 | | | | 6,777 | |
| Euro | | Citibank N.A. | | | 276,957 | | | | 401,136 | | | | 8/18/11 | | | | 462 | |
| | | | | | | | | | | | | | | | | | 46,222 | |
| | | | | |
| Contracts to Sell: | | | | | | | | | | | | | | | | | | |
| British Pound | | Citibank N.A. | | | 100,000 | | | | 160,409 | | | | 8/18/11 | | | $ | 1,927 | |
| British Pound | | Citibank N.A. | | | 946,185 | | | | 1,517,761 | | | | 8/18/11 | | | | 45,204 | |
| British Pound | | Credit Suisse | | | 306,262 | | | | 491,271 | | | | 8/18/11 | | | | 9,609 | |
| British Pound | | UBS AG | | | 200,000 | | | | 320,817 | | | | 8/18/11 | | | | 1,655 | |
| British Pound | | UBS AG | | | 400,000 | | | | 641,634 | | | | 8/18/11 | | | | 2,218 | |
| British Pound | | UBS AG | | | 1,346,488 | | | | 2,159,881 | | | | 8/18/11 | | | | 45,612 | |
| Euro | | Citibank N.A. | | | 215,000 | | | | 311,399 | | | | 8/18/11 | | | | 3,413 | |
| Euro | | Citibank N.A. | | | 275,000 | | | | 398,301 | | | | 8/18/11 | | | | (7,996) | |
| Euro | | Citibank N.A. | | | 300,000 | | | | 434,510 | | | | 8/18/11 | | | | 970 | |
| Euro | | Citibank N.A. | | | 350,000 | | | | 506,929 | | | | 8/18/11 | | | | (7,013) | |
| Euro | | Citibank N.A. | | | 600,667 | | | | 869,986 | | | | 8/18/11 | | | | 6,515 | |
| Euro | | Citibank N.A. | | | 1,165,339 | | | | 1,687,838 | | | | 8/18/11 | | | | 41,856 | |
| Euro | | Citibank N.A. | | | 8,597,379 | | | | 12,452,161 | | | | 8/18/11 | | | | 14,554 | |
| | | | | | | | | | | | | | | | | | 158,524 | |
| Net unrealized gain on open forward foreign currency contracts | | | $ | 204,746 | |
4. Derivative instruments and hedging activities
Financial Accounting Standards Board Codification Topic 815 requires enhanced disclosure about an entity’s derivative and hedging activities.
Below is a table, grouped by derivative type that provides information about the fair value and the location of derivatives within the Statement of Assets and Liabilities at June 30, 2011.
| | | | | | | | | | | | |
| ASSET DERIVATIVES1 | |
| | | Foreign
Exchange
Contracts Risk | | | Credit
Contracts Risk | | | Total | |
| Purchased options2 | | | — | | | $ | 276,652 | | | $ | 276,652 | |
| Forward foreign currency contracts | | $ | 221,112 | | | | — | | | | 221,112 | |
| Total | | $ | 221,112 | | | $ | 276,652 | | | $ | 497,764 | |
| | |
| 40 | | Legg Mason Western Asset Variable Global High Yield Bond Portfolio 2011 Semi-Annual Report |
Notes to financial statements (unaudited) (cont’d)
| | | | | | | | | | | | | | | | |
| LIABILITY DERIVATIVES1 | |
| | | Interest Rate
Contracts Risk | | | Foreign Exchange
Contracts Risk | | | Credit
Contracts Risk | | | Total | |
| Written options | | | — | | | | — | | | $ | 1,072,624 | | | $ | 1,072,624 | |
| Futures contracts3 | | $ | 51,565 | | | | — | | | | — | | | | 51,565 | |
| Forward foreign currency contracts | | | — | | | $ | 16,366 | | | | — | | | | 16,366 | |
| Total | | $ | 51,565 | | | $ | 16,366 | | | $ | 1,072,624 | | | $ | 1,140,555 | |
| 1 | Generally, the balance sheet location for asset derivatives is receivables/net unrealized appreciation (depreciation) and for liability derivatives is payables/net unrealized appreciation (depreciation). |
| 2 | Market value of purchased options is reported in Investments at value in the Statement of Assets and Liabilities. |
| 3 | Includes cumulative appreciation (depreciation) of futures contracts as reported in the footnotes. Only variation margin is reported within the receivables and/or payables of the Statement of Assets and Liabilities. |
The following tables provide information about the effect of derivatives and hedging activities on the Portfolio’s Statement of Operations for the six months ended June 30, 2011. The first table provides additional detail about the amounts and sources of gains (losses) realized on derivatives during the period. The second table provides additional information about the change in unrealized appreciation (depreciation) resulting from the Portfolio’s derivatives and hedging activities during the period.
| | | | | | | | | | | | |
| AMOUNT OF REALIZED GAIN (LOSS) ON DERIVATIVES RECOGNIZED | |
| | | Interest Rate
Contracts Risk | | | Foreign Exchange
Contracts Risk | | | Total | |
| Futures contracts | | $ | (42,863) | | | | — | | | $ | (42,863) | |
| Forward foreign currency contracts | | | — | | | $ | 927,438 | | | | 927,438 | |
| Total | | $ | (42,863) | | | $ | 927,438 | | | $ | 884,575 | |
| | | | | | | | | | | | | | | | |
| CHANGE IN UNREALIZED APPRECIATION (DEPRECIATION) ON DERIVATIVES RECOGNIZED | |
| | | Interest Rate
Contracts Risk | | | Foreign Exchange
Contracts Risk | | | Credit
Contracts Risk | | | Total | |
| Purchased options | | | — | | | | — | | | $ | (58,976) | | | $ | (58,976) | |
| Written options | | | — | | | | — | | | | 19,614 | | | | 19,614 | |
| Futures contracts | | $ | (109,445) | | | | — | | | | — | | | | (109,445) | |
| Forward foreign currency contracts | | | — | | | $ | 252,946 | | | | — | | | | 252,946 | |
| Total | | $ | (109,445) | | | $ | 252,946 | | | $ | (39,362) | | | $ | 104,139 | |
During the six months ended June 30, 2011, the volume of derivative activity for Portfolio was as follows:
| | | | |
| | | Average Market
Value | |
| Purchased options | | $ | 82,746 | |
| Written options | | | 312,273 | |
| Forward foreign currency contracts (to buy) | | | 1,961,987 | |
| Forward foreign currency contracts (to sell) | | | 19,626,100 | |
| Futures contracts (to buy) | | | 1,506,161 | |
| Futures contracts (to sell) | | | 5,786,649 | |
| | | | |
| Legg Mason Western Asset Variable Global High Yield Bond Portfolio 2011 Semi-Annual Report | | | 41 | |
5. Class specific expenses
The Portfolio has adopted a Rule 12b-1 distribution plan and under that plan the Portfolio pays a distribution fee with respect to its Class II shares calculated at the annual rate of 0.25% of the average daily net assets of the class. There is no distribution fee incurred by the Portfolio’s Class I shares. Service and/or distribution fees are accrued daily and paid monthly.
For the six months ended June 30, 2011, class specific expenses were as follows:
| | | | | | | | |
| | | Service and/or
Distribution Fees | | | Transfer Agent
Fees | |
| Class I | | | — | | | $ | 3,465 | |
| Class II | | $ | 36,791 | | | | 2,998 | |
| Total | | $ | 36,791 | | | $ | 6,463 | |
6. Distributions to shareholders by class
| | | | | | | | |
| | | Six Months Ended
June 30, 2011 | | | Year Ended
December 31, 2010 | |
| Net Investment Income: | | | | | |
| Class I | | $ | 1,007,482 | | | $ | 10,165,006 | |
| Class II | | | 192,525 | | | | 2,234,999 | |
| Total | | $ | 1,200,007 | | | $ | 12,400,005 | |
7. Shares of beneficial interest
At June 30, 2011, the Trust had an unlimited number of shares of beneficial interest authorized with a par value of $0.00001 per share. The Portfolio has the ability to issue multiple classes of shares. Each class of shares represents an identical interest and has the same rights, except that each class bears certain direct expenses, including those specifically related to the distribution of its shares.
Transactions in shares of each class were as follows:
| | | | | | | | | | | | | | | | |
| | | Six Months Ended
June 30, 2011 | | | Year Ended
December 31, 2010 | |
| | | Shares | | | Amount | | | Shares | | | Amount | |
| Class I | | | | | | | | | | | | | | | | |
| Shares sold | | | 1,550,998 | | | $ | 12,721,137 | | | | 6,035,143 | | | $ | 48,255,755 | |
| Shares issued on reinvestment | | | 121,530 | | | | 1,007,482 | | | | 1,295,212 | | | | 10,165,006 | |
| Shares repurchased | | | (1,558,014) | | | | (12,795,366) | | | | (8,435,750) | | | | (65,818,139) | |
| Net increase (decrease) | | | 114,514 | | | $ | 933,253 | | | | (1,105,395) | | | $ | (7,397,378) | |
| | | | |
| Class II | | | | | | | | | | | | | | | | |
| Shares sold | | | 456,947 | | | $ | 3,809,290 | | | | 977,548 | | | $ | 7,819,937 | |
| Shares issued on reinvestment | | | 22,892 | | | | 192,524 | | | | 280,806 | | | | 2,234,999 | |
| Shares repurchased | | | (449,034) | | | | (3,739,859) | | | | (1,588,106) | | | | (12,790,014) | |
| Net increase (decrease) | | | 30,805 | | | $ | 261,955 | | | | (329,752) | | | $ | (2,735,078) | |
| | |
| 42 | | Legg Mason Western Asset Variable Global High Yield Bond Portfolio 2011 Semi-Annual Report |
Notes to financial statements (unaudited) (cont’d)
8. Capital loss carryforward
As of December 31, 2011, the Portfolio had a net capital loss carryforward of approximately $20,715,922, of which $4,727,421 expires in 2016 and $15,988,501 expires in 2017. These amounts will be available to offset any future taxable capital gains.
Under the recently enacted Regulated Investment Company Modernization Act of 2010, the Portfolio will be permitted to carry forward capital losses incurred in taxable years beginning after December 22, 2010 for an unlimited period. However, any losses incurred during those future years will be required to be utilized prior to the losses incurred in pre-enactment taxable years. As a result of this ordering rule, pre-enactment capital loss carryforwards may be more likely to expire unused. Additionally, post-enactment capital losses that are carried forward will retain their character as either short-term or long-term capital losses rather than being considered all short-term as under previous law.
9. Legal matters
Beginning in May 2004, class action lawsuits alleging violations of the federal securities laws were filed against Citigroup Global Markets Inc. (“CGM”), a former distributor of the Portfolio, and other affiliated funds (collectively, the “Funds”) and a number of its then affiliates, including Smith Barney Fund Management LLC (“SBFM”) and Salomon Brothers Asset Management Inc. (“SBAM”), which were then investment adviser or manager to certain of the Funds (the “Managers”), substantially all of the mutual funds then managed by the Managers (the “Defendant Funds”), and Board members of the Defendant Funds (collectively, the “Defendants”). The complaints alleged, among other things, that CGM created various undisclosed incentives for its brokers to sell Smith Barney and Salomon Brothers funds. In addition, according to the complaints, the Managers caused the Defendant Funds to pay excessive brokerage commissions to CGM for steering clients towards proprietary funds. The complaints also alleged that the Defendants breached their fiduciary duty to the Defendant Funds by improperly charging Rule 12b-1 fees and by drawing on fund assets to make undisclosed payments of soft dollars and excessive brokerage commissions. The complaints also alleged that the Defendant Funds failed to adequately disclose certain of the allegedly wrongful conduct. The complaints sought injunctive relief and compensatory and punitive damages, rescission of the Defendant Funds’ contracts with the Managers, recovery of all fees paid to the Managers pursuant to such contracts and an award of attorneys’ fees and litigation expenses.
On December 15, 2004, a consolidated amended complaint (the “Complaint”) was filed alleging substantially similar causes of action. On May 27, 2005, all of the Defendants filed motions to dismiss the Complaint. On July 26, 2006, the court issued a decision and order (1) finding that plaintiffs lacked standing to sue on behalf of the shareholders of the Funds in which none of the plaintiffs had invested and dismissing those Funds from the case (although stating that they could be brought back into the case if standing as to them could be established), and (2) other than one stayed claim, dismissing all of the causes of action against the remaining Defendants, with prejudice, except for the cause of action under Section 36(b) of the 1940 Act, which the court granted plaintiffs leave to replead as a derivative claim.
| | | | |
| Legg Mason Western Asset Variable Global High Yield Bond Portfolio 2011 Semi-Annual Report | | | 43 | |
On October 16, 2006, plaintiffs filed their Second Consolidated Amended Complaint (“Second Amended Complaint”) which alleges derivative claims on behalf of nine funds identified in the Second Amended Complaint, under Section 36(b) of the 1940 Act, against Citigroup Asset Management, SBAM and SBFM as investment advisers to the identified funds, as well as CGM as a distributor for the identified funds (collectively, the “Second Amended Complaint Defendants”). The Portfolio was not identified in the Second Amended Complaint. The Second Amended Complaint alleges no claims against any of the funds or any of their Board Members. Under Section 36(b), the Second Amended Complaint alleges similar facts and seeks similar relief against the Second Amended Complaint Defendants as the Complaint.
On December 3, 2007, the court granted the Defendants’ motion to dismiss, with prejudice. On January 2, 2008, the plaintiffs filed a notice of appeal to the Second Circuit Court of Appeals. The appeal was fully briefed and oral argument before the U.S. Court of Appeals for the Second Circuit took place on March 5, 2009. On June 9, 2011, the Court of Appeals issued a Summary Order affirming the District Court’s dismissal of all claims with the exception of Plaintiffs’ Section 36(b) claim as it relates to Transfer Agent fees paid to an affiliate of the Managers. The case has been remanded to the District Court for further proceedings in accordance with the Summary Order.
Additional lawsuits arising out of these circumstances and presenting similar allegations and requests for relief may be filed in the future.
10. Other matters
On or about May 30, 2006, John Halebian, a purported shareholder of Western Asset New York Tax Free Money Market Fund (prior to May 31, 2010, the Fund was known as Western Asset / CitiSM New York Tax Free Reserves, and prior to June 1, 2009, as CitiSM New York Tax Free Reserves), a series of Legg Mason Partners Money Market Trust, formerly a series of CitiFunds Trust III (the “Subject Trust”), filed a complaint in the United States District Court for the Southern District of New York against the independent trustees of the Subject Trust (Elliott J. Berv, Donald M. Carlton, A. Benton Cocanougher, Mark T. Finn, Stephen Randolph Gross, Diana R. Harrington, Susan B. Kerley, Alan G. Merten and R. Richardson Pettit).
The Subject Trust is also named in the complaint as a nominal defendant. The complaint alleges both a derivative claim on behalf of the Subject Trust and class claims on behalf of a putative class of shareholders of the Subject Trust in connection with the 2005 sale of Citigroup’s asset management business to Legg Mason and the related approval of new investment advisory agreements by the trustees and shareholders. In the derivative claim, the plaintiff alleges, among other things, that the independent trustees breached their fiduciary duty to the Subject Trust and its shareholders by failing to negotiate lower fees or seek competing bids from other qualified investment advisers in connection with Citigroup’s sale to Legg Mason (the “Derivative Claim”). In the claims brought on behalf of the putative class of shareholders, the plaintiff alleges that the independent trustees violated the proxy solicitation requirements of the 1940 Act, and breached their fiduciary duty to shareholders, by virtue of the voting procedures, including “echo voting,” used to
| | |
| 44 | | Legg Mason Western Asset Variable Global High Yield Bond Portfolio 2011 Semi-Annual Report |
Notes to financial statements (unaudited) (cont’d)
obtain approval of the new investment advisory agreements and statements made in a proxy statement regarding those voting procedures (the “Putative Class Claims”). The plaintiff alleges that the proxy statement was misleading because it failed to disclose that the voting procedures violated the 1940 Act. The relief sought includes an award of damages, rescission of the advisory agreement, and an award of costs and attorney fees.
In advance of filing the complaint, Mr. Halebian’s lawyers made written demand for relief on the Board of the Subject Trust, and the Board’s independent trustees formed a demand review committee to investigate the matters raised in the demand, and subsequently in the complaint, and recommend a course of action to the Board.
The committee, after a thorough review, determined that the independent trustees did not breach their fiduciary duties as alleged by Mr. Halebian, and that the action demanded by Mr. Halebian would not be in the best interests of the Subject Trust. The Board of the Subject Trust (the trustee who is an “interested person” of the Subject Trust, within the meaning of the 1940 Act, having recused himself from the matter), after receiving and considering the committee’s report and based upon the findings of the committee, subsequently also determined and, adopting the recommendation of the committee, directed counsel to move to dismiss Mr. Halebian’s complaint. A motion to dismiss was filed on October 23, 2006. Opposition papers were filed on or about December 7, 2006. The complaint was dismissed on July 31, 2007. Mr. Halebian filed an appeal in the U.S. Court of Appeals for the Second Circuit. On December 29, 2009, the U.S. Court of Appeals for the Second Circuit reserved judgment after determining that the propriety of the district court’s dismissal depended upon an unsettled question of Massachusetts state law regarding the statute governing derivative proceedings was better addressed by a Massachusetts court and certified the question to the Massachusetts Supreme Judicial Court.
On August 23, 2010, the Massachusetts Supreme Judicial Court answered the certified question, concluding that a derivative action must be dismissed under applicable state law following a corporation’s independent determination, made in good faith and after reasonable inquiry, that maintenance of the derivative proceeding is not in the best interests of the corporation, regardless whether the derivative complaint has been filed before or after the corporation’s rejection of the shareholder’s demand.
On May 6, 2011, the U.S. Court of Appeals for the Second Circuit affirmed the district court’s dismissal of the Putative Class Claims. With regard to the Derivative Claim, to which the certified question related and as to which the district court granted a motion to dismiss, the Second Circuit vacated the district court’s judgment and remanded with instructions to the court to convert the motion to dismiss to a motion for summary judgment, and to rule on that motion, after further discovery should the court determine that such further discovery is warranted.
| | | | |
| Legg Mason Western Asset Variable Global High Yield Bond Portfolio 2011 Semi-Annual Report | | | 45 | |
11. Other tax information
On December 22, 2010, President Obama signed into law the Regulated Investment Company Modernization Act of 2010 (the “Act”). The Act updates certain tax rules applicable to regulated investment companies (“RICs”). The various provisions of the Act will generally be effective for RICs with taxable years beginning after December 22, 2010. Additional information regarding the impact of the Act on the Portfolio, if any, will be contained within the relevant sections of the notes to the financial statements for the fiscal year ended December 31, 2011.
Legg Mason Western Asset
Variable Global High Yield Bond Portfolio
Trustees
Elliott J. Berv
A. Benton Cocanougher
Jane F. Dasher
Mark T. Finn
R. Jay Gerken, CFA
Chairman
Rainer Greeven
Stephen R. Gross
Richard E. Hanson, Jr.
Diana R. Harrington
Susan M. Heilbron
Susan B. Kerley
Alan G. Merten
R. Richardson Pettit
Investment manager
Legg Mason Partners Fund Advisor, LLC
Subadvisers
Western Asset Management Company
Western Asset Management Company Limited
Western Asset Management Company Pte. Ltd.
Distributor
Legg Mason Investor Services, LLC
Custodian
State Street Bank and Trust Company
Transfer agent
Boston Financial Data Services, Inc.
2000 Crown Colony Drive
Quincy, MA 02169
Independent registered public accounting firm
KPMG LLP
345 Park Avenue
New York, NY 10154
Legg Mason Western Asset Variable Global High Yield Bond Portfolio
The Portfolio is a separate investment series of Legg Mason Partners Variable Income Trust, a Maryland statutory trust.
Legg Mason Western Asset Variable Global High Yield Bond Portfolio
Legg Mason Funds
55 Water Street
New York, NY 10041
The Portfolio files its complete schedule of portfolio holdings with the Securities and Exchange Commission (“SEC”) for the first and third quarters of each fiscal year on Form N-Q. The Portfolio’s Forms N-Q are available on the SEC’s website at www.sec.gov. The Portfolio’s Forms N-Q may be reviewed and copied at the SEC’s Public Reference Room in Washington, D.C., and information on the operation of the Public Reference Room may be obtained by calling 1-800-SEC-0330. To obtain information on Form N-Q, shareholders can call the Portfolio at 1-877-721-1926.
Information on how the Portfolio voted proxies relating to portfolio securities during the prior 12-month period ended June 30th of each year and a description of the policies and procedures that the Portfolio uses to determine how to vote proxies related to portfolio transactions are available (1) without charge, upon request, by calling the Portfolio at 1-877-721-1926, (2) on the Portfolio’s website at www.leggmason.com/
individualinvestors and (3) on the SEC’s website at www.sec.gov.
This report is submitted for the general information of the shareholders of Legg Mason Western Asset Variable Global High Yield Bond Portfolio. This report is not authorized for distribution to prospective investors in the Portfolio unless preceded or accompanied by a current prospectus.
Investors should consider the Portfolio’s investment objectives, risks, charges and expenses carefully before investing. The prospectus contains this and other important information about the Portfolio. Please read the prospectus carefully before investing.
www.leggmason.com/individualinvestors
©2011 Legg Mason Investor Services, LLC
Member FINRA, SIPC
Legg Mason Funds Privacy and Security Notice
Your Privacy and the Security of Your Personal Information is Very Important to the Legg Mason Funds
This Privacy and Security Notice (the “Privacy Notice”) addresses the Legg Mason Funds’ privacy and data protection practices with respect to nonpublic personal information the Funds receive. The Legg Mason Funds include any funds sold by the Funds’ distributor, Legg Mason Investor Services, LLC, as well as Legg Mason-sponsored closed-end funds. The provisions of this Privacy Notice apply to your information both while you are a shareholder and after you are no longer invested with the Funds.
The Type of Nonpublic Personal Information the Funds Collect About You
The Funds collect and maintain nonpublic personal information about you in connection with your shareholder account. Such information may include, but is not limited to:
| Ÿ | | Personal information included on applications or other forms; |
| Ÿ | | Account balances, transactions, and mutual fund holdings and positions; |
| Ÿ | | Online account access user IDs, passwords, security challenge question responses; and |
| Ÿ | | Information received from consumer reporting agencies regarding credit history and creditworthiness (such as the amount of an individual’s total debt, payment history, etc.). |
How the Funds Use Nonpublic Personal Information About You
The Funds do not sell or share your nonpublic personal information with third parties or with affiliates for their marketing purposes, or with other financial institutions or affiliates for joint marketing purposes, unless you have authorized the Funds to do so. The Funds do not disclose any nonpublic personal information about you except as may be required to perform transactions or services you have authorized or as permitted or required by law. The Funds may disclose information about you to:
| Ÿ | | Employees, agents, and affiliates on a “need to know” basis to enable the Funds to conduct ordinary business or comply with obligations to government regulators; |
| Ÿ | | Service providers, including the Funds’ affiliates, who assist the Funds as part of the ordinary course of business (such as printing, mailing services, or processing or servicing your account with us) or otherwise perform services on the Funds’ behalf, including companies that may perform marketing services solely for the Funds; |
| Ÿ | | The Funds’ representatives such as legal counsel, accountants and auditors; and |
| Ÿ | | Fiduciaries or representatives acting on your behalf, such as an IRA custodian or trustee of a grantor trust. |
|
| NOT PART OF THE SEMI-ANNUAL REPORT |
Legg Mason Funds Privacy and Security Notice (cont’d)
Except as otherwise permitted by applicable law, companies acting on the Funds’ behalf are contractually obligated to keep nonpublic personal information the Funds provide to them confidential and to use the information the Funds share only to provide the services the Funds ask them to perform.
The Funds may disclose nonpublic personal information about you when necessary to enforce their rights or protect against fraud, or as permitted or required by applicable law, such as in connection with a law enforcement or regulatory request, subpoena, or similar legal process. In the event of a corporate action or in the event a Fund service provider changes, the Funds may be required to disclose your nonpublic personal information to third parties. While it is the Funds’ practice to obtain protections for disclosed information in these types of transactions, the Funds cannot guarantee their privacy policy will remain unchanged.
Keeping You Informed of the Funds’ Privacy and Security Practices
The Funds will notify you annually of their privacy policy as required by federal law. While the Funds reserve the right to modify this policy at any time they will notify you promptly if this privacy policy changes.
The Funds’ Security Practices
The Funds maintain appropriate physical, electronic and procedural safeguards designed to guard your nonpublic personal information. The Funds’ internal data security policies restrict access to your nonpublic personal information to authorized employees, who may use your nonpublic personal information for Fund business purposes only.
Although the Funds strive to protect your nonpublic personal information, they cannot ensure or warrant the security of any information you provide or transmit to them, and you do so at your own risk. In the event of a breach of the confidentiality or security of your nonpublic personal information, the Funds will attempt to notify you as necessary so you can take appropriate protective steps. If you have consented to the Funds using electronic communications or electronic delivery of statements, they may notify you under such circumstances using the most current email address you have on record with them.
In order for the Funds to provide effective service to you, keeping your account information accurate is very important. If you believe that your account information is incomplete, not accurate or not current, or if you have questions about the Funds’ privacy practices, write the Funds using the contact information on your account statements, email the Funds by clicking on the Contact Us section of the Funds’ website at www.leggmason.com, or contact the Fund at 1-877-721-1926.
Revised April 2011
|
| NOT PART OF THE SEMI-ANNUAL REPORT |
www.leggmason.com/individualinvestors
©2011 Legg Mason Investor Services, LLC
FDXX010090 8/11 SR11-1453
Not applicable.
| ITEM 3. | AUDIT COMMITTEE FINANCIAL EXPERT. |
Not applicable.
| ITEM 4. | PRINCIPAL ACCOUNTANT FEES AND SERVICES. |
Not applicable.
| ITEM 5. | AUDIT COMMITTEE OF LISTED REGISTRANTS. |
Not applicable.
| ITEM 6. | SCHEDULE OF INVESTMENTS. |
Included herein under Item 1.
| ITEM 7. | DISCLOSURE OF PROXY VOTING POLICIES AND PROCEDURES FOR CLOSED-END MANAGEMENT INVESTMENT COMPANIES. |
Not applicable.
| ITEM 8. | PORTFOLIO MANAGERS OF CLOSED-END MANAGEMENT INVESTMENT COMPANIES. |
Not applicable.
| ITEM 9. | PURCHASES OF EQUITY SECURITIES BY CLOSED-END MANAGEMENT INVESTMENT COMPANY AND AFFILIATED PURCHASERS. |
Not applicable.
| ITEM 10. | SUBMISSION OF MATTERS TO A VOTE OF SECURITY HOLDERS. |
Not applicable.
| ITEM 11. | CONTROLS AND PROCEDURES. |
| | (a) | The registrant’s principal executive officer and principal financial officer have concluded that the registrant’s disclosure controls and procedures (as defined in Rule 30a- 3(c) under the Investment Company Act of 1940, as amended (the “1940 Act”)) are effective as of a date within 90 days of the filing date of this report that includes the disclosure required by this paragraph, based on their evaluation of the disclosure controls and procedures required by Rule 30a-3(b) under the 1940 Act and 15d-15(b) under the Securities Exchange Act of 1934. |
| | (b) | There were no changes in the registrant’s internal control over financial reporting (as defined in Rule 30a-3(d) under the 1940 Act) that occurred during the registrant’s last fiscal half-year (the registrant’s second fiscal half-year in the case of an annual report) that have materially affected, or are likely to materially affect the registrant’s internal control over financial reporting. |
(a) (1) Not applicable.
Exhibit 99.CODE ETH
(a) (2) Certifications pursuant to section 302 of the Sarbanes-Oxley Act of 2002 attached hereto.
Exhibit 99.CERT
(b) Certifications pursuant to Section 906 of the Sarbanes-Oxley Act of 2002 attached hereto.
Exhibit 99.906CERT
SIGNATURES
Pursuant to the requirements of the Securities Exchange Act of 1934 and the Investment Company Act of 1940, the registrant has duly caused this Report to be signed on its behalf by the undersigned, there unto duly authorized.
| | |
| Legg Mason Partners Variable Income Trust |
| |
By: | | /s/ R. Jay Gerken |
| | (R. Jay Gerken) Chief Executive Officer of Legg Mason Partners Variable Income Trust |
| |
Date: | | August 26, 2011 |
Pursuant to the requirements of the Securities Exchange Act of 1934 and the Investment Company Act of 1940, this report has been signed below by the following persons on behalf of the registrant and in the capacities and on the dates indicated.
| | |
By: | | /s/ R. Jay Gerken |
| | (R. Jay Gerken) |
| | Chief Executive Officer of Legg Mason Partners Variable Income Trust |
| |
Date: | | August 26, 2011 |
| |
By: | | /s/ Kaprel Ozsolak |
| | (Kaprel Ozsolak) |
| | Chief Financial Officer of Legg Mason Partners Variable Income Trust |
| |
Date: | | August 26, 2011 |