UNITED STATES
SECURITIES AND EXCHANGE COMMISSION
Washington, D.C. 20549
FORM N-CSR
CERTIFIED SHAREHOLDER REPORT OF REGISTERED
MANAGEMENT INVESTMENT COMPANIES
Investment Company Act file number 811-06310
Legg Mason Partners Variable Income Trust
(Exact name of registrant as specified in charter)
620 Eighth Avenue, 49th Floor, New York, NY 10018
(Address of principal executive offices) (Zip code)
Robert I. Frenkel, Esq.
Legg Mason & Co., LLC
100 First Stamford Place
Stamford, CT 06902
(Name and address of agent for service)
Registrant’s telephone number, including area code: 1-877-721-1926
Date of fiscal year end: December 31
Date of reporting period: December 31, 2016
| ITEM 1. | REPORT TO STOCKHOLDERS. |
The Annual Report to Stockholders is filed herewith.

| | |
| Annual Report | | December 31, 2016 |
WESTERN ASSET
CORE PLUS VIT PORTFOLIO

|
| INVESTMENT PRODUCTS: NOT FDIC INSURED • NO BANK GUARANTEE • MAY LOSE VALUE |
Portfolio objective
The Portfolio seeks to maximize total return, consistent with prudent investment management and liquidity needs, by investing to obtain a dollar-weighted average effective duration that is normally within 30% of the average duration of the domestic bond market as a whole.
Letter from the president

Dear Shareholder,
We are pleased to provide the annual report of Western Asset Core Plus VIT Portfolio for the twelve-month reporting period ended December 31, 2016. Please read on for a detailed look at prevailing economic and market conditions during the Portfolio’s reporting period and to learn how those conditions have affected Portfolio performance.
As always, we remain committed to providing you with excellent service and a full spectrum of investment choices. We also remain committed to supplementing the support you receive from your financial advisor. One way we accomplish this is through our website, www.leggmason.com. Here you can gain immediate access to market and investment information, including:
| • | | Market insights and commentaries from our portfolio managers and |
| • | | A host of educational resources. |
We look forward to helping you meet your financial goals.
Sincerely,

Jane Trust, CFA
President and Chief Executive Officer
January 31, 2017
| | |
| II | | Western Asset Core Plus VIT Portfolio |
Investment commentary
Economic review
The pace of U.S. economic activity fluctuated during the twelve months ended December 31, 2016 (the “reporting period”). Looking back, the U.S. Department of Commerce reported that first and second quarter 2016 U.S. gross domestic product (“GDP”)i growth was 0.8% and 1.4%, respectively. GDP growth for the third quarter of 2016 was 3.5%, the strongest reading in two years. The U.S. Department of Commerce’s initial reading for fourth quarter 2016 GDP growth — released after the reporting period ended — was 1.9%. The deceleration in growth reflected a downturn in exports, an acceleration in imports, a deceleration in personal consumption expenditures and a downturn in federal government spending.
While there was a pocket of weakness in May 2016, job growth in the U.S. was solid overall and a tailwind for the economy during the reporting period. When the reporting period ended on December 31, 2016, the unemployment rate was 4.7%, as reported by the U.S. Department of Labor. The percentage of longer-term unemployed also declined over the period. In December 2016, 24.2% of Americans looking for a job had been out of work for more than six months, versus 26.9% when the period began.
After an extended period of maintaining the federal funds rateii at a historically low range between zero and 0.25%, the Federal Reserve Board (the “Fed”)iii increased the rate at its meeting on December 16, 2015. This marked the first rate hike since 2006. In particular, the U.S. central bank raised the federal funds rate to a range between 0.25% and 0.50%. The Fed then kept rates on hold at each meeting prior to its meeting in mid-December 2016. On December 14, 2016, the Fed raised rates to a range between 0.50% and 0.75%. In the Fed’s statement after the December meeting it said, “The Committee expects that economic conditions will evolve in a manner that will warrant only gradual increases in the federal funds rate; the federal funds rate is likely to remain, for some time, below levels that are expected to prevail in the longer run. However, the actual path of the federal funds rate will depend on the economic outlook as informed by incoming data.”
As always, thank you for your confidence in our stewardship of your assets.
Sincerely,
Jane Trust, CFA
President and Chief Executive Officer
January 31, 2017
All investments are subject to risk including the possible loss of principal. Past performance is no guarantee of future results.
| i | Gross domestic product (“GDP”) is the market value of all final goods and services produced within a country in a given period of time. |
| ii | The federal funds rate is the rate charged by one depository institution on an overnight sale of immediately available funds (balances at the Federal Reserve) to another depository institution; the rate may vary from depository institution to depository institution and from day to day. |
| iii | The Federal Reserve Board (the “Fed”) is responsible for the formulation of U.S. policies designed to promote economic growth, full employment, stable prices and a sustainable pattern of international trade and payments. |
| | |
| Western Asset Core Plus VIT Portfolio | | III |
Portfolio overview
Q. What is the Portfolio’s investment strategy?
A. The Portfolio seeks to maximize total return, consistent with prudent investment management and liquidity needs, by investing to obtain the average durationi specified below. The Portfolio invests in a portfolio of fixed income securities of various maturities and, under normal market conditions, will invest at least 80% of its net assets in debt and fixed income securities. Although the Portfolio may invest in securities of any maturity, the Portfolio will normally maintain a dollar-weighted average effective durationii within 30% of the average duration of the domestic bond market as a whole as estimated by Western Asset Management Company (“Western Asset”), a subadviser to the Portfolio (generally, this range is 2.5 to 7 years). The Portfolio may invest up to 20% of its total assets in non-U.S. dollar denominated securities. Up to 20% of the Portfolio’s net assets may be invested in debt securities that are not rated in the Baa or BBB categories or above at the time of purchase by one or more nationally recognized statistical rating organizations (“NRSROs”) or, if unrated, securities that we determined to be of comparable quality at the time of purchase. Securities rated in the Baa or BBB categories or above by one or more NRSROs or unrated securities of comparable quality are known as “investment grade securities.” Securities rated below investment grade are commonly known as “high yield” or “junk” bonds. The Portfolio may invest up to 25% of its total assets in the securities of non-U.S. issuers. The Portfolio intends to invest a substantial portion of its assets in mortgage-backed and asset-backed securities.
The Portfolio may also enter into various exchange-traded and over-the-counter derivative transactions for both hedging and non-hedging purposes, including for purposes of enhancing returns. These derivative transactions include, but are not limited to, futures, options, swaps, foreign currency futures, and forwards. In particular, the Portfolio may use interest rate swaps, credit default swaps (including buying and selling credit default swaps on individual securities and/or baskets of securities), options (including options on credit default swaps), and/or futures contracts to a significant extent, although the amounts invested in these instruments may change from time to time. Other instruments may also be used to a significant extent from time to time.
At Western Asset, we utilize a fixed-income team approach, with decisions derived from interaction among various investment management sector specialists. The sector teams are comprised of Western Asset’s senior portfolio management personnel, research analysts and an in-house economist. Under this team approach, management of client fixed-income portfolios will reflect a consensus of interdisciplinary views within the Western Asset organization.
Q. What were the overall market conditions during the Portfolio’s reporting period?
A. The overall fixed income market experienced periods of volatility but generated positive results over the twelve-month reporting period ended December 31, 2016. The spreads sectors (non-Treasuries) had a weak start to the reporting period, partially driven by concerns over moderating growth in China, low oil and other commodity prices
| | |
| Western Asset Core Plus VIT Portfolio 2016 Annual Report | | 1 |
Portfolio overview (cont’d)
and uncertainties regarding future Federal Reserve Board (the “Fed”)iii monetary policy. However, from February through September 2016, the spread sectors largely rallied after these concerns eased due to firmer energy prices and Chinese growth as well as a dovish pivot by the Fed. This rally occurred even as the market overcame several headwinds, including questions related to global monetary policy, implications of the U.K.‘s referendum to leave the European Union (“Brexit”) and a number of geopolitical issues. Finally, U.S. Treasury yields moved sharply higher and most segments of the fixed income market generated weak results during the final three months of the year (yields and prices move in the opposite direction). This turnaround was triggered by expectations for improving economic growth and higher inflation due to potential fiscal stimulus from the Trump administration. In addition, for the first time in a year the Fed raised rates in December 2016. The U.S. central bank also indicated that it may institute more rate hikes in 2017 than it had previously projected.
Both short- and long-term Treasury yields moved higher during the reporting period as a whole. The yield for the two-year Treasury began the reporting period at 1.06% and ended the period at 1.20%. Their peak of 1.29% occurred on December 15, 2016, and they were as low as 0.56% on July 5, 2016. The yield for the ten-year Treasury was 2.27% at the beginning of the period and ended the period at 2.45%. Their peak of 2.60% was on both December 15 and 16, 2016, and their low of 1.37% occurred on both July 5 and July 8, 2016.
All told, the Bloomberg Barclays U.S. Aggregate Indexiv returned 2.65% for the twelve months ended December 31, 2016. Comparatively, riskier fixed-income securities, including high-yield bonds and emerging market debt, produced superior results. Over the fiscal year, the Bloomberg Barclays U.S. Corporate High Yield — 2% Issuer Cap Indexv gained 17.13%. U.S, dollar-denominated emerging market debt, as measured by the JPMorgan Emerging Markets Bond Index Global (“EMBI Global”)vi, gained 10.19% over the same period. Finally, emerging market local currency debt, as measured by the JPMorgan Government Bond Index-Emerging Markets Global Diversified Indexvii, rose 9.94% in 2016.
Q. How did we respond to these changing market conditions?
A. A number of adjustments were made to the Portfolio during the reporting period. We reduced the Portfolio’s allocation to investment-grade corporate bonds, as their spreads had narrowed and we looked to capture some profits. We also pared our allocation to high-yield corporate bonds, while increasing our exposure to senior secured bank loans. Given the strong performance in the high-yield market we found better relative value in bank loans, as they did not rally as significantly. In addition, bank loans have a higher placement in the capital structure and their floating rate feature may be beneficial in a rising rate environment. We added to agency mortgage-backed securities when their spreads widened thereby reducing our underweight position versus the benchmark. From a foreign exchange perspective, we reduced the Portfolio’s short yen and euro positions after they had weakened versus the U.S. dollar and we felt additional weakness may be limited. We initiated long positions in the Russian ruble and Indian rupee given improving fundamentals in both countries.
| | |
| 2 | | Western Asset Core Plus VIT Portfolio 2016 Annual Report |
The Portfolio used U.S. Treasury futures and options, Eurodollar futures and options, interest rate swaps and swaptions and futures on Japanese and German rates to manage our duration and yield curveviii exposure. The use of these instruments contributed to performance. Credit default swaps (“CDS”), which were used to manage the Portfolio’s exposure to individual credits, were additive for results. High-yield index swaps (“CDX”), which were used to manage the Portfolio’s high-yield corporate bond exposure, contributed to results. Finally, the use of currency forwards to hedge its non-U.S. dollar currency exposure was a positive for performance.
Performance review
For the twelve months ended December 31, 2016, Class I shares of Western Asset Core Plus VIT Portfolio1 returned 4.55%. The Portfolio’s unmanaged benchmark, the Bloomberg Barclays U.S. Aggregate Index, returned 2.65%, for the same period. The Lipper Variable Core Plus Bond Funds Category Average2 returned 3.71% over the same time frame.
| | | | | | | | |
Performance Snapshot as of December 31, 2016
(unaudited) | |
| | | 6 months | | | 12 months | |
| Western Asset Core Plus VIT Portfolio1: | | | | | | | | |
Class I | | | -1.60 | % | | | 4.55 | % |
Class II | | | -1.62 | % | | | 4.17 | % |
| Bloomberg Barclays U.S. Aggregate Index | | | -2.53 | % | | | 2.65 | % |
| Lipper Variable Core Plus Bond Funds Category Average2 | | | -1.08 | % | | | 3.71 | % |
The performance shown represents past performance. Past performance is no guarantee of future results and current performance may be higher or lower than the performance shown above. Principal value, investment returns and yields will fluctuate and investors’ shares, when redeemed, may be worth more or less than their original cost.
All share class returns assume the reinvestment of all distributions at net asset value and the deduction of all Portfolio expenses. Performance figures for periods shorter than one year represent cumulative figures and are not annualized.
The 30-Day SEC Yields for the period ended December 31, 2016 for Class I and Class II shares were 2.61% and 2.35%, respectively. The 30-Day SEC Yield is subject to change and is based on the yield to maturity of the Portfolio’s investments over a 30-day period and not on the dividends paid by the Portfolio, which may differ.
| 1 | The Portfolio is an underlying investment option of various variable annuity and variable life insurance products. The Portfolio’s performance returns do not reflect the deduction of expenses imposed in connection with investing in variable annuity or variable life insurance contracts, such as administrative fees, account charges and surrender charges, which, if reflected, would reduce the performance of the Portfolio. Past performance is no guarantee of future results. |
| 2 | Lipper, Inc., a wholly-owned subsidiary of Reuters, provides independent insight on global collective investments. Returns are based on the period ended December 31, 2016, including the reinvestment of all distributions, including returns of capital, if any, calculated among the 43 funds for the six-month period and among the 43 funds for the twelve-month period in the Portfolio’s Lipper category. |
| | |
| Western Asset Core Plus VIT Portfolio 2016 Annual Report | | 3 |
Portfolio overview (cont’d)
|
| Total Annual Operating Expenses (unaudited) |
As of the Portfolio’s current prospectus dated May 1, 2016, the gross total annual fund operating expense ratios for Class I and Class II shares were 0.61% and 0.76%, respectively.
Actual expenses may be higher. For example, expenses may be higher than those shown if average net assets decrease. Net assets are more likely to decrease and Portfolio expense ratios are more likely to increase when markets are volatile.
As a result of expense limitation arrangements, the ratio of total annual fund operating expenses, other than interest, brokerage, taxes, extraordinary expenses and acquired fund fees and expenses, to average net assets will not exceed 0.54% for Class I shares and 0.79% for Class II shares. This expense limitation arrangement cannot be terminated prior to December 31, 2018 without the Board of Trustees’ consent.
The manager is permitted to recapture amounts waived and/or reimbursed to the class during the same fiscal year if the class’ total annual operating expenses have fallen to a level below the expense limitation (“expense cap”) in effect at the time the fees were earned or the expenses incurred. In no case will the manager recapture any amount that would result, on any particular business day of the Portfolio, in the class’ total annual operating expenses exceeding the expense cap or any other lower limit then in effect.
Q. What were the leading contributors to performance?
A. The largest contributor to the Portfolio’s relative performance during the reporting period was our out-of-benchmark allocation to high-yield corporate bonds. After a difficult start to the year, they rallied significantly given rising oil prices, moderating defaults, continued economic growth and strong demand from investors looking to generate yield in the low interest rate environment. Examples of strong high-yield corporate bond performers were our overweights in Petrobras Global Finance Company, Sprint (Sprint Capital Corp. and Sprint Corp.) and Chesapeake Energy Corp.
Yield curve positioning, with an overweight to longer dated securities, was beneficial as the yield curve flattened, with intermediate rates rising more than long term rates. The Portfolio’s out-of-benchmark allocation to non-agency mortgage-backed securities (“MBS”) was beneficial given a lack of new issuance and solid investor demand.
Security selection of investment-grade corporate bonds was additive for results. In particular, Anheuser-Busch Inbev Finance, Inc., Goldman Sachs Group, Inc. and Verizon Communications contributed the most to performance. An allocation to U.S. Treasury Inflation-Protected Securities (“TIPS”)ix contributed to results based on increased inflation expectations in the market following the November 2016 elections. An overweight to commercial mortgage-backed securities (“CMBS”) also beneficial for results as their spreads narrowed overall during the reporting period.
Finally, the Portfolio’s developed non-U.S. dollar positioning was positive for performance. Specifically, tactical short yen and euro positions contributed to results as the two currencies weakened relative to the U.S. dollar when the shorts were in place. Within emerging market currencies, a short to the Chinese yuan and a long to the Brazilian real were additive.
| | |
| 4 | | Western Asset Core Plus VIT Portfolio 2016 Annual Report |
Q. What were the leading detractors from performance?
A. The largest detractor from the Portfolio’s relative performance for the period was its duration position. We tactically adjusted the Portfolio’s duration given our changing views on the economy and Fed monetary policy.
An underweight exposure to agency MBS was negative for results. We held an underweight to the sector as we found more attractive valued opportunities in other spread sectors. This positioning was not rewarded as agency MBS spreads narrowed during the reporting period amid overall solid demand and continued reinvestment of agency MBS by the Fed. Elsewhere, an out-of-benchmark allocation to local emerging market currency exposure was negative for performance. In particular, a long position in the Mexican peso was a headwind for results as it came under pressure given the outcome of the U.S. Presidential election.
Finally, while security selection of investment-grade and high-yield corporate bonds overall was beneficial for performance, several individual holdings were negative for results. In terms of investment grade corporate bonds, Danone SA, Microsoft Corp., and Netflix, Inc. were headwinds for results. Examples of high-yield corporate bonds that detracted from performance included Valeant Pharmaceuticals International Inc, Mirabela Nickel Limited and Hexion, Inc.
Thank you for your investment in Western Asset Core Plus VIT Portfolio. As always, we appreciate that you have chosen us to manage your assets and we remain focused on achieving the Portfolio’s investment goals.
Sincerely,
Western Asset Management Company
January 21, 2017
RISKS: Investments in fixed income securities involve a variety of risks, including interest rate, credit, inflation and reinvestment risks. As interest rates rise, bond prices fall, reducing the value of the Portfolio’s share price. High-yield bonds, commonly known as “junk bonds,” are rated below investment grade and carry more risk than higher-rated securities. Asset-backed, mortgaged-backed or mortgage-related securities are subject to prepayment and extension risks. Non-U.S. investments are subject to special risks including currency fluctuations, and social, economic and political uncertainties, which could increase volatility. These risks are magnified in emerging markets. The Portfolio may use derivatives, such as options, futures, and swaps, which can be illiquid, may disproportionately increase losses, and have a potentially large impact on Portfolio performance. The use of leverage may increase volatility and possibility of loss. Please see the Portfolio’s prospectuses for a more complete discussion of these and other risks and the Portfolio’s investment strategies.
Portfolio holdings and breakdowns are as of December 31, 2016 and are subject to change and may not be representative of the portfolio managers’ current or future investments. Please refer to pages 14 through 37 for a list and percentage breakdown of the Portfolio’s holdings.
The mention of sector breakdowns is for informational purposes only and should not be construed as a recommendation to purchase or sell any securities. The information provided regarding such sectors is not a sufficient basis upon which to make an investment decision. Investors seeking financial advice regarding the appropriateness of investing in any securities or investment strategies discussed should consult
| | |
| Western Asset Core Plus VIT Portfolio 2016 Annual Report | | 5 |
Portfolio overview (cont’d)
their financial professional. Portfolio holdings are subject to change at any time and may not be representative of the portfolio managers’ current or future investments. The Portfolio’s top five sector holdings (as a percentage of net assets) as of December 31, 2016 were: U.S. Government & Agency Obligations (25.3%), Mortgage-Backed Securities (21.1%), Collateralized Mortgage Obligations (9.8%), Financials (8.7%) and Sovereign Bonds (5.6%). The Portfolio’s composition is subject to change at any time.
All investments are subject to risk including the possible loss of principal. Past performance is no guarantee of future results. All index performance reflects no deduction for fees, expenses or taxes. Please note that an investor cannot invest directly in an index.
The information provided is not intended to be a forecast of future events, a guarantee of future results or investment advice. Views expressed may differ from those of the firm as a whole.
| i | Duration is the measure of the price sensitivity of a fixed-income security to an interest rate change of 100 basis points. Calculation is based on the weighted average of the present values for all cash flows. |
| ii | Effective duration is a duration calculation for bonds with embedded options. Effective duration takes into account that expected cash flows will fluctuate as interest rates change. Please note, duration measures the sensitivity of price (the value of principal) of a fixed-income investment to a change in interest rates. Funds that employ leverage calculate effective duration based off of Net Assets. |
| iii | The Federal Reserve Board (the “Fed”) is responsible for the formulation of U.S. policies designed to promote economic growth, full employment, stable prices, and a sustainable pattern of international trade and payments. |
| iv | The Bloomberg Barclays U.S. Aggregate Index is a broad-based bond index comprised of government, corporate, mortgage- and asset-backed issues, rated investment grade or higher, and having at least one year to maturity. |
| v | The Bloomberg Barclays U.S. Corporate High Yield — 2% Issuer Cap Index is an index of the 2% Issuer Cap component of the Bloomberg Barclays U.S. Corporate High |
| Yield Index, which covers the U.S. dollar-denominated, non-investment grade, fixed-rate, taxable corporate bond market. |
| vi | The JPMorgan Emerging Markets Bond Index Global (“EMBI Global”) tracks total returns for U.S. dollar-denominated debt instruments issued by emerging market sovereign and quasi-sovereign entities: Brady bonds, loans, Eurobonds and local market instruments. |
| vii | JPMorgan Government Bond Index-Emerging Markets Global Diversified Index tracks the performance of local currency debt issued by emerging market governments, whose debt is accessible by most of the international investor base. |
| viii | The yield curve is the graphical depiction of the relationship between the yield on bonds of the same credit quality but different maturities. |
| ix | U.S. Treasury Inflation-Protected Securities (“TIPS”) are inflation-indexed securities issued by the U.S. Treasury in five-year, ten-year and thirty-year maturities. The principal is adjusted to the Consumer Price Index, the commonly used measure of inflation. The coupon rate is constant, but generates a different amount of interest when multiplied by the inflation-adjusted principal. |
| | |
| 6 | | Western Asset Core Plus VIT Portfolio 2016 Annual Report |
Portfolio at a glance† (unaudited)
Investment breakdown (%) as a percent of total investments
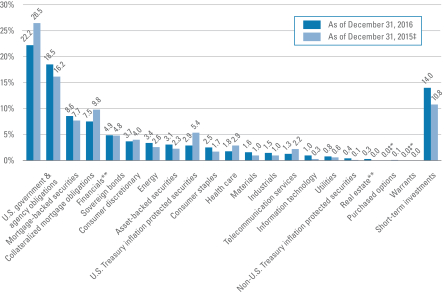
| † | The bar graph above represents the composition of the Portfolio’s investments as of December 31, 2016 and December 31, 2015 and does not include derivatives such as swap contracts, forward foreign currency contracts, futures contracts and written options. The Portfolio is actively managed. As a result, the composition of the Portfolio’s investments is subject to change at any time. |
| ‡ | Effective April 15, 2015, the Portfolio’s investment objective, 80% investment policy and principal investment strategies were changed. |
| * | Represents less than 0.1%. |
| ** | Effective August 31, 2016, the Financials sector was redefined to exclude real estate and a Real Estate sector was created. |
| | |
| Western Asset Core Plus VIT Portfolio 2016 Annual Report | | 7 |
Portfolio expenses (unaudited)
Example
As a shareholder of the Portfolio, you may incur two types of costs: (1) transaction costs and (2) ongoing costs, including management fees; distribution and/or service (12b-1) fees; and other Portfolio expenses. This example is intended to help you understand your ongoing costs (in dollars) of investing in the Portfolio and to compare these costs with the ongoing costs of investing in other mutual funds.
This example is based on an investment of $1,000 invested on July 1, 2016 and held for the six months ended December 31, 2016.
Actual expenses
The table below titled “Based on Actual Total Return” provides information about actual account values and actual expenses. You may use the information provided in this table, together with the amount you invested, to estimate the expenses that you paid over the period. To estimate the expenses you paid on your account, divide your ending account value by $1,000 (for example, an $8,600 ending account value divided by $1,000 = 8.6), then multiply the result by the number under the heading entitled “Expenses Paid During the Period”.
Hypothetical example for comparison purposes
The table below titled “Based on Hypothetical Total Return” provides information about hypothetical account values and hypothetical expenses based on the actual expense ratio and an assumed rate of return of 5.00% per year before expenses, which is not the Portfolio’s actual return. The hypothetical account values and expenses may not be used to estimate the actual ending account balance or expenses you paid for the period. You may use the information provided in this table to compare the ongoing costs of investing in the Portfolio and other funds. To do so, compare the 5.00% hypothetical example relating to the Portfolio with the 5.00% hypothetical examples that appear in the shareholder reports of the other funds.
Please note that the expenses shown in the table below are meant to highlight your ongoing costs only and do not reflect any transactional costs. Therefore, the table is useful in comparing ongoing costs only, and will not help you determine the relative total costs of owning different funds. In addition, if these transaction costs were included, your costs would have been higher.
| | | | | | | | | | | | | | | | | | | | | | | | | | | | | | | | | | | | | | | | | | | | | | |
| Based on actual total return1 | | | | | | Based on hypothetical total return1 | |
| | | Actual
Total
Return2 | | | Beginning
Account
Value | | | Ending
Account
Value | | | Annualized
Expense
Ratio | | | Expenses
Paid
During
the
Period3 | | | | | | | | Hypothetical
Annualized
Total Return | | | Beginning
Account
Value | | | Ending
Account
Value | | | Annualized
Expense
Ratio | | | Expenses
Paid
During
the
Period3 | |
| Class I | | | -1.60 | % | | $ | 1,000.00 | | | $ | 984.00 | | | | 0.51 | % | | $ | 2.54 | | | | | | | Class I | | | 5.00 | % | | $ | 1,000.00 | | | $ | 1,022.57 | | | | 0.51 | % | | $ | 2.59 | |
| Class II | | | -1.62 | | | | 1,000.00 | | | | 983.80 | | | | 0.76 | | | | 3.79 | | | | | | | Class II | | | 5.00 | | | | 1,000.00 | | | | 1,021.32 | | | | 0.76 | | | | 3.86 | |
| | |
| 8 | | Western Asset Core Plus VIT Portfolio 2016 Annual Report |
| 1 | For the six months ended December 31, 2016. |
| 2 | Assumes the reinvestment of all distributions, including returns of capital, if any, at net asset value. Total return is not annualized, as it may not be representative of the total return for the year. Total return does not reflect expenses associated with separate accounts such as administrative fees, account charges and surrender charges, which, if reflected, would reduce the total returns. Performance figures may reflect compensating balance arrangements, fee waivers and/or expense reimbursements. In the absence of compensating balance arrangements, fee waivers and/or expense reimbursements, the total return would have been lower. Past performance is no guarantee of future results. |
| 3 | Expenses (net of compensating balance arrangements, fee waivers and/or expense reimbursements) are equal to each class’ respective annualized expense ratio multiplied by the average account value over the period, multiplied by the number of days in the most recent fiscal half-year (184), then divided by 366. |
| | |
| Western Asset Core Plus VIT Portfolio 2016 Annual Report | | 9 |
Portfolio performance (unaudited)
| | | | | | | | |
| Average annual total returns1 | | | | | | |
| | | Class I | | | Class II | |
| Twelve Months Ended 12/31/16 | | | 4.55 | % | | | 4.17 | % |
| Five Years Ended 12/31/16 | | | 6.30 | | | | N/A | |
| Ten Years Ended 12/31/16 | | | 6.18 | | | | N/A | |
| Inception* through 12/31/16 | | | — | | | | 1.35 | |
| | | | |
| Cumulative total returns1 | | | |
| Class I (12/31/06 through 12/31/16) | | | 82.10 | % |
| Class II (Inception date of 5/1/15 through 12/31/16) | | | 2.25 | |
All figures represent past performance and are not a guarantee of future results. Investment return and principal value of an investment will fluctuate so that an investor’s shares, when redeemed, may be worth more or less than their original cost. The returns shown do not reflect expenses associated with separate accounts such as administrative fees, account charges and surrender charges, which, if reflected, would reduce the total returns. Performance figures may reflect compensating balance arrangements, fee waivers and/or expense reimbursements. In the absence of compensating balance arrangements, fee waivers and/or expense reimbursements, the total return would have been lower.
| 1 | Assumes the reinvestment of all distributions, including returns of capital, if any, at net asset value. |
| * | Inception dates for Class I and Class II shares are June 16, 1994 and May 1, 2015, respectively. |
| | |
| 10 | | Western Asset Core Plus VIT Portfolio 2016 Annual Report |
Historical performance
Value of $10,000 invested in
Class I shares of Western Asset Core Plus VIT Portfolio vs. Bloomberg Barclays U.S. Aggregate Index† — December 2006 - December 2016
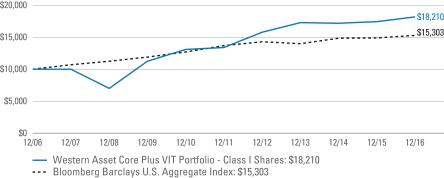
All figures represent past performance and are not a guarantee of future results. Investment return and principal value of an investment will fluctuate so that an investor’s shares, when redeemed, may be worth more or less than their original cost. The returns shown do not reflect expenses associated with separate accounts such as administrative fees, account charges and surrender charges, which, if reflected, would reduce the total returns. Performance figures may reflect compensating balance arrangements, fee waivers and/or expense reimbursements. In the absence of compensating balance arrangements, fee waivers and/or expense reimbursements, the total return would have been lower.
| † | Hypothetical illustration of $10,000 invested in Class I shares of Western Asset Core Plus VIT Portfolio on December 31, 2006, assuming the reinvestment of all distributions, including returns of capital, if any, at net asset value through December 31, 2016. The hypothetical illustration also assumes a $10,000 investment in the Bloomberg Barclays U.S. Aggregate Index. The Bloomberg Barclays U.S. Aggregate Index is a broad-based bond index comprised of government, corporate, mortgage- and asset-backed issues, rated investment grade or higher, and having at least one year to maturity. This index is unmanaged and is not subject to the same management and trading expenses as a fund. Please note that an investor cannot invest directly in an index. The performance of the Portfolio’s other class may be greater or less than Class I shares’ performance indicated on this chart, depending on whether greater or lesser fees were incurred by shareholders investing in the other class. Prior to April 15, 2015, the Portfolio was named Western Asset Variable High Income Portfolio, had a different investment objective, used different investment strategies and had a different benchmark index. |
| | |
| Western Asset Core Plus VIT Portfolio 2016 Annual Report | | 11 |
Spread duration (unaudited)
Economic exposure — December 31, 2016
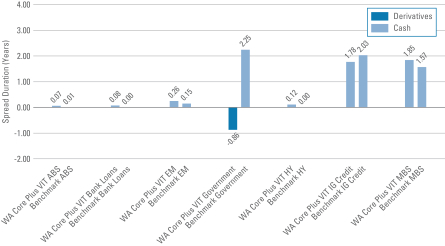
Spread duration measures the sensitivity to changes in spreads. The spread over Treasuries is the annual risk-premium demanded by investors to hold non-Treasury securities. Spread duration is quantified as the % change in price resulting from a 100 basis points change in spreads. For a security with positive spread duration, an increase in spreads would result in a price decline and a decline in spreads would result in a price increase. This chart highlights the market sector exposure of the Portfolio’s sectors relative to the selected benchmark sectors as of the end of the reporting period.
| | |
| Benchmark | | — Bloomberg Barclays U.S. Aggregate Index |
| ABS | | — Asset-Backed Securities |
| EM | | — Emerging Markets |
| HY | | — High Yield |
| IG Credit | | — Investment Grade Credit |
| MBS | | — Mortgage-Backed Securities |
| WA Core Plus VIT | | — Western Asset Core Plus VIT Portfolio |
| | |
| 12 | | Western Asset Core Plus VIT Portfolio 2016 Annual Report |
Effective duration (unaudited)
Interest rate exposure — December 31, 2016
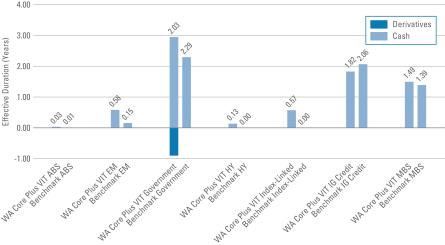
Effective duration measures the sensitivity to changes in relevant interest rates. Effective duration is quantified as the % change in price resulting from a 100 basis points change in interest rates. For a security with positive effective duration, an increase in interest rates would result in a price decline and a decline in interest rates would result in a price increase. This chart highlights the interest rate exposure of the Portfolio’s sectors relative to the selected benchmark sectors as of the end of the reporting period.
| | |
| Benchmark | | — Bloomberg Barclays U.S. Aggregate Index |
| ABS | | — Asset-Backed Securities |
| EM | | — Emerging Markets |
| HY | | — High Yield |
| IG Credit | | — Investment Grade Credit |
| MBS | | — Mortgage-Backed Securities |
| WA Core Plus VIT | | — Western Asset Core Plus VIT Portfolio |
| | |
| Western Asset Core Plus VIT Portfolio 2016 Annual Report | | 13 |
Schedule of investments
December 31, 2016
Western Asset Core Plus VIT Portfolio
| | | | | | | | | | | | | | | | |
| Security | | Rate | | | Maturity
Date | | | Face
Amount† | | | Value | |
| Corporate Bonds & Notes — 24.6% | | | | | | | | | | | | | | | | |
| Consumer Discretionary — 2.5% | | | | | | | | | | | | | | | | |
Auto Components — 0.1% | | | | | | | | | | | | | | | | |
American Axle & Manufacturing Inc., Senior Notes | | | 6.625 | % | | | 10/15/22 | | | | 140,000 | | | $ | 145,068 | |
Goodyear Tire & Rubber Co., Senior Notes | | | 5.000 | % | | | 5/31/26 | | | | 240,000 | | | | 239,506 | |
ZF North America Capital Inc., Senior Notes | | | 4.750 | % | | | 4/29/25 | | | | 370,000 | | | | 377,862 | (a) |
Total Auto Components | | | | | | | | | | | | | | | 762,436 | |
Automobiles — 0.5% | | | | | | | | | | | | | | | | |
Fiat Chrysler Automobiles NV, Senior Notes | | | 5.250 | % | | | 4/15/23 | | | | 280,000 | | | | 286,174 | |
Ford Motor Co., Senior Notes | | | 4.750 | % | | | 1/15/43 | | | | 370,000 | | | | 352,560 | |
Ford Motor Credit Co., LLC, Senior Notes | | | 3.200 | % | | | 1/15/21 | | | | 540,000 | | | | 541,295 | |
General Motors Co., Senior Notes | | | 5.200 | % | | | 4/1/45 | | | | 560,000 | | | | 541,748 | |
General Motors Financial Co. Inc., Senior Notes | | | 4.375 | % | | | 9/25/21 | | | | 1,390,000 | | | | 1,443,400 | |
Total Automobiles | | | | | | | | | | | | | | | 3,165,177 | |
Hotels, Restaurants & Leisure — 0.4% | | | | | | | | | | | | | | | | |
1011778 BC ULC/New Red Finance Inc., Secured Notes | | | 6.000 | % | | | 4/1/22 | | | | 500,000 | | | | 523,750 | (a) |
Bossier Casino Venture Holdco Inc., Senior Secured Bonds | | | 14.000 | % | | | 2/9/18 | | | | 362,461 | | | | 362,461 | (a)(b)(c) |
GLP Capital LP/GLP Financing II Inc., Senior Notes | | | 5.375 | % | | | 11/1/23 | | | | 270,000 | | | | 290,250 | |
McDonald’s Corp., Senior Notes | | | 3.700 | % | | | 1/30/26 | | | | 380,000 | | | | 387,602 | |
NCL Corp. Ltd., Senior Notes | | | 4.750 | % | | | 12/15/21 | | | | 500,000 | | | | 500,940 | (a) |
Scientific Games International Inc., Senior Secured Notes | | | 7.000 | % | | | 1/1/22 | | | | 270,000 | | | | 290,925 | (a) |
Total Hotels, Restaurants & Leisure | | | | | | | | | | | | | | | 2,355,928 | |
Household Durables — 0.1% | | | | | | | | | | | | | | | | |
Newell Brands Inc., Senior Notes | | | 3.150 | % | | | 4/1/21 | | | | 220,000 | | | | 224,110 | |
Newell Brands Inc., Senior Notes | | | 3.850 | % | | | 4/1/23 | | | | 250,000 | | | | 259,677 | |
Newell Brands Inc., Senior Notes | | | 4.200 | % | | | 4/1/26 | | | | 170,000 | | | | 177,642 | |
Toll Brothers Finance Corp., Senior Notes | | | 6.750 | % | | | 11/1/19 | | | | 50,000 | | | | 54,938 | |
Total Household Durables | | | | | | | | | | | | | | | 716,367 | |
Internet & Direct Marketing Retail — 0.2% | | | | | | | | | | | | | | | | |
Amazon.com Inc., Senior Notes | | | 4.950 | % | | | 12/5/44 | | | | 370,000 | | | | 423,669 | |
Netflix Inc., Senior Bonds | | | 5.875 | % | | | 2/15/25 | | | | 500,000 | | | | 540,625 | |
Total Internet & Direct Marketing Retail | | | | | | | | | | | | | | | 964,294 | |
Media — 1.2% | | | | | | | | | | | | | | | | |
CCO Holdings LLC/CCO Holdings Capital Corp., Senior Notes | | | 5.375 | % | | | 5/1/25 | | | | 460,000 | | | | 474,950 | (a) |
Charter Communications Operating LLC/Charter Communications Operating Capital Corp., Senior Secured Notes | | | 4.464 | % | | | 7/23/22 | | | | 10,000 | | | | 10,463 | |
Charter Communications Operating LLC/Charter Communications Operating Capital Corp., Senior Secured Notes | | | 4.908 | % | | | 7/23/25 | | | | 50,000 | | | | 52,786 | |
See Notes to Financial Statements.
| | |
| 14 | | Western Asset Core Plus VIT Portfolio 2016 Annual Report |
Western Asset Core Plus VIT Portfolio
| | | | | | | | | | | | | | | | |
| Security | | Rate | | | Maturity
Date | | | Face
Amount† | | | Value | |
Media — continued | | | | | | | | | | | | | | | | |
Charter Communications Operating LLC/Charter Communications Operating Capital Corp., Senior Secured Notes | | | 6.384 | % | | | 10/23/35 | | | | 10,000 | | | $ | 11,450 | |
Comcast Corp., Senior Notes | | | 3.375 | % | | | 8/15/25 | | | | 360,000 | | | | 362,567 | |
Comcast Corp., Senior Notes | | | 6.950 | % | | | 8/15/37 | | | | 800,000 | | | | 1,093,154 | |
Comcast Corp., Senior Notes | | | 6.400 | % | | | 3/1/40 | | | | 650,000 | | | | 847,740 | |
DISH DBS Corp., Senior Notes | | | 7.875 | % | | | 9/1/19 | | | | 250,000 | | | | 278,125 | |
DISH DBS Corp., Senior Notes | | | 6.750 | % | | | 6/1/21 | | | | 250,000 | | | | 271,875 | |
SFR Group SA, Senior Secured Bonds | | | 6.000 | % | | | 5/15/22 | | | | 300,000 | | | | 309,000 | (a) |
Time Warner Cable LLC, Debentures | | | 7.300 | % | | | 7/1/38 | | | | 30,000 | | | | 37,014 | |
Time Warner Cable LLC, Senior Bonds | | | 6.550 | % | | | 5/1/37 | | | | 1,070,000 | | | | 1,214,858 | |
Time Warner Cable LLC, Senior Notes | | | 5.875 | % | | | 11/15/40 | | | | 890,000 | | | | 952,222 | |
Time Warner Inc., Senior Notes | | | 4.750 | % | | | 3/29/21 | | | | 60,000 | | | | 64,340 | |
Time Warner Inc., Senior Notes | | | 6.250 | % | | | 3/29/41 | | | | 710,000 | | | | 831,176 | |
Univision Communications Inc., Senior Secured Notes | | | 5.125 | % | | | 2/15/25 | | | | 190,000 | | | | 182,400 | (a) |
Viacom Inc., Senior Notes | | | 4.250 | % | | | 9/1/23 | | | | 240,000 | | | | 240,536 | |
Virgin Media Finance PLC, Senior Notes | | | 6.000 | % | | | 10/15/24 | | | | 500,000 | | | | 516,875 | (a) |
Total Media | | | | | | | | | | | | | | | 7,751,531 | |
Multiline Retail — 0.0% | | | | | | | | | | | | | | | | |
Dollar Tree Inc., Senior Notes | | | 5.750 | % | | | 3/1/23 | | | | 240,000 | | | | 255,317 | |
Specialty Retail — 0.0% | | | | | | | | | | | | | | | | |
L Brands Inc., Senior Notes | | | 5.625 | % | | | 10/15/23 | | | | 120,000 | | | | 129,900 | |
PetSmart Inc., Senior Notes | | | 7.125 | % | | | 3/15/23 | | | | 20,000 | | | | 20,450 | (a) |
Total Specialty Retail | | | | | | | | | | | | | | | 150,350 | |
Total Consumer Discretionary | | | | | | | | | | | | | | | 16,121,400 | |
| Consumer Staples — 2.6% | | | | | | | | | | | | | | | | |
Beverages — 0.9% | | | | | | | | | | | | | | | | |
Anheuser-Busch InBev Finance Inc., Senior Notes | | | 2.650 | % | | | 2/1/21 | | | | 390,000 | | | | 392,610 | |
Anheuser-Busch InBev Finance Inc., Senior Notes | | | 3.300 | % | | | 2/1/23 | | | | 490,000 | | | | 499,355 | |
Anheuser-Busch InBev Finance Inc., Senior Notes | | | 3.650 | % | | | 2/1/26 | | | | 1,390,000 | | | | 1,413,763 | |
Anheuser-Busch InBev Finance Inc., Senior Notes | | | 4.900 | % | | | 2/1/46 | | | | 1,320,000 | | | | 1,432,406 | |
Anheuser-Busch InBev Worldwide Inc., Senior Notes | | | 2.500 | % | | | 7/15/22 | | | | 800,000 | | | | 788,373 | |
Carolina Beverage Group LLC/Carolina Beverage Group Finance Inc., Secured Notes | | | 10.625 | % | | | 8/1/18 | | | | 200,000 | | | | 187,000 | (a) |
Constellation Brands Inc., Senior Notes | | | 4.750 | % | | | 11/15/24 | | | | 500,000 | | | | 533,250 | |
Pernod-Ricard SA, Senior Notes | | | 5.500 | % | | | 1/15/42 | | | | 150,000 | | | | 165,727 | (a) |
Total Beverages | | | | | | | | | | | | | | | 5,412,484 | |
Food & Staples Retailing — 0.4% | | | | | | | | | | | | | | | | |
CVS Health Corp., Senior Notes | | | 2.750 | % | | | 12/1/22 | | | | 200,000 | | | | 197,292 | |
See Notes to Financial Statements.
| | |
| Western Asset Core Plus VIT Portfolio 2016 Annual Report | | 15 |
Schedule of investments (cont’d)
December 31, 2016
Western Asset Core Plus VIT Portfolio
| | | | | | | | | | | | | | | | |
| Security | | Rate | | | Maturity
Date | | | Face
Amount† | | | Value | |
Food & Staples Retailing — continued | | | | | | | | | | | | | | | | |
CVS Health Corp., Senior Notes | | | 3.875 | % | | | 7/20/25 | | | | 700,000 | | | $ | 723,397 | |
CVS Health Corp., Senior Notes | | | 5.125 | % | | | 7/20/45 | | | | 1,250,000 | | | | 1,398,476 | |
Walgreens Boots Alliance Inc., Senior Notes | | | 3.450 | % | | | 6/1/26 | | | | 360,000 | | | | 354,080 | |
Total Food & Staples Retailing | | | | | | | | | | | | | | | 2,673,245 | |
Food Products — 0.6% | | | | | | | | | | | | | | | | |
Danone SA, Senior Bonds | | | 2.589 | % | | | 11/2/23 | | | | 1,130,000 | �� | | | 1,090,512 | (a) |
Danone SA, Senior Notes | | | 2.077 | % | | | 11/2/21 | | | | 530,000 | | | | 515,268 | (a) |
Danone SA, Senior Notes | | | 2.947 | % | | | 11/2/26 | | | | 1,010,000 | | | | 965,857 | (a) |
Kraft Heinz Foods Co., Secured Notes | | | 4.875 | % | | | 2/15/25 | | | | 30,000 | | | | 32,387 | (a) |
Kraft Heinz Foods Co., Senior Notes | | | 3.950 | % | | | 7/15/25 | | | | 210,000 | | | | 213,111 | |
Kraft Heinz Foods Co., Senior Notes | | | 5.000 | % | | | 7/15/35 | | | | 600,000 | | | | 631,346 | |
Kraft Heinz Foods Co., Senior Notes | | | 5.200 | % | | | 7/15/45 | | | | 330,000 | | | | 346,745 | |
Lamb Weston Holdings Inc., Senior Notes | | | 4.875 | % | | | 11/1/26 | | | | 230,000 | | | | 228,131 | (a) |
Total Food Products | | | | | | | | | | | | | | | 4,023,357 | |
Household Products — 0.1% | | | | | | | | | | | | | | | | |
Spectrum Brands Inc., Senior Notes | | | 5.750 | % | | | 7/15/25 | | | | 270,000 | | | | 281,475 | |
Tobacco — 0.6% | | | | | | | | | | | | | | | | |
Altria Group Inc., Senior Notes | | | 9.250 | % | | | 8/6/19 | | | | 430,000 | | | | 507,687 | |
Altria Group Inc., Senior Notes | | | 2.850 | % | | | 8/9/22 | | | | 570,000 | | | | 571,432 | |
Altria Group Inc., Senior Notes | | | 5.375 | % | | | 1/31/44 | | | | 320,000 | | | | 371,039 | |
Philip Morris International Inc., Senior Notes | | | 2.900 | % | | | 11/15/21 | | | | 90,000 | | | | 91,269 | |
Philip Morris International Inc., Senior Notes | | | 2.500 | % | | | 8/22/22 | | | | 760,000 | | | | 744,215 | |
Philip Morris International Inc., Senior Notes | | | 4.500 | % | | | 3/20/42 | | | | 60,000 | | | | 61,364 | |
Reynolds American Inc., Senior Notes | | | 3.250 | % | | | 6/12/20 | | | | 22,000 | | | | 22,561 | |
Reynolds American Inc., Senior Notes | | | 5.850 | % | | | 8/15/45 | | | | 1,250,000 | | | | 1,485,676 | |
Total Tobacco | | | | | | | | | | | | | | | 3,855,243 | |
Total Consumer Staples | | | | | | | | | | | | | | | 16,245,804 | |
| Energy — 3.7% | | | | | | | | | | | | | | | | |
Energy Equipment & Services — 0.2% | | | | | | | | | | | | | | | | |
Ensco PLC, Senior Notes | | | 4.700 | % | | | 3/15/21 | | | | 120,000 | | | | 116,031 | |
Halliburton Co., Senior Bonds | | | 3.800 | % | | | 11/15/25 | | | | 470,000 | | | | 478,345 | |
Halliburton Co., Senior Notes | | | 4.850 | % | | | 11/15/35 | | | | 50,000 | | | | 52,893 | |
Halliburton Co., Senior Notes | | | 5.000 | % | | | 11/15/45 | | | | 20,000 | | | | 21,653 | |
Pride International Inc., Senior Notes | | | 8.500 | % | | | 6/15/19 | | | | 130,000 | | | | 145,600 | |
Pride International Inc., Senior Notes | | | 6.875 | % | | | 8/15/20 | | | | 50,000 | | | | 53,625 | |
Total Energy Equipment & Services | | | | | | | | | | | | | | | 868,147 | |
Oil, Gas & Consumable Fuels — 3.5% | | | | | | | | | | | | | | | | |
Anadarko Petroleum Corp., Senior Notes | | | 4.850 | % | | | 3/15/21 | | | | 150,000 | | | | 160,986 | |
See Notes to Financial Statements.
| | |
| 16 | | Western Asset Core Plus VIT Portfolio 2016 Annual Report |
Western Asset Core Plus VIT Portfolio
| | | | | | | | | | | | | | | | |
| Security | | Rate | | | Maturity
Date | | | Face
Amount† | | | Value | |
Oil, Gas & Consumable Fuels — continued | | | | | | | | | | | | | | | | |
Anadarko Petroleum Corp., Senior Notes | | | 6.450 | % | | | 9/15/36 | | | | 440,000 | | | $ | 525,228 | |
Anadarko Petroleum Corp., Senior Notes | | | 6.200 | % | | | 3/15/40 | | | | 300,000 | | | | 344,704 | |
Anadarko Petroleum Corp., Senior Notes | | | 6.600 | % | | | 3/15/46 | | | | 70,000 | | | | 86,645 | |
Apache Corp., Senior Notes | | | 5.100 | % | | | 9/1/40 | | | | 480,000 | | | | 503,916 | |
Apache Corp., Senior Notes | | | 4.250 | % | | | 1/15/44 | | | | 360,000 | | | | 356,310 | |
BP Capital Markets PLC, Senior Bonds | | | 3.506 | % | | | 3/17/25 | | | | 950,000 | | | | 960,102 | |
BP Capital Markets PLC, Senior Notes | | | 3.216 | % | | | 11/28/23 | | | | 600,000 | | | | 606,541 | |
Chesapeake Energy Corp., Senior Notes | | | 5.375 | % | | | 6/15/21 | | | | 320,000 | | | | 301,600 | |
Chesapeake Energy Corp., Senior Notes | | | 5.750 | % | | | 3/15/23 | | | | 70,000 | | | | 66,150 | |
Chevron Corp., Senior Notes | | | 2.954 | % | | | 5/16/26 | | | | 850,000 | | | | 837,140 | |
CNOOC Finance 2015 USA LLC, Senior Notes | | | 3.500 | % | | | 5/5/25 | | | | 1,290,000 | | | | 1,256,065 | |
Concho Resources Inc., Senior Notes | | | 5.500 | % | | | 4/1/23 | | | | 200,000 | | | | 208,260 | |
Devon Energy Corp., Senior Notes | | | 3.250 | % | | | 5/15/22 | | | | 160,000 | | | | 159,179 | |
Devon Energy Corp., Senior Notes | | | 5.850 | % | | | 12/15/25 | | | | 440,000 | | | | 500,767 | |
Devon Energy Corp., Senior Notes | | | 5.600 | % | | | 7/15/41 | | | | 30,000 | | | | 31,003 | |
Devon Energy Corp., Senior Notes | | | 5.000 | % | | | 6/15/45 | | | | 690,000 | | | | 680,355 | |
Devon Financing Co., LLC, Debentures | | | 7.875 | % | | | 9/30/31 | | | | 100,000 | | | | 127,183 | |
Ecopetrol SA, Senior Notes | | | 5.875 | % | | | 5/28/45 | | | | 1,050,000 | | | | 912,450 | |
EOG Resources Inc., Senior Notes | | | 4.150 | % | | | 1/15/26 | | | | 170,000 | | | | 178,231 | |
Exxon Mobil Corp., Senior Notes | | | 3.043 | % | | | 3/1/26 | | | | 430,000 | | | | 429,929 | |
Exxon Mobil Corp., Senior Notes | | | 4.114 | % | | | 3/1/46 | | | | 120,000 | | | | 123,225 | |
Kerr-McGee Corp., Notes | | | 6.950 | % | | | 7/1/24 | | | | 650,000 | | | | 768,013 | |
Kerr-McGee Corp., Notes | | | 7.875 | % | | | 9/15/31 | | | | 90,000 | | | | 115,519 | |
Kinder Morgan Energy Partners LP, Senior Notes | | | 3.500 | % | | | 9/1/23 | | | | 350,000 | | | | 346,222 | |
Kinder Morgan Energy Partners LP, Senior Notes | | | 4.250 | % | | | 9/1/24 | | | | 40,000 | | | | 40,914 | |
Kinder Morgan Inc., Medium-Term Notes | | | 7.750 | % | | | 1/15/32 | | | | 150,000 | | | | 184,254 | |
Kinder Morgan Inc., Senior Notes | | | 5.300 | % | �� | | 12/1/34 | | | | 250,000 | | | | 254,431 | |
Noble Energy Inc., Senior Notes | | | 8.250 | % | | | 3/1/19 | | | | 120,000 | | | | 134,864 | |
Noble Energy Inc., Senior Notes | | | 4.150 | % | | | 12/15/21 | | | | 600,000 | | | | 625,076 | |
Oasis Petroleum Inc., Senior Notes | | | 6.500 | % | | | 11/1/21 | | | | 100,000 | | | | 102,375 | |
Oasis Petroleum Inc., Senior Notes | | | 6.875 | % | | | 3/15/22 | | | | 60,000 | | | | 61,800 | |
Oasis Petroleum Inc., Senior Notes | | | 6.875 | % | | | 1/15/23 | | | | 10,000 | | | | 10,300 | |
Occidental Petroleum Corp., Senior Notes | | | 3.400 | % | | | 4/15/26 | | | | 310,000 | | | | 312,701 | |
Occidental Petroleum Corp., Senior Notes | | | 3.000 | % | | | 2/15/27 | | | | 260,000 | | | | 251,895 | |
Occidental Petroleum Corp., Senior Notes | | | 4.625 | % | | | 6/15/45 | | | | 300,000 | | | | 312,896 | |
Occidental Petroleum Corp., Senior Notes | | | 4.400 | % | | | 4/15/46 | | | | 100,000 | | | | 102,014 | |
Occidental Petroleum Corp., Senior Notes | | | 4.100 | % | | | 2/15/47 | | | | 330,000 | | | | 322,256 | |
Petrobras Global Finance BV, Senior Notes | | | 5.375 | % | | | 1/27/21 | | | | 1,790,000 | | | | 1,755,095 | |
See Notes to Financial Statements.
| | |
| Western Asset Core Plus VIT Portfolio 2016 Annual Report | | 17 |
Schedule of investments (cont’d)
December 31, 2016
Western Asset Core Plus VIT Portfolio
| | | | | | | | | | | | | | | | |
| Security | | Rate | | | Maturity
Date | | | Face
Amount† | | | Value | |
Oil, Gas & Consumable Fuels — continued | | | | | | | | | | | | | | | | |
Petrobras Global Finance BV, Senior Notes | | | 4.375 | % | | | 5/20/23 | | | | 300,000 | | | $ | 262,860 | |
Petrobras Global Finance BV, Senior Notes | | | 6.850 | % | | | 6/5/2115 | | | | 90,000 | | | | 73,350 | |
Petroleos Mexicanos, Senior Bonds | | | 6.625 | % | | | 6/15/35 | | | | 800,000 | | | | 792,000 | |
Petroleos Mexicanos, Senior Notes | | | 6.875 | % | | | 8/4/26 | | | | 250,000 | | | | 264,375 | (a) |
Petroleos Mexicanos, Senior Notes | | | 6.375 | % | | | 1/23/45 | | | | 500,000 | | | | 457,500 | |
Range Resources Corp., Senior Notes | | | 5.000 | % | | | 3/15/23 | | | | 490,000 | | | | 486,325 | (a) |
Rockies Express Pipeline LLC, Senior Notes | | | 6.875 | % | | | 4/15/40 | | | | 200,000 | | | | 200,000 | (a) |
Sabine Pass Liquefaction LLC, Senior Secured Notes | | | 5.750 | % | | | 5/15/24 | | | | 290,000 | | | | 312,475 | |
Schlumberger Holdings Corp., Senior Notes | | | 3.000 | % | | | 12/21/20 | | | | 290,000 | | | | 296,296 | (a) |
Schlumberger Holdings Corp., Senior Notes | | | 4.000 | % | | | 12/21/25 | | | | 240,000 | | | | 251,795 | (a) |
Shell International Finance BV, Senior Notes | | | 2.875 | % | | | 5/10/26 | | | | 850,000 | | | | 822,773 | |
Shell International Finance BV, Senior Notes | | | 4.125 | % | | | 5/11/35 | | | | 40,000 | | | | 40,921 | |
Shell International Finance BV, Senior Notes | | | 4.375 | % | | | 5/11/45 | | | | 780,000 | | | | 792,051 | |
Shell International Finance BV, Senior Notes | | | 4.000 | % | | | 5/10/46 | | | | 340,000 | | | | 325,953 | |
Sinopec Group Overseas Development Ltd., Senior Notes | | | 2.750 | % | | | 5/17/17 | | | | 200,000 | | | | 200,703 | (a) |
Sinopec Group Overseas Development Ltd., Senior Notes | | | 4.375 | % | | | 4/10/24 | | | | 550,000 | | | | 572,554 | (a) |
SM Energy Co., Senior Notes | | | 5.000 | % | | | 1/15/24 | | | | 10,000 | | | | 9,475 | |
Transcontinental Gas Pipe Line Co., LLC, Senior Notes | | | 7.850 | % | | | 2/1/26 | | | | 520,000 | | | | 656,796 | (a) |
Williams Cos. Inc., Senior Notes | | | 7.875 | % | | | 9/1/21 | | | | 410,000 | | | | 470,475 | |
WPX Energy Inc., Senior Notes | | | 6.000 | % | | | 1/15/22 | | | | 80,000 | | | | 82,400 | |
Total Oil, Gas & Consumable Fuels | | | | | | | | | | | | | | | 22,427,671 | |
Total Energy | | | | | | | | | | | | | | | 23,295,818 | |
| Financials — 8.3% | | | | | | | | | | | | | | | | |
Banks — 6.1% | | | | | | | | | | | | | | | | |
Bank of America Corp., Junior Subordinated Notes | | | 5.200 | % | | | 6/1/23 | | | | 160,000 | | | | 153,600 | (d)(e) |
Bank of America Corp., Senior Notes | | | 2.600 | % | | | 1/15/19 | | | | 90,000 | | | | 90,814 | |
Bank of America Corp., Senior Notes | | | 5.625 | % | | | 7/1/20 | | | | 1,300,000 | | | | 1,430,559 | |
Bank of America Corp., Senior Notes | | | 3.300 | % | | | 1/11/23 | | | | 240,000 | | | | 241,128 | |
Bank of America Corp., Senior Notes | | | 3.875 | % | | | 8/1/25 | | | | 1,880,000 | | | | 1,915,113 | |
Bank of America Corp., Senior Notes | | | 3.500 | % | | | 4/19/26 | | | | 410,000 | | | | 405,331 | |
Bank of America Corp., Senior Notes | | | 4.875 | % | | | 4/1/44 | | | | 1,950,000 | | | | 2,124,115 | |
Bank of America Corp., Subordinated Bonds | | | 4.450 | % | | | 3/3/26 | | | | 110,000 | | | | 113,572 | |
Bank of America Corp., Subordinated Notes | | | 4.000 | % | | | 1/22/25 | | | | 350,000 | | | | 351,038 | |
Bank of America Corp., Subordinated Notes | | | 4.250 | % | | | 10/22/26 | | | | 1,200,000 | | | | 1,216,949 | |
Barclays Bank PLC, Subordinated Notes | | | 7.625 | % | | | 11/21/22 | | | | 1,010,000 | | | | 1,110,369 | |
Barclays PLC, Junior Subordinated Bonds | | | 8.250 | % | | | 12/15/18 | | | | 200,000 | | | | 208,825 | (d)(e) |
CIT Group Inc., Senior Notes | | | 5.000 | % | | | 8/15/22 | | | | 250,000 | | | | 261,250 | |
CIT Group Inc., Senior Notes | | | 5.000 | % | | | 8/1/23 | | | | 180,000 | | | | 186,300 | |
See Notes to Financial Statements.
| | |
| 18 | | Western Asset Core Plus VIT Portfolio 2016 Annual Report |
Western Asset Core Plus VIT Portfolio
| | | | | | | | | | | | | | | | |
| Security | | Rate | | | Maturity
Date | | | Face
Amount† | | | Value | |
Banks — continued | | | | | | | | | | | | | | | | |
Citigroup Inc., Junior Subordinated Bonds | | | 6.300 | % | | | 5/15/24 | | | | 150,000 | | | $ | 148,913 | (d)(e) |
Citigroup Inc., Junior Subordinated Bonds | | | 5.950 | % | | | 5/15/25 | | | | 270,000 | | | | 267,016 | (d)(e) |
Citigroup Inc., Senior Notes | | | 8.125 | % | | | 7/15/39 | | | | 37,000 | | | | 55,151 | |
Citigroup Inc., Senior Notes | | | 4.650 | % | | | 7/30/45 | | | | 895,000 | | | | 947,175 | |
Citigroup Inc., Subordinated Bonds | | | 4.400 | % | | | 6/10/25 | | | | 110,000 | | | | 112,733 | |
Citigroup Inc., Subordinated Notes | | | 3.500 | % | | | 5/15/23 | | | | 120,000 | | | | 119,782 | |
Citigroup Inc., Subordinated Notes | | | 4.300 | % | | | 11/20/26 | | | | 230,000 | | | | 232,564 | |
Citigroup Inc., Subordinated Notes | | | 4.450 | % | | | 9/29/27 | | | | 2,400,000 | | | | 2,443,210 | |
Citigroup Inc., Subordinated Notes | | | 5.300 | % | | | 5/6/44 | | | | 93,000 | | | | 100,550 | |
Citigroup Inc., Subordinated Notes | | | 4.750 | % | | | 5/18/46 | | | | 70,000 | | | | 70,358 | |
Cooperatieve Rabobank U.A., Junior Subordinated Notes | | | 11.000 | % | | | 6/30/19 | | | | 655,000 | | | | 772,278 | (a)(d)(e) |
Cooperatieve Rabobank U.A., Subordinated Notes | | | 4.625 | % | | | 12/1/23 | | | | 1,050,000 | | | | 1,106,327 | |
Cooperatieve Rabobank U.A., Subordinated Notes | | | 5.250 | % | | | 8/4/45 | | | | 560,000 | | | | 610,760 | |
Credit Agricole SA, Junior Subordinated Notes | | | 8.375 | % | | | 10/13/19 | | | | 810,000 | | | | 892,636 | (a)(d)(e) |
HSBC Holdings PLC, Junior Subordinated Bonds | | | 6.375 | % | | | 9/17/24 | | | | 1,030,000 | | | | 1,015,837 | (d)(e) |
HSBC Holdings PLC, Senior Notes | | | 3.400 | % | | | 3/8/21 | | | | 750,000 | | | | 763,102 | |
HSBC Holdings PLC, Senior Notes | | | 4.300 | % | | | 3/8/26 | | | | 270,000 | | | | 280,272 | |
HSBC Holdings PLC, Senior Notes | | | 3.900 | % | | | 5/25/26 | | | | 1,550,000 | | | | 1,562,414 | |
ING Bank NV, Subordinated Notes | | | 5.800 | % | | | 9/25/23 | | | | 500,000 | | | | 550,165 | (a) |
Intesa Sanpaolo SpA, Subordinated Bonds | | | 5.017 | % | | | 6/26/24 | | | | 1,070,000 | | | | 990,381 | (a) |
JPMorgan Chase & Co., Senior Notes | | | 4.250 | % | | | 10/15/20 | | | | 1,300,000 | | | | 1,376,428 | |
JPMorgan Chase & Co., Subordinated Notes | | | 3.875 | % | | | 9/10/24 | | | | 170,000 | | | | 172,297 | |
JPMorgan Chase & Co., Subordinated Notes | | | 4.125 | % | | | 12/15/26 | | | | 730,000 | | | | 746,594 | |
JPMorgan Chase & Co., Subordinated Notes | | | 4.250 | % | | | 10/1/27 | | | | 140,000 | | | | 144,149 | |
JPMorgan Chase & Co., Subordinated Notes | | | 4.950 | % | | | 6/1/45 | | | | 650,000 | | | | 694,725 | |
Lloyds Banking Group PLC, Subordinated Notes | | | 4.500 | % | | | 11/4/24 | | | | 560,000 | | | | 570,819 | |
Nordea Bank AB, Subordinated Notes | | | 4.875 | % | | | 5/13/21 | | | | 530,000 | | | | 569,992 | (a) |
Royal Bank of Scotland Group PLC, Subordinated Notes | | | 6.000 | % | | | 12/19/23 | | | | 340,000 | | | | 353,660 | |
Royal Bank of Scotland Group PLC, Subordinated Notes | | | 5.125 | % | | | 5/28/24 | | | | 2,500,000 | | | | 2,496,502 | |
Royal Bank of Scotland NV, Subordinated Bonds | | | 7.750 | % | | | 5/15/23 | | | | 100,000 | | | | 111,877 | |
Standard Chartered PLC, Subordinated Notes | | | 5.700 | % | | | 3/26/44 | | | | 900,000 | | | | 901,965 | (a) |
Wachovia Capital Trust III, Junior Subordinated Bonds | | | 5.570 | % | | | 1/30/17 | | | | 1,240,000 | | | | 1,218,362 | (d)(e) |
Wells Fargo & Co., Senior Notes | | | 3.000 | % | | | 10/23/26 | | | | 750,000 | | | | 715,195 | |
Wells Fargo & Co., Subordinated Notes | | | 4.100 | % | | | 6/3/26 | | | | 200,000 | | | | 202,874 | |
Wells Fargo & Co., Subordinated Notes | | | 4.300 | % | | | 7/22/27 | | | | 2,260,000 | | | | 2,327,529 | |
Wells Fargo & Co., Subordinated Notes | | | 4.650 | % | | | 11/4/44 | | | | 1,170,000 | | | | 1,154,219 | |
Wells Fargo & Co., Subordinated Notes | | | 4.900 | % | | | 11/17/45 | | | | 1,510,000 | | | | 1,554,577 | |
Wells Fargo & Co., Subordinated Notes | | | 4.400 | % | | | 6/14/46 | | | | 110,000 | | | | 105,531 | |
See Notes to Financial Statements.
| | |
| Western Asset Core Plus VIT Portfolio 2016 Annual Report | | 19 |
Schedule of investments (cont’d)
December 31, 2016
Western Asset Core Plus VIT Portfolio
| | | | | | | | | | | | | | | | |
| Security | | Rate | | | Maturity
Date | | | Face
Amount† | | | Value | |
Banks — continued | | | | | | | | | | | | | | | | |
Wells Fargo & Co., Subordinated Notes | | | 4.750 | % | | | 12/7/46 | | | | 420,000 | | | $ | 427,264 | |
Total Banks | | | | | | | | | | | | | | | 38,695,146 | |
Capital Markets — 1.2% | | | | | | | | | | | | | | | | |
Credit Suisse Group Funding Guernsey Ltd., Senior Notes | | | 4.550 | % | | | 4/17/26 | | | | 250,000 | | | | 260,135 | |
Credit Suisse Group Funding Guernsey Ltd., Senior Notes | | | 4.875 | % | | | 5/15/45 | | | | 880,000 | | | | 906,798 | |
Goldman Sachs Group Inc., Senior Bonds | | | 4.750 | % | | | 10/21/45 | | | | 450,000 | | | | 476,925 | |
Goldman Sachs Group Inc., Senior Notes | | | 2.600 | % | | | 4/23/20 | | | | 800,000 | | | | 801,453 | |
Goldman Sachs Group Inc., Senior Notes | | | 5.250 | % | | | 7/27/21 | | | | 300,000 | | | | 329,132 | |
Goldman Sachs Group Inc., Senior Notes | | | 3.850 | % | | | 7/8/24 | | | | 400,000 | | | | 408,960 | |
Goldman Sachs Group Inc., Senior Notes | | | 3.500 | % | | | 1/23/25 | | | | 650,000 | | | | 642,470 | |
Goldman Sachs Group Inc., Senior Notes | | | 3.500 | % | | | 11/16/26 | | | | 400,000 | | | | 391,601 | |
Goldman Sachs Group Inc., Senior Notes | | | 6.250 | % | | | 2/1/41 | | | | 100,000 | | | | 124,379 | |
Goldman Sachs Group Inc., Subordinated Notes | | | 4.250 | % | | | 10/21/25 | | | | 540,000 | | | | 549,556 | |
Goldman Sachs Group Inc., Subordinated Notes | | | 6.450 | % | | | 5/1/36 | | | | 40,000 | | | | 47,811 | |
Goldman Sachs Group Inc., Subordinated Notes | | | 6.750 | % | | | 10/1/37 | | | | 940,000 | | | | 1,164,274 | |
Goldman Sachs Group Inc., Subordinated Notes | | | 5.150 | % | | | 5/22/45 | | | | 1,320,000 | | | | 1,393,474 | |
KKR Group Finance Co. II LLC, Senior Notes | | | 5.500 | % | | | 2/1/43 | | | | 10,000 | | | | 10,058 | (a) |
Total Capital Markets | | | | | | | | | | | | | | | 7,507,026 | |
Consumer Finance — 0.1% | | | | | | | | | | | | | | | | |
Navient Corp., Medium-Term Notes, Senior Notes | | | 8.000 | % | | | 3/25/20 | | | | 340,000 | | | | 378,046 | |
Diversified Financial Services — 0.5% | | | | | | | | | | | | | | | | |
GE Capital International Funding Co., Unlimited Co., Senior Notes | | | 2.342 | % | | | 11/15/20 | | | | 202,000 | | | | 202,015 | |
International Lease Finance Corp., Senior Notes | | | 6.250 | % | | | 5/15/19 | | | | 120,000 | | | | 129,300 | |
International Lease Finance Corp., Senior Notes | | | 8.250 | % | | | 12/15/20 | | | | 500,000 | | | | 583,750 | |
International Lease Finance Corp., Senior Notes | | | 8.625 | % | | | 1/15/22 | | | | 350,000 | | | | 421,312 | |
International Lease Finance Corp., Senior Notes | | | 5.875 | % | | | 8/15/22 | | | | 70,000 | | | | 76,125 | |
Magnolia Finance X Ltd. | | | 3.065 | % | | | 12/3/20 | | | | 1,213,049 | GBP | | | 1,476,274 | (a)(c) |
Magnolia Finance X Ltd. | | | 4.332 | % | | | 12/3/20 | | | | 364,901 | GBP | | | 444,082 | (a)(c) |
Total Diversified Financial Services | | | | | | | | | | | | | | | 3,332,858 | |
Insurance — 0.4% | | | | | | | | | | | | | | | | |
American International Group Inc., Senior Notes | | | 3.750 | % | | | 7/10/25 | | | | 660,000 | | | | 665,432 | |
Chubb INA Holdings Inc., Senior Notes | | | 2.300 | % | | | 11/3/20 | | | | 110,000 | | | | 110,035 | |
Chubb INA Holdings Inc., Senior Notes | | | 3.350 | % | | | 5/3/26 | | | | 150,000 | | | | 152,114 | |
Chubb INA Holdings Inc., Senior Notes | | | 4.350 | % | | | 11/3/45 | | | | 350,000 | | | | 370,626 | |
Teachers Insurance & Annuity Association of America, Notes | | | 6.850 | % | | | 12/16/39 | | | | 90,000 | | | | 117,022 | (a) |
Teachers Insurance & Annuity Association of America, Subordinated Notes | | | 4.900 | % | | | 9/15/44 | | | | 780,000 | | | | 845,745 | (a) |
Total Insurance | | | | | | | | | | | | | | | 2,260,974 | |
See Notes to Financial Statements.
| | |
| 20 | | Western Asset Core Plus VIT Portfolio 2016 Annual Report |
Western Asset Core Plus VIT Portfolio
| | | | | | | | | | | | | | | | |
| Security | | Rate | | | Maturity
Date | | | Face
Amount† | | | Value | |
Thrifts & Mortgage Finance — 0.0% | | | | | | | | | | | | | | | | |
Quicken Loans Inc., Senior Notes | | | 5.750 | % | | | 5/1/25 | | | | 160,000 | | | $ | 156,400 | (a) |
Total Financials | | | | | | | | | | | | | | | 52,330,450 | |
| Health Care — 1.5% | | | | | | | | | | | | | | | | |
Biotechnology — 0.4% | | | | | | | | | | | | | | | | |
AbbVie Inc., Senior Subordinated Notes | | | 3.600 | % | | | 5/14/25 | | | | 330,000 | | | | 327,446 | |
Amgen Inc., Senior Bonds | | | 4.663 | % | | | 6/15/51 | | | | 69,000 | | | | 66,594 | (a) |
Celgene Corp., Senior Notes | | | 5.000 | % | | | 8/15/45 | | | | 530,000 | | | | 553,167 | |
Gilead Sciences Inc., Senior Notes | | | 3.500 | % | | | 2/1/25 | | | | 150,000 | | | | 151,814 | |
Gilead Sciences Inc., Senior Notes | | | 3.650 | % | | | 3/1/26 | | | | 720,000 | | | | 730,863 | |
Gilead Sciences Inc., Senior Notes | | | 4.750 | % | | | 3/1/46 | | | | 380,000 | | | | 394,109 | |
Total Biotechnology | | | | | | | | | | | | | | | 2,223,993 | |
Health Care Equipment & Supplies — 0.3% | | | | | | | | | | | | | | | | |
Abbott Laboratories, Senior Notes | | | 3.750 | % | | | 11/30/26 | | | | 480,000 | | | | 477,663 | |
Abbott Laboratories, Senior Notes | | | 4.750 | % | | | 11/30/36 | | | | 320,000 | | | | 326,350 | |
Abbott Laboratories, Senior Notes | | | 4.900 | % | | | 11/30/46 | | | | 430,000 | | | | 443,059 | |
Becton, Dickinson & Co., Senior Notes | | | 3.734 | % | | | 12/15/24 | | | | 111,000 | | | | 113,700 | |
Becton, Dickinson & Co., Senior Notes | | | 4.685 | % | | | 12/15/44 | | | | 20,000 | | | | 20,800 | |
Medtronic Inc., Senior Notes | | | 3.500 | % | | | 3/15/25 | | | | 780,000 | | | | 804,033 | |
Total Health Care Equipment & Supplies | | | | | | | | | | | | | | | 2,185,605 | |
Health Care Providers & Services — 0.5% | | | | | | | | | | | | | | | | |
Aetna Inc., Senior Notes | | | 2.400 | % | | | 6/15/21 | | | | 260,000 | | | | 259,094 | |
Aetna Inc., Senior Notes | | | 2.800 | % | | | 6/15/23 | | | | 70,000 | | | | 69,052 | |
Aetna Inc., Senior Notes | | | 3.200 | % | | | 6/15/26 | | | | 340,000 | | | | 337,032 | |
Aetna Inc., Senior Notes | | | 4.375 | % | | | 6/15/46 | | | | 70,000 | | | | 70,579 | |
Centene Corp., Senior Notes | | | 4.750 | % | | | 5/15/22 | | | | 150,000 | | | | 152,250 | |
DaVita Inc., Senior Notes | | | 5.000 | % | | | 5/1/25 | | | | 390,000 | | | | 384,637 | |
Fresenius Medical Care U.S. Finance II Inc., Senior Notes | | | 4.750 | % | | | 10/15/24 | | | | 510,000 | | | | 517,650 | (a) |
HCA Inc., Senior Bonds | | | 5.375 | % | | | 2/1/25 | | | | 190,000 | | | | 190,713 | |
HCA Inc., Senior Secured Notes | | | 5.250 | % | | | 6/15/26 | | | | 420,000 | | | | 435,225 | |
MPH Acquisition Holdings LLC, Senior Notes | | | 7.125 | % | | | 6/1/24 | | | | 300,000 | | | | 316,530 | (a) |
Tenet Healthcare Corp., Senior Notes | | | 8.125 | % | | | 4/1/22 | | | | 80,000 | | | | 75,880 | |
UnitedHealth Group Inc., Senior Notes | | | 3.750 | % | | | 7/15/25 | | | | 310,000 | | | | 321,273 | |
Total Health Care Providers & Services | | | | | | | | | | | | | | | 3,129,915 | |
Pharmaceuticals — 0.3% | | | | | | | | | | | | | | | | |
Actavis Funding SCS, Senior Notes | | | 3.800 | % | | | 3/15/25 | | | | 940,000 | | | | 942,753 | |
Valeant Pharmaceuticals International Inc., Senior Notes | | | 5.375 | % | | | 3/15/20 | | | | 230,000 | | | | 195,500 | (a) |
Valeant Pharmaceuticals International Inc., Senior Notes | | | 7.000 | % | | | 10/1/20 | | | | 90,000 | | | | 78,019 | (a) |
Valeant Pharmaceuticals International Inc., Senior Notes | | | 6.375 | % | | | 10/15/20 | | | | 40,000 | | | | 34,563 | (a) |
See Notes to Financial Statements.
| | |
| Western Asset Core Plus VIT Portfolio 2016 Annual Report | | 21 |
Schedule of investments (cont’d)
December 31, 2016
Western Asset Core Plus VIT Portfolio
| | | | | | | | | | | | | | | | |
| Security | | Rate | | | Maturity
Date | | | Face
Amount† | | | Value | |
Pharmaceuticals — continued | | | | | | | | | | | | | | | | |
Valeant Pharmaceuticals International Inc., Senior Notes | | | 5.875 | % | | | 5/15/23 | | | | 260,000 | | | $ | 197,600 | (a) |
Wyeth LLC, Notes | | | 5.950 | % | | | 4/1/37 | | | | 150,000 | | | | 189,127 | |
Total Pharmaceuticals | | | | | | | | | | | | | | | 1,637,562 | |
Total Health Care | | | | | | | | | | | | | | | 9,177,075 | |
| Industrials — 1.4% | | | | | | | | | | | | | | | | |
Aerospace & Defense — 0.2% | | | | | | | | | | | | | | | | |
Boeing Co., Senior Notes | | | 4.875 | % | | | 2/15/20 | | | | 630,000 | | | | 685,225 | |
Lockheed Martin Corp., Senior Notes | | | 3.100 | % | | | 1/15/23 | | | | 30,000 | | | | 30,369 | |
Lockheed Martin Corp., Senior Notes | | | 3.550 | % | | | 1/15/26 | | | | 460,000 | | | | 470,871 | |
Lockheed Martin Corp., Senior Notes | | | 4.500 | % | | | 5/15/36 | | | | 70,000 | | | | 74,662 | |
United Technologies Corp., Senior Notes | | | 4.500 | % | | | 6/1/42 | | | | 150,000 | | | | 160,933 | |
Total Aerospace & Defense | | | | | | | | | | | | | | | 1,422,060 | |
Airlines — 0.2% | | | | | | | | | | | | | | | | |
American Airlines, Pass-Through Trust, Secured Notes | | | 7.000 | % | | | 1/31/18 | | | | 155,585 | | | | 160,447 | (a) |
Delta Air Lines Inc., Pass-Through Certificates, Senior Secured Bonds | | | 6.821 | % | | | 8/10/22 | | | | 158,221 | | | | 182,151 | |
Delta Air Lines Inc., Pass-Through Trust, Secured Notes | | | 6.875 | % | | | 5/7/19 | | | | 132,534 | | | | 142,806 | (a) |
United Airlines Inc., Pass-Through Certificates, Secured Bonds | | | 5.375 | % | | | 8/15/21 | | | | 163,492 | | | | 169,827 | |
United Airlines Inc., Pass-Through Certificates, Secured Notes | | | 4.750 | % | | | 4/11/22 | | | | 301,300 | | | | 301,677 | |
United Airlines Inc., Pass-Through Certificates, Secured Notes | | | 4.625 | % | | | 9/3/22 | | | | 162,761 | | | | 166,626 | |
Total Airlines | | | | | | | | | | | | | | | 1,123,534 | |
Commercial Services & Supplies — 0.1% | | | | | | | | | | | | | | | | |
United Rentals North America Inc., Senior Notes | | | 5.750 | % | | | 11/15/24 | | | | 290,000 | | | | 305,950 | |
Waste Management Inc., Senior Notes | | | 3.500 | % | | | 5/15/24 | | | | 50,000 | | | | 51,633 | |
West Corp., Senior Notes | | | 5.375 | % | | | 7/15/22 | | | | 430,000 | | | | 417,100 | (a) |
West Corp., Senior Secured Notes | | | 4.750 | % | | | 7/15/21 | | | | 10,000 | | | | 10,250 | (a) |
Total Commercial Services & Supplies | | | | | | | | | | | | | | | 784,933 | |
Construction & Engineering — 0.1% | | | | | | | | | | | | | | | | |
Michael Baker Holdings LLC/Michael Baker Finance Corp., Senior Notes | | | 8.875 | % | | | 4/15/19 | | | | 261,397 | | | | 239,178 | (a)(b) |
Michael Baker International LLC/CDL Acquisition Co. Inc., Senior Secured Notes | | | 8.250 | % | | | 10/15/18 | | | | 60,000 | | | | 59,400 | (a) |
Total Construction & Engineering | | | | | | | | | | | | | | | 298,578 | |
Electrical Equipment — 0.2% | | | | | | | | | | | | | | | | |
Eaton Corp., Senior Notes | | | 2.750 | % | | | 11/2/22 | | | | 920,000 | | | | 912,417 | |
Eaton Corp., Senior Notes | | | 4.150 | % | | | 11/2/42 | | | | 240,000 | | | | 235,513 | |
Total Electrical Equipment | | | | | | | | | | | | | | | 1,147,930 | |
See Notes to Financial Statements.
| | |
| 22 | | Western Asset Core Plus VIT Portfolio 2016 Annual Report |
Western Asset Core Plus VIT Portfolio
| | | | | | | | | | | | | | | | |
| Security | | Rate | | | Maturity
Date | | | Face
Amount† | | | Value | |
Industrial Conglomerates — 0.6% | | | | | | | | | | | | | | | | |
General Electric Co., Senior Notes | | | 4.650 | % | | | 10/17/21 | | | | 72,000 | | | $ | 79,030 | |
General Electric Co., Senior Notes | | | 5.875 | % | | | 1/14/38 | | | | 80,000 | | | | 100,880 | |
General Electric Co., Senior Notes | | | 6.875 | % | | | 1/10/39 | | | | 2,121,000 | | | | 2,996,339 | |
General Electric Co., Senior Notes | | | 4.500 | % | | | 3/11/44 | | | | 560,000 | | | | 602,594 | |
General Electric Co., Subordinated Notes | | | 5.300 | % | | | 2/11/21 | | | | 50,000 | | | | 55,484 | |
Total Industrial Conglomerates | | | | | | | | | | | | | | | 3,834,327 | |
Road & Rail — 0.0% | | | | | | | | | | | | | | | | |
Florida East Coast Holdings Corp., Senior Secured Notes | | | 6.750 | % | | | 5/1/19 | | | | 200,000 | | | | 207,500 | (a) |
Total Industrials | | | | | | | | | | | | | | | 8,818,862 | |
| Information Technology — 1.0% | | | | | | | | | | | | | | | | |
Communications Equipment — 0.0% | | | | | | | | | | | | | | | | |
Harris Corp., Senior Notes | | | 5.054 | % | | | 4/27/45 | | | | 200,000 | | | | 211,969 | |
IT Services — 0.3% | | | | | | | | | | | | | | | | |
First Data Corp., Senior Secured Notes | | | 5.375 | % | | | 8/15/23 | | | | 470,000 | | | | 488,800 | (a) |
Visa Inc., Senior Notes | | | 3.150 | % | | | 12/14/25 | | | | 760,000 | | | | 764,199 | |
Visa Inc., Senior Notes | | | 4.300 | % | | | 12/14/45 | | | | 540,000 | | | | 571,405 | |
Total IT Services | | | | | | | | | | | | | | | 1,824,404 | |
Semiconductors & Semiconductor Equipment — 0.0% | | | | | | | | | | | | | | | | |
Intel Corp., Senior Notes | | | 3.700 | % | | | 7/29/25 | | | | 230,000 | | | | 242,854 | |
Software — 0.2% | | | | | | | | | | | | | | | | |
Activision Blizzard Inc., Senior Notes | | | 6.125 | % | | | 9/15/23 | | | | 40,000 | | | | 43,782 | (a) |
Microsoft Corp., Senior Bonds | | | 2.400 | % | | | 8/8/26 | | | | 1,340,000 | | | | 1,267,502 | |
Microsoft Corp., Senior Notes | | | 3.450 | % | | | 8/8/36 | | | | 30,000 | | | | 28,571 | |
Total Software | | | | | | | | | | | | | | | 1,339,855 | |
Technology Hardware, Storage & Peripherals — 0.5% | | | | | | | | | | | | | | | | |
Apple Inc., Senior Notes | | | 2.450 | % | | | 8/4/26 | | | | 750,000 | | | | 704,801 | |
Diamond 1 Finance Corp./Diamond 2 Finance Corp., Senior Notes | | | 7.125 | % | | | 6/15/24 | | | | 350,000 | | | | 388,781 | (a) |
Diamond 1 Finance Corp./Diamond 2 Finance Corp., Senior Secured Notes | | | 3.480 | % | | | 6/1/19 | | | | 980,000 | | | | 1,000,965 | (a) |
Diamond 1 Finance Corp./Diamond 2 Finance Corp., Senior Secured Notes | | | 4.420 | % | | | 6/15/21 | | | | 870,000 | | | | 901,118 | (a) |
Total Technology Hardware, Storage & Peripherals | | | | | | | | | | | | | | | 2,995,665 | |
Total Information Technology | | | | | | | | | | | | | | | 6,614,747 | |
| Materials — 1.5% | | | | | | | | | | | | | | | | |
Chemicals — 0.2% | | | | | | | | | | | | | | | | |
Eco Services Operations LLC/Eco Finance Corp., Senior Notes | | | 8.500 | % | | | 11/1/22 | | | | 130,000 | | | | 138,775 | (a) |
Equate Petrochemical BV, Senior Notes | | | 4.250 | % | | | 11/3/26 | | | | 440,000 | | | | 421,318 | (a) |
See Notes to Financial Statements.
| | |
| Western Asset Core Plus VIT Portfolio 2016 Annual Report | | 23 |
Schedule of investments (cont’d)
December 31, 2016
Western Asset Core Plus VIT Portfolio
| | | | | | | | | | | | | | | | |
| Security | | Rate | | | Maturity
Date | | | Face
Amount† | | | Value | |
Chemicals — continued | | | | | | | | | | | | | | | | |
OCP SA, Senior Notes | | | 4.500 | % | | | 10/22/25 | | | | 250,000 | | | $ | 239,703 | (a) |
Westlake Chemical Corp., Senior Notes | | | 4.625 | % | | | 2/15/21 | | | | 190,000 | | | | 197,125 | (a) |
Westlake Chemical Corp., Senior Notes | | | 4.875 | % | | | 5/15/23 | | | | 80,000 | | | | 83,200 | (a) |
Total Chemicals | | | | | | | | | | | | | | | 1,080,121 | |
Construction Materials — 0.0% | | | | | | | | | | | | | | | | |
American Builders & Contractors Supply Co. Inc., Senior Notes | | | 5.750 | % | | | 12/15/23 | | | | 220,000 | | | | 227,150 | (a) |
Containers & Packaging — 0.1% | | | | | | | | | | | | | | | | |
Ardagh Packaging Finance PLC/Ardagh MP Holdings USA Inc., Senior Secured Notes | | | 3.963 | % | | | 12/15/19 | | | | 260,000 | | | | 264,550 | (a)(d) |
Pactiv LLC, Senior Bonds | | | 8.375 | % | | | 4/15/27 | | | | 250,000 | | | | 274,375 | |
Reynolds Group Issuer Inc./Reynolds Group Issuer LLC/Reynolds Group Issuer (Luxembourg) SA, Senior Secured Notes | | | 5.125 | % | | | 7/15/23 | | | | 70,000 | | | | 71,575 | (a) |
Total Containers & Packaging | | | | | | | | | | | | | | | 610,500 | |
Metals & Mining — 1.1% | | | | | | | | | | | | | | | | |
Alcoa Nederland Holding BV, Senior Notes | | | 7.000 | % | | | 9/30/26 | | | | 200,000 | | | | 219,500 | (a) |
Barrick Gold Corp., Senior Notes | | | 4.100 | % | | | 5/1/23 | | | | 251,000 | | | | 257,843 | |
Barrick North America Finance LLC, Senior Notes | | | 4.400 | % | | | 5/30/21 | | | | 15,000 | | | | 15,779 | |
Barrick North America Finance LLC, Senior Notes | | | 5.700 | % | | | 5/30/41 | | | | 710,000 | | | | 727,034 | |
BHP Billiton Finance USA Ltd., Senior Notes | | | 5.000 | % | | | 9/30/43 | | | | 660,000 | | | | 738,893 | |
BHP Billiton Finance USA Ltd., Subordinated Notes | | | 6.750 | % | | | 10/19/75 | | | | 1,250,000 | | | | 1,406,250 | (a)(d) |
Freeport-McMoRan Inc., Senior Notes | | | 4.000 | % | | | 11/14/21 | | | | 310,000 | | | | 303,800 | |
Freeport-McMoRan Inc., Senior Notes | | | 5.450 | % | | | 3/15/43 | | | | 140,000 | | | | 116,553 | |
Glencore Finance Canada Ltd., Senior Notes | | | 2.700 | % | | | 10/25/17 | | | | 280,000 | | | | 282,198 | (a) |
Glencore Funding LLC, Senior Notes | | | 4.625 | % | | | 4/29/24 | | | | 800,000 | | | | 821,000 | (a) |
Midwest Vanadium Pty Ltd., Senior Secured Notes | | | 11.500 | % | | | 2/15/18 | | | | 304,929 | | | | 6,098 | *(a)(f) |
Mirabela Nickel Ltd., Subordinated Notes | | | 1.000 | % | | | 9/10/44 | | | | 2,970 | | | | 0 | (a)(c)(g) |
Southern Copper Corp., Senior Notes | | | 5.250 | % | | | 11/8/42 | | | | 1,290,000 | | | | 1,188,285 | |
Steel Dynamics Inc., Senior Notes | | | 6.375 | % | | | 8/15/22 | | | | 140,000 | | | | 146,650 | |
Teck Resources Ltd., Senior Notes | | | 8.000 | % | | | 6/1/21 | | | | 250,000 | | | | 275,625 | (a) |
Vale Overseas Ltd., Senior Notes | | | 4.375 | % | | | 1/11/22 | | | | 70,000 | | | | 68,950 | |
Vale Overseas Ltd., Senior Notes | | | 6.875 | % | | | 11/21/36 | | | | 810,000 | | | | 801,900 | |
Total Metals & Mining | | | | | | | | | | | | | | | 7,376,358 | |
Paper & Forest Products — 0.1% | | | | | | | | | | | | | | | | |
Celulosa Arauco y Constitucion SA, Senior Notes | | | 4.750 | % | | | 1/11/22 | | | | 250,000 | | | | 260,665 | |
Georgia-Pacific LLC, Senior Notes | | | 8.875 | % | | | 5/15/31 | | | | 110,000 | | | | 163,362 | |
Total Paper & Forest Products | | | | | | | | | | | | | | | 424,027 | |
Total Materials | | | | | | | | | | | | | | | 9,718,156 | |
See Notes to Financial Statements.
| | |
| 24 | | Western Asset Core Plus VIT Portfolio 2016 Annual Report |
Western Asset Core Plus VIT Portfolio
| | | | | | | | | | | | | | | | |
| Security | | Rate | | | Maturity
Date | | | Face
Amount† | | | Value | |
| Real Estate — 0.2% | | | | | | | | | | | | | | | | |
Equity Real Estate Investment Trusts (REITs) — 0.2% | | | | | | | | | | | | | | | | |
CB Richard Ellis Services Inc., Senior Notes | | | 5.250 | % | | | 3/15/25 | | | | 440,000 | | | $ | 454,445 | |
WEA Finance LLC/Westfield UK & Europe Finance PLC, Senior Notes | | | 3.750 | % | | | 9/17/24 | | | | 880,000 | | | | 891,230 | (a) |
Total Real Estate | | | | | | | | | | | | | | | 1,345,675 | |
| Telecommunication Services — 1.1% | | | | | | | | | | | | | | | | |
Diversified Telecommunication Services — 0.8% | | | | | | | | | | | | | | | | |
AT&T Inc., Senior Notes | | | 3.400 | % | | | 5/15/25 | | | | 1,840,000 | | | | 1,776,623 | |
AT&T Inc., Senior Notes | | | 4.350 | % | | | 6/15/45 | | | | 1,130,000 | | | | 1,010,768 | |
Bharti Airtel Ltd., Senior Notes | | | 4.375 | % | | | 6/10/25 | | | | 730,000 | | | | 721,177 | (a) |
Verizon Communications Inc., Senior Notes | | | 5.150 | % | | | 9/15/23 | | | | 430,000 | | | | 476,148 | |
Verizon Communications Inc., Senior Notes | | | 6.550 | % | | | 9/15/43 | | | | 1,140,000 | | | | 1,428,828 | |
Verizon Communications Inc., Senior Notes | | | 4.862 | % | | | 8/21/46 | | | | 20,000 | | | | 20,346 | |
Total Diversified Telecommunication Services | | | | | | | | | | | | | | | 5,433,890 | |
Wireless Telecommunication Services — 0.3% | | | | | | | | | | | | | | | | |
Altice Financing SA, Senior Secured Notes | | | 6.625 | % | | | 2/15/23 | | | | 300,000 | | | | 309,000 | (a) |
America Movil SAB de CV, Senior Notes | | | 5.625 | % | | | 11/15/17 | | | | 80,000 | | | | 82,672 | |
America Movil SAB de CV, Senior Notes | | | 5.000 | % | | | 3/30/20 | | | | 320,000 | | | | 342,707 | |
Sprint Communications Inc., Senior Notes | | | 7.000 | % | | | 3/1/20 | | | | 480,000 | | | | 522,000 | (a) |
Sprint Corp., Senior Notes | | | 7.625 | % | | | 2/15/25 | | | | 440,000 | | | | 463,650 | |
Total Wireless Telecommunication Services | | | | | | | | | | | | | | | 1,720,029 | |
Total Telecommunication Services | | | | | | | | | | | | | | | 7,153,919 | |
| Utilities — 0.8% | | | | | | | | | | | | | | | | |
Electric Utilities — 0.8% | | | | | | | | | | | | | | | | |
Berkshire Hathaway Energy Co., Bonds | | | 6.125 | % | | | 4/1/36 | | | | 500,000 | | | | 626,341 | |
Duke Energy Carolinas LLC, Secured Bonds | | | 5.300 | % | | | 2/15/40 | | | | 500,000 | | | | 594,340 | |
FirstEnergy Corp., Notes | | | 7.375 | % | | | 11/15/31 | | | | 1,050,000 | | | | 1,356,648 | |
FirstEnergy Corp., Senior Notes | | | 4.250 | % | | | 3/15/23 | | | | 1,000,000 | | | | 1,035,148 | |
Pacific Gas & Electric Co., First Mortgage Bonds | | | 6.050 | % | | | 3/1/34 | | | | 950,000 | | | | 1,192,287 | |
Total Electric Utilities | | | | | | | | | | | | | | | 4,804,764 | |
Gas Utilities — 0.0% | | | | | | | | | | | | | | | | |
Southern Natural Gas Co., LLC, Senior Notes | | | 8.000 | % | | | 3/1/32 | | | | 130,000 | | | | 163,151 | |
Independent Power and Renewable Electricity Producers — 0.0% | | | | | | | | | | | | | |
AES Corp., Senior Notes | | | 5.500 | % | | | 3/15/24 | | | | 20,000 | | | | 20,450 | |
AES Corp., Senior Notes | | | 5.500 | % | | | 4/15/25 | | | | 210,000 | | | | 211,050 | |
Total Independent Power and Renewable Electricity Producers | | | | | | | | | | | | 231,500 | |
Total Utilities | | | | | | | | | | | | | | | 5,199,415 | |
Total Corporate Bonds & Notes (Cost — $155,700,162) | | | | | | | | | | | | | | | 156,021,321 | |
See Notes to Financial Statements.
| | |
| Western Asset Core Plus VIT Portfolio 2016 Annual Report | | 25 |
Schedule of investments (cont’d)
December 31, 2016
Western Asset Core Plus VIT Portfolio
| | | | | | | | | | | | | | | | |
| Security | | Rate | | | Maturity
Date | | | Face
Amount†/
Units | | | Value | |
| Asset-Backed Securities — 3.5% | | | | | | | | | | | | | | | | |
Bear Stearns Asset-Backed Securities Trust, 2003-3 A2 | | | 1.936 | % | | | 6/25/43 | | | | 1,575,154 | | | $ | 1,553,747 | (d) |
Community Funding CLO Ltd., 2015-1A A | | | 5.750 | % | | | 11/1/27 | | | | 250,000 | | | | 234,050 | (a)(c) |
Conseco Financial Corp., 1997-7 M1 | | | 7.030 | % | | | 7/15/28 | | | | 287,036 | | | | 280,704 | |
Countrywide Asset-Backed Certificates, 2005-8 M4 | | | 1.376 | % | | | 12/25/35 | | | | 1,660,000 | | | | 1,630,261 | (d) |
GMAC Mortgage Corp. Loan Trust, 2004-VF1 A1 | | | 1.342 | % | | | 2/25/31 | | | | 144,717 | | | | 144,761 | (a)(d) |
Keycorp Student Loan Trust, 2004-A 1A2 | | | 1.126 | % | | | 10/27/42 | | | | 1,629,066 | | | | 1,508,507 | (d) |
Nelnet Student Loan Trust, 2008-3 A4 | | | 2.575 | % | | | 11/25/24 | | | | 223,634 | | | | 225,406 | (d) |
New Century Home Equity Loan Trust, 2004-3 M1 | | | 1.686 | % | | | 11/25/34 | | | | 1,788,914 | | | | 1,637,071 | (d) |
OneMain Financial Issuance Trust, 2016-2A A | | | 4.100 | % | | | 3/20/28 | | | | 2,150,000 | | | | 2,194,604 | (a) |
Park Place Securities Inc., 2005-WHQ1 M6 | | | 1.926 | % | | | 3/25/35 | | | | 3,150,000 | | | | 2,274,285 | (d) |
Purchasing Power Funding LLC, 2015-A A2 | | | 4.750 | % | | | 12/15/19 | | | | 1,470,000 | | | | 1,471,837 | (a) |
SLM Student Loan Trust, 2006-1 A5 | | | 0.992 | % | | | 7/26/21 | | | | 1,160,000 | | | | 1,106,887 | (d) |
SLM Student Loan Trust, 2006-A A5 | | | 1.253 | % | | | 6/15/39 | | | | 1,270,000 | | | | 1,158,593 | (d) |
SLM Student Loan Trust, 2008-4 A4 | | | 2.532 | % | | | 7/25/22 | | | | 388,378 | | | | 390,944 | (d) |
SLM Student Loan Trust, 2008-5 A4 | | | 2.582 | % | | | 7/25/23 | | | | 192,090 | | | | 193,325 | (d) |
SLM Student Loan Trust, 2008-8 A4 | | | 2.382 | % | | | 4/25/23 | | | | 1,150,000 | | | | 1,151,546 | (d) |
Small Business Administration Participation Certificates, 2016-20A 1 | | | 2.780 | % | | | 1/1/36 | | | | 676,368 | | | | 676,165 | |
SMB Private Education Loan Trust, 2015-C R | | | 0.000 | % | | | 9/18/46 | | | | 1,092 | | | | 1,419,600 | (a)(c) |
Sofi Consumer Loan Program, 2016-3 A | | | 3.050 | % | | | 12/26/25 | | | | 2,898,148 | | | | 2,892,074 | (a) |
Total Asset-Backed Securities (Cost — $22,069,124) | | | | | | | | | | | | | | | 22,144,367 | |
| | | | |
| | | | | | | | | Face
Amount† | | | | |
| Collateralized Mortgage Obligations — 9.8% | | | | | | | | | | | | | | | | |
Banc of America Funding Corp., 2015-R4 6A1 | | | 0.732 | % | | | 8/27/36 | | | | 414,430 | | | | 402,157 | (a)(d) |
Banc of America Funding Corp., 2015-R4 6A2 | | | 0.732 | % | | | 8/27/36 | | | | 780,000 | | | | 676,771 | (a)(d) |
Bank of America Merrill Lynch Large Loan Inc., 2016-GG10 AJA | | | 5.793 | % | | | 7/10/17 | | | | 2,082,038 | | | | 1,366,693 | (a)(d) |
BBCCRE Trust, 2015-GTP D | | | 4.715 | % | | | 8/10/33 | | | | 2,280,000 | | | | 2,113,047 | (a)(d) |
BBCCRE Trust, 2015-GTP E | | | 4.715 | % | | | 8/10/33 | | | | 2,520,000 | | | | 2,162,946 | (a)(d) |
BCAP LLC Trust, 2013-RR5 2A2 | | | 2.497 | % | | | 3/26/37 | | | | 2,730,955 | | | | 1,856,526 | (a)(d) |
BCAP LLC Trust, 2015-RR6 1A2 | | | 3.500 | % | | | 5/26/37 | | | | 360,000 | | | | 317,706 | (a)(d) |
CD Commercial Mortgage Trust, 2016-CD1 A4 | | | 2.724 | % | | | 8/10/49 | | | | 3,210,000 | | | | 3,095,046 | |
CFCRE Commercial Mortgage Trust, 2011-C2 B | | | 5.933 | % | | | 12/15/47 | | | | 120,000 | | | | 134,901 | (a)(d) |
CGBAM Commercial Mortgage Trust, 2016-IMC E | | | 8.104 | % | | | 11/15/21 | | | | 730,000 | | | | 739,184 | (a)(d) |
Chevy Chase Mortgage Funding Corp., 2004-2A B1 | | | 1.015 | % | | | 5/25/35 | | | | 306,245 | | | | 223,001 | (a)(d) |
Chevy Chase Mortgage Funding Corp., 2004-3A A1 | | | 1.006 | % | | | 8/25/35 | | | | 1,239,792 | | | | 1,115,715 | (a)(d) |
Chevy Chase Mortgage Funding Corp., 2004-3A A2 | | | 1.056 | % | | | 8/25/35 | | | | 1,352,793 | | | | 1,225,466 | (a)(d) |
Citigroup Commercial Mortgage Trust, 2015-GC29 D | | | 3.110 | % | | | 4/10/48 | | | | 1,570,000 | | | | 1,096,636 | (a) |
Citigroup Commercial Mortgage Trust, 2015-GC33 D | | | 3.172 | % | | | 9/10/58 | | | | 130,000 | | | | 92,012 | |
See Notes to Financial Statements.
| | |
| 26 | | Western Asset Core Plus VIT Portfolio 2016 Annual Report |
Western Asset Core Plus VIT Portfolio
| | | | | | | | | | | | | | | | |
| Security | | Rate | | | Maturity
Date | | | Face
Amount† | | | Value | |
| Collateralized Mortgage Obligations — continued | | | | | | | | | | | | | |
COMM Mortgage Trust, 2013-LC13 E | | | 3.719 | % | | | 8/10/46 | | | | 680,000 | | | $ | 455,455 | (a)(d) |
Commercial Mortgage Trust, 2013-CR6 B | | | 3.397 | % | | | 3/10/46 | | | | 974,000 | | | | 975,335 | (a) |
Credit Suisse Mortgage Trust, 2015-10R 3A11 | | | 1.363 | % | | | 10/27/46 | | | | 4,588,320 | | | | 2,171,724 | (a)(d) |
Credit Suisse Mortgage Trust, 2015-10R 3A2 | | | 1.363 | % | | | 10/27/46 | | | | 3,580,000 | | | | 2,968,197 | (a)(d) |
Credit Suisse Mortgage Trust, 2015-12R 2A2 | | | 1.034 | % | | | 11/30/37 | | | | 1,890,000 | | | | 1,160,572 | (a)(d) |
Credit Suisse Mortgage Trust, 2016-BDWN A | | | 3.439 | % | | | 2/15/29 | | | | 470,000 | | | | 474,461 | (a)(d) |
CSAIL Commercial Mortgage Trust, 2015-C2 AS | | | 3.849 | % | | | 6/15/57 | | | | 420,000 | | | | 427,842 | (d) |
CSAIL Commercial Mortgage Trust, 2015-C2 C | | | 4.211 | % | | | 6/15/57 | | | | 436,000 | | | | 414,369 | (d) |
Federal Home Loan Mortgage Corp. (FHLMC), 3281 AI, IO | | | 5.726 | % | | | 2/15/37 | | | | 4,265,114 | | | | 808,559 | (d) |
Federal Home Loan Mortgage Corp. (FHLMC) Multifamily Structured Pass Through Certificates, K058 X1, IO | | | 0.931 | % | | | 9/25/49 | | | | 9,281,477 | | | | 660,368 | (d) |
Federal Home Loan Mortgage Corp. (FHLMC) STRIPS, 328 S4, IO | | | 2.077 | % | | | 2/15/38 | | | | 482,671 | | | | 35,623 | (d) |
Federal Home Loan Mortgage Corp. (FHLMC), Multi-Family Structured Pass-Through Certificates, K720 X1, IO | | | 0.660 | % | | | 8/25/22 | | | | 17,443,846 | | | | 436,857 | (d) |
Federal Home Loan Mortgage Corp. (FHLMC), Multi-Family Structured Pass-Through Certificates, K721 X1, IO | | | 0.342 | % | | | 8/25/22 | | | | 21,337,294 | | | | 350,824 | (d) |
Federal Home Loan Mortgage Corp. (FHLMC), Multi-Family Structured Pass-Through Certificates, KJ08 A2 | | | 2.356 | % | | | 8/25/22 | | | | 640,000 | | | | 636,652 | |
Federal National Mortgage Association (FNMA),
2006-115 EI, IO | | | 5.884 | % | | | 12/25/36 | | | | 4,029,993 | | | | 788,064 | (d) |
Federal National Mortgage Association (FNMA),
2015-55 IO, IO | | | 1.810 | % | | | 8/25/55 | | | | 1,050,335 | | | | 68,947 | (d) |
Federal National Mortgage Association (FNMA),
2016-60 QS, IO | | | 5.344 | % | | | 9/25/46 | | | | 1,311,709 | | | | 238,375 | (d) |
First Horizon Mortgage Pass-Through Trust, 2005-AR1 B1 | | | 2.911 | % | | | 4/25/35 | | | | 332,424 | | | | 253,535 | (d) |
FREMF Mortgage Trust, 2016-K57 C | | | 4.053 | % | | | 8/25/49 | | | | 560,000 | | | | 445,807 | (a)(d) |
GE Business Loan Trust, 2007-1A A | | | 0.874 | % | | | 4/16/35 | | | | 260,057 | | | | 245,329 | (a)(d) |
GE Capital Commercial Mortgage Corp., 2007-C1 AJ | | | 5.677 | % | | | 12/10/49 | | | | 3,940,000 | | | | 2,527,802 | (d) |
Government National Mortgage Association (GNMA),
2012-034 SA, IO | | | 5.311 | % | | | 3/20/42 | | | | 1,131,843 | | | | 216,905 | (d) |
Government National Mortgage Association (GNMA),
2012-043 SN, IO | | | 5.893 | % | | | 4/16/42 | | | | 636,211 | | | | 148,833 | (d) |
Government National Mortgage Association (GNMA),
2014-186 IO, IO | | | 0.790 | % | | | 8/16/54 | | | | 2,875,943 | | | | 161,395 | (d) |
Government National Mortgage Association (GNMA),
2015-167 OI, IO | | | 4.000 | % | | | 4/16/45 | | | | 429,209 | | | | 88,804 | |
Government National Mortgage Association (GNMA),
2016-135 SB, IO | | | 5.393 | % | | | 10/16/46 | | | | 481,570 | | | | 111,706 | (d) |
Government National Mortgage Association (GNMA),
2016-84 IG, PAC, IO | | | 4.500 | % | | | 11/16/45 | | | | 3,279,828 | | | | 690,834 | |
GS Mortgage Securities Trust, 2012-GC6 AS | | | 4.948 | % | | | 1/10/45 | | | | 380,000 | | | | 415,161 | (a) |
GS Mortgage Securities Trust, 2015-GC30 AS | | | 3.777 | % | | | 5/10/50 | | | | 400,000 | | | | 407,857 | (d) |
See Notes to Financial Statements.
| | |
| Western Asset Core Plus VIT Portfolio 2016 Annual Report | | 27 |
Schedule of investments (cont’d)
December 31, 2016
Western Asset Core Plus VIT Portfolio
| | | | | | | | | | | | | | | | |
| Security | | Rate | | | Maturity
Date | | | Face
Amount† | | | Value | |
| Collateralized Mortgage Obligations — continued | | | | | | | | | | | | | |
GS Mortgage Securities Trust, 2015-GC30 D | | | 3.384 | % | | | 5/10/50 | | | | 300,000 | | | $ | 207,514 | |
GS Mortgage Securities Trust, 2015-GC34 AAB | | | 3.278 | % | | | 10/10/48 | | | | 1,000,000 | | | | 1,022,698 | |
GS Mortgage Securities Trust, 2015-GC34 D | | | 2.979 | % | | | 10/10/48 | | | | 2,890,000 | | | | 2,091,243 | |
GS Mortgage Securities Trust, 2016-GS3 A4 | | | 2.850 | % | | | 10/10/49 | | | | 440,000 | | | | 426,014 | |
GS Mortgage Securities Trust, 2016-ICE2 E | | | 9.038 | % | | | 2/15/33 | | | | 490,000 | | | | 500,747 | (a)(d) |
Homestar Mortgage Acceptance Corp., 2004-5 M2 | | | 1.262 | % | | | 10/25/34 | | | | 728,414 | | | | 689,475 | (d) |
Indymac IMSC Mortgage Loan Trust, 2007-HOA1 A22 | | | 0.936 | % | | | 7/25/47 | | | | 486,908 | | | | 311,733 | (d) |
JPMBB Commercial Mortgage Securities Trust, 2015-C31 B | | | 4.618 | % | | | 8/15/48 | | | | 60,000 | | | | 59,458 | (d) |
JPMorgan Chase Commercial Mortgage Securities Trust,
2006-LDP9 AJ | | | 5.411 | % | | | 5/15/47 | | | | 3,520,000 | | | | 2,517,134 | |
JPMorgan Chase Commercial Mortgage Securities Trust,
2007-LDPX AJFX | | | 5.438 | % | | | 1/15/49 | | | | 1,210,000 | | | | 478,426 | (a) |
JPMorgan Chase Commercial Mortgage Securities Trust, 2015-FL7 D | | | 4.454 | % | | | 5/15/28 | | | | 200,000 | | | | 184,799 | (a)(d) |
JPMorgan Chase Commercial Mortgage Securities Trust, 2016-JP3 A5 | | | 2.870 | % | | | 8/15/49 | | | | 620,000 | | | | 600,015 | |
LSTAR Commercial Mortgage Trust, 2015-3 A2 | | | 2.729 | % | | | 4/20/48 | | | | 223,481 | | | | 223,616 | (a)(d) |
Morgan Stanley Bank of America Merrill Lynch Trust,
2016-C32 A4 | | | 3.720 | % | | | 12/15/49 | | | | 620,000 | | | | 633,295 | |
Morgan Stanley Capital I Trust, 2007-IQ13 AJ | | | 5.438 | % | | | 3/15/44 | | | | 250,000 | | | | 224,033 | |
Morgan Stanley Capital I Trust, 2007-IQ16 AJ | | | 6.095 | % | | | 12/12/49 | | | | 260,000 | | | | 239,388 | (d) |
Morgan Stanley Capital I Trust, 2016-BNK2 XA, IO | | | 1.131 | % | | | 11/15/49 | | | | 7,443,321 | | | | 561,747 | (d) |
Morgan Stanley Capital I Trust, 2016-UB12 A4 | | | 3.596 | % | | | 12/15/49 | | | | 610,000 | | | | 619,891 | |
Morgan Stanley Re-remic Trust, 2015-R3 7A1 | | | 1.245 | % | | | 4/26/47 | | | | 605,637 | | | | 590,708 | (a)(d) |
Morgan Stanley Re-remic Trust, 2015-R3 7A2 | | | 1.245 | % | | | 4/26/47 | | | | 730,000 | | | | 642,371 | (a)(d) |
Morgan Stanley Re-remic Trust, 2015-R3 9A1 | | | 0.852 | % | | | 4/26/47 | | | | 423,909 | | | | 414,866 | (a)(d) |
Morgan Stanley Re-remic Trust, 2015-R3 9A2 | | | 0.852 | % | | | 4/26/47 | | | | 520,000 | | | | 418,208 | (a)(d) |
Morgan Stanley Re-remic Trust, 2015-R6 2A1 | | | 0.822 | % | | | 7/26/45 | | | | 209,348 | | | | 200,678 | (a)(d) |
Mortgage Repurchase Agreement Financing Trust, 2016-4 A1 | | | 1.737 | % | | | 5/10/19 | | | | 1,610,000 | | | | 1,610,518 | (a)(d) |
Motel 6 Trust, 2015-MTL6 D | | | 4.532 | % | | | 2/5/30 | | | | 170,000 | | | | 170,960 | (a) |
MSCG Trust, 2015-ALDR A2 | | | 3.462 | % | | | 6/7/35 | | | | 210,000 | | | | 208,458 | (a)(d) |
New Residential Mortgage Loan Trust, 2016-4A A1 | | | 3.750 | % | | | 11/25/56 | | | | 1,485,167 | | | | 1,539,868 | (a)(d) |
Nomura Resecuritization Trust, 2015-5R 4A1 | | | 2.514 | % | | | 7/26/37 | | | | 491,176 | | | | 478,453 | (a)(d) |
Nomura Resecuritization Trust, 2015-6R 3A1 | | | 0.724 | % | | | 5/26/46 | | | | 151,410 | | | | 146,900 | (a)(d) |
Structured Agency Credit Risk Debt Notes, 2016-DNA1 M2 | | | 3.656 | % | | | 7/25/28 | | | | 1,260,000 | | | | 1,297,666 | (d) |
Structured Agency Credit Risk Debt Notes, 2016-HQA3 M2 | | | 1.942 | % | | | 3/25/29 | | | | 2,610,000 | | | | 2,613,490 | (d) |
Towd Point Mortgage Funding Trust, 2016-V1A A1 | | | 1.538 | % | | | 2/20/54 | | | | 920,000 | GBP | | | 1,125,724 | (a)(d) |
Towd Point Mortgage Trust, 2015-5 A1B | | | 2.750 | % | | | 5/25/55 | | | | 2,429,542 | | | | 2,441,508 | (a)(d) |
Waterfall Commercial Mortgage Trust, 2015-SBC5 A | | | 4.104 | % | | | 9/14/22 | | | | 242,558 | | | | 237,479 | (a)(d) |
Wells Fargo Commercial Mortgage Trust, 2015-C28 AS | | | 3.872 | % | | | 5/15/48 | | | | 320,000 | | | | 327,186 | (d) |
See Notes to Financial Statements.
| | |
| 28 | | Western Asset Core Plus VIT Portfolio 2016 Annual Report |
Western Asset Core Plus VIT Portfolio
| | | | | | | | | | | | | | | | |
| Security | | Rate | | | Maturity
Date | | | Face
Amount† | | | Value | |
| Collateralized Mortgage Obligations — continued | | | | | | | | | | | | | |
Wells Fargo Commercial Mortgage Trust, 2016-C37 C | | | 4.495 | % | | | 12/15/49 | | | | 640,000 | | | $ | 622,769 | (d) |
Total Collateralized Mortgage Obligations (Cost — $62,012,509) | | | | | | | | 62,083,035 | |
| Convertible Bonds & Notes — 0.0% | | | | | | | | | | | | | | | | |
| Materials — 0.0% | | | | | | | | | | | | | | | | |
Metals & Mining — 0.0% | | | | | | | | | | | | | | | | |
Mirabela Nickel Ltd., Senior Secured Bonds
(Cost — $313,033) | | | 9.500 | % | | | 6/24/19 | | | | 313,033 | | | | 28,173 | (a)(b) |
| Mortgage-Backed Securities — 21.1% | | | | | | | | | | | | | | | | |
FHLMC — 5.6% | | | | | | | | | | | | | | | | |
Federal Home Loan Mortgage Corp. (FHLMC), Gold | | | 3.500 | % | | | 3/1/43-3/1/45 | | | | 1,324,645 | | | | 1,365,023 | |
Federal Home Loan Mortgage Corp. (FHLMC), Gold | | | 3.500 | % | | | 1/18/47 | | | | 5,200,000 | | | | 5,324,909 | (h) |
Federal Home Loan Mortgage Corp. (FHLMC), Gold | | | 5.000 | % | | | 6/1/41 | | | | 606,050 | | | | 669,110 | |
Federal Home Loan Mortgage Corp. (FHLMC), Gold | | | 4.500 | % | | | 6/1/38 | | | | 2,410,515 | | | | 2,597,531 | |
Federal Home Loan Mortgage Corp. (FHLMC), Gold | | | 4.000 | % | | | 6/1/43 | | | | 8,594,331 | | | | 9,113,453 | |
Federal Home Loan Mortgage Corp. (FHLMC), Gold | | | 3.000 | % | | | 1/18/47 | | | | 16,700,000 | | | | 16,583,977 | (h) |
Total FHLMC | | | | | | | | | | | | | | | 35,654,003 | |
FNMA — 11.2% | | | | | | | | | | | | | | | | |
Federal National Mortgage Association (FNMA) | | | 4.000 | % | | | 10/1/40-7/1/45 | | | | 3,060,721 | | | | 3,248,517 | |
Federal National Mortgage Association (FNMA) | | | 3.500 | % | | | 1/1/44-1/1/46 | | | | 1,119,563 | | | | 1,150,620 | |
Federal National Mortgage Association (FNMA) | | | 2.500 | % | | | 1/23/32 | | | | 7,900,000 | | | | 7,913,115 | (h) |
Federal National Mortgage Association (FNMA) | | | 3.000 | % | | | 1/23/32-1/18/47 | | | | 14,500,000 | | | | 14,422,012 | (h) |
Federal National Mortgage Association (FNMA) | | | 3.500 | % | | | 1/23/32-1/18/47 | | | | 11,700,000 | | | | 12,031,357 | (h) |
Federal National Mortgage Association (FNMA) | | | 4.000 | % | | | 1/18/47 | | | | 12,900,000 | | | | 13,562,889 | (h) |
Federal National Mortgage Association (FNMA) | | | 4.500 | % | | | 1/18/47 | | | | 6,400,000 | | | | 6,884,750 | (h) |
Federal National Mortgage Association (FNMA) | | | 5.000 | % | | | 1/18/47 | | | | 2,400,000 | | | | 2,614,875 | (h) |
Federal National Mortgage Association (FNMA) | | | 3.000 | % | | | 9/1/46-11/1/46 | | | | 9,552,132 | | | | 9,507,749 | |
Total FNMA | | | | | | | | | | | | | | | 71,335,884 | |
GNMA — 4.3% | | | | | | | | | | | | | | | | |
Government National Mortgage Association (GNMA) | | | 4.500 | % | | | 1/24/47 | | | | 200,000 | | | | 216,305 | (h) |
Government National Mortgage Association (GNMA) II | | | 3.000 | % | | | 8/20/46 | | | | 781,513 | | | | 792,674 | |
Government National Mortgage Association (GNMA) II | | | 4.000 | % | | | 9/20/45-11/20/45 | | | | 5,362,477 | | | | 5,746,404 | |
Government National Mortgage Association (GNMA) II | | | 3.000 | % | | | 1/24/47 | | | | 11,600,000 | | | | 11,746,132 | (h) |
Government National Mortgage Association (GNMA) II | | | 3.500 | % | | | 1/24/47 | | | | 8,200,000 | | | | 8,524,637 | (h) |
Total GNMA | | | | | | | | | | | | | | | 27,026,152 | |
Total Mortgage-Backed Securities (Cost — $134,721,941) | | | | | | | | 134,016,039 | |
See Notes to Financial Statements.
| | |
| Western Asset Core Plus VIT Portfolio 2016 Annual Report | | 29 |
Schedule of investments (cont’d)
December 31, 2016
Western Asset Core Plus VIT Portfolio
| | | | | | | | | | | | | | | | |
| Security | | Rate | | | Maturity
Date | | | Face
Amount† | | | Value | |
| Senior Loans — 3.8% | | | | | | | | | | | | | | | | |
| Consumer Discretionary — 1.6% | | | | | | | | | | | | | | | | |
Hotels, Restaurants & Leisure — 0.3% | | | | | | | | | | | | | | | | |
1011778 B.C. Unlimited Liability Co., Term Loan B2 | | | 3.750 | % | | | 12/10/21 | | | | 713,934 | | | $ | 720,925 | (i)(j) |
Aristocrat Technologies Inc., 2016 Term Loan B | | | 3.631 | % | | | 10/20/21 | | | | 56,075 | | | | 56,734 | (i)(j) |
Boyd Gaming Corp., Term Loan B2 | | | 3.756 | % | | | 9/15/23 | | | | 224,438 | | | | 226,962 | (i)(j) |
Hilton Worldwide Finance LLC, Term Loan B1 | | | 3.500 | % | | | 10/26/20 | | | | 16,002 | | | | 16,156 | (i)(j) |
Hilton Worldwide Finance LLC, Term Loan B2 | | | 3.256 | % | | | 10/25/23 | | | | 895,542 | | | | 906,976 | (i)(j) |
Landry’s Inc., 2016 Term Loan B | | | 4.000 | % | | | 10/4/23 | | | | 325,000 | | | | 328,981 | (i)(j) |
Total Hotels, Restaurants & Leisure | | | | | | | | | | | | | | | 2,256,734 | |
Media — 0.5% | | | | | | | | | | | | | | | | |
Charter Communications Operating LLC, 2016 Term Loan I | | | 3.005 | % | | | 1/24/23 | | | | 916,850 | | | | 922,644 | (i)(j)(k) |
Lions Gate Entertainment Corp., 2016 First Lien Term Loan | | | 3.750 | % | | | 12/8/23 | | | | 325,000 | | | | 327,385 | (i)(j) |
Univision Communications Inc., Term Loan C3 | | | 4.000 | % | | | 3/1/20 | | | | 68,703 | | | | 69,084 | (i)(j) |
Univision Communications Inc., Term Loan C4 | | | 4.000 | % | | | 3/1/20 | | | | 581,743 | | | | 585,177 | (i)(j) |
UPC Financing Partnership, USD Term Loan AN | | | 4.080 | % | | | 8/31/24 | | | | 650,000 | | | | 657,394 | (i)(j) |
Virgin Media Investment Holdings Ltd., USD Term Loan I | | | — | | | | 1/31/25 | | | | 548,519 | | | | 551,718 | (k) |
Ziggo Financing Partnership, USD Term Loan B1 | | | 3.500 | % | | | 1/15/22 | | | | 22,187 | | | | 22,306 | (i)(j) |
Ziggo Financing Partnership, USD Term Loan B2A | | | 3.500 | % | | | 1/15/22 | | | | 13,149 | | | | 13,219 | (i)(j) |
Ziggo Financing Partnership, USD Term Loan B3 | | | 3.701 | % | | | 1/15/22 | | | | 4,086 | | | | 4,108 | (i)(j) |
Total Media | | | | | | | | | | | | | | | 3,153,035 | |
Multiline Retail — 0.1% | | | | | | | | | | | | | | | | |
Dollar Tree Inc., Term Loan B3 | | | 3.250 | % | | | 7/6/22 | | | | 129,963 | | | | 131,317 | (i)(j) |
Neiman Marcus Group Inc., 2020 Term Loan | | | 4.250 | % | | | 10/25/20 | | | | 414,720 | | | | 362,880 | (i)(j) |
Total Multiline Retail | | | | | | | | | | | | | | | 494,197 | |
Specialty Retail — 0.7% | | | | | | | | | | | | | | | | |
Academy Ltd., 2015 Term Loan B | | | 5.000 | % | | | 7/1/22 | | | | 592,044 | | | | 548,910 | (i)(j) |
CWGS Group LLC, 2016 Term Loan | | | 4.500 | % | | | 11/8/23 | | | | 220,000 | | | | 222,131 | (i)(j) |
Michaels Stores Inc., 2016 Term Loan B1 | | | 3.750 | % | | | 1/27/23 | | | | 1,296,435 | | | | 1,311,252 | (i)(j) |
Party City Holdings Inc., 2016 Term Loan | | | 3.820-4.240 | % | | | 8/19/22 | | | | 613,889 | | | | 618,829 | (i)(j) |
Petco Animal Supplies Inc., 2016 Term Loan B1 | | | 5.000 | % | | | 1/26/23 | | | | 648,367 | | | | 654,175 | (i)(j) |
PetSmart Inc., Term Loan B2 | | | 4.000 | % | | | 3/11/22 | | | | 1,066,269 | | | | 1,071,539 | (i)(j) |
Total Specialty Retail | | | | | | | | | | | | | | | 4,426,836 | |
Textiles, Apparel & Luxury Goods — 0.0% | | | | | | | | | | | | | | | | |
TOMS Shoes LLC, Term Loan B | | | 6.500 | % | | | 10/28/20 | | | | 147,375 | | | | 109,057 | (i)(j) |
Total Consumer Discretionary | | | | | | | | | | | | | | | 10,439,859 | |
See Notes to Financial Statements.
| | |
| 30 | | Western Asset Core Plus VIT Portfolio 2016 Annual Report |
Western Asset Core Plus VIT Portfolio
| | | | | | | | | | | | | | | | |
| Security | | Rate | | | Maturity
Date | | | Face
Amount† | | | Value | |
| Consumer Staples — 0.2% | | | | | | | | | | | | | | | | |
Food & Staples Retailing — 0.1% | | | | | | | | | | | | | | | | |
Albertsons LLC, USD 2016 Term Loan B4 | | | 3.770 | % | | | 8/22/21 | | | | 336,656 | | | $ | 340,890 | (i)(j) |
Albertsons LLC, USD 2016 Term Loan B6 | | | 4.061 | % | | | 6/22/23 | | | | 312,500 | | | | 317,439 | (i)(j)(k) |
Total Food & Staples Retailing | | | | | | | | | | | | | | | 658,329 | |
Food Products — 0.1% | | | | | | | | | | | | | | | | |
AdvancePierre Foods Inc., 2016 Term Loan | | | 4.000 | % | | | 6/2/23 | | | | 635,243 | | | | 645,169 | (i)(j) |
Keurig Green Mountain Inc., USD Term Loan B | | | 5.250-5.313 | % | | | 3/3/23 | | | | 177,958 | | | | 181,034 | (i)(j) |
Total Food Products | | | | | | | | | | | | | | | 826,203 | |
Total Consumer Staples | | | | | | | | | | | | | | | 1,484,532 | |
| Energy — 0.0% | | | | | | | | | | | | | | | | |
Oil, Gas & Consumable Fuels — 0.0% | | | | | | | | | | | | | | | | |
Murray Energy Corp., Term Loan B2 | | | 8.250 | % | | | 4/16/20 | | | | 164,187 | | | | 157,312 | (i)(j) |
Westmoreland Coal Co., Term Loan B | | | 7.500 | % | | | 12/16/20 | | | | 144,795 | | | | 131,401 | (i)(j) |
Total Energy | | | | | | | | | | | | | | | 288,713 | |
| Financials — 0.2% | | | | | | | | | | | | | | | | |
Capital Markets — 0.2% | | | | | | | | | | | | | | | | |
RPI Finance Trust, Term Loan B5 | | | — | | | | 10/14/22 | | | | 997,500 | | | | 1,009,880 | (k) |
| Health Care — 0.6% | | | | | | | | | | | | | | | | |
Health Care Equipment & Supplies — 0.0% | | | | | | | | | | | | | | | | |
Immucor Inc., REFI Term Loan B2 | | | 5.000 | % | | | 8/17/18 | | | | 170,647 | | | | 165,314 | (i)(j) |
Health Care Providers & Services — 0.5% | | | | | | | | | | | | | | | | |
Air Medical Group Holdings Inc., Term Loan B | | | 4.250 | % | | | 4/28/22 | | | | 744,477 | | | | 743,361 | (i)(j) |
HCA Inc., Term Loan B7 | | | 3.520 | % | | | 2/15/24 | | | | 656,355 | | | | 664,267 | (i)(j) |
Jaguar Holding Co. II, 2015 Term Loan B | | | 4.250 | % | | | 8/18/22 | | | | 649,515 | | | | 656,822 | (i)(j)(k) |
MPH Acquisition Holdings LLC, 2016 Term Loan B | | | 5.000 | % | | | 6/7/23 | | | | 660,049 | | | | 672,779 | (i)(j) |
Select Medical Corp., Series F Term Loan B | | | 6.000-7.750 | % | | | 3/3/21 | | | | 426,775 | | | | 435,310 | (i)(j) |
Total Health Care Providers & Services | | | | | | | | | | | | | | | 3,172,539 | |
Pharmaceuticals — 0.1% | | | | | | | | | | | | | | | | |
Catalent Pharma Solutions Inc., USD Term Loan B | | | 4.250 | % | | | 5/20/21 | | | | 269,458 | | | | 271,788 | (i)(j) |
Total Health Care | | | | | | | | | | | | | | | 3,609,641 | |
| Industrials — 0.3% | | | | | | | | | | | | | | | | |
Air Freight & Logistics — 0.1% | | | | | | | | | | | | | | | | |
XPO Logistics Inc., Term Loan B2 | | | 4.250 | % | | | 10/30/21 | | | | 478,968 | | | | 485,674 | (i)(j) |
Airlines — 0.1% | | | | | | | | | | | | | | | | |
American Airlines Inc., New Term Loan | | | 3.256 | % | | | 6/27/20 | | | | 664,750 | | | | 668,957 | (i)(j) |
Commercial Services & Supplies — 0.1% | | | | | | | | | | | | | | | | |
Prime Security Services Borrower LLC, 2016 Incremental Term Loan B1 | | | 4.750 | % | | | 5/2/22 | | | | 650,000 | | | | 658,450 | (i)(j) |
Total Industrials | | | | | | | | | | | | | | | 1,813,081 | |
See Notes to Financial Statements.
| | |
| Western Asset Core Plus VIT Portfolio 2016 Annual Report | | 31 |
Schedule of investments (cont’d)
December 31, 2016
Western Asset Core Plus VIT Portfolio
| | | | | | | | | | | | | | | | |
| Security | | Rate | | | Maturity
Date | | | Face
Amount† | | | Value | |
| Information Technology — 0.1% | | | | | | | | | | | | | | | | |
IT Services — 0.1% | | | | | | | | | | | | | | | | |
First Data Corp., 2016 USD Term Loan | | | — | | | | 3/24/21 | | | | 642,254 | | | $ | 649,345 | (k) |
| Materials — 0.3% | | | | | | | | | | | | | | | | |
Construction Materials — 0.1% | | | | | | | | | | | | | | | | |
American Builders & Contractors Supply Co., Term Loan B | | | 3.520 | % | | | 10/31/23 | | | | 732,143 | | | | 740,314 | (i)(j) |
Containers & Packaging — 0.2% | | | | | | | | | | | | | | | | |
Berry Plastics Holding Corp., Term Loan H | | | 3.750 | % | | | 10/1/22 | | | | 427,441 | | | | 431,875 | (i)(j) |
Reynolds Group Holdings Inc., 2016 USD Term Loan | | | 4.250 | % | | | 2/5/23 | | | | 648,398 | | | | 656,282 | (i)(j)(k) |
Total Containers & Packaging | | | | | | | | | | | | | | | 1,088,157 | |
Metals & Mining — 0.0% | | | | | | | | | | | | | | | | |
Essar Steel Algoma Inc., Term Loan | | | 0.000 | % | | | 8/9/19 | | | | 99,000 | | | | 35,888 | *(f)(i)(j) |
Total Materials | | | | | | | | | | | | | | | 1,864,359 | |
| Real Estate — 0.1% | | | | | | | | | | | | | | | | |
Equity Real Estate Investment Trusts (REITs) — 0.1% | | | | | | | | | | | | | | | | |
MGM Growth Properties Operating Partnership LP, 2016 Term Loan B | | | 3.520 | % | | | 4/25/23 | | | | 447,744 | | | | 451,732 | (i)(j) |
| Telecommunication Services — 0.3% | | | | | | | | | | | | | | | | |
Diversified Telecommunication Services — 0.2% | | | | | | | | | | | | | | | | |
Level 3 Financing Inc., 2015 Term Loan B2 | | | 3.500 | % | | | 5/31/22 | | | | 950,000 | | | | 959,995 | (i)(j) |
Wireless Telecommunication Services — 0.1% | | | | | | | | | | | | | | | | |
CSC Holdings LLC, 2016 Term Loan | | | 3.876 | % | | | 10/11/24 | | | | 276,316 | | | | 279,727 | (i)(j) |
T-Mobile USA Inc., Term Loan B | | | 3.520 | % | | | 11/9/22 | | | | 646,118 | | | | 654,310 | (i)(j) |
Total Wireless Telecommunication Services | | | | | | | | | | | | | | | 934,037 | |
Total Telecommunication Services | | | | | | | | | | | | | | | 1,894,032 | |
| Utilities — 0.1% | | | | | | | | | | | | | | | | |
Electric Utilities — 0.0% | | | | | | | | | | | | | | | | |
Panda Temple Power LLC, 2015 Term Loan B | | | 7.250 | % | | | 3/4/22 | | | | 216,150 | | | | 192,373 | (i)(j) |
Independent Power and Renewable Electricity Producers — 0.1% | | | | | | | | | | | | | |
Energy Future Intermediate Holding Co., LLC, 2016 DIP Term Loan | | | 4.250 | % | | | 6/30/17 | | | | 426,974 | | | | 430,283 | (i)(j) |
TPF II Power LLC, Term Loan B | | | 5.000 | % | | | 10/2/21 | | | | 158,483 | | | | 160,068 | (i)(j) |
Total Independent Power and Renewable Electricity Producers | | | | | | | | 590,351 | |
Total Utilities | | | | | | | | | | | | | | | 782,724 | |
Total Senior Loans (Cost — $24,335,365) | | | | | | | | | | | | | | | 24,287,898 | |
| Sovereign Bonds — 5.6% | | | | | | | | | | | | | | | | |
Argentina — 0.2% | | | | | | | | | | | | | | | | |
Republic of Argentina, Senior Notes | | | 6.875 | % | | | 4/22/21 | | | | 310,000 | | | | 330,925 | (a) |
Republic of Argentina, Senior Notes | | | 7.500 | % | | | 4/22/26 | | | | 460,000 | | | | 484,150 | (a) |
See Notes to Financial Statements.
| | |
| 32 | | Western Asset Core Plus VIT Portfolio 2016 Annual Report |
Western Asset Core Plus VIT Portfolio
| | | | | | | | | | | | | | | | |
| Security | | Rate | | | Maturity
Date | | | Face
Amount† | | | Value | |
Argentina — continued | | | | | | | | | | | | | | | | |
Republic of Argentina, Senior Notes | | | 7.125 | % | | | 7/6/36 | | | | 150,000 | | | $ | 143,063 | (a) |
Republic of Argentina, Senior Notes | | | 7.625 | % | | | 4/22/46 | | | | 150,000 | | | | 150,375 | (a) |
Total Argentina | | | | | | | | | | | | | | | 1,108,513 | |
Brazil — 1.2% | | | | | | | | | | | | | | | | |
Federative Republic of Brazil, Notes | | | 10.000 | % | | | 1/1/21 | | | | 17,407,000 | BRL | | | 5,163,905 | |
Federative Republic of Brazil, Notes | | | 10.000 | % | | | 1/1/23 | | | | 3,952,000 | BRL | | | 1,145,449 | |
Federative Republic of Brazil, Senior Bonds | | | 5.625 | % | | | 1/7/41 | | | | 770,000 | | | | 688,919 | |
Federative Republic of Brazil, Senior Bonds | | | 5.000 | % | | | 1/27/45 | | | | 1,050,000 | | | | 857,010 | |
Total Brazil | | | | | | | | | | | | | | | 7,855,283 | |
China — 0.3% | | | | | | | | | | | | | | | | |
China Government Bond, Senior Bonds | | | 3.380 | % | | | 11/21/24 | | | | 3,000,000 | CNY | | | 419,447 | (l) |
China Government Bond, Senior Bonds | | | 3.390 | % | | | 5/21/25 | | | | 1,500,000 | CNY | | | 209,551 | (l) |
China Government Bond, Senior Bonds | | | 3.310 | % | | | 11/30/25 | | | | 7,500,000 | CNY | | | 1,039,397 | (l) |
Total China | | | | | | | | | | | | | | | 1,668,395 | |
Colombia — 0.1% | | | | | | | | | | | | | | | | |
Republic of Colombia, Senior Bonds | | | 5.625 | % | | | 2/26/44 | | | | 440,000 | | | | 455,400 | |
Indonesia — 0.2% | | | | | | | | | | | | | | | | |
Republic of Indonesia, Notes | | | 3.750 | % | | | 4/25/22 | | | | 1,510,000 | | | | 1,519,425 | (l) |
Mexico — 1.8% | | | | | | | | | | | | | | | | |
United Mexican States, Senior Bonds | | | 6.500 | % | | | 6/9/22 | | | | 62,688,000 | MXN | | | 2,922,961 | |
United Mexican States, Senior Bonds | | | 10.000 | % | | | 12/5/24 | | | | 2,000,000 | MXN | | | 111,805 | |
United Mexican States, Senior Bonds | | | 7.750 | % | | | 11/13/42 | | | | 145,520,000 | MXN | | | 6,929,621 | |
United Mexican States, Senior Notes | | | 5.550 | % | | | 1/21/45 | | | | 1,630,000 | | | | 1,672,788 | |
Total Mexico | | | | | | | | | | | | | | | 11,637,175 | |
Peru — 0.1% | | | | | | | | | | | | | | | | |
Republic of Peru, Senior Bonds | | | 6.550 | % | | | 3/14/37 | | | | 20,000 | | | | 25,210 | |
Republic of Peru, Senior Bonds | | | 5.625 | % | | | 11/18/50 | | | | 530,000 | | | | 601,550 | |
Total Peru | | | | | | | | | | | | | | | 626,760 | |
Poland — 1.0% | | | | | | | | | | | | | | | | |
Republic of Poland, Bonds | | | 3.250 | % | | | 7/25/25 | | | | 9,650,000 | PLN | | | 2,264,746 | |
Republic of Poland, Bonds | | | 2.500 | % | | | 7/25/26 | | | | 11,680,000 | PLN | | | 2,540,647 | |
Republic of Poland, Senior Notes | | | 4.000 | % | | | 1/22/24 | | | | 1,270,000 | | | | 1,301,914 | |
Total Poland | | | | | | | | | | | | | | | 6,107,307 | |
Russia — 0.7% | | | | | | | | | | | | | | | | |
Russian Federal Bond, Bonds | | | 7.000 | % | | | 8/16/23 | | | | 39,030,000 | RUB | | | 600,319 | |
Russian Federal Bond, Bonds | | | 7.750 | % | | | 9/16/26 | | | | 11,810,000 | RUB | | | 186,505 | |
Russian Federal Bond, Bonds | | | 8.150 | % | | | 2/3/27 | | | | 120,100,000 | RUB | | | 1,957,296 | |
See Notes to Financial Statements.
| | |
| Western Asset Core Plus VIT Portfolio 2016 Annual Report | | 33 |
Schedule of investments (cont’d)
December 31, 2016
Western Asset Core Plus VIT Portfolio
| | | | | | | | | | | | | | | | |
| Security | | Rate | | | Maturity
Date | | | Face
Amount† | | | Value | |
Russia — continued | | | | | | | | | | | | | | | | |
Russian Federal Bond, Bonds | | | 7.050 | % | | | 1/19/28 | | | | 128,060,000 | RUB | | $ | 1,916,268 | |
Total Russia | | | | | | | | | | | | | | | 4,660,388 | |
Total Sovereign Bonds (Cost — $40,129,093) | | | | | | | | | | | | | | | 35,638,646 | |
| U.S. Government & Agency Obligations — 25.3% | | | | | | | | | | | | | | | | |
U.S. Government Obligations — 25.3% | | | | | | | | | | | | | | | | |
U.S. Treasury Bonds | | | 2.750 | % | | | 11/15/42 | | | | 2,000,000 | | | | 1,889,532 | |
U.S. Treasury Bonds | | | 2.875 | % | | | 5/15/43 | | | | 8,830,000 | | | | 8,531,299 | |
U.S. Treasury Bonds | | | 3.000 | % | | | 5/15/45 | | | | 21,900,000 | | | | 21,609,562 | |
U.S. Treasury Bonds | | | 3.000 | % | | | 11/15/45 | | | | 11,750,000 | | | | 11,592,104 | |
U.S. Treasury Bonds | | | 2.500 | % | | | 2/15/46 | | | | 4,150,000 | | | | 3,688,719 | |
U.S. Treasury Bonds | | | 2.500 | % | | | 5/15/46 | | | | 18,800,000 | | | | 16,707,767 | |
U.S. Treasury Bonds | | | 2.250 | % | | | 8/15/46 | | | | 170,000 | | | | 142,946 | |
U.S. Treasury Bonds | | | 2.875 | % | | | 11/15/46 | | | | 2,700,000 | | | | 2,607,242 | |
U.S. Treasury Notes | | | 1.125 | % | | | 6/30/21 | | | | 300,000 | | | | 290,396 | |
U.S. Treasury Notes | | | 1.125 | % | | | 8/31/21 | | | | 32,540,000 | | | | 31,444,964 | |
U.S. Treasury Notes | | | 1.125 | % | | | 9/30/21 | | | | 26,670,000 | | | | 25,726,149 | |
U.S. Treasury Notes | | | 1.375 | % | | | 9/30/23 | | | | 1,150,000 | | | | 1,089,087 | |
U.S. Treasury Notes | | | 2.125 | % | | | 11/30/23 | | | | 10,890,000 | | | | 10,819,171 | |
U.S. Treasury Notes | | | 2.000 | % | | | 2/15/25 | | | | 40,000 | | | | 38,939 | |
U.S. Treasury Notes | | | 2.000 | % | | | 8/15/25 | | | | 25,010,000 | | | | 24,231,364 | |
U.S. Treasury Notes | | | 1.625 | % | | | 5/15/26 | | | | 160,000 | | | | 149,228 | |
Total U.S. Government & Agency Obligations (Cost — $168,871,176) | | | | | | | | 160,558,469 | |
| U.S. Treasury Inflation Protected Securities — 3.3% | | | | | | | | | | | | | | | | |
U.S. Treasury Bonds, Inflation Indexed | | | 0.750 | % | | | 2/15/45 | | | | 5,768,874 | | | | 5,438,115 | |
U.S. Treasury Bonds, Inflation Indexed | | | 1.000 | % | | | 2/15/46 | | | | 4,121,406 | | | | 4,143,192 | |
U.S. Treasury Notes, Inflation Indexed | | | 0.125 | % | | | 4/15/21 | | | | 4,946,418 | | | | 4,977,961 | |
U.S. Treasury Notes, Inflation Indexed | | | 0.125 | % | | | 7/15/26 | | | | 6,746,330 | | | | 6,527,560 | |
Total U.S. Treasury Inflation Protected Securities (Cost — $20,692,744) | | | | | | | | 21,086,828 | |
| Non-U.S. Treasury Inflation Protected Securities — 0.5% | | | | | | | | | | | | | |
Japan — 0.5% | | | | | | | | | | | | | | | | |
Japanese Government CPI Linked Bond, Senior Bonds
(Cost — $3,420,036) | | | 0.100 | % | | | 3/10/26 | | | | 337,995,840 | JPY | | | 3,087,149 | |
| | | | |
| | | | | | | | | Shares | | | | |
| Common Stocks — 0.3% | | | | | | | | | | | | | | | | |
| Consumer Discretionary — 0.1% | | | | | | | | | | | | | | | | |
Hotels, Restaurants & Leisure — 0.1% | | | | | | | | | | | | | | | | |
Bossier Casino Venture Holdco Inc. | | | | | | | | | | | 22,038 | | | | 213,328 | *(c) |
See Notes to Financial Statements.
| | |
| 34 | | Western Asset Core Plus VIT Portfolio 2016 Annual Report |
Western Asset Core Plus VIT Portfolio
| | | | | | | | | | | | | | | | |
| Security | | | | | | | | Shares | | | Value | |
Media — 0.0% | | | | | | | | | | | | | | | | |
New Cotai LLC/New Cotai Capital Corp., Class B Shares | | | | | | | | | | | 1 | | | $ | 26,352 | * |
Total Consumer Discretionary | | | | | | | | | | | | | | | 239,680 | |
| Energy — 0.2% | | | | | | | | | | | | | | | | |
Energy Equipment & Services — 0.2% | | | | | | | | | | | | | | | | |
KCAD Holdings I Ltd. | | | | | | | | | | | 108,106,087 | | | | 951,334 | *(c) |
Oil, Gas & Consumable Fuels — 0.0% | | | | | | | | | | | | | | | | |
MWO Holdings LLC | | | | | | | | | | | 146 | | | | 165,933 | (c) |
Total Energy | | | | | | | | | | | | | | | 1,117,267 | |
| Health Care — 0.0% | | | | | | | | | | | | | | | | |
Health Care Providers & Services — 0.0% | | | | | | | | | | | | | | | | |
Physiotherapy Associates Holdings Inc. (Escrow) | | | | | | | | | | | 3,500 | | | | 42,420 | *(c) |
| Industrials — 0.0% | | | | | | | | | | | | | | | | |
Marine — 0.0% | | | | | | | | | | | | | | | | |
Tricer HoldCo, S.C.A | | | | | | | | | | | 17,686 | | | | 23,876 | *(c) |
Road & Rail — 0.0% | | | | | | | | | | | | | | | | |
Jack Cooper Enterprises Inc. | | | | | | | | | | | 965 | | | | 0 | (a)(c)(g) |
Total Industrials | | | | | | | | | | | | | | | 23,876 | |
| Materials — 0.0% | | | | | | | | | | | | | | | | |
Metals & Mining — 0.0% | | | | | | | | | | | | | | | | |
Mirabela Nickel Ltd. | | | | | | | | | | | 638,674 | | | | 0 | *(c)(g) |
Total Common Stocks (Cost — $1,312,110) | | | | | | | | | | | | | | | 1,423,243 | |
| | | | |
| | | Rate | | | | | | | | | | |
| Preferred Stocks — 0.2% | | | | | | | | | | | | | | | | |
| Financials — 0.2% | | | | | | | | | | | | | | | | |
Consumer Finance — 0.1% | | | | | | | | | | | | | | | | |
GMAC Capital Trust I | | | 6.691 | % | | | | | | | 18,769 | | | | 476,733 | (d) |
Diversified Financial Services — 0.1% | | | | | | | | | | | | | | | | |
Citigroup Capital XIII | | | 7.257 | % | | | | | | | 25,825 | | | | 666,801 | (d) |
Total Financials | | | | | | | | | | | | | | | 1,143,534 | |
| Industrials — 0.0% | | | | | | | | | | | | | | | | |
Marine — 0.0% | | | | | | | | | | | | | | | | |
Tricer Tracking Preferred Equity Certificates | | | 8.000 | % | | | | | | | 7,860,600 | | | | 106,087 | *(c) |
Total Preferred Stocks (Cost — $1,734,314) | | | | | | | | | | | | | | | 1,249,621 | |
| | | | |
| | | | | | Expiration
Date | | | Contracts | | | | |
| Purchased Options — 0.0% | | | | | | | | | | | | | | | | |
U.S. Dollar/Japanese Yen, Call @ 105.92 JPY | | | | | | | 2/10/17 | | | | 2,160,000 | | | | 198,102 | |
U.S. Treasury 10-Year Notes, Call @ $124.50 | | | | | | | 1/27/17 | | | | 23 | | | | 12,938 | |
U.S. Treasury Long-Term Bonds, Call @ $152.00 | | | | | | | 1/27/17 | | | | 23 | | | | 24,797 | |
Total Purchased Options (Cost — $83,949) | | | | | | | | | | | | | | | 235,837 | |
See Notes to Financial Statements.
| | |
| Western Asset Core Plus VIT Portfolio 2016 Annual Report | | 35 |
Schedule of investments (cont’d)
December 31, 2016
Western Asset Core Plus VIT Portfolio
| | | | | | | | | | | | | | | | |
| Security | | | | | Expiration
Date | | | Warrants | | | Value | |
| Warrants — 0.0% | | | | | | | | | | | | | | | | |
Hercules LLC (Cost — $0) | | | | | | | 3/31/29 | | | | 80 | | | $ | 0 | *(c)(g) |
Total Investments before Short-Term Investments (Cost — $635,395,556) | | | | 621,860,626 | |
| | | | |
| | | Rate | | | Maturity
Date | | | Face
Amount† | | | | |
| Short-Term Investments — 16.0% | | | | | | | | | | | | | | | | |
Repurchase Agreements — 1.6% | | | | | | | | | | | | | | | | |
Deutsche Bank Securities Inc. repurchase agreement dated 12/30/16; Proceeds at maturity — $10,000,489; (Fully collateralized by U.S. government obligations, 1.625% due 01/15/18; Market value — $10,200,000) (Cost — $10,000,000) | | | 0.440 | % | | | 1/3/17 | | | | 10,000,000 | | | | 10,000,000 | |
| | | | |
| | | | | | | | | Shares | | | | |
Money Market Funds — 14.4% | | | | | | | | | | | | | | | | |
State Street Institutional U.S. Government Money Market Fund, Premier Class (Cost — $91,542,336) | | | 0.411 | % | | | | | | | 91,542,336 | | | | 91,542,336 | |
Total Short-Term Investments (Cost — $101,542,336) | | | | | | | | 101,542,336 | |
Total Investments — 114.0% (Cost — $736,937,892#) | | | | | | | | 723,402,962 | |
Liabilities in Excess of Other Assets — (14.0)% | | | | | | | | (88,821,561 | ) |
Total Net Assets — 100.0% | | | | | | | $ | 634,581,401 | |
| † | Face amount denominated in U.S. dollars, unless otherwise noted. |
| * | Non-income producing security. |
| (a) | Security is exempt from registration under Rule 144A of the Securities Act of 1933. This security may be resold in transactions that are exempt from registration, normally to qualified institutional buyers. This security has been deemed liquid pursuant to guidelines approved by the Board of Trustees, unless otherwise noted. |
| (b) | Payment-in-kind security for which the issuer has the option at each interest payment date of making interest payments in cash or additional debt securities. |
| (c) | Security is valued in good faith in accordance with procedures approved by the Board of Trustees (See Note 1). |
| (d) | Variable rate security. Interest rate disclosed is as of the most recent information available. |
| (e) | Security has no maturity date. The date shown represents the next call date. |
| (f) | The coupon payment on these securities is currently in default as of December 31, 2016. |
| (g) | Value is less than $1. |
| (h) | This security is traded on a to-be-announced (“TBA”) basis. At December 31, 2016, the Portfolio held TBA securities with a total cost of $99,877,433 (See Note 1). |
| (i) | Senior loans may be considered restricted in that the Portfolio ordinarily is contractually obligated to receive approval from the agent bank and/or borrower prior to the disposition of a senior loan. |
| (j) | Interest rates disclosed represent the effective rates on senior loans. Ranges in interest rates are attributable to multiple contracts under the same loan. |
| (k) | All or a portion of this loan is unfunded as of December 31, 2016. The interest rate for fully unfunded term loans is to be determined. |
See Notes to Financial Statements.
| | |
| 36 | | Western Asset Core Plus VIT Portfolio 2016 Annual Report |
Western Asset Core Plus VIT Portfolio
| (l) | Security is exempt from registration under Regulation S of the Securities Act of 1933. Regulation S applies to securities offerings that are made outside of the United States and do not involve direct selling efforts in the United States. This security has been deemed liquid pursuant to guidelines approved by the Board of Trustees, unless otherwise noted. |
| # | Aggregate cost for federal income tax purposes is $738,222,355. |
| | |
Abbreviations used in this schedule: |
| BRL | | — Brazilian Real |
| CLO | | — Collateral Loan Obligation |
| CNY | | — Chinese Yuan Renminbi |
| DIP | | — Debtor-in-Possession |
| GBP | | — British Pound |
| IO | | — Interest Only |
| JPY | | — Japanese Yen |
| MXN | | — Mexican Peso |
| PAC | | — Planned Amortization Class |
| PLN | | — Polish Zloty |
| REFI | | — Refinancing |
| RUB | | — Russian Ruble |
| STRIPS | | — Separate Trading of Registered Interest and Principal Securities |
| | | | | | | | | | | | | | | | |
| Schedule of Written Options | |
| Security | | Expiration
Date | | | Strike
Price | | | Contracts | | | Value | |
| U.S. Dollar/Mexican Peso, Put | | | 1/23/17 | | | | 17.95 | MXN | | | 5,620,000 | | | $ | 17 | |
| U.S. Dollar/Mexican Peso, Put | | | 2/14/17 | | | | 19.91 | MXN | | | 3,440,000 | | | | 16,478 | |
| U.S. Treasury 5-Year Notes Futures, Call | | | 1/27/17 | | | $ | 120.00 | | | | 137 | | | | 2,141 | |
| U.S. Treasury 5-Year Notes Futures, Call | | | 2/24/17 | | | | 117.75 | | | | 23 | | | | 12,758 | |
| U.S. Treasury 5-Year Notes Futures, Call | | | 1/27/17 | | | | 117.75 | | | | 234 | | | | 84,094 | |
| U.S. Treasury 10-Year Notes Futures, Call | | | 2/24/17 | | | | 127.50 | | | | 46 | | | | 7,187 | |
| U.S. Treasury 10-Year Notes Futures, Call | | | 1/27/17 | | | | 126.00 | | | | 23 | | | | 3,234 | |
| U.S. Treasury 10-Year Notes Futures, Call | | | 1/27/17 | | | | 127.50 | | | | 23 | | | | 1,078 | |
| U.S. Treasury 10-Year Notes Futures, Call | | | 1/27/17 | | | | 126.50 | | | | 23 | | | | 2,156 | |
| U.S. Treasury 10-Year Notes Futures, Call | | | 2/24/17 | | | | 126.00 | | | | 46 | | | | 17,250 | |
| U.S. Treasury 10-Year Notes Futures, Call | | | 1/27/17 | | | | 125.00 | | | | 46 | | | | 16,531 | |
| U.S. Treasury Long-Term Bonds Futures, Call | | | 1/27/17 | | | | 150.00 | | | | 26 | | | | 52,813 | |
| U.S. Treasury Long-Term Bonds Futures, Call | | | 1/27/17 | | | | 151.00 | | | | 9 | | | | 13,500 | |
| U.S. Treasury Long-Term Bonds Futures, Put | | | 1/27/17 | | | | 143.00 | | | | 34 | | | | 4,250 | |
| Total Written Options (Premiums received — $336,681) | | | $ | 233,487 | |
See Notes to Financial Statements.
| | |
| Western Asset Core Plus VIT Portfolio 2016 Annual Report | | 37 |
Statement of assets and liabilities
December 31, 2016
| | | | |
|
| Assets: | |
Investments, at value (Cost — $736,937,892) | | $ | 723,402,962 | |
Foreign currency, at value (Cost — $1,394,999) | | | 1,372,036 | |
Cash | | | 383,919 | |
Receivable for securities sold | | | 10,753,125 | |
Interest receivable | | | 3,790,354 | |
Unrealized appreciation on forward foreign currency contracts | | | 2,737,119 | |
Deposits with brokers for centrally cleared swap contracts | | | 1,942,019 | |
Foreign currency collateral for open futures contracts, at value (Cost — $1,185,227) | | | 1,147,452 | |
Deposits with brokers for TBA securities | | | 1,030,000 | |
Deposits with brokers for open futures contracts | | | 917,816 | |
Receivable for Portfolio shares sold | | | 279,846 | |
Prepaid expenses | | | 11,356 | |
Total Assets | | | 747,768,004 | |
|
| Liabilities: | |
Payable for securities purchased | | | 111,345,164 | |
Unrealized depreciation on forward foreign currency contracts | | | 739,687 | |
Investment management fee payable | | | 239,737 | |
Written options, at value (premiums received — $336,681) | | | 233,487 | |
Payable to broker — variation margin on centrally cleared swaps | | | 202,749 | |
Payable for Portfolio shares repurchased | | | 143,079 | |
Service and/or distribution fees payable | | | 118,197 | |
Payable to broker — variation margin on open futures contracts | | | 43,339 | |
Trustees’ fees payable | | | 2,190 | |
Accrued expenses | | | 118,974 | |
Total Liabilities | | | 113,186,603 | |
| Total Net Assets | | $ | 634,581,401 | |
|
| Net Assets: | |
Par value (Note 7) | | $ | 1,114 | |
Paid-in capital in excess of par value | | | 655,744,076 | |
Overdistributed net investment income | | | (908,031) | |
Accumulated net realized loss on investments, futures contracts, written options, swap contracts and foreign currency transactions | | | (10,378,482) | |
Net unrealized depreciation on investments, futures contracts, written options, swap contracts and foreign currencies | | | (9,877,276) | |
| Total Net Assets | | $ | 634,581,401 | |
See Notes to Financial Statements.
| | |
| 38 | | Western Asset Core Plus VIT Portfolio 2016 Annual Report |
| | | | |
|
| Net Assets: | |
Class I | | | $71,158,662 | |
Class II | | | $563,422,739 | |
|
| Shares Outstanding: | |
Class I | | | 12,475,237 | |
Class II | | | 98,946,845 | |
|
| Net Asset Value: | |
Class I | | | $5.70 | |
Class II | | | $5.69 | |
See Notes to Financial Statements.
| | |
| Western Asset Core Plus VIT Portfolio 2016 Annual Report | | 39 |
Statement of operations
For the Year Ended December 31, 2016
| | | | |
|
| Investment Income: | |
Interest | | $ | 15,118,182 | |
Dividends | | | 110,767 | |
Total Investment Income | | | 15,228,949 | |
|
| Expenses: | |
Investment management fee (Note 2) | | | 2,198,161 | |
Service and/or distribution fees (Notes 2 and 5) | | | 1,033,153 | |
Shareholder reports | | | 82,981 | |
Audit and tax fees | | | 47,514 | |
Fund accounting fees | | | 45,622 | |
Legal fees | | | 38,016 | |
Custody fees | | | 19,451 | |
Trustees’ fees | | | 10,272 | |
Commitment fees (Note 8) | | | 5,100 | |
Insurance | | | 3,798 | |
Transfer agent fees (Note 5) | | | 1,297 | |
Miscellaneous expenses | | | 15,349 | |
Total Expenses | | | 3,500,714 | |
| Net Investment Income | | | 11,728,235 | |
|
Realized and Unrealized Gain (Loss) on Investments, Futures Contracts,
Written Options, Swap Contracts and Foreign Currency Transactions (Notes 1, 3 and 4): | |
Net Realized Gain (Loss) From: | |
Investment transactions | | | (1,845,100) | |
Futures contracts | | | 3,904,540 | |
Written options | | | 1,788,042 | |
Swap contracts | | | (794,379) | |
Foreign currency transactions | | | 409,735 | |
Net Realized Gain | | | 3,462,838 | |
Change in Net Unrealized Appreciation (Depreciation) From: | |
Investments | | | (4,174,196) | |
Futures contracts | | | (712,860) | |
Written options | | | 25,429 | |
Swap contracts | | | 1,670,357 | |
Foreign currencies | | | 996,799 | |
Change in Net Unrealized Appreciation (Depreciation) | | | (2,194,471) | |
| Net Gain on Investments, Futures Contracts, Written Options, Swap Contracts and Foreign Currency Transactions | | | 1,268,367 | |
| Increase in Net Assets From Operations | | $ | 12,996,602 | |
See Notes to Financial Statements.
| | |
| 40 | | Western Asset Core Plus VIT Portfolio 2016 Annual Report |
Statements of changes in net assets
| | | | | | | | |
| For the Years Ended December 31, | | 2016 | | | 2015 | |
| | |
| Operations: | | | | | | | | |
Net investment income | | $ | 11,728,235 | | | $ | 4,977,843 | |
Net realized gain (loss) | | | 3,462,838 | | | | (2,435,546) | |
Change in net unrealized appreciation (depreciation) | | | (2,194,471) | | | | (3,660,685) | |
Increase (Decrease) in Net Assets From Operations | | | 12,996,602 | | | | (1,118,388) | |
|
| Distributions to Shareholders From (Notes 1 and 6): | |
Net investment income | | | (13,150,182) | | | | (5,270,109) | |
Decrease in Net Assets From Distributions to Shareholders | | | (13,150,182) | | | | (5,270,109) | |
|
| Portfolio Share Transactions (Note 7): | |
Net proceeds from sale of shares | | | 408,063,479 | | | | 363,297,427 | |
Reinvestment of distributions | | | 13,150,182 | | | | 5,270,109 | |
Cost of shares repurchased | | | (211,053,347) | | | | (28,007,716) | |
Increase in Net Assets From Portfolio Share Transactions | | | 210,160,314 | | | | 340,559,820 | |
Increase in Net Assets | | | 210,006,734 | | | | 334,171,323 | |
|
| Net Assets: | |
Beginning of year | | | 424,574,667 | | | | 90,403,344 | |
End of year* | | $ | 634,581,401 | | | $ | 424,574,667 | |
*Includes overdistributed net investment income of: | | | $(908,031) | | | | $(536,971) | |
See Notes to Financial Statements.
| | |
| Western Asset Core Plus VIT Portfolio 2016 Annual Report | | 41 |
Financial highlights
| | | | | | | | | | | | | | | | | | | | |
| For a share of each class of beneficial interest outstanding throughout each year ended December 31: | |
| Class I Shares1,2 | | 2016 | | | 2015 | | | 2014 | | | 2013 | | | 2012 | |
| | | | | |
| Net asset value, beginning of year | | | $5.58 | | | | $5.60 | | | | $6.08 | | | | $6.00 | | | | $5.54 | |
|
| Income (loss) from operations: | |
Net investment income | | | 0.15 | | | | 0.22 | | | | 0.41 | | | | 0.44 | | | | 0.47 | |
Net realized and unrealized gain (loss) | | | 0.10 | | | | (0.15) | | | | (0.43) | | | | 0.11 | | | | 0.52 | |
Total income (loss) from operations | | | 0.25 | | | | 0.07 | | | | (0.02) | | | | 0.55 | | | | 0.99 | |
|
| Less distributions from: | |
Net investment income | | | (0.13) | | | | (0.09) | | | | (0.46) | | | | (0.47) | | | | (0.53) | |
Total distributions | | | (0.13) | | | | (0.09) | | | | (0.46) | | | | (0.47) | | | | (0.53) | |
| | | | | |
| Net asset value, end of year | | | $5.70 | | | | $5.58 | | | | $5.60 | | | | $6.08 | | | | $6.00 | |
Total return3 | | | 4.55 | % | | | 1.20 | % | | | (0.33) | % | | | 9.21 | % | | | 17.88 | % |
| | | | | |
| Net assets, end of year (millions) | | | $71 | | | | $77 | | | | $90 | | | | $108 | | | | $120 | |
|
| Ratios to average net assets: | |
Gross expenses | | | 0.50 | % | | | 0.65 | % | | | 0.75 | % | | | 0.74 | % | | | 0.72 | % |
Net expenses4 | | | 0.50 | | | | 0.60 | 5 | | | 0.75 | | | | 0.74 | | | | 0.72 | |
Net investment income | | | 2.63 | | | | 3.79 | | | | 6.54 | | | | 6.97 | | | | 7.86 | |
| | | | | |
| Portfolio turnover rate | | | 108 | %6 | | | 185 | %6 | | | 68 | % | | | 75 | % | | | 76 | % |
| 1 | In April 2015, the Portfolio’s outstanding class of shares, which was previously unnamed, became known as Class I shares. |
| 2 | Per share amounts have been calculated using the average shares method. |
| 3 | Performance figures may reflect compensating balance arrangements, fee waivers and/or expense reimbursements. In the absence of compensating balance arrangements, fee waivers and/or expense reimbursements, the total return would have been lower. Total returns do not reflect expenses associated with separate accounts such as administrative fees, account charges and surrender charges which, if reflected, would reduce the total return for all periods shown. Past performance is no guarantee of future results. |
| 4 | As a result of an expense limitation arrangement, effective April 15, 2015, the ratio of total annual fund operating expenses, other than interest, brokerage, taxes, extraordinary expenses and acquired fund fees and expenses, to average net assets of Class I shares did not exceed 0.54%. This expense limitation arrangement cannot be terminated prior to December 31, 2018 without the Board of Trustees’ consent. Prior to April 15, 2015, the expense limitation was 1.00%. |
| 5 | Reflects fee waivers and/or expense reimbursements. |
| 6 | Excluding mortgage dollar roll transactions. If mortgage dollar roll transactions had been included, the portfolio turnover rate would have been 280% and 417% for the years ended December 31, 2016 and 2015, respectively. |
See Notes to Financial Statements.
| | |
| 42 | | Western Asset Core Plus VIT Portfolio 2016 Annual Report |
| | | | | | | | |
For a share of each class of beneficial interest outstanding throughout each year ended December 31,
unless otherwise noted: | |
| Class II Shares1 | | 2016 | | | 20152 | |
| | |
| Net asset value, beginning of year | | | $5.57 | | | | $5.77 | |
|
| Income (loss) from operations: | |
Net investment income | | | 0.14 | | | | 0.08 | |
Net realized and unrealized gain (loss) | | | 0.10 | | | | (0.20) | |
Total income (loss) from operations | | | 0.24 | | | | (0.12) | |
|
| Less distributions from: | |
Net investment income | | | (0.12) | | | | (0.08) | |
Total distributions | | | (0.12) | | | | (0.08) | |
| | |
| Net asset value, end of year | | | $5.69 | | | | $5.57 | |
Total return3 | | | 4.17 | % | | | (1.85) | % |
| | |
| Net assets, end of year (millions) | | | $563 | | | | $348 | |
|
| Ratios to average net assets: | |
Gross expenses | | | 0.76 | % | | | 0.76 | %4 |
Net expenses5 | | | 0.76 | | | | 0.71 | 4,6 |
Net investment income | | | 2.36 | | | | 2.05 | 4 |
| | |
| Portfolio turnover rate7 | | | 108 | % | | | 185 | %8 |
| 1 | Per share amounts have been calculated using the average shares method. |
| 2 | For the period May 1, 2015 (inception date) to December 31, 2015. |
| 3 | Performance figures may reflect compensating balance arrangements, fee waivers and/or expense reimbursements. In the absence of compensating balance arrangements, fee waivers and/or expense reimbursements, the total return would have been lower. Total returns do not reflect expenses associated with separate accounts such as administrative fees, account charges and surrender charges which, if reflected, would reduce the total return for all periods shown. Past performance is no guarantee of future results. Total returns for periods of less than one year are not annualized. |
| 5 | As a result of an expense limitation arrangement, the ratio of total annual fund operating expenses, other than interest, brokerage, taxes, extraordinary expenses and acquired fund fees and expenses, to average net assets of Class II shares did not exceed 0.79%. This expense limitation arrangement cannot be terminated prior to December 31, 2018 without the Board of Trustees’ consent. |
| 6 | Reflects fee waivers and/or expense reimbursements. |
| 7 | Excluding mortgage dollar roll transactions. If mortgage dollar roll transactions had been included, the portfolio turnover rate would have been 280% and 417% for the years ended December 31, 2016 and 2015, respectively. |
| 8 | For the year ended December 31, 2015. |
See Notes to Financial Statements.
| | |
| Western Asset Core Plus VIT Portfolio 2016 Annual Report | | 43 |
Notes to financial statements
1. Organization and significant accounting policies
Western Asset Core Plus VIT Portfolio (the “Portfolio”) is a separate diversified investment series of Legg Mason Partners Variable Income Trust (the “Trust”). The Trust, a Maryland statutory trust, is registered under the Investment Company Act of 1940, as amended (the “1940 Act”), as an open-end management investment company.
Shares of the Portfolio may only be purchased or redeemed through variable annuity contracts and variable life insurance policies offered by the separate accounts of participating insurance companies or through eligible pension or other qualified plans.
The following are significant accounting policies consistently followed by the Portfolio and are in conformity with U.S. generally accepted accounting principles (“GAAP”). Estimates and assumptions are required to be made regarding assets, liabilities and changes in net assets resulting from operations when financial statements are prepared. Changes in the economic environment, financial markets and any other parameters used in determining these estimates could cause actual results to differ. Subsequent events have been evaluated through the date the financial statements were issued.
(a) Investment valuation. The valuations for fixed income securities (which may include, but are not limited to, corporate, government, municipal, mortgage-backed, collateralized mortgage obligations and asset-backed securities) and certain derivative instruments are typically the prices supplied by independent third party pricing services, which may use market prices or broker/dealer quotations or a variety of valuation techniques and methodologies. The independent third party pricing services use inputs that are observable such as issuer details, interest rates, yield curves, prepayment speeds, credit risks/spreads, default rates and quoted prices for similar securities. Short-term fixed income securities that will mature in 60 days or less are valued at amortized cost, unless it is determined that using this method would not reflect an investment’s fair value. Investments in open-end funds are valued at the closing net asset value per share of each fund on the day of valuation. Futures contracts are valued daily at the settlement price established by the board of trade or exchange on which they are traded. Equity securities for which market quotations are available are valued at the last reported sales price or official closing price on the primary market or exchange on which they trade. When the Portfolio holds securities or other assets that are denominated in a foreign currency, the Portfolio will normally use the currency exchange rates as of 4:00 p.m. (Eastern Time). If independent third party pricing services are unable to supply prices for a portfolio investment, or if the prices supplied are deemed by the manager to be unreliable, the market price may be determined by the manager using quotations from one or more broker/dealers or at the transaction price if the security has recently been purchased and no value has yet been obtained from a pricing service or pricing broker. When reliable prices are not readily available, such as when the value of a security has been significantly affected by events after the close of the exchange or market on which the security is principally traded, but before the Portfolio calculates its net asset value, the Portfolio values these securities as determined in accordance with procedures approved by the Portfolio’s Board of Trustees.
| | |
| 44 | | Western Asset Core Plus VIT Portfolio 2016 Annual Report |
The Board of Trustees is responsible for the valuation process and has delegated the supervision of the daily valuation process to the Legg Mason North Atlantic Fund Valuation Committee (the “Valuation Committee”). The Valuation Committee, pursuant to the policies adopted by the Board of Trustees, is responsible for making fair value determinations, evaluating the effectiveness of the Portfolio’s pricing policies, and reporting to the Board of Trustees. When determining the reliability of third party pricing information for investments owned by the Portfolio, the Valuation Committee, among other things, conducts due diligence reviews of pricing vendors, monitors the daily change in prices and reviews transactions among market participants.
The Valuation Committee will consider pricing methodologies it deems relevant and appropriate when making fair value determinations. Examples of possible methodologies include, but are not limited to, multiple of earnings; discount from market of a similar freely traded security; discounted cash-flow analysis; book value or a multiple thereof; risk premium/yield analysis; yield to maturity; and/or fundamental investment analysis. The Valuation Committee will also consider factors it deems relevant and appropriate in light of the facts and circumstances. Examples of possible factors include, but are not limited to, the type of security; the issuer’s financial statements; the purchase price of the security; the discount from market value of unrestricted securities of the same class at the time of purchase; analysts’ research and observations from financial institutions; information regarding any transactions or offers with respect to the security; the existence of merger proposals or tender offers affecting the security; the price and extent of public trading in similar securities of the issuer or comparable companies; and the existence of a shelf registration for restricted securities.
For each portfolio security that has been fair valued pursuant to the policies adopted by the Board of Trustees, the fair value price is compared against the last available and next available market quotations. The Valuation Committee reviews the results of such back testing monthly and fair valuation occurrences are reported to the Board of Trustees quarterly.
The Portfolio uses valuation techniques to measure fair value that are consistent with the market approach and/or income approach, depending on the type of security and the particular circumstance. The market approach uses prices and other relevant information generated by market transactions involving identical or comparable securities. The income approach uses valuation techniques to discount estimated future cash flows to present value.
GAAP establishes a disclosure hierarchy that categorizes the inputs to valuation techniques used to value assets and liabilities at measurement date. These inputs are summarized in the three broad levels listed below:
| • | | Level 1 — quoted prices in active markets for identical investments |
| • | | Level 2 — other significant observable inputs (including quoted prices for similar investments, interest rates, prepayment speeds, credit risk, etc.) |
| • | | Level 3 — significant unobservable inputs (including the Portfolio’s own assumptions in determining the fair value of investments) |
| | |
| Western Asset Core Plus VIT Portfolio 2016 Annual Report | | 45 |
Notes to financial statements (cont’d)
The inputs or methodologies used to value securities are not necessarily an indication of the risk associated with investing in those securities.
The following is a summary of the inputs used in valuing the Portfolio’s assets and liabilities carried at fair value:
| | | | | | | | | | | | | | | | |
| ASSETS | |
| Description | | Quoted Prices
(Level 1) | | | Other Significant
Observable Inputs
(Level 2) | | | Significant
Unobservable
Inputs
(Level 3) | | | Total | |
| Long-term investments†: | | | | | | | | | | | | | | | | |
Corporate bonds & notes: | | | | | | | | | | | | | | | | |
Consumer discretionary | | | — | | | $ | 15,758,939 | | | $ | 362,461 | | | $ | 16,121,400 | |
Financials | | | — | | | | 50,410,094 | | | | 1,920,356 | | | | 52,330,450 | |
Materials | | | — | | | | 9,718,156 | | | | 0 | * | | | 9,718,156 | |
Other corporate bonds & notes | | | — | | | | 77,851,315 | | | | — | | | | 77,851,315 | |
Asset-backed securities | | | — | | | | 20,490,717 | | | | 1,653,650 | | | | 22,144,367 | |
Collateralized mortgage obligations | | | — | | | | 58,932,649 | | | | 3,150,386 | | | | 62,083,035 | |
Convertible bonds & notes | | | — | | | | 28,173 | | | | — | | | | 28,173 | |
Mortgage-backed securities | | | — | | | | 134,016,039 | | | | — | | | | 134,016,039 | |
Senior loans: | | | | | | | | | | | | | | | | |
Energy | | | — | | | | 157,312 | | | | 131,401 | | | | 288,713 | |
Utilities | | | — | | | | 590,351 | | | | 192,373 | | | | 782,724 | |
Other senior loans | | | — | | | | 23,216,461 | | | | — | | | | 23,216,461 | |
Sovereign bonds | | | — | | | | 35,638,646 | | | | — | | | | 35,638,646 | |
U.S. government & agency obligations | | | — | | | | 160,558,469 | | | | — | | | | 160,558,469 | |
U.S. Treasury inflation protected securities | | | — | | | | 21,086,828 | | | | — | | | | 21,086,828 | |
Non-U.S. Treasury inflation protected securities | | | — | | | | 3,087,149 | | | | — | | | | 3,087,149 | |
Common stocks: | | | | | | | | | | | | | | | | |
Consumer discretionary | | | — | | | | — | | | | 239,680 | | | | 239,680 | |
Energy | | | — | | | | — | | | | 1,117,267 | | | | 1,117,267 | |
Health care | | | — | | | | — | | | | 42,420 | | | | 42,420 | |
Industrials | | | — | | | | — | | | | 23,876 | | | | 23,876 | |
Materials | | | — | | | | — | | | | 0 | * | | | 0 | * |
Preferred stocks: | | | | | | | | | | | | | | | | |
Financials | | $ | 1,143,534 | | | | — | | | | — | | | | 1,143,534 | |
Industrials | | | — | | | | — | | | | 106,087 | | | | 106,087 | |
Purchased options | | | 37,735 | | | | 198,102 | | | | — | | | | 235,837 | |
Warrants | | | — | | | | — | | | | 0 | * | | | 0 | * |
| Total long-term investments | | | 1,181,269 | | | | 611,739,400 | | | | 8,939,957 | | | | 621,860,626 | |
| Short-term investments†: | | | | | | | | | | | | | | | | |
Repurchase agreements | | | — | | | | 10,000,000 | | | | — | | | | 10,000,000 | |
Money market funds | | | 91,542,336 | | | | — | | | | — | | | | 91,542,336 | |
| Total short-term investments | | | 91,542,336 | | | | 10,000,000 | | | | — | | | | 101,542,336 | |
| Total investments | | $ | 92,723,605 | | | $ | 621,739,400 | | | $ | 8,939,957 | | | $ | 723,402,962 | |
| | |
| 46 | | Western Asset Core Plus VIT Portfolio 2016 Annual Report |
| | | | | | | | | | | | | | | | |
| ASSETS | |
| Description | | Quoted Prices
(Level 1) | | | Other Significant
Observable Inputs
(Level 2) | | | Significant
Unobservable
Inputs
(Level 3) | | | Total | |
| Other financial instruments: | | | | | | | | | | | | | | | | |
Forward foreign currency contracts | | | — | | | $ | 2,737,119 | | | | — | | | $ | 2,737,119 | |
Futures contracts | | $ | 582,835 | | | | — | | | | — | | | | 582,835 | |
Centrally cleared interest rate swaps | | | — | | | | 1,970,181 | | | | — | | | | 1,970,181 | |
| Total other financial instruments | | $ | 582,835 | | | $ | 4,707,300 | | | | — | | | $ | 5,290,135 | |
| Total | | $ | 93,306,440 | | | $ | 626,446,700 | | | $ | 8,939,957 | | | $ | 728,693,097 | |
|
| LIABILITIES | |
| Description | | Quoted Prices
(Level 1) | | | Other Significant
Observable Inputs
(Level 2) | | | Significant
Unobservable
Inputs
(Level 3) | | | Total | |
| Other financial instruments: | | | | | | | | | | | | | | | | |
Written options | | $ | 216,992 | | | $ | 16,495 | | | | — | | | $ | 233,487 | |
Forward foreign currency contracts | | | — | | | | 739,687 | | | | — | | | | 739,687 | |
Futures contracts | | | 713,482 | | | | — | | | | — | | | | 713,482 | |
Centrally cleared interest rate swaps | | | — | | | | 221,326 | | | | — | | | | 221,326 | |
| Total | | $ | 930,474 | | | $ | 977,508 | | | | — | | | $ | 1,907,982 | |
| † | See Schedule of Investments for additional detailed categorizations. |
| * | Amount represents less than $1. |
The following is a reconciliation of investments in which significant unobservable inputs (Level 3) were used in determining fair value:
| | | | | | | | | | | | | | | | | | | | | | | | |
| | | Corporate Bonds & Notes | | | | | | | | | | |
Investments in
Securities | | Consumer
Discretionary | | | Financials | | | Materials | | | Asset-Backed
Securities | | | Collateralized
Mortgage
Obligations | | | Mortgage-
Backed
Securities | |
| Balance as of December 31, 2015 | | $ | 443,083 | | | $ | 2,341,030 | | | $ | 0 | * | | $ | 1,756,960 | | | $ | 296,288 | | | $ | 205,875 | |
| Accrued premiums/discounts | | | 8,952 | | | | 3,016 | | | | — | | | | — | | | | 29,627 | | | | — | |
| Realized gain (loss)1 | | | 4,650 | | | | (4,179) | | | | — | | | | — | | | | (1,054) | | | | — | |
| Change in unrealized appreciation (depreciation)2 | | | 24,056 | | | | (389,905) | | | | (29) | | | | (103,310) | | | | 191,809 | | | | — | |
| Purchases | | | 47,518 | | | | — | | | | 29 | | | | — | | | | 4,831,495 | | | | — | |
| Sales | | | (165,798) | | | | (29,606) | | | | — | | | | — | | | | (34,833) | | | | (205,875) | |
| Transfers into Level 3 | | | — | | | | — | | | | — | | | | — | | | | — | | | | — | |
| Transfers out of Level 33 | | | — | | | | — | | | | — | | | | — | | | | (2,162,946) | | | | — | |
| Balance as of December 31, 2016 | | $ | 362,461 | | | $ | 1,920,356 | | | $ | 0 | * | | $ | 1,653,650 | | | $ | 3,150,386 | | | | — | |
| Net change in unrealized appreciation (depreciation) for investments insecurities still held at December 31, 20162 | | $ | 24,056 | | | $ | (389,905) | | | $ | (29) | | | $ | (103,310) | | | $ | 10,279 | | | | — | |
| | |
| Western Asset Core Plus VIT Portfolio 2016 Annual Report | | 47 |
Notes to financial statements (cont’d)
| | | | | | | | | | | | | | | | |
| | | Senior Loans | |
| Investments in Securities (cont’d) | | Consumer Discretionary | | | Energy | | | Industrials | | | Utilities | |
| Balance as of December 31, 2015 | | $ | 101,235 | | | $ | 91,416 | | | $ | 260,580 | | | $ | 180,139 | |
| Accrued premiums/discounts | | | 2,204 | | | | 540 | | | | 218 | | | | 527 | |
| Realized gain (loss)1 | | | 114 | | | | 28 | | | | 674 | | | | 37 | |
| Change in unrealized appreciation (depreciation)2 | | | 7,005 | | | | 40,887 | | | | 4,426 | | | | 13,870 | |
| Purchases | | | — | | | | — | | | | — | | | | — | |
| Sales | | | (1,500) | | | | (1,470) | | | | (265,898) | | | | (2,200) | |
| Transfers into Level 3 | | | — | | | | — | | | | — | | | | — | |
| Transfers out of Level 33 | | | (109,058) | | | | — | | | | — | | | | — | |
| Balance as of December 31, 2016 | | | — | | | $ | 131,401 | | | | — | | | $ | 192,373 | |
| Net change in unrealized appreciation (depreciation) for investments insecurities still held at December 31, 20162 | | | — | | | $ | 40,887 | | | | — | | | $ | 13,870 | |
| | | | | | | | | | | | | | | | | | | | | | | | | | | | | | | | |
| | | Common Stocks | | | | | | | | | | |
Investments in Securities
(cont’d) | | Consumer
Discretionary | | | Energy | | | Health Care | | | Industrials | | | Materials | | | Preferred
Stocks | | | Warrants | | | Total | |
| Balance as of December 31, 2015 | | $ | 30,920 | | | $ | 379,561 | | | $ | 290,500 | | | $ | 157,210 | | | $ | 38,628 | | | | — | | | | — | | | $ | 6,573,425 | |
| Accrued premiums/discounts | | | — | | | | — | | | | — | | | | — | | | | — | | | | — | | | | — | | | | 45,084 | |
| Realized gain (loss)1 | | | — | | | | — | | | | 102,936 | | | | — | | | | — | | | | — | | | | — | | | | 103,206 | |
| Change in unrealized appreciation (depreciation)2 | | | 208,760 | | | | 591,456 | | | | 2,788 | | | | 508,572 | | | | (38,628) | | | $ | (535,819) | | | | — | | | | 525,938 | |
| Purchases | | | — | | | | 146,250 | | | | 28,153 | | | | 144,455 | | | | — | | | | 641,906 | | | $ | 0 | * | | | 5,839,806 | |
| Sales | | | — | | | | — | | | | (381,957) | | | | (786,361) | | | | — | | | | — | | | | — | | | | (1,875,498) | |
| Transfers into Level 3 | | | — | | | | — | | | | — | | | | — | | | | — | | | | — | | | | — | | | | — | |
| Transfers out of Level 33 | | | — | | | | — | | | | — | | | | — | | | | — | | | | — | | | | — | | | | (2,272,004) | |
| Balance as of December 31, 2016 | | $ | 239,680 | | | $ | 1,117,267 | | | $ | 42,420 | | | $ | 23,876 | | | $ | 0 | * | | $ | 106,087 | | | $ | 0 | * | | $ | 8,939,957 | |
| Net change in unrealized appreciation (depreciation) for investments insecurities still held at December 31, 20162 | | $ | 208,760 | | | $ | 591,456 | | | $ | 14,267 | | | $ | (120,578) | | | $ | (38,628) | | | $ | (535,819) | | | | — | | | $ | (284,694) | |
The Portfolio’s policy is to recognize transfers between levels as of the end of the reporting period.
| * | Amount represents less than $1. |
| 1 | This amount is included in net realized gain (loss) from investment transactions in the accompanying Statement of Operations. |
| 2 | This amount is included in the change in net unrealized appreciation (depreciation) in the accompanying Statement of Operations. Change in unrealized appreciation (depreciation) includes net unrealized appreciation (depreciation) resulting from changes in investment values during the reporting period and the reversal of previously recorded unrealized appreciation (depreciation) when gains or losses are realized. |
| 3 | Transferred out of Level 3 as a result of the availability of a quoted price in an active market for an identical investment or the availability of other significant observable inputs. |
(b) Repurchase agreements. The Portfolio may enter into repurchase agreements with institutions that its subadviser has determined are creditworthy. Each repurchase agreement is recorded at cost. Under the terms of a typical repurchase agreement, the Portfolio acquires a debt security subject to an obligation of the seller to repurchase, and of the Portfolio to resell, the security at an agreed-upon price and time, thereby determining the yield
| | |
| 48 | | Western Asset Core Plus VIT Portfolio 2016 Annual Report |
during the Portfolio’s holding period. When entering into repurchase agreements, it is the Portfolio’s policy that its custodian or a third party custodian, acting on the Portfolio’s behalf, take possession of the underlying collateral securities, the market value of which, at all times, at least equals the principal amount of the repurchase transaction, including accrued interest. To the extent that any repurchase transaction maturity exceeds one business day, the value of the collateral is marked-to-market and measured against the value of the agreement in an effort to ensure the adequacy of the collateral. If the counterparty defaults, the Portfolio generally has the right to use the collateral to satisfy the terms of the repurchase transaction. However, if the market value of the collateral declines during the period in which the Portfolio seeks to assert its rights or if bankruptcy proceedings are commenced with respect to the seller of the security, realization of the collateral by the Portfolio may be delayed or limited.
(c) Securities traded on a to-be-announced basis. The Portfolio may trade securities on a to-be-announced (“TBA”) basis. In a TBA transaction, the Portfolio commits to purchasing or selling securities which have not yet been issued by the issuer and for which specific information, such as the face amount, maturity date and underlying pool of investments in U.S. government agency mortgage pass-through securities, is not announced. Securities purchased on a TBA basis are not settled until they are delivered to the Portfolio. Beginning on the date the Portfolio enters into a TBA transaction, cash, U.S. government securities or other liquid high-grade debt obligations are segregated in an amount equal in value to the purchase price of the TBA security. These securities are subject to market fluctuations and their current value is determined in the same manner as for other securities.
(d) Mortgage dollar rolls. The Portfolio may enter into mortgage dollar rolls in which the Portfolio sells mortgage-backed securities for delivery in the current month, realizing a gain or loss, and simultaneously contracts to repurchase substantially similar (same type, coupon and maturity) securities to settle on a specified future date.
The Portfolio executes its mortgage dollar rolls entirely in the TBA market, whereby the Portfolio makes a forward commitment to purchase a security and, instead of accepting delivery, the position is offset by a sale of the security with a simultaneous agreement to repurchase at a future date. The Portfolio accounts for mortgage dollar rolls as purchases and sales.
The risk of entering into mortgage dollar rolls is that the market value of the securities the Portfolio is obligated to repurchase under the agreement may decline below the repurchase price. In the event the buyer of securities under a mortgage dollar roll files for bankruptcy or becomes insolvent, the Portfolio’s use of the proceeds of the mortgage dollar roll may be restricted pending a determination by the counterparty, or its trustee or receiver, whether to enforce the Portfolio’s obligation to repurchase the securities.
(e) Inflation-indexed bonds. Inflation-indexed bonds are fixed-income securities whose principal value or interest rate is periodically adjusted according to the rate of inflation. As the index measuring inflation changes, the principal value or interest rate of inflation-indexed
| | |
| Western Asset Core Plus VIT Portfolio 2016 Annual Report | | 49 |
Notes to financial statements (cont’d)
bonds will be adjusted accordingly. Inflation adjustments to the principal amount of inflation-indexed bonds are reflected as an increase or decrease to investment income on the Statement of Operations. Repayment of the original bond principal upon maturity (as adjusted for inflation) is guaranteed in the case of U.S. Treasury inflation-indexed bonds. For bonds that do not provide a similar guarantee, the adjusted principal value of the bond repaid at maturity may be less than the original principal.
(f) Foreign currency translation. Investment securities and other assets and liabilities denominated in foreign currencies are translated into U.S. dollar amounts based upon prevailing exchange rates on the date of valuation. Purchases and sales of investment securities and income and expense items denominated in foreign currencies are translated into U.S. dollar amounts based upon prevailing exchange rates on the respective dates of such transactions.
The Portfolio does not isolate that portion of the results of operations resulting from fluctuations in foreign exchange rates on investments from the fluctuations arising from changes in market prices of securities held. Such fluctuations are included with the net realized and unrealized gain or loss on investments.
Net realized foreign exchange gains or losses arise from sales of foreign currencies, including gains and losses on forward foreign currency contracts, currency gains or losses realized between the trade and settlement dates on securities transactions, and the difference between the amounts of dividends, interest, and foreign withholding taxes recorded on the Portfolio’s books and the U.S. dollar equivalent of the amounts actually received or paid. Net unrealized foreign exchange gains and losses arise from changes in the values of assets and liabilities, other than investments in securities, on the date of valuation, resulting from changes in exchange rates.
Foreign security and currency transactions may involve certain considerations and risks not typically associated with those of U.S. dollar denominated transactions as a result of, among other factors, the possibility of lower levels of governmental supervision and regulation of foreign securities markets and the possibility of political or economic instability.
(g) Forward foreign currency contracts. The Portfolio enters into a forward foreign currency contract to hedge against foreign currency exchange rate risk on its non-U.S. dollar denominated securities or to facilitate settlement of a foreign currency denominated portfolio transaction. A forward foreign currency contract is an agreement between two parties to buy and sell a currency at a set price with delivery and settlement at a future date. The contract is marked-to-market daily and the change in value is recorded by the Portfolio as an unrealized gain or loss. When a forward foreign currency contract is closed, through either delivery or offset by entering into another forward foreign currency contract, the Portfolio recognizes a realized gain or loss equal to the difference between the value of the contract at the time it was opened and the value of the contract at the time it is closed.
Forward foreign currency contracts involve elements of market risk in excess of the amounts reflected on the Statement of Assets and Liabilities. The Portfolio bears the risk of an
| | |
| 50 | | Western Asset Core Plus VIT Portfolio 2016 Annual Report |
unfavorable change in the foreign exchange rate underlying the forward foreign currency contract. Risks may also arise upon entering into these contracts from the potential inability of the counterparties to meet the terms of their contracts.
(h) Swap agreements. The Portfolio invests in swaps for the purpose of managing its exposure to interest rate, credit or market risk, or for other purposes. The use of swaps involves risks that are different from those associated with other portfolio transactions. Swap agreements are privately negotiated in the over-the-counter market and may be entered into as a bilateral contract (“OTC Swaps”) or centrally cleared (“Centrally Cleared Swaps”). Unlike Centrally Cleared Swaps, the Portfolio has credit exposure to the counterparties of OTC Swaps.
In a Centrally Cleared Swap, immediately following execution of the swap, the swap agreement is submitted to a clearinghouse or central counterparty (the “CCP”) and the CCP becomes the ultimate counterparty of the swap agreement. The Portfolio is required to interface with the CCP through a broker, acting in an agency capacity. All payments are settled with the CCP through the broker. Upon entering into a Centrally Cleared Swap, the Portfolio is required to deposit initial margin with the broker in the form of cash or securities.
Swap contracts are marked-to-market daily and changes in value are recorded as unrealized appreciation (depreciation). The daily change in valuation of Centrally Cleared Swaps, if any, is recorded as a receivable or payable for variation margin on the Statement of Assets and Liabilities. Gains or losses are realized upon termination of the swap agreement. Collateral, in the form of restricted cash or securities, may be required to be held in segregated accounts with the Portfolio’s custodian in compliance with the terms of the swap contracts. Securities posted as collateral for swap contracts are identified in the Schedule of Investments and restricted cash, if any, is identified on the Statement of Assets and Liabilities. Risks may exceed amounts recorded in the Statement of Assets and Liabilities. These risks include changes in the returns of the underlying instruments, failure of the counterparties to perform under the contracts’ terms, and the possible lack of liquidity with respect to the swap agreements.
OTC swap payments received or made at the beginning of the measurement period are reflected as a premium or deposit, respectively, on the Statement of Assets and Liabilities. These upfront payments are amortized over the life of the swap and are recognized as realized gain or loss in the Statement of Operations. Net periodic payments received or paid by the Portfolio are recognized as a realized gain or loss in the Statement of Operations.
The Portfolio’s maximum exposure in the event of a defined credit event on a credit default swap to sell protection is the notional amount. As of December 31, 2016, the Portfolio did not hold any credit default swaps to sell protection.
For average notional amounts of swaps held during the year ended December 31, 2016, see Note 4.
| | |
| Western Asset Core Plus VIT Portfolio 2016 Annual Report | | 51 |
Notes to financial statements (cont’d)
Credit default swaps
The Portfolio enters into credit default swap (“CDS”) contracts for investment purposes, to manage its credit risk or to add leverage. CDS agreements involve one party making a stream of payments to another party in exchange for the right to receive a specified return in the event of a default by a third party, typically corporate or sovereign issuers, on a specified obligation, or in the event of a write-down, principal shortfall, interest shortfall or default of all or part of the referenced entities comprising a credit index. The Portfolio may use a CDS to provide protection against defaults of the issuers (i.e., to reduce risk where the Portfolio has exposure to an issuer) or to take an active long or short position with respect to the likelihood of a particular issuer’s default. As a seller of protection, the Portfolio generally receives an upfront payment or a stream of payments throughout the term of the swap provided that there is no credit event. If the Portfolio is a seller of protection and a credit event occurs, as defined under the terms of that particular swap agreement, the maximum potential amount of future payments (undiscounted) that the Portfolio could be required to make under a credit default swap agreement would be an amount equal to the notional amount of the agreement. These amounts of potential payments will be partially offset by any recovery of values from the respective referenced obligations. As a seller of protection, the Portfolio effectively adds leverage to its portfolio because, in addition to its total net assets, the Portfolio is subject to investment exposure on the notional amount of the swap. As a buyer of protection, the Portfolio generally receives an amount up to the notional value of the swap if a credit event occurs.
Implied spreads are the theoretical prices a lender receives for credit default protection. When spreads rise, market perceived credit risk rises and when spreads fall, market perceived credit risk falls. The implied credit spread of a particular referenced entity reflects the cost of buying/selling protection and may include upfront payments required to enter into the agreement. Wider credit spreads and decreasing market values, when compared to the notional amount of the swap, represent a deterioration of the referenced entity’s credit soundness and a greater likelihood or risk of default or other credit event occurring as defined under the terms of the agreement. Credit spreads utilized in determining the period end market value of credit default swap agreements on corporate or sovereign issues are disclosed in the Notes to Financial Statements and serve as an indicator of the current status of the payment/performance risk and represent the likelihood or risk of default for credit derivatives. For credit default swap agreements on asset-backed securities and credit indices, the quoted market prices and resulting values, particularly in relation to the notional amount of the contract as well as the annual payment rate, serve as an indication of the current status of the payment/performance risk.
The Portfolio’s maximum risk of loss from counterparty risk, as the protection buyer, is the fair value of the contract (this risk is mitigated by the posting of collateral by the counterparty to the Portfolio to cover the Portfolio’s exposure to the counterparty). As the protection seller, the Portfolio’s maximum risk is the notional amount of the contract. Credit default swaps are considered to have credit risk-related contingent features since they require payment by the protection seller to the protection buyer upon the occurrence of a defined credit event.
| | |
| 52 | | Western Asset Core Plus VIT Portfolio 2016 Annual Report |
Entering into a CDS agreement involves, to varying degrees, elements of credit, market and documentation risk in excess of the related amounts recognized on the Statement of Assets and Liabilities. Such risks involve the possibility that there will be no liquid market for these agreements, that the counterparty to the agreement may default on its obligation to perform or disagree as to the meaning of the contractual terms in the agreement, and that there will be unfavorable changes in net interest rates.
Interest rate swaps
The Portfolio enters into interest rate swap contracts to manage its exposure to interest rate risk. Interest rate swaps are agreements between two parties to exchange cash flows based on a notional principal amount. The Portfolio may elect to pay a fixed rate and receive a floating rate, or receive a fixed rate and pay a floating rate, on a notional principal amount. Interest rate swaps are marked-to-market daily based upon quotations from market makers and the change, if any, is recorded as an unrealized gain or loss in the Statement of Operations. When a swap contract is terminated early, the Portfolio records a realized gain or loss equal to the difference between the original cost and the settlement amount of the closing transaction.
The risks of interest rate swaps include changes in market conditions that will affect the value of the contract or changes in the present value of the future cash flow streams and the possible inability of the counterparty to fulfill its obligations under the agreement. The Portfolio’s maximum risk of loss from counterparty credit risk is the discounted net value of the cash flows to be received from the counterparty over the contract’s remaining life, to the extent that amount is positive. This risk is mitigated by the posting of collateral by the counterparty to the Portfolio to cover the Portfolio’s exposure to the counterparty.
(i) Purchased options. When the Portfolio purchases an option, an amount equal to the premium paid by the Portfolio is recorded as an investment on the Statement of Assets and Liabilities, the value of which is marked-to-market to reflect the current market value of the option purchased. If the purchased option expires, the Portfolio realizes a loss equal to the amount of premium paid. When an instrument is purchased or sold through the exercise of an option, the related premium paid is added to the basis of the instrument acquired or deducted from the proceeds of the instrument sold. The risk associated with purchasing put and call options is limited to the premium paid.
(j) Written options. When the Portfolio writes an option, an amount equal to the premium received by the Portfolio is recorded as a liability, the value of which is marked-to-market daily to reflect the current market value of the option written. If the option expires, the premium received is recorded as a realized gain. When a written call option is exercised, the difference between the premium received plus the option exercise price and the Portfolio’s basis in the underlying security (in the case of a covered written call option), or the cost to purchase the underlying security (in the case of an uncovered written call option), including brokerage commission, is recognized as a realized gain or loss. When a written put option is exercised, the amount of the premium received is subtracted from the cost of the security purchased by the Portfolio from the exercise of the
| | |
| Western Asset Core Plus VIT Portfolio 2016 Annual Report | | 53 |
Notes to financial statements (cont’d)
written put option to form the Portfolio’s basis in the underlying security purchased. The writer or buyer of an option traded on an exchange can liquidate the position before the exercise of the option by entering into a closing transaction. The cost of a closing transaction is deducted from the original premium received resulting in a realized gain or loss to the Portfolio.
The risk in writing a covered call option is that the Portfolio may forego the opportunity of profit if the market price of the underlying security increases and the option is exercised. The risk in writing a put option is that the Portfolio may incur a loss if the market price of the underlying security decreases and the option is exercised. The risk in writing an uncovered call option is that the Portfolio is exposed to the risk of loss if the market price of the underlying security increases. In addition, there is the risk that the Portfolio may not be able to enter into a closing transaction because of an illiquid secondary market.
(k) Futures contracts. The Portfolio uses futures contracts generally to gain exposure to, or hedge against, changes in interest rates or gain exposure to, or hedge against, changes in certain asset classes. A futures contract represents a commitment for the future purchase or sale of an asset at a specified price on a specified date.
Upon entering into a futures contract, the Portfolio is required to deposit cash or cash equivalents with a broker in an amount equal to a certain percentage of the contract amount. This is known as the ‘‘initial margin’’ and subsequent payments (‘‘variation margin’’) are made or received by the Portfolio each day, depending on the daily fluctuation in the value of the contract. For certain futures, including foreign denominated futures, variation margin is not settled daily, but is recorded as a net variation margin payable or receivable. The daily changes in contract value are recorded as unrealized gains or losses in the Statement of Operations and the Portfolio recognizes a realized gain or loss when the contract is closed.
Futures contracts involve, to varying degrees, risk of loss in excess of the amounts reflected in the financial statements. In addition, there is the risk that the Portfolio may not be able to enter into a closing transaction because of an illiquid secondary market.
(l) Options on futures contracts. An option on a futures contract gives the purchaser the right, in return for the premium paid, to assume a position in the underlying futures contract at the specified option exercise price at any time prior to the expiration date of the option. Upon exercise of an option, the delivery of the futures position by the writer of the option to the holder of the option will be accompanied by delivery of the accumulated balance in the writer’s futures margin account that represents the amount by which the market price of the futures contract exceeds (in the case of a call) or is less than (in the case of a put) the exercise price of the option on the futures contract. The potential for loss related to the purchase of an option on a futures contract is limited to the premium paid for the option plus transaction costs. Because the value of the option is fixed at the point of purchase, there are no daily cash payments by the purchaser to reflect changes in the value of the underlying contract; however, the value of the option changes daily and that change would
| | |
| 54 | | Western Asset Core Plus VIT Portfolio 2016 Annual Report |
be reflected in the net asset value of the Portfolio. The potential for loss related to writing call options is unlimited. The potential for loss related to writing put options is limited only by the aggregate strike price of the put option less the premium received.
(m) Swaptions. The Portfolio purchases or writes swaptions to manage exposure to an underlying instrument. The Portfolio may also purchase or write swaptions to manage exposure to fluctuations in interest rates or to enhance yield. Swaption contracts written by the Portfolio represent an option that gives the purchaser the right, but not the obligation, to enter into a previously agreed upon swap contract at a future date. Swaption contracts purchased by the Portfolio represent an option that gives the Portfolio the right, but not the obligation, to enter into a previously agreed upon swap contract at a future date.
When the Portfolio writes a swaption, an amount equal to the premium received by the Portfolio is recorded as a liability, the value of which is marked-to-market daily to reflect the current market value of the swaption written. If the swaption expires, the Portfolio realizes a gain equal to the amount of the premium received.
When the Portfolio purchases a swaption, an amount equal to the premium paid by the Portfolio is recorded as an investment on the Statement of Assets and Liabilities, the value of which is marked-to-market daily to reflect the current market value of the swaption purchased. If the swaption expires, the Portfolio realizes a loss equal to the amount of the premium paid.
Swaptions are marked-to-market daily based upon quotations from market makers. Changes in the value of the swaption are reported as unrealized gains or losses in the Statement of Operations.
(n) Stripped securities. The Portfolio may invest in ‘‘Stripped Securities,’’ a term used collectively for components, or strips, of fixed income securities. Stripped Securities can be principal only securities (“PO”), which are debt obligations that have been stripped of unmatured interest coupons, or interest only securities (“IO”), which are unmatured interest coupons that have been stripped from debt obligations. The market value of Stripped Securities will fluctuate in response to changes in economic conditions, rates of pre-payment, interest rates and the market’s perception of the securities. However, fluctuations in response to interest rates may be greater in Stripped Securities than for debt obligations of comparable maturities that pay interest currently. The amount of fluctuation may increase with a longer period of maturity.
The yield to maturity on IO’s is sensitive to the rate of principal repayments (including prepayments) on the related underlying debt obligation and principal payments may have a material effect on yield to maturity. If the underlying debt obligation experiences greater than anticipated prepayments of principal, the Portfolio may not fully recoup its initial investment in IO’s.
(o) Loan participations. The Portfolio may invest in loans arranged through private negotiation between one or more financial institutions. The Portfolio’s investment in any
| | |
| Western Asset Core Plus VIT Portfolio 2016 Annual Report | | 55 |
Notes to financial statements (cont’d)
such loan may be in the form of a participation in or an assignment of the loan. In connection with purchasing participations, the Portfolio generally will have no right to enforce compliance by the borrower with the terms of the loan agreement related to the loan, or any rights of off-set against the borrower and the Portfolio may not benefit directly from any collateral supporting the loan in which it has purchased the participation.
The Portfolio assumes the credit risk of the borrower, the lender that is selling the participation and any other persons interpositioned between the Portfolio and the borrower. In the event of the insolvency of the lender selling the participation, the Portfolio may be treated as a general creditor of the lender and may not benefit from any off-set between the lender and the borrower.
(p) Unfunded loan commitments. The Portfolio may enter into certain credit agreements where all or a portion of which may be unfunded. The Portfolio is obligated to fund these commitments at the borrower’s discretion. The commitments are disclosed in the accompanying Schedule of Investments. At December 31, 2016, the Portfolio had sufficient cash and/or securities to cover these commitments.
(q) Credit and market risk. The Portfolio invests in high-yield and emerging market instruments that are subject to certain credit and market risks. The yields of high-yield and emerging market debt obligations reflect, among other things, perceived credit and market risks. The Portfolio’s investments in securities rated below investment grade typically involve risks not associated with higher rated securities including, among others, greater risk related to timely and ultimate payment of interest and principal, greater market price volatility and less liquid secondary market trading. The consequences of political, social, economic or diplomatic changes may have disruptive effects on the market prices of investments held by the Portfolio. The Portfolio’s investments in non-U.S. dollar denominated securities may also result in foreign currency losses caused by devaluations and exchange rate fluctuations.
Investments in securities that are collateralized by real estate mortgages are subject to certain credit and liquidity risks. When market conditions result in an increase in default rates of the underlying mortgages and the foreclosure values of underlying real estate properties are materially below the outstanding amount of these underlying mortgages, collection of the full amount of accrued interest and principal on these investments may be doubtful. Such market conditions may significantly impair the value and liquidity of these investments and may result in a lack of correlation between their credit ratings and values.
(r) Foreign investment risks. The Portfolio’s investments in foreign securities may involve risks not present in domestic investments. Since securities may be denominated in foreign currencies, may require settlement in foreign currencies or pay interest or dividends in foreign currencies, changes in the relationship of these foreign currencies to the U.S. dollar can significantly affect the value of the investments and earnings of the Portfolio. Foreign investments may also subject the Portfolio to foreign government exchange restrictions, expropriation, taxation or other political, social or economic developments, all of which affect the market and/or credit risk of the investments.
| | |
| 56 | | Western Asset Core Plus VIT Portfolio 2016 Annual Report |
(s) Counterparty risk and credit-risk-related contingent features of derivative instruments. The Portfolio may invest in certain securities or engage in other transactions, where the Portfolio is exposed to counterparty credit risk in addition to broader market risks. The Portfolio may invest in securities of issuers, which may also be considered counterparties as trading partners in other transactions. This may increase the risk of loss in the event of default or bankruptcy by the counterparty or if the counterparty otherwise fails to meet its contractual obligations. The Portfolio’s subadviser attempts to mitigate counterparty risk by (i) periodically assessing the creditworthiness of its trading partners, (ii) monitoring and/or limiting the amount of its net exposure to each individual counterparty based on its assessment and (iii) requiring collateral from the counterparty for certain transactions. Market events and changes in overall economic conditions may impact the assessment of such counterparty risk by the subadviser. In addition, declines in the values of underlying collateral received may expose the Portfolio to increased risk of loss.
The Portfolio has entered into master agreements with certain of its derivative counterparties that provide for general obligations, representations, agreements, collateral, events of default or termination and credit related contingent features. The credit related contingent features include, but are not limited to, a percentage decrease in the Portfolio’s net assets or NAV over a specified period of time. If these credit related contingent features were triggered, the derivatives counterparty could terminate the positions and demand payment or require additional collateral.
Collateral requirements differ by type of derivative. Collateral or margin requirements are set by the broker or exchange clearing house for exchange traded derivatives while collateral terms are contract specific for over-the-counter traded derivatives. Cash collateral that has been pledged to cover obligations of the Portfolio under derivative contracts, if any, will be reported separately in the Statement of Assets and Liabilities. Securities pledged as collateral, if any, for the same purpose are noted in the Schedule of Investments.
Absent an event of default by the counterparty or a termination of the agreement, the terms of the master agreements do not result in an offset of reported amounts of financial assets and financial liabilities in the Statement of Assets and Liabilities across transactions between the Portfolio and the applicable counterparty. The enforceability of the right to offset may vary by jurisdiction.
As of December 31, 2016, the Portfolio held written options and forward foreign currency contracts with credit related contingent features which had a liability position of $973,174. If a contingent feature in the master agreements would have been triggered, the Portfolio would have been required to pay this amount to its derivatives counterparties.
(t) Security transactions and investment income. Security transactions are accounted for on a trade date basis. Interest income, adjusted for amortization of premium and accretion of discount, is recorded on the accrual basis. Paydown gains and losses on mortgage and asset-backed securities are recorded as adjustments to interest income. Dividend income is recorded on the ex-dividend date. Foreign dividend income is recorded on the ex-dividend date or as soon as practicable after the Portfolio determines the existence of a dividend declaration after exercising reasonable due diligence. The cost of
| | |
| Western Asset Core Plus VIT Portfolio 2016 Annual Report | | 57 |
Notes to financial statements (cont’d)
investments sold is determined by use of the specific identification method. To the extent any issuer defaults or a credit event occurs that impacts the issuer, the Portfolio may halt any additional interest income accruals and consider the realizability of interest accrued up to the date of default or credit event.
(u) Distributions to shareholders. Distributions from net investment income and distributions of net realized gains, if any, are declared at least annually. Distributions to shareholders of the Portfolio are recorded on the ex-dividend date and are determined in accordance with income tax regulations, which may differ from GAAP.
(v) Share class accounting. Investment income, common expenses and realized/unrealized gains (losses) on investments are allocated to the various classes of the Portfolio on the basis of daily net assets of each class. Fees relating to a specific class are charged directly to that share class.
(w) Compensating balance arrangements. The Portfolio has an arrangement with its custodian bank whereby a portion of the custodian’s fees is paid indirectly by credits earned on the Portfolio’s cash on deposit with the bank.
(x) Federal and other taxes. It is the Portfolio’s policy to comply with the federal income and excise tax requirements of the Internal Revenue Code of 1986 (the “Code”), as amended, applicable to regulated investment companies. Accordingly, the Portfolio intends to distribute its taxable income and net realized gains, if any, to shareholders in accordance with timing requirements imposed by the Code. Therefore, no federal or state income tax provision is required in the Portfolio’s financial statements.
Management has analyzed the Portfolio’s tax positions taken on income tax returns for all open tax years and has concluded that as of December 31, 2016, no provision for income tax is required in the Portfolio’s financial statements. The Portfolio’s federal and state income and federal excise tax returns for tax years for which the applicable statutes of limitations have not expired are subject to examination by the Internal Revenue Service and state departments of revenue.
Under the applicable foreign tax laws, a withholding tax may be imposed on interest, dividends and capital gains at various rates.
(y) Reclassification. GAAP requires that certain components of net assets be reclassified to reflect permanent differences between financial and tax reporting. These reclassifications have no effect on net assets or net asset value per share. During the current year, the following reclassifications have been made:
| | | | | | | | | | | | |
| | | Overdistributed Net
Investment Income | | | Accumulated Net
Realized Loss | | | Paid-in
Capital | |
| (a) | | | — | | | $ | 13,304,041 | | | $ | (13,304,041) | |
| (b) | | $ | 1,050,887 | | | | (1,050,887) | | | | — | |
| (a) | Reclassifications are due to the expiration of a capital loss carryforward. |
| (b) | Reclassifications are due to foreign currency transactions treated as ordinary income for tax purposes, differences between book and tax amortization of premium on fixed income securities, losses from mortgage backed securities treated as capital losses for tax purposes, book/tax differences in the treatment of inflation-indexed bonds, book/tax differences in the treatment of swap contracts and book/tax differences in the treatment of partnership investments. |
| | |
| 58 | | Western Asset Core Plus VIT Portfolio 2016 Annual Report |
2. Investment management agreement and other transactions with affiliates
Legg Mason Partners Fund Advisor, LLC (“LMPFA”) is the Portfolio’s investment manager. Western Asset Management Company (“Western Asset”), Western Asset Management Company Limited (“Western Asset Limited”), Western Asset Management Company Pte. Ltd. in Singapore (“Western Singapore”) and Western Asset Management Company Ltd. in Japan (“Western Japan”) are the Portfolio’s subadvisers. LMPFA, Western Asset, Western Asset Limited, Western Singapore and Western Japan are wholly-owned subsidiaries of Legg Mason, Inc. (“Legg Mason”).
Under the investment management agreement, the Portfolio pays a management fee, calculated daily and paid monthly at an annual rate of 0.45% of the first $500 million, 0.425% of the next $500 million and 0.40% of assets over $1 billion of its average daily net assets.
LMPFA provides administrative and certain oversight services to the Portfolio. LMPFA delegates to the subadvisers the day-to-day portfolio management of the Portfolio. Western Asset Limited, Western Asset Japan and Western Asset Singapore provide certain subadvisory services related to currency transactions and investments in non-U.S. dollar denominated securities and related foreign currency instruments. For its services, LMPFA pays Western Asset monthly 70% of the net management fee it receives from the Portfolio. In turn, Western Asset pays Western Asset Limited, Western Singapore and Western Japan a subadvisory fee of 0.30% on the assets managed by Western Asset Limited, Western Singapore and Western Japan.
As a result of expense limitation arrangements between the Portfolio and LMPFA, the ratio of total annual fund operating expenses, other than interest, brokerage, taxes, extraordinary expenses and acquired fund fees and expenses, to average net assets of Class I and Class II shares did not exceed 0.54% and 0.79%, respectively. These expense limitation arrangements cannot be terminated prior to December 31, 2018 without the Board of Trustees’ consent.
LMPFA is permitted to recapture amounts waived and/or reimbursed to a class during the same fiscal year if the class’ total annual operating expenses have fallen to a level below the expense limitation (“expense cap”) in effect at the time the fees were earned or the expenses incurred. In no case will LMPFA recapture any amount that would result, on any particular business day of the Portfolio, in the class’ total annual operating expenses exceeding the expense cap or any other lower limit then in effect.
Legg Mason Investor Services, LLC, a wholly-owned broker-dealer subsidiary of Legg Mason, serves as the Portfolio’s sole and exclusive distributor.
All officers and one Trustee of the Trust are employees of Legg Mason or its affiliates and do not receive compensation from the Trust.
| | |
| Western Asset Core Plus VIT Portfolio 2016 Annual Report | | 59 |
Notes to financial statements (cont’d)
3. Investments
During the year ended December 31, 2016, the aggregate cost of purchases and proceeds from sales of investments (excluding short-term investments) and U.S. Government & Agency Obligations were as follows:
| | | | | | | | |
| | | Investments | | | U.S. Government &
Agency Obligations | |
| Purchases | | $ | 178,804,680 | | | $ | 1,401,753,469 | |
| Sales | | | 67,607,433 | | | | 1,299,751,112 | |
At December 31, 2016, the aggregate gross unrealized appreciation and depreciation of investments for federal income tax purposes were as follows:
| | | | |
| Gross unrealized appreciation | | $ | 6,153,368 | |
| Gross unrealized depreciation | | | (20,972,761) | |
| Net unrealized depreciation | | $ | (14,819,393) | |
At December 31, 2016, the Portfolio had the following open futures contracts:
| | | | | | | | | | | | | | | | | | | | |
| | | Number of
Contracts | | | Expiration
Date | | | Basis
Value | | | Market
Value | | | Unrealized
Appreciation
(Depreciation) | |
| Contracts to Buy: | | | | | | | | | | | | | | | | | | | | |
| Euro BTP | | | 99 | | | | 3/17 | | | $ | 13,896,021 | | | $ | 14,100,979 | | | $ | 204,958 | |
| U.S. Treasury 2-Year Notes | | | 350 | | | | 3/17 | | | | 75,912,857 | | | | 75,840,625 | | | | (72,232) | |
| U.S. Treasury 5-Year Notes | | | 1,127 | | | | 3/17 | | | | 132,928,757 | | | | 132,607,399 | | | | (321,358) | |
| U.S. Treasury 10-Year Notes | | | 236 | | | | 3/17 | | | | 29,313,580 | | | | 29,330,375 | | | | 16,795 | |
| | | | | | | | | | | | | | | | | | | | (171,837) | |
| Contracts to Sell: | | | | | | | | | | | | | | | | | | | | |
| 90-Day Eurodollar | | | 657 | | | | 3/17 | | | | 162,556,215 | | | | 162,541,800 | | | | 14,415 | |
| Euro-Bund | | | 133 | | | | 3/17 | | | | 22,674,954 | | | | 22,981,411 | | | | (306,457) | |
| Japanese 10-Year Bonds | | | 4 | | | | 3/17 | | | | 5,142,561 | | | | 5,141,904 | | | | 657 | |
| U.S. Treasury 10-Year Notes | | | 144 | | | | 3/17 | | | | 19,405,454 | | | | 19,305,000 | | | | 100,454 | |
| U.S. Treasury Long-Term Bonds | | | 9 | | | | 3/17 | | | | 1,342,471 | | | | 1,355,906 | | | | (13,435) | |
| U.S. Treasury Ultra Long-Term Bonds | | | 139 | | | | 3/17 | | | | 22,520,306 | | | | 22,274,750 | | | | 245,556 | |
| | | | | | | | | | | | | | | | | | | | 41,190 | |
| Net unrealized depreciation on open futures contracts | | | $ | (130,647) | |
During the year ended December 31, 2016, written option transactions for the Portfolio were as follows:
| | | | | | | | |
| | | Number of Contracts/
Notional Amount | | | Premiums | |
| Written options, outstanding as of December 31, 2015 | | | 2,071,076 | | | $ | 244,882 | |
| Options written | | | 22,311,031 | | | | 2,621,162 | |
| Options closed | | | (2,803,174) | | | | (1,336,645) | |
| Options exercised | | | — | | | | — | |
| Options expired | | | (12,518,263) | | | | (1,192,718) | |
| Written options, outstanding as of December 31, 2016 | | | 9,060,670 | | | $ | 336,681 | |
| | |
| 60 | | Western Asset Core Plus VIT Portfolio 2016 Annual Report |
At December 31, 2016, the Portfolio had the following open forward foreign currency contracts:
| | | | | | | | | | | | | | | | | | | | |
Currency
Purchased | | | Currency
Sold | | | Counterparty | | Settlement
Date | | | Unrealized
Appreciation
(Depreciation) | |
| IDR | | | 14,865,470,000 | | | USD | | | 1,130,196 | | | Bank of America N.A. | | | 1/20/17 | | | $ | (29,212) | |
| USD | | | 1,144,841 | | | GBP | | | 909,304 | | | Bank of America N.A. | | | 1/20/17 | | | | 23,679 | |
| GBP | | | 1,960,000 | | | USD | | | 2,435,378 | | | Barclays Bank PLC | | | 1/20/17 | | | | (18,719) | |
| USD | | | 6,235,285 | | | CNY | | | 42,004,000 | | | Barclays Bank PLC | | | 1/20/17 | | | | 195,075 | |
| GBP | | | 563,000 | | | USD | | | 701,607 | | | Citibank N.A. | | | 1/20/17 | | | | (7,434) | |
| IDR | | | 29,832,390,000 | | | USD | | | 2,261,743 | | | Citibank N.A. | | | 1/20/17 | | | | (52,261) | |
| INR | | | 101,210,000 | | | USD | | | 1,497,411 | | | Citibank N.A. | | | 1/20/17 | | | | (8,422) | |
| INR | | | 124,640,000 | | | USD | | | 1,846,245 | | | Citibank N.A. | | | 1/20/17 | | | | (12,557) | |
| JPY | | | 355,510,267 | | | USD | | | 3,431,033 | | | Citibank N.A. | | | 1/20/17 | | | | (386,228) | |
| PLN | | | 8,280,000 | | | USD | | | 2,120,306 | | | Citibank N.A. | | | 1/20/17 | | | | (142,253) | |
| USD | | | 855 | | | CAD | | | 1,125 | | | Citibank N.A. | | | 1/20/17 | | | | 17 | |
| USD | | | 3,855,904 | | | CNY | | | 26,010,000 | | | Citibank N.A. | | | 1/20/17 | | | | 115,644 | |
| USD | | | 1,585,895 | | | CNY | | | 10,900,000 | | | Citibank N.A. | | | 1/20/17 | | | | 18,466 | |
| USD | | | 1,127,979 | | | EUR | | | 1,004,952 | | | Citibank N.A. | | | 1/20/17 | | | | 69,149 | |
| USD | | | 298,652 | | | EUR | | | 270,000 | | | Citibank N.A. | | | 1/20/17 | | | | 14,177 | |
| USD | | | 830,115 | | | EUR | | | 750,000 | | | Citibank N.A. | | | 1/20/17 | | | | 39,906 | |
| USD | | | 244,992 | | | EUR | | | 220,000 | | | Citibank N.A. | | | 1/20/17 | | | | 13,197 | |
| USD | | | 110,774 | | | EUR | | | 100,000 | | | Citibank N.A. | | | 1/20/17 | | | | 5,413 | |
| USD | | | 149,296 | | | EUR | | | 140,000 | | | Citibank N.A. | | | 1/20/17 | | | | 1,790 | |
| USD | | | 10,276,915 | | | JPY | | | 1,059,077,223 | | | Citibank N.A. | | | 1/20/17 | | | | 1,206,338 | |
| USD | | | 1,573,782 | | | JPY | | | 167,126,341 | | | Citibank N.A. | | | 1/20/17 | | | | 142,411 | |
| USD | | | 1,814,428 | | | MXN | | | 35,450,834 | | | Citibank N.A. | | | 1/20/17 | | | | 108,195 | |
| USD | | | 2,153,964 | | | PLN | | | 8,280,000 | | | Citibank N.A. | | | 1/20/17 | | | | 175,911 | |
| USD | | | 3,435,380 | | | JPY | | | 355,510,267 | | | Goldman Sachs Group Inc. | | | 1/20/17 | | | | 390,575 | |
| MXN | | | 26,740,000 | | | USD | | | 1,369,470 | | | JPMorgan Chase & Co. | | | 1/20/17 | | | | (82,486) | |
| USD | | | 1,961,148 | | | GBP | | | 1,588,000 | | | Bank of America N.A. | | | 2/13/17 | | | | 2,093 | |
| EUR | | | 4,995 | | | USD | | | 5,383 | | | Citibank N.A. | | | 2/13/17 | | | | (115) | |
| USD | | | 3,993,309 | | | EUR | | | 3,592,333 | | | Citibank N.A. | | | 2/13/17 | | | | 204,376 | |
| MXN | | | 19,360,730 | | | USD | | | 917,792 | | | Citibank N.A. | | | 2/16/17 | | | | 10,707 | |
| Total | | | | | | | | | | | | | | | | | | $ | 1,997,432 | |
| | |
Abbreviations used in this table: |
| CAD | | — Canadian Dollar |
| CNY | | — Chinese Yuan Renminbi |
| EUR | | — Euro |
| GBP | | — British Pound |
| IDR | | — Indonesian Rupiah |
| INR | | — Indian Rupee |
| JPY | | — Japanese Yen |
| MXN | | — Mexican Peso |
| PLN | | — Polish Zloty |
| USD | | — United States Dollar |
| | |
| Western Asset Core Plus VIT Portfolio 2016 Annual Report | | 61 |
Notes to financial statements (cont’d)
At December 31, 2016, the Portfolio had the following open swap contracts:
| | | | | | | | | | | | | | | | | | | | | | |
| CENTRALLY CLEARED INTEREST RATE SWAPS | |
| Central Counterparty | | Notional
Amount | | | Termination
Date | | | Payments
Made by
the Portfolio† | | Payments
Received by
the Portfolio† | | | Upfront
Premiums
Paid
(Received) | | | Unrealized
Appreciation
(Depreciation) | |
| Chicago Mercantile Exchange | | $ | 7,100,000 | | | | 6/13/21 | | | 1.185% semi-annually | | | 3-Month LIBOR quarterly | | | | — | | | $ | (221,326) | |
| Chicago Mercantile Exchange | | | 3,600,000 | | | | 8/31/22 | | | 1.897% semi-annually | | | 3-Month LIBOR quarterly | | | | — | | | | 28,607 | |
| Chicago Mercantile Exchange | | | 36,704,000 | | | | 11/30/22 | | | 1.900% semi-annually | | | 3-Month LIBOR quarterly | | | | — | | | | 355,494 | |
| Chicago Mercantile Exchange | | | 39,808,000 | | | | 5/15/23 | | | 1.267% semi-annually | | | 3-Month LIBOR quarterly | | | $ | 911,469 | | | | 1,128,801 | |
| Chicago Mercantile Exchange | | | 7,080,000 | | | | 6/13/26 | | | 1.580% semi-annually | | | 3-Month LIBOR quarterly | | | | 947 | | | | 457,279 | |
| Total | | $ | 94,292,000 | | | | | | | | | | | | | $ | 912,416 | | | $ | 1,748,855 | |
| † | Percentage shown is an annual percentage rate. |
4. Derivative instruments and hedging activities
Below is a table, grouped by derivative type, that provides information about the fair value and the location of derivatives within the Statement of Assets and Liabilities at December 31, 2016.
| | | | | | | | | | | | |
| ASSET DERIVATIVES1 | |
| | | Interest
Rate Risk | | | Foreign
Exchange Risk | | | Total | |
| Purchased options2 | | $ | 37,735 | | | $ | 198,102 | | | $ | 235,837 | |
| Futures contracts3 | | | 582,835 | | | | — | | | | 582,835 | |
| Centrally cleared swap contracts4 | | | 1,970,181 | | | | — | | | | 1,970,181 | |
| Forward foreign currency contracts | | | — | | | | 2,737,119 | | | | 2,737,119 | |
| Total | | $ | 2,590,751 | | | $ | 2,935,221 | | | $ | 5,525,972 | |
| | | | | | | | | | | | |
| LIABILITY DERIVATIVES1 | |
| | | Interest
Rate Risk | | | Foreign
Exchange Risk | | | Total | |
| Written options | | $ | 216,992 | | | $ | 16,495 | | | $ | 233,487 | |
| Futures contracts3 | | | 713,482 | | | | — | | | | 713,482 | |
| Centrally cleared swap contracts4 | | | 221,326 | | | | — | | | | 221,326 | |
| Forward foreign currency contracts | | | — | | | | 739,687 | | | | 739,687 | |
| Total | | $ | 1,151,800 | | | $ | 756,182 | | | $ | 1,907,982 | |
| 1 | Generally, the balance sheet location for asset derivatives is receivables/net unrealized appreciation (depreciation) and for liability derivatives is payables/net unrealized appreciation (depreciation). |
| 2 | Market value of purchased options is reported in Investments at value in the Statement of Assets and Liabilities. |
| 3 | Includes cumulative appreciation (depreciation) of futures contracts as reported in the footnotes. Only variation margin is reported within the receivables and/or payables on the Statement of Assets and Liabilities. |
| 4 | Includes cumulative appreciation (depreciation) of centrally cleared swap contracts as reported in the footnotes. Only variation margin is reported within the receivables and/or payables on the Statement of Assets and Liabilities. |
| | |
| 62 | | Western Asset Core Plus VIT Portfolio 2016 Annual Report |
The following tables provide information about the effect of derivatives and hedging activities on the Portfolio’s Statement of Operations for the year ended December 31, 2016. The first table provides additional detail about the amounts and sources of gains (losses) realized on derivatives during the period. The second table provides additional information about the change in unrealized appreciation (depreciation) resulting from the Portfolio’s derivatives and hedging activities during the period.
| | | | | | | | | | | | | | | | |
| AMOUNT OF REALIZED GAIN (LOSS) ON DERIVATIVES RECOGNIZED | |
| | | Interest
Rate Risk | | | Foreign
Exchange Risk | | | Credit
Risk | | | Total | |
| Purchased options1 | | $ | (2,028,427) | | | $ | (620,307) | | | $ | (21,019) | | | $ | (2,669,753) | |
| Futures contracts | | | 3,904,540 | | | | — | | | | — | | | | 3,904,540 | |
| Written options | | | 1,527,181 | | | | 260,861 | | | | — | | | | 1,788,042 | |
| Swap contracts | | | (998,697) | | | | — | | | | 204,318 | | | | (794,379) | |
| Forward foreign currency contracts2 | | | — | | | | 484,540 | | | | — | | | | 484,540 | |
| Total | | $ | 2,404,597 | | | $ | 125,094 | | | $ | 183,299 | | | $ | 2,712,990 | |
| 1 | Net realized gain (loss) from purchased options is reported in net realized gain (loss) from investment transactions in the Statement of Operations. |
| 2 | Net realized gain (loss) from forward foreign currency contracts is reported in net realized gain (loss) from foreign currency transactions in the Statement of Operations. |
| | | | | | | | | | | | | | | | |
| CHANGE IN UNREALIZED APPRECIATION (DEPRECIATION) ON DERIVATIVES RECOGNIZED | |
| | | Interest
Rate Risk | | | Foreign
Exchange Risk | | | Credit
Risk | | | Total | |
| Purchased options1 | | $ | (94,363) | | | $ | 154,600 | | | $ | 18,682 | | | $ | 78,919 | |
| Written options | | | (33,169) | | | | 58,598 | | | | — | | | | 25,429 | |
| Futures contracts | | | (712,860) | | | | — | | | | — | | | | (712,860) | |
| Swap contracts | | | 1,640,406 | | | | — | | | | 29,951 | | | | 1,670,357 | |
| Forward foreign currency contracts2 | | | — | | | | 1,043,468 | | | | — | | | | 1,043,468 | |
| Total | | $ | 800,014 | | | $ | 1,256,666 | | | $ | 48,633 | | | $ | 2,105,313 | |
| 1 | The change in unrealized appreciation (depreciation) from purchased options is reported in the change in net unrealized appreciation (depreciation) from investments in the Statement of Operations. |
| 2 | The change in unrealized appreciation (depreciation) from forward foreign currency contracts is reported in the change in net unrealized appreciation (depreciation) from foreign currencies in the Statement of Operations. |
During the year ended December 31, 2016, the volume of derivative activity for the Portfolio was as follows:
| | | | |
| | | Average Market
Value | |
| Purchased options | | $ | 220,124 | |
| Written options | | | 166,916 | |
| Futures contracts (to buy) | | | 187,342,100 | |
| Futures contracts (to sell) | | | 250,251,615 | |
| Forward foreign currency contracts (to buy) | | | 15,591,999 | |
| Forward foreign currency contracts (to sell) | | | 43,658,815 | |
| | |
| Western Asset Core Plus VIT Portfolio 2016 Annual Report | | 63 |
Notes to financial statements (cont’d)
| | | | |
| | | Average Notional
Balance | |
| Interest rate swap contracts | | $ | 263,801,231 | |
| Credit default swap contracts (to sell protection)† | | | 4,769,231 | |
| † | At December 31, 2016, there were no open positions held in this derivative. |
The following table presents by financial instrument, the Portfolio’s derivative assets net of the related collateral received by the Portfolio at December 31, 2016:
| | | | | | | | | | | | |
| | | Gross Amount of Derivative
Assets in the Statement of
Assets and Liabilities1 | | | Collateral
Received | | | Net
Amount | |
| Purchased options2 | | $ | 235,837 | | | | — | | | $ | 235,837 | |
| Forward foreign currency contracts | | | 2,737,119 | | | | — | | | | 2,737,119 | |
| Total | | $ | 2,972,956 | | | | — | | | $ | 2,972,956 | |
The following table presents by financial instrument, the Portfolio’s derivative liabilities net of the related collateral pledged by the Portfolio at December 31, 2016:
| | | | | | | | | | | | |
| | | Gross Amount of Derivative
Liabilities in the Statement of
Assets and Liabilities1 | | | Collateral
Pledged3,4 | | | Net
Amount | |
| Written options | | $ | 233,487 | | | | — | | | $ | 233,487 | |
| Futures contracts5 | | | 43,339 | | | $ | (43,339) | | | | — | |
| Centrally cleared swap contracts5 | | | 202,749 | | | | (202,749) | | | | — | |
| Forward foreign currency contracts | | | 739,687 | | | | — | | | | 739,687 | |
| Total | | $ | 1,219,262 | | | $ | (246,088) | | | $ | 973,174 | |
| 1 | Absent an event of default or early termination, derivative assets and liabilities are presented gross and not offset in the Statement of Assets and Liabilities. |
| 2 | Market value of purchased options is reported in Investments at value in the Statement of Assets and Liabilities. |
| 3 | Gross amounts are not offset in the Statement of Assets and Liabilities. |
| 4 | In some instances, the actual collateral received and/or pledged may be more than the amount shown here due to overcollateralization. |
| 5 | Amount represents the current day’s variation margin as reported in the Statement of Assets and Liabilities. It differs from the cumulative appreciation (depreciation) presented in the previous table. |
5. Class specific expenses, waivers and/or expense reimbursements
The Portfolio has adopted a Rule 12b-1 shareholder services and distribution plan and under that plan the Portfolio pays service and/or distribution fees with respect to its Class II shares calculated at the annual rate of 0.25% of the average daily net assets of the class. Service and/or distribution fees are accrued daily and paid monthly.
For the year ended December 31, 2016, class specific expenses were as follows:
| | | | | | | | |
| | | Service and/or
Distribution Fees | | | Transfer Agent
Fees | |
| Class I | | | — | | | $ | 72 | |
| Class II | | $ | 1,033,153 | | | | 1,225 | |
| Total | | $ | 1,033,153 | | | $ | 1,297 | |
| | |
| 64 | | Western Asset Core Plus VIT Portfolio 2016 Annual Report |
6. Distributions to shareholders by class
| | | | | | | | |
| | | Year Ended
December 31, 2016 | | | Year Ended
December 31, 2015 | |
| Net Investment Income: | | | | | | | | |
| Class I | | $ | 1,628,152 | | | $ | 1,211,169 | 1 |
| Class II | | | 11,522,030 | | | | 4,058,940 | 2 |
| Total | | $ | 13,150,182 | | | $ | 5,270,109 | |
| 1 | In April 2015, the Portfolio’s outstanding class of shares, which was previously unnamed, became known as Class I shares. |
| 2 | For the period May 1, 2015 (inception date) to December 31, 2015. |
7. Shares of beneficial interest
At December 31, 2016, the Trust had an unlimited number of shares of beneficial interest authorized with a par value of $0.00001 per share. The Portfolio has the ability to issue multiple classes of shares. Each class of shares represents an identical interest and has the same rights, except that each class bears certain direct expenses, including those specifically related to the distribution of its shares.
Transactions in shares of each class were as follows:
| | | | | | | | | | | | | | | | |
| | | Year Ended
December 31, 2016 | | | Year Ended
December 31, 2015 | |
| | | Shares | | | Amount | | | Shares | | | Amount | |
| Class I | | | | | | | | | | | | | | | | |
| Shares sold | | | 368,457 | | | $ | 2,161,571 | | | | 137,573 | 1 | | $ | 780,043 | 1 |
| Shares issued on reinvestment | | | 287,496 | | | | 1,628,152 | | | | 215,986 | 1 | | | 1,211,169 | 1 |
| Shares repurchased | | | (1,960,238) | | | | (11,388,037) | | | | (2,731,372) | 1 | | | (15,552,446) | 1 |
| Net decrease | | | (1,304,285) | | | $ | (7,598,314) | | | | (2,377,813) | 1 | | $ | (13,561,234) | 1 |
| | | | |
| Class II | | | | | | | | | | | | | | | | |
| Shares sold | | | 68,251,287 | | | $ | 405,901,908 | | | | 63,847,133 | 2 | | $ | 362,517,384 | 2 |
| Shares issued on reinvestment | | | 2,039,799 | | | | 11,522,030 | | | | 726,080 | 2 | | | 4,058,940 | 2 |
| Shares repurchased | | | (33,717,889) | | | | (199,665,310) | | | | (2,199,565) | 2 | | | (12,455,270) | 2 |
| Net increase | | | 36,573,197 | | | $ | 217,758,628 | | | | 62,373,648 | 2 | | $ | 354,121,054 | 2 |
| 1 | In April 2015, the Portfolio’s outstanding class of shares, which was previously unnamed, became known as Class I shares. |
| 2 | For the period May 1, 2015 (inception date) to December 31, 2015. |
8. Redemption facility
The Portfolio and certain other participating funds within Legg Mason Partners Income Trust, Legg Mason Partners Institutional Trust, Legg Mason Partners Variable Income Trust, and Master Portfolio Trust (the “Participating Funds”), have available an unsecured revolving credit facility (the “Redemption Facility”) from the lenders and The Bank of New York Mellon (“BNY Mellon”), as administrative agent for the lenders. The Redemption Facility is to be used for temporary or emergency purposes as an additional source of liquidity to fund redemptions of shares. Under the agreement, BNY Mellon provides a 364-day revolving credit facility, in the aggregate amount of $220 million. Unless renewed, the agreement will terminate on November 20, 2017. Any borrowings under the Redemption Facility will bear
| | |
| Western Asset Core Plus VIT Portfolio 2016 Annual Report | | 65 |
Notes to financial statements (cont’d)
interest at current market rates as set forth in the credit agreement. The annual commitment fee to maintain the Redemption Facility is 0.10% and is incurred on the unused portion of the facility and is allocated to all Participating Funds pro rata based on net assets. For the year ended December 31, 2016, the Portfolio incurred a commitment fee in the amount of $5,100. The Portfolio did not utilize the Redemption Facility during the year ended December 31, 2016.
9. Income tax information and distributions to shareholders
The tax character of distributions paid during the fiscal years ended December 31, was as follows:
| | | | | | | | |
| | | 2016 | | | 2015 | |
| Distributions paid from: | | | | | | | | |
| Ordinary income | | $ | 13,150,182 | | | $ | 5,270,109 | |
As of December 31, 2016, the components of accumulated earnings (losses) on a tax basis were as follows:
| | | | |
| Undistributed ordinary income — net | | $ | 1,411,189 | |
| Deferred Capital Losses* | | | (5,614,317) | |
| Capital loss carryforward** | | | (3,098,143) | |
| Other book/tax temporary differences(a) | | | (2,700,779) | |
| Unrealized appreciation (depreciation)(b) | | | (11,161,739) | |
| Total accumulated earnings (losses) — net | | $ | (21,163,789) | |
| * | These capital losses have been deferred in the current year as either short-term or long-term losses. The losses will be deemed to occur on the first day of the next taxable year in the same character as they were originally deferred and will be available to offset future taxable capital gains. These losses must be utilized before any of the Portfolio’s capital loss carryforward may be utilized. |
| ** | During the taxable year ended December 31, 2016, the Portfolio utilized $7,162,583 of its capital loss carryforward available from prior years. As of December 31, 2016, the Portfolio had the following net capital loss carryforwards remaining: |
| | | | |
| Year of Expiration | | Amount | |
| 12/31/2018 | | $ | (3,098,143 | ) |
This amount will be available to offset any future taxable capital gains.
| (a) | Other book/tax temporary differences are attributable to the tax deferral of losses on straddles, the realization for tax purposes of unrealized gains (losses) on certain futures, options and foreign currency contracts, book/tax differences in the accrual of interest income on securities in default and book/tax differences in the timing of the deductibility of various expenses. |
| (b) | The difference between book-basis and tax-basis unrealized appreciation (depreciation) is attributable to the tax deferral of losses on wash sales, the difference between book and tax amortization methods for premiums on fixed income securities and other book/tax basis adjustments. |
10. Recent accounting pronouncement
In October 2016, the U.S. Securities and Exchange Commission adopted new rules and amended existing rules (together, the “final rules”) intended to modernize the reporting and disclosure of information by registered investment companies. In part, the final rules amend Regulation S-X and require standardized, enhanced disclosure about derivatives in investment company financial statements, as well as other amendments. The compliance date for the amendments to Regulation S-X is August 1, 2017. Management is currently evaluating the impact that the adoption of the amendments to Regulation S-X will have on the Portfolio’s financial statements and related disclosures.
| | |
| 66 | | Western Asset Core Plus VIT Portfolio 2016 Annual Report |
Report of independent registered public accounting firm
The Board of Trustees and Shareholders
Legg Mason Partners Variable Income Trust:
We have audited the accompanying statement of assets and liabilities of Western Asset Core Plus VIT Portfolio, a series of Legg Mason Partners Variable Income Trust, including the schedule of investments, as of December 31, 2016, and the related statement of operations for the year then ended, the statements of changes in net assets for each of the years in the two-year period then ended, and the financial highlights for each of the years or periods in the five-year period then ended. These financial statements and financial highlights are the responsibility of the Portfolio’s management. Our responsibility is to express an opinion on these financial statements and financial highlights based on our audits.
We conducted our audits in accordance with the standards of the Public Company Accounting Oversight Board (United States). Those standards require that we plan and perform the audit to obtain reasonable assurance about whether the financial statements and financial highlights are free of material misstatement. An audit includes examining, on a test basis, evidence supporting the amounts and disclosures in the financial statements. Our procedures included confirmation of securities owned as of December 31, 2016, by correspondence with the custodian and brokers or by other appropriate auditing procedures. An audit also includes assessing the accounting principles used and significant estimates made by management, as well as evaluating the overall financial statement presentation. We believe that our audits provide a reasonable basis for our opinion.
In our opinion, the financial statements and financial highlights referred to above present fairly, in all material respects, the financial position of Western Asset Core Plus VIT Portfolio as of December 31, 2016, the results of its operations for the year then ended, the changes in its net assets for each of the years in the two-year period then ended, and the financial highlights for each of the years or periods in the five-year period then ended, in conformity with U.S. generally accepted accounting principles.

New York, New York
February 17, 2017
| | |
| Western Asset Core Plus VIT Portfolio 2016 Annual Report | | 67 |
Board approval of management and subadvisory agreements (unaudited)
At an in-person meeting of the Board of Trustees of Legg Mason Partners Variable Income Trust (the “Trust”) held on November 7-8, 2016, the Board, including the Trustees who are not considered to be “interested persons” of the Trust (the “Independent Trustees”) under the Investment Company Act of 1940, as amended (the “1940 Act”), approved for an annual period the continuation of the management agreement (the “Management Agreement”) between the Trust and Legg Mason Partners Fund Advisor, LLC (the “Manager”) with respect to Western Asset Core Plus VIT Portfolio, a series of the Trust (the “Fund”), and the sub-advisory agreement (the “Sub-Advisory Agreement”) between the Manager and Western Asset Management Company (the “Subadviser”), an affiliate of the Manager, with respect to the Fund. At that meeting, the Board, including the Independent Trustees, also approved for an annual period the continuation of sub-advisory agreements (together with the Sub-Advisory Agreement, the “Sub-Advisory Agreements”) between the Subadviser and Western Asset Management Company Limited, Western Asset Management Company Pte. Ltd. (Singapore) and Western Asset Management Company Ltd (Japan) (together with the Subadviser, the “Subadvisers”), each an affiliate of the Manager and the Subadviser, with respect to the Fund.
Background
The Board received extensive information in advance of the meeting from the Manager to assist it in its consideration of the Management Agreement and the Sub-Advisory Agreements and was given the opportunity to ask questions and request additional information from management. Throughout the prior year the Board had met with representatives of the Manager and the Subadvisers, and had received information relevant to the renewal of the Management Agreement and the Sub-Advisory Agreements. In addition, prior to the meeting the Independent Trustees met with their independent legal counsel to discuss and consider the information provided by management and submitted questions to management, and they considered the responses provided. The Board received and considered a variety of information about the Manager and the Subadvisers, as well as the management and sub-advisory arrangements for the Fund and other funds overseen by the Board, certain portions of which are discussed below. The information received and considered by the Board both in conjunction with the November meeting and throughout the year was both written and oral.
The information provided and presentations made to the Board encompassed the Fund and all funds for which the Board has responsibility. The discussion below covers both the advisory and the administrative functions being rendered by the Manager, both of which functions are encompassed by the Management Agreement, as well as the advisory functions rendered by the Subadvisers pursuant to the Sub-Advisory Agreements.
Board approval of management agreement and sub-advisory agreements
The Independent Trustees were advised by separate independent legal counsel throughout the process. Prior to voting, the Independent Trustees received a memorandum from their independent legal counsel discussing the legal standards for their consideration of the
| | |
| 68 | | Western Asset Core Plus VIT Portfolio |
proposed continuation of the Management Agreement and the Sub-Advisory Agreements. The Independent Trustees also reviewed the proposed continuation of the Management Agreement and the Sub-Advisory Agreements in private sessions with their independent legal counsel at which no representatives of the Manager and Subadvisers were present. The Independent Trustees considered the Management Agreement and each Sub-Advisory Agreement separately in the course of their review. In doing so, they noted the respective roles of the Manager and the Subadvisers in providing services to the Fund.
In approving the Management Agreement and Sub-Advisory Agreements, the Board, including the Independent Trustees, considered a variety of factors, including those factors discussed below. No single factor reviewed by the Board was identified by the Board as the principal factor in determining whether to approve the Management Agreement and the Sub-Advisory Agreements. Each Trustee may have attributed different weight to the various factors in evaluating the Management Agreement and each Sub-Advisory Agreement.
After considering all relevant factors and information, the Board, exercising its business judgment, determined that the continuation of the Management Agreement and Sub-Advisory Agreements was in the best interests of the Fund’s shareholders and approved the continuation of each such agreement for another year.
Nature, extent and quality of the services under the management agreement and sub-advisory agreements
The Board received and considered information regarding the nature, extent and quality of services provided to the Fund by the Manager and the Subadvisers under the Management Agreement and the Sub-Advisory Agreements, respectively, during the past year. The Board noted information received at regular meetings throughout the year related to the services rendered by the Manager in its management of the Fund’s affairs and the Manager’s role in coordinating the activities of the Fund’s other service providers. The Board’s evaluation of the services provided by the Manager and the Subadvisers took into account the Board’s knowledge gained as Trustees of funds in the Legg Mason fund complex, including knowledge gained regarding the scope and quality of the investment management and other capabilities of the Manager and the Subadvisers, and the quality of the Manager’s administrative and other services. The Board observed that the scope of services provided by the Manager and the Subadvisers, and of the undertakings required of the Manager and Subadvisers in connection with those services, including maintaining and monitoring their own and the Fund’s compliance programs, liquidity management programs and cybersecurity programs, had expanded over time as a result of regulatory, market and other developments. The Board also noted that on a regular basis it received and reviewed information from the Manager and the Subadvisers regarding the Fund’s compliance policies and procedures established pursuant to Rule 38a-1 under the 1940 Act. The Board also considered the risks associated with the Fund borne by the Manager and its affiliates (such as entrepreneurial, operational, reputational, litigation and regulatory risk), as well as the Manager’s and each Subadviser’s risk management processes.
| | |
| Western Asset Core Plus VIT Portfolio | | 69 |
Board approval of management and subadvisory agreements (unaudited) (cont’d)
The Board reviewed the qualifications, backgrounds and responsibilities of the Manager’s and each Subadviser’s senior personnel and the team of investment professionals primarily responsible for the day-to-day portfolio management of the Fund. The Board also considered, based on its knowledge of the Manager and its affiliates, the financial resources of Legg Mason, Inc., the parent organization of the Manager and the Subadvisers. The Board recognized the importance of having a fund manager with significant resources.
The Board considered the division of responsibilities between the Manager and the Subadvisers and the oversight provided by the Manager. The Board also considered the policies and practices of the Manager and the Subadvisers regarding the selection of brokers and dealers and the execution of portfolio transactions. In addition, management also periodically reported to the Board on, among other things, its business plans and any organizational changes.
The Board received and considered performance information for the Fund as well as for a group of funds (the “Performance Universe”) selected by Broadridge Financial Solutions, Inc. (“Broadridge”), an independent provider of investment company data. The Board was provided with a description of the methodology Broadridge used to determine the similarity of the Fund with the funds included in the Performance Universe. It was noted that while the Board found the Broadridge data generally useful they recognized its limitations, including in particular that the data may vary depending on the end date selected and that the results of the performance comparisons may vary depending on the selection of the peer group. The Board also noted that it had received and discussed with management information throughout the year at periodic intervals comparing the Fund’s performance against its benchmark and against the Fund’s peers. In addition, the Board considered the Fund’s performance in light of overall financial market conditions.
The information comparing the Fund’s performance to that of its Performance Universe, consisting of all funds classified by Broadridge as core plus bond funds underlying variable insurance products, showed, among other data, that the Fund’s performance for the 1-, 3-, 5- and 10-year periods ended June 30, 2016 was above the median.
The Board concluded that, overall, the nature, extent and quality of services provided (and expected to be provided), including performance, under the Management Agreement and the Sub-Advisory Agreements were sufficient for renewal.
Management fees and expense ratios
The Board reviewed and considered the contractual management fee (the “Contractual Management Fee”) and the actual management fees paid by the Fund to the Manager (the “Actual Management Fee”) in light of the nature, extent and quality of the management and sub-advisory services provided by the Manager and the Subadvisers. The Board also considered that fee waiver and/or expense reimbursement arrangements are currently in place for the Fund. The Board also noted that the compensation paid to the Subadvisers is the responsibility and expense of the Manager, not the Fund.
| | |
| 70 | | Western Asset Core Plus VIT Portfolio |
In addition, the Board received and considered information provided by Broadridge comparing the Contractual Management Fee and the Actual Management Fee and the Fund’s total actual expenses with those of funds in both the relevant expense group and a broader group of funds, each selected by Broadridge. The Board also reviewed information regarding fees charged by the Manager to other U.S. clients investing primarily in an asset class similar to that of the Fund, including, where applicable, separate accounts.
The Manager reviewed with the Board the differences in services provided to these different types of accounts, noting that the Fund is provided with certain administrative services, office facilities, and Fund officers (including the Fund’s chief executive, chief financial and chief compliance officers), and that the Manager coordinates and oversees the provision of services to the Fund by other Fund service providers. The Board considered the fee comparisons in light of the differences in management of these different types of accounts.
The Board considered the overall management fee, the fees of each of the Subadvisers and the amount of the management fee retained by the Manager after payment of the subadvisory fees in each case in light of the services rendered for those amounts. The Board also received an analysis of complex-wide management fees provided by the Manager, which, among other things, set out a framework of fees based on asset classes.
The information comparing the Fund’s Contractual and Actual Management Fees as well as its actual total expense ratio to its expense group, consisting of a group of funds (including the Fund) classified as core plus bond funds underlying variable insurance products and chosen by Broadridge to be comparable to the Fund, showed that the Fund’s Contractual Management Fee was approximately equivalent to the median and the Actual Management Fee was at the median. The Board noted that the Fund’s actual total expense ratio was approximately equivalent to the median. The Board also considered that the current limitation on the Fund’s expenses is expected to continue through December 2018.
Taking all of the above into consideration, as well as the factors identified below, the Board determined that the management fee and the subadvisory fees for the Fund were reasonable in light of the nature, extent and quality of the services provided to the Fund under the Management Agreement and the Sub-Advisory Agreements.
Manager profitability
The Board received and considered an analysis of the profitability of the Manager and its affiliates in providing services to the Fund. The Board also received profitability information with respect to the Legg Mason fund complex as a whole. In addition, the Board received information with respect to the Manager’s allocation methodologies used in preparing this profitability data. It was noted that the allocation methodologies had been reviewed by an outside consultant. The profitability of the Manager and its affiliates was considered by the Board not excessive in light of the nature, extent and quality of the services provided to the Fund.
| | |
| Western Asset Core Plus VIT Portfolio | | 71 |
Board approval of management and subadvisory agreements (unaudited) (cont’d)
Economies of scale
The Board received and discussed information concerning whether the Manager realizes economies of scale as the Fund’s assets grow. The Board noted that the Manager had previously agreed to institute breakpoints in the Fund’s Contractual Management Fee, reflecting the potential for reducing the Contractual Management Fee as the Fund grows. The Board considered whether the breakpoint fee structure was a reasonable means of sharing any economies of scale or other efficiencies that might accrue from increases in the Fund’s asset levels. The Board noted that although the Fund had not reached the specified asset level at which a breakpoint to its Contractual Management Fee would be triggered, the Fund’s Contractual Management Fee is below the asset-weighted average of management fees paid by other funds in the same Broadridge investment classification/objective at the range of asset levels relevant to the Fund. In addition, the Board noted the size of the Fund.
The Board determined that the management fee structure for the Fund, including breakpoints, was reasonable.
Other benefits to the manager and the subadvisers
The Board considered other benefits received by the Manager, the Subadvisers and their affiliates as a result of their relationship with the Fund, including the opportunity to offer additional products and services to Fund shareholders.
In light of the costs of providing investment management and other services to the Fund and the ongoing commitment of the Manager and the Subadvisers to the Fund, the Board considered that the ancillary benefits that the Manager and its affiliates received were reasonable.
| | |
| 72 | | Western Asset Core Plus VIT Portfolio |
Additional information (unaudited)
Information about Trustees and Officers
The business and affairs of Western Asset Core Plus VIT Portfolio (the “Portfolio”) are conducted by management under the supervision and subject to the direction of its Board of Trustees. The business address of each Trustee is c/o Jane Trust, Legg Mason, 100 International Drive, 11th Floor, Baltimore, Maryland 21202. Information pertaining to the Trustees and officers of the Portfolio is set forth below.
The Statement of Additional Information includes additional information about Trustees and is available, without charge, upon request by calling the Portfolio at 1-877-721-1926.
| | |
| Independent Trustees†: | | |
| Elliott J. Berv | | |
| Year of birth | | 1943 |
| Position(s) with Trust | | Trustee and Chairman |
| Term of office1 and length of time served2 | | Since 1989 (Chairman of the Board since 2016) |
| Principal occupation(s) during past five years | | President and Chief Executive Officer, Catalyst (consulting) (since 1984); formerly, Chief Executive Officer, Rocket City Enterprises (media) (2000 to 2005) |
| Number of funds in fund complex overseen by Trustee | | 50 |
| Other board memberships held by Trustee during past five years | | None |
| |
| Jane F. Dasher | | |
| Year of birth | | 1949 |
| Position(s) with Trust | | Trustee |
| Term of office1 and length of time served2 | | Since 1999 |
| Principal occupation(s) during past five years | | Chief Financial Officer, Long Light Capital, LLC, formerly known as Korsant Partners, LLC (a family investment company) (since 1997) |
| Number of funds in fund complex overseen by Trustee | | 50 |
| Other board memberships held by Trustee during past five years | | None |
| |
| Mark T. Finn | | |
| Year of birth | | 1943 |
| Position(s) with Trust | | Trustee |
| Term of office1 and length of time served2 | | Since 1989 |
| Principal occupation(s) during past five years | | Adjunct Professor, College of William & Mary (since 2002); Chairman, Chief Executive Officer and Owner, Vantage Consulting Group, Inc. (investment management) (since 1988); formerly, Principal/Member, Balvan Partners (investment management) (2002 to 2009) |
| Number of funds in fund complex overseen by Trustee | | 50 |
| Other board memberships held by Trustee during past five years | | None |
| | |
| Western Asset Core Plus VIT Portfolio | | 73 |
Additional information (unaudited) (cont’d)
Information about Trustees and Officers
| | |
| Independent Trustees cont’d | | |
| Stephen R. Gross | | |
| Year of birth | | 1947 |
| Position(s) with Trust | | Trustee |
| Term of office1 and length of time served2 | | Since 1986 |
| Principal occupation(s) during past five years | | Chairman Emeritus (since 2011) and formerly, Chairman, HLB Gross Collins, P.C. (accounting and consulting firm) (1974 to 2011); Executive Director of Business Builders Team, LLC (since 2005); Principal, Gross Consulting Group, LLC (since 2011); CEO, Gross Capital Partners, LLC (since 2011); CEO, Trusted CFO Solutions, LLC (since 2011) |
| Number of funds in fund complex overseen by Trustee | | 50 |
| Other board memberships held by Trustee during past five years | | None |
| |
| Richard E. Hanson, Jr. | | |
| Year of birth | | 1941 |
| Position(s) with Trust | | Trustee |
| Term of office1 and length of time served2 | | Since 1985 |
| Principal occupation(s) during past five years | | Retired; formerly, Headmaster, The New Atlanta Jewish Community High School, Atlanta, Georgia (1996 to 2000) |
| Number of funds in fund complex overseen by Trustee | | 50 |
| Other board memberships held by Trustee during past five years | | None |
| |
| Diana R. Harrington | | |
| Year of birth | | 1940 |
| Position(s) with Trust | | Trustee |
| Term of office1 and length of time served2 | | Since 1992 |
| Principal occupation(s) during past five years | | Babson Distinguished Professor of Finance, Babson College (since 1992) |
| Number of funds in fund complex overseen by Trustee | | 50 |
| Other board memberships held by Trustee during past five years | | None |
| |
| Susan M. Heilbron | | |
| Year of birth | | 1945 |
| Position(s) with Trust | | Trustee |
| Term of office1 and length of time served2 | | Since 1994 |
| Principal occupation(s) during past five years | | Retired; formerly, President, Lacey & Heilbron (communications consulting) (1990 to 2002); General Counsel and Executive Vice President, The Trump Organization (1986 to 1990); Senior Vice President, New York State Urban Development Corporation (1984 to 1986); Associate, Cravath, Swaine & Moore (1980 to 1984) and (1977 to 1979) |
| Number of funds in fund complex overseen by Trustee | | 50 |
| Other board memberships held by Trustee during past five years | | Formerly, Director, Lincoln Savings Bank, FSB (1991 to 1994); Director, Trump Shuttle, Inc. (air transportation) (1989 to 1990); Director, Alexander’s Inc. (department store) (1987 to 1990) |
| | |
| 74 | | Western Asset Core Plus VIT Portfolio |
| | |
| Independent Trustees cont’d | | |
| Susan B. Kerley | | |
| Year of birth | | 1951 |
| Position(s) with Trust | | Trustee |
| Term of office1 and length of time served2 | | Since 1992 |
| Principal occupation(s) during past five years | | Investment Consulting Partner, Strategic Management Advisors, LLC (investment consulting) (since 1990) |
| Number of funds in fund complex overseen by Trustee | | 50 |
| Other board memberships held by Trustee during past five years | | Director and Trustee (since 1990) and formerly, Chairman (2005 to 2012) of various series of MainStay Family of Funds (66 funds); Investment Company Institute (ICI) Board of Governors (2006 to 2014); ICI Executive Committee (2011 to 2014); Chairman of the Independent Directors Council (2012 to 2014) |
| |
| Alan G. Merten | | |
| Year of birth | | 1941 |
| Position(s) with Trust | | Trustee |
| Term of office1 and length of time served2 | | Since 1990 |
| Principal occupation(s) during past five years | | President Emeritus (since 2012) and formerly, President, George Mason University (1996 to 2012) |
| Number of funds in fund complex overseen by Trustee | | 50 |
| Other board memberships held by Trustee during past five years | | Director Emeritus (since 2012) and formerly, Director, Cardinal Financial Corporation (2006 to 2012); Trustee, First Potomac Realty Trust (since 2005); formerly, Director, DeVry Inc. (educational services) (2012 to 2016); Director, Xybernaut Corporation (information technology) (2004 to 2006); Director, Digital Net Holdings, Inc. (2003 to 2004); Director, Comshare, Inc. (information technology) (1985 to 2003) |
| |
| R. Richardson Pettit | | |
| Year of birth | | 1942 |
| Position(s) with Trust | | Trustee |
| Term of office1 and length of time served2 | | Since 1990 |
| Principal occupation(s) during past five years | | Retired; Duncan Professor of Finance Emeritus, University of Houston (1977 to 2006); previous academic or management positions include: University of Washington, University of Pennsylvania and Purdue University |
| Number of funds in fund complex overseen by Trustee | | 50 |
| Other board memberships held by Trustee during past five years | | None |
| | |
| Western Asset Core Plus VIT Portfolio | | 75 |
Additional information (unaudited) (cont’d)
Information about Trustees and Officers
| | |
| Interested Trustee and Officer: |
| Jane Trust, CFA3 | | |
| Year of birth | | 1962 |
| Position(s) with Trust | | Trustee, President, and Chief Executive Officer |
| Term of office1 and length of time served2 | | Since 2015 |
| Principal occupation(s) during past five years | | Managing Director of Legg Mason & Co., LLC (“Legg Mason & Co.”) (since 2016); Officer and/or Trustee/Director of 156 funds associated with Legg Mason Partners Fund Advisor, LLC (“LMPFA”) or its affiliates (since 2015); President and Chief Executive Officer of LMPFA (since 2015); formerly, Senior Vice President of LMPFA (2015); Director of ClearBridge, LLC (formerly, Legg Mason Capital Management, LLC) (2007 to 2014); Managing Director of Legg Mason Investment Counsel & Trust Co. (2000 to 2007) |
| Number of funds in fund complex overseen by Trustee | | 149 |
| Other board memberships held by Trustee during past five years | | None |
| | |
| Additional Officers: |
Ted P. Becker Legg Mason 620 Eighth Avenue, 49th Floor, New York, NY 10018 | | |
| Year of birth | | 1951 |
| Position(s) with Trust | | Chief Compliance Officer |
| Term of office1 and length of time served2 | | Since 2007 |
| Principal occupation(s) during past five years | | Director of Global Compliance at Legg Mason (since 2006); Chief Compliance Officer of LMPFA (since 2006); Managing Director of Compliance of Legg Mason & Co. (since 2005); Chief Compliance Officer of certain mutual funds associated with Legg Mason & Co. or its affiliates (since 2006) |
| |
Susan Kerr
Legg Mason 620 Eighth Avenue, 49th Floor, New York, NY 10018 | | |
| Year of birth | | 1949 |
| Position(s) with Trust | | Chief Anti-Money Laundering Compliance Officer |
| Term of office1 and length of time served2 | | Since 2013 |
| Principal occupation(s) during past five years | | Assistant Vice President of Legg Mason & Co. and Legg Mason Investor Services, LLC (“LMIS”) (since 2010); Chief Anti-Money Laundering Compliance Officer of certain mutual funds associated with Legg Mason & Co. or its affiliates (since 2013) and Anti-Money Laundering Compliance Officer of LMIS (since 2012); Senior Compliance Officer of LMIS (since 2011); formerly, AML Consultant, DTCC (2010); AML Consultant, Rabobank Netherlands, (2009); First Vice President, Director of Marketing & Advertising Compliance and Manager of Communications Review Group at Citigroup Inc. (1996 to 2008) |
| | |
| 76 | | Western Asset Core Plus VIT Portfolio |
| | |
| Additional Officers cont’d |
Jenna Bailey
Legg Mason 100 First Stamford Place, 6th Floor, Stamford, CT 06902 | | |
| Year of birth | | 1978 |
| Position(s) with Trust | | Identity Theft Prevention Officer |
| Term of office1 and length of time served2 | | Since 2015 |
| Principal occupation(s) during past five years | | Identity Theft Prevention Officer of certain mutual funds associated with Legg Mason & Co. or its affiliates (since 2015); Compliance Officer of Legg Mason & Co. (since 2013); Assistant Vice President of Legg Mason & Co. (since 2011); formerly, Associate Compliance Officer of Legg Mason & Co. (2011 to 2013); Risk Manager of U.S. Distribution of Legg Mason & Co. (2007 to 2011) |
|
Robert I. Frenkel
Legg Mason 100 First Stamford Place, 6th Floor, Stamford, CT 06902 |
| Year of birth | | 1954 |
| Position(s) with Trust | | Secretary and Chief Legal Officer |
| Term of office1 and length of time served2 | | Since 2007 |
| Principal occupation(s) during past five years | | Vice President and Deputy General Counsel of Legg Mason (since 2006); Managing Director and General Counsel — U.S. Mutual Funds for Legg Mason & Co. (since 2006) and Legg Mason & Co. predecessors (since 1994); Secretary and Chief Legal Officer of certain mutual funds associated with Legg Mason & Co. or its affiliates (since 2006) and Legg Mason & Co. predecessors (prior to 2006) |
| |
Thomas C. Mandia
Legg Mason 100 First Stamford Place, 6th Floor, Stamford, CT 06902 | | |
| Year of birth | | 1962 |
| Position(s) with Trust | | Assistant Secretary |
| Term of office1 and length of time served2 | | Since 2007 |
| Principal occupation(s) during past five years | | Managing Director and Deputy General Counsel of Legg Mason & Co. (since 2005) and Legg Mason & Co. predecessors (prior to 2005); Secretary of LMPFA (since 2006); Assistant Secretary of certain mutual funds associated with Legg Mason & Co. or its affiliates (since 2006) and Legg Mason & Co. predecessors (prior to 2006); Secretary of LM Asset Services, LLC (“LMAS”) (since 2002) and Legg Mason Fund Asset Management, Inc. (“LMFAM”) (since 2013) (formerly registered investment advisers) |
| | |
| Western Asset Core Plus VIT Portfolio | | 77 |
Additional information (unaudited) (cont’d)
Information about Trustees and Officers
| | |
| Additional Officers cont’d |
Richard F. Sennett
Legg Mason 100 International Drive, 7th Floor, Baltimore, MD 21202 | | |
| Year of birth | | 1970 |
| Position(s) with Trust | | Principal Financial Officer and Treasurer |
| Term of office1 and length of time served2 | | Since 2011 and since 2017 |
| Principal occupation(s) during past five years | | Principal Financial Officer and Treasurer of certain mutual funds associated with Legg Mason & Co. or its affiliates (since 2011 and since 2013); Managing Director of Legg Mason & Co. and Senior Manager of the Treasury Policy group for Legg Mason & Co.’s Global Fiduciary Platform (since 2011); formerly, Chief Accountant within the SEC’s Division of Investment Management (2007 to 2011); Assistant Chief Accountant within the SEC’s Division of Investment Management (2002 to 2007) |
| |
Jeanne M. Kelly
Legg Mason 620 Eighth Avenue, 49th Floor, New York, NY 10018 | | |
| Year of birth | | 1951 |
| Position(s) with Trust | | Senior Vice President |
| Term of office1 and length of time served2 | | Since 2007 |
| Principal occupation(s) during past five years | | Senior Vice President of certain mutual funds associated with Legg Mason & Co. or its affiliates (since 2007); Senior Vice President of LMPFA (since 2006); President and Chief Executive Officer of LMAS and LMFAM (since 2015); Managing Director of Legg Mason & Co. (since 2005) and Legg Mason & Co. predecessors (prior to 2005); formerly, Senior Vice President of LMFAM (2013 to 2015) |
| † | Trustees who are not “interested persons” of the Portfolio within the meaning of Section 2(a)(19) of the Investment Company Act of 1940, as amended (the “1940 Act”). |
| 1 | Each Trustee and officer serves until his or her respective successor has been duly elected and qualified or until his or her earlier death, resignation, retirement or removal. |
| 2 | Indicates the earliest year in which the Trustee became a board member for a fund in the Legg Mason fund complex or the officer took such office. |
| 3 | Ms. Trust is an “interested person” of the Portfolio, as defined in the 1940 Act, because of her position with LMPFA and/or certain of its affiliates. |
| | |
| 78 | | Western Asset Core Plus VIT Portfolio |
Important tax information (unaudited)
The following information is provided with respect to the distributions paid during the taxable year ended December 31, 2016:
| | | | | | | | |
| Record date: | | | 6/7/2016 | | | | 12/16/2016 | |
| Payable date: | | | 6/8/2016 | | | | 12/19/2016 | |
Dividends qualifying for the dividends | | | | | | | | |
received deduction for corporations | | | 2.02 | % | | | 1.65 | % |
Please retain this information for your records.
| | |
| Western Asset Core Plus VIT Portfolio | | 79 |
Western Asset
Core Plus VIT Portfolio
Trustees
Elliott J. Berv
Chairman
Jane F. Dasher
Mark T. Finn
Stephen R. Gross
Richard E. Hanson, Jr.
Diana R. Harrington
Susan M. Heilbron
Susan B. Kerley
Alan G. Merten
R. Richardson Pettit
Jane Trust
Investment manager
Legg Mason Partners Fund Advisor, LLC
Subadvisers
Western Asset Management Company
Western Asset Management Company Limited
Western Asset Management Company Pte. Ltd.
Western Asset Management Company Ltd.
Distributor
Legg Mason Investor Services, LLC
Custodian
State Street Bank and Trust Company
Transfer agent
BNY Mellon Investment Servicing (US) Inc.
4400 Computer Drive
Westborough, MA 01581
Independent registered public accounting firm
KPMG LLP 345 Park Avenue New York, NY 10154
Western Asset Core Plus VIT Portfolio
The Portfolio is a separate investment series of Legg Mason Partners Variable Income Trust, a Maryland statutory trust.
Western Asset Core Plus VIT Portfolio
Legg Mason Funds
620 Eighth Avenue, 49th Floor
New York, NY 10018
The Portfolio files its complete schedule of portfolio holdings with the Securities and Exchange Commission (“SEC”) for the first and third quarters of each fiscal year on Form N-Q. The Portfolio’s Forms N-Q are available on the SEC’s website at www.sec.gov. The Portfolio’s Forms N-Q may be reviewed and copied at the SEC’s Public Reference Room in Washington, D.C., and information on the operation of the Public Reference Room may be obtained by calling 1-800-SEC-0330. To obtain information on Form N-Q, shareholders can call the Portfolio at 1-887-721-1926.
Information on how the Portfolio voted proxies relating to portfolio securities during the prior 12-month period ended June 30th of each year and a description of the policies and procedures that the Portfolio uses to determine how to vote proxies related to portfolio transactions are available (1) without charge, upon request, by calling the Portfolio at 1-887-721-1926, (2) at www.leggmason.com/variablefunds and (3) on the SEC’s website at www.sec.gov.
This report is submitted for the general information of the shareholders of Western Asset Core Plus VIT Portfolio. This report is not authorized for distribution to prospective investors in the Portfolio unless preceded or accompanied by a current prospectus.
Investors should consider the Portfolio’s investment objectives, risks, charges and expenses carefully before investing. The prospectus contains this and other important information about the Portfolio. Please read the prospectus carefully before investing.
www.leggmason.com
© 2017 Legg Mason Investor Services, LLC
Member FINRA, SIPC
Legg Mason Funds Privacy and Security Notice
Your Privacy and the Security of Your Personal Information is Very Important to the Legg Mason Funds
This Privacy and Security Notice (the “Privacy Notice”) addresses the Legg Mason Funds’ privacy and data protection practices with respect to nonpublic personal information the Funds receive. The Legg Mason Funds include any funds sold by the Funds’ distributor, Legg Mason Investor Services, LLC, as well as Legg Mason-sponsored closed-end funds and certain closed-end funds managed or sub-advised by Legg Mason or its affiliates. The provisions of this Privacy Notice apply to your information both while you are a shareholder and after you are no longer invested with the Funds.
The Type of Nonpublic Personal Information the Funds Collect About You
The Funds collect and maintain nonpublic personal information about you in connection with your shareholder account. Such information may include, but is not limited to:
| • | | Personal information included on applications or other forms; |
| • | | Account balances, transactions, and mutual fund holdings and positions; |
| • | | Online account access user IDs, passwords, security challenge question responses; and |
| • | | Information received from consumer reporting agencies regarding credit history and creditworthiness (such as the amount of an individual’s total debt, payment history, etc.). |
How the Funds Use Nonpublic Personal Information About You
The Funds do not sell or share your nonpublic personal information with third parties or with affiliates for their marketing purposes, or with other financial institutions or affiliates for joint marketing purposes, unless you have authorized the Funds to do so. The Funds do not disclose any nonpublic personal information about you except as may be required to perform transactions or services you have authorized or as permitted or required by law. The Funds may disclose information about you to:
| • | | Employees, agents, and affiliates on a “need to know” basis to enable the Funds to conduct ordinary business or comply with obligations to government regulators; |
| • | | Service providers, including the Funds’ affiliates, who assist the Funds as part of the ordinary course of business (such as printing, mailing services, or processing or servicing your account with us) or otherwise perform services on the Funds’ behalf, including companies that may perform marketing services solely for the Funds; |
| • | | The Funds’ representatives such as legal counsel, accountants and auditors; and |
| • | | Fiduciaries or representatives acting on your behalf, such as an IRA custodian or trustee of a grantor trust. |
|
| NOT PART OF THE ANNUAL REPORT |
Legg Mason Funds Privacy and Security Notice
Except as otherwise permitted by applicable law, companies acting on the Funds’ behalf are contractually obligated to keep nonpublic personal information the Funds provide to them confidential and to use the information the Funds share only to provide the services the Funds ask them to perform.
The Funds may disclose nonpublic personal information about you when necessary to enforce their rights or protect against fraud, or as permitted or required by applicable law, such as in connection with a law enforcement or regulatory request, subpoena, or similar legal process. In the event of a corporate action or in the event a Fund service provider changes, the Funds may be required to disclose your nonpublic personal information to third parties. While it is the Funds’ practice to obtain protections for disclosed information in these types of transactions, the Funds cannot guarantee their privacy policy will remain unchanged.
Keeping You Informed of the Funds’ Privacy and Security Practices
The Funds will notify you annually of their privacy policy as required by federal law. While the Funds reserve the right to modify this policy at any time they will notify you promptly if this privacy policy changes.
The Funds’ Security Practices
The Funds maintain appropriate physical, electronic and procedural safeguards designed to guard your nonpublic personal information. The Funds’ internal data security policies restrict access to your nonpublic personal information to authorized employees, who may use your nonpublic personal information for Fund business purposes only.
Although the Funds strive to protect your nonpublic personal information, they cannot ensure or warrant the security of any information you provide or transmit to them, and you do so at your own risk. In the event of a breach of the confidentiality or security of your nonpublic personal information, the Funds will attempt to notify you as necessary so you can take appropriate protective steps. If you have consented to the Funds using electronic communications or electronic delivery of statements, they may notify you under such circumstances using the most current email address you have on record with them.
In order for the Funds to provide effective service to you, keeping your account information accurate is very important. If you believe that your account information is incomplete, not accurate or not current, or if you have questions about the Funds’ privacy practices, write the Funds using the contact information on your account statements, email the Funds by clicking on the Contact Us section of the Funds’ website at www.leggmason.com, or contact the Fund at 1-877-721-1926.
|
| NOT PART OF THE ANNUAL REPORT |
www.leggmason.com
© 2017 Legg Mason Investor Services, LLC Member FINRA, SIPC
FDXX010544 2/17 SR17-2987
The registrant has adopted a code of ethics that applies to the registrant’s principal executive officer, principal financial officer, principal accounting officer or controller.
| ITEM 3. | AUDIT COMMITTEE FINANCIAL EXPERT. |
The Board of Trustees of the registrant has determined that Stephen R. Gross and Jane F. Dasher possess the technical attributes identified in Instruction 2(b) of Item 3 to Form N-CSR to qualify as an “audit committee financial expert,” and have designated Mr. Gross and Ms. Dasher as the Audit Committee’s financial experts. Mr. Gross and Ms. Dasher are “independent” Trustees pursuant to paragraph (a) (2) of Item 3 to Form N-CSR.
| ITEM 4. | PRINCIPAL ACCOUNTANT FEES AND SERVICES. |
a) Audit Fees. The aggregate fees billed in the last two fiscal years ending December 31, 2015 and December 31, 2016 (the “Reporting Periods”) for professional services rendered by the Registrant’s principal accountant (the “Auditor”) for the audit of the Registrant’s annual financial statements, or services that are normally provided by the Auditor in connection with the statutory and regulatory filings or engagements for the Reporting Periods, were $80,515 in December 31, 2015 and $77,005 in December 31, 2016.
b) Audit-Related Fees. The aggregate fees billed in the Reporting Period for assurance and related services by the Auditor that are reasonably related to the performance of the Registrant’s financial statements were $0 in December 31, 2015 and $0 in December 31, 2016.
(c) Tax Fees. The aggregate fees billed in the Reporting Periods for professional services rendered by the Auditor for tax compliance, tax advice and tax planning (“Tax Services”) were $8,160, in December 31, 2015 and $8,240 in December 31, 2016. These services consisted of (i) review or preparation of U.S. federal, state, local and excise tax returns; (ii) U.S. federal, state and local tax planning, advice and assistance regarding statutory, regulatory or administrative developments, and (iii) tax advice regarding tax qualification matters and/or treatment of various financial instruments held or proposed to be acquired or held.
There were no fees billed for tax services by the Auditors to service affiliates during the Reporting Periods that required pre-approval by the Audit Committee.
d) All Other Fees. There were no other fees billed in the Reporting Periods for products and services provided by the Auditor, other than the services reported in paragraphs (a) through (c) of this Item for the Legg Mason Partners Variable Income Trust.
All Other Fees. There were no other non-audit services rendered by the Auditor to Legg Mason Partners Fund Advisors, LLC (“LMPFA”), and any entity controlling, controlled by or under common control with LMPFA that provided ongoing services to Legg Mason Partners Variable Income Trust requiring pre-approval by the Audit Committee in the Reporting Period.
(e) Audit Committee’s pre–approval policies and procedures described in paragraph (c) (7) of Rule 2-01 of Regulation S-X.
(1) The Charter for the Audit Committee (the “Committee”) of the Board of each registered investment company (the “Fund”) advised by LMPFA or one of their affiliates (each, an “Adviser”) requires that the Committee shall approve (a) all audit and permissible non-audit services to be provided to the Fund and (b) all permissible non-audit services to be provided by the Fund’s independent auditors to the Adviser and any Covered Service Providers if the engagement relates directly to the operations and financial reporting of the Fund. The Committee may implement policies and procedures by which such services are approved other than by the full Committee.
The Committee shall not approve non-audit services that the Committee believes may impair the independence of the auditors. As of the date of the approval of this Audit Committee Charter, permissible non-audit services include any professional services (including tax services), that are not prohibited services as described below, provided to the Fund by the independent auditors, other than those provided to the Fund in connection with an audit or a review of the financial statements of the Fund. Permissible non-audit services may not include: (i) bookkeeping or other services related to the accounting records or financial statements of the Fund; (ii) financial information systems design and implementation; (iii) appraisal or valuation services, fairness opinions or contribution-in-kind reports; (iv) actuarial services; (v) internal audit outsourcing services; (vi) management functions or human resources; (vii) broker or dealer, investment adviser or investment banking services; (viii) legal services and expert services unrelated to the audit; and (ix) any other service the Public Company Accounting Oversight Board determines, by regulation, is impermissible.
Pre-approval by the Committee of any permissible non-audit services is not required so long as: (i) the aggregate amount of all such permissible non-audit services provided to the Fund, the Adviser and any service providers controlling, controlled by or under common control with the Adviser that provide ongoing services to the Fund (“Covered Service Providers”) constitutes not more than 5% of the total amount of revenues paid to the independent auditors during the fiscal year in which the permissible non-audit services are provided to (a) the Fund, (b) the Adviser and (c) any entity controlling, controlled by or under common control with the Adviser that provides ongoing services to the Fund during the fiscal year in which the services are provided that would have to be approved by the Committee; (ii) the permissible non-audit services were not recognized by the Fund at the time of the engagement to be non-audit services; and (iii) such services are promptly brought to the attention of the Committee and approved by the Committee (or its delegate(s)) prior to the completion of the audit.
(2) For the Legg Mason Partners Variable Income Trust, the percentage of fees that were approved by the audit committee, with respect to: Audit-Related Fees were 100% and 100% for December 31, 2015 and December 31, 2016; Tax Fees were 100% and 100% for December 31, 2015 and December 31, 2016; and Other Fees were 100% and 100% for December 31, 2015 and December 31, 2016.
(f) N/A
(g) Non-audit fees billed by the Auditor for services rendered to Legg Mason Partners Variable Income Trust, LMPFA and any entity controlling, controlled by, or under common control with LMPFA that provides ongoing services to Legg Mason Partners Variable Income Trust during the reporting period were $0 in December 31, 2016.
(h) Yes. Legg Mason Partners Variable Income Trust’s Audit Committee has considered whether the provision of non-audit services that were rendered to Service Affiliates, which were not pre-approved (not requiring pre-approval), is compatible with maintaining the Accountant’s independence. All services provided by the Auditor to the Legg Mason Partners Variable Income Trust or to Service Affiliates, which were required to be pre-approved, were pre-approved as required.
| ITEM 5. | AUDIT COMMITTEE OF LISTED REGISTRANTS. |
| | a) | The independent board members are acting as the registrant’s audit committee as specified in Section 3(a)(58)(B) of the Exchange Act. The Audit Committee consists of the following Board members: |
Elliott J. Berv
Jane F. Dasher
Mark T. Finn
Stephen R. Gross
Richard E. Hanson, Jr.
Diana R. Harrington
Susan M. Heilbron
Susan B. Kerley
Alan G. Merten
R. Richardson Pettit
| ITEM 6. | SCHEDULE OF INVESTMENTS. |
Included herein under Item 1.
| ITEM 7. | DISCLOSURE OF PROXY VOTING POLICIES AND PROCEDURES FOR CLOSED-END MANAGEMENT INVESTMENT COMPANIES. |
Not applicable.
| ITEM 8. | PORTFOLIO MANAGERS OF CLOSED-END MANAGEMENT INVESTMENT COMPANIES. |
Not applicable.
| ITEM 9. | PURCHASES OF EQUITY SECURITIES BY CLOSED-END MANAGEMENT INVESTMENT COMPANY AND AFFILIATED PURCHASERS. |
Not applicable.
| ITEM 10. | SUBMISSION OF MATTERS TO A VOTE OF SECURITY HOLDERS. |
Not applicable.
| ITEM 11. | CONTROLS AND PROCEDURES. |
| | (a) | The registrant’s principal executive officer and principal financial officer have concluded that the registrant’s disclosure controls and procedures (as defined in Rule 30a- 3(c) under the Investment Company Act of 1940, as amended (the “1940 Act”)) are effective as of a date within 90 days of the filing date of this report that includes the disclosure required by this paragraph, based on their evaluation of the disclosure controls and procedures required by Rule 30a-3(b) under the 1940 Act and 15d-15(b) under the Securities Exchange Act of 1934. |
| | (b) | There were no changes in the registrant’s internal control over financial reporting (as defined in Rule 30a-3(d) under the 1940 Act) that occurred during the second fiscal quarter of the period covered by this report that have materially affected, or are likely to materially affect the registrant’s internal control over financial reporting. |
(a) (1) Code of Ethics attached hereto.
Exhibit 99.CODE ETH
(a) (2) Certifications pursuant to section 302 of the Sarbanes-Oxley Act of 2002 attached hereto.
Exhibit 99.CERT
(b) Certifications pursuant to Section 906 of the Sarbanes-Oxley Act of 2002 attached hereto.
Exhibit 99.906CERT
SIGNATURES
Pursuant to the requirements of the Securities Exchange Act of 1934 and the Investment Company Act of 1940, the registrant has duly caused this Report to be signed on its behalf by the undersigned, there unto duly authorized.
Legg Mason Partners Variable Income Trust
| | |
| By: | | /s/ Jane Trust |
| | Jane Trust |
| | Chief Executive Officer |
| |
| Date: | | February 24, 2017 |
Pursuant to the requirements of the Securities Exchange Act of 1934 and the Investment Company Act of 1940, this report has been signed below by the following persons on behalf of the registrant and in the capacities and on the dates indicated.
| | |
| By: | | /s/ Jane Trust |
| | Jane Trust |
| | Chief Executive Officer |
| |
| Date: | | February 24, 2017 |
| |
| By: | | /s/ Richard F. Sennett |
| | Richard F. Sennett |
| | Principal Financial Officer |
| |
| Date: | | February 24, 2017 |