UNITED STATES
SECURITIES AND EXCHANGE COMMISSION
Washington, D.C. 20549
FORM N-CSR
CERTIFIED SHAREHOLDER REPORT OF REGISTERED
MANAGEMENT INVESTMENT COMPANIES
Investment Company Act file number 811-06310
Legg Mason Partners Variable Income Trust
(Exact name of registrant as specified in charter)
620 Eighth Avenue, 49th Floor, New York, NY 10018
(Address of principal executive offices) (Zip code)
Robert I. Frenkel, Esq.
Legg Mason & Co., LLC
100 First Stamford Place
Stamford, CT 06902
(Name and address of agent for service)
Registrant’s telephone number, including area code: 1-877-721-1926
Date of fiscal year end: December 31
Date of reporting period: June 30, 2018
| ITEM 1. | REPORT TO STOCKHOLDERS. |
The Semi-Annual Report to Stockholders is filed herewith.

| | |
| Semi-Annual Report | | June 30, 2018 |
WESTERN ASSET
VARIABLE GLOBAL HIGH YIELD BOND PORTFOLIO

|
| INVESTMENT PRODUCTS: NOT FDIC INSURED • NO BANK GUARANTEE • MAY LOSE VALUE |
Portfolio objective
The Portfolio seeks to maximize total return.
Letter from the president

Dear Shareholder,
We are pleased to provide the semi-annual report of Western Asset Variable Global High Yield Bond Portfolio for the six-month reporting period ended June 30, 2018. Please read on for Portfolio performance information and a detailed look at prevailing economic and market conditions during the Portfolio’s reporting period.
As always, we remain committed to providing you with excellent service and a full spectrum of investment choices. We also remain committed to supplementing the support you receive from your financial advisor. One way we accomplish this is through our website, www.leggmason.com. Here you can gain immediate access to market and investment information, including:
| • | | Market insights and commentaries from our portfolio managers and |
| • | | A host of educational resources. |
We look forward to helping you meet your financial goals.
Sincerely,

Jane Trust, CFA
President and Chief Executive Officer
July 27, 2018
| | |
| II | | Western Asset Variable Global High Yield Bond Portfolio |
Investment commentary
Economic review
Economic activity in the U.S. was mixed during the six months ended June 30, 2018 (the “reporting period”). Looking back, the U.S. Department of Commerce reported that revised fourth quarter 2017 U.S. gross domestic product (“GDP”)i growth was 2.3%. GDP growth then moderated to a revised 2.2% during the first quarter of 2018. Finally, the U.S. Department of Commerce’s initial reading for second quarter 2018 GDP growth — released after the reporting period ended — was 4.1%. The acceleration in GDP growth in the second quarter reflected positive contributions from personal consumption expenditures (“PCE”), exports, nonresidential fixed investment, federal government spending and state and local government spending. These were partly offset by negative contributions from private inventory investment and residential fixed investment. Imports, which are a subtraction in the calculation of GDP, increased.
Job growth in the U.S. was solid overall and supported the economy during the reporting period. When the reporting period ended on June 30, 2018, the unemployment rate was 4.0%, as reported by the U.S. Department of Labor. While the unemployment rate ticked up from 3.8% to 4.0% in June, the increase was largely attributed to an increase in the workforce participation rate. The percentage of longer-term unemployed moved higher during the reporting period. In June 2018, 23.0% of Americans looking for a job had been out of work for more than six months, versus 21.5% when the period began.
Turning to the global economy, in its July 2018 World Economic Outlook Update — released after the reporting period ended — the International Monetary Fund (“IMF”)ii said, “Global growth is projected to reach 3.9 percent in 2018 and 2019, in line with the forecast of the April 2018 World Economic Outlook, but the expansion is becoming less even, and risks to the outlook are mounting. The rate of expansion appears to have peaked in some major economies and growth has become less synchronized.” From a regional perspective, the IMF projects 2018 growth in the Eurozone will be 2.2%, versus 2.4% in 2017. Japan’s economy is expected to expand 1.0% in 2018, compared to 1.7% in 2017. Elsewhere, the IMF projects that overall growth in emerging market countries will accelerate to 4.9% in 2018, versus 4.7% in 2017.
| | |
| Western Asset Variable Global High Yield Bond Portfolio | | III |
Investment commentary (cont’d)
Market review
Q. How did the Federal Reserve Board (the “Fed”)iii respond to the economic environment?
A. The Fed increased the federal funds rateiv twice during the reporting period. Looking back, at its meeting that concluded on September 20, 2017 — before the reporting period began — the Fed kept rates on hold, but reiterated its intention to begin reducing its balance sheet. At its meeting that ended on December 13, 2017, the Fed raised rates to a range between 1.25% and 1.50%. As expected, the Fed kept rates on hold at its meeting that concluded on January 31, 2018. However, at its meeting that ended on March 21, 2018, the Fed again raised the federal funds rate, moving it to a range between 1.50% and 1.75%. Finally, at its meeting that concluded on June 13, 2018, the Fed raised the federal funds rate to a range between 1.75% and 2.00%.
Q. What actions did international central banks take during the reporting period?
A. Central banks outside the U.S. largely maintained their accommodative monetary policy stances during the reporting period. Looking back, in December 2016, the European Central Bank (“ECB”)v extended its bond buying program until December 2017. From April 2017 through December 2017, the ECB purchased €60 billion-per-month of bonds. In October 2017, the ECB announced that it would continue to buy bonds through September 2018, but after December 2017 it would pare its purchases to €30 billion-per-month. In June 2018, the ECB announced it would end its bond buying program by the end of the year, but it did not anticipate raising interest rates “at least through the summer of 2019”. In other developed countries, on November 2, 2017, the Bank of Englandvi raised rates from 0.25% to 0.50% — the first increase since July 2007. After holding rates steady at 0.10% for more than five years, in January 2016, the Bank of Japanvii announced that it cut the rate on current accounts that commercial banks hold with it to -0.10% and kept rates on hold during the reporting period. Elsewhere, the People’s Bank of Chinaviii kept rates steady at 4.35% during the reporting period.
Q. Did Treasury yields trend higher or lower during the reporting period?
A. Both short-term and longer-term Treasury yields moved higher during the six-month reporting period ended June 30, 2018. The yield for the two-year Treasury note began the reporting period at 1.89% — the low for the period — and ended the period at 2.52%. The peak for the period of 2.59% occurred on several occasions in May and June 2018. The yield for the ten-year Treasury began the reporting period at 2.40% — the low for the period — and ended the period at 2.85%. The high for the period of 3.11% took place on May 17, 2018.
Q. What factors impacted the spread sectors (non-Treasuries) during the reporting period?
A. Most spread sectors generally posted weak results during the reporting period. Performance fluctuated given changing expectations for global growth, uncertainties regarding future central bank monetary policy and concerns over a global trade war. All told, the broad U.S. bond market, as measured by the Bloomberg Barclays U.S. Aggregate Indexix, returned -1.62% during the six-month reporting period ended June 30, 2018.
| | |
| IV | | Western Asset Variable Global High Yield Bond Portfolio |
Q. How did the high-yield bond market perform over the reporting period?
A. The U.S. high-yield bond market, as measured by the Bloomberg Barclays U.S. Corporate High Yield -2% Issuer Cap Indexx, returned 0.16% for the six months ended June 30, 2018. The high-yield market posted a modest gain during the first month of the reporting period. Those gains were then erased in February and March 2018. This turnaround was triggered by a number of factors, including fears that the Fed may take a more aggressive approach to rate hikes, trade war concerns and high-profile issues in the technology industry. However, the high yield market then rallied in April, was relatively flat in May and moved higher in June 2018.
Q. How did the emerging markets debt asset class perform over the reporting period?
A. The JPMorgan Emerging Markets Bond Index Global (“EMBI Global”)xi returned -5.23% during the six months ended June 30, 2018. The asset class produced choppy results during the reporting period. At times it was supported by solid investor demand, less concern over a significant shift in U.S. trade policy and a weakening U.S. dollar. However, at other times it was dragged down by rising U.S. interest rates, periods of investor risk aversion and geopolitical issues. In addition, the U.S. dollar rallied during the second half of the reporting period, negatively impacting the performance of the asset class.
Performance review
For the six months ended June 30, 2018, Class I shares of Western Asset Variable Global High Yield Bond Portfolio1 returned -2.68%. The Portfolio’s unmanaged benchmark, the Bloomberg Barclays Global High Yield Index (Hedged)xii, returned -1.80% for the same period. The Lipper Variable High Yield Funds Category Average2 returned -0.19% over the same time frame.
| | | | |
Performance Snapshot as of June 30, 2018
(unaudited) | |
| | | 6 months | |
Western Asset Variable Global
High Yield Bond Portfolio1: | | | | |
Class I | | | -2.68 | % |
Class II | | | -2.73 | % |
Bloomberg Barclays Global High
Yield Index (Hedged) | | | -1.80 | % |
Lipper Variable High Yield Funds
Category Average2 | | | -0.19 | % |
The performance shown represents past performance. Past performance is no guarantee of future results and current performance may be higher or lower than the performance shown above. Principal value, investment returns and yields will fluctuate and investors’ shares, when redeemed, may be worth more or less than their original cost.
All share class returns assume the reinvestment of all distributions, including returns of capital, if any, at net asset value and the deduction of all Portfolio expenses. Performance figures for periods shorter than one year represent cumulative figures and are not annualized.
| 1 | The Portfolio is an underlying investment option of various variable annuity and variable life insurance products. The Portfolio’s performance returns do not reflect the deduction of expenses imposed in connection with investing in variable annuity or variable life insurance contracts, such as administrative fees, account charges and surrender charges, which, if reflected, would reduce the performance of the Portfolio. Past performance is no guarantee of future results. |
| 2 | Lipper, Inc., a wholly-owned subsidiary of Reuters, provides independent insight on global collective investments. Returns are based on the six-month period ended June 30, 2018, including the reinvestment of all distributions, including returns of capital, if any, calculated among the 111 funds in the Portfolio’s Lipper category. |
| | |
| Western Asset Variable Global High Yield Bond Portfolio | | V |
Investment commentary (cont’d)
The 30-Day SEC Yields for the period ended June 30, 2018 for Class I and Class II shares were 5.40% and 5.14%, respectively. The 30-Day SEC Yield, calculated pursuant to the standard SEC formula, is based on a Portfolio’s investments over an annualized trailing 30-day period, and not on the distributions paid by the Portfolio, which may differ.
|
| Total Annual Operating Expenses (unaudited) |
As of the Portfolio’s current prospectus dated May 1, 2018, the gross total annual fund operating expense ratios for Class I and Class II shares were 0.83% and 1.08%, respectively.
Actual expenses may be higher. For example, expenses may be higher than those shown if average net assets decrease. Net assets are more likely to decrease and Portfolio expense ratios are more likely to increase when markets are volatile.
As always, thank you for your confidence in our stewardship of your assets.
Sincerely,
Jane Trust, CFA
President and Chief Executive Officer
July 27, 2018
RISKS: Investments in bonds are subject to interest rate and credit risks. As interest rates rise, bond prices fall, reducing the value of the Portfolio’s share price. High-yield bonds, commonly known as “junk” bonds, involve greater credit and liquidity risks than investment grade bonds. Investing in foreign securities is subject to certain risks not associated with domestic investing, such as currency fluctuations and social, political and economic uncertainties, which could increase volatility. These risks are magnified in emerging or developing markets. The Portfolio may use derivatives, such as options and futures, which can be illiquid, may disproportionately increase losses, and have a potentially large impact on Portfolio performance. Please see the Portfolio’s prospectus for a more complete discussion of these and other risks and the Portfolio’s investment strategies.
All investments are subject to risk including the possible loss of principal. Past performance is no guarantee of future results. All index performance reflects no deduction for fees, expenses or taxes. Please note that an investor cannot invest directly in an index.
The information provided is not intended to be a forecast of future events, a guarantee of future results or investment advice. Views expressed may differ from those of the firm as a whole. Forecasts and predictions are inherently limited and should not be relied upon as an indication of actual or future performance.
| | |
| VI | | Western Asset Variable Global High Yield Bond Portfolio |
| i | Gross domestic product (“GDP”) is the market value of all final goods and services produced within a country in a given period of time. |
| ii | The International Monetary Fund (“IMF”) is an organization of 189 countries, working to foster global monetary cooperation, secure financial stability, facilitate international trade, promote high employment and sustainable economic growth, and reduce poverty around the world. |
| iii | The Federal Reserve Board (the “Fed”) is responsible for the formulation of U.S. policies designed to promote economic growth, full employment, stable prices and a sustainable pattern of international trade and payments. |
| iv | The federal funds rate is the rate charged by one depository institution on an overnight sale of immediately available funds (balances at the Federal Reserve) to another depository institution; the rate may vary from depository institution to depository institution and from day to day. |
| v | The European Central Bank (“ECB”) is responsible for the monetary system of the European Union and the euro currency. |
| vi | The Bank of England (“BoE”), formally the Governor and Company of the BoE, is the central bank of the United Kingdom. The BoE’s purpose is to maintain monetary and financial stability. |
| vii | The Bank of Japan is the central bank of Japan. The bank is responsible for issuing and handling currency and treasury securities, implementing monetary policy, maintaining the stability of the Japanese financial system and the yen currency. |
| viii | The People’s Bank of China is the central bank of the People’s Republic of China with the power to carry out monetary policy and regulate financial institutions in mainland China. |
| ix | The Bloomberg Barclays U.S. Aggregate Index is a broad-based bond index comprised of government, corporate, mortgage- and asset-backed issues, rated investment grade or higher, and having at least one year to maturity. |
| x | The Bloomberg Barclays U.S. Corporate High Yield -2% Issuer Cap Index is an index of the 2% Issuer Cap component of the Bloomberg Barclays U.S. Corporate High Yield Index, which covers the U.S. dollar-denominated, non-investment grade, fixed-rate, taxable corporate bond market. |
| xi | The JPMorgan Emerging Markets Bond Index Global (“EMBI Global”) tracks total returns for U.S. dollar-denominated debt instruments issued by emerging market sovereign and quasi-sovereign entities: Brady bonds, loans, Eurobonds and local market instruments. |
| xii | The Bloomberg Barclays Global High Yield Index (Hedged) provides a broad-based measure of the global high-yield fixed-income markets, representing the union of the U.S. High-Yield, Pan-European High-Yield, U.S. Emerging Markets High-Yield, CMBS High-Yield and Pan European Emerging Markets High-Yield Indices. |
| | |
| Western Asset Variable Global High Yield Bond Portfolio | | VII |
Portfolio at a glance† (unaudited)
Investment breakdown (%) as a percent of total investments
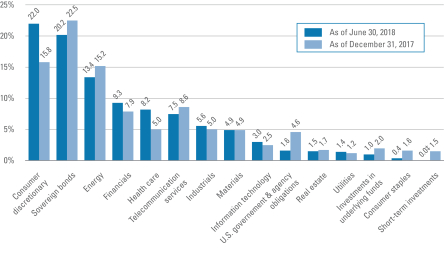
| † | The bar graph above represents the composition of the Portfolio’s investments as of June 30, 2018 and December 31, 2017 and does not include derivatives, such as futures contracts, written options and forward foreign currency contracts. The Portfolio is actively managed. As a result, the composition of the Portfolio’s investments is subject to change at any time. |
| ‡ | Represents less than 0.1%. |
| | |
| Western Asset Variable Global High Yield Bond Portfolio 2018 Semi-Annual Report | | 1 |
Portfolio expenses (unaudited)
Example
As a shareholder of the Portfolio, you may incur two types of costs: (1) transaction costs and (2) ongoing costs, including management fees; service and/or distribution (12b-1) fees; and other Portfolio expenses. This example is intended to help you understand your ongoing costs (in dollars) of investing in the Portfolio and to compare these costs with the ongoing costs of investing in other mutual funds.
This example is based on an investment of $1,000 invested on January 1, 2018 and held for the six months ended June 30, 2018.
Actual expenses
The table below titled “Based on Actual Total Return” provides information about actual account values and actual expenses. You may use the information provided in this table, together with the amount you invested, to estimate the expenses that you paid over the period. To estimate the expenses you paid on your account, divide your ending account value by $1,000 (for example, an $8,600 ending account value divided by $1,000 = 8.6), then multiply the result by the number under the heading entitled “Expenses Paid During the Period”.
Hypothetical example for comparison purposes
The table below titled “Based on Hypothetical Total Return” provides information about hypothetical account values and hypothetical expenses based on the actual expense ratio and an assumed rate of return of 5.00% per year before expenses, which is not the Portfolio’s actual return. The hypothetical account values and expenses may not be used to estimate the actual ending account balance or expenses you paid for the period. You may use the information provided in this table to compare the ongoing costs of investing in the Portfolio and other funds. To do so, compare the 5.00% hypothetical example relating to the Portfolio with the 5.00% hypothetical examples that appear in the shareholder reports of the other funds.
Please note that the expenses shown in the table below are meant to highlight your ongoing costs only and do not reflect any transactional costs. Therefore, the table is useful in comparing ongoing costs only, and will not help you determine the relative total costs of owning different funds. In addition, if these transaction costs were included, your costs would have been higher.
| | | | | | | | | | | | | | | | | | | | | | | | | | | | | | | | | | | | | | | | | | | | | | |
| Based on actual total return1 | | | | | | | | | Based on hypothetical total return1 | |
| | | Actual
Total Return2 | | | Beginning
Account
Value | | | Ending
Account
Value | | | Annualized
Expense
Ratio | | | Expenses
Paid
During
the
Period3 | | | | | | | | Hypothetical
Annualized
Total Return | | | Beginning
Account
Value | | | Ending
Account
Value | | | Annualized
Expense
Ratio | | | Expenses
Paid
During
the
Period3 | |
| Class I | | | -2.68 | % | | $ | 1,000.00 | | | $ | 973.20 | | | | 0.82 | % | | $ | 4.01 | | | | | | | Class I | | | 5.00 | % | | $ | 1,000.00 | | | $ | 1,020.73 | | | | 0.82 | % | | $ | 4.11 | |
| Class II | | | -2.73 | | | | 1,000.00 | | | | 972.70 | | | | 1.08 | | | | 5.28 | | | | | | | Class II | | | 5.00 | | | | 1,000.00 | | | | 1,019.44 | | | | 1.08 | | | | 5.41 | |
| | |
| 2 | | Western Asset Variable Global High Yield Bond Portfolio 2018 Semi-Annual Report |
| 1 | For the six months ended June 30, 2018. |
| 2 | Assumes the reinvestment of all distributions, including returns of capital, if any, at net asset value. Total return is not annualized, as it may not be representative of the total return for the year. Total returns do not reflect expenses associated with separate accounts such as administrative fees, account charges and surrender charges, which, if reflected, would reduce the total returns. Performance figures may reflect compensating balance arrangements, fee waivers and/or expense reimbursements. In the absence of compensating balance arrangements, fee waivers and/or expense reimbursements, the total return would have been lower. Past performance is no guarantee of future results. |
| 3 | Expenses (net of compensating balance arrangements, fee waivers and/or expense reimbursements) are equal to each class’ respective annualized expense ratio multiplied by the average account value over the period, multiplied by the number of days in the most recent fiscal half-year (181), then divided by 365. |
| | |
| Western Asset Variable Global High Yield Bond Portfolio 2018 Semi-Annual Report | | 3 |
Spread duration (unaudited)
Economic exposure — June 30, 2018
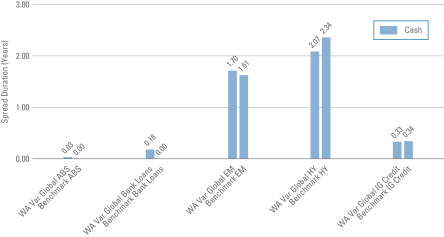
Spread duration measures the sensitivity to changes in spreads. The spread over Treasuries is the annual risk-premium demanded by investors to hold non-Treasury securities. Spread duration is quantified as the % change in price resulting from a 100 basis points change in spreads. For a security with positive spread duration, an increase in spreads would result in a price decline and a decline in spreads would result in a price increase. This chart highlights the market sector exposure of the Portfolio’s sectors relative to the selected benchmark sectors as of the end of the reporting period.
| | |
| ABS | | — Asset-Backed Securities |
| Benchmark | | — Bloomberg Barclays Global High Yield Index (Hedged) |
| EM | | — Emerging Markets |
| HY | | — High Yield |
| IG Credit | | — Investment Grade Credit |
| WA Var Global | | — Western Asset Variable Global High Yield Bond Portfolio |
| | |
| 4 | | Western Asset Variable Global High Yield Bond Portfolio 2018 Semi-Annual Report |
Effective duration (unaudited)
Interest rate exposure — June 30, 2018
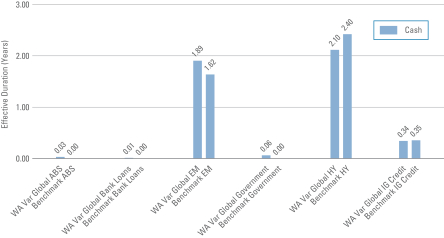
Effective duration measures the sensitivity to changes in relevant interest rates. Effective duration is quantified as the % change in price resulting from a 100 basis points change in interest rates. For a security with positive effective duration, an increase in interest rates would result in a price decline and a decline in interest rates would result in a price increase. This chart highlights the interest rate exposure of the Portfolio’s sectors relative to the selected benchmark sectors as of the end of the reporting period.
| | |
| ABS | | — Asset-Backed Securities |
| Benchmark | | — Bloomberg Barclays Global High Yield Index (Hedged) |
| EM | | — Emerging Markets |
| HY | | — High Yield |
| IG Credit | | — Investment Grade Credit |
| WA Var Global | | — Western Asset Variable Global High Yield Bond Portfolio |
| | |
| Western Asset Variable Global High Yield Bond Portfolio 2018 Semi-Annual Report | | 5 |
Schedule of investments (unaudited)
June 30, 2018
Western Asset Variable Global High Yield Bond Portfolio
| | | | | | | | | | | | | | | | |
| Security | | Rate | | | Maturity
Date | | | Face
Amount† | | | Value | |
| Corporate Bonds & Notes — 64.7% | | | | | | | | | | | | | | | | |
| Consumer Discretionary — 15.4% | | | | | | | | | | | | | | | | |
Auto Components — 1.2% | | | | | | | | | | | | | | | | |
Adient Global Holdings, Ltd., Senior Notes | | | 4.875 | % | | | 8/15/26 | | | | 670,000 | | | $ | 604,675 | (a) |
IHO Verwaltungs GmbH, Senior Secured Notes, (4.750% Cash or 5.500% PIK) | | | 4.750 | % | | | 9/15/26 | | | | 720,000 | | | | 679,500 | (a)(b) |
JB Poindexter & Co. Inc., Senior Notes | | | 7.125 | % | | | 4/15/26 | | | | 390,000 | | | | 401,700 | (a) |
ZF North America Capital Inc., Senior Notes | | | 4.500 | % | | | 4/29/22 | | | | 218,000 | | | | 222,143 | (a) |
Total Auto Components | | | | | | | | | | | | | | | 1,908,018 | |
Diversified Consumer Services — 0.9% | | | | | | | | | | | | | | | | |
Carriage Services Inc., Senior Notes | | | 6.625 | % | | | 6/1/26 | | | | 390,000 | | | | 397,313 | (a) |
Prime Security Services Borrower LLC/Prime Finance, Inc., Secured Notes | | | 9.250 | % | | | 5/15/23 | | | | 851,000 | | | | 908,187 | (a) |
Total Diversified Consumer Services | | | | | | | | | | | | | | | 1,305,500 | |
Hotels, Restaurants & Leisure — 3.1% | | | | | | | | | | | | | | | | |
Bossier Casino Venture Holdco Inc., Senior Secured Bonds (14.000% PIK) | | | 14.000 | % | | | 2/9/23 | | | | 433,444 | | | | 433,444 | (a)(b)(d)(e) |
Burger King France SAS, Senior Secured Notes | | | 6.000 | % | | | 5/1/24 | | | | 130,000 | EUR | | | 162,231 | (a) |
Carrols Restaurant Group Inc., Secured Notes | | | 8.000 | % | | | 5/1/22 | | | | 770,000 | | | | 804,650 | |
Hilton Worldwide Finance LLC/Hilton Worldwide Finance Corp., Senior Notes | | | 4.625 | % | | | 4/1/25 | | | | 380,000 | | | | 371,450 | |
Hilton Worldwide Finance LLC/Hilton Worldwide Finance Corp., Senior Notes | | | 4.875 | % | | | 4/1/27 | | | | 550,000 | | | | 532,125 | |
Marstons Issuer PLC, Secured Bonds (5.641% to 7/15/19 then 3 mo. GBP LIBOR + 2.550%) | | | 5.641 | % | | | 7/15/35 | | | | 223,000 | GBP | | | 267,162 | (c)(f) |
NCL Corp. Ltd., Senior Notes | | | 4.750 | % | | | 12/15/21 | | | | 371,000 | | | | 371,000 | (a) |
Pinnacle Bidco PLC, Senior Secured Notes | | | 6.375 | % | | | 2/15/25 | | | | 110,000 | GBP | | | 146,618 | (a) |
Silversea Cruise Finance Ltd., Senior Secured Notes | | | 7.250 | % | | | 2/1/25 | | | | 262,000 | | | | 284,296 | (a) |
VOC Escrow Ltd., Senior Secured Notes | | | 5.000 | % | | | 2/15/28 | | | | 1,460,000 | | | | 1,386,577 | (a) |
Total Hotels, Restaurants & Leisure | | | | | | | | | | | | | | | 4,759,553 | |
Household Durables — 0.6% | | | | | | | | | | | | | | | | |
Lennar Corp., Senior Notes | | | 4.750 | % | | | 11/29/27 | | | | 560,000 | | | | 527,968 | |
LGI Homes Inc., Senior Notes | | | 6.875 | % | | | 7/15/26 | | | | 390,000 | | | | 390,000 | (a) |
Total Household Durables | | | | | | | | | | | | | | | 917,968 | |
Media — 7.5% | | | | | | | | | | | | | | | | |
Altice France SA, Senior Secured Notes | | | 6.000 | % | | | 5/15/22 | | | | 750,000 | | | | 753,600 | (a) |
Altice France SA, Senior Secured Notes | | | 6.250 | % | | | 5/15/24 | | | | 650,000 | | | | 633,750 | (a) |
Altice France SA, Senior Secured Notes | | | 7.375 | % | | | 5/1/26 | | | | 2,790,000 | | | | 2,738,245 | (a) |
Altice Luxembourg SA, Senior Secured Notes | | | 7.750 | % | | | 5/15/22 | | | | 2,320,000 | | | | 2,253,300 | (a) |
CCO Holdings LLC/CCO Holdings Capital Corp., Senior Notes | | | 5.125 | % | �� | | 5/1/27 | | | | 720,000 | | | | 675,450 | (a) |
See Notes to Financial Statements.
| | |
| 6 | | Western Asset Variable Global High Yield Bond Portfolio 2018 Semi-Annual Report |
Western Asset Variable Global High Yield Bond Portfolio
| | | | | | | | | | | | | | | | |
| Security | | Rate | | | Maturity
Date | | | Face
Amount† | | | Value | |
Media — continued | | | | | | | | | | | | | | | | |
CCO Holdings LLC/CCO Holdings Capital Corp., Senior Notes | | | 5.000 | % | | | 2/1/28 | | | | 820,000 | | | $ | 754,400 | (a) |
DISH DBS Corp., Senior Notes | | | 5.000 | % | | | 3/15/23 | | | | 100,000 | | | | 87,125 | |
DISH DBS Corp., Senior Notes | | | 5.875 | % | | | 11/15/24 | | | | 1,030,000 | | | | 875,500 | |
DISH DBS Corp., Senior Notes | | | 7.750 | % | | | 7/1/26 | | | | 2,380,000 | | | | 2,094,400 | |
Virgin Media Secured Finance PLC, Senior Secured Notes | | | 5.500 | % | | | 1/15/25 | | | | 504,000 | GBP | | | 679,039 | (c) |
Total Media | | | | | | | | | | | | | | | 11,544,809 | |
Specialty Retail — 1.4% | | | | | | | | | | | | | | | | |
Hertz Corp., Senior Notes | | | 5.875 | % | | | 10/15/20 | | | | 490,000 | | | | 481,425 | |
Masaria Investments SAU, Senior Secured Bonds | | | 5.000 | % | | | 9/15/24 | | | | 130,000 | EUR | | | 143,540 | (a) |
Masaria Investments SAU, Senior Secured Bonds, (3 mo. Euribor +5.250%) | | | 4.890 | % | | | 9/15/24 | | | | 360,000 | EUR | | | 399,808 | (a)(f) |
Maxeda DIY Holding BV, Senior Secured Notes | | | 6.125 | % | | | 7/15/22 | | | | 339,000 | EUR | | | 361,912 | (c) |
Maxeda DIY Holding BV, Senior Secured Notes | | | 6.125 | % | | | 7/15/22 | | | | 260,000 | EUR | | | 277,572 | (a) |
ServiceMaster Co. LLC, Senior Notes | | | 5.125 | % | | | 11/15/24 | | | | 438,000 | | | | 425,955 | (a) |
Total Specialty Retail | | | | | | | | | | | | | | | 2,090,212 | |
Textiles, Apparel & Luxury Goods — 0.7% | | | | | | | | | | | | | | | | |
CBR Fashion Finance BV, Senior Secured Notes | | | 5.125 | % | | | 10/1/22 | | | | 300,000 | EUR | | | 301,131 | (c) |
Hanesbrands Inc., Senior Notes | | | 4.625 | % | | | 5/15/24 | | | | 90,000 | | | | 88,200 | (a) |
Hanesbrands Inc., Senior Notes | | | 4.875 | % | | | 5/15/26 | | | | 730,000 | | | | 708,100 | (a) |
Total Textiles, Apparel & Luxury Goods | | | | | | | | | | | | | | | 1,097,431 | |
Total Consumer Discretionary | | | | | | | | | | | | | | | 23,623,491 | |
| Consumer Staples — 0.4% | | | | | | | | | | | | | | | | |
Food Products — 0.1% | | | | | | | | | | | | | | | | |
Boparan Finance PLC, Senior Secured Notes | | | 5.500 | % | | | 7/15/21 | | | | 170,000 | GBP | | | 195,854 | (c) |
Household Products — 0.3% | | | | | | | | | | | | | | | | |
Spectrum Brands, Inc., Senior Notes | | | 5.750 | % | | | 7/15/25 | | | | 480,000 | | | | 476,400 | |
Total Consumer Staples | | | | | | | | | | | | | | | 672,254 | |
| Energy — 11.7% | | | | | | | | | | | | | | | | |
Energy Equipment & Services — 0.3% | | | | | | | | | | | | | | | | |
Transocean Guardian Ltd., Senior Secured Notes | | | 5.875 | % | | | 1/15/24 | | | | 220,000 | | | | 219,450 | (a) |
Transocean, Inc., Senior Notes | | | 6.800 | % | | | 3/15/38 | | | | 240,000 | | | | 196,200 | |
Total Energy Equipment & Services | | | | | | | | | | | | | | | 415,650 | |
Oil, Gas & Consumable Fuels — 11.4% | | | | | | | | | | | | | | | | |
Berry Petroleum Co. Escrow | | | — | | | | — | | | | 120,000 | | | | 0 | *(d)(e)(g) |
Berry Petroleum Co. Escrow | | | — | | | | — | | | | 630,000 | | | | 0 | *(d)(e)(g) |
Blue Racer Midstream LLC / Blue Racer Finance Corp., Senior Notes | | | 6.625 | % | | | 7/15/26 | | | | 80,000 | | | | 79,376 | (a) |
Blue Racer Midstream LLC/Blue Racer Finance Corp., Senior Notes | | | 6.125 | % | | | 11/15/22 | | | | 360,000 | | | | 365,400 | (a) |
See Notes to Financial Statements.
| | |
| Western Asset Variable Global High Yield Bond Portfolio 2018 Semi-Annual Report | | 7 |
Schedule of investments (unaudited) (cont’d)
June 30, 2018
Western Asset Variable Global High Yield Bond Portfolio
| | | | | | | | | | | | | | | | |
| Security | | Rate | | | Maturity
Date | | | Face
Amount† | | | Value | |
Oil, Gas & Consumable Fuels — continued | | | | | | | | | | | | | | | | |
Chesapeake Energy Corp., Senior Notes | | | 8.000 | % | | | 1/15/25 | | | | 350,000 | | | $ | 357,333 | (a) |
Chesapeake Energy Corp., Senior Notes | | | 8.000 | % | | | 6/15/27 | | | | 180,000 | | | | 183,600 | (a) |
Genesis Energy LP / Genesis Energy Finance Corp., Senior Notes | | | 6.000 | % | | | 5/15/23 | | | | 270,000 | | | | 266,288 | |
Magnum Hunter Resources Corp. Escrow | | | — | | | | — | | | | 810,000 | | | | 0 | *(d)(e)(g) |
MEG Energy Corp., Senior Notes | | | 6.375 | % | | | 1/30/23 | | | | 40,000 | | | | 37,400 | (a) |
MEG Energy Corp., Senior Notes | | | 7.000 | % | | | 3/31/24 | | | | 1,350,000 | | | | 1,265,625 | (a) |
NGL Energy Partners LP/NGL Energy Finance Corp., Senior Notes | | | 7.500 | % | | | 11/1/23 | | | | 370,000 | | | | 375,088 | |
Oasis Petroleum Inc., Senior Notes | | | 6.250 | % | | | 5/1/26 | | | | 410,000 | | | | 414,612 | (a) |
Petrobras Global Finance BV, Senior Notes | | | 4.375 | % | | | 5/20/23 | | | | 1,140,000 | | | | 1,071,030 | |
Petrobras Global Finance BV, Senior Notes | | | 7.375 | % | | | 1/17/27 | | | | 670,000 | | | | 670,837 | |
Petrobras Global Finance BV, Senior Notes | | | 5.999 | % | | | 1/27/28 | | | | 1,260,000 | | | | 1,142,505 | (a) |
Petrobras Global Finance BV, Senior Notes | | | 5.750 | % | | | 2/1/29 | | | | 3,980,000 | | | | 3,504,907 | |
PT Pertamina Persero, Senior Notes | | | 5.250 | % | | | 5/23/21 | | | | 370,000 | | | | 382,487 | (c) |
Rockies Express Pipeline LLC, Senior Notes | | | 7.500 | % | | | 7/15/38 | | | | 90,000 | | | | 106,650 | (a) |
Targa Resources Partners LP/Targa Resources Partners Finance Corp., Senior Notes | | | 5.250 | % | | | 5/1/23 | | | | 20,000 | | | | 20,050 | |
Targa Resources Partners LP/Targa Resources Partners Finance Corp., Senior Notes | | | 4.250 | % | | | 11/15/23 | | | | 150,000 | | | | 144,375 | |
Targa Resources Partners LP/Targa Resources Partners Finance Corp., Senior Notes | | | 5.875 | % | | | 4/15/26 | | | | 1,290,000 | | | | 1,301,287 | (a) |
Targa Resources Partners LP/Targa Resources Partners Finance Corp., Senior Notes | | | 5.375 | % | | | 2/1/27 | | | | 25,000 | | | | 24,313 | |
Targa Resources Partners LP/Targa Resources Partners Finance Corp., Senior Notes | | | 5.000 | % | | | 1/15/28 | | | | 230,000 | | | | 214,475 | (a) |
Transportadora de Gas del Peru SA, Senior Notes | | | 4.250 | % | | | 4/30/28 | | | | 1,250,000 | | | | 1,208,562 | (a) |
Transportadora de Gas del Sur SA, Senior Notes | | | 6.750 | % | | | 5/2/25 | | | | 500,000 | | | | 460,000 | (a) |
Ultrapar International SA, Senior Notes | | | 5.250 | % | | | 10/6/26 | | | | 480,000 | | | | 447,360 | (a) |
Whiting Petroleum Corp., Senior Notes | | | 6.250 | % | | | 4/1/23 | | | | 150,000 | | | | 154,125 | |
Whiting Petroleum Corp., Senior Notes | | | 6.625 | % | | | 1/15/26 | | | | 290,000 | | | | 299,063 | (a) |
Williams Cos Inc., Senior Notes | | | 3.700 | % | | | 1/15/23 | | | | 630,000 | | | | 612,675 | |
Williams Cos Inc., Senior Notes | | | 4.550 | % | | | 6/24/24 | | | | 260,000 | | | | 261,300 | |
Williams Cos Inc., Senior Notes | | | 7.500 | % | | | 1/15/31 | | | | 680,000 | | | | 812,158 | |
Williams Cos Inc., Senior Notes | | | 5.750 | % | | | 6/24/44 | | | | 260,000 | | | | 270,075 | |
WPX Energy, Inc., Senior Notes | | | 5.750 | % | | | 6/1/26 | | | | 150,000 | | | | 150,141 | |
YPF Sociedad Anonima, Senior Notes | | | 8.500 | % | | | 3/23/21 | | | | 490,000 | | | | 499,310 | (a) |
YPF Sociedad Anonima, Senior Notes | | | 8.500 | % | | | 7/28/25 | | | | 400,000 | | | | 382,380 | (a) |
Total Oil, Gas & Consumable Fuels | | | | | | | | | | | | | | | 17,484,787 | |
Total Energy | | | | | | | | | | | | | | | 17,900,437 | |
See Notes to Financial Statements.
| | |
| 8 | | Western Asset Variable Global High Yield Bond Portfolio 2018 Semi-Annual Report |
Western Asset Variable Global High Yield Bond Portfolio
| | | | | | | | | | | | | | | | |
| Security | | Rate | | | Maturity
Date | | | Face
Amount† | | | Value | |
| Financials — 9.2% | | | | | | | | | | | | | | | | |
Banks — 4.7% | | | | | | | | | | | | | | | | |
Barclays Bank PLC, Subordinated Notes | | | 7.625 | % | | | 11/21/22 | | | | 540,000 | | | $ | 582,322 | |
CIT Group Inc., Senior Notes | | | 4.125 | % | | | 3/9/21 | | | | 180,000 | | | | 179,325 | |
CIT Group Inc., Senior Notes | | | 5.000 | % | | | 8/15/22 | | | | 601,000 | | | | 609,264 | |
CIT Group Inc., Senior Notes | | | 5.000 | % | | | 8/1/23 | | | | 110,000 | | | | 111,551 | |
CIT Group Inc., Senior Notes | | | 5.250 | % | | | 3/7/25 | | | | 240,000 | | | | 242,400 | |
Credit Agricole SA, Junior Subordinated Notes (8.125% to 12/23/25 then USD 5 year Swap Rate + 6.185%) | | | 8.125 | % | | | 12/23/25 | | | | 430,000 | | | | 456,338 | (a)(f) |
Intesa Sanpaolo SpA, Subordinated Notes | | | 5.710 | % | | | 1/15/26 | | | | 2,070,000 | | | | 1,895,543 | (a) |
Itau Unibanco Holding SA Island, Subordinated Notes | | | 5.650 | % | | | 3/19/22 | | | | 400,000 | | | | 407,000 | (c) |
NatWest Markets NV, Subordinated Notes | | | 7.750 | % | | | 5/15/23 | | | | 160,000 | | | | 176,891 | |
Royal Bank of Scotland Group PLC, Junior Subordinated Notes (8.625% to 8/15/21 then USD 5 year Swap Rate + 7.598%) | | | 8.625 | % | | | 8/15/21 | | | | 210,000 | | | | 223,703 | (f) |
Royal Bank of Scotland Group PLC, Subordinated Notes | | | 6.000 | % | | | 12/19/23 | | | | 820,000 | | | | 861,485 | |
Santander UK Group Holdings PLC, Junior Subordinated Bonds, (7.375% to 6/24/22 then GBP 5 year Swap Rate + 5.543%) | | | 7.375 | % | | | 6/24/22 | | | | 310,000 | GBP | | | 426,817 | (c)(f)(h) |
Sberbank of Russia Via SB Capital SA, Subordinated Notes (5.500% to 2/26/19 then 5 year Treasury Constant Maturity Rate + 4.023%) | | | 5.500 | % | | | 2/26/24 | | | | 700,000 | | | | 703,034 | (c)(f) |
TC Ziraat Bankasi AS, Senior Notes | | | 5.125 | % | | | 5/3/22 | | | | 350,000 | | | | 325,484 | (a) |
Total Banks | | | | | | | | | | | | | | | 7,201,157 | |
Consumer Finance — 0.1% | | | | | | | | | | | | | | | | |
Navient Corp., Senior Notes | | | 6.750 | % | | | 6/15/26 | | | | 210,000 | | | | 205,737 | |
Diversified Financial Services — 4.0% | | | | | | | | | | | | | | | | |
ASP AMC Merger Subordinated Inc., Senior Notes | | | 8.000 | % | | | 5/15/25 | | | | 250,000 | | | | 208,750 | (a) |
DAE Funding LLC, Senior Notes | | | 5.000 | % | | | 8/1/24 | | | | 3,633,000 | | | | 3,498,579 | (a) |
Garfunkelux Holdco 3 SA, Senior Secured Notes | | | 7.500 | % | | | 8/1/22 | | | | 250,000 | EUR | | | 285,296 | (c) |
Hunt Cos., Inc., Senior Secured Notes | | | 6.250 | % | | | 2/15/26 | | | | 250,000 | | | | 233,750 | (a) |
Jerrold Finco PLC, Senior Secured Notes | | | 6.125 | % | | | 1/15/24 | | | | 220,000 | GBP | | | 292,904 | (a) |
LHC3 PLC, Senior Secured Bonds (4.125% PIK) | | | 4.125 | % | | | 8/15/24 | | | | 220,000 | EUR | | | 257,237 | (a)(b) |
Park Aerospace Holdings Ltd., Senior Notes | | | 5.500 | % | | | 2/15/24 | | | | 830,000 | | | | 821,526 | (a) |
Travelport Corporate Finance PLC, Senior Secured Notes | | | 6.000 | % | | | 3/15/26 | | | | 462,000 | | | | 466,620 | (a) |
Total Diversified Financial Services | | | | | | | | | | | | | | | 6,064,662 | |
Insurance — 0.4% | | | | | | | | | | | | | | | | |
Fidelity & Guaranty Life Holdings Inc., Senior Notes | | | 5.500 | % | | | 5/1/25 | | | | 210,000 | | | | 205,275 | (a) |
Galaxy Bidco Ltd., Senior Secured Notes | | | 6.375 | % | | | 11/15/20 | | | | 280,000 | GBP | | | 370,121 | (c) |
Total Insurance | | | | | | | | | | | | | | | 575,396 | |
Total Financials | | | | | | | | | | | | | | | 14,046,952 | |
See Notes to Financial Statements.
| | |
| Western Asset Variable Global High Yield Bond Portfolio 2018 Semi-Annual Report | | 9 |
Schedule of investments (unaudited) (cont’d)
June 30, 2018
Western Asset Variable Global High Yield Bond Portfolio
| | | | | | | | | | | | | | | | |
| Security | | Rate | | | Maturity
Date | | | Face
Amount† | | | Value | |
| Health Care — 7.7% | | | | | | | | | | | | | | | | |
Health Care Equipment & Supplies — 0.2% | | | | | | | | | | | | | | | | |
IDH Finance PLC, Senior Secured Notes | | | 6.250 | % | | | 8/15/22 | | | | 280,000 | GBP | | $ | 339,317 | (c) |
Health Care Providers & Services — 2.1% | | | | | | | | | | | | | | | | |
Air Medical Group Holdings Inc., Senior Notes | | | 6.375 | % | | | 5/15/23 | | | | 190,000 | | | | 177,650 | (a) |
BioScrip Inc., First Lien Notes (1 mo. USD LIBOR + 7.000%) | | | 8.224 | % | | | 6/30/22 | | | | 459,000 | | | | 479,655 | (e)(f)(i) |
Centene Corp., Senior Notes | | | 4.750 | % | | | 5/15/22 | | | | 260,000 | | | | 262,925 | |
Centene Corp., Senior Notes | | | 6.125 | % | | | 2/15/24 | | | | 90,000 | | | | 95,062 | |
Centene Corp., Senior Notes | | | 4.750 | % | | | 1/15/25 | | | | 750,000 | | | | 748,125 | |
DaVita HealthCare Partners, Senior Notes | | | 5.750 | % | | | 8/15/22 | | | | 130,000 | | | | 132,276 | |
HCA Inc., Senior Bonds | | | 5.375 | % | | | 2/1/25 | | | | 30,000 | | | | 29,616 | |
HCA Inc., Senior Notes | | | 7.500 | % | | | 2/15/22 | | | | 270,000 | | | | 294,300 | |
HCA Inc., Senior Notes | | | 5.875 | % | | | 5/1/23 | | | | 10,000 | | | | 10,400 | |
HCA Inc., Senior Secured Notes | | | 5.000 | % | | | 3/15/24 | | | | 530,000 | | | | 531,325 | |
HCA Inc., Senior Secured Notes | | | 5.250 | % | | | 6/15/26 | | | | 340,000 | | | | 338,538 | |
Total Health Care Providers & Services | | | | | | | | | | | | | | | 3,099,872 | |
Pharmaceuticals — 5.4% | | | | | | | | | | | | | | | | |
Endo Finance LLC/Endo Finco, Inc., Senior Notes | | | 7.250 | % | | | 1/15/22 | | | | 100,000 | | | | 92,500 | (a) |
Endo Finance LLC/Endo Finco, Inc., Senior Notes | | | 5.375 | % | | | 1/15/23 | | | | 90,000 | | | | 72,450 | (a) |
Nidda BondCo GmbH, Senior Notes | | | 5.000 | % | | | 9/30/25 | | | | 280,000 | EUR | | | 300,021 | (c) |
Teva Pharmaceutical Finance Co. BV, Senior Notes | | | 3.650 | % | | | 11/10/21 | | | | 120,000 | | | | 115,013 | |
Teva Pharmaceutical Finance Netherlands III BV, Senior Notes | | | 2.200 | % | | | 7/21/21 | | | | 5,570,000 | | | | 5,170,121 | |
Valeant Pharmaceuticals International Inc., Senior Notes | | | 7.250 | % | | | 7/15/22 | | | | 340,000 | | | | 348,215 | (a) |
Valeant Pharmaceuticals International Inc., Senior Notes | | | 5.500 | % | | | 3/1/23 | | | | 250,000 | | | | 233,750 | (a) |
Valeant Pharmaceuticals International Inc., Senior Notes | | | 6.125 | % | | | 4/15/25 | | | | 2,130,000 | | | | 1,970,250 | (a) |
Total Pharmaceuticals | | | | | | | | | | | | | | | 8,302,320 | |
Total Health Care | | | | | | | | | | | | | | | 11,741,509 | |
| Industrials — 4.3% | | | | | | | | | | | | | | | | |
Aerospace & Defense — 0.5% | | | | | | | | | | | | | | | | |
BBA US Holdings Inc., Senior Notes | | | 5.375 | % | | | 5/1/26 | | | | 430,000 | | | | 432,692 | (a) |
BWX Technologies Inc., Senior Notes | | | 5.375 | % | | | 7/15/26 | | | | 290,000 | | | | 294,350 | (a) |
Total Aerospace & Defense | | | | | | | | | | | | | | | 727,042 | |
Airlines — 0.0% | | | | | | | | | | | | | | | | |
Continental Airlines Inc., Pass-Through Certificates, Secured Bonds | | | 8.388 | % | | | 11/1/20 | | | | 30 | | | | 33 | |
Building Products — 0.4% | | | | | | | | | | | | | | | | |
Standard Industries Inc., Senior Notes | | | 5.375 | % | | | 11/15/24 | | | | 320,000 | | | | 317,600 | (a) |
Standard Industries Inc., Senior Notes | | | 4.750 | % | | | 1/15/28 | | | | 320,000 | | | | 295,200 | (a) |
Total Building Products | | | | | | | | | | | | | | | 612,800 | |
See Notes to Financial Statements.
| | |
| 10 | | Western Asset Variable Global High Yield Bond Portfolio 2018 Semi-Annual Report |
Western Asset Variable Global High Yield Bond Portfolio
| | | | | | | | | | | | | | | | |
| Security | | Rate | | | Maturity
Date | | | Face
Amount† | | | Value | |
Commercial Services & Supplies — 1.4% | | | | | | | | | | | | | | | | |
ADT Corp., Senior Secured Notes | | | 6.250 | % | | | 10/15/21 | | | | 210,000 | | | $ | 218,400 | |
Brink’s Co., Senior Notes | | | 4.625 | % | | | 10/15/27 | | | | 530,000 | | | | 496,875 | (a) |
GFL Environmental, Inc., Senior Notes | | | 5.375 | % | | | 3/1/23 | | | | 150,000 | | | | 139,125 | (a) |
United Rentals North America, Inc., Senior Notes | | | 5.500 | % | | | 7/15/25 | | | | 550,000 | | | | 556,187 | |
United Rentals North America, Inc., Senior Notes | | | 4.625 | % | | | 10/15/25 | | | | 130,000 | | | | 124,150 | |
United Rentals North America, Inc., Senior Notes | | | 4.875 | % | | | 1/15/28 | | | | 380,000 | | | | 352,811 | |
Waste Pro USA, Inc., Senior Notes | | | 5.500 | % | | | 2/15/26 | | | | 240,000 | | | | 231,300 | (a) |
Total Commercial Services & Supplies | | | | | | | | | | | | | | | 2,118,848 | |
Containers & Packaging — 0.2% | | | | | | | | | | | | | | | | |
Hercule Debtco Sarl, Senior Secured Notes (6.750% Cash or 7.500% PIK) | | | 6.750 | % | | | 6/30/24 | | | | 260,000 | EUR | | | 297,601 | (a)(b) |
Machinery — 0.7% | | | | | | | | | | | | | | | | |
Allison Transmission Inc., Senior Bonds | | | 5.000 | % | | | 10/1/24 | | | | 690,000 | | | | 680,513 | (a) |
Allison Transmission Inc., Senior Notes | | | 4.750 | % | | | 10/1/27 | | | | 390,000 | | | | 364,650 | (a) |
Total Machinery | | | | | | | | | | | | | | | 1,045,163 | |
Marine — 0.2% | | | | | | | | | | | | | | | | |
Navios Maritime Acquisition Corp./Navios Acquisition Finance U.S. Inc., Senior Secured Notes | | | 8.125 | % | | | 11/15/21 | | | | 440,000 | | | | 361,900 | (a) |
Trading Companies & Distributors — 0.8% | | | | | | | | | | | | | | | | |
Ashtead Capital Inc., Secured Notes | | | 4.125 | % | | | 8/15/25 | | | | 880,000 | | | | 825,000 | (a) |
Ashtead Capital Inc., Secured Notes | | | 4.375 | % | | | 8/15/27 | | | | 250,000 | | | | 233,125 | (a) |
Beacon Escrow Corp., Senior Notes | | | 4.875 | % | | | 11/1/25 | | | | 250,000 | | | | 231,100 | (a) |
Total Trading Companies & Distributors | | | | | | | | | | | | | | | 1,289,225 | |
Transportation Infrastructure — 0.1% | | | | | | | | | | | | | | | | |
Neovia Logistics Services LLC/Neovia Logistics Intermediate Finance Corp., Senior Notes (10.000% Cash or 10.750% PIK) | | | 10.000 | % | | | 4/1/20 | | | | 302,977 | | | | 172,697 | (a)(b) |
Neovia Logistics Services LLC/SPL Logistics Finance Corp., Senior Secured Notes | | | 8.875 | % | | | 8/1/20 | | | | 50,000 | | | | 42,750 | (a) |
Total Transportation Infrastructure | | | | | | | | | | | | | | | 215,447 | |
Total Industrials | | | | | | | | | | | | | | | 6,668,059 | |
| Information Technology — 1.8% | | | | | | | | | | | | | | | | |
Internet Software & Services — 1.0% | | | | | | | | | | | | | | | | |
IPD 3 BV, Senior Secured Notes | | | 4.500 | % | | | 7/15/22 | | | | 260,000 | EUR | | | 308,147 | (a) |
Match Group Inc., Senior Notes | | | 5.000 | % | | | 12/15/27 | | | | 1,040,000 | | | | 969,800 | (a) |
Match Group, Inc., Senior Notes | | | 6.375 | % | | | 6/1/24 | | | | 230,000 | | | | 242,938 | |
Total Internet Software & Services | | | | | | | | | | | | | | | 1,520,885 | |
IT Services — 0.3% | | | | | | | | | | | | | | | | |
Vantiv LLC/Vanity Issuer Corp., Senior Notes | | | 4.375 | % | | | 11/15/25 | | | | 433,000 | | | | 414,801 | (a) |
See Notes to Financial Statements.
| | |
| Western Asset Variable Global High Yield Bond Portfolio 2018 Semi-Annual Report | | 11 |
Schedule of investments (unaudited) (cont’d)
June 30, 2018
Western Asset Variable Global High Yield Bond Portfolio
| | | | | | | | | | | | | | | | |
| Security | | Rate | | | Maturity
Date | | | Face
Amount† | | | Value | |
Software — 0.5% | | | | | | | | | | | | | | | | |
CDK Global Inc., Senior Notes | | | 5.875 | % | | | 6/15/26 | | | | 440,000 | | | $ | 449,460 | |
j2 Cloud Services LLC/j2 Global Co.-Obligor Inc., Senior Notes | | | 6.000 | % | | | 7/15/25 | | | | 400,000 | | | | 407,000 | (a) |
Total Software | | | | | | | | | | | | | | | 856,460 | |
Total Information Technology | | | | | | | | | | | | | | | 2,792,146 | |
| Materials — 4.2% | | | | | | | | | | | | | | | | |
Chemicals — 0.5% | | | | | | | | | | | | | | | | |
Monitchem HoldCo 2 SA, Senior Notes | | | 6.875 | % | | | 6/15/22 | | | | 350,000 | EUR | | | 362,846 | (c) |
Valvoline, Inc., Senior Notes | | | 5.500 | % | | | 7/15/24 | | | | 350,000 | | | | 354,375 | |
Total Chemicals | | | | | | | | | | | | | | | 717,221 | |
Containers & Packaging — 1.1% | | | | | | | | | | | | | | | | |
ARD Securities Finance SARL, Senior Secured Notes, (8.75% PIK) | | | 8.750 | % | | | 1/31/23 | | | | 310,000 | | | | 316,975 | (a)(b) |
Ardagh Packaging Finance PLC/Ardagh MP Holdings USA Inc., Senior Notes | | | 6.000 | % | | | 2/15/25 | | | | 330,000 | | | | 322,163 | (a) |
Ardagh Packaging Finance PLC/Ardagh MP Holdings USA Inc., Senior Secured Notes | | | 4.625 | % | | | 5/15/23 | | | | 220,000 | | | | 218,075 | (a) |
Pactiv LLC, Senior Notes | | | 7.950 | % | | | 12/15/25 | | | | 720,000 | | | | 792,000 | |
Total Containers & Packaging | | | | | | | | | | | | | | | 1,649,213 | |
Metals & Mining — 2.6% | | | | | | | | | | | | | | | | |
Alcoa Nederland Holding BV, Senior Notes | | | 6.750 | % | | | 9/30/24 | | | | 370,000 | | | | 392,048 | (a) |
Alcoa Nederland Holding BV, Senior Notes | | | 7.000 | % | | | 9/30/26 | | | | 250,000 | | | | 267,500 | (a) |
Alcoa Nederland Holding BV, Senior Notes | | | 6.125 | % | | | 5/15/28 | | | | 400,000 | | | | 403,500 | (a) |
ArcelorMittal SA, Senior Bonds | | | 6.125 | % | | | 6/1/25 | | | | 340,000 | | | | 368,050 | |
First Quantum Minerals Ltd., Senior Notes | | | 6.500 | % | | | 3/1/24 | | | | 200,000 | | | | 193,500 | (a) |
Freeport-McMoRan Inc., Senior Notes | | | 6.875 | % | | | 2/15/23 | | | | 610,000 | | | | 645,807 | |
Freeport-McMoRan Inc., Senior Notes | | | 3.875 | % | | | 3/15/23 | | | | 1,440,000 | | | | 1,364,400 | |
Freeport-McMoRan Inc., Senior Notes | | | 5.450 | % | | | 3/15/43 | | | | 360,000 | | | | 317,592 | |
Midwest Vanadium Pty Ltd., Senior Secured Notes | | | 11.500 | % | | | 2/15/18 | | | | 391,562 | | | | 4,405 | *(a)(j) |
Teck Resources Ltd., Senior Notes | | | 4.750 | % | | | 1/15/22 | | | | 110,000 | | | | 110,780 | |
Total Metals & Mining | | | | | | | | | | | | | | | 4,067,582 | |
Total Materials | | | | | | | | | | | | | | | 6,434,016 | |
| Real Estate — 1.5% | | | | | | | | | | | | | | | | |
Equity Real Estate Investment Trusts (REITs) — 1.0% | | | | | | | | | | | | | | | | |
CoreCivic Inc., Senior Notes | | | 4.750 | % | | | 10/15/27 | | | | 320,000 | | | | 291,200 | |
CTR Partnership LP/CareTrust Capital Corp., Senior Notes | | | 5.250 | % | | | 6/1/25 | | | | 340,000 | | | | 328,950 | |
MPT Operating Partnership LP/MPT Finance Corp., Senior Notes | | | 5.000 | % | | | 10/15/27 | | | | 910,000 | | | | 871,325 | |
Total Equity Real Estate Investment Trusts (REITs) | | | | | | | | | | | | | | | 1,491,475 | |
See Notes to Financial Statements.
| | |
| 12 | | Western Asset Variable Global High Yield Bond Portfolio 2018 Semi-Annual Report |
Western Asset Variable Global High Yield Bond Portfolio
| | | | | | | | | | | | | | | | |
| Security | | Rate | | | Maturity
Date | | | Face
Amount† | | | Value | |
Real Estate Management & Development — 0.5% | | | | | | | | | | | | | | | | |
Tesco Property Finance 6 PLC, Senior Secured Notes | | | 5.411 | % | | | 7/13/44 | | | | 242,880 | GBP | | $ | 363,498 | (c) |
WeWork Cos. Inc., Senior Notes | | | 7.875 | % | | | 5/1/25 | | | | 400,000 | | | | 385,000 | (a) |
Total Real Estate Management & Development | | | | | | | | | | | | | | | 748,498 | |
Total Real Estate | | | | | | | | | | | | | | | 2,239,973 | |
| Telecommunication Services — 7.4% | | | | | | | | | | | | | | | | |
Diversified Telecommunication Services — 4.2% | | | | | | | | | | | | | | | | |
Cogent Communications Group, Inc., Senior Secured Notes | | | 5.375 | % | | | 3/1/22 | | | | 970,000 | | | | 999,100 | (a) |
Intelsat Jackson Holdings SA, Senior Bonds | | | 5.500 | % | | | 8/1/23 | | | | 325,000 | | | | 292,403 | |
Telecom Italia SpA, Senior Notes | | | 5.303 | % | | | 5/30/24 | | | | 1,590,000 | | | | 1,574,100 | (a) |
UPCB Finance IV Ltd., Senior Secured Notes | | | 5.375 | % | | | 1/15/25 | | | | 1,320,000 | | | | 1,260,732 | (a) |
Wind Tre SpA, Senior Secured Notes | | | 5.000 | % | | | 1/20/26 | | | | 240,000 | | | | 191,450 | (a) |
Windstream Services LLC/Windstream Finance Corp., Senior Notes | | | 7.750 | % | | | 10/15/20 | | | | 2,285,000 | | | | 2,062,213 | |
Total Diversified Telecommunication Services | | | | | | | | | | | | | | | 6,379,998 | |
Wireless Telecommunication Services — 3.2% | | | | | | | | | | | | | | | | |
CSC Holdings LLC, Senior Notes | | | 6.625 | % | | | 10/15/25 | | | | 900,000 | | | | 923,625 | (a) |
Millicom International Cellular SA, Senior Notes | | | 5.125 | % | | | 1/15/28 | | | | 420,000 | | | | 387,870 | (a) |
Sprint Capital Corp., Senior Notes | | | 6.875 | % | | | 11/15/28 | | | | 770,000 | | | | 739,200 | |
Sprint Capital Corp., Senior Notes | | | 8.750 | % | | | 3/15/32 | | | | 230,000 | | | | 246,675 | |
Sprint Corp., Senior Notes | | | 7.875 | % | | | 9/15/23 | | | | 1,350,000 | | | | 1,403,156 | |
VEON Holdings BV, Senior Notes | | | 7.504 | % | | | 3/1/22 | | | | 380,000 | | | | 406,410 | (c) |
VEON Holdings BV, Senior Notes | | | 5.950 | % | | | 2/13/23 | | | | 780,000 | | | | 788,190 | (a) |
Total Wireless Telecommunication Services | | | | | | | | | | | | | | | 4,895,126 | |
Total Telecommunication Services | | | | | | | | | | | | | | | 11,275,124 | |
| Utilities — 1.1% | | | | | | | | | | | | | | | | |
Electric Utilities — 0.7% | | | | | | | | | | | | | | | | |
NRG REMA LLC, Pass-Through Certificates, Senior Secured Bonds | | | 9.681 | % | | | 7/2/26 | | | | 380,000 | | | | 273,600 | |
Pampa Energia SA, Senior Notes | | | 7.500 | % | | | 1/24/27 | | | | 480,000 | | | | 434,400 | (a) |
PT Perusahaan Listrik Negara, Senior Notes | | | 5.500 | % | | | 11/22/21 | | | | 390,000 | | | | 408,041 | (c) |
Total Electric Utilities | | | | | | | | | | | | | | | 1,116,041 | |
Gas Utilities — 0.4% | | | | | | | | | | | | | | | | |
Suburban Propane Partners LP/Suburban Energy Finance Corp., Senior Notes | | | 5.875 | % | | | 3/1/27 | | | | 550,000 | | | | 517,000 | |
Total Utilities | | | | | | | | | | | | | | | 1,633,041 | |
Total Corporate Bonds & Notes (Cost — $100,488,111) | | | | | | | | | | | | | | | 99,027,002 | |
See Notes to Financial Statements.
| | |
| Western Asset Variable Global High Yield Bond Portfolio 2018 Semi-Annual Report | | 13 |
Schedule of investments (unaudited) (cont’d)
June 30, 2018
Western Asset Variable Global High Yield Bond Portfolio
| | | | | | | | | | | | | | | | |
| Security | | Rate | | | Maturity
Date | | | Face
Amount† | | | Value | |
| Sovereign Bonds — 19.8% | | | | | | | | | | | | | | | | |
Argentina — 4.6% | | | | | | | | | | | | | | | | |
Argentine Republic Government International Bond, Senior Notes | | | 7.500 | % | | | 4/22/26 | | | | 710,000 | | | $ | 657,638 | |
Argentine Republic Government International Bond, Senior Notes | | | 6.875 | % | | | 1/26/27 | | | | 890,000 | | | | 786,537 | |
Argentine Republic Government International Bond, Senior Notes | | | 5.875 | % | | | 1/11/28 | | | | 3,080,000 | | | | 2,512,125 | |
Autonomous City of Buenos Aires Argentina, Senior Notes | | | 7.500 | % | | | 6/1/27 | | | | 600,000 | | | | 545,136 | (a) |
Provincia de Buenos Aires, Senior Notes | | | 7.875 | % | | | 6/15/27 | | | | 950,000 | | | | 836,000 | (a) |
Provincia de Buenos Aires/Argentina, Senior Notes | | | 9.125 | % | | | 3/16/24 | | | | 890,000 | | | | 858,850 | (a) |
Republic of Argentina, Bonds (Argentina Central Bank 7 Day Repo Reference Rate) | | | 40.000 | % | | | 6/21/20 | | | | 24,650,000 | ARS | | | 882,580 | (f) |
Total Argentina | | | | | | | | | | | | | | | 7,078,866 | |
Brazil — 3.3% | | | | | | | | | | | | | | | | |
Brazilian Government International Bond, Senior Notes | | | 4.250 | % | | | 1/7/25 | | | | 3,690,000 | | | | 3,491,662 | |
Federative Republic of Brazil, Notes | | | 10.000 | % | | | 1/1/21 | | | | 187,000 | BRL | | | 48,966 | |
Federative Republic of Brazil, Notes | | | 10.000 | % | | | 1/1/23 | | | | 3,400,000 | BRL | | | 857,310 | |
Federative Republic of Brazil, Notes | | | 10.000 | % | | | 1/1/27 | | | | 3,026,000 | BRL | | | 714,756 | |
Total Brazil | | | | | | | | | | | | | | | 5,112,694 | |
Colombia — 1.5% | | | | | | | | | | | | | | | | |
Colombia Government International Bond, Senior Notes | | | 4.000 | % | | | 2/26/24 | | | | 2,250,000 | | | | 2,250,563 | |
Costa Rica — 0.2% | | | | | | | | | | | | | | | | |
Costa Rica Government International Bond, Senior Notes | | | 7.000 | % | | | 4/4/44 | | | | 350,000 | | | | 343,000 | (a) |
Dominican Republic — 0.5% | | | | | | | | | | | | | | | | |
Dominican Republic International Bond, Senior Notes | | | 5.500 | % | | | 1/27/25 | | | | 200,000 | | | | 198,964 | (a) |
Dominican Republic International Bond, Senior Notes | | | 6.850 | % | | | 1/27/45 | | | | 600,000 | | | | 596,058 | (a) |
Total Dominican Republic | | | | | | | | | | | | | | | 795,022 | |
Ecuador — 1.1% | | | | | | | | | | | | | | | | |
Ecuador Government International Bond, Senior Notes | | | 10.750 | % | | | 3/28/22 | | | | 250,000 | | | | 257,613 | (a) |
Ecuador Government International Bond, Senior Notes | | | 8.750 | % | | | 6/2/23 | | | | 650,000 | | | | 611,292 | (c) |
Republic of Ecuador, Senior Bonds | | | 7.950 | % | | | 6/20/24 | | | | 980,000 | | | | 868,721 | (c) |
Total Ecuador | | | | | | | | | | | | | | | 1,737,626 | |
Egypt — 0.6% | | | | | | | | | | | | | | | | |
Arab Republic of Egypt, Senior Bonds | | | 5.577 | % | | | 2/21/23 | | | | 400,000 | | | | 380,000 | (a) |
Egypt Government International Bond, Senior Notes | | | 6.125 | % | | | 1/31/22 | | | | 240,000 | | | | 236,627 | (c) |
Egypt Government International Bond, Senior Notes | | | 7.500 | % | | | 1/31/27 | | | | 270,000 | | | | 266,073 | (a) |
Total Egypt | | | | | | | | | | | | | | | 882,700 | |
El Salvador — 0.2% | | | | | | | | | | | | | | | | |
El Salvador Government International Bond, Senior Notes | | | 6.375 | % | | | 1/18/27 | | | | 300,000 | | | | 280,875 | (a) |
See Notes to Financial Statements.
| | |
| 14 | | Western Asset Variable Global High Yield Bond Portfolio 2018 Semi-Annual Report |
Western Asset Variable Global High Yield Bond Portfolio
| | | | | | | | | | | | | | | | |
| Security | | Rate | | | Maturity
Date | | | Face
Amount† | | | Value | |
Ghana — 0.2% | | | | | | | | | | | | | | | | |
Ghana Government International Bond, Bonds | | | 10.750 | % | | | 10/14/30 | | | | 290,000 | | | $ | 353,162 | (a) |
Guatemala — 0.4% | | | | | | | | | | | | | | | | |
Guatemala Government Bond, Senior Notes | | | 4.375 | % | | | 6/5/27 | | | | 620,000 | | | | 576,600 | (a) |
Honduras — 0.5% | | | | | | | | | | | | | | | | |
Honduras Government International Bond, Senior Notes | | | 6.250 | % | | | 1/19/27 | | | | 700,000 | | | | 704,130 | (a) |
Indonesia — 0.6% | | | | | | | | | | | | | | | | |
Indonesia Government International Bond, Senior Notes | | | 5.950 | % | | | 1/8/46 | | | | 650,000 | | | | 714,317 | (c) |
Republic of Indonesia, Senior Notes | | | 3.850 | % | | | 7/18/27 | | | | 250,000 | | | | 237,597 | (a) |
Total Indonesia | | | | | | | | | | | | | | | 951,914 | |
Ivory Coast — 0.2% | | | | | | | | | | | | | | | | |
Ivory Coast Government International Bond, Senior Notes | | | 6.125 | % | | | 6/15/33 | | | | 200,000 | | | | 176,823 | (a) |
Ivory Coast Government International Bond, Senior Notes, Step Bond | | | 5.750 | % | | | 12/31/32 | | | | 185,000 | | | | 171,996 | (c) |
Total Ivory Coast | | | | | | | | | | | | | | | 348,819 | |
Nigeria — 0.3% | | | | | | | | | | | | | | | | |
Nigeria Government International Bond, Senior Notes | | | 6.500 | % | | | 11/28/27 | | | | 260,000 | | | | 242,545 | (c) |
Nigeria Government International Bond, Senior Notes | | | 7.875 | % | | | 2/16/32 | | | | 200,000 | | | | 196,712 | (a) |
Total Nigeria | | | | | | | | | | | | | | | 439,257 | |
Russia — 1.6% | | | | | | | | | | | | | | | | |
Russian Federal Bond, Bonds | | | 8.150 | % | | | 2/3/27 | | | | 57,800,000 | RUB | | | 956,014 | |
Russian Federal Bond, Bonds | | | 7.050 | % | | | 1/19/28 | | | | 95,633,000 | RUB | | | 1,473,222 | |
Total Russia | | | | | | | | | | | | | | | 2,429,236 | |
Senegal — 0.1% | | | | | | | | | | | | | | | | |
Senegal Government International Bond, Bonds | | | 6.250 | % | | | 5/23/33 | | | | 250,000 | | | | 222,313 | (a) |
South Africa — 0.3% | | | | | | | | | | | | | | | | |
Republic of South Africa Government International Bond, Senior Notes | | | 4.875 | % | | | 4/14/26 | | | | 400,000 | | | | 385,615 | |
Sri Lanka — 0.2% | | | | | | | | | | | | | | | | |
Sri Lanka Government International Bond, Senior Notes | | | 6.250 | % | | | 7/27/21 | | | | 240,000 | | | | 242,099 | (c) |
Turkey — 2.0% | | | | | | | | | | | | | | | | |
Turkey Government International Bond, Senior Notes | | | 4.250 | % | | | 4/14/26 | | | | 2,570,000 | | | | 2,202,025 | |
Turkey Government International Bond, Senior Notes | | | 4.875 | % | | | 10/9/26 | | | | 900,000 | | | | 794,033 | |
Total Turkey | | | | | | | | | | | | | | | 2,996,058 | |
Ukraine — 0.6% | | | | | | | | | | | | | | | | |
Ukraine Government International Bond, Senior Notes | | | 7.750 | % | | | 9/1/26 | | | | 400,000 | | | | 372,058 | (a) |
Ukraine Government International Bond, Senior Notes | | | 7.375 | % | | | 9/25/32 | | | | 600,000 | | | | 516,029 | (a) |
Total Ukraine | | | | | | | | | | | | | | | 888,087 | |
See Notes to Financial Statements.
| | |
| Western Asset Variable Global High Yield Bond Portfolio 2018 Semi-Annual Report | | 15 |
Schedule of investments (unaudited) (cont’d)
June 30, 2018
Western Asset Variable Global High Yield Bond Portfolio
| | | | | | | | | | | | | | | | |
| Security | | Rate | | | Maturity
Date | | | Face
Amount† | | | Value | |
Uruguay — 0.4% | | | | | | | | | | | | | | | | |
Uruguay Government International Bond, Senior Notes | | | 8.500 | % | | | 3/15/28 | | | | 24,910,000 | UYU | | $ | 688,504 | (c) |
Venezuela — 0.4% | | | | | | | | | | | | | | | | |
Venezuela Government International Bond, Senior Notes | | | 7.750 | % | | | 10/13/19 | | | | 1,474,000 | | | | 407,856 | *(c)(k) |
Venezuela Government International Bond, Senior Notes | | | 8.250 | % | | | 10/13/24 | | | | 610,000 | | | | 168,787 | *(c)(k) |
Total Venezuela | | | | | | | | | | | | | | | 576,643 | |
Total Sovereign Bonds (Cost — $33,795,935) | | | | | | | | | | | | | | | 30,283,783 | |
| Senior Loans — 7.5% | | | | | | | | | | | | | | | | |
| Consumer Discretionary — 4.5% | | | | | | | | | | | | | | | | |
Auto Components — 0.8% | | | | | | | | | | | | | | | | |
American Axle & Manufacturing Inc., Term Loan B (1 mo. LIBOR + 2.250%) | | | 3.000 | % | | | 4/6/24 | | | | 902,095 | | | | 900,065 | (f)(l)(m) |
American Media Inc., Bridge Loan (1 mo. LIBOR + 8.000%) | | | 10.334 | % | | | 9/30/18 | | | | 270,000 | | | | 264,769 | (f)(l)(m) |
Total Auto Components | | | | | | | | | | | | | | | 1,164,834 | |
Hotels, Restaurants & Leisure — 0.8% | | | | | | | | | | | | | | | | |
Aramark Services, Inc., Term Loan B3 (3 mo. LIBOR + 1.750%) | | | — | | | | 3/11/25 | | | | 937,493 | | | | 938,079 | (n) |
Hilton Worldwide Finance LLC, Term Loan B2 (1 mo. LIBOR + 1.750%) | | | 3.841 | % | | | 10/25/23 | | | | 348,970 | | | | 349,170 | (f)(l)(m)(n) |
Total Hotels, Restaurants & Leisure | | | | | | | | | | | | | | | 1,287,249 | |
Media — 1.2% | | | | | | | | | | | | | | | | |
Charter Communications Operating LLC, 2017 Term Loan B (1 mo. LIBOR + 2.000%) | | | 4.100 | % | | | 4/30/25 | | | | 1,428,916 | | | | 1,429,241 | (f)(l)(m) |
Lamar Media Corp., Term Loan B (1 mo. LIBOR + 1.750%) | | | 3.875 | % | | | 3/16/25 | | | | 319,200 | | | | 319,200 | (f)(l)(m) |
Total Media | | | | | | | | | | | | | | | 1,748,441 | |
Specialty Retail — 1.7% | | | | | | | | | | | | | | | | |
PetSmart Inc., Term Loan B2 (1 mo. LIBOR + 3.000%) | | | 4.000 | % | | | 3/11/22 | | | | 2,827,953 | | | | 2,349,322 | (f)(l)(m)(n) |
Spencer Gifts LLC, Second Lien Term Loan (1 mo. LIBOR + 8.250%) | | | 10.310 | % | | | 6/29/22 | | | | 410,000 | | | | 307,500 | (f)(l)(m) |
Total Specialty Retail | | | | | | | | | | | | | | | 2,656,822 | |
Total Consumer Discretionary | | | | | | | | | | | | | | | 6,857,346 | |
| Energy — 0.4% | | | | | | | | | | | | | | | | |
Energy Equipment & Services — 0.0% | | | | | | | | | | | | | | | | |
Hercules Offshore Inc., (Wind-down lender claim) | | | — | | | | — | | | | 32,500 | | | | 27,625 | *(e) |
Oil, Gas & Consumable Fuels — 0.4% | | | | | | | | | | | | | | | | |
Chesapeake Energy Corp., Term Loan (1 mo. LIBOR + 7.500%) | | | 9.594 | % | | | 8/23/21 | | | | 510,000 | | | | 534,544 | (f)(l)(m) |
Total Energy | | | | | | | | | | | | | | | 562,169 | |
| Industrials — 1.1% | | | | | | | | | | | | | | | | |
Air Freight & Logistics — 0.4% | | | | | | | | | | | | | | | | |
Avolon TLB Borrower 1 (US) LLC, Term Loan B3 (1 mo. LIBOR + 2.000%) | | | 4.088 | % | | | 1/15/25 | | | | 647,742 | | | | 640,973 | (f)(l)(m) |
See Notes to Financial Statements.
| | |
| 16 | | Western Asset Variable Global High Yield Bond Portfolio 2018 Semi-Annual Report |
Western Asset Variable Global High Yield Bond Portfolio
| | | | | | | | | | | | | | | | |
| Security | | Rate | | | Maturity
Date | | | Face
Amount† | | | Value | |
Professional Services — 0.3% | | | | | | | | | | | | | | | | |
TransUnion LLC, Term Loan B3 (1 mo. LIBOR + 2.000%) | | | 4.094 | % | | | 4/10/23 | | | | 496,250 | | | $ | 495,506 | (f)(l)(m) |
Trading Companies & Distributors — 0.4% | | | | | | | | | | | | | | | | |
Beacon Roofing Supply Inc., 2017 Term Loan B (1 mo. LIBOR + 2.250%) | | | 4.280 | % | | | 1/2/25 | | | | 498,750 | | | | 496,957 | (f)(l)(m) |
Total Industrials | | | | | | | | | | | | | | | 1,633,436 | |
| Information Technology — 0.8% | | | | | | | | | | | | | | | | |
IT Services — 0.8% | | | | | | | | | | | | | | | | |
First Data Corp., 2024 USD Term Loan (1 mo. LIBOR + 2.000%) | | | 4.091 | % | | | 4/26/24 | | | | 1,255,995 | | | | 1,250,029 | (f)(l)(m) |
| Materials — 0.6% | | | | | | | | | | | | | | | | |
Containers & Packaging — 0.6% | | | | | | | | | | | | | | | | |
Reynolds Group Holdings Inc., USD 2017 Term Loan (1 mo. LIBOR + 2.750%) | | | 4.844 | % | | | 2/5/23 | | | | 991,209 | | | | 991,071 | (f)(l)(m) |
| Utilities — 0.1% | | | | | | | | | | | | | | | | |
Electric Utilities — 0.1% | | | | | | | | | | | | | | | | |
Panda Temple Power LLC, Term Loan (3 mo. LIBOR + 8.000%) | | | 10.046 | % | | | 2/7/23 | | | | 161,367 | | | | 164,594 | (e)(f)(l)(m)(n) |
Total Senior Loans (Cost — $11,828,436) | | | | | | | | | | | | | | | 11,458,645 | |
| Convertible Bonds & Notes — 1.9% | | | | | | | | | | | | | | | | |
| Consumer Discretionary — 1.2% | | | | | | | | | | | | | | | | |
Media — 1.1% | | | | | | | | | | | | | | | | |
DISH Network Corp., Senior Notes | | | 3.375 | % | | | 8/15/26 | | | | 770,000 | | | | 747,744 | |
GCI Liberty Inc., Senior Notes | | | 1.750 | % | | | 9/30/46 | | | | 230,000 | | | | 237,808 | (a) |
Liberty Media Corp., Senior Notes | | | 2.125 | % | | | 3/31/48 | | | | 400,000 | | | | 395,428 | (a) |
Live Nation Entertainment Inc., Senior Notes | | | 2.500 | % | | | 3/15/23 | | | | 270,000 | | | | 280,236 | (a) |
Total Media | | | | | | | | | | | | | | | 1,661,216 | |
Specialty Retail — 0.1% | | | | | | | | | | | | | | | | |
RH, PO | | | 0.000 | % | | | 6/15/23 | | | | 110,000 | | | | 102,832 | (a) |
Total Consumer Discretionary | | | | | | | | | | | | | | | 1,764,048 | |
| Energy — 0.0% | | | | | | | | | | | | | | | | |
Oil, Gas & Consumable Fuels — 0.0% | | | | | | | | | | | | | | | | |
Cheniere Energy Inc., Senior Notes | | | 4.250 | % | | | 3/15/45 | | | | 90,000 | | | | 71,703 | |
| Health Care — 0.4% | | | | | | | | | | | | | | | | |
Pharmaceuticals — 0.4% | | | | | | | | | | | | | | | | |
Jazz Investments I Ltd., Senior Notes | | | 1.500 | % | | | 8/15/24 | | | | 510,000 | | | | 533,249 | (a) |
| Information Technology — 0.3% | | | | | | | | | | | | | | | | |
Internet Software & Services — 0.3% | | | | | | | | | | | | | | | | |
Akamai Technologies Inc., Senior Notes | | | 0.125 | % | | | 5/1/25 | | | | 120,000 | | | | 120,463 | (a) |
Twitter Inc., Senior Notes | | | 1.000 | % | | | 9/15/21 | | | | 280,000 | | | | 271,630 | |
See Notes to Financial Statements.
| | |
| Western Asset Variable Global High Yield Bond Portfolio 2018 Semi-Annual Report | | 17 |
Schedule of investments (unaudited) (cont’d)
June 30, 2018
Western Asset Variable Global High Yield Bond Portfolio
| | | | | | | | | | | | | | | | |
| Security | | Rate | | | Maturity
Date | | | Face
Amount† | | | Value | |
Internet Software & Services — continued | | | | | | | | | | | | | | | | |
Twitter Inc., Senior Notes | | | 0.250 | % | | | 6/15/24 | | | | 60,000 | | | $ | 62,131 | (a) |
Total Information Technology | | | | | | | | | | | | | | | 454,224 | |
Total Convertible Bonds & Notes (Cost — $2,812,285) | | | | | | | | | | | | | | | 2,823,224 | |
| U.S. Government & Agency Obligations — 1.6% | | | | | | | | | | | | | | | | |
U.S. Government Obligations — 1.6% | | | | | | | | | | | | | | | | |
U.S. Treasury Notes | | | 2.125 | % | | | 8/15/21 | | | | 1,550,000 | | | | 1,526,296 | |
U.S. Treasury Notes | | | 1.625 | % | | | 5/31/23 | | | | 1,000,000 | | | | 949,551 | |
Total U.S. Government & Agency Obligations (Cost — $2,468,979) | | | | | | | | | | | | 2,475,847 | |
| | | | |
| | | | | | | | | Shares | | | | |
| Common Stocks — 1.3% | | | | | | | | | | | | | | | | |
| Consumer Discretionary — 0.5% | | | | | | | | | | | | | | | | |
Hotels, Restaurants & Leisure — 0.4% | | | | | | | | | | | | | | | | |
Bossier Casino Venture Holdco Inc. | | | | | | | | | | | 26,303 | | | | 614,438 | (d)(e) |
Media — 0.1% | | | | | | | | | | | | | | | | |
New Cotai LLC/New Cotai Capital Corp., Class B Shares | | | | | | | | | | | 2 | | | | 133,897 | *(d)(e) |
Total Consumer Discretionary | | | | | | | | | | | | | | | 748,335 | |
| Energy — 0.6% | | | | | | | | | | | | | | | | |
Energy Equipment & Services — 0.2% | | | | | | | | | | | | | | | | |
Hercules Offshore Inc. (Escrow) | | | | | | | | | | | 17,554 | | | | 4,950 | *(d)(e) |
KCAD Holdings I Ltd. | | | | | | | | | | | 75,024,286 | | | | 379,623 | *(d)(e) |
Total Energy Equipment & Services | | | | | | | | | | | | | | | 384,573 | |
Oil, Gas & Consumable Fuels — 0.4% | | | | | | | | | | | | | | | | |
Berry Petroleum Co. | | | | | | | | | | | 29,497 | | | | 359,495 | * |
Blue Ridge Mountain Resources Inc. | | | | | | | | | | | 40,967 | | | | 264,237 | *(d)(e) |
MWO Holdings LLC | | | | | | | | | | | 211 | | | | 0 | *(d)(e)(g) |
Total Oil, Gas & Consumable Fuels | | | | | | | | | | | | | | | 623,732 | |
Total Energy | | | | | | | | | | | | | | | 1,008,305 | |
| Industrials — 0.0% | | | | | | | | | | | | | | | | |
Marine — 0.0% | | | | | | | | | | | | | | | | |
Tricer HoldCo, S.C.A. | | | | | | | | | | | 10,471 | | | | 43,769 | *(d)(e) |
Road & Rail — 0.0% | | | | | | | | | | | | | | | | |
Jack Cooper Enterprises Inc. | | | | | | | | | | | 936 | | | | 0 | *(d)(e)(g) |
Total Industrials | | | | | | | | | | | | | | | 43,769 | |
See Notes to Financial Statements.
| | |
| 18 | | Western Asset Variable Global High Yield Bond Portfolio 2018 Semi-Annual Report |
Western Asset Variable Global High Yield Bond Portfolio
| | | | | | | | | | | | | | | | |
Security | | | | | | | | Shares | | | Value | |
| Utilities — 0.2% | | | | | | | | | | | | | | | | |
Electric Utilities — 0.2% | | | | | | | | | | | | | | | | |
Panda Temple Power LLC | | | | | | | | | | | 11,090 | | | $ | 249,525 | *(d)(e) |
Total Common Stocks (Cost — $3,603,806) | | | | | | | | | | | | | | | 2,049,934 | |
| Investment in Underlying Funds — 1.0% | | | | | | | | | | | | | | | | |
Invesco Senior Loan ETF (Cost — $1,501,860) | | | | | | | | | | | 65,000 | | | | 1,488,500 | * |
| | | | |
| | | Rate | | | | | | | | | | |
| Convertible Preferred Stocks — 0.3% | | | | | | | | | | | | | | | | |
| Energy — 0.3% | | | | | | | | | | | | | | | | |
Oil, Gas & Consumable Fuels — 0.3% | | | | | | | | | | | | | | | | |
Berry Petroleum Co., (6.000% Cash or 6.000% PIK) | | | 6.000 | % | | | | | | | 33,772 | | | | 472,808 | (b) |
Berry Petroleum Co., (6.000% Cash or 6.000% PIK) | | | 6.000 | % | | | | | | | 506 | | | | 7,084 | (b)(i) |
Total Convertible Preferred Stocks (Cost — $317,490) | | | | | | | | | | | | | | | 479,892 | |
| Preferred Stocks — 0.0% | | | | | | | | | | | | | | | | |
| Industrials — 0.0% | | | | | | | | | | | | | | | | |
Marine — 0.0% | | | | | | | | | | | | | | | | |
Tricer Tracking Preferred Equity Certificates, (8.000% PIK) (Cost — $384,121) | | | 8.000 | % | | | | | | | 5,026,217 | | | | 50,262 | (b)(d)(e) |
Total Investments before Short-Term Investments (Cost — $157,201,024) | | | | 150,137,089 | |
| Short-Term Investments — 0.0% | | | | | | | | | | | | | | | | |
Western Asset Government Cash Management Portfolio LLC (Cost — $351) | | | 1.830 | % | | | | | | | 351 | | | | 351 | (o) |
Total Investments — 98.1% (Cost — $157,201,375) | | | | | | | | | | | | | | | 150,137,440 | |
Other Assets in Excess of Liabilities — 1.9% | | | | | | | | | | | | | | | 2,959,586 | |
Total Net Assets — 100.0% | | | | | | | | | | | | | | $ | 153,097,026 | |
| † | Face amount denominated in U.S. dollars, unless otherwise noted. |
| * | Non-income producing security. |
| (a) | Security is exempt from registration under Rule 144A of the Securities Act of 1933. This security may be resold in transactions that are exempt from registration, normally to qualified institutional buyers. This security has been deemed liquid pursuant to guidelines approved by the Board of Trustees. |
| (b) | Payment-in-kind security for which the issuer has the option at each interest payment date of making interest payments in cash or additional debt securities. |
| (c) | Security is exempt from registration under Regulation S of the Securities Act of 1933. Regulation S applies to securities offerings that are made outside of the United States and do not involve direct selling efforts in the United States. This security has been deemed liquid pursuant to guidelines approved by the Board of Trustees. |
| (d) | Security is valued in good faith in accordance with procedures approved by the Board of Trustees (Note 1). |
| (e) | Security is valued using significant unobservable inputs (Note 1). |
| (f) | Variable rate security. Interest rate disclosed is as of the most recent information available. Certain variable rate securities are not based on a published reference rate and spread but are determined by the issuer or agent and are based on current market conditions. These securities do not indicate a reference rate and spread in their description above. |
See Notes to Financial Statements.
| | |
| Western Asset Variable Global High Yield Bond Portfolio 2018 Semi-Annual Report | | 19 |
Schedule of investments (unaudited) (cont’d)
June 30, 2018
Western Asset Variable Global High Yield Bond Portfolio
| (g) | Value is less than $1. |
| (h) | Security has no maturity date. The date shown represents the next call date. |
| (i) | Restricted security (See Note 9). |
| (j) | The maturity principal is currently in default as of June 30, 2018. |
| (k) | The coupon payment on these securities is currently in default as of June 30, 2018. |
| (l) | Senior loans may be considered restricted in that the Portfolio ordinarily is contractually obligated to receive approval from the agent bank and/or borrower prior to the disposition of a senior loan. |
| (m) | Interest rates disclosed represent the effective rates on senior loans. Ranges in interest rates are attributable to multiple contracts under the same loan. |
| (n) | All or a portion of this loan is unfunded as of June 30, 2018. The interest rate for fully unfunded term loans is to be determined. |
| (o) | In this instance, as defined in the Investment Company Act of 1940, an “Affiliated Company” represents Portfolio ownership of at least 5% of the outstanding voting securities of an issuer, or a company which is under ownership or control. At June 30, 2018, the total market value of investments in Affiliated Companies was $351 and the cost was $351 (See Note 2). |
| | |
Abbreviations used in this schedule: |
| ARS | | — Argentine Peso |
| BRL | | — Brazilian Real |
| ETF | | — Exchange-Traded Fund |
| EUR | | — Euro |
| Euribor | | — Euro Interbank Offered Rate |
| GBP | | — British Pound |
| LIBOR | | — London Interbank Offered Rate |
| RUB | | — Russian Ruble |
| UYU | | — Uruguayan Peso |
At June 30, 2018, the Portfolio had the following open futures contracts:
| | | | | | | | | | | | | | | | | | | | |
| | | Number of
Contracts | | | Expiration
Date | | | Notional
Amount | | | Market
Value | | | Unrealized
Appreciation | |
| Contracts to Sell: | | | | | | | | | | | | | | | | | | | | |
| Euro Currency Futures | | | 27 | | | | 9/18 | | | $ | 4,001,696 | | | $ | 3,961,069 | | | $ | 40,627 | |
At June 30, 2018, the Portfolio had the following open forward foreign currency contracts:
| | | | | | | | | | | | | | | | | | | | |
Currency
Purchased | | | Currency
Sold | | | Counterparty | | Settlement
Date | | | Unrealized
Appreciation
(Depreciation) | |
| EUR | | | 853,698 | | | USD | | | 1,060,732 | | | Barclays Bank PLC | | | 7/19/18 | | | $ | (62,309) | |
| USD | | | 3,330,979 | | | GBP | | | 2,331,188 | | | Barclays Bank PLC | | | 7/19/18 | | | | 251,538 | |
| USD | | | 116,410 | | | EUR | | | 100,000 | | | Citibank N.A. | | | 7/19/18 | | | | (543) | |
| USD | | | 236,001 | | | EUR | | | 200,000 | | | Citibank N.A. | | | 7/19/18 | | | | 2,096 | |
| Total | | | | | | | | | | | | | | | | | | $ | 190,782 | |
| | |
Abbreviations used in this table: |
| EUR | | — Euro |
| GBP | | — British Pound |
| USD | | — United States Dollar |
See Notes to Financial Statements.
| | |
| 20 | | Western Asset Variable Global High Yield Bond Portfolio 2018 Semi-Annual Report |
Western Asset Variable Global High Yield Bond Portfolio
| | | | |
| Summary of Investments by Country* | | | |
| United States | | | 46.7 | % |
| Brazil | | | 8.2 | |
| Argentina | | | 5.9 | |
| United Kingdom | | | 4.1 | |
| Israel | | | 3.5 | |
| France | | | 3.2 | |
| Luxembourg | | | 2.8 | |
| Italy | | | 2.4 | |
| Netherlands | | | 2.4 | |
| United Arab Emirates | | | 2.3 | |
| Turkey | | | 2.2 | |
| Russia | | | 2.1 | |
| Colombia | | | 1.8 | |
| Indonesia | | | 1.2 | |
| Ecuador | | | 1.2 | |
| Canada | | | 1.0 | |
| Germany | | | 1.0 | |
| Ireland | | | 0.9 | |
| Peru | | | 0.8 | |
| Ukraine | | | 0.6 | |
| Egypt | | | 0.6 | |
| Dominican Republic | | | 0.5 | |
| Honduras | | | 0.5 | |
| Uruguay | | | 0.5 | |
| Cayman Islands | | | 0.4 | |
| Venezuela | | | 0.4 | |
| Guatemala | | | 0.4 | |
| Spain | | | 0.4 | |
| Nigeria | | | 0.3 | |
| South Africa | | | 0.3 | |
| Ghana | | | 0.2 | |
| Ivory Coast | | | 0.2 | |
| Costa Rica | | | 0.2 | |
| El Salvador | | | 0.2 | |
| Jersey | | | 0.2 | |
| Sri Lanka | | | 0.2 | |
| Senegal | | | 0.1 | |
| Zambia | | | 0.1 | |
| Australia | | | 0.0 | ‡ |
| Short-Term Investments | | | 0.0 | ‡ |
| | | | 100.0 | % |
| * | As a percentage of total investments. Please note that the Portfolio holdings are as of June 30, 2018 and are subject to change. |
| ‡ | Represents less than 0.1%. |
See Notes to Financial Statements.
| | |
| Western Asset Variable Global High Yield Bond Portfolio 2018 Semi-Annual Report | | 21 |
Statement of assets and liabilities (unaudited)
June 30, 2018
| | | | |
| |
| Assets: | | | | |
Investments in unaffiliated securities, at value (Cost — $157,201,024) | | $ | 150,137,089 | |
Investments in affiliated securities, at value (cost $351) | | | 351 | |
Cash | | | 510,459 | |
Foreign currency, at value (Cost — $202,422) | | | 190,728 | |
Receivable for securities sold | | | 3,945,009 | |
Interest receivable | | | 2,534,382 | |
Unrealized appreciation on forward foreign currency contracts | | | 253,634 | |
Receivable for Portfolio shares sold | | | 74,673 | |
Deposits with brokers for open futures contracts | | | 63,031 | |
Prepaid expenses | | | 1,337 | |
Total Assets | | | 157,710,693 | |
| |
| Liabilities: | | | | |
Payable for securities purchased | | | 4,287,299 | |
Investment management fee payable | | | 88,726 | |
Unrealized depreciation on forward foreign currency contracts | | | 62,852 | |
Payable for Portfolio shares repurchased | | | 59,388 | |
Payable to broker — variation margin on open futures contracts | | | 38,138 | |
Service and/or distribution fees payable | | | 5,349 | |
Trustees’ fees payable | | | 416 | |
Accrued expenses | | | 71,499 | |
Total Liabilities | | | 4,613,667 | |
| Total Net Assets | | $ | 153,097,026 | |
| |
| Net Assets: | | | | |
Par value (Note 7) | | $ | 215 | |
Paid-in capital in excess of par value | | | 171,085,448 | |
Undistributed net investment income | | | 3,932,409 | |
Accumulated net realized loss on investments, futures contracts, written options, forward foreign currency contracts and foreign currency transactions | | | (15,057,603) | |
Net unrealized depreciation on investments, futures contracts, forward foreign currency contracts and foreign currencies | | | (6,863,443) | |
| Total Net Assets | | $ | 153,097,026 | |
See Notes to Financial Statements.
| | |
| 22 | | Western Asset Variable Global High Yield Bond Portfolio 2018 Semi-Annual Report |
| | | | |
| |
| Net Assets: | | | | |
Class I | | | $126,927,898 | |
Class II | | | $26,169,128 | |
| |
| Shares Outstanding: | | | | |
Class I | | | 17,876,739 | |
Class II | | | 3,582,198 | |
| |
| Net Asset Value: | | | | |
Class I | | | $7.10 | |
Class II | | | $7.31 | |
See Notes to Financial Statements.
| | |
| Western Asset Variable Global High Yield Bond Portfolio 2018 Semi-Annual Report | | 23 |
Statement of operations (unaudited)
For the Six Months Ended June 30, 2018
| | | | |
| |
| Investment Income: | | | | |
Dividends | | $ | 53,143 | |
Interest from unaffiliated securities | | | 4,723,939 | |
Interest from affiliated investments | | | 7,167 | |
Less: Foreign taxes withheld | | | (939) | |
Total Investment Income | | | 4,783,310 | |
| |
| Expenses: | | | | |
Investment management fee (Note 2) | | | 561,887 | |
Shareholder reports | | | 34,626 | |
Service and/or distribution fees (Notes 2 and 5) | | | 32,709 | |
Audit and tax fees | | | 20,939 | |
Fund accounting fees | | | 18,061 | |
Legal fees | | | 13,038 | |
Custody fees | | | 3,844 | |
Trustees’ fees | | | 2,046 | |
Insurance | | | 1,553 | |
Transfer agent fees (Note 5) | | | 1,397 | |
Commitment fees (Note 10) | | | 929 | |
Interest expense | | | 22 | |
Miscellaneous expenses | | | 3,992 | |
Total Expenses | | | 695,043 | |
| Net Investment Income | | | 4,088,267 | |
| |
| Realized and Unrealized Gain (Loss) on Investments, Futures Contracts, Written Options, Forward Foreign Currency Contracts and Foreign Currency Transactions (Notes 1, 3 and 4): | | | | |
Net Realized Gain (Loss) From: | | | | |
Investment transactions in unaffiliated securities | | | 1,228,446 | |
Futures contracts | | | 70,853 | |
Written options | | | 36,451 | |
Forward foreign currency contracts | | | (168,160) | |
Foreign currency transactions | | | (292,017) | |
Net Realized Gain | | | 875,573 | |
Change in Net Unrealized Appreciation (Depreciation) From: | | | | |
Investments in unaffiliated securities | | | (9,614,628) | |
Futures contracts | | | 40,627 | |
Written options | | | 23,624 | |
Forward foreign currency contracts | | | 221,525 | |
Foreign currencies | | | (38,655) | |
Change in Net Unrealized Appreciation (Depreciation) | | | (9,367,507) | |
| Net Loss on Investments, Futures Contracts, Written Options, Forward Foreign Currency Contracts and Foreign Currency Transactions | | | (8,491,934) | |
| Decrease in Net Assets From Operations | | $ | (4,403,667) | |
See Notes to Financial Statements.
| | |
| 24 | | Western Asset Variable Global High Yield Bond Portfolio 2018 Semi-Annual Report |
Statements of changes in net assets
| | | | | | | | |
For the Six Months Ended June 30, 2018 (unaudited)
and the Year Ended December 31, 2017 | | 2018 | | | 2017 | |
| | |
| Operations: | | | | | | | | |
Net investment income | | $ | 4,088,267 | | | $ | 9,117,254 | |
Net realized gain | | | 875,573 | | | | 1,379,009 | |
Change in net unrealized appreciation (depreciation) | | | (9,367,507) | | | | 3,593,245 | |
Increase (Decrease) in Net Assets From Operations | | | (4,403,667) | | | | 14,089,508 | |
| | |
| Distributions to Shareholders From (Notes 1 and 6): | | | | | | | | |
Net investment income | | | (100,022) | | | | (8,900,018) | |
Decrease in Net Assets From Distributions to Shareholders | | | (100,022) | | | | (8,900,018) | |
| | |
| Portfolio Share Transactions (Note 7): | | | | | | | | |
Net proceeds from sale of shares | | | 13,965,740 | | | | 55,508,449 | |
Reinvestment of distributions | | | 100,022 | | | | 8,900,018 | |
Cost of shares repurchased | | | (29,137,480) | | | | (56,044,545) | |
Increase (Decrease) in Net Assets From Portfolio Share Transactions | | | (15,071,718) | | | | 8,363,922 | |
Increase (Decrease) in Net Assets | | | (19,575,407) | | | | 13,553,412 | |
| | |
| Net Assets: | | | | | | | | |
Beginning of period | | | 172,672,433 | | | | 159,119,021 | |
End of period* | | $ | 153,097,026 | | | $ | 172,672,433 | |
*Includes undistributed (overdistributed) net investment income, respectively, of: | | | $3,932,409 | | | | $(55,836) | |
See Notes to Financial Statements.
| | |
| Western Asset Variable Global High Yield Bond Portfolio 2018 Semi-Annual Report | | 25 |
Financial highlights
| | | | | | | | | | | | | | | | | | | | | | | | |
For a share of each class of beneficial interest outstanding throughout each year ended December 31,
unless otherwise noted: | |
| Class I Shares1 | | 20182 | | | 2017 | | | 2016 | | | 2015 | | | 2014 | | | 2013 | |
| | | | | | |
| Net asset value, beginning of period | | | $7.30 | | | | $7.09 | | | | $6.53 | | | | $7.42 | | | | $8.12 | | | | $8.12 | |
| | | | | | |
| Income (loss) from operations: | | | | | | | | | | | | | | | | | | | | | | | | |
Net investment income | | | 0.18 | | | | 0.40 | | | | 0.47 | | | | 0.47 | | | | 0.53 | | | | 0.57 | |
Net realized and unrealized gain (loss) | | | (0.38) | | | | 0.21 | | | | 0.54 | | | | (0.90) | | | | (0.63) | | | | (0.06) | |
Total income (loss) from operations | | | (0.20) | | | | 0.61 | | | | 1.01 | | | | (0.43) | | | | (0.10) | | | | 0.51 | |
| | | | | | |
| Less distributions from: | | | | | | | | | | | | | | | | | | | | | | | | |
Net investment income | | | (0.00) | 3 | | | (0.40) | | | | (0.45) | | | | (0.46) | | | | (0.60) | | | | (0.51) | |
Total distributions | | | (0.00) | 3 | | | (0.40) | | | | (0.45) | | | | (0.46) | | | | (0.60) | | | | (0.51) | |
| | | | | | |
| Net asset value, end of period | | | $7.10 | | | | $7.30 | | | | $7.09 | | | | $6.53 | | | | $7.42 | | | | $8.12 | |
Total return4 | | | (2.68) | % | | | 8.65 | % | | | 15.60 | % | | | (5.84) | % | | | (1.15) | % | | | 6.27 | % |
| | | | | | |
| Net assets, end of period (millions) | | | $127 | | | | $144 | | | | $138 | | | | $138 | | | | $160 | | | | $163 | |
| | | | | | |
| Ratios to average net assets: | | | | | | | | | | | | | | | | | | | | | | | | |
Gross expenses | | | 0.82 | %5 | | | 0.82 | % | | | 0.81 | % | | | 0.80 | % | | | 0.81 | % | | | 0.81 | % |
Net expenses6 | | | 0.82 | 5 | | | 0.82 | | | | 0.81 | | | | 0.80 | | | | 0.81 | | | | 0.81 | |
Net investment income | | | 5.13 | 5 | | | 5.34 | | | | 6.77 | | | | 6.36 | | | | 6.34 | | | | 6.77 | |
| | | | | | |
| Portfolio turnover rate | | | 62 | % | | | 112 | % | | | 98 | % | | | 82 | % | | | 62 | % | | | 74 | % |
| 1 | Per share amounts have been calculated using the average shares method. |
| 2 | For the six months ended June 30, 2018 (unaudited). |
| 3 | Amount represents less than $0.005 per share. |
| 4 | Performance figures may reflect compensating balance arrangements, fee waivers and/or expense reimbursements. In the absence of compensating balance arrangements, fee waivers and/or expense reimbursements, the total return would have been lower. Total returns do not reflect expenses associated with separate accounts such as administrative fees, account charges and surrender charges which, if reflected, would reduce the total return for all periods shown. Past performance is no guarantee of future results. Total returns for periods of less than one year are not annualized. |
| 6 | As a result of an expense limitation arrangement, the ratio of total annual fund operating expenses, other than interest, brokerage, taxes, extraordinary expenses and acquired fund fees and expenses, to average net assets of Class I shares did not exceed 0.90%. This expense limitation arrangement cannot be terminated prior to December 31, 2019 without the Board of Trustees’ consent. |
See Notes to Financial Statements.
| | |
| 26 | | Western Asset Variable Global High Yield Bond Portfolio 2018 Semi-Annual Report |
| | | | | | | | | | | | | | | | | | | | | | | | |
For a share of each class of beneficial interest outstanding throughout each year ended December 31,
unless otherwise noted: | |
| Class II Shares1 | | 20182 | | | 2017 | | | 2016 | | | 2015 | | | 2014 | | | 2013 | |
| | | | | | |
| Net asset value, beginning of period | | | $7.52 | | | | $7.29 | | | | $6.70 | | | | $7.60 | | | | $8.30 | | | | $8.29 | |
| | | | | | |
| Income (loss) from operations: | | | | | | | | | | | | | | | | | | | | | | | | |
Net investment income | | | 0.18 | | | | 0.39 | | | | 0.47 | | | | 0.46 | | | | 0.52 | | | | 0.55 | |
Net realized and unrealized gain (loss) | | | (0.39) | | | | 0.22 | | | | 0.55 | | | | (0.92) | | | | (0.65) | | | | (0.05) | |
Total income (loss) from operations | | | (0.21) | | | | 0.61 | | | | 1.02 | | | | (0.46) | | | | (0.13) | | | | 0.50 | |
| | | | | | |
| Less distributions from: | | | | | | | | | | | | | | | | | | | | | | | | |
Net investment income | | | (0.00) | 3 | | | (0.38) | | | | (0.43) | | | | (0.44) | | | | (0.57) | | | | (0.49) | |
Total distributions | | | (0.00) | 3 | | | (0.38) | | | | (0.43) | | | | (0.44) | | | | (0.57) | | | | (0.49) | |
| | | | | | |
| Net asset value, end of period | | | $7.31 | | | | $7.52 | | | | $7.29 | | | | $6.70 | | | | $7.60 | | | | $8.30 | |
Total return4 | | | (2.73) | % | | | 8.43 | % | | | 15.36 | % | | | (6.08) | % | | | (1.51) | % | | | 6.06 | % |
| | | | | | |
| Net assets, end of period (000s) | | | $26,169 | | | | $29,168 | | | | $20,725 | | | | $18,929 | | | | $31,611 | | | | $43,929 | |
| | | | | | |
| Ratios to average net assets: | | | | | | | | | | | | | | | | | | | | | | | | |
Gross expenses | | | 1.08 | %5 | | | 1.07 | % | | | 1.06 | % | | | 1.05 | % | | | 1.07 | % | | | 1.08 | % |
Net expenses6 | | | 1.08 | 5 | | | 1.07 | | | | 1.06 | | | | 1.05 | | | | 1.07 | | | | 1.08 | |
Net investment income | | | 4.90 | 5 | | | 5.09 | | | | 6.54 | | | | 6.08 | | | | 6.06 | | | | 6.49 | |
| | | | | | |
| Portfolio turnover rate | | | 62 | % | | | 112 | % | | | 98 | % | | | 82 | % | | | 62 | % | | | 74 | % |
| 1 | Per share amounts have been calculated using the average shares method. |
| 2 | For the six months ended June 30, 2018 (unaudited). |
| 3 | Amount represents less than $0.005 per share. |
| 4 | Performance figures may reflect compensating balance arrangements, fee waivers and/or expense reimbursements. In the absence of compensating balance arrangements, fee waivers and/or expense reimbursements, the total return would have been lower. Total returns do not reflect expenses associated with separate accounts such as administrative fees, account charges and surrender charges which, if reflected, would reduce the total return for all periods shown. Past performance is no guarantee of future results. Total returns for periods of less than one year are not annualized. |
| 6 | As a result of an expense limitation arrangement, the ratio of total annual fund operating expenses, other than interest, brokerage, taxes, extraordinary expenses and acquired fund fees and expenses, to average net assets of Class II shares did not exceed 1.15%. This expense limitation arrangement cannot be terminated prior to December 31, 2019 without the Board of Trustees’ consent. |
See Notes to Financial Statements.
| | |
| Western Asset Variable Global High Yield Bond Portfolio 2018 Semi-Annual Report | | 27 |
Notes to financial statements (unaudited)
1. Organization and significant accounting policies
Western Asset Variable Global High Yield Bond Portfolio (the “Portfolio”) is a separate diversified investment series of Legg Mason Partners Variable Income Trust (the “Trust”). The Trust, a Maryland statutory trust, is registered under the Investment Company Act of 1940, as amended (the “1940 Act”), as an open-end management investment company.
Shares of the Portfolio may only be purchased or redeemed through variable annuity contracts and variable life insurance policies offered by the separate accounts of participating insurance companies or through eligible pension or other qualified plans.
The following are significant accounting policies consistently followed by the Portfolio and are in conformity with U.S. generally accepted accounting principles (“GAAP”). Estimates and assumptions are required to be made regarding assets, liabilities and changes in net assets resulting from operations when financial statements are prepared. Changes in the economic environment, financial markets and any other parameters used in determining these estimates could cause actual results to differ. Subsequent events have been evaluated through the date the financial statements were issued.
(a) Investment valuation. The valuations for fixed income securities (which may include, but are not limited to, corporate, government, municipal, mortgage-backed, collateralized mortgage obligations and asset-backed securities) and certain derivative instruments are typically the prices supplied by independent third party pricing services, which may use market prices or broker/dealer quotations or a variety of valuation techniques and methodologies. The independent third party pricing services use inputs that are observable such as issuer details, interest rates, yield curves, prepayment speeds, credit risks/spreads, default rates and quoted prices for similar securities. Investments in open-end funds are valued at the closing net asset value per share of each fund on the day of valuation. Futures contracts are valued daily at the settlement price established by the board of trade or exchange on which they are traded. Equity securities for which market quotations are available are valued at the last reported sales price or official closing price on the primary market or exchange on which they trade. When the Portfolio holds securities or other assets that are denominated in a foreign currency, the Portfolio will normally use the currency exchange rates as of 4:00 p.m. (Eastern Time). If independent third party pricing services are unable to supply prices for a portfolio investment, or if the prices supplied are deemed by the manager to be unreliable, the market price may be determined by the manager using quotations from one or more broker/dealers or at the transaction price if the security has recently been purchased and no value has yet been obtained from a pricing service or pricing broker. When reliable prices are not readily available, such as when the value of a security has been significantly affected by events after the close of the exchange or market on which the security is principally traded, but before the Portfolio calculates its net asset value, the Portfolio values these securities as determined in accordance with procedures approved by the Portfolio’s Board of Trustees.
The Board of Trustees is responsible for the valuation process and has delegated the supervision of the daily valuation process to the Legg Mason North Atlantic Fund Valuation
| | |
| 28 | | Western Asset Variable Global High Yield Bond Portfolio 2018 Semi-Annual Report |
Committee (the “Valuation Committee”). The Valuation Committee, pursuant to the policies adopted by the Board of Trustees, is responsible for making fair value determinations, evaluating the effectiveness of the Portfolio’s pricing policies, and reporting to the Board of Trustees. When determining the reliability of third party pricing information for investments owned by the Portfolio, the Valuation Committee, among other things, conducts due diligence reviews of pricing vendors, monitors the daily change in prices and reviews transactions among market participants.
The Valuation Committee will consider pricing methodologies it deems relevant and appropriate when making fair value determinations. Examples of possible methodologies include, but are not limited to, multiple of earnings; discount from market of a similar freely traded security; discounted cash-flow analysis; book value or a multiple thereof; risk premium/ yield analysis; yield to maturity; and/or fundamental investment analysis. The Valuation Committee will also consider factors it deems relevant and appropriate in light of the facts and circumstances. Examples of possible factors include, but are not limited to, the type of security; the issuer’s financial statements; the purchase price of the security; the discount from market value of unrestricted securities of the same class at the time of purchase; analysts’ research and observations from financial institutions; information regarding any transactions or offers with respect to the security; the existence of merger proposals or tender offers affecting the security; the price and extent of public trading in similar securities of the issuer or comparable companies; and the existence of a shelf registration for restricted securities.
For each portfolio security that has been fair valued pursuant to the policies adopted by the Board of Trustees, the fair value price is compared against the last available and next available market quotations. The Valuation Committee reviews the results of such back testing monthly and fair valuation occurrences are reported to the Board of Trustees quarterly.
The Portfolio uses valuation techniques to measure fair value that are consistent with the market approach and/or income approach, depending on the type of security and the particular circumstance. The market approach uses prices and other relevant information generated by market transactions involving identical or comparable securities. The income approach uses valuation techniques to discount estimated future cash flows to present value.
GAAP establishes a disclosure hierarchy that categorizes the inputs to valuation techniques used to value assets and liabilities at measurement date. These inputs are summarized in the three broad levels listed below:
| • | | Level 1 — quoted prices in active markets for identical investments |
| • | | Level 2 — other significant observable inputs (including quoted prices for similar investments, interest rates, prepayment speeds, credit risk, etc.) |
| • | | Level 3 — significant unobservable inputs (including the Portfolio’s own assumptions in determining the fair value of investments) |
| | |
| Western Asset Variable Global High Yield Bond Portfolio 2018 Semi-Annual Report | | 29 |
Notes to financial statements (unaudited) (cont’d)
The inputs or methodologies used to value securities are not necessarily an indication of the risk associated with investing in those securities.
The following is a summary of the inputs used in valuing the Portfolio’s assets and liabilities carried at fair value:
| | | | | | | | | | | | | | | | |
| ASSETS | |
| Description | | Quoted Prices
(Level 1) | | | Other Significant
Observable Inputs
(Level 2) | | | Significant
Unobservable
Inputs
(Level 3) | | | Total | |
| Long-term investments†: | | | | | | | | | | | | | | | | |
Corporate bonds & notes: | | | | | | | | | | | | | | | | |
Consumer discretionary | | | — | | | $ | 23,190,047 | | | $ | 433,444 | | | $ | 23,623,491 | |
Energy | | | — | | | | 17,900,437 | | | | 0 | * | | | 17,900,437 | |
Health care | | | — | | | | 11,261,854 | | | | 479,655 | | | | 11,741,509 | |
Other corporate bonds & notes | | | — | | | | 45,761,565 | | | | — | | | | 45,761,565 | |
Sovereign bonds | | | — | | | | 30,283,783 | | | | — | | | | 30,283,783 | |
Senior loans: | | | | | | | | | | | | | | | | |
Energy | | | — | | | | 534,544 | | | | 27,625 | | | | 562,169 | |
Utilities | | | — | | | | — | | | | 164,594 | | | | 164,594 | |
Other senior loans | | | — | | | | 10,731,882 | | | | — | | | | 10,731,882 | |
Convertible bonds & notes | | | — | | | | 2,823,224 | | | | — | | | | 2,823,224 | |
U.S. government & agency obligations | | | — | | | | 2,475,847 | | | | — | | | | 2,475,847 | |
Common stocks: | | | | | | | | | | | | | | | | |
Consumer discretionary | | | — | | | | — | | | | 748,335 | | | | 748,335 | |
Energy | | | — | | | | 359,495 | | | | 648,810 | | | | 1,008,305 | |
Industrials | | | — | | | | — | | | | 43,769 | | | | 43,769 | |
Utilities | | | — | | | | — | | | | 249,525 | | | | 249,525 | |
Investment in underlying funds | | $ | 1,488,500 | | | | — | | | | — | | | | 1,488,500 | |
Convertible preferred stocks: | | | — | | | | 479,892 | | | | — | | | | 479,892 | |
Preferred stocks | | | — | | | | — | | | | 50,262 | | | | 50,262 | |
| Total long-term investments | | | 1,488,500 | | | | 145,802,570 | | | | 2,846,019 | | | | 150,137,089 | |
| Short-term investments† | | | — | | | | 351 | | | | — | | | | 351 | |
| Total investments | | $ | 1,488,500 | | | $ | 145,802,921 | | | $ | 2,846,019 | | | $ | 150,137,440 | |
| Other financial instruments: | | | | | | | | | | | | | | | | |
Futures contracts | | | 40,627 | | | | — | | | | — | | | | 40,627 | |
Forward foreign currency contracts | | | — | | | | 253,634 | | | | — | | | | 253,634 | |
| Total other financial instruments | | $ | 40,627 | | | $ | 253,634 | | | | — | | | $ | 294,261 | |
| Total | | $ | 1,529,127 | | | $ | 146,056,555 | | | $ | 2,846,019 | | | $ | 150,431,701 | |
|
| LIABILITIES | |
| Description | | Quoted Prices
(Level 1) | | | Other Significant
Observable Inputs
(Level 2) | | | Significant
Unobservable
Inputs
(Level 3) | | | Total | |
| Other financial instruments: | | | | | | | | | | | | | | | | |
Forward foreign currency contracts | | | — | | | $ | 62,852 | | | | — | | | $ | 62,852 | |
| † | See Schedule of Investments for additional detailed categorizations. |
| * | Amount represents less than $1. |
| | |
| 30 | | Western Asset Variable Global High Yield Bond Portfolio 2018 Semi-Annual Report |
| | | | | | | | | | | | | | | | | | | | |
| Investments in Securities | | Balance as of December 31,
2017 | | | Accrued Premiums/
Discounts | | | Realized Gain/(Loss)1 | | | Change in Unrealized Appreciation
(Depreciation)2 | | | Purchases | |
| Corporate bonds | | | | | | | | | | | | | | | | | | | | |
| Consumer discretionary | | $ | 390,503 | | | $ | 1,428 | | | $ | — | | | $ | (1,428) | | | $ | 42,941 | |
| Energy | | | 0 | * | | | — | | | | — | | | | — | | | | — | |
| Health care | | | 458,679 | | | | 391 | | | | — | | | | 20,585 | | | | — | |
| Industrials | | | 127,102 | | | | (632) | | | | — | | | | — | | | | — | |
| Materials | | | 0 | * | | | — | | | | (84) | | | | 84 | | | | — | |
| Senior loans | | | | | | | | | | | | | | | | | | | | |
| Consumer discretionary | | | 217,300 | | | | (419) | | | | — | | | | 90,619 | | | | — | |
| Energy | | | 89,713 | | | | 8 | | | | 53 | | | | 10,895 | | | | — | |
| Information technology | | | 1,258,238 | | | | 111 | | | | — | | | | (8,320) | | | | — | |
| Utilities | | | — | | | | (2,000) | | | | — | | | | (35,122) | | | | 201,716 | |
| Common stocks | | | | | | | | | | | | | | | | | | | | |
| Consumer discretionary | | | 412,102 | | | | — | | | | — | | | | 336,233 | | | | — | |
| Energy | | | 414,776 | | | | — | | | | — | | | | (30,203) | | | | — | |
| Industrials | | | 30,471 | | | | — | | | | — | | | | 13,298 | | | | — | |
| Utilities | | | — | | | | — | | | | — | | | | 5,588 | | | | 243,937 | |
| Preferred stocks | | | | | | | | | | | | | | | | | | | | |
| Industrials | | | 46,542 | | | | — | | | | — | | | | — | | | | 3,720 | |
| | | $ | 3,445,426 | | | $ | (1,113) | | | $ | (31) | | | $ | 402,229 | | | $ | 492,314 | |
| | | | | | | | | | | | | | | | | | | | |
| Investments in Securities (con'd) | | Sales | | | Transfers
into
Level 33 | | | Transfers out
of Level 34 | | | Balance as of
June 30, 2018 | | | Net Change in Unrealized Appreciation
(Depreciation)
for Investments in Securities Still Held at June 30, 20182 | |
| Corporate bonds | | | | | | | | | | | | | | | | | | | | |
| Consumer discretionary | | $ | — | | | $ | — | | | $ | — | | | $ | 433,444 | | | $ | (1,428) | |
| Energy | | | — | | | | — | | | | — | | | | 0 | * | | | — | |
| Health care | | | — | | | | — | | | | — | | | | 479,655 | | | | 20,585 | |
| Industrials | | | (126,470) | | | | — | | | | — | | | | — | | | | — | |
| Materials | | | — | | | | — | | | | — | | | | — | | | | — | |
| Senior loans | | | | | | | | | | | | | | | | | | | | |
| Consumer discretionary | | | — | | | | — | | | | (307,500) | | | | — | | | | — | |
| Energy | | | (73,044) | | | | — | | | | — | | | | 27,625 | | | | (4,853) | |
| Information technology | | | — | | | | — | | | | (1,250,029) | | | | — | | | | — | |
| Utilities | | | — | | | | — | | | | — | | | | 164,594 | | | | (35,122) | |
| Common stocks | | | | | | | | | | | | | | | | | | | | |
| Consumer discretionary | | | — | | | | — | | | | — | | | | 748,335 | | | | 336,233 | |
| Energy | | | — | | | | 264,237 | | | | — | | | | 648,810 | | | | (30,203) | |
| Industrials | | | — | | | | — | | | | — | | | | 43,769 | | | | 13,298 | |
| Utilities | | | — | | | | — | | | | — | | | | 249,525 | | | | 5,588 | |
| Preferred stocks | | | | | | | | | | | | | | | | | | | | |
| Industrials | | | — | | | | — | | | | — | | | | 50,262 | | | | — | |
| | | $ | (199,514) | | | $ | 264,237 | | | | $(1,557,529) | | | $ | 2,846,019 | | | $ | 304,098 | |
| | |
| Western Asset Variable Global High Yield Bond Portfolio 2018 Semi-Annual Report | | 31 |
Notes to financial statements (unaudited) (cont’d)
The Portfolio’s policy is to recognize transfers between levels as of the end of the reporting period.
| * | Amount represents less than $1. |
| 1 | This amount is included in net realized gain (loss) from investment transactions in the accompanying Statement of Operations. |
| 2 | This amount is included in the change in net unrealized appreciation (depreciation) in the accompanying Statement of Operations. Change in unrealized appreciation (depreciation) includes net unrealized appreciation (depreciation) resulting from changes in investment values during the reporting period and the reversal of previously recorded unrealized appreciation (depreciation) when gains or losses are realized. |
| 3 | Transferred into Level 3 as a result of the unavailability of a quoted price in an active market for an identical investment or the unavailability of other significant observable inputs. |
| 4 | Transferred out of Level 3 as a result of the availability of a quoted price in an active market for an identical investment or the availability of other significant observable inputs. |
(b) Written options. When the Portfolio writes an option, an amount equal to the premium received by the Portfolio is recorded as a liability, the value of which is marked-to-market daily to reflect the current market value of the option written. If the option expires, the premium received is recorded as a realized gain. When a written call option is exercised, the difference between the premium received plus the option exercise price and the Portfolio’s basis in the underlying security (in the case of a covered written call option), or the cost to purchase the underlying security (in the case of an uncovered written call option), including brokerage commission, is recognized as a realized gain or loss. When a written put option is exercised, the amount of the premium received is subtracted from the cost of the security purchased by the Portfolio from the exercise of the written put option to form the Portfolio’s basis in the underlying security purchased. The writer or buyer of an option traded on an exchange can liquidate the position before the exercise of the option by entering into a closing transaction. The cost of a closing transaction is deducted from the original premium received resulting in a realized gain or loss to the Portfolio.
The risk in writing a covered call option is that the Portfolio may forego the opportunity of profit if the market price of the underlying security increases and the option is exercised. The risk in writing a put option is that the Portfolio may incur a loss if the market price of the underlying security decreases and the option is exercised. The risk in writing an uncovered call option is that the Portfolio is exposed to the risk of loss if the market price of the underlying security increases. In addition, there is the risk that the Portfolio may not be able to enter into a closing transaction because of an illiquid secondary market.
(c) Futures contracts. The Portfolio uses futures contracts generally to gain exposure to, or hedge against, changes in interest rates or gain exposure to, or hedge against, changes in certain asset classes. A futures contract represents a commitment for the future purchase or sale of an asset at a specified price on a specified date.
Upon entering into a futures contract, the Portfolio is required to deposit cash or cash equivalents with a broker in an amount equal to a certain percentage of the contract amount. This is known as the ‘‘initial margin’’ and subsequent payments (‘‘variation margin’’) are made or received by the Portfolio each day, depending on the daily fluctuation in the value of the contract. For certain futures, including foreign denominated futures, variation margin is not settled
| | |
| 32 | | Western Asset Variable Global High Yield Bond Portfolio 2018 Semi-Annual Report |
daily, but is recorded as a net variation margin payable or receivable. The daily changes in contract value are recorded as unrealized gains or losses in the Statement of Operations and the Portfolio recognizes a realized gain or loss when the contract is closed.
Futures contracts involve, to varying degrees, risk of loss in excess of the amounts reflected in the financial statements. In addition, there is the risk that the Portfolio may not be able to enter into a closing transaction because of an illiquid secondary market.
(d) Forward foreign currency contracts. The Portfolio enters into a forward foreign currency contract to hedge against foreign currency exchange rate risk on its non-U.S. dollar denominated securities or to facilitate settlement of a foreign currency denominated portfolio transaction. A forward foreign currency contract is an agreement between two parties to buy and sell a currency at a set price with delivery and settlement at a future date. The contract is marked-to-market daily and the change in value is recorded by the Portfolio as an unrealized gain or loss. When a forward foreign currency contract is closed, through either delivery or offset by entering into another forward foreign currency contract, the Portfolio recognizes a realized gain or loss equal to the difference between the value of the contract at the time it was opened and the value of the contract at the time it is closed.
Forward foreign currency contracts involve elements of market risk in excess of the amounts reflected on the Statement of Assets and Liabilities. The Portfolio bears the risk of an unfavorable change in the foreign exchange rate underlying the forward foreign currency contract. Risks may also arise upon entering into these contracts from the potential inability of the counterparties to meet the terms of their contracts.
(e) Loan participations. The Portfolio may invest in loans arranged through private negotiation between one or more financial institutions. The Portfolio’s investment in any such loan may be in the form of a participation in or an assignment of the loan. In connection with purchasing participations, the Portfolio generally will have no right to enforce compliance by the borrower with the terms of the loan agreement related to the loan, or any rights of off-set against the borrower and the Portfolio may not benefit directly from any collateral supporting the loan in which it has purchased the participation.
The Portfolio assumes the credit risk of the borrower, the lender that is selling the participation and any other persons interpositioned between the Portfolio and the borrower. In the event of the insolvency of the lender selling the participation, the Portfolio may be treated as a general creditor of the lender and may not benefit from any off-set between the lender and the borrower.
(f) Unfunded loan commitments. The Portfolio may enter into certain credit agreements where all or a portion of which may be unfunded. The Portfolio is obligated to fund these commitments at the borrower’s discretion. The commitments are disclosed in the accompanying Schedule of Investments. At June 30, 2018, the Portfolio had sufficient cash and/or securities to cover these commitments.
(g) Foreign currency translation. Investment securities and other assets and liabilities denominated in foreign currencies are translated into U.S. dollar amounts based upon
| | |
| Western Asset Variable Global High Yield Bond Portfolio 2018 Semi-Annual Report | | 33 |
Notes to financial statements (unaudited) (cont’d)
prevailing exchange rates on the date of valuation. Purchases and sales of investment securities and income and expense items denominated in foreign currencies are translated into U.S. dollar amounts based upon prevailing exchange rates on the respective dates of such transactions.
The Portfolio does not isolate that portion of the results of operations resulting from fluctuations in foreign exchange rates on investments from the fluctuations arising from changes in market prices of securities held. Such fluctuations are included with the net realized and unrealized gain or loss on investments.
Net realized foreign exchange gains or losses arise from sales of foreign currencies, including gains and losses on forward foreign currency contracts, currency gains or losses realized between the trade and settlement dates on securities transactions, and the difference between the amounts of dividends, interest, and foreign withholding taxes recorded on the Portfolio’s books and the U.S. dollar equivalent of the amounts actually received or paid. Net unrealized foreign exchange gains and losses arise from changes in the values of assets and liabilities, other than investments in securities, on the date of valuation, resulting from changes in exchange rates.
Foreign security and currency transactions may involve certain considerations and risks not typically associated with those of U.S. dollar denominated transactions as a result of, among other factors, the possibility of lower levels of governmental supervision and regula-tion of foreign securities markets and the possibility of political or economic instability.
(h) Credit and market risk. The Portfolio invests in high-yield and emerging market instruments that are subject to certain credit and market risks. The yields of high-yield and emerging market debt obligations reflect, among other things, perceived credit and market risks. The Portfolio’s investments in securities rated below investment grade typically involve risks not associated with higher rated securities including, among others, greater risk related to timely and ultimate payment of interest and principal, greater market price volatility and less liquid secondary market trading. The consequences of political, social, economic or diplomatic changes may have disruptive effects on the market prices of investments held by the Portfolio. The Portfolio’s investments in non-U.S. dollar denominated securities may also result in foreign currency losses caused by devaluations and exchange rate fluctuations.
(i) Foreign investment risks. The Portfolio’s investments in foreign securities may involve risks not present in domestic investments. Since securities may be denominated in foreign currencies, may require settlement in foreign currencies or pay interest or dividends in foreign currencies, changes in the relationship of these foreign currencies to the U.S. dollar can significantly affect the value of the investments and earnings of the Portfolio. Foreign investments may also subject the Portfolio to foreign government exchange restrictions, expropriation, taxation or other political, social or economic developments, all of which affect the market and/or credit risk of the investments.
| | |
| 34 | | Western Asset Variable Global High Yield Bond Portfolio 2018 Semi-Annual Report |
(j) Counterparty risk and credit-risk-related contingent features of derivative instruments. The Portfolio may invest in certain securities or engage in other transactions,where the Portfolio is exposed to counterparty credit risk in addition to broader market risks. The Portfolio may invest in securities of issuers, which may also be considered counterparties as trading partners in other transactions. This may increase the risk of loss in the event of default or bankruptcy by the counterparty or if the counterparty otherwise fails to meet its contractual obligations. The Portfolio’s subadviser attempts to mitigate counterparty risk by (i) periodically assessing the creditworthiness of its trading partners, (ii) monitoring and/or limiting the amount of its net exposure to each individual counterparty based on its assessment and (iii) requiring collateral from the counterparty for certain transactions. Market events and changes in overall economic conditions may impact the assessment of such counterparty risk by the subadviser. In addition, declines in the values of underlying collateral received may expose the Portfolio to increased risk of loss.
With exchange traded and centrally cleared derivatives, there is less counterparty risk to the Portfolio since the exchange or clearinghouse, as counterparty to such instruments, guarantees against a possible default. The clearinghouse stands between the buyer and the seller of the contract; therefore, the credit risk is limited to failure of the clearinghouse. While offset rights may exist under applicable law, the Portfolio does not have a contractual right of offset against a clearing broker or clearinghouse in the event of a default of the clearing broker or clearinghouse.
The Portfolio has entered into master agreements, such as an International Swaps and Derivatives Association, Inc. Master Agreement (“ISDA Master Agreement”) or similar agreement, with certain of its derivative counterparties that govern over-the-counter derivatives and provide for general obligations, representations, agreements, collateral posting terms, netting provisions in the event of default or termination and credit related contingent features. The credit related contingent features include, but are not limited to, a percentage decrease in the Portfolio’s net assets or NAV over a specified period of time. If these credit related contingent features were triggered, the derivatives counterparty could terminate the positions and demand payment or require additional collateral.
Under an ISDA Master Agreement, the Portfolio may, under certain circumstances, offset with the counterparty certain derivative financial instruments’ payables and/or receivables with collateral held and/or posted and create one single net payment. However, absent
an event of default by the counterparty or a termination of the agreement, the terms of the ISDA Master Agreements do not result in an offset of reported amounts of financial assets and financial liabilities in the Statement of Assets and Liabilities across transactions between the Portfolio and the applicable counterparty. The enforceability of the right to offset may vary by jurisdiction.
Collateral requirements differ by type of derivative. Collateral or margin requirements are set by the broker or exchange clearinghouse for exchange traded derivatives while collateral terms are contract specific for over-the-counter traded derivatives. Cash collateral that has been pledged to cover obligations of the Portfolio under derivative contracts, if any,
| | |
| Western Asset Variable Global High Yield Bond Portfolio 2018 Semi-Annual Report | | 35 |
Notes to financial statements (unaudited) (cont’d)
will be reported separately in the Statement of Assets and Liabilities. Securities pledged as collateral, if any, for the same purpose are noted in the Schedule of Investments.
As of June 30, 2018, the Portfolio held forward foreign currency contracts with credit related contingent features which had a liability position of $62,852. If a contingent feature in the master agreements would have been triggered, the Portfolio would have been required to pay this amount to its derivative counterparties.
(k) Security transactions and investment income. Security transactions are accounted for on a trade date basis. Interest income (including interest income from payment-in-kind securities), adjusted for amortization of premium and accretion of discount, is recorded on the accrual basis. Dividend income is recorded on the ex-dividend date for dividends received in cash and/or securities. Foreign dividend income is recorded on the ex-dividend date or as soon as practicable after the Portfolio determines the existence of a dividend declaration after exercising reasonable due diligence. The cost of investments sold is determined by use of the specific identification method. To the extent any issuer defaults or a credit event occurs that impacts the issuer, the Portfolio may halt any additional interest income accruals and consider the realizability of interest accrued up to the date of default or credit event.
(l) Distributions to shareholders. Distributions from net investment income and distributions of net realized gains, if any, are declared at least annually. Distributions to shareholders of the Portfolio are recorded on the ex-dividend date and are determined in accordance with income tax regulations, which may differ from GAAP.
(m) Share class accounting. Investment income, common expenses and realized/ unrealized gains (losses) on investments are allocated to the various classes of the Portfolio on the basis of daily net assets of each class. Fees relating to a specific class are charged directly to that share class.
(n) Compensating balance arrangements. The Portfolio has an arrangement with its custodian bank whereby a portion of the custodian’s fees is paid indirectly by credits earned on the Portfolio’s cash on deposit with the bank.
(o) Federal and other taxes. It is the Portfolio’s policy to comply with the federal income and excise tax requirements of the Internal Revenue Code of 1986 (the “Code”), as amended, applicable to regulated investment companies. Accordingly, the Portfolio intends to distribute its taxable income and net realized gains, if any, to shareholders in accordance with timing requirements imposed by the Code. Therefore, no federal or state income tax provision is required in the Portfolio’s financial statements.
Management has analyzed the Portfolio’s tax positions taken on income tax returns for all open tax years and has concluded that as of December 31, 2017, no provision for income tax is required in the Portfolio’s financial statements. The Portfolio’s federal and state income and federal excise tax returns for tax years for which the applicable statutes of limitations have not expired are subject to examination by the Internal Revenue Service and state departments of revenue.
| | |
| 36 | | Western Asset Variable Global High Yield Bond Portfolio 2018 Semi-Annual Report |
Under the applicable foreign tax laws, a withholding tax may be imposed on interest, dividends and capital gains at various rates. Realized gain upon disposition of securities issued in or by certain foreign countries are subject to capital gains tax imposed by those countries.
(p) Reclassification. GAAP requires that certain components of net assets be reclassified to reflect permanent differences between financial and tax reporting. These reclassifications have no effect on net assets or net asset value per share.
2. Investment management agreement and other transactions with affiliates
Legg Mason Partners Fund Advisor, LLC (“LMPFA”) is the Portfolio’s investment manager. Western Asset Management Company, LLC (formerly Western Asset Management Company) (“Western Asset”), Western Asset Management Company Limited (“Western Asset London”) and Western Asset Management Company Pte. Ltd. (“Western Singapore”) are the Portfolio’s subadvisers. LMPFA, Western Asset, Western Asset London and Western Singapore are wholly-owned subsidiaries of Legg Mason, Inc. (“Legg Mason”).
Under the investment management agreement, the Portfolio pays an investment management fee, calculated daily and paid monthly, at an annual rate of 0.70% of the Portfolio’s average daily net assets.
LMPFA provides administrative and certain oversight services to the Portfolio. LMPFA delegates to Western Asset the day-to-day portfolio management of the Portfolio. Western Asset London and Western Singapore provide certain subadvisory services to the Portfolio relating to currency transactions and investment in non-U.S. dollar denominated securities and related foreign currency instruments. For its services, LMPFA pays Western Asset monthly 70% of the net management fee it receives from the Portfolio. In turn, Western Asset pays Western Asset London and Western Singapore monthly a subadvisory fee of 0.30% on the assets managed by Western Asset London and Western Singapore.
As a result of expense limitation arrangements between the Portfolio and LMPFA, the ratio of total annual fund operating expenses, other than interest, brokerage, taxes, extraordinary expenses and acquired fund fees and expenses, to average net assets of Class I and Class II shares did not exceed 0.90% and 1.15%, respectively. These expense limitation arrangements cannot be terminated prior to December 31, 2019 without the Board of Trustees’ consent.
LMPFA is permitted to recapture amounts waived and/or reimbursed to a class during the same fiscal year if the class’ total annual operating expenses have fallen to a level below the expense limitation (“expense cap”) in effect at the time the fees were earned or the expenses incurred. In no case will LMPFA recapture any amount that would result, on any particular business day of the Portfolio, in the class’ total annual operating expenses exceeding the expense cap or any other lower limit then in effect.
Legg Mason Investor Services, LLC, a wholly-owned broker-dealer subsidiary of Legg Mason, serves as the Portfolio’s sole and exclusive distributor.
| | |
| Western Asset Variable Global High Yield Bond Portfolio 2018 Semi-Annual Report | | 37 |
Notes to financial statements (unaudited) (cont’d)
All officers and one Trustee of the Trust are employees of Legg Mason or its affiliates and do not receive compensation from the Trust.
3. Investments
During the six months ended June 30, 2018, the aggregate cost of purchases and proceeds from sales of investments (excluding short-term investments) and U.S. Government & Agency Obligations were as follows:
| | | | | | | | |
| | | Investments | | | U.S. Government &
Agency Obligations | |
| Purchases | | $ | 89,740,358 | | | $ | 11,906,094 | |
| Sales | | | 93,647,180 | | | | 17,370,751 | |
At June 30, 2018, the aggregate cost of investments and the aggregate gross unrealized appreciation and depreciation of investments for federal income tax purposes were substantially as follows:
| | | | | | | | | | | | | | | | |
| | | Cost | | | Gross
Unrealized
Appreciation | | | Gross
Unrealized
Depreciation | | | Net
Unrealized
Appreciation/
(Depreciation) | |
| Securities | | $ | 157,201,375 | | | $ | 2,940,737 | | | $ | (10,004,672) | | | $ | (7,063,935) | |
| Futures contracts | | | — | | | | 40,627 | | | | — | | | | 40,627 | |
| Forward foreign currency contracts | | | — | | | | 253,634 | | | | (62,852) | | | | 190,782 | |
4. Derivative instruments and hedging activities
Below is a table, grouped by derivative type, that provides information about the fair value and the location of derivatives within the Statement of Assets and Liabilities at June 30, 2018.
| | | | |
ASSET DERIVATIVES1 | |
| | | Foreign
Exchange Risk | |
| Futures contracts2 | | $ | 40,627 | |
| Forward foreign currency contracts | | | 253,634 | |
| Total | | $ | 294,261 | |
| | | | |
LIABILITY DERIVATIVES1 | |
| | | Foreign
Exchange Risk | |
| Forward foreign currency contracts | | $ | 62,852 | |
| 1 | Generally, the balance sheet location for asset derivatives is receivables/net unrealized appreciation (depreciation) and for liability derivatives is payables/net unrealized appreciation (depreciation). |
| 2 | Includes cumulative appreciation (depreciation) of futures contracts as reported in the Schedule of Investments. Only variation margin is reported within the receivables and/or payables on the Statement of Assets and Liabilities. |
The following tables provide information about the effect of derivatives and hedging activities on the Portfolio’s Statement of Operations for the six months ended June 30, 2018. The first table provides additional detail about the amounts and sources of gains (losses) realized on
| | |
| 38 | | Western Asset Variable Global High Yield Bond Portfolio 2018 Semi-Annual Report |
derivatives during the period. The second table provides additional information about the change in unrealized appreciation (depreciation) resulting from the Portfolio’s derivatives and hedging activities during the period.
| | | | |
| AMOUNT OF REALIZED GAIN (LOSS) ON DERIVATIVES RECOGNIZED | |
| | | Foreign
Exchange Risk | |
| Written options | | $ | 36,451 | |
| Futures contracts | | | 70,853 | |
| Forward foreign currency contracts | | | (168,160) | |
| Total | | $ | (60,856) | |
| | | | |
| CHANGE IN UNREALIZED APPRECIATION (DEPRECIATION) ON DERIVATIVES RECOGNIZED | |
| | | Foreign
Exchange Risk | |
| Written options | | $ | 23,624 | |
| Futures contracts | | | 40,627 | |
| Forward foreign currency contracts | | | 221,525 | |
| Total | | $ | 285,776 | |
During the six months ended June 30, 2018, the volume of derivative activity for the Portfolio was as follows:
| | | | |
| | | Average Market
Value | |
| Written options† | | $ | 8,582 | |
| Futures contracts (to sell) | | | 3,499,538 | |
| Forward foreign currency contracts (to buy) | | | 1,351,291 | |
| Forward foreign currency contracts (to sell) | | | 3,653,386 | |
| † | At June 30, 2018, there were no open positions held in this derivative. |
The following table presents the Portfolio’s OTC derivative assets and liabilities by counterparty net of amounts available for offset under an ISDA Master Agreement and net of the related collateral pledged (received) by the Portfolio as of June 30, 2018.
| | | | | | | | | | | | | | | | | | | | |
| Counterparty | | Gross Assets
Subject to
Master
Agreements1 | | | Gross
Liabilities
Subject to
Master
Agreements1 | | | Net Assets
(Liabilities)
Subject to
Master
Agreements | | | Collateral
Pledged
(Received) | | | Net
Amount2 | |
| Barclays Bank PLC | | $ | 251,538 | | | $ | (62,309) | | | $ | 189,229 | | | | — | | | $ | 189,229 | |
| Citibank N.A. | | | 2,096 | | | | (543) | | | | 1,553 | | | | — | | | | 1,553 | |
| Total | | $ | 253,634 | | | $ | (62,852) | | | $ | 190,782 | | | | — | | | $ | 190,782 | |
| 1 | Absent an event of default or early termination, derivative assets and liabilities are presented gross and not offset in the Statement of Assets and Liabilities. |
| 2 | Represents the net amount receivable (payable) from (to) the counterparty in the event of default. |
5. Class specific expenses, waivers and/or expense reimbursements
The Portfolio has adopted a Rule 12b-1 shareholder services and distribution plan and under that plan the Portfolio pays service and/or distribution fees with respect to its Class II
| | |
| Western Asset Variable Global High Yield Bond Portfolio 2018 Semi-Annual Report | | 39 |
Notes to financial statements (unaudited) (cont’d)
shares calculated at the annual rate of 0.25% of the average daily net assets of the class. Service and/or distribution fees are accrued daily and paid monthly.
For the six months ended June 30, 2018, class specific expenses were as follows:
| | | | | | | | |
| | | Service and/or
Distribution Fees | | | Transfer Agent
Fees | |
| Class I | | | — | | | $ | 1,039 | |
| Class II | | $ | 32,709 | | | | 358 | |
| Total | | $ | 32,709 | | | $ | 1,397 | |
6. Distributions to shareholders by class
| | | | | | | | |
| | | Six Months Ended
June 30, 2018 | | | Year Ended
December 31, 2017 | |
| Net Investment Income: | | | | | | | | |
| Class I | | $ | 83,495 | | | $ | 7,516,849 | |
| Class II | | | 16,527 | | | | 1,383,169 | |
| Total | | $ | 100,022 | | | $ | 8,900,018 | |
7. Shares of beneficial interest
At June 30, 2018, the Trust had an unlimited number of shares of beneficial interest authorized with a par value of $0.00001 per share. The Portfolio has the ability to issue multiple classes of shares. Each class of shares represents an identical interest and has the same rights, except that each class bears certain direct expenses, including those specifically related to the distribution of its shares.
Transactions in shares of each class were as follows:
| | | | | | | | | | | | | | | | |
| | | Six Months Ended
June 30, 2018 | | | Year Ended
December 31, 2017 | |
| | | Shares | | | Amount | | | Shares | | | Amount | |
| Class I | | | | | | | | | | | | | | | | |
| Shares sold | | | 1,303,910 | | | $ | 9,432,522 | | | | 4,641,443 | | | $ | 34,977,067 | |
| Shares issued on reinvestment | | | 11,694 | | | | 83,495 | | | | 1,033,954 | | | | 7,516,849 | |
| Shares repurchased | | | (3,093,789) | | | | (22,353,430) | | | | (5,548,003) | | | | (41,866,908) | |
| Net increase (decrease) | | | (1,778,185) | | | $ | (12,837,413) | | | | 127,394 | | | $ | 627,008 | |
| | | | |
| Class II | | | | | | | | | | | | | | | | |
| Shares sold | | | 609,629 | | | $ | 4,533,218 | | | | 2,705,045 | | | $ | 20,531,382 | |
| Shares issued on reinvestment | | | 2,249 | | | | 16,527 | | | | 184,669 | | | | 1,383,169 | |
| Shares repurchased | | | (907,892) | | | | (6,784,050) | | | | (1,855,157) | | | | (14,177,637) | |
| Net increase (decrease) | | | (296,014) | | | $ | (2,234,305) | | | | 1,034,557 | | | $ | 7,736,914 | |
8. Transactions with affiliated companies
As defined by the 1940 Act, an affiliated company is one in which the Portfolio owns 5% or more of the outstanding voting securities, or a company which is under common ownership or control. The Portfolio may invest in Western Asset Government Cash Management Portfolio, LLC (“Cash Management Portfolio”), an affiliated private money
| | |
| 40 | | Western Asset Variable Global High Yield Bond Portfolio 2018 Semi-Annual Report |
market fund managed by Western Asset, the Portfolio’s subadviser. Cash Management Portfolio is available as a cash management vehicle for certain proprietary investment companies affiliated with Legg Mason. While Cash Management Portfolio is not a registered money market fund, it conducts all of its investment activities in accordance with the requirements of Rule 2a-7 under the 1940 Act. Based on the Portfolio’s relative ownership, the following companies were considered affiliated companies for all or some portion of the six months ended June 30, 2018. The following transactions were effected in shares of such companies for the six months ended June 30, 2018.
| | | | | | | | | | | | | | | | | | | | | | | | | | | | | | | | | | | | |
| | | Affiliate
Value at
December 31,
2017 | | | Purchased | | | Sold | | | Realized
Gain
(Loss) | | | Interest
Income | | | Net Increase
(Decrease) in
Unrealized
Appreciation
(Depreciation) | | | Affiliate
Value at
June 30,
2018 | |
| | Cost | | | Shares | | | Cost | | | Shares | |
| Western Asset Government Cash Management Portfolio LLC | | $ | 2,502,039 | | | $ | 23,208,852 | | | | 23,208,852 | | | $ | 25,710,540 | | | | 25,710,540 | | | | — | | | $ | 7,167 | | | | — | | | $ | 351 | |
9. Restricted securities
The following Portfolio investments are restricted as to resale.
| | | | | | | | | | | | | | | | | | | | | | | | |
| Security | | Number of
Shares/
Units | | | Acquisition
Date | | | Cost | | | Value
at 6/30/2018 | | | Value Per
Share/Unit | | | Percent of
Net Assets | |
| BioScrip Inc., First Lien Notes, 8.224%, due 6/30/22 | | $ | 459,000 | | | | 6/17 | | | $ | 455,178 | | | $ | 479,655 | | | $ | 104.50 | | | | 0.31 | % |
| Berry Petroleum Co., Covertible Preferred Stocks | | | 506 | | | | 2/17 | | | | 4,835 | | | | 7,084 | | | | 14.00 | | | | 0.00 | |
| | | | | | | | | | | $ | 460,013 | | | $ | 486,739 | | | | | | | | 0.31 | % |
10. Redemption facility
The Portfolio and certain other participating funds within the Legg Mason Partners Income Trust, Legg Mason Partners Institutional Trust, Legg Mason Partners Variable Income Trust, and Master Portfolio Trust (the “Participating Funds”), have available an unsecured revolving credit facility (the “Redemption Facility”) from the lenders and The Bank of New York Mellon (“BNY Mellon”), as administrative agent for the lenders. The Redemption Facility is to be used for temporary or emergency purposes as an additional source of liquidity to fund redemptions of shares. Under the agreement, BNY Mellon provides a 364-day revolving credit facility, in the aggregate amount of $220 million. Unless renewed, the agreement will terminate on November 19, 2018. Any borrowings under the Redemption Facility will bear interest at current market rates as set forth in the credit agreement. The annual commitment fee to maintain the Redemption Facility is 0.10% and is incurred on the unused portion of the facility and is allocated to all Participating Funds pro rata based on net assets. For the six months ended June 30, 2018, the Portfolio incurred a commitment fee in the amount of $929. The Portfolio did not utilize the Redemption Facility during the six months ended June 30, 2018.
| | |
| Western Asset Variable Global High Yield Bond Portfolio 2018 Semi-Annual Report | | 41 |
Western Asset
Variable Global High Yield Bond Portfolio
Trustees
Elliot J. Berv
Jane F. Dasher
Mark T. Finn
Stephen R. Gross
Richard E. Hanson, Jr.
Susan M. Heilbron
Chair
Susan B. Kerley
R. Richardson Pettit
Jane Trust
| † | Prior to May 2, 2018, known as Western Asset Management Company. |
| * | Effective April 9, 2018, BNY became custodian. |
Investment manager
Legg Mason Partners Fund Advisor, LLC
Subadviser
Western Asset Management Company,
LLC†
Western Asset Management Company Limited
Western Asset Management Company Pte. Ltd.
Distributor
Legg Mason Investor Services, LLC
Custodian
The Bank of New York Mellon (“BNY”)*
Transfer agent
BNY Mellon Investment Servicing (US) Inc.
4400 Computer Drive
Westborough, MA 01581
Independent registered public accounting firm
PricewaterhouseCoopers LLP
Baltimore, MD
Western Asset Variable Global High Yield Bond Portfolio
The Portfolio is a separate investment series of Legg Mason Partners Variable Income Trust, a Maryland statutory trust.
Western Asset Variable Global High Yield Bond Portfolio
Legg Mason Funds
620 Eighth Avenue, 49th Floor
New York, NY 10018
The Portfolio files its complete schedule of portfolio holdings with the Securities and Exchange Commission (“SEC”) for the first and third quarters of each fiscal year on Form N-Q. The Portfolio’s Forms N-Q are available on the SEC’s website at www.sec.gov. The Portfolio’s Forms N-Q may be reviewed and copied at the SEC’s Public Reference Room in Washington, D.C., and information on the operation of the Public Reference Room may be obtained by calling 1-800-SEC-0330. To obtain information on Form N-Q, shareholders can call the Portfolio at 1-877-721-1926.
Information on how the Portfolio voted proxies relating to portfolio securities during the prior 12-month period ended June 30th of each year and a description of the policies and procedures that the Portfolio uses to determine how to vote proxies related to portfolio transactions are available (1) without charge, upon request, by calling the Portfolio at 1-877-721-1926, (2) at www.leggmason.com/variablefunds and (3) on the SEC’s website at www.sec.gov.
This report is submitted for the general information of the shareholders of Western Asset Variable Global High Yield Bond Portfolio. This report is not authorized for distribution to prospective investors in the Portfolio unless preceded or accompanied by a current prospectus.
Investors should consider the Portfolio’s investment objectives, risks, charges and expenses carefully before investing. The prospectus contains this and other important information about the Portfolio. Please read the prospectus carefully before investing.
www.leggmason.com
© 2018 Legg Mason Investors Services, LLC
Member FINRA, SIPC
Legg Mason Funds Privacy and Security Notice
Your Privacy and the Security of Your Personal Information is Very Important to the Legg Mason Funds
This Privacy and Security Notice (the “Privacy Notice”) addresses the Legg Mason Funds’ privacy and data protection practices with respect to nonpublic personal information the Funds receive. The Legg Mason Funds include any funds sold by the Funds’ distributor, Legg Mason Investor Services, LLC, as well as Legg Mason-sponsored closed-end funds. The provisions of this Privacy Notice apply to your information both while you are a shareholder and after you are no longer invested with the Funds.
The Type of Nonpublic Personal Information the Funds Collect About You
The Funds collect and maintain nonpublic personal information about you in connection with your shareholder account. Such information may include, but is not limited to:
| • | | Personal information included on applications or other forms; |
| • | | Account balances, transactions, and mutual fund holdings and positions; |
| • | | Bank account information, legal documents, and identity verification documentation; |
| • | | Online account access user IDs, passwords, security challenge question responses; and |
| • | | Information received from consumer reporting agencies regarding credit history and creditworthiness (such as the amount of an individual’s total debt, payment history, etc.). |
How the Funds Use Nonpublic Personal Information About You
The Funds do not sell or share your nonpublic personal information with third parties or with affiliates for their marketing purposes, or with other financial institutions or affiliates for joint marketing purposes, unless you have authorized the Funds to do so. The Funds do not disclose any nonpublic personal information about you except as may be required to perform transactions or services you have authorized or as permitted or required by law. The Funds may disclose information about you to:
| • | | Employees, agents, and affiliates on a “need to know” basis to enable the Funds to conduct ordinary business or to comply with obligations to government regulators; |
| • | | Service providers, including the Funds’ affiliates, who assist the Funds as part of the ordinary course of business (such as printing, mailing services, or processing or servicing your account with us) or otherwise perform services on the Funds’ behalf, including companies that may perform statistical analysis, market research and marketing services solely for the Funds; |
| • | | Permit access to transfer, whether in the United States or countries outside of the United States to such Funds’ employees, agents and affiliates and service providers as required to enable the Funds to conduct ordinary business, or to comply with obligations to government regulators; |
| • | | The Funds’ representatives such as legal counsel, accountants and auditors to enable the Funds to conduct ordinary business, or to comply with obligations to government regulators; |
| • | | Fiduciaries or representatives acting on your behalf, such as an IRA custodian or trustee of a grantor trust. |
|
| NOT PART OF THE SEMI-ANNUAL REPORT |
Legg Mason Funds Privacy and Security Notice (cont’d)
Except as otherwise permitted by applicable law, companies acting on the Funds’ behalf, including those outside the United States, are contractually obligated to keep nonpublic personal information the Funds provide to them confidential and to use the information the Funds share only to provide the services the Funds ask them to perform.
The Funds may disclose nonpublic personal information about you when necessary to enforce their rights or protect against fraud, or as permitted or required by applicable law, such as in connection with a law enforcement or regulatory request, subpoena, or similar legal process. In the event of a corporate action or in the event a Fund service provider changes, the Funds may be required to disclose your nonpublic personal information to third parties. While it is the Funds’ practice to obtain protections for disclosed information in these types of transactions, the Funds cannot guarantee their privacy policy will remain unchanged.
Keeping You Informed of the Funds’ Privacy and Security Practices
The Funds will notify you annually of their privacy policy as required by federal law. While the Funds reserve the right to modify this policy at any time they will notify you promptly if this privacy policy changes.
The Funds’ Security Practices
The Funds maintain appropriate physical, electronic and procedural safeguards designed to guard your nonpublic personal information. The Funds’ internal data security policies restrict access to your nonpublic personal information to authorized employees, who may use your nonpublic personal information for Fund business purposes only.
Although the Funds strive to protect your nonpublic personal information, they cannot ensure or warrant the security of any information you provide or transmit to them, and you do so at your own risk. In the event of a breach of the confidentiality or security of your nonpublic personal information, the Funds will attempt to notify you as necessary so you can take appropriate protective steps. If you have consented to the Funds using electronic communications or electronic delivery of statements, they may notify you under such circumstances using the most current email address you have on record with them.
In order for the Funds to provide effective service to you, keeping your account information accurate is very important. If you believe that your account information is incomplete, not accurate or not current, if you have questions about the Funds’ privacy practices, or our use of your nonpublic personal information, write the Funds using the contact information on your account statements, email the Funds by clicking on the Contact Us section of the Funds’ website at www.leggmason.com, or contact the Funds at 1-877-721-1926.
Revised April 2018
|
| NOT PART OF THE SEMI-ANNUAL REPORT |
www.leggmason.com
© 2018 Legg Mason Investor Services, LLC
FDXX010090 8/18 SR18-3402
Not applicable.
| ITEM 3. | AUDIT COMMITTEE FINANCIAL EXPERT. |
Not applicable.
| ITEM 4. | PRINCIPAL ACCOUNTANT FEES AND SERVICES. |
Not applicable.
| ITEM 5. | AUDIT COMMITTEE OF LISTED REGISTRANTS. |
Not applicable.
| ITEM 6. | SCHEDULE OF INVESTMENTS. |
Included herein under Item 1.
| ITEM 7. | DISCLOSURE OF PROXY VOTING POLICIES AND PROCEDURES FOR CLOSED-END MANAGEMENT INVESTMENT COMPANIES. |
Not applicable.
| ITEM 8. | PORTFOLIO MANAGERS OF CLOSED-END MANAGEMENT INVESTMENT COMPANIES. |
Not applicable.
| ITEM 9. | PURCHASES OF EQUITY SECURITIES BY CLOSED-END MANAGEMENT INVESTMENT COMPANY AND AFFILIATED PURCHASERS. |
Not applicable.
| ITEM 10. | SUBMISSION OF MATTERS TO A VOTE OF SECURITY HOLDERS. |
Not applicable.
| ITEM 11. | CONTROLS AND PROCEDURES. |
| | (a) | The registrant’s principal executive officer and principal financial officer have concluded that the registrant’s disclosure controls and procedures (as defined in Rule 30a- 3(c) under the Investment Company Act of 1940, as amended (the “1940 Act”)) are effective as of a date within 90 days of the filing date of this report that includes the disclosure required by this paragraph, based on their evaluation of the disclosure controls and procedures required by Rule 30a-3(b) under the 1940 Act and 15d-15(b) under the Securities Exchange Act of 1934. |
| | (b) | There were no changes in the registrant’s internal control over financial reporting (as defined in Rule 30a-3(d) under the 1940 Act) that occurred during the second fiscal quarter of the period covered by this report that have materially affected, or are likely to materially affect the registrant’s internal control over financial reporting. |
(a) (1) Not applicable.
Exhibit 99.CODE ETH
(a) (2) Certifications pursuant to section 302 of the Sarbanes-Oxley Act of 2002 attached hereto.
Exhibit 99.CERT
(b) Certifications pursuant to Section 906 of the Sarbanes-Oxley Act of 2002 attached hereto.
Exhibit 99.906CERT
SIGNATURES
Pursuant to the requirements of the Securities Exchange Act of 1934 and the Investment Company Act of 1940, the registrant has duly caused this Report to be signed on its behalf by the undersigned, there unto duly authorized.
Legg Mason Partners Variable Income Trust
| | |
| By: | | /s/ Jane Trust |
| | Jane Trust |
| | Chief Executive Officer |
| |
| Date: | | August 21, 2018 |
Pursuant to the requirements of the Securities Exchange Act of 1934 and the Investment Company Act of 1940, this report has been signed below by the following persons on behalf of the registrant and in the capacities and on the dates indicated.
| | |
| By: | | /s/ Jane Trust |
| | Jane Trust |
| | Chief Executive Officer |
| |
| Date: | | August 21, 2018 |
| | |
| By: | | /s/ Richard F. Sennett |
| | Richard F. Sennett |
| | Principal Financial Officer |
| |
| Date: | | August 21, 2018 |