UNITED STATES
SECURITIES AND EXCHANGE COMMISSION
Washington, D.C. 20549
FORM N-CSR
CERTIFIED SHAREHOLDER REPORT OF REGISTERED
MANAGEMENT INVESTMENT COMPANIES
Investment Company Act file number 811-06310
Legg Mason Partners Variable Income Trust
(Exact name of registrant as specified in charter)
620 Eighth Avenue, 47th Floor, New York, NY 10018
(Address of principal executive offices) (Zip code)
Marc A. De Oliveira
Franklin Templeton
100 First Stamford Place
Stamford, CT 06902
(Name and address of agent for service)
Registrant’s telephone number, including area code: 1-877-721-1926
Date of fiscal year end: December 31
Date of reporting period: June 30, 2021
| ITEM 1. | REPORT TO STOCKHOLDERS. |
The Semi-Annual Report to Stockholders is filed herewith.

| | |
| Semi-Annual Report | | June 30, 2021 |
WESTERN ASSET
VARIABLE GLOBAL
HIGH YIELD BOND
PORTFOLIO
Your insurance company may no longer send you paper copies of the Fund’s shareholder reports like this one by mail, unless you specifically request paper copies of the reports from the insurance company or your financial intermediary. Instead, the shareholder reports will be made available on a website, and you will be notified by mail each time a report is posted and provided with a website link to access the report. Instructions for requesting paper copies will be provided by your insurance company.
If you already elected to receive shareholder reports electronically, you will not be affected by this change and you need not take any action. If your insurance company offers electronic delivery, you may elect to receive shareholder reports and other communications from them electronically by following the instructions provided by the insurance company.
You may elect to receive all future reports in paper free of charge. You can inform the insurance company that you wish to continue receiving paper copies of shareholder reports by following the instructions provided by them. Your election will apply to all Funds available under your contract with the insurance company.

|
| INVESTMENT PRODUCTS: NOT FDIC INSURED • NO BANK GUARANTEE • MAY LOSE VALUE |
Portfolio objective
The Portfolio seeks to maximize total return.
Letter from the president

Dear Shareholder,
We are pleased to provide the semi-annual report of Western Asset Variable Global High Yield Bond Portfolio for the six-month reporting period ended June 30, 2021. Please read on for Portfolio performance information during the Portfolio’s reporting period.
As always, we remain committed to providing you with excellent service and a full spectrum of investment choices. We also remain committed to supplementing the support you receive from your financial advisor. One way we accomplish this is through our website, www.leggmason.com. Here you can gain immediate access to market and investment information, including:
| • | | Market insights and commentaries from our portfolio managers and |
| • | | A host of educational resources. |
We look forward to helping you meet your financial goals.
Sincerely,

Jane Trust, CFA
President and Chief Executive Officer
July 30, 2021
| | |
II | | Western Asset Variable Global High Yield Bond Portfolio |
Performance review
For the six months ended June 30, 2021, Class I shares of Western Asset Variable Global High Yield Bond Portfolio1 returned 2.56%. The Portfolio’s unmanaged benchmark, the Bloomberg Barclays Global High Yield Index (Hedged) i, returned 2.70% for the same period. The Lipper Variable High Yield Funds Category Averageii returned 3.49% over the same time frame.
| | | | |
Performance Snapshot as of June 30, 2021
(unaudited) | |
| | | 6 months | |
| Western Asset Variable Global High Yield Bond Portfolio: | | | | |
Class I | | | 2.56 | % |
Class II | | | 2.47 | % |
| Bloomberg Barclays Global High Yield Index (Hedged) | | | 2.70 | % |
| Lipper Variable High Yield Funds Category Average | | | 3.49 | % |
The performance shown represents past performance. Past performance is no guarantee of future results and current performance may be higher or lower than the performance shown above. Principal value, investment returns and yields will fluctuate and investors’ shares, when redeemed, may be worth more or less than their original cost.
All share class returns assume the reinvestment of all distributions, including returns of capital, if any, at net asset value and the deduction of all Portfolio expenses. Performance figures for periods shorter than one year represent cumulative figures and are not annualized.
The 30-Day SEC Yields for the period ended June 30, 2021 for Class I and Class II shares were 3.57% and 3.32%, respectively. The 30-Day SEC Yield, calculated pursuant to the standard SEC formula, is based on the Portfolio’s investments over an annualized trailing 30-day period, and not on the distributions paid by the Portfolio, which may differ.
|
| Total Annual Operating Expenses (unaudited) |
As of the Portfolio’s current prospectus dated May 1, 2021, the gross total annual fund operating expense ratios for Class I and Class II shares were 0.85% and 1.11%, respectively.
Actual expenses may be higher. For example, expenses may be higher than those shown if average net assets decrease. Net assets are more likely to decrease and Portfolio expense ratios are more likely to increase when markets are volatile.
| 1 | The Portfolio is an underlying investment option of various variable annuity and variable life insurance products. The Portfolio’s performance returns do not reflect the deduction of expenses imposed in connection with investing in variable annuity or variable life insurance contracts, such as administrative fees, account charges and surrender charges, which, if reflected, would reduce the performance of the Portfolio. Past performance is no guarantee of future results. |
| | | | | | |
| Western Asset Variable Global High Yield Bond Portfolio | | | | | III | |
Performance review (cont’d)
As always, thank you for your confidence in our stewardship of your assets.
Sincerely,
Jane Trust, CFA
President and Chief Executive Officer
July 30, 2021
RISKS: Investments in bonds are subject to interest rate and credit risks. As interest rates rise, bond prices fall, thereby reducing the value of the Portfolio’s share price. High-yield bonds, commonly known as “junk” bonds, involve greater credit and liquidity risks than investment grade bonds. Investing in foreign securities is subject to certain risks not associated with domestic investing, such as currency fluctuations and social, political and economic uncertainties, which could increase volatility. These risks are magnified in emerging or developing markets. Emerging market countries tend to have economic, political, and legal systems that are less developed and are less stable than those of more developed countries. The Portfolio may use derivatives, such as options and futures, which can be illiquid, may disproportionately increase losses, and have a potentially large impact on Portfolio performance. The use of leverage may increase volatility and possibility of loss. Please see the Portfolio’s prospectus for a more complete discussion of these and other risks and the Portfolio’s investment strategies.
All investments are subject to risk including the possible loss of principal. Past performance is no guarantee of future results. All index performance reflects no deduction for fees, expenses or taxes. Please note that an investor cannot invest directly in an index.
| i | The Bloomberg Barclays Global High Yield Index (Hedged) provides a broad-based measure of the global high-yield fixed income markets, representing the union of the U.S. High-Yield, Pan-European High-Yield, U.S. Emerging Markets High-Yield, CMBS High-Yield and Pan European Emerging Markets High-Yield Indices. |
| ii | Lipper, Inc., a wholly-owned subsidiary of Refinitiv, provides independent insight on global collective investments. Returns are based on the six-month period ended June 30, 2021, including the reinvestment of all distributions, including returns of capital, if any, calculated among the 100 funds in the Portfolio’s Lipper category. |
| | | | |
IV | | | | Western Asset Variable Global High Yield Bond Portfolio |
Portfolio at a glance† (unaudited)
Investment breakdown (%) as a percent of total investments
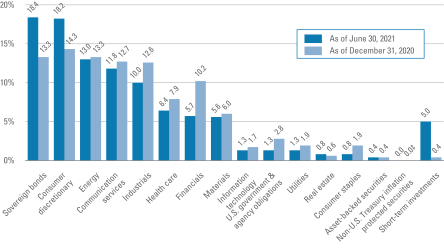
| † | The bar graph above represents the composition of the Portfolio’s investments as of June 30, 2021 and December 31, 2020 and does not include derivatives, such as futures contracts and forward foreign currency contracts. The Portfolio is actively managed. As a result, the composition of the Portfolio’s investments is subject to change at any time. |
| ‡ | Represents less than 0.1%. |
| | | | | | |
| Western Asset Variable Global High Yield Bond Portfolio 2021 Semi-Annual Report | | | | | 1 | |
Portfolio expenses (unaudited)
Example
As a shareholder of the Portfolio, you may incur two types of costs: (1) transaction costs and (2) ongoing costs, including management fees; service and/or distribution (12b-1) fees; and other Portfolio expenses. This example is intended to help you understand your ongoing costs (in dollars) of investing in the Portfolio and to compare these costs with the ongoing costs of investing in other funds.
This example is based on an investment of $1,000 invested on January 1, 2021 and held for the six months ended June 30, 2021.
Actual expenses
The table below titled “Based on Actual Total Return” provides information about actual account values and actual expenses. You may use the information provided in this table, together with the amount you invested, to estimate the expenses that you paid over the period. To estimate the expenses you paid on your account, divide your ending account value by $1,000 (for example, an $8,600 ending account value divided by $1,000 = 8.6), then multiply the result by the number under the heading entitled “Expenses Paid During the Period”.
Hypothetical example for comparison purposes
The table below titled “Based on Hypothetical Total Return” provides information about hypothetical account values and hypothetical expenses based on the actual expense ratio and an assumed rate of return of 5.00% per year before expenses, which is not the Portfolio’s actual return. The hypothetical account values and expenses may not be used to estimate the actual ending account balance or expenses you paid for the period. You may use the information provided in this table to compare the ongoing costs of investing in the Portfolio and other funds. To do so, compare the 5.00% hypothetical example relating to the Portfolio with the 5.00% hypothetical examples that appear in the shareholder reports of the other funds.
Please note that the expenses shown in the table below are meant to highlight your ongoing costs only and do not reflect any transactional costs. Therefore, the table is useful in comparing ongoing costs only, and will not help you determine the relative total costs of owning different funds. In addition, if these transaction costs were included, your costs would have been higher.
| | | | | | | | | | | | | | | | | | | | | | | | | | | | | | | | | | | | | | | | | | | | | | |
| | | | | |
| Based on actual total return1 | | | | | | | | | | | | Based on hypothetical total return1 | | | | |
| | | Actual
Total
Return2 | | | Beginning
Account
Value | | | Ending
Account
Value | | | Annualized
Expense
Ratio | | | Expenses
Paid
During
the
Period3 | | | | | | | | Hypothetical
Annualized
Total Return | | | Beginning
Account
Value | | | Ending
Account
Value | | | Annualized
Expense
Ratio | | | Expenses
Paid
During
the
Period3 | |
| Class I | | | 2.56 | % | | $ | 1,000.00 | | | $ | 1,025.60 | | | | 0.82 | % | | $ | 4.12 | | | | | | | Class I | | | 5.00 | % | | $ | 1,000.00 | | | $ | 1,020.73 | | | | 0.82 | % | | $ | 4.11 | |
| Class II | | | 2.47 | | | | 1,000.00 | | | | 1,024.70 | | | | 1.07 | | | | 5.37 | | | | | | | Class II | | | 5.00 | | | | 1,000.00 | | | | 1,019.49 | | | | 1.07 | | | | 5.36 | |
| | | | |
2 | | | | Western Asset Variable Global High Yield Bond Portfolio 2021 Semi-Annual Report |
| 1 | For the six months ended June 30, 2021. |
| 2 | Assumes the reinvestment of all distributions, including returns of capital, if any, at net asset value. Total return is not annualized, as it may not be representative of the total return for the year. Total returns do not reflect expenses associated with separate accounts such as administrative fees, account charges and surrender charges, which, if reflected, would reduce the total returns. Performance figures may reflect compensating balance arrangements, fee waivers and/or expense reimbursements. In the absence of compensating balance arrangements, fee waivers and/or expense reimbursements, the total return would have been lower. Past performance is no guarantee of future results. |
| 3 | Expenses (net of compensating balance arrangements, fee waivers and/or expense reimbursements) are equal to each class’ respective annualized expense ratio multiplied by the average account value over the period, multiplied by the number of days in the most recent fiscal half-year (181), then divided by 365. |
| | | | | | |
| Western Asset Variable Global High Yield Bond Portfolio 2021 Semi-Annual Report | | | | | 3 | |
Schedule of investments (unaudited)
June 30, 2021
Western Asset Variable Global High Yield Bond Portfolio
| | | | | | | | | | | | | | | | |
| Security | | Rate | | | Maturity
Date | | | Face
Amount† | | | Value | |
| Corporate Bonds & Notes — 70.2% | | | | | | | | | | | | | | | | |
| Communication Services — 10.3% | | | | | | | | | | | | | | | | |
Diversified Telecommunication Services — 2.7% | | | | | | | | | | | | | | | | |
Altice France Holding SA, Senior Secured Notes | | | 10.500 | % | | | 5/15/27 | | | | 510,000 | | | $ | 567,383 | (a) |
Altice France SA, Senior Secured Notes | | | 7.375 | % | | | 5/1/26 | | | | 337,000 | | | | 350,878 | (a) |
Cogent Communications Group Inc., Senior Secured Notes | | | 5.375 | % | | | 3/1/22 | | | | 638,000 | | | | 650,948 | (a) |
Frontier Communications Holdings LLC, Senior Secured Notes | | | 5.000 | % | | | 5/1/28 | | | | 330,000 | | | | 341,576 | (a) |
Level 3 Financing Inc., Senior Notes | | | 3.625 | % | | | 1/15/29 | | | | 1,160,000 | | | | 1,121,047 | (a) |
Lumen Technologies Inc., Senior Notes | | | 4.500 | % | | | 1/15/29 | | | | 470,000 | | | | 459,284 | (a) |
Turk Telekomunikasyon AS, Senior Notes | | | 6.875 | % | | | 2/28/25 | | | | 850,000 | | | | 940,593 | (a) |
Total Diversified Telecommunication Services | | | | | | | | | | | | | | | 4,431,709 | |
Entertainment — 0.1% | | | | | | | | | | | | | | | | |
Netflix Inc., Senior Notes | | | 5.875 | % | | | 11/15/28 | | | | 190,000 | | | | 233,456 | |
Interactive Media & Services — 0.3% | | | | | | | | | | | | | | | | |
Rackspace Technology Global Inc., Senior Secured Notes | | | 3.500 | % | | | 2/15/28 | | | | 500,000 | | | | 484,450 | (a) |
Media — 4.8% | | | | | | | | | | | | | | | | |
CCO Holdings LLC/CCO Holdings Capital Corp., Senior Notes | | | 4.500 | % | | | 8/15/30 | | | | 900,000 | | | | 938,218 | (a) |
CCO Holdings LLC/CCO Holdings Capital Corp., Senior Notes | | | 4.250 | % | | | 2/1/31 | | | | 170,000 | | | | 173,400 | (a) |
CCO Holdings LLC/CCO Holdings Capital Corp., Senior Notes | | | 4.500 | % | | | 5/1/32 | | | | 2,480,000 | | | | 2,578,493 | |
Clear Channel Outdoor Holdings Inc., Senior Notes | | | 7.500 | % | | | 6/1/29 | | | | 110,000 | | | | 114,025 | (a) |
DISH DBS Corp., Senior Notes | | | 5.875 | % | | | 11/15/24 | | | | 280,000 | | | | 301,000 | |
DISH DBS Corp., Senior Notes | | | 7.750 | % | | | 7/1/26 | | | | 590,000 | | | | 668,912 | |
DISH DBS Corp., Senior Notes | | | 5.125 | % | | | 6/1/29 | | | | 600,000 | | | | 593,208 | (a) |
Sirius XM Radio Inc., Senior Notes | | | 4.125 | % | | | 7/1/30 | | | | 700,000 | | | | 707,920 | (a) |
Summer BC Holdco B SARL, Senior Secured Notes | | | 5.750 | % | | | 10/31/26 | | | | 330,000 | EUR | | | 410,369 | (a) |
Univision Communications Inc., Senior Secured Notes | | | 9.500 | % | | | 5/1/25 | | | | 250,000 | | | | 276,479 | (a) |
Virgin Media Vendor Financing Notes IV DAC, Senior Notes | | | 5.000 | % | | | 7/15/28 | | | | 1,000,000 | | | | 1,023,605 | (a) |
Total Media | | | | | | | | | | | | | | | 7,785,629 | |
See Notes to Financial Statements.
| | | | |
4 | | | | Western Asset Variable Global High Yield Bond Portfolio 2021 Semi-Annual Report |
Western Asset Variable Global High Yield Bond Portfolio
| | | | | | | | | | | | | | | | |
| Security | | Rate | | | Maturity
Date | | | Face
Amount† | | | Value | |
Wireless Telecommunication Services — 2.4% | | | | | | | | | | | | | | | | |
Crystal Almond SARL, Senior Secured Notes | | | 4.250 | % | | | 10/15/24 | | | | 178,000 | EUR | | $ | 216,311 | (a) |
CSC Holdings LLC, Senior Notes | | | 6.500 | % | | | 2/1/29 | | | | 570,000 | | | | 632,050 | (a) |
CSC Holdings LLC, Senior Notes | | | 4.500 | % | | | 11/15/31 | | | | 540,000 | | | | 543,991 | (a) |
T-Mobile USA Inc., Senior Notes | | | 2.625 | % | | | 2/15/29 | | | | 1,650,000 | | | | 1,631,437 | |
T-Mobile USA Inc., Senior Notes | | | 2.875 | % | | | 2/15/31 | | | | 340,000 | | | | 337,875 | |
Vmed O2 UK Financing I PLC, Senior Secured Notes | | | 4.750 | % | | | 7/15/31 | | | | 510,000 | | | | 518,925 | (a)(b) |
Total Wireless Telecommunication Services | | | | | | | | | | | | | | | 3,880,589 | |
Total Communication Services | | | | | | | | | | | | | | | 16,815,833 | |
| Consumer Discretionary — 18.0% | | | | | | | | | | | | | | | | |
Auto Components — 1.1% | | | | | | | | | | | | | | | | |
Adient Global Holdings Ltd., Senior Notes | | | 4.875 | % | | | 8/15/26 | | | | 410,000 | | | | 422,497 | (a) |
JB Poindexter & Co. Inc., Senior Notes | | | 7.125 | % | | | 4/15/26 | | | | 1,290,000 | | | | 1,365,232 | (a) |
Total Auto Components | | | | | | | | | | | | | | | 1,787,729 | |
Automobiles — 2.8% | | | | | | | | | | | | | | | | |
Ford Motor Credit Co. LLC, Senior Notes | | | 3.815 | % | | | 11/2/27 | | | | 400,000 | | | | 417,151 | |
Ford Motor Credit Co. LLC, Senior Notes | | | 2.900 | % | | | 2/16/28 | | | | 1,800,000 | | | | 1,793,727 | |
Ford Motor Credit Co. LLC, Senior Notes | | | 4.000 | % | | | 11/13/30 | | | | 1,600,000 | | | | 1,678,000 | |
Ford Motor Credit Co. LLC, Senior Notes | | | 3.625 | % | | | 6/17/31 | | | | 740,000 | | | | 755,266 | |
Total Automobiles | | | | | | | | | | | | | | | 4,644,144 | |
Diversified Consumer Services — 1.5% | | | | | | | | | | | | | | | | |
Carriage Services Inc., Senior Notes | | | 4.250 | % | | | 5/15/29 | | | | 890,000 | | | | 889,831 | (a) |
Prime Security Services Borrower LLC/ Prime Finance Inc., Senior Secured Notes | | | 5.750 | % | | | 4/15/26 | | | | 420,000 | | | | 465,066 | (a) |
StoneMor Inc., Senior Secured Notes | | | 8.500 | % | | | 5/15/29 | | | | 340,000 | | | | 344,250 | (a) |
WW International Inc., Senior Secured Notes | | | 4.500 | % | | | 4/15/29 | | | | 690,000 | | | | 696,110 | (a) |
Total Diversified Consumer Services | | | | | | | | | | | | | | | 2,395,257 | |
Hotels, Restaurants & Leisure — 9.9% | | | | | | | | | | | | | | | | |
1011778 BC ULC/New Red Finance Inc., Senior Secured Notes | | | 3.500 | % | | | 2/15/29 | | | | 460,000 | | | | 454,825 | (a) |
Boyne USA Inc., Senior Notes | | | 4.750 | % | | | 5/15/29 | | | | 300,000 | | | | 310,385 | (a) |
Carnival Corp., Senior Notes | | | 7.625 | % | | | 3/1/26 | | | | 240,000 | | | | 261,000 | (a) |
Carnival Corp., Senior Notes | | | 5.750 | % | | | 3/1/27 | | | | 540,000 | | | | 566,325 | (a) |
Carrols Restaurant Group Inc., Senior Notes | | | 5.875 | % | | | 7/1/29 | | | | 260,000 | | | | 257,075 | (a) |
Marston’s Issuer PLC, Secured Notes (3 mo. GBP LIBOR + 2.550%) | | | 2.633 | % | | | 7/16/35 | | | | 853,000 | GBP | | | 928,921 | (c)(d) |
Melco Resorts Finance Ltd., Senior Notes | | | 5.375 | % | | | 12/4/29 | | | | 680,000 | | | | 719,525 | (a) |
See Notes to Financial Statements.
| | | | | | |
| Western Asset Variable Global High Yield Bond Portfolio 2021 Semi-Annual Report | | | | | 5 | |
Schedule of investments (unaudited) (cont’d)
June 30, 2021
Western Asset Variable Global High Yield Bond Portfolio
| | | | | | | | | | | | | | | | |
| Security | | Rate | | | Maturity
Date | | | Face
Amount† | | | Value | |
Hotels, Restaurants & Leisure — continued | | | | | | | | | | | | | | | | |
MGM China Holdings Ltd., Senior Notes | | | 4.750 | % | | | 2/1/27 | | | | 870,000 | | | $ | 888,470 | (a) |
NCL Corp. Ltd., Senior Secured Notes | | | 12.250 | % | | | 5/15/24 | | | | 750,000 | | | | 906,739 | (a) |
NCL Corp. Ltd., Senior Secured Notes | | | 10.250 | % | | | 2/1/26 | | | | 520,000 | | | | 605,787 | (a) |
Royal Caribbean Cruises Ltd., Senior Notes | | | 4.250 | % | | | 7/1/26 | | | | 520,000 | | | | 520,000 | (a) |
Royal Caribbean Cruises Ltd., Senior Notes | | | 5.500 | % | | | 4/1/28 | | | | 560,000 | | | | 587,188 | (a) |
Saga PLC, Senior Notes | | | 3.375 | % | | | 5/12/24 | | | | 2,560,000 | GBP | | | 3,506,048 | (c) |
Viking Cruises Ltd., Senior Notes | | | 7.000 | % | | | 2/15/29 | | | | 1,030,000 | | | | 1,074,640 | (a) |
Viking Cruises Ltd., Senior Secured Notes | | | 13.000 | % | | | 5/15/25 | | | | 200,000 | | | | 235,688 | (a) |
Viking Ocean Cruises Ship VII Ltd., Senior Secured Notes | | | 5.625 | % | | | 2/15/29 | | | | 320,000 | | | | 324,030 | (a) |
VOC Escrow Ltd., Senior Secured Notes | | | 5.000 | % | | | 2/15/28 | | | | 1,460,000 | | | | 1,478,980 | (a) |
Wyndham Hotels & Resorts Inc., Senior Notes | | | 4.375 | % | | | 8/15/28 | | | | 140,000 | | | | 145,775 | (a) |
Wynn Macau Ltd., Senior Notes | | | 5.625 | % | | | 8/26/28 | | | | 780,000 | | | | 815,591 | (a) |
Wynn Macau Ltd., Senior Notes | | | 5.125 | % | | | 12/15/29 | | | | 890,000 | | | | 919,005 | (a) |
Wynn Resorts Finance LLC/Wynn Resorts Capital Corp., Senior Notes | | | 7.750 | % | | | 4/15/25 | | | | 600,000 | | | | 647,958 | (a) |
Total Hotels, Restaurants & Leisure | | | | | | | | | | | | | | | 16,153,955 | |
Household Durables — 0.3% | | | | | | | | | | | | | | | | |
TopBuild Corp., Senior Notes | | | 3.625 | % | | | 3/15/29 | | | | 440,000 | | | | 436,212 | (a) |
Internet & Direct Marketing Retail — 1.2% | | | | | | | | | | | | | | | | |
MercadoLibre Inc., Senior Notes | | | 3.125 | % | | | 1/14/31 | | | | 2,060,000 | | | | 2,024,980 | |
Specialty Retail — 1.2% | | | | | | | | | | | | | | | | |
Magic Mergeco Inc., Senior Notes | | | 7.875 | % | | | 5/1/29 | | | | 540,000 | | | | 557,550 | (a) |
Magic Mergeco Inc., Senior Secured Notes | | | 5.250 | % | | | 5/1/28 | | | | 220,000 | | | | 225,979 | (a) |
Party City Holdings Inc., Senior Secured Notes | | | 8.750 | % | | | 2/15/26 | | | | 310,000 | | | | 331,312 | (a) |
PetSmart Inc./PetSmart Finance Corp., Senior Secured Notes | | | 4.750 | % | | | 2/15/28 | | | | 250,000 | | | | 260,000 | (a) |
Tendam Brands SAU, Senior Secured Notes | | | 5.000 | % | | | 9/15/24 | | | | 130,000 | EUR | | | 152,473 | (a) |
Tendam Brands SAU, Senior Secured Notes (3 mo. EURIBOR + 5.250%, 5.250% floor) | | | 5.250 | % | | | 9/15/24 | | | | 360,000 | EUR | | | 424,196 | (a)(d) |
Total Specialty Retail | | | | | | | | | | | | | | | 1,951,510 | |
Total Consumer Discretionary | | | | | | | | | | | | | | | 29,393,787 | |
| Consumer Staples — 0.8% | | | | | | | | | | | | | | | | |
Beverages — 0.1% | | | | | | | | | | | | | | | | |
Primo Water Holdings Inc., Senior Notes | | | 3.875 | % | | | 10/31/28 | | | | 190,000 | EUR | | | 230,196 | (a) |
See Notes to Financial Statements.
| | | | |
6 | | | | Western Asset Variable Global High Yield Bond Portfolio 2021 Semi-Annual Report |
Western Asset Variable Global High Yield Bond Portfolio
| | | | | | | | | | | | | | | | |
| Security | | Rate | | | Maturity
Date | | | Face
Amount† | | | Value | |
Food Products — 0.7% | | | | | | | | | | | | | | | | |
Kraft Heinz Foods Co., Senior Notes | | | 7.125 | % | | | 8/1/39 | | | | 560,000 | | | $ | 820,051 | (a) |
Kraft Heinz Foods Co., Senior Notes | | | 5.200 | % | | | 7/15/45 | | | | 190,000 | | | | 236,316 | |
Total Food Products | | | | | | | | | | | | | | | 1,056,367 | |
Total Consumer Staples | | | | | | | | | | | | | | | 1,286,563 | |
| Energy — 13.0% | | | | | | | | | | | | | | | | |
Oil, Gas & Consumable Fuels — 13.0% | | | | | | | | | | | | | | | | |
Apache Corp., Senior Notes | | | 5.100 | % | | | 9/1/40 | | | | 250,000 | | | | 262,188 | |
Blue Racer Midstream LLC/Blue Racer Finance Corp., Senior Notes | | | 7.625 | % | | | 12/15/25 | | | | 110,000 | | | | 119,350 | (a) |
Blue Racer Midstream LLC/Blue Racer Finance Corp., Senior Notes | | | 6.625 | % | | | 7/15/26 | | | | 655,000 | | | | 686,905 | (a) |
Cheniere Energy Inc., Senior Secured Notes | | | 4.625 | % | | | 10/15/28 | | | | 220,000 | | | | 232,375 | (a) |
Cheniere Energy Partners LP, Senior Notes | | | 4.000 | % | | | 3/1/31 | | | | 380,000 | | | | 397,575 | (a) |
Energy Transfer LP, Junior Subordinated Notes (6.500% to 11/15/26 then 5 year Treasury Constant Maturity Rate + 5.694%) | | | 6.500 | % | | | 11/15/26 | | | | 130,000 | | | | 132,860 | (d)(e) |
EnLink Midstream LLC, Senior Notes | | | 5.625 | % | | | 1/15/28 | | | | 220,000 | | | | 233,078 | (a) |
EQM Midstream Partners LP, Senior Notes | | | 6.500 | % | | | 7/1/27 | | | | 150,000 | | | | 167,688 | (a) |
EQT Corp., Senior Notes | | | 3.125 | % | | | 5/15/26 | | | | 160,000 | | | | 164,177 | (a) |
EQT Corp., Senior Notes | | | 3.900 | % | | | 10/1/27 | | | | 1,820,000 | | | | 1,951,950 | |
EQT Corp., Senior Notes | | | 5.000 | % | | | 1/15/29 | | | | 460,000 | | | | 513,521 | |
EQT Corp., Senior Notes | | | 3.625 | % | | | 5/15/31 | | | | 150,000 | | | | 156,759 | (a) |
MEG Energy Corp., Senior Notes | | | 7.125 | % | | | 2/1/27 | | | | 220,000 | | | | 234,967 | (a) |
MEG Energy Corp., Senior Notes | | | 5.875 | % | | | 2/1/29 | | | | 270,000 | | | | 281,858 | (a) |
Oasis Petroleum Inc., Senior Notes | | | 6.375 | % | | | 6/1/26 | | | | 610,000 | | | | 636,828 | (a) |
Occidental Petroleum Corp., Senior Notes | | | 6.625 | % | | | 9/1/30 | | | | 270,000 | | | | 324,338 | |
Occidental Petroleum Corp., Senior Notes | | | 6.125 | % | | | 1/1/31 | | | | 500,000 | | | | 588,890 | |
Petrobras Global Finance BV, Senior Notes | | | 5.750 | % | | | 2/1/29 | | | | 2,550,000 | | | | 2,913,757 | |
Petrobras Global Finance BV, Senior Notes | | | 6.900 | % | | | 3/19/49 | | | | 340,000 | | | | 405,790 | |
Petroleos del Peru SA, Senior Notes | | | 4.750 | % | | | 6/19/32 | | | | 1,500,000 | | | | 1,576,875 | (a) |
Petroleos Mexicanos, Senior Notes | | | 6.625 | % | | | 6/15/35 | | | | 2,050,000 | | | | 1,982,350 | |
Petroleos Mexicanos, Senior Notes | | | 6.625 | % | | | 6/15/38 | | | | 1,350,000 | | | | 1,250,775 | |
Qatar Petroleum, Senior Notes | | | 2.250 | % | | | 7/12/31 | | | | 700,000 | | | | 692,559 | (a)(b) |
Range Resources Corp., Senior Notes | | | 5.000 | % | | | 3/15/23 | | | | 441,000 | | | | 457,575 | |
Range Resources Corp., Senior Notes | | | 4.875 | % | | | 5/15/25 | | | | 560,000 | | | | 580,300 | |
Targa Resources Partners LP/Targa Resources Partners Finance Corp., Senior Notes | | | 5.875 | % | | | 4/15/26 | | | | 250,000 | | | | 263,266 | |
See Notes to Financial Statements.
| | | | | | |
| Western Asset Variable Global High Yield Bond Portfolio 2021 Semi-Annual Report | | | | | 7 | |
Schedule of investments (unaudited) (cont’d)
June 30, 2021
Western Asset Variable Global High Yield Bond Portfolio
| | | | | | | | | | | | | | | | |
| Security | | Rate | | | Maturity
Date | | | Face
Amount† | | | Value | |
Oil, Gas & Consumable Fuels — continued | | | | | | | | | | | | | | | | |
Targa Resources Partners LP/Targa Resources Partners Finance Corp., Senior Notes | | | 6.500 | % | | | 7/15/27 | | | | 70,000 | | | $ | 76,080 | |
Transportadora de Gas del Sur SA, Senior Notes | | | 6.750 | % | | | 5/2/25 | | | | 1,310,000 | | | | 1,229,776 | (a) |
Ultrapar International SA, Senior Notes | | | 5.250 | % | | | 10/6/26 | | | | 480,000 | | | | 529,478 | (a) |
Western Midstream Operating LP, Senior Notes | | | 4.650 | % | | | 7/1/26 | | | | 620,000 | | | | 663,688 | |
Western Midstream Operating LP, Senior Notes | | | 4.750 | % | | | 8/15/28 | | | | 400,000 | | | | 433,418 | |
Western Midstream Operating LP, Senior Notes | | | 5.300 | % | | | 2/1/30 | | | | 30,000 | | | | 33,686 | |
Western Midstream Operating LP, Senior Notes | | | 5.500 | % | | | 8/15/48 | | | | 90,000 | | | | 98,336 | |
YPF SA, Senior Notes | | | 8.500 | % | | | 7/28/25 | | | | 200,000 | | | | 158,550 | (a) |
YPF SA, Senior Notes | | | 6.950 | % | | | 7/21/27 | | | | 690,000 | | | | 488,589 | (a) |
YPF SA, Senior Secured Notes, Step bond (4.000% to 1/1/23 then 9.000%) | | | 4.000 | % | | | 2/12/26 | | | | 419,400 | | | | 352,967 | (a) |
Total Energy | | | | | | | | | | | | | | | 21,273,122 | |
| Financials — 5.7% | | | | | | | | | | | | | | | | |
Banks — 2.5% | | | | | | | | | | | | | | | | |
BBVA Bancomer SA, Subordinated Notes (5.125% to 1/17/28 then 5 year Treasury Constant Maturity Rate + 2.650%) | | | 5.125 | % | | | 1/18/33 | | | | 2,340,000 | | | | 2,444,598 | (a)(d) |
Intesa Sanpaolo SpA, Subordinated Notes | | | 4.198 | % | | | 6/1/32 | | | | 370,000 | | | | 379,928 | (a) |
NatWest Markets NV, Subordinated Notes | | | 7.750 | % | | | 5/15/23 | | | | 160,000 | | | | 179,420 | |
TC Ziraat Bankasi AS, Senior Notes | | | 5.125 | % | | | 5/3/22 | | | | 550,000 | | | | 561,660 | (a) |
TC Ziraat Bankasi AS, Senior Notes | | | 5.125 | % | | | 9/29/23 | | | | 560,000 | | | | 574,723 | (a) |
Total Banks | | | | | | | | | | | | | | | 4,140,329 | |
Capital Markets — 0.7% | | | | | | | | | | | | | | | | |
Credit Suisse Group AG, Junior Subordinated Notes (7.250% to 9/12/25 then USD 5 year ICE Swap Rate + 4.332%) | | | 7.250 | % | | | 9/12/25 | | | | 500,000 | | | | 565,597 | (a)(d)(e) |
Credit Suisse Group AG, Junior Subordinated Notes (7.500% to 7/17/23 then USD 5 year ICE Swap Rate + 4.600%) | | | 7.500 | % | | | 7/17/23 | | | | 450,000 | | | | 490,500 | (a)(d)(e) |
Total Capital Markets | | | | | | | | | | | | | | | 1,056,097 | |
Consumer Finance — 0.1% | | | | | | | | | | | | | | | | |
Navient Corp., Senior Notes | | | 6.750 | % | | | 6/15/26 | | | | 210,000 | | | | 234,833 | |
See Notes to Financial Statements.
| | | | |
8 | | | | Western Asset Variable Global High Yield Bond Portfolio 2021 Semi-Annual Report |
Western Asset Variable Global High Yield Bond Portfolio
| | | | | | | | | | | | | | | | |
| Security | | Rate | | | Maturity
Date | | | Face
Amount† | | | Value | |
Diversified Financial Services — 2.1% | | | | | | | | | | | | | | | | |
Allied Universal Holdco LLC/Allied Universal Finance Corp., Senior Notes | | | 6.000 | % | | | 6/1/29 | | | | 390,000 | | | $ | 395,893 | (a) |
Allied Universal Holdco LLC/Allied Universal Finance Corp./Atlas Luxco 4 Sarl, Senior Secured Notes | | | 4.625 | % | | | 6/1/28 | | | | 1,170,000 | | | | 1,175,686 | (a) |
Global Aircraft Leasing Co. Ltd., Senior Notes (6.500% Cash or 7.250% PIK) | | | 6.500 | % | | | 9/15/24 | | | | 1,562,198 | | | | 1,572,001 | (a)(f) |
Huarong Finance 2019 Co. Ltd., Senior Notes | | | 2.500 | % | | | 2/24/23 | | | | 250,000 | | | | 193,199 | (c) |
Total Diversified Financial Services | | | | | | | | | | | | | | | 3,336,779 | |
Mortgage Real Estate Investment Trusts (REITs) — 0.3% | | | | | | | | | | | | | |
Ladder Capital Finance Holdings LLLP/ Ladder Capital Finance Corp., Senior Notes | | | 4.250 | % | | | 2/1/27 | | | | 465,000 | | | | 465,872 | (a) |
Total Financials | | | | | | | | | | | | | | | 9,233,910 | |
| Health Care — 6.2% | | | | | | | | | | | | | | | | |
Health Care Providers & Services — 0.6% | | | | | | | | | | | | | | | | |
Centene Corp., Senior Notes | | | 5.375 | % | | | 6/1/26 | | | | 550,000 | | | | 575,438 | (a) |
HCA Inc., Senior Notes | | | 5.375 | % | | | 9/1/26 | | | | 270,000 | | | | 311,040 | |
Total Health Care Providers & Services | | | | | | | | | | | | | | | 886,478 | |
Pharmaceuticals — 5.6% | | | | | | | | | | | | | |
Bausch Health Cos. Inc., Senior Secured Notes | | | 4.875 | % | | | 6/1/28 | | | | 770,000 | | | | 789,057 | (a) |
Cheplapharm Arzneimittel GmbH, Senior Secured Notes | | | 5.500 | % | | | 1/15/28 | | | | 560,000 | | | | 574,700 | (a) |
Cidron Aida Finco Sarl, Senior Secured Notes | | | 6.250 | % | | | 4/1/28 | | | | 360,000 | GBP | | | 509,193 | (a) |
Endo Luxembourg Finance Co. I Sarl/Endo US Inc., Senior Secured Notes | | | 6.125 | % | | | 4/1/29 | | | | 250,000 | | | | 245,313 | (a) |
Teva Pharmaceutical Finance Netherlands III BV, Senior Notes | | | 2.200 | % | | | 7/21/21 | | | | 1,530,000 | | | | 1,529,770 | |
Teva Pharmaceutical Finance Netherlands III BV, Senior Notes | | | 3.150 | % | | | 10/1/26 | | | | 5,820,000 | | | | 5,543,550 | |
Total Pharmaceuticals | | | | | | | | | | | | | | | 9,191,583 | |
Total Health Care | | | | | | | | | | | | | | | 10,078,061 | |
| Industrials — 7.4% | | | | | | | | | | | | | | | | |
Aerospace & Defense — 0.5% | | | | | | | | | | | | | | | | |
BWX Technologies Inc., Senior Notes | | | 4.125 | % | | | 6/30/28 | | | | 840,000 | | | | 858,030 | (a) |
Airlines — 3.4% | | | | | | | | | | | | | | | | |
Delta Air Lines Inc., Senior Notes | | | 7.375 | % | | | 1/15/26 | | | | 590,000 | | | | 692,734 | |
Delta Air Lines Inc., Senior Secured Notes | | | 7.000 | % | | | 5/1/25 | | | | 1,300,000 | | | | 1,517,975 | (a) |
See Notes to Financial Statements.
| | | | | | |
| Western Asset Variable Global High Yield Bond Portfolio 2021 Semi-Annual Report | | | | | 9 | |
Schedule of investments (unaudited) (cont’d)
June 30, 2021
Western Asset Variable Global High Yield Bond Portfolio
| | | | | | | | | | | | | | | | |
| Security | | Rate | | | Maturity
Date | | | Face
Amount† | | | Value | |
Airlines — continued | | | | | | | | | | | | | | | | |
Hawaiian Brand Intellectual Property Ltd./ HawaiianMiles Loyalty Ltd., Senior Secured Notes | | | 5.750 | % | | | 1/20/26 | | | | 380,000 | | | $ | 408,447 | (a) |
Spirit Loyalty Cayman Ltd./Spirit IP Cayman Ltd., Senior Secured Notes | | | 8.000 | % | | | 9/20/25 | | | | 1,038,000 | | | | 1,176,054 | (a) |
United Airlines Inc., Senior Secured Notes | | | 4.625 | % | | | 4/15/29 | | | | 1,650,000 | | | | 1,709,813 | (a) |
Total Airlines | | | | | | | | | | | | | | | 5,505,023 | |
Commercial Services & Supplies — 0.6% | | | | | | | | | | | | | | | | |
CoreCivic Inc., Senior Notes | | | 8.250 | % | | | 4/15/26 | | | | 420,000 | | | | 436,359 | |
CoreCivic Inc., Senior Notes | | | 4.750 | % | | | 10/15/27 | | | | 160,000 | | | | 146,197 | |
GFL Environmental Inc., Senior Secured Notes | | | 5.125 | % | | | 12/15/26 | | | | 350,000 | | | �� | 371,343 | (a) |
Total Commercial Services & Supplies | | | | | | | | | | | | | | | 953,899 | |
Electrical Equipment — 0.5% | | | | | | | | | | | | | | | | |
Sensata Technologies Inc., Senior Notes | | | 4.375 | % | | | 2/15/30 | | | | 810,000 | | | | 854,742 | (a) |
Machinery — 1.2% | | | | | | | | | | | | | | | | |
ATS Automation Tooling Systems Inc., Senior Notes | | | 4.125 | % | | | 12/15/28 | | | | 710,000 | | | | 729,309 | (a) |
Cellnex Finance Co. SA, Senior Notes | | | 2.000 | % | | | 2/15/33 | | | | 200,000 | EUR | | | 235,213 | (c) |
Renk AG, Senior Secured Notes | | | 5.750 | % | | | 7/15/25 | | | | 100,000 | EUR | | | 123,322 | (a) |
Titan International Inc., Senior Secured Notes | | | 7.000 | % | | | 4/30/28 | | | | 260,000 | | | | 272,368 | (a) |
TK Elevator Midco GmbH, Senior Secured Notes | | | 4.375 | % | | | 7/15/27 | | | | 420,000 | EUR | | | 521,250 | (a) |
Total Machinery | | | | | | | | | | | | | | | 1,881,462 | |
Trading Companies & Distributors — 1.2% | | | | | | | | | | | | | | | | |
Boise Cascade Co., Senior Notes | | | 4.875 | % | | | 7/1/30 | | | | 780,000 | | | | 830,349 | (a) |
H&E Equipment Services Inc., Senior Notes | | | 3.875 | % | | | 12/15/28 | | | | 1,130,000 | | | | 1,113,332 | (a) |
Total Trading Companies & Distributors | | | | | | | | | | | | | | | 1,943,681 | |
Total Industrials | | | | | | | | | | | | | | | 11,996,837 | |
| Information Technology — 1.4% | | | | | | | | | | | | | | | | |
IT Services — 0.4% | | | | | | | | | | | | | | | | |
Acuris Finance US Inc./Acuris Finance SARL, Senior Secured Notes | | | 5.000 | % | | | 5/1/28 | | | | 320,000 | | | | 319,989 | (a) |
CDW LLC/CDW Finance Corp., Senior Notes | | | 3.250 | % | | | 2/15/29 | | | | 60,000 | | | | 60,867 | |
IPD 3 BV, Senior Secured Notes | | | 5.500 | % | | | 12/1/25 | | | | 100,000 | EUR | | | 123,698 | (a) |
IPD 3 BV, Senior Secured Notes | | | 5.500 | % | | | 12/1/25 | | | | 100,000 | EUR | | | 123,697 | (c) |
Total IT Services | | | | | | | | | | | | | | | 628,251 | |
See Notes to Financial Statements.
| | | | |
10 | | | | Western Asset Variable Global High Yield Bond Portfolio 2021 Semi-Annual Report |
Western Asset Variable Global High Yield Bond Portfolio
| | | | | | | | | | | | | | | | |
| Security | | Rate | | | Maturity
Date | | | Face
Amount† | | | Value | |
Software — 1.0% | | | | | | | | | | | | | | | | |
Fair Isaac Corp., Senior Notes | | | 4.000 | % | | | 6/15/28 | | | | 510,000 | | | $ | 527,924 | (a) |
Helios Software Holdings Inc./ION Corporate Solutions Finance Sarl, Senior Secured Notes | | | 4.625 | % | | | 5/1/28 | | | | 820,000 | | | | 805,142 | (a) |
Open Text Corp., Senior Notes | | | 3.875 | % | | | 2/15/28 | | | | 170,000 | | | | 172,686 | (a) |
Open Text Holdings Inc., Senior Notes | | | 4.125 | % | | | 2/15/30 | | | | 90,000 | | | | 91,894 | (a) |
Total Software | | | | | | | | | | | | | | | 1,597,646 | |
Total Information Technology | | | | | | | | | | | | | | | 2,225,897 | |
| Materials — 5.3% | | | | | | | | | | | | | | | | |
Chemicals — 1.6% | | | | | | | | | | | | | | | | |
Braskem Netherlands Finance BV, Senior Notes | | | 4.500 | % | | | 1/10/28 | | | | 500,000 | | | | 527,475 | (a) |
INEOS Quattro Finance 1 PLC, Senior Notes | | | 3.750 | % | | | 7/15/26 | | | | 130,000 | EUR | | | 158,878 | (a) |
INEOS Quattro Finance 2 PLC, Senior Secured Notes | | | 3.375 | % | | | 1/15/26 | | | | 1,140,000 | | | | 1,156,507 | (a) |
Sasol Financing USA LLC, Senior Notes | | | 5.500 | % | | | 3/18/31 | | | | 760,000 | | | | 802,180 | |
Total Chemicals | | | | | | | | | | | | | | | 2,645,040 | |
Construction Materials — 0.7% | | | | | | | | | | | | | | | | |
Cemex SAB de CV, Senior Secured Notes | | | 7.375 | % | | | 6/5/27 | | | | 730,000 | | | | 824,973 | (a) |
SRM Escrow Issuer LLC, Senior Secured Notes | | | 6.000 | % | | | 11/1/28 | | | | 370,000 | | | | 392,672 | (a) |
Total Construction Materials | | | | | | | | | | | | | | | 1,217,645 | |
Containers & Packaging — 2.6% | | | | | | | | | | | | | | | | |
ARD Finance SA, Senior Secured Notes (6.500% Cash or 7.250% PIK) | | | 6.500 | % | | | 6/30/27 | | | | 600,000 | | | | 631,248 | (a)(f) |
Ardagh Packaging Finance PLC/Ardagh Holdings USA Inc., Senior Notes | | | 6.000 | % | | | 2/15/25 | | | | 1,380,000 | | | | 1,427,231 | (a) |
Ball Corp., Senior Notes | | | 2.875 | % | | | 8/15/30 | | | | 1,400,000 | | | | 1,376,018 | |
Cascades Inc./Cascades USA Inc., Senior Notes | | | 5.375 | % | | | 1/15/28 | | | | 110,000 | | | | 115,775 | (a) |
Pactiv LLC, Senior Notes | | | 7.950 | % | | | 12/15/25 | | | | 570,000 | | | | 642,675 | |
Total Containers & Packaging | | | | | | | | | | | | | | | 4,192,947 | |
Metals & Mining — 0.4% | | | | | | | | | | | | | | | | |
First Quantum Minerals Ltd., Senior Notes | | | 6.875 | % | | | 10/15/27 | | | | 600,000 | | | | 654,570 | (a) |
Total Materials | | | | | | | | | | | | | | | 8,710,202 | |
| Real Estate — 0.8% | | | | | | | | | | | | | | | | |
Equity Real Estate Investment Trusts (REITs) — 0.3% | | | | | | | | | | | | | | | | |
Diversified Healthcare Trust, Senior Notes | | | 4.375 | % | | | 3/1/31 | | | | 590,000 | | | | 566,105 | |
See Notes to Financial Statements.
| | | | | | |
| Western Asset Variable Global High Yield Bond Portfolio 2021 Semi-Annual Report | | | | | 11 | |
Schedule of investments (unaudited) (cont’d)
June 30, 2021
Western Asset Variable Global High Yield Bond Portfolio
| | | | | | | | | | | | | | | | |
| Security | | Rate | | | Maturity
Date | | | Face
Amount† | | | Value | |
Real Estate Management & Development — 0.5% | | | | | | | | | | | | | | | | |
Yuzhou Group Holdings Co. Ltd., Senior Secured Notes | | | 6.000 | % | | | 10/25/23 | | | | 900,000 | | | $ | 792,079 | (c) |
Total Real Estate | | | | | | | | | | | | | | | 1,358,184 | |
| Utilities — 1.3% | | | | | | | | | | | | | | | | |
Electric Utilities — 0.1% | | | | | | | | | | | | | | | | |
Pampa Energia SA, Senior Notes | | | 7.500 | % | | | 1/24/27 | | | | 230,000 | | | | 206,453 | (a) |
Gas Utilities — 0.5% | | | | | | | | | | | | | | | | |
Suburban Propane Partners LP/Suburban Energy Finance Corp., Senior Notes | | | 5.000 | % | | | 6/1/31 | | | | 730,000 | | | | 748,250 | (a) |
Independent Power and Renewable Electricity Producers — 0.7% | | | | | | | | | |
Cikarang Listrindo Tbk PT, Senior Notes | | | 4.950 | % | | | 9/14/26 | | | | 350,000 | | | | 359,464 | (a) |
Minejesa Capital BV, Senior Secured Notes | | | 4.625 | % | | | 8/10/30 | | | | 770,000 | | | | 817,316 | (a) |
Total Independent Power and Renewable Electricity Producers | | | | | | | | 1,176,780 | |
Total Utilities | | | | | | | | | | | | | | | 2,131,483 | |
Total Corporate Bonds & Notes (Cost — $108,547,756) | | | | | | | | 114,503,879 | |
| Sovereign Bonds — 18.7% | | | | | | | | | | | | | | | | |
Angola — 0.2% | | | | | | | | | | | | | | | | |
Angolan Government International Bond, Senior Notes | | | 8.250 | % | | | 5/9/28 | | | | 400,000 | | | | 418,564 | (a) |
Argentina — 1.3% | | | | | | | | | | | | | | | | |
Argentine Republic Government International Bond, Senior Notes | | | 1.000 | % | | | 7/9/29 | | | | 193,002 | | | | 73,568 | |
Argentine Republic Government International Bond, Senior Notes, Step bond (0.125% to 7/9/21 then 0.500%) | | | 0.125 | % | | | 7/9/30 | | | | 523,917 | | | | 188,982 | |
Argentine Republic Government International Bond, Senior Notes, Step bond (0.125% to 7/9/21 then 1.125%) | | | 0.125 | % | | | 7/9/35 | | | | 2,309,180 | | | | 736,652 | |
Provincia de Buenos Aires, Senior Notes | | | 9.950 | % | | | 6/9/21 | | | | 910,000 | | | | 434,534 | *(a)(g) |
Provincia de Buenos Aires, Senior Notes | | | 9.125 | % | | | 3/16/24 | | | | 890,000 | | | | 402,734 | *(a)(h) |
Provincia de Cordoba, Senior Notes, Step bond (5.000% to 6/1/22 then 6.990%) | | | 5.000 | % | | | 6/1/27 | | | | 390,000 | | | | 267,154 | (a) |
Total Argentina | | | | | | | | | | | | | | | 2,103,624 | |
Bahamas — 0.2% | | | | | | | | | | | | | | | | |
Bahamas Government International Bond, Senior Notes | | | 6.950 | % | | | 11/20/29 | | | | 300,000 | | | | 316,878 | (a) |
Bahrain — 0.3% | | | | | | | | | | | | | | | | |
Bahrain Government International Bond, Senior Notes | | | 6.000 | % | | | 9/19/44 | | | | 510,000 | | | | 485,928 | (a) |
See Notes to Financial Statements.
| | | | |
12 | | | | Western Asset Variable Global High Yield Bond Portfolio 2021 Semi-Annual Report |
Western Asset Variable Global High Yield Bond Portfolio
| | | | | | | | | | | | | | | | |
| Security | | Rate | | | Maturity
Date | | | Face
Amount† | | | Value | |
Brazil — 0.9% | | | | | | | | | | | | | | | | |
Brazil Notas do Tesouro Nacional Serie F, Notes | | | 10.000 | % | | | 1/1/25 | | | | 867,000 | BRL | | $ | 184,037 | |
Brazil Notas do Tesouro Nacional Serie F, Notes | | | 10.000 | % | | | 1/1/27 | | | | 246,000 | BRL | | | 52,458 | |
Brazilian Government International Bond, Senior Notes | | | 3.875 | % | | | 6/12/30 | | | | 1,150,000 | | | | 1,161,672 | |
Total Brazil | | | | | | | | | | | | | | | 1,398,167 | |
Costa Rica — 0.2% | | | | | | | | | | | | | | | | |
Costa Rica Government International Bond, Senior Notes | | | 7.000 | % | | | 4/4/44 | | | | 350,000 | | | | 363,128 | (a) |
Dominican Republic — 0.9% | | | | | | | | | | | | | | | | |
Dominican Republic International Bond, Senior Notes | | | 4.500 | % | | | 1/30/30 | | | | 800,000 | | | | 820,008 | (a) |
Dominican Republic International Bond, Senior Notes | | | 6.850 | % | | | 1/27/45 | | | | 600,000 | | | | 680,250 | (a) |
Total Dominican Republic | | | | | | | | | | | | | | | 1,500,258 | |
Ecuador — 0.3% | | | | | | | | | | | | | | | | |
Ecuador Government International Bond, Senior Notes, Step bond (0.500% to 7/31/21 then 1.000%) | | | 0.500 | % | | | 7/31/35 | | | | 800,000 | | | | 552,000 | (a) |
Egypt — 0.8% | | | | | | | | | | | | | | | | |
Egypt Government International Bond, Senior Notes | | | 3.875 | % | | | 2/16/26 | | | | 240,000 | | | | 236,470 | (a) |
Egypt Government International Bond, Senior Notes | | | 6.588 | % | | | 2/21/28 | | | | 300,000 | | | | 318,000 | (c) |
Egypt Government International Bond, Senior Notes | | | 7.600 | % | | | 3/1/29 | | | | 670,000 | | | | 737,904 | (a) |
Total Egypt | | | | | | | | | | | | | | | 1,292,374 | |
El Salvador — 0.2% | | | | | | | | | | | | | | | | |
El Salvador Government International Bond, Senior Notes | | | 6.375 | % | | | 1/18/27 | | | | 300,000 | | | | 272,250 | (a) |
Ghana — 0.7% | | | | | | | | | | | | | | | | |
Ghana Government International Bond | | | 10.750 | % | | | 10/14/30 | | | | 290,000 | | | | 367,212 | (a) |
Ghana Government International Bond, Senior Notes | | | 8.125 | % | | | 3/26/32 | | | | 730,000 | | | | 742,087 | (a) |
Total Ghana | | | | | | | | | | | | | | | 1,109,299 | |
Indonesia — 1.3% | | | | | | | | | | | | | | | | |
Indonesia Government International Bond, Senior Notes | | | 1.850 | % | | | 3/12/31 | | | | 630,000 | | | | 617,623 | |
See Notes to Financial Statements.
| | | | | | |
| Western Asset Variable Global High Yield Bond Portfolio 2021 Semi-Annual Report | | | | | 13 | |
Schedule of investments (unaudited) (cont’d)
June 30, 2021
Western Asset Variable Global High Yield Bond Portfolio
| | | | | | | | | | | | | | | | |
| Security | | Rate | | | Maturity
Date | | | Face Amount† | | | Value | |
Indonesia — continued | | | | | | | | | | | | | | | | |
Indonesia Treasury Bond | | | 8.250 | % | | | 7/15/21 | | | | 2,465,000,000 | IDR | | $ | 170,273 | |
Indonesia Treasury Bond | | | 7.000 | % | | | 5/15/22 | | | | 18,765,000,000 | IDR | | | 1,334,735 | |
Total Indonesia | | | | | | | | | | | | | | | 2,122,631 | |
Ivory Coast — 0.2% | | | | | | | | | | | | | | | | |
Ivory Coast Government International Bond, Senior Notes | | | 6.125 | % | | | 6/15/33 | | | | 200,000 | | | | 211,594 | (a) |
Ivory Coast Government International Bond, Senior Notes, Step bond | | | 5.750 | % | | | 12/31/32 | | | | 136,879 | | | | 137,590 | (c) |
Total Ivory Coast | | | | | | | | | | | | | | | 349,184 | |
Jamaica — 0.3% | | | | | | | | | | | | | | | | |
Jamaica Government International Bond, Senior Notes | | | 6.750 | % | | | 4/28/28 | | | | 400,000 | | | | 468,500 | |
Jordan — 0.2% | | | | | | | | | | | | | | | | |
Jordan Government International Bond, Senior Notes | | | 6.125 | % | | | 1/29/26 | | | | 250,000 | | | | 271,724 | (a) |
Kenya — 0.2% | | | | | | | | | | | | | | | | |
Kenya Government International Bond, Senior Notes | | | 7.250 | % | | | 2/28/28 | | | | 300,000 | | | | 332,205 | (a) |
Mexico — 2.1% | | | | | | | | | | | | | | | | |
Mexican Bonos, Senior Notes | | | 7.750 | % | | | 11/23/34 | | | | 22,020,000 | MXN | | | 1,166,616 | |
Mexico Government International Bond, Senior Notes | | | 2.659 | % | | | 5/24/31 | | | | 2,400,000 | | | | 2,350,536 | |
Total Mexico | | | | | | | | | | | | | | | 3,517,152 | |
Nigeria — 0.3% | | | | | | | | | | | | | | | | |
Nigeria Government International Bond, Senior Notes | | | 6.500 | % | | | 11/28/27 | | | | 260,000 | | | | 276,352 | (c) |
Nigeria Government International Bond, Senior Notes | | | 7.875 | % | | | 2/16/32 | | | | 200,000 | | | | 216,013 | (a) |
Total Nigeria | | | | | | | | | | | | | | | 492,365 | |
Oman — 0.5% | | | | | | | | | | | | | | | | |
Oman Government International Bond, Senior Notes | | | 5.625 | % | | | 1/17/28 | | | | 800,000 | | | | 842,901 | (a) |
Panama — 1.1% | | | | | | | | | | | | | | | | |
Panama Government International Bond, Senior Notes | | | 2.252 | % | | | 9/29/32 | | | | 1,850,000 | | | | 1,777,942 | |
Paraguay — 0.8% | | | | | | | | | | | | | | | | |
Paraguay Government International Bond, Senior Notes | | | 2.739 | % | | | 1/29/33 | | | | 1,340,000 | | | | 1,309,850 | (a) |
See Notes to Financial Statements.
| | | | |
14 | | | | Western Asset Variable Global High Yield Bond Portfolio 2021 Semi-Annual Report |
Western Asset Variable Global High Yield Bond Portfolio
| | | | | | | | | | | | | | | | |
| Security | | Rate | | | Maturity
Date | | | Face
Amount† | | | Value | |
Peru — 0.8% | | | | | | | | | | | | | | | | |
Peruvian Government International Bond, Senior Notes | | | 1.862 | % | | | 12/1/32 | | | | 1,370,000 | | | $ | 1,274,573 | |
Russia — 1.9% | | | | | | | | | | | | | | | | |
Russian Federal Bond — OFZ | | | 8.150 | % | | | 2/3/27 | | | | 34,070,000 | RUB | | | 492,689 | |
Russian Federal Bond — OFZ | | | 7.050 | % | | | 1/19/28 | | | | 88,573,000 | RUB | | | 1,220,157 | |
Russian Federal Bond — OFZ | | | 6.900 | % | | | 5/23/29 | | | | 98,650,000 | RUB | | | 1,344,055 | |
Total Russia | | | | | | | | | | | | | | | 3,056,901 | |
Senegal — 0.3% | | | | | | | | | | | | | | | | |
Senegal Government International Bond, Senior Notes | | | 6.750 | % | | | 3/13/48 | | | | 460,000 | | | | 465,846 | (a) |
South Africa — 0.5% | | | | | | | | | | | | | | | | |
Republic of South Africa Government | | | | | | | | | | | | | | | | |
International Bond, Senior Notes | | | 4.300 | % | | | 10/12/28 | | | | 400,000 | | | | 414,020 | |
Republic of South Africa Government | | | | | | | | | | | | | | | | |
International Bond, Senior Notes | | | 5.650 | % | | | 9/27/47 | | | | 380,000 | | | | 388,417 | |
Total South Africa | | | | | | | | | | | | | | | 802,437 | |
Turkey — 1.5% | | | | | | | | | | | | | | | | |
Turkey Government International Bond, Senior Notes | | | 4.250 | % | | | 4/14/26 | | | | 1,920,000 | | | | 1,849,459 | |
Turkey Government International Bond, Senior Notes | | | 4.875 | % | | | 10/9/26 | | | | 700,000 | | | | 686,902 | |
Total Turkey | | | | | | | | | | | | | | | 2,536,361 | |
Ukraine — 0.7% | | | | | | | | | | | | | | | | |
Ukraine Government International Bond, Senior Notes | | | 7.750 | % | | | 9/1/24 | | | | 250,000 | | | | 273,384 | (a) |
Ukraine Government International Bond, Senior Notes | | | 7.750 | % | | | 9/1/26 | | | | 200,000 | | | | 221,313 | (a) |
Ukraine Government International Bond, Senior Notes | | | 7.375 | % | | | 9/25/32 | | | | 600,000 | | | | 632,479 | (a) |
Total Ukraine | | | | | | | | | | | | | | | 1,127,176 | |
Total Sovereign Bonds (Cost — $30,593,455) | | | | | | | | | | | | | | | 30,560,218 | |
| Senior Loans — 5.0% | | | | | | | | | | | | | | | | |
| Communication Services — 0.9% | | | | | | | | | | | | | | | | |
Media — 0.9% | | | | | | | | | | | | | | | | |
Clear Channel Outdoor Holdings Inc., Term Loan B | | | — | | | | 8/21/26 | | | | 1,496,193 | | | | 1,462,762 | (i) |
| Consumer Discretionary — 0.5% | | | | | | | | | | | | | | | | |
Hotels, Restaurants & Leisure — 0.2% | | | | | | | | | | | | | | | | |
Royal Caribbean Cruises Ltd., First Lien Term Loan A | | | — | | | | 4/5/22 | | | | 440,000 | | | | 429,000 | (i)(j) |
See Notes to Financial Statements.
| | | | | | |
| Western Asset Variable Global High Yield Bond Portfolio 2021 Semi-Annual Report | | | | | 15 | |
Schedule of investments (unaudited) (cont’d)
June 30, 2021
Western Asset Variable Global High Yield Bond Portfolio
| | | | | | | | | | | | | | | | |
| Security | | Rate | | | Maturity
Date | | | Face
Amount† | | | Value | |
Specialty Retail — 0.3% | | | | | | | | | | | | | | | | |
PetSmart LLC, Initial Term Loan (the greater of 3 mo. USD LIBOR or 0.750% + 3.500%) | | | 4.250 | % | | | 2/11/28 | | | | 470,000 | | | $ | 470,881 | (d)(k)(l) |
Total Consumer Discretionary | | | | | | | | | | | | | | | 899,881 | |
| Health Care — 0.3% | | | | | | | | | | | | | | | | |
Pharmaceuticals — 0.3% | | | | | | | | | | | | | | | | |
Jazz Financing Lux Sarl, Initial Dollar Term Loan (the greater of 1 mo. USD LIBOR or 0.500% + 3.500%) | | | 4.000 | % | | | 5/5/28 | | | | 530,000 | | | | 532,603 | (d)(k)(l) |
| Industrials — 2.9% | | | | | | | | | | | | | | | | |
Airlines — 2.9% | | | | | | | | | | | | | | | | |
American Airlines Inc., Initial Term Loan | | | — | | | | 4/20/28 | | | | 750,000 | | | | 782,812 | (i) |
Delta Air Lines Inc., Initial Term Loan (the greater of 3 mo. USD LIBOR or 1.000% + 3.750%) | | | 4.750 | % | | | 10/20/27 | | | | 380,000 | | | | 401,803 | (d)(k)(l) |
Mileage Plus Holdings LLC, Initial Term | | | | | | | | | | | | | | | | |
Loan (the greater of 3 mo. USD LIBOR or 1.000% + 5.250%) | | | 6.250 | % | | | 6/21/27 | | | | 470,000 | | | | 502,349 | (d)(k)(l) |
United Airlines Inc., Term Loan B (the greater of 3 mo. USD LIBOR or 0.750% + 3.750%) | | | 4.500 | % | | | 4/21/28 | | | | 2,992,500 | | | | 3,035,251 | (d)(k)(l) |
Total Industrials | | | | | | | | | | | | | | | 4,722,215 | |
| Materials — 0.4% | | | | | | | | | | | | | | | | |
Chemicals — 0.4% | | | | | | | | | | | | | | | | |
INEOS US Petrochem LLC, 2026 Dollar Term Loan B (the greater of 1 mo. USD LIBOR or 0.500% + 2.750%) | | | 3.250 | % | | | 1/29/26 | | | | 600,000 | | | | 599,437 | (d)(k)(l) |
Total Senior Loans (Cost — $8,109,842) | | | | | | | | | | | | | | | 8,216,898 | |
| U.S. Government & Agency Obligations — 1.3% | | | | | | | | | | | | | | | | |
U.S. Government Obligations — 1.3% | | | | | | | | | | | | | | | | |
U.S. Treasury Notes | | | 0.500 | % | | | 2/28/26 | | | | 750,000 | | | | 738,765 | |
U.S. Treasury Notes | | | 0.750 | % | | | 4/30/26 | | | | 500,000 | | | | 497,519 | |
U.S. Treasury Notes | | | 0.375 | % | | | 7/31/27 | | | | 700,000 | | | | 671,015 | |
U.S. Treasury Notes | | | 0.625 | % | | | 5/15/30 | | | | 250,000 | | | | 233,721 | |
Total U.S. Government & Agency Obligations (Cost — $2,176,316) | | | | | | | | | | | | | | | 2,141,020 | |
| Convertible Bonds & Notes — 0.8% | | | | | | | | | | | | | | | | |
| Communication Services — 0.8% | | | | | | | | | | | | | | | | |
Media — 0.8% | | | | | | | | | | | | | | | | |
DISH Network Corp., Senior Notes (Cost — $1,260,851) | | | 3.375 | % | | | 8/15/26 | | | | 1,320,000 | | | | 1,350,360 | |
See See Notes to Financial Statements.
| | | | |
16 | | | | Western Asset Variable Global High Yield Bond Portfolio 2021 Semi-Annual Report |
Western Asset Variable Global High Yield Bond Portfolio
| | | | | | | | | | | | | | | | |
| Security | | Rate | | | Maturity
Date | | | Face Amount† | | | Value | |
| Asset-Backed Securities — 0.4% | | | | | | | | | | | | | | | | |
Magnetite XII Ltd., 2015-12A ER (3 mo. USD LIBOR + 5.680%) (Cost — $591,016) | | | 5.864 | % | | | 10/15/31 | | | | 600,000 | | | $ | 591,941 | (a)(d) |
| | | | |
| | | | | | | | | Shares | | | | |
| Convertible Preferred Stocks — 0.3% | | | | | | | | | | | | | | | | |
| Energy — 0.3% | | | | | | | | | | | | | | | | |
Oil, Gas & Consumable Fuels — 0.3% | | | | | | | | | | | | | | | | |
Targa Resources Corp., Non Voting Shares (Cost — $399,000) | | | 9.500 | % | | | | | | | 380 | | | | 411,446 | |
| Common Stocks — 0.1% | | | | | | | | | | | | | | | | |
| Energy — 0.0%†† | | | | | | | | | | | | | | | | |
Energy Equipment & Services — 0.0%†† | | | | | | | | | | | | | | | | |
Hercules Offshore Inc. (Escrow) | | | | | | | | | | | 17,554 | | | | 10,487 | *(j)(m) |
KCAD Holdings I Ltd. | | | | | | | | | | | 75,024,286 | | | | 0 | *(j)(m)(n) |
Total Energy | | | | | | | | | | | | | | | 10,487 | |
| Financials — 0.1% | | | | | | | | | | | | | | | | |
Capital Markets — 0.1% | | | | | | | | | | | | | | | | |
EG Acquisition Corp. | | | | | | | | | | | 19,920 | | | | 199,200 | * |
Total Common Stocks (Cost — $1,846,794) | | | | | | | | | | | | | | | 209,687 | |
Total Investments before Short-Term Investments (Cost — $153,525,030) | | | | | | | | 157,985,449 | |
| | | Rate | | | | | | | | | | |
| Short-Term Investments — 5.1% | | | | | | | | | | | | | | | | |
Western Asset Premier Institutional Government Reserves, Premium Shares
(Cost — $8,322,987) | | | 0.010 | % | | | | | | | 8,322,987 | | | | 8,322,987 | (o) |
Total Investments — 101.9% (Cost — $161,848,017) | | | | | | | | | | | | | | | 166,308,436 | |
Liabilities in Excess of Other Assets — (1.9)% | | | | | | | | | | | | | | | (3,112,324 | ) |
Total Net Assets — 100.0% | | | | | | | | | | | | | | $ | 163,196,112 | |
See Notes to Financial Statements.
| | | | | | |
| Western Asset Variable Global High Yield Bond Portfolio 2021 Semi-Annual Report 17 | | | | | 17 | |
Schedule of investments (unaudited) (cont’d)
June 30, 2021
Western Asset Variable Global High Yield Bond Portfolio
| † | Face amount denominated in U.S. dollars, unless otherwise noted. |
| †† | Represents less than 0.1%. |
| * | Non-income producing security. |
| (a) | Security is exempt from registration under Rule 144A of the Securities Act of 1933. This security may be resold in transactions that are exempt from registration, normally to qualified institutional buyers. This security has been deemed liquid pursuant to guidelines approved by the Board of Trustees. |
| (b) | Securities traded on a when-issued or delayed delivery basis. |
| (c) | Security is exempt from registration under Regulation S of the Securities Act of 1933. Regulation S applies to securities offerings that are made outside of the United States and do not involve direct selling efforts in the United States. This security has been deemed liquid pursuant to guidelines approved by the Board of Trustees. |
| (d) | Variable rate security. Interest rate disclosed is as of the most recent information available. Certain variable rate securities are not based on a published reference rate and spread but are determined by the issuer or agent and are based on current market conditions. These securities do not indicate a reference rate and spread in their description above. |
| (e) | Security has no maturity date. The date shown represents the next call date. |
| (f) | Payment-in-kind security for which the issuer has the option at each interest payment date of making interest payments in cash or additional securities. |
| (g) | The maturity principal is currently in default as of June 30, 2021. |
| (h) | The coupon payment on this security is currently in default as of June 30, 2021. |
| (i) | All or a portion of this loan is unfunded as of June 30, 2021. The interest rate for fully unfunded term loans is to be determined. |
| (j) | Security is valued using significant unobservable inputs (Note 1). |
| (k) | Interest rates disclosed represent the effective rates on senior loans. Ranges in interest rates are attributable to multiple contracts under the same loan. |
| (l) | Senior loans may be considered restricted in that the Portfolio ordinarily is contractually obligated to receive approval from the agent bank and/or borrower prior to the disposition of a senior loan. |
| (m) | Security is valued in good faith in accordance with procedures approved by the Board of Trustees (Note 1). |
| (n) | Value is less than $1. |
| (o) | In this instance, as defined in the Investment Company Act of 1940, an “Affiliated Company” represents Portfolio ownership of at least 5% of the outstanding voting securities of an issuer, or a company which is under common ownership or control with the Portfolio. At June 30, 2021, the total market value of investments in Affiliated Companies was $8,322,987 and the cost was $8,322,987 (Note 8). |
| | |
Abbreviation(s) used in this schedule: |
| |
| BRL | | — Brazilian Real |
| |
| EUR | | — Euro |
| |
| EURIBOR | | — Euro Interbank Offered Rate |
| |
| GBP | | — British Pound |
| |
| ICE | | — Intercontinental Exchange |
| |
| IDR | | — Indonesian Rupiah |
| |
| LIBOR | | — London Interbank Offered Rate |
| |
| MXN | | — Mexican Peso |
| |
| OFZ | | — Obligatsyi Federal’novo Zaima (Russian Federal Loan Obligation) |
| |
| PIK | | — Payment-In-Kind |
| |
| RUB | | — Russian Ruble |
| |
| USD | | — United States Dollar |
See Notes to Financial Statements.
| | | | |
18 | | | | Western Asset Variable Global High Yield Bond Portfolio 2021 Semi-Annual Report |
Western Asset Variable Global High Yield Bond Portfolio
At June 30, 2021, the Portfolio had the following open futures contracts:
| | | | | | | | | | | | | | | | | | | | |
| | | Number of
Contracts | | | Expiration
Date | | | Notional
Amount | | | Market Value | | | Unrealized
Appreciation
(Depreciation) | |
| Contracts to Sell: | | | | | | | | | | | | | | | | | | | | |
| Euro | | | 27 | | | | 9/21 | | | $ | 4,118,276 | | | $ | 4,004,437 | | | $ | 113,839 | |
| U.S. Treasury 10-Year Notes | | | 100 | | | | 9/21 | | | | 13,179,515 | | | | 13,250,000 | | | | (70,485) | |
| Net unrealized appreciation on open futures contracts | | | | | | | $ | 43,354 | |
At June 30, 2021, the Portfolio had the following open forward foreign currency contracts:
| | | | | | | | | | | | | | | | | | | | |
Currency
Purchased | | | Currency Sold | | | Counterparty | | Settlement
Date | | | Unrealized Appreciation
(Depreciation) | |
| EUR | | | 150,000 | | | USD | | | 179,062 | | | Citibank N.A. | | | 7/19/21 | | | $ | (1,129) | |
| EUR | | | 210,000 | | | USD | | | 254,686 | | | Citibank N.A. | | | 7/19/21 | | | | (5,580 | ) |
| EUR | | | 240,000 | | | USD | | | 290,885 | | | Citibank N.A. | | | 7/19/21 | | | | (6,192 | ) |
| EUR | | | 971,829 | | | USD | | | 1,155,961 | | | Citibank N.A. | | | 7/19/21 | | | | (3,159 | ) |
| MXN | | | 495,546 | | | USD | | | 24,299 | | | Citibank N.A. | | | 7/19/21 | | | | 503 | |
| USD | | | 131,295 | | | EUR | | | 110,000 | | | Citibank N.A. | | | 7/19/21 | | | | 811 | |
| USD | | | 235,981 | | | EUR | | | 193,000 | | | Citibank N.A. | | | 7/19/21 | | | | 7,041 | |
| USD | | | 253,795 | | | EUR | | | 210,000 | | | Citibank N.A. | | | 7/19/21 | | | | 4,688 | |
| USD | | | 554,691 | | | GBP | | | 400,000 | | | Citibank N.A. | | | 7/19/21 | | | | 1,339 | |
| USD | | | 709,880 | | | GBP | | | 500,000 | | | Citibank N.A. | | | 7/19/21 | | | | 18,190 | |
| GBP | | | 700,000 | | | USD | | | 977,194 | | | Goldman Sachs Group Inc. | | | 7/19/21 | | | | (8,828 | ) |
| USD | | | 3,543,177 | | | GBP | | | 2,578,554 | | | Goldman Sachs Group Inc. | | | 7/19/21 | | | | (23,942 | ) |
| USD | | | 319,863 | | | CAD | | | 390,000 | | | JPMorgan Chase & Co. | | | 7/19/21 | | | | 5,250 | |
| USD | | | 635,394 | | | GBP | | | 450,000 | | | JPMorgan Chase & Co. | | | 7/19/21 | | | | 12,873 | |
| Total | | | | | | $ | 1,865 | |
| | |
Abbreviation(s) used in this table: |
| |
| CAD | | — Canadian Dollar |
| |
| EUR | | — Euro |
| |
| GBP | | — British Pound |
| |
| MXN | | — Mexican Peso |
| |
| USD | | — United States Dollar |
| | | | |
| Summary of Investments by Country* | | | |
| United States | | | 45.1 | % |
| Mexico | | | 6.0 | |
| United Kingdom | | | 4.4 | |
| Israel | | | 4.2 | |
| Argentina | | | 3.9 | |
| Brazil | | | 3.5 | |
| Turkey | | | 2.8 | |
See Notes to Financial Statements.
| | | | | | |
| Western Asset Variable Global High Yield Bond Portfolio 2021 Semi-Annual Report | | | | | 19 | |
Schedule of investments (unaudited) (cont’d)
June 30, 2021
Western Asset Variable Global High Yield Bond Portfolio
| | | | |
| Summary of Investments by Country* (cont’d) | | | |
| Indonesia | | | 2.0 | % |
| Russia | | | 1.8 | |
| Peru | | | 1.7 | |
| Canada | | | 1.6 | |
| Macau | | | 1.6 | |
| Cayman Islands | | | 1.3 | |
| Luxembourg | | | 1.3 | |
| Panama | | | 1.1 | |
| South Africa | | | 1.0 | |
| Dominican Republic | | | 0.9 | |
| Paraguay | | | 0.8 | |
| Egypt | | | 0.8 | |
| Germany | | | 0.7 | |
| Ukraine | | | 0.7 | |
| Ghana | | | 0.7 | |
| Switzerland | | | 0.6 | |
| China | | | 0.6 | |
| Oman | | | 0.5 | |
| Spain | | | 0.5 | |
| Hong Kong | | | 0.4 | |
| Qatar | | | 0.4 | |
| Zambia | | | 0.4 | |
| France | | | 0.4 | |
| Ecuador | | | 0.3 | |
| Nigeria | | | 0.3 | |
| Bahrain | | | 0.3 | |
| Jamaica | | | 0.3 | |
| Senegal | | | 0.3 | |
| Angola | | | 0.2 | |
| Italy | | | 0.2 | |
| Costa Rica | | | 0.2 | |
| Ivory Coast | | | 0.2 | |
| Kenya | | | 0.2 | |
| Bahamas | | | 0.2 | |
| El Salvador | | | 0.2 | |
| Jordan | | | 0.2 | |
| Greece | | | 0.1 | |
See Notes to Financial Statements.
| | | | |
20 | | | | Western Asset Variable Global High Yield Bond Portfolio 2021 Semi-Annual Report |
Western Asset Variable Global High Yield Bond Portfolio
| | | | |
| Summary of Investments by Country* (cont’d) | | | |
| Netherlands | | | 0.1 | % |
| Short-Term Investments | | | 5.0 | |
| | | | 100.0 | % |
| * | As a percentage of total investments. Please note that the Portfolio holdings are as of June 30, 2021 and are subject to change. |
See Notes to Financial Statements.
| | | | | | |
| Western Asset Variable Global High Yield Bond Portfolio 2021 Semi-Annual Report | | | | | 21 | |
Statement of assets and liabilities (unaudited)
June 30, 2021
| | | | |
| |
| Assets: | | | | |
Investments in unaffiliated securities, at value (Cost — $153,525,030) | | $ | 157,985,449 | |
Investments in affiliated securities, at value (Cost — $8,322,987) | | | 8,322,987 | |
Foreign currency, at value (Cost — $933,457) | | | 926,375 | |
Cash | | | 1,499,038 | |
Interest receivable | | | 1,831,604 | |
Receivable for securities sold | | | 1,000,639 | |
Deposits with brokers for open futures contracts | | | 243,023 | |
Unrealized appreciation on forward foreign currency contracts | | | 50,695 | |
Receivable for Portfolio shares sold | | | 34,153 | |
Prepaid expenses | | | 621 | |
Total Assets | | | 171,894,584 | |
| |
| Liabilities: | | | | |
Payable for securities purchased | | | 4,569,242 | |
Payable for Portfolio shares repurchased | | | 3,909,535 | |
Investment management fee payable | | | 93,650 | |
Unrealized depreciation on forward foreign currency contracts | | | 48,830 | |
Service and/or distribution fees payable | | | 11,946 | |
Payable to broker — net variation margin on open futures contracts | | | 4,875 | |
Trustees’ fees payable | | | 240 | |
Accrued expenses | | | 60,154 | |
Total Liabilities | | | 8,698,472 | |
| Total Net Assets | | $ | 163,196,112 | |
| |
| Net Assets: | | | | |
Par value (Note 7) | | $ | 212 | |
Paid-in capital in excess of par value | | | 170,280,244 | |
Total distributable earnings (loss) | | | (7,084,344) | |
| Total Net Assets | | $ | 163,196,112 | |
| |
| Net Assets: | | | | |
Class I | | | $104,344,012 | |
Class II | | | $58,852,100 | |
| |
| Shares Outstanding: | | | | |
Class I | | | 13,697,524 | |
Class II | | | 7,482,309 | |
| |
| Net Asset Value: | | | | |
Class I | | | $7.62 | |
Class II | | | $7.87 | |
See Notes to Financial Statements.
| | | | |
22 | | | | Western Asset Variable Global High Yield Bond Portfolio 2021 Semi-Annual Report |
Statement of operations (unaudited)
For the Six Months Ended June 30, 2021
| | | | |
| |
| Investment Income: | | | | |
Interest from unaffiliated investments | | $ | 4,189,344 | |
Interest from affiliated investments | | | 86 | |
Dividends | | | 12,099 | |
Less: Foreign taxes withheld | | | (22,205) | |
Total Investment Income | | | 4,179,324 | |
| |
| Expenses: | | | | |
Investment management fee (Note 2) | | | 553,184 | |
Service and/or distribution fees (Notes 2 and 5) | | | 68,469 | |
Fund accounting fees | | | 34,838 | |
Shareholder reports | | | 22,613 | |
Audit and tax fees | | | 20,590 | |
Legal fees | | | 4,662 | |
Custody fees | | | 2,791 | |
Transfer agent fees (Note 5) | | | 1,862 | |
Trustees’ fees | | | 1,477 | |
Insurance | | | 1,270 | |
Commitment fees (Note 9) | | | 619 | |
Interest expense | | | 344 | |
Miscellaneous expenses | | | 2,329 | |
Total Expenses | | | 715,048 | |
Less: Fee waivers and/or expense reimbursements (Notes 2 and 5) | | | (265) | |
Net Expenses | | | 714,783 | |
| Net Investment Income | | | 3,464,541 | |
| |
| Realized and Unrealized Gain (Loss) on Investments, Futures Contracts, Forward Foreign Currency Contracts and Foreign Currency Transactions (Notes 1, 3 and 4): | | | | |
Net Realized Gain (Loss) From: | | | | |
Investment transactions in unaffiliated securities | | | 4,302,850 | |
Futures contracts | | | 4,253 | |
Forward foreign currency contracts | | | (182,879) | |
Foreign currency transactions | | | 32,556 | |
Net Realized Gain | | | 4,156,780 | |
Change in Net Unrealized Appreciation (Depreciation) From: | | | | |
Investments in unaffiliated securities | | | (3,800,373) | |
Futures contracts | | | 69,038 | |
Forward foreign currency contracts | | | 131,190 | |
Foreign currencies | | | (23,512) | |
Change in Net Unrealized Appreciation (Depreciation) | | | (3,623,657) | |
| Net Gain on Investments, Futures Contracts, Forward Foreign Currency Contracts and Foreign Currency Transactions | | | 533,123 | |
| Increase in Net Assets From Operations | | $ | 3,997,664 | |
See Notes to Financial Statements.
| | | | | | |
| Western Asset Variable Global High Yield Bond Portfolio 2021 Semi-Annual Report | | | | | 23 | |
Statements of changes in net assets
| | | | | | | | |
For the Six Months Ended June 30, 2021 (unaudited) and the Year Ended December 31, 2020 | | 2021 | | | 2020 | |
| | |
| Operations: | | | | | | | | |
Net investment income | | $ | 3,464,541 | | | $ | 7,002,121 | |
Net realized gain (loss) | | | 4,156,780 | | | | (4,799,688) | |
Change in net unrealized appreciation (depreciation) | | | (3,623,657) | | | | 7,832,694 | |
Increase in Net Assets From Operations | | | 3,997,664 | | | | 10,035,127 | |
| | |
| Distributions to Shareholders From (Notes 1 and 6): | | | | | | | | |
Total distributable earnings | | | — | | | | (5,651,705) | |
Return of capital | | | — | | | | (28,305) | |
Decrease in Net Assets From Distributions to Shareholders | | | — | | | | (5,680,010) | |
| | |
| Portfolio Share Transactions (Note 7): | | | | | | | | |
Net proceeds from sale of shares | | | 40,190,027 | | | | 40,201,240 | |
Reinvestment of distributions | | | — | | | | 5,680,010 | |
Cost of shares repurchased | | | (35,102,782) | | | | (47,484,259) | |
Increase (Decrease) in Net Assets From Portfolio Share Transactions | | | 5,087,245 | | | | (1,603,009) | |
Increase in Net Assets | | | 9,084,909 | | | | 2,752,108 | |
| | |
| Net Assets: | | | | | | | | |
Beginning of period | | | 154,111,203 | | | | 151,359,095 | |
End of period | | $ | 163,196,112 | | | $ | 154,111,203 | |
See Notes to Financial Statements.
| | | | |
24 | | | | Western Asset Variable Global High Yield Bond Portfolio 2021 Semi-Annual Report |
Financial highlights
| | | | | | | | | | | | | | | | | | | | | | | | |
For a share of each class of beneficial interest outstanding throughout each year ended December 31,
unless otherwise noted: | |
| Class I Shares1 | | 20212 | | | 2020 | | | 2019 | | | 2018 | | | 2017 | | | 2016 | |
| | | | | | |
| Net asset value, beginning of period | | | $7.43 | | | | $7.19 | | | | $6.65 | | | | $7.30 | | | | $7.09 | | | | $6.53 | |
| | | | | | |
| Income (loss) from operations: | | | | | | | | | | | | | | | | | | | | | | | | |
Net investment income | | | 0.17 | | | | 0.35 | | | | 0.40 | | | | 0.39 | | | | 0.40 | | | | 0.47 | |
Net realized and unrealized gain (loss) | | | 0.02 | | | | 0.18 | | | | 0.53 | | | | (0.66) | | | | 0.21 | | | | 0.54 | |
Total income (loss) from operations | | | 0.19 | | | | 0.53 | | | | 0.93 | | | | (0.27) | | | | 0.61 | | | | 1.01 | |
| | | | | | |
| Less distributions from: | | | | | | | | | | | | | | | | | | | | | | | | |
Net investment income | | | — | | | | (0.29) | | | | (0.39) | | | | (0.38) | | | | (0.40) | | | | (0.45) | |
Return of capital | | | — | | | | (0.00) | 3 | | | — | | | | — | | | | — | | | | — | |
Total distributions | | | — | | | | (0.29) | | | | (0.39) | | | | (0.38) | | | | (0.40) | | | | (0.45) | |
| | | | | | |
| Net asset value, end of period | | | $7.62 | | | | $7.43 | | | | $7.19 | | | | $6.65 | | | | $7.30 | | | | $7.09 | |
Total return4 | | | 2.56 | % | | | 7.32 | % | | | 14.39 | % | | | (3.92) | % | | | 8.65 | % | | | 15.60 | % |
| | | | | | |
| Net assets, end of period (millions) | | | $104 | | | | $104 | | | | $109 | | | | $118 | | | | $144 | | | | $138 | |
| | | | | | |
| Ratios to average net assets: | | | | | | | | | | | | | | | | | | | | | | | | |
Gross expenses | | | 0.82 | %5 | | | 0.84 | % | | | 0.83 | % | | | 0.85 | % | | | 0.82 | % | | | 0.81 | % |
Net expenses6 | | | 0.82 | 5,7 | | | 0.84 | 7 | | | 0.83 | 7 | | | 0.85 | | | | 0.82 | | | | 0.81 | |
Net investment income | | | 4.47 | 5 | | | 4.89 | | | | 5.56 | | | | 5.37 | | | | 5.34 | | | | 6.77 | |
| | | | | | |
| Portfolio turnover rate | | | 52 | % | | | 98 | % | | | 78 | % | | | 103 | % | | | 112 | % | | | 98 | % |
| 1 | Per share amounts have been calculated using the average shares method. |
| 2 | For the six months ended June 30, 2021 (unaudited). |
| 3 | Amount represents less than $0.005 per share. |
| 4 | Performance figures may reflect compensating balance arrangements, fee waivers and/or expense reimbursements. In the absence of compensating balance arrangements, fee waivers and/or expense reimbursements, the total return would have been lower. Total returns do not reflect expenses associated with separate accounts such as administrative fees, account charges and surrender charges which, if reflected, would reduce the total return for all periods shown. Past performance is no guarantee of future results. Total returns for periods of less than one year are not annualized. |
| 6 | As a result of an expense limitation arrangement, the ratio of total annual fund operating expenses, other than interest, brokerage, taxes, extraordinary expenses and acquired fund fees and expenses, to average net assets of Class I shares did not exceed 0.90%. This expense limitation arrangement cannot be terminated prior to December 31, 2022 without the Board of Trustees’ consent. In addition, the manager has agreed to waive the Portfolio’s management fee to an extent sufficient to offset the net management fee payable in connection with any investment in an affiliated money market fund. |
| 7 | Reflects fee waivers and/or expense reimbursements. |
See Notes to Financial Statements.
| | | | | | |
| Western Asset Variable Global High Yield Bond Portfolio 2021 Semi-Annual Report | | | | | 25 | |
Financial highlights (cont’d)
| | | | | | | | | | | | | | | | | | | | | | | | |
For a share of each class of beneficial interest outstanding throughout each year ended December 31,
unless otherwise noted: | |
| Class II Shares1 | | 20212 | | | 2020 | | | 2019 | | | 2018 | | | 2017 | | | 2016 | |
| | | | | | |
| Net asset value, beginning of period | | | $7.68 | | | | $7.43 | | | | $6.86 | | | | $7.52 | | | | $7.29 | | | | $6.70 | |
| | | | | | |
| Income (loss) from operations: | | | | | | | | | | | | | | | | | | | | | | | | |
Net investment income | | | 0.16 | | | | 0.34 | | | | 0.39 | | | | 0.38 | | | | 0.39 | | | | 0.47 | |
Net realized and unrealized gain (loss) | | | 0.03 | | | | 0.19 | | | | 0.56 | | | | (0.68) | | | | 0.22 | | | | 0.55 | |
Total income (loss) from operations | | | 0.19 | | | | 0.53 | | | | 0.95 | | | | (0.30) | | | | 0.61 | | | | 1.02 | |
| | | | | | |
| Less distributions from: | | | | | | | | | | | | | | | | | | | | | | | | |
Net investment income | | | — | | | | (0.28) | | | | (0.38) | | | | (0.36) | | | | (0.38) | | | | (0.43) | |
Return of capital | | | — | | | | (0.00) | 3 | | | — | | | | — | | | | — | | | | — | |
Total distributions | | | — | | | | (0.28) | | | | (0.38) | | | | (0.36) | | | | (0.38) | | | | (0.43) | |
| | | | | | |
| Net asset value, end of period | | | $7.87 | | | | $7.68 | | | | $7.43 | | | | $6.86 | | | | $7.52 | | | | $7.29 | |
Total return4 | | | 2.47 | % | | | 7.12 | % | | | 14.01 | % | | | (4.16) | % | | | 8.43 | % | | | 15.36 | % |
| | | | | | |
| Net assets, end of period (000s) | | | $58,852 | | | | $50,137 | | | | $42,186 | | | | $29,432 | | | | $29,168 | | | | $20,725 | |
| | | | | | |
| Ratios to average net assets: | | | | | | | | | | | | | | | | | | | | | | | | |
Gross expenses | | | 1.07 | %5 | | | 1.10 | % | | | 1.08 | % | | | 1.11 | % | | | 1.07 | % | | | 1.06 | % |
Net expenses6 | | | 1.07 | 5,7 | | | 1.10 | 7 | | | 1.08 | 7 | | | 1.11 | | | | 1.07 | | | | 1.06 | |
Net investment income | | | 4.22 | 5 | | | 4.63 | | | | 5.29 | | | | 5.16 | | | | 5.09 | | | | 6.54 | |
| | | | | | |
| Portfolio turnover rate | | | 52 | % | | | 98 | % | | | 78 | % | | | 103 | % | | | 112 | % | | | 98 | % |
| 1 | Per share amounts have been calculated using the average shares method. |
| 2 | For the six months ended June 30, 2021 (unaudited). |
| 3 | Amount represents less than $0.005 per share. |
| 4 | Performance figures may reflect compensating balance arrangements, fee waivers and/or expense reimbursements. In the absence of compensating balance arrangements, fee waivers and/or expense reimbursements, the total return would have been lower. Total returns do not reflect expenses associated with separate accounts such as administrative fees, account charges and surrender charges which, if reflected, would reduce the total return for all periods shown. Past performance is no guarantee of future results. Total returns for periods of less than one year are not annualized. |
| 6 | As a result of an expense limitation arrangement, the ratio of total annual fund operating expenses, other than interest, brokerage, taxes, extraordinary expenses and acquired fund fees and expenses, to average net assets of Class II shares did not exceed 1.15%. This expense limitation arrangement cannot be terminated prior to December 31, 2022 without the Board of Trustees’ consent. In addition, the manager has agreed to waive the Portfolio’s management fee to an extent sufficient to offset the net management fee payable in connection with any investment in an affiliated money market fund. |
| 7 | Reflects fee waivers and/or expense reimbursements. |
See Notes to Financial Statements.
| | | | |
26 | | | | Western Asset Variable Global High Yield Bond Portfolio 2021 Semi-Annual Report |
Notes to financial statements (unaudited)
1. Organization and significant accounting policies
Western Asset Variable Global High Yield Bond Portfolio (the “Portfolio”) is a separate diversified investment series of Legg Mason Partners Variable Income Trust (the “Trust”). The Trust, a Maryland statutory trust, is registered under the Investment Company Act of 1940, as amended (the “1940 Act”), as an open-end management investment company.
Shares of the Portfolio may only be purchased or redeemed through variable annuity contracts and variable life insurance policies offered by the separate accounts of participating insurance companies or through eligible pension or other qualified plans.
The following are significant accounting policies consistently followed by the Portfolio and are in conformity with U.S. generally accepted accounting principles (“GAAP”). Estimates and assumptions are required to be made regarding assets, liabilities and changes in net assets resulting from operations when financial statements are prepared. Changes in the economic environment, financial markets and any other parameters used in determining these estimates could cause actual results to differ. Subsequent events have been evaluated through the date the financial statements were issued.
(a) Investment valuation. The valuations for fixed income securities (which may include, but are not limited to, corporate, government, municipal, mortgage-backed, collateralized mortgage obligations and asset-backed securities) and certain derivative instruments are typically the prices supplied by independent third party pricing services, which may use market prices or broker/dealer quotations or a variety of valuation techniques and methodologies. The independent third party pricing services typically use inputs that are observable such as issuer details, interest rates, yield curves, prepayment speeds, credit risks/spreads, default rates and quoted prices for similar securities. Investments in open-end funds are valued at the closing net asset value per share of each fund on the day of valuation. Futures contracts are valued daily at the settlement price established by the board of trade or exchange on which they are traded. Equity securities for which market quotations are available are valued at the last reported sales price or official closing price on the primary market or exchange on which they trade. When the Portfolio holds securities or other assets that are denominated in a foreign currency, the Portfolio will normally use the currency exchange rates as of 4:00 p.m. (Eastern Time). If independent third party pricing services are unable to supply prices for a portfolio investment, or if the prices supplied are deemed by the manager to be unreliable, the market price may be determined by the manager using quotations from one or more broker/dealers or at the transaction price if the security has recently been purchased and no value has yet been obtained from a pricing service or pricing broker. When reliable prices are not readily available, such as when the value of a security has been significantly affected by events after the close of the exchange or market on which the security is principally traded, but before the Portfolio calculates its net asset value, the Portfolio values these securities as determined in accordance with procedures approved by the Portfolio’s Board of Trustees.
| | | | | | |
| Western Asset Variable Global High Yield Bond Portfolio 2021 Semi-Annual Report | | | | | 27 | |
Notes to financial statements (unaudited) (cont’d)
The Board of Trustees is responsible for the valuation process and has delegated the supervision of the daily valuation process to the Global Fund Valuation Committee (formerly known as Legg Mason North Atlantic Fund Valuation Committee prior to March 1, 2021) (the “Valuation Committee”). The Valuation Committee, pursuant to the policies adopted by the Board of Trustees, is responsible for making fair value determinations, evaluating the effectiveness of the Portfolio’s pricing policies, and reporting to the Board of Trustees. When determining the reliability of third party pricing information for investments owned by the Portfolio, the Valuation Committee, among other things, conducts due diligence reviews of pricing vendors, monitors the daily change in prices and reviews transactions among market participants.
The Valuation Committee will consider pricing methodologies it deems relevant and appropriate when making fair value determinations. Examples of possible methodologies include, but are not limited to, multiple of earnings; discount from market of a similar freely traded security; discounted cash-flow analysis; book value or a multiple thereof; risk premium/yield analysis; yield to maturity; and/or fundamental investment analysis. The Valuation Committee will also consider factors it deems relevant and appropriate in light of the facts and circumstances. Examples of possible factors include, but are not limited to, the type of security; the issuer’s financial statements; the purchase price of the security; the discount from market value of unrestricted securities of the same class at the time of purchase; analysts’ research and observations from financial institutions; information regarding any transactions or offers with respect to the security; the existence of merger proposals or tender offers affecting the security; the price and extent of public trading in similar securities of the issuer or comparable companies; and the existence of a shelf registration for restricted securities.
For each portfolio security that has been fair valued pursuant to the policies adopted by the Board of Trustees, the fair value price is compared against the last available and next available market quotations. The Valuation Committee reviews the results of such back testing monthly and fair valuation occurrences are reported to the Board of Trustees quarterly.
The Portfolio uses valuation techniques to measure fair value that are consistent with the market approach and/or income approach, depending on the type of security and the particular circumstance. The market approach uses prices and other relevant information generated by market transactions involving identical or comparable securities. The income approach uses valuation techniques to discount estimated future cash flows to present value.
| | | | |
28 | | | | Western Asset Variable Global High Yield Bond Portfolio 2021 Semi-Annual Report |
GAAP establishes a disclosure hierarchy that categorizes the inputs to valuation techniques used to value assets and liabilities at measurement date. These inputs are summarized in the three broad levels listed below:
| • | | Level 1 — quoted prices in active markets for identical investments |
| • | | Level 2 — other significant observable inputs (including quoted prices for similar investments, interest rates, prepayment speeds, credit risk, etc.) |
| • | | Level 3 — significant unobservable inputs (including the Portfolio’s own assumptions in determining the fair value of investments) |
The inputs or methodologies used to value securities are not necessarily an indication of the risk associated with investing in those securities.
The following is a summary of the inputs used in valuing the Portfolio’s assets and liabilities carried at fair value:
| | | | | | | | | | | | | | | | |
| ASSETS | |
| Description | | Quoted Prices
(Level 1) | | | Other Significant
Observable Inputs (Level 2) | | | Significant
Unobservable
Inputs (Level 3) | | | Total | |
| Long-Term Investments†: | | | | | | | | | | | | | | | | |
Corporate Bonds & Notes | | | — | | | $ | 114,503,879 | | | | — | | | $ | 114,503,879 | |
Sovereign Bonds | | | — | | | | 30,560,218 | | | | — | | | | 30,560,218 | |
Senior Loans: | | | | | | | | | | | | | | | | |
Consumer Discretionary | | | — | | | | 470,881 | | | $ | 429,000 | | | | 899,881 | |
Other Senior Loans | | | — | | | | 7,317,017 | | | | — | | | | 7,317,017 | |
U.S. Government & Agency Obligations | | | — | | | | 2,141,020 | | | | — | | | | 2,141,020 | |
Convertible Bonds & Notes | | | — | | | | 1,350,360 | | | | — | | | | 1,350,360 | |
Asset-Backed Securities | | | — | | | | 591,941 | | | | — | | | | 591,941 | |
Convertible Preferred Stocks | | | — | | | | 411,446 | | | | — | | | | 411,446 | |
Common Stocks: | | | | | | | | | | | | | | | | |
Energy | | | — | | | | — | | | | 10,487 | | | | 10,487 | |
Financials | | $ | 199,200 | | | | — | | | | — | | | | 199,200 | |
| Total Long-Term Investments | | | 199,200 | | | | 157,346,762 | | | | 439,487 | | | | 157,985,449 | |
| Short-Term Investments† | | | 8,322,987 | | | | — | | | | — | | | | 8,322,987 | |
| Total Investments | | $ | 8,522,187 | | | $ | 157,346,762 | | | $ | 439,487 | | | $ | 166,308,436 | |
| Other Financial Instruments: | | | | | | | | | | | | | | | | |
Futures Contracts†† | | $ | 113,839 | | | | — | | | | — | | | $ | 113,839 | |
Forward Foreign Currency Contracts†† | | | — | | | $ | 50,695 | | | | — | | | | 50,695 | |
| Total Other Financial Instruments | | $ | 113,839 | | | $ | 50,695 | | | | — | | | $ | 164,534 | |
| Total | | $ | 8,636,026 | | | $ | 157,397,457 | | | $ | 439,487 | | | $ | 166,472,970 | |
| | | | | | |
| Western Asset Variable Global High Yield Bond Portfolio 2021 Semi-Annual Report | | | | | 29 | |
Notes to financial statements (unaudited) (cont’d)
| | | | | | | | | | | | | | | | |
| LIABILITIES | |
| Description | | Quoted Prices
(Level 1) | | | Other Significant
Observable Inputs
(Level 2) | | | Significant
Unobservable
Inputs
(Level 3) | | | Total | |
| Other Financial Instruments: | | | | | | | | | | | | | | | | |
Futures Contracts†† | | $ | 70,485 | | | | — | | | | — | | | $ | 70,485 | |
Forward Foreign Currency Contracts†† | | | — | | | $ | 48,830 | | | | — | | | | 48,830 | |
| Total | | $ | 70,485 | | | $ | 48,830 | | | | — | | | $ | 119,315 | |
| † | See Schedule of Investments for additional detailed categorizations. |
| †† | Reflects the unrealized appreciation (depreciation) of the instruments. |
(b) Futures contracts. The Portfolio uses futures contracts generally to gain exposure to, or hedge against, changes in interest rates or gain exposure to, or hedge against, changes in certain asset classes. A futures contract represents a commitment for the future purchase or sale of an asset at a specified price on a specified date.
Upon entering into a futures contract, the Portfolio is required to deposit cash or securities with a broker in an amount equal to a certain percentage of the contract amount. This is known as the ‘‘initial margin’’ and subsequent payments (‘‘variation margin’’) are made or received by the Portfolio each day, depending on the daily fluctuation in the value of the contract. For certain futures, including foreign denominated futures, variation margin is not settled daily, but is recorded as a net variation margin payable or receivable. The daily changes in contract value are recorded as unrealized appreciation or depreciation in the Statement of Operations and the Portfolio recognizes a realized gain or loss when the contract is closed.
Futures contracts involve, to varying degrees, risk of loss in excess of the amounts reflected in the financial statements. In addition, there is the risk that the Portfolio may not be able to enter into a closing transaction because of an illiquid secondary market.
(c) Forward foreign currency contracts. The Portfolio enters into a forward foreign currency contract to hedge against foreign currency exchange rate risk on its non-U.S. dollar denominated securities or to facilitate settlement of a foreign currency denominated portfolio transaction. A forward foreign currency contract is an agreement between two parties to buy and sell a currency at a set price with delivery and settlement at a future date. The contract is marked-to-market daily and the change in value is recorded by the Portfolio as an unrealized gain or loss. When a forward foreign currency contract is closed, through either delivery or offset by entering into another forward foreign currency contract, the Portfolio recognizes a realized gain or loss equal to the difference between the value of the contract at the time it was opened and the value of the contract at the time it is closed.
| | | | |
30 | | | | Western Asset Variable Global High Yield Bond Portfolio 2021 Semi-Annual Report |
Forward foreign currency contracts involve elements of market risk in excess of the amounts reflected on the Statement of Assets and Liabilities. The Portfolio bears the risk of an unfavorable change in the foreign exchange rate underlying the forward foreign currency contract. Risks may also arise upon entering into these contracts from the potential inability of the counterparties to meet the terms of their contracts.
(d) Loan participations. The Portfolio may invest in loans arranged through private negotiation between one or more financial institutions. The Portfolio’s investment in any such loan may be in the form of a participation in or an assignment of the loan. In connection with purchasing participations, the Portfolio generally will have no right to enforce compliance by the borrower with the terms of the loan agreement related to the loan, or any rights of off-set against the borrower and the Portfolio may not benefit directly from any collateral supporting the loan in which it has purchased the participation.
The Portfolio assumes the credit risk of the borrower, the lender that is selling the participation and any other persons interpositioned between the Portfolio and the borrower. In the event of the insolvency of the lender selling the participation, the Portfolio may be treated as a general creditor of the lender and may not benefit from any off-set between the lender and the borrower.
(e) Unfunded loan commitments. The Portfolio may enter into certain credit agreements where all or a portion of the total amount committed may be unfunded. The Portfolio is obligated to fund these commitments at the borrower’s discretion. The commitments are disclosed in the accompanying Schedule of Investments. At June 30, 2021, the Portfolio had sufficient cash and/or securities to cover these commitments.
(f) Securities traded on a when-issued and delayed delivery basis. The Portfolio may trade securities on a when-issued or delayed delivery basis. In when-issued and delayed delivery transactions, the securities are purchased or sold by the Portfolio with payment and delivery taking place in the future in order to secure what is considered to be an advantageous price and yield to the Portfolio at the time of entering into the transaction.
Purchasing such securities involves risk of loss if the value of the securities declines prior to settlement. These securities are subject to market fluctuations and their current value is determined in the same manner as for other securities.
(g) Inflation-indexed bonds. Inflation-indexed bonds are fixed income securities whose principal value or interest rate is periodically adjusted according to the rate of inflation. As the index measuring inflation changes, the principal value or interest rate of inflation-indexed bonds will be adjusted accordingly. Inflation adjustments to the principal amount of inflation-indexed bonds are reflected as an increase or decrease to investment income on the Statement of Operations. Repayment of the original bond principal upon maturity (as adjusted for inflation) is guaranteed in the case of U.S. Treasury inflation-indexed bonds. For bonds that do not provide a similar guarantee, the adjusted principal value of the bond repaid at maturity may be less than the original principal.
| | | | | | |
| Western Asset Variable Global High Yield Bond Portfolio 2021 Semi-Annual Report | | | | | 31 | |
Notes to financial statements (unaudited) (cont’d)
(h) Foreign currency translation. Investment securities and other assets and liabilities denominated in foreign currencies are translated into U.S. dollar amounts based upon prevailing exchange rates on the date of valuation. Purchases and sales of investment securities and income and expense items denominated in foreign currencies are translated into U.S. dollar amounts based upon prevailing exchange rates on the respective dates of such transactions.
The Portfolio does not isolate that portion of the results of operations resulting from fluctuations in foreign exchange rates on investments from the fluctuations arising from changes in market prices of securities held. Such fluctuations are included with the net realized and unrealized gain or loss on investments.
Net realized foreign exchange gains or losses arise from sales of foreign currencies, including gains and losses on forward foreign currency contracts, currency gains or losses realized between the trade and settlement dates on securities transactions, and the difference between the amounts of dividends, interest, and foreign withholding taxes recorded on the Portfolio’s books and the U.S. dollar equivalent of the amounts actually received or paid. Net unrealized foreign exchange gains and losses arise from changes in the values of assets and liabilities, other than investments in securities, on the date of valuation, resulting from changes in exchange rates.
Foreign security and currency transactions may involve certain considerations and risks not typically associated with those of U.S. dollar denominated transactions as a result of, among other factors, the possibility of lower levels of governmental supervision and regulation of foreign securities markets and the possibility of political or economic instability.
(i) Credit and market risk. The Portfolio invests in high-yield and emerging market instruments that are subject to certain credit and market risks. The yields of high-yield and emerging market debt obligations reflect, among other things, perceived credit and market risks. The Portfolio’s investments in securities rated below investment grade typically involve risks not associated with higher rated securities including, among others, greater risk related to timely and ultimate payment of interest and principal, greater market price volatility and less liquid secondary market trading. The consequences of political, social, economic or diplomatic changes may have disruptive effects on the market prices of investments held by the Portfolio. The Portfolio’s investments in non-U.S. dollar denominated securities may also result in foreign currency losses caused by devaluations and exchange rate fluctuations.
(j) Foreign investment risks. The Portfolio’s investments in foreign securities may involve risks not present in domestic investments. Since securities may be denominated in foreign currencies, may require settlement in foreign currencies or may pay interest or dividends in foreign currencies, changes in the relationship of these foreign currencies to the U.S. dollar
| | | | |
32 | | | | Western Asset Variable Global High Yield Bond Portfolio 2021 Semi-Annual Report |
can significantly affect the value of the investments and earnings of the Portfolio. Foreign investments may also subject the Portfolio to foreign government exchange restrictions, expropriation, taxation or other political, social or economic developments, all of which affect the market and/or credit risk of the investments.
(k) Counterparty risk and credit-risk-related contingent features of derivative instruments. The Portfolio may invest in certain securities or engage in other transactions where the Portfolio is exposed to counterparty credit risk in addition to broader market risks. The Portfolio may invest in securities of issuers, which may also be considered counterparties as trading partners in other transactions. This may increase the risk of loss in the event of default or bankruptcy by the counterparty or if the counterparty otherwise fails to meet its contractual obligations. The Portfolio’s subadviser attempts to mitigate counterparty risk by (i) periodically assessing the creditworthiness of its trading partners, (ii) monitoring and/or limiting the amount of its net exposure to each individual counterparty based on its assessment and (iii) requiring collateral from the counterparty for certain transactions. Market events and changes in overall economic conditions may impact the assessment of such counterparty risk by the subadviser. In addition, declines in the values of underlying collateral received may expose the Portfolio to increased risk of loss.
With exchange traded and centrally cleared derivatives, there is less counterparty risk to the Portfolio since the exchange or clearinghouse, as counterparty to such instruments, guarantees against a possible default. The clearinghouse stands between the buyer and the seller of the contract; therefore, the credit risk is limited to failure of the clearinghouse. While offset rights may exist under applicable law, the Portfolio does not have a contractual right of offset against a clearing broker or clearinghouse in the event of a default of the clearing broker or clearinghouse.
The Portfolio has entered into master agreements, such as an International Swaps and Derivatives Association, Inc. Master Agreement (“ISDA Master Agreement”) or similar agreement, with certain of its derivative counterparties that govern over-the-counter (“OTC”) derivatives and provide for general obligations, representations, agreements, collateral posting terms, netting provisions in the event of default or termination and credit related contingent features. The credit related contingent features include, but are not limited to, a percentage decrease in the Portfolio’s net assets or net asset value per share over a specified period of time. If these credit related contingent features were triggered, the derivatives counterparty could terminate the positions and demand payment or require additional collateral.
Under an ISDA Master Agreement, the Portfolio may, under certain circumstances, offset with the counterparty certain derivative financial instruments’ payables and/or receivables with collateral held and/or posted and create one single net payment. However, absent an event of default by the counterparty or a termination of the agreement, the terms of the ISDA Master Agreements do not result in an offset of reported amounts of financial assets and financial liabilities in the Statement of Assets and Liabilities across transactions between the Portfolio and the applicable counterparty. The enforceability of the right to offset may vary by jurisdiction.
| | | | | | |
| Western Asset Variable Global High Yield Bond Portfolio 2021 Semi-Annual Report | | | | | 33 | |
Notes to financial statements (unaudited) (cont’d)
Collateral requirements differ by type of derivative. Collateral or margin requirements are set by the broker or exchange clearinghouse for exchange traded derivatives while collateral terms are contract specific for OTC traded derivatives. Cash collateral that has been pledged to cover obligations of the Portfolio under derivative contracts, if any, will be reported separately in the Statement of Assets and Liabilities. Securities pledged as collateral, if any, for the same purpose are noted in the Schedule of Investments.
As of June 30, 2021, the Portfolio held forward foreign currency contracts with credit related contingent features which had a liability position of $48,830. If a contingent feature in the master agreements would have been triggered, the Portfolio would have been required to pay this amount to its derivatives counterparties.
(l) Security transactions and investment income. Security transactions are accounted for on a trade date basis. Interest income (including interest income from payment-in-kind securities), adjusted for amortization of premium and accretion of discount, is recorded on the accrual basis. Dividend income is recorded on the ex-dividend date for dividends received in cash and/or securities. Foreign dividend income is recorded on the ex-dividend date or as soon as practicable after the Portfolio determines the existence of a dividend declaration after exercising reasonable due diligence. The cost of investments sold is determined by use of the specific identification method. To the extent any issuer defaults or a credit event occurs that impacts the issuer, the Portfolio may halt any additional interest income accruals and consider the realizability of interest accrued up to the date of default or credit event.
(m) Distributions to shareholders. Distributions from net investment income and distributions of net realized gains, if any, are declared at least annually. Distributions to shareholders of the Portfolio are recorded on the ex-dividend date and are determined in accordance with income tax regulations, which may differ from GAAP.
(n) Share class accounting. Investment income, common expenses and realized/ unrealized gains (losses) on investments are allocated to the various classes of the Portfolio on the basis of daily net assets of each class. Fees relating to a specific class are charged directly to that share class.
(o) Compensating balance arrangements. The Portfolio has an arrangement with its custodian bank whereby a portion of the custodian’s fees is paid indirectly by credits earned on the Portfolio’s cash on deposit with the bank.
| | | | |
34 | | | | Western Asset Variable Global High Yield Bond Portfolio 2021 Semi-Annual Report |
(p) Federal and other taxes. It is the Portfolio’s policy to comply with the federal income and excise tax requirements of the Internal Revenue Code of 1986 (the “Code”), as amended, applicable to regulated investment companies. Accordingly, the Portfolio intends to distribute its taxable income and net realized gains, if any, to shareholders in accordance with timing requirements imposed by the Code. Therefore, no federal or state income tax provision is required in the Portfolio’s financial statements.
Management has analyzed the Portfolio’s tax positions taken on income tax returns for all open tax years and has concluded that as of December 31, 2020, no provision for income tax is required in the Portfolio’s financial statements. The Portfolio’s federal and state income and federal excise tax returns for tax years for which the applicable statutes of limitations have not expired are subject to examination by the Internal Revenue Service and state departments of revenue.
Under the applicable foreign tax laws, a withholding tax may be imposed on interest, dividends and capital gains at various rates. Realized gains upon disposition of securities issued in or by certain foreign countries are subject to capital gains tax imposed by those countries.
(q) Reclassification. GAAP requires that certain components of net assets be reclassified to reflect permanent differences between financial and tax reporting. These reclassifications have no effect on net assets or net asset value per share.
2. Investment management agreement and other transactions with affiliates
Legg Mason Partners Fund Advisor, LLC (“LMPFA”) is the Portfolio’s investment manager. Western Asset Management Company, LLC (“Western Asset”), Western Asset Management Company Limited (“Western Asset London”) and Western Asset Management Company Pte. Ltd. (“Western Asset Singapore”) are the Portfolio’s subadvisers. LMPFA, Western Asset, Western Asset London and Western Asset Singapore are indirect, wholly-owned subsidiaries of Franklin Resources, Inc. (“Franklin Resources”).
Under the investment management agreement, the Portfolio pays an investment management fee, calculated daily and paid monthly, at an annual rate of 0.70% of the Portfolio’s average daily net assets.
LMPFA provides administrative and certain oversight services to the Portfolio. LMPFA delegates to Western Asset the day-to-day portfolio management of the Portfolio. Western Asset London and Western Asset Singapore provide certain subadvisory services to the Portfolio relating to currency transactions and investments in non-U.S. dollar denominated securities and related foreign currency instruments. For its services, LMPFA pays Western Asset a fee monthly, at an annual rate equal to 70% of the net management fee it receives from the Portfolio. In turn, Western Asset pays Western Asset London and Western Asset Singapore a monthly subadvisory fee in an amount equal to 100% of the management fee paid to Western Asset on the assets that Western Asset allocates to each such non-U.S. subadviser to manage.
| | | | | | |
| Western Asset Variable Global High Yield Bond Portfolio 2021 Semi-Annual Report | | | | | 35 | |
Notes to financial statements (unaudited) (cont’d)
As a result of expense limitation arrangements between the Portfolio and LMPFA, the ratio of total annual fund operating expenses, other than interest, brokerage, taxes, extraordinary expenses and acquired fund fees and expenses, to average net assets of Class I and Class II shares did not exceed 0.90% and 1.15%, respectively. These expense limitation arrangements cannot be terminated prior to December 31, 2022 without the Board of Trustees’ consent. In addition, the manager has agreed to waive the Portfolio’s management fee to an extent sufficient to offset the net management fee payable in connection with any investment in an affiliated money market fund (the “affiliated money market fund waiver”). The affiliated money market fund waiver is not subject to the recapture provision discussed below.
During the six months ended June 30, 2021, fees waived and/or expenses reimbursed amounted to $265, all of which was an affiliated money market fund waiver.
LMPFA is permitted to recapture amounts waived and/or reimbursed to a class within two years after the fiscal year in which LMPFA earned the fee or incurred the expense if the class’ total annual fund operating expenses have fallen to a level below the expense limitation (“expense cap”) in effect at the time the fees were earned or the expenses incurred. In no case will LMPFA recapture any amount that would result, on any particular business day of the Portfolio, in the class’ total annual fund operating expenses exceeding the expense cap or any other lower limit then in effect.
Pursuant to these arrangements, at June 30, 2021, the Fund had no remaining fee waivers and/or expense reimbursements subject to recapture by LMPFA. For the six months ended June 30, 2021, LMPFA did not recapture any fees.
Legg Mason Investor Services, LLC (“LMIS”) serves as the Portfolio’s sole and exclusive distributor. LMIS is an indirect, wholly-owned broker-dealer subsidiary of Franklin Resources. As of July 7, 2021, LMIS was renamed Franklin Distributors, LLC.
All officers and one Trustee of the Trust are employees of Franklin Resources or its affiliates and do not receive compensation from the Trust.
3. Investments
During the six months ended June 30, 2021, the aggregate cost of purchases and proceeds from sales of investments (excluding short-term investments) and U.S. Government & Agency Obligations were as follows:
| | | | | | | | |
| | | Investments | | | U.S. Government &
Agency Obligations | |
| Purchases | | $ | 85,929,495 | | | $ | 1,973,486 | |
| Sales | | | 77,407,554 | | | | 3,809,555 | |
| | | | |
36 | | | | Western Asset Variable Global High Yield Bond Portfolio 2021 Semi-Annual Report |
At June 30, 2021, the aggregate cost of investments and the aggregate gross unrealized appreciation and depreciation of investments for federal income tax purposes were substantially as follows:
| | | | | | | | | | | | | | | | |
| | | Cost | | | Gross
Unrealized
Appreciation | | | Gross
Unrealized
Depreciation | | | Net
Unrealized
Appreciation | |
Securities | | $ | 161,848,017 | | | $ | 8,033,591 | | | $ | (3,573,172) | | | $ | 4,460,419 | |
| Futures contracts | | | — | | | | 113,839 | | | | (70,485) | | | | 43,354 | |
| Forward foreign currency contracts | | | — | | | | 50,695 | | | | (48,830) | | | | 1,865 | |
4. Derivative instruments and hedging activities
Below is a table, grouped by derivative type, that provides information about the fair value and the location of derivatives within the Statement of Assets and Liabilities at June 30, 2021.
| | | | |
| ASSET DERIVATIVES1 | |
| | | Foreign
Exchange Risk | |
| Futures contracts2 | | $ | 113,839 | |
| Forward foreign currency contracts | | | 50,695 | |
| Total | | $ | 164,534 | |
| | | | | | | | | | | | |
| LIABILITY DERIVATIVES1 | |
| | | Interest Rate Risk | | | Foreign Exchange Risk | | | Total | |
| Futures contracts2 | | $ | 70,485 | | | | — | | | $ | 70,485 | |
| Forward foreign currency contracts | | | — | | | $ | 48,830 | | | | 48,830 | |
| Total | | $ | 70,485 | | | $ | 48,830 | | | $ | 119,315 | |
| 1 | Generally, the balance sheet location for asset derivatives is receivables/net unrealized appreciation and for liability derivatives is payables/net unrealized depreciation. |
| 2 | Includes cumulative unrealized appreciation (depreciation) of futures contracts as reported in the Schedule of Investments. Only net variation margin is reported within the receivables and/or payables on the Statement of Assets and Liabilities. |
| | | | | | |
| Western Asset Variable Global High Yield Bond Portfolio 2021 Semi-Annual Report | | | | | 37 | |
Notes to financial statements (unaudited) (cont’d)
The following tables provide information about the effect of derivatives and hedging activities on the Portfolio’s Statement of Operations for the six months ended June 30, 2021. The first table provides additional detail about the amounts and sources of gains (losses) realized on derivatives during the period. The second table provides additional information about the change in unrealized appreciation (depreciation) resulting from the Portfolio’s derivatives and hedging activities during the period.
| | | | |
| AMOUNT OF REALIZED GAIN (LOSS) ON DERIVATIVES RECOGNIZED | |
| | | Foreign
Exchange Risk | |
| Futures contracts | | $ | 4,253 | |
| Forward foreign currency contracts | | | (182,879) | |
| Total | | $ | (178,626) | |
| | | | | | | | | | | | |
| CHANGE IN UNREALIZED APPRECIATION (DEPRECIATION) ON DERIVATIVES RECOGNIZED | |
| | | Interest Rate Risk | | | Foreign Exchange Risk | | | Total | |
| Futures contracts | | $ | (70,485) | | | $ | 139,523 | | | $ | 69,038 | |
| Forward foreign currency contracts | | | — | | | | 131,190 | | | | 131,190 | |
| Total | | $ | (70,485) | | | $ | 270,713 | | | $ | 200,228 | |
During the six months ended June 30, 2021, the volume of derivative activity for the Portfolio was as follows:
| | | | |
| | | Average Market
Value | |
| Futures contracts (to sell) | | $ | 5,958,021 | |
| Forward foreign currency contracts (to buy) | | | 2,085,700 | |
| Forward foreign currency contracts (to sell) | | | 4,543,340 | |
The following table presents the Portfolio’s OTC derivative assets and liabilities by counterparty net of amounts available for offset under an ISDA Master Agreement and net of the related collateral pledged (received) by the Portfolio as of June 30, 2021.
| | | | | | | | | | | | | | | | | | | | |
| Counterparty | | Gross Assets
Subject to
Master
Agreements1 | | | Gross
Liabilities
Subject to
Master
Agreements1 | | | Net Assets
(Liabilities)
Subject to
Master
Agreements | | | Collateral
Pledged
(Received) | | | Net
Amount2 | |
| Citibank N.A. | | $ | 32,572 | | | $ | (16,060) | | | $ | 16,512 | | | | — | | | $ | 16,512 | |
| Goldman Sachs Group Inc. | | | — | | | | (32,770) | | | | (32,770) | | | | — | | | | (32,770) | |
| JPMorgan Chase & Co. | | | 18,123 | | | | — | | | | 18,123 | | | | — | | | | 18,123 | |
| Total | | $ | 50,695 | | | $ | (48,830) | | | $ | 1,865 | | | | — | | | $ | 1,865 | |
| 1 | Absent an event of default or early termination, derivative assets and liabilities are presented gross and not offset in the Statement of Assets and Liabilities. |
| 2 | Represents the net amount receivable (payable) from (to) the counterparty in the event of default. |
| | | | |
38 | | | | Western Asset Variable Global High Yield Bond Portfolio 2021 Semi-Annual Report |
5. Class specific expenses, waivers and/or expense reimbursements
The Portfolio has adopted a Rule 12b-1 shareholder services and distribution plan and under that plan the Portfolio pays service and/or distribution fees with respect to its Class II shares calculated at the annual rate of 0.25% of the average daily net assets of the class. Service and/or distribution fees are accrued daily and paid monthly.
For the six months ended June 30, 2021, class specific expenses were as follows:
| | | | | | | | |
| | | Service and/or
Distribution Fees | | | Transfer Agent
Fees | |
| Class I | | | — | | | $ | 1,276 | |
| Class II | | $ | 68,469 | | | | 586 | |
| Total | | $ | 68,469 | | | $ | 1,862 | |
For the six months ended June 30, 2021, waivers and/or expense reimbursements by class were as follows:
| | | | |
| | | Waivers/
Expense
Reimbursements | |
| Class I | | $ | 174 | |
| Class II | | | 91 | |
| Total | | $ | 265 | |
| | |
| 6. Distributions to shareholders by class |
| | | | | | | | |
| | | Six Months Ended June 30, 2021 | | | Year Ended
December 31, 2020 | |
| Net Investment Income: | | | | | | | | |
| Class I | | | — | | | $ | $3,949,951 | |
| Class II | | | — | | | | 1,701,754 | |
| Total | | | — | | | $ | 5,651,705 | |
| | |
| Return of Capital: | | | | | | | | |
| Class I | | | — | | | $ | 19,782 | |
| Class II | | | — | | | | 8,523 | |
| Total | | | — | | | $ | 28,305 | |
7. Shares of beneficial interest
At June 30, 2021, the Trust had an unlimited number of shares of beneficial interest authorized with a par value of $0.00001 per share. The Portfolio has the ability to issue multiple classes of shares. Each class of shares represents an identical interest and has the same rights, except that each class bears certain direct expenses, including those specifically related to the distribution of its shares.
| | | | | | |
| Western Asset Variable Global High Yield Bond Portfolio 2021 Semi-Annual Report | | | | | 39 | |
Notes to financial statements (unaudited) (cont’d)
Transactions in shares of each class were as follows:
| | | | | | | | | | | | | | | | |
| | | Six Months Ended
June 30, 2021 | | | Year Ended
December 31, 2020 | |
| | | Shares | | | Amount | | | Shares | | | Amount | |
| Class I | | | | | | | | | | | | | | | | |
| Shares sold | | | 3,814,198 | | | $ | 28,686,888 | | | | 2,961,843 | | | $ | 20,487,608 | |
| Shares issued on reinvestment | | | — | | | | — | | | | 538,752 | | | | 3,969,733 | |
| Shares repurchased | | | (4,113,699) | | | | (30,944,146) | | | | (4,677,419) | | | | (32,859,673) | |
| Net decrease | | | (299,501) | | | $ | (2,257,258) | | | | (1,176,824) | | | $ | (8,402,332) | |
| | | | |
| Class II | | | | | | | | | | | | | | | | |
| Shares sold | | | 1,494,868 | | | $ | 11,503,139 | | | | 2,673,959 | | | $ | 19,713,632 | |
| Shares issued on reinvestment | | | — | | | | — | | | | 224,490 | | | | 1,710,277 | |
| Shares repurchased | | | (541,799) | | | | (4,158,636) | | | | (2,046,988) | | | | (14,624,586) | |
| Net increase | | | 953,069 | | | $ | 7,344,503 | | | | 851,461 | | | $ | 6,799,323 | |
8. Transactions with affiliated company
As defined by the 1940 Act, an affiliated company is one in which the Portfolio owns 5% or more of the outstanding voting securities, or a company which is under common ownership or control with the Portfolio. The following company was considered an affiliated company for all or some portion of the six months ended June 30, 2021. The following transactions were effected in such company for the six months ended June 30, 2021.
| | | | | | | | | | | | | | | | | | | | |
| | | Affiliate
Value at
December 31, 2020 | | | Purchased | | | Sold | |
| | | Cost | | | Shares | | | Cost | | | Shares | |
| Western Asset Premier Institutional Government Reserves, Premium Shares | | $ | 670,225 | | | $ | 59,907,386 | | | | 59,907,386 | | | $ | 52,254,624 | | | | 52,254,624 | |
| | | | | | | | | | | | | | | | |
| (cont’d) | | Realized
Gain (Loss) | | | Interest
Income | | | Net Increase
(Decrease) in
Unrealized
Appreciation
(Depreciation) | | | Affiliate
Value at
June 30,
2021 | |
| Western Asset Premier Institutional Government Reserves, Premium Shares | | | — | | | $ | 86 | | | | — | | | $ | 8,322,987 | |
9. Redemption facility
Effective February 5, 2021, the Portfolio’s redemption facility (the “Redemption Facility”) was terminated and the Portfolio and certain other participating funds within the Trust, together with other U.S. registered and foreign investment funds (collectively, the
| | | | |
40 | | | | Western Asset Variable Global High Yield Bond Portfolio 2021 Semi-Annual Report |
“Borrowers”) managed by LMPFA or Franklin Resources, became borrowers in a joint syndicated senior unsecured credit facility totaling $2.675 billion (the “Global Credit Facility”). The Global Credit Facility provides a source of funds to the Borrowers for temporary and emergency purposes, including the ability to meet future unanticipated or unusually large redemption requests. Unless renewed, the Global Credit Facility will terminate on February 4, 2022.
Under the terms of the Global Credit Facility, the Portfolio shall, in addition to interest charged on any borrowings made by the Portfolio and other costs incurred by the Portfolio, pay its share of fees and expenses incurred in connection with the implementation and maintenance of the Global Credit Facility, based upon its relative share of the aggregate net assets of all the Borrowers, including an annual commitment fee of 0.15% based upon the unused portion of the Global Credit Facility; there is no upfront fee. Under the Redemption Facility, the Portfolio had access to the aggregate amount of $485 million prior to February 5, 2021 and the following terms were in effect: the annual commitment fee to maintain the Redemption Facility was 0.15% incurred on the unused portion of the facility and there was an annual upfront fee of 0.06%. The aggregate commitment fees under the Global Credit Facility and Redemption Facility are reflected in the Statement of Operations. The Portfolio did not utilize the Global Credit Facility nor the Redemption Facility during the six months ended June 30, 2021.
10. Deferred capital losses
As of December 31, 2020, the Portfolio had deferred capital losses of $18,957,792, which have no expiration date, that will be available to offset future taxable capital gains.
11. Recent accounting pronouncement
In March 2020, the Financial Accounting Standards Board issued Accounting Standards Update No. 2020-04, Reference Rate Reform (Topic 848) – Facilitation of the Effects of Reference Rate Reform on Financial Reporting (the “ASU”). The amendments in the ASU provide optional temporary financial reporting relief from the effect of certain types of contract modifications due to the planned discontinuation of the London Interbank Offered Rate and other interbank-offered based reference rates as of the end of 2021. The ASU is effective for certain reference rate-related contract modifications that occur during the period March 12, 2020 through December 31, 2022. Management has reviewed the requirements and believes the adoption of this ASU will not have a material impact on the financial statements.
12. Other matters
The outbreak of the respiratory illness COVID-19 (commonly referred to as “coronavirus”) has continued to rapidly spread around the world, causing considerable uncertainty for the global economy and financial markets. The ultimate economic fallout from the pandemic, and the long-term impact on economies, markets, industries and individual issuers, are not
| | | | | | |
| Western Asset Variable Global High Yield Bond Portfolio 2021 Semi-Annual Report | | | | | 41 | |
Notes to financial statements (unaudited) (cont’d)
known. The COVID-19 pandemic could adversely affect the value and liquidity of the Portfolio’s investments, impair the Portfolio’s ability to satisfy redemption requests, and negatively impact the Portfolio’s performance. In addition, the outbreak of COVID-19, and measures taken to mitigate its effects, could result in disruptions to the services provided to the Portfolio by its service providers.
* * *
The Portfolio’s investments, payment obligations, and financing terms may be based on floating rates, such as the London Interbank Offered Rate, or “LIBOR,” which is the offered rate for short-term Eurodollar deposits between major international banks. On March 5, 2021, the ICE Benchmark Administration, the administrator of LIBOR, stated that it will cease the publication of (i) the overnight and one-, three-, six- and twelve-month USD LIBOR settings immediately following the LIBOR publication on Friday, June 30, 2023 and (ii) all other LIBOR settings, including the one-week and two-month USD LIBOR settings, immediately following the LIBOR publication on Friday, December 31, 2021. There remains uncertainty regarding the nature of any replacement rate and the impact of the transition from LIBOR on the Portfolio’s transactions and the financial markets generally. As such, the potential effect of a transition away from LIBOR on the Portfolio or the Portfolio’s investments cannot yet be determined.
| | | | |
42 | | | | Western Asset Variable Global High Yield Bond Portfolio 2021 Semi-Annual Report |
Western Asset
Variable Global High Yield Bond Portfolio
Trustees
Robert Abeles, Jr.
Jane F. Dasher
Anita L. DeFrantz
Susan B. Kerley
Michael Larson
Ronald L. Olson
Avedick B. Poladian
William E.B. Siart
Chairman
Jaynie M. Studenmund
Peter J. Taylor
Jane Trust
Investment manager
Legg Mason Partners Fund Advisor, LLC
Subadvisers
Western Asset Management Company, LLC
Western Asset Management Company Limited
Western Asset Management Company Pte. Ltd.
Distributor
Franklin Distributors, LLC†
| † | Effective July 7, 2021, LMIS was renamed Franklin Distributors, LLC. |
Custodian
The Bank of New York Mellon
Transfer agent
BNY Mellon Investment Servicing (US) Inc.
4400 Computer Drive
Westborough, MA 01581
Independent registered public accounting firm
PricewaterhouseCoopers LLP
Baltimore, MD
Western Asset Variable Global High Yield Bond Portfolio
The Portfolio is a separate investment series of Legg Mason Partners Variable Income Trust, a Maryland statutory trust.
Western Asset Variable Global High Yield Bond Portfolio
Legg Mason Funds
620 Eighth Avenue, 47th Floor
New York, NY 10018
The Portfolio files its complete schedule of portfolio holdings with the Securities and Exchange Commission (“SEC”) for the first and third quarters of each fiscal year as an exhibit to its reports on Form N-PORT. The Portfolio’s Forms N-PORT are available on the SEC’s website at www.sec.gov. To obtain information on Form N-PORT, shareholders can call the Portfolio at 1-877-721-1926.
Information on how the Portfolio voted proxies relating to portfolio securities during the prior 12-month period ended June 30th of each year and a description of the policies and procedures that the Portfolio uses to determine how to vote proxies related to portfolio transactions are available (1) without charge, upon request, by calling the Portfolio at 1-877-721-1926, (2) at www.leggmason.com/variablefunds and (3) on the SEC’s website at www.sec.gov.
This report is submitted for the general information of the shareholders of Western Asset Variable Global High Yield Bond Portfolio. This report is not authorized for distribution to prospective investors in the Portfolio unless preceded or accompanied by a current prospectus.
Investors should consider the Portfolio’s investment objectives, risks, charges and expenses carefully before investing. The prospectus contains this and other important information about the Portfolio. Please read the prospectus carefully before investing.
www.leggmason.com
© 2021 Franklin Distributors, LLC,
Member FINRA/SIPC. All rights reserved.
Legg Mason Funds Privacy and Security Notice
Your Privacy and the Security of Your Personal Information is Very Important to the Legg Mason Funds
This Privacy and Security Notice (the “Privacy Notice”) addresses the Legg Mason Funds’ privacy and data protection practices with respect to nonpublic personal information the Funds receive. The Legg Mason Funds include any funds sold by the Funds’ distributor, Franklin Distributors, LLC, as well as Legg Mason-sponsored closed-end funds. The provisions of this Privacy Notice apply to your information both while you are a shareholder and after you are no longer invested with the Funds.
The Type of Nonpublic Personal Information the Funds Collect About You
The Funds collect and maintain nonpublic personal information about you in connection with your shareholder account. Such information may include, but is not limited to:
| • | | Personal information included on applications or other forms; |
| • | | Account balances, transactions, and mutual fund holdings and positions; |
| • | | Bank account information, legal documents, and identity verification documentation; |
| • | | Online account access user IDs, passwords, security challenge question responses; and |
| • | | Information received from consumer reporting agencies regarding credit history and creditworthiness (such as the amount of an individual’s total debt, payment history, etc.). |
How the Funds Use Nonpublic Personal Information About You
The Funds do not sell or share your nonpublic personal information with third parties or with affiliates for their marketing purposes, or with other financial institutions or affiliates for joint marketing purposes, unless you have authorized the Funds to do so. The Funds do not disclose any nonpublic personal information about you except as may be required to perform transactions or services you have authorized or as permitted or required by law.
The Funds may disclose information about you to:
| • | | Employees, agents, and affiliates on a “need to know” basis to enable the Funds to conduct ordinary business, or to comply with obligations to government regulators; |
| • | | Service providers, including the Funds’ affiliates, who assist the Funds as part of the ordinary course of business (such as printing, mailing services, or processing or servicing your account with us) or otherwise perform services on the Funds’ behalf, including companies that may perform statistical analysis, market research and marketing services solely for the Funds; |
| • | | Permit access to transfer, whether in the United States or countries outside of the United States to such Funds’ employees, agents and affiliates and service providers as required to enable the Funds to conduct ordinary business, or to comply with obligations to government regulators; |
| • | | The Funds’ representatives such as legal counsel, accountants and auditors to enable the Funds to conduct ordinary business, or to comply with obligations to government regulators; |
| • | | Fiduciaries or representatives acting on your behalf, such as an IRA custodian or trustee of a grantor trust. |
|
| NOT PART OF THE SEMI-ANNUAL REPORT |
Legg Mason Funds Privacy and Security Notice (cont’d)
Except as otherwise permitted by applicable law, companies acting on the Funds’ behalf, including those outside the United States, are contractually obligated to keep nonpublic personal information the Funds provide to them confidential and to use the information the Funds share only to provide the services the Funds ask them to perform. The Funds may disclose nonpublic personal information about you when necessary to enforce their rights or protect against fraud, or as permitted or required by applicable law, such as in connection with a law enforcement or regulatory request, subpoena, or similar legal process. In the event of a corporate action or in the event a Fund service provider changes, the Funds may be required to disclose your nonpublic personal information to third parties. While it is the Funds’ practice to obtain protections for disclosed information in these types of transactions, the Funds cannot guarantee their privacy policy will remain unchanged.
Keeping You Informed of the Funds’ Privacy and Security Practices
The Funds will notify you annually of their privacy policy as required by federal law. While the Funds reserve the right to modify this policy at any time they will notify you promptly if this privacy policy changes.
The Funds’ Security Practices
The Funds maintain appropriate physical, electronic and procedural safeguards designed to guard your nonpublic personal information. The Funds’ internal data security policies restrict access to your nonpublic personal information to authorized employees, who may use your nonpublic personal information for Fund business purposes only.
Although the Funds strive to protect your nonpublic personal information, they cannot ensure or warrant the security of any information you provide or transmit to them, and you do so at your own risk. In the event of a breach of the confidentiality or security of your nonpublic personal information, the Funds will attempt to notify you as necessary, so you can take appropriate protective steps. If you have consented to the Funds using electronic communications or electronic delivery of statements, they may notify you under such circumstances using the most current email address you have on record with them.
In order for the Funds to provide effective service to you, keeping your account information accurate is very important. If you believe that your account information is incomplete, not accurate or not current, if you have questions about the Funds’ privacy practices, or our use of your nonpublic personal information, write the Funds using the contact information on your account statements, email the Funds by clicking on the Contact Us section of the Funds’ website at www.leggmason.com, or contact the Fund at 1-877-721-1926.
Revised April 2018
Legg Mason California Consumer Privacy Act Policy
Although much of the personal information we collect is “nonpublic personal information” subject to federal law, residents of California may, in certain circumstances, have additional rights under the California Consumer Privacy Act (“CCPA”). For example, if you are a broker,
|
| NOT PART OF THE SEMI-ANNUAL REPORT |
Legg Mason Funds Privacy and Security Notice (cont’d)
dealer, agent, fiduciary, or representative acting by or on behalf of, or for, the account of any other person(s) or household, or a financial advisor, or if you have otherwise provided personal information to us separate from the relationship we have with personal investors, the provisions of this Privacy Policy apply to your personal information (as defined by the CCPA).
| • | | In addition to the provisions of the Legg Mason Funds Security and Privacy Notice, you may have the right to know the categories and specific pieces of personal information we have collected about you. |
| • | | You also have the right to request the deletion of the personal information collected or maintained by the Funds. |
If you wish to exercise any of the rights you have in respect of your personal information, you should advise the Funds by contacting them as set forth below. The rights noted above are subject to our other legal and regulatory obligations and any exemptions under the CCPA. You may designate an authorized agent to make a rights request on your behalf, subject to the identification process described below. We do not discriminate based on requests for information related to our use of your personal information, and you have the right not to receive discriminatory treatment related to the exercise of your privacy rights.
We may request information from you in order to verify your identity or authority in making such a request. If you have appointed an authorized agent to make a request on your behalf, or you are an authorized agent making such a request (such as a power of attorney or other written permission), this process may include providing a password/passcode, a copy of government issued identification, affidavit or other applicable documentation, i.e. written permission. We may require you to verify your identity directly even when using an authorized agent, unless a power of attorney has been provided. We reserve the right to deny a request submitted by an agent if suitable and appropriate proof is not provided.
For the 12-month period prior to the date of this Privacy Policy, the Legg Mason Funds have not sold any of your personal information; nor do we have any plans to do so in the future.
Contact Information
Address: Data Privacy Officer, 100 International Dr., Baltimore, MD 21202
Email: DataProtectionOfficer@franklintempleton.com
Phone: 1-800-396-4748
Revised October 2020
|
| NOT PART OF THE SEMI-ANNUAL REPORT |
www.leggmason.com
© 2021 Franklin Distributors, LLC,
FDXX010090 8/21 SR21-4213
Not applicable.
| ITEM 3. | AUDIT COMMITTEE FINANCIAL EXPERT. |
Not applicable.
| ITEM 4. | PRINCIPAL ACCOUNTANT FEES AND SERVICES. |
Not applicable.
| ITEM 5. | AUDIT COMMITTEE OF LISTED REGISTRANTS. |
Not applicable.
| ITEM 6. | SCHEDULE OF INVESTMENTS. |
Included herein under Item 1.
| ITEM 7. | DISCLOSURE OF PROXY VOTING POLICIES AND PROCEDURES FOR CLOSED-END MANAGEMENT INVESTMENT COMPANIES. |
Not applicable.
| ITEM 8. | PORTFOLIO MANAGERS OF CLOSED-END MANAGEMENT INVESTMENT COMPANIES. |
Not applicable.
| ITEM 9. | PURCHASES OF EQUITY SECURITIES BY CLOSED-END MANAGEMENT INVESTMENT COMPANY AND AFFILIATED PURCHASERS. |
Not applicable.
| ITEM 10. | SUBMISSION OF MATTERS TO A VOTE OF SECURITY HOLDERS. |
Not applicable.
| ITEM 11. | CONTROLS AND PROCEDURES. |
| | (a) | The registrant’s principal executive officer and principal financial officer have concluded that the registrant’s disclosure controls and procedures (as defined in Rule 30a- 3(c) under the Investment Company Act of 1940, as amended (the “1940 Act”)) are effective as of a date within 90 days of the filing date of this report that includes the disclosure required by this paragraph, based on their evaluation of the disclosure controls and procedures required by Rule 30a-3(b) under the 1940 Act and 15d-15(b) under the Securities Exchange Act of 1934. |
| | (b) | There were no changes in the registrant’s internal control over financial reporting (as defined in Rule 30a-3(d) under the 1940 Act) that occurred during the second fiscal quarter of the period covered by this report that have materially affected, or are likely to materially affect the registrant’s internal control over financial reporting. |
| ITEM 12. | DISCLOSURE OF SECURITIES LENDING ACTIVITIES FOR CLOSED-END MANAGEMENT INVESTMENT COMPANIES. |
Not applicable
(a) (1) Not applicable.
Exhibit 99.CODE ETH
(a) (2) Certifications pursuant to section 302 of the Sarbanes-Oxley Act of 2002 attached hereto.
Exhibit 99.CERT
(b) Certifications pursuant to Section 906 of the Sarbanes-Oxley Act of 2002 attached hereto.
Exhibit 99.906CERT
SIGNATURES
Pursuant to the requirements of the Securities Exchange Act of 1934 and the Investment Company Act of 1940, the registrant has duly caused this Report to be signed on its behalf by the undersigned, there unto duly authorized.
Legg Mason Partners Variable Income Trust
| | |
| By: | | /s/Jane Trust |
| | Jane Trust |
| | Chief Executive Officer |
| |
| Date: | | August 19, 2021 |
Pursuant to the requirements of the Securities Exchange Act of 1934 and the Investment Company Act of 1940, this report has been signed below by the following persons on behalf of the registrant and in the capacities and on the dates indicated.
| | |
| By: | | /s/Jane Trust |
| | Jane Trust |
| | Chief Executive Officer |
| |
| Date: | | August 19, 2021 |
| | |
| |
| By: | | /s/Christopher Berarducci |
| | Christopher Berarducci |
| | Principal Financial Officer |
| |
| Date: | | August 19, 2021 |