UNITED STATES
SECURITIES AND EXCHANGE COMMISSION
Washington, D.C. 20549
FORM N-CSR
CERTIFIED SHAREHOLDER REPORT OF REGISTERED
MANAGEMENT INVESTMENT COMPANIES
Investment Company Act file number 811-06310
Legg Mason Partners Variable Income Trust
(Exact name of registrant as specified in charter)
620 Eighth Avenue, 47th Floor, New York, NY 10018
(Address of principal executive offices) (Zip code)
Marc A. De Oliveira
Franklin Templeton
100 First Stamford Place
Stamford, CT 06902
(Name and address of agent for service)
Registrant’s telephone number, including area code: 877-6LM-FUND/656-3863
Date of fiscal year end: December 31
Date of reporting period: June 30, 2023
| ITEM 1. | REPORT TO STOCKHOLDERS. |
The Semi-Annual Report to Stockholders is filed herewith.

| | |
Semi-Annual Report | | June 30, 2023 |
WESTERN ASSET
LONG CREDIT VIT
The Securities and Exchange Commission has adopted new regulations that will result in changes to the design and delivery of annual and semi-annual shareholder reports beginning in July 2024.
If you have previously elected to receive shareholder reports electronically, you will continue to do so and need not take any action.
Otherwise, paper copies of the Fund’s shareholder reports will be mailed to you beginning in July 2024. If you would like to receive shareholder reports and other communications from the Fund electronically instead of by mail, you may make that request at any time by contacting your insurance company or your financial intermediary (such as a broker-dealer or bank).

|
| INVESTMENT PRODUCTS: NOT FDIC INSURED • NO BANK GUARANTEE • MAY LOSE VALUE |
Portfolio objective
The Portfolio seeks total return consistent with prudent investment management.
Letter from the president

Dear Shareholder,
We are pleased to provide the semi-annual report of Western Asset Long Credit VIT for the period since the Portfolio’s inception on May 1, 2023 through June 30, 2023. Please read on for Portfolio performance information during the Portfolio’s reporting period.
As always, we remain committed to providing you with excellent service and a full spectrum of investment choices. We also remain committed to supplementing the support you receive from your financial advisor. One way we accomplish this is through our website, www.franklintempleton.com. Here you can gain immediate access to market and investment information, including:
| • | | Market insights and commentaries from our portfolio managers, and |
| • | | A host of educational resources. |
We look forward to helping you meet your financial goals.
Sincerely,

Jane Trust, CFA
President and Chief Executive Officer
July 31, 2023
| | |
II | | Western Asset Long Credit VIT |
Performance review
For the two months ended June 30, 2023, Class I shares of Western Asset Long Credit VIT1 returned -1.61%. The Portfolio’s unmanaged benchmarks, the Bloomberg U.S. Long Credit Indexi and the Custom Benchmarkii, returned -0.61% and -0.76%, respectively, over the same time frame.
| | | | |
| Performance Snapshot as of June 30, 2023 (unaudited) | |
| | | Since Portfolio Inception* | |
| Western Asset Long Credit VIT: | | | | |
Class I | | | -1.61 | % |
| Bloomberg U.S. Long Credit Index | | | -0.61 | % |
| Custom Benchmark | | | -0.76 | % |
The performance shown represents past performance. Past performance is no guarantee of future results and current performance may be higher or lower than the performance shown above. Principal value, investment returns and yields will fluctuate and investors’ shares, when redeemed, may be worth more or less than their original cost.
Share class return assumes the reinvestment of all distributions, including returns of capital, if any, at net asset value and the deduction of all Portfolio expenses. Performance figures for periods shorter than one year represent cumulative figures and are not annualized.
Portfolio performance figures reflect fee waivers and/or expense reimbursements, without which the performance would have been lower.
The 30-Day SEC Yield for the period ended June 30, 2023, for Class I shares were 5.51%. Absent fee waiver and/or expense reimbursements, the 30-Day SEC Yield for Class I shares would have been 5.34%. The 30-Day SEC Yield, calculated pursuant to the standard SEC formula, is based on the Portfolio’s investments over an annualized trailing 30-day period, and not on the distributions paid by the Portfolio, which may differ.
* The Portfolio’s inception date is May 1, 2023. Performance data is shown as of the date the Portfolio began to invest in accordance with its investment objective and guidelines.
|
| Total Annual Operating Expenses (unaudited) |
As of the Portfolio’s current prospectus dated April 21, 2023, the gross total annual fund operating expense ratio for Class I shares was 0.45%.
Actual expenses may be higher. For example, expenses may be higher than those shown if average net assets decrease. Net assets are more likely to decrease and Portfolio expense ratios are more likely to increase when markets are volatile.
| 1 | The Portfolio is an underlying investment option of various variable annuity and variable life insurance products. The Portfolio’s performance returns do not reflect the deduction of expenses imposed in connection with investing in variable annuity or variable life insurance contracts, such as administrative fees, account charges and surrender charges, which, if reflected, would reduce the performance of the Portfolio. Past performance is no guarantee of future results. |
| | |
| Western Asset Long Credit VIT | | III |
Performance review (cont’d)
As always, thank you for your confidence in our stewardship of your assets.
Sincerely,
Jane Trust, CFA
President and Chief Executive Officer
July 31, 2023
RISKS: Investments in fixed income securities involve a variety of risks, including interest rate, credit, inflation, and reinvestment risks. As interest rates rise, bond prices fall, reducing the value of the Portfolio’s share price. High yield bonds, commonly known as “junk” bonds, are rated below investment grade and carry more risk than higher-rated securities. Asset-backed, mortgaged-backed and mortgage-related securities are subject to prepayment and extension risks. Foreign investments are subject to special risks including currency fluctuations, and social, economic and political uncertainties, which could increase volatility. These risks are magnified in emerging markets. Emerging market countries tend to have economic, political, and legal systems that are less developed and are less stable than those of more developed countries. The Portfolio may use derivatives, such as options, futures, and swaps, which can be illiquid, may disproportionately increase losses and have a potentially large impact on Portfolio performance. The use of leverage may increase volatility and the possibility of loss. The market values of securities or other assets will fluctuate, sometimes sharply and unpredictably, due to changes in general market conditions, overall economic trends or events, governmental actions or intervention, actions taken by the U.S. Federal Reserve or foreign central banks, market disruptions caused by trade disputes or other factors, political developments, armed conflicts, economic sanctions and countermeasures in response to sanctions, major cybersecurity events, investor sentiment, the global and domestic effects of a pandemic, and other factors that may or may not be related to the issuer of the security or other asset. Please see the Portfolio’s prospectus for a more complete discussion of these and other risks and the Portfolio’s investment strategies.
All investments are subject to risk including the possible loss of principal. Past performance is no guarantee of future results. All index performance reflects no deduction for fees, expenses or taxes. Please note that an investor cannot invest directly in an index.
| | |
IV | | Western Asset Long Credit VIT |
| i | The Bloomberg U.S. Long Credit Index measures the performance of investment grade, U.S. dollar-denominated, fixed-rate, taxable corporate and government-related debt with at least ten years to maturity. It is composed of a corporate and a non-corporate component that includes non-U.S. agencies, sovereigns, supranationals and local authorities. |
| ii | The Custom Benchmark is a representation of the performance of the major asset classes in which the Portfolio may typically invest, consisting of 60% Bloomberg U.S. Long Credit Index and 40% Bloomberg U.S. Intermediate Credit Index. The Bloomberg U.S. Intermediate Credit Index measures the investment grade, U.S. dollar-denominated, fixed-rate, taxable corporate and government-related bond markets with a maturity greater than 1 year and less than 10 years. |
| | |
| Western Asset Long Credit VIT | | V |
Portfolio at a glance† (unaudited)
Investment breakdown (%) as a percent of total investments
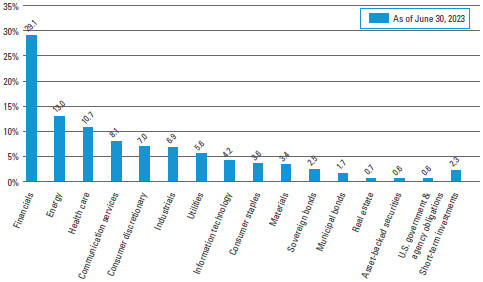
| † | The bar graph above represents the composition of the Portfolio’s investments as of June 30, 2023 and does not include derivatives, such as futures contracts. The Portfolio is actively managed. As a result, the composition of the Portfolio’s investments is subject to change at any time. |
| | |
| Western Asset Long Credit VIT 2023 Semi-Annual Report | | 1 |
Portfolio expenses (unaudited)
Example
As a shareholder of the Portfolio, you may incur two types of costs: (1) transaction costs and (2) ongoing costs, including management fees; and other Portfolio expenses. This example is intended to help you understand your ongoing costs (in dollars) of investing in the Portfolio and to compare these costs with the ongoing costs of investing in other funds.
This example is based on an investment of $1,000 invested on January 1, 2023 and held for the six months ended June 30, 2023, unless otherwise noted.
Actual expenses
The table below titled “Based on actual total return” provides information about actual account values and actual expenses. You may use the information provided in this table, together with the amount you invested, to estimate the expenses that you paid over the period. To estimate the expenses you paid on your account, divide your ending account value by $1,000 (for example, an $8,600 ending account value divided by $1,000 = 8.6), then multiply the result by the number under the heading entitled “Expenses Paid During the Period”.
Hypothetical example for comparison purposes
The table below titled “Based on hypothetical total return” provides information about hypothetical account values and hypothetical expenses based on the actual expense ratio and an assumed rate of return of 5.00% per year before expenses, which is not the Portfolio’s actual return. The hypothetical account values and expenses may not be used to estimate the actual ending account balance or expenses you paid for the period. You may use the information provided in this table to compare the ongoing costs of investing in the Portfolio and other funds. To do so, compare the 5.00% hypothetical example relating to the Portfolio with the 5.00% hypothetical examples that appear in the shareholder reports of the other funds.
Please note that the expenses shown in the table below are meant to highlight your ongoing costs only and do not reflect any transactional costs. Therefore, the table is useful in comparing ongoing costs only, and will not help you determine the relative total costs of owning different funds. In addition, if these transaction costs were included, your costs would have been higher.
| | | | | | | | | | | | | | | | | | | | | | | | | | | | | | | | | | | | | | | | | | | | | | |
| | | |
| Based on actual total return1 | | | | | | | Based on hypothetical total return5 |
| | | Actual Total Return2,3 | | Beginning Account Value | | Ending Account Value | | Annualized Expense Ratio | | Expenses Paid During the Period4 | | | | | | Hypothetical Annualized Total Return | | Beginning Account Value | | Ending Account Value | | Annualized Expense Ratio | | Expenses Paid During the Period6 |
| Class I | | | -1.61 | % | | | $1,000.00 | | | | $983.90 | | | | 0.45 | % | | | $0.75 | | | | | | | Class I | | | 5.00 | % | | | $1,000.00 | | | | $1,022.56 | | | | 0.45 | % | | | $2.26 | |
| | |
2 | | Western Asset Long Credit VIT 2023 Semi-Annual Report |
| 1 | For the period May 1, 2023 (inception date) to June 30, 2023. |
| 2 | Performance data is shown as of the date the Portfolio began to invest in accordance with its investment objective and guidelines. |
| 3 | Assumes the reinvestment of all distributions, including returns of capital, if any, at net asset value. Total return is not annualized, as it may not be representative of the total return for the year. Total returns do not reflect expenses associated with separate accounts such as administrative fees, account charges and surrender charges, which, if reflected, would reduce the total returns. Performance figures may reflect compensating balance arrangements, fee waivers and/or expense reimbursements. In the absence of compensating balance arrangements, fee waivers and/or expense reimbursements, the total return would have been lower. Past performance is no guarantee of future results. |
| 4 | Expenses (net of compensating balance arrangements, fee waivers and/or expense reimbursements) are equal to the class’ annualized expense ratio multiplied by the average account value over the period, multiplied by the number of days in the most recent fiscal period (61), then divided by 365. |
| 5 | For the six months ended June 30, 2023. |
| 6 | Expenses (net of compensating balance arrangements, fee waivers and/or expense reimbursements) are equal to the class’ annualized expense ratio multiplied by the average account value over the period, multiplied by the number of days in the most recent fiscal half-year (181), then divided by 365. |
| | |
| Western Asset Long Credit VIT 2023 Semi-Annual Report | | 3 |
Schedule of investments (unaudited)
June 30, 2023
Western Asset Long Credit VIT
(Percentages shown based on Portfolio net assets)
| | | | | | | | | | | | | | | | |
| Security | | Rate | | | Maturity Date | | | Face Amount | | | Value | |
| Corporate Bonds & Notes — 90.9% | | | | | | | | | | | | | | | | |
| Communication Services — 7.8% | | | | | | | | | | | | | | | | |
Diversified Telecommunication Services — 2.7% | | | | | | | | | | | | | | | | |
AT&T Inc., Senior Notes | | | 1.650 | % | | | 2/1/28 | | | $ | 110,000 | | | $ | 94,594 | |
AT&T Inc., Senior Notes | | | 2.250 | % | | | 2/1/32 | | | | 140,000 | | | | 111,244 | |
AT&T Inc., Senior Notes | | | 6.375 | % | | | 3/1/41 | | | | 50,000 | | | | 53,426 | |
AT&T Inc., Senior Notes | | | 4.800 | % | | | 6/15/44 | | | | 110,000 | | | | 97,312 | |
AT&T Inc., Senior Notes | | | 4.500 | % | | | 3/9/48 | | | | 200,000 | | | | 169,327 | |
AT&T Inc., Senior Notes | | | 3.500 | % | | | 9/15/53 | | | | 500,000 | | | | 354,312 | |
AT&T Inc., Senior Notes | | | 3.550 | % | | | 9/15/55 | | | | 400,000 | | | | 280,320 | |
AT&T Inc., Senior Notes | | | 3.800 | % | | | 12/1/57 | | | | 180,000 | | | | 130,469 | |
British Telecommunications PLC, Senior Notes | | | 9.625 | % | | | 12/15/30 | | | | 40,000 | | | | 49,243 | |
Deutsche Telekom International Finance BV, Senior Notes | | | 8.750 | % | | | 6/15/30 | | | | 80,000 | | | | 95,863 | |
Verizon Communications Inc., Senior Notes | | | 4.125 | % | | | 3/16/27 | | | | 70,000 | | | | 67,997 | |
Verizon Communications Inc., Senior Notes | | | 2.550 | % | | | 3/21/31 | | | | 60,000 | | | | 50,114 | |
Verizon Communications Inc., Senior Notes | | | 5.250 | % | | | 3/16/37 | | | | 150,000 | | | | 148,660 | |
Verizon Communications Inc., Senior Notes | | | 3.400 | % | | | 3/22/41 | | | | 170,000 | | | | 131,310 | |
Verizon Communications Inc., Senior Notes | | | 3.850 | % | | | 11/1/42 | | | | 210,000 | | | | 170,063 | |
Verizon Communications Inc., Senior Notes | | | 4.125 | % | | | 8/15/46 | | | | 100,000 | | | | 82,302 | |
Verizon Communications Inc., Senior Notes | | | 3.550 | % | | | 3/22/51 | | | | 200,000 | | | | 149,311 | |
Verizon Communications Inc., Senior Notes | | | 3.700 | % | | | 3/22/61 | | | | 100,000 | | | | 72,785 | |
Total Diversified Telecommunication Services | | | | | | | | | | | | | | | 2,308,652 | |
Entertainment — 0.7% | | | | | | | | | | | | | | | | |
Walt Disney Co., Senior Notes | | | 6.650 | % | | | 11/15/37 | | | | 50,000 | | | | 57,852 | |
Warnermedia Holdings Inc., Senior Notes | | | 6.412 | % | | | 3/15/26 | | | | 70,000 | | | | 70,074 | |
Warnermedia Holdings Inc., Senior Notes | | | 4.279 | % | | | 3/15/32 | | | | 120,000 | | | | 106,481 | |
Warnermedia Holdings Inc., Senior Notes | | | 5.050 | % | | | 3/15/42 | | | | 170,000 | | | | 143,382 | |
Warnermedia Holdings Inc., Senior Notes | | | 5.141 | % | | | 3/15/52 | | | | 220,000 | | | | 179,280 | |
Warnermedia Holdings Inc., Senior Notes | | | 5.391 | % | | | 3/15/62 | | | | 100,000 | | | | 81,563 | |
Total Entertainment | | | | | | | | | | | | | | | 638,632 | |
Interactive Media & Services — 0.2% | | | | | | | | | | | | | | | | |
Alphabet Inc., Senior Notes | | | 1.100 | % | | | 8/15/30 | | | | 50,000 | | | | 40,480 | |
Tencent Holdings Ltd., Senior Notes | | | 3.840 | % | | | 4/22/51 | | | | 200,000 | | | | 147,116 | (a) |
Total Interactive Media & Services | | | | | | | | | | | | | | | 187,596 | |
Media — 3.4% | | | | | | | | | | | | | | | | |
Charter Communications Operating LLC/Charter Communications Operating Capital Corp., Senior Secured Notes | | | 5.050 | % | | | 3/30/29 | | | | 100,000 | | | | 95,403 | |
See Notes to Financial Statements.
| | |
4 | | Western Asset Long Credit VIT 2023 Semi-Annual Report |
Western Asset Long Credit VIT
(Percentages shown based on Portfolio net assets)
| | | | | | | | | | | | | | | | |
| Security | | Rate | | | Maturity Date | | | Face Amount | | | Value | |
Media — continued | | | | | | | | | | | | | | | | |
Charter Communications Operating LLC/Charter Communications Operating Capital Corp., Senior Secured Notes | | | 4.400 | % | | | 4/1/33 | | | $ | 210,000 | | | $ | 184,401 | |
Charter Communications Operating LLC/Charter Communications Operating Capital Corp., Senior Secured Notes | | | 3.500 | % | | | 6/1/41 | | | | 110,000 | | | | 74,495 | |
Charter Communications Operating LLC/Charter Communications Operating Capital Corp., Senior Secured Notes | | | 5.750 | % | | | 4/1/48 | | | | 210,000 | | | | 179,939 | |
Charter Communications Operating LLC/Charter Communications Operating Capital Corp., Senior Secured Notes | | | 5.250 | % | | | 4/1/53 | | | | 60,000 | | | | 48,495 | |
Charter Communications Operating LLC/Charter Communications Operating Capital Corp., Senior Secured Notes | | | 5.500 | % | | | 4/1/63 | | | | 150,000 | | | | 120,908 | |
Comcast Corp., Senior Notes | | | 3.950 | % | | | 10/15/25 | | | | 100,000 | | | | 97,505 | |
Comcast Corp., Senior Notes | | | 4.250 | % | | | 10/15/30 | | | | 170,000 | | | | 163,811 | |
Comcast Corp., Senior Notes | | | 3.750 | % | | | 4/1/40 | | | | 110,000 | | | | 92,749 | |
Comcast Corp., Senior Notes | | | 4.049 | % | | | 11/1/52 | | | | 460,000 | | | | 382,638 | |
Comcast Corp., Senior Notes | | | 2.937 | % | | | 11/1/56 | | | | 220,000 | | | | 143,424 | |
Comcast Corp., Senior Notes | | | 2.987 | % | | | 11/1/63 | | | | 210,000 | | | | 133,294 | |
DISH DBS Corp., Senior Notes | | | 5.875 | % | | | 11/15/24 | | | | 50,000 | | | | 43,794 | |
Fox Corp., Senior Notes | | | 4.030 | % | | | 1/25/24 | | | | 100,000 | | | | 99,018 | |
Fox Corp., Senior Notes | | | 5.476 | % | | | 1/25/39 | | | | 100,000 | | | | 93,501 | |
Time Warner Cable Enterprises LLC, Senior Secured Notes | | | 8.375 | % | | | 7/15/33 | | | | 330,000 | | | | 362,719 | |
Time Warner Cable LLC, Senior Secured Notes | | | 5.875 | % | | | 11/15/40 | | | | 700,000 | | | | 618,075 | |
Total Media | | | | | | | | | | | | | | | 2,934,169 | |
Wireless Telecommunication Services — 0.8% | | | | | | | | | | | | | | | | |
Sprint LLC, Senior Notes | | | 7.125 | % | | | 6/15/24 | | | | 140,000 | | | | 141,378 | |
T-Mobile USA Inc., Senior Notes | | | 2.400 | % | | | 3/15/29 | | | | 130,000 | | | | 111,805 | |
T-Mobile USA Inc., Senior Notes | | | 3.875 | % | | | 4/15/30 | | | | 70,000 | | | | 64,531 | |
T-Mobile USA Inc., Senior Notes | | | 2.875 | % | | | 2/15/31 | | | | 70,000 | | | | 59,231 | |
T-Mobile USA Inc., Senior Notes | | | 3.000 | % | | | 2/15/41 | | | | 90,000 | | | | 65,853 | |
T-Mobile USA Inc., Senior Notes | | | 3.400 | % | | | 10/15/52 | | | | 310,000 | | | | 221,542 | |
Total Wireless Telecommunication Services | | | | | | | | | | | | | | | 664,340 | |
Total Communication Services | | | | | | | | | | | | | | | 6,733,389 | |
| Consumer Discretionary — 6.9% | | | | | | | | | | | | | | | | |
Automobile Components — 0.2% | | | | | | | | | | | | | | | | |
ZF North America Capital Inc., Senior Notes | | | 4.750 | % | | | 4/29/25 | | | | 220,000 | | | | 214,676 | (a) |
See Notes to Financial Statements.
| | |
| Western Asset Long Credit VIT 2023 Semi-Annual Report | | 5 |
Schedule of investments (unaudited) (cont’d)
June 30, 2023
Western Asset Long Credit VIT
(Percentages shown based on Portfolio net assets)
| | | | | | | | | | | | | | | | |
| Security | | Rate | | | Maturity Date | | | Face Amount | | | Value | |
Automobiles — 1.9% | | | | | | | | | | | | | | | | |
Ford Motor Co., Senior Notes | | | 3.250 | % | | | 2/12/32 | | | $ | 350,000 | | | $ | 275,662 | |
Ford Motor Credit Co. LLC, Senior Notes | | | 6.950 | % | | | 3/6/26 | | | | 410,000 | | | | 412,580 | |
General Motors Co., Senior Notes | | | 6.125 | % | | | 10/1/25 | | | | 180,000 | | | | 181,296 | |
General Motors Co., Senior Notes | | | 5.600 | % | | | 10/15/32 | | | | 50,000 | | | | 48,397 | |
General Motors Co., Senior Notes | | | 6.600 | % | | | 4/1/36 | | | | 40,000 | | | | 41,107 | |
General Motors Co., Senior Notes | | | 6.250 | % | | | 10/2/43 | | | | 60,000 | | | | 58,743 | |
General Motors Co., Senior Notes | | | 5.950 | % | | | 4/1/49 | | | | 70,000 | | | | 65,456 | |
Nissan Motor Acceptance Co. LLC, Senior Notes | | | 1.050 | % | | | 3/8/24 | | | | 20,000 | | | | 19,214 | (a) |
Nissan Motor Acceptance Co. LLC, Senior Notes | | | 2.750 | % | | | 3/9/28 | | | | 60,000 | | | | 49,356 | (a) |
Nissan Motor Co. Ltd., Senior Notes | | | 3.043 | % | | | 9/15/23 | | | | 200,000 | | | | 198,600 | (a) |
Nissan Motor Co. Ltd., Senior Notes | | | 3.522 | % | | | 9/17/25 | | | | 200,000 | | | | 186,143 | (a) |
Toyota Motor Corp., Senior Notes | | | 1.339 | % | | | 3/25/26 | | | | 70,000 | | | | 63,548 | |
Total Automobiles | | | | | | | | | | | | | | | 1,600,102 | |
Broadline Retail — 1.1% | | | | | | | | | | | | | | | | |
Alibaba Group Holding Ltd., Senior Notes | | | 2.125 | % | | | 2/9/31 | | | | 200,000 | | | | 162,965 | |
Alibaba Group Holding Ltd., Senior Notes | | | 2.700 | % | | | 2/9/41 | | | | 200,000 | | | | 133,755 | |
Amazon.com Inc., Senior Notes | | | 3.150 | % | | | 8/22/27 | | | | 70,000 | | | | 65,914 | |
Amazon.com Inc., Senior Notes | | | 2.100 | % | | | 5/12/31 | | | | 80,000 | | | | 67,314 | |
Amazon.com Inc., Senior Notes | | | 3.100 | % | | | 5/12/51 | | | | 540,000 | | | | 403,417 | |
Amazon.com Inc., Senior Notes | | | 3.250 | % | | | 5/12/61 | | | | 60,000 | | | | 43,485 | |
Nordstrom Inc., Senior Notes | | | 2.300 | % | | | 4/8/24 | | | | 70,000 | | | | 67,428 | |
Total Broadline Retail | | | | | | | | | | | | | | | 944,278 | |
Diversified Consumer Services — 0.1% | | | | | | | | | | | | | | | | |
Massachusetts Institute of Technology, Senior Notes | | | 5.600 | % | | | 7/1/2111 | | | | 100,000 | | | | 113,106 | |
Hotels, Restaurants & Leisure — 2.4% | | | | | | | | | | | | | | | | |
Las Vegas Sands Corp., Senior Notes | | | 3.200 | % | | | 8/8/24 | | | | 300,000 | | | | 290,758 | |
Las Vegas Sands Corp., Senior Notes | | | 2.900 | % | | | 6/25/25 | | | | 130,000 | | | | 122,232 | |
Las Vegas Sands Corp., Senior Notes | | | 3.500 | % | | | 8/18/26 | | | | 120,000 | | | | 111,846 | |
Las Vegas Sands Corp., Senior Notes | | | 3.900 | % | | | 8/8/29 | | | | 80,000 | | | | 71,481 | |
Marriott International Inc., Senior Notes | | | 3.600 | % | | | 4/15/24 | | | | 190,000 | | | | 186,850 | |
McDonald’s Corp., Senior Notes | | | 3.800 | % | | | 4/1/28 | | | | 140,000 | | | | 134,269 | |
McDonald’s Corp., Senior Notes | | | 4.875 | % | | | 12/9/45 | | | | 100,000 | | | | 95,773 | |
McDonald’s Corp., Senior Notes | | | 3.625 | % | | | 9/1/49 | | | | 250,000 | | | | 197,398 | |
Sands China Ltd., Senior Notes | | | 5.625 | % | | | 8/8/25 | | | | 200,000 | | | | 195,248 | |
Sands China Ltd., Senior Notes | | | 3.750 | % | | | 8/8/31 | | | | 290,000 | | | | 236,288 | |
Wynn Las Vegas LLC/Wynn Las Vegas Capital Corp., Senior Notes | | | 5.500 | % | | | 3/1/25 | | | | 50,000 | | | | 49,246 | (a) |
See Notes to Financial Statements.
| | |
6 | | Western Asset Long Credit VIT 2023 Semi-Annual Report |
Western Asset Long Credit VIT
(Percentages shown based on Portfolio net assets)
| | | | | | | | | | | | | | | | |
| Security | | Rate | | | Maturity Date | | | Face Amount | | | Value | |
Hotels, Restaurants & Leisure — continued | | | | |
Wynn Macau Ltd., Senior Notes | | | 4.875 | % | | | 10/1/24 | | | $ | 200,000 | | | $ | 195,228 | (a) |
Wynn Macau Ltd., Senior Notes | | | 5.125 | % | | | 12/15/29 | | | | 200,000 | | | | 168,256 | (a) |
Total Hotels, Restaurants & Leisure | | | | | | | | | | | | | | | 2,054,873 | |
Household Durables — 0.3% | | | | | | | | | | | | | | | | |
DR Horton Inc., Senior Notes | | | 2.500 | % | | | 10/15/24 | | | | 100,000 | | | | 95,665 | |
MDC Holdings Inc., Senior Notes | | | 2.500 | % | | | 1/15/31 | | | | 120,000 | | | | 94,406 | |
MDC Holdings Inc., Senior Notes | | | 6.000 | % | | | 1/15/43 | | | | 50,000 | | | | 45,163 | |
Total Household Durables | | | | | | | | | | | | | | | 235,234 | |
Specialty Retail — 0.9% | | | | | | | | | | | | | | | | |
Home Depot Inc., Senior Notes | | | 3.900 | % | | | 12/6/28 | | | | 40,000 | | | | 38,745 | |
Home Depot Inc., Senior Notes | | | 3.300 | % | | | 4/15/40 | | | | 50,000 | | | | 40,642 | |
Home Depot Inc., Senior Notes | | | 3.625 | % | | | 4/15/52 | | | | 250,000 | | | | 199,546 | |
Home Depot Inc., Senior Notes | | | 3.500 | % | | | 9/15/56 | | | | 60,000 | | | | 46,212 | |
Lithia Motors Inc., Senior Notes | | | 3.875 | % | | | 6/1/29 | | | | 50,000 | | | | 43,498 | (a) |
Lowe’s Cos. Inc., Senior Notes | | | 1.700 | % | | | 9/15/28 | | | | 110,000 | | | | 93,297 | |
Lowe’s Cos. Inc., Senior Notes | | | 2.800 | % | | | 9/15/41 | | | | 50,000 | | | | 35,402 | |
Lowe’s Cos. Inc., Senior Notes | | | 4.250 | % | | | 4/1/52 | | | | 250,000 | | | | 204,217 | |
TJX Cos. Inc., Senior Notes | | | 1.150 | % | | | 5/15/28 | | | | 80,000 | | | | 68,200 | |
TJX Cos. Inc., Senior Notes | | | 1.600 | % | | | 5/15/31 | | | | 40,000 | | | | 32,438 | |
Total Specialty Retail | | | | | | | | | | | | | | | 802,197 | |
Total Consumer Discretionary | | | | | | | | | | | | | | | 5,964,466 | |
| Consumer Staples — 3.5% | | | | | | | | | | | | | | | | |
Beverages — 0.7% | | | | | | | | | | | | | | | | |
Anheuser-Busch Cos. LLC/Anheuser-Busch InBev Worldwide Inc., Senior Notes | | | 3.650 | % | | | 2/1/26 | | | | 100,000 | | | | 96,892 | |
Anheuser-Busch Cos. LLC/Anheuser-Busch InBev Worldwide Inc., Senior Notes | | | 4.900 | % | | | 2/1/46 | | | | 20,000 | | | | 19,133 | |
Anheuser-Busch InBev Worldwide Inc., Senior Notes | | | 5.550 | % | | | 1/23/49 | | | | 210,000 | | | | 221,541 | |
Anheuser-Busch InBev Worldwide Inc., Senior Notes | | | 5.800 | % | | | 1/23/59 | | | | 220,000 | | | | 240,100 | |
Total Beverages | | | | | | | | | | | | | | | 577,666 | |
Consumer Staples Distribution & Retail — 0.3% | | | | | | | | | | | | | | | | |
Walmart Inc., Senior Notes | | | 1.800 | % | | | 9/22/31 | | | | 200,000 | | | | 166,192 | |
Walmart Inc., Senior Notes | | | 2.650 | % | | | 9/22/51 | | | | 110,000 | | | | 78,225 | |
Total Consumer Staples Distribution & Retail | | | | | | | | | | | | | | | 244,417 | |
Food Products — 0.2% | | | | | | | | | | | | | | | | |
Hershey Co., Senior Notes | | | 2.650 | % | | | 6/1/50 | | | | 80,000 | | | | 54,073 | |
Mondelez International Inc., Senior Notes | | | 2.625 | % | | | 9/4/50 | | | | 40,000 | | | | 25,968 | |
Pilgrim’s Pride Corp., Senior Notes | | | 5.875 | % | | | 9/30/27 | | | | 100,000 | | | | 98,912 | (a) |
Total Food Products | | | | | | | | | | | | | | | 178,953 | |
See Notes to Financial Statements.
| | |
| Western Asset Long Credit VIT 2023 Semi-Annual Report | | 7 |
Schedule of investments (unaudited) (cont’d)
June 30, 2023
Western Asset Long Credit VIT
(Percentages shown based on Portfolio net assets)
| | | | | | | | | | | | | | | | |
| Security | | Rate | | | Maturity Date | | | Face Amount | | | Value | |
Personal Care Products — 0.5% | | | | | | | | | | | | | | | | |
Kenvue Inc., Senior Notes | | | 5.350 | % | | | 3/22/26 | | | $ | 110,000 | | | $ | 110,891 | (a) |
Kenvue Inc., Senior Notes | | | 5.050 | % | | | 3/22/28 | | | | 160,000 | | | | 161,396 | (a) |
Kenvue Inc., Senior Notes | | | 5.050 | % | | | 3/22/53 | | | | 120,000 | | | | 122,597 | (a) |
Kenvue Inc., Senior Notes | | | 5.200 | % | | | 3/22/63 | | | | 70,000 | | | | 71,726 | (a) |
Total Personal Care Products | | | | | | | | | | | | | | | 466,610 | |
Tobacco — 1.8% | | | | | | | | | | | | | | | | |
Altria Group Inc., Senior Notes | | | 4.400 | % | | | 2/14/26 | | | | 140,000 | | | | 137,059 | |
Altria Group Inc., Senior Notes | | | 4.800 | % | | | 2/14/29 | | | | 100,000 | | | | 97,324 | |
Altria Group Inc., Senior Notes | | | 2.450 | % | | | 2/4/32 | | | | 70,000 | | | | 54,628 | |
Altria Group Inc., Senior Notes | | | 5.800 | % | | | 2/14/39 | | | | 230,000 | | | | 225,398 | |
Altria Group Inc., Senior Notes | | | 4.250 | % | | | 8/9/42 | | | | 120,000 | | | | 93,719 | |
Altria Group Inc., Senior Notes | | | 3.875 | % | | | 9/16/46 | | | | 70,000 | | | | 49,133 | |
Altria Group Inc., Senior Notes | | | 5.950 | % | | | 2/14/49 | | | | 410,000 | | | | 389,662 | |
Altria Group Inc., Senior Notes | | | 6.200 | % | | | 2/14/59 | | | | 70,000 | | | | 67,656 | |
BAT Capital Corp., Senior Notes | | | 2.259 | % | | | 3/25/28 | | | | 110,000 | | | | 94,354 | |
BAT Capital Corp., Senior Notes | | | 3.734 | % | | | 9/25/40 | | | | 190,000 | | | | 135,380 | |
BAT Capital Corp., Senior Notes | | | 3.984 | % | | | 9/25/50 | | | | 110,000 | | | | 74,239 | |
Philip Morris International Inc., Senior Notes | | | 1.750 | % | | | 11/1/30 | | | | 80,000 | | | | 63,264 | |
Philip Morris International Inc., Senior Notes | | | 3.875 | % | | | 8/21/42 | | | | 120,000 | | | | 95,013 | |
Total Tobacco | | | | | | | | | | | | | | | 1,576,829 | |
Total Consumer Staples | | | | | | | | | | | | | | | 3,044,475 | |
| Energy — 12.8% | | | | | | | | | | | | | | | | |
Energy Equipment & Services — 0.1% | | | | | | | | | | | | | | | | |
Halliburton Co., Senior Notes | | | 4.850 | % | | | 11/15/35 | | | | 60,000 | | | | 56,555 | |
Halliburton Co., Senior Notes | | | 4.750 | % | | | 8/1/43 | | | | 50,000 | | | | 43,823 | |
Total Energy Equipment & Services | | | | | | | | | | | | | | | 100,378 | |
Oil, Gas & Consumable Fuels — 12.7% | | | | | | | | | | | | | | | | |
Apache Corp., Senior Notes | | | 4.750 | % | | | 4/15/43 | | | | 120,000 | | | | 88,381 | |
Berry Petroleum Co. LLC, Senior Notes | | | 7.000 | % | | | 2/15/26 | | | | 210,000 | | | | 194,500 | (a) |
Blue Racer Midstream LLC/Blue Racer Finance Corp., Senior Notes | | | 7.625 | % | | | 12/15/25 | | | | 100,000 | | | | 101,181 | (a) |
BP Capital Markets America Inc., Senior Notes | | | 3.000 | % | | | 2/24/50 | | | | 240,000 | | | | 167,508 | |
BP Capital Markets PLC, Senior Notes | | | 3.723 | % | | | 11/28/28 | | | | 100,000 | | | | 94,600 | |
Chesapeake Energy Corp., Senior Notes | | | 5.500 | % | | | 2/1/26 | | | | 70,000 | | | | 68,313 | (a) |
Continental Resources Inc., Senior Notes | | | 2.268 | % | | | 11/15/26 | | | | 160,000 | | | | 142,526 | (a) |
Continental Resources Inc., Senior Notes | | | 4.375 | % | | | 1/15/28 | | | | 50,000 | | | | 46,987 | |
Continental Resources Inc., Senior Notes | | | 2.875 | % | | | 4/1/32 | | | | 80,000 | | | | 61,519 | (a) |
Continental Resources Inc., Senior Notes | | | 4.900 | % | | | 6/1/44 | | | | 80,000 | | | | 62,239 | |
Coterra Energy Inc., Senior Notes | | | 3.900 | % | | | 5/15/27 | | | | 140,000 | | | | 132,051 | |
See Notes to Financial Statements.
| | |
8 | | Western Asset Long Credit VIT 2023 Semi-Annual Report |
Western Asset Long Credit VIT
(Percentages shown based on Portfolio net assets)
| | | | | | | | | | | | | | | | |
| Security | | Rate | | | Maturity Date | | | Face Amount | | | Value | |
Oil, Gas & Consumable Fuels — continued | | | | |
Coterra Energy Inc., Senior Notes | | | 4.375 | % | | | 3/15/29 | | | $ | 110,000 | | | $ | 102,814 | |
DCP Midstream Operating LP, Senior Notes | | | 3.250 | % | | | 2/15/32 | | | | 80,000 | | | | 67,829 | |
DCP Midstream Operating LP, Senior Notes | | | 6.450 | % | | | 11/3/36 | | | | 50,000 | | | | 51,437 | (a) |
Devon Energy Corp., Senior Notes | | | 5.850 | % | | | 12/15/25 | | | | 150,000 | | | | 151,248 | |
Devon Energy Corp., Senior Notes | | | 4.500 | % | | | 1/15/30 | | | | 100,000 | | | | 94,243 | |
Devon Energy Corp., Senior Notes | | | 5.600 | % | | | 7/15/41 | | | | 150,000 | | | | 141,362 | |
Devon Energy Corp., Senior Notes | | | 5.000 | % | | | 6/15/45 | | | | 210,000 | | | | 182,323 | |
Diamondback Energy Inc., Senior Notes | | | 3.250 | % | | | 12/1/26 | | | | 40,000 | | | | 37,602 | |
Diamondback Energy Inc., Senior Notes | | | 3.500 | % | | | 12/1/29 | | | | 100,000 | | | | 90,104 | |
Diamondback Energy Inc., Senior Notes | | | 6.250 | % | | | 3/15/53 | | | | 220,000 | | | | 222,777 | |
Ecopetrol SA, Senior Notes | | | 4.625 | % | | | 11/2/31 | | | | 50,000 | | | | 38,643 | |
Ecopetrol SA, Senior Notes | | | 5.875 | % | | | 11/2/51 | | | | 120,000 | | | | 79,527 | |
Energy Transfer LP, Junior Subordinated Notes (6.500% to 11/15/26 then 5 year Treasury Constant Maturity Rate + 5.694%) | | | 6.500 | % | | | 11/15/26 | | | | 250,000 | | | | 227,705 | (b)(c) |
Energy Transfer LP, Junior Subordinated Notes (7.125% to 5/15/30 then 5 year Treasury Constant Maturity Rate + 5.306%) | | | 7.125 | % | | | 5/15/30 | | | | 370,000 | | | | 314,656 | (b)(c) |
Energy Transfer LP, Senior Notes | | | 2.900 | % | | | 5/15/25 | | | | 100,000 | | | | 94,791 | |
Energy Transfer LP, Senior Notes | | | 3.750 | % | | | 5/15/30 | | | | 200,000 | | | | 180,605 | |
Energy Transfer LP, Senior Notes | | | 5.800 | % | | | 6/15/38 | | | | 130,000 | | | | 124,851 | |
Energy Transfer LP, Senior Notes | | | 6.000 | % | | | 6/15/48 | | | | 190,000 | | | | 180,454 | |
Enterprise Products Operating LLC, Senior Notes | | | 4.150 | % | | | 10/16/28 | | | | 190,000 | | | | 181,778 | |
Enterprise Products Operating LLC, Senior Notes | | | 6.875 | % | | | 3/1/33 | | | | 130,000 | | | | 146,559 | |
Enterprise Products Operating LLC, Senior Notes | | | 4.850 | % | | | 3/15/44 | | | | 150,000 | | | | 138,631 | |
Enterprise Products Operating LLC, Senior Notes | | | 4.900 | % | | | 5/15/46 | | | | 210,000 | | | | 193,801 | |
Enterprise Products Operating LLC, Senior Notes | | | 3.300 | % | | | 2/15/53 | | | | 290,000 | | | | 207,308 | |
Enterprise Products Operating LLC, Senior Notes | | | 3.950 | % | | | 1/31/60 | | | | 80,000 | | | | 61,789 | |
Enterprise Products Operating LLC, Senior Notes (5.375% to 2/15/28 then 3 mo. Term SOFR + 2.832%) | | | 5.375 | % | | | 2/15/78 | | | | 130,000 | | | | 107,870 | (c) |
EOG Resources Inc., Senior Notes | | | 4.375 | % | | | 4/15/30 | | | | 140,000 | | | | 137,049 | |
EOG Resources Inc., Senior Notes | | | 3.900 | % | | | 4/1/35 | | | | 50,000 | | | | 44,926 | |
EOG Resources Inc., Senior Notes | | | 4.950 | % | | | 4/15/50 | | | | 110,000 | | | | 108,709 | |
EQM Midstream Partners LP, Senior Notes | | | 7.500 | % | | | 6/1/27 | | | | 50,000 | | | | 50,527 | (a) |
EQT Corp., Senior Notes | | | 3.900 | % | | | 10/1/27 | | | | 100,000 | | | | 92,542 | |
Exxon Mobil Corp., Senior Notes | | | 3.482 | % | | | 3/19/30 | | | | 40,000 | | | | 37,563 | |
Exxon Mobil Corp., Senior Notes | | | 4.227 | % | | | 3/19/40 | | | | 150,000 | | | | 138,410 | |
Exxon Mobil Corp., Senior Notes | | | 4.327 | % | | | 3/19/50 | | | | 120,000 | | | | 108,893 | |
See Notes to Financial Statements.
| | |
| Western Asset Long Credit VIT 2023 Semi-Annual Report | | 9 |
Schedule of investments (unaudited) (cont’d)
June 30, 2023
Western Asset Long Credit VIT
(Percentages shown based on Portfolio net assets)
| | | | | | | | | | | | | | | | |
| Security | | Rate | | | Maturity Date | | | Face Amount | | | Value | |
Oil, Gas & Consumable Fuels — continued | | | | | | | | | | | | | | | | |
Florida Gas Transmission Co. LLC, Senior Notes | | | 2.300 | % | | | 10/1/31 | | | $ | 120,000 | | | $ | 95,680 | (a) |
Kinder Morgan Energy Partners LP, Senior Notes | | | 7.300 | % | | | 8/15/33 | | | | 40,000 | | | | 43,602 | |
Kinder Morgan Inc., Senior Notes | | | 4.300 | % | | | 6/1/25 | | | | 50,000 | | | | 48,789 | |
Kinder Morgan Inc., Senior Notes | | | 5.300 | % | | | 12/1/34 | | | | 80,000 | | | | 77,092 | |
Kinder Morgan Inc., Senior Notes | | | 5.050 | % | | | 2/15/46 | | | | 160,000 | | | | 136,917 | |
Kinder Morgan Inc., Senior Notes | | | 3.600 | % | | | 2/15/51 | | | | 140,000 | | | | 97,238 | |
Magellan Midstream Partners LP, Senior Notes | | | 4.250 | % | | | 9/15/46 | | | | 60,000 | | | | 44,377 | |
MEG Energy Corp., Senior Notes | | | 5.875 | % | | | 2/1/29 | | | | 240,000 | | | | 225,940 | (a) |
MPLX LP, Senior Notes | | | 4.800 | % | | | 2/15/29 | | | | 120,000 | | | | 115,801 | |
MPLX LP, Senior Notes | | | 5.000 | % | | | 3/1/33 | | | | 100,000 | | | | 95,828 | |
MPLX LP, Senior Notes | | | 4.500 | % | | | 4/15/38 | | | | 140,000 | | | | 120,653 | |
MPLX LP, Senior Notes | | | 5.650 | % | | | 3/1/53 | | | | 100,000 | | | | 93,589 | |
Occidental Petroleum Corp., Senior Notes | | | 3.400 | % | | | 4/15/26 | | | | 40,000 | | | | 37,049 | |
Occidental Petroleum Corp., Senior Notes | | | 6.450 | % | | | 9/15/36 | | | | 70,000 | | | | 71,940 | |
Occidental Petroleum Corp., Senior Notes | | | 6.600 | % | | | 3/15/46 | | | | 50,000 | | | | 51,550 | |
Occidental Petroleum Corp., Senior Notes | | | 4.400 | % | | | 8/15/49 | | | | 50,000 | | | | 36,800 | |
Ovintiv Inc., Senior Notes | | | 6.250 | % | | | 7/15/33 | | | | 80,000 | | | | 78,958 | |
Ovintiv Inc., Senior Notes | | | 7.100 | % | | | 7/15/53 | | | | 70,000 | | | | 72,117 | |
Petrobras Global Finance BV, Senior Notes | | | 7.375 | % | | | 1/17/27 | | | | 70,000 | | | | 72,820 | |
Petrobras Global Finance BV, Senior Notes | | | 5.500 | % | | | 6/10/51 | | | | 180,000 | | | | 141,839 | |
Piedmont Natural Gas Co. Inc., Senior Notes | | | 5.050 | % | | | 5/15/52 | | | | 100,000 | | | | 90,287 | |
Pioneer Natural Resources Co., Senior Notes | | | 5.100 | % | | | 3/29/26 | | | | 110,000 | | | | 109,377 | |
Pioneer Natural Resources Co., Senior Notes | | | 2.150 | % | | | 1/15/31 | | | | 60,000 | | | | 49,133 | |
Plains All American Pipeline LP/PAA Finance Corp., Senior Notes | | | 6.700 | % | | | 5/15/36 | | | | 50,000 | | | | 49,347 | |
Qatar Energy, Senior Notes | | | 2.250 | % | | | 7/12/31 | | | | 200,000 | | | | 167,991 | (a) |
QatarEnergy, Senior Notes | | | 3.300 | % | | | 7/12/51 | | | | 200,000 | | | | 147,217 | (a) |
Range Resources Corp., Senior Notes | | | 4.875 | % | | | 5/15/25 | | | | 110,000 | | | | 107,905 | |
Reliance Industries Ltd., Senior Notes | | | 2.875 | % | | | 1/12/32 | | | | 270,000 | | | | 225,336 | (a) |
Reliance Industries Ltd., Senior Notes | | | 3.625 | % | | | 1/12/52 | | | | 270,000 | | | | 192,965 | (a) |
Shell International Finance BV, Senior Notes | | | 3.875 | % | | | 11/13/28 | | | | 50,000 | | | | 48,400 | |
Shell International Finance BV, Senior Notes | | | 5.500 | % | | | 3/25/40 | | | | 80,000 | | | | 83,792 | |
Shell International Finance BV, Senior Notes | | | 3.250 | % | | | 4/6/50 | | | | 190,000 | | | | 141,577 | |
Southwestern Energy Co., Senior Notes | | | 8.375 | % | | | 9/15/28 | | | | 80,000 | | | | 83,362 | |
Southwestern Energy Co., Senior Notes | | | 4.750 | % | | | 2/1/32 | | | | 70,000 | | | | 61,793 | |
Targa Resources Corp., Senior Notes | | | 5.200 | % | | | 7/1/27 | | | | 70,000 | | | | 68,767 | |
Targa Resources Corp., Senior Notes | | | 4.200 | % | | | 2/1/33 | | | | 80,000 | | | | 70,874 | |
Targa Resources Corp., Senior Notes | | | 6.250 | % | | | 7/1/52 | | | | 20,000 | | | | 19,577 | |
Targa Resources Corp., Senior Notes | | | 6.500 | % | | | 2/15/53 | | | | 360,000 | | | | 368,015 | |
See Notes to Financial Statements.
| | |
10 | | Western Asset Long Credit VIT 2023 Semi-Annual Report |
Western Asset Long Credit VIT
(Percentages shown based on Portfolio net assets)
| | | | | | | | | | | | | | | | |
| Security | | Rate | | | Maturity Date | | | Face Amount | | | Value | |
Oil, Gas & Consumable Fuels — continued | | | | |
Targa Resources Partners LP/Targa Resources Partners Finance Corp., Senior Notes | | | 4.000 | % | | | 1/15/32 | | | $ | 110,000 | | | $ | 95,237 | |
Tennessee Gas Pipeline Co. LLC, Senior Notes | | | 7.000 | % | | | 3/15/27 | | | | 50,000 | | | | 52,306 | |
Tennessee Gas Pipeline Co. LLC, Senior Notes | | | 7.000 | % | | | 10/15/28 | | | | 120,000 | | | | 126,803 | |
Tennessee Gas Pipeline Co. LLC, Senior Notes | | | 2.900 | % | | | 3/1/30 | | | | 60,000 | | | | 51,282 | (a) |
Transcontinental Gas Pipe Line Co. LLC, Senior Notes | | | 7.850 | % | | | 2/1/26 | | | | 210,000 | | | | 219,963 | |
Transcontinental Gas Pipe Line Co. LLC, Senior Notes | | | 3.950 | % | | | 5/15/50 | | | | 150,000 | | | | 116,068 | |
Western Midstream Operating LP, Senior Notes | | | 3.950 | % | | | 6/1/25 | | | | 140,000 | | | | 134,605 | |
Western Midstream Operating LP, Senior Notes | | | 4.500 | % | | | 3/1/28 | | | | 50,000 | | | | 47,197 | |
Western Midstream Operating LP, Senior Notes | | | 4.300 | % | | | 2/1/30 | | | | 50,000 | | | | 44,937 | |
Western Midstream Operating LP, Senior Notes | | | 6.150 | % | | | 4/1/33 | | | | 270,000 | | | | 272,503 | |
Western Midstream Operating LP, Senior Notes | | | 5.300 | % | | | 3/1/48 | | | | 290,000 | | | | 242,526 | |
Western Midstream Operating LP, Senior Notes | | | 5.500 | % | | | 2/1/50 | | | | 140,000 | | | | 114,885 | |
Williams Cos. Inc., Senior Notes | | | 7.500 | % | | | 1/15/31 | | | | 230,000 | | | | 253,071 | |
Williams Cos. Inc., Senior Notes | | | 3.500 | % | | | 10/15/51 | | | | 100,000 | | | | 69,102 | |
Total Oil, Gas & Consumable Fuels | | | | | | | | | | | | | | | 10,983,910 | |
Total Energy | | | | | | | | | | | | | | | 11,084,288 | |
| Financials — 28.7% | | | | | | | | | | | | | | | | |
Banks — 17.8% | | | | | | | | | | | | | | | | |
Banco Santander SA, Senior Notes (4.175% to 3/24/27 then 1 year Treasury Constant Maturity Rate + 2.000%) | | | 4.175 | % | | | 3/24/28 | | | | 200,000 | | | | 187,344 | (c) |
Bank of America Corp., Senior Notes | | | 3.500 | % | | | 4/19/26 | | | | 430,000 | | | | 412,718 | |
Bank of America Corp., Senior Notes (1.922% to 10/24/30 then SOFR + 1.370%) | | | 1.922 | % | | | 10/24/31 | | | | 510,000 | | | | 403,870 | (c) |
Bank of America Corp., Senior Notes (2.299% to 7/21/31 then SOFR + 1.220%) | | | 2.299 | % | | | 7/21/32 | | | | 150,000 | | | | 120,017 | (c) |
Bank of America Corp., Senior Notes (2.831% to 10/24/50 then SOFR + 1.880%) | | | 2.831 | % | | | 10/24/51 | | | | 290,000 | | | | 190,713 | (c) |
Bank of America Corp., Senior Notes (2.972% to 2/4/32 then SOFR + 1.330%) | | | 2.972 | % | | | 2/4/33 | | | | 140,000 | | | | 116,757 | (c) |
Bank of America Corp., Senior Notes (3.311% to 4/22/41 then SOFR + 1.580%) | | | 3.311 | % | | | 4/22/42 | | | | 380,000 | | | | 289,845 | (c) |
Bank of America Corp., Senior Notes (3.593% to 7/21/27 then 3 mo. Term SOFR + 1.632%) | | | 3.593 | % | | | 7/21/28 | | | | 500,000 | | | | 465,185 | (c) |
Bank of America Corp., Senior Notes (4.443% to 1/20/47 then 3 mo. Term SOFR + 2.252%) | | | 4.443 | % | | | 1/20/48 | | | | 210,000 | | | | 186,161 | (c) |
See Notes to Financial Statements.
| | |
| Western Asset Long Credit VIT 2023 Semi-Annual Report | | 11 |
Schedule of investments (unaudited) (cont’d)
June 30, 2023
Western Asset Long Credit VIT
(Percentages shown based on Portfolio net assets)
| | | | | | | | | | | | | | | | |
| Security | | Rate | | | Maturity Date | | | Face Amount | | | Value | |
Banks — continued | | | | | | | | | | | | | | | | |
Bank of America Corp., Senior Notes (4.571% to 4/27/32 then SOFR + 1.830%) | | | 4.571 | % | | | 4/27/33 | | | $ | 370,000 | | | $ | 348,064 | (c) |
Bank of America Corp., Subordinated Notes (2.482% to 9/21/31 then 5 year Treasury Constant Maturity Rate + 1.200%) | | | 2.482 | % | | | 9/21/36 | | | | 350,000 | | | | 267,920 | (c) |
Bank of Nova Scotia, Senior Notes | | | 3.450 | % | | | 4/11/25 | | | | 240,000 | | | | 231,164 | |
Bank of Nova Scotia, Subordinated Notes (4.588% to 5/4/32 then 5 year Treasury Constant Maturity Rate + 2.050%) | | | 4.588 | % | | | 5/4/37 | | | | 210,000 | | | | 181,157 | (c) |
BNP Paribas SA, Senior Notes (2.219% to 6/9/25 then SOFR + 2.074%) | | | 2.219 | % | | | 6/9/26 | | | | 200,000 | | | | 185,072 | (a)(c) |
BNP Paribas SA, Senior Notes (5.125% to 1/13/28 then 1 year Treasury Constant Maturity Rate + 1.450%) | | | 5.125 | % | | | 1/13/29 | | | | 200,000 | | | | 195,861 | (a)(c) |
Citigroup Inc., Junior Subordinated Notes (4.000% to 12/10/25 then 5 year Treasury Constant Maturity Rate + 3.597%) | | | 4.000 | % | | | 12/10/25 | | | | 160,000 | | | | 137,000 | (b)(c) |
Citigroup Inc., Senior Notes | | | 3.400 | % | | | 5/1/26 | | | | 200,000 | | | | 190,312 | |
Citigroup Inc., Senior Notes | | | 8.125 | % | | | 7/15/39 | | | | 230,000 | | | | 294,497 | |
Citigroup Inc., Senior Notes | | | 4.650 | % | | | 7/23/48 | | | | 110,000 | | | | 99,737 | |
Citigroup Inc., Senior Notes (0.776% to 10/30/23 then SOFR + 0.686%) | | | 0.776 | % | | | 10/30/24 | | | | 80,000 | | | | 78,599 | (c) |
Citigroup Inc., Senior Notes (2.904% to 11/3/41 then SOFR + 1.379%) | | | 2.904 | % | | | 11/3/42 | | | | 100,000 | | | | 70,918 | (c) |
Citigroup Inc., Senior Notes (3.785% to 3/17/32 then SOFR + 1.939%) | | | 3.785 | % | | | 3/17/33 | | | | 680,000 | | | | 601,135 | (c) |
Citigroup Inc., Subordinated Notes | | | 4.125 | % | | | 7/25/28 | | | | 120,000 | | | | 113,204 | |
Citigroup Inc., Subordinated Notes | | | 4.750 | % | | | 5/18/46 | | | | 100,000 | | | | 85,690 | |
Citigroup Inc., Subordinated Notes (6.174% to 5/25/33 then SOFR + 2.661%) | | | 6.174 | % | | | 5/25/34 | | | | 170,000 | | | | 171,574 | (c) |
Comerica Inc., Senior Notes | | | 3.700 | % | | | 7/31/23 | | | | 320,000 | | | | 319,061 | |
Cooperatieve Rabobank UA, Senior Notes | | | 4.375 | % | | | 8/4/25 | | | | 250,000 | | | | 241,421 | |
Cooperatieve Rabobank UA, Senior Notes (3.649% to 4/6/27 then 1 year Treasury Constant Maturity Rate + 1.220%) | | | 3.649 | % | | | 4/6/28 | | | | 250,000 | | | | 231,718 | (a)(c) |
Cooperatieve Rabobank UA, Senior Notes (3.758% to 4/6/32 then 1 year Treasury Constant Maturity Rate + 1.420%) | | | 3.758 | % | | | 4/6/33 | | | | 270,000 | | | | 234,795 | (a)(c) |
Credit Agricole SA, Senior Notes | | | 5.589 | % | | | 7/5/26 | | | | 250,000 | | | | 249,720 | (a)(d) |
Credit Agricole SA, Senior Notes | | | 5.301 | % | | | 7/12/28 | | | | 270,000 | | | | 269,251 | (a) |
Credit Agricole SA, Senior Notes | | | 5.514 | % | | | 7/5/33 | | | | 250,000 | | | | 251,689 | (a)(d) |
See Notes to Financial Statements.
| | |
12 | | Western Asset Long Credit VIT 2023 Semi-Annual Report |
Western Asset Long Credit VIT
(Percentages shown based on Portfolio net assets)
| | | | | | | | | | | | | | | | |
| Security | | Rate | | | Maturity
Date | | | Face
Amount | | | Value | |
Banks — continued | | | | | | | | | | | | | | | | |
Danske Bank A/S, Senior Notes (0.976% to 9/10/24 then 1 year Treasury Constant Maturity Rate + 0.550%) | | | 0.976 | % | | | 9/10/25 | | | $ | 350,000 | | | $ | 326,712 | (a)(c) |
Danske Bank A/S, Senior Notes (4.298% to 4/1/27 then 1 year Treasury Constant Maturity Rate + 1.750%) | | | 4.298 | % | | | 4/1/28 | | | | 200,000 | | | | 186,869 | (a)(c) |
Danske Bank A/S, Senior Notes (6.466% to 1/9/25 then 1 year Treasury Constant Maturity Rate + 2.100%) | | | 6.466 | % | | | 1/9/26 | | | | 200,000 | | | | 199,633 | (a)(c) |
HSBC Holdings PLC, Senior Notes (1.589% to 5/24/26 then SOFR + 1.290%) | | | 1.589 | % | | | 5/24/27 | | | | 230,000 | | | | 203,106 | (c) |
HSBC Holdings PLC, Senior Notes (6.161% to 3/9/28 then SOFR + 1.970%) | | | 6.161 | % | | | 3/9/29 | | | | 250,000 | | | | 252,365 | (c) |
HSBC Holdings PLC, Senior Notes (6.254% to 3/9/33 then SOFR + 2.390%) | | | 6.254 | % | | | 3/9/34 | | | | 300,000 | | | | 307,684 | (c) |
HSBC Holdings PLC, Senior Notes (6.332% to 3/9/43 then SOFR + 2.650%) | | | 6.332 | % | | | 3/9/44 | | | | 280,000 | | | | 290,528 | (c) |
HSBC Holdings PLC, Subordinated Notes | | | 6.500 | % | | | 9/15/37 | | | | 130,000 | | | | 136,281 | |
Intesa Sanpaolo SpA, Senior Notes (7.778% to 6/20/53 then 1 year Treasury Constant Maturity Rate + 3.900%) | | | 7.778 | % | | | 6/20/54 | | | | 200,000 | | | | 199,513 | (a)(c) |
JPMorgan Chase & Co., Junior Subordinated Notes (3.650% to 6/1/26 then 5 year Treasury Constant Maturity Rate + 2.850%) | | | 3.650 | % | | | 6/1/26 | | | | 100,000 | | | | 88,265 | (b)(c) |
JPMorgan Chase & Co., Senior Notes | | | 3.200 | % | | | 6/15/26 | | | | 290,000 | | | | 276,500 | |
JPMorgan Chase & Co., Senior Notes (2.545% to 11/8/31 then SOFR + 1.180%) | | | 2.545 | % | | | 11/8/32 | | | | 410,000 | | | | 336,093 | (c) |
JPMorgan Chase & Co., Senior Notes (3.157% to 4/22/41 then SOFR + 1.460%) | | | 3.157 | % | | | 4/22/42 | | | | 140,000 | | | | 105,821 | (c) |
JPMorgan Chase & Co., Senior Notes (3.328% to 4/22/51 then SOFR + 1.580%) | | | 3.328 | % | | | 4/22/52 | | | | 300,000 | | | | 218,885 | (c) |
JPMorgan Chase & Co., Senior Notes (4.260% to 2/22/47 then 3 mo. Term SOFR + 1.842%) | | | 4.260 | % | | | 2/22/48 | | | | 170,000 | | | | 146,898 | (c) |
JPMorgan Chase & Co., Senior Notes (4.586% to 4/26/32 then SOFR + 1.800%) | | | 4.586 | % | | | 4/26/33 | | | | 110,000 | | | | 104,905 | (c) |
JPMorgan Chase & Co., Senior Notes (5.546% to 12/15/24 then SOFR + 1.070%) | | | 5.546 | % | | | 12/15/25 | | | | 460,000 | | | | 458,287 | (c) |
JPMorgan Chase & Co., Subordinated Notes | | | 5.625 | % | | | 8/16/43 | | | | 80,000 | | | | 82,116 | |
Lloyds Banking Group PLC, Junior Subordinated Notes (8.000% to 3/27/30 then 5 year Treasury Constant Maturity Rate + 3.913%) | | | 8.000 | % | | | 9/27/29 | | | | 450,000 | | | | 412,267 | (b)(c) |
See Notes to Financial Statements.
| | |
| Western Asset Long Credit VIT 2023 Semi-Annual Report | | 13 |
Schedule of investments (unaudited) (cont’d)
June 30, 2023
Western Asset Long Credit VIT
(Percentages shown based on Portfolio net assets)
| | | | | | | | | | | | | | | | |
| Security | | Rate | | | Maturity
Date | | | Face
Amount | | | Value | |
Banks — continued | | | | | | | | | | | | | | | | |
Lloyds Banking Group PLC, Senior Notes (3.511% to 3/18/25 then 1 year Treasury Constant Maturity Rate + 1.600%) | | | 3.511 | % | | | 3/18/26 | | | $ | 200,000 | | | $ | 190,493 | (c) |
Mitsubishi UFJ Financial Group Inc., Senior Notes (3.837% to 4/17/25 then 1 year Treasury Constant Maturity Rate + 1.125%) | | | 3.837 | % | | | 4/17/26 | | | | 200,000 | | | | 192,389 | (c) |
Mitsubishi UFJ Financial Group Inc., Senior Notes (4.080% to 4/19/27 then 1 year Treasury Constant Maturity Rate + 1.300%) | | | 4.080 | % | | | 4/19/28 | | | | 200,000 | | | | 189,905 | (c) |
NatWest Group PLC, Senior Notes (5.847% to 3/2/26 then 1 year Treasury Constant Maturity Rate + 1.350%) | | | 5.847 | % | | | 3/2/27 | | | | 230,000 | | | | 227,630 | (c) |
PNC Financial Services Group Inc., Senior Notes (5.582% to 6/12/28 then SOFR + 1.841%) | | | 5.582 | % | | | 6/12/29 | | | | 70,000 | | | | 69,721 | (c) |
PNC Financial Services Group Inc., Senior Notes (5.812% to 6/12/25 then SOFR + 1.322%) | | | 5.812 | % | | | 6/12/26 | | | | 70,000 | | | | 69,616 | (c) |
Royal Bank of Canada, Senior Notes | | | 3.375 | % | | | 4/14/25 | | | | 60,000 | | | | 57,785 | |
Toronto-Dominion Bank, Junior Subordinated Notes (8.125% to 10/31/27 then 5 year Treasury Constant Maturity Rate + 4.075%) | | | 8.125 | % | | | 10/31/82 | | | | 220,000 | | | | 224,044 | (c) |
Toronto-Dominion Bank, Senior Notes | | | 4.456 | % | | | 6/8/32 | | | | 50,000 | | | | 47,485 | |
Truist Financial Corp., Senior Notes (5.867% to 6/8/33 then SOFR + 2.361%) | | | 5.867 | % | | | 6/8/34 | | | | 160,000 | | | | 160,139 | (c) |
Truist Financial Corp., Senior Notes (6.047% to 6/8/26 then SOFR + 2.050%) | | | 6.047 | % | | | 6/8/27 | | | | 70,000 | | | | 70,061 | (c) |
US Bancorp, Senior Notes (5.775% to 6/12/28 then SOFR + 2.020%) | | | 5.775 | % | | | 6/12/29 | | | | 40,000 | | | | 40,015 | (c) |
US Bancorp, Senior Notes (5.836% to 6/10/33 then SOFR + 2.260%) | | | 5.836 | % | | | 6/12/34 | | | | 170,000 | | | | 171,308 | (c) |
Wells Fargo & Co., Junior Subordinated Notes | | | 5.900 | % | | | 6/15/24 | | | | 140,000 | | | | 138,425 | (b)(c) |
Wells Fargo & Co., Senior Notes | | | 3.000 | % | | | 4/22/26 | | | | 270,000 | | | | 254,027 | |
Wells Fargo & Co., Senior Notes (2.406% to 10/30/24 then 3 mo. Term SOFR + 1.087%) | | | 2.406 | % | | | 10/30/25 | | | | 240,000 | | | | 228,639 | (c) |
Wells Fargo & Co., Senior Notes (2.879% to 10/30/29 then 3 mo. Term SOFR + 1.432%) | | | 2.879 | % | | | 10/30/30 | | | | 120,000 | | | | 103,743 | (c) |
Wells Fargo & Co., Senior Notes (3.068% to 4/30/40 then SOFR + 2.530%) | | | 3.068 | % | | | 4/30/41 | | | | 150,000 | | | | 110,453 | (c) |
Wells Fargo & Co., Senior Notes (4.611% to 4/25/52 then SOFR + 2.130%) | | | 4.611 | % | | | 4/25/53 | | | | 660,000 | | | | 579,371 | (c) |
Wells Fargo & Co., Senior Notes (5.389% to 4/24/33 then SOFR + 2.020%) | | | 5.389 | % | | | 4/24/34 | | | | 70,000 | | | | 69,585 | (c) |
See Notes to Financial Statements.
| | |
14 | | Western Asset Long Credit VIT 2023 Semi-Annual Report |
Western Asset Long Credit VIT
(Percentages shown based on Portfolio net assets)
| | | | | | | | | | | | | | | | |
| Security | | Rate | | | Maturity
Date | | | Face
Amount | | | Value | |
Banks — continued | | | | |
Wells Fargo & Co., Subordinated Notes | | | 4.900 | % | | | 11/17/45 | | | $ | 370,000 | | | $ | 326,092 | |
Westpac Banking Corp., Subordinated Notes | | | 3.133 | % | | | 11/18/41 | | | | 160,000 | | | | 108,596 | |
Total Banks | | | | | | | | | | | | | | | 15,384,419 | |
Capital Markets — 7.1% | | | | | | | | | | | | | | | | |
Ameriprise Financial Inc., Senior Notes | | | 5.150 | % | | | 5/15/33 | | | | 170,000 | | | | 168,913 | |
Charles Schwab Corp., Junior Subordinated Notes (5.375% to 6/1/25 then 5 year Treasury Constant Maturity Rate + 4.971%) | | | 5.375 | % | | | 6/1/25 | | | | 160,000 | | | | 153,715 | (b)(c) |
Charles Schwab Corp., Senior Notes (5.643% to 5/19/28 then SOFR + 2.210%) | | | 5.643 | % | | | 5/19/29 | | | | 80,000 | | | | 80,002 | (c) |
Charles Schwab Corp., Senior Notes (5.853% to 5/19/33 then SOFR + 2.500%) | | | 5.853 | % | | | 5/19/34 | | | | 110,000 | | | | 111,714 | (c) |
CI Financial Corp., Senior Notes | | | 3.200 | % | | | 12/17/30 | | | | 80,000 | | | | 60,050 | |
Credit Suisse AG, Senior Notes | | | 0.520 | % | | | 8/9/23 | | | | 500,000 | | | | 496,358 | |
Daimler Trucks Finance North America LLC, Senior Notes | | | 3.650 | % | | | 4/7/27 | | | | 200,000 | | | | 189,167 | (a) |
Goldman Sachs Group Inc., Junior Subordinated Notes (3.650% to 8/10/26 then 5 year Treasury Constant Maturity Rate + 2.915%) | | | 3.650 | % | | | 8/10/26 | | | | 40,000 | | | | 31,020 | (b)(c) |
Goldman Sachs Group Inc., Senior Notes | | | 4.000 | % | | | 3/3/24 | | | | 200,000 | | | | 197,483 | |
Goldman Sachs Group Inc., Senior Notes | | | 6.250 | % | | | 2/1/41 | | | | 130,000 | | | | 139,847 | |
Goldman Sachs Group Inc., Senior Notes | | | 4.800 | % | | | 7/8/44 | | | | 50,000 | | | | 45,835 | |
Goldman Sachs Group Inc., Senior Notes (1.093% to 12/9/25 then SOFR + 0.789%) | | | 1.093 | % | | | 12/9/26 | | | | 190,000 | | | | 169,414 | (c) |
Goldman Sachs Group Inc., Senior Notes (2.650% to 10/21/31 then SOFR + 1.264%) | | | 2.650 | % | | | 10/21/32 | | | | 640,000 | | | | 521,893 | (c) |
Goldman Sachs Group Inc., Senior Notes (4.223% to 5/1/28 then 3 mo. Term SOFR + 1.563%) | | | 4.223 | % | | | 5/1/29 | | | | 140,000 | | | | 132,318 | (c) |
Goldman Sachs Group Inc., Subordinated Notes | | | 6.750 | % | | | 10/1/37 | | | | 310,000 | | | | 333,685 | |
Goldman Sachs Group Inc., Subordinated Notes | | | 5.150 | % | | | 5/22/45 | | | | 140,000 | | | | 130,805 | |
Intercontinental Exchange Inc., Senior Notes | | | 4.600 | % | | | 3/15/33 | | | | 50,000 | | | | 48,589 | |
Intercontinental Exchange Inc., Senior Notes | | | 4.950 | % | | | 6/15/52 | | | | 40,000 | | | | 37,971 | |
Intercontinental Exchange Inc., Senior Notes | | | 5.200 | % | | | 6/15/62 | | | | 140,000 | | | | 139,407 | |
KKR Group Finance Co. VII LLC, Senior Notes | | | 3.625 | % | | | 2/25/50 | | | | 140,000 | | | | 96,516 | (a) |
Morgan Stanley, Senior Notes (1.593% to 5/4/26 then SOFR + 0.879%) | | | 1.593 | % | | | 5/4/27 | | | | 270,000 | | | | 241,841 | (c) |
Morgan Stanley, Senior Notes (3.217% to 4/22/41 then SOFR + 1.485%) | | | 3.217 | % | | | 4/22/42 | | | | 70,000 | | | | 53,165 | (c) |
Morgan Stanley, Senior Notes (6.342% to 10/18/32 then SOFR + 2.560%) | | | 6.342 | % | | | 10/18/33 | | | | 240,000 | | | | 255,423 | (c) |
See Notes to Financial Statements.
| | |
| Western Asset Long Credit VIT 2023 Semi-Annual Report | | 15 |
Schedule of investments (unaudited) (cont’d)
June 30, 2023
Western Asset Long Credit VIT
(Percentages shown based on Portfolio net assets)
| | | | | | | | | | | | | | | | |
| Security | | Rate | | | Maturity
Date | | | Face
Amount | | | Value | |
Capital Markets — continued | | | | | | | | | | | | | | | | |
Morgan Stanley, Subordinated Notes (2.484% to 9/16/31 then SOFR + 1.360%) | | | 2.484 | % | | | 9/16/36 | | | $ | 310,000 | | | $ | 235,342 | (c) |
Morgan Stanley, Subordinated Notes (5.948% to 1/19/33 then 5 year Treasury Constant Maturity Rate + 2.430%) | | | 5.948 | % | | | 1/19/38 | | | | 230,000 | | | | 227,149 | (c) |
Morgan Stanley Bank NA, Senior Notes | | | 4.754 | % | | | 4/21/26 | | | | 350,000 | | | | 345,007 | |
Raymond James Financial Inc., Senior Notes | | | 4.950 | % | | | 7/15/46 | | | | 50,000 | | | | 45,136 | |
S&P Global Inc., Senior Notes | | | 3.250 | % | | | 12/1/49 | | | | 40,000 | | | | 30,110 | |
UBS AG, Senior Notes | | | 1.250 | % | | | 6/1/26 | | | | 230,000 | | | | 202,446 | (a) |
UBS Group AG, Senior Notes (2.746% to 2/11/32 then 1 year Treasury Constant Maturity Rate + 1.100%) | | | 2.746 | % | | | 2/11/33 | | | | 270,000 | | | | 210,460 | (a)(c) |
UBS Group AG, Senior Notes (6.442% to 8/11/27 then SOFR + 3.700%) | | | 6.442 | % | | | 8/11/28 | | | | 270,000 | | | | 271,223 | (a)(c) |
UBS Group AG, Senior Notes (6.537% to 8/12/32 then SOFR + 3.920%) | | | 6.537 | % | | | 8/12/33 | | | | 410,000 | | | | 420,256 | (a)(c) |
UBS Group AG, Senior Notes (9.016% to 11/15/32 then SOFR + 5.020%) | | | 9.016 | % | | | 11/15/33 | | | | 250,000 | | | | 299,846 | (a)(c) |
Total Capital Markets | | | | | | | | | | | | | | | 6,122,106 | |
Consumer Finance — 0.2% | | | | | | | | | | | | | | | | |
American Express Co., Junior Subordinated Notes (3.550% to 9/15/26 then 5 year Treasury Constant Maturity Rate + 2.854%) | | | 3.550 | % | | | 9/15/26 | | | | 60,000 | | | | 49,950 | (b)(c) |
American Express Co., Senior Notes | | | 3.375 | % | | | 5/3/24 | | | | 140,000 | | | | 137,313 | |
Total Consumer Finance | | | | | | | | | | | | | | | 187,263 | |
Financial Services — 1.9% | | | | | | | | | | | | | | | | |
AerCap Ireland Capital DAC/AerCap Global Aviation Trust, Senior Notes | | | 4.500 | % | | | 9/15/23 | | | | 150,000 | | | | 149,449 | |
AerCap Ireland Capital DAC/AerCap Global Aviation Trust, Senior Notes | | | 2.450 | % | | | 10/29/26 | | | | 150,000 | | | | 134,088 | |
AerCap Ireland Capital DAC/AerCap Global Aviation Trust, Senior Notes | | | 3.400 | % | | | 10/29/33 | | | | 150,000 | | | | 120,636 | |
AerCap Ireland Capital DAC/AerCap Global Aviation Trust, Senior Notes | | | 3.850 | % | | | 10/29/41 | | | | 180,000 | | | | 136,893 | |
Berkshire Hathaway Energy Co., Senior Notes | | | 6.125 | % | | | 4/1/36 | | | | 170,000 | | | | 177,517 | |
Berkshire Hathaway Energy Co., Senior Notes | | | 4.250 | % | | | 10/15/50 | | | | 160,000 | | | | 129,991 | |
ILFC E-Capital Trust I, Ltd. GTD ((Highest of 3 mo. USD LIBOR, 10 year Treasury Constant Maturity Rate and 30 year Treasury Constant Maturity Rate) + 1.550%) | | | 7.064 | % | | | 12/21/65 | | | | 120,000 | | | | 80,951 | (a)(c) |
See Notes to Financial Statements.
| | |
16 | | Western Asset Long Credit VIT 2023 Semi-Annual Report |
Western Asset Long Credit VIT
(Percentages shown based on Portfolio net assets)
| | | | | | | | | | | | | | | | |
| Security | | Rate | | | Maturity
Date | | | Face
Amount | | | Value | |
Financial Services — continued | | | | |
ILFC E-Capital Trust II, Ltd. GTD ((Highest of 3 mo. USD LIBOR, 10 year Treasury Constant Maturity Rate and 30 year Treasury Constant Maturity Rate) + 1.800%) | | | 7.314 | % | | | 12/21/65 | | | $ | 100,000 | | | $ | 69,921 | (a)(c) |
Mastercard Inc., Senior Notes | | | 3.350 | % | | | 3/26/30 | | | | 100,000 | | | | 93,321 | |
Mastercard Inc., Senior Notes | | | 2.950 | % | | | 3/15/51 | | | | 130,000 | | | | 94,981 | |
PayPal Holdings Inc., Senior Notes | | | 2.300 | % | | | 6/1/30 | | | | 40,000 | | | | 33,940 | |
PayPal Holdings Inc., Senior Notes | | | 5.050 | % | | | 6/1/52 | | | | 170,000 | | | | 166,585 | |
Rocket Mortgage LLC/Rocket Mortgage Co-Issuer Inc., Senior Notes | | | 2.875 | % | | | 10/15/26 | | | | 120,000 | | | | 106,327 | (a) |
Rocket Mortgage LLC/Rocket Mortgage Co-Issuer Inc., Senior Notes | | | 4.000 | % | | | 10/15/33 | | | | 50,000 | | | | 39,159 | (a) |
Visa Inc., Senior Notes | | | 4.300 | % | | | 12/14/45 | | | | 130,000 | | | | 120,724 | |
Total Financial Services | | | | | | | | | | | | | | | 1,654,483 | |
Insurance — 1.7% | | | | | | | | | | | | | | | | |
AmFam Holdings Inc., Senior Notes | | | 3.833 | % | | | 3/11/51 | | | | 60,000 | | | | 37,076 | (a) |
Arthur J Gallagher & Co., Senior Notes | | | 5.750 | % | | | 3/2/53 | | | | 140,000 | | | | 140,923 | |
Berkshire Hathaway Finance Corp., Senior Notes | | | 4.200 | % | | | 8/15/48 | | | | 110,000 | | | | 99,171 | |
Chubb INA Holdings Inc., Senior Notes | | | 3.050 | % | | | 12/15/61 | | | | 80,000 | | | | 53,934 | |
Marsh & McLennan Cos. Inc., Senior Notes | | | 2.375 | % | | | 12/15/31 | | | | 40,000 | | | | 32,634 | |
Marsh & McLennan Cos. Inc., Senior Notes | | | 2.900 | % | | | 12/15/51 | | | | 50,000 | | | | 33,380 | |
Massachusetts Mutual Life Insurance Co., Subordinated Notes | | | 4.900 | % | | | 4/1/77 | | | | 80,000 | | | | 68,454 | (a) |
MetLife Inc., Junior Subordinated Notes | | | 6.400 | % | | | 12/15/36 | | | | 80,000 | | | | 79,945 | |
MetLife Inc., Senior Notes | | | 5.000 | % | | | 7/15/52 | | | | 50,000 | | | | 47,042 | |
Metropolitan Life Global Funding I, Senior Secured Notes | | | 5.150 | % | | | 3/28/33 | | | | 150,000 | | | | 148,467 | (a) |
New York Life Global Funding, Secured Notes | | | 4.550 | % | | | 1/28/33 | | | | 150,000 | | | | 144,620 | (a) |
New York Life Insurance Co., Subordinated Notes | | | 3.750 | % | | | 5/15/50 | | | | 100,000 | | | | 76,522 | (a) |
New York Life Insurance Co., Subordinated Notes | | | 4.450 | % | | | 5/15/69 | | | | 50,000 | | | | 41,733 | (a) |
Prudential Financial Inc., Junior Subordinated Notes (6.750% to 3/1/33 then 5 year Treasury Constant Maturity Rate + 2.848%) | | | 6.750 | % | | | 3/1/53 | | | | 20,000 | | | | 20,173 | (c) |
Prudential Financial Inc., Senior Notes | | | 1.500 | % | | | 3/10/26 | | | | 60,000 | | | | 54,839 | |
Reliance Standard Life Global Funding II, Secured Notes | | | 2.500 | % | | | 10/30/24 | | | | 60,000 | | | | 56,857 | (a) |
RenaissanceRe Holdings Ltd., Senior Notes | | | 5.750 | % | | | 6/5/33 | | | | 70,000 | | | | 68,618 | |
See Notes to Financial Statements.
| | |
| Western Asset Long Credit VIT 2023 Semi-Annual Report | | 17 |
Schedule of investments (unaudited) (cont’d)
June 30, 2023
Western Asset Long Credit VIT
(Percentages shown based on Portfolio net assets)
| | | | | | | | | | | | | | | | |
| Security | | Rate | | | Maturity
Date | | | Face
Amount | | | Value | |
Insurance — continued | | | | | | | | | | | | | | | | |
Teachers Insurance & Annuity Association of America, Subordinated Notes | | | 3.300 | % | | | 5/15/50 | | | $ | 230,000 | | | $ | 159,402 | (a) |
Travelers Cos. Inc., Senior Notes | | | 4.100 | % | | | 3/4/49 | | | | 50,000 | | | | 42,727 | |
Total Insurance | | | | | | | | | | | | | | | 1,406,517 | |
Total Financials | | | | | | | | | | | | | | | 24,754,788 | |
| Health Care — 10.6% | | | | | | | | | | | | | | | | |
Biotechnology — 2.6% | | | | | | | | | | | | | | | | |
AbbVie Inc., Senior Notes | | | 2.950 | % | | | 11/21/26 | | | | 530,000 | | | | 495,388 | |
AbbVie Inc., Senior Notes | | | 4.050 | % | | | 11/21/39 | | | | 340,000 | | | | 296,195 | |
AbbVie Inc., Senior Notes | | | 4.250 | % | | | 11/21/49 | | | | 420,000 | | | | 362,784 | |
Amgen Inc., Senior Notes | | | 5.150 | % | | | 3/2/28 | | | | 110,000 | | | | 109,979 | |
Amgen Inc., Senior Notes | | | 5.250 | % | | | 3/2/30 | | | | 100,000 | | | | 100,276 | |
Amgen Inc., Senior Notes | | | 5.250 | % | | | 3/2/33 | | | | 70,000 | | | | 70,123 | |
Amgen Inc., Senior Notes | | | 5.600 | % | | | 3/2/43 | | | | 150,000 | | | | 150,557 | |
Amgen Inc., Senior Notes | | | 5.650 | % | | | 3/2/53 | | | | 160,000 | | | | 162,149 | |
Amgen Inc., Senior Notes | | | 5.750 | % | | | 3/2/63 | | | | 120,000 | | | | 121,828 | |
Gilead Sciences Inc., Senior Notes | | | 3.700 | % | | | 4/1/24 | | | | 180,000 | | | | 177,448 | |
Gilead Sciences Inc., Senior Notes | | | 5.650 | % | | | 12/1/41 | | | | 60,000 | | | | 63,159 | |
Gilead Sciences Inc., Senior Notes | | | 4.750 | % | | | 3/1/46 | | | | 130,000 | | | | 122,487 | |
Total Biotechnology | | | | | | | | | | | | | | | 2,232,373 | |
Health Care Equipment & Supplies — 0.3% | | | | | | | | | | | | | | | | |
Abbott Laboratories, Senior Notes | | | 4.750 | % | | | 11/30/36 | | | | 40,000 | | | | 40,190 | |
Becton Dickinson & Co., Senior Notes | | | 4.669 | % | | | 6/6/47 | | | | 110,000 | | | | 101,183 | |
GE HealthCare Technologies Inc., Senior Notes | | | 6.377 | % | | | 11/22/52 | | | | 100,000 | | | | 111,351 | (a) |
Total Health Care Equipment & Supplies | | | | | | | | | | | | | | | 252,724 | |
Health Care Providers & Services — 5.7% | | | | | | | | | | | | | | | | |
Aetna Inc., Senior Notes | | | 3.875 | % | | | 8/15/47 | | | | 80,000 | | | | 62,423 | |
Centene Corp., Senior Notes | | | 3.375 | % | | | 2/15/30 | | | | 220,000 | | | | 189,275 | |
Cigna Group, Senior Notes | | | 4.125 | % | | | 11/15/25 | | | | 70,000 | | | | 68,170 | |
Cigna Group, Senior Notes | | | 4.375 | % | | | 10/15/28 | | | | 100,000 | | | | 96,746 | |
Cigna Group, Senior Notes | | | 4.800 | % | | | 8/15/38 | | | | 190,000 | | | | 179,556 | |
Cigna Group, Senior Notes | | | 4.900 | % | | | 12/15/48 | | | | 200,000 | | | | 186,264 | |
Cleveland Clinic Foundation, Senior Notes | | | 4.858 | % | | | 1/1/2114 | | | | 100,000 | | | | 90,116 | |
CSL Finance PLC, Senior Notes | | | 4.050 | % | | | 4/27/29 | | | | 100,000 | | | | 94,948 | (a) |
CSL Finance PLC, Senior Notes | | | 4.625 | % | | | 4/27/42 | | | | 40,000 | | | | 37,171 | (a) |
CVS Health Corp., Senior Notes | | | 3.875 | % | | | 7/20/25 | | | | 140,000 | | | | 136,105 | |
CVS Health Corp., Senior Notes | | | 1.300 | % | | | 8/21/27 | | | | 270,000 | | | | 232,501 | |
CVS Health Corp., Senior Notes | | | 5.250 | % | | | 1/30/31 | | | | 70,000 | | | | 69,802 | |
CVS Health Corp., Senior Notes | | | 4.780 | % | | | 3/25/38 | | | | 360,000 | | | | 332,433 | |
See Notes to Financial Statements.
| | |
18 | | Western Asset Long Credit VIT 2023 Semi-Annual Report |
Western Asset Long Credit VIT
(Percentages shown based on Portfolio net assets)
| | | | | | | | | | | | | | | | |
| Security | | Rate | | | Maturity
Date | | | Face
Amount | | | Value | |
Health Care Providers & Services — continued | | | | |
CVS Health Corp., Senior Notes | | | 2.700 | % | | | 8/21/40 | | | $ | 180,000 | | | $ | 125,784 | |
CVS Health Corp., Senior Notes | | | 5.050 | % | | | 3/25/48 | | | | 220,000 | | | | 202,940 | |
Elevance Health Inc., Senior Notes | | | 5.500 | % | | | 10/15/32 | | | | 180,000 | | | | 185,172 | |
Elevance Health Inc., Senior Notes | | | 6.100 | % | | | 10/15/52 | | | | 210,000 | | | | 230,258 | |
HCA Inc., Senior Notes | | | 5.200 | % | | | 6/1/28 | | | | 200,000 | | | | 198,514 | |
HCA Inc., Senior Notes | | | 5.500 | % | | | 6/1/33 | | | | 40,000 | | | | 39,954 | |
HCA Inc., Senior Notes | | | 5.125 | % | | | 6/15/39 | | | | 40,000 | | | | 37,142 | |
HCA Inc., Senior Notes | | | 5.900 | % | | | 6/1/53 | | | | 130,000 | | | | 128,907 | |
Humana Inc., Senior Notes | | | 5.875 | % | | | 3/1/33 | | | | 80,000 | | | | 83,178 | |
Humana Inc., Senior Notes | | | 5.500 | % | | | 3/15/53 | | | | 50,000 | | | | 49,844 | |
Kaiser Foundation Hospitals, Senior Notes | | | 2.810 | % | | | 6/1/41 | | | | 200,000 | | | | 147,100 | |
McKesson Corp., Senior Notes | | | 4.900 | % | | | 7/15/28 | | | | 100,000 | | | | 99,402 | |
Northwell Healthcare Inc., Secured Notes | | | 4.260 | % | | | 11/1/47 | | | | 100,000 | | | | 82,169 | |
UnitedHealth Group Inc., Senior Notes | | | 4.000 | % | | | 5/15/29 | | | | 190,000 | | | | 181,711 | |
UnitedHealth Group Inc., Senior Notes | | | 5.350 | % | | | 2/15/33 | | | | 290,000 | | | | 301,522 | |
UnitedHealth Group Inc., Senior Notes | | | 4.250 | % | | | 3/15/43 | | | | 220,000 | | | | 200,446 | |
UnitedHealth Group Inc., Senior Notes | | | 5.875 | % | | | 2/15/53 | | | | 560,000 | | | | 622,609 | |
UnitedHealth Group Inc., Senior Notes | | | 6.050 | % | | | 2/15/63 | | | | 210,000 | | | | 237,683 | |
Total Health Care Providers & Services | | | | | | | | | | | | | | | 4,929,845 | |
Pharmaceuticals — 2.0% | | | | | | | | | | | | | | | | |
AstraZeneca PLC, Senior Notes | | | 3.000 | % | | | 5/28/51 | | | | 80,000 | | | | 59,413 | |
Bristol-Myers Squibb Co., Senior Notes | | | 3.200 | % | | | 6/15/26 | | | | 100,000 | | | | 95,743 | |
Bristol-Myers Squibb Co., Senior Notes | | | 2.550 | % | | | 11/13/50 | | | | 210,000 | | | | 136,713 | |
Eli Lilly & Co., Senior Notes | | | 4.875 | % | | | 2/27/53 | | | | 50,000 | | | | 51,396 | |
Eli Lilly & Co., Senior Notes | | | 4.950 | % | | | 2/27/63 | | | | 50,000 | | | | 51,070 | |
Johnson & Johnson, Senior Notes | | | 2.100 | % | | | 9/1/40 | | | | 60,000 | | | | 42,309 | |
Johnson & Johnson, Senior Notes | | | 3.700 | % | | | 3/1/46 | | | | 100,000 | | | | 88,152 | |
Johnson & Johnson, Senior Notes | | | 2.450 | % | | | 9/1/60 | | | | 80,000 | | | | 51,807 | |
Merck & Co. Inc., Senior Notes | | | 1.450 | % | | | 6/24/30 | | | | 50,000 | | | | 40,797 | |
Pfizer Inc., Senior Notes | | | 4.125 | % | | | 12/15/46 | | | | 110,000 | | | | 98,705 | |
Pfizer Investment Enterprises Pte Ltd., Senior Notes | | | 4.450 | % | | | 5/19/28 | | | | 50,000 | | | | 49,168 | |
Pfizer Investment Enterprises Pte Ltd., Senior Notes | | | 4.650 | % | | | 5/19/30 | | | | 80,000 | | | | 79,084 | |
Pfizer Investment Enterprises Pte Ltd., Senior Notes | | | 4.750 | % | | | 5/19/33 | | | | 140,000 | | | | 139,527 | |
Pfizer Investment Enterprises Pte Ltd., Senior Notes | | | 5.110 | % | | | 5/19/43 | | | | 160,000 | | | | 160,466 | |
Pfizer Investment Enterprises Pte Ltd., Senior Notes | | | 5.300 | % | | | 5/19/53 | | | | 110,000 | | | | 114,451 | |
Pfizer Investment Enterprises Pte Ltd., Senior Notes | | | 5.340 | % | | | 5/19/63 | | | | 150,000 | | | | 151,918 | |
Teva Pharmaceutical Finance Netherlands III BV, Senior Notes | | | 8.125 | % | | | 9/15/31 | | | | 200,000 | | | | 209,866 | |
See Notes to Financial Statements.
| | |
| Western Asset Long Credit VIT 2023 Semi-Annual Report | | 19 |
Schedule of investments (unaudited) (cont’d)
June 30, 2023
Western Asset Long Credit VIT
(Percentages shown based on Portfolio net assets)
| | | | | | | | | | | | | | | | |
Security | | Rate | | | Maturity
Date | | | Face
Amount | | | Value | |
Pharmaceuticals — continued | | | | | | | | | | | | | | | | |
Teva Pharmaceutical Finance Netherlands III BV, Senior Notes | | | 4.100 | % | | | 10/1/46 | | | $ | 100,000 | | | $ | 65,875 | |
Wyeth LLC, Senior Notes | | | 5.950 | % | | | 4/1/37 | | | | 50,000 | | | | 54,694 | |
Total Pharmaceuticals | | | | | | | | | | | | | | | 1,741,154 | |
Total Health Care | | | | | | | | | | | | | | | 9,156,096 | |
| Industrials — 6.8% | | | | | | | | | | | | | | | | |
Aerospace & Defense — 2.9% | | | | | | | | | | | | | | | | |
Boeing Co., Senior Notes | | | 2.196 | % | | | 2/4/26 | | | | 500,000 | | | | 459,115 | |
Boeing Co., Senior Notes | | | 5.705 | % | | | 5/1/40 | | | | 70,000 | | | | 69,879 | |
Boeing Co., Senior Notes | | | 3.750 | % | | | 2/1/50 | | | | 220,000 | | | | 165,358 | |
Boeing Co., Senior Notes | | | 5.805 | % | | | 5/1/50 | | | | 170,000 | | | | 169,524 | |
Boeing Co., Senior Notes | | | 3.950 | % | | | 8/1/59 | | | | 130,000 | | | | 96,132 | |
Boeing Co., Senior Notes | | | 5.930 | % | | | 5/1/60 | | | | 70,000 | | | | 69,383 | |
General Dynamics Corp., Senior Notes | | | 3.500 | % | | | 4/1/27 | | | | 50,000 | | | | 47,750 | |
General Dynamics Corp., Senior Notes | | | 3.625 | % | | | 4/1/30 | | | | 70,000 | | | | 66,003 | |
General Dynamics Corp., Senior Notes | | | 4.250 | % | | | 4/1/40 | | | | 70,000 | | | | 64,474 | |
Howmet Aerospace Inc., Senior Notes | | | 6.875 | % | | | 5/1/25 | | | | 70,000 | | | | 71,176 | |
L3Harris Technologies Inc., Senior Notes | | | 4.400 | % | | | 6/15/28 | | | | 50,000 | | | | 48,105 | |
L3Harris Technologies Inc., Senior Notes | | | 4.854 | % | | | 4/27/35 | | | | 40,000 | | | | 38,467 | |
Lockheed Martin Corp., Senior Notes | | | 1.850 | % | | | 6/15/30 | | | | 80,000 | | | | 66,630 | |
Lockheed Martin Corp., Senior Notes | | | 4.500 | % | | | 5/15/36 | | | | 50,000 | | | | 48,304 | |
Lockheed Martin Corp., Senior Notes | | | 4.090 | % | | | 9/15/52 | | | | 110,000 | | | | 96,877 | |
Lockheed Martin Corp., Senior Notes | | | 4.300 | % | | | 6/15/62 | | | | 170,000 | | | | 150,759 | |
Northrop Grumman Corp., Senior Notes | | | 3.200 | % | | | 2/1/27 | | | | 80,000 | | | | 75,463 | |
Northrop Grumman Corp., Senior Notes | | | 5.250 | % | | | 5/1/50 | | | | 170,000 | | | | 172,985 | |
Raytheon Technologies Corp., Senior Notes | | | 3.950 | % | | | 8/16/25 | | | | 100,000 | | | | 98,018 | |
Raytheon Technologies Corp., Senior Notes | | | 4.500 | % | | | 6/1/42 | | | | 180,000 | | | | 165,804 | |
Raytheon Technologies Corp., Senior Notes | | | 4.625 | % | | | 11/16/48 | | | | 130,000 | | | | 121,443 | |
Raytheon Technologies Corp., Senior Notes | | | 5.375 | % | | | 2/27/53 | | | | 100,000 | | | | 103,946 | |
Total Aerospace & Defense | | | | | | | | | | | | | | | 2,465,595 | |
Building Products — 0.0%†† | | | | | | | | | | | | | | | | |
Lennox International Inc., Senior Notes | | | 1.700 | % | | | 8/1/27 | | | | 50,000 | | | | 43,486 | |
Commercial Services & Supplies — 0.3% | | | | | | | | | | | | | | | | |
California Institute of Technology, Senior Notes | | | 4.700 | % | | | 11/1/2111 | | | | 140,000 | | | | 122,690 | |
Cintas Corp. No 2, Senior Notes | | | 3.700 | % | | | 4/1/27 | | | | 70,000 | | | | 67,514 | |
Republic Services Inc., Senior Notes | | | 3.950 | % | | | 5/15/28 | | | | 50,000 | | | | 47,982 | |
Total Commercial Services & Supplies | | | | | | | | | | | | | | | 238,186 | |
Construction & Engineering — 0.2% | | | | | | | | | | | | | | | | |
Vinci SA, Senior Notes | | | 3.750 | % | | | 4/10/29 | | | | 200,000 | | | | 187,078 | (a) |
See Notes to Financial Statements.
| | |
20 | | Western Asset Long Credit VIT 2023 Semi-Annual Report |
Western Asset Long Credit VIT
(Percentages shown based on Portfolio net assets)
| | | | | | | | | | | | | | | | |
| Security | | Rate | | | Maturity Date | | | Face
Amount | | | Value | |
Electrical Equipment — 0.3% | | | | | | | | | | | | | | | | |
Eaton Corp., Senior Notes | | | 4.150 | % | | | 11/2/42 | | | $ | 80,000 | | | $ | 71,285 | |
Regal Rexnord Corp., Senior Notes | | | 6.050 | % | | | 2/15/26 | | | | 150,000 | | | | 150,277 | (a) |
Total Electrical Equipment | | | | | | | | | | | | | | | 221,562 | |
Ground Transportation — 0.6% | | | | | | | | | | | | | | | | |
Burlington Northern Santa Fe LLC, Senior Notes | | | 5.050 | % | | | 3/1/41 | | | | 80,000 | | | | 79,000 | |
Canadian Pacific Railway Co., Senior Notes | | | 3.100 | % | | | 12/2/51 | | | | 70,000 | | | | 49,753 | |
Norfolk Southern Corp., Senior Notes | | | 4.550 | % | | | 6/1/53 | | | | 140,000 | | | | 126,642 | |
Norfolk Southern Corp., Senior Notes | | | 3.155 | % | | | 5/15/55 | | | | 80,000 | | | | 54,812 | |
Union Pacific Corp., Senior Notes | | | 2.973 | % | | | 9/16/62 | | | | 160,000 | | | | 104,415 | |
Union Pacific Corp., Senior Notes | | | 3.799 | % | | | 4/6/71 | | | | 130,000 | | | | 99,424 | |
Total Ground Transportation | | | | | | | | | | | | | | | 514,046 | |
Industrial Conglomerates — 0.2% | | | | | | | | | | | | | | | | |
3M Co., Senior Notes | | | 2.875 | % | | | 10/15/27 | | | | 100,000 | | | | 91,584 | |
Honeywell International Inc., Senior Notes | | | 5.000 | % | | | 2/15/33 | | | | 110,000 | | | | 112,232 | |
Total Industrial Conglomerates | | | | | | | | | | | | | | | 203,816 | |
Passenger Airlines — 1.9% | | | | | | | | | | | | | | | | |
American Airlines Inc., Senior Secured Notes | | | 11.750 | % | | | 7/15/25 | | | | 170,000 | | | | 186,563 | (a) |
American Airlines Inc./AAdvantage Loyalty IP Ltd., Senior Secured Notes | | | 5.500 | % | | | 4/20/26 | | | | 140,000 | | | | 138,823 | (a) |
American Airlines Inc./AAdvantage Loyalty IP Ltd., Senior Secured Notes | | | 5.750 | % | | | 4/20/29 | | | | 70,000 | | | | 68,031 | (a) |
Delta Air Lines Inc., Senior Notes | | | 7.375 | % | | | 1/15/26 | | | | 70,000 | | | | 73,037 | |
Delta Air Lines Inc., Senior Notes | | | 3.750 | % | | | 10/28/29 | | | | 50,000 | | | | 45,010 | |
Delta Air Lines Inc./SkyMiles IP Ltd., Senior Secured Notes | | | 4.750 | % | | | 10/20/28 | | | | 210,000 | | | | 204,014 | (a) |
Hawaiian Brand Intellectual Property Ltd./ HawaiianMiles Loyalty Ltd., Senior Secured Notes | | | 5.750 | % | | | 1/20/26 | | | | 150,000 | | | | 142,122 | (a) |
Mileage Plus Holdings LLC/Mileage Plus Intellectual Property Assets Ltd., Senior Secured Notes | | | 6.500 | % | | | 6/20/27 | | | | 160,000 | | | | 160,543 | (a) |
Southwest Airlines Co., Senior Notes | | | 5.250 | % | | | 5/4/25 | | | | 50,000 | | | | 49,492 | |
Spirit Loyalty Cayman Ltd./Spirit IP Cayman Ltd., Senior Secured Notes | | | 8.000 | % | | | 9/20/25 | | | | 270,000 | | | | 272,259 | (a) |
United Airlines Pass-Through Trust | | | 5.800 | % | | | 1/15/36 | | | | 340,000 | | | | 346,696 | |
Total Passenger Airlines | | | | | | | | | | | | | | | 1,686,590 | |
Trading Companies & Distributors — 0.4% | | | | | | | | | | | | | | | | |
Air Lease Corp., Senior Notes | | | 3.375 | % | | | 7/1/25 | | | | 190,000 | | | | 180,188 | |
Air Lease Corp., Senior Notes | | | 1.875 | % | | | 8/15/26 | | | | 50,000 | | | | 44,439 | |
See Notes to Financial Statements.
| | |
| Western Asset Long Credit VIT 2023 Semi-Annual Report | | 21 |
Schedule of investments (unaudited) (cont’d)
June 30, 2023
Western Asset Long Credit VIT
(Percentages shown based on Portfolio net assets)
| | | | | | | | | | | | | | | | |
| Security | | Rate | | | Maturity Date | | | Face
Amount | | | Value | |
Trading Companies & Distributors — continued | | | | | | | | | | | | | | | | |
Air Lease Corp., Senior Notes | | | 5.850 | % | | | 12/15/27 | | | $ | 80,000 | | | $ | 79,969 | |
Air Lease Corp., Senior Notes | | | 5.300 | % | | | 2/1/28 | | | | 50,000 | | | | 49,107 | |
Total Trading Companies & Distributors | | | | | | | | 353,703 | |
Total Industrials | | | | | | | | | | | | | | | 5,914,062 | |
| Information Technology — 4.1% | | | | | | | | | | | | | | | | |
Electronic Equipment, Instruments & Components — 0.2% | | | | | | | | | | | | | | | | |
Jabil Inc., Senior Notes | | | 5.450 | % | | | 2/1/29 | | | | 50,000 | | | | 49,644 | |
TD SYNNEX Corp., Senior Notes | | | 1.250 | % | | | 8/9/24 | | | | 120,000 | | | | 113,548 | |
Total Electronic Equipment, Instruments & Components | | | | | | | | | | | | | | | 163,192 | |
IT Services — 0.1% | | | | | | | | | | | | | | | | |
Kyndryl Holdings Inc., Senior Notes | | | 3.150 | % | | | 10/15/31 | | | | 100,000 | | | | 75,091 | |
Semiconductors & Semiconductor Equipment — 1.8% | | | | | | | | | | | | | | | | |
Broadcom Inc., Senior Notes | | | 4.300 | % | | | 11/15/32 | | | | 120,000 | | | | 110,121 | |
Intel Corp., Senior Notes | | | 2.800 | % | | | 8/12/41 | | | | 70,000 | | | | 49,940 | |
Intel Corp., Senior Notes | | | 3.734 | % | | | 12/8/47 | | | | 50,000 | | | | 38,917 | |
Intel Corp., Senior Notes | | | 4.900 | % | | | 8/5/52 | | | | 100,000 | | | | 92,378 | |
Intel Corp., Senior Notes | | | 5.700 | % | | | 2/10/53 | | | | 70,000 | | | | 71,261 | |
Intel Corp., Senior Notes | | | 3.200 | % | | | 8/12/61 | | | | 80,000 | | | | 52,055 | |
KLA Corp., Senior Notes | | | 4.650 | % | | | 7/15/32 | | | | 40,000 | | | | 39,877 | |
KLA Corp., Senior Notes | | | 4.950 | % | | | 7/15/52 | | | | 70,000 | | | | 69,004 | |
Lam Research corp., Senior Notes | | | 1.900 | % | | | 6/15/30 | | | | 70,000 | | | | 58,367 | |
Lam Research Corp., Senior Notes | | | 3.125 | % | | | 6/15/60 | | | | 20,000 | | | | 13,488 | |
Micron Technology Inc., Senior Notes | | | 5.875 | % | | | 9/15/33 | | | | 140,000 | | | | 138,805 | |
Micron Technology Inc., Senior Notes | | | 3.366 | % | | | 11/1/41 | | | | 50,000 | | | | 34,995 | |
QUALCOMM Inc., Senior Notes | | | 4.500 | % | | | 5/20/52 | | | | 100,000 | | | | 91,082 | |
Texas Instruments Inc., Senior Notes | | | 2.900 | % | | | 11/3/27 | | | | 70,000 | | | | 65,303 | |
Texas Instruments Inc., Senior Notes | | | 3.650 | % | | | 8/16/32 | | | | 50,000 | | | | 46,471 | |
Texas Instruments Inc., Senior Notes | | | 3.875 | % | | | 3/15/39 | | | | 80,000 | | | | 71,742 | |
Texas Instruments Inc., Senior Notes | | | 4.150 | % | | | 5/15/48 | | | | 80,000 | | | | 72,748 | |
Texas Instruments Inc., Senior Notes | | | 5.050 | % | | | 5/18/63 | | | | 100,000 | | | | 100,284 | |
TSMC Arizona Corp., Senior Notes | | | 2.500 | % | | | 10/25/31 | | | | 200,000 | | | | 167,797 | |
TSMC Arizona Corp., Senior Notes | | | 3.250 | % | | | 10/25/51 | | | | 200,000 | | | | 153,883 | |
Total Semiconductors & Semiconductor Equipment | | | | | | | | | | | | | | | 1,538,518 | |
Software — 1.5% | | | | | | | | | | | | | | | | |
Fortinet Inc., Senior Notes | | | 1.000 | % | | | 3/15/26 | | | | 50,000 | | | | 44,653 | |
Microsoft Corp., Senior Notes | | | 2.921 | % | | | 3/17/52 | | | | 150,000 | | | | 111,693 | |
Microsoft Corp., Senior Notes | | | 3.041 | % | | | 3/17/62 | | | | 50,000 | | | | 36,516 | |
Oracle Corp., Senior Notes | | | 6.250 | % | | | 11/9/32 | | | | 130,000 | | | | 138,050 | |
Oracle Corp., Senior Notes | | | 4.000 | % | | | 7/15/46 | | | | 310,000 | | | | 238,470 | |
See Notes to Financial Statements.
| | |
22 | | Western Asset Long Credit VIT 2023 Semi-Annual Report |
Western Asset Long Credit VIT
(Percentages shown based on Portfolio net assets)
| | | | | | | | | | | | | | | | |
| Security | | Rate | | | Maturity Date | | | Face Amount | | | Value | |
Software — continued | | | | | | | | | | | | | | | | |
Oracle Corp., Senior Notes | | | 5.550 | % | | | 2/6/53 | | | $ | 570,000 | | | $ | 552,368 | |
Oracle Corp., Senior Notes | | | 4.100 | % | | | 3/25/61 | | | | 130,000 | | | | 96,052 | |
Salesforce Inc., Senior Notes | | | 1.500 | % | | | 7/15/28 | | | | 80,000 | | | | 68,960 | |
Total Software | | | | | | | | | | | | | | | 1,286,762 | |
Technology Hardware, Storage & Peripherals — 0.5% | | | | | | | | | |
Apple Inc., Senior Notes | | | 1.400 | % | | | 8/5/28 | | | | 180,000 | | | | 155,469 | |
Apple Inc., Senior Notes | | | 2.650 | % | | | 5/11/50 | | | | 400,000 | | | | 278,730 | |
Dell International LLC/EMC Corp., Senior Notes | | | 8.100 | % | | | 7/15/36 | | | | 50,000 | | | | 58,536 | |
Total Technology Hardware, Storage & Peripherals | | | | | | | | | | | | 492,735 | |
Total Information Technology | | | | | | | | | | | | | | | 3,556,298 | |
| Materials — 3.4% | | | | | | | | | | | | | | | | |
Chemicals — 0.6% | | | | | | | | | | | | | | | | |
OCP SA, Senior Notes | | | 3.750 | % | | | 6/23/31 | | | | 200,000 | | | | 165,906 | (a) |
Sasol Financing USA LLC, Senior Notes | | | 8.750 | % | | | 5/3/29 | | | | 200,000 | | | | 195,041 | (a) |
Sociedad Quimica y Minera de Chile SA, Senior Notes | | | 3.500 | % | | | 9/10/51 | | | | 200,000 | | | | 141,407 | (a) |
Total Chemicals | | | | | | | | | | | | | | | 502,354 | |
Containers & Packaging — 0.0%†† | | | | | | | | | | | | | | | | |
Ball Corp., Senior Notes | | | 3.125 | % | | | 9/15/31 | | | | 50,000 | | | | 41,190 | |
Metals & Mining — 2.8% | | | | | | | | | | | | | | | | |
Alcoa Nederland Holding BV, Senior Notes | | | 5.500 | % | | | 12/15/27 | | | | 200,000 | | | | 193,633 | (a) |
Anglo American Capital PLC, Senior Notes | | | 4.000 | % | | | 9/11/27 | | | | 200,000 | | | | 188,217 | (a) |
ArcelorMittal SA, Senior Notes | | | 6.550 | % | | | 11/29/27 | | | | 40,000 | | | | 41,052 | |
ArcelorMittal SA, Senior Notes | | | 6.750 | % | | | 3/1/41 | | | | 60,000 | | | | 61,146 | |
Barrick North America Finance LLC, Senior Notes | | | 5.750 | % | | | 5/1/43 | | | | 140,000 | | | | 144,024 | |
First Quantum Minerals Ltd., Senior Notes | | | 6.875 | % | | | 10/15/27 | | | | 500,000 | | | | 488,507 | (a) |
First Quantum Minerals Ltd., Senior Notes | | | 8.625 | % | | | 6/1/31 | | | | 200,000 | | | | 205,226 | (a) |
Freeport-McMoRan Inc., Senior Notes | | | 4.125 | % | | | 3/1/28 | | | | 40,000 | | | | 37,515 | |
Freeport-McMoRan Inc., Senior Notes | | | 5.400 | % | | | 11/14/34 | | | | 80,000 | | | | 77,367 | |
Freeport-McMoRan Inc., Senior Notes | | | 5.450 | % | | | 3/15/43 | | | | 80,000 | | | | 74,703 | |
Glencore Finance Canada Ltd., Senior Notes | | | 5.550 | % | | | 10/25/42 | | | | 200,000 | | | | 186,321 | (a) |
Glencore Funding LLC, Senior Notes | | | 1.625 | % | | | 9/1/25 | | | | 220,000 | | | | 202,062 | (a) |
Glencore Funding LLC, Senior Notes | | | 3.875 | % | | | 10/27/27 | | | | 70,000 | | | | 65,484 | (a) |
Glencore Funding LLC, Senior Notes | | | 3.375 | % | | | 9/23/51 | | | | 80,000 | | | | 53,999 | (a) |
Rio Tinto Finance USA Ltd., Senior Notes | | | 5.200 | % | | | 11/2/40 | | | | 50,000 | | | | 50,503 | |
Southern Copper Corp., Senior Notes | | | 5.250 | % | | | 11/8/42 | | | | 200,000 | | | | 191,488 | |
Teck Resources Ltd., Senior Notes | | | 6.250 | % | | | 7/15/41 | | | | 120,000 | | | | 121,455 | |
Total Metals & Mining | | | | | | | | | | | | | | | 2,382,702 | |
Total Materials | | | | | | | | | | | | | | | 2,926,246 | |
See Notes to Financial Statements.
| | |
| Western Asset Long Credit VIT 2023 Semi-Annual Report | | 23 |
Schedule of investments (unaudited) (cont’d)
June 30, 2023
Western Asset Long Credit VIT
(Percentages shown based on Portfolio net assets)
| | | | | | | | | | | | | | | | |
| Security | | Rate | | | Maturity Date | | | Face Amount | | | Value | |
| Real Estate — 0.8% | | | | | | | | | | | | | | | | |
Health Care REITs — 0.1% | | | | | | | | | | | | | | | | |
Diversified Healthcare Trust, Senior Notes | | | 4.750 | % | | | 5/1/24 | | | $ | 60,000 | | | $ | 55,944 | |
Welltower OP LLC, Senior Notes | | | 3.850 | % | | | 6/15/32 | | | | 50,000 | | | | 44,120 | |
Total Health Care REITs | | | | | | | | | | | | | | | 100,064 | |
Industrial REITs — 0.1% | | | | | | | | | | | | | | | | |
Prologis LP, Senior Notes | | | 1.250 | % | | | 10/15/30 | | | | 60,000 | | | | 46,395 | |
Office REITs — 0.1% | | | | | | | | | | | | | | | | |
Alexandria Real Estate Equities Inc., Senior Notes | | | 2.000 | % | | | 5/18/32 | | | | 60,000 | | | | 45,377 | |
Alexandria Real Estate Equities Inc., Senior Notes | | | 3.000 | % | | | 5/18/51 | | | | 120,000 | | | | 73,946 | |
Total Office REITs | | | | | | | | | | | | | | | 119,323 | |
Residential REITs — 0.1% | | | | | | | | | | | | | | | | |
Invitation Homes Operating Partnership LP, Senior Notes | | | 4.150 | % | | | 4/15/32 | | | | 50,000 | | | | 44,839 | |
Retail REITs — 0.3% | | | | | | | | | | | | | | | | |
Kimco Realty OP LLC, Senior Notes | | | 2.250 | % | | | 12/1/31 | | | | 130,000 | | | | 101,334 | |
WEA Finance LLC/Westfield UK & Europe Finance PLC, Senior Notes | | | 3.750 | % | | | 9/17/24 | | | | 200,000 | | | | 188,951 | (a) |
Total Retail REITs | | | | | | | | | | | | | | | 290,285 | |
Specialized REITs — 0.1% | | | | | | | | | | | | | | | | |
Extra Space Storage LP, Senior Notes | | | 3.900 | % | | | 4/1/29 | | | | 50,000 | | | | 45,615 | |
Total Real Estate | | | | | | | | | | | | | | | 646,521 | |
| Utilities — 5.5% | | | | | | | | | | | | | | | | |
Electric Utilities — 5.2% | | | | | | | | | | | | | | | | |
AEP Transmission Co. LLC, Senior Notes | | | 4.500 | % | | | 6/15/52 | | | | 50,000 | | | | 44,815 | |
CenterPoint Energy Houston Electric LLC, Senior Secured Bonds | | | 4.950 | % | | | 4/1/33 | | | | 70,000 | | | | 69,914 | |
CenterPoint Energy Houston Electric LLC, Senior Secured Bonds | | | 4.250 | % | | | 2/1/49 | | | | 110,000 | | | | 95,947 | |
Comision Federal de Electricidad, Senior Notes | | | 3.348 | % | | | 2/9/31 | | | | 200,000 | | | | 158,248 | (a) |
Commonwealth Edison Co., First Mortgage Bonds | | | 5.300 | % | | | 2/1/53 | | | | 110,000 | | | | 112,030 | |
DTE Electric Co., Senior Secured Bonds | | | 3.250 | % | | | 4/1/51 | | | | 80,000 | | | | 57,993 | |
Duke Energy Carolinas LLC, First Mortgage Bonds | | | 4.950 | % | | | 1/15/33 | | | | 50,000 | | | | 49,655 | |
Duke Energy Carolinas LLC, First Mortgage Bonds | | | 5.300 | % | | | 2/15/40 | | | | 80,000 | | | | 80,387 | |
Duke Energy Carolinas LLC, First Mortgage Bonds | | | 5.400 | % | | | 1/15/54 | | | | 30,000 | | | | 30,597 | |
Duke Energy Florida LLC, First Mortgage Bonds | | | 3.400 | % | | | 10/1/46 | | | | 80,000 | | | | 59,890 | |
Duke Energy Indiana LLC, First Mortgage Bonds | | | 5.400 | % | | | 4/1/53 | | | | 100,000 | | | | 100,957 | |
Duke Energy Progress LLC, First Mortgage Bonds | | | 3.450 | % | | | 3/15/29 | | | | 100,000 | | | | 91,751 | |
Duke Energy Progress LLC, First Mortgage Bonds | | | 5.350 | % | | | 3/15/53 | | | | 110,000 | | | | 110,913 | |
See Notes to Financial Statements.
| | |
24 | | Western Asset Long Credit VIT 2023 Semi-Annual Report |
Western Asset Long Credit VIT
(Percentages shown based on Portfolio net assets)
| | | | | | | | | | | | | | | | |
| Security | | Rate | | | Maturity Date | | | Face Amount | | | Value | |
Electric Utilities — continued | | | | | | | | | | | | | | | | |
Edison International, Junior Subordinated Notes (5.000% to 3/15/27 then 5 year Treasury Constant Maturity Rate + 3.901%) | | | 5.000 | % | | | 12/15/26 | | | $ | 110,000 | | | $ | 95,304 | (b)(c) |
Edison International, Junior Subordinated Notes (5.375% to 3/15/26 then 5 year Treasury Constant Maturity Rate + 4.698%) | | | 5.375 | % | | | 3/15/26 | | | | 100,000 | | | | 87,640 | (b)(c) |
Edison International, Junior Subordinated Notes (8.125% to 6/15/28 then 5 year Treasury Constant Maturity Rate + 3.864%) | | | 8.125 | % | | | 6/15/53 | | | | 110,000 | | | | 112,525 | (c) |
Edison International, Senior Notes | | | 4.950 | % | | | 4/15/25 | | | | 60,000 | | | | 58,767 | |
Enel Finance International NV, Senior Notes | | | 6.800 | % | | | 10/14/25 | | | | 200,000 | | | | 203,804 | (a) |
Entergy Mississippi LLC, First Mortgage Bonds | | | 5.000 | % | | | 9/1/33 | | | | 60,000 | | | | 58,912 | |
Exelon Corp., Senior Notes | | | 5.625 | % | | | 6/15/35 | | | | 100,000 | | | | 101,239 | |
FirstEnergy Corp., Senior Notes | | | 4.150 | % | | | 7/15/27 | | | | 50,000 | | | | 47,537 | |
FirstEnergy Corp., Senior Notes | | | 5.100 | % | | | 7/15/47 | | | | 230,000 | | | | 206,616 | |
Florida Power & Light Co., First Mortgage Bonds | | | 5.300 | % | | | 4/1/53 | | | | 80,000 | | | | 82,849 | |
Kentucky Utilities Co., First Mortgage Bonds | | | 5.450 | % | | | 4/15/33 | | | | 50,000 | | | | 50,970 | |
Kentucky Utilities Co., First Mortgage Bonds | | | 3.300 | % | | | 6/1/50 | | | | 80,000 | | | | 57,027 | |
Louisville Gas and Electric Co., First Mortgage Bonds | | | 5.450 | % | | | 4/15/33 | | | | 50,000 | | | | 50,966 | |
Metropolitan Edison Co., Senior Notes | | | 5.200 | % | | | 4/1/28 | | | | 50,000 | | | | 49,536 | (a) |
Monongahela Power Co., First Mortgage Bonds | | | 5.400 | % | | | 12/15/43 | | | | 110,000 | | | | 106,842 | (a) |
NextEra Energy Capital Holdings Inc., Senior Notes | | | 6.051 | % | | | 3/1/25 | | | | 110,000 | | | | 110,463 | |
NRG Energy Inc., Senior Secured Notes | | | 2.450 | % | | | 12/2/27 | | | | 120,000 | | | | 101,227 | (a) |
Ohio Edison Co., Senior Notes | | | 5.500 | % | | | 1/15/33 | | | | 140,000 | | | | 140,370 | (a) |
Oncor Electric Delivery Co. LLC, Senior Secured Notes | | | 4.600 | % | | | 6/1/52 | | | | 150,000 | | | | 137,312 | |
Pacific Gas and Electric Co., First Mortgage Bonds | | | 2.100 | % | | | 8/1/27 | | | | 160,000 | | | | 136,793 | |
Pacific Gas and Electric Co., First Mortgage Bonds | | | 2.500 | % | | | 2/1/31 | | | | 100,000 | | | | 78,367 | |
Pacific Gas and Electric Co., First Mortgage Bonds | | | 4.950 | % | | | 7/1/50 | | | | 150,000 | | | | 118,010 | |
Pacific Gas and Electric Co., First Mortgage Bonds | | | 6.750 | % | | | 1/15/53 | | | | 50,000 | | | | 49,407 | |
Pacific Gas and Electric Co., First Mortgage Bonds | | | 6.700 | % | | | 4/1/53 | | | | 200,000 | | | | 196,545 | |
Pennsylvania Electric Co., Senior Notes | | | 5.150 | % | | | 3/30/26 | | | | 50,000 | | | | 49,267 | (a) |
PG&E Wildfire Recovery Funding LLC, Senior Secured Notes | | | 4.674 | % | | | 12/1/51 | | | | 400,000 | | | | 375,818 | |
Progress Energy Inc., Senior Notes | | | 6.000 | % | | | 12/1/39 | | | | 60,000 | | | | 60,790 | |
Southern California Edison Co., First Mortgage Bonds | | | 2.250 | % | | | 6/1/30 | | | | 50,000 | | | | 41,852 | |
Southern California Edison Co., First Mortgage Bonds | | | 4.650 | % | | | 10/1/43 | | | | 170,000 | | | | 149,223 | |
See Notes to Financial Statements.
| | |
| Western Asset Long Credit VIT 2023 Semi-Annual Report | | 25 |
Schedule of investments (unaudited) (cont’d)
June 30, 2023
Western Asset Long Credit VIT
(Percentages shown based on Portfolio net assets)
| | | | | | | | | | | | | | | | |
| Security | | Rate | | | Maturity Date | | | Face Amount | | | Value | |
Electric Utilities — continued | | | | | | | | | | | | | | | | |
Southern California Edison Co., First Mortgage Bonds | | | 5.700 | % | | | 3/1/53 | | | $ | 200,000 | | | $ | 200,321 | |
Virginia Electric and Power Co., Senior Notes | | | 3.800 | % | | | 9/15/47 | | | | 120,000 | | | | 94,039 | |
Total Electric Utilities | | | | | | | | | | | | | | | 4,473,435 | |
Multi-Utilities — 0.3% | | | | | | | | | | | | | | | | |
Dominion Energy Inc., Senior Notes | | | 3.375 | % | | | 4/1/30 | | | | 180,000 | | | | 161,183 | |
San Diego Gas & Electric Co., First Mortgage Bonds | | | 3.320 | % | | | 4/15/50 | | | | 80,000 | | | | 57,383 | |
San Diego Gas & Electric Co., Senior Secured Notes | | | 1.700 | % | | | 10/1/30 | | | | 60,000 | | | | 48,034 | |
Total Multi-Utilities | | | | | | | | | | | | | | | 266,600 | |
Total Utilities | | | | | | | | | | | | | | | 4,740,035 | |
Total Corporate Bonds & Notes (Cost — $79,442,002) | | | | | | | | | | | | 78,520,664 | |
| Sovereign Bonds — 2.4% | | | | | | | | | | | | | | | | |
Argentina — 0.1% | | | | | | | | | | | | | | | | |
Provincia de Cordoba, Senior Notes | | | 6.875 | % | | | 12/10/25 | | | | 125,001 | | | | 94,376 | (a) |
Chile — 0.2% | | | | | | | | | | | | | | | | |
Chile Government International Bond, Senior Notes | | | 3.100 | % | | | 5/7/41 | | | | 200,000 | | | | 150,596 | |
Colombia — 0.1% | | | | | | | | | | | | | | | | |
Colombia Government International Bond, Senior Notes | | | 5.000 | % | | | 6/15/45 | | | | 200,000 | | | | 139,734 | |
Israel — 0.4% | | | | | | | | | | | | | | | | |
Israel Government International Bond, Senior Notes | | | 3.250 | % | | | 1/17/28 | | | | 200,000 | | | | 187,253 | |
Israel Government International Bond, Senior Notes | | | 3.875 | % | | | 7/3/50 | | | | 200,000 | | | | 164,408 | |
Total Israel | | | | | | | | | | | | | | | 351,661 | |
Jordan — 0.2% | | | | | | | | | | | | | | | | |
Jordan Government International Bond, Senior Notes | | | 4.950 | % | | | 7/7/25 | | | | 200,000 | | | | 194,016 | (a) |
Mexico — 0.9% | | | | | | | | | | | | | | | | |
Mexico Government International Bond, Senior Notes | | | 3.500 | % | | | 2/12/34 | | | | 200,000 | | | | 168,014 | |
Mexico Government International Bond, Senior Notes | | | 4.280 | % | | | 8/14/41 | | | | 200,000 | | | | 165,033 | |
Mexico Government International Bond, Senior Notes | | | 4.750 | % | | | 3/8/44 | | | | 320,000 | | | | 274,672 | |
Mexico Government International Bond, Senior Notes | | | 4.350 | % | | | 1/15/47 | | | | 200,000 | | | | 160,294 | |
Total Mexico | | | | | | | | | | | | | | | 768,013 | |
Panama — 0.2% | | | | | | | | | | | | | | | | |
Panama Government International Bond, Senior Notes | | | 2.252 | % | | | 9/29/32 | | | | 200,000 | | | | 153,333 | |
See Notes to Financial Statements.
| | |
26 | | Western Asset Long Credit VIT 2023 Semi-Annual Report |
Western Asset Long Credit VIT
(Percentages shown based on Portfolio net assets)
| | | | | | | | | | | | | | | | |
| Security | | Rate | | | Maturity Date | | | Face Amount | | | Value | |
Paraguay — 0.2% | | | | | | | | | | | | | | | | |
Paraguay Government International Bond, Senior Notes | | | 5.400 | % | | | 3/30/50 | | | $ | 200,000 | | | $ | 171,354 | (a) |
Uruguay — 0.1% | | | | | | | | | | | | | | | | |
Uruguay Government International Bond, Senior Notes | | | 5.100 | % | | | 6/18/50 | | | | 100,000 | | | | 99,895 | |
Total Sovereign Bonds (Cost — $2,164,414) | | | | | | | | | | | | | | | 2,122,978 | |
| Municipal Bonds — 1.7% | | | | | | | | | | | | | | | | |
California — 1.1% | | | | | | | | | | | | | | | | |
California State, GO, Build America Bonds | | | 7.300 | % | | | 10/1/39 | | | | 650,000 | | | | 786,281 | |
University of California General Revenue, Taxable, Series AD | | | 4.858 | % | | | 5/15/2112 | | | | 150,000 | | | | 133,731 | |
Total California | | | | | | | | | | | | | | | 920,012 | |
Illinois — 0.2% | | | | | | | | | | | | | | | | |
State of Illinois, GO, Taxable, Pension Funding Series 2003 | | | 5.100 | % | | | 6/1/33 | | | | 150,000 | | | | 147,561 | |
Michigan — 0.2% | | | | | | | | | | | | | | | | |
University of Michigan General Revenue, Taxable, Series AD | | | 4.454 | % | | | 4/1/2122 | | | | 171,000 | | | | 148,774 | |
Minnesota — 0.1% | | | | | | | | | | | | | | | | |
University of Minnesota, GO, Taxable, Series 2022 | | | 4.048 | % | | | 4/1/52 | | | | 100,000 | | | | 88,581 | |
Ohio — 0.1% | | | | | | | | | | | | | | | | |
American Municipal Power Inc., OH, Revenue, Combined Hydroelectric Project, Taxable Series B, Refunding | | | 8.084 | % | | | 2/15/50 | | | | 100,000 | | | | 135,594 | |
Total Municipal Bonds (Cost — $1,482,115) | | | | | | | | | | | | | | | 1,440,522 | |
| Asset-Backed Securities — 0.6% | | | | | | | | | | | | | | | | |
Bristol Park CLO Ltd., 2016-1A BR (3 mo. USD LIBOR + 1.450%) | | | 6.710 | % | | | 4/15/29 | | | | 250,000 | | | | 243,693 | (a)(c) |
GoldenTree Loan Opportunities Ltd., 2014-9A BR2 (3 mo. USD LIBOR + 1.600%) | | | 6.899 | % | | | 10/29/29 | | | | 260,000 | | | | 257,100 | (a)(c) |
Total Asset-Backed Securities (Cost — $501,126) | | | | | | | | | | | | | | | 500,793 | |
| U.S. Government & Agency Obligations — 0.5% | | | | | | | | | | | | | | | | |
U.S. Government Obligations — 0.5% | | | | | | | | | | | | | | | | |
U.S. Treasury Bonds | | | 3.875 | % | | | 5/15/43 | | | | 270,000 | | | | 263,503 | |
U.S. Treasury Bonds | | | 3.625 | % | | | 2/15/53 | | | | 40,000 | | | | 38,400 | |
U.S. Treasury Notes | | | 4.250 | % | | | 5/31/25 | | | | 30,000 | | | | 29,625 | |
U.S. Treasury Notes | | | 4.125 | % | | | 6/15/26 | | | | 120,000 | | | | 118,800 | |
U.S. Treasury Notes | | | 3.375 | % | | | 5/15/33 | | | | 30,000 | | | | 28,936 | |
Total U.S. Government & Agency Obligations (Cost — $481,327) | | | | | | | | 479,264 | |
See Notes to Financial Statements.
| | |
| Western Asset Long Credit VIT 2023 Semi-Annual Report | | 27 |
Schedule of investments (unaudited) (cont’d)
June 30, 2023
Western Asset Long Credit VIT
(Percentages shown based on Portfolio net assets)
| | | | | | | | | | | | | | | | |
| Security | | Rate | | | Maturity Date | | | Face Amount | | | Value | |
| Convertible Bonds & Notes — 0.2% | | | | | | | | | | | | | | | | |
| Communication Services — 0.2% | | | | | | | | | | | | | | | | |
Media — 0.2% | | | | | | | | | | | | | | | | |
DISH Network Corp., Senior Notes (Cost — $141,036) | | | 2.375 | % | | | 3/15/24 | | | $ | 160,000 | | | $ | 142,400 | |
Total Investments before Short-Term Investments (Cost — $84,212,020) | | | | | | | | 83,206,621 | |
| | | | |
| | | | | | | | | Shares | | | | |
| Short-Term Investments — 2.3% | | | | | | | | | | | | | | | | |
Western Asset Premier Institutional Government Reserves, Premium Shares
(Cost — $1,963,013) | | | 5.044 | % | | | | | | | 1,963,013 | | | | 1,963,013 | (e)(f) |
Total Investments — 98.6% (Cost — $86,175,033) | | | | | | | | | | | | | | | 85,169,634 | |
Other Assets in Excess of Liabilities — 1.4% | | | | | | | | | | | | | | | 1,218,132 | |
Total Net Assets — 100.0% | | | | | | | | | | | | | | $ | 86,387,766 | |
| †† | Represents less than 0.1%. |
| (a) | Security is exempt from registration under Rule 144A of the Securities Act of 1933. This security may be resold in transactions that are exempt from registration, normally to qualified institutional buyers. This security has been deemed liquid pursuant to guidelines approved by the Board of Trustees. |
| (b) | Security has no maturity date. The date shown represents the next call date. |
| (c) | Variable rate security. Interest rate disclosed is as of the most recent information available. Certain variable rate securities are not based on a published reference rate and spread but are determined by the issuer or agent and are based on current market conditions. These securities do not indicate a reference rate and spread in their description above. |
| (d) | Securities traded on a when-issued or delayed delivery basis. |
| (e) | Rate shown is one-day yield as of the end of the reporting period. |
| (f) | In this instance, as defined in the Investment Company Act of 1940, an “Affiliated Company” represents Portfolio ownership of at least 5% of the outstanding voting securities of an issuer, or a company which is under common ownership or control with the Portfolio. At June 30, 2023, the total market value of investments in Affiliated Companies was $1,963,013 and the cost was $1,963,013 (Note 6). |
| | |
Abbreviation(s) used in this schedule: |
| |
| CLO | | — Collateralized Loan Obligation |
| |
| GO | | — General Obligation |
| |
| GTD | | — Guaranteed |
| |
| LIBOR | | — London Interbank Offered Rate |
| |
| SOFR | | — Secured Overnight Financing Rate |
| |
| USD | | — United States Dollar |
See Notes to Financial Statements.
| | |
28 | | Western Asset Long Credit VIT 2023 Semi-Annual Report |
Western Asset Long Credit VIT
At June 30, 2023, the Portfolio had the following open futures contracts:
| | | | | | | | | | | | | | | | | | | | |
| | | Number of Contracts | | | Expiration Date | | | Notional Amount | | | Market Value | | | Unrealized Appreciation (Depreciation) | |
| Contracts to Buy: | | | | | | | | | | | | | | | | | | | | |
| U.S. Treasury 2-Year Notes | | | 53 | | | | 9/23 | | | $ | 10,926,247 | | | $ | 10,777,218 | | | $ | (149,029) | |
| U.S. Treasury 5-Year Notes | | | 76 | | | | 9/23 | | | | 8,340,538 | | | | 8,139,125 | | | | (201,413) | |
| U.S. Treasury Long-Term Bonds | | | 59 | | | | 9/23 | | | | 7,565,435 | | | | 7,487,469 | | | | (77,966) | |
| U.S. Treasury Ultra 10-Year Notes | | | 13 | | | | 9/23 | | | | 1,557,927 | | | | 1,539,688 | | | | (18,239) | |
| U.S. Treasury Ultra Long- Term Bonds | | | 11 | | | | 9/23 | | | | 1,484,185 | | | | 1,498,406 | | | | 14,221 | |
| | | | | | | | | | | | | | | | | | | | (432,426) | |
| Contracts to Sell: | | | | | | | | | | | | | | | | | | | | |
| U.S. Treasury 10-Year Notes | | | 6 | | | | 9/23 | | | | 677,771 | | | | 673,594 | | | | 4,177 | |
| Net unrealized depreciation on open futures contracts | | | $ | (428,249) | |
See Notes to Financial Statements.
| | |
| Western Asset Long Credit VIT 2023 Semi-Annual Report | | 29 |
Statement of assets and liabilities (unaudited)
June 30, 2023
| | | | |
| |
| Assets: | | | | |
Investments in unaffiliated securities, at value (Cost — $84,212,020) | | $ | 83,206,621 | |
Investments in affiliated securities, at value (Cost — $1,963,013) | | | 1,963,013 | |
Cash | | | 1,040 | |
Interest receivable | | | 1,028,719 | |
Deposits with brokers for open futures contracts | | | 702,476 | |
Receivable from brokers — net variation margin on open futures contracts | | | 59,359 | |
Deferred offering costs | | | 53,971 | |
Dividends receivable from affiliated investments | | | 10,862 | |
Total Assets | | | 87,026,061 | |
| |
| Liabilities: | | | | |
Payable for securities purchased | | | 500,240 | |
Payable for offering costs | | | 64,800 | |
Payable for organization costs | | | 33,400 | |
Investment management fee payable | | | 12,222 | |
Trustees’ fees payable | | | 855 | |
Payable for Portfolio shares repurchased | | | 129 | |
Accrued expenses | | | 26,649 | |
Total Liabilities | | | 638,295 | |
| Total Net Assets | | $ | 86,387,766 | |
| |
| Net Assets: | | | | |
Par value (Note 5) | | $ | 88 | |
Paid-in capital in excess of par value | | | 88,462,487 | |
Total distributable earnings (loss) | | | (2,074,809) | |
| Total Net Assets | | $ | 86,387,766 | |
| |
| Shares Outstanding: | | | | |
Class I | | | 8,848,845 | |
| |
| Net Asset Value: | | | | |
Class I (and redemption price) | | | $9.76 | |
See Notes to Financial Statements.
| | |
30 | | Western Asset Long Credit VIT 2023 Semi-Annual Report |
Statement of operations (unaudited)
For the Period Ended June 30, 2023†
| | | | |
| |
| Investment Income: | | | | |
Interest | | $ | 743,394 | |
Dividends from affiliated investments | | | 41,916 | |
Less: Foreign taxes withheld | | | (10,002) | |
Total Investment Income | | | 775,308 | |
| |
| Expenses: | | | | |
Investment management fee (Note 2) | | | 48,640 | |
Organization costs (Note 1) | | | 33,400 | |
Audit and tax fees | | | 13,445 | |
Fund accounting fees | | | 11,306 | |
Offering costs (Note 1) | | | 10,829 | |
Legal fees | | | 1,121 | |
Trustees’ fees | | | 857 | |
Shareholder reports | | | 329 | |
Custody fees | | | 189 | |
Transfer agent fees | | | 2 | |
Miscellaneous expenses | | | 603 | |
Total Expenses | | | 120,721 | |
Less: Fee waivers and/or expense reimbursements (Note 2) | | | (58,710) | |
Net Expenses | | | 62,011 | |
| Net Investment Income | | | 713,297 | |
| |
| Realized and Unrealized Loss on Investments and Futures Contracts (Notes 1, 3 and 4): | | | | |
Net Realized Loss From: | | | | |
Investment transactions in unaffiliated securities | | | (18,618) | |
Futures contracts | | | (622,523) | |
Net Realized Loss | | | (641,141) | |
Change in Net Unrealized Appreciation (Depreciation) From: | | | | |
Investments in unaffiliated securities | | | (1,005,399) | |
Futures contracts | | | (428,249) | |
Change in Net Unrealized Appreciation (Depreciation) | | | (1,433,648) | |
| Net Loss on Investments and Futures Contracts | | | (2,074,789) | |
| Decrease in Net Assets From Operations | | $ | (1,361,492) | |
| † | For the period May 1, 2023 (inception date) to June 30, 2023. |
See Notes to Financial Statements.
| | |
| Western Asset Long Credit VIT 2023 Semi-Annual Report | | 31 |
Statement of changes in net assets
| | | | |
| For the Period Ended June 30, 2023 (unaudited)† | | 2023 | |
| |
| Operations: | | | | |
Net investment income | | $ | 713,297 | |
Net realized loss | | | (641,141) | |
Change in net unrealized appreciation (depreciation) | | | (1,433,648) | |
Decrease in Net Assets From Operations | | | (1,361,492) | |
| |
| Distributions to Shareholders From (Note 1): | | | | |
Total distributable earnings | | | (713,317) | |
Decrease in Net Assets From Distributions to Shareholders | | | (713,317) | |
| |
| Portfolio Share Transactions (Note 5): | | | | |
Net proceeds from sale of shares | | | 87,878,613 | |
Reinvestment of distributions | | | 713,317 | |
Cost of shares repurchased | | | (129,355) | |
Increase in Net Assets From Portfolio Share Transactions | | | 88,462,575 | |
Increase in Net Assets | | | 86,387,766 | |
| |
| Net Assets: | | | | |
Beginning of period | | | — | |
End of period | | $ | 86,387,766 | |
| † | For the period May 1, 2023 (inception date) to June 30, 2023. |
See Notes to Financial Statements.
| | |
32 | | Western Asset Long Credit VIT 2023 Semi-Annual Report |
Financial highlights
| | | | |
For a share of each class of beneficial interest outstanding throughout each year ended December 31,
unless otherwise noted: | |
| Class I Shares1 | | 20232 | |
| |
| Net asset value, beginning of period | | | $10.00 | |
| |
| Income (loss) from operations: | | | | |
Net investment income | | | 0.08 | |
Net realized and unrealized loss | | | (0.24) | |
Total loss from operations | | | (0.16) | |
| |
| Less distributions from: | | | | |
Net investment income | | | (0.08) | |
Total distributions | | | (0.08) | |
| |
| Net asset value, end of period | | | $9.76 | |
Total return3,4 | | | (1.61) | % |
| |
| Net assets, end of period (000s) | | | $86,388 | |
| |
| Ratios to average net assets: | | | | |
Gross expenses5,6 | | | 0.87 | % |
Net expenses6,7,8 | | | 0.45 | |
Net investment income6 | | | 5.13 | |
| |
| Portfolio turnover rate | | | 3 | % |
| 1 | Per share amounts have been calculated using the average shares method. |
| 2 | For the period May 1, 2023 (inception date) to June 30, 2023. |
| 3 | Performance data is shown as of the date the Portfolio began to invest in accordance with its investment objective and guidelines. |
| 4 | Performance figures may reflect compensating balance arrangements, fee waivers and/or expense reimbursements. In the absence of compensating balance arrangements, fee waivers and/or expense reimbursements, the total return would have been lower. Total returns do not reflect expenses associated with separate accounts such as administrative fees, account charges and surrender charges which, if reflected, would reduce the total return for all periods shown. Past performance is no guarantee of future results. Total returns for periods of less than one year are not annualized. |
| 5 | Ratio includes 0.32% of non-recurring organizational and offering costs related to the inception of the Portfolio. |
| 7 | As a result of an expense limitation arrangement, the ratio of total annual fund operating expenses, other than interest, brokerage, taxes, extraordinary expenses and acquired fund fees and expenses, to average net assets of Class I shares did not exceed 0.45%. This expense limitation arrangement cannot be terminated prior to December 31, 2024 without the Board of Trustees’ consent. In addition, the manager has agreed to waive the Portfolio’s management fee to an extent sufficient to offset the net management fee payable in connection with any investment in an affiliated money market fund. |
| 8 | Reflects fee waivers and/or expense reimbursements. |
See Notes to Financial Statements.
| | |
| Western Asset Long Credit VIT 2023 Semi-Annual Report | | 33 |
Notes to financial statements (unaudited)
1. Organization and significant accounting policies
Western Asset Long Credit VIT (the “Portfolio”) is a separate diversified investment series of Legg Mason Partners Variable Income Trust (the “Trust”). The Trust, a Maryland statutory trust, is registered under the Investment Company Act of 1940, as amended (the “1940 Act”), as an open-end management investment company.
Shares of the Portfolio may only be purchased or redeemed through variable annuity contracts and variable life insurance policies offered by the separate accounts of participating insurance companies or through eligible pension or other qualified plans.
The Portfolio follows the accounting and reporting guidance in Financial Accounting Standards Board (“FASB”) Accounting Standards Codification Topic 946, Financial Services – Investment Companies (“ASC 946”). The following are significant accounting policies consistently followed by the Portfolio and are in conformity with U.S. generally accepted accounting principles (“GAAP”), including, but not limited to, ASC 946. Estimates and assumptions are required to be made regarding assets, liabilities and changes in net assets resulting from operations when financial statements are prepared. Changes in the economic environment, financial markets and any other parameters used in determining these estimates could cause actual results to differ. Subsequent events have been evaluated through the date the financial statements were issued.
(a) Investment valuation. The valuations for fixed income securities (which may include, but are not limited to, corporate, government, municipal, mortgage-backed, collateralized mortgage obligations and asset-backed securities) and certain derivative instruments are typically the prices supplied by independent third party pricing services, which may use market prices or broker/dealer quotations or a variety of valuation techniques and methodologies. The independent third party pricing services typically use inputs that are observable such as issuer details, interest rates, yield curves, prepayment speeds, credit risks/spreads, default rates and quoted prices for similar securities. Investments in open-end funds are valued at the closing net asset value per share of each fund on the day of valuation. Futures contracts are valued daily at the settlement price established by the board of trade or exchange on which they are traded. Equity securities for which market quotations are available are valued at the last reported sales price or official closing price on the primary market or exchange on which they trade. When the Portfolio holds securities or other assets that are denominated in a foreign currency, the Portfolio will normally use the currency exchange rates as of 4:00 p.m. (Eastern Time). If independent third party pricing services are unable to supply prices for a portfolio investment, or if the prices supplied are deemed by the manager to be unreliable, the market price may be determined by the manager using quotations from one or more broker/dealers or at the transaction price if the security has recently been purchased and no value has yet been obtained from a pricing service or pricing broker. When reliable prices are not readily available, such as when the value of a security has been significantly affected by events after the close of the exchange or market on which the security is principally traded, but before the Portfolio
| | |
34 | | Western Asset Long Credit VIT 2023 Semi-Annual Report |
calculates its net asset value, the Portfolio values these securities as determined in accordance with procedures approved by the Portfolio’s Board of Trustees.
Pursuant to policies adopted by the Board of Trustees, the Portfolio’s manager has been designated as the valuation designee and is responsible for the oversight of the daily valuation process. The Portfolio’s manager is assisted by the Global Fund Valuation Committee (the “Valuation Committee”). The Valuation Committee is responsible for making fair value determinations, evaluating the effectiveness of the Portfolio’s pricing policies, and reporting to the Portfolio’s manager and the Board of Trustees. When determining the reliability of third party pricing information for investments owned by the Portfolio, the Valuation Committee, among other things, conducts due diligence reviews of pricing vendors, monitors the daily change in prices and reviews transactions among market participants.
The Valuation Committee will consider pricing methodologies it deems relevant and appropriate when making fair value determinations. Examples of possible methodologies include, but are not limited to, multiple of earnings; discount from market of a similar freely traded security; discounted cash-flow analysis; book value or a multiple thereof; risk premium/yield analysis; yield to maturity; and/or fundamental investment analysis. The Valuation Committee will also consider factors it deems relevant and appropriate in light of the facts and circumstances. Examples of possible factors include, but are not limited to, the type of security; the issuer’s financial statements; the purchase price of the security; the discount from market value of unrestricted securities of the same class at the time of purchase; analysts’ research and observations from financial institutions; information regarding any transactions or offers with respect to the security; the existence of merger proposals or tender offers affecting the security; the price and extent of public trading in similar securities of the issuer or comparable companies; and the existence of a shelf registration for restricted securities.
For each portfolio security that has been fair valued pursuant to the policies adopted by the Board of Trustees, the fair value price is compared against the last available and next available market quotations. The Valuation Committee reviews the results of such back testing monthly and fair valuation occurrences are reported to the Board of Trustees quarterly.
The Portfolio uses valuation techniques to measure fair value that are consistent with the market approach and/or income approach, depending on the type of security and the particular circumstance. The market approach uses prices and other relevant information generated by market transactions involving identical or comparable securities. The income approach uses valuation techniques to discount estimated future cash flows to present value.
| | |
| Western Asset Long Credit VIT 2023 Semi-Annual Report | | 35 |
Notes to financial statements (unaudited) (cont’d)
GAAP establishes a disclosure hierarchy that categorizes the inputs to valuation techniques used to value assets and liabilities at measurement date. These inputs are summarized in the three broad levels listed below:
| • | | Level 1 — unadjusted quoted prices in active markets for identical investments |
| • | | Level 2 — other significant observable inputs (including quoted prices for similar investments, interest rates, prepayment speeds, credit risk, etc.) |
| • | | Level 3 — significant unobservable inputs (including the Portfolio’s own assumptions in determining the fair value of investments) |
The inputs or methodologies used to value securities are not necessarily an indication of the risk associated with investing in those securities.
The following is a summary of the inputs used in valuing the Portfolio’s assets and liabilities carried at fair value:
| | | | | | | | | | | | | | | | |
| ASSETS | |
| Description | | Quoted Prices
(Level 1) | | | Other Significant
Observable Inputs
(Level 2) | | | Significant
Unobservable
Inputs
(Level 3) | | | Total | |
| Long-Term Investments†: | | | | | | | | | | | | | | | | |
Corporate Bonds & Notes | | | — | | | $ | 78,520,664 | | | | — | | | $ | 78,520,664 | |
Sovereign Bonds | | | — | | | | 2,122,978 | | | | — | | | | 2,122,978 | |
Municipal Bonds | | | — | | | | 1,440,522 | | | | — | | | | 1,440,522 | |
Asset-Backed Securities | | | — | | | | 500,793 | | | | — | | | | 500,793 | |
U.S. Government & Agency Obligations | | | — | | | | 479,264 | | | | — | | | | 479,264 | |
Convertible Bonds & Notes | | | — | | | | 142,400 | | | | — | | | | 142,400 | |
| Total Long-Term Investments | | | — | | | | 83,206,621 | | | | — | | | | 83,206,621 | |
| Short-Term Investments† | | $ | 1,963,013 | | | | — | | | | — | | | | 1,963,013 | |
| Total Investments | | $ | 1,963,013 | | | $ | 83,206,621 | | | | — | | | $ | 85,169,634 | |
| Other Financial Instruments: | | | | | | | | | | | | | | | | |
Futures Contracts†† | | $ | 18,398 | | | | — | | | | — | | | $ | 18,398 | |
| Total | | $ | 1,981,411 | | | $ | 83,206,621 | | | | — | | | $ | 85,188,032 | |
|
| LIABILITIES | |
| Description | | Quoted Prices
(Level 1) | | | Other Significant
Observable Inputs
(Level 2) | | | Significant
Unobservable
Inputs
(Level 3) | | | Total | |
| Other Financial Instruments: | | | | | | | | | | | | | | | | |
Futures Contracts†† | | $ | 446,647 | | | | — | | | | — | | | $ | 446,647 | |
| † | See Schedule of Investments for additional detailed categorizations. |
| †† | Reflects the unrealized appreciation (depreciation) of the instruments. |
(b) Futures contracts. The Portfolio uses futures contracts generally to gain exposure to, or hedge against, changes in interest rates or gain exposure to, or hedge against, changes
| | |
36 | | Western Asset Long Credit VIT 2023 Semi-Annual Report |
in certain asset classes. A futures contract represents a commitment for the future purchase or sale of an asset at a specified price on a specified date.
Upon entering into a futures contract, the Portfolio is required to deposit cash or securities with a broker in an amount equal to a certain percentage of the contract amount. This is known as the ‘‘initial margin’’ and subsequent payments (‘‘variation margin’’) are made or received by the Portfolio each day, depending on the daily fluctuation in the value of the contract. For certain futures, including foreign denominated futures, variation margin is not settled daily, but is recorded as a net variation margin payable or receivable. The daily changes in contract value are recorded as unrealized appreciation or depreciation in the Statement of Operations and the Portfolio recognizes a realized gain or loss when the contract is closed.
Futures contracts involve, to varying degrees, risk of loss in excess of the amounts reflected in the financial statements. In addition, there is the risk that the Portfolio may not be able to enter into a closing transaction because of an illiquid secondary market.
(c) Securities traded on a when-issued and delayed delivery basis. The Portfolio may trade securities on a when-issued or delayed delivery basis. In when-issued and delayed delivery transactions, the securities are purchased or sold by the Portfolio with payment and delivery taking place in the future in order to secure what is considered to be an advantageous price and yield to the Portfolio at the time of entering into the transaction.
Purchasing such securities involves risk of loss if the value of the securities declines prior to settlement. These securities are subject to market fluctuations and their current value is determined in the same manner as for other securities.
(d) Credit and market risk. The Portfolio invests in high-yield and emerging market instruments that are subject to certain credit and market risks. The yields of high-yield and emerging market debt obligations reflect, among other things, perceived credit and market risks. The Portfolio’s investments in securities rated below investment grade typically involve risks not associated with higher rated securities including, among others, greater risk related to timely and ultimate payment of interest and principal, greater market price volatility and less liquid secondary market trading. The consequences of political, social, economic or diplomatic changes may have disruptive effects on the market prices of investments held by the Portfolio. The Portfolio’s investments in non-U.S. dollar denominated securities may also result in foreign currency losses caused by devaluations and exchange rate fluctuations.
Investments in securities that are collateralized by real estate mortgages are subject to certain credit and liquidity risks. When market conditions result in an increase in default rates of the underlying mortgages and the foreclosure values of underlying real estate properties are materially below the outstanding amount of these underlying mortgages, collection of the full amount of accrued interest and principal on these investments may be
| | |
| Western Asset Long Credit VIT 2023 Semi-Annual Report | | 37 |
Notes to financial statements (unaudited) (cont’d)
doubtful. Such market conditions may significantly impair the value and liquidity of these investments and may result in a lack of correlation between their credit ratings and values.
(e) Foreign investment risks. The Portfolio’s investments in foreign securities may involve risks not present in domestic investments. Since securities may be denominated in foreign currencies, may require settlement in foreign currencies or may pay interest or dividends in foreign currencies, changes in the relationship of these foreign currencies to the U.S. dollar can significantly affect the value of the investments and earnings of the Portfolio. Foreign investments may also subject the Portfolio to foreign government exchange restrictions, expropriation, taxation or other political, social or economic developments, all of which affect the market and/or credit risk of the investments.
(f) Security transactions and investment income. Security transactions are accounted for on a trade date basis. Interest income (including interest income from payment-in-kind securities), adjusted for amortization of premium and accretion of discount, is recorded on the accrual basis. Paydown gains and losses on mortgage- and asset-backed securities are recorded as adjustments to interest income. Dividend income is recorded on the ex-dividend date for dividends received in cash and/or securities. Foreign dividend income is recorded on the ex-dividend date or as soon as practicable after the Portfolio determines the existence of a dividend declaration after exercising reasonable due diligence. The cost of investments sold is determined by use of the specific identification method. To the extent any issuer defaults or a credit event occurs that impacts the issuer, the Portfolio may halt any additional interest income accruals and consider the realizability of interest accrued up to the date of default or credit event.
(g) Distributions to shareholders. Distributions from net investment income of the Portfolio are declared each business day to shareholders of record and are paid monthly. Distributions of net realized gains, if any, are declared at least annually. Distributions to shareholders of the Portfolio are recorded on the ex-dividend date and are determined in accordance with income tax regulations, which may differ from GAAP.
(h) Compensating balance arrangements. The Portfolio has an arrangement with its custodian bank whereby a portion of the custodian’s fees is paid indirectly by credits earned on the Portfolio’s cash on deposit with the bank.
(i) Organization costs. Organization costs associated with the establishment of the Portfolio are charged to expense as they are incurred.
(j) Offering costs. Costs incurred by the Portfolio in connection with offering of the Portfolio’s shares at the commencement of the Portfolio’s operations are being amortized on a straight line basis over twelve months.
(k) Federal and other taxes. It is the Portfolio’s policy to comply with the federal income and excise tax requirements of the Internal Revenue Code of 1986 (the “Code”), as
| | |
38 | | Western Asset Long Credit VIT 2023 Semi-Annual Report |
amended, applicable to regulated investment companies. Accordingly, the Portfolio intends to distribute its taxable income and net realized gains, if any, to shareholders in accordance with timing requirements imposed by the Code. Therefore, no federal or state income tax provision is required in the Portfolio’s financial statements.
Under the applicable foreign tax laws, a withholding tax may be imposed on interest, dividends and capital gains at various rates.
(l) Reclassification. GAAP requires that certain components of net assets be reclassified to reflect permanent differences between financial and tax reporting. These reclassifications have no effect on net assets or net asset value per share.
2. Investment management agreement and other transactions with affiliates
Legg Mason Partners Fund Advisor, LLC (“LMPFA”) is the Portfolio’s investment manager. Western Asset Management Company, LLC (“Western Asset”), Western Asset Management Company Limited (“Western Asset London”), are the Portfolio’s subadvisers. LMPFA, Western Asset and Western Asset London, are indirect, wholly-owned subsidiaries of Franklin Resources, Inc. (“Franklin Resources”).
Under the investment management agreement, the Portfolio pays an investment management fee, calculated daily and paid monthly, at an annual rate of 0.35% of the Portfolio’s average daily net assets.
LMPFA provides administrative and certain oversight services to the Portfolio. LMPFA delegates to the subadvisers the day-to-day portfolio management of the Portfolio. Western Asset London, provide certain subadvisory services related to currency transactions and investments in non-U.S. dollar denominated securities and related foreign currency instruments. For its services, LMPFA pays Western Asset a fee monthly, at an annual rate equal to 70% of the net management fee it receives from the Portfolio. In turn, Western Asset pays Western Asset London, monthly a subadvisory fee in an amount equal to 100% of the management fee paid to Western Asset on the assets that Western Asset allocates to each such non-U.S. subadviser to manage.
As a result of an expense limitation arrangement between the Portfolio and LMPFA, the ratio of total annual fund operating expenses, other than interest, brokerage, taxes, extraordinary expenses and acquired fund fees and expenses, to average net assets of Class I shares did not exceed 0.45%. This expense limitation arrangement cannot be terminated prior to December 31, 2024 without the Board of Trustees’ consent. In addition, the manager has agreed to waive the Portfolio’s management fee to an extent sufficient to offset the net management fee payable in connection with any investment in an affiliated money market fund (the “affiliated money market fund waiver”). The affiliated money market fund waiver is not subject to the recapture provision discussed below.
| | |
| Western Asset Long Credit VIT 2023 Semi-Annual Report | | 39 |
Notes to financial statements (unaudited) (cont’d)
During the period ended June 30, 2023, fees waived and/or expenses reimbursed amounted to $58,710, which included an affiliated money market fund waiver of $526.
LMPFA is permitted to recapture amounts waived and/or reimbursed to a class within two years after the fiscal year in which LMPFA earned the fee or incurred the expense if the class’ total annual fund operating expenses have fallen to a level below the expense limitation (“expense cap”) in effect at the time the fees were earned or the expenses incurred. In no case will LMPFA recapture any amount that would result, on any particular business day of the Portfolio, in the class’ total annual fund operating expenses exceeding the expense cap or any other lower limit then in effect.
Pursuant to these arrangements, at June 30, 2023, the Portfolio had remaining fee waivers and/or expense reimbursements subject to recapture by LMPFA and respective dates of expiration as follows:
| | | | |
| | | Class I | |
| Expires December 31, 2025 | | $ | 58,184 | |
For the period ended June 30, 2023, LMPFA did not recapture any fees.
Franklin Templeton Investor Services, LLC (“Investor Services”) serves as the Portfolio’s shareholder servicing agent and acts as the Portfolio’s transfer agent and dividend-paying agent. Investor Services is an indirect, wholly-owned subsidiary of Franklin Resources. Franklin Distributors, LLC (“Franklin Distributors”) serves as the Portfolio’s sole and exclusive distributor. Franklin Distributors is an indirect, wholly-owned broker-dealer subsidiary of Franklin Resources.
All officers and one Trustee of the Trust are employees of Franklin Resources or its affiliates and do not receive compensation from the Trust.
3. Investments
During the period ended June 30, 2023, the aggregate cost of purchases and proceeds from sales of investments (excluding short-term investments) and U.S. Government & Agency Obligations were as follows:
| | | | | | | | |
| | | Investments | | | U.S. Government &
Agency Obligations | |
| Purchases | | $ | 83,766,038 | | | $ | 977,719 | |
| Sales | | | 2,188,222 | | | | 496,792 | |
| | |
40 | | Western Asset Long Credit VIT 2023 Semi-Annual Report |
At June 30, 2023, the aggregate cost of investments and the aggregate gross unrealized appreciation and depreciation of investments for federal income tax purposes were substantially as follows:
| | | | | | | | | | | | | | | | |
| | | Cost | | | Gross
Unrealized
Appreciation | | | Gross
Unrealized
Depreciation | | | Net
Unrealized
Depreciation | |
| Securities | | $ | 86,175,033 | | | $ | 156,107 | | | $ | (1,161,506) | | | $ | (1,005,399) | |
| Futures contracts | | | — | | | | 18,398 | | | | (446,647) | | | | (428,249) | |
4. Derivative instruments and hedging activities
Below is a table, grouped by derivative type, that provides information about the fair value and the location of derivatives within the Statement of Assets and Liabilities at June 30, 2023.
| | | | |
| ASSET DERIVATIVES1 | |
| | | Interest
Rate Risk | |
| Futures contracts2 | | $ | 18,398 | |
| 1 | Generally, the balance sheet location for asset derivatives is receivables/net unrealized appreciation and for liability derivatives is payables/net unrealized depreciation. |
| 2 | Includes cumulative unrealized appreciation (depreciation) of futures contracts as reported in the Schedule of Investments. Only net variation margin is reported within the receivables and/or payables on the Statement of Assets and Liabilities. |
| | | | |
| LIABILITY DERIVATIVES1 | |
| | | Interest
Rate Risk | |
| Futures contracts2 | | $ | 446,647 | |
| 1 | Generally, the balance sheet location for asset derivatives is receivables/net unrealized appreciation and for liability derivatives is payables/net unrealized depreciation. |
| 2 | Includes cumulative unrealized appreciation (depreciation) of futures contracts as reported in the Schedule of Investments. Only net variation margin is reported within the receivables and/or payables on the Statement of Assets and Liabilities. |
The following tables provide information about the effect of derivatives and hedging activities on the Portfolio’s Statement of Operations for the period ended June 30, 2023. The first table provides additional detail about the amounts and sources of gains (losses) realized on derivatives during the period. The second table provides additional information about the change in net unrealized appreciation (depreciation) resulting from the Portfolio’s derivatives and hedging activities during the period.
| | | | |
| AMOUNT OF NET REALIZED GAIN (LOSS) ON DERIVATIVES RECOGNIZED | |
| | | Interest
Rate Risk | |
| Futures contracts | | $ | (622,523) | |
| | |
| Western Asset Long Credit VIT 2023 Semi-Annual Report | | 41 |
Notes to financial statements (unaudited) (cont’d)
| | | | |
| CHANGE IN NET UNREALIZED APPRECIATION (DEPRECIATION) ON DERIVATIVES RECOGNIZED | |
| | | Interest
Rate Risk | |
| Futures contracts | | $ | (428,249) | |
During the period ended June 30, 2023, the volume of derivative activity for the Portfolio was as follows:
| | | | |
| | | Average Market
Value | |
| Futures contracts (to buy) | | $ | 30,206,289 | |
| Futures contracts (to sell) | | | 451,266 | |
5. Shares of beneficial interest
At June 30, 2023, the Trust had an unlimited number of shares of beneficial interest authorized with a par value of $0.00001 per share. The Portfolio has the ability to issue multiple classes of shares. Each class of shares represents an identical interest and has the same rights, except that each class bears certain direct expenses, including those specifically related to the distribution of its shares.
Transactions in shares of the Portfolio were as follows:
| | | | | | | | |
| | | Period Ended
June 30, 20231 | |
| | | Shares | | | Amount | |
| Class I | | | | | | | | |
| Shares sold | | | 8,787,907 | | | $ | 87,878,613 | |
| Shares issued on reinvestment | | | 74,151 | | | | 713,317 | |
| Shares repurchased | | | (13,213 | ) | | | (129,355 | ) |
| Net increase | | | 8,848,845 | | | $ | 88,462,575 | |
| 1 | For the period May 1, 2023 (inception date) to June 30, 2023. |
6. Transactions with affiliated company
As defined by the 1940 Act, an affiliated company is one in which the Portfolio owns 5% or more of the outstanding voting securities, or a company which is under common ownership or control with the Portfolio. The following company was considered an affiliated company
| | |
42 | | Western Asset Long Credit VIT 2023 Semi-Annual Report |
for all or some portion of the period ended June 30, 2023. The following transactions were effected in such company for the period ended June 30, 2023.
| | | | | | | | | | | | | | | | | | | | |
| | | Affiliate
Value at
May 1, 2023
(inception date) | | | Purchased | | | Sold | |
| | | Cost | | | Shares | | | Proceeds | | | Shares | |
| Western Asset Premier Institutional Government Reserves, Premium Shares | | | — | | | $ | 89,434,321 | | | | 89,434,321 | | | $ | 87,471,308 | | | | 87,471,308 | |
| | | | | |
| (cont’d) | | Realized
Gain (Loss) | | | Dividend
Income | | | | | | Net Increase
(Decrease) in
Unrealized
Appreciation
(Depreciation) | | | Affiliate
Value at
June 30,
2023 | |
| Western Asset Premier Institutional Government Reserves, Premium Shares | | | — | | | $ | 41,916 | | | | | | | | — | | | $ | 1,963,013 | |
7. Recent accounting pronouncement
In March 2020, the Financial Accounting Standards Board (FASB) issued Accounting Standards Update (ASU) No. 2020-04, Reference Rate Reform (Topic 848) – Facilitation of the Effects of Reference Rate Reform on Financial Reporting. In January 2021 and December 2022, the FASB issued ASU No. 2021-01 and ASU No. 2022-06, with further amendments to Topic 848. The amendments in the ASUs provide optional temporary accounting recognition and financial reporting relief from the effect of certain types of contract modifications due to the planned discontinuation of the London Interbank Offered Rate (LIBOR) and other interbank-offered based reference rates as of the end of 2021 for certain LIBOR settings and 2023 for the remainder. The ASUs are effective for certain reference rate-related contract modifications that occur during the period March 12, 2020 through December 31, 2024. Management has reviewed the requirements and believes the adoption of these ASUs will not have a material impact on the financial statements.
8. Other matter
The Portfolio’s investments, payment obligations, and financing terms may be based on floating rates, such as the London Interbank Offered Rate, or “LIBOR,” which was the offered rate for short-term Eurodollar deposits between major international banks. In 2017, the U.K. Financial Conduct Authority (“FCA”) announced its intention to cease compelling banks to provide the quotations needed to sustain LIBOR after 2021. In addition, global regulators have announced that, with limited exceptions, no new LIBOR-based contracts should be entered into after 2021. In connection with the global transition away from LIBOR led by regulators and market participants, LIBOR is no longer published on a representative
| | |
| Western Asset Long Credit VIT 2023 Semi-Annual Report | | 43 |
Notes to financial statements (unaudited) (cont’d)
basis. Alternative references rates have been established in most major currencies. In March 2022, the U.S. federal government enacted legislation to establish a process for replacing LIBOR in certain existing contracts that do not already provide for the use of a clearly defined or practicable replacement benchmark rate as described in the legislation. Generally speaking, for contracts that do not contain a fallback provision as described in the legislation, a benchmark replacement recommended by the Federal Reserve Board effectively automatically replaced the USD LIBOR benchmark in the contract upon LIBOR’s cessation at the end of June 2023. The recommended benchmark replacement is based on the Secured Overnight Financing Rate (SOFR) published by the Federal Reserve Bank of New York, including certain spread adjustments and benchmark replacement conforming changes. Various industry groups are in the process of facilitating the transition away from LIBOR, but there remains uncertainty regarding the impact of the transition from LIBOR on the Portfolio’s transactions and the financial markets generally.
| | |
44 | | Western Asset Long Credit VIT 2023 Semi-Annual Report |
Initial Board approval of management and subadvisory agreements (unaudited)
At an in-person meeting of the Board of Trustees of Legg Mason Partners Variable Income Trust (the “Trust”) held on February 7, 2023 (the “Meeting”), the Board, including the Trustees who are not considered to be “interested persons” of the Trust (the “Independent Trustees”) under the Investment Company Act of 1940, as amended (the “1940 Act”), considered and approved for an initial two-year period the management agreement (the “Management Agreement”) between the Trust and Legg Mason Partners Fund Advisor, LLC (the “Manager”) with respect to the Western Asset Long Credit VIT, a new series of the Trust (the “Fund”). The Board, including the Independent Trustees, also considered and approved for an initial two-year period the sub-advisory agreements with respect to the Fund (the “Sub-Advisory Agreements,” and collectively with the Management Agreement, the “Agreements”) between the Manager and Western Asset Management Company, LLC (“Western Asset”) and the Manager and Western Asset Management Company Limited in London (“WAML” and together with Western Asset, the “Subadvisers,” and, collectively with the Manager, the “Advisers”).
Background
The Board received extensive information in advance of the Meeting from the Manager to assist it in its consideration of the Management Agreement and the Sub-Advisory Agreements and was given the opportunity to ask questions and request additional information from management. In addition, prior to the Meeting, the Independent Trustees met with their independent legal counsel to discuss and consider the information provided by management and submitted questions to management, and they considered the responses provided. The Board received and considered a variety of information about the Manager and the Subadvisers, as well as the proposed management and sub-advisory arrangements for the Fund and the existing management and sub-advisory arrangements for the other funds overseen by the Board, certain portions of which are discussed below.
The discussion below covers both the proposed advisory and the proposed administrative functions to be rendered by the Manager, both of which functions are encompassed by the Management Agreement, as well as the proposed advisory functions to be rendered by each Subadviser pursuant to the Sub-Advisory Agreements.
The Independent Trustees were advised by separate independent counsel, who is independent, within the meaning of the Securities and Exchange Commission rules regarding the independence of counsel, of the Advisers, throughout the process. Prior to voting, the Independent Trustees noted that they have previously received memorandums from management discussing the legal standards for their consideration of management agreements. The Independent Trustees also reviewed the Agreements in private sessions with their independent counsel at which no representatives of the Advisers were present. The Independent Trustees considered the Management Agreement and the Sub-Advisory
| | |
| Western Asset Long Credit VIT | | 45 |
Initial Board approval of management and subadvisory agreements (unaudited) (cont’d)
Agreements separately in the course of their review. In doing so, they noted the respective roles of the Manager and the Subadvisers in providing services to the Fund.
In approving the Agreements, the Board, including the Independent Trustees, considered a variety of factors, including those factors discussed below. In arriving at a decision, the Trustees, including the Independent Trustees, did not identify any single matter as all-important or controlling, and each Trustee may have attributed different weight to the various factors in evaluating the Agreements.
Nature, extent and quality of the services expected to be provided under the management agreement and sub-advisory agreements
The Board received and considered information regarding the nature, extent and quality of services expected to be provided to the Fund by the Manager and the Subadvisers under the Management Agreement and the Sub-Advisory Agreements, respectively. In considering the nature, extent and quality of services expected to be provided under the Management Agreement and the Sub-Advisory Agreements, the Board took into account information provided in conjunction with the most recent contract review for the funds in the Legg Mason Funds complex. The Board noted that the Management Agreement and the Sub- Advisory Agreements are substantially similar to the investment management and subadvisory agreements most recently approved by the Board for the Trust, other than the respective management fee arrangements. The Board also noted information received at regular meetings throughout the year related to the services rendered by the Manager in its management of those other funds and the Manager’s role in coordinating the activities of the other service providers. The Board’s evaluation of the services expected to be provided to the Fund by the Manager and the Subadvisers took into account the Board’s knowledge gained as Trustees of funds in the Legg Mason Funds complex, including knowledge gained regarding the scope and quality of the investment management and other capabilities of the Manager and the Subadvisers, and the quality of the Manager’s administrative and other services. The Board observed that the scope of services expected to be provided by the Manager and the Subadvisers, and of the undertakings required of the Manager and Subadvisers in connection with those services, including maintaining and monitoring their own and the Fund’s compliance programs and cybersecurity programs established pursuant to Rule 38a-1 under the 1940 Act, had expanded over time as a result of regulatory, market and other developments. The Board also considered the Manager’s and the Subadvisers’ risk management processes.
The Board considered the qualifications, backgrounds and responsibilities of the Advisers’ senior personnel and the team of investment professionals expected to be primarily responsible for the day-to-day portfolio management of the Fund. The Board also considered, based on its knowledge of the Manager and its affiliates, the financial
| | |
46 | | Western Asset Long Credit VIT |
resources of Franklin Templeton, the parent organization of the Advisers. The Board recognized the importance of having a fund manager with significant resources.
The Board considered the expected division of responsibilities between the Manager and the Subadvisers and the oversight expected to be provided by the Manager. The Board also considered the proposed policies and practices of the Manager and the Subadvisers regarding the selection of brokers and dealers and the execution of portfolio transactions. In addition, management also reported to the Board on, among other things, its business plans and any organizational changes.
The Board noted that the Fund was newly organized and thus did not yet have any performance history. In addition, the Trustees noted that, in the future, they expected to receive and discuss with management performance information for the Fund and for a group of comparable funds selected by Broadridge Financial Solutions, Inc., an independent provider of investment company data.
The Board concluded that, overall, the nature, extent and quality of services expected to be provided under the Management Agreement and the Sub-Advisory Agreements were sufficient for approval of such agreements for the initial two-year period.
Management fees and expected expense ratios
The Board noted that the Fund expects to pay the Manager a management fee at an annual rate of 0.35% of its average daily net assets. The Board also recognized that the Manager had agreed to waive fees and /or reimburse all operating expenses of the Fund, except interest, brokerage, taxes, extraordinary expenses and acquired fees and expenses, to the extent necessary so that the total annual operating expenses (with the foregoing exclusions) for each class of the Fund would not exceed 0.45%, with respect to Class I, and 0.70%, with respect to Class II.
The Board noted that the Manager will be permitted to recapture amounts waived and/or reimbursed to a class within two years after the fiscal year in which the Manager earned the fee or incurred the expense if the total annual fund operating expenses have fallen to a level below the limits described above. In addition, the Board also noted that the Manager has agreed to waive the Fund’s management fee to an extent sufficient to offset the net management fee payable in connection with any investment in an affiliated money market fund.
The Board considered that this arrangement is expected to continue through December 31, 2024, and that the Board would have the opportunity to reconsider the term of such limitation at a future Board meeting during which expense limitations for other funds in the Legg Mason Funds complex would also be considered.
| | |
| Western Asset Long Credit VIT | | 47 |
Initial Board approval of management and subadvisory agreements (unaudited) (cont’d)
Taking all of the above into consideration, as well as the factors identified below, the Board determined that the proposed fee and expense arrangements for the Fund were reasonable in light of the nature, extent and quality of the services expected to be provided to the Fund under the Management Agreement and the Sub-Advisory Agreements.
Manager profitability
The Board considered that, since the Fund was a newly-created series of the Trust, information relating to the profitability of the Manager and its affiliates in providing services to the Fund was not yet available. The Board noted, however, that it would have opportunities to review such information in the future, including as part of its annual consideration of the advisory and sub-advisory agreements for the various funds in the Legg Mason Funds complex. The Board also noted that it had previously considered profitability information with respect to the Legg Mason Funds complex as a whole, which included an analysis of the profitability of the Manager and its affiliates.
Economies of scale
The Board discussed whether the Manager realizes economies of scale as the Fund’s assets grow and determined that the proposed management fee structure for the Fund was reasonable.
Other expected benefits to the manager and the subadvisers
The Board considered other benefits that the Manager, the Subadvisers and their affiliates were expected to receive as a result of their relationship with the Fund, including the opportunity to offer additional products and services to Fund shareholders.
In light of the expected costs of providing investment management and other services to the Fund and the proposed commitment of the Manager and the Subadvisers to the Fund, the Board considered that the ancillary benefits the Manager and its affiliates were expected to receive would be reasonable if the Management Agreement and the Sub-Advisory Agreements were approved.
In light of all of the foregoing, the Board determined that approval of each of the Management Agreement and Sub-Advisory Agreements would be in the best interests of the Fund’s shareholders, and approved such agreements for an initial two-year period.
| | |
48 | | Western Asset Long Credit VIT |
Western Asset
Long Credit VIT
Trustees
Robert Abeles, Jr.
Jane F. Dasher
Anita L. DeFrantz
Susan B. Kerley
Michael Larson
Ronald L. Olson
Avedick B. Poladian
William E.B. Siart
Chairman
Jaynie M. Studenmund
Peter J. Taylor
Jane Trust
Investment manager
Legg Mason Partners Fund Advisor, LLC
Subadvisers
Western Asset Management Company, LLC
Western Asset Management Company Limited
Distributor
Franklin Distributors, LLC
Custodian
The Bank of New York Mellon
Transfer agent
Franklin Templeton Investor Services, LLC
3344 Quality Drive
Rancho Cordova, CA 95670-7313
Independent registered public accounting firm
PricewaterhouseCoopers LLP
Baltimore, MD
Legal counsel
Ropes and Gray
1211 Avenue of the Americas
New York, NY 10036
Western Asset Long Credit VIT
The Portfolio is a separate investment series of Legg Mason Partners Variable Income Trust, a Maryland statutory trust.
Western Asset Long Credit VIT
Legg Mason Funds
620 Eighth Avenue, 47th Floor
New York, NY 10018
The Portfolio files its complete schedule of portfolio holdings with the Securities and Exchange Commission (“SEC”) for the first and third quarters of each fiscal year as an exhibit to its reports on Form N-PORT. The Portfolio’s Forms N-PORT are available on the SEC’s website at www.sec.gov. To obtain information on Form N-PORT, shareholders can call the Portfolio at 877-6LM-FUND/656-3863.
Information on how the Portfolio voted proxies relating to portfolio securities during the prior 12-month period ended June 30th of each year and a description of the policies and procedures that the Portfolio uses to determine how to vote proxies related to portfolio transactions are available (1) without charge, upon request, by calling the Portfolio at 877-6LM-FUND/656- 3863, (2) at www.franklintempleton.com and (3) on the SEC’s website at www.sec.gov.
This report is submitted for the general information of the shareholders of Western Asset Long Credit VIT. This report is not authorized for distribution to prospective investors in the Portfolio unless preceded or accompanied by a current prospectus.
Investors should consider the Portfolio’s investment objectives, risks, charges and expenses carefully before investing. The prospectus contains this and other important information about the Portfolio. Please read the prospectus carefully before investing.
www.franklintempleton.com
© 2023 Franklin Distributors, LLC, Member FINRA/SIPC. All rights reserved.
Legg Mason Funds Privacy and Security Notice
Your Privacy Is Our Priority
Franklin Templeton* is committed to safeguarding your personal information. This notice is designed to provide you with a summary of the non-public personal information Franklin Templeton may collect and maintain about current or former individual investors; our policy regarding the use of that information; and the measures we take to safeguard the information. We do not sell individual investors’ non-public personal information to anyone and only share it as described in this notice.
Information We Collect
When you invest with us, you provide us with your non-public personal information. We collect and use this information to service your accounts and respond to your requests. The non-public personal information we may collect falls into the following categories:
| • | | Information we receive from you or your financial intermediary on applications or other forms, whether we receive the form in writing or electronically. For example, this information may include your name, address, tax identification number, birth date, investment selection, beneficiary information, and your personal bank account information and/or email address if you have provided that information. |
| • | | Information about your transactions and account history with us, or with other companies that are part of Franklin Templeton, including transactions you request on our website or in our app. This category also includes your communications to us concerning your investments. |
| • | | Information we receive from third parties (for example, to update your address if you move, obtain or verify your email address or obtain additional information to verify your identity). |
| • | | Information collected from you online, such as your IP address or device ID and data gathered from your browsing activity and location. (For example, we may use cookies to collect device and browser information so our website recognizes your online preferences and device information.) Our website contains more information about cookies and similar technologies and ways you may limit them. |
| • | | Other general information that we may obtain about you such as demographic information. |
Disclosure Policy
To better service your accounts and process transactions or services you requested, we may share non-public personal information with other Franklin Templeton companies. From time to time we may also send you information about products/services offered by other Franklin Templeton companies although we will not share your non-public personal information with these companies without first offering you the opportunity to prevent that sharing.
We will only share non-public personal information with outside parties in the limited circumstances permitted by law. For example, this includes situations where we need to share information with companies who work on our behalf to service or maintain your account or
|
| NOT PART OF THE SEMI-ANNUAL REPORT |
Legg Mason Funds Privacy and Security Notice (cont’d)
process transactions you requested, when the disclosure is to companies assisting us with our own marketing efforts, when the disclosure is to a party representing you, or when required by law (for example, in response to legal process). Additionally, we will ensure that any outside companies working on our behalf, or with whom we have joint marketing agreements, are under contractual obligations to protect the confidentiality of your information, and to use it only to provide the services we asked them to perform.
Confidentiality and Security
Our employees are required to follow procedures with respect to maintaining the confidentiality of our investors’ non-public personal information. Additionally, we maintain physical, electronic and procedural safeguards to protect the information. This includes performing ongoing evaluations of our systems containing investor information and making changes when appropriate.
At all times, you may view our current privacy notice on our website at franklintempleton.com or contact us for a copy at (800) 632-2301.
* For purposes of this privacy notice Franklin Templeton shall refer to the following entities:
Fiduciary Trust International of the South (FTIOS), as custodian for individual retirement plans
Franklin Advisers, Inc.
Franklin Distributors, LLC, including as program manager of the Franklin Templeton 529 College Savings Plan and the NJBEST 529 College Savings Plan
Franklin Mutual Advisers, LLC
Franklin, Templeton and Mutual Series Funds
Franklin Templeton Institutional, LLC
Franklin Templeton Investments Corp., Canada
Franklin Templeton Investments Management, Limited UK
Franklin Templeton Portfolio Advisors, Inc.
Legg Mason Funds serviced by Franklin Templeton Investor Services, LLC
Templeton Asset Management, Limited
Templeton Global Advisors, Limited
Templeton Investment Counsel, LLC
If you are a customer of other Franklin Templeton affiliates and you receive notices from them, you will need to read those notices separately.
|
| NOT PART OF THE SEMI-ANNUAL REPORT |
www.franklintempleton.com
© 2023 Franklin Distributors, LLC, Member FINRA/SIPC. All rights reserved.
36280 S 08/23 SR23-4725
Not applicable.
| ITEM 3. | AUDIT COMMITTEE FINANCIAL EXPERT. |
Not applicable.
| ITEM 4. | PRINCIPAL ACCOUNTANT FEES AND SERVICES. |
Not applicable.
| ITEM 5. | AUDIT COMMITTEE OF LISTED REGISTRANTS. |
Not applicable.
| ITEM 6. | SCHEDULE OF INVESTMENTS. |
Included herein under Item 1.
| ITEM 7. | DISCLOSURE OF PROXY VOTING POLICIES AND PROCEDURES FOR CLOSED-END MANAGEMENT INVESTMENT COMPANIES. |
Not applicable.
| ITEM 8. | PORTFOLIO MANAGERS OF CLOSED-END MANAGEMENT INVESTMENT COMPANIES. |
Not applicable.
| ITEM 9. | PURCHASES OF EQUITY SECURITIES BY CLOSED-END MANAGEMENT INVESTMENT COMPANY AND AFFILIATED PURCHASERS. |
Not applicable.
| ITEM 10. | SUBMISSION OF MATTERS TO A VOTE OF SECURITY HOLDERS. |
Not applicable.
| ITEM 11. | CONTROLS AND PROCEDURES. |
| | (a) | The registrant’s principal executive officer and principal financial officer have concluded that the registrant’s disclosure controls and procedures (as defined in Rule 30a- 3(c) under the Investment Company Act of 1940, as amended (the “1940 Act”)) are effective as of a date within 90 days of the filing date of this report that includes the disclosure required by this paragraph, based on their evaluation of the disclosure controls and procedures required by Rule 30a-3(b) under the 1940 Act and 15d-15(b) under the Securities Exchange Act of 1934. |
| | (b) | There were no changes in the registrant’s internal control over financial reporting (as defined in Rule 30a-3(d) under the 1940 Act) that occurred during the period covered by this report that have materially affected, or are likely to materially affect the registrant’s internal control over financial reporting. |
| ITEM 12. | DISCLOSURE OF SECURITIES LENDING ACTIVITIES FOR CLOSED-END MANAGEMENT INVESTMENT COMPANIES. |
Not applicable
(a) (1) Not applicable.
Exhibit 99.CODE ETH
(a) (2) Certifications pursuant to section 302 of the Sarbanes-Oxley Act of 2002 attached hereto.
Exhibit 99.CERT
(b) Certifications pursuant to Section 906 of the Sarbanes-Oxley Act of 2002 attached hereto.
Exhibit 99.906CERT
SIGNATURES
Pursuant to the requirements of the Securities Exchange Act of 1934 and the Investment Company Act of 1940, the registrant has duly caused this Report to be signed on its behalf by the undersigned, there unto duly authorized.
Legg Mason Partners Variable Income Trust
| | |
| By: | | /s/ Jane Trust |
| | Jane Trust |
| | Chief Executive Officer |
| |
| Date: | | August 18, 2023 |
Pursuant to the requirements of the Securities Exchange Act of 1934 and the Investment Company Act of 1940, this report has been signed below by the following persons on behalf of the registrant and in the capacities and on the dates indicated.
| | |
| By: | | /s/ Jane Trust |
| | Jane Trust |
| | Chief Executive Officer |
| |
| Date: | | August 18, 2023 |
| |
| By: | | /s/ Christopher Berarducci |
| | Christopher Berarducci |
| | Principal Financial Officer |
| |
| Date: | | August 18, 2023 |